申科Vision 14笔记本电脑评测--大规模的酷睿i7-12700H性能升级
去年,申克公司发布了一款非常激动人心的14英寸笔记本电脑,由于其略高于1公斤(2.2磅)的低重量,它以极强的便携性而大放异彩,名为 愿景14,同时在良好的端口选择或性能方面没有妥协。今年早些时候,该设备被 焕然一新配备了英特尔Tiger Lake-H35处理器,包括一个更有效的冷却解决方案,具有液态金属以及一个专用的 GeForce RTX 3050 TiGPU选项。我们对上述笔记本电脑的主要疑虑是第11代英特尔处理器的平庸性能和相对较短的电池寿命。
虽然申克公司几个月前宣布了Vision 14的更新,但由于供应链问题,我们现在才有机会对其进行审查。与我们的第一印象相反,新设备是一个相当大的升级,还配备了一个巨大的99瓦时电池选项,并需要对内部布局进行某些改变。此外,来自Tiger Lake 代的老式四核处理器已被最新的Alder Lake模型取代。与该类别中的大多数其他设备不同,申克没有选择Alder Lake-P处理器(28W TDP),而是选择了45瓦的处理器 酷睿i7-12700H.
我们收到了Schenker提供的Vision 14的两个版本;一个有专用的GeForce GPU,另一个没有。由于它们在其他方面是相同的(酷睿i7-12700H,3K面板,99瓦时电池),我们将在这次审查中列出小的差异,而不是分别审查这两个设备。带iGPU的新Vision 14起价约为1659美元,而RTX 3050 Ti型号可以从1931美元左右开始购买。这些型号可以配置多种可用的内存和固态硬盘选项;我们的测试设备配备了32GB内存和1TB PCIe-4.0固态硬盘(三星980 Pro),价格约为2200美元。
潜在的竞争对手比较
Rating | Date | Model | Weight | Height | Size | Resolution | Price |
|---|---|---|---|---|---|---|---|
| 88.8 % v7 (old) | 10 / 2022 | Schenker Vision 14 2022 RTX 3050 Ti i7-12700H, GeForce RTX 3050 Ti Laptop GPU | 1.3 kg | 16.6 mm | 14.00" | 2880x1800 | |
| 90.3 % v7 (old) | 09 / 2022 | Huawei MateBook X Pro 2022 i7-1260P, Iris Xe G7 96EUs | 1.3 kg | 15.6 mm | 14.20" | 3120x2080 | |
| 90.6 % v7 (old) | 05 / 2022 | Lenovo Yoga 9i 14 2022 i7-1260P i7-1260P, Iris Xe G7 96EUs | 1.4 kg | 15.25 mm | 14.00" | 3840x2400 | |
| 87.2 % v7 (old) | 09 / 2022 | Dell Inspiron 14 Plus 7420 i7-12700H, GeForce RTX 3050 4GB Laptop GPU | 1.7 kg | 18.87 mm | 14.00" | 2240x1400 | |
| 86.3 % v7 (old) | 07 / 2022 | Asus Vivobook Pro 14 M3401QC-KM007T R5 5600H, GeForce RTX 3050 4GB Laptop GPU | 1.5 kg | 19 mm | 14.00" | 2880x1800 | |
| 92.7 % v7 (old) | 11 / 2021 | Apple MacBook Pro 14 2021 M1 Pro Entry M1 Pro 8-Core, M1 Pro 14-Core GPU | 1.6 kg | 15.5 mm | 14.20" | 3024x1964 |
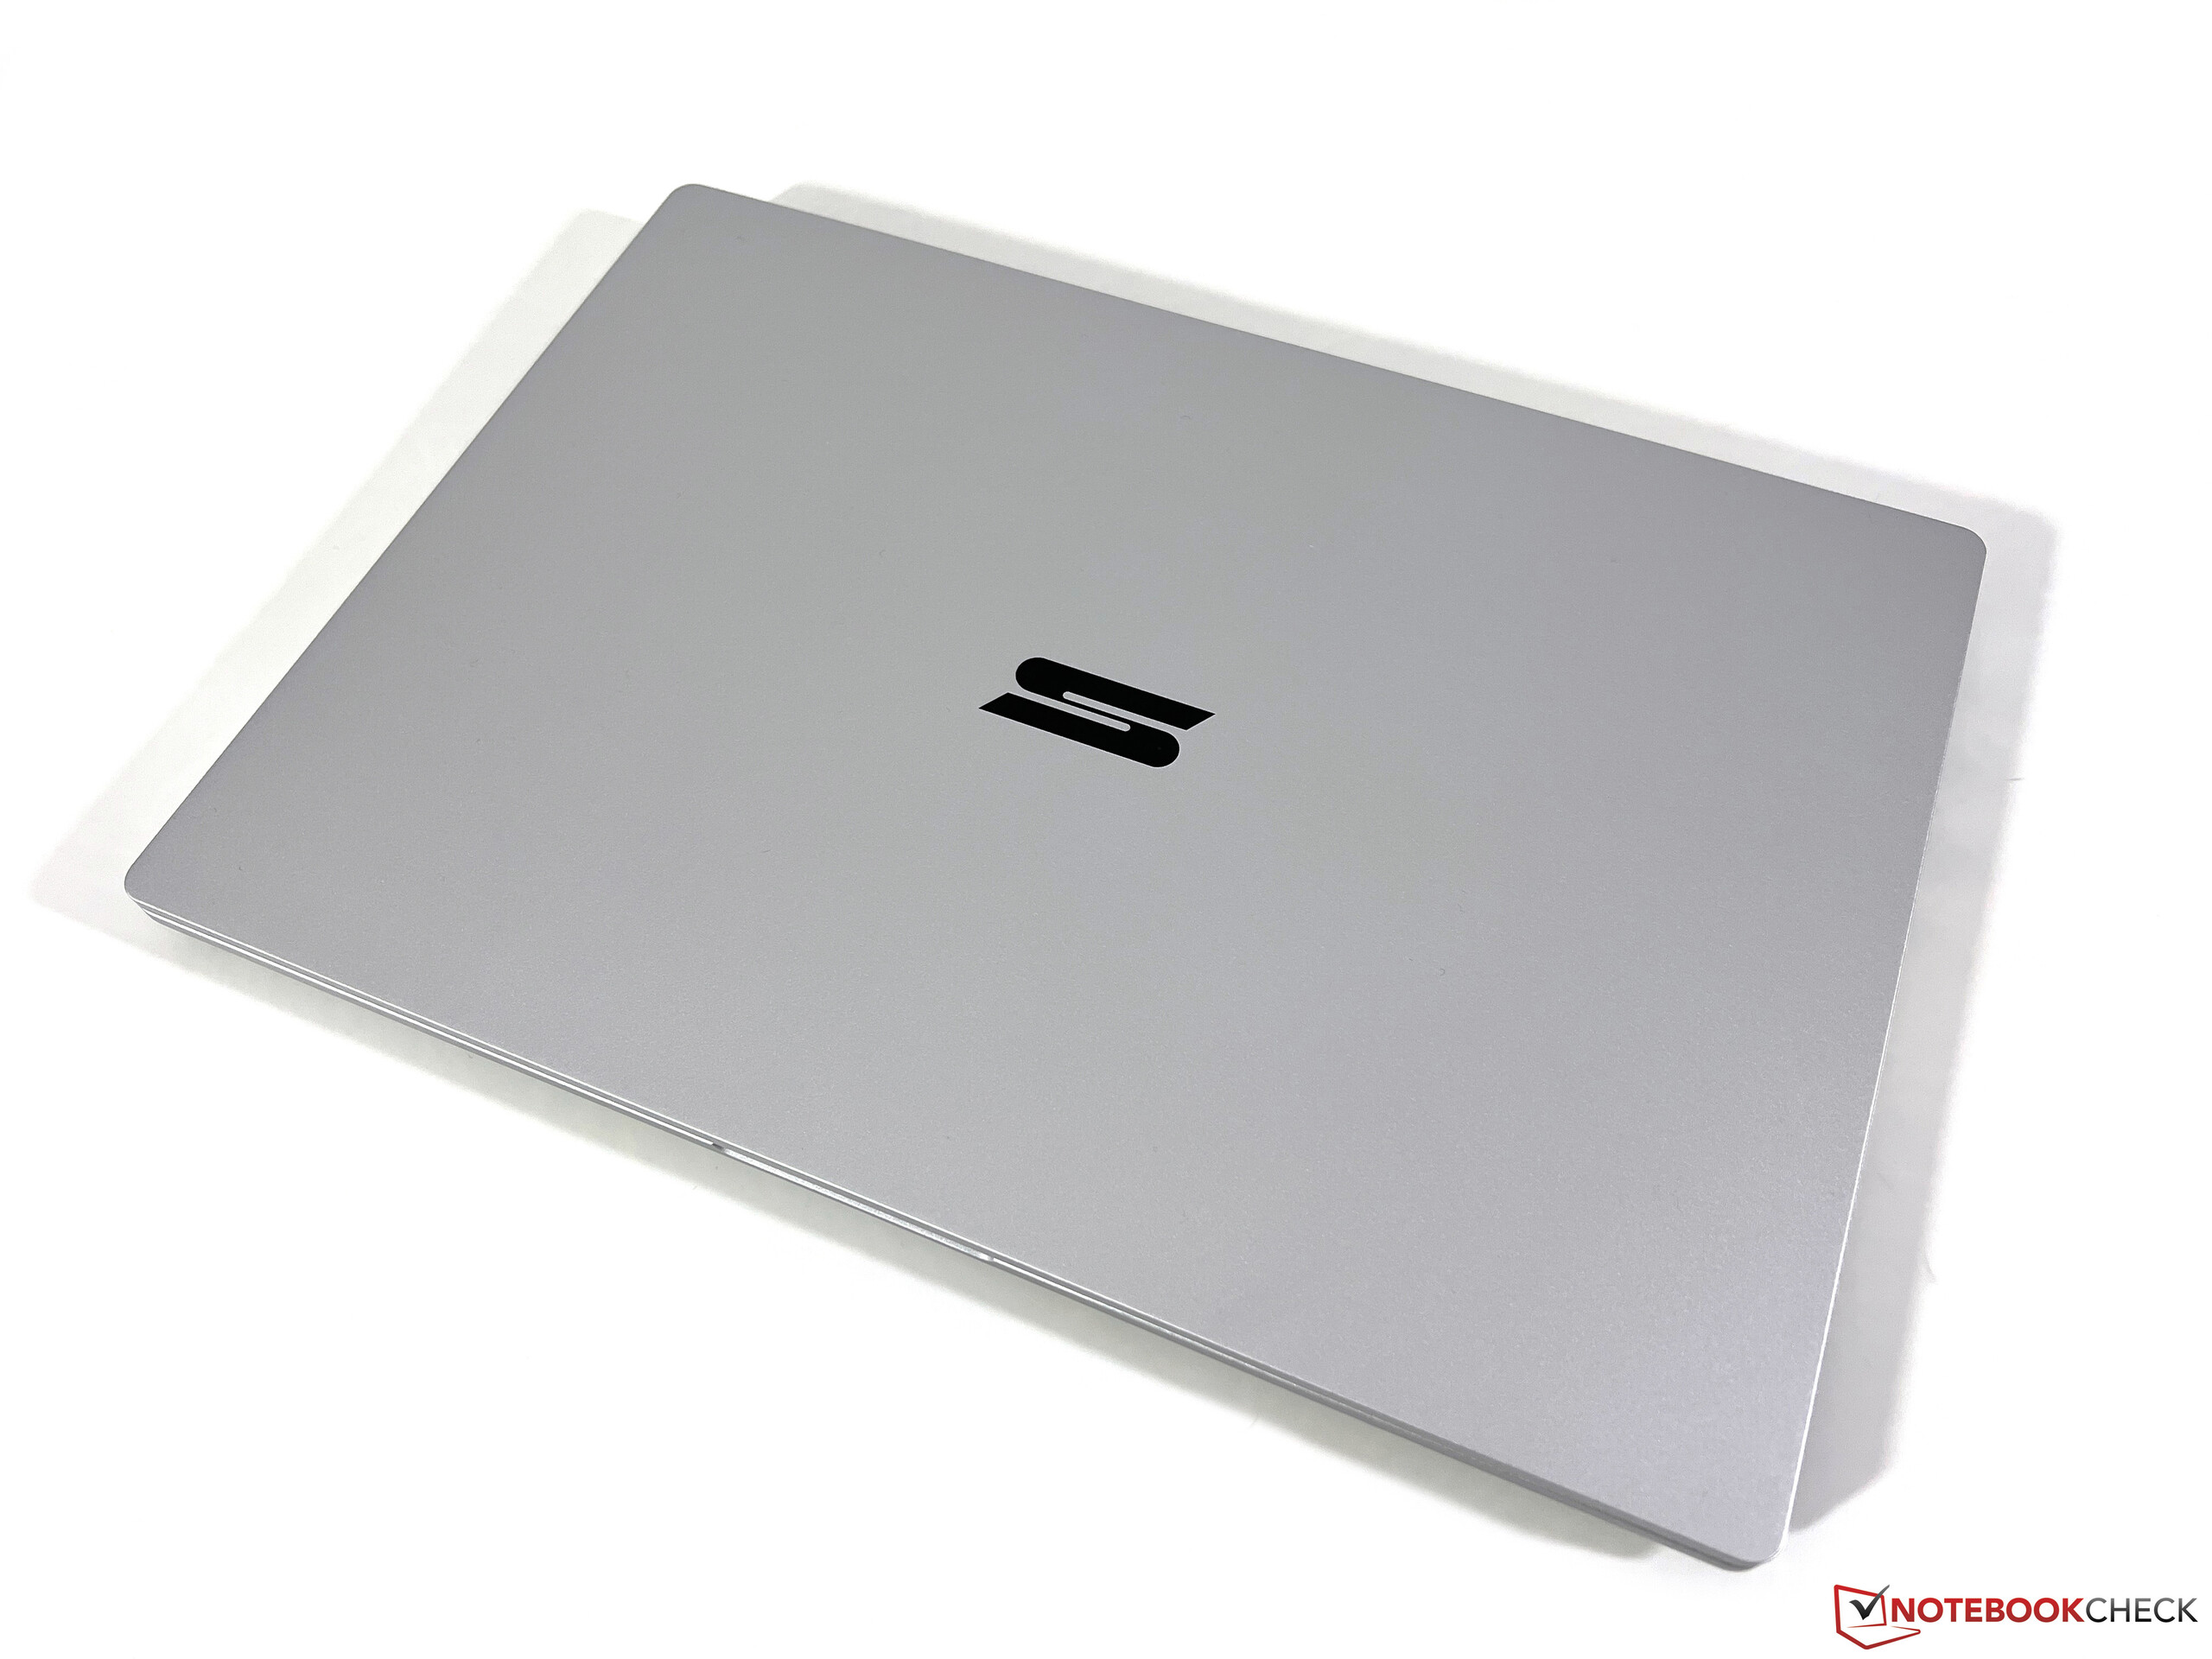
箱子 - 镁质视觉14的两种颜色
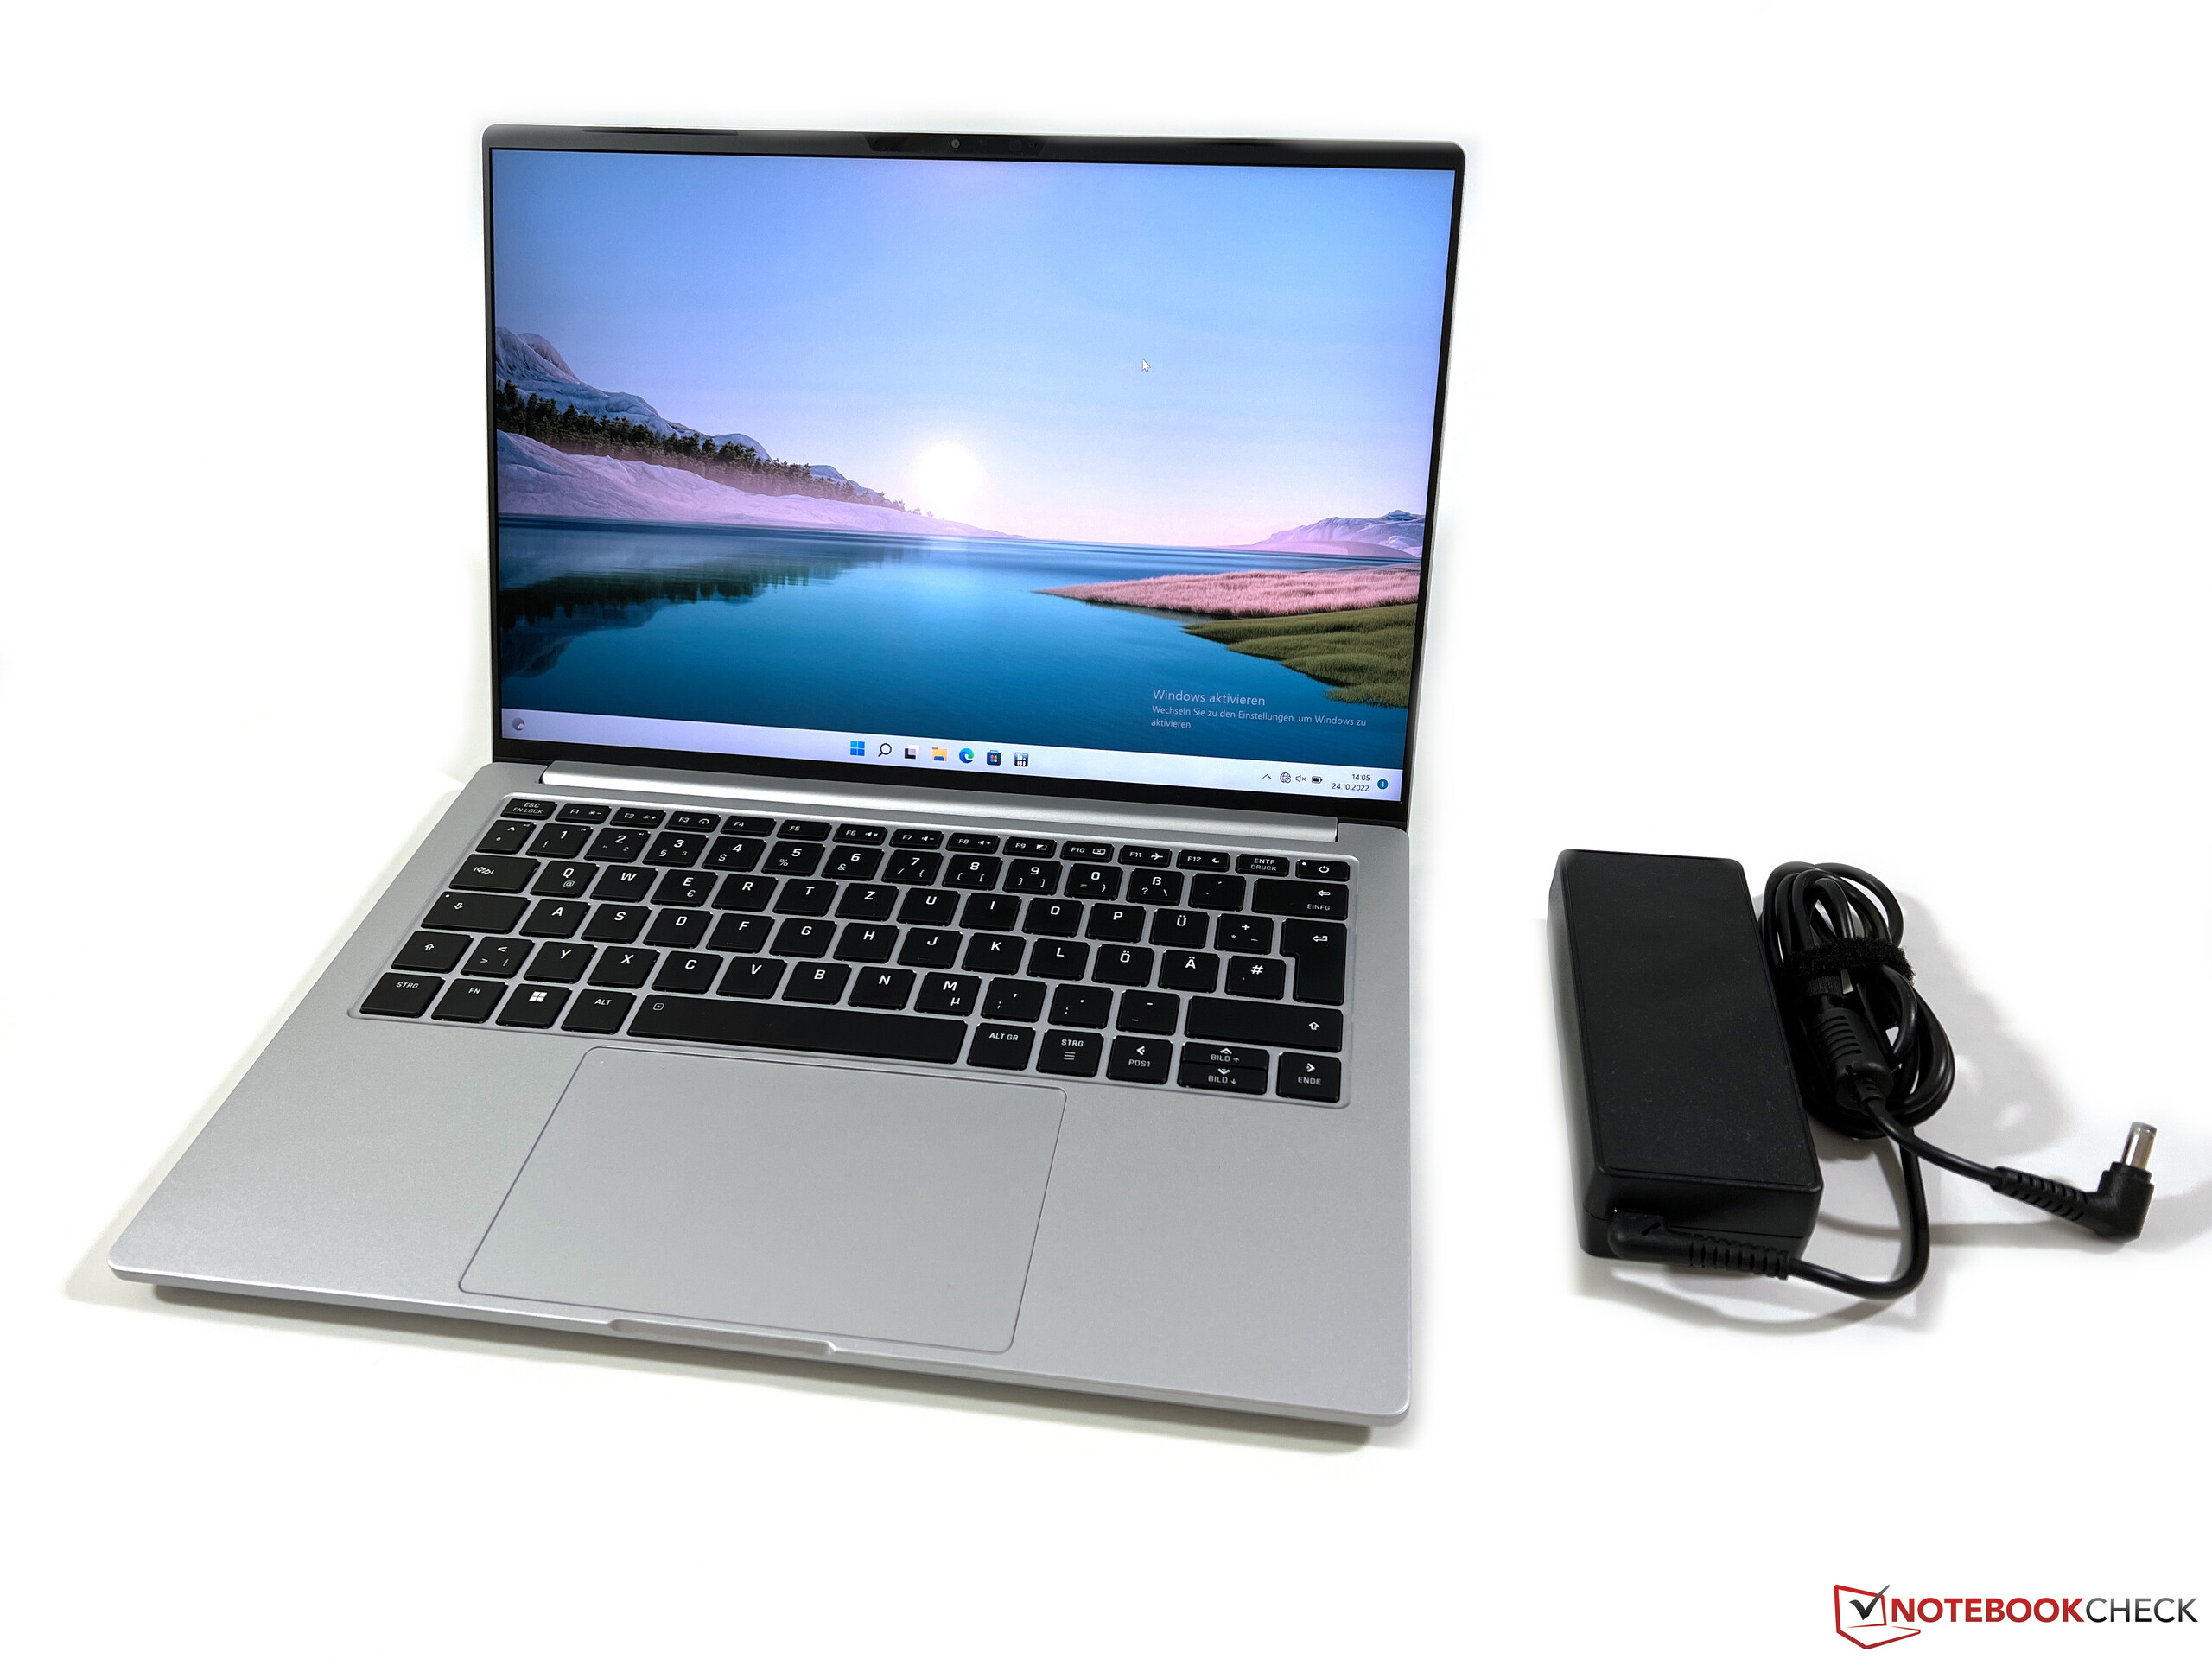
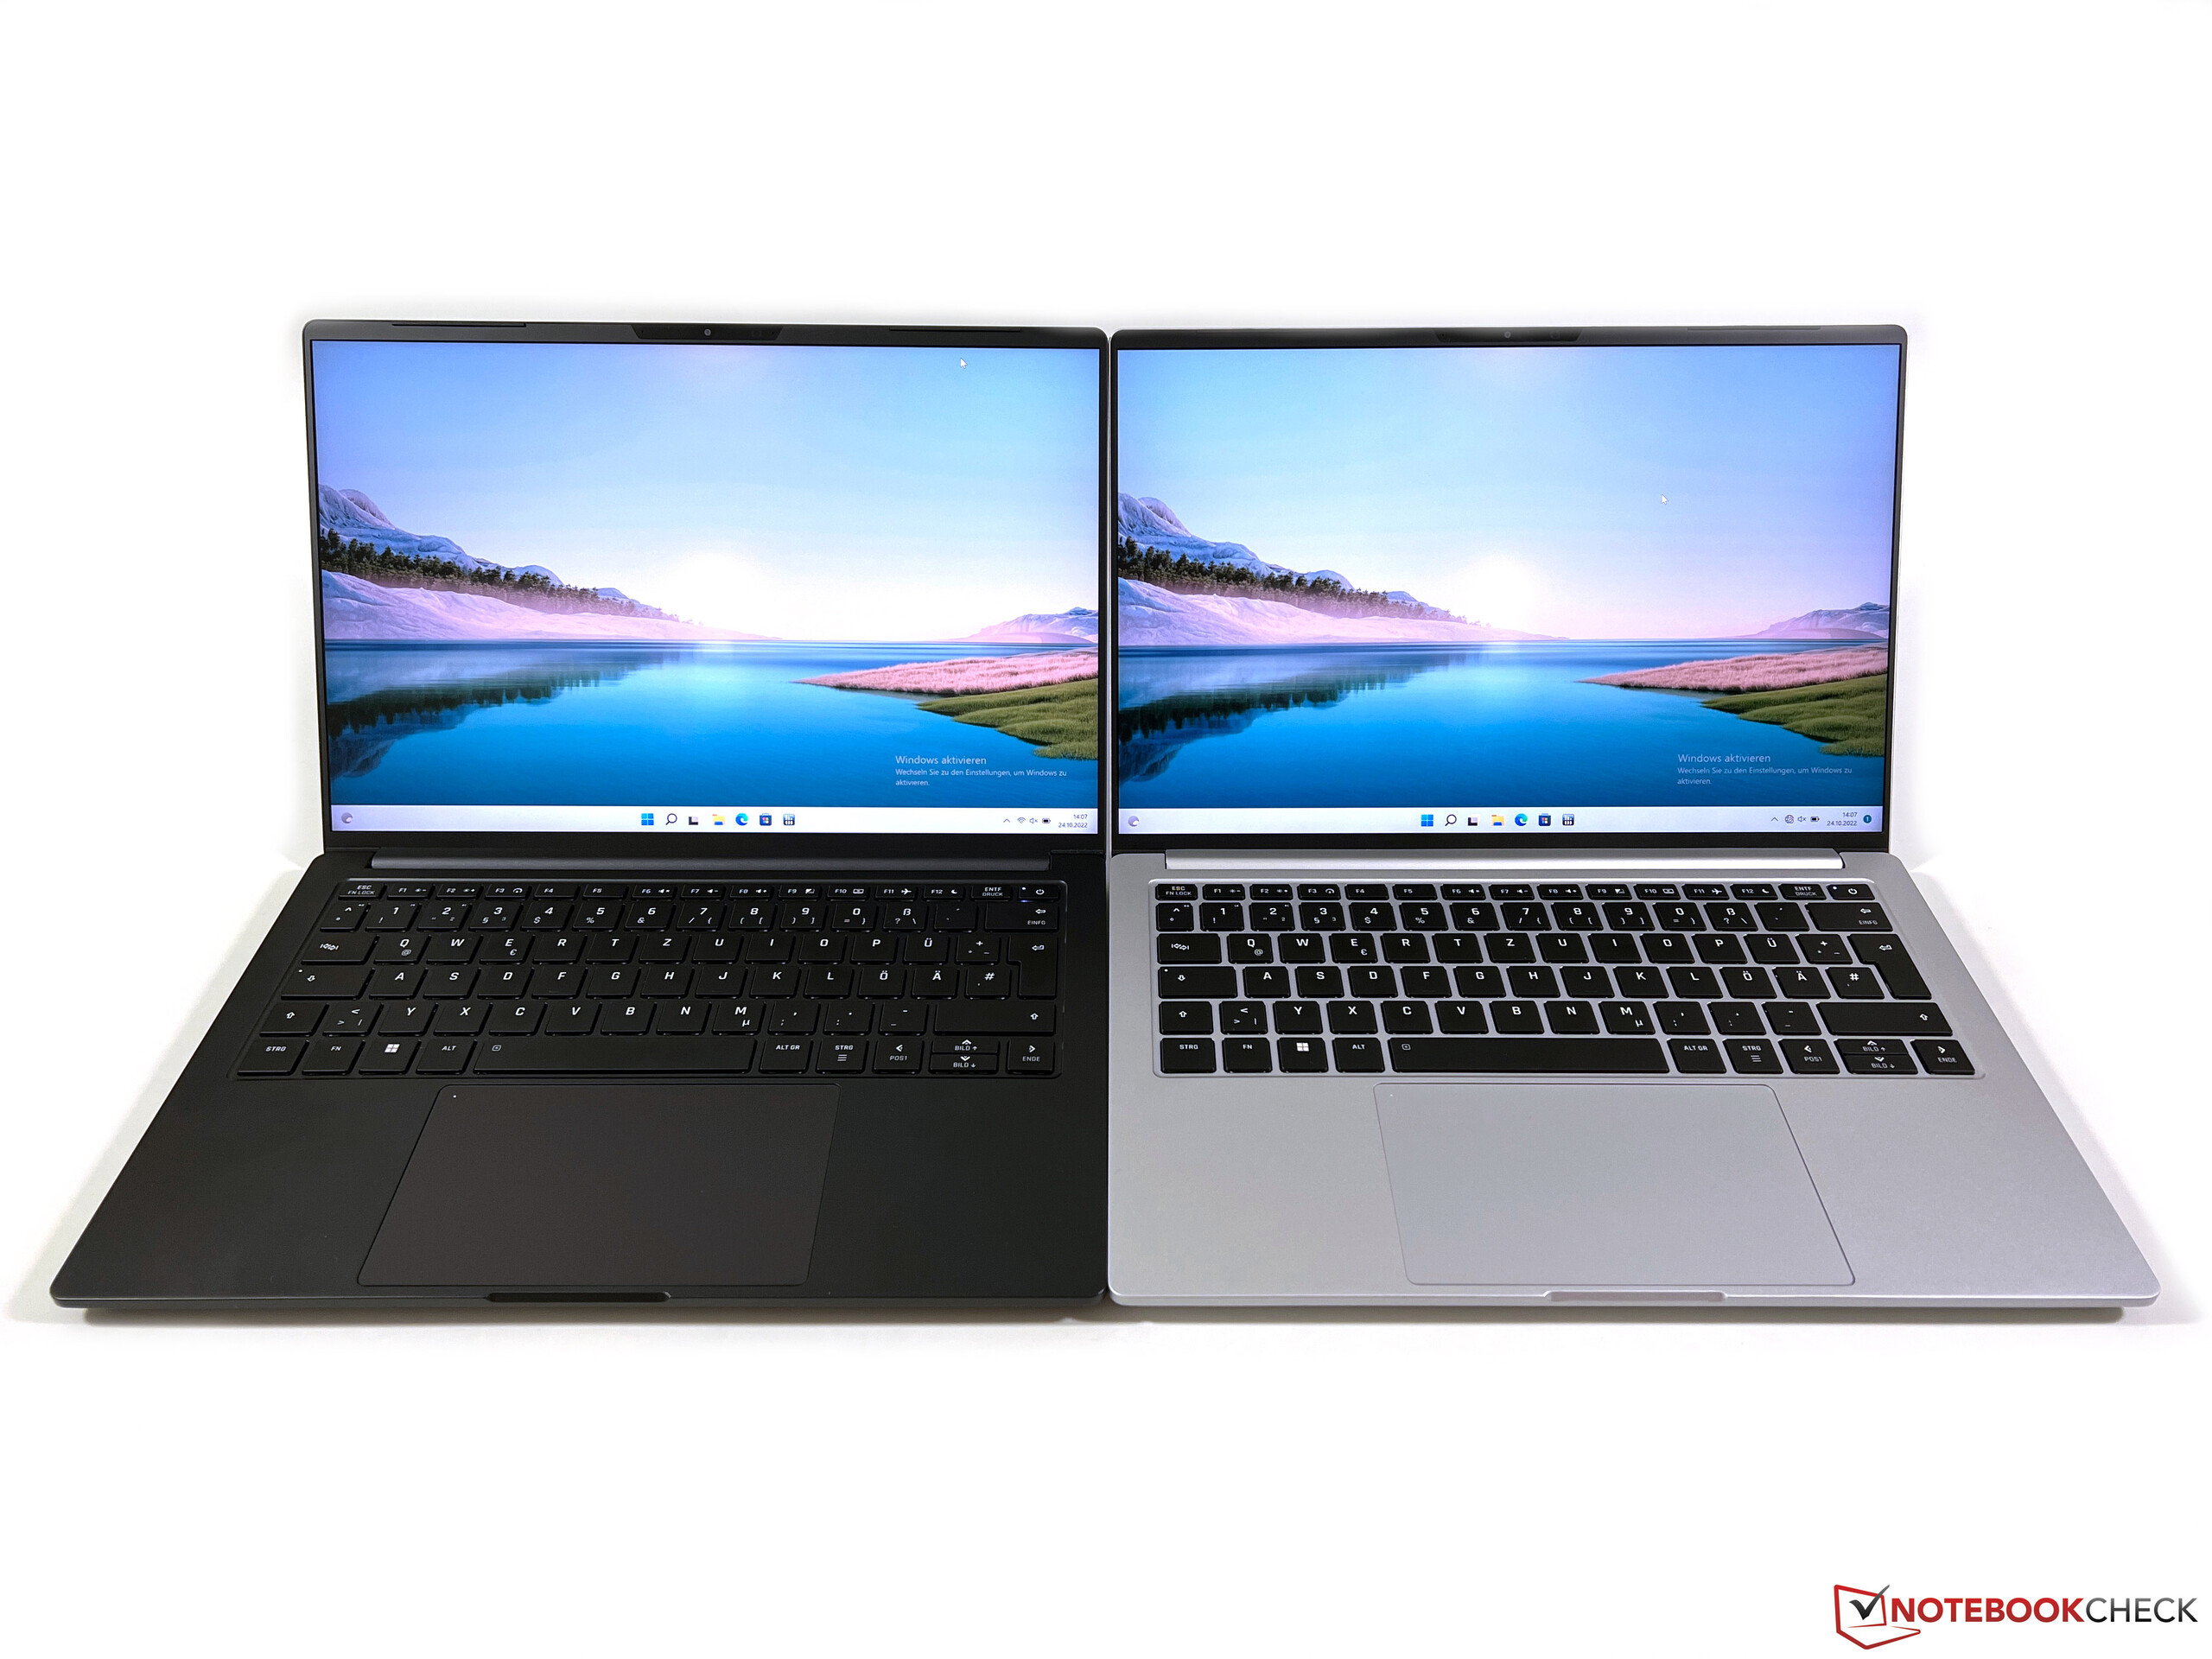
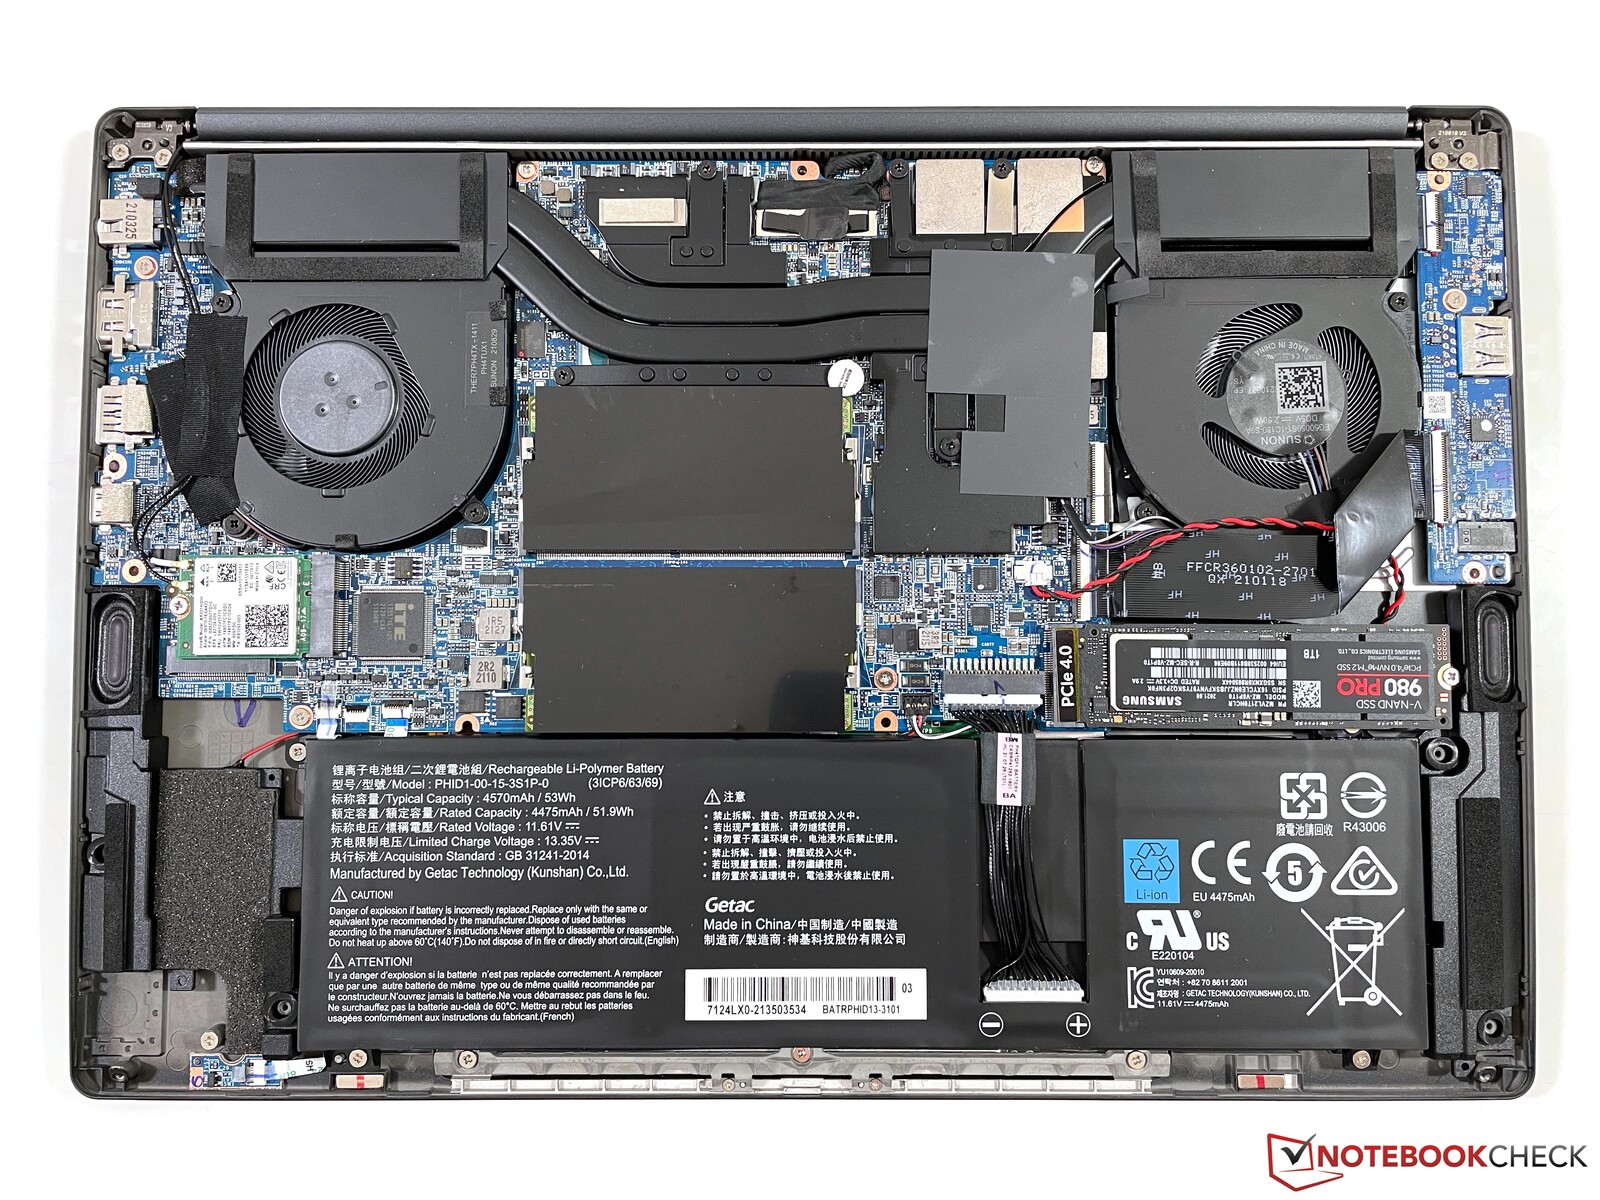
使用99瓦时电池和GeForce RTX 3050 Ti,我们测试设备的重量为1310克(约2.89磅),超过了它的 前代产品几乎200克(约0.44磅),这使它成为Vision 14中最重的一款。更轻的53-Wh型号(~1.1公斤/~2.43磅)。在1269克(约2.80磅),没有RTX 3050 Ti的Vision 14的99-Wh变体只是稍微轻一点。同时,新的99-Wh机型也厚了1毫米(16.6毫米对15.6毫米/0.65对0.61英寸)。
相对而言,即使是我们测试设备的最高配置,其重量也明显低于我们与专用显卡比较的其他设备。513克(约1.13磅),附带的交流适配器相对较重。
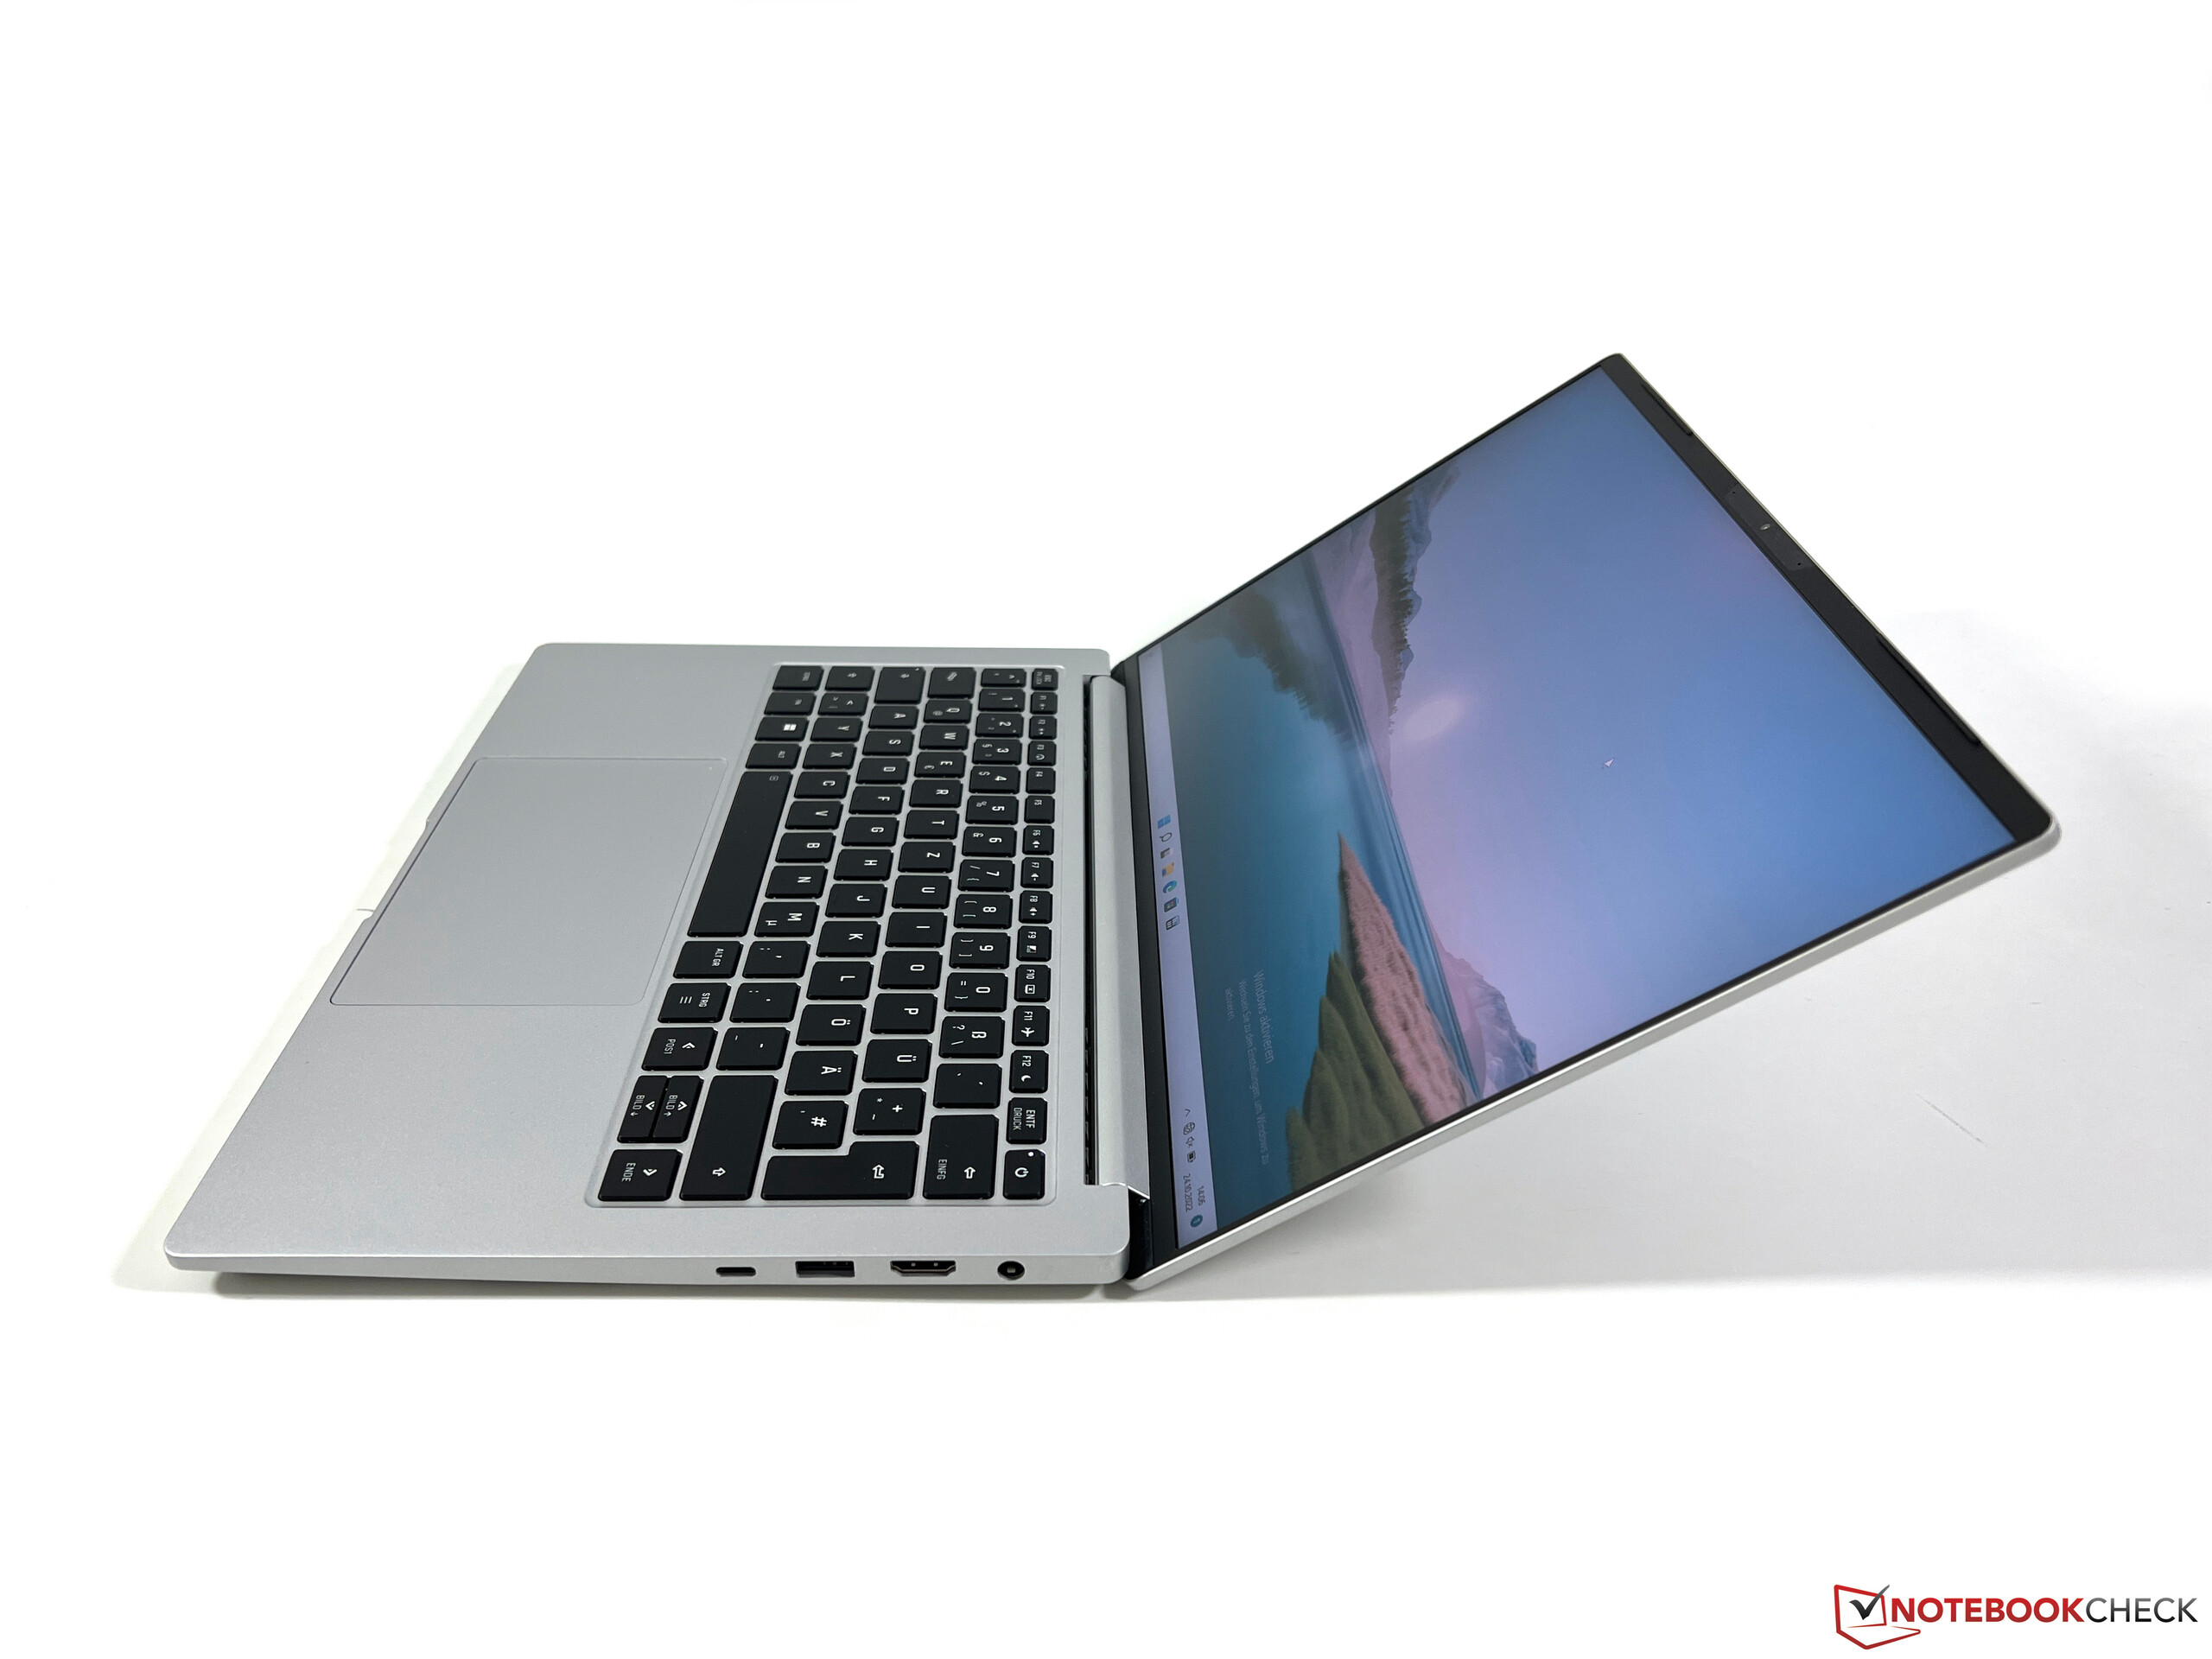
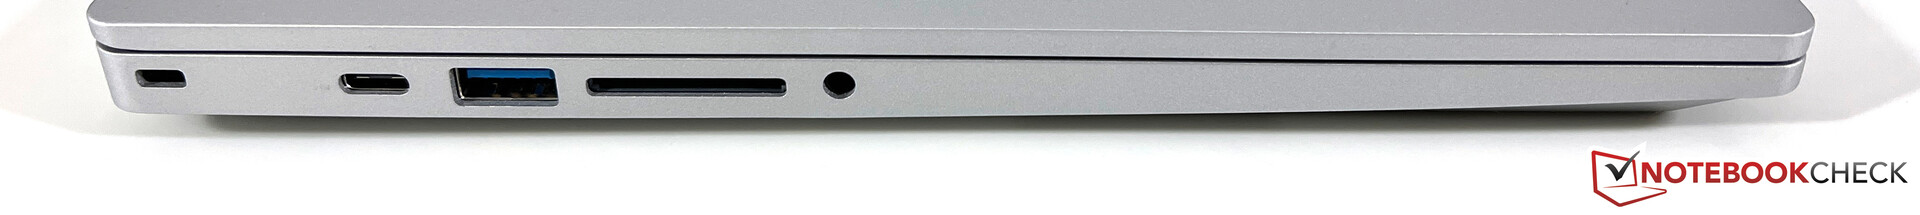
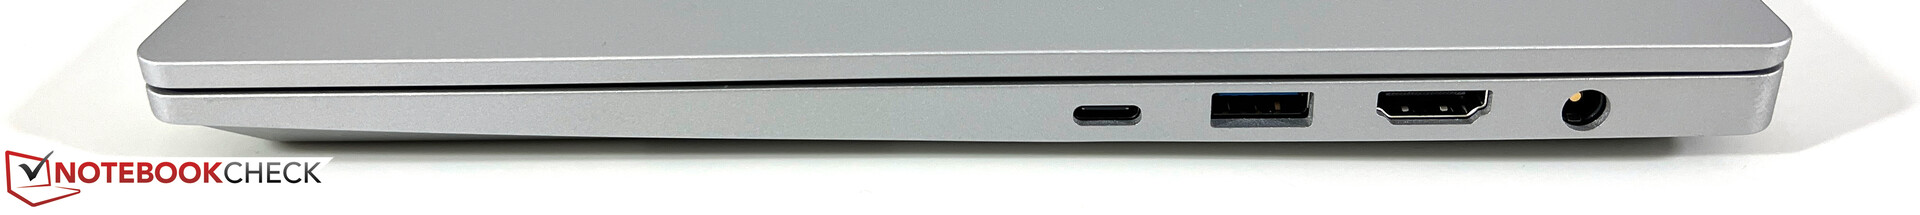
连接性 - Vision 14带Thunderbolt 4和读卡器
在连接方面没有变化,这意味着用户继续受益于相同的、慷慨的端口选择,包括Thunderbolt 4。一个全尺寸的读卡器也可用。Schenker仍然使用英特尔AX201 Wi-Fi模块,在我们的测试中达到良好的传输速度。由于Vision 14的天线设置不支持6-GHz网络,Wi-Fi 6E模块(如AX211)无法使用。
| SD Card Reader | |
| average JPG Copy Test (av. of 3 runs) | |
| Apple MacBook Pro 14 2021 M1 Pro Entry (AV PRO V60) | |
| Schenker Vision 14 (Angelbird AV Pro V60) | |
| Average of class Subnotebook (23.7 - 188, n=9, last 2 years) | |
| Schenker Vision 14 2022 RTX 3050 Ti | |
| Asus Vivobook Pro 14 M3401QC-KM007T (AV Pro SD microSD 128 GB V60) | |
| Dell Inspiron 14 Plus 7420 (AV PRO microSD 128 GB V60) | |
| maximum AS SSD Seq Read Test (1GB) | |
| Average of class Subnotebook (24.9 - 195, n=8, last 2 years) | |
| Schenker Vision 14 (Angelbird AV Pro V60) | |
| Schenker Vision 14 2022 RTX 3050 Ti | |
| Asus Vivobook Pro 14 M3401QC-KM007T (AV Pro SD microSD 128 GB V60) | |
| Dell Inspiron 14 Plus 7420 (AV PRO microSD 128 GB V60) | |
网络摄像头
网络摄像头的传感器已经从旧的720p升级到1080p版本。这略微提高了图像的清晰度,同时总体上保持了相当低的色彩偏差。


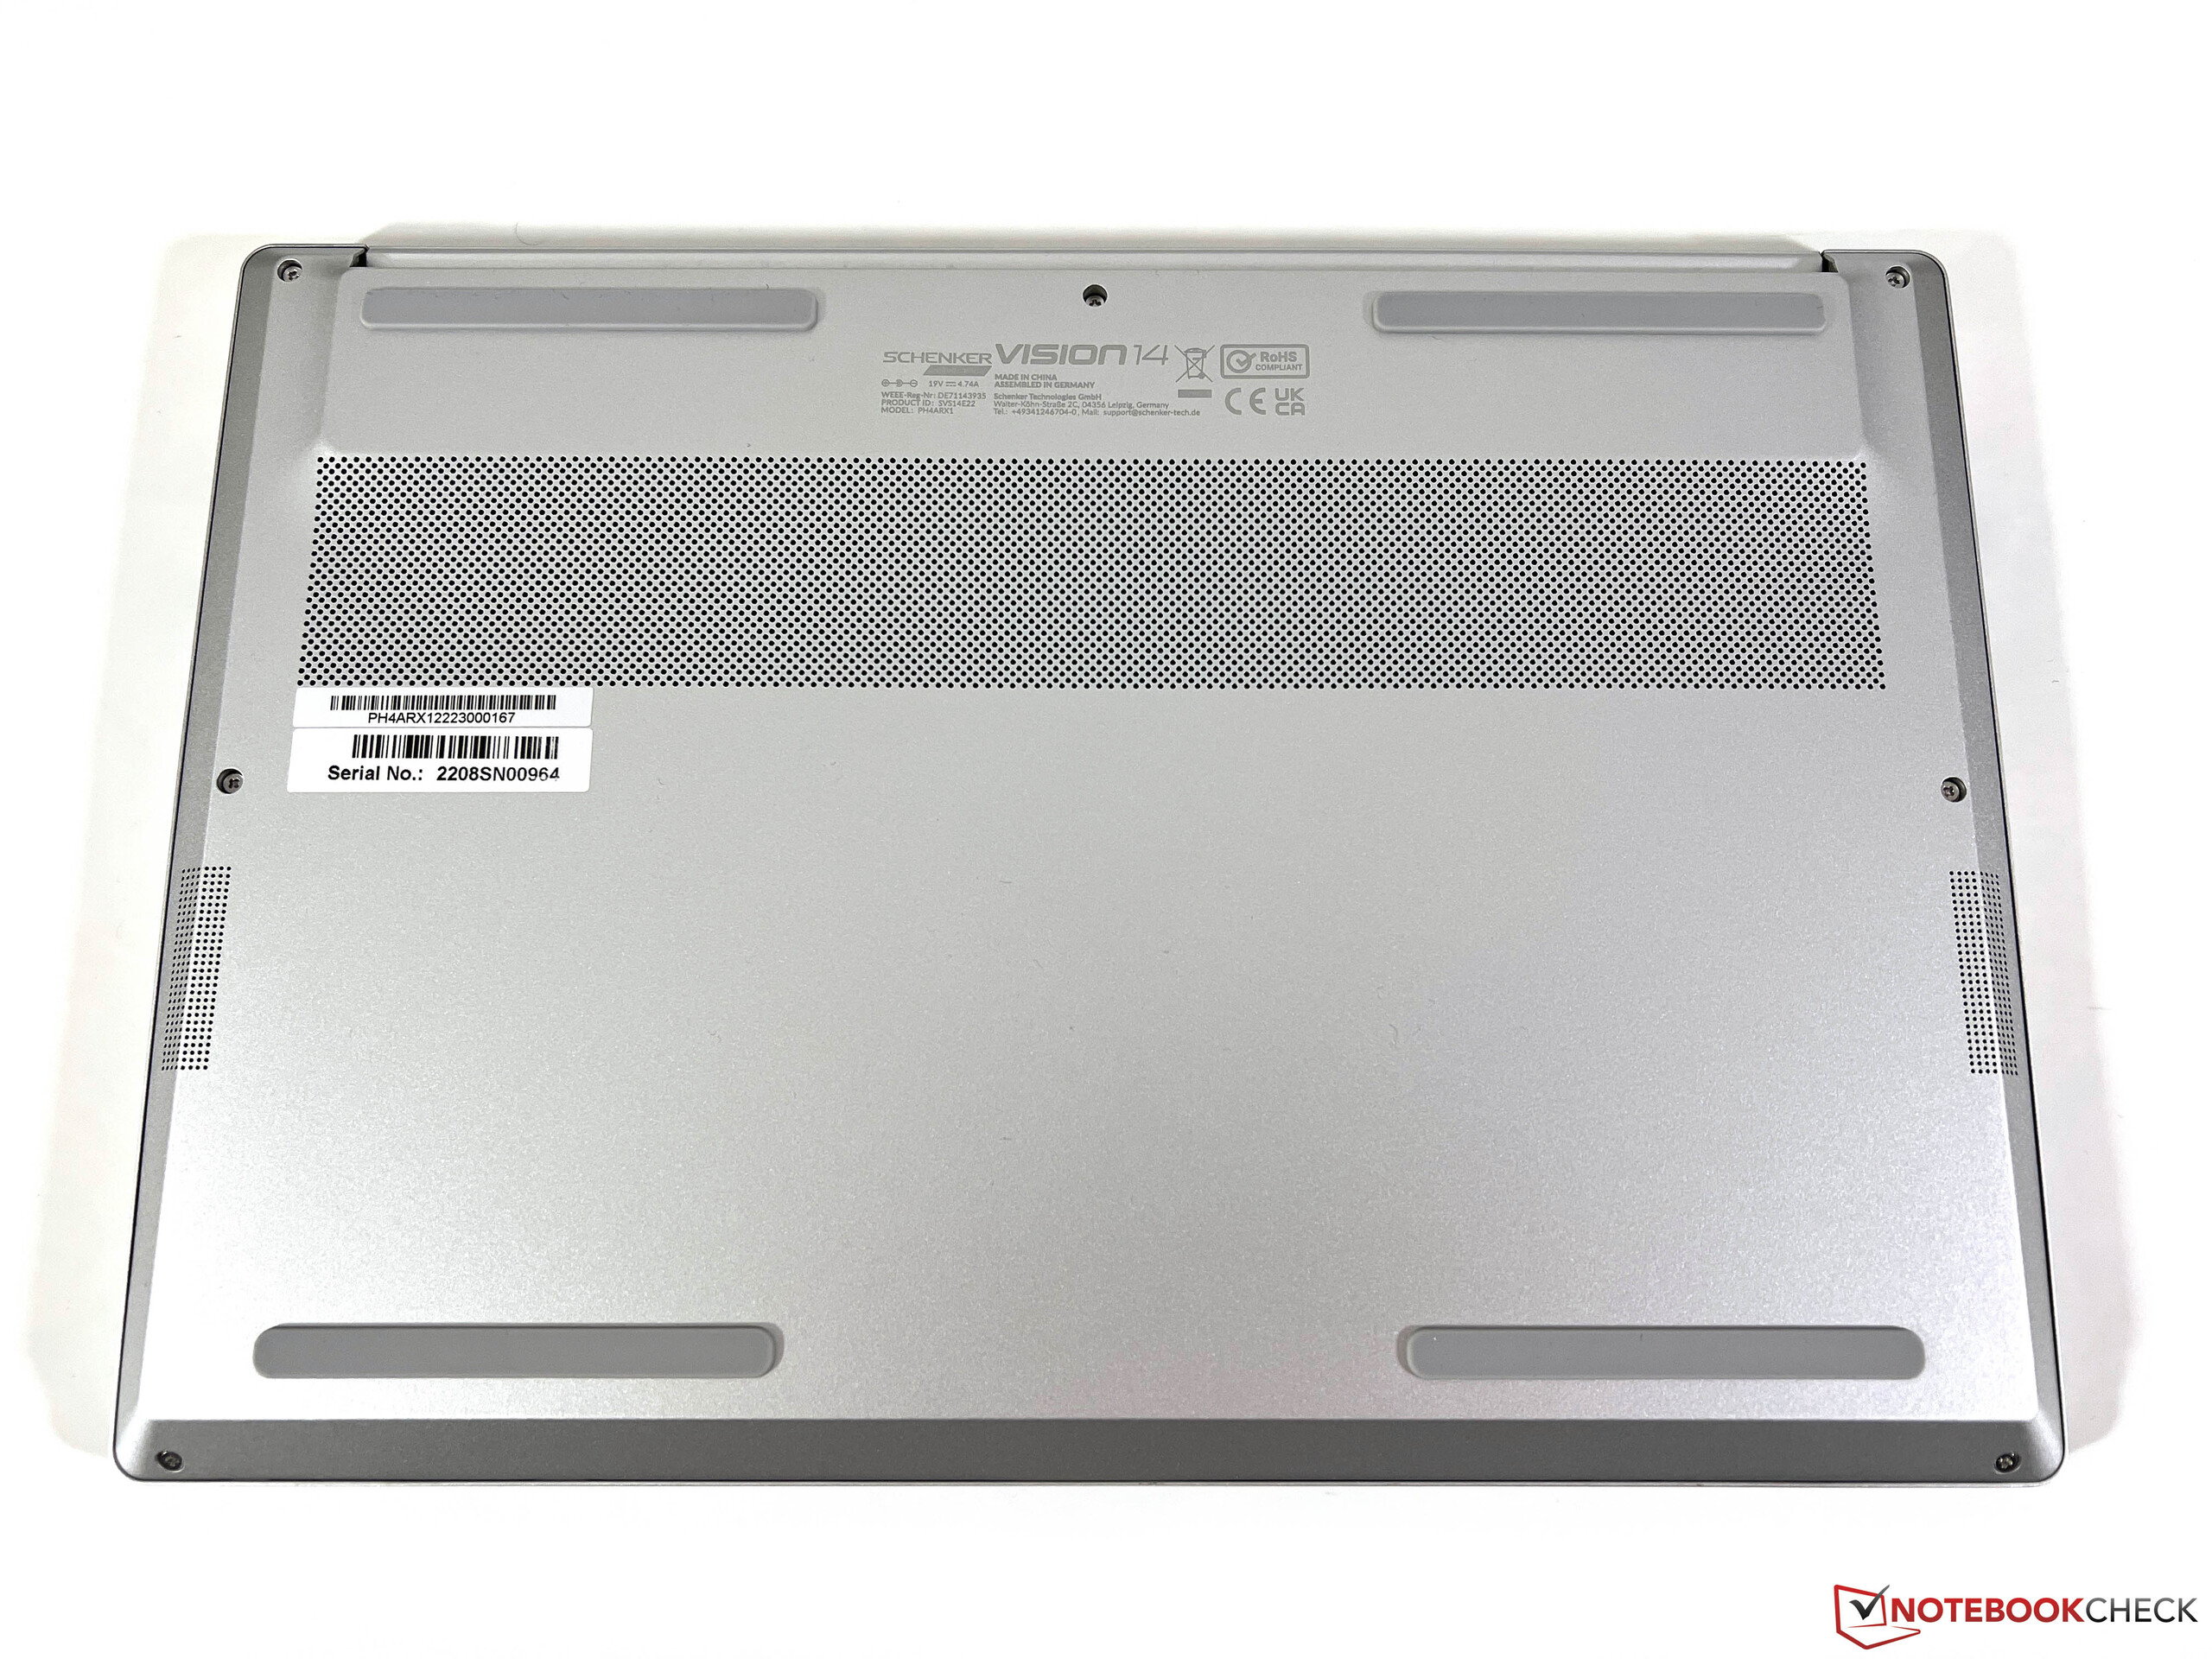
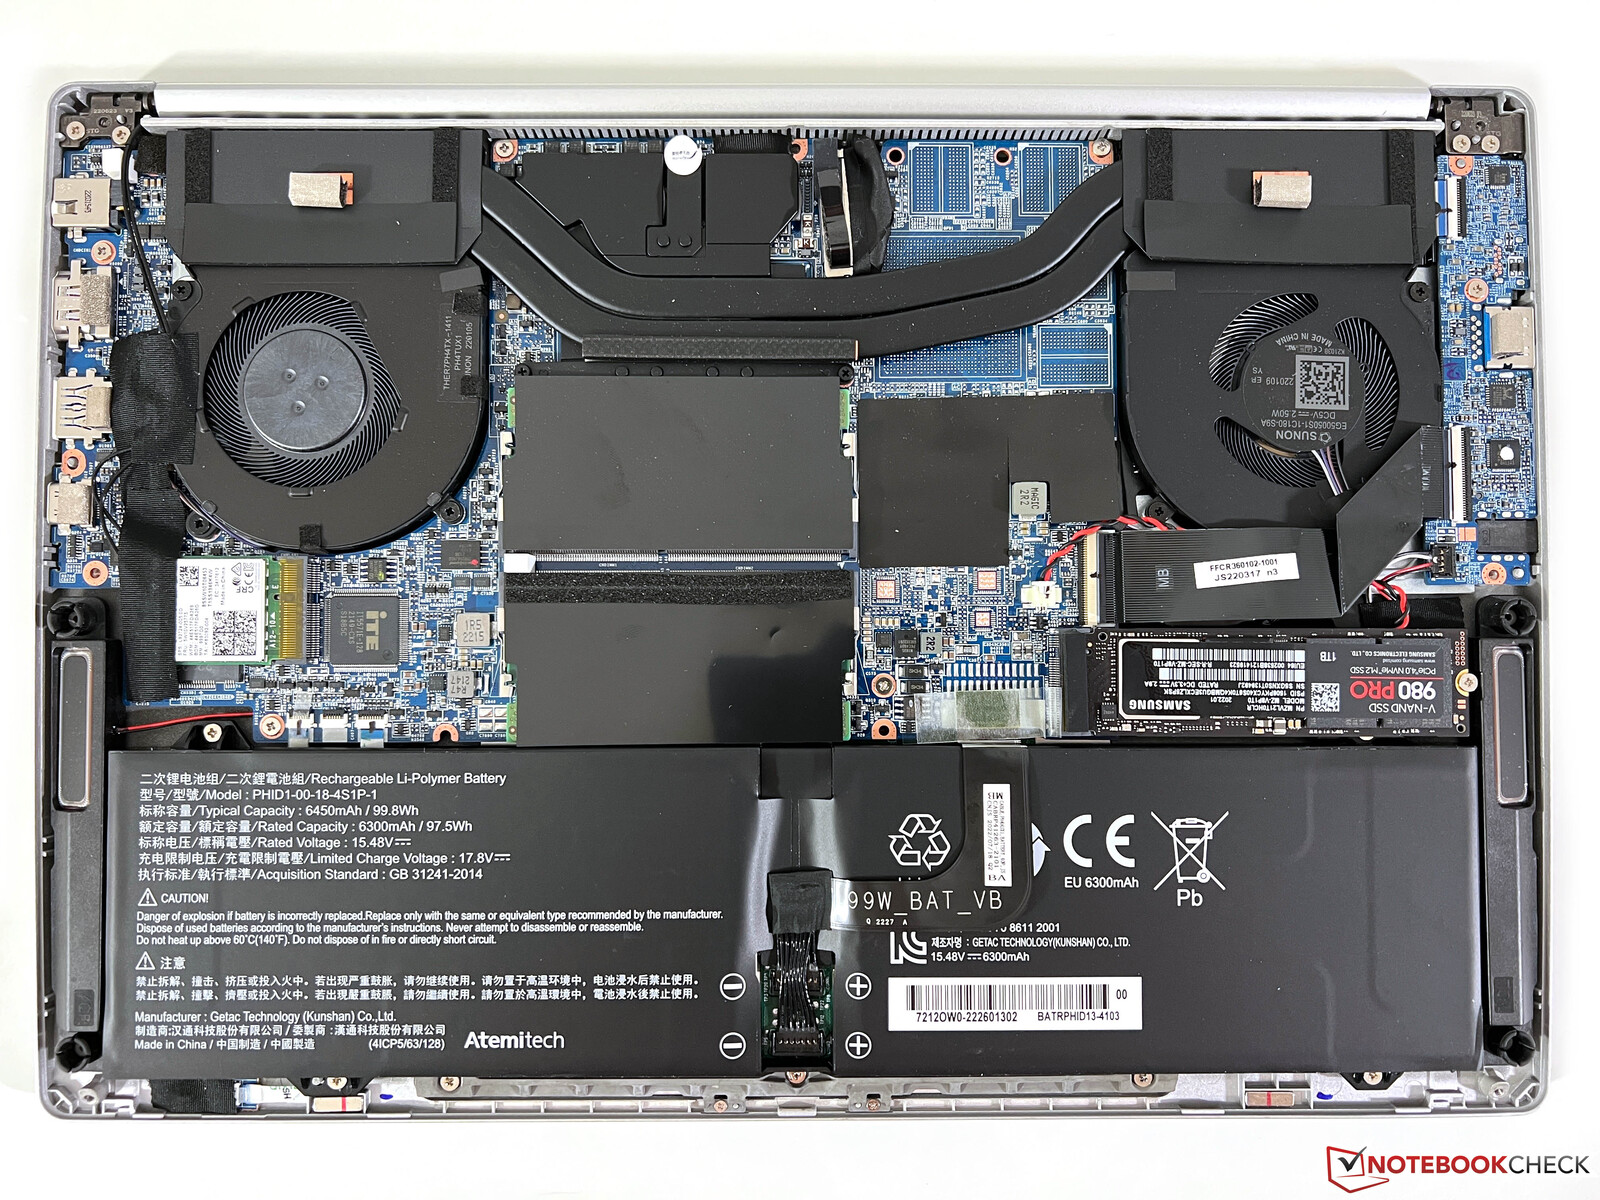
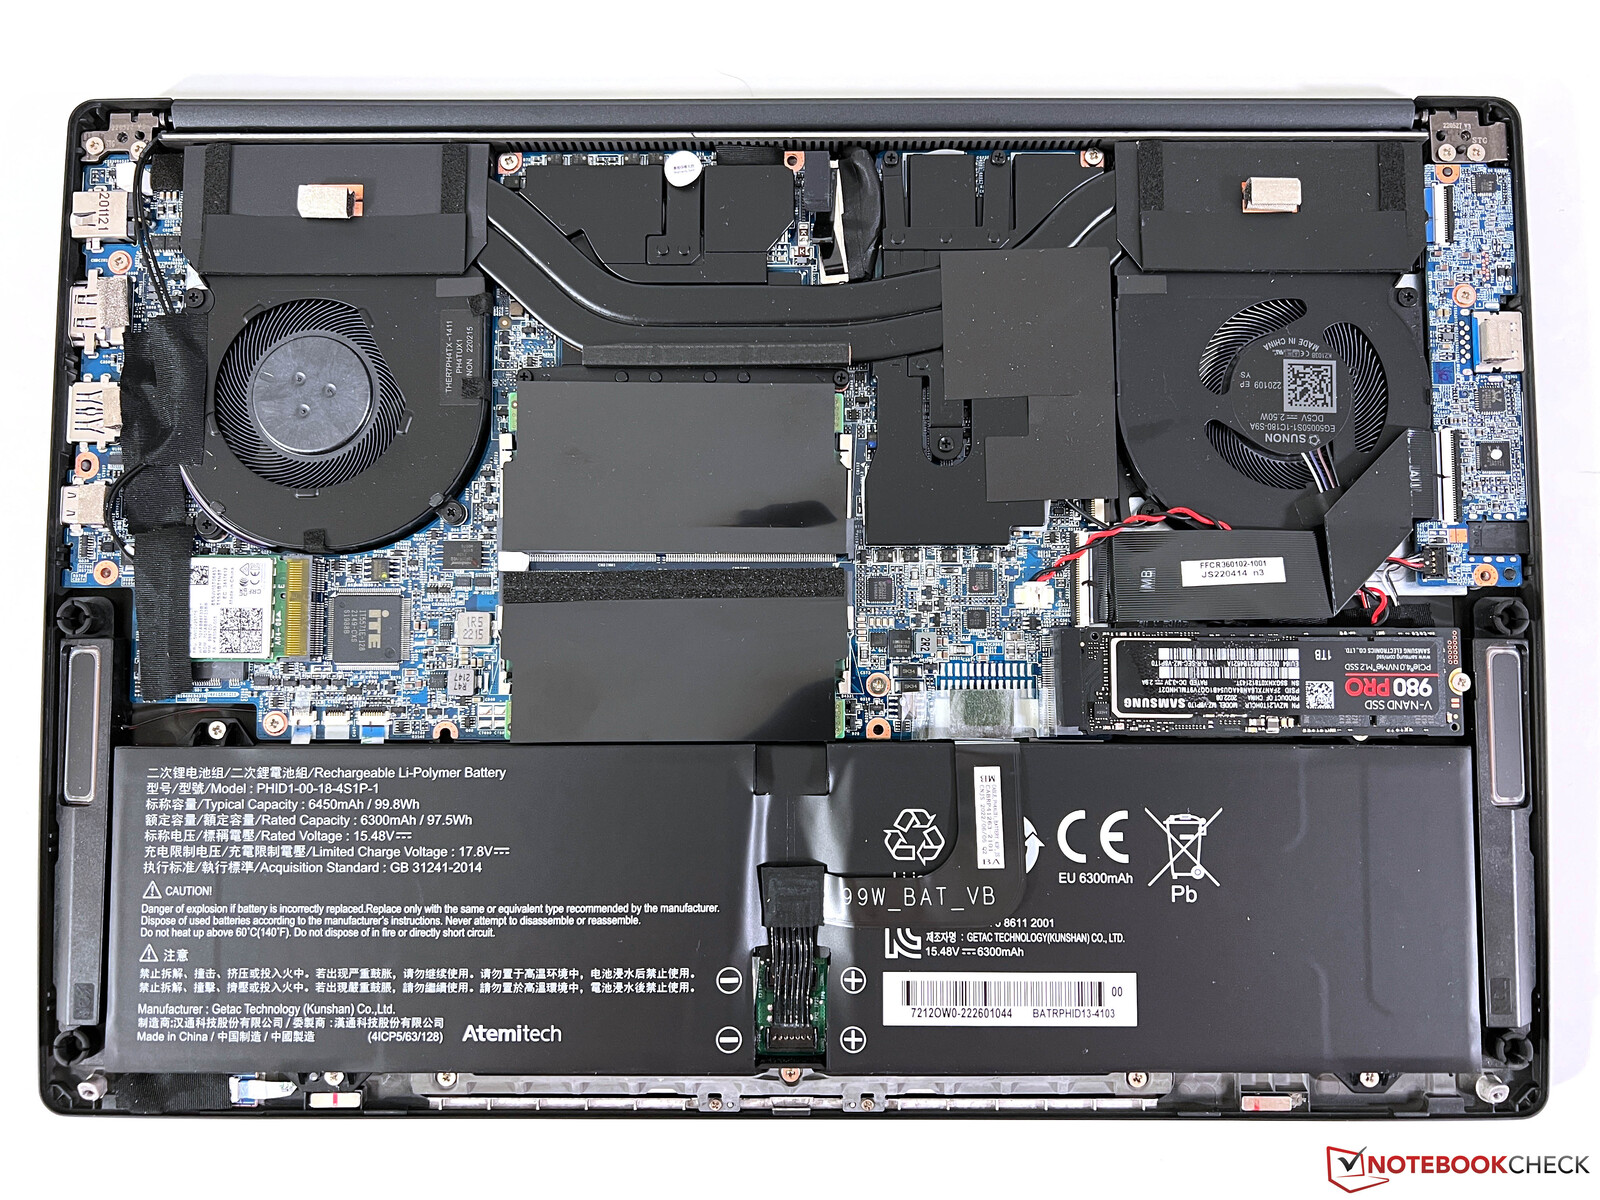
维护
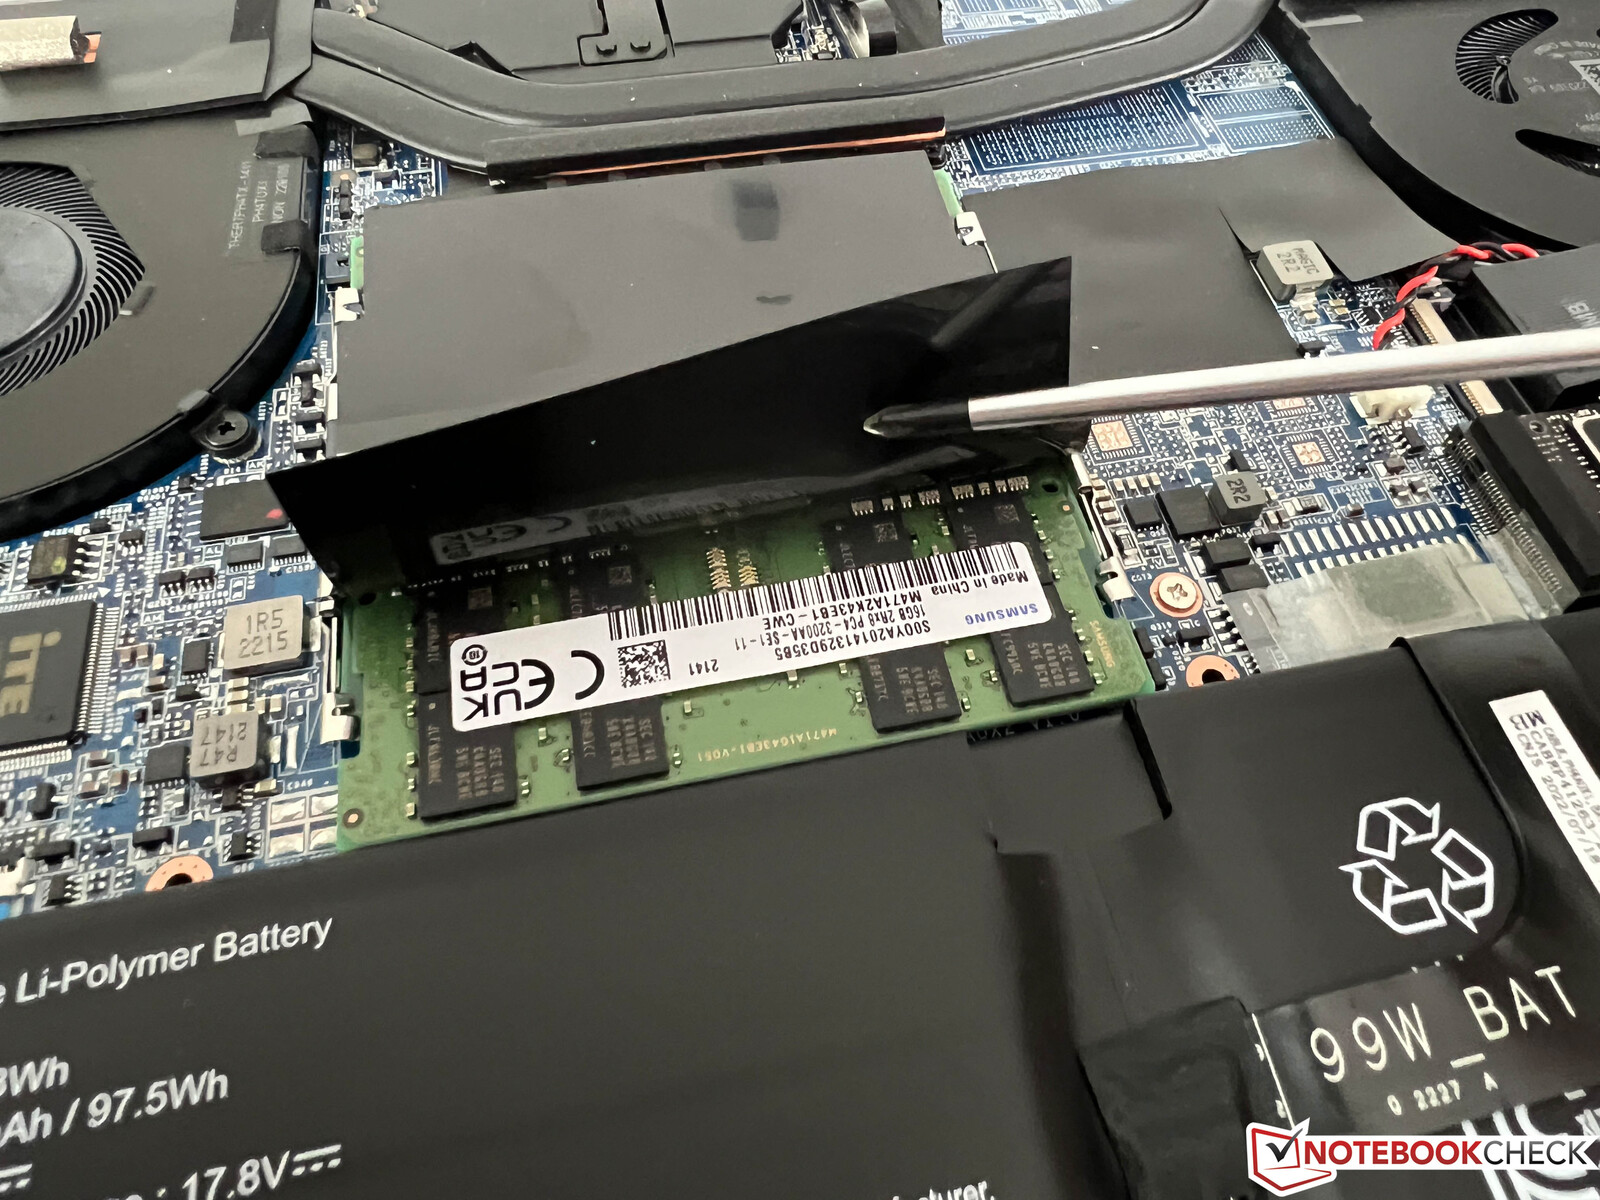
底板可以很容易地取下,立即显示出内部的新的99-Wh,以及主板和扬声器的几个巧合的变化。这意味着新电池不适合以前的Vision 14型号。应该注意的是,二级M.2-2280插槽在配备更大电池的型号上是不可用的。内存和Wi-Fi模块仍然可以升级。
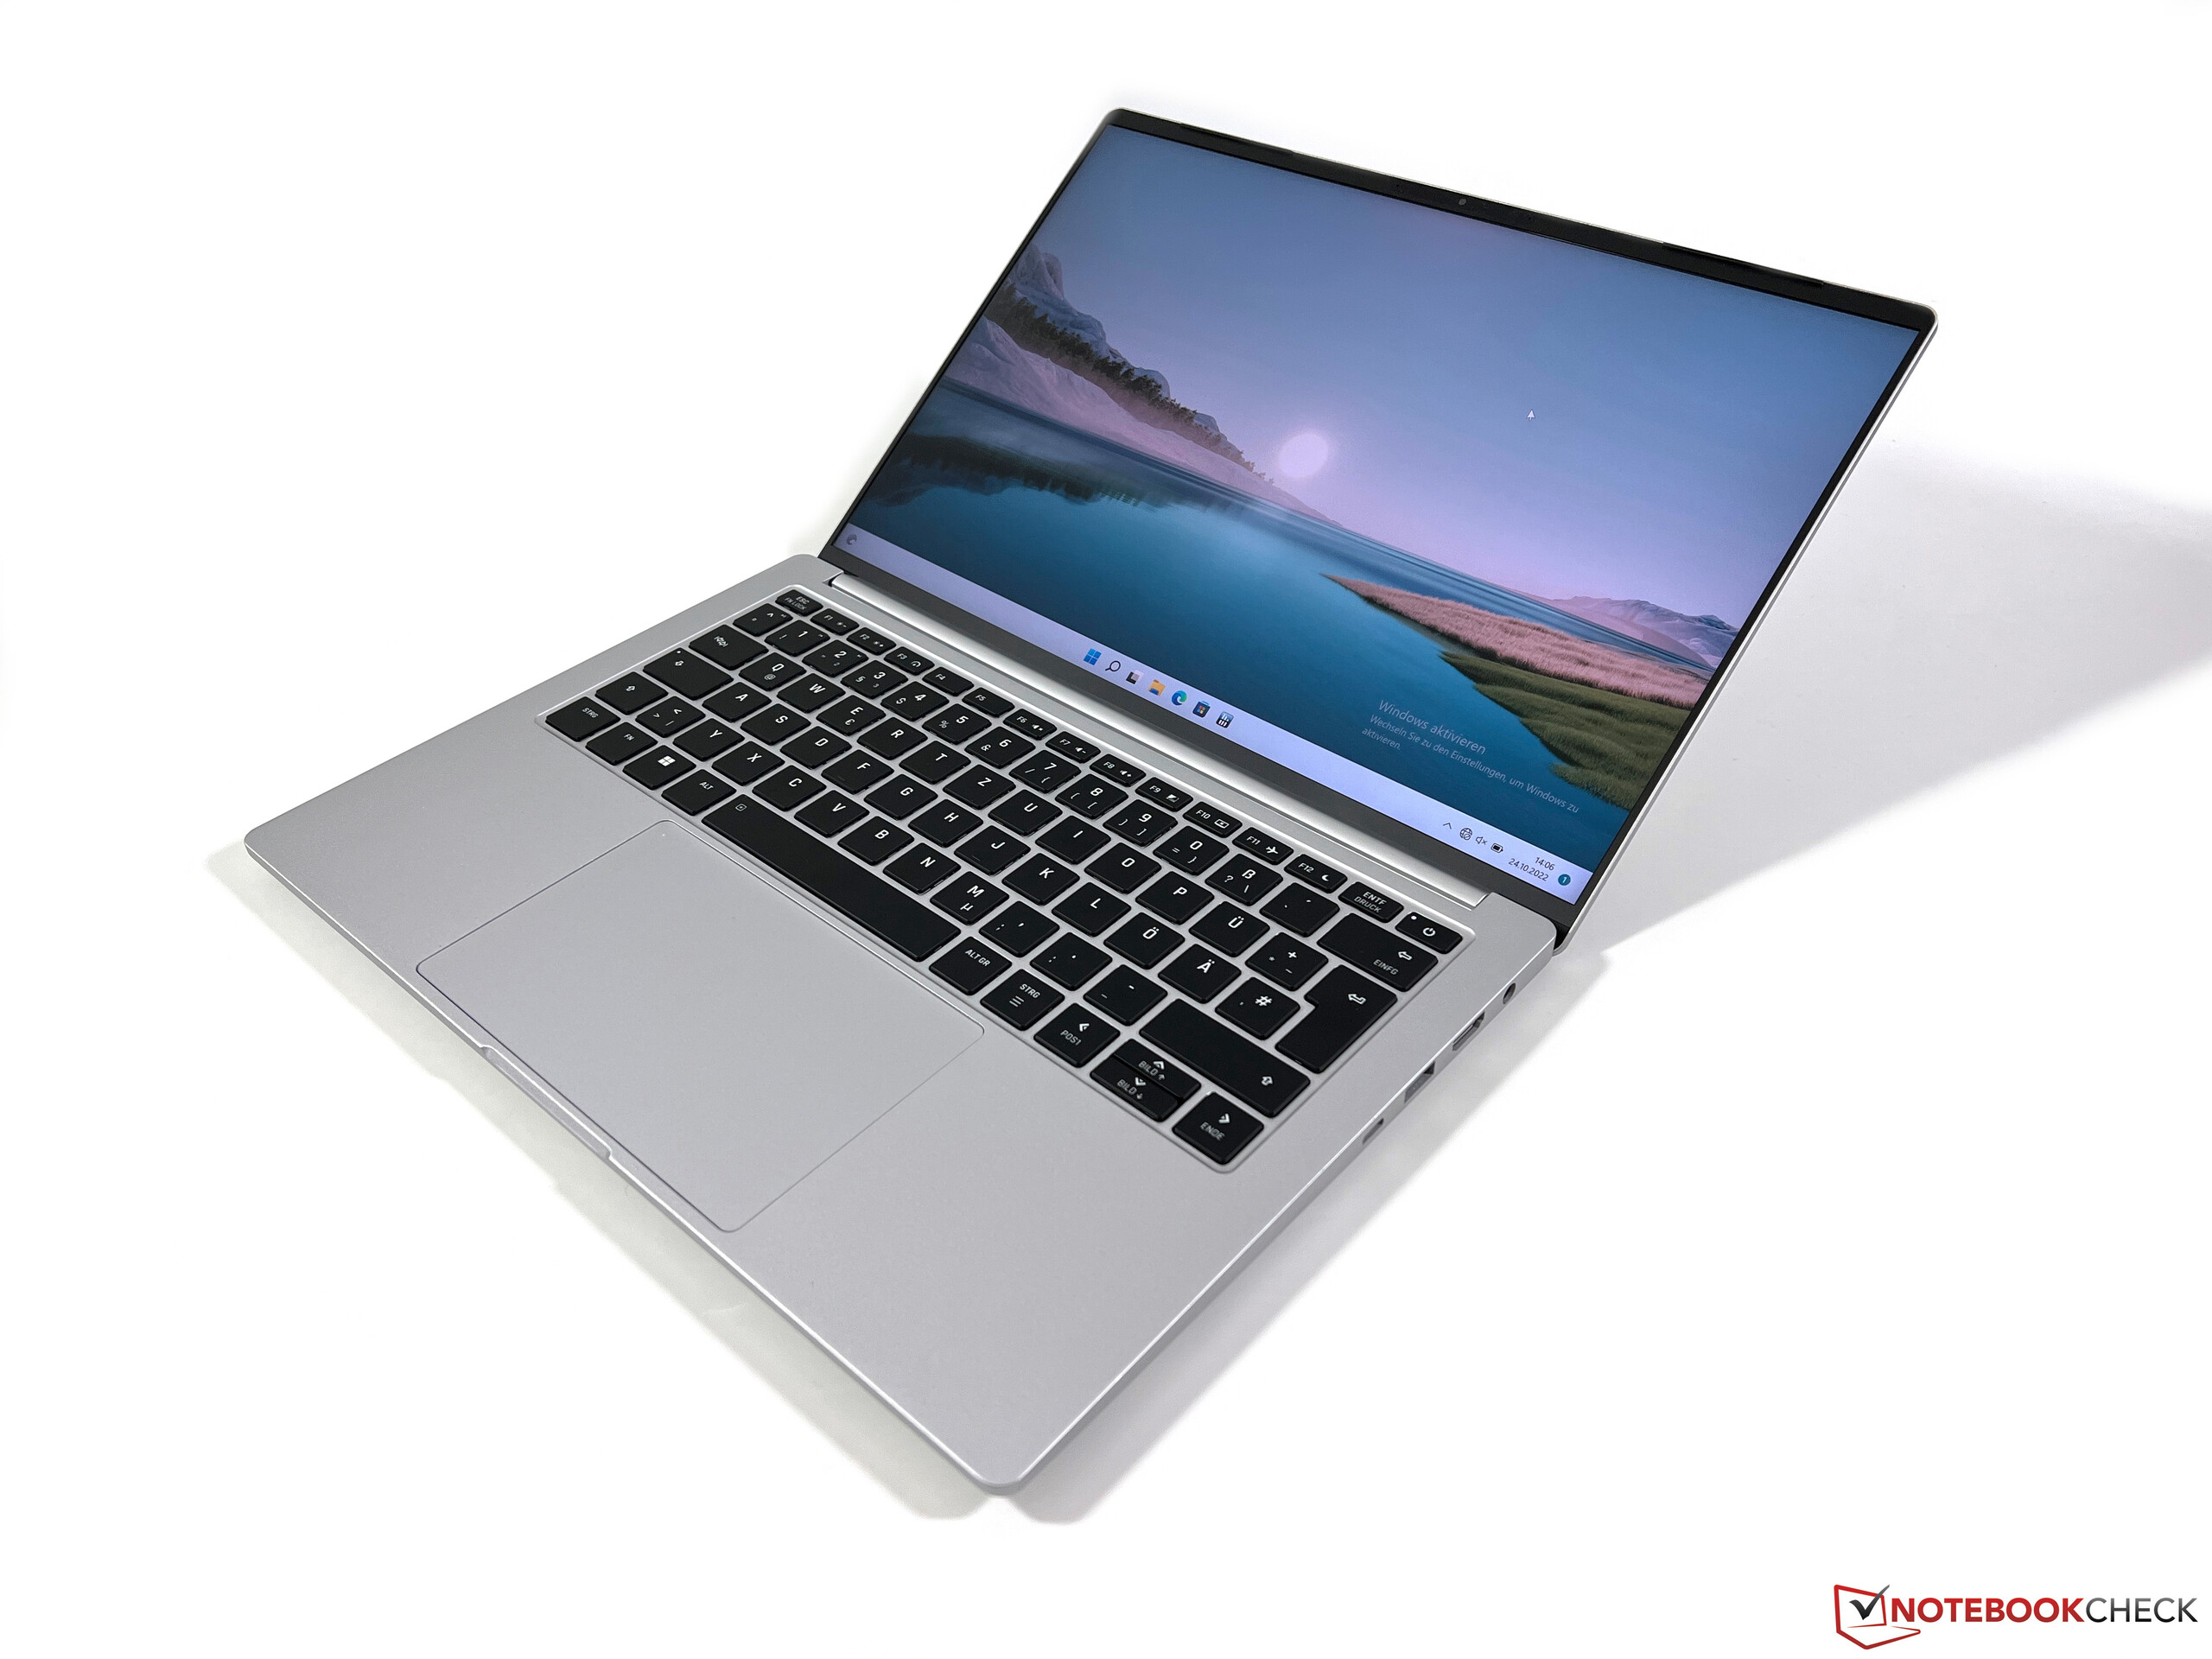
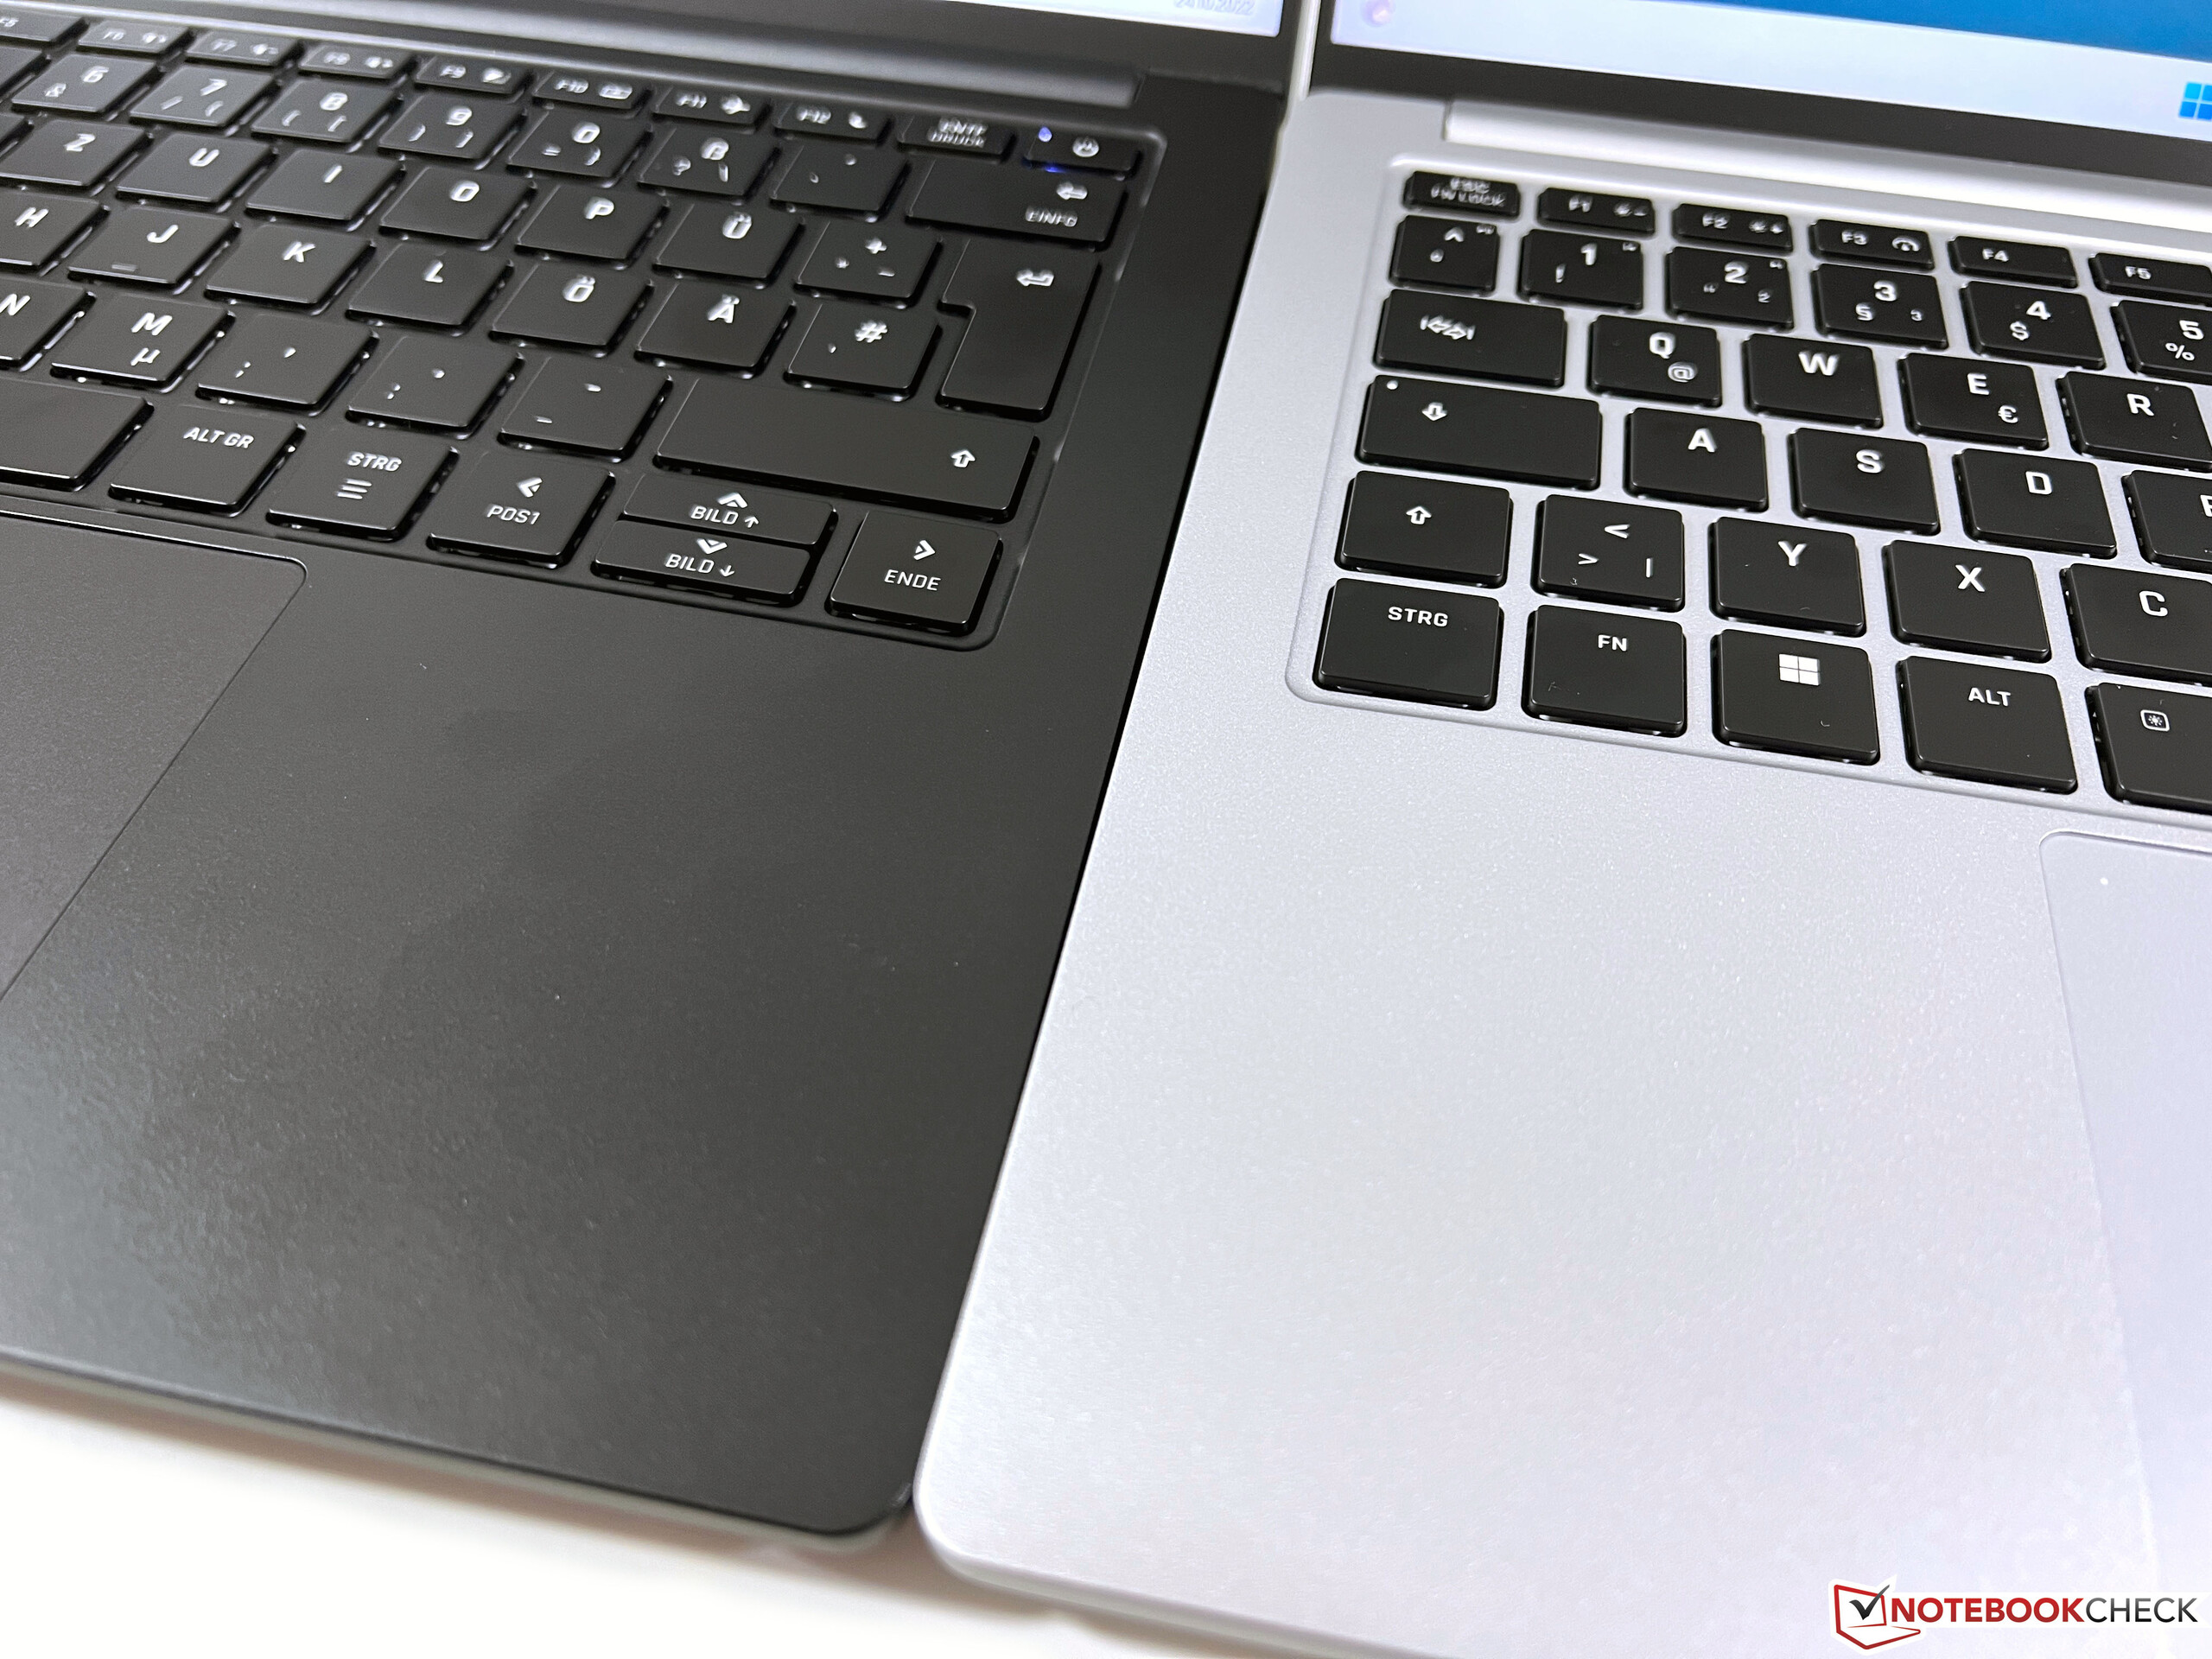
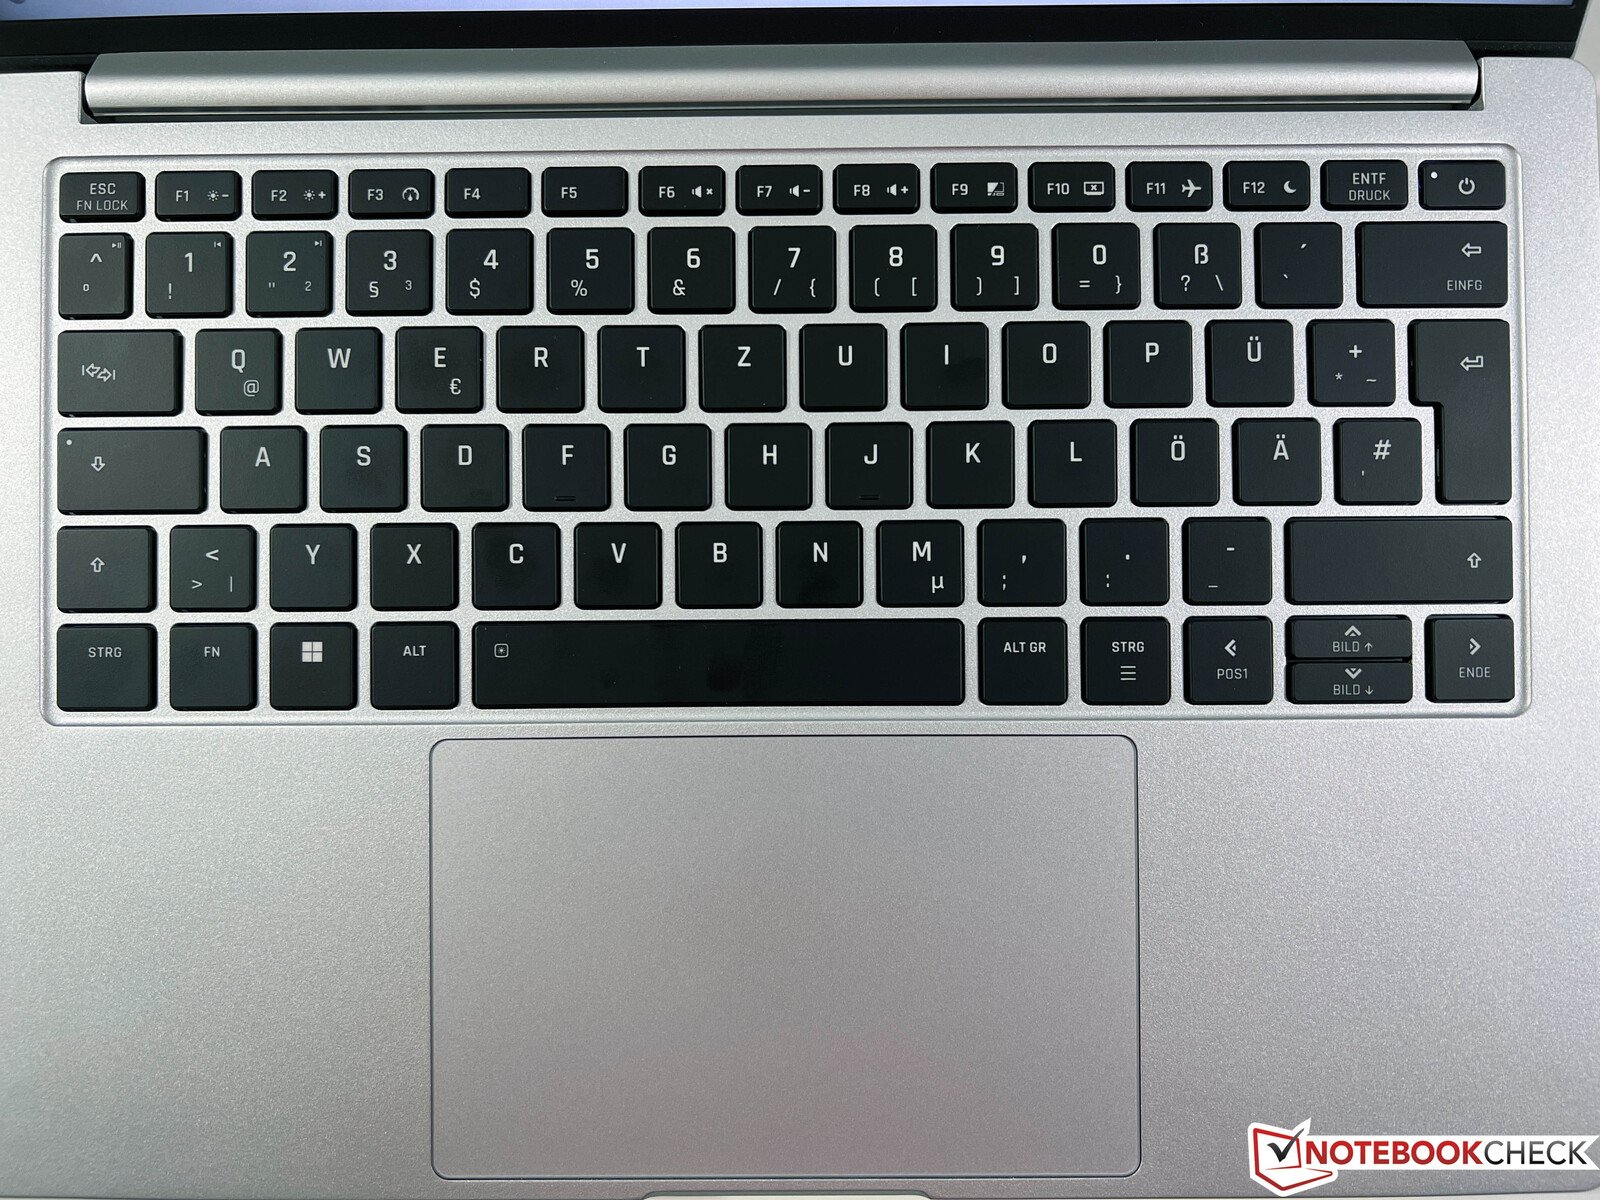
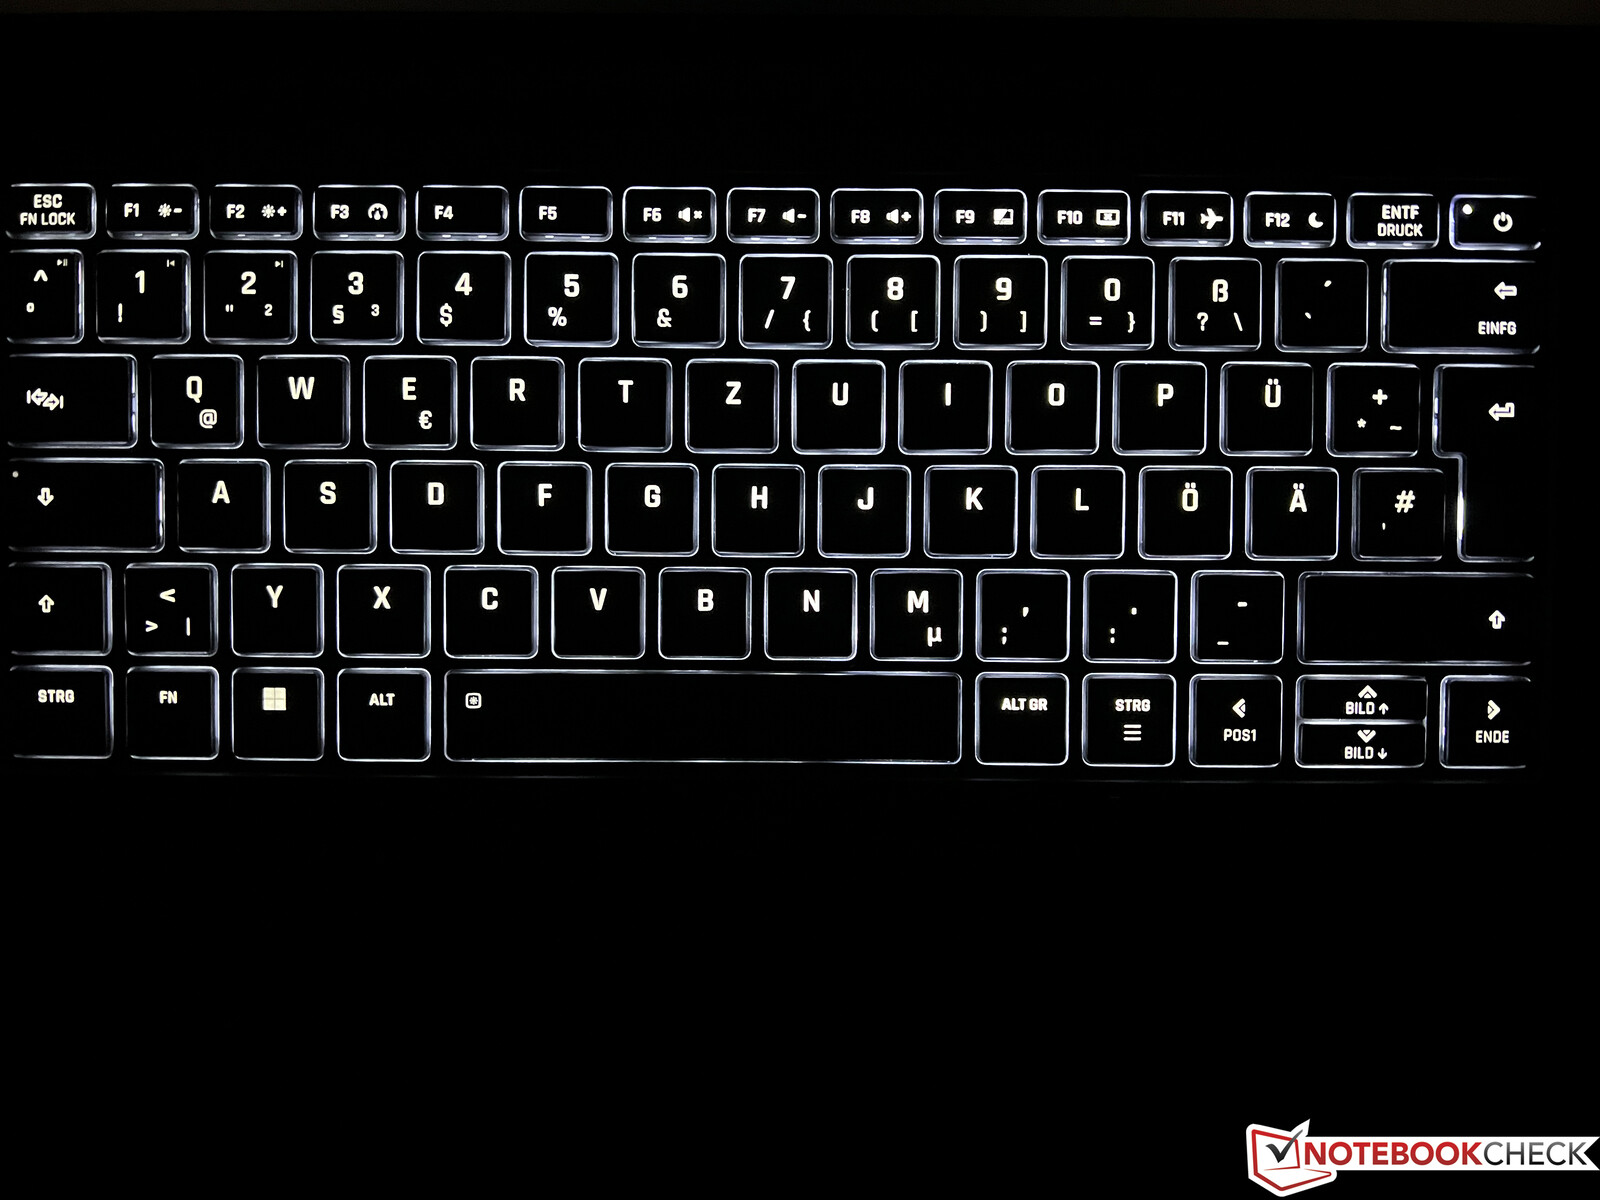
输入设备 - 背光键盘和玻璃触摸板
输入设备与之前的型号相比没有变化。 以前的型号.背光键盘提供了舒适的打字体验和安静的按键咔哒声。虽然玻璃触摸板(13 x 8厘米/5.12 x 3.15英寸)也很好,但它的咔嚓声非常响。
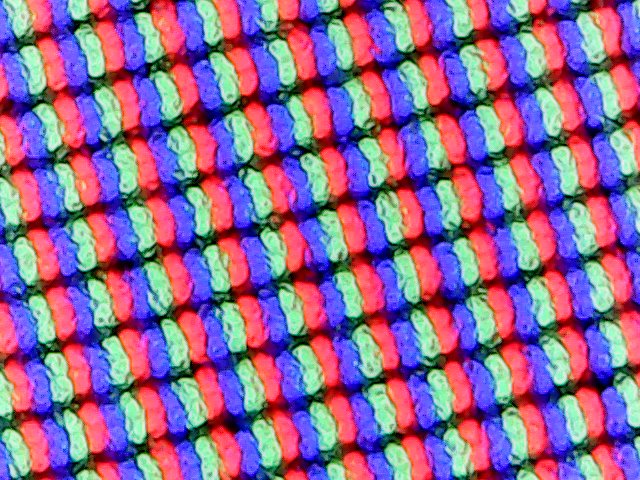
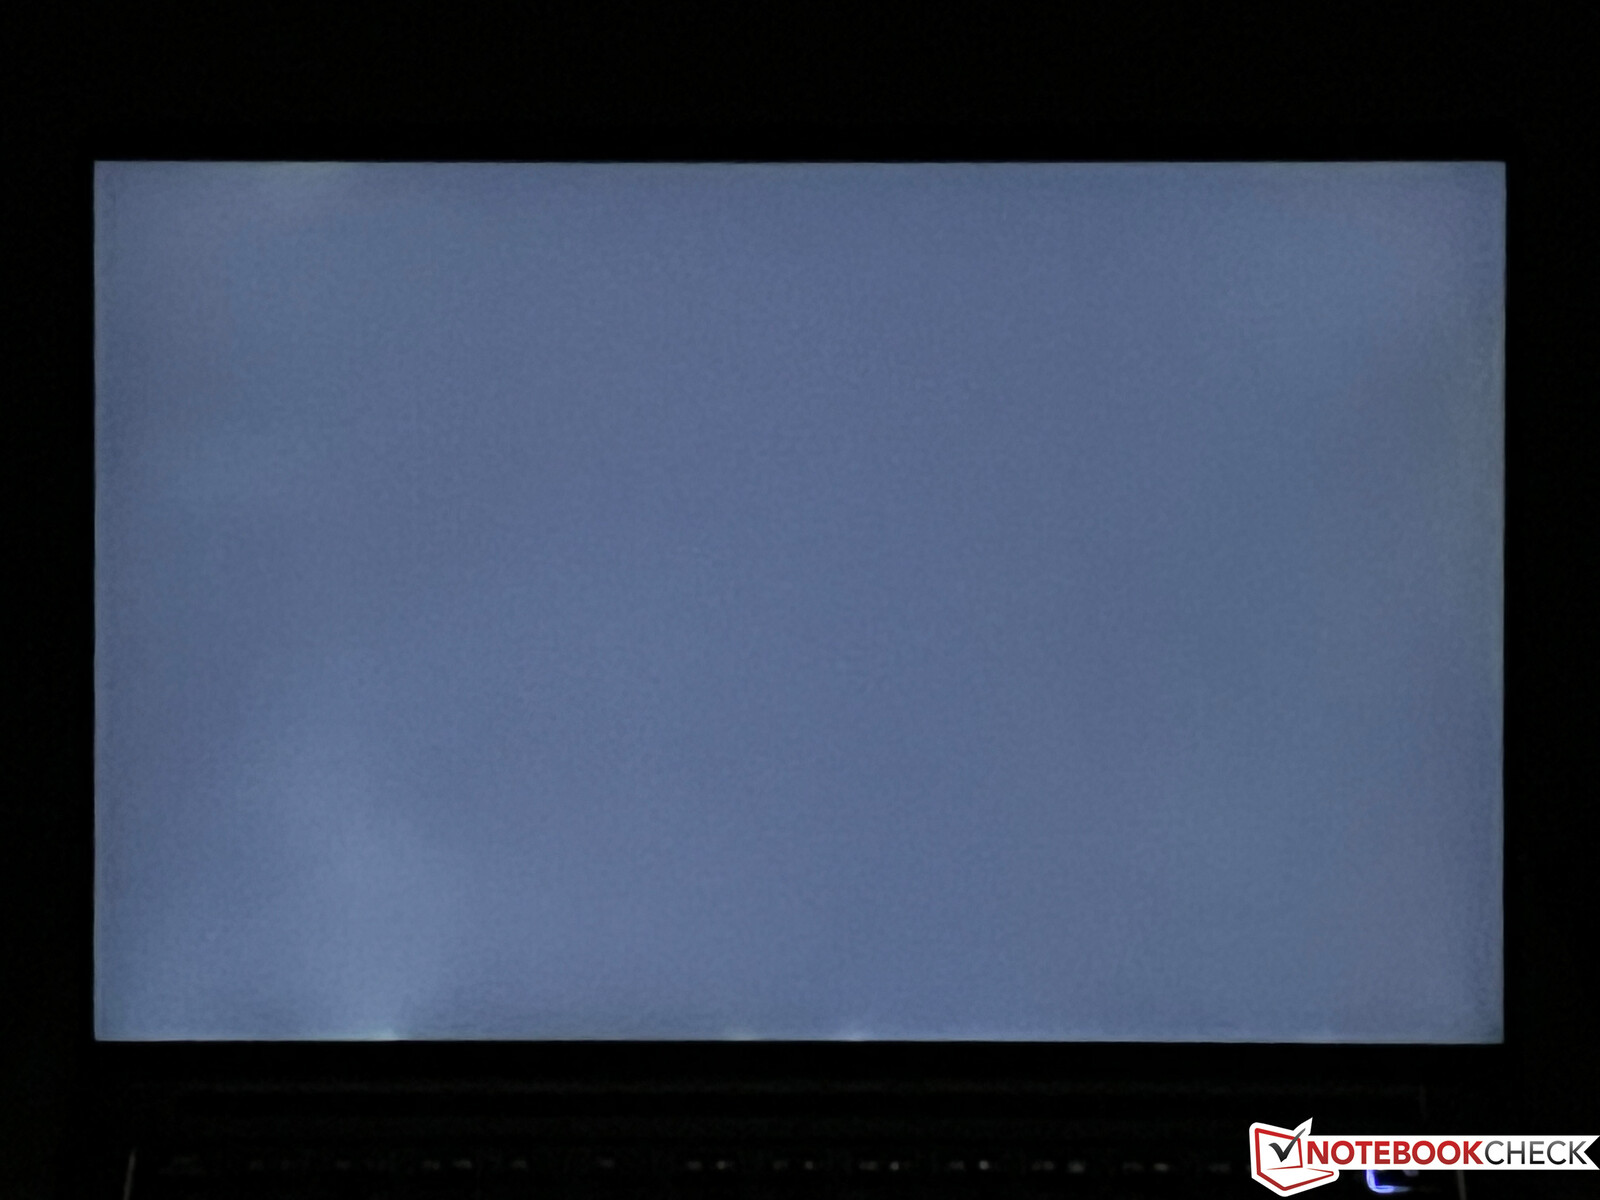
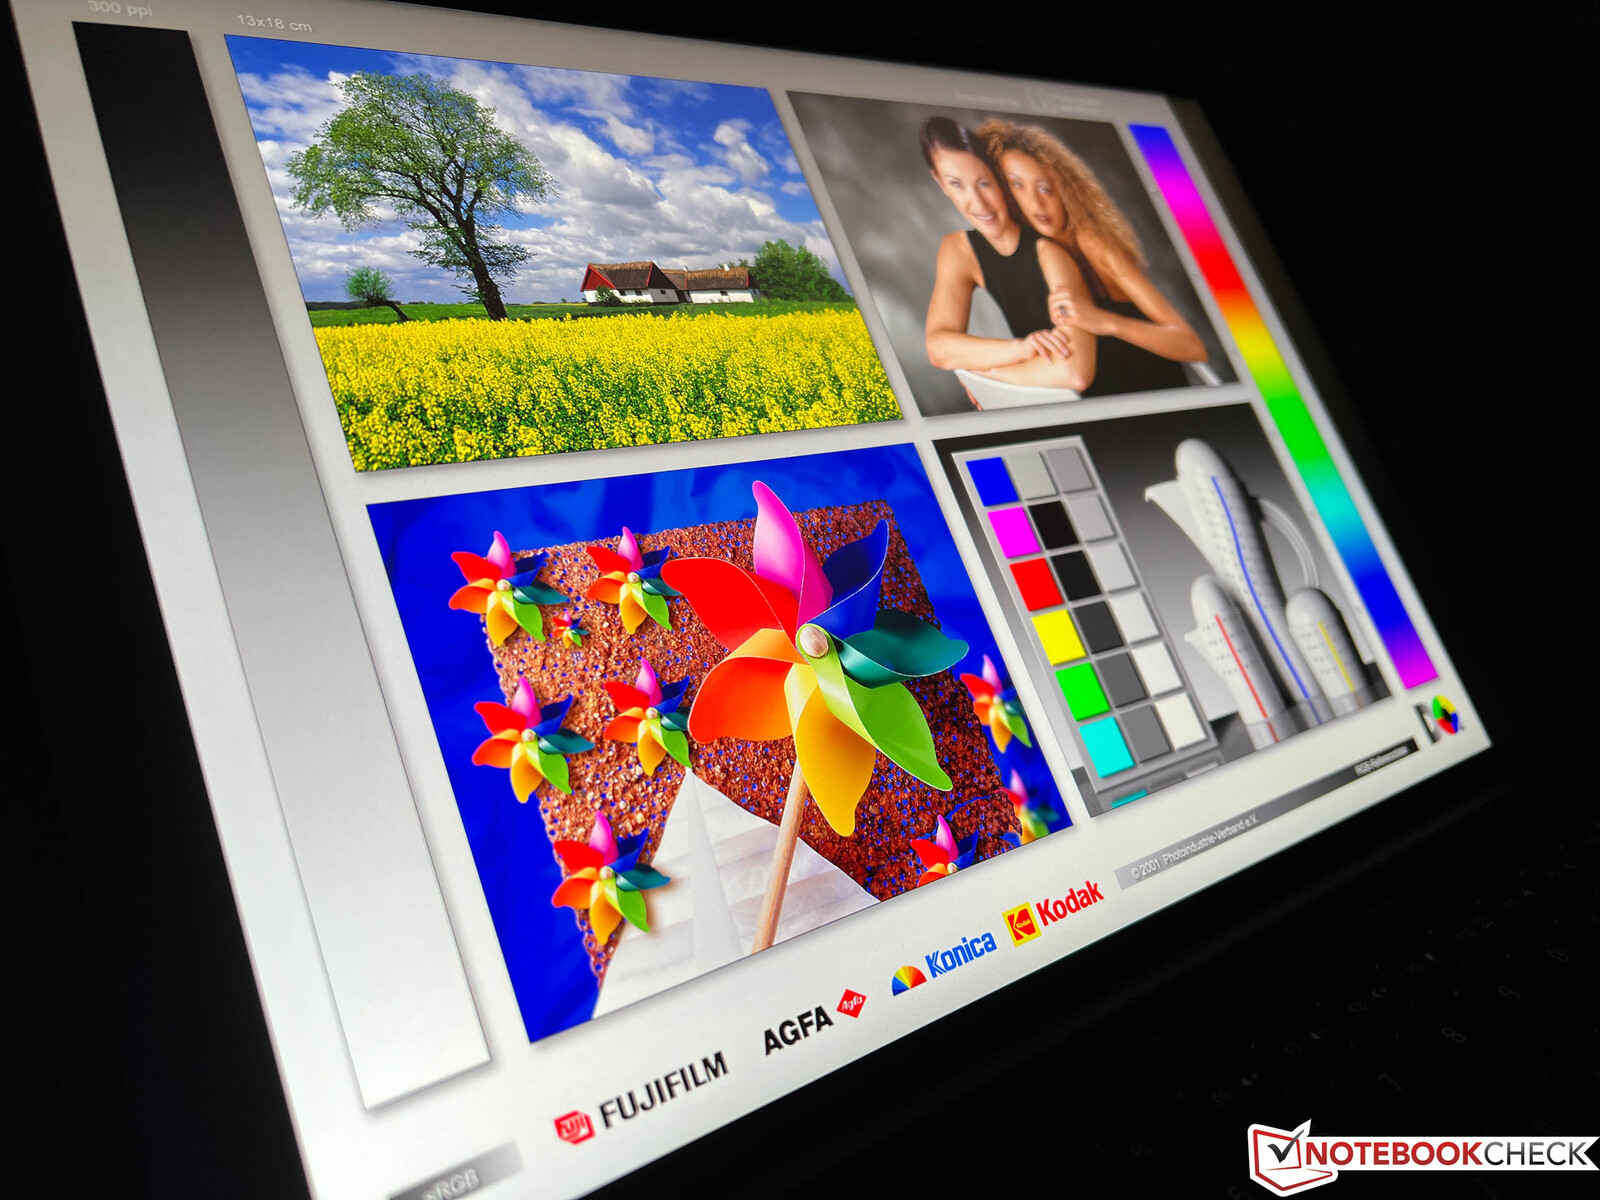
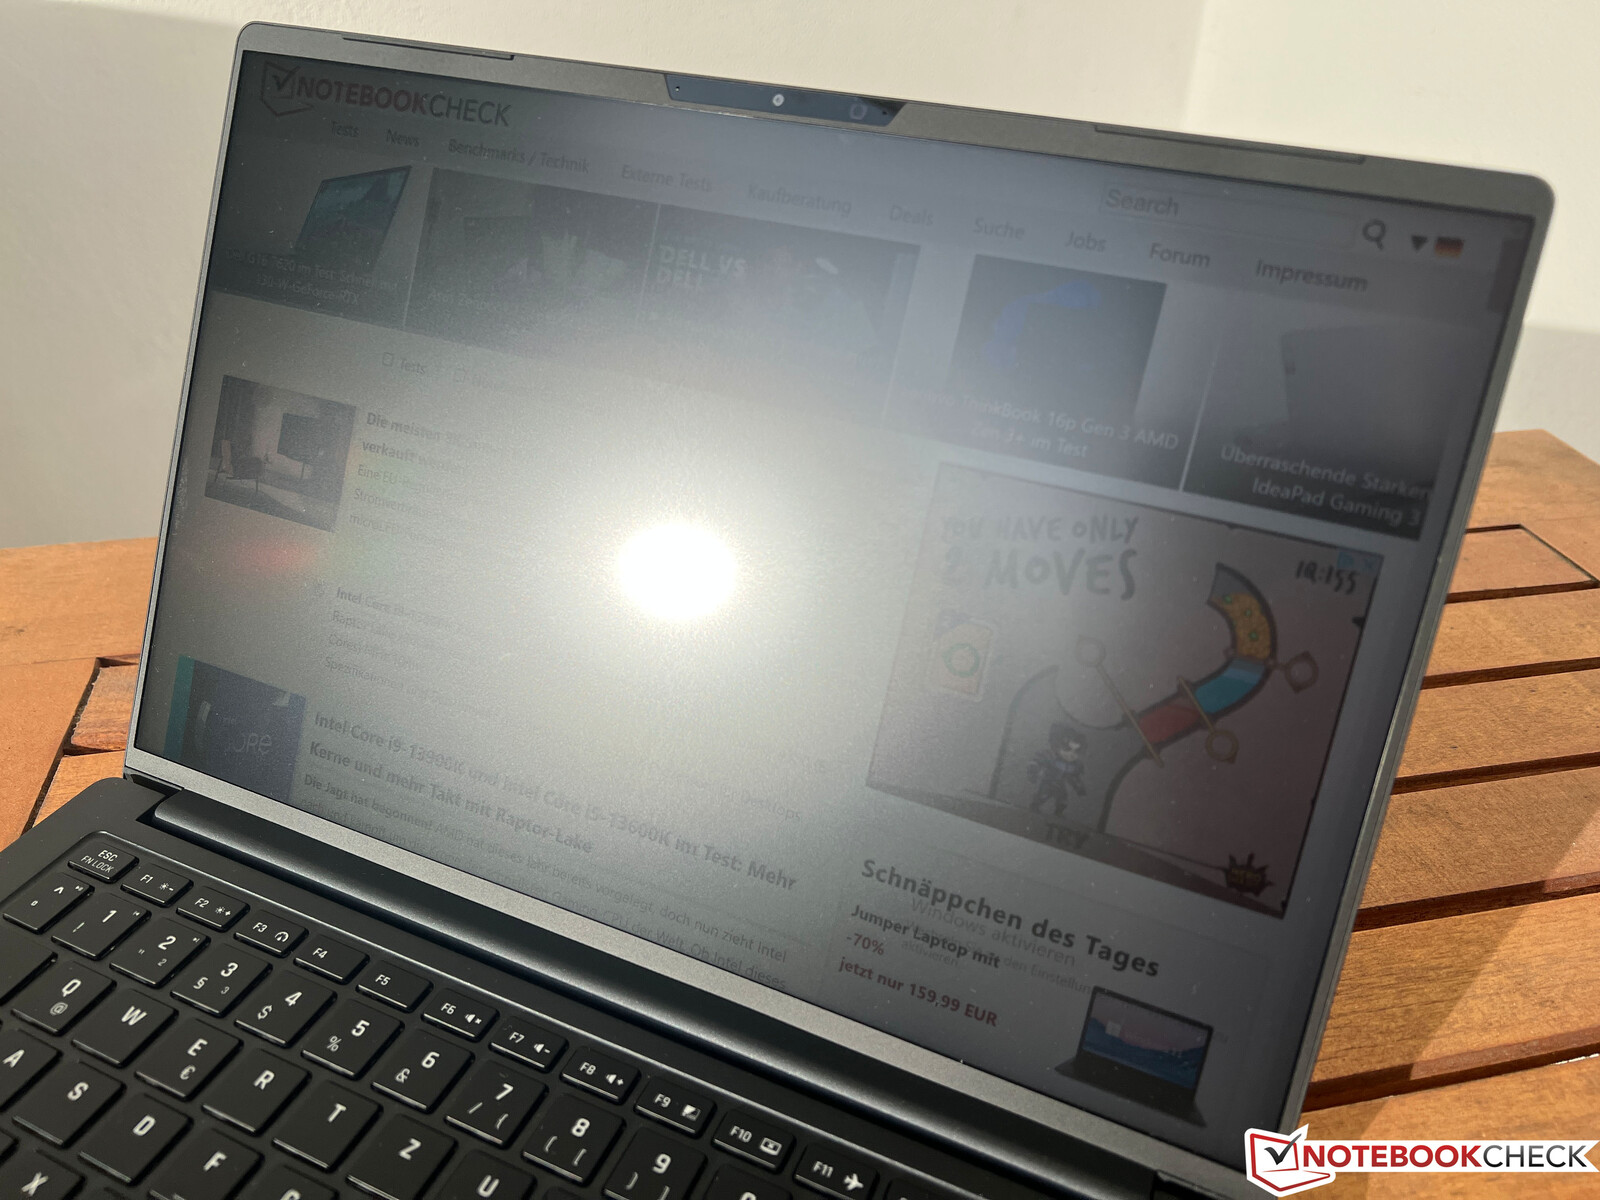
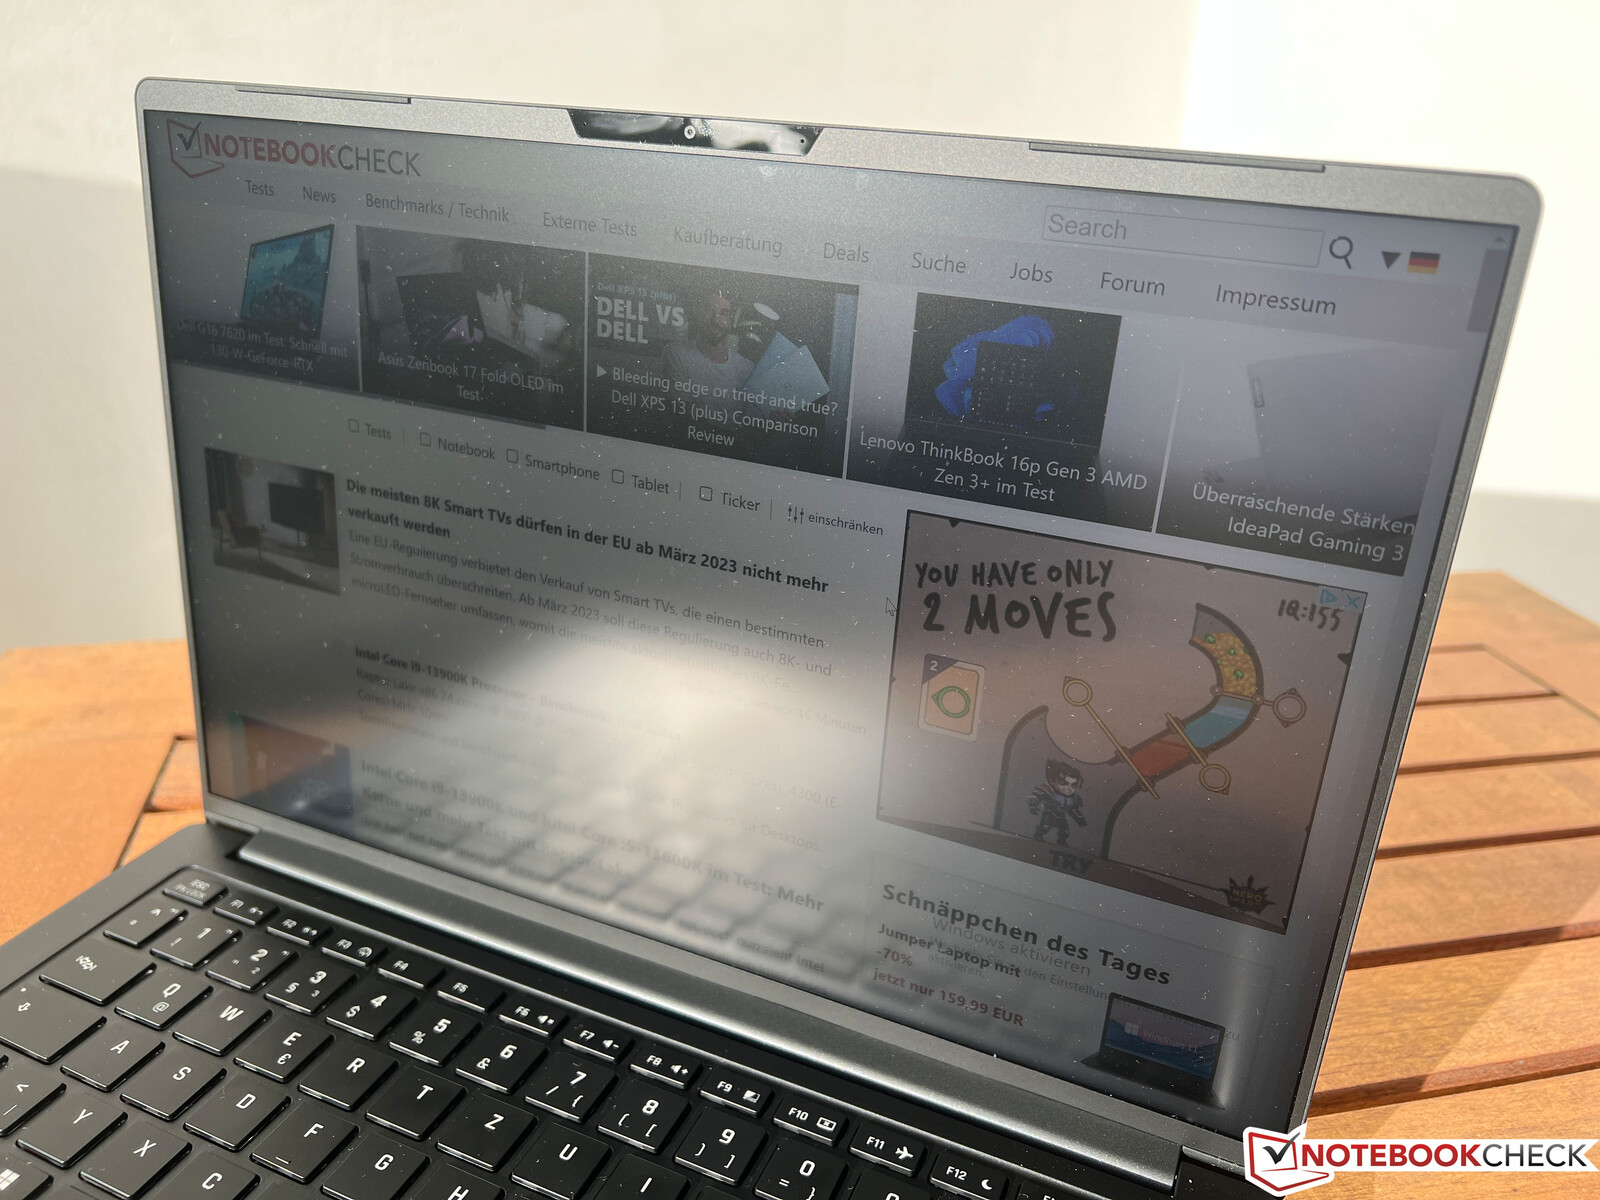
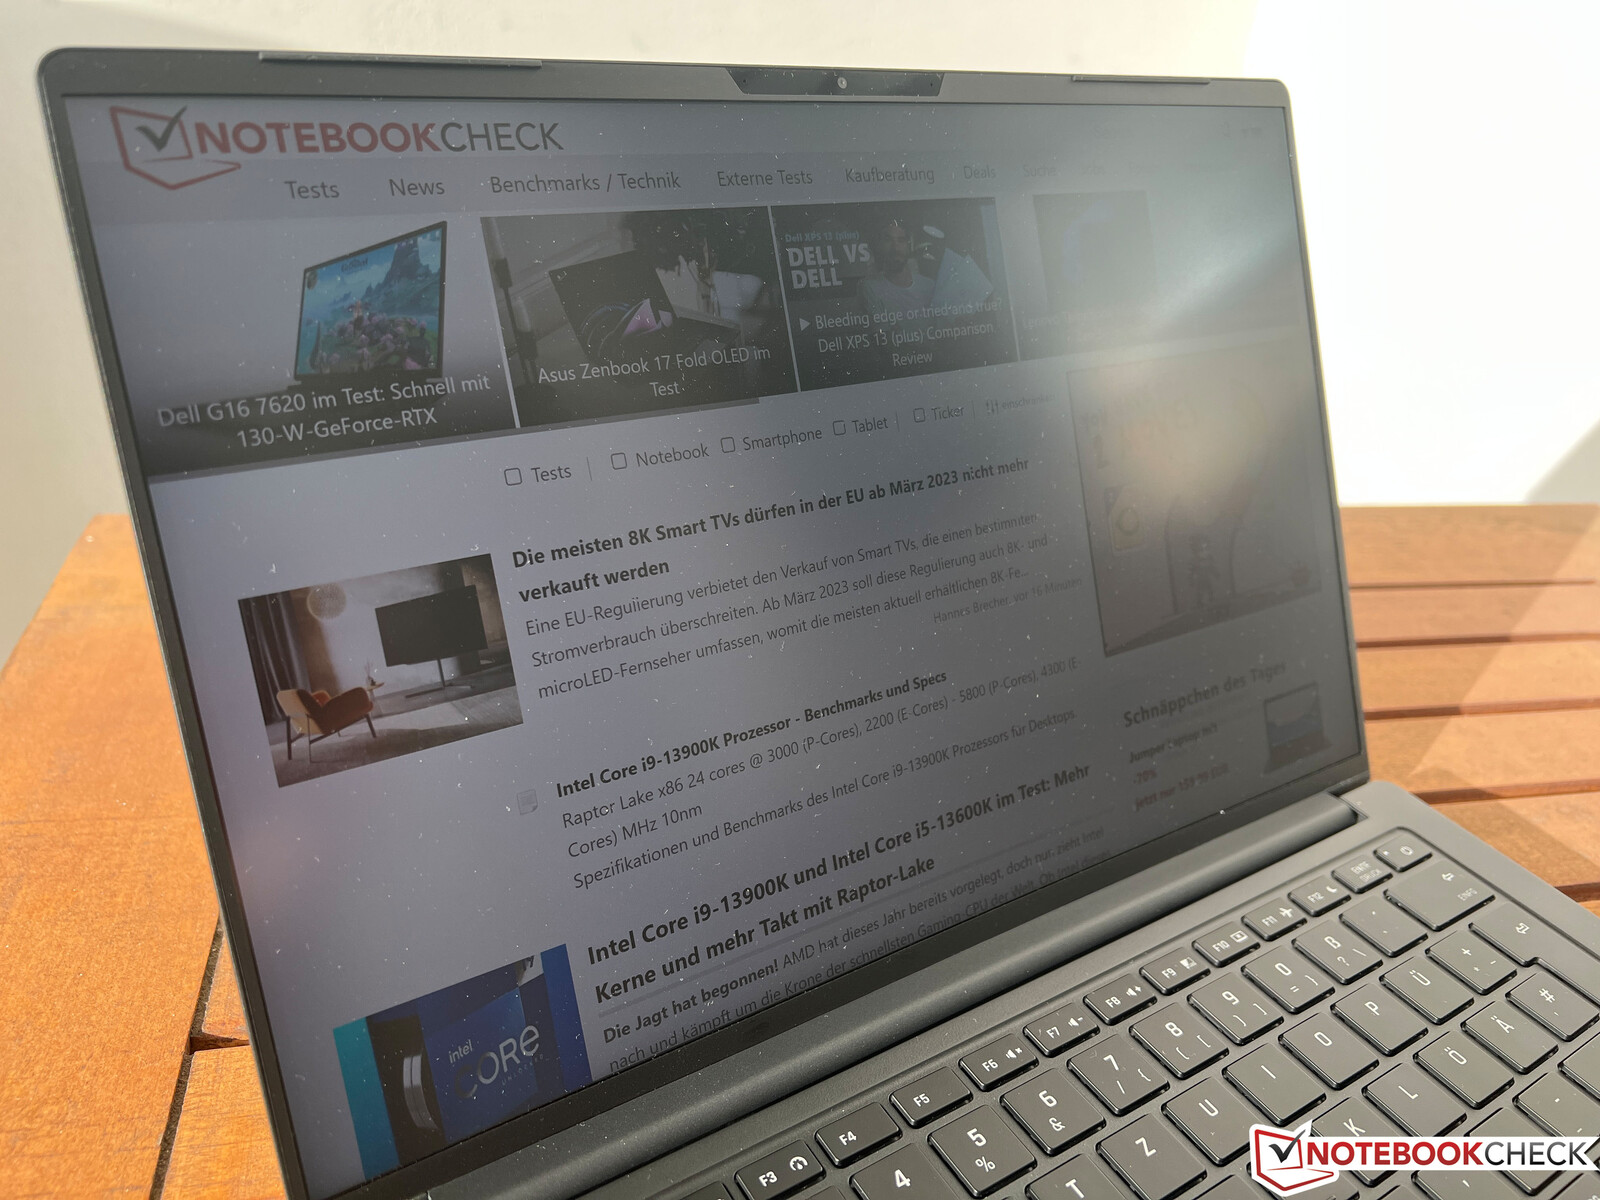
显示屏 - Vision 14 Still with 3K IPS and 90 Hz
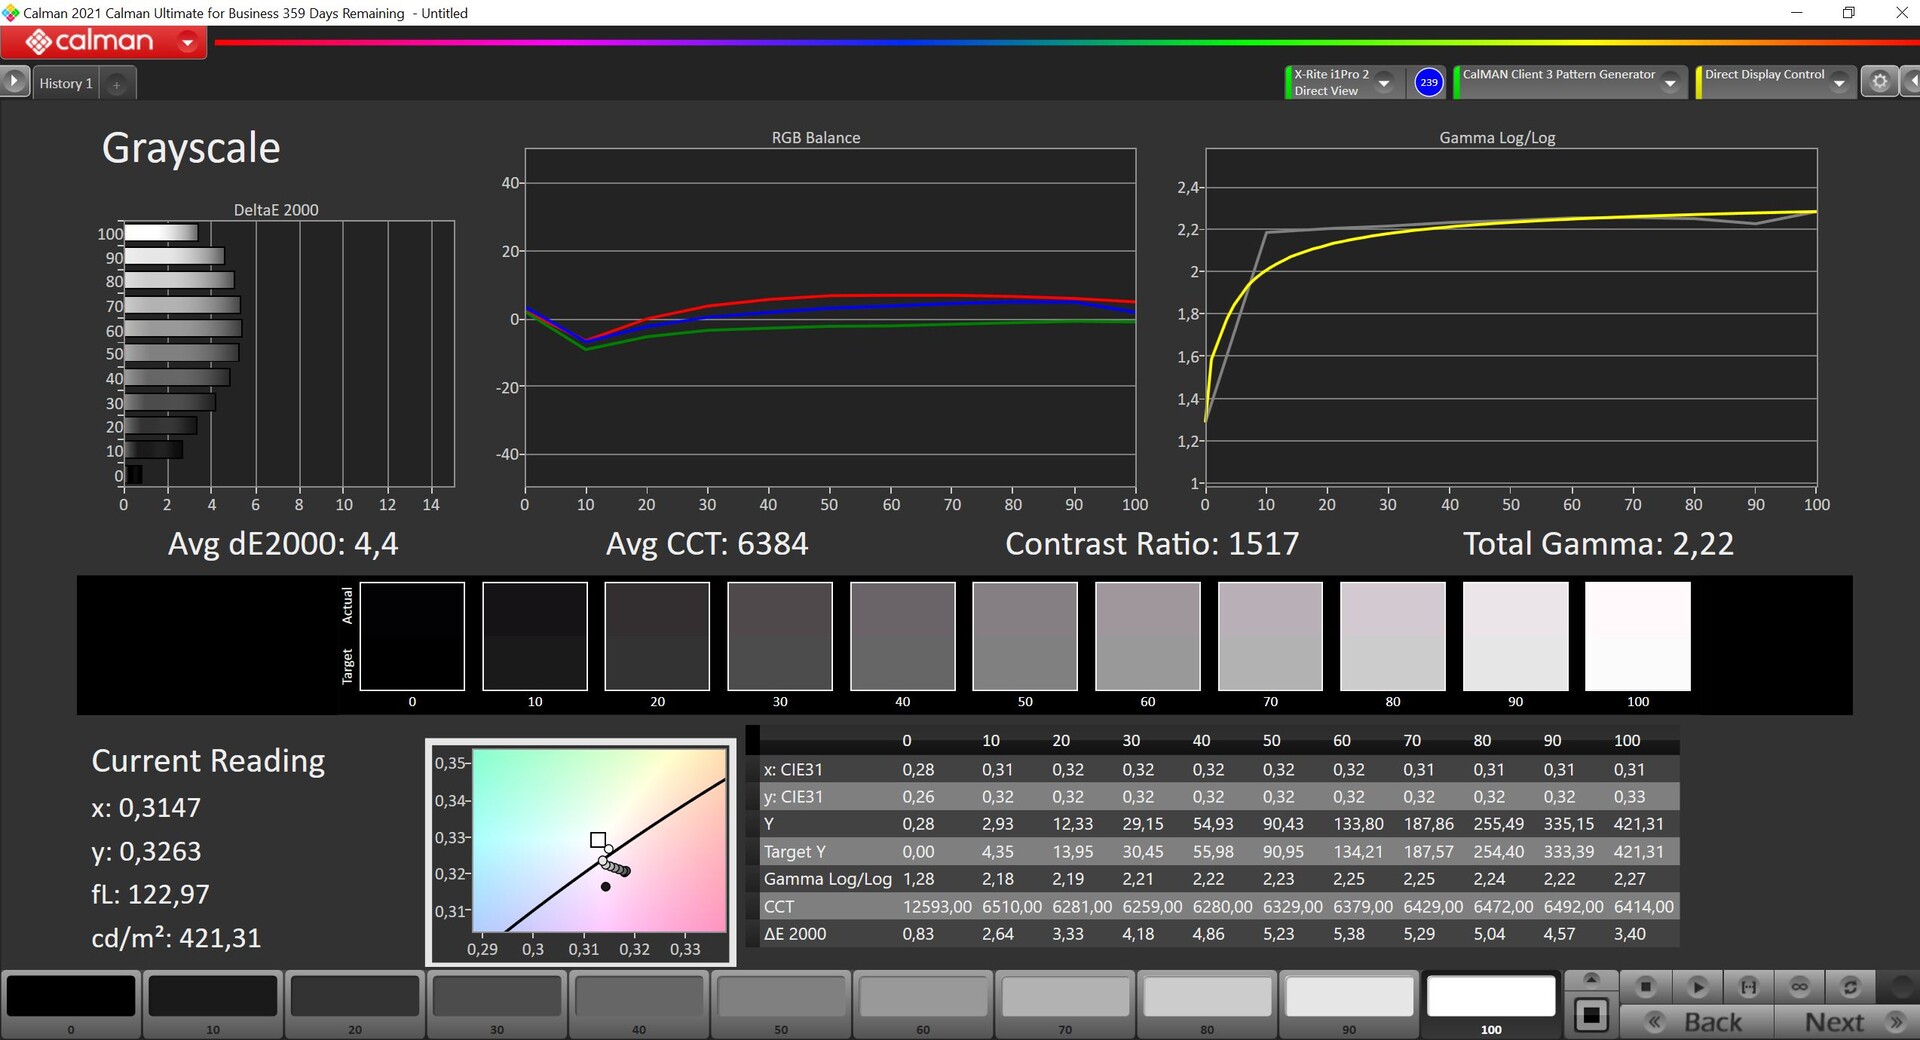
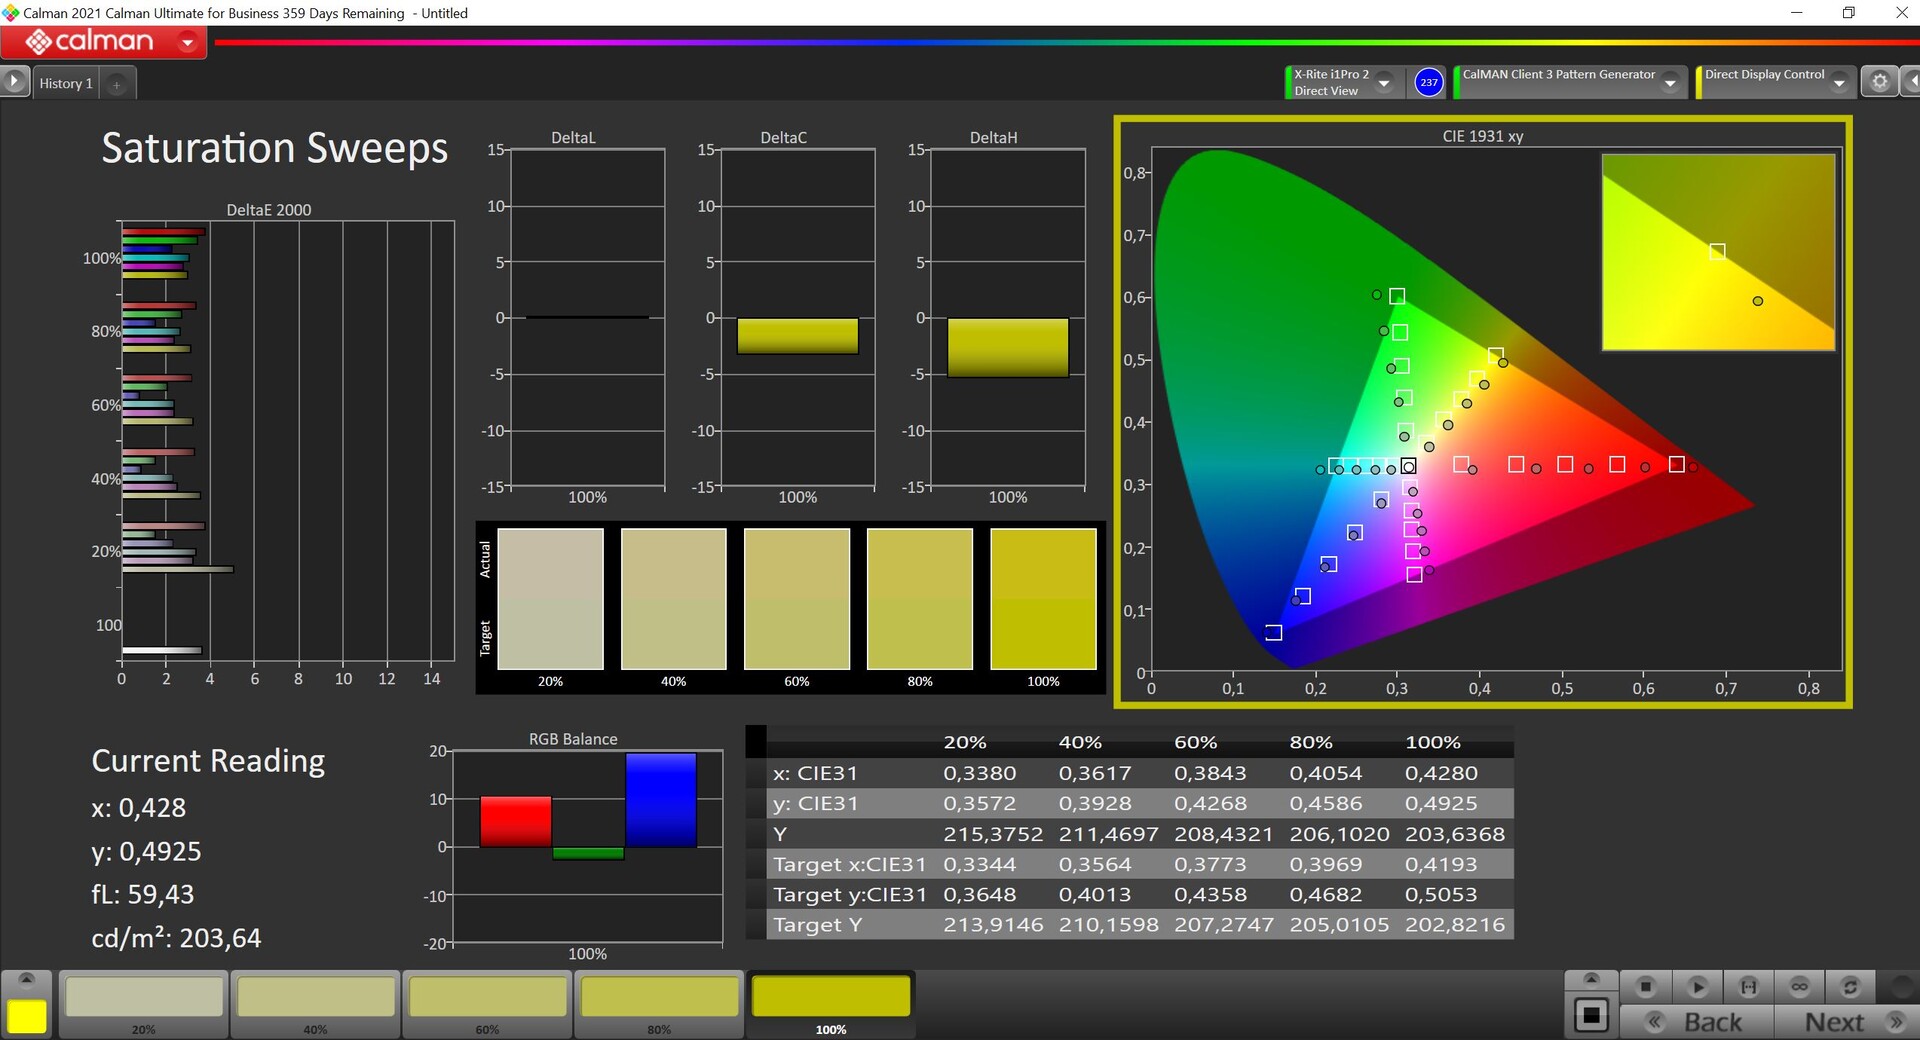
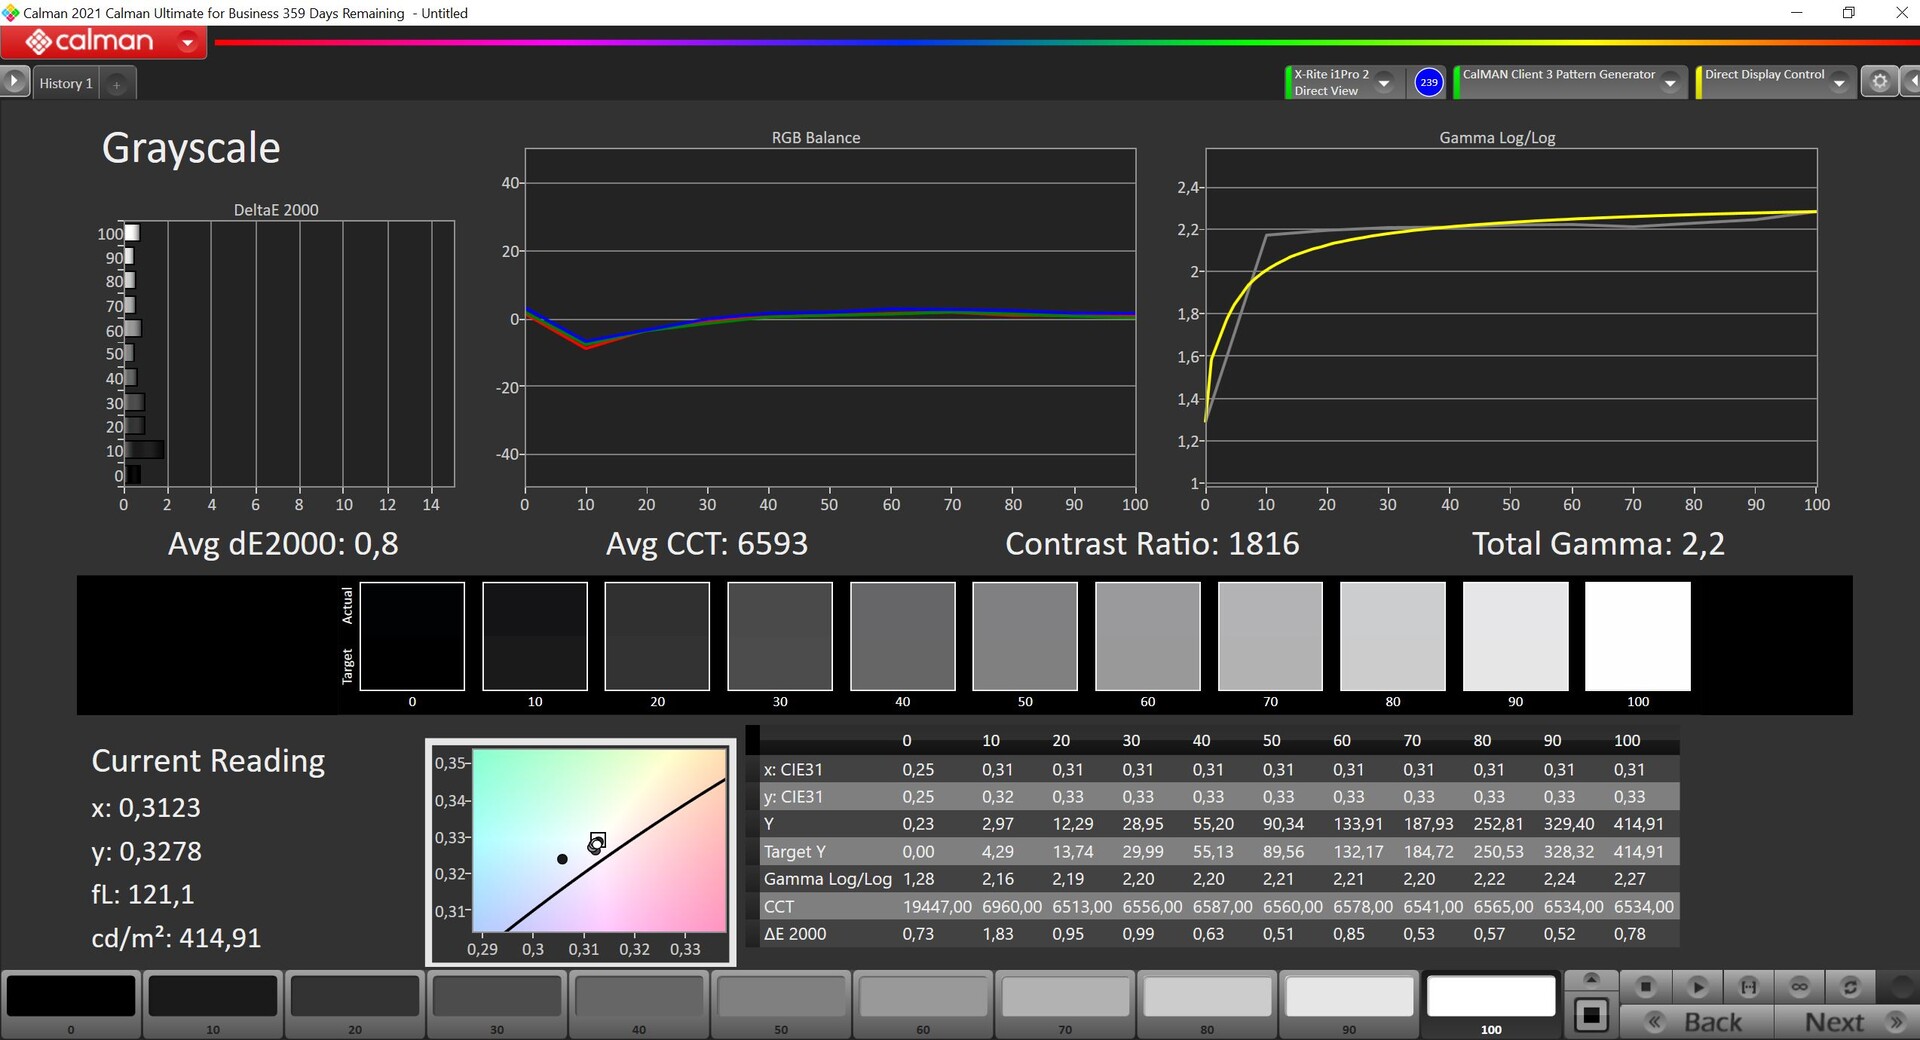
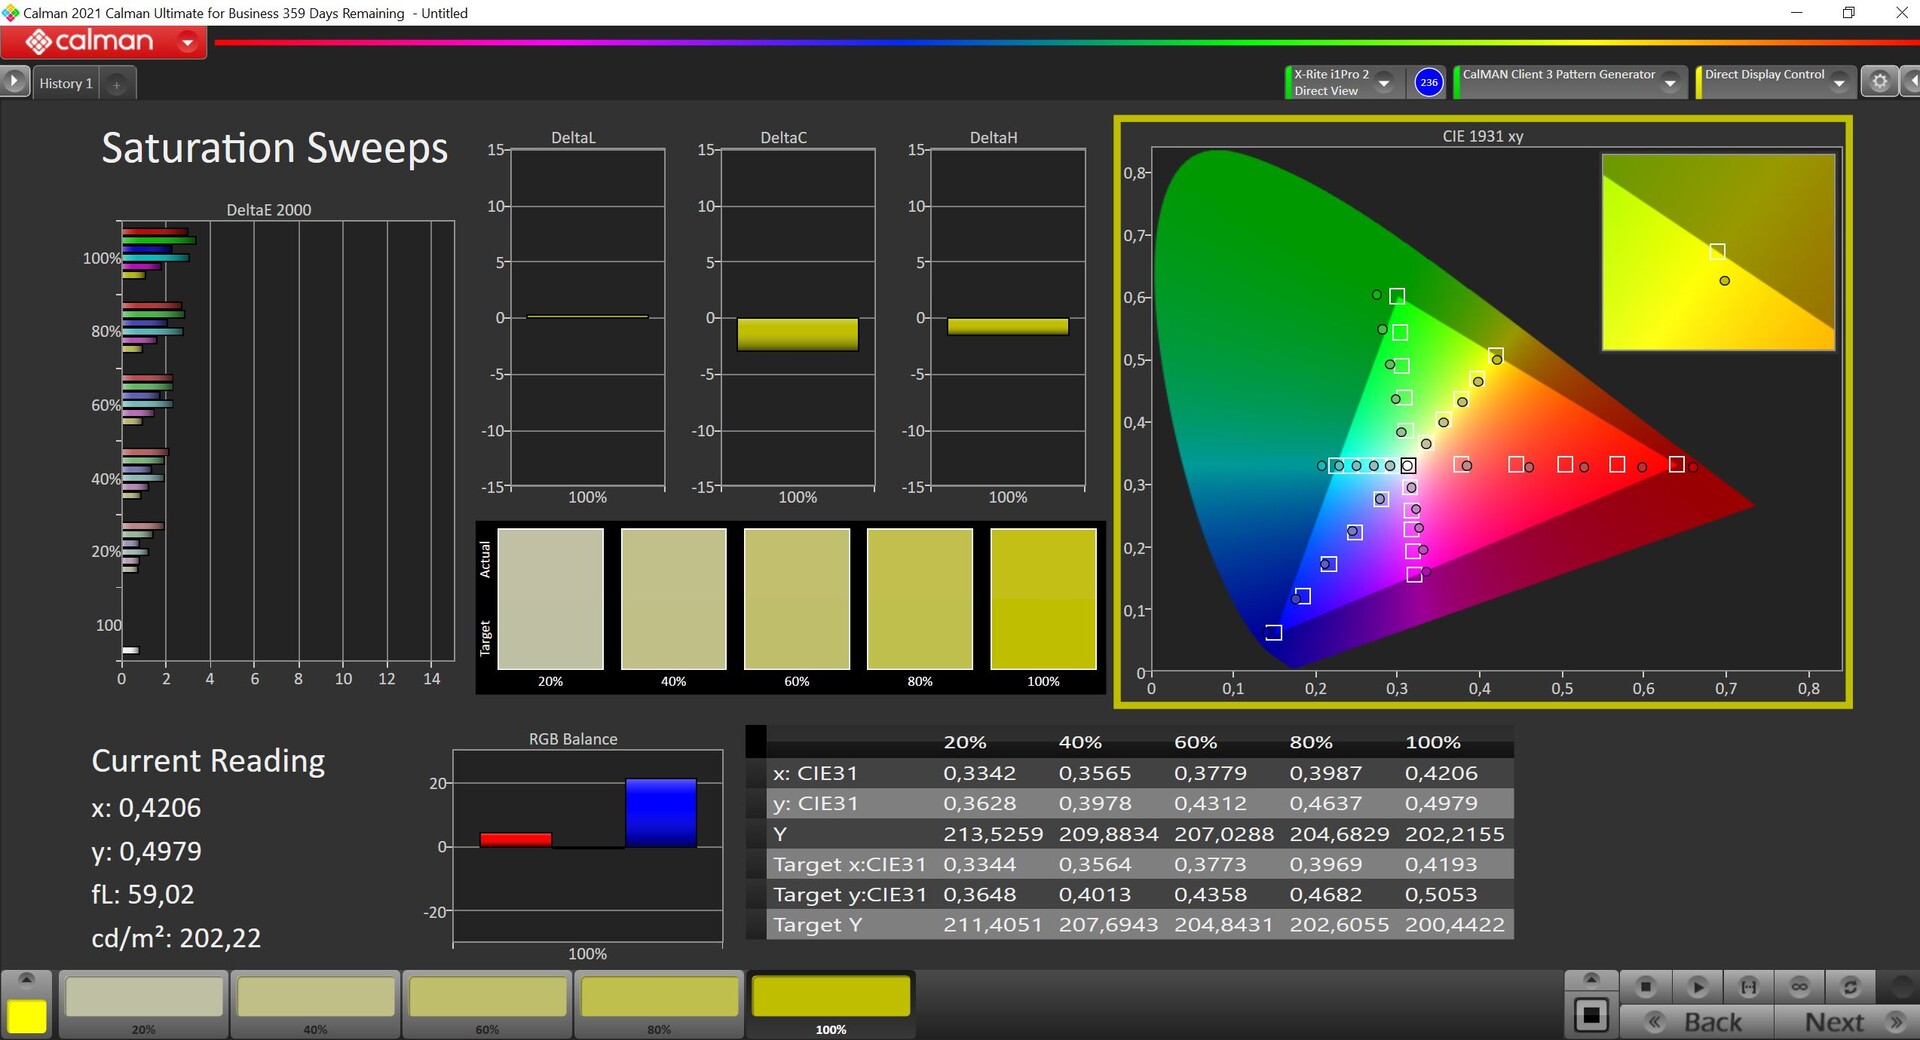
对于显示屏没有什么可说的,因为制造商仍然依赖于相同的、哑光的3K面板(16:10,2880 x 1800像素)。显示质量很好,尽管有哑光层,但明亮的区域看起来没有颗粒感。在我们专业的CalMAN软件分析中,该面板的表现也不错。它的平均亮度达到了约415尼特,对比度为1500:1。在出厂时,有一个微弱的色调,尽管我们能够通过校准来解决这个问题。由于全sRGB覆盖,照片编辑也是可能的。该面板不依赖PWM。
| |||||||||||||||||||||||||
Brightness Distribution: 89 %
Center on Battery: 424 cd/m²
Contrast: 1504:1 (Black: 0.28 cd/m²)
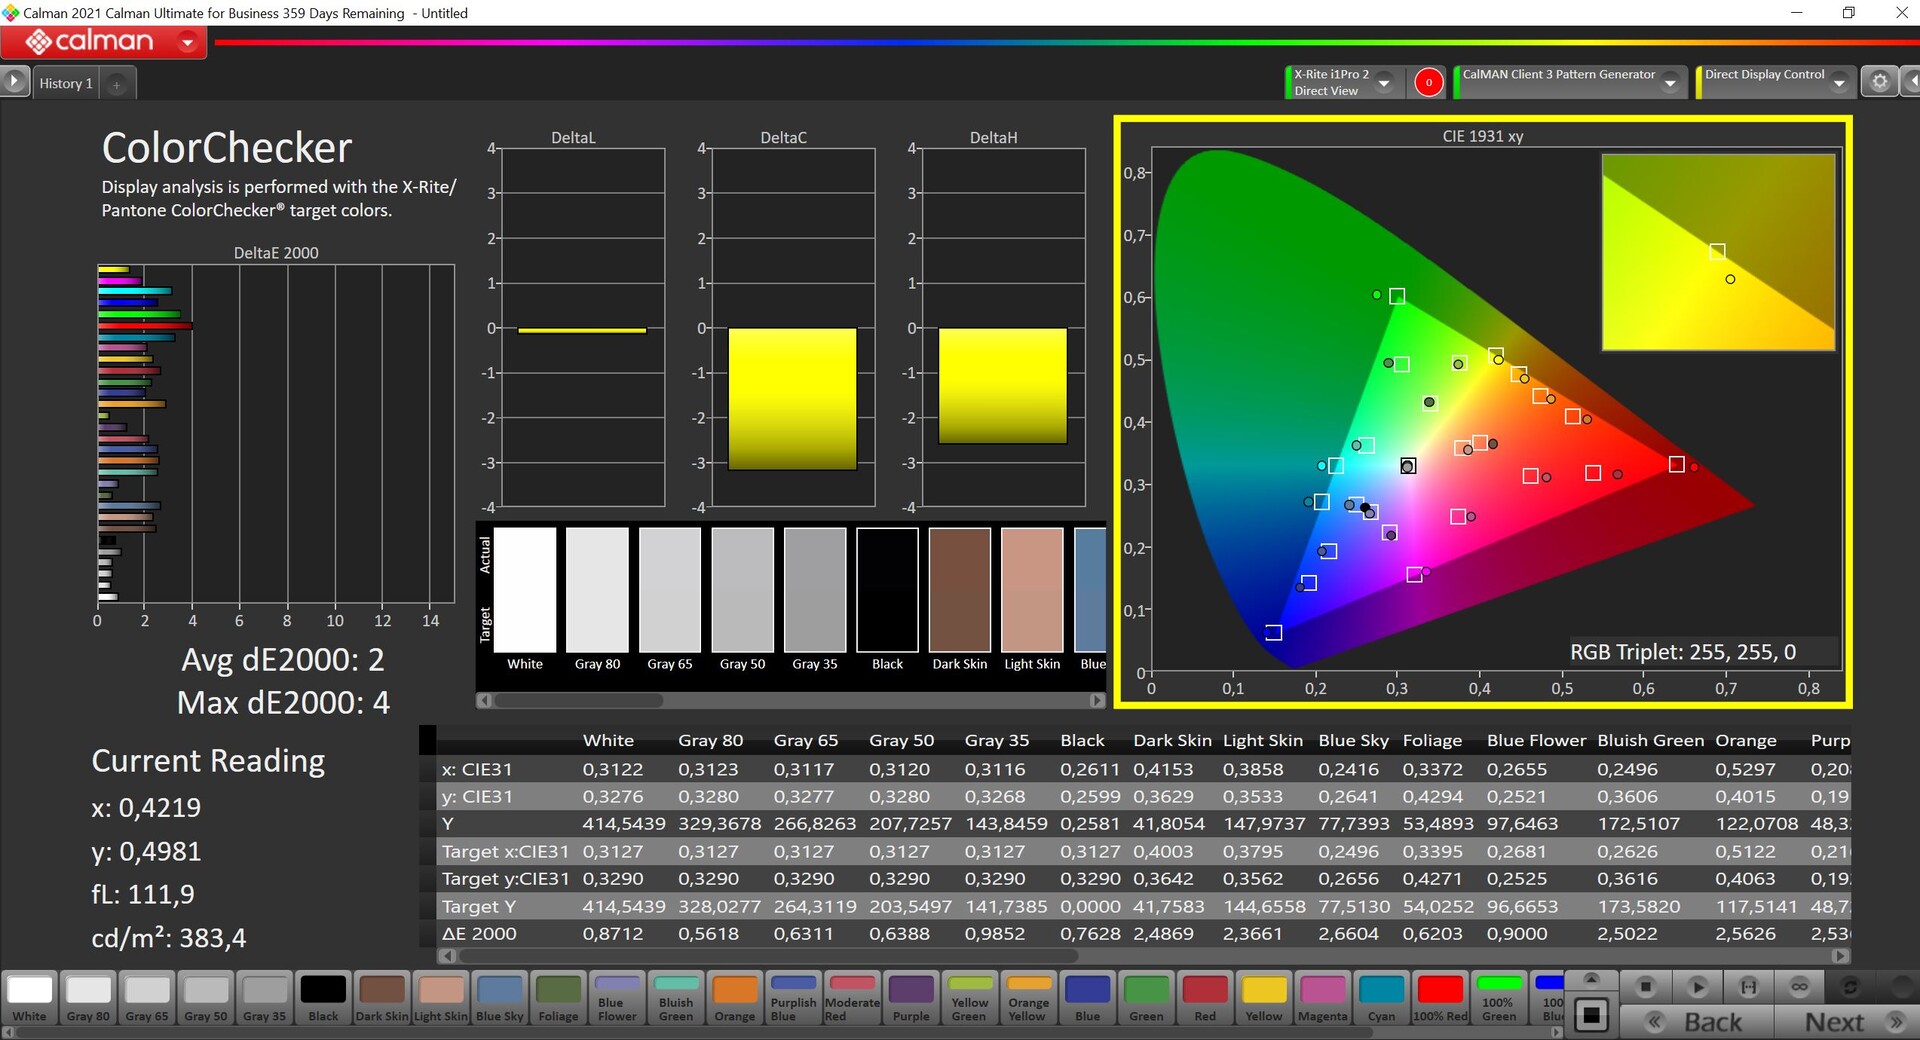
ΔE ColorChecker Calman: 3.2 | ∀{0.5-29.43 Ø4.71}
calibrated: 2
ΔE Greyscale Calman: 4.4 | ∀{0.09-98 Ø4.96}
75.3% AdobeRGB 1998 (Argyll 3D)
97.4% sRGB (Argyll 3D)
74.1% Display P3 (Argyll 3D)
Gamma: 2.22
CCT: 6384 K
| Schenker Vision 14 2022 RTX 3050 Ti MNE007ZA1-1, IPS, 2880x1800, 14" | Schenker Vision 14 MNE007ZA1, IPS, 2880x1800, 14" | Huawei MateBook X Pro 2022 TMX1422, IPS, 3120x2080, 14.2" | Lenovo Yoga 9i 14 2022 i7-1260P LEN140WQUXGA, OLED, 3840x2400, 14" | Dell Inspiron 14 Plus 7420 InfoVision 140NWHE, IPS, 2240x1400, 14" | Asus Vivobook Pro 14 M3401QC-KM007T SAMSUNG: SDC4171, OLED, 2880x1800, 14" | Apple MacBook Pro 14 2021 M1 Pro Entry Mini-LED, 3024x1964, 14.2" | |
|---|---|---|---|---|---|---|---|
| Display | 0% | 15% | 22% | -4% | 21% | 34% | |
| Display P3 Coverage (%) | 74.1 | 74.3 0% | 94.6 28% | 98.7 33% | 68.8 -7% | 99.41 34% | 99.3 34% |
| sRGB Coverage (%) | 97.4 | 97.6 0% | 99.5 2% | 99.8 2% | 99.3 2% | 99.94 3% | |
| AdobeRGB 1998 Coverage (%) | 75.3 | 75.7 1% | 86.5 15% | 98.5 31% | 69.5 -8% | 94.79 26% | |
| Response Times | -28% | 1% | 86% | -31% | 85% | -132% | |
| Response Time Grey 50% / Grey 80% * (ms) | 31.5 ? | 40.4 ? -28% | 25.4 ? 19% | 2.8 ? 91% | 32.8 ? -4% | 3 ? 90% | 58.4 ? -85% |
| Response Time Black / White * (ms) | 14.5 ? | 18.4 ? -27% | 17.1 ? -18% | 2.8 ? 81% | 22.8 ? -57% | 3 ? 79% | 40.4 ? -179% |
| PWM Frequency (Hz) | 239.2 ? | 360 | 14880 | ||||
| Screen | 11% | 31% | 3006% | 5% | 53% | 439% | |
| Brightness middle (cd/m²) | 421 | 407 -3% | 603 43% | 361 -14% | 331.1 -21% | 384 -9% | 489 16% |
| Brightness (cd/m²) | 416 | 407 -2% | 586 41% | 362 -13% | 326 -22% | 385 -7% | 479 15% |
| Brightness Distribution (%) | 89 | 94 6% | 91 2% | 98 10% | 85 -4% | 98 10% | 94 6% |
| Black Level * (cd/m²) | 0.28 | 0.25 11% | 0.39 -39% | 0.001 100% | 0.29 -4% | 0.07 75% | 0.01 96% |
| Contrast (:1) | 1504 | 1628 8% | 1546 3% | 361000 23903% | 1142 -24% | 5486 265% | 48900 3151% |
| Colorchecker dE 2000 * | 3.2 | 2.6 19% | 1.1 66% | 2.8 13% | 2.23 30% | 1.75 45% | 0.8 75% |
| Colorchecker dE 2000 max. * | 5.5 | 4.4 20% | 2.2 60% | 5.8 -5% | 5.44 1% | 3.41 38% | 1.3 76% |
| Colorchecker dE 2000 calibrated * | 2 | 2 -0% | 1.2 40% | 0.63 68% | 2.32 -16% | ||
| Greyscale dE 2000 * | 4.4 | 2.7 39% | 1.5 66% | 1.9 57% | 3.6 18% | 1.06 76% | 1.1 75% |
| Gamma | 2.22 99% | 2.18 101% | 2.17 101% | 2.16 102% | 2.21 100% | 2.39 92% | 2.24 98% |
| CCT | 6384 102% | 6316 103% | 6549 99% | 6181 105% | 6022 108% | 6440 101% | |
| Total Average (Program / Settings) | -6% /
3% | 16% /
23% | 1038% /
1868% | -10% /
-2% | 53% /
51% | 114% /
298% |
* ... smaller is better

Display Response Times
| ↔ Response Time Black to White | ||
|---|---|---|
| 14.5 ms ... rise ↗ and fall ↘ combined | ↗ 4.7 ms rise | 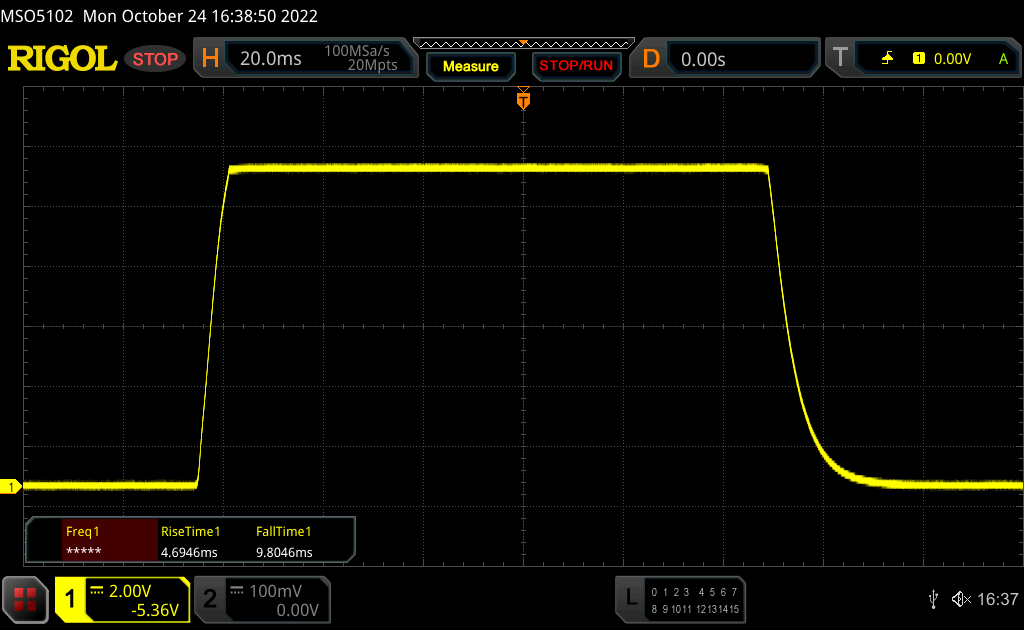 |
| ↘ 9.8 ms fall | ||
| The screen shows good response rates in our tests, but may be too slow for competitive gamers. In comparison, all tested devices range from 0.1 (minimum) to 240 (maximum) ms. » 36 % of all devices are better. This means that the measured response time is better than the average of all tested devices (19.8 ms). | ||
| ↔ Response Time 50% Grey to 80% Grey | ||
| 31.5 ms ... rise ↗ and fall ↘ combined | ↗ 14 ms rise | 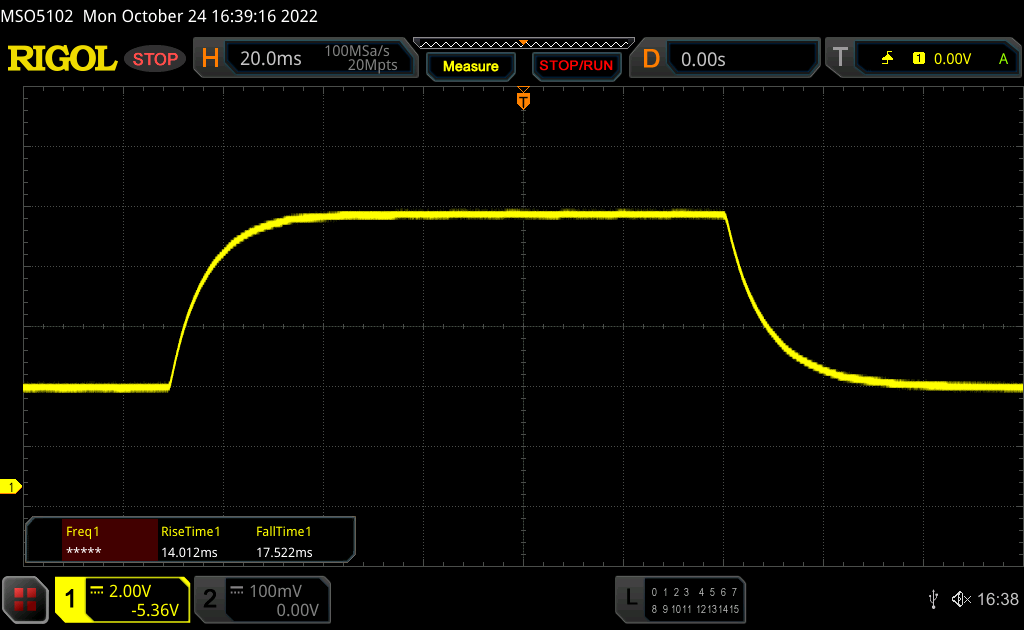 |
| ↘ 17.5 ms fall | ||
| The screen shows slow response rates in our tests and will be unsatisfactory for gamers. In comparison, all tested devices range from 0.165 (minimum) to 636 (maximum) ms. » 43 % of all devices are better. This means that the measured response time is similar to the average of all tested devices (31 ms). | ||
Screen Flickering / PWM (Pulse-Width Modulation)
| Screen flickering / PWM not detected | 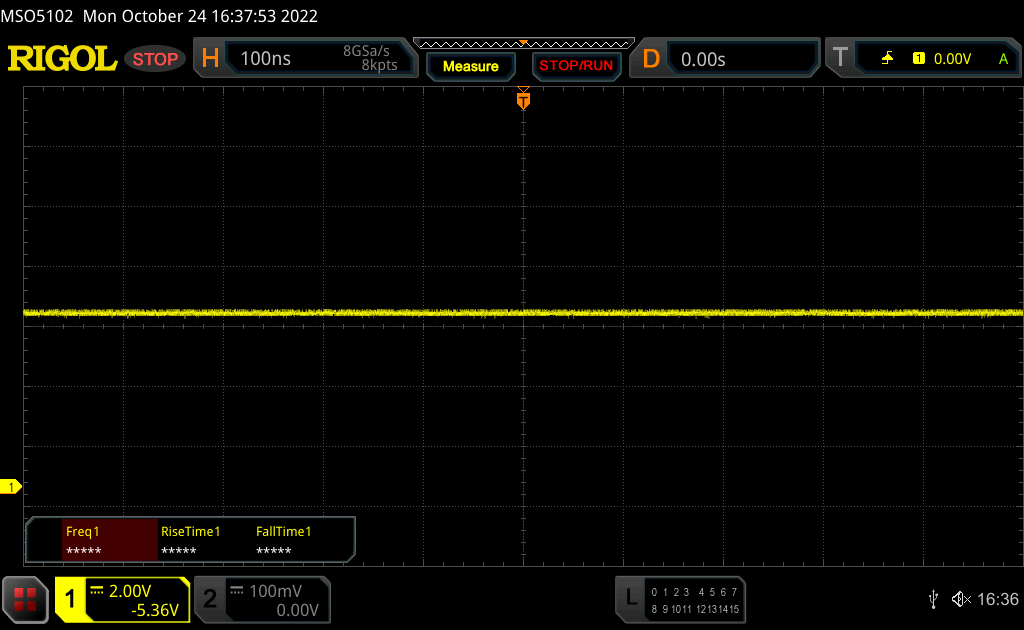 | ||
In comparison: 52 % of all tested devices do not use PWM to dim the display. If PWM was detected, an average of 7757 (minimum: 5 - maximum: 343500) Hz was measured. | |||
性能 - Alder Lake-H &GeForce RTX 3050 Ti
测试条件
在预装的控制中心软件(安静和性能)上,同样有两个基本配置文件和三个子配置文件。方便的是,基本配置文件可以通过F3键进行切换。下表列出了各种功率配置的性能数据。
| 概况 | CPU压力 | GPU压力 | CPU+GPU的组合压力 | 最大风扇噪音 |
|---|---|---|---|---|
| 安静 20分贝 | 10瓦 | 20瓦 | CPU:10瓦GPU :20瓦 |
32.5 dB(A) |
| 静音30分贝 | 13瓦 | 25瓦 | CPU:13瓦GPU:25瓦。 13瓦GPU :25瓦 |
40分贝(A) |
| 静音40分贝 | 15瓦 | 35瓦 | CPU:15瓦GPU 。35瓦 |
45.8分贝(A) |
| 性能平衡 | 60 -> 20瓦 | 45瓦 | CPU: 20瓦GPU :40瓦 |
45.8 dB(A) |
| 性能爱好者 | 60 -> 40瓦 | 45瓦 | CPU: 25瓦GPU :35瓦 |
48.8分贝(A) |
| 性能超强 | 60 -> 45瓦 | 45瓦 | CPU: 25瓦GPU :35瓦 |
51.1 dB(A) |
在我们的测试设备和老款产品之间有两个明显的区别 旧型号.虽然老款的 Tiger Lake Core i7-11370H被限制在46瓦,而较新的酷睿i7-12700H可以获得高达60瓦。 RTX 3050 Ti现在不得不使用45瓦(35瓦的TGP+10瓦的Dynamic Boost),而旧型号的GPU最多可使用50瓦。
由于性能爱好者配置文件在整体上提供了最好的妥协,我们选择它进行测试。在下面的一些章节中(特别是系统噪音部分),我们也将仔细研究其他配置文件,尽管用户可能想选择一个较弱的配置文件,以便在要求不高的日常场景中享受更安静的风扇噪音。
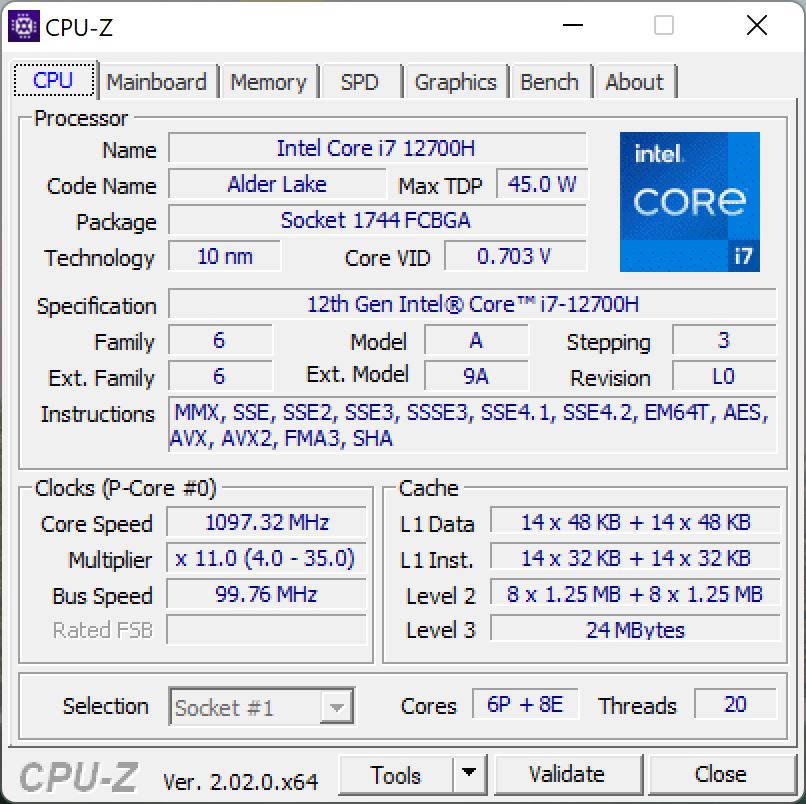
处理器 - 英特尔酷睿i7-12700H
芯片 酷睿i7-12700H是一个45瓦的处理器,有6个性能核心和8个效率核心,使其能够同时处理多达20个线程。TDP限制(60/40瓦)被牢牢把持,整体性能很好。老款的 酷睿i7-11370H不仅在多线程测试中明显落后(较新的型号在这里基本上是两倍的速度),而且在单线程测试中也由于新的性能核心而落后。
Cinebench R15 Multi Loop
现在的问题是,在这些TDP值下,酷睿i7-12700H是否比Alder Lake-P处理器(如Alder Lake)更有意义? 酷睿i7-1260P(有4个性能核心)。答案是明确的,因为性能核心的数量是最终的关键。正如我们所知,在更高的时钟速度下,性能核心的效率变得越来越低。虽然在更多的性能核心之间分配可用的TDP会导致时钟速度略低,但它也会导致更低的温度,这反过来有利于性能。此外,两个额外的核心对稍低的时钟速度有很大的补偿作用。虽然这也将是一个 酷睿i7-1280P(与i7-12700H的核心配置相同),但OEM没有为Vision 14的裸机版提供Alder Lake-P芯片,并配有双热管。
酷睿i7-12700H的优势在与以下产品的比较中变得非常明显 联想Yoga 9i 14的对比中,酷睿i7-1260P的TDP为64/38瓦,非常相似。不管怎么说,酷睿i7-12700H在多线程测试中大大超过了它(在我们的CB R15多循环中~18%)。也就是说,应该注意的是,酷睿i7-12700H在这里无法释放其全部潜力,这将需要超过120瓦的最大全核心时钟速度。Vision 14的iGPU版本的CPU性能是相同的。
在电池模式下,处理器被限制在45瓦,随后是40瓦,这意味着性能水平仍然相当高。在电池水平低于20%时,性能下降变得更加明显。更多的CPU基准测试可以在 我们的技术部分.
Cinebench R23: Multi Core | Single Core
Cinebench R20: CPU (Multi Core) | CPU (Single Core)
Cinebench R15: CPU Multi 64Bit | CPU Single 64Bit
Blender: v2.79 BMW27 CPU
7-Zip 18.03: 7z b 4 | 7z b 4 -mmt1
Geekbench 5.5: Multi-Core | Single-Core
HWBOT x265 Benchmark v2.2: 4k Preset
LibreOffice : 20 Documents To PDF
R Benchmark 2.5: Overall mean
| CPU Performance rating | |
| Average Intel Core i7-12700H | |
| Dell Inspiron 14 Plus 7420 | |
| Schenker Vision 14 2022 RTX 3050 Ti | |
| Apple MacBook Pro 14 2021 M1 Pro Entry -8! | |
| Average of class Subnotebook | |
| Lenovo Yoga 9i 14 2022 i7-1260P | |
| Huawei MateBook X Pro 2022 | |
| Asus Vivobook Pro 14 M3401QC-KM007T | |
| Schenker Vision 14 | |
| Cinebench R23 / Multi Core | |
| Average Intel Core i7-12700H (4032 - 19330, n=64) | |
| Schenker Vision 14 2022 RTX 3050 Ti | |
| Dell Inspiron 14 Plus 7420 | |
| Average of class Subnotebook (1555 - 21812, n=60, last 2 years) | |
| Lenovo Yoga 9i 14 2022 i7-1260P | |
| Apple MacBook Pro 14 2021 M1 Pro Entry | |
| Huawei MateBook X Pro 2022 | |
| Asus Vivobook Pro 14 M3401QC-KM007T | |
| Schenker Vision 14 | |
| Cinebench R23 / Single Core | |
| Lenovo Yoga 9i 14 2022 i7-1260P | |
| Dell Inspiron 14 Plus 7420 | |
| Average Intel Core i7-12700H (778 - 1826, n=63) | |
| Average of class Subnotebook (358 - 2213, n=61, last 2 years) | |
| Schenker Vision 14 2022 RTX 3050 Ti | |
| Huawei MateBook X Pro 2022 | |
| Apple MacBook Pro 14 2021 M1 Pro Entry | |
| Schenker Vision 14 | |
| Asus Vivobook Pro 14 M3401QC-KM007T | |
| Cinebench R20 / CPU (Multi Core) | |
| Average Intel Core i7-12700H (1576 - 7407, n=64) | |
| Schenker Vision 14 2022 RTX 3050 Ti | |
| Dell Inspiron 14 Plus 7420 | |
| Average of class Subnotebook (579 - 8541, n=57, last 2 years) | |
| Lenovo Yoga 9i 14 2022 i7-1260P | |
| Huawei MateBook X Pro 2022 | |
| Asus Vivobook Pro 14 M3401QC-KM007T | |
| Schenker Vision 14 | |
| Cinebench R20 / CPU (Single Core) | |
| Schenker Vision 14 2022 RTX 3050 Ti | |
| Dell Inspiron 14 Plus 7420 | |
| Average Intel Core i7-12700H (300 - 704, n=64) | |
| Huawei MateBook X Pro 2022 | |
| Average of class Subnotebook (128 - 832, n=57, last 2 years) | |
| Lenovo Yoga 9i 14 2022 i7-1260P | |
| Schenker Vision 14 | |
| Asus Vivobook Pro 14 M3401QC-KM007T | |
| Cinebench R15 / CPU Multi 64Bit | |
| Average Intel Core i7-12700H (1379 - 2916, n=70) | |
| Dell Inspiron 14 Plus 7420 | |
| Schenker Vision 14 2022 RTX 3050 Ti | |
| Average of class Subnotebook (327 - 3345, n=57, last 2 years) | |
| Huawei MateBook X Pro 2022 | |
| Huawei MateBook X Pro 2022 | |
| Lenovo Yoga 9i 14 2022 i7-1260P | |
| Asus Vivobook Pro 14 M3401QC-KM007T | |
| Apple MacBook Pro 14 2021 M1 Pro Entry | |
| Schenker Vision 14 | |
| Schenker Vision 14 | |
| Cinebench R15 / CPU Single 64Bit | |
| Average of class Subnotebook (72.4 - 322, n=57, last 2 years) | |
| Schenker Vision 14 2022 RTX 3050 Ti | |
| Dell Inspiron 14 Plus 7420 | |
| Average Intel Core i7-12700H (113 - 263, n=65) | |
| Huawei MateBook X Pro 2022 | |
| Lenovo Yoga 9i 14 2022 i7-1260P | |
| Schenker Vision 14 | |
| Asus Vivobook Pro 14 M3401QC-KM007T | |
| Apple MacBook Pro 14 2021 M1 Pro Entry | |
| Blender / v2.79 BMW27 CPU | |
| Schenker Vision 14 | |
| Average of class Subnotebook (159 - 2271, n=58, last 2 years) | |
| Asus Vivobook Pro 14 M3401QC-KM007T | |
| Huawei MateBook X Pro 2022 | |
| Lenovo Yoga 9i 14 2022 i7-1260P | |
| Schenker Vision 14 2022 RTX 3050 Ti | |
| Dell Inspiron 14 Plus 7420 | |
| Average Intel Core i7-12700H (168 - 732, n=63) | |
| 7-Zip 18.03 / 7z b 4 | |
| Average Intel Core i7-12700H (22844 - 73067, n=63) | |
| Dell Inspiron 14 Plus 7420 | |
| Schenker Vision 14 2022 RTX 3050 Ti | |
| Lenovo Yoga 9i 14 2022 i7-1260P | |
| Average of class Subnotebook (11668 - 77867, n=57, last 2 years) | |
| Huawei MateBook X Pro 2022 | |
| Asus Vivobook Pro 14 M3401QC-KM007T | |
| Schenker Vision 14 | |
| 7-Zip 18.03 / 7z b 4 -mmt1 | |
| Schenker Vision 14 2022 RTX 3050 Ti | |
| Average Intel Core i7-12700H (2743 - 5972, n=63) | |
| Dell Inspiron 14 Plus 7420 | |
| Average of class Subnotebook (2643 - 6699, n=59, last 2 years) | |
| Schenker Vision 14 | |
| Huawei MateBook X Pro 2022 | |
| Asus Vivobook Pro 14 M3401QC-KM007T | |
| Lenovo Yoga 9i 14 2022 i7-1260P | |
| Geekbench 5.5 / Multi-Core | |
| Dell Inspiron 14 Plus 7420 | |
| Average Intel Core i7-12700H (5144 - 13745, n=64) | |
| Schenker Vision 14 2022 RTX 3050 Ti | |
| Average of class Subnotebook (2557 - 17218, n=48, last 2 years) | |
| Lenovo Yoga 9i 14 2022 i7-1260P | |
| Huawei MateBook X Pro 2022 | |
| Apple MacBook Pro 14 2021 M1 Pro Entry | |
| Asus Vivobook Pro 14 M3401QC-KM007T | |
| Schenker Vision 14 | |
| Geekbench 5.5 / Single-Core | |
| Average of class Subnotebook (726 - 2224, n=48, last 2 years) | |
| Schenker Vision 14 2022 RTX 3050 Ti | |
| Apple MacBook Pro 14 2021 M1 Pro Entry | |
| Lenovo Yoga 9i 14 2022 i7-1260P | |
| Huawei MateBook X Pro 2022 | |
| Average Intel Core i7-12700H (803 - 1851, n=64) | |
| Dell Inspiron 14 Plus 7420 | |
| Schenker Vision 14 | |
| Asus Vivobook Pro 14 M3401QC-KM007T | |
| HWBOT x265 Benchmark v2.2 / 4k Preset | |
| Average Intel Core i7-12700H (4.67 - 21.8, n=64) | |
| Dell Inspiron 14 Plus 7420 | |
| Schenker Vision 14 2022 RTX 3050 Ti | |
| Average of class Subnotebook (0.97 - 25.1, n=57, last 2 years) | |
| Lenovo Yoga 9i 14 2022 i7-1260P | |
| Huawei MateBook X Pro 2022 | |
| Asus Vivobook Pro 14 M3401QC-KM007T | |
| Schenker Vision 14 | |
| LibreOffice / 20 Documents To PDF | |
| Asus Vivobook Pro 14 M3401QC-KM007T | |
| Average of class Subnotebook (39.9 - 220, n=56, last 2 years) | |
| Dell Inspiron 14 Plus 7420 | |
| Schenker Vision 14 | |
| Lenovo Yoga 9i 14 2022 i7-1260P | |
| Average Intel Core i7-12700H (34.2 - 95.3, n=63) | |
| Schenker Vision 14 2022 RTX 3050 Ti | |
| Huawei MateBook X Pro 2022 | |
| R Benchmark 2.5 / Overall mean | |
| Asus Vivobook Pro 14 M3401QC-KM007T | |
| Schenker Vision 14 | |
| Average of class Subnotebook (0.4024 - 1.456, n=58, last 2 years) | |
| Lenovo Yoga 9i 14 2022 i7-1260P | |
| Huawei MateBook X Pro 2022 | |
| Dell Inspiron 14 Plus 7420 | |
| Average Intel Core i7-12700H (0.4441 - 1.052, n=63) | |
| Schenker Vision 14 2022 RTX 3050 Ti | |
* ... smaller is better
AIDA64: FP32 Ray-Trace | FPU Julia | CPU SHA3 | CPU Queen | FPU SinJulia | FPU Mandel | CPU AES | CPU ZLib | FP64 Ray-Trace | CPU PhotoWorxx
| Performance rating | |
| Average Intel Core i7-12700H | |
| Schenker Vision 14 2022 RTX 3050 Ti | |
| Dell Inspiron 14 Plus 7420 | |
| Average of class Subnotebook | |
| Asus Vivobook Pro 14 M3401QC-KM007T | |
| Huawei MateBook X Pro 2022 | |
| Lenovo Yoga 9i 14 2022 i7-1260P | |
| AIDA64 / FP32 Ray-Trace | |
| Average of class Subnotebook (1135 - 32888, n=58, last 2 years) | |
| Schenker Vision 14 2022 RTX 3050 Ti | |
| Dell Inspiron 14 Plus 7420 | |
| Average Intel Core i7-12700H (2585 - 17957, n=64) | |
| Asus Vivobook Pro 14 M3401QC-KM007T | |
| Lenovo Yoga 9i 14 2022 i7-1260P | |
| Huawei MateBook X Pro 2022 | |
| AIDA64 / FPU Julia | |
| Asus Vivobook Pro 14 M3401QC-KM007T | |
| Average of class Subnotebook (5218 - 123315, n=58, last 2 years) | |
| Schenker Vision 14 2022 RTX 3050 Ti | |
| Dell Inspiron 14 Plus 7420 | |
| Average Intel Core i7-12700H (12439 - 90760, n=64) | |
| Huawei MateBook X Pro 2022 | |
| Lenovo Yoga 9i 14 2022 i7-1260P | |
| AIDA64 / CPU SHA3 | |
| Average of class Subnotebook (444 - 5287, n=58, last 2 years) | |
| Average Intel Core i7-12700H (833 - 4242, n=64) | |
| Schenker Vision 14 2022 RTX 3050 Ti | |
| Dell Inspiron 14 Plus 7420 | |
| Asus Vivobook Pro 14 M3401QC-KM007T | |
| Lenovo Yoga 9i 14 2022 i7-1260P | |
| Huawei MateBook X Pro 2022 | |
| AIDA64 / CPU Queen | |
| Average Intel Core i7-12700H (57923 - 103202, n=63) | |
| Dell Inspiron 14 Plus 7420 | |
| Schenker Vision 14 2022 RTX 3050 Ti | |
| Huawei MateBook X Pro 2022 | |
| Asus Vivobook Pro 14 M3401QC-KM007T | |
| Average of class Subnotebook (10579 - 95002, n=49, last 2 years) | |
| Lenovo Yoga 9i 14 2022 i7-1260P | |
| AIDA64 / FPU SinJulia | |
| Average Intel Core i7-12700H (3249 - 9939, n=64) | |
| Asus Vivobook Pro 14 M3401QC-KM007T | |
| Schenker Vision 14 2022 RTX 3050 Ti | |
| Dell Inspiron 14 Plus 7420 | |
| Average of class Subnotebook (744 - 18418, n=58, last 2 years) | |
| Huawei MateBook X Pro 2022 | |
| Lenovo Yoga 9i 14 2022 i7-1260P | |
| AIDA64 / FPU Mandel | |
| Asus Vivobook Pro 14 M3401QC-KM007T | |
| Average of class Subnotebook (3341 - 65433, n=58, last 2 years) | |
| Dell Inspiron 14 Plus 7420 | |
| Schenker Vision 14 2022 RTX 3050 Ti | |
| Average Intel Core i7-12700H (7135 - 44760, n=64) | |
| Huawei MateBook X Pro 2022 | |
| Lenovo Yoga 9i 14 2022 i7-1260P | |
| AIDA64 / CPU AES | |
| Asus Vivobook Pro 14 M3401QC-KM007T | |
| Average Intel Core i7-12700H (31839 - 144360, n=64) | |
| Schenker Vision 14 2022 RTX 3050 Ti | |
| Dell Inspiron 14 Plus 7420 | |
| Huawei MateBook X Pro 2022 | |
| Average of class Subnotebook (638 - 96917, n=58, last 2 years) | |
| Lenovo Yoga 9i 14 2022 i7-1260P | |
| AIDA64 / CPU ZLib | |
| Average Intel Core i7-12700H (305 - 1171, n=64) | |
| Schenker Vision 14 2022 RTX 3050 Ti | |
| Dell Inspiron 14 Plus 7420 | |
| Average of class Subnotebook (164.9 - 1379, n=58, last 2 years) | |
| Lenovo Yoga 9i 14 2022 i7-1260P | |
| Huawei MateBook X Pro 2022 | |
| Asus Vivobook Pro 14 M3401QC-KM007T | |
| AIDA64 / FP64 Ray-Trace | |
| Average of class Subnotebook (610 - 17495, n=58, last 2 years) | |
| Schenker Vision 14 2022 RTX 3050 Ti | |
| Dell Inspiron 14 Plus 7420 | |
| Average Intel Core i7-12700H (1437 - 9692, n=64) | |
| Asus Vivobook Pro 14 M3401QC-KM007T | |
| Lenovo Yoga 9i 14 2022 i7-1260P | |
| Huawei MateBook X Pro 2022 | |
| AIDA64 / CPU PhotoWorxx | |
| Average of class Subnotebook (6569 - 85600, n=58, last 2 years) | |
| Huawei MateBook X Pro 2022 | |
| Dell Inspiron 14 Plus 7420 | |
| Average Intel Core i7-12700H (12863 - 52207, n=64) | |
| Schenker Vision 14 2022 RTX 3050 Ti | |
| Lenovo Yoga 9i 14 2022 i7-1260P | |
| Asus Vivobook Pro 14 M3401QC-KM007T | |
系统性能
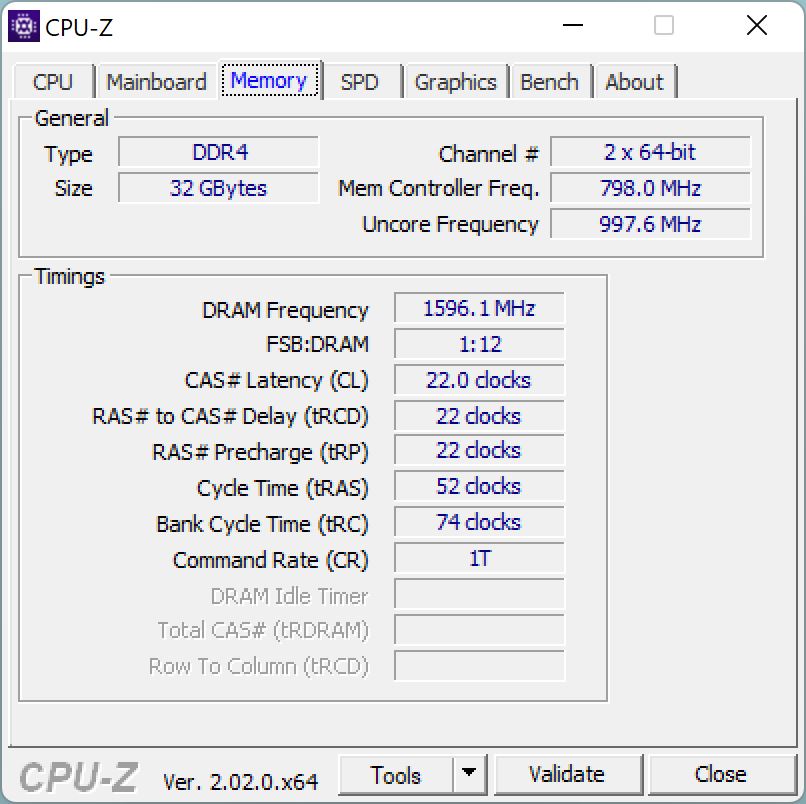
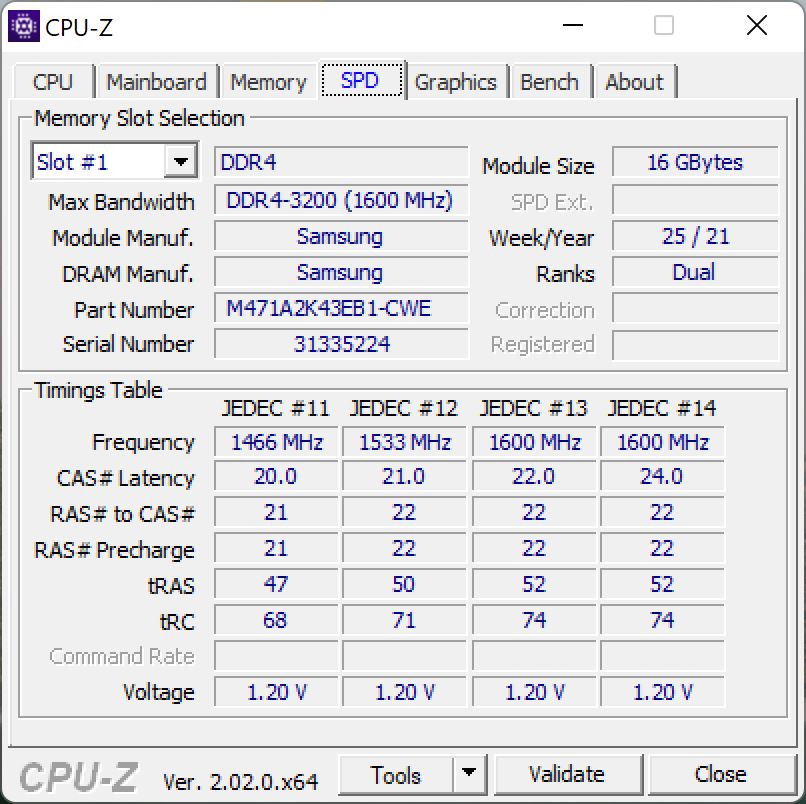
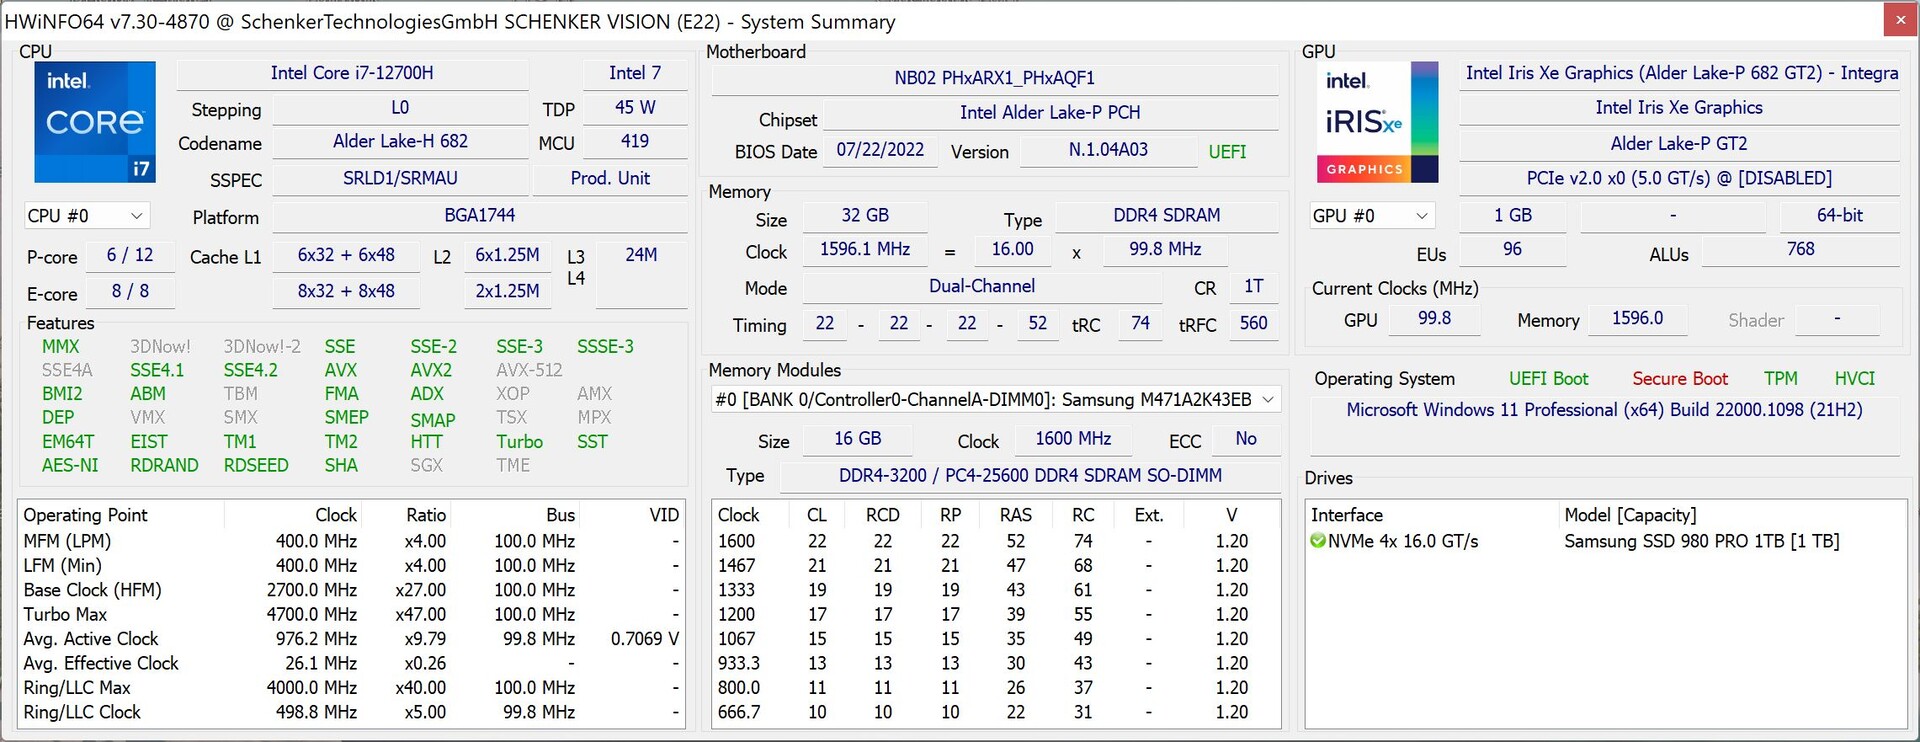
Vision 14非常灵敏的主观印象被我们的合成基准测试所证实。在我们的测试中,我们没有遇到任何问题。Schenker决定不使用DDR5内存(据制造商说是由于成本原因),但这并不影响日常使用。
CrossMark: Overall | Productivity | Creativity | Responsiveness
| PCMark 10 / Score | |
| Average of class Subnotebook (4920 - 9939, n=45, last 2 years) | |
| Average Intel Core i7-12700H, NVIDIA GeForce RTX 3050 Ti Laptop GPU (6623 - 7075, n=5) | |
| Dell Inspiron 14 Plus 7420 | |
| Schenker Vision 14 2022 RTX 3050 Ti | |
| Huawei MateBook X Pro 2022 | |
| Schenker Vision 14 | |
| Asus Vivobook Pro 14 M3401QC-KM007T | |
| Lenovo Yoga 9i 14 2022 i7-1260P | |
| PCMark 10 / Essentials | |
| Lenovo Yoga 9i 14 2022 i7-1260P | |
| Huawei MateBook X Pro 2022 | |
| Schenker Vision 14 2022 RTX 3050 Ti | |
| Average of class Subnotebook (8552 - 11646, n=45, last 2 years) | |
| Average Intel Core i7-12700H, NVIDIA GeForce RTX 3050 Ti Laptop GPU (9540 - 10970, n=5) | |
| Dell Inspiron 14 Plus 7420 | |
| Asus Vivobook Pro 14 M3401QC-KM007T | |
| Schenker Vision 14 | |
| PCMark 10 / Productivity | |
| Average of class Subnotebook (5435 - 16606, n=45, last 2 years) | |
| Average Intel Core i7-12700H, NVIDIA GeForce RTX 3050 Ti Laptop GPU (8530 - 9555, n=5) | |
| Dell Inspiron 14 Plus 7420 | |
| Schenker Vision 14 | |
| Huawei MateBook X Pro 2022 | |
| Schenker Vision 14 2022 RTX 3050 Ti | |
| Asus Vivobook Pro 14 M3401QC-KM007T | |
| Lenovo Yoga 9i 14 2022 i7-1260P | |
| PCMark 10 / Digital Content Creation | |
| Average of class Subnotebook (5722 - 13779, n=45, last 2 years) | |
| Average Intel Core i7-12700H, NVIDIA GeForce RTX 3050 Ti Laptop GPU (8855 - 9542, n=5) | |
| Schenker Vision 14 2022 RTX 3050 Ti | |
| Dell Inspiron 14 Plus 7420 | |
| Asus Vivobook Pro 14 M3401QC-KM007T | |
| Lenovo Yoga 9i 14 2022 i7-1260P | |
| Schenker Vision 14 | |
| Huawei MateBook X Pro 2022 | |
| CrossMark / Overall | |
| Huawei MateBook X Pro 2022 | |
| Average Intel Core i7-12700H, NVIDIA GeForce RTX 3050 Ti Laptop GPU (1654 - 1872, n=5) | |
| Dell Inspiron 14 Plus 7420 | |
| Lenovo Yoga 9i 14 2022 i7-1260P | |
| Average of class Subnotebook (365 - 2356, n=60, last 2 years) | |
| Schenker Vision 14 2022 RTX 3050 Ti | |
| Schenker Vision 14 | |
| Apple MacBook Pro 14 2021 M1 Pro Entry | |
| Asus Vivobook Pro 14 M3401QC-KM007T | |
| CrossMark / Productivity | |
| Huawei MateBook X Pro 2022 | |
| Average Intel Core i7-12700H, NVIDIA GeForce RTX 3050 Ti Laptop GPU (1595 - 1792, n=5) | |
| Schenker Vision 14 2022 RTX 3050 Ti | |
| Dell Inspiron 14 Plus 7420 | |
| Lenovo Yoga 9i 14 2022 i7-1260P | |
| Average of class Subnotebook (364 - 2277, n=60, last 2 years) | |
| Schenker Vision 14 | |
| Asus Vivobook Pro 14 M3401QC-KM007T | |
| Apple MacBook Pro 14 2021 M1 Pro Entry | |
| CrossMark / Creativity | |
| Apple MacBook Pro 14 2021 M1 Pro Entry | |
| Dell Inspiron 14 Plus 7420 | |
| Average of class Subnotebook (372 - 2743, n=60, last 2 years) | |
| Huawei MateBook X Pro 2022 | |
| Average Intel Core i7-12700H, NVIDIA GeForce RTX 3050 Ti Laptop GPU (1699 - 1993, n=5) | |
| Lenovo Yoga 9i 14 2022 i7-1260P | |
| Schenker Vision 14 2022 RTX 3050 Ti | |
| Schenker Vision 14 | |
| Asus Vivobook Pro 14 M3401QC-KM007T | |
| CrossMark / Responsiveness | |
| Huawei MateBook X Pro 2022 | |
| Average Intel Core i7-12700H, NVIDIA GeForce RTX 3050 Ti Laptop GPU (1383 - 1768, n=5) | |
| Lenovo Yoga 9i 14 2022 i7-1260P | |
| Schenker Vision 14 2022 RTX 3050 Ti | |
| Schenker Vision 14 | |
| Dell Inspiron 14 Plus 7420 | |
| Average of class Subnotebook (312 - 1854, n=60, last 2 years) | |
| Asus Vivobook Pro 14 M3401QC-KM007T | |
| Apple MacBook Pro 14 2021 M1 Pro Entry | |
| PCMark 10 Score | 6623 points | |
Help | ||
| AIDA64 / Memory Copy | |
| Average of class Subnotebook (14554 - 131023, n=58, last 2 years) | |
| Huawei MateBook X Pro 2022 | |
| Dell Inspiron 14 Plus 7420 | |
| Average Intel Core i7-12700H (25615 - 80511, n=64) | |
| Schenker Vision 14 2022 RTX 3050 Ti | |
| Asus Vivobook Pro 14 M3401QC-KM007T | |
| AIDA64 / Memory Read | |
| Average of class Subnotebook (15948 - 127174, n=58, last 2 years) | |
| Huawei MateBook X Pro 2022 | |
| Dell Inspiron 14 Plus 7420 | |
| Average Intel Core i7-12700H (25586 - 79442, n=64) | |
| Asus Vivobook Pro 14 M3401QC-KM007T | |
| Schenker Vision 14 2022 RTX 3050 Ti | |
| AIDA64 / Memory Write | |
| Average of class Subnotebook (15709 - 135141, n=58, last 2 years) | |
| Huawei MateBook X Pro 2022 | |
| Dell Inspiron 14 Plus 7420 | |
| Average Intel Core i7-12700H (23679 - 88660, n=64) | |
| Schenker Vision 14 2022 RTX 3050 Ti | |
| Asus Vivobook Pro 14 M3401QC-KM007T | |
| AIDA64 / Memory Latency | |
| Dell Inspiron 14 Plus 7420 | |
| Huawei MateBook X Pro 2022 | |
| Average of class Subnotebook (6.1 - 159.9, n=56, last 2 years) | |
| Schenker Vision 14 2022 RTX 3050 Ti | |
| Asus Vivobook Pro 14 M3401QC-KM007T | |
| Average Intel Core i7-12700H (76.2 - 133.9, n=62) | |
* ... smaller is better
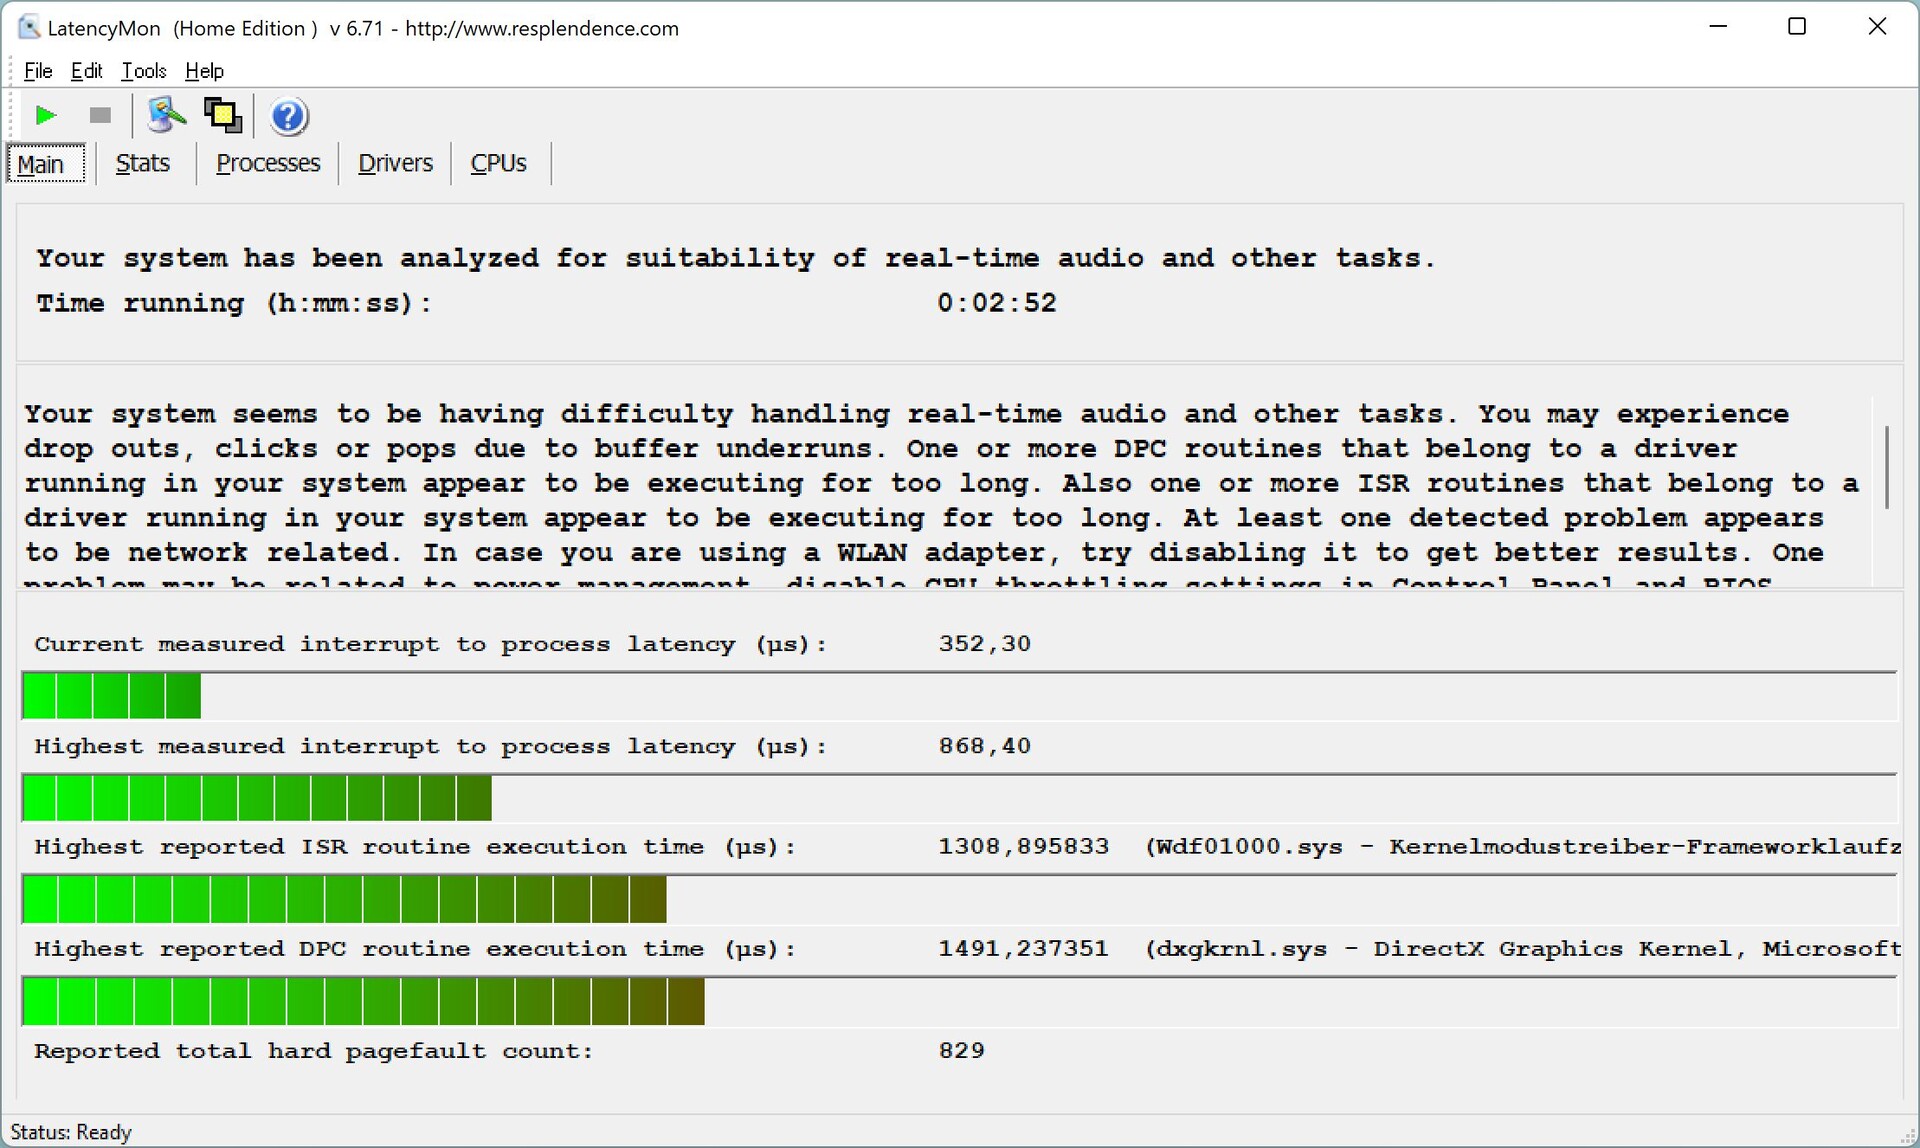
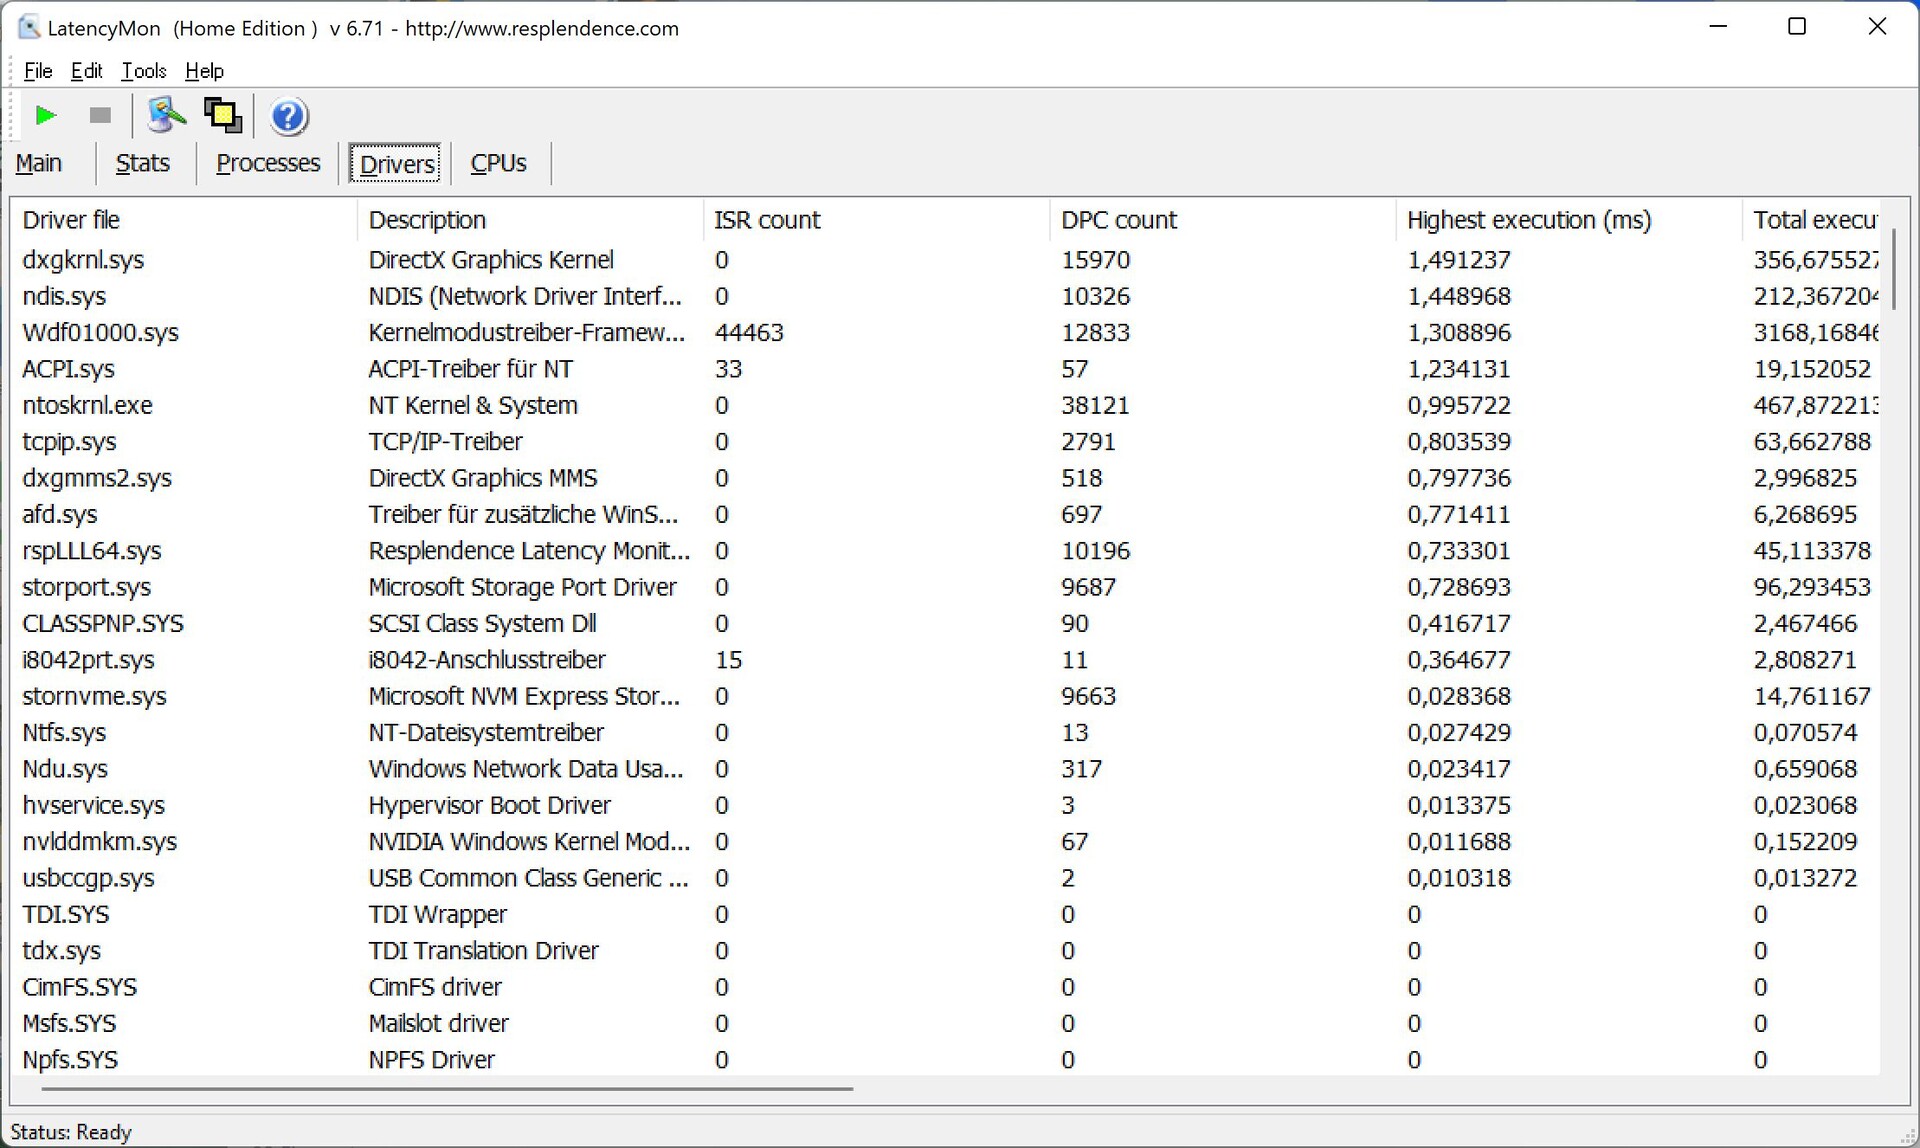
DPC延时
在我们对当前BIOS版本进行的标准化延迟测试中,Vision 14显示延迟略有增加,使其成为实时应用程序的次优选择。在YouTube上播放4K视频时没有丢帧。
| DPC Latencies / LatencyMon - interrupt to process latency (max), Web, Youtube, Prime95 | |
| Asus Vivobook Pro 14 M3401QC-KM007T | |
| Lenovo Yoga 9i 14 2022 i7-1260P | |
| Huawei MateBook X Pro 2022 | |
| Schenker Vision 14 2022 RTX 3050 Ti | |
| Dell Inspiron 14 Plus 7420 | |
* ... smaller is better
存储解决方案
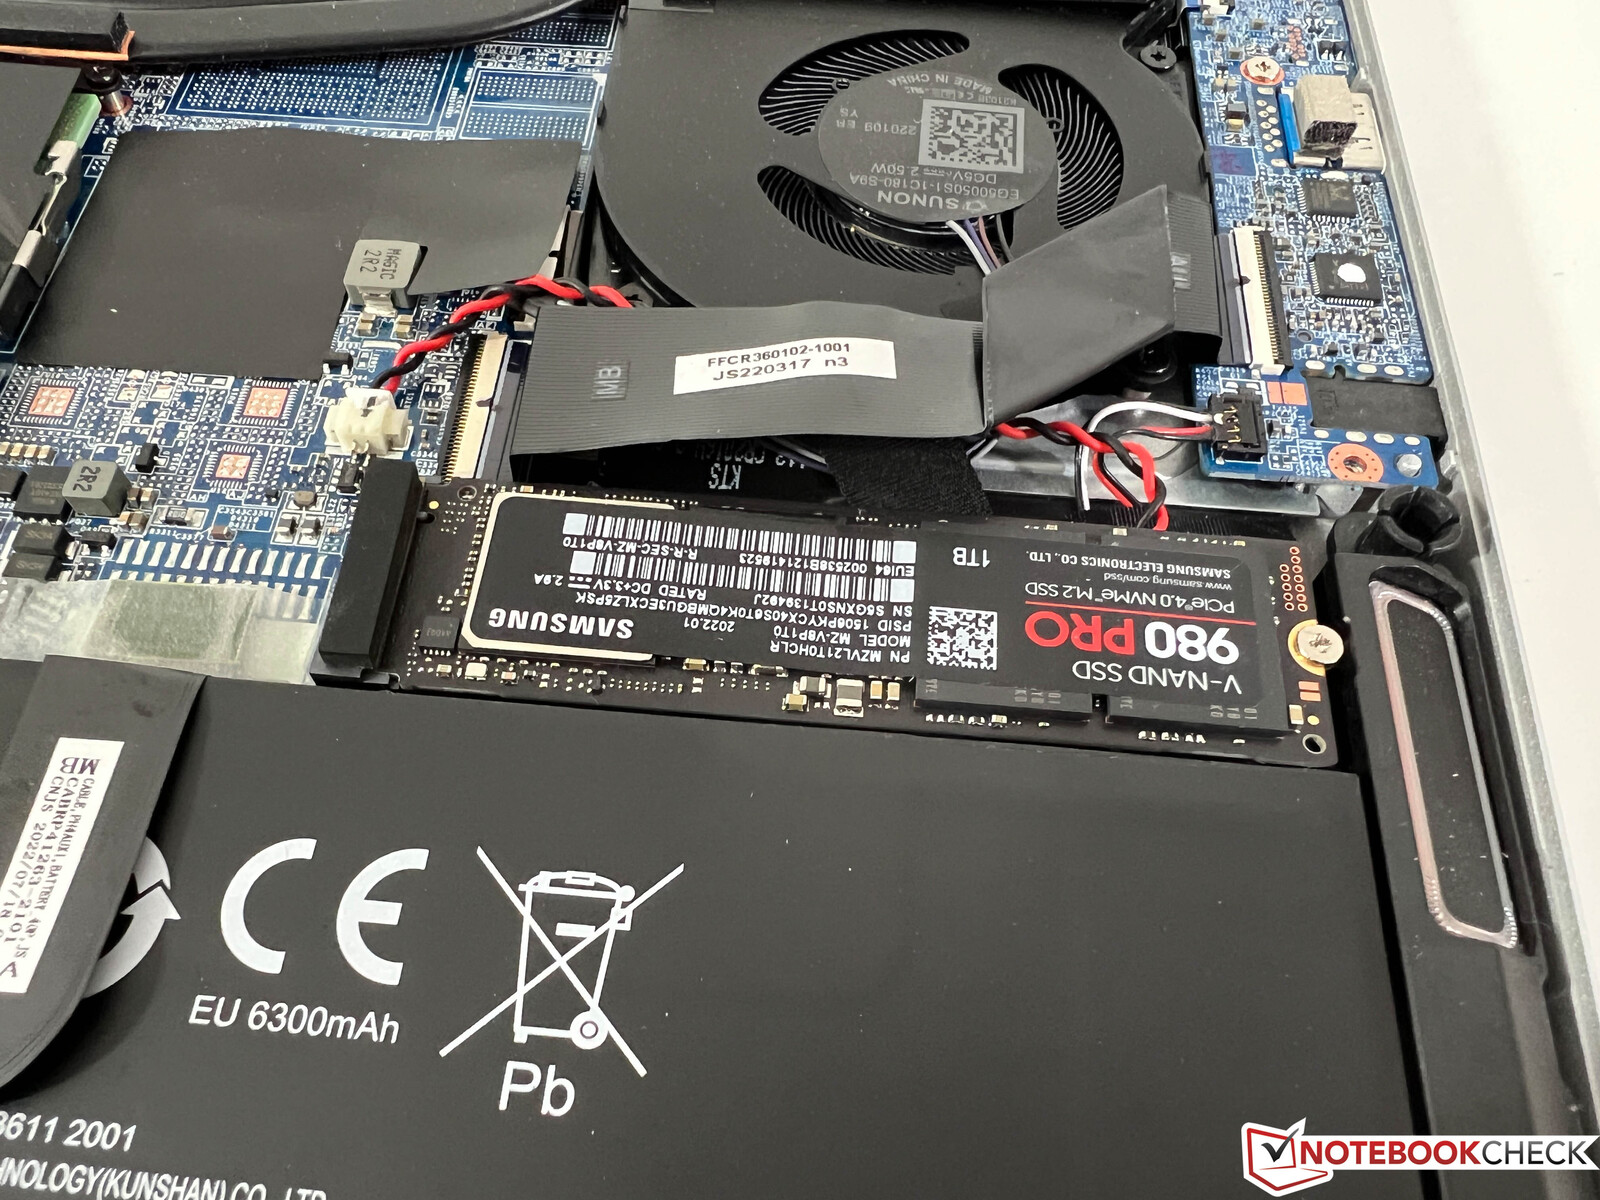
如前所述,选择较大的99瓦时电池意味着没有二级M.2-2280插槽。我们的测试设备配备了三星Pro 1 TB,其传输速度高达7GB/s,是目前最快的硬盘之一。也没有散热问题,即使在连续的负载下,性能也完全保持一致。更多SSD基准测试 可以在这里找到.

* ... smaller is better
Disk Throttling: DiskSpd Read Loop, Queue Depth 8
GPU性能
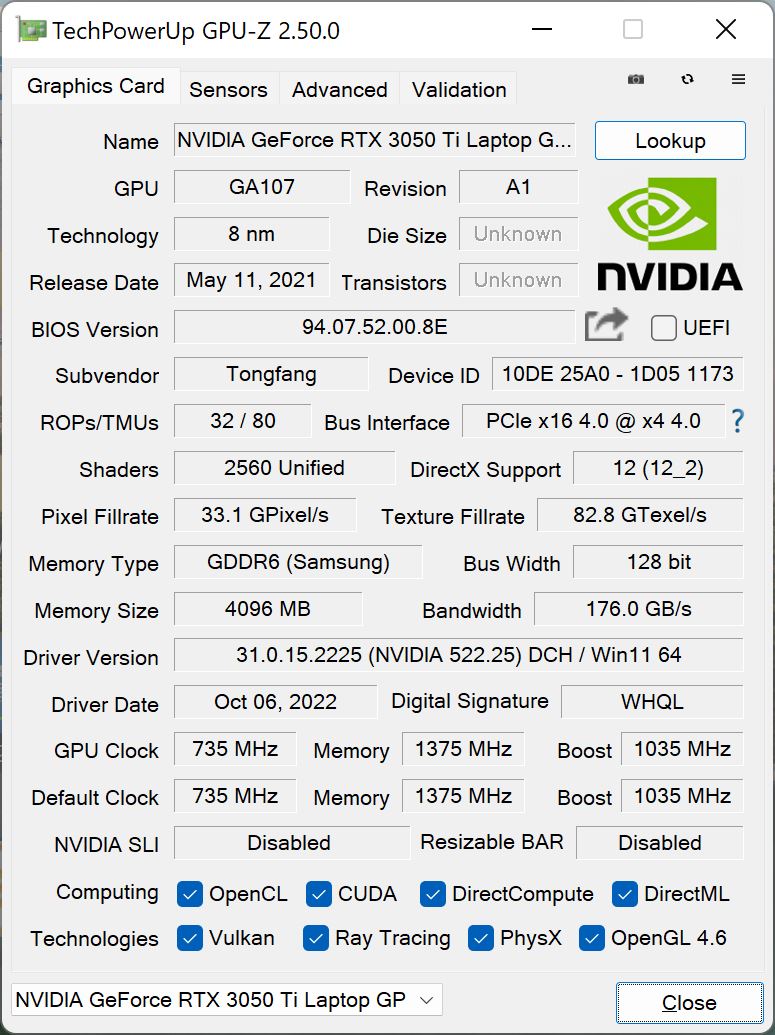
Vision 14仍然使用流行的Nvidia GeForce RTX 3050 TiTGP为35瓦(以及CPU的额外10瓦动态提升)。Nvidia RTX 3050 Ti的TGP额定值为35-80瓦,这意味着我们的测试模型使用了该芯片的较弱版本。Vision 14的基准测试反映了这一点,其结果对该GPU来说略显逊色。
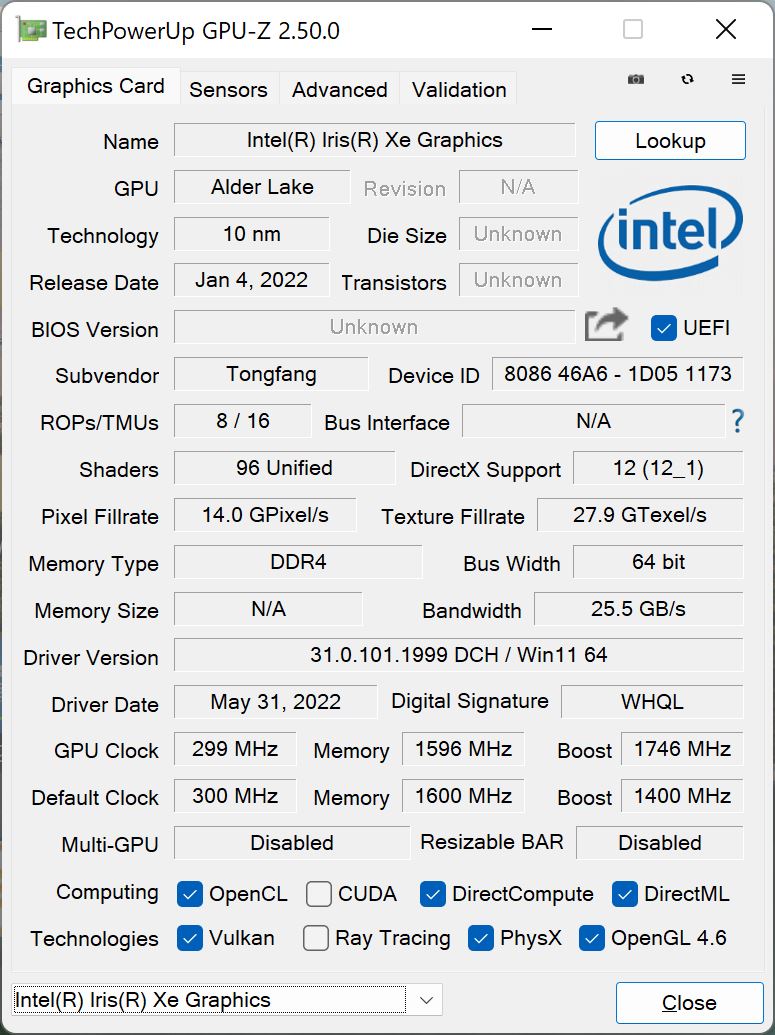
与 前者的RTX 3050 Ti相比,最新的Vision 14能够确保一个小的领先优势,并与M1 Pro GPU相提并论。 M1 Pro GPU在基础型号的 Apple MacBook Pro 14.当选择Vision 14的iGPU版本时,英特尔的 Iris Xe Graphics G7,有96个EUs而不是使用英特尔的Iris Xe Graphics G7,导致GPU性能明显变慢,这一点在竞争对手 联想Yoga 9i 14和 华为MateBook X Pro.
即使在连续负载下,GPU性能仍然保持一致,尽管它在电池模式下(~75%)确实受到相当大的影响。更多GPU基准测试 可以在这里找到.
| 3DMark 11 Performance | 16439 points | |
| 3DMark Fire Strike Score | 11233 points | |
| 3DMark Time Spy Score | 5098 points | |
Help | ||
| Blender / v3.3 Classroom OPTIX/RTX | |
| Dell Inspiron 14 Plus 7420 | |
| Asus VivoBook Pro 16X OLED N7600PC-L2026X | |
| Schenker Vision 14 2022 RTX 3050 Ti | |
| Average NVIDIA GeForce RTX 3050 Ti Laptop GPU (48 - 60, n=7) | |
| Dell Precision 7670 | |
| Lenovo ThinkBook 16p G3 ARH | |
| Blender / v3.3 Classroom CUDA | |
| Asus VivoBook Pro 16X OLED N7600PC-L2026X | |
| Dell Inspiron 14 Plus 7420 | |
| Schenker Vision 14 2022 RTX 3050 Ti | |
| Average NVIDIA GeForce RTX 3050 Ti Laptop GPU (83 - 104, n=7) | |
| Dell Precision 7670 | |
| Lenovo ThinkBook 16p G3 ARH | |
| Blender / v3.3 Classroom CPU | |
| Asus VivoBook Pro 16X OLED N7600PC-L2026X | |
| Huawei MateBook X Pro 2022 | |
| Lenovo ThinkPad T14 G3-21CF004NGE | |
| Average of class Subnotebook (241 - 861, n=60, last 2 years) | |
| Dell Inspiron 14 Plus 7420 | |
| Schenker Vision 14 2022 RTX 3050 Ti | |
| Average NVIDIA GeForce RTX 3050 Ti Laptop GPU (379 - 557, n=7) | |
| Lenovo ThinkBook 16p G3 ARH | |
| Dell Precision 7670 | |
* ... smaller is better
游戏性能
由于游戏性能仍然主要由 GeForce RTX 3050 Ti的影响,即使一些基准测试结果显示了更快的处理器的优势,新的和旧的Vision 14之间只有微小的差异。 旧版Vision 14特别是在非常高的质量设置下。许多现代游戏即使在高或最大细节下也能顺利运行,尽管在要求非常高的游戏中,如《赛博朋克2077》或《F1 2022》,图形设置将不得不降低,以实现流畅的帧率。
| Cyberpunk 2077 1.6 | |
| 1920x1080 High Preset | |
| Average NVIDIA GeForce RTX 3050 Ti Laptop GPU (39 - 51.5, n=9) | |
| Dell Inspiron 14 Plus 7420 | |
| Schenker Vision 14 2022 RTX 3050 Ti | |
| 1920x1080 Ultra Preset | |
| Average NVIDIA GeForce RTX 3050 Ti Laptop GPU (31 - 50.5, n=9) | |
| Dell Inspiron 14 Plus 7420 | |
| Schenker Vision 14 2022 RTX 3050 Ti | |
Witcher 3 FPS Graph
在持续的压力下,游戏性能保持一致,正如我们的 Witcher 3循环显示。然而,测试更安静的电源配置文件是否能提供足够的游戏性能可能是值得的,这取决于游戏的情况。在电池模式下,游戏性能明显降低,必须大幅减少细节,才能保持游戏的可玩性。
| low | med. | high | ultra | QHD | |
|---|---|---|---|---|---|
| GTA V (2015) | 170.6 | 163.3 | 121 | 67.5 | 48.4 |
| The Witcher 3 (2015) | 249 | 264 | 92 | 44.2 | |
| Dota 2 Reborn (2015) | 148.1 | 121.9 | 114.4 | 109.1 | |
| Final Fantasy XV Benchmark (2018) | 130.6 | 71 | 50.1 | 36.2 | |
| X-Plane 11.11 (2018) | 112.4 | 99.6 | 82.3 | ||
| Far Cry 5 (2018) | 121 | 87 | 79 | 75 | 53 |
| Strange Brigade (2018) | 259 | 126.9 | 100.8 | 86 | 63 |
| F1 2021 (2021) | 223 | 148 | 120.8 | 59.2 | 41 |
| Cyberpunk 2077 1.6 (2022) | 56 | 49 | 40 | 31 | 20 |
| F1 22 (2022) | 136.1 | 124.8 | 93 | 28 | 16.1 |
排放--《愿景14》的声音太大
系统噪音
与前一型号相比,在冷却解决方案方面没有任何变化。Vision 14仍然使用两个风扇和两个热管。尽管一些结果略有变化,但它们基本上与老款产品的结果一致。 旧型号.我们在各种情况下的结果列在下表中。我们没有注意到任何电子噪音。
| 概况 | Cinebench R23 Multi | Witcher 3 Ultra | 压力测试 |
|---|---|---|---|
| 静音20 dB | 26 dB(A) | 32.5 dB(A) | 32.5 dB(A) |
| 安静30分贝 | 26 dB(A) | 40 dB(A) | 40 dB(A) |
| 静音40 dB | 27.8 dB(A) | 45.8 dB(A) | 45.8 dB(A) |
| 高性能平衡型 | 29.2 dB(A) | 45.8 dB(A) | 45.8 dB(A) |
| 高性能爱好者 | 46 dB(A) | 48.2dB(A) | 48.8 dB(A) |
| 性能过强 | 48.2 dB(A) | 51.1 dB(A) | 51.1 dB(A) |
Noise level
| Idle |
| 24.4 / 24.4 / 27.8 dB(A) |
| Load |
| 43.3 / 48.8 dB(A) |
 | ||
30 dB silent 40 dB(A) audible 50 dB(A) loud |
||
min: | ||
| Schenker Vision 14 2022 RTX 3050 Ti GeForce RTX 3050 Ti Laptop GPU, i7-12700H, Samsung SSD 980 Pro 1TB MZ-V8P1T0BW | Huawei MateBook X Pro 2022 Iris Xe G7 96EUs, i7-1260P, Silicon Motion PCIe-8 SSD 1TB | Lenovo Yoga 9i 14 2022 i7-1260P Iris Xe G7 96EUs, i7-1260P, Samsung PM9A1 MZVL21T0HCLR | Dell Inspiron 14 Plus 7420 GeForce RTX 3050 4GB Laptop GPU, i7-12700H, SK Hynix BC711 512GB HFM512GD3GX013N | Asus Vivobook Pro 14 M3401QC-KM007T GeForce RTX 3050 4GB Laptop GPU, R5 5600H, Intel SSD 670p SSDPEKNU512GZ | Apple MacBook Pro 14 2021 M1 Pro Entry M1 Pro 14-Core GPU, M1 Pro 8-Core, Apple SSD AP0512 | Schenker Vision 14 GeForce RTX 3050 Ti Laptop GPU, i7-11370H, Samsung SSD 980 Pro 1TB MZ-V8P1T0BW | |
|---|---|---|---|---|---|---|---|
| Noise | 12% | 6% | 1% | -11% | 12% | 2% | |
| off / environment * (dB) | 24.4 | 23.5 4% | 24.1 1% | 23.2 5% | 25.4 -4% | 24.8 -2% | 24.3 -0% |
| Idle Minimum * (dB) | 24.4 | 23.5 4% | 24.1 1% | 23.2 5% | 25.4 -4% | 24.8 -2% | 24.3 -0% |
| Idle Average * (dB) | 24.4 | 23.5 4% | 24.1 1% | 23.2 5% | 25.4 -4% | 24.8 -2% | 24.3 -0% |
| Idle Maximum * (dB) | 27.8 | 25.9 7% | 30 -8% | 23.2 17% | 30.9 -11% | 24.8 11% | 25.9 7% |
| Load Average * (dB) | 43.3 | 33.8 22% | 39.4 9% | 47.5 -10% | 56 -29% | 27.8 36% | 43.3 -0% |
| Witcher 3 ultra * (dB) | 48.2 | 35.4 27% | 39.4 18% | 51.7 -7% | 27.8 42% | 44.6 7% | |
| Load Maximum * (dB) | 48.8 | 40.6 17% | 39.4 19% | 51.7 -6% | 56 -15% | 49.5 -1% | 49.5 -1% |
* ... smaller is better
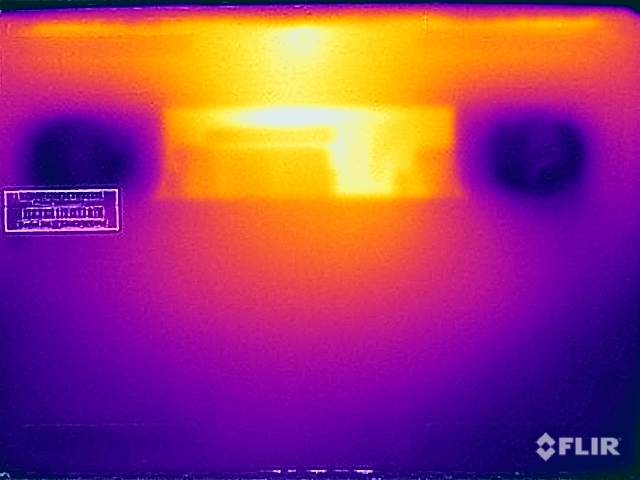
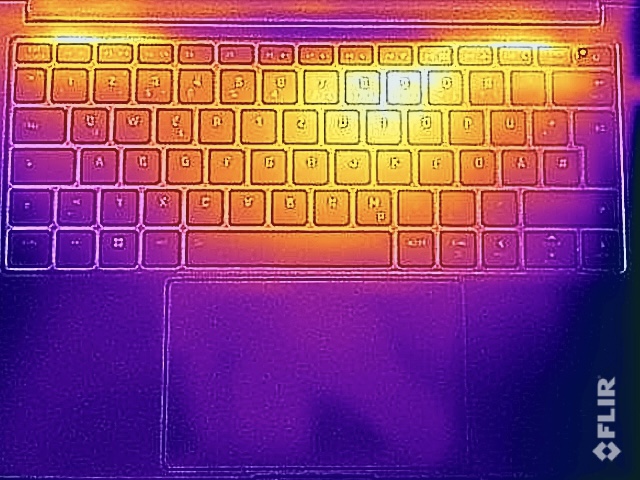
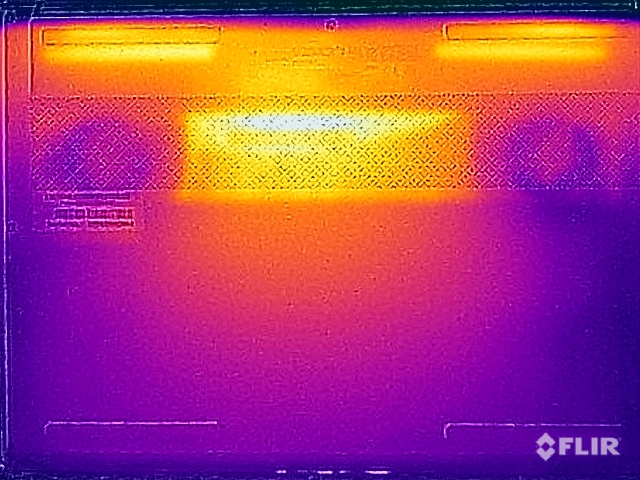
温度
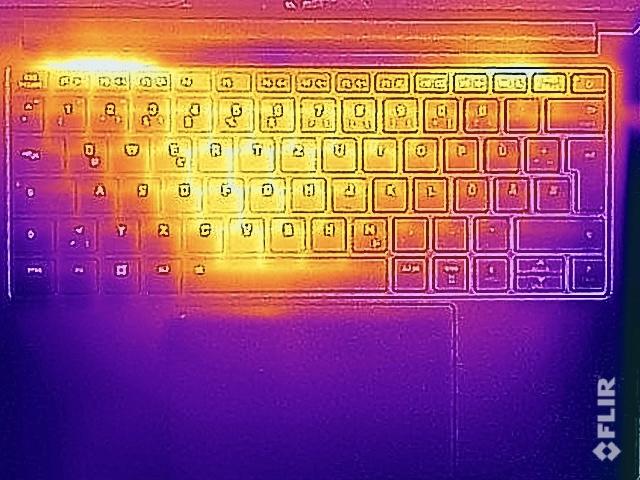
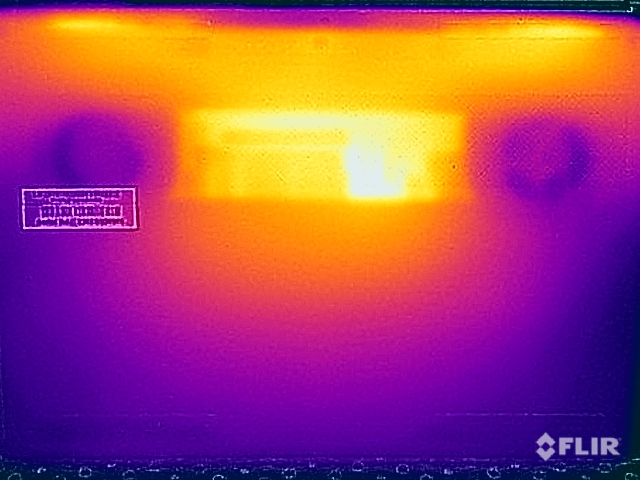
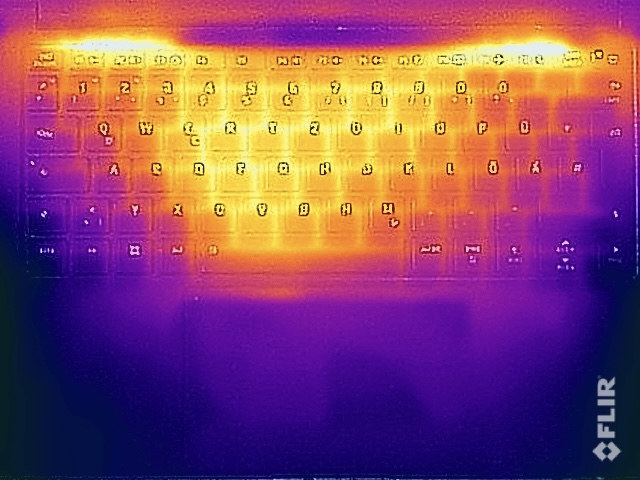
也有惊人的相似之处,那就是 前辈在表面温度方面也有惊人的相似之处。在空闲时和执行要求不高的任务时,温度保持较低,而键盘上方的中心区域和底部中心区域可以分别达到接近非常热的50℃(122°F)和50℃以上。我们建议在这些情况下不要把笔记本放在腿上使用。在负载情况下,iGPU版本的温度最高只有45°C(113°F),仍然明显较低。
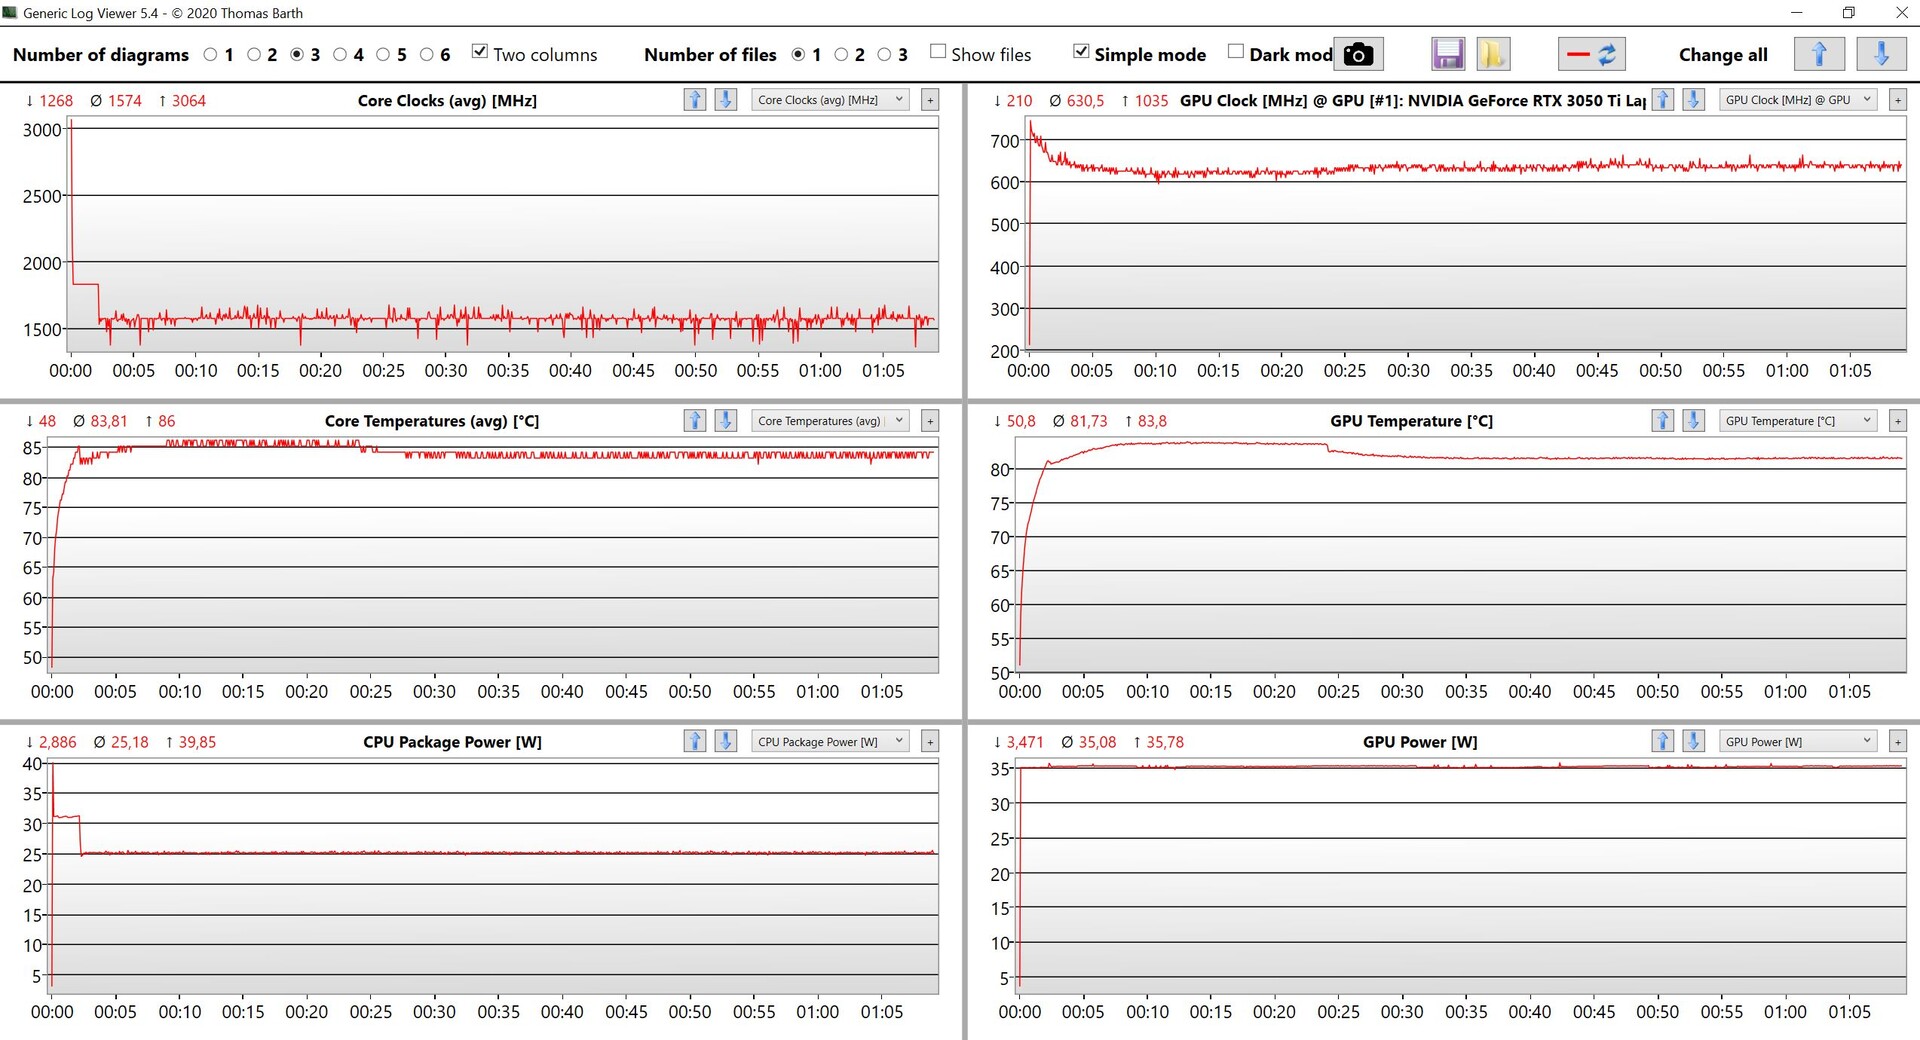
在我们的压力测试中,显卡始终保持在35瓦,而处理器最初消耗的功率约为31瓦,几分钟后稳定在25瓦。在压力测试之后,仍然可以直接获得全部性能。
(-) The maximum temperature on the upper side is 48.4 °C / 119 F, compared to the average of 35.9 °C / 97 F, ranging from 21.4 to 59 °C for the class Subnotebook.
(-) The bottom heats up to a maximum of 57.1 °C / 135 F, compared to the average of 39.2 °C / 103 F
(+) In idle usage, the average temperature for the upper side is 26.6 °C / 80 F, compared to the device average of 30.8 °C / 87 F.
(-) Playing The Witcher 3, the average temperature for the upper side is 40.8 °C / 105 F, compared to the device average of 30.8 °C / 87 F.
(+) The palmrests and touchpad are cooler than skin temperature with a maximum of 28.5 °C / 83.3 F and are therefore cool to the touch.
(±) The average temperature of the palmrest area of similar devices was 28.2 °C / 82.8 F (-0.3 °C / -0.5 F).
| Schenker Vision 14 2022 RTX 3050 Ti Intel Core i7-12700H, NVIDIA GeForce RTX 3050 Ti Laptop GPU | Huawei MateBook X Pro 2022 Intel Core i7-1260P, Intel Iris Xe Graphics G7 96EUs | Lenovo Yoga 9i 14 2022 i7-1260P Intel Core i7-1260P, Intel Iris Xe Graphics G7 96EUs | Dell Inspiron 14 Plus 7420 Intel Core i7-12700H, NVIDIA GeForce RTX 3050 4GB Laptop GPU | Asus Vivobook Pro 14 M3401QC-KM007T AMD Ryzen 5 5600H, NVIDIA GeForce RTX 3050 4GB Laptop GPU | Apple MacBook Pro 14 2021 M1 Pro Entry Apple M1 Pro 8-Core, Apple M1 Pro 14-Core GPU | Schenker Vision 14 Intel Core i7-11370H, NVIDIA GeForce RTX 3050 Ti Laptop GPU | |
|---|---|---|---|---|---|---|---|
| Heat | 8% | 4% | 14% | -7% | 16% | -2% | |
| Maximum Upper Side * (°C) | 48.4 | 43.1 11% | 47.5 2% | 40 17% | 42.3 13% | 46.8 3% | 49.7 -3% |
| Maximum Bottom * (°C) | 57.1 | 42 26% | 52.2 9% | 36.4 36% | 49.6 13% | 40.9 28% | 56 2% |
| Idle Upper Side * (°C) | 28.1 | 29.4 -5% | 27.1 4% | 27 4% | 34.2 -22% | 24.2 14% | 28.8 -2% |
| Idle Bottom * (°C) | 29 | 29.4 -1% | 28.5 2% | 29.2 -1% | 37.9 -31% | 24.2 17% | 30.6 -6% |
* ... smaller is better
发言人
由于电池较大,不得不使用两个新的扬声器模块。然而,没有可察觉的差异,音频质量仍然是Vision 14的弱点之一。扬声器的声音非常单薄,无法与其他多媒体笔记本电脑的扬声器竞争。
Schenker Vision 14 2022 RTX 3050 Ti audio analysis
(±) | speaker loudness is average but good (81.9 dB)
Bass 100 - 315 Hz
(-) | nearly no bass - on average 20.6% lower than median
(±) | linearity of bass is average (9% delta to prev. frequency)
Mids 400 - 2000 Hz
(±) | higher mids - on average 6.7% higher than median
(+) | mids are linear (5.8% delta to prev. frequency)
Highs 2 - 16 kHz
(+) | balanced highs - only 4.3% away from median
(+) | highs are linear (4.9% delta to prev. frequency)
Overall 100 - 16.000 Hz
(±) | linearity of overall sound is average (20.4% difference to median)
Compared to same class
» 65% of all tested devices in this class were better, 8% similar, 26% worse
» The best had a delta of 5%, average was 18%, worst was 53%
Compared to all devices tested
» 54% of all tested devices were better, 8% similar, 38% worse
» The best had a delta of 4%, average was 23%, worst was 134%
Apple MacBook Pro 14 2021 M1 Pro Entry audio analysis
(+) | speakers can play relatively loud (84.9 dB)
Bass 100 - 315 Hz
(+) | good bass - only 4.3% away from median
(+) | bass is linear (5.9% delta to prev. frequency)
Mids 400 - 2000 Hz
(+) | balanced mids - only 1.1% away from median
(+) | mids are linear (1.9% delta to prev. frequency)
Highs 2 - 16 kHz
(+) | balanced highs - only 2.9% away from median
(+) | highs are linear (3% delta to prev. frequency)
Overall 100 - 16.000 Hz
(+) | overall sound is linear (5.6% difference to median)
Compared to same class
» 2% of all tested devices in this class were better, 1% similar, 97% worse
» The best had a delta of 5%, average was 17%, worst was 45%
Compared to all devices tested
» 0% of all tested devices were better, 0% similar, 100% worse
» The best had a delta of 4%, average was 23%, worst was 134%
能源管理--99瓦时电池带来的更高运行时间
能源消耗
尽管与旧款相比,能源消耗已略有改善 旧型号但Vision 14超过11瓦的能耗仍然不能使它成为一个非常高效的设备,这是3K面板的结果。我们测量的最大消耗为110瓦(几分钟后下降并稳定在约93瓦)。由于电池容量在测试过程中没有变化,附带的90瓦的交流适配器似乎有一些隐藏的储备。用USB-C充电器(最小65瓦)为设备充电和供电一般是可能的,90瓦的型号就可能无法达到Vision 14的全部性能潜力,或者被迫在满负荷的情况下接入电池。
| Off / Standby | |
| Idle | |
| Load |
|
Key:
min: | |
| Schenker Vision 14 2022 RTX 3050 Ti i7-12700H, GeForce RTX 3050 Ti Laptop GPU, Samsung SSD 980 Pro 1TB MZ-V8P1T0BW, IPS, 2880x1800, 14" | Huawei MateBook X Pro 2022 i7-1260P, Iris Xe G7 96EUs, Silicon Motion PCIe-8 SSD 1TB, IPS, 3120x2080, 14.2" | Lenovo Yoga 9i 14 2022 i7-1260P i7-1260P, Iris Xe G7 96EUs, Samsung PM9A1 MZVL21T0HCLR, OLED, 3840x2400, 14" | Dell Inspiron 14 Plus 7420 i7-12700H, GeForce RTX 3050 4GB Laptop GPU, SK Hynix BC711 512GB HFM512GD3GX013N, IPS, 2240x1400, 14" | Asus Vivobook Pro 14 M3401QC-KM007T R5 5600H, GeForce RTX 3050 4GB Laptop GPU, Intel SSD 670p SSDPEKNU512GZ, OLED, 2880x1800, 14" | Apple MacBook Pro 14 2021 M1 Pro Entry M1 Pro 8-Core, M1 Pro 14-Core GPU, Apple SSD AP0512, Mini-LED, 3024x1964, 14.2" | Schenker Vision 14 i7-11370H, GeForce RTX 3050 Ti Laptop GPU, Samsung SSD 980 Pro 1TB MZ-V8P1T0BW, IPS, 2880x1800, 14" | Average NVIDIA GeForce RTX 3050 Ti Laptop GPU | Average of class Subnotebook | |
|---|---|---|---|---|---|---|---|---|---|
| Power Consumption | 6% | 16% | -19% | 13% | 27% | -7% | -23% | 42% | |
| Idle Minimum * (Watt) | 7.5 | 6.5 13% | 7.1 5% | 6.3 16% | 6.6 12% | 2.9 61% | 6.7 11% | 8.2 ? -9% | 3.76 ? 50% |
| Idle Average * (Watt) | 10.4 | 13.7 -32% | 10 4% | 10.3 1% | 9.6 8% | 11.6 -12% | 12.6 -21% | 12.6 ? -21% | 6.54 ? 37% |
| Idle Maximum * (Watt) | 11.4 | 14.4 -26% | 10.8 5% | 20 -75% | 7.3 36% | 11.9 -4% | 15.4 -35% | 17.2 ? -51% | 7.89 ? 31% |
| Load Average * (Watt) | 83.3 | 64.6 22% | 64 23% | 106.2 -27% | 73 12% | 49.5 41% | 85.7 -3% | 92 ? -10% | 42 ? 50% |
| Witcher 3 ultra * (Watt) | 92.7 | 57.2 38% | 47.7 49% | 96.1 -4% | 74.4 20% | 58.2 37% | 83 10% | ||
| Load Maximum * (Watt) | 110.3 | 90.9 18% | 97 12% | 136.5 -24% | 119 -8% | 68.5 38% | 110.9 -1% | 139.1 ? -26% | 64.8 ? 41% |
* ... smaller is better
Power Consumption Witcher 3 / Stress Test
Power Consumption external Monitor
电池寿命
新电池的容量为99Wh,几乎是原来的两倍,毫不奇怪,这使得电池寿命大大增加。虽然 前代产品在我们的Wi-Fi测试中只能持续4.5-5.5小时,这取决于亮度设置,而新机型在150尼特的亮度下达到8-10小时和11小时的视频播放(在我们的测试设备中约36%的最大亮度)。虽然这些结果很好,但它们也表明,3K面板根本不是很有效。一个拥有这么多电池容量的设备本来可以达到更好的运行时间。
当设备被打开时,充电过程需要105分钟;36分钟后,50%的电池已经可用。Vision 14的iGPU模型基本上达到了相同的结果,偏差在几分钟之内。
| Schenker Vision 14 2022 RTX 3050 Ti i7-12700H, GeForce RTX 3050 Ti Laptop GPU, 99.8 Wh | Huawei MateBook X Pro 2022 i7-1260P, Iris Xe G7 96EUs, 60 Wh | Lenovo Yoga 9i 14 2022 i7-1260P i7-1260P, Iris Xe G7 96EUs, 75 Wh | Dell Inspiron 14 Plus 7420 i7-12700H, GeForce RTX 3050 4GB Laptop GPU, 64 Wh | Asus Vivobook Pro 14 M3401QC-KM007T R5 5600H, GeForce RTX 3050 4GB Laptop GPU, 63 Wh | Apple MacBook Pro 14 2021 M1 Pro Entry M1 Pro 8-Core, M1 Pro 14-Core GPU, 69.9 Wh | Schenker Vision 14 i7-11370H, GeForce RTX 3050 Ti Laptop GPU, 53 Wh | Average of class Subnotebook | |
|---|---|---|---|---|---|---|---|---|
| Battery runtime | -26% | -8% | -43% | -8% | 9% | -39% | 24% | |
| H.264 (h) | 11.1 | 7.6 -32% | 12.6 14% | 15 35% | 6.8 -39% | 15.4 ? 39% | ||
| WiFi v1.3 (h) | 10.1 | 7.5 -26% | 8.6 -15% | 7.2 -29% | 9.5 -6% | 13.6 35% | 5.5 -46% | 14 ? 39% |
| Load (h) | 2.1 | 1.7 -19% | 1.6 -24% | 0.9 -57% | 1.9 -10% | 1.2 -43% | 1.4 -33% | 1.969 ? -6% |
| Reader / Idle (h) | 11.9 | 11.5 | 28.6 ? |
Pros
Cons
结论 - 愿景14有了显著的改进
通过最新版本的Vision 14,Schenker解决了我们对前代产品的两个主要批评。新的Alder Lake-H45处理器比旧的Tiger Lake 芯片提供了更多的性能,使Vision 14成为其设备级别中最快的型号之一。同样地, RTX 3050 Ti表现也不错,尽管一段时间以来该领域的发展少之又少,这让我们对即将推出的RTX 4000 GPU更加兴奋。
由于新的99瓦时电池,电池运行时间也大大增加,尽管这是以重量增加约0.44磅、厚度增加1毫米(约0.04英寸)和次级M.2-2280 SSD插槽为代价的。虽然带有较小的53瓦时电池的更轻版本仍然可用,但它必须配置专用的GeForce GPU。对于不需要长时间运行的用户来说,更轻的型号仍然是一个简单的推荐。
由于酷睿i7-12700H和99-Wh的电池,新的Vision 14在CPU性能或电池寿命方面不再那么受限制。虽然14英寸的机身略重且略厚,但良好的性能、广泛的端口、良好的维护选项以及90赫兹的漂亮3K显示屏的组合,使Vision 14成为一个极其令人激动的优秀14英寸笔记本电脑。
尽管Vision 14的机身略厚且重,但它仍保留了非常小的占地面积、足够的端口选项、内存插槽和可拆卸的Wi-Fi模块。尽管与现代6-GHz网络(Wi-Fi 6E)不兼容是一个缺点,但用户可能暂时不会受此限制。此外,与竞争对手相比,盖子的铰链没有那么紧,导致了相当明显的摇晃。虽然90瓦的交流适配器在名义上太弱,但对于110瓦的峰值消耗来说似乎已经足够。此外,在高负荷或游戏时,用户仍将不得不面对高的表面温度和响亮的风扇。这只是在一个紧凑的机箱中使用非常高性能的组件的结果。
具有类似性能特征和专用GPU的竞争者明显比Vision 14重,这基本上是目前这种小尺寸产品的最大性能。然而,配备RTX 3050 Ti的Vision 14并不完全是一个便宜货,其价格与目前的 MacBook Pro 14(尽管内存和存储较少)。由于迷你LED面板、高效的M1 Pro芯片和出色的扬声器设置,后者可能是不依赖Windows的用户的更好选择。同时, 戴尔Inspiron 14 Plus 7420 - 虽然明显更重更厚,但却是一个更便宜的选择。
价格和可用性
Schenker Vision 14可以在Bestware.com上配置。从1659欧元(约1659美元)起。https://bestware.com/de/schenker-vision-14-e22.html
Schenker Vision 14 2022 RTX 3050 Ti
- 10/25/2022 v7 (old)
Andreas Osthoff
Price comparison

