华硕VivoBook Pro 16回顾:一台拥有Core i7、RTX 3050 Ti和DCI-P3的多媒体笔记本电脑
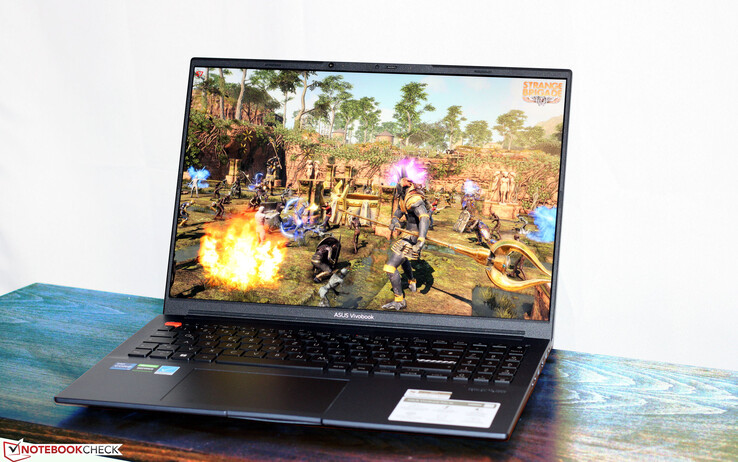
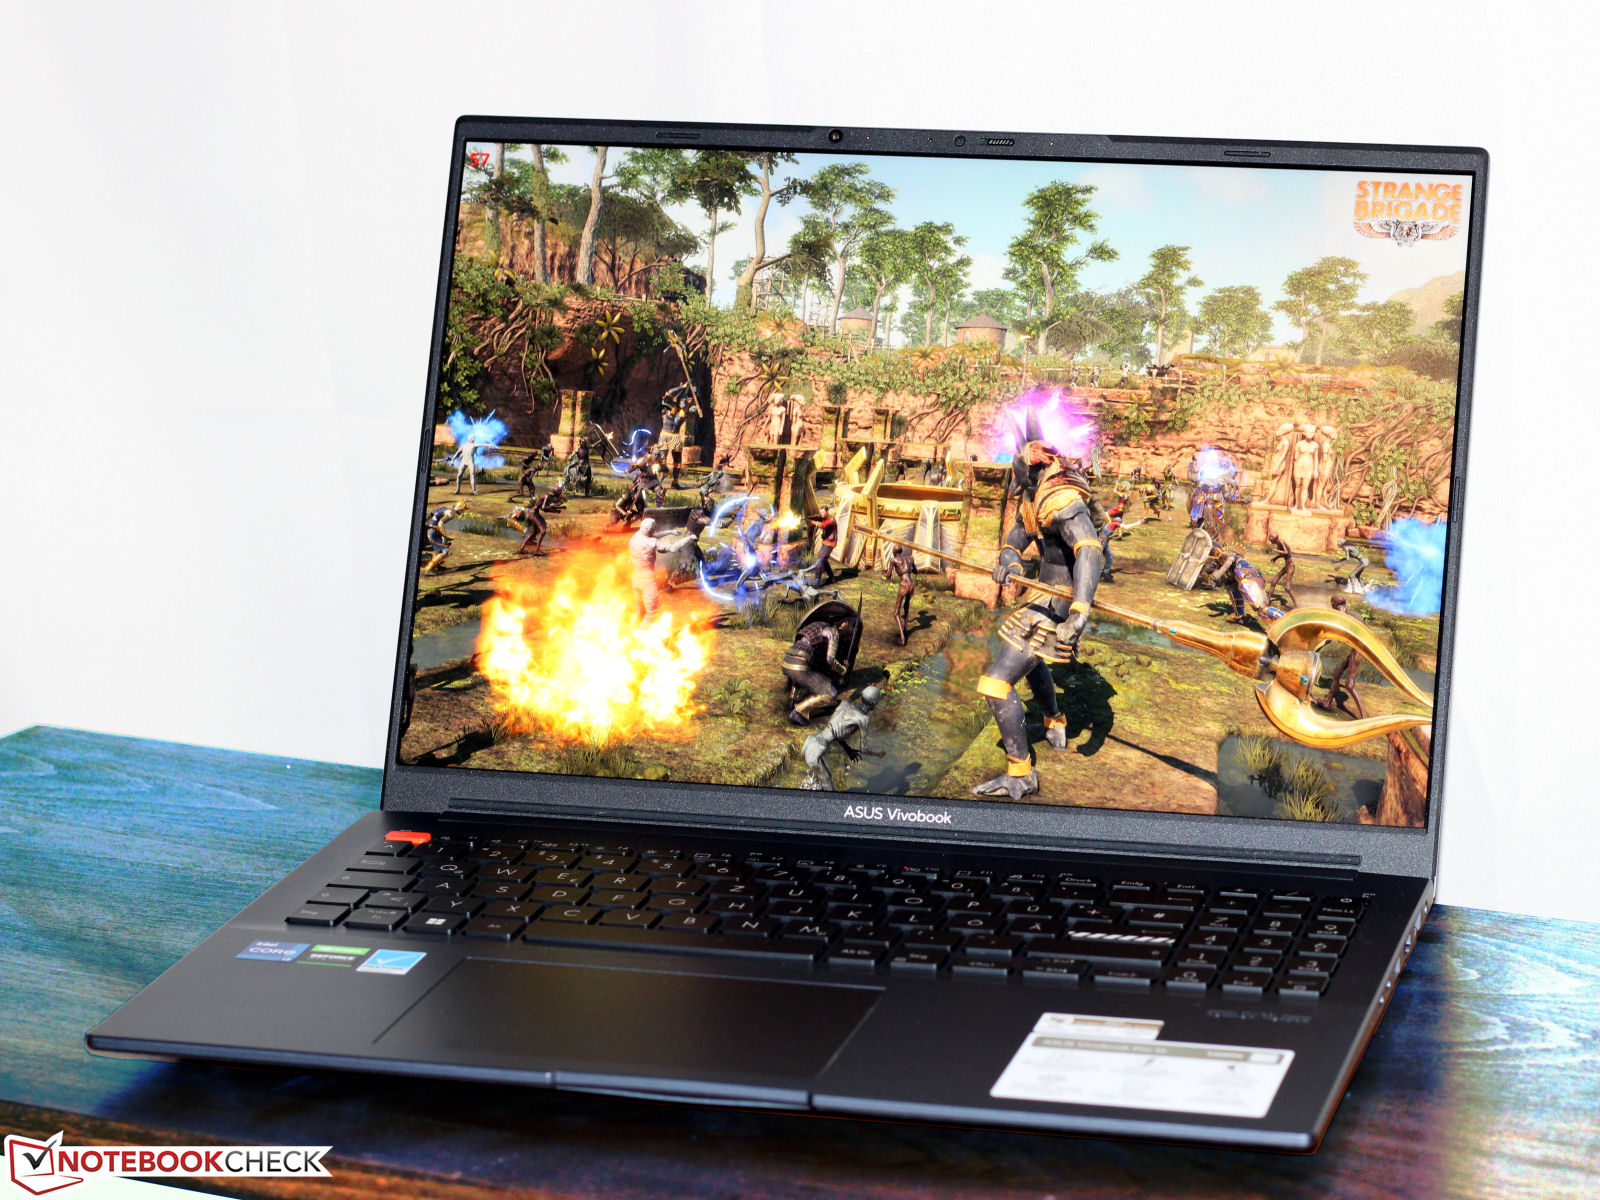
华硕VivoBook是一款适合游戏玩家和创意工作者的便携式16英寸笔记本电脑。这款笔记本电脑配备了合适的硬件:A酷睿i7-12700H,GeForce RTX 3050 Ti和一个明亮的16:10格式的IPS显示屏,具有很好的色彩准确性。这款笔记本电脑类似于VivoBook Pro 16X但它们的结构并不完全相同。这款笔记本电脑的竞争者包括 戴尔 Inspiron 16 Plus 7620,以及XMG Fusion 15 (Mid 22)和Acer Swift X 16.
潜在的竞争对手比较
Rating | Date | Model | Weight | Height | Size | Resolution | Price |
|---|---|---|---|---|---|---|---|
| 86.3 % v7 (old) | 05 / 2023 | Asus VivoBook Pro 16 i7-12700H, GeForce RTX 3050 Ti Laptop GPU | 1.9 kg | 20 mm | 16.00" | 2560x1600 | |
| 86.4 % v7 (old) | 11 / 2022 | Acer Swift X SFX16-52G-77RX i7-1260P, A370M | 1.8 kg | 21.2 mm | 16.00" | 2560x1600 | |
| 87.4 % v7 (old) | 08 / 2022 | Dell Inspiron 16 Plus 7620 i7-12700H, GeForce RTX 3050 Ti Laptop GPU | 2.1 kg | 18.99 mm | 16.00" | 3072x1920 | |
| 87.4 % v7 (old) | 08 / 2022 | Schenker XMG Fusion 15 (Mid 22) i7-11800H, GeForce RTX 3070 Laptop GPU | 1.9 kg | 21.65 mm | 15.60" | 2560x1440 |
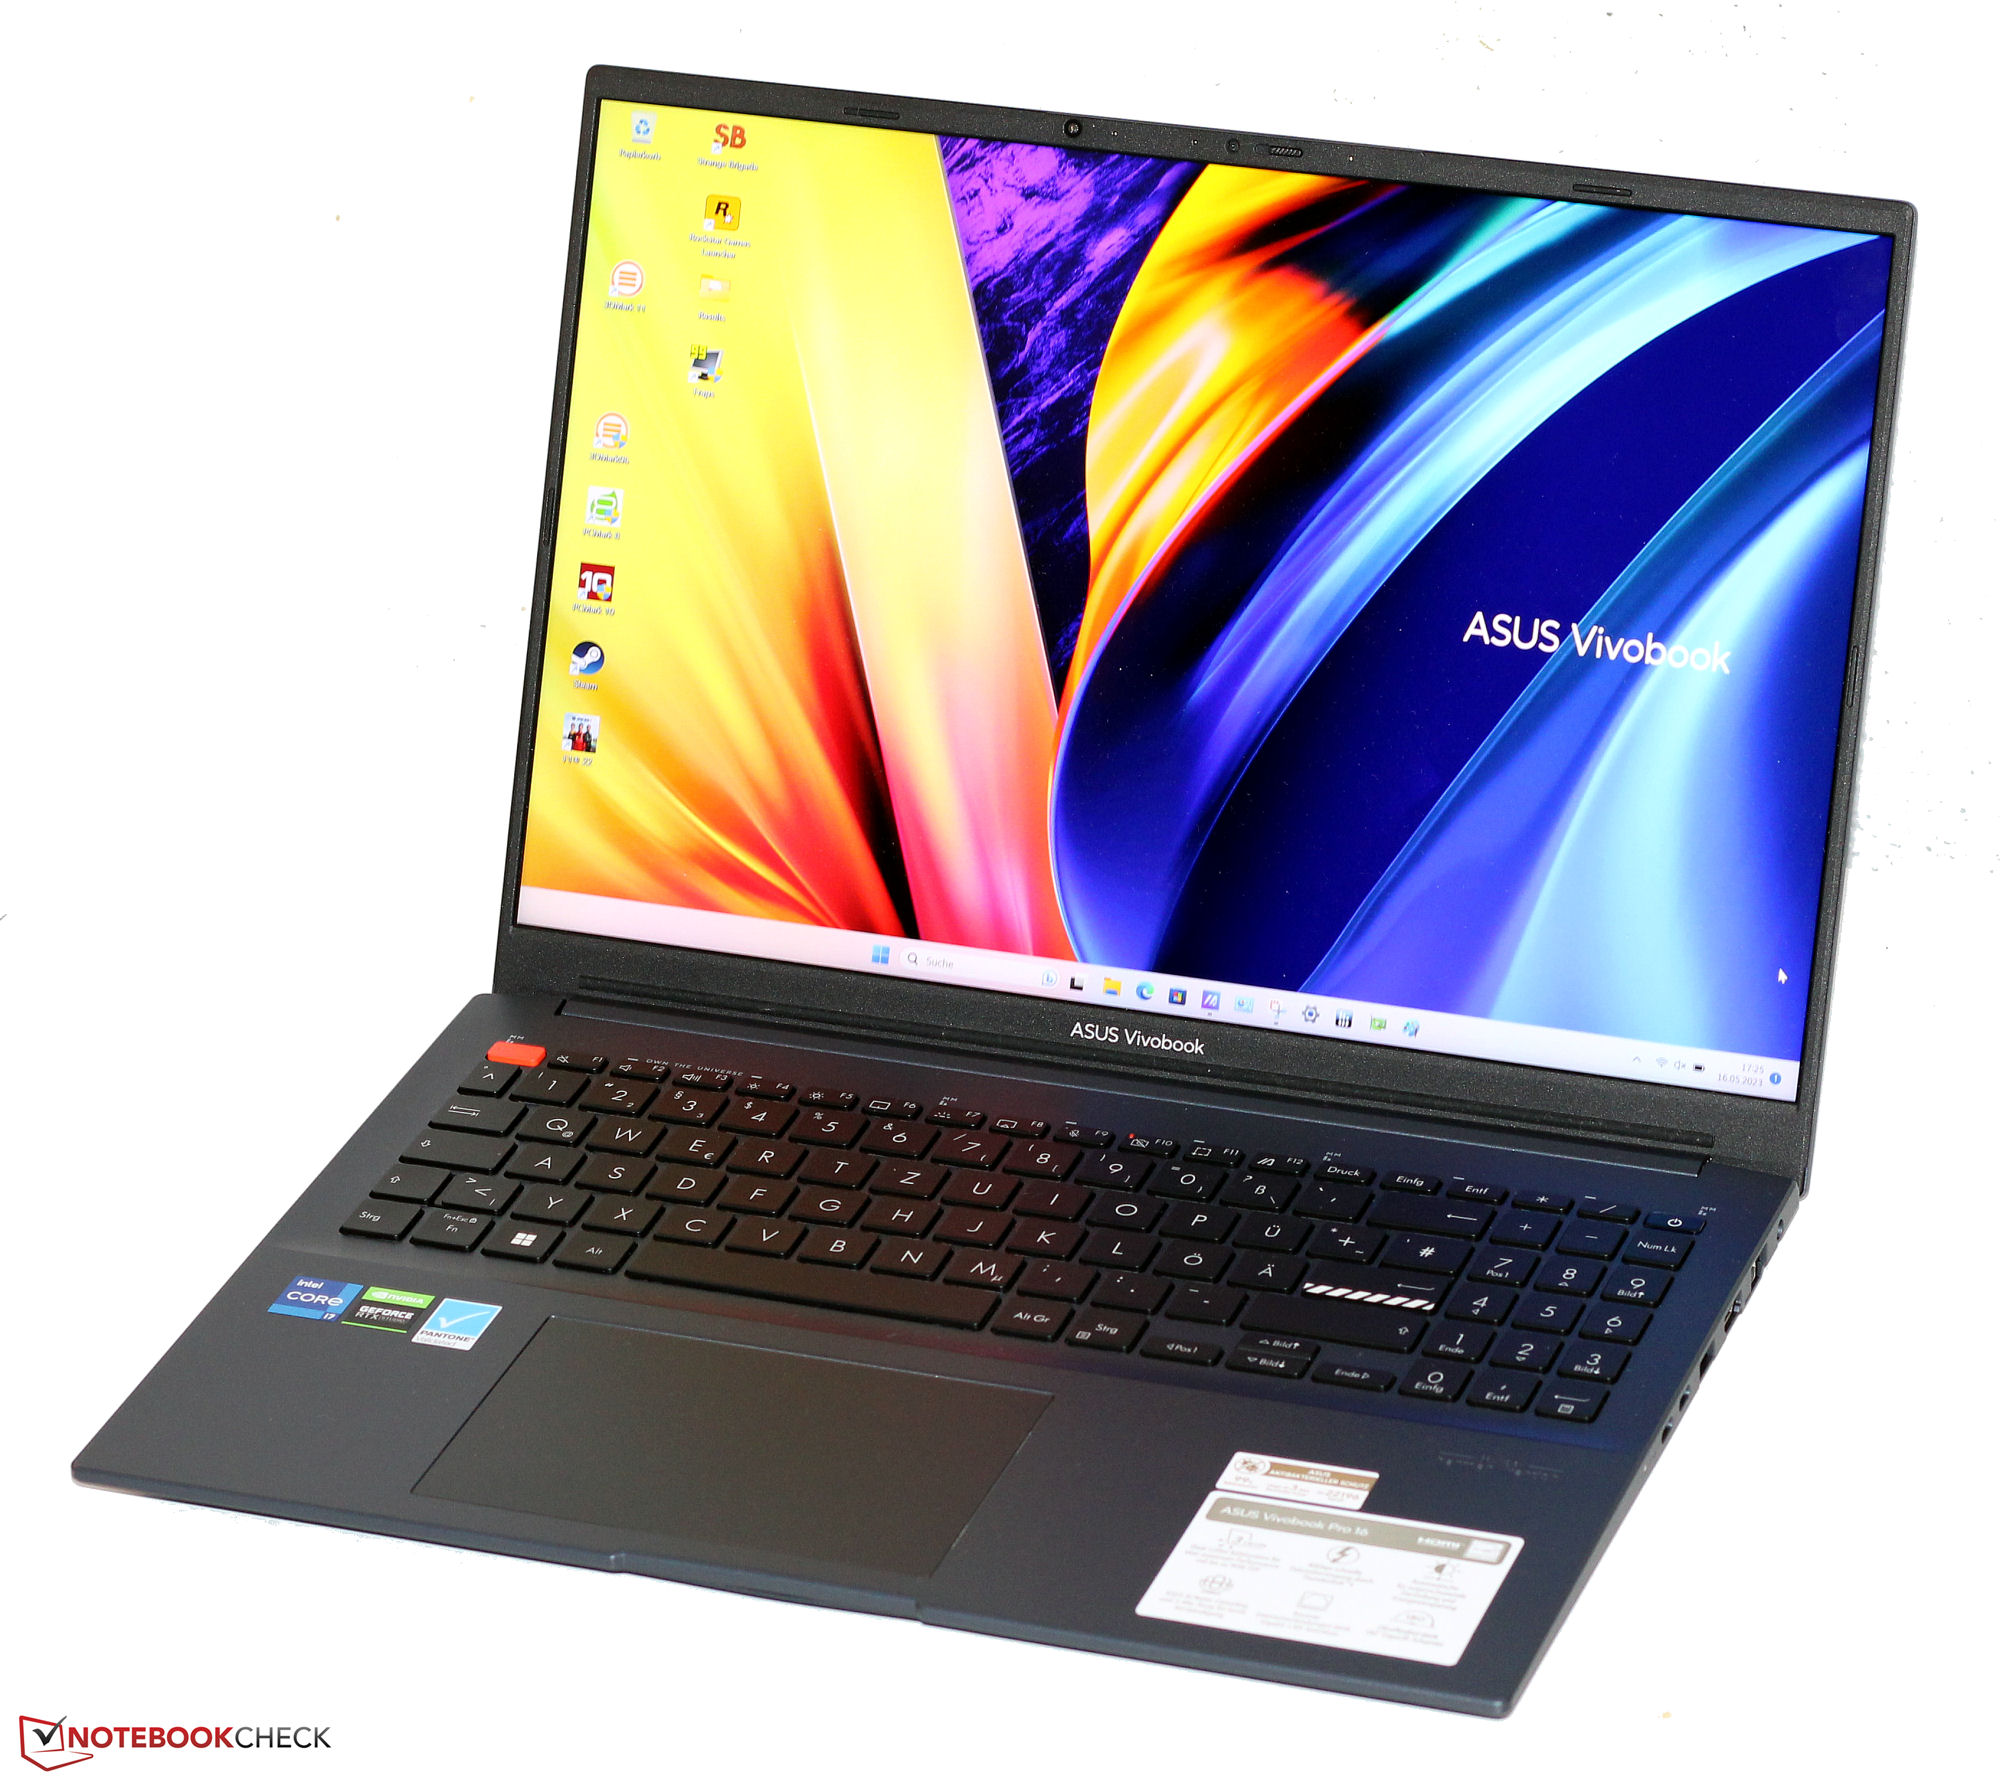
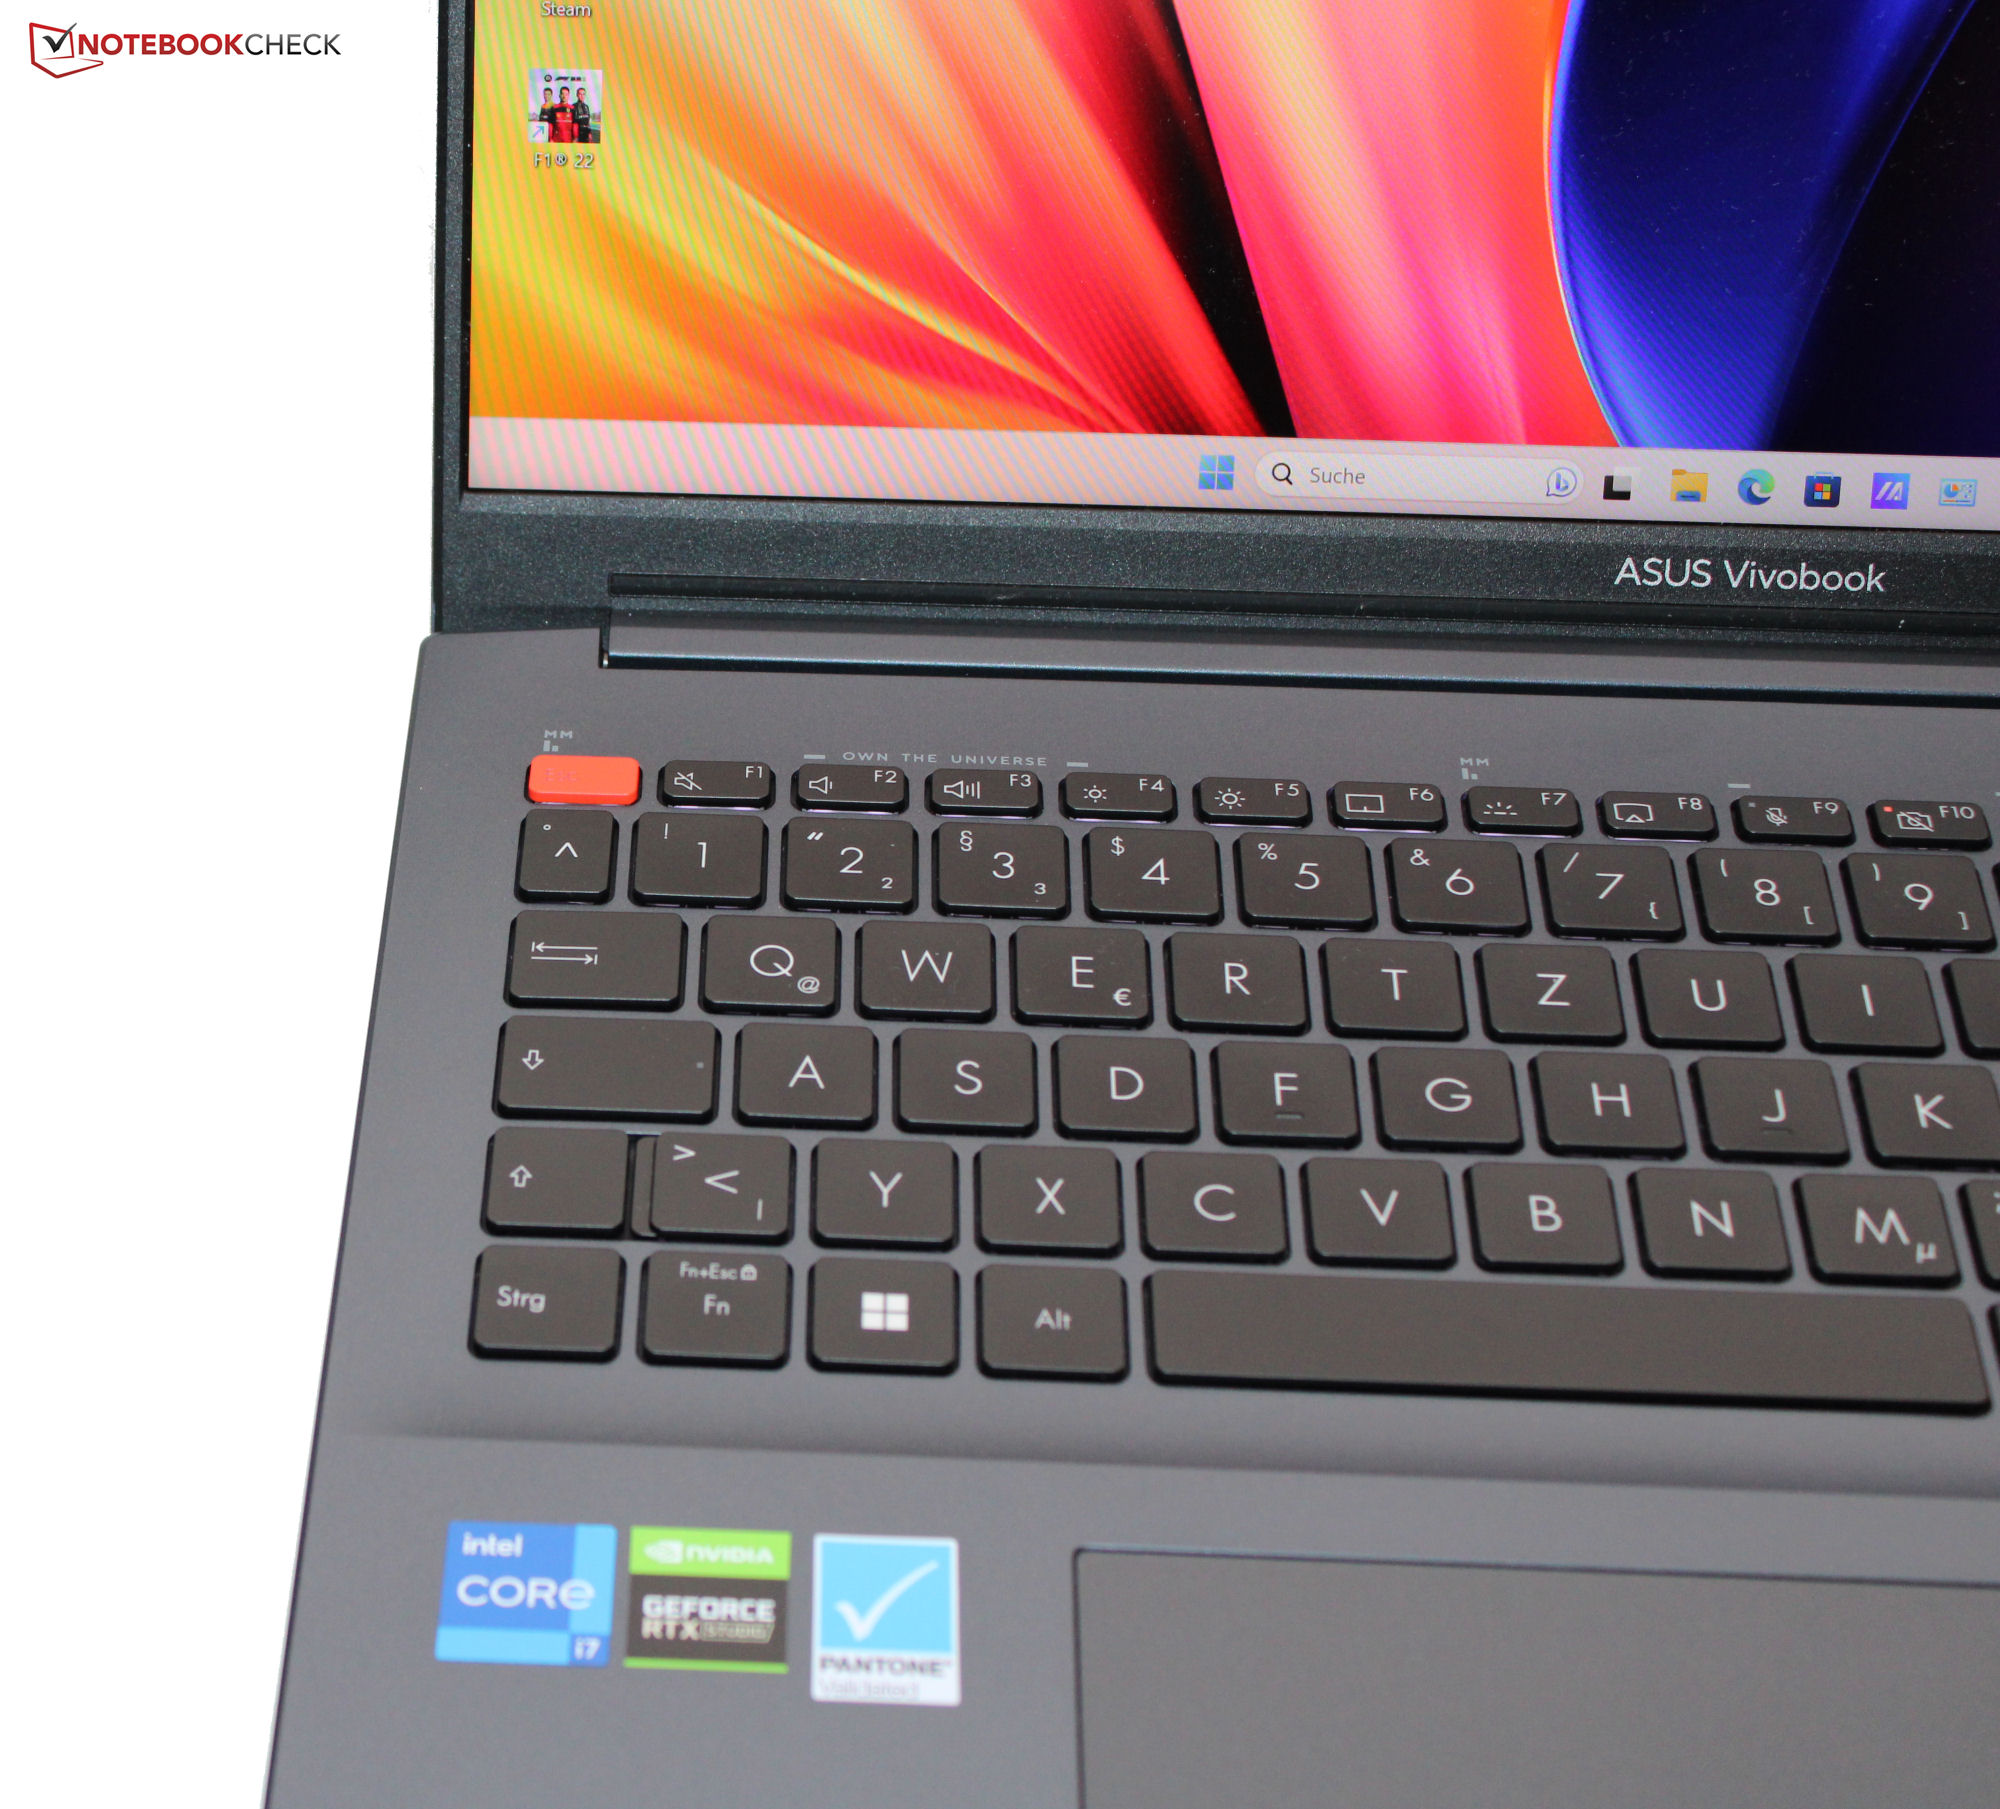
外壳和功能 - 带有Thunderbolt 4的VivoBook
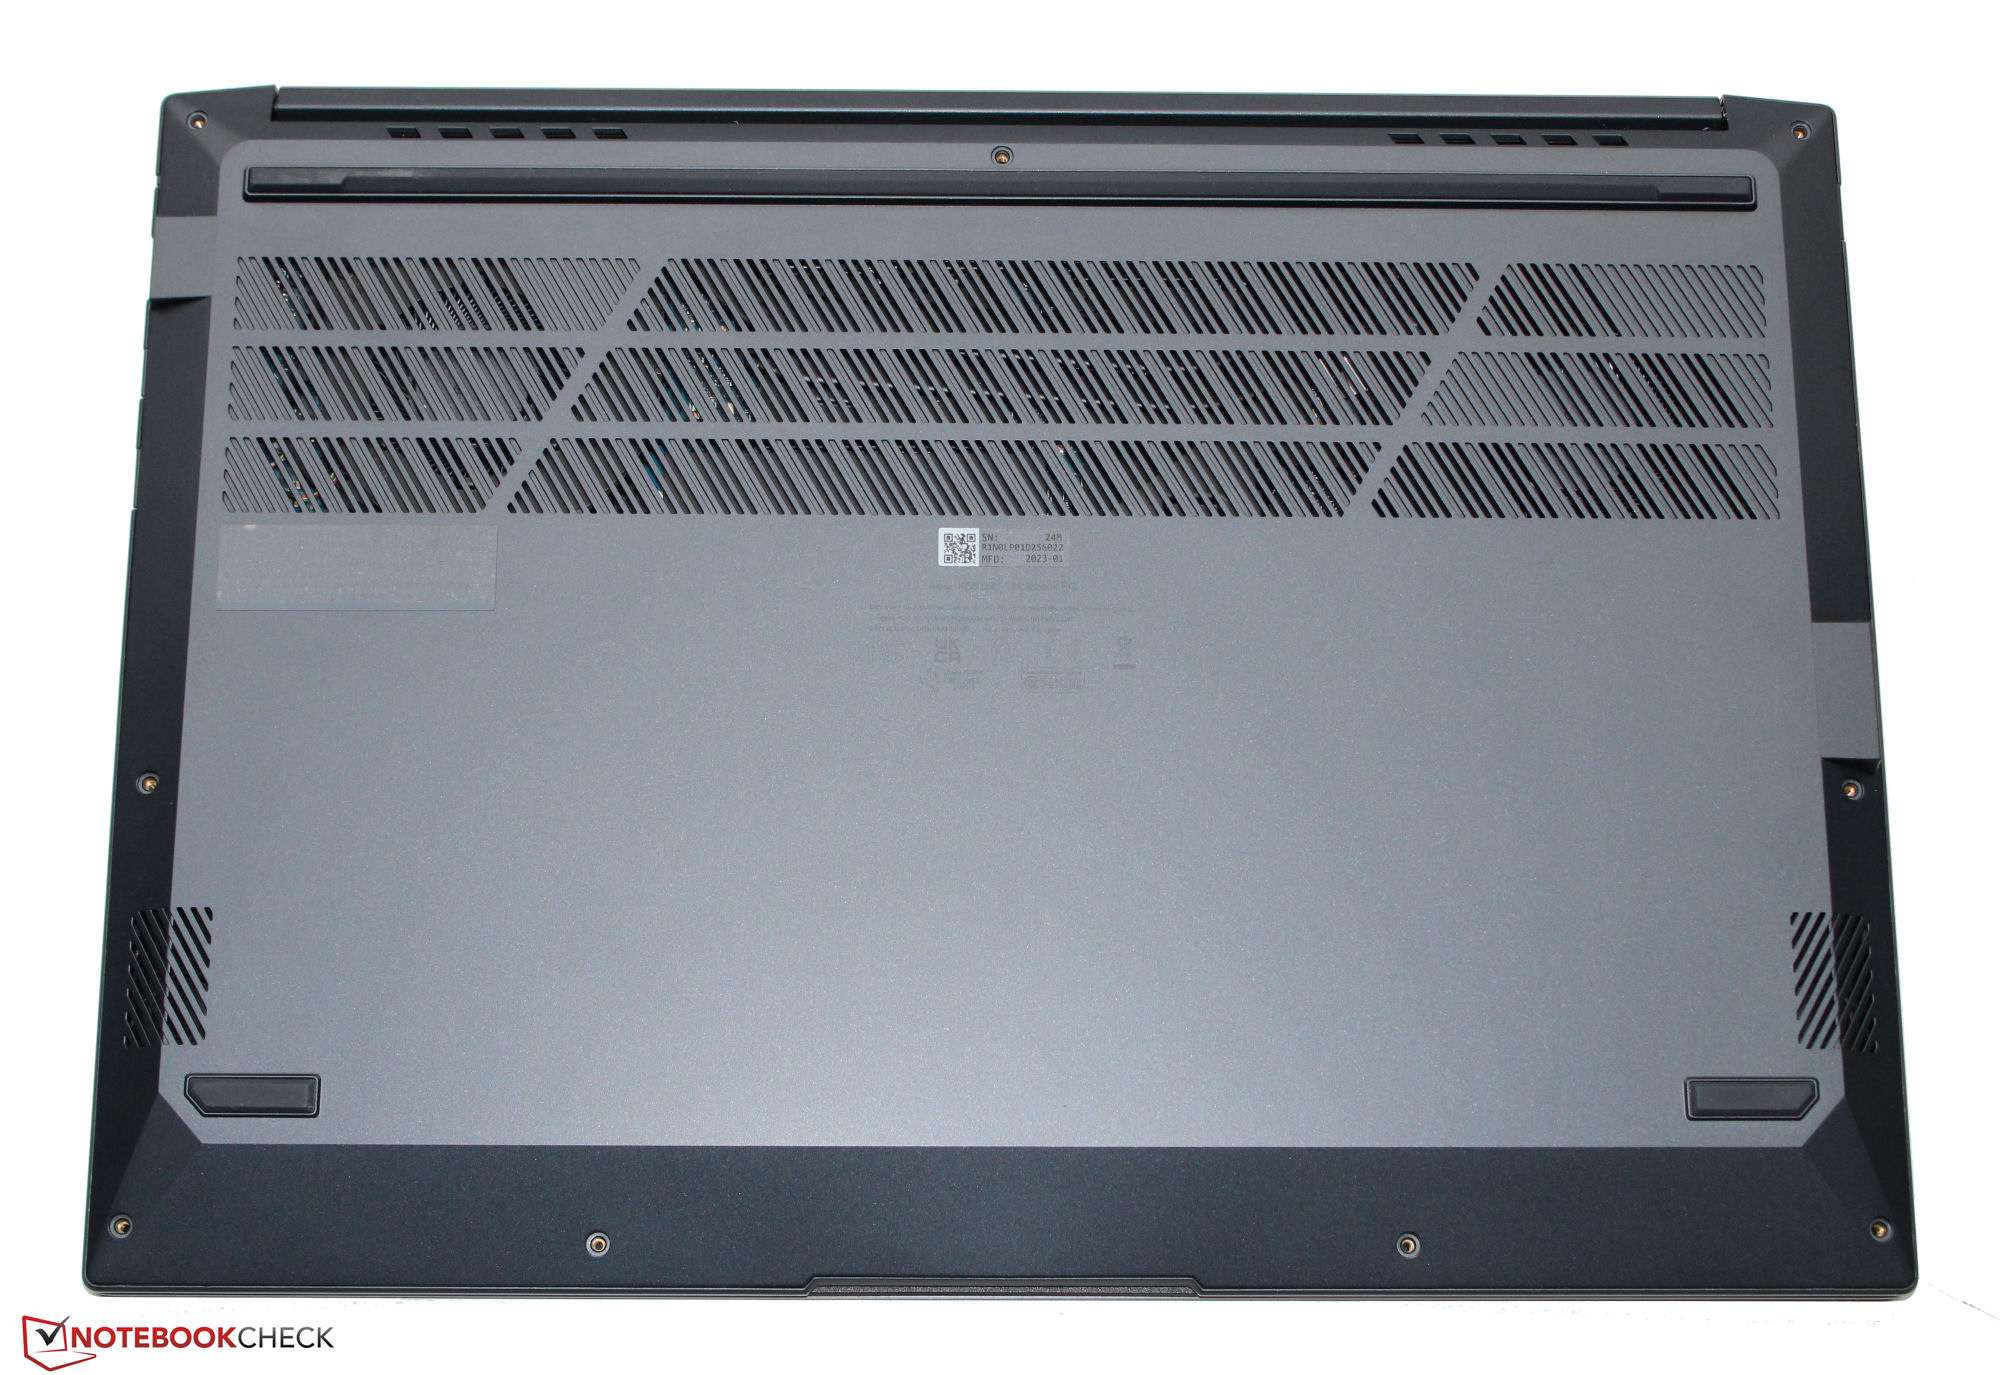
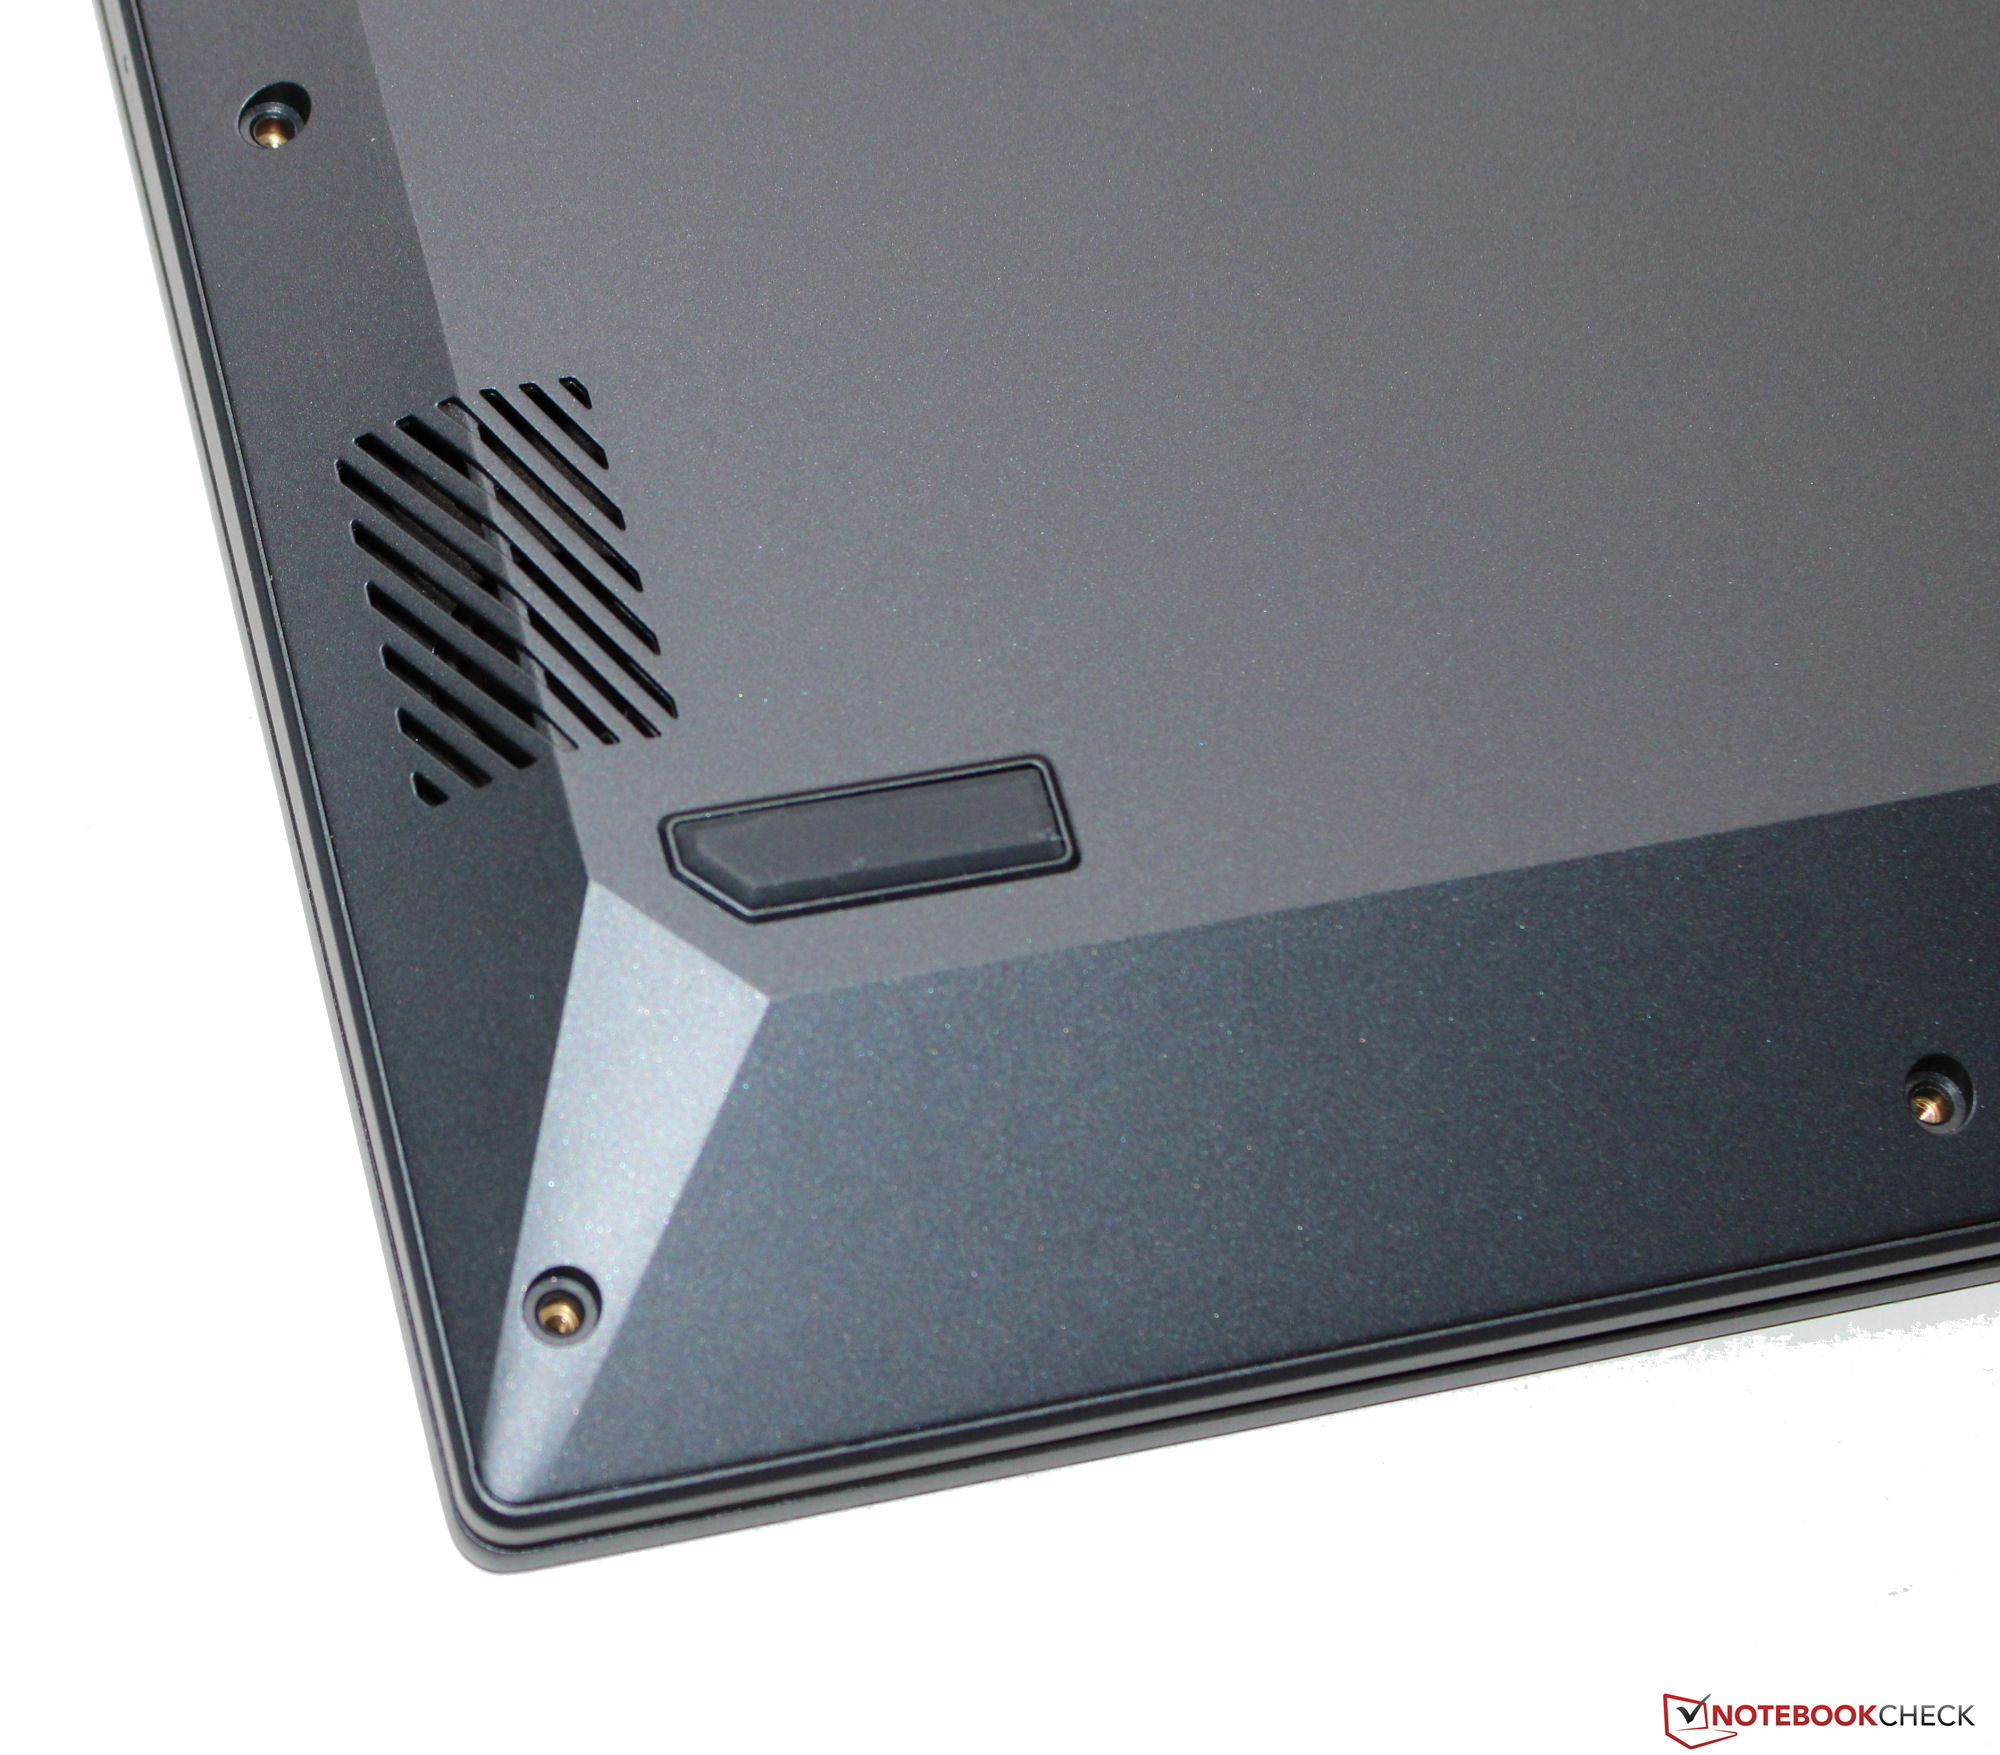
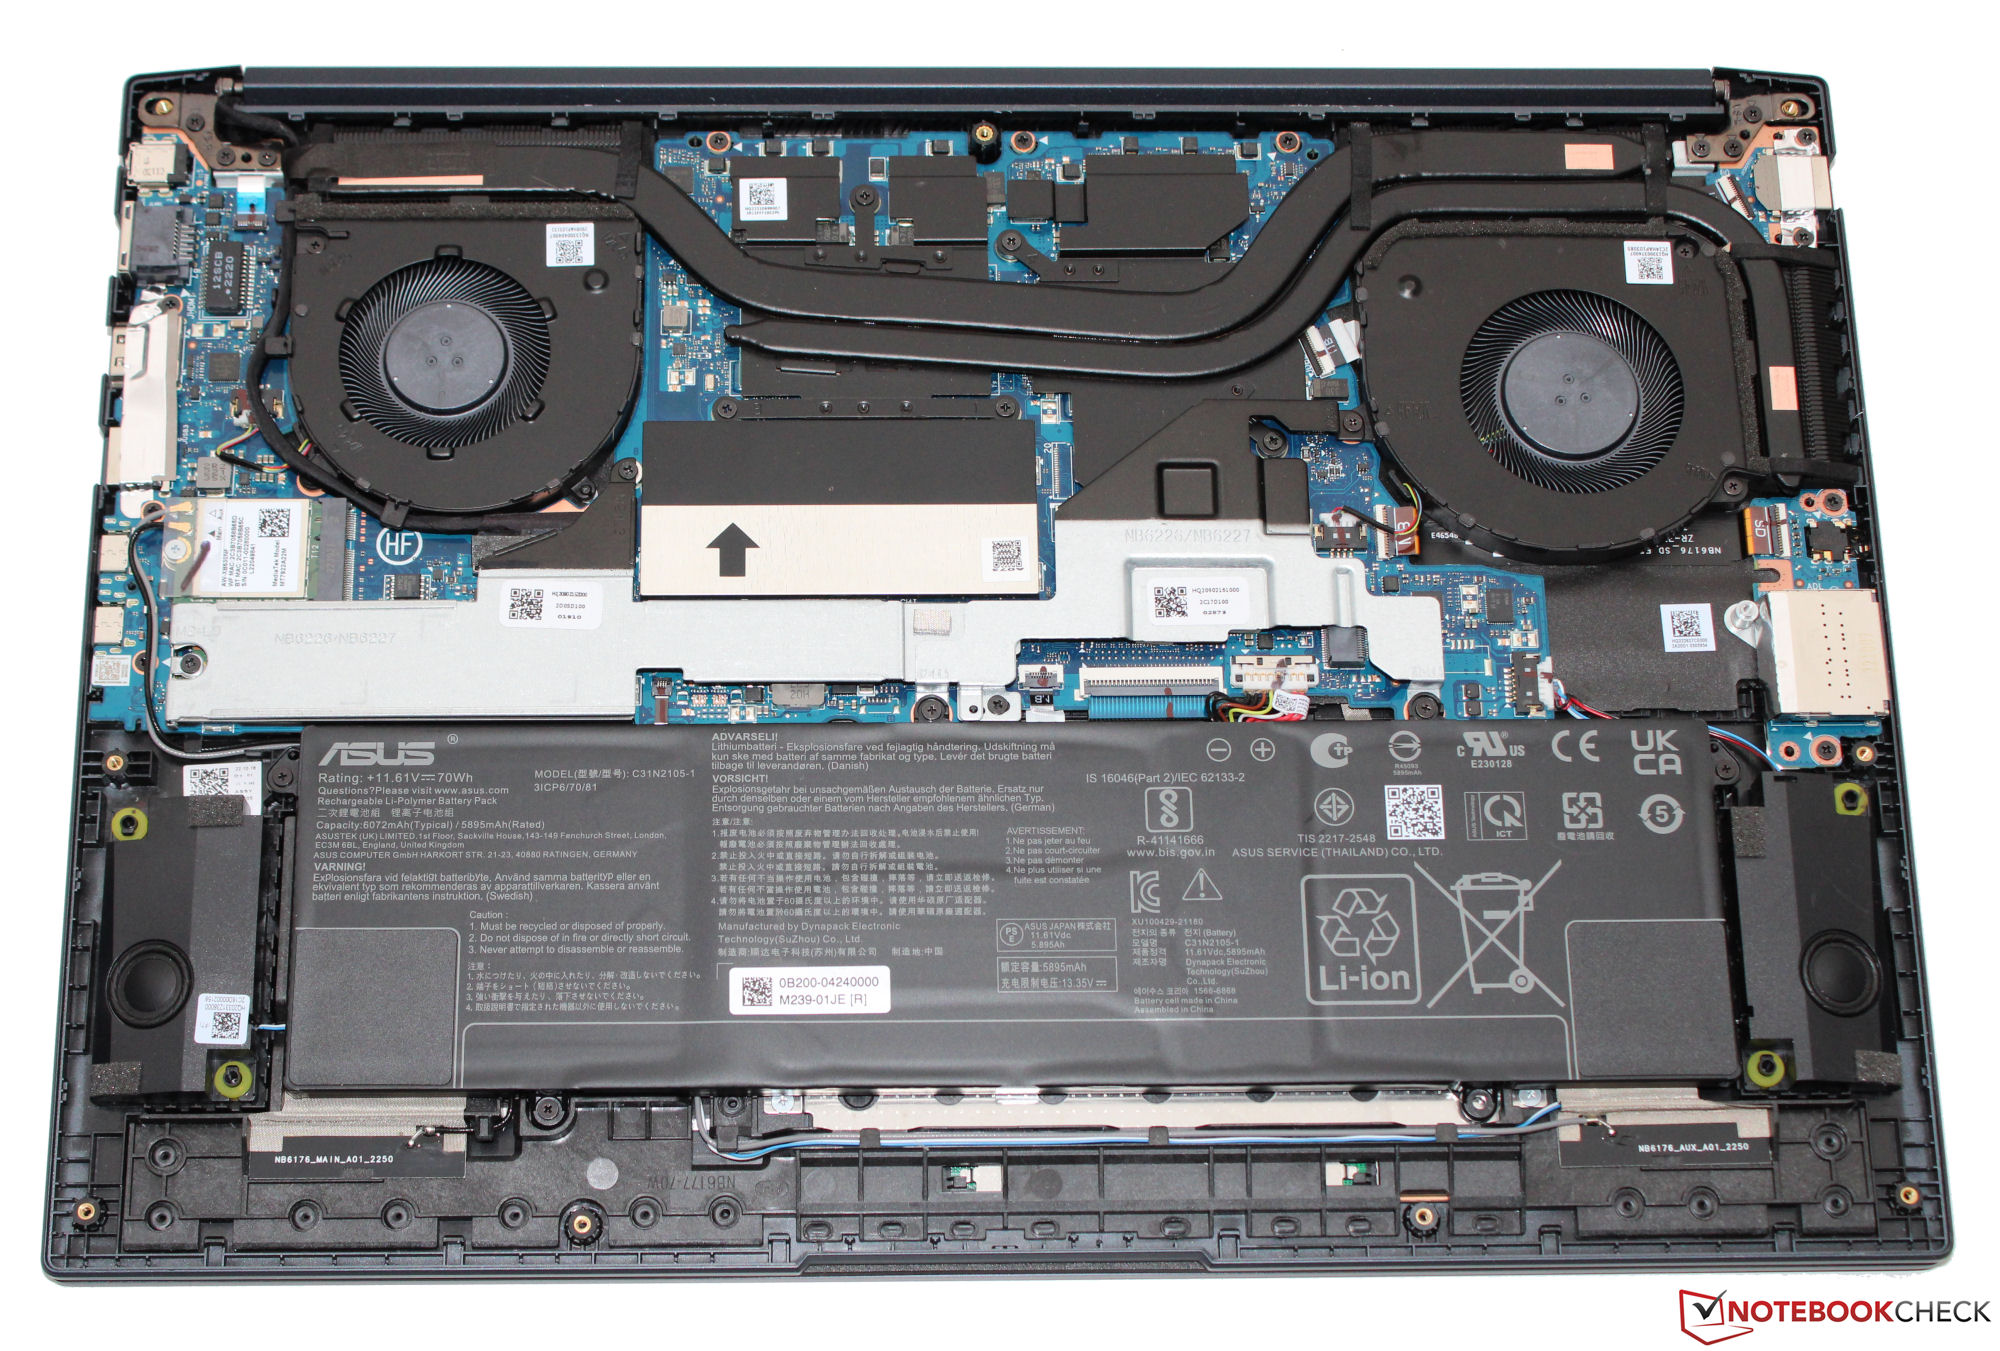
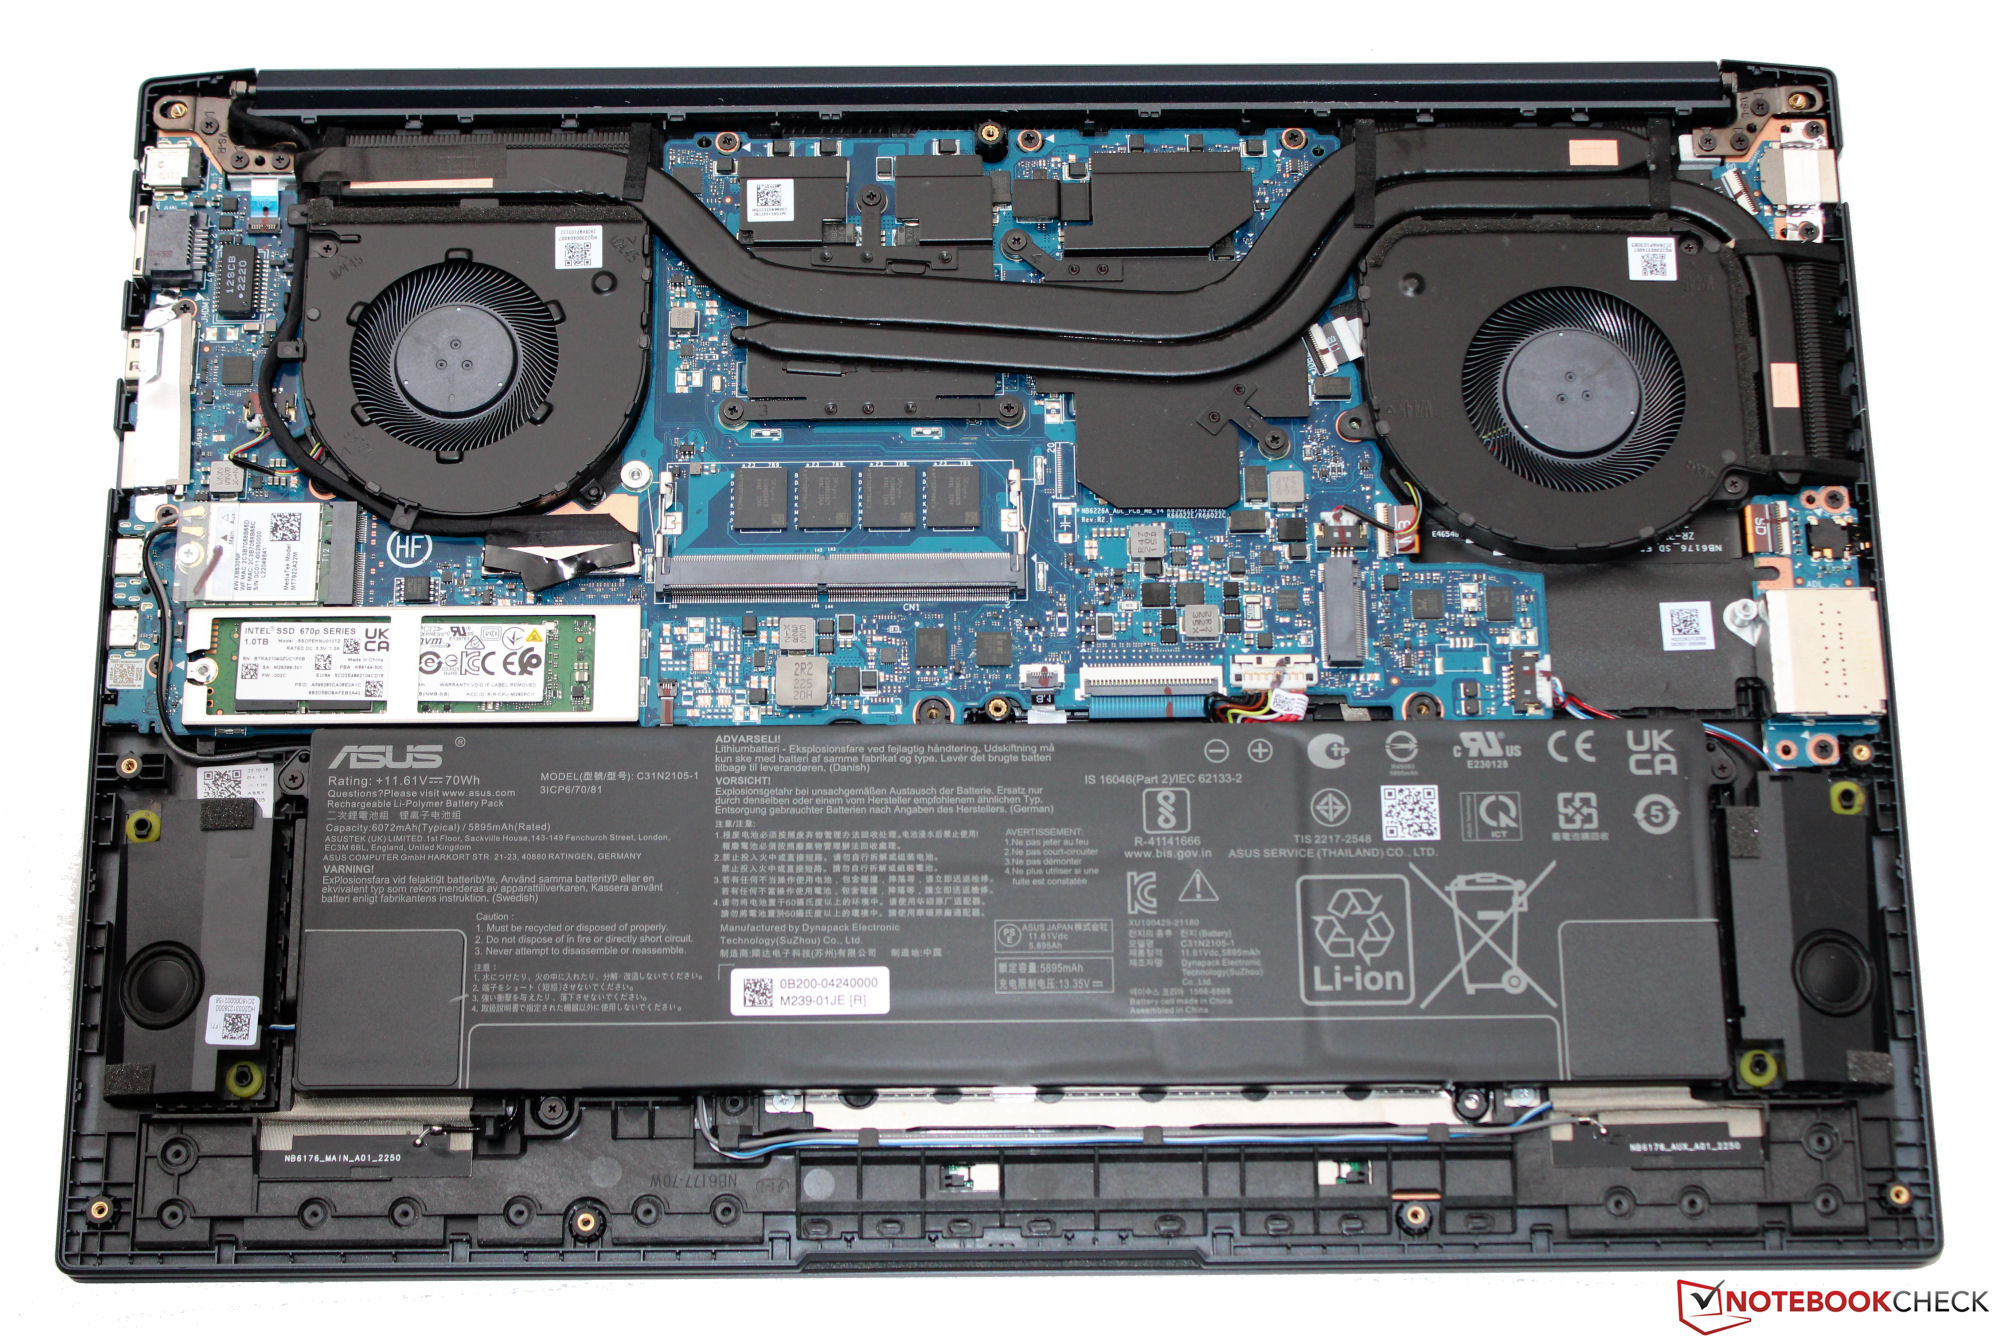
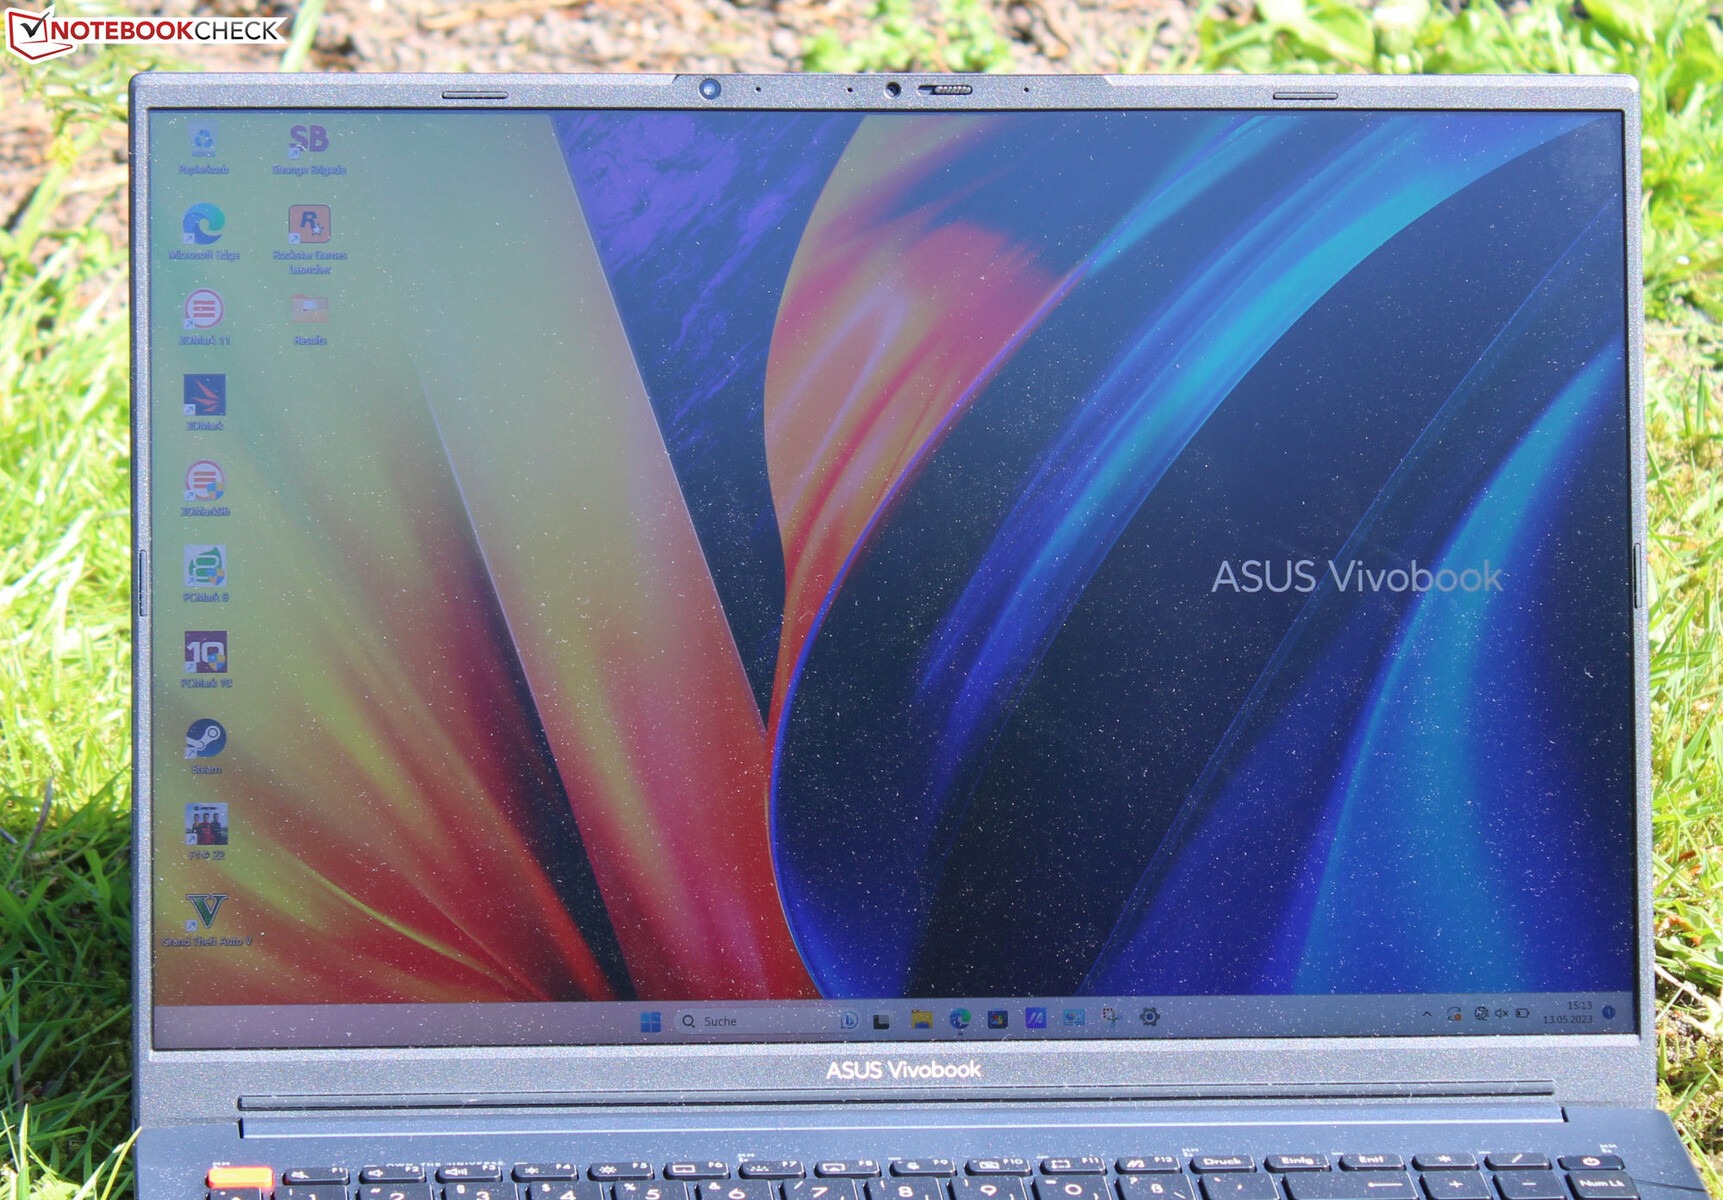
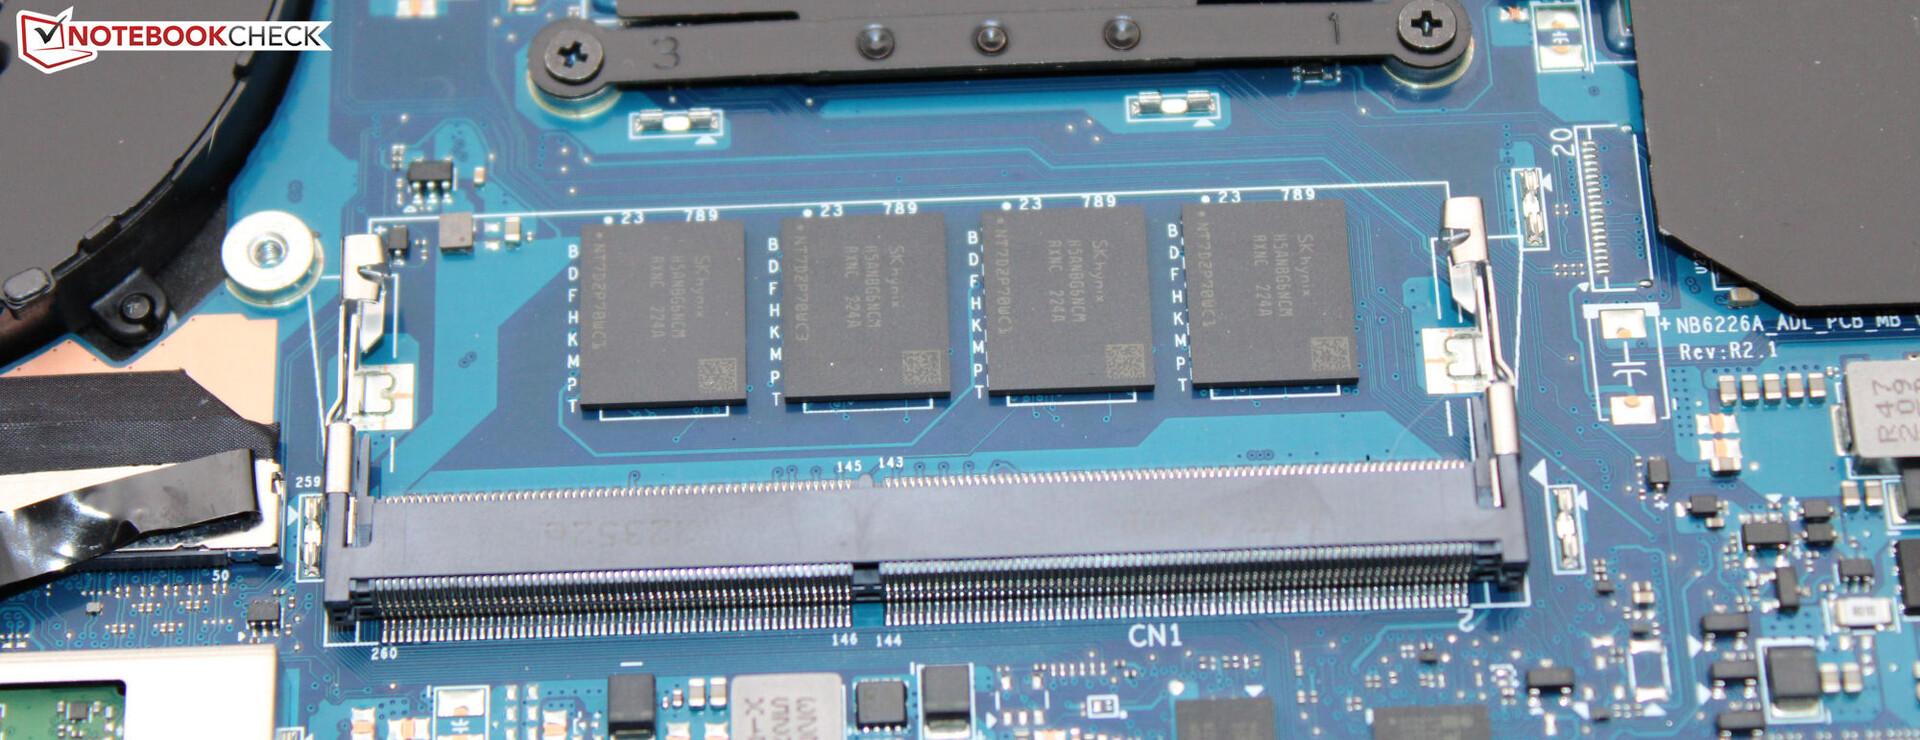
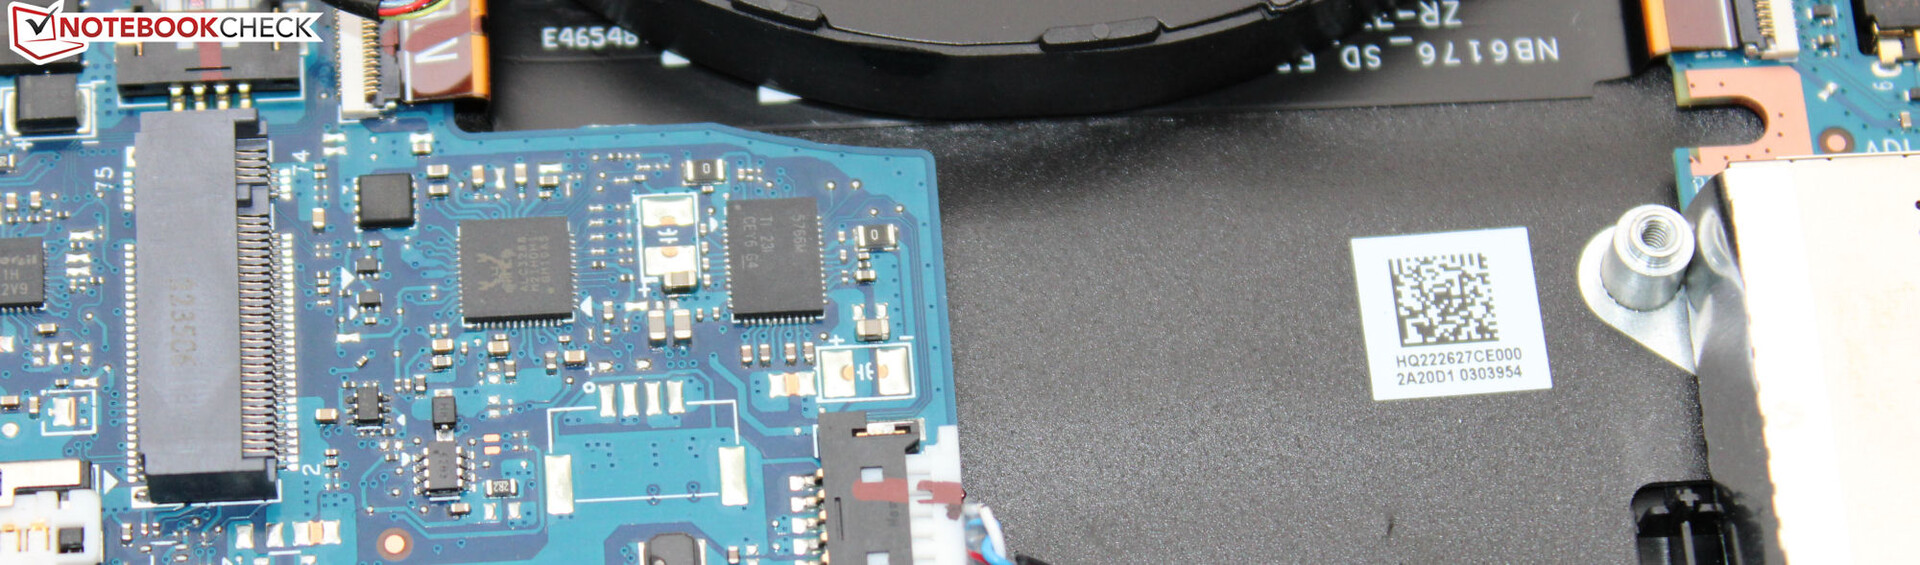
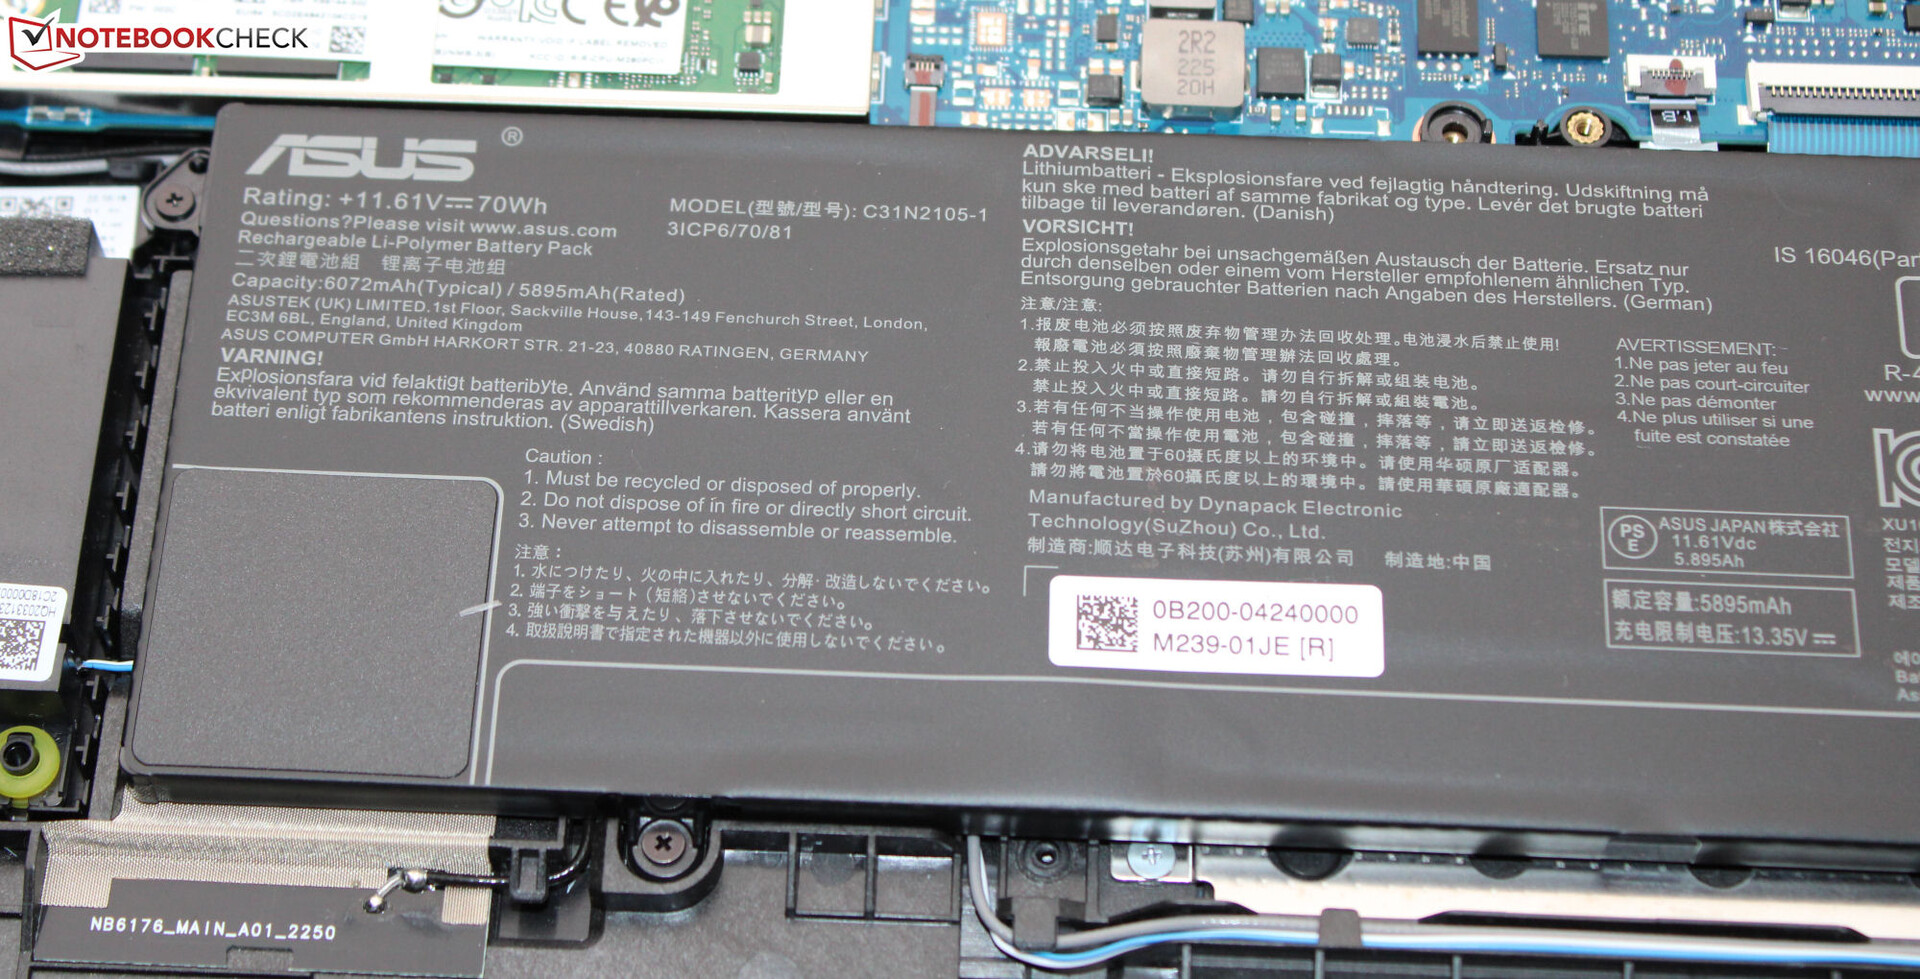
VivoBook的颜色是深蓝色(静谧蓝),表面光滑,有哑光。它的基本单元(塑料)和盖子(铝制背面)可以有点太容易扭曲。你可以打开盖子的最大角度为180度。一旦你取下机箱底部,就可以接触到电池(用螺丝固定,不是粘在上面)以及笔记本电脑的其他内部零件。
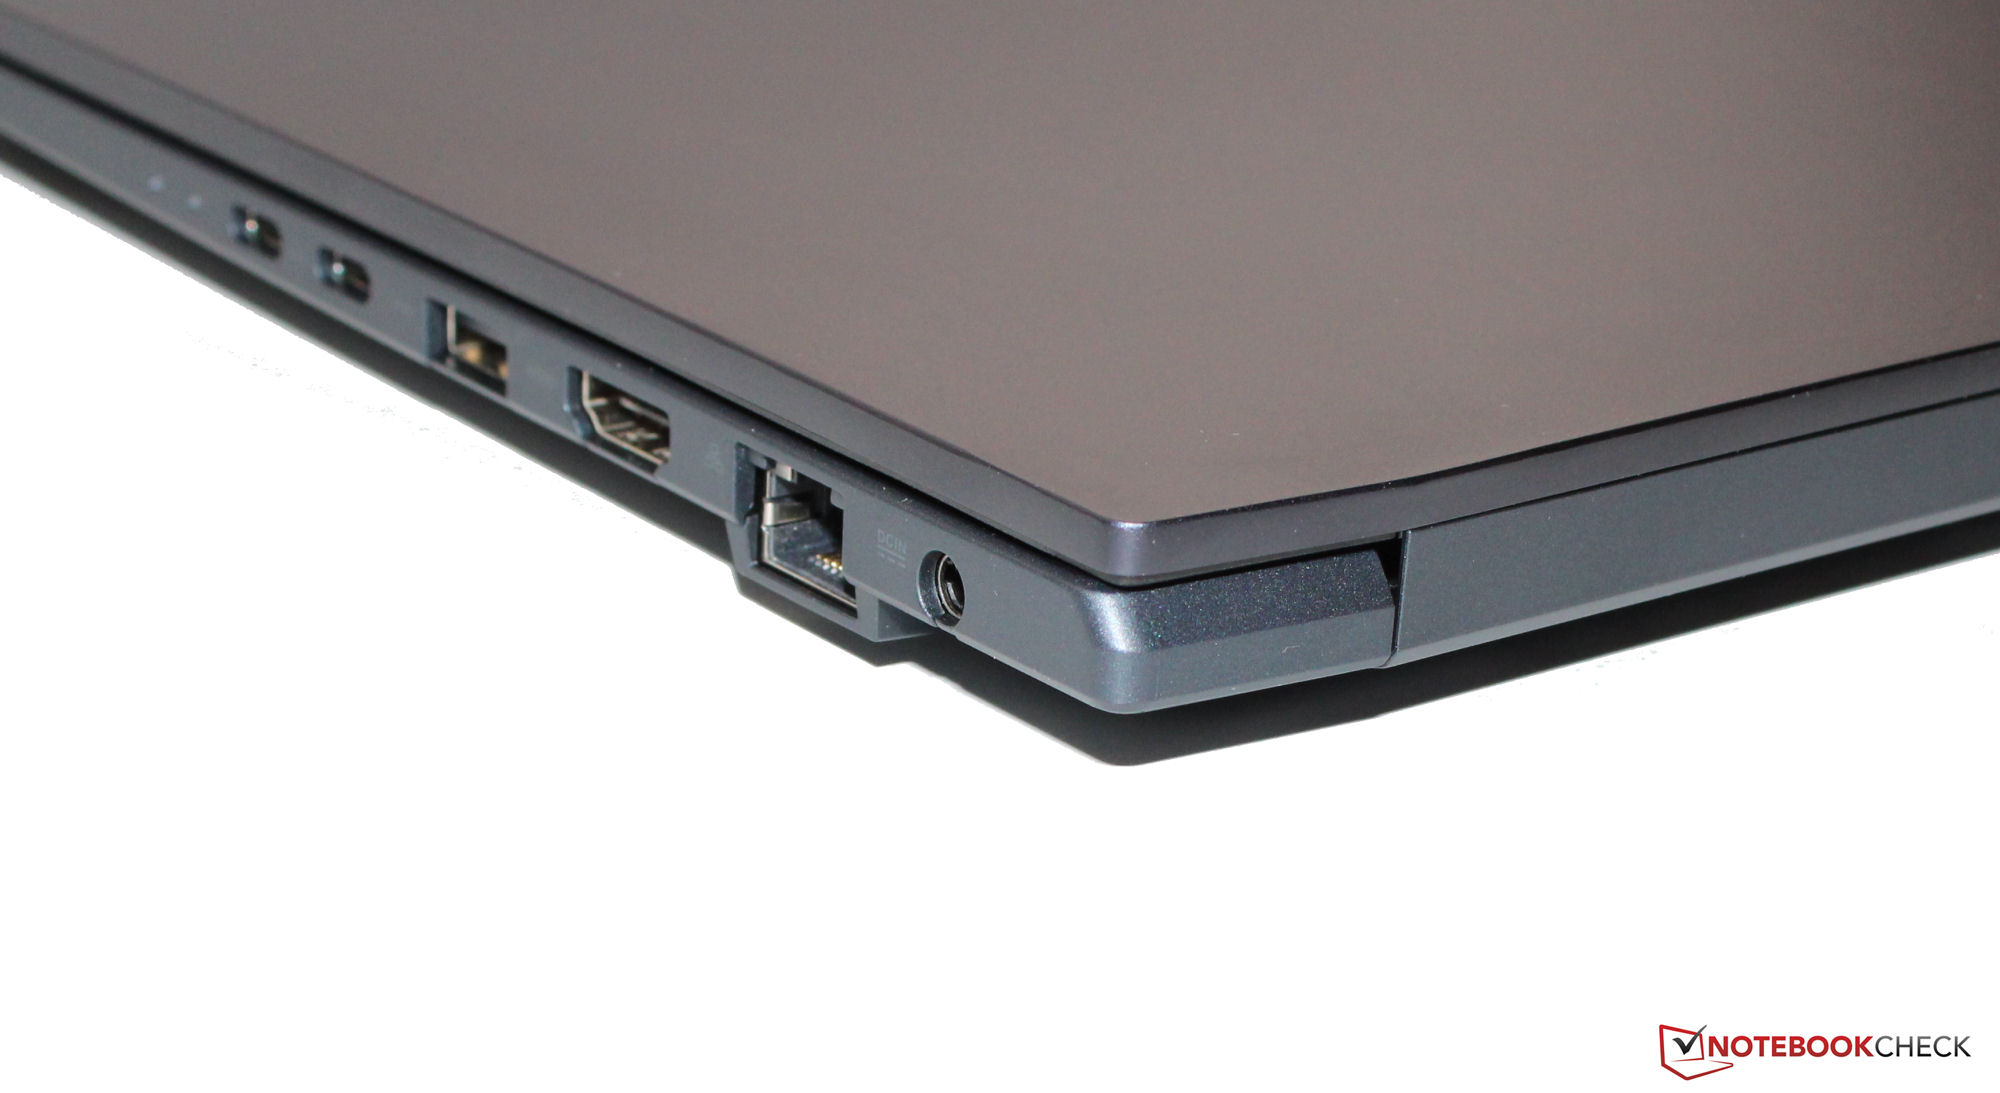
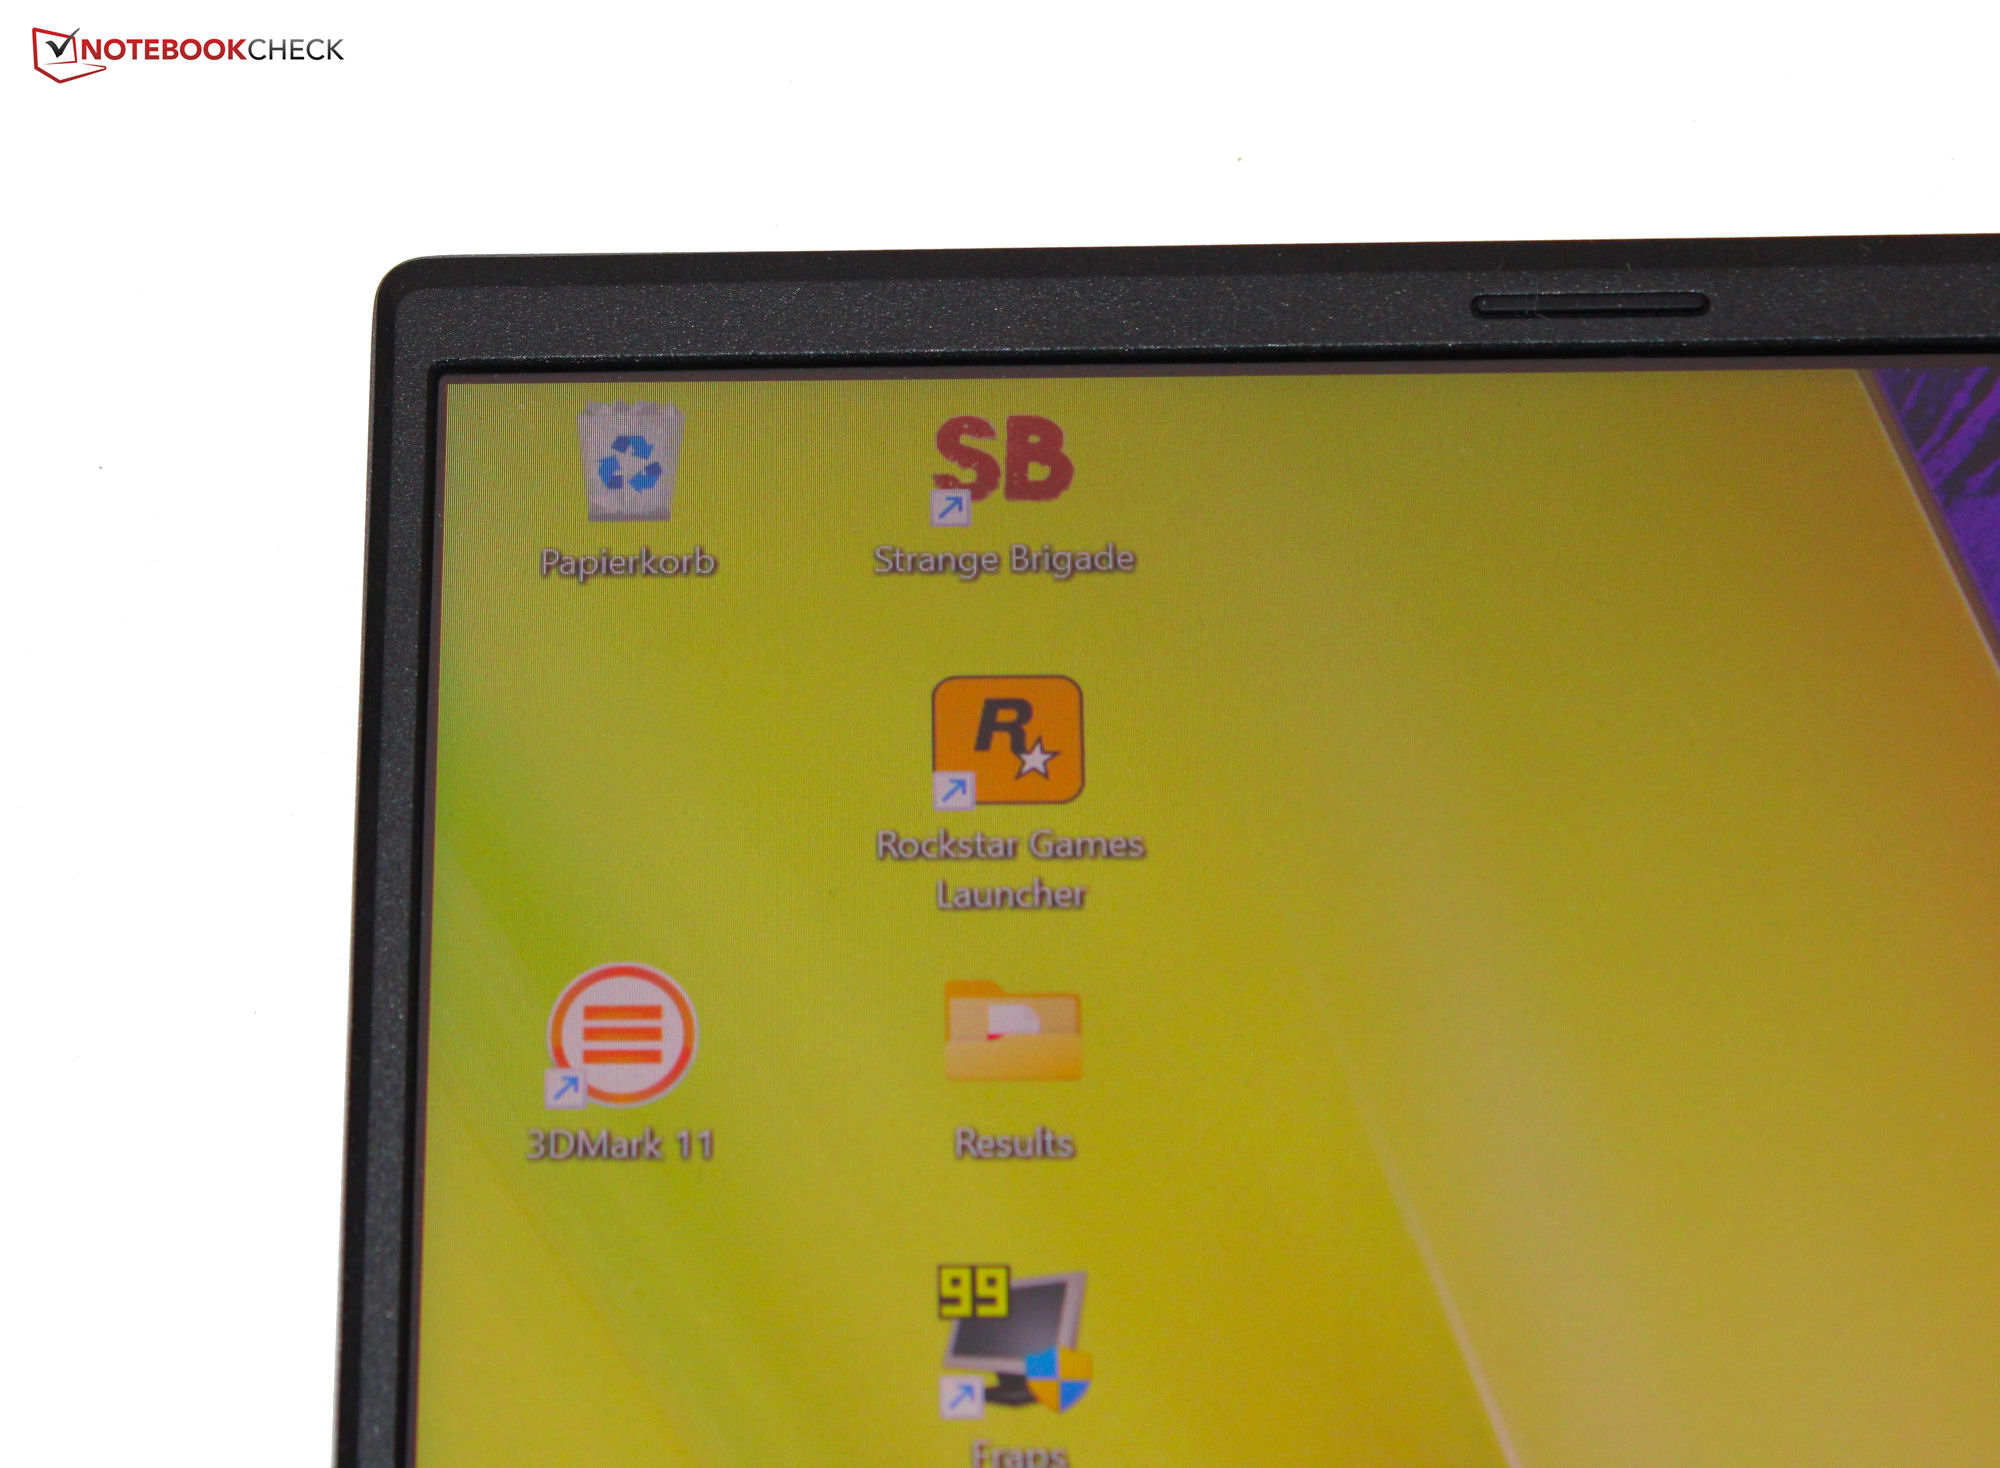
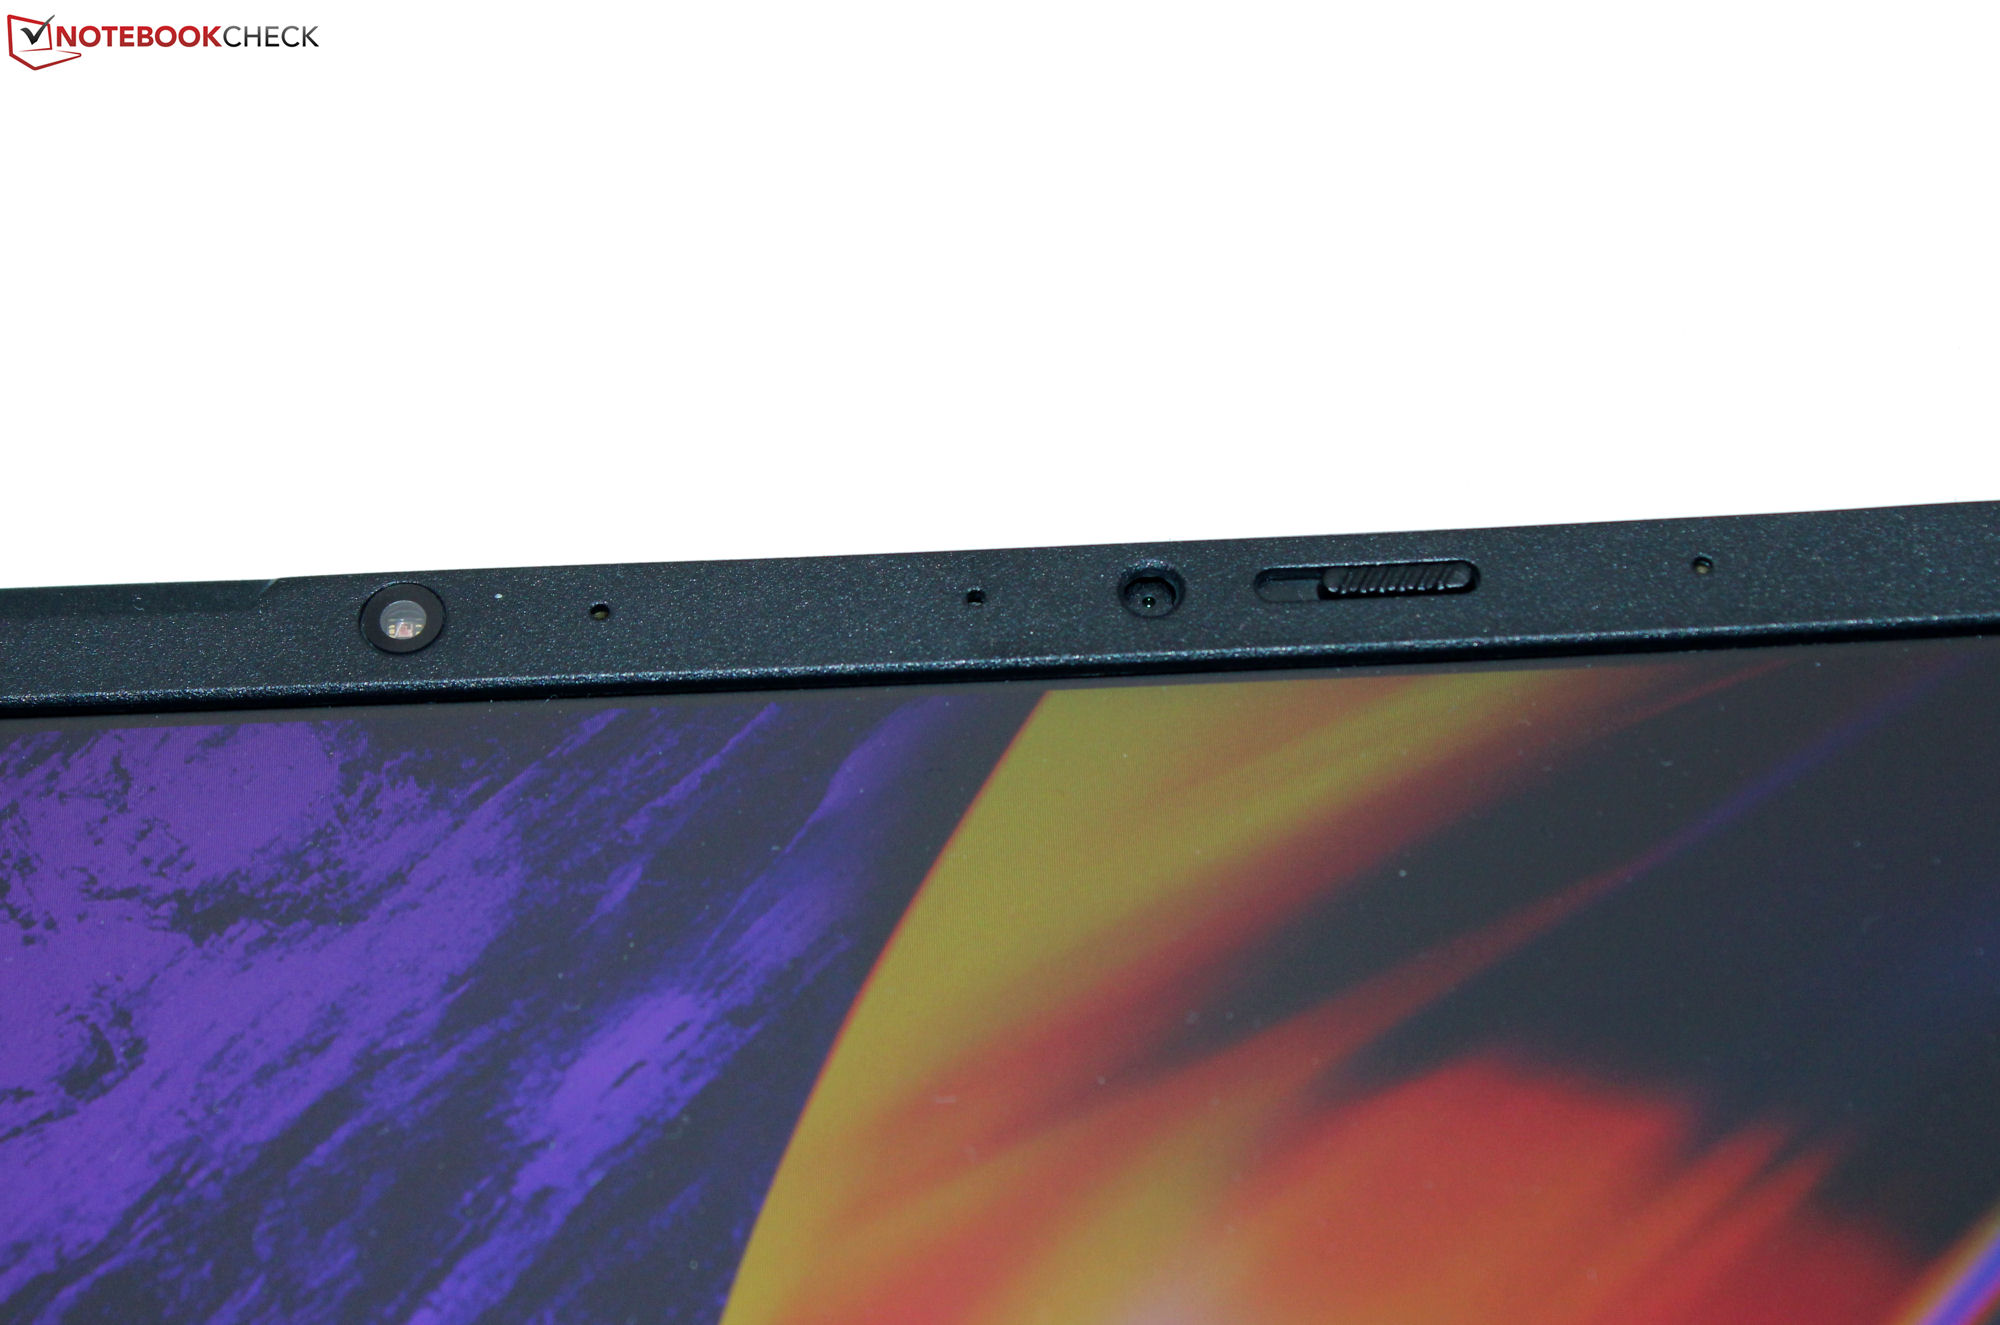
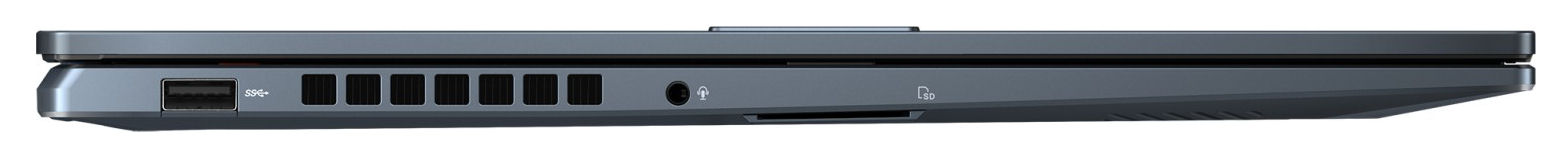
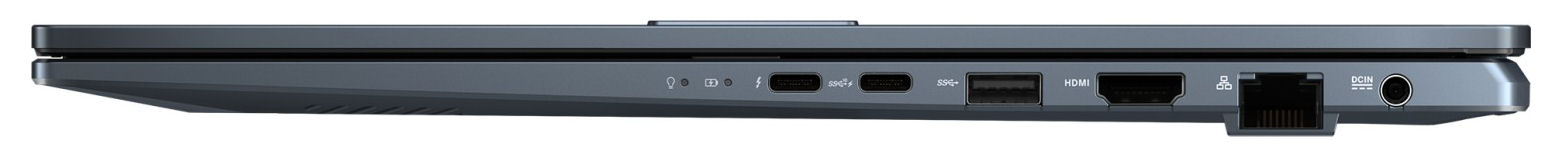
该设备有两个USB-A端口(USB 3.2 Gen 1),以及两个USB-C端口(1个Thunderbolt 4,1个USB 3.2 Gen 2)。后者支持电源传输,TB4端口还可以输出DisplayPort信号。总共有两个视频输出(1个DP,1个HDMI)。SD读卡器(参考卡:AV PRO microSD 128 GB V60)提供平均速度。一个积极因素:网络摄像头(210万像素,最大1,920 x 1,080像素)有一个机械盖。
在最佳条件下(附近没有WiFi设备,笔记本电脑和服务器PC之间的距离很短),你可以实现很好的WiFi数据速率。笔记本电脑使用WiFi 6E芯片(联发科MT7922)。有线连接由Realtek芯片(RTL 816878111;1 GBit/s)负责。
| SD Card Reader | |
| average JPG Copy Test (av. of 3 runs) | |
| Average of class Multimedia (23 - 531, n=40, last 2 years) | |
| Schenker XMG Fusion 15 (Mid 22) (AV PRO microSD 128 GB V60) | |
| Asus VivoBook Pro 16 (AV Pro SD microSD 128 GB V60) | |
| Dell Inspiron 16 Plus 7620 (Toshiba Exceria Pro SDXC 64 GB UHS-II) | |
| maximum AS SSD Seq Read Test (1GB) | |
| Average of class Multimedia (37.3 - 1455, n=39, last 2 years) | |
| Asus VivoBook Pro 16 (AV Pro SD microSD 128 GB V60) | |
| Dell Inspiron 16 Plus 7620 (Toshiba Exceria Pro SDXC 64 GB UHS-II) | |


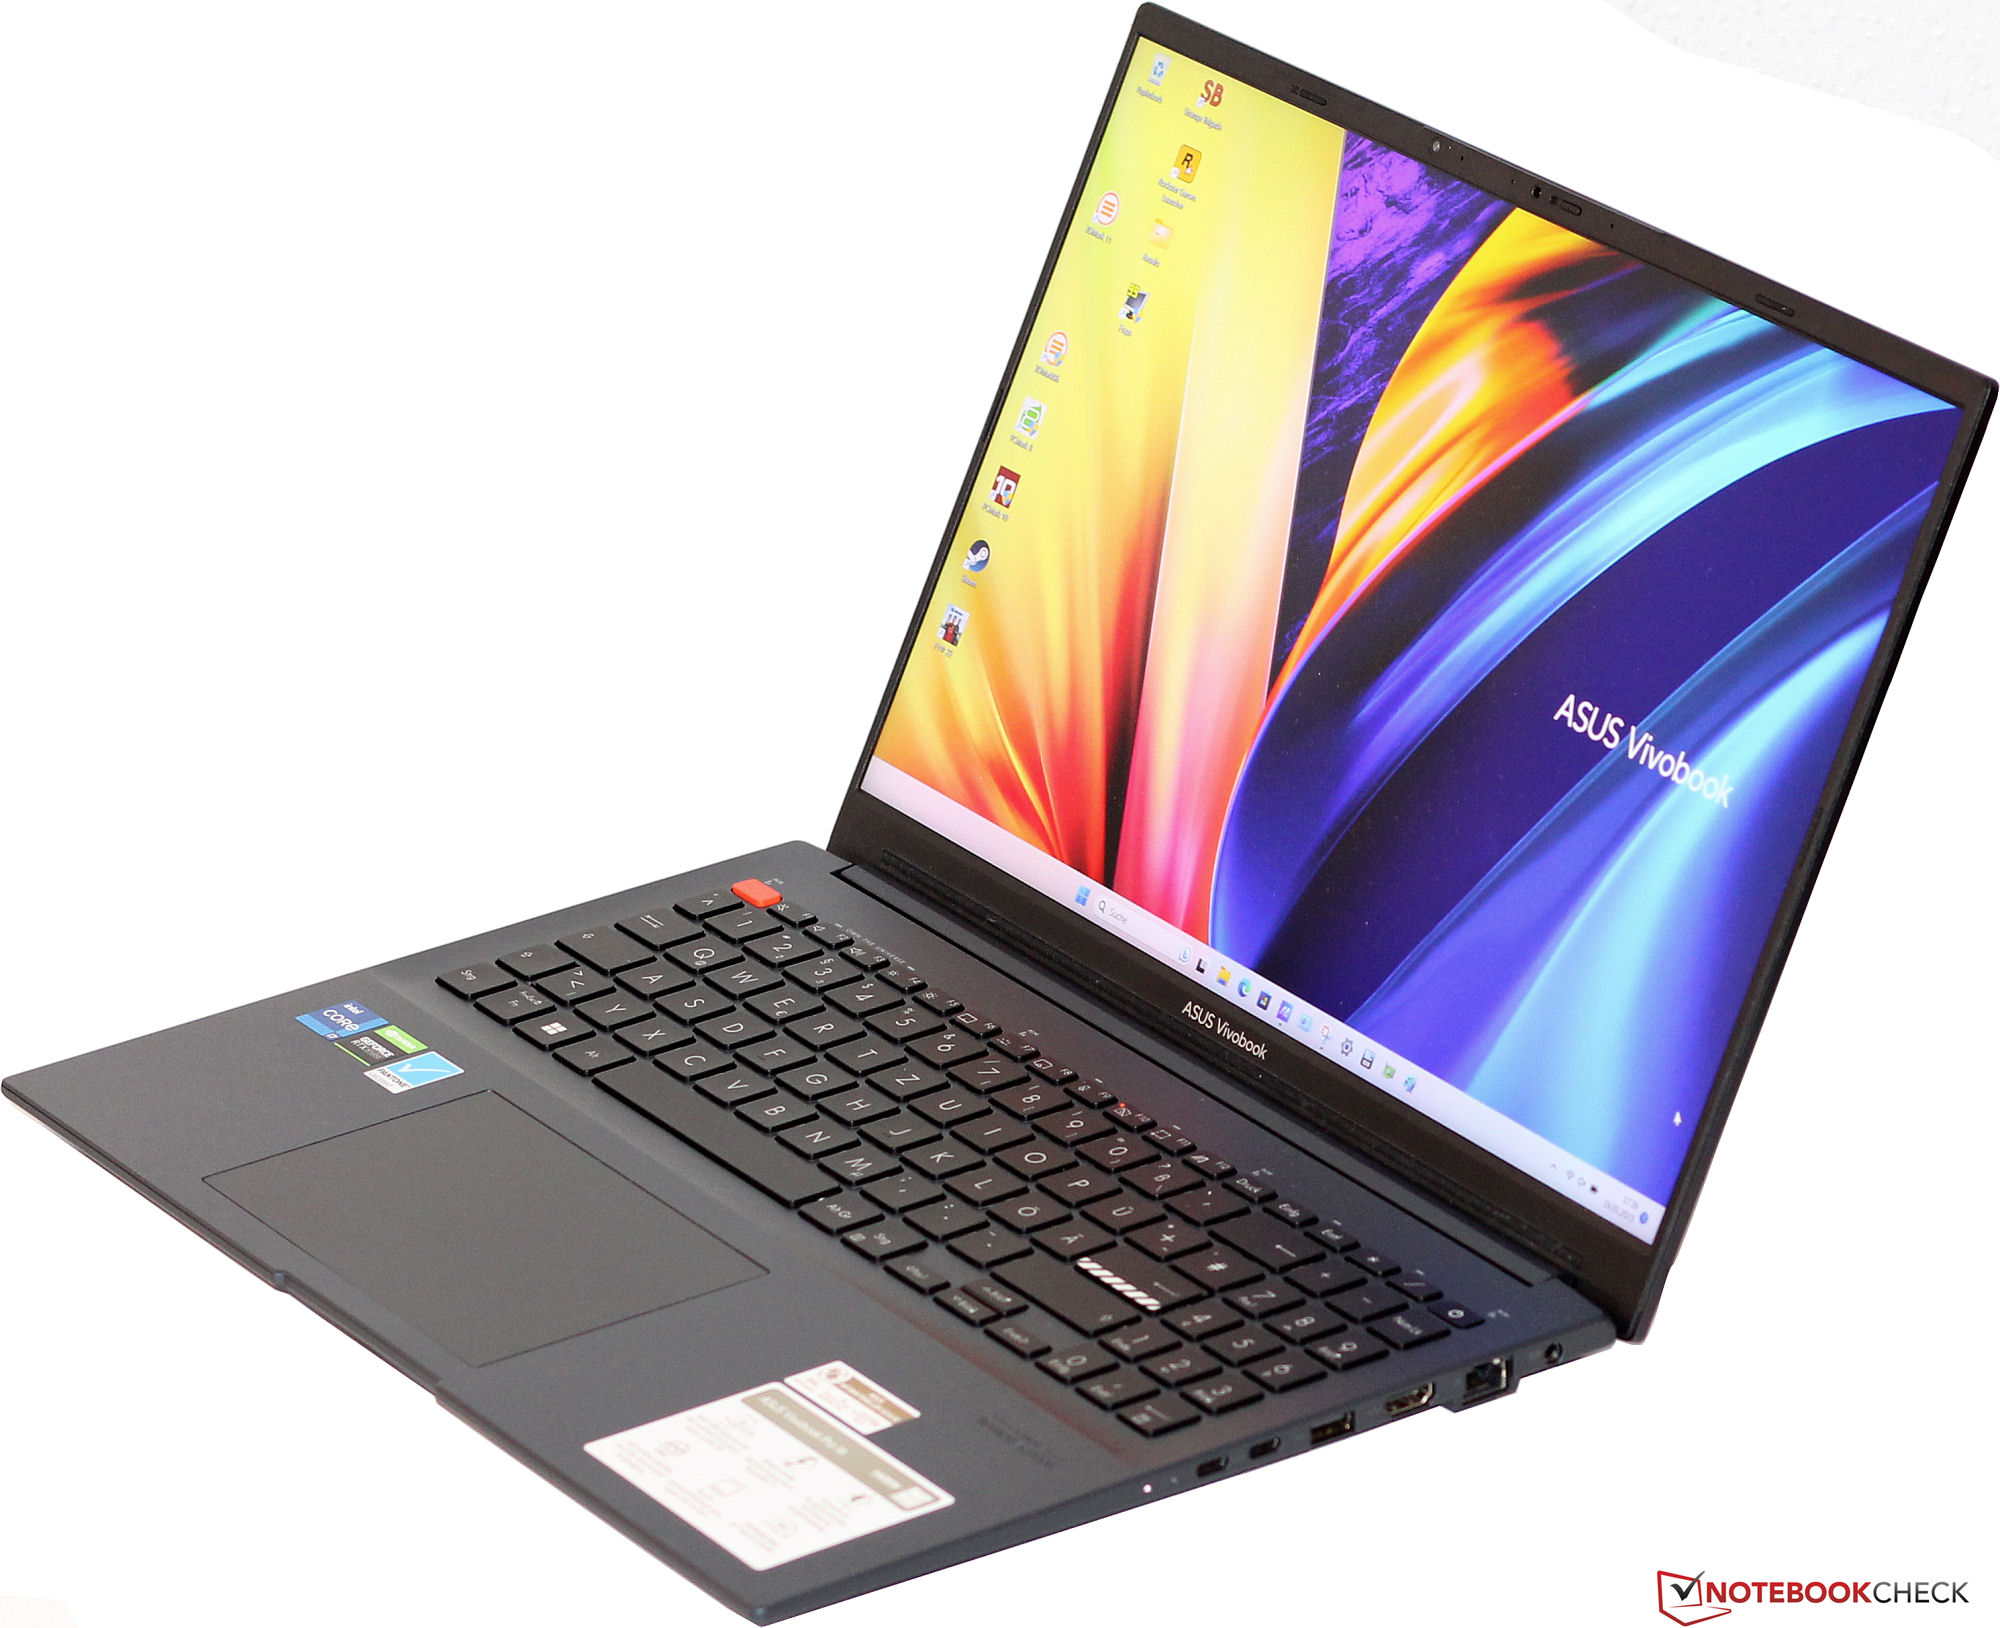
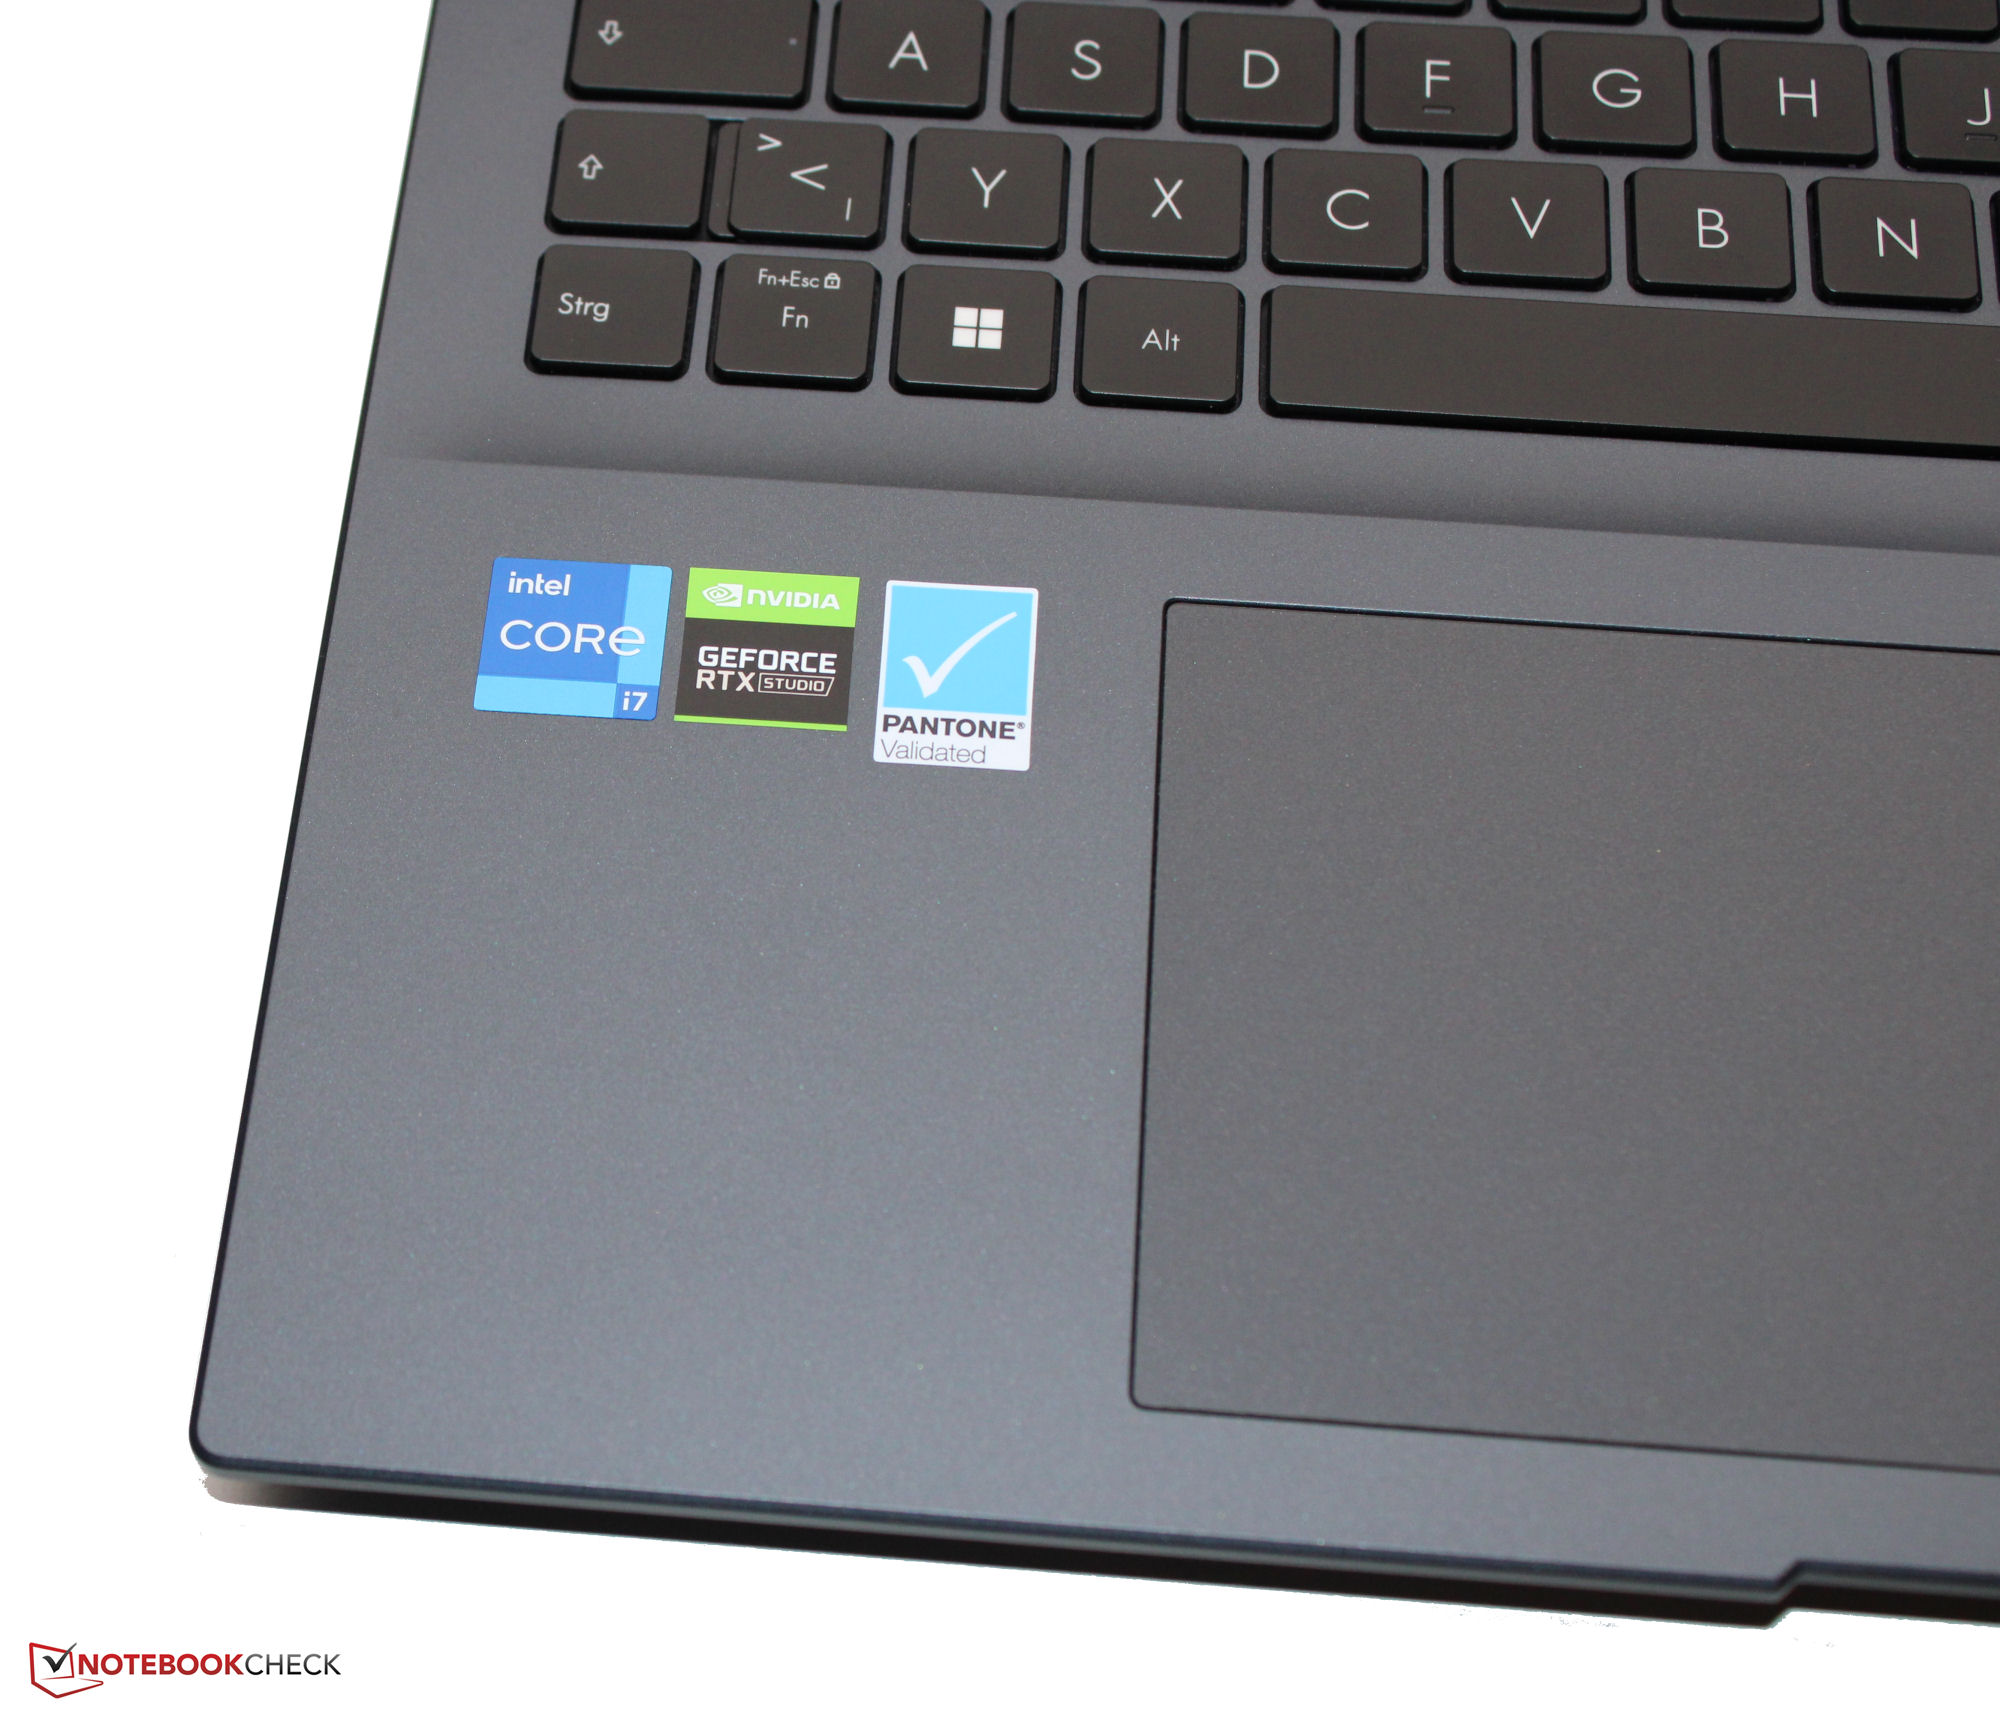
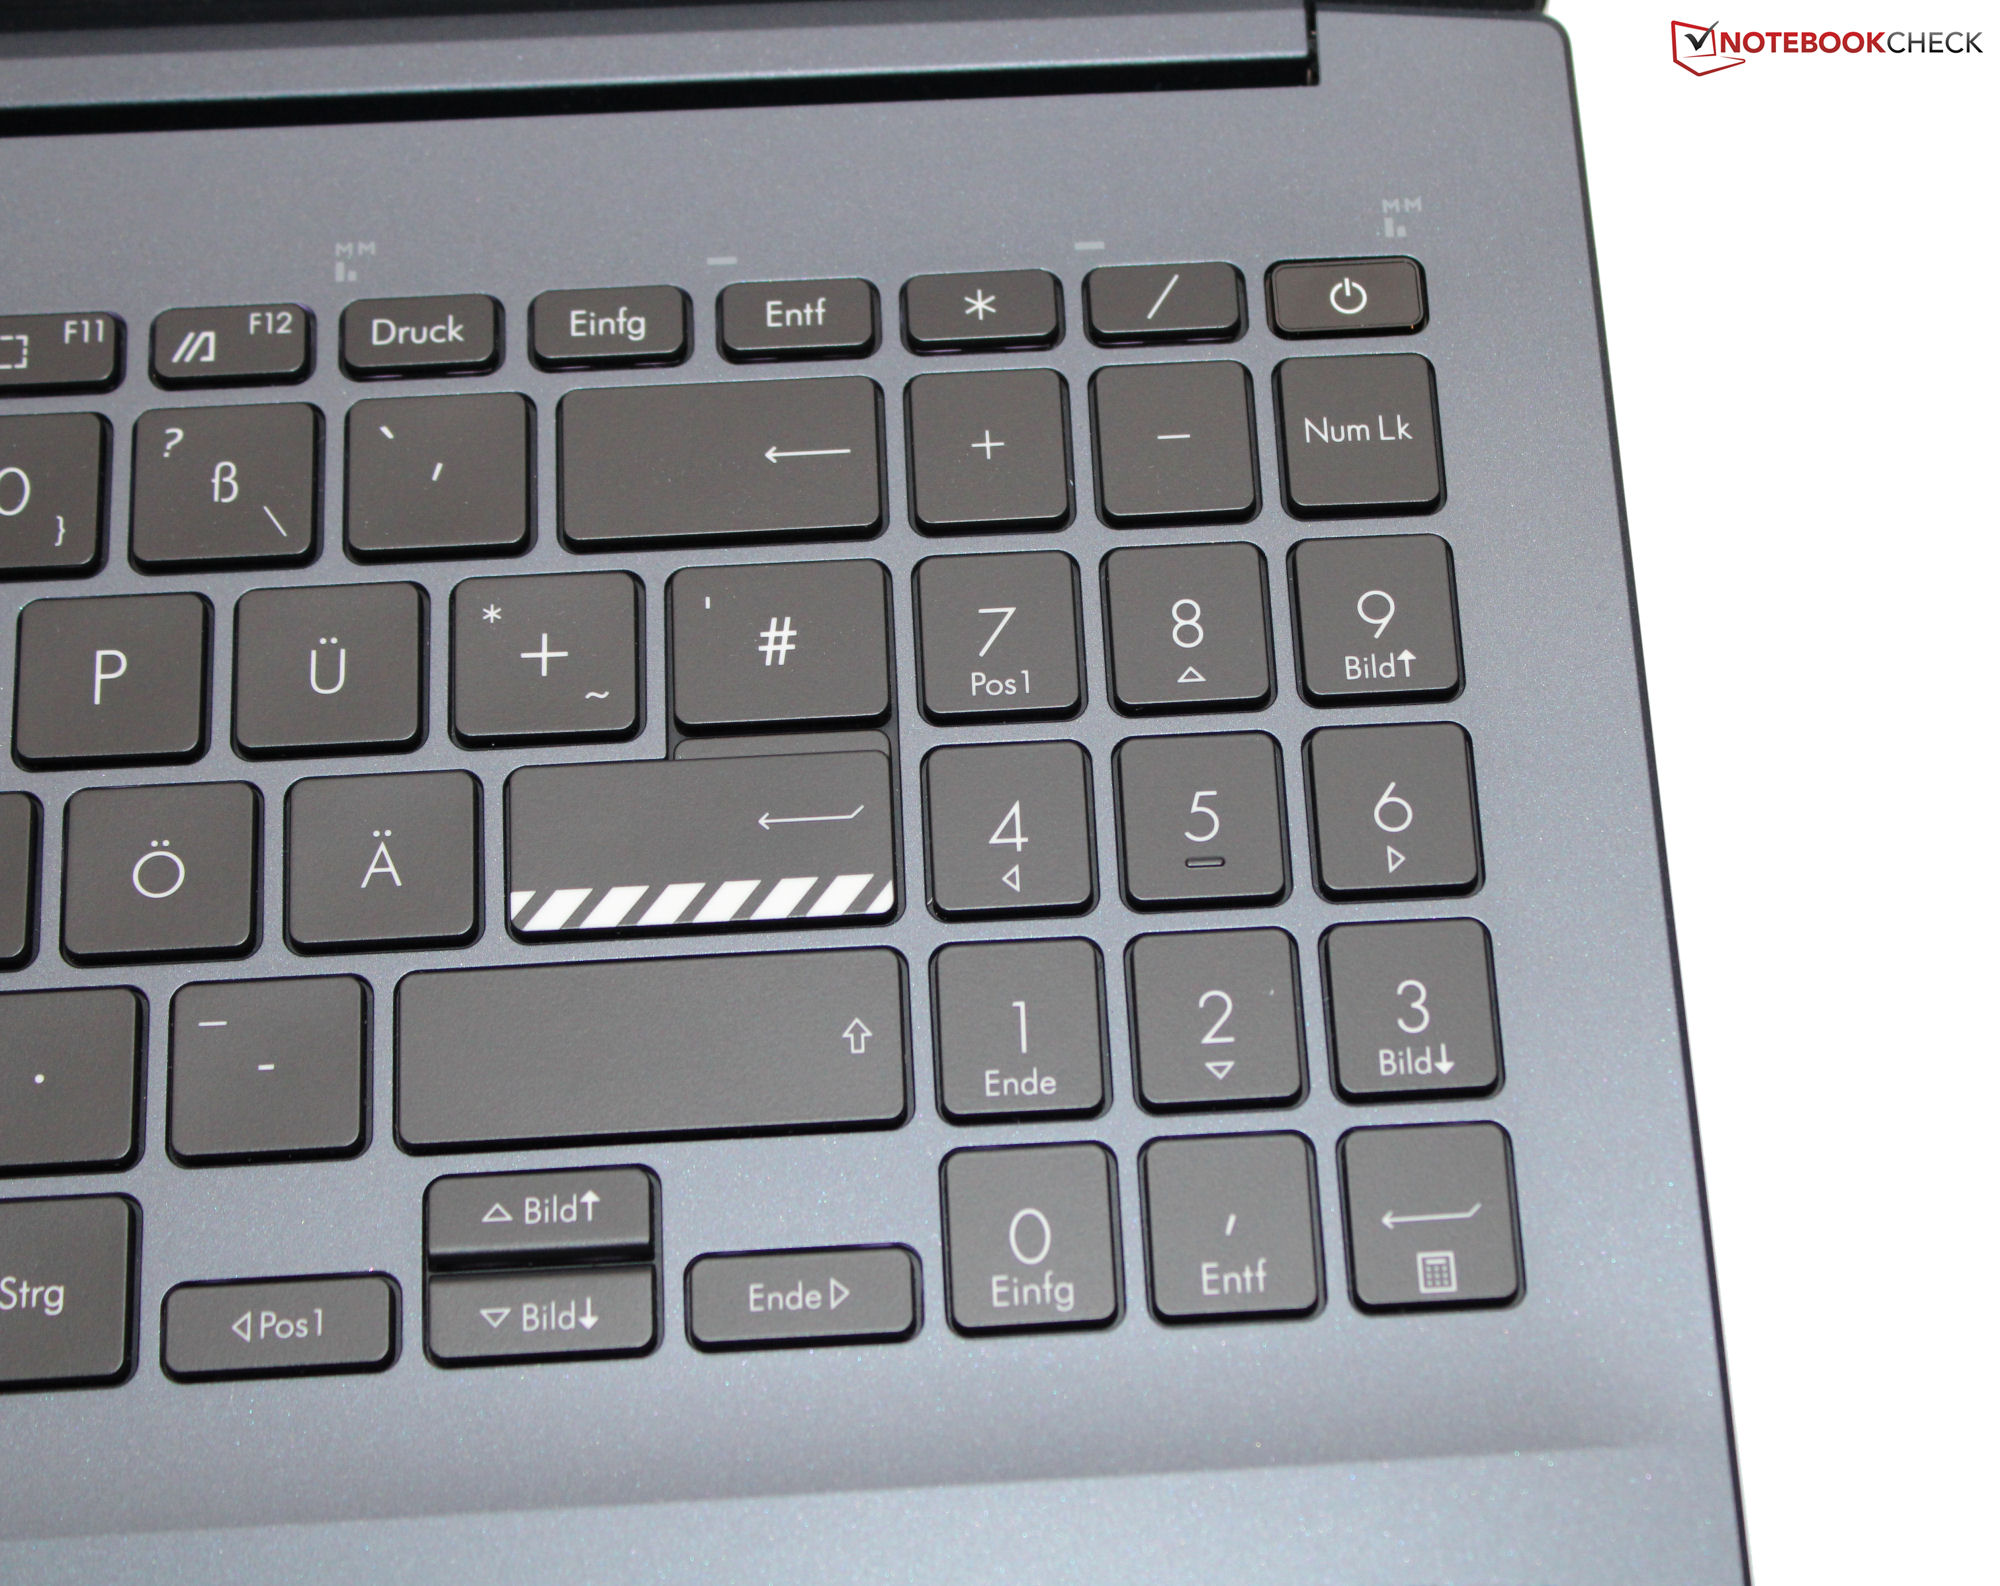
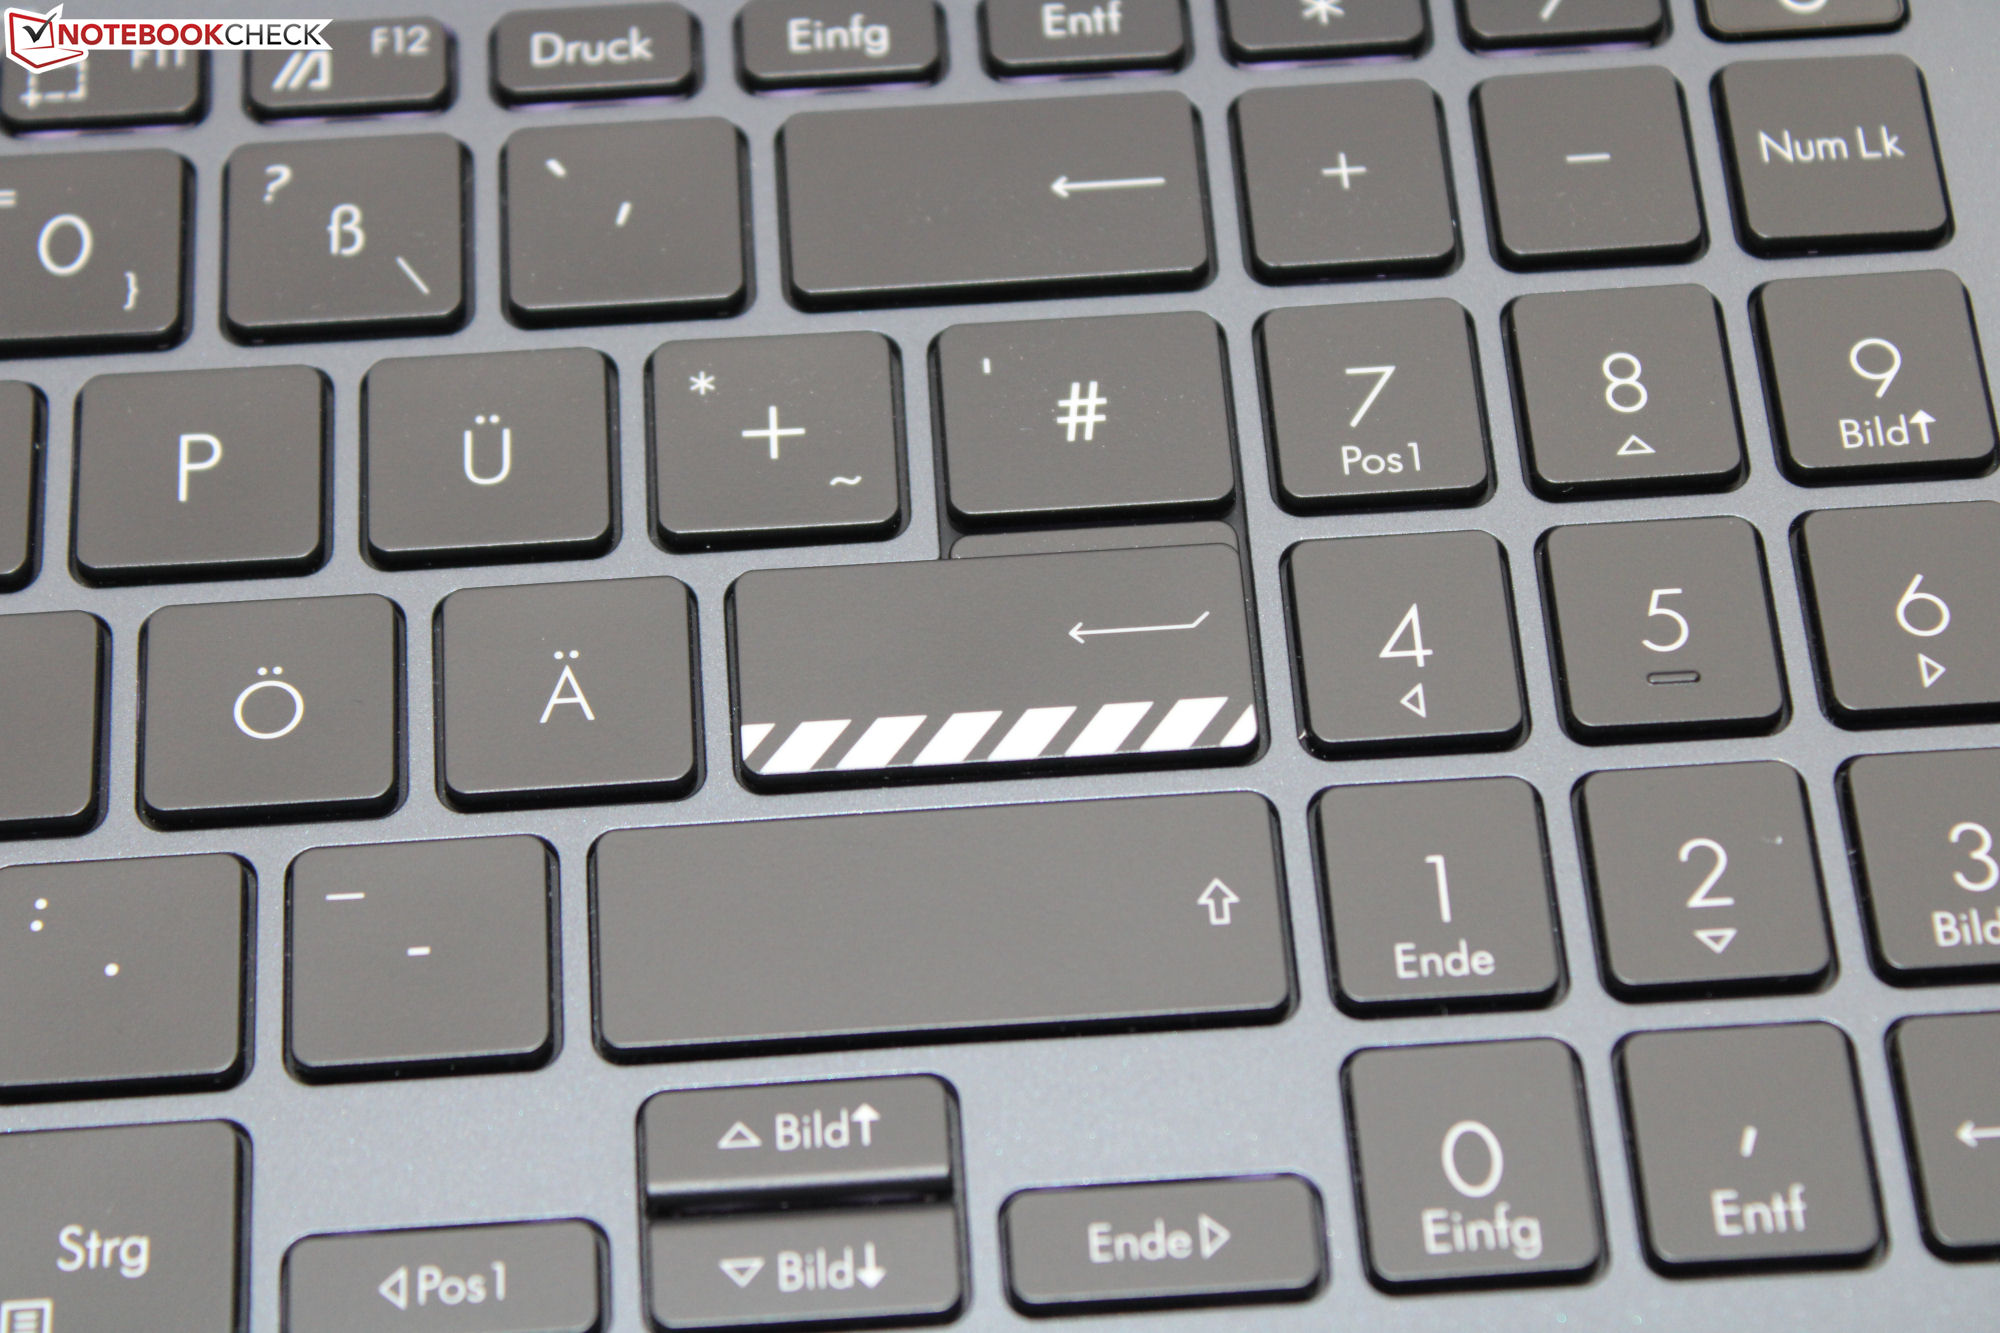
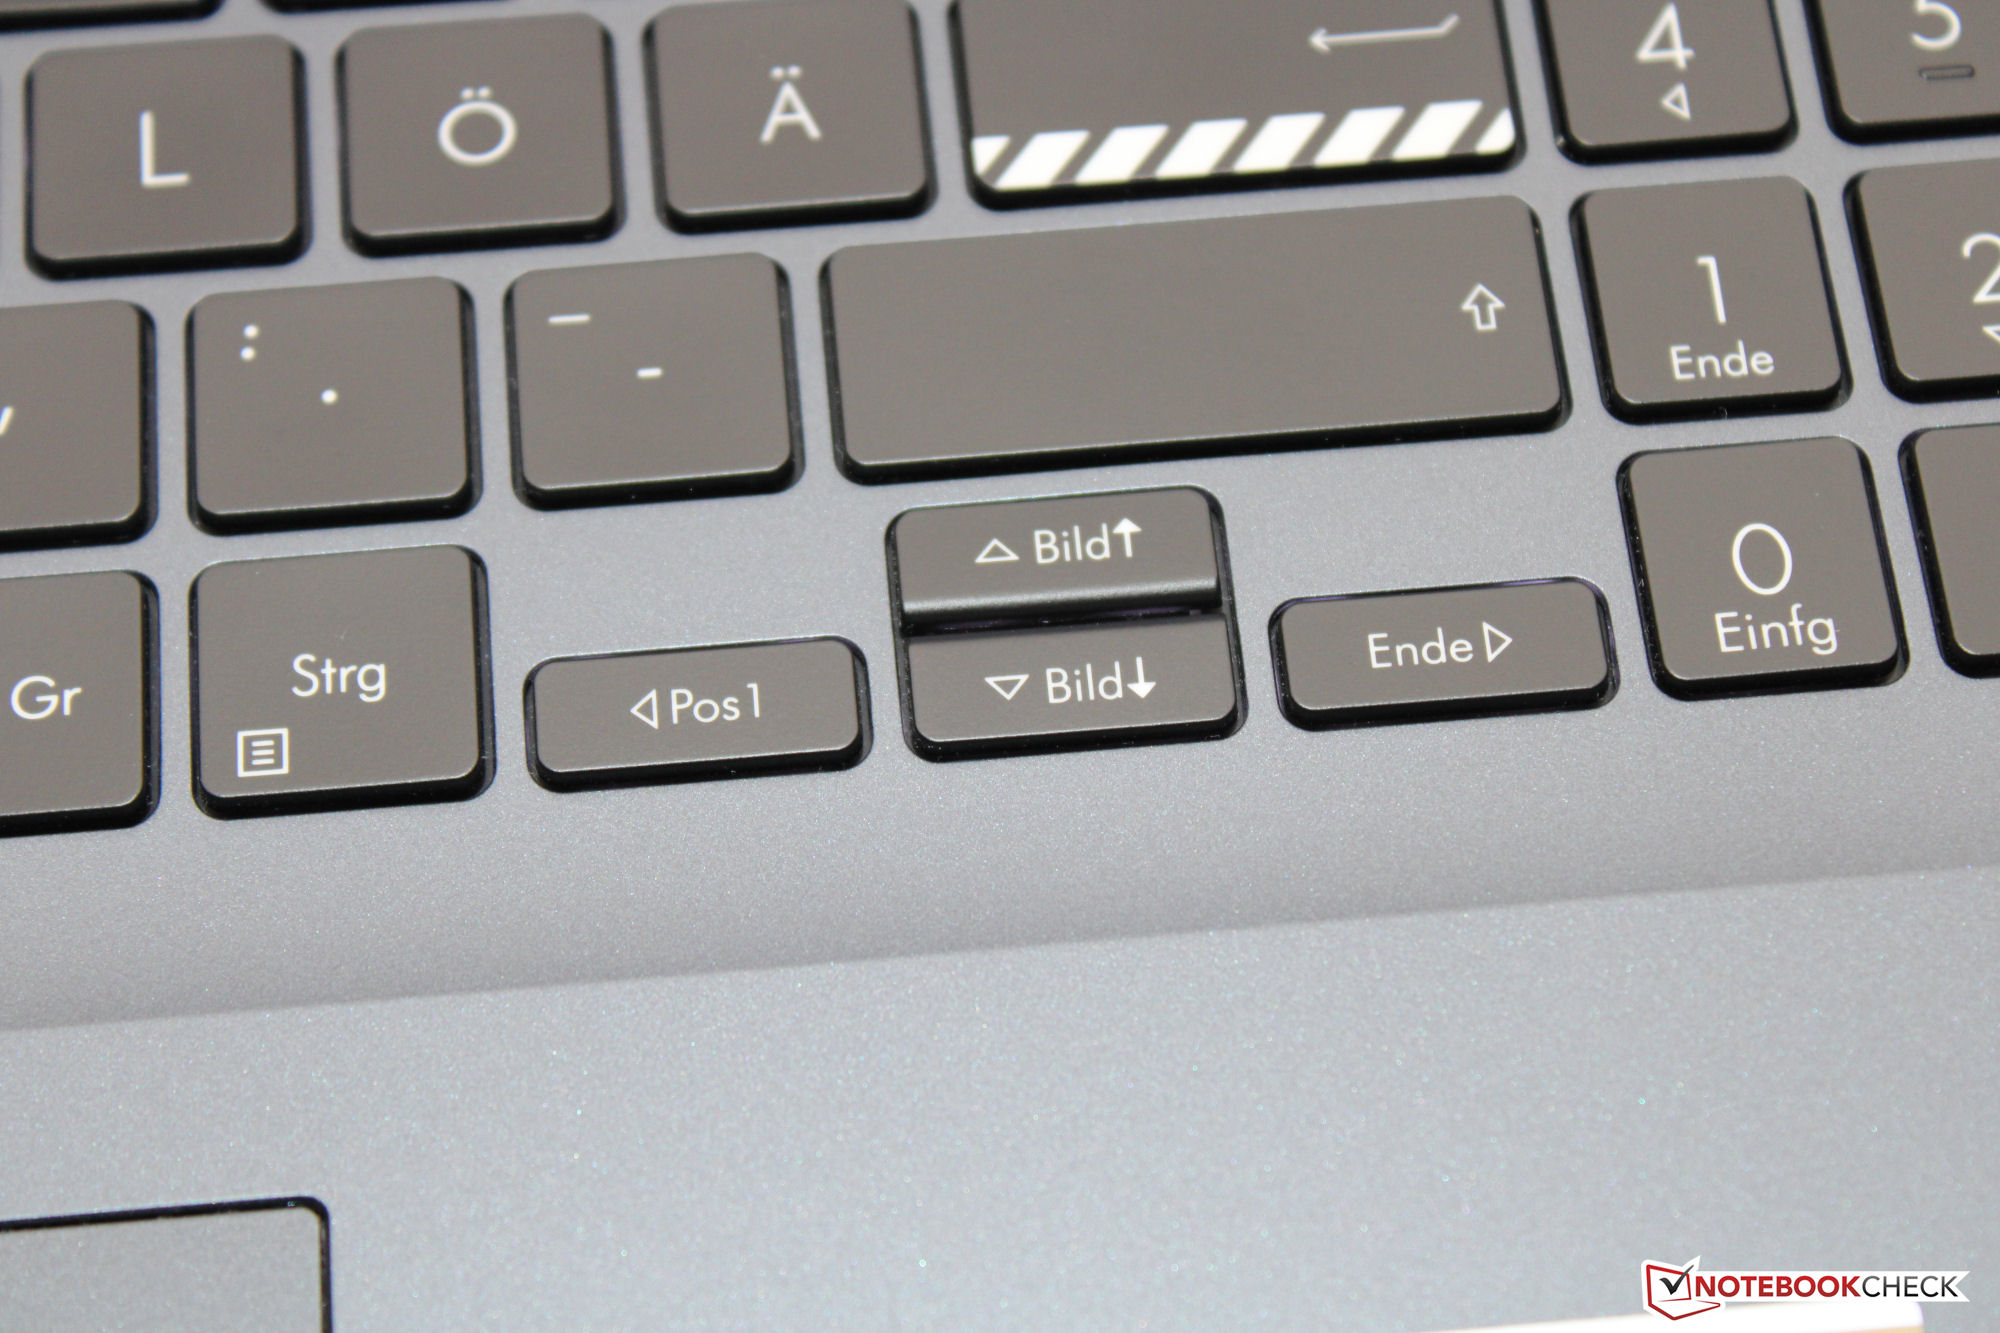
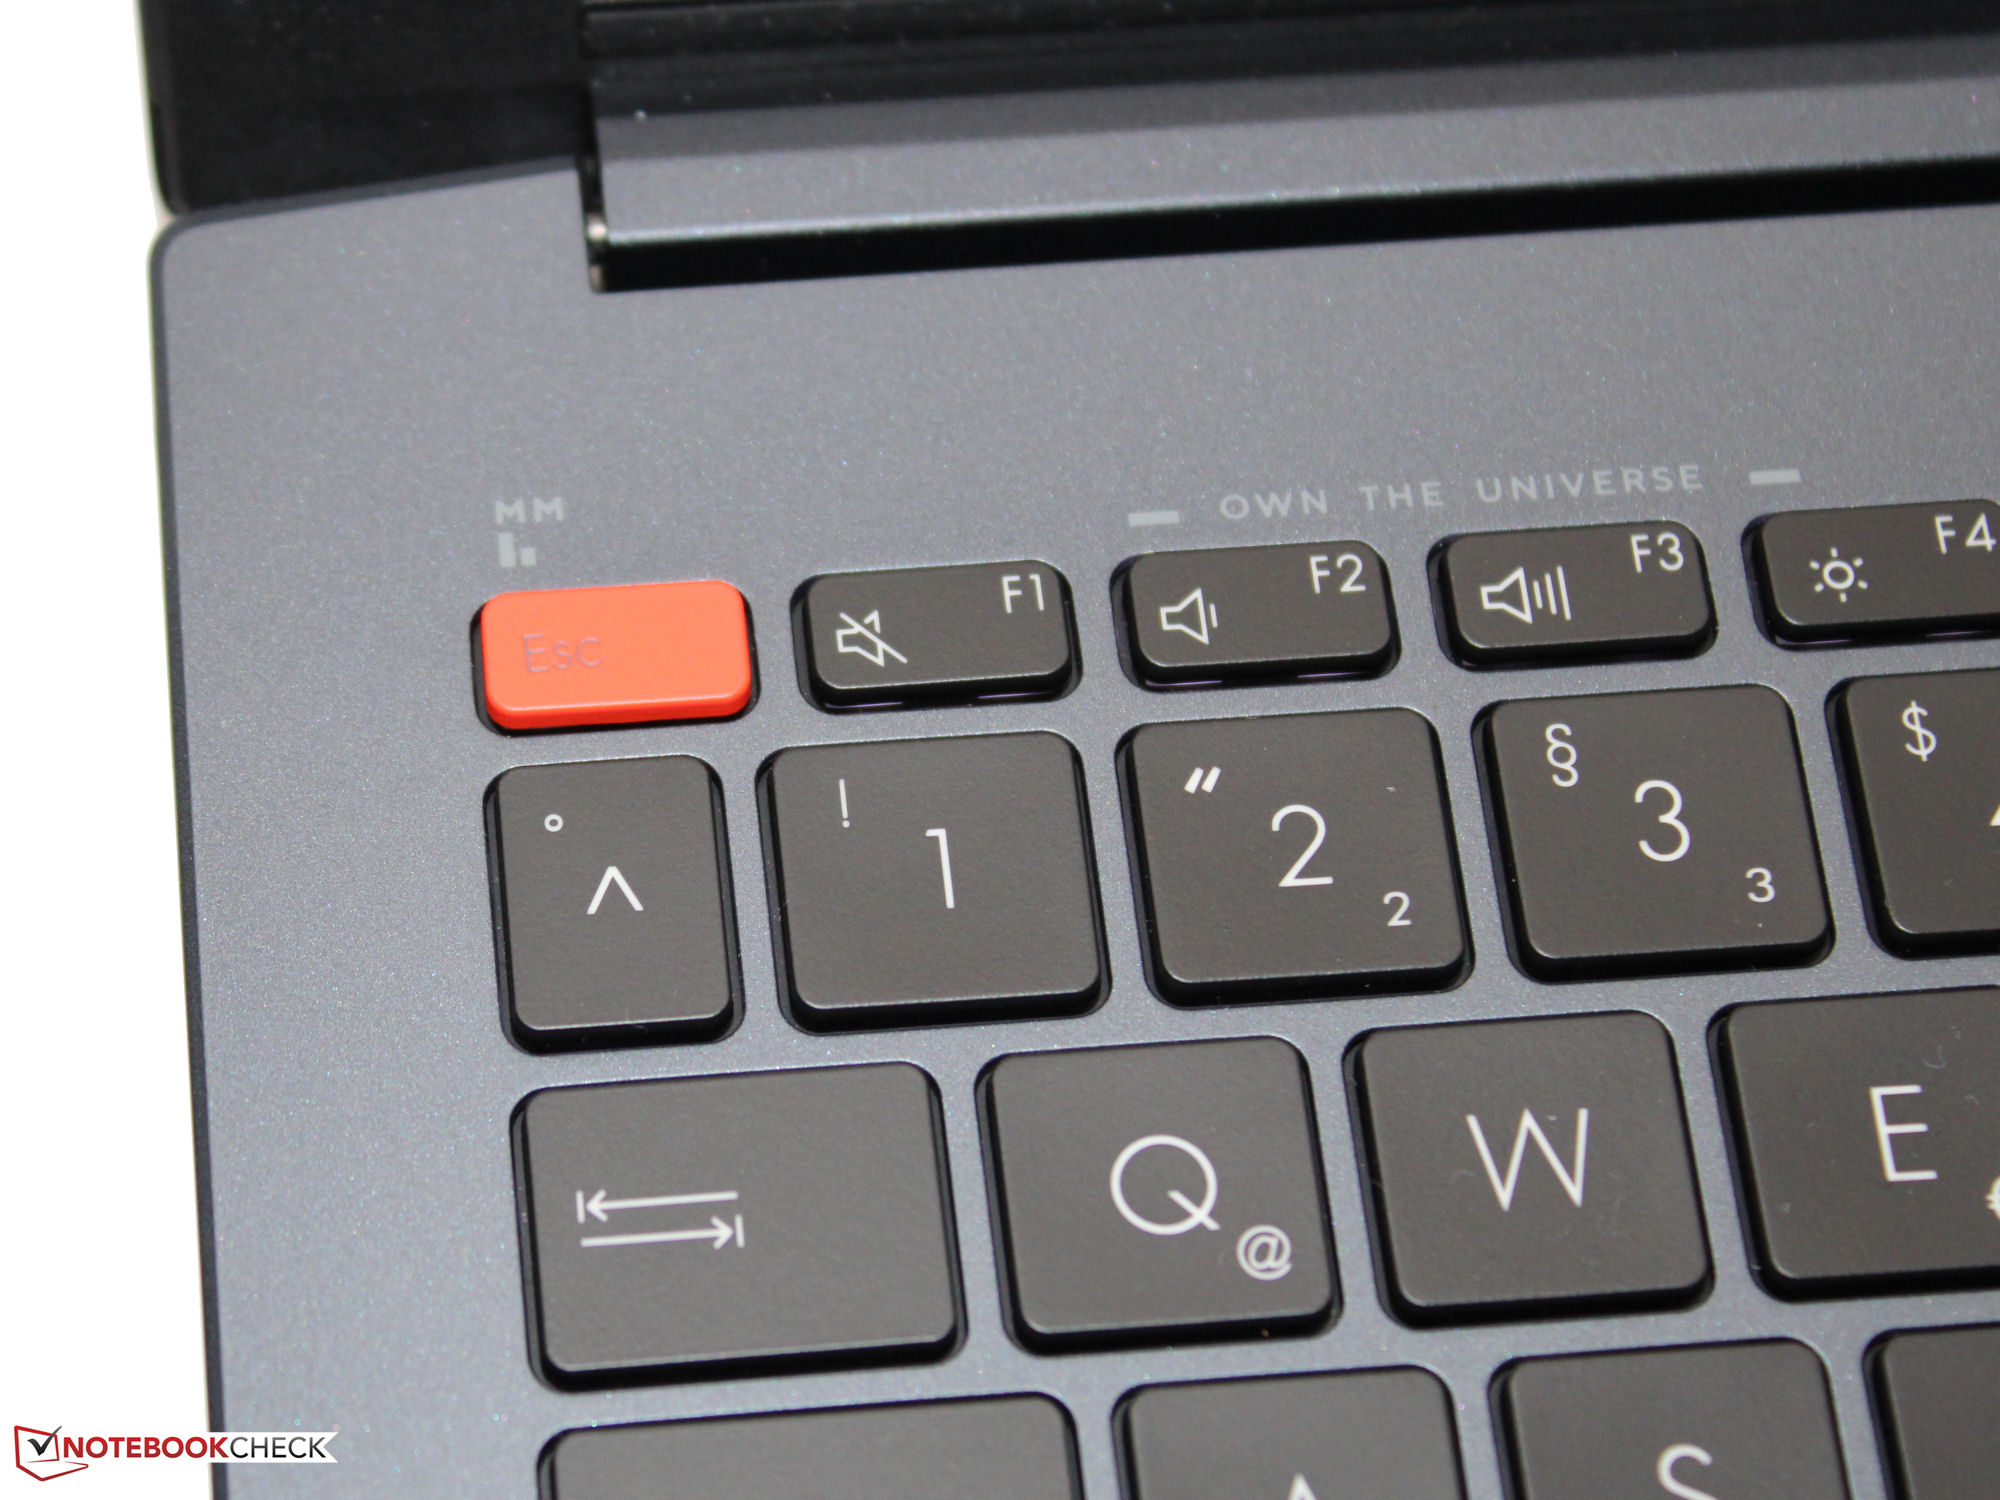
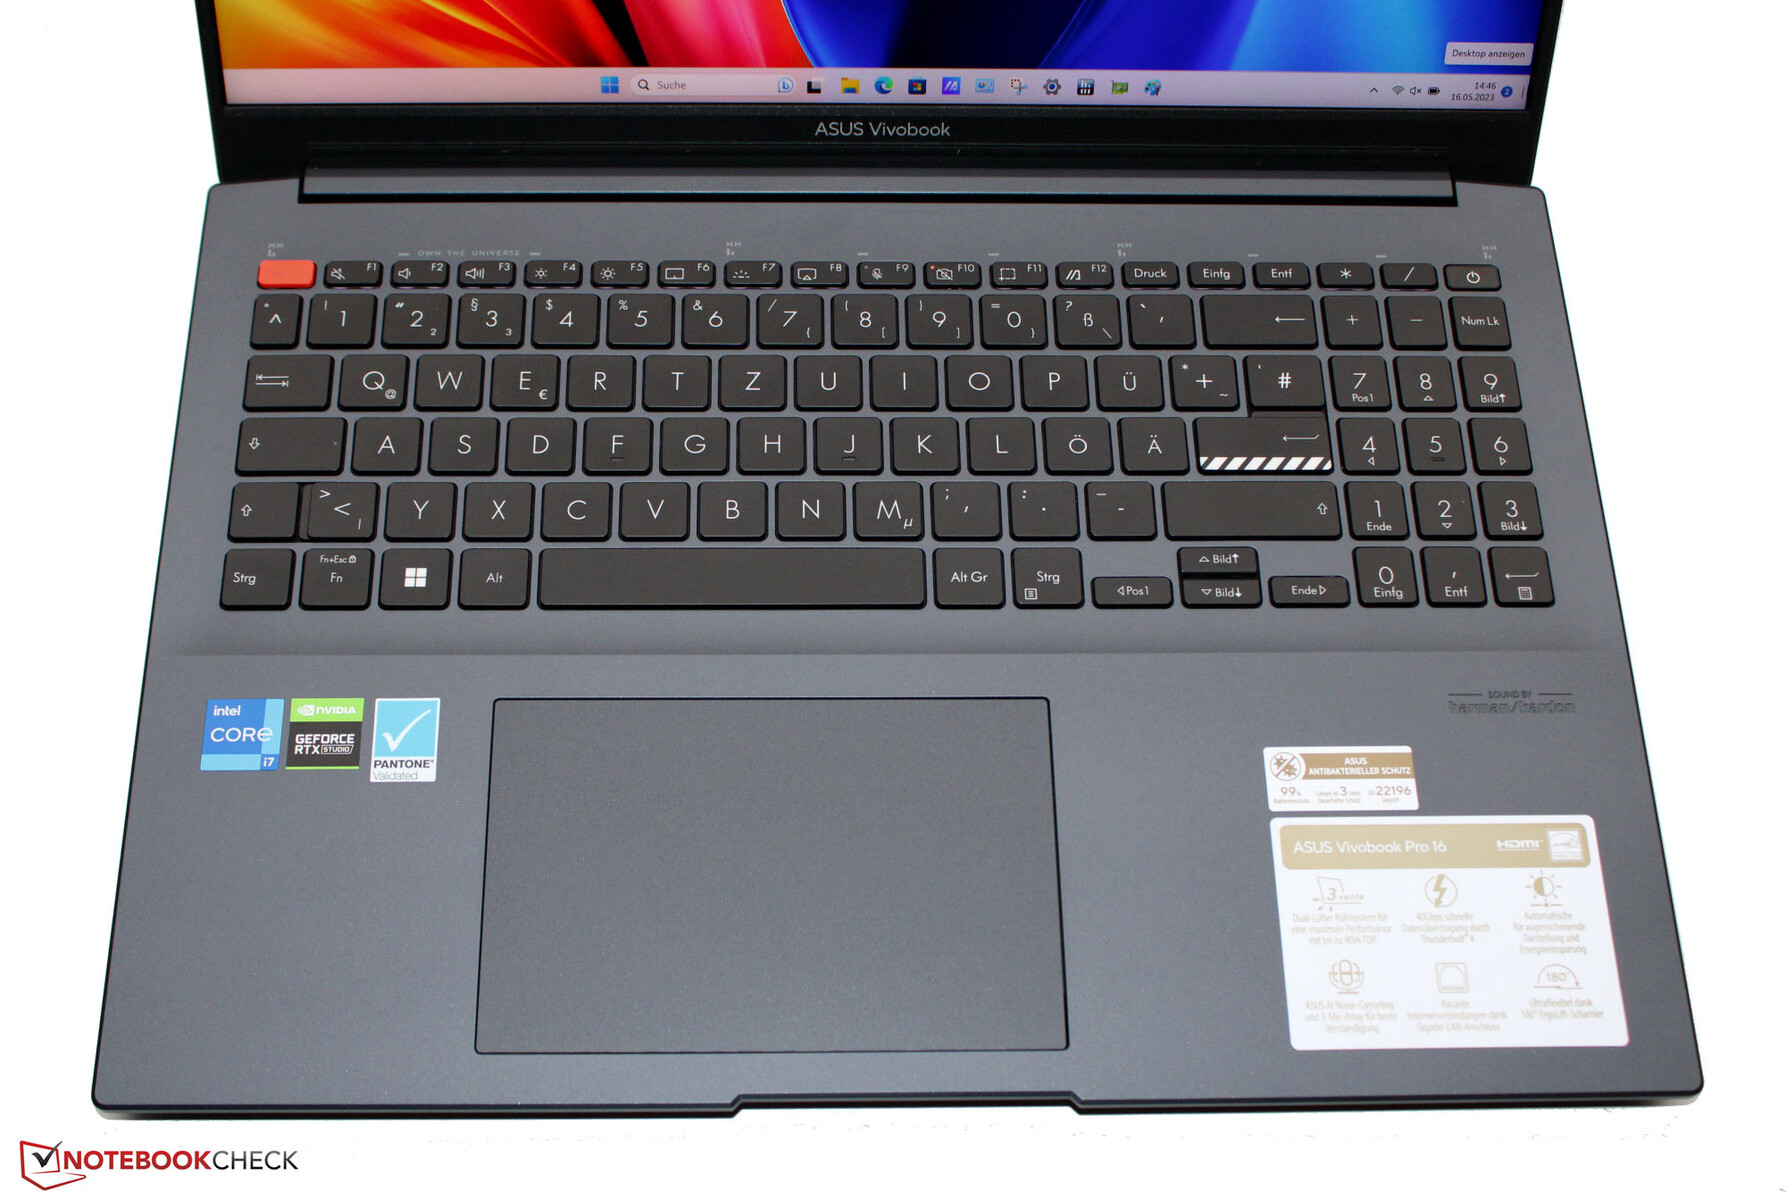
输入设备 - 带照明键盘的华硕电脑
Chiclet键盘的按键(部分弯曲,有三种照明模式)有一个中等水平的提升和一个清晰的压力点。它们有很好的阻力水平--但它们可以感觉更清晰一些。当你打字的时候,键盘有轻微的松动--这其实并不是什么坏事。总的来说,华硕笔记本电脑的键盘对于日常使用来说是不错的。
点击垫(13 x 8.5厘米)取代了对鼠标的需求,其光滑的表面意味着你的手指可以舒适地在上面滑行。它对输入的反应一直到边缘,有一个最小的提升和一个清晰的压力点。
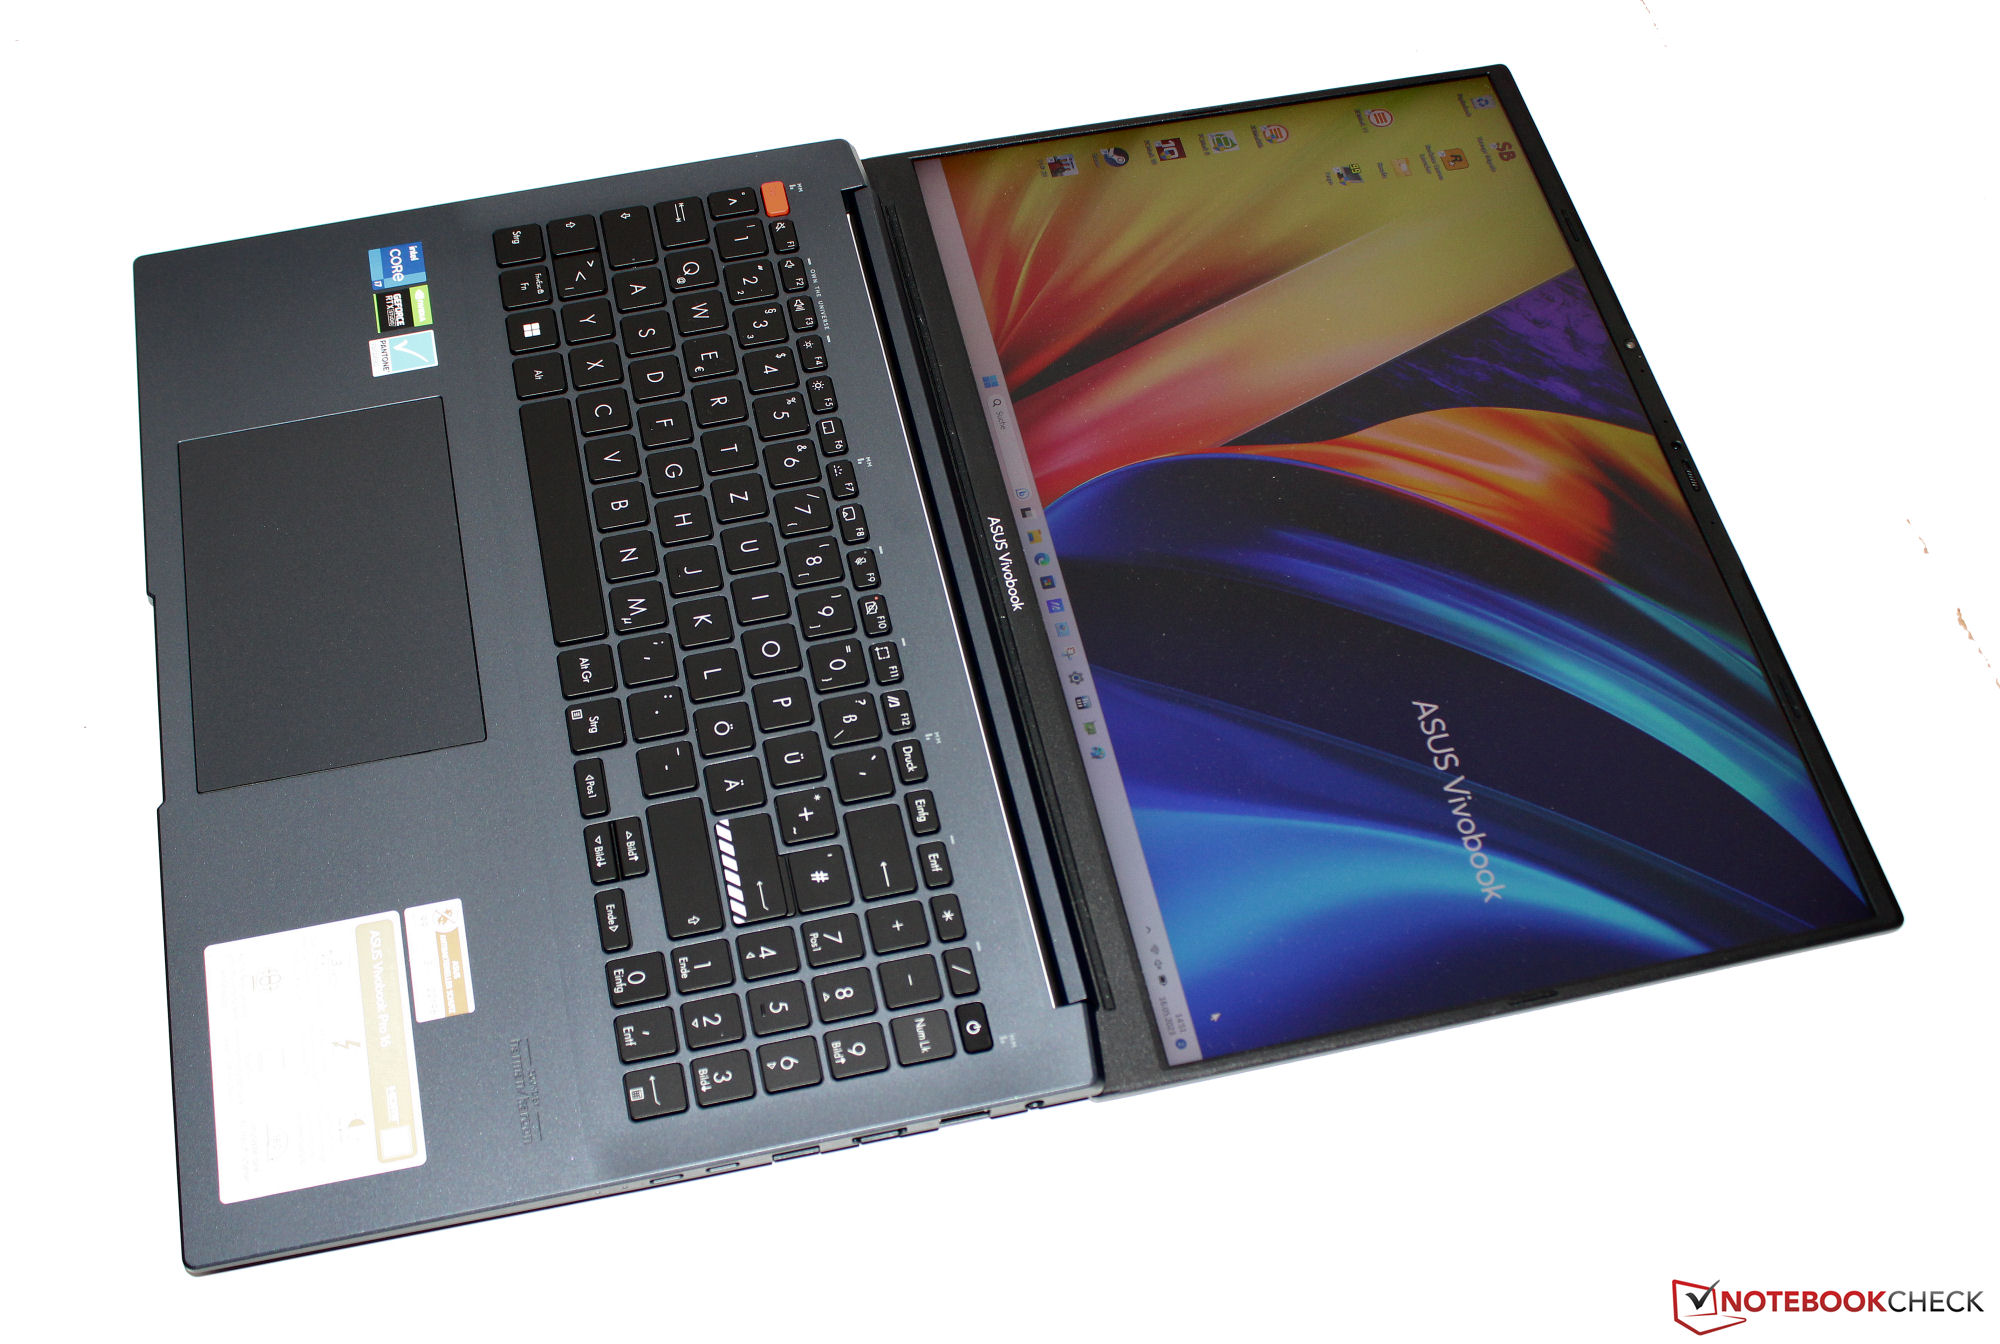
显示屏 - 16:10面板,覆盖DCI-P3

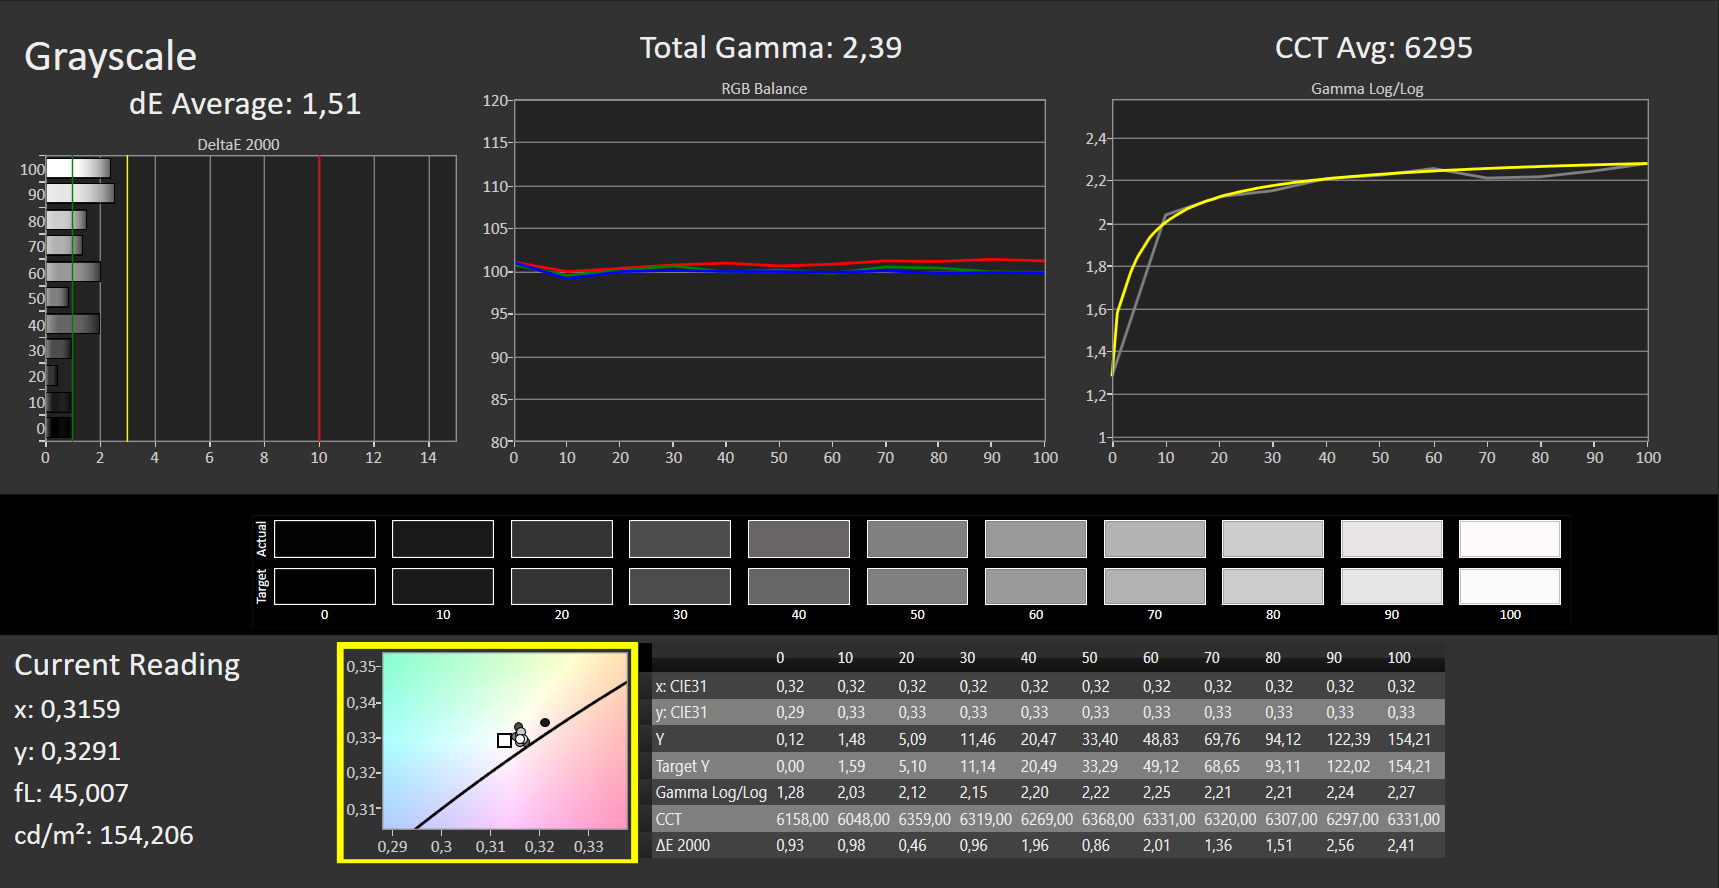
16:10格式的快速反应的120-Hz面板在所有亮度水平上都没有显示出PWM闪烁的迹象。哑光16英寸显示屏(2,560 x 1,600像素)的亮度和对比度完全达到了应有的水平(> 300 cd/m²或1.000:1)。
| |||||||||||||||||||||||||
Brightness Distribution: 87 %
Center on Battery: 509 cd/m²
Contrast: 1440:1 (Black: 0.35 cd/m²)
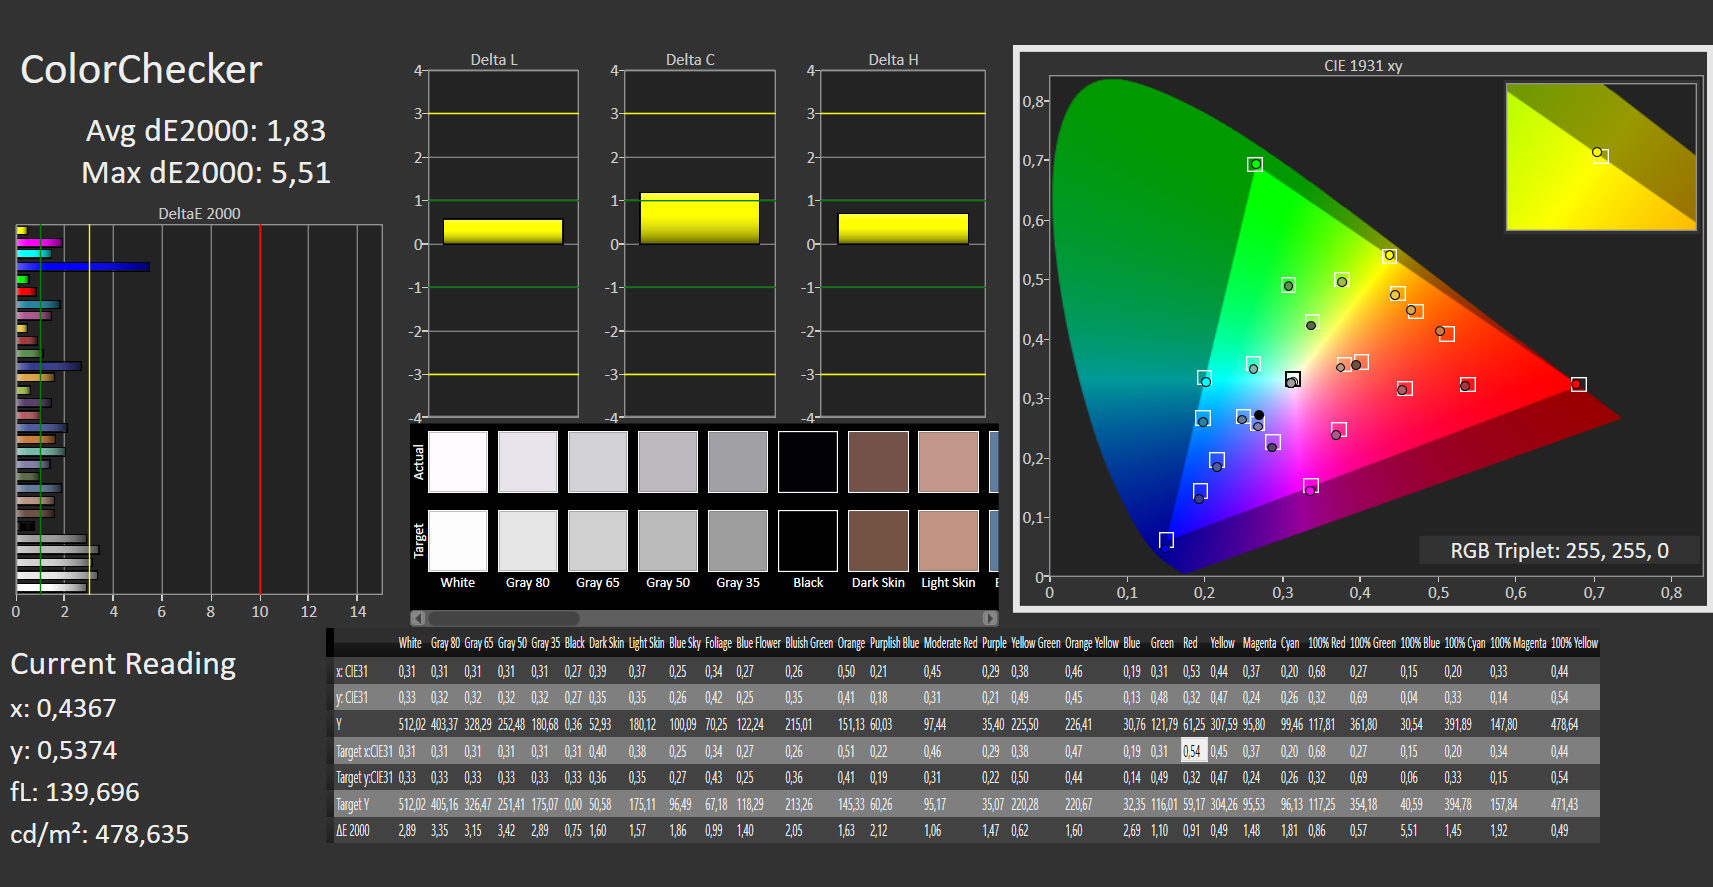
ΔE ColorChecker Calman: 1.83 | ∀{0.5-29.43 Ø4.71}
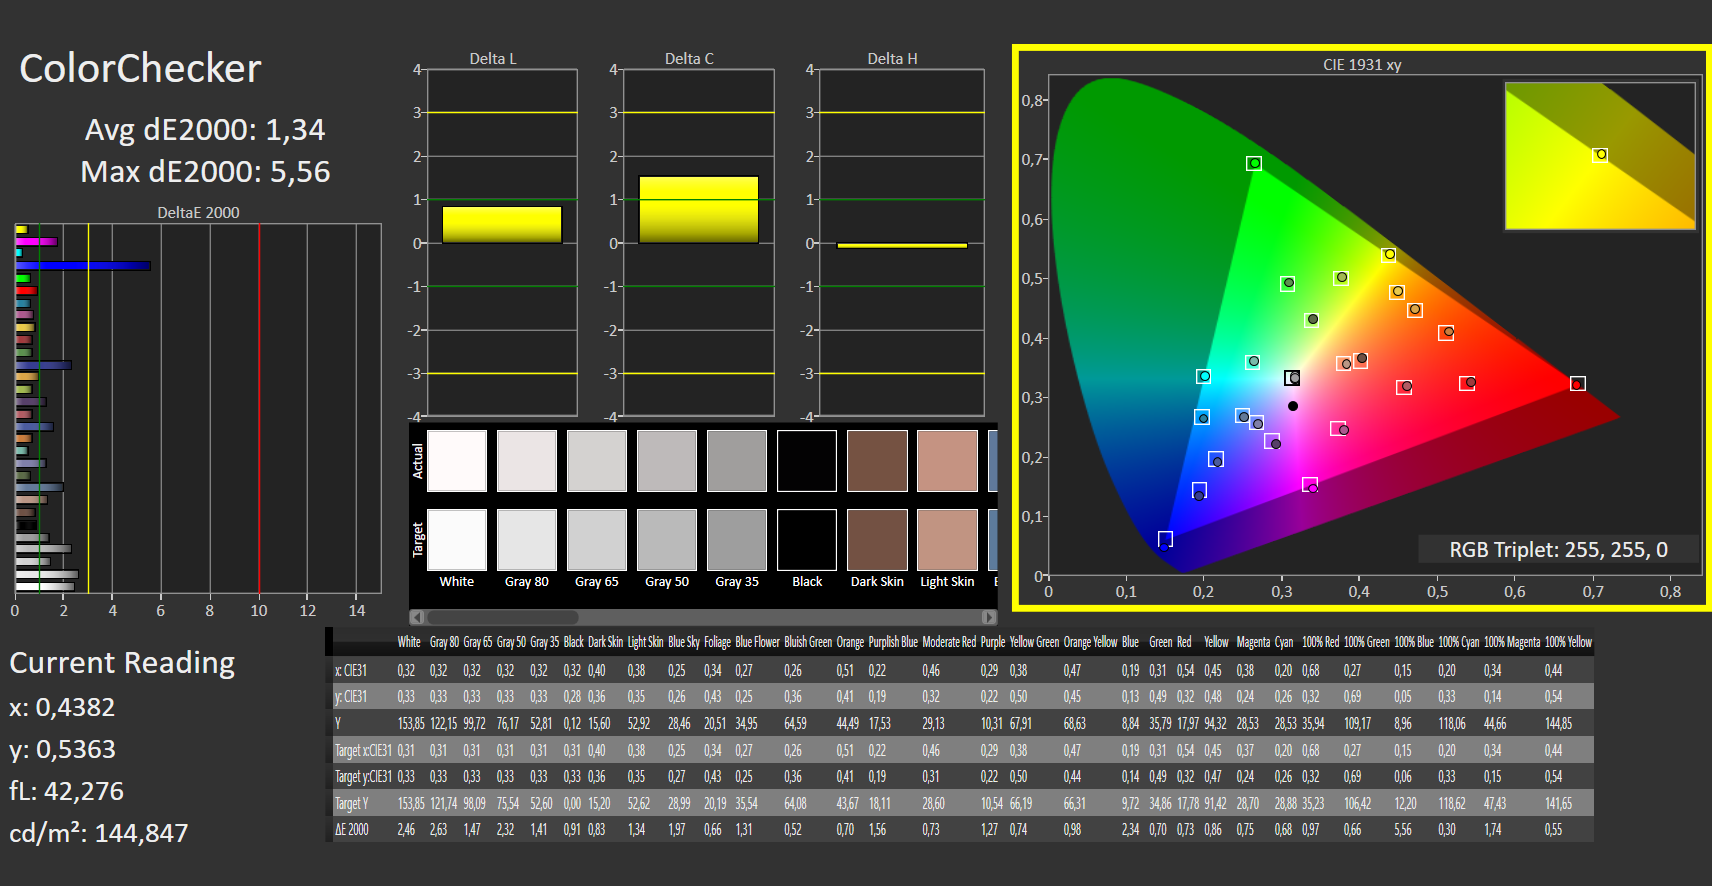
calibrated: 1.34
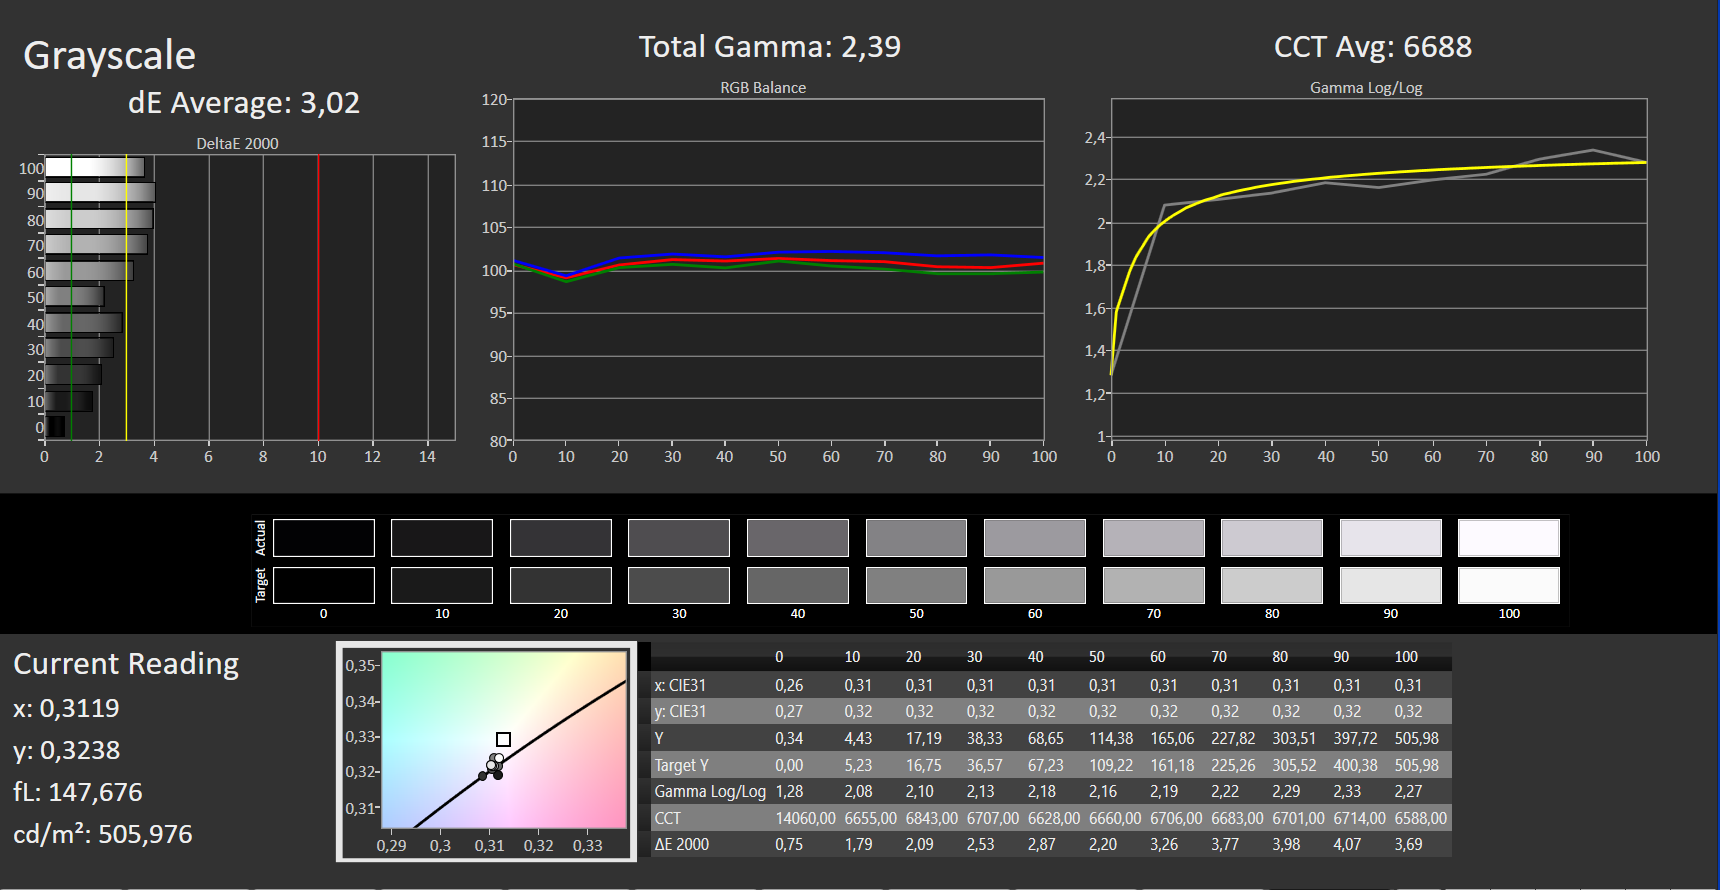
ΔE Greyscale Calman: 3.02 | ∀{0.09-98 Ø4.96}
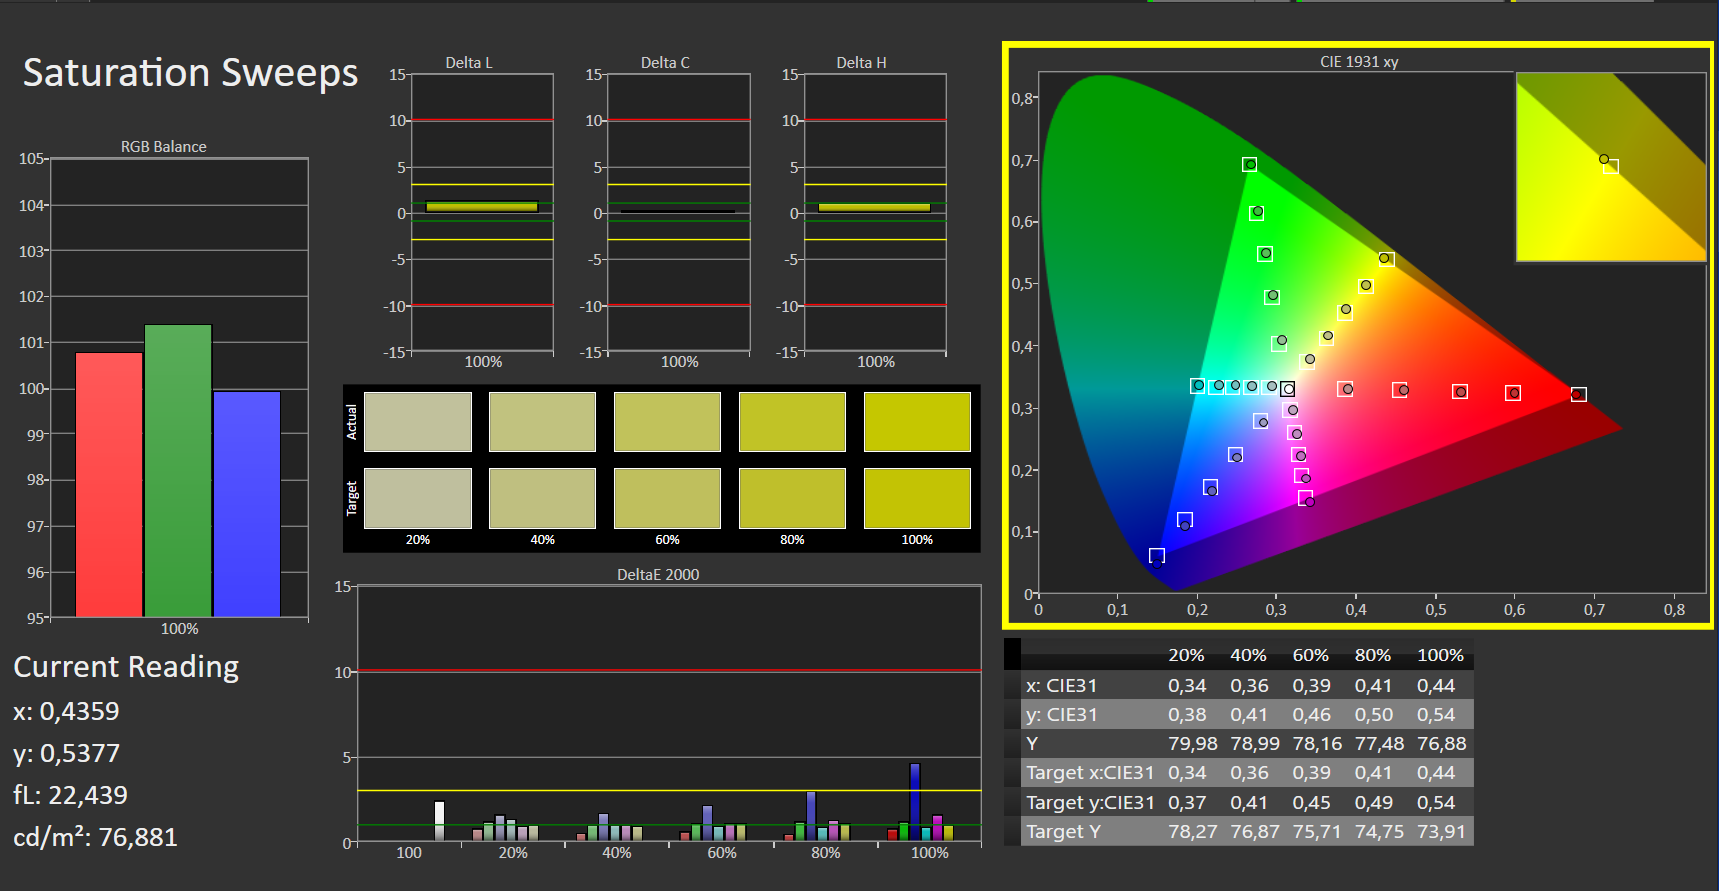
86.1% AdobeRGB 1998 (Argyll 3D)
99.9% sRGB (Argyll 3D)
98.5% Display P3 (Argyll 3D)
Gamma: 2.39
CCT: 6688 K
| Asus VivoBook Pro 16 Au Optronics B160QAN02.L, IPS, 2560x1600, 16" | Dell Inspiron 16 Plus 7620 BOE NE16N41, IPS, 3072x1920, 16" | Schenker XMG Fusion 15 (Mid 22) BOE CQ NE156QHM-NY2, IPS, 2560x1440, 15.6" | Acer Swift X SFX16-52G-77RX B160QAN02.M, IPS-LED, 2560x1600, 16" | |
|---|---|---|---|---|
| Display | -14% | -19% | -11% | |
| Display P3 Coverage (%) | 98.5 | 70.8 -28% | 67.3 -32% | 76.4 -22% |
| sRGB Coverage (%) | 99.9 | 99.5 0% | 96.7 -3% | 100 0% |
| AdobeRGB 1998 Coverage (%) | 86.1 | 73.2 -15% | 68.2 -21% | 76.6 -11% |
| Response Times | -1025% | -234% | -819% | |
| Response Time Grey 50% / Grey 80% * (ms) | 2 ? | 38 ? -1800% | 11.6 ? -480% | 33 ? -1550% |
| Response Time Black / White * (ms) | 8 ? | 28 ? -250% | 7 ? 12% | 15 ? -88% |
| PWM Frequency (Hz) | ||||
| Screen | 7% | -32% | -4% | |
| Brightness middle (cd/m²) | 504 | 288.9 -43% | 326 -35% | 411 -18% |
| Brightness (cd/m²) | 465 | 276 -41% | 303 -35% | 378 -19% |
| Brightness Distribution (%) | 87 | 92 6% | 89 2% | 83 -5% |
| Black Level * (cd/m²) | 0.35 | 0.26 26% | 0.33 6% | 0.29 17% |
| Contrast (:1) | 1440 | 1111 -23% | 988 -31% | 1417 -2% |
| Colorchecker dE 2000 * | 1.83 | 1.88 -3% | 2.73 -49% | 2.18 -19% |
| Colorchecker dE 2000 max. * | 5.51 | 4.37 21% | 9.54 -73% | 4.84 12% |
| Colorchecker dE 2000 calibrated * | 1.34 | 0.42 69% | 1.36 -1% | 1.48 -10% |
| Greyscale dE 2000 * | 3.02 | 1.4 54% | 5.2 -72% | 2.68 11% |
| Gamma | 2.39 92% | 2.3 96% | 2.074 106% | 2.43 91% |
| CCT | 6688 97% | 6634 98% | 6911 94% | 6717 97% |
| Total Average (Program / Settings) | -344% /
-145% | -95% /
-58% | -278% /
-122% |
* ... smaller is better
该屏幕的X Rite Pantone认证意味着它有非常自然的色彩描述:它的偏差约为1.8,开箱即可提供可接受的结果(DeltaE<3)。对它进行校准后,偏差会减少到1.3,灰度色调更加平衡。色彩准确性没有问题:该面板可以描绘整个DCI P3色彩空间和86%的Adobe RGB空间。
Display Response Times
| ↔ Response Time Black to White | ||
|---|---|---|
| 8 ms ... rise ↗ and fall ↘ combined | ↗ 1 ms rise |  |
| ↘ 7 ms fall | ||
| The screen shows fast response rates in our tests and should be suited for gaming. In comparison, all tested devices range from 0.1 (minimum) to 240 (maximum) ms. » 22 % of all devices are better. This means that the measured response time is better than the average of all tested devices (19.8 ms). | ||
| ↔ Response Time 50% Grey to 80% Grey | ||
| 2 ms ... rise ↗ and fall ↘ combined | ↗ 1 ms rise |  |
| ↘ 1 ms fall | ||
| The screen shows very fast response rates in our tests and should be very well suited for fast-paced gaming. In comparison, all tested devices range from 0.165 (minimum) to 636 (maximum) ms. » 10 % of all devices are better. This means that the measured response time is better than the average of all tested devices (31 ms). | ||
Screen Flickering / PWM (Pulse-Width Modulation)
| Screen flickering / PWM not detected |     | ||
In comparison: 52 % of all tested devices do not use PWM to dim the display. If PWM was detected, an average of 7757 (minimum: 5 - maximum: 343500) Hz was measured. | |||
其视角稳定的IPS面板可以从任何角度轻松阅读。在户外,只要阳光不是太强烈,显示屏一般都能保持清晰。
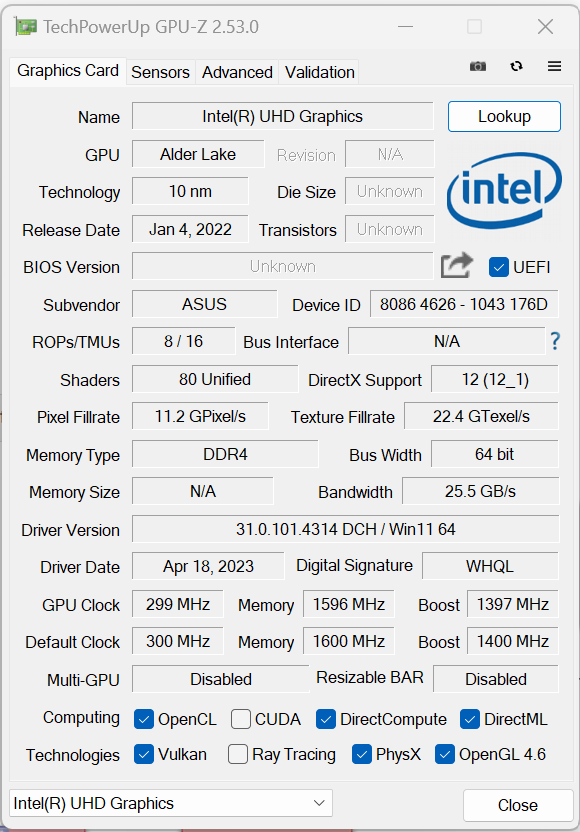
业绩 - 阿尔德湖和安培
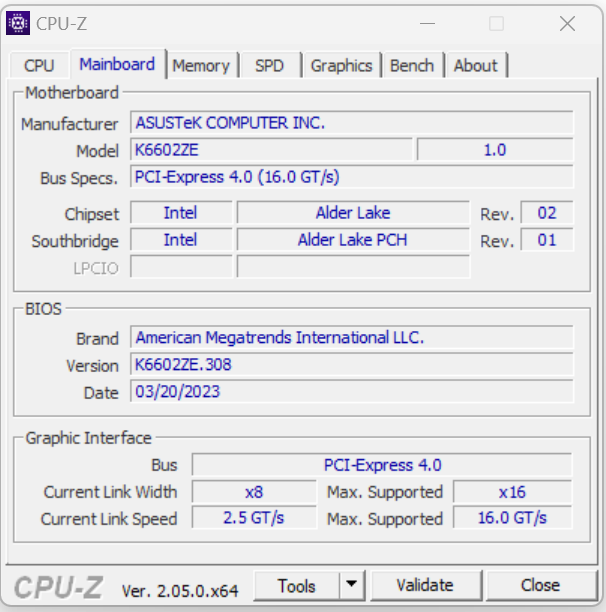
VivoBook Pro 16系列包括5个型号范围(见型号),它们基于不同的CPU和GPU世代。目前的K6602ZE型号使用Alder Lake CPU和一个GeForce-RTX-3050-TGPU。我们的测试设备的MRSP是1,247美元。其他变种在测试时没有提供。
测试条件
你可以使用组合键 "Fn "+"F "在三个制造商特定的冷却模式之间切换(见表)。我们使用了 "标准模式"(基准测试)和 "低声模式"(电池测试)。
| 性能模式 | 标准模式 | 悄悄话模式 | |
|---|---|---|---|
| 功率限制1(HWInfo) | 80瓦 | 50瓦 | 28瓦 |
| 功率限制 2 (HWInfo) | 120 瓦 | 120 瓦 | 120 瓦 |
| TGP (Witcher 3) | 65 watts | 50 watts | 25 watts |
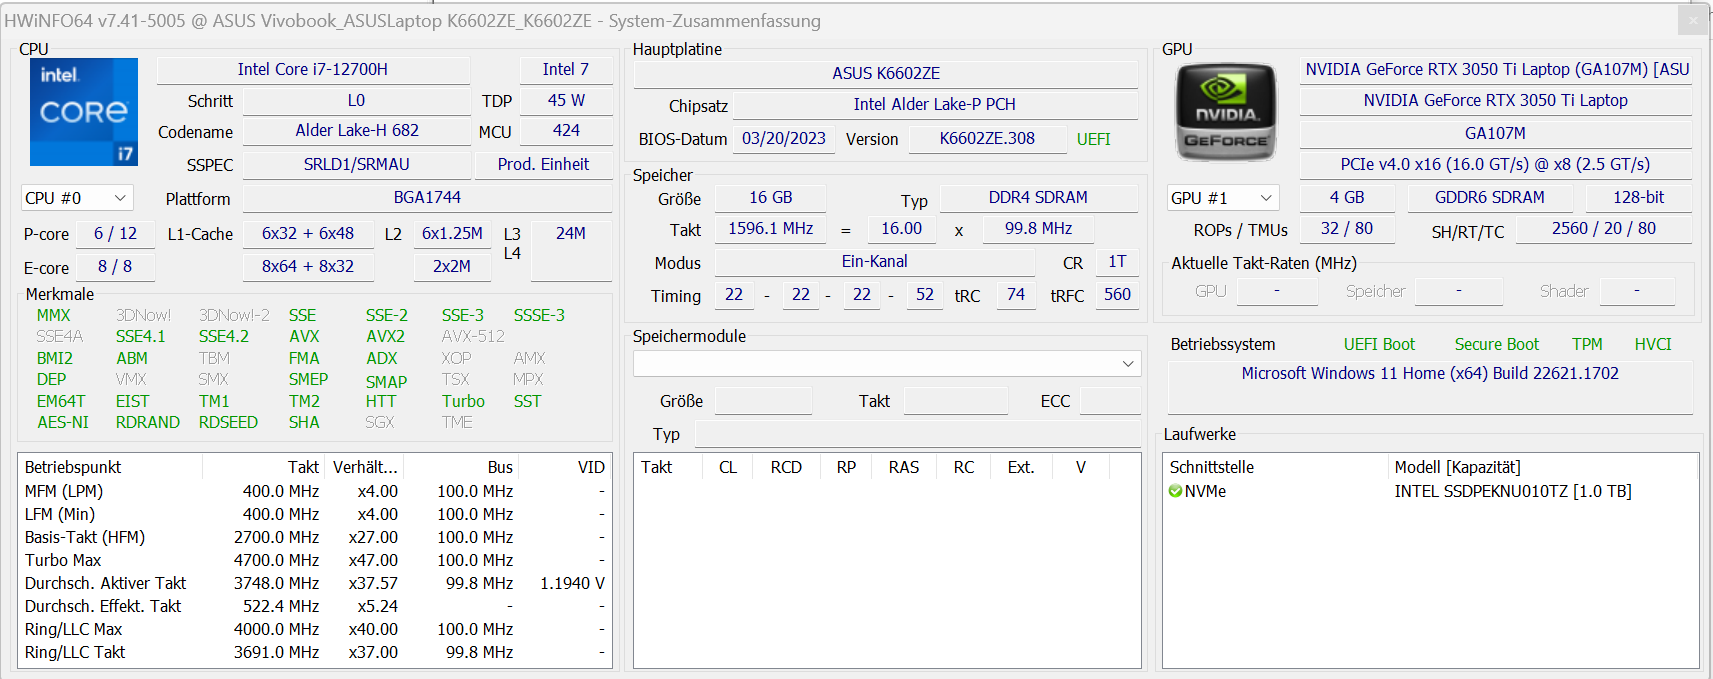
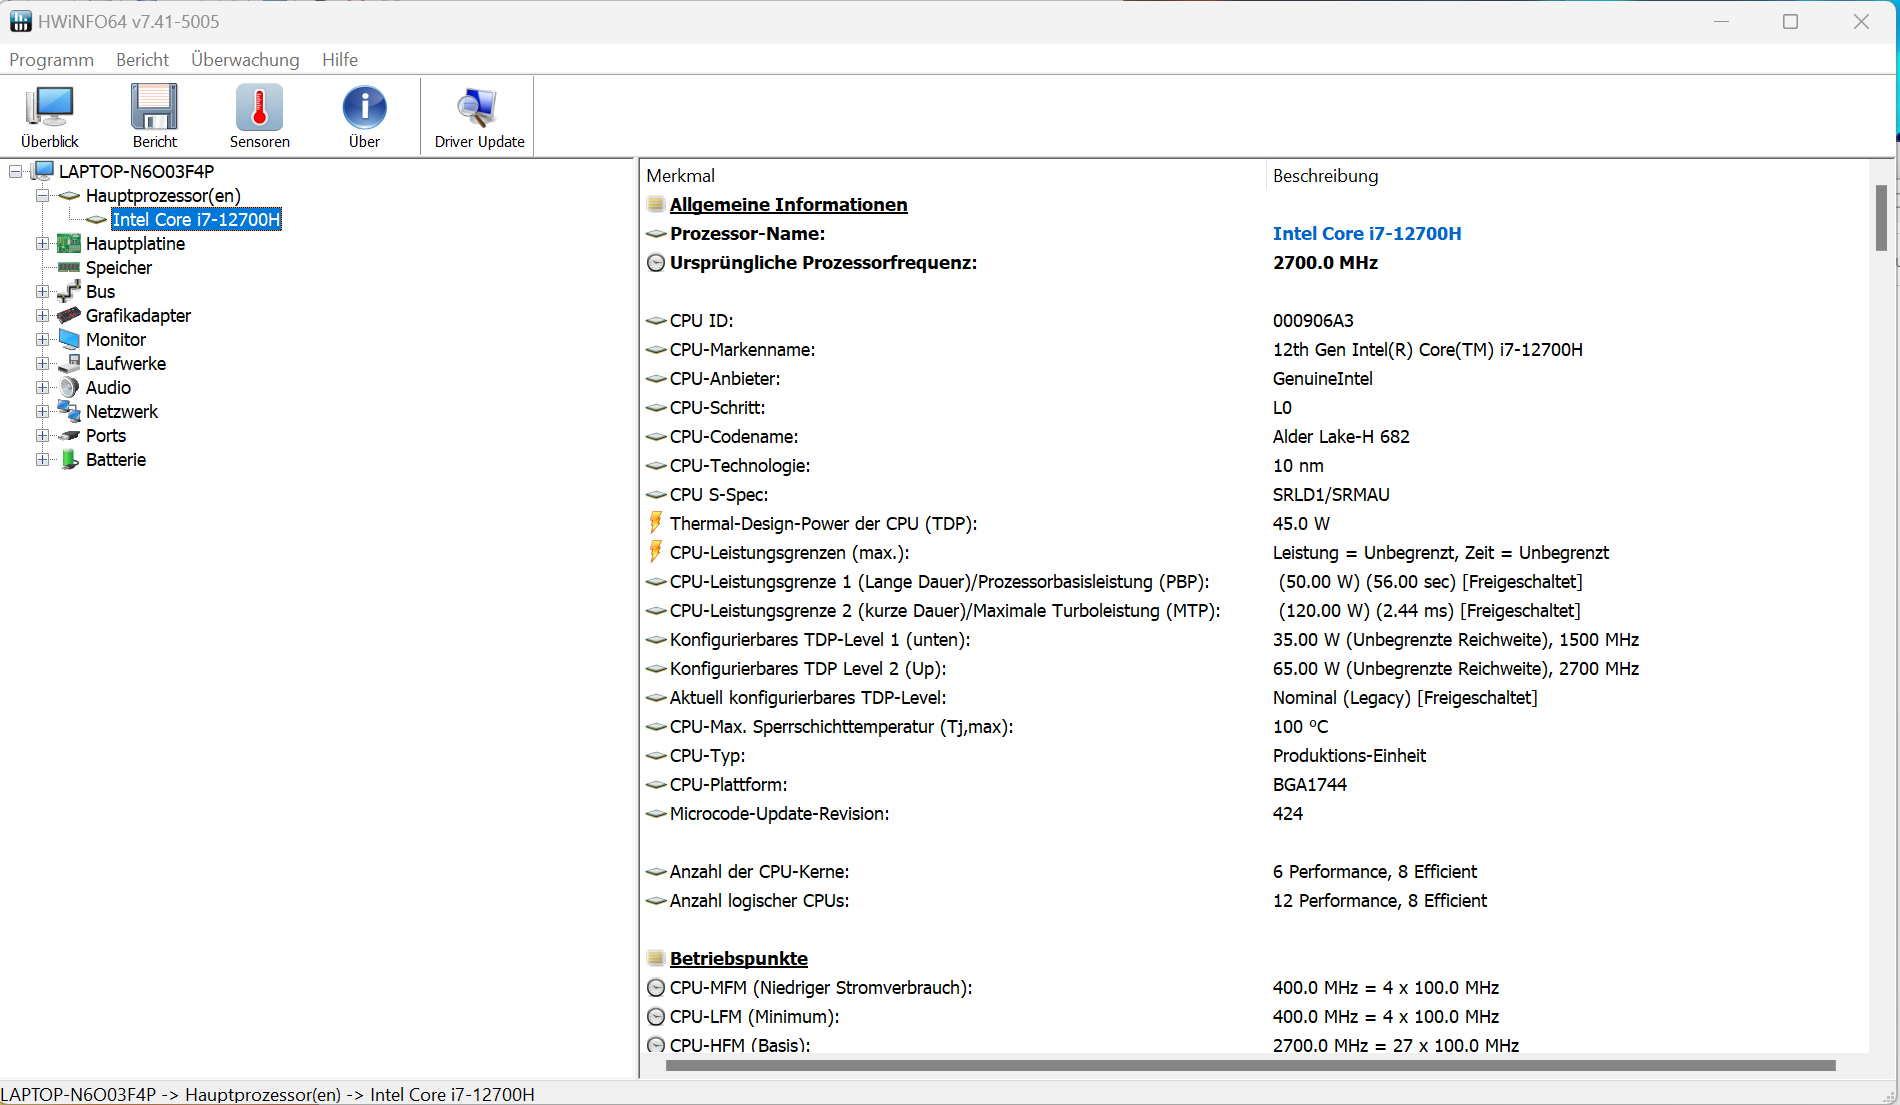
处理器
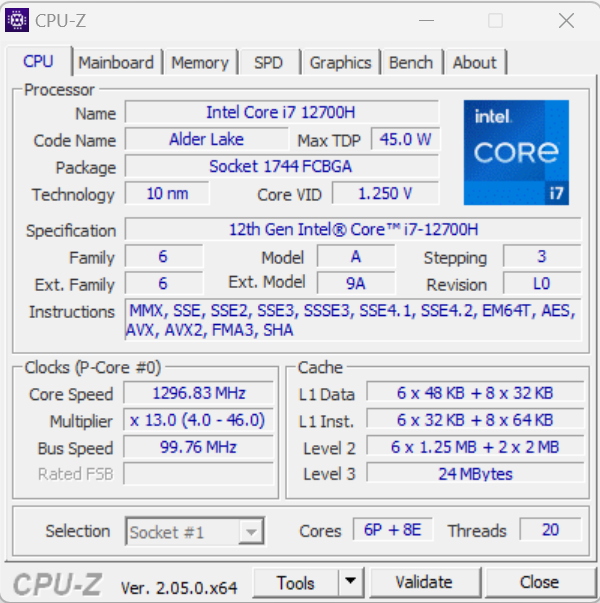
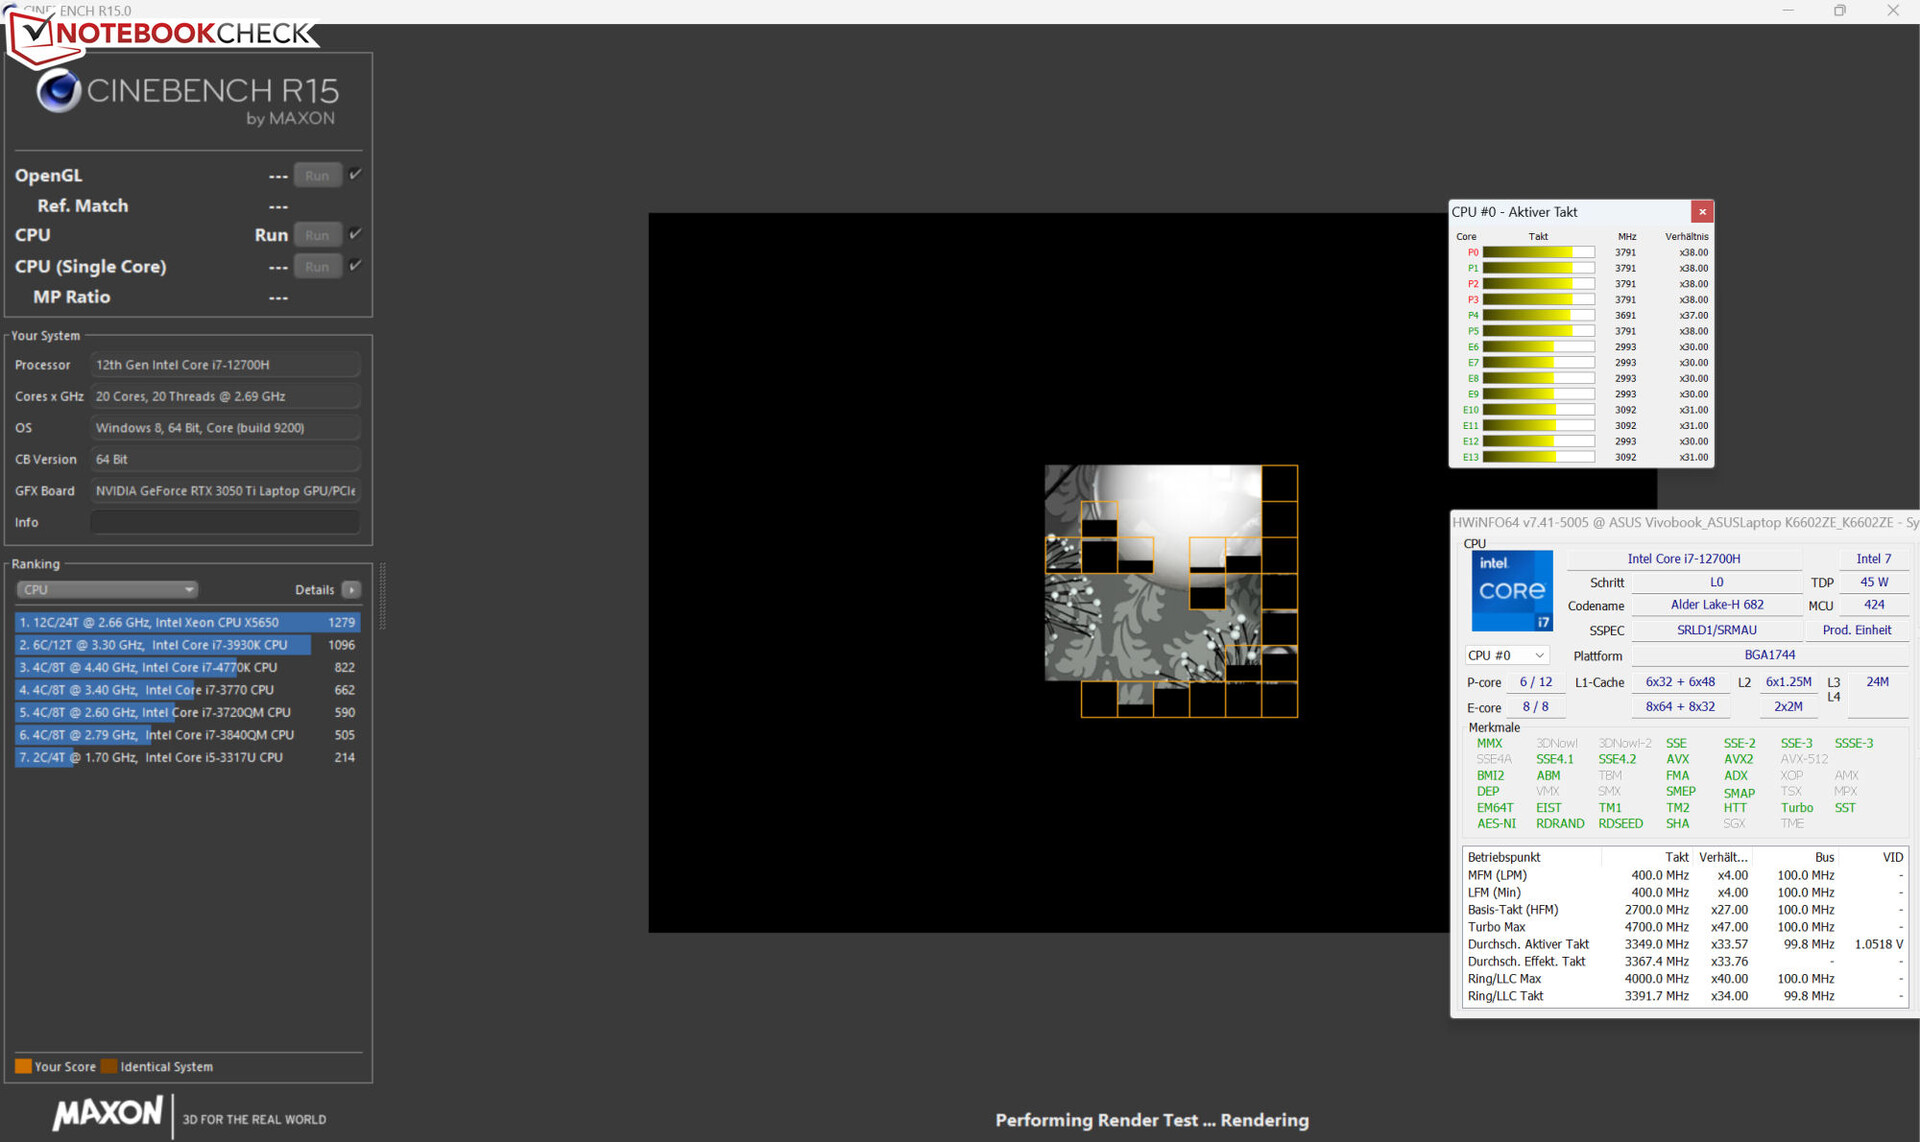
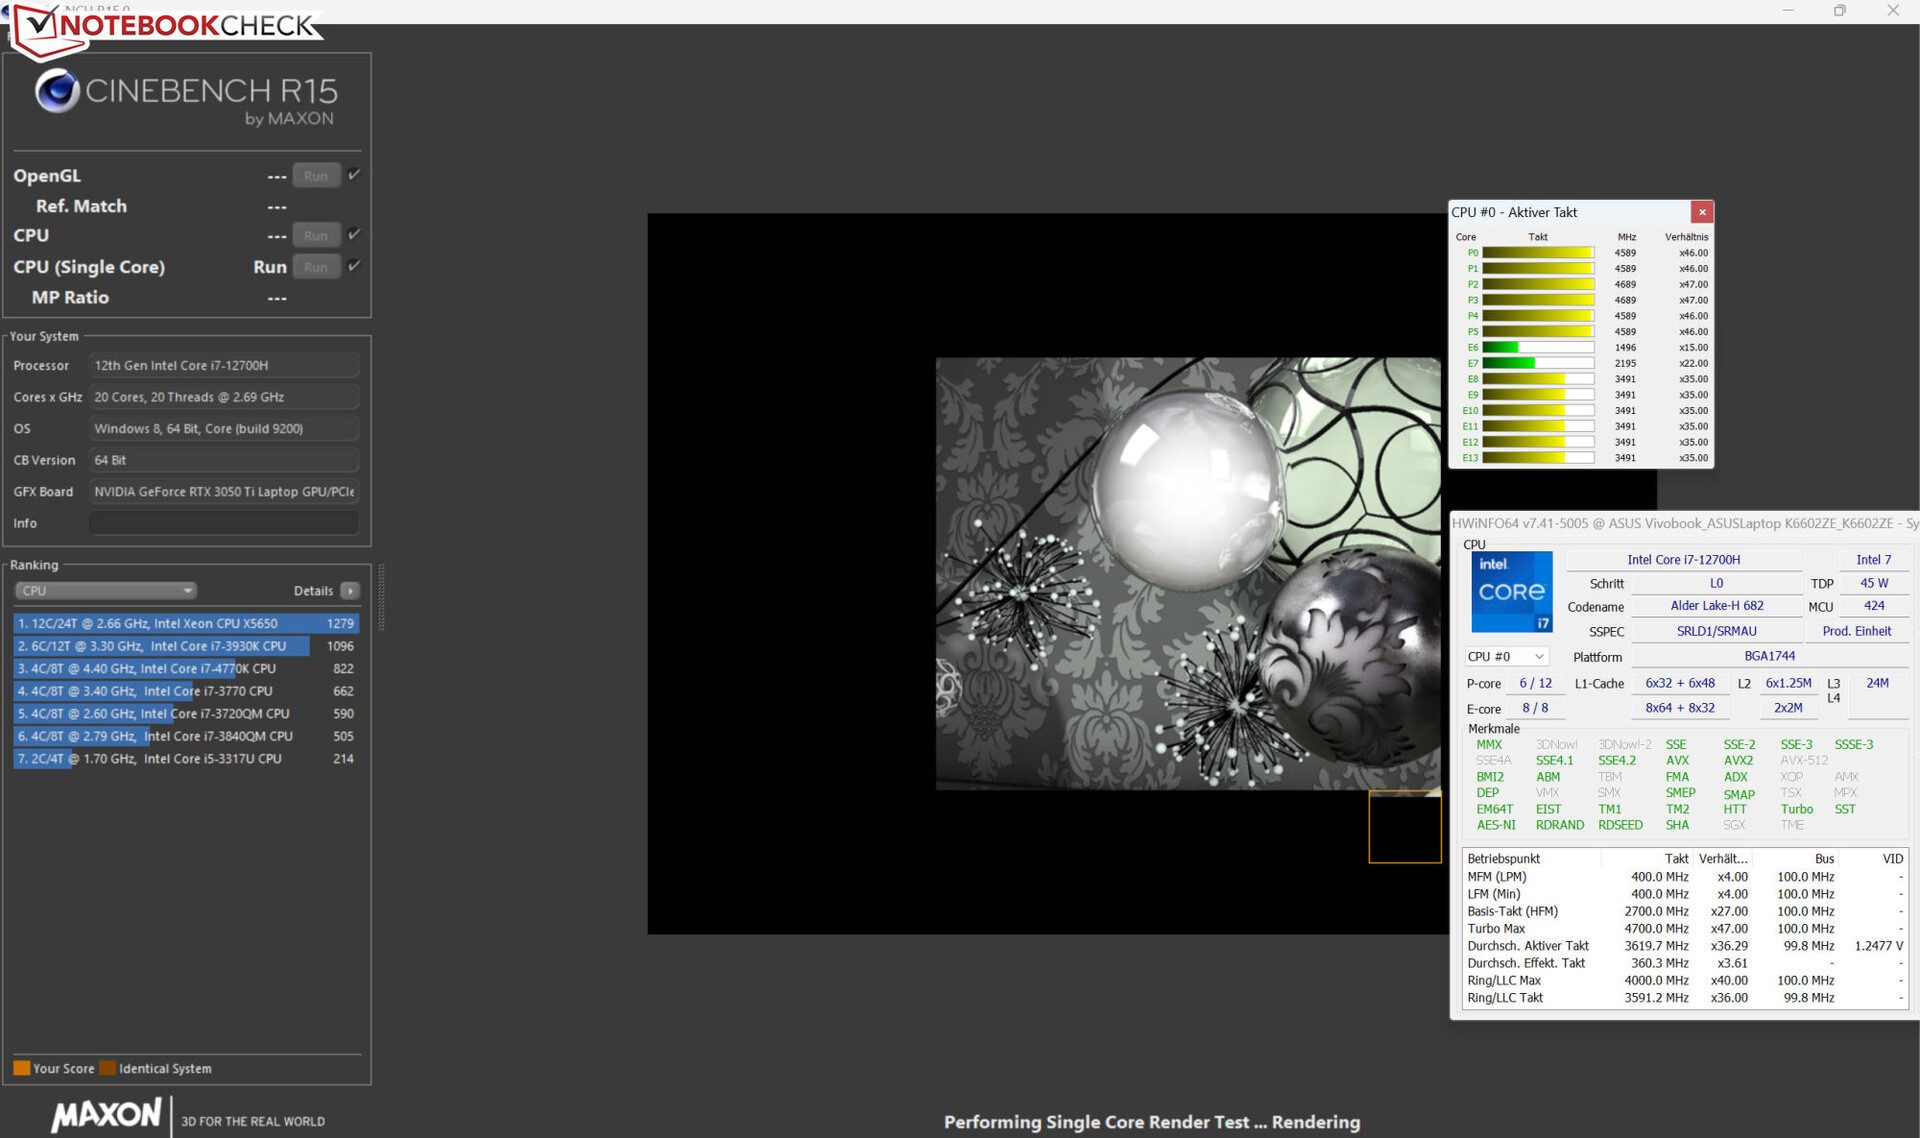
这款笔记本电脑的酷睿-i7-12700H处理器(Alder Lake)包括6个性能核心(超线程,2.4 - 4.7 GHz)和8个效率核心(无超线程,1.8 - 3.5 GHz)。总的来说,这加起来就是20个逻辑CPU核心。
我们使用激活的 "性能模式 "测量了最好的基准结果--尽管,与 "标准模式 "的距离很小。无论如何,这些数值都低于CPU的平均水平。在电池模式下,其单线程性能(127分)比其多线程性能(1695分)降低得更多。
CB15的循环测试显示:连续的多线程负载导致涡轮机的时钟速率从第一次运行到第四次运行时下降。随后,该速率保持不变。使用 "性能模式 "没有导致性能改善。
Cinebench R15 Multi continuous test
| CPU Performance rating - Percent | |
| Average of class Multimedia | |
| Average Intel Core i7-12700H | |
| Dell Inspiron 16 Plus 7620 | |
| Asus VivoBook Pro 16 | |
| Acer Swift X SFX16-52G-77RX | |
| Schenker XMG Fusion 15 (Mid 22) | |
* ... smaller is better
AIDA64: FP32 Ray-Trace | FPU Julia | CPU SHA3 | CPU Queen | FPU SinJulia | FPU Mandel | CPU AES | CPU ZLib | FP64 Ray-Trace | CPU PhotoWorxx
| Performance rating | |
| Average of class Multimedia | |
| Schenker XMG Fusion 15 (Mid 22) | |
| Asus VivoBook Pro 16 | |
| Dell Inspiron 16 Plus 7620 | |
| Average Intel Core i7-12700H | |
| Acer Swift X SFX16-52G-77RX | |
| AIDA64 / FP32 Ray-Trace | |
| Average of class Multimedia (2214 - 50388, n=55, last 2 years) | |
| Asus VivoBook Pro 16 (v6.75.6100) | |
| Dell Inspiron 16 Plus 7620 (v6.70.6000) | |
| Schenker XMG Fusion 15 (Mid 22) (v6.70.6000) | |
| Average Intel Core i7-12700H (2585 - 17957, n=64) | |
| Acer Swift X SFX16-52G-77RX (v6.70.6000) | |
| AIDA64 / FPU Julia | |
| Average of class Multimedia (12867 - 201874, n=56, last 2 years) | |
| Asus VivoBook Pro 16 (v6.75.6100) | |
| Dell Inspiron 16 Plus 7620 (v6.70.6000) | |
| Schenker XMG Fusion 15 (Mid 22) (v6.70.6000) | |
| Average Intel Core i7-12700H (12439 - 90760, n=64) | |
| Acer Swift X SFX16-52G-77RX (v6.70.6000) | |
| AIDA64 / CPU SHA3 | |
| Schenker XMG Fusion 15 (Mid 22) (v6.70.6000) | |
| Average of class Multimedia (626 - 8623, n=56, last 2 years) | |
| Asus VivoBook Pro 16 (v6.75.6100) | |
| Average Intel Core i7-12700H (833 - 4242, n=64) | |
| Dell Inspiron 16 Plus 7620 (v6.70.6000) | |
| Acer Swift X SFX16-52G-77RX (v6.70.6000) | |
| AIDA64 / CPU Queen | |
| Asus VivoBook Pro 16 (v6.75.6100) | |
| Average Intel Core i7-12700H (57923 - 103202, n=63) | |
| Dell Inspiron 16 Plus 7620 (v6.70.6000) | |
| Schenker XMG Fusion 15 (Mid 22) | |
| Acer Swift X SFX16-52G-77RX (v6.70.6000) | |
| Average of class Multimedia (13483 - 181505, n=43, last 2 years) | |
| AIDA64 / FPU SinJulia | |
| Average Intel Core i7-12700H (3249 - 9939, n=64) | |
| Average of class Multimedia (886 - 28794, n=56, last 2 years) | |
| Asus VivoBook Pro 16 (v6.75.6100) | |
| Schenker XMG Fusion 15 (Mid 22) (v6.70.6000) | |
| Dell Inspiron 16 Plus 7620 (v6.70.6000) | |
| Acer Swift X SFX16-52G-77RX (v6.70.6000) | |
| AIDA64 / FPU Mandel | |
| Average of class Multimedia (6395 - 105740, n=55, last 2 years) | |
| Schenker XMG Fusion 15 (Mid 22) (v6.70.6000) | |
| Asus VivoBook Pro 16 (v6.75.6100) | |
| Dell Inspiron 16 Plus 7620 (v6.70.6000) | |
| Average Intel Core i7-12700H (7135 - 44760, n=64) | |
| Acer Swift X SFX16-52G-77RX (v6.70.6000) | |
| AIDA64 / CPU AES | |
| Schenker XMG Fusion 15 (Mid 22) (v6.70.6000) | |
| Average Intel Core i7-12700H (31839 - 144360, n=64) | |
| Average of class Multimedia (8171 - 126790, n=56, last 2 years) | |
| Asus VivoBook Pro 16 (v6.75.6100) | |
| Dell Inspiron 16 Plus 7620 (v6.70.6000) | |
| Acer Swift X SFX16-52G-77RX (v6.70.6000) | |
| AIDA64 / CPU ZLib | |
| Average of class Multimedia (143.8 - 2022, n=56, last 2 years) | |
| Dell Inspiron 16 Plus 7620 (v6.70.6000) | |
| Average Intel Core i7-12700H (305 - 1171, n=64) | |
| Asus VivoBook Pro 16 (v6.75.6100) | |
| Schenker XMG Fusion 15 (Mid 22) (v6.70.6000) | |
| Acer Swift X SFX16-52G-77RX (v6.70.6000) | |
| AIDA64 / FP64 Ray-Trace | |
| Average of class Multimedia (1014 - 26875, n=56, last 2 years) | |
| Asus VivoBook Pro 16 (v6.75.6100) | |
| Schenker XMG Fusion 15 (Mid 22) (v6.70.6000) | |
| Dell Inspiron 16 Plus 7620 (v6.70.6000) | |
| Average Intel Core i7-12700H (1437 - 9692, n=64) | |
| Acer Swift X SFX16-52G-77RX (v6.70.6000) | |
| AIDA64 / CPU PhotoWorxx | |
| Average of class Multimedia (8187 - 88154, n=56, last 2 years) | |
| Acer Swift X SFX16-52G-77RX (v6.70.6000) | |
| Dell Inspiron 16 Plus 7620 (v6.70.6000) | |
| Average Intel Core i7-12700H (12863 - 52207, n=64) | |
| Schenker XMG Fusion 15 (Mid 22) (v6.70.6000) | |
| Asus VivoBook Pro 16 (v6.75.6100) | |
系统性能
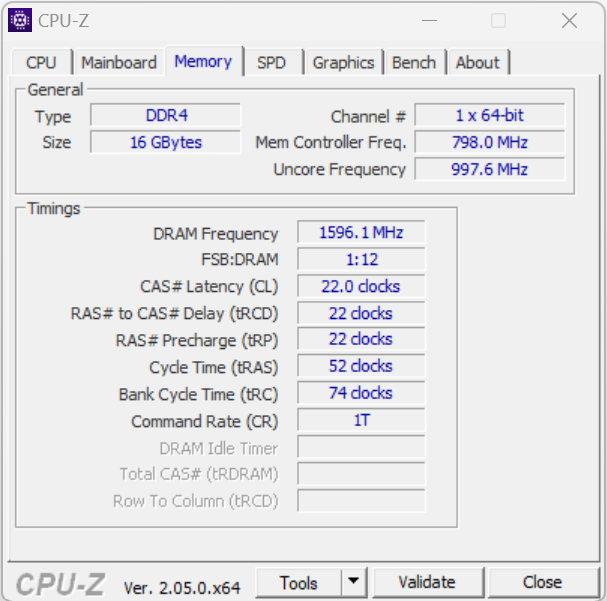
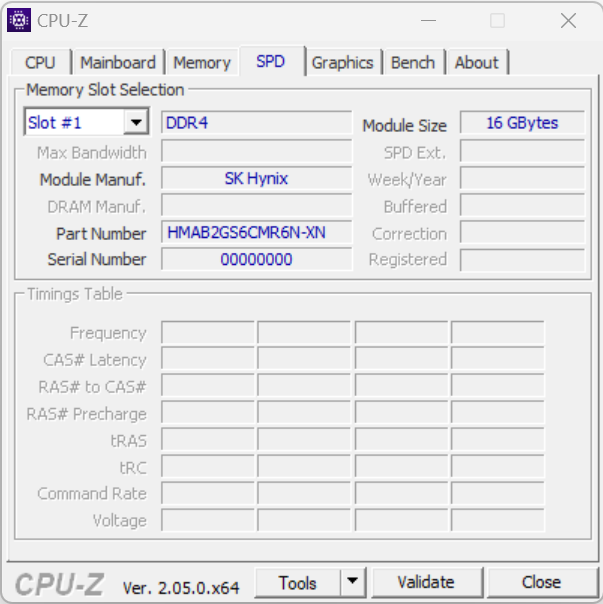
其流畅运行的系统掌握了游戏、流媒体和渲染。它的一部分处理能力处于闲置状态,因为内存(16GB,DDR4-3200,板载)只在单通道模式下运行。安装一个内存模块(=双通道模式激活)将解决这个问题--与具有相同存储空间的竞争对手相比,它还可以将其数据速率提高到类似水平。
CrossMark: Overall | Productivity | Creativity | Responsiveness
| PCMark 10 / Score | |
| Average of class Multimedia (4325 - 10386, n=54, last 2 years) | |
| Dell Inspiron 16 Plus 7620 | |
| Average Intel Core i7-12700H, NVIDIA GeForce RTX 3050 Ti Laptop GPU (6623 - 7075, n=5) | |
| Asus VivoBook Pro 16 | |
| Schenker XMG Fusion 15 (Mid 22) | |
| Acer Swift X SFX16-52G-77RX | |
| PCMark 10 / Essentials | |
| Acer Swift X SFX16-52G-77RX | |
| Average of class Multimedia (8025 - 11664, n=53, last 2 years) | |
| Average Intel Core i7-12700H, NVIDIA GeForce RTX 3050 Ti Laptop GPU (9540 - 10970, n=5) | |
| Dell Inspiron 16 Plus 7620 | |
| Schenker XMG Fusion 15 (Mid 22) | |
| Asus VivoBook Pro 16 | |
| PCMark 10 / Productivity | |
| Average of class Multimedia (7323 - 18233, n=53, last 2 years) | |
| Dell Inspiron 16 Plus 7620 | |
| Average Intel Core i7-12700H, NVIDIA GeForce RTX 3050 Ti Laptop GPU (8530 - 9555, n=5) | |
| Asus VivoBook Pro 16 | |
| Schenker XMG Fusion 15 (Mid 22) | |
| Acer Swift X SFX16-52G-77RX | |
| PCMark 10 / Digital Content Creation | |
| Average of class Multimedia (3651 - 16240, n=53, last 2 years) | |
| Dell Inspiron 16 Plus 7620 | |
| Asus VivoBook Pro 16 | |
| Average Intel Core i7-12700H, NVIDIA GeForce RTX 3050 Ti Laptop GPU (8855 - 9542, n=5) | |
| Acer Swift X SFX16-52G-77RX | |
| Schenker XMG Fusion 15 (Mid 22) | |
| CrossMark / Overall | |
| Average of class Multimedia (866 - 2728, n=62, last 2 years) | |
| Dell Inspiron 16 Plus 7620 | |
| Acer Swift X SFX16-52G-77RX | |
| Average Intel Core i7-12700H, NVIDIA GeForce RTX 3050 Ti Laptop GPU (1654 - 1872, n=5) | |
| Asus VivoBook Pro 16 | |
| Schenker XMG Fusion 15 (Mid 22) | |
| CrossMark / Productivity | |
| Average of class Multimedia (931 - 2489, n=62, last 2 years) | |
| Acer Swift X SFX16-52G-77RX | |
| Asus VivoBook Pro 16 | |
| Average Intel Core i7-12700H, NVIDIA GeForce RTX 3050 Ti Laptop GPU (1595 - 1792, n=5) | |
| Dell Inspiron 16 Plus 7620 | |
| Schenker XMG Fusion 15 (Mid 22) | |
| CrossMark / Creativity | |
| Average of class Multimedia (907 - 3465, n=62, last 2 years) | |
| Dell Inspiron 16 Plus 7620 | |
| Average Intel Core i7-12700H, NVIDIA GeForce RTX 3050 Ti Laptop GPU (1699 - 1993, n=5) | |
| Acer Swift X SFX16-52G-77RX | |
| Asus VivoBook Pro 16 | |
| Schenker XMG Fusion 15 (Mid 22) | |
| CrossMark / Responsiveness | |
| Asus VivoBook Pro 16 | |
| Acer Swift X SFX16-52G-77RX | |
| Schenker XMG Fusion 15 (Mid 22) | |
| Average Intel Core i7-12700H, NVIDIA GeForce RTX 3050 Ti Laptop GPU (1383 - 1768, n=5) | |
| Average of class Multimedia (605 - 2024, n=62, last 2 years) | |
| Dell Inspiron 16 Plus 7620 | |
| PCMark 8 Home Score Accelerated v2 | 4565 points | |
| PCMark 8 Work Score Accelerated v2 | 5386 points | |
| PCMark 10 Score | 6652 points | |
Help | ||
| AIDA64 / Memory Copy | |
| Average of class Multimedia (11299 - 132135, n=56, last 2 years) | |
| Acer Swift X SFX16-52G-77RX | |
| Dell Inspiron 16 Plus 7620 | |
| Average Intel Core i7-12700H (25615 - 80511, n=64) | |
| Schenker XMG Fusion 15 (Mid 22) | |
| Asus VivoBook Pro 16 | |
| AIDA64 / Memory Read | |
| Average of class Multimedia (11624 - 174586, n=56, last 2 years) | |
| Acer Swift X SFX16-52G-77RX | |
| Dell Inspiron 16 Plus 7620 | |
| Average Intel Core i7-12700H (25586 - 79442, n=64) | |
| Schenker XMG Fusion 15 (Mid 22) | |
| Asus VivoBook Pro 16 | |
| AIDA64 / Memory Write | |
| Average of class Multimedia (11755 - 134998, n=56, last 2 years) | |
| Acer Swift X SFX16-52G-77RX | |
| Dell Inspiron 16 Plus 7620 | |
| Average Intel Core i7-12700H (23679 - 88660, n=64) | |
| Schenker XMG Fusion 15 (Mid 22) | |
| Asus VivoBook Pro 16 | |
| AIDA64 / Memory Latency | |
| Average of class Multimedia (7 - 535, n=55, last 2 years) | |
| Acer Swift X SFX16-52G-77RX | |
| Dell Inspiron 16 Plus 7620 | |
| Schenker XMG Fusion 15 (Mid 22) | |
| Asus VivoBook Pro 16 | |
| Average Intel Core i7-12700H (76.2 - 133.9, n=62) | |
* ... smaller is better
DPC延时
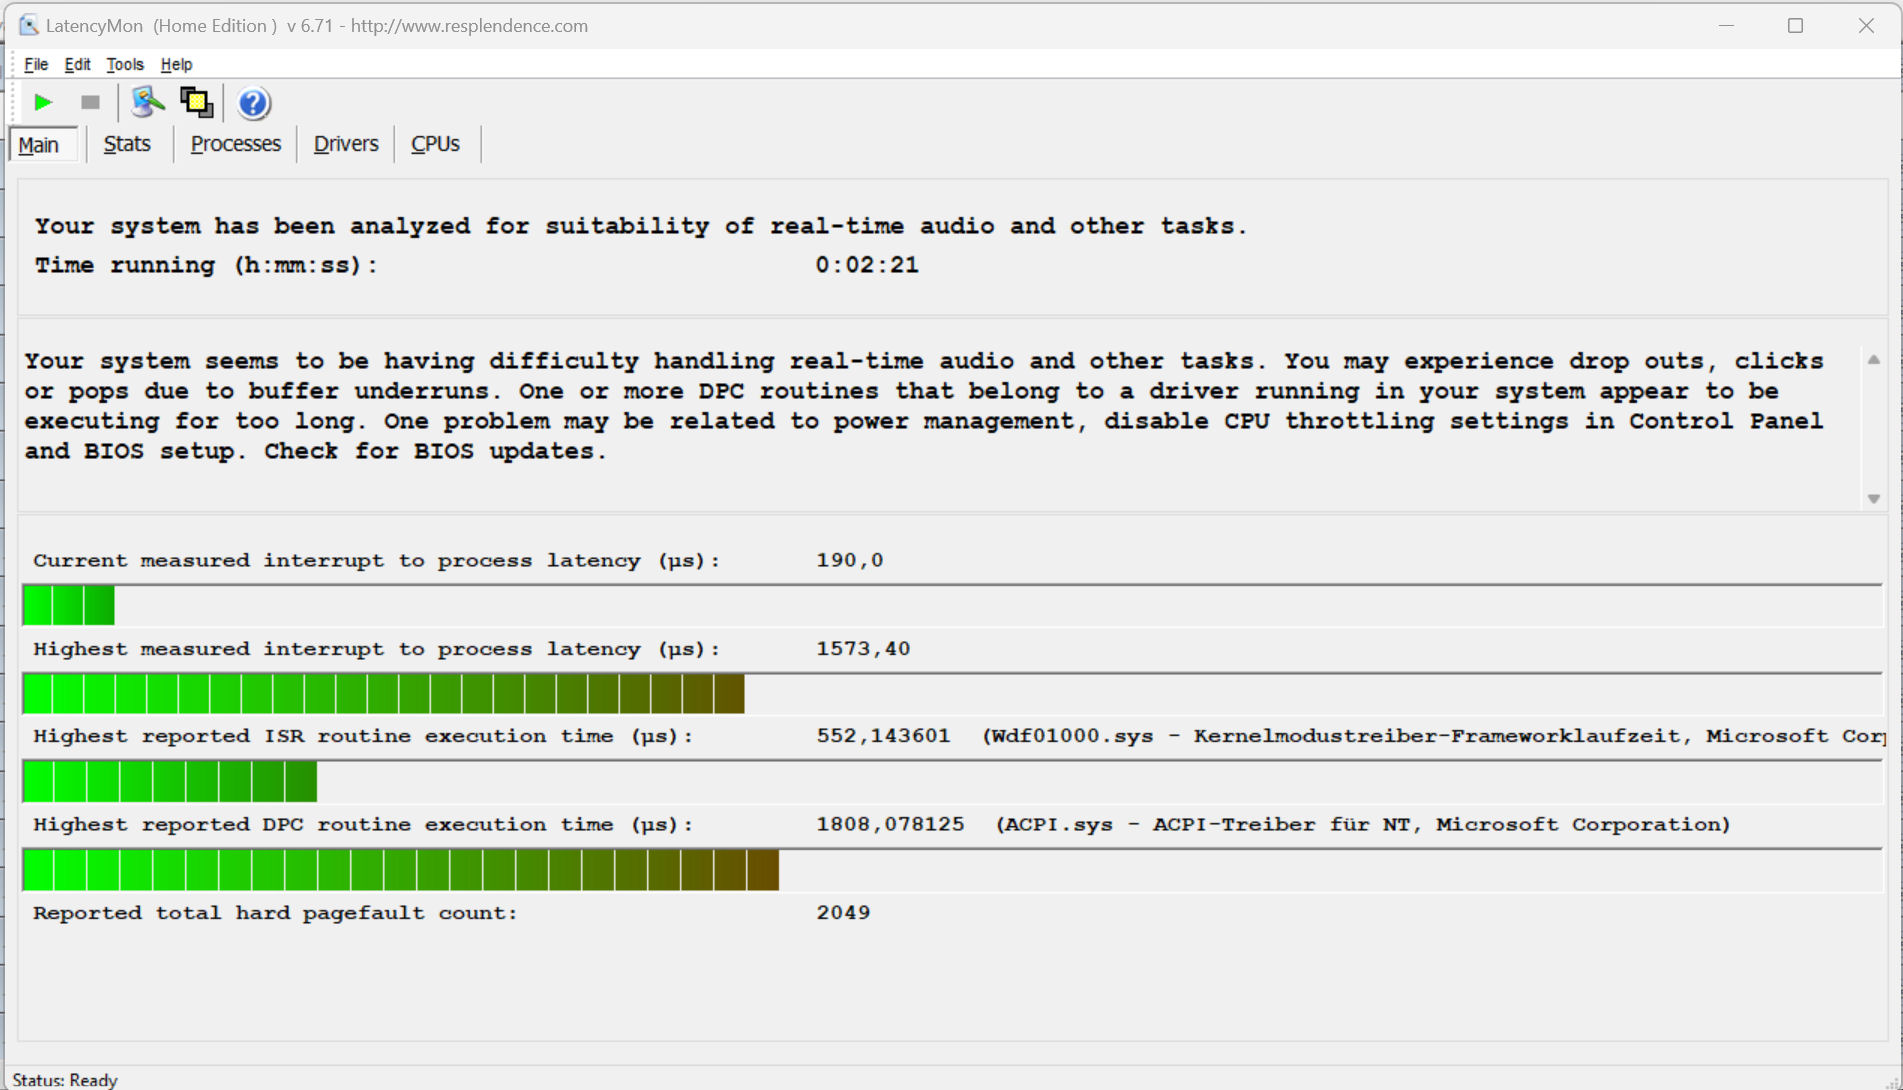
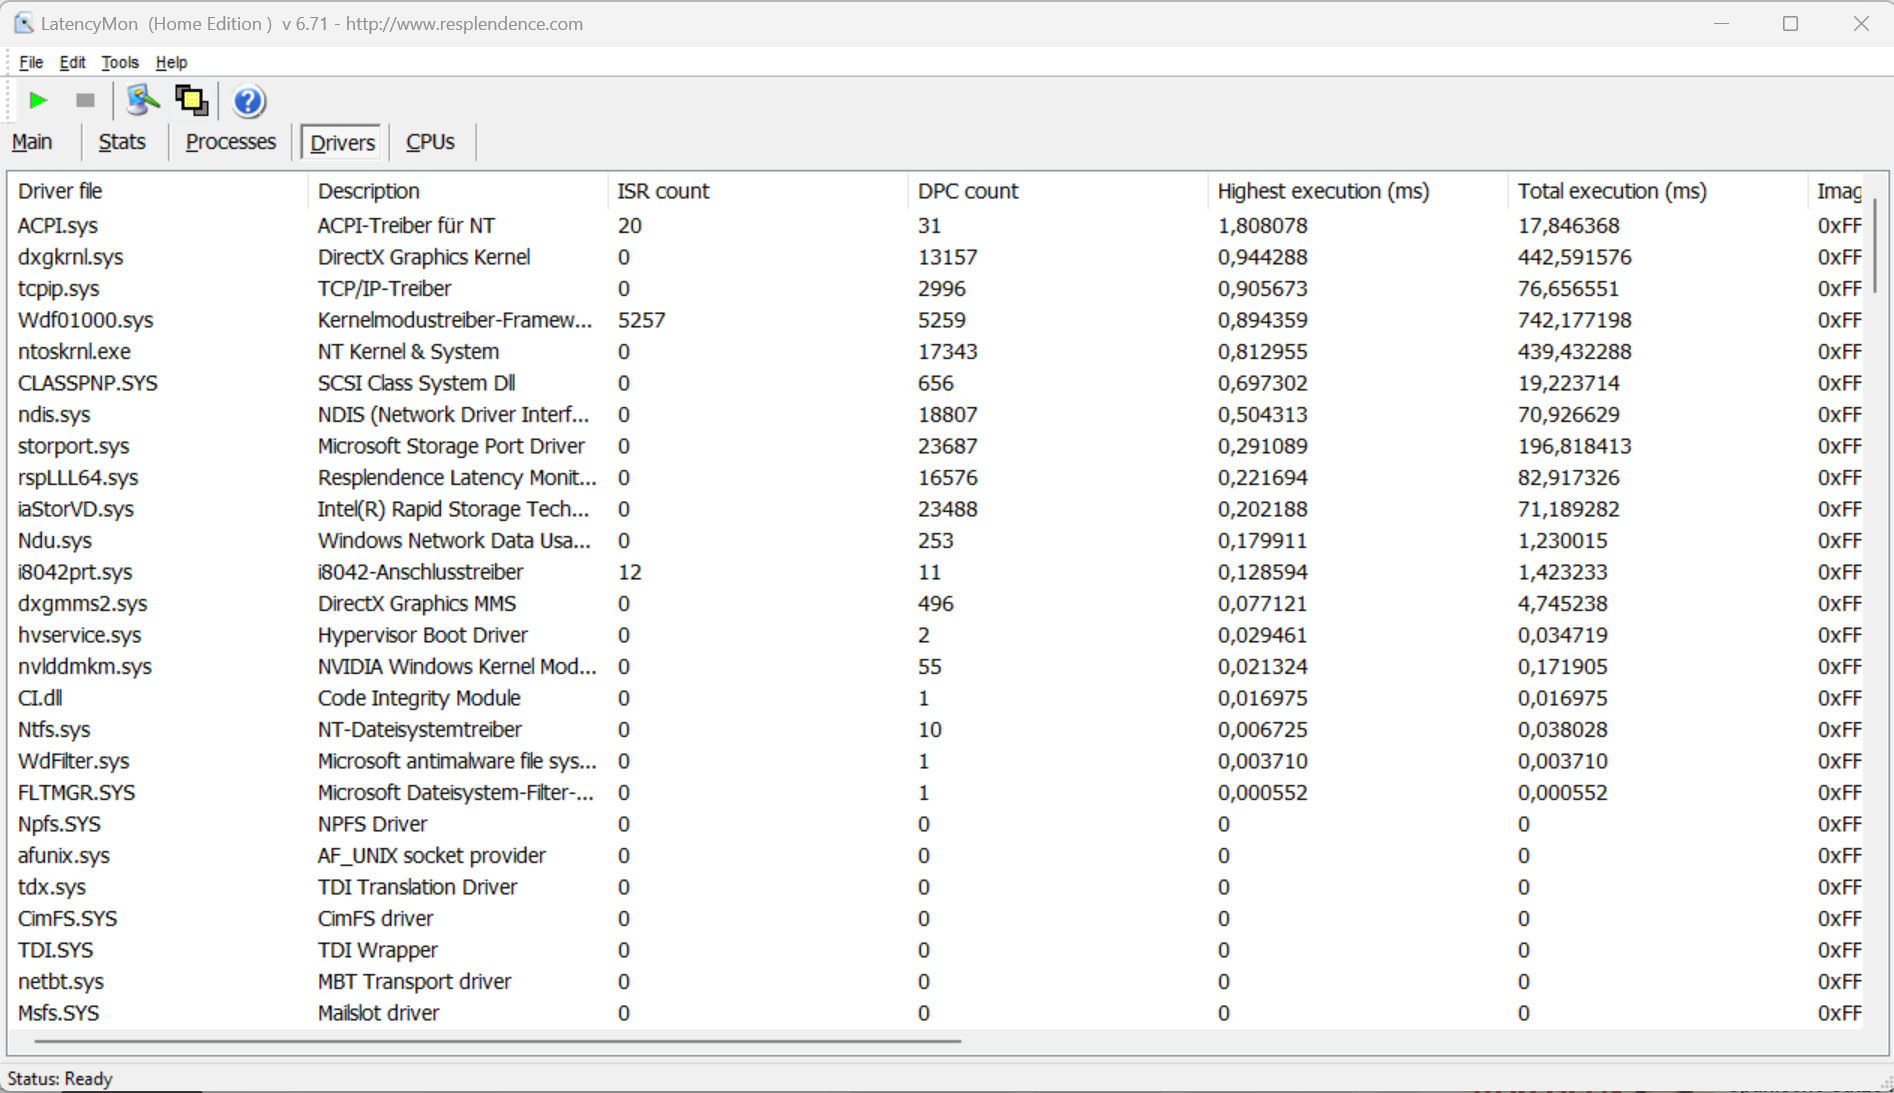
标准化的延迟监测测试(网络冲浪、4k视频播放、Prime95高负荷)发现了一些异常情况。该系统似乎不适合实时视频和音频编辑。未来的软件更新可能会导致改进,甚至是退化。
| DPC Latencies / LatencyMon - interrupt to process latency (max), Web, Youtube, Prime95 | |
| Schenker XMG Fusion 15 (Mid 22) | |
| Asus VivoBook Pro 16 | |
| Dell Inspiron 16 Plus 7620 | |
| Acer Swift X SFX16-52G-77RX | |
* ... smaller is better
存储设备
华硕为笔记本配备了英特尔的PCIe-3固态硬盘(M.2-2280),其容量为1TB。它能提供良好的数据速率,但不能被归类为固态硬盘的精英。这台电脑为第二块SSD提供了空间。


* ... smaller is better
reading continuous performance: DiskSpd Read Loop, Queue Depth 8
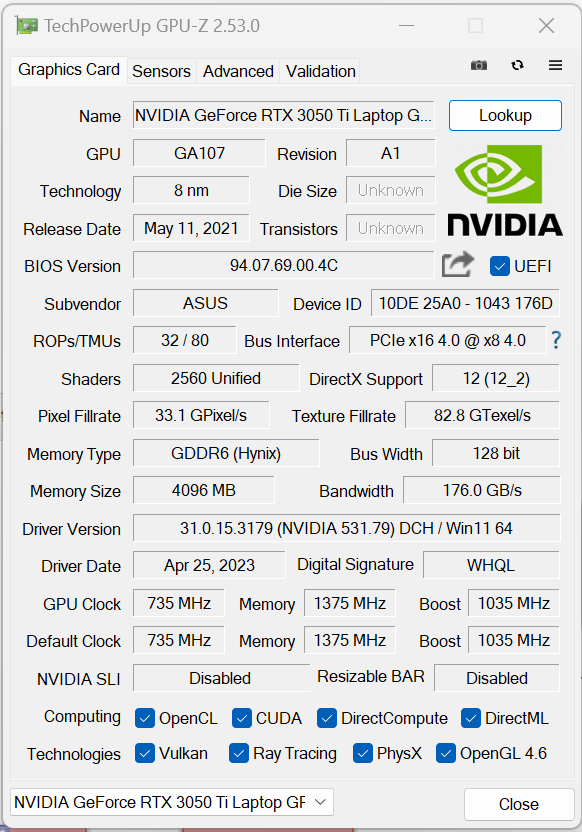
图形卡
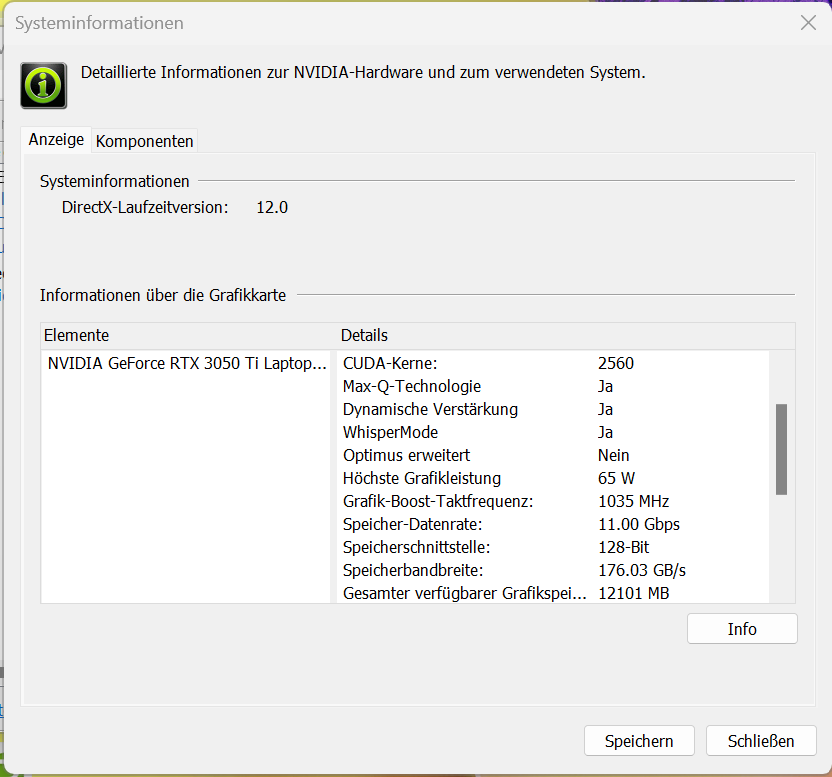
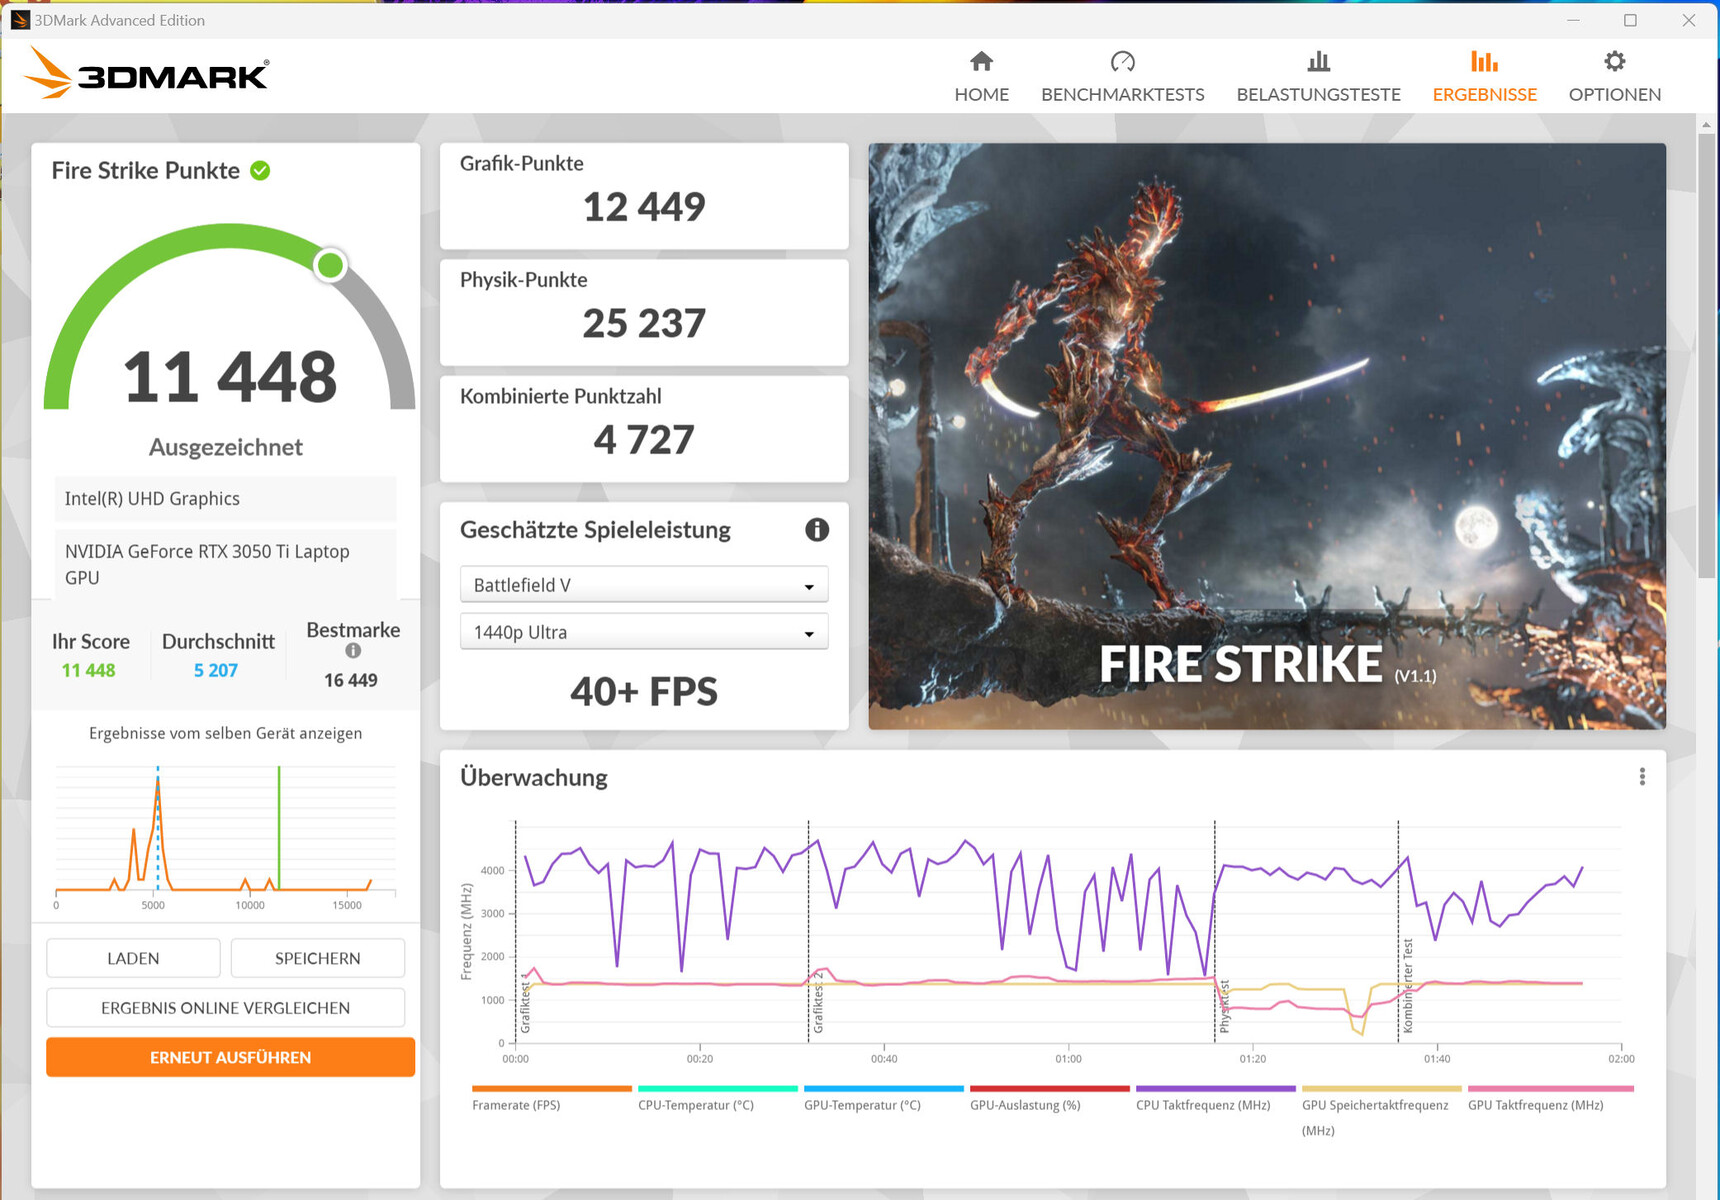
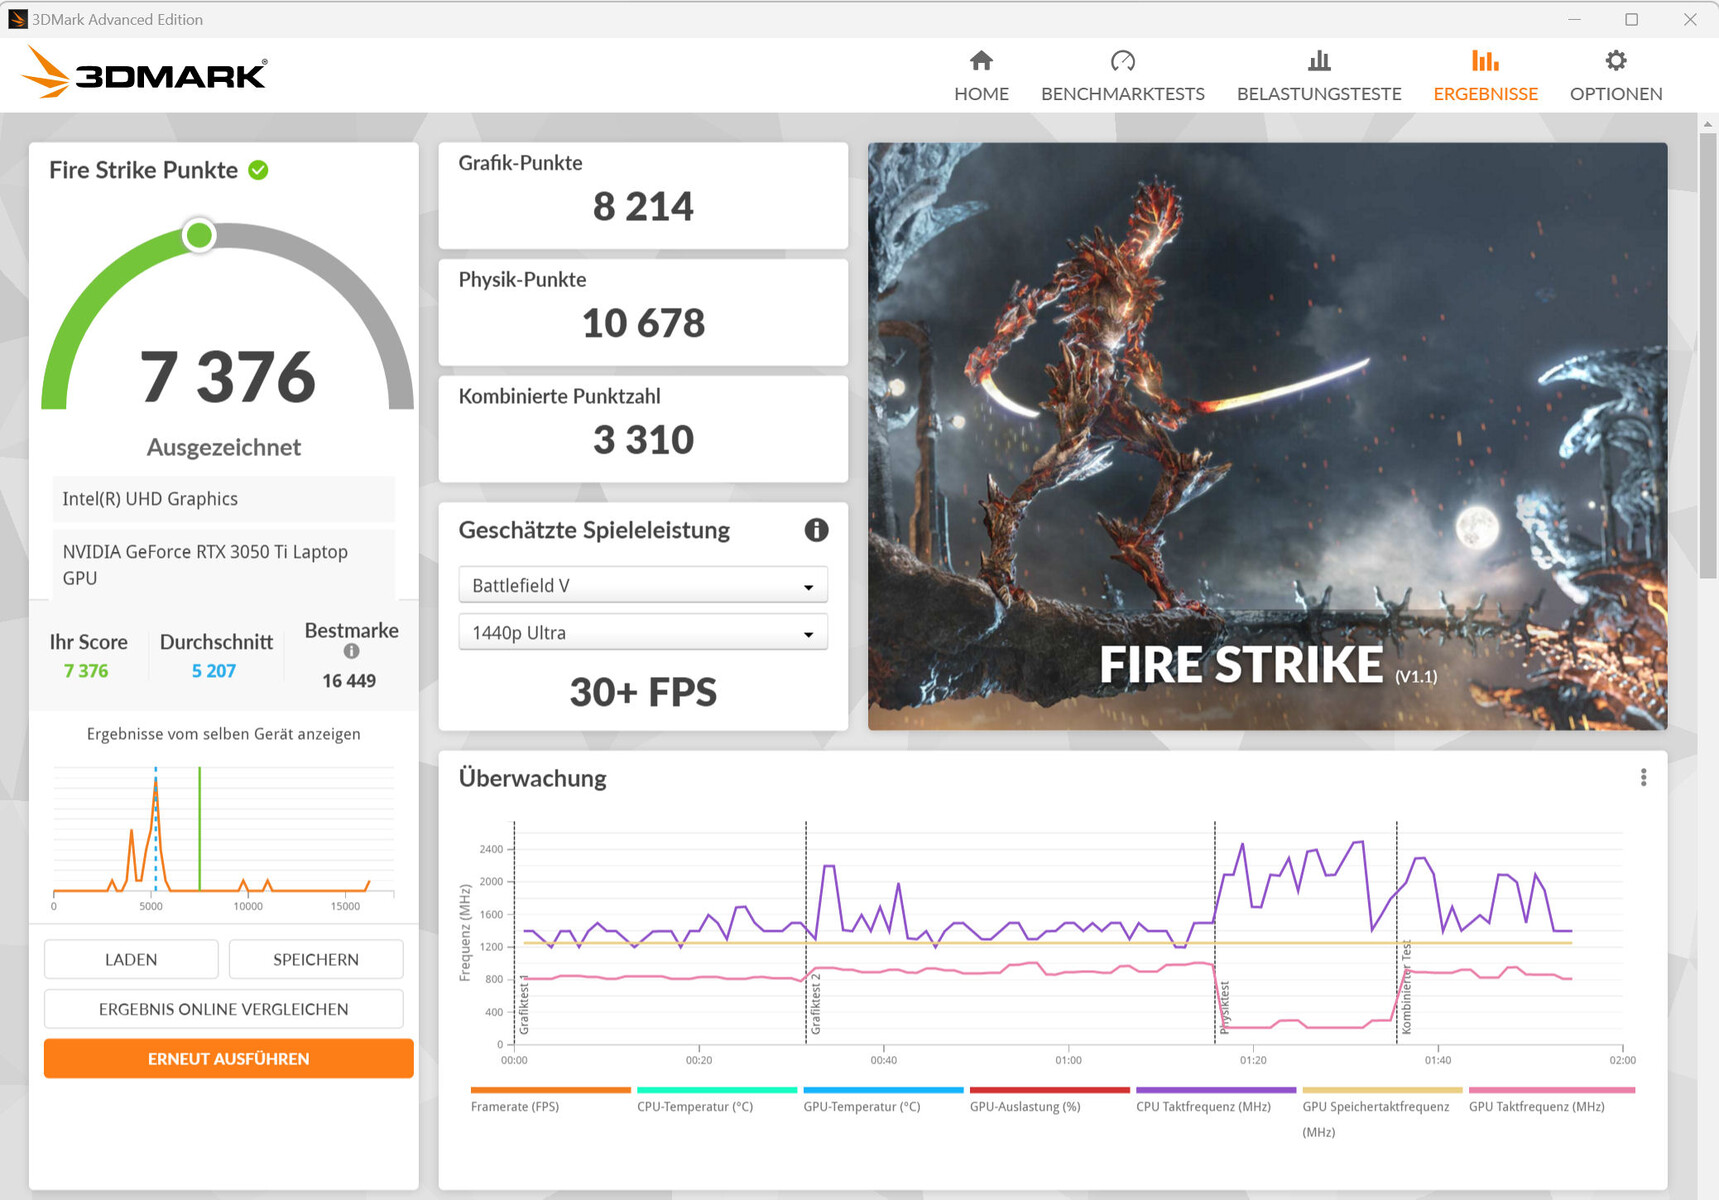
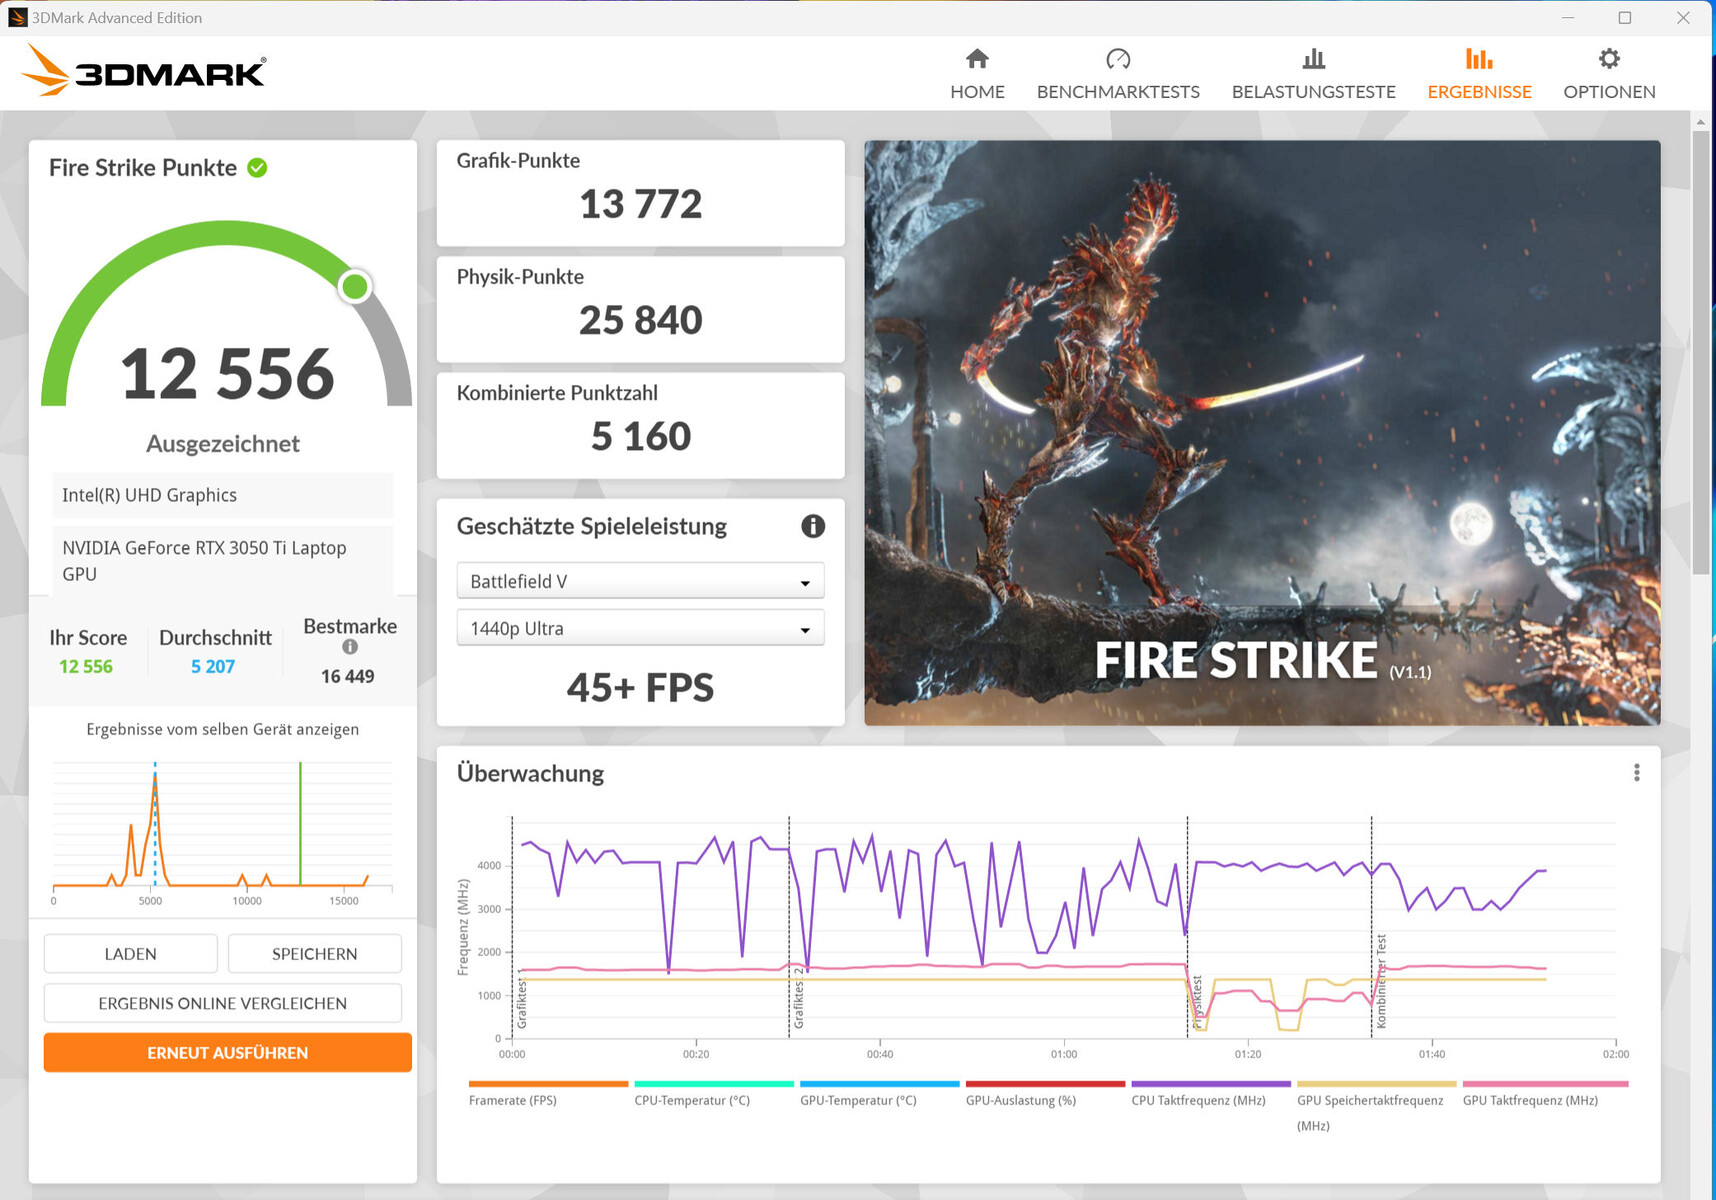
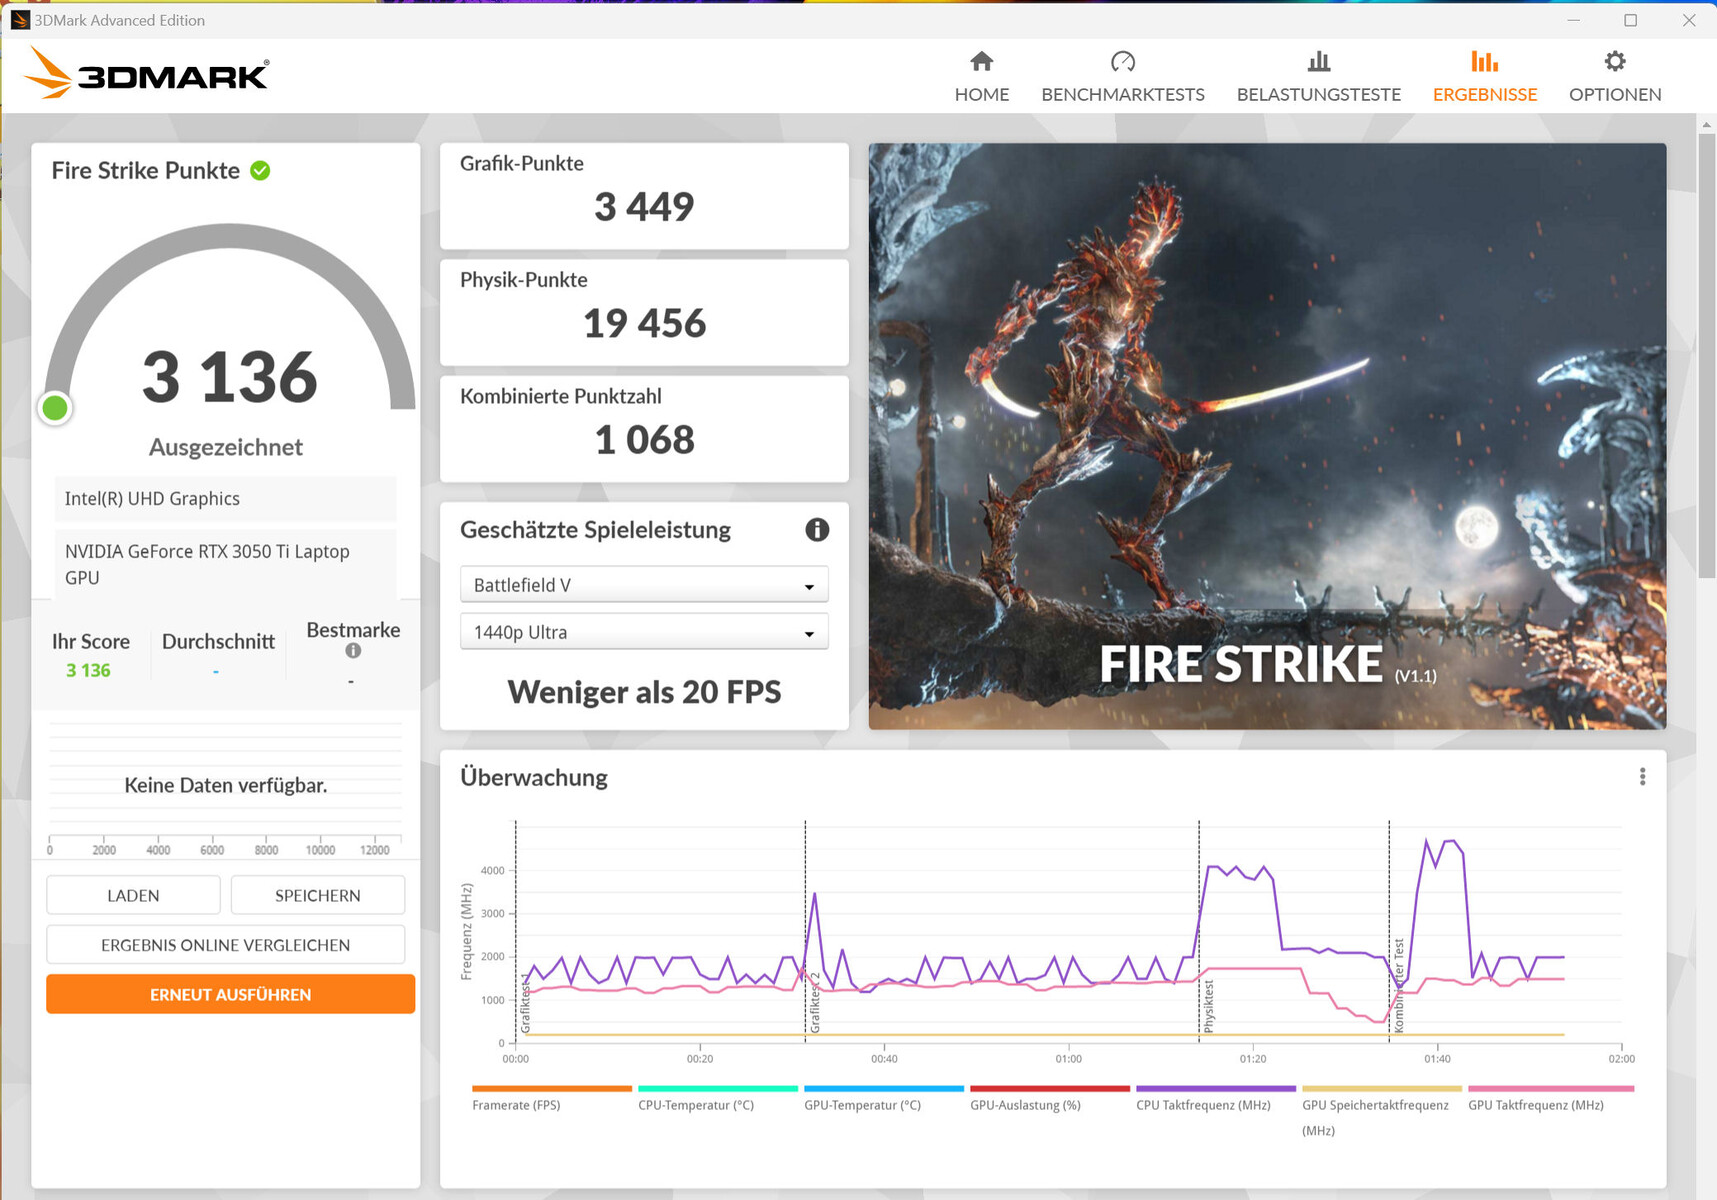
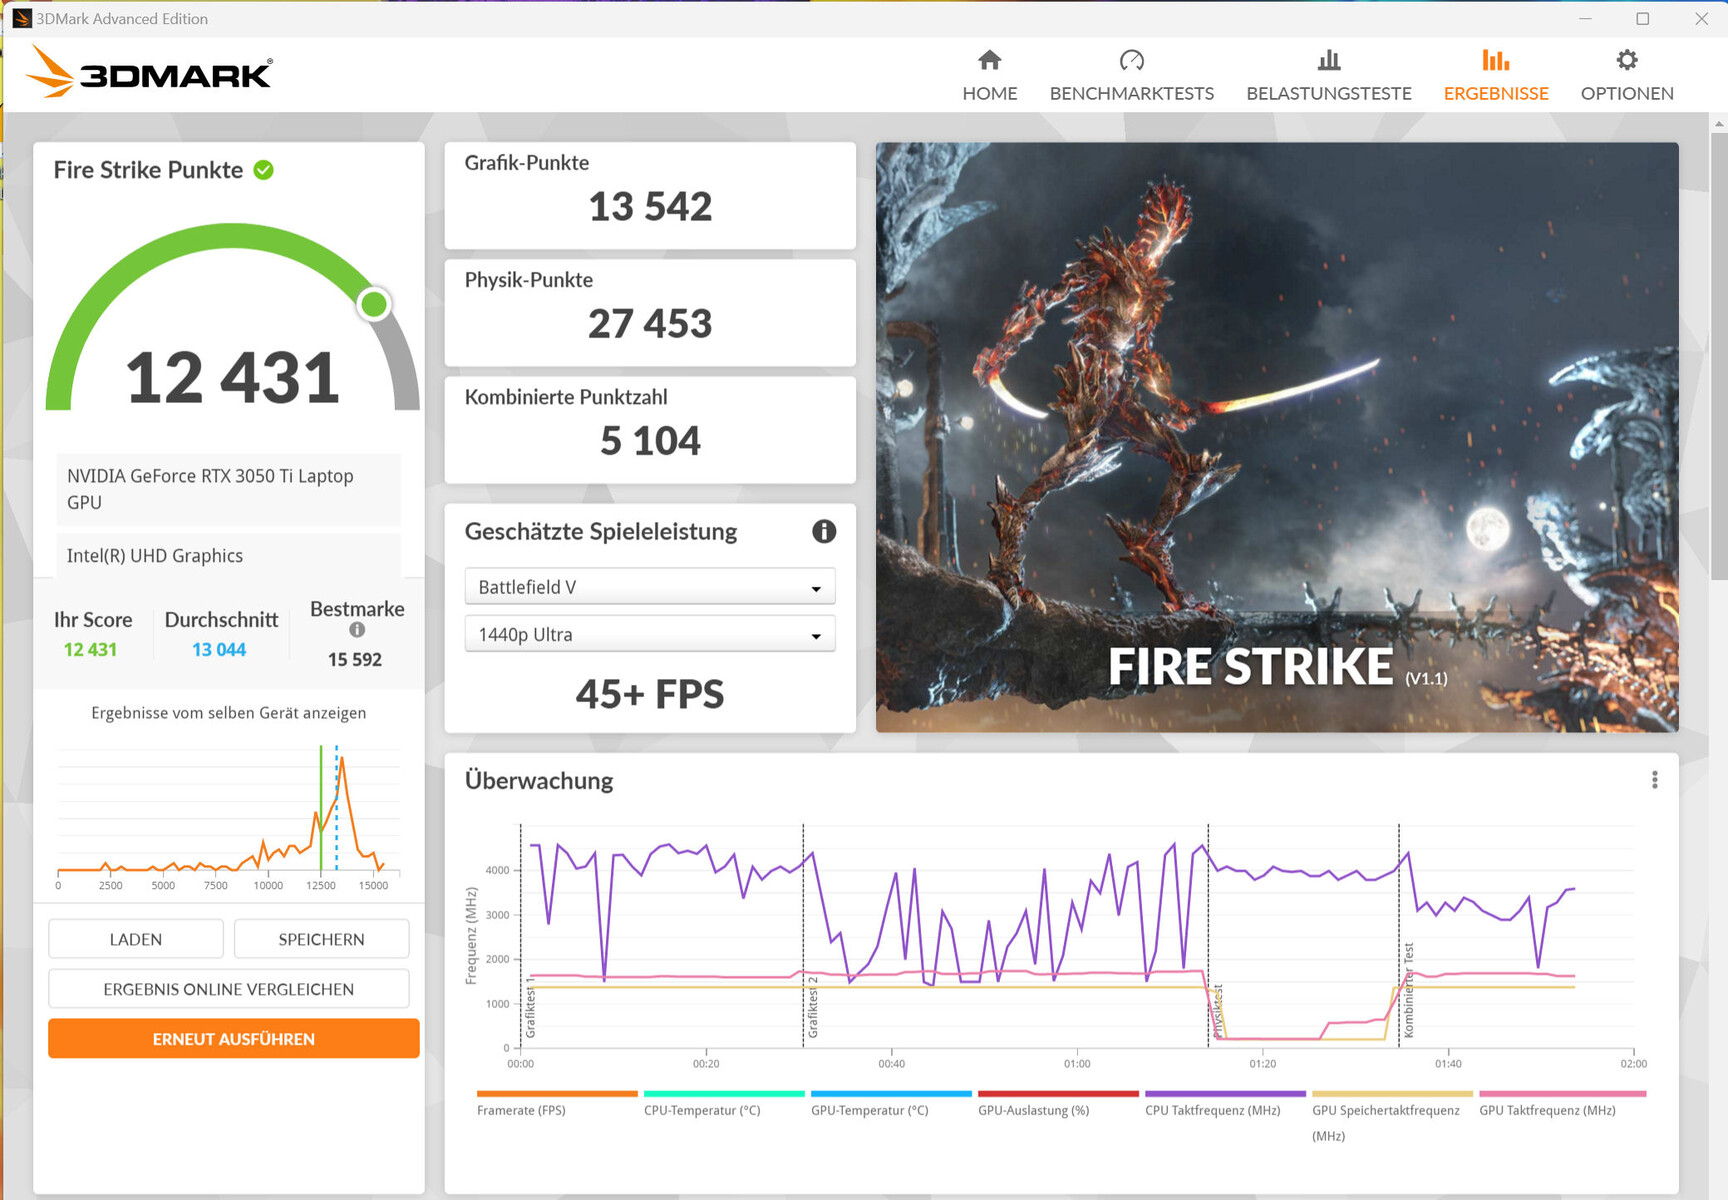
我们的基准测试和游戏测试显示 GeForce RTX 3050 Ti笔记本GPU(TGP:65瓦)的性能率略低于GPU的平均水平("标准模式")。使用 "性能模式 "导致10%至15%的速率 - 根据Witcher 3 测试,TGP已经耗尽。使用dGPU模式(通过MyAsus应用程序)导致性能没有提高。
该电脑允许使用低到高的设置进行FHD游戏,使用低到中的设置进行HD游戏(耳语模式)。后者将TGP降低到25瓦,这导致了更低的噪音排放。
| 3DMark 06 Standard Score | 45370 points | |
| 3DMark 11 Performance | 16180 points | |
| 3DMark Cloud Gate Standard Score | 45033 points | |
| 3DMark Fire Strike Score | 11448 points | |
| 3DMark Time Spy Score | 4969 points | |
Help | ||
| Geekbench 6.0 | |
| GPU Vulkan 6.0 | |
| Average of class Multimedia (n=1last 2 years) | |
| Asus VivoBook Pro 16 | |
| Average NVIDIA GeForce RTX 3050 Ti Laptop GPU (n=1) | |
| GPU OpenCL 6.0 | |
| Average of class Multimedia (n=1last 2 years) | |
| Asus VivoBook Pro 16 | |
| Average NVIDIA GeForce RTX 3050 Ti Laptop GPU (n=1) | |
| V-Ray Benchmark Next 4.10 | |
| GPU | |
| Schenker XMG Fusion 15 (Mid 22) (v4.10.07 ) | |
| Average of class Multimedia (32 - 1191, n=55, last 2 years) | |
| Average NVIDIA GeForce RTX 3050 Ti Laptop GPU (171 - 216, n=22) | |
| Asus VivoBook Pro 16 (v4.10.07 ) | |
| Acer Swift X SFX16-52G-77RX (v4.10.07 ) | |
| CPU | |
| Average of class Multimedia (4772 - 35165, n=55, last 2 years) | |
| Asus VivoBook Pro 16 (v4.10.07 ) | |
| Acer Swift X SFX16-52G-77RX (v4.10.07 ) | |
| Schenker XMG Fusion 15 (Mid 22) (v4.10.07 ) | |
| Average NVIDIA GeForce RTX 3050 Ti Laptop GPU (5796 - 16665, n=22) | |
* ... smaller is better
| The Witcher 3 - 1920x1080 Ultra Graphics & Postprocessing (HBAO+) | |
| Schenker XMG Fusion 15 (Mid 22) | |
| Dell Inspiron 16 Plus 7620 | |
| Average of class Multimedia (11 - 121, n=10, last 2 years) | |
| Average NVIDIA GeForce RTX 3050 Ti Laptop GPU (19 - 58.5, n=29) | |
| Asus VivoBook Pro 16 | |
| Acer Swift X SFX16-52G-77RX | |
| Final Fantasy XV Benchmark - 1920x1080 High Quality | |
| Schenker XMG Fusion 15 (Mid 22) (1.3) | |
| Average of class Multimedia (7.61 - 144.4, n=60, last 2 years) | |
| Dell Inspiron 16 Plus 7620 (1.3) | |
| Average NVIDIA GeForce RTX 3050 Ti Laptop GPU (23.5 - 106, n=24) | |
| Asus VivoBook Pro 16 (1.3) | |
| Acer Swift X SFX16-52G-77RX (1.3) | |
| Strange Brigade - 1920x1080 ultra AA:ultra AF:16 | |
| Schenker XMG Fusion 15 (Mid 22) (1.47.22.14 D3D12) | |
| Average of class Multimedia (13.3 - 303, n=60, last 2 years) | |
| Dell Inspiron 16 Plus 7620 (1.47.22.14 D3D12) | |
| Average NVIDIA GeForce RTX 3050 Ti Laptop GPU (34.8 - 101.3, n=25) | |
| Asus VivoBook Pro 16 (1.47.22.14 D3D12) | |
| Acer Swift X SFX16-52G-77RX (1.47.22.14 D3D12) | |
| Dota 2 Reborn - 1920x1080 ultra (3/3) best looking | |
| Dell Inspiron 16 Plus 7620 | |
| Schenker XMG Fusion 15 (Mid 22) | |
| Average NVIDIA GeForce RTX 3050 Ti Laptop GPU (67.3 - 145, n=27) | |
| Asus VivoBook Pro 16 | |
| Average of class Multimedia (29 - 179.9, n=62, last 2 years) | |
| Acer Swift X SFX16-52G-77RX | |
Witcher 3 FPS diagram
| low | med. | high | ultra | QHD | |
|---|---|---|---|---|---|
| GTA V (2015) | 175.1 | 170.9 | 111.9 | 53.8 | 39 |
| The Witcher 3 (2015) | 218.5 | 150.8 | 87.6 | 47.1 | |
| Dota 2 Reborn (2015) | 134.6 | 118.9 | 108.5 | 101.6 | |
| Final Fantasy XV Benchmark (2018) | 112.7 | 65 | 46.2 | 32 | |
| X-Plane 11.11 (2018) | 125.4 | 110.2 | 90.5 | ||
| Strange Brigade (2018) | 241 | 121.2 | 98.3 | 84.5 | 61 |
| Doom Eternal (2020) | 188.1 | 120 | |||
| Flight Simulator 2020 (2020) | 99 | 52.1 | 38.4 | 26.4 | 19.6 |
| F1 22 (2022) | 127.5 | 115.3 | 73.1 | 24.3 | 17.4 |
| FIFA 23 (2022) | 78.2 | ||||
| Uncharted Legacy of Thieves Collection (2022) | 48.4 | 30.5 | 20.6 | 20 | 14.1 |
| Call of Duty Modern Warfare 2 2022 (2022) | 63 | 58 | 44 | 36 | |
| Spider-Man Miles Morales (2022) | 66.6 | 53.6 | 44.8 | 36.8 | 26.3 |
| The Callisto Protocol (2022) | 82.5 | 62.2 | 58.3 | 31.7 | 21.4 |
| Need for Speed Unbound (2022) | 73.9 | 62.6 | 35.5 | 27.9 | 15.6 |
| High On Life (2023) | 104.7 | 77.5 | 60.3 | 50.8 | 31.8 |
| The Witcher 3 v4 (2023) | 88.4 | 75.6 | 36.8 | 32.4 | 19.6 |
| Dead Space Remake (2023) | 37.2 | 35.1 | 28.2 | 24.6 | 9.81 |
| Hogwarts Legacy (2023) | 63.9 | 50 | 40.2 | 32.8 | 25 |
| Returnal (2023) | 52 | 50 | 45 | 34 | 27 |
| Atomic Heart (2023) | 94.3 | 71.4 | 41.6 | 32.3 | 24.5 |
| Company of Heroes 3 (2023) | 106.2 | 91.1 | 68.4 | 68.5 | 48.8 |
| Sons of the Forest (2023) | 54.9 | 38.8 | 35.4 | 33.3 | 25.6 |
| Resident Evil 4 Remake (2023) | 74.6 | 47.4 | 41 | 8.97 | 7.82 |
| The Last of Us (2023) | 44.9 | 32.9 | 25.6 | ||
| Dead Island 2 (2023) | 95.7 | 75.7 | 64.1 | 58 | 45.9 |
| Star Wars Jedi Survivor (2023) | 36.9 | 31 | 28.9 | 25.8 | 15.4 |
排放与功率 - 华硕电脑的噪音很大
噪声排放
在空闲模式以及日常使用中(办公室、互联网),笔记本电脑一般都能安静地工作--有时甚至无声无息。在满负荷状态下,我们测得的噪音高达61.5 dB(A)("性能模式")--太高了。使用 "标准模式 "可以使噪音与性能的比例更加平衡--即便如此,冷却器还是会发出相当大的噪音。
"低音模式 "可能是大多数用户的首选--它完全做到了它所描述的那样。 风扇以低速运行,即使在负载时也几乎听不到--以牺牲处理能力为代价。游戏仍然是可能的,但只是在高清状态下。
Noise level
| Idle |
| 25.2 / 25.2 / 25.2 dB(A) |
| Load |
| 55.1 / 61.5 dB(A) |
 | ||
30 dB silent 40 dB(A) audible 50 dB(A) loud |
||
min: | ||
| Asus VivoBook Pro 16 GeForce RTX 3050 Ti Laptop GPU, i7-12700H, Intel SSD 670p SSDPEKNU010TZ | Dell Inspiron 16 Plus 7620 GeForce RTX 3050 Ti Laptop GPU, i7-12700H, Kioxia BG5 KBG50ZNS512G | Schenker XMG Fusion 15 (Mid 22) GeForce RTX 3070 Laptop GPU, i7-11800H, Samsung SSD 980 Pro 1TB MZ-V8P1T0BW | Acer Swift X SFX16-52G-77RX A370M, i7-1260P, WDC PC SN810 1TB | |
|---|---|---|---|---|
| Noise | 3% | 0% | 8% | |
| off / environment * (dB) | 25.2 | 23.3 8% | 26 -3% | 25 1% |
| Idle Minimum * (dB) | 25.2 | 25.7 -2% | 26 -3% | 25 1% |
| Idle Average * (dB) | 25.2 | 26.1 -4% | 28 -11% | 25 1% |
| Idle Maximum * (dB) | 25.2 | 30.6 -21% | 31 -23% | 25 1% |
| Load Average * (dB) | 55.1 | 46.2 16% | 45 18% | 44.7 19% |
| Load Maximum * (dB) | 61.5 | 49.4 20% | 48 22% | 45.6 26% |
| Witcher 3 ultra * (dB) | 49.2 | 46 |
* ... smaller is better
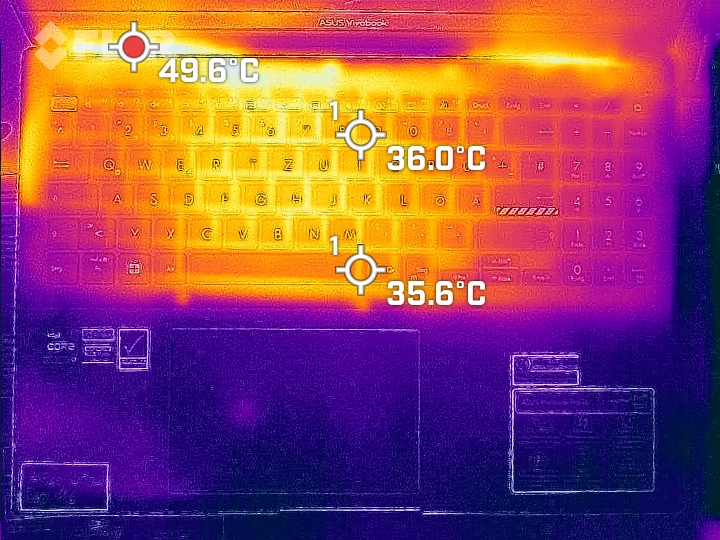
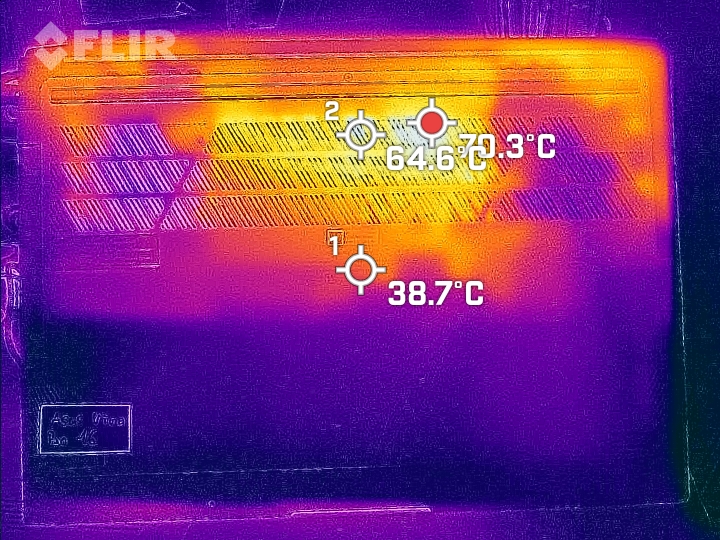
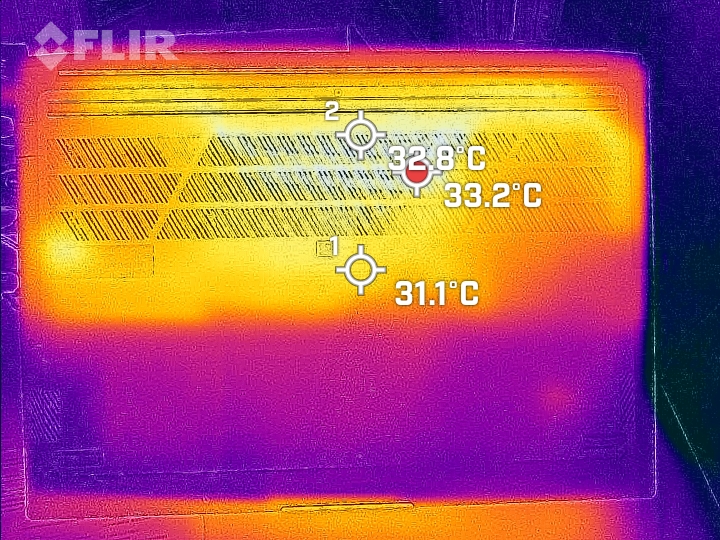
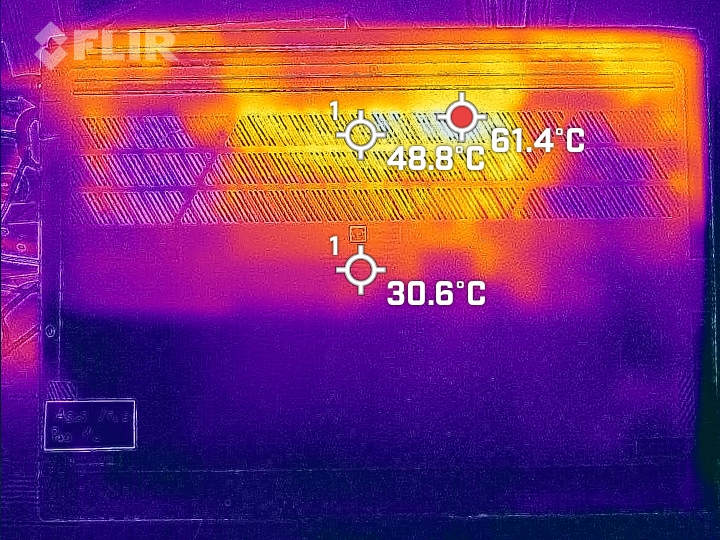
温度
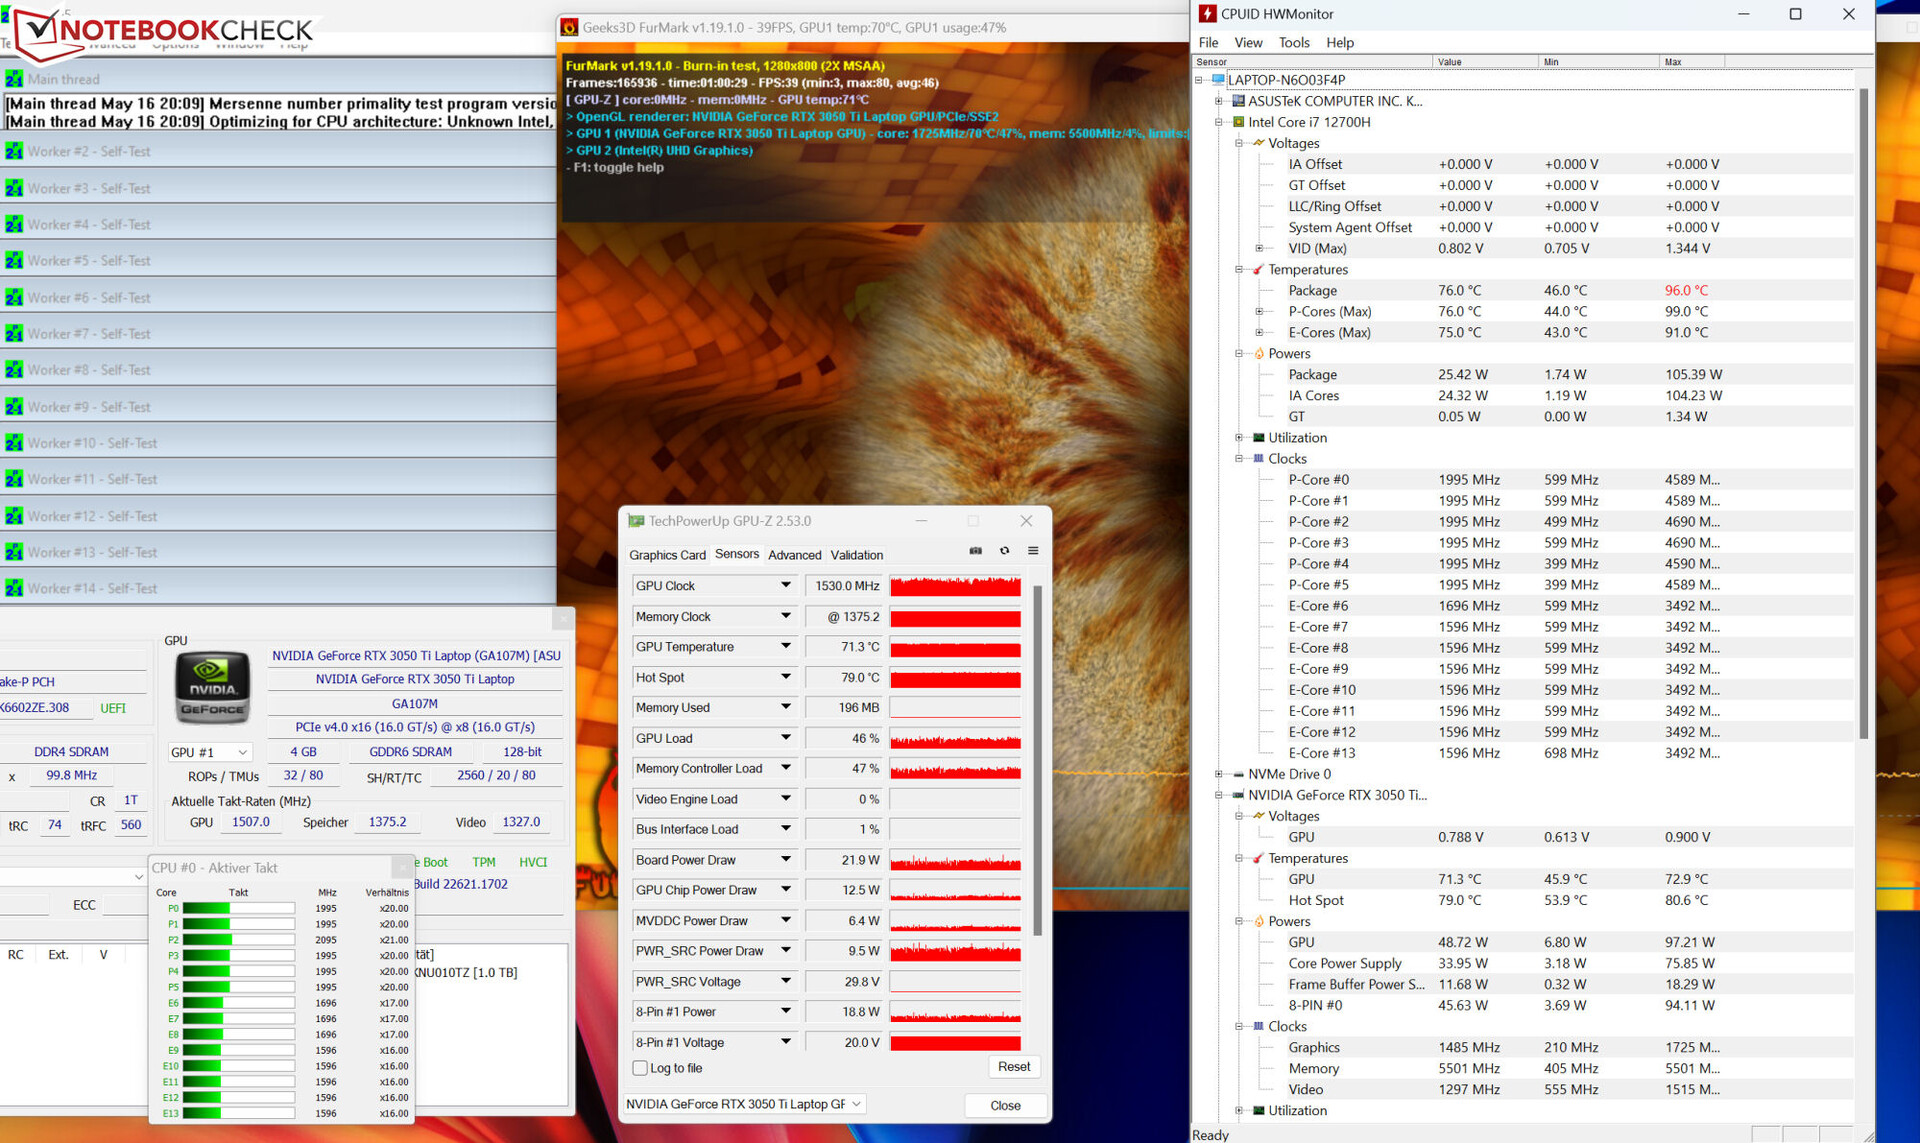
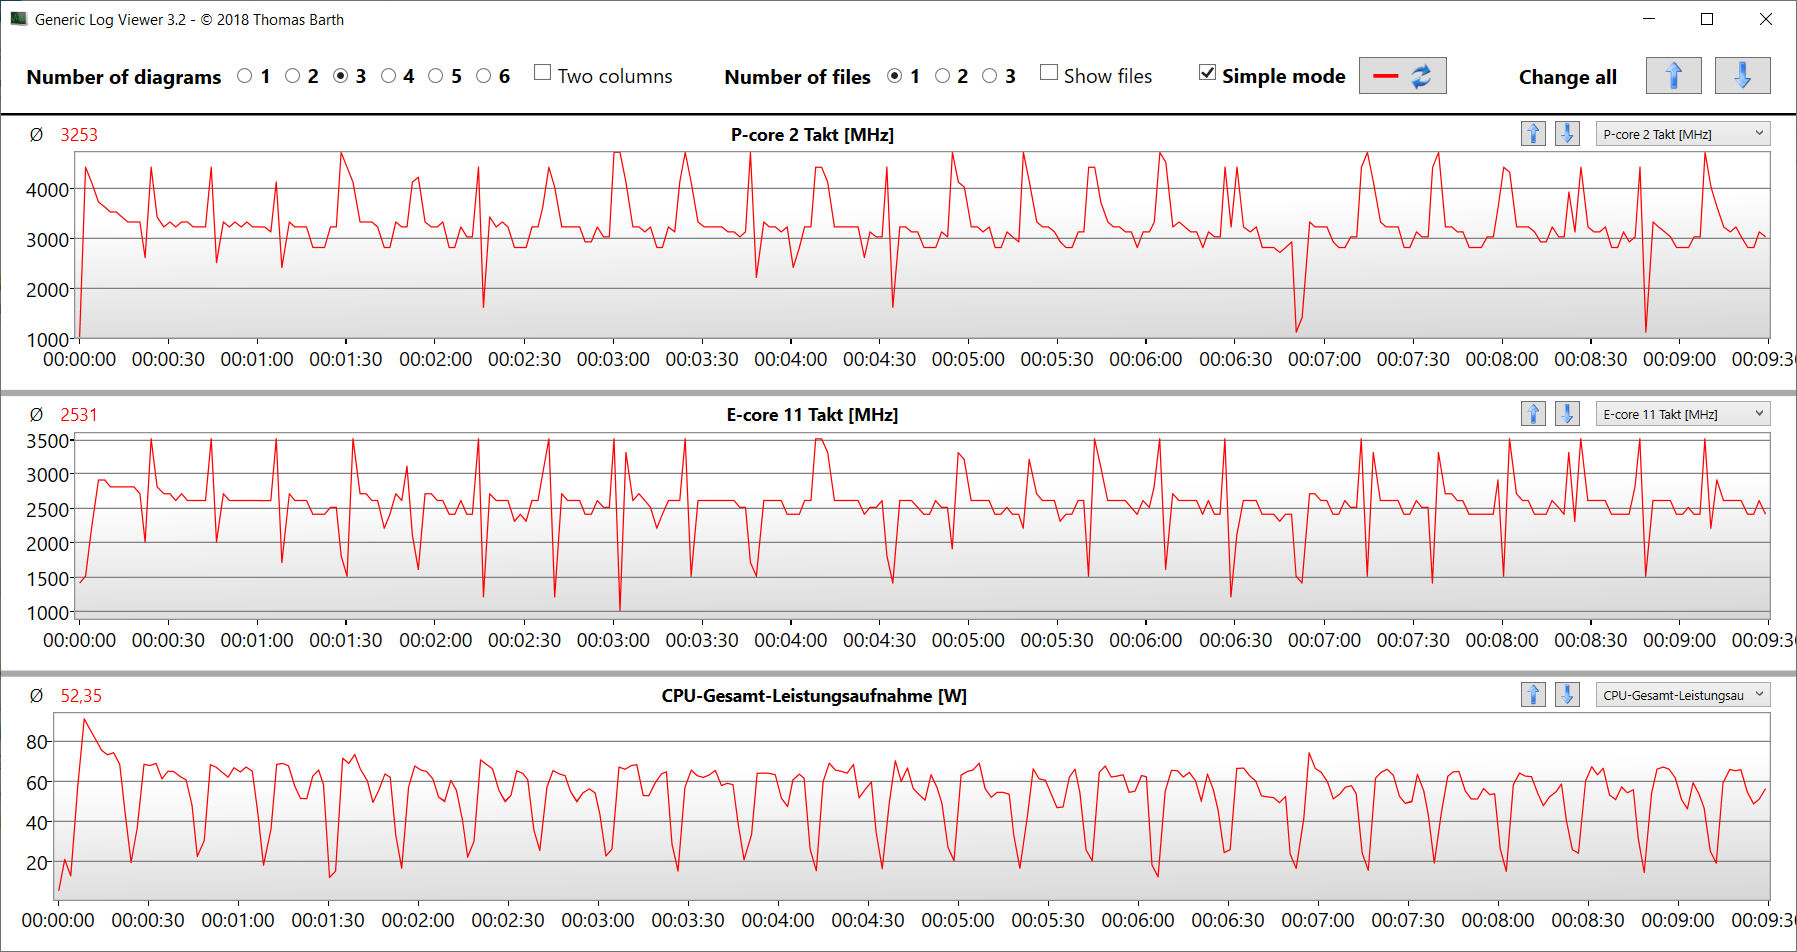
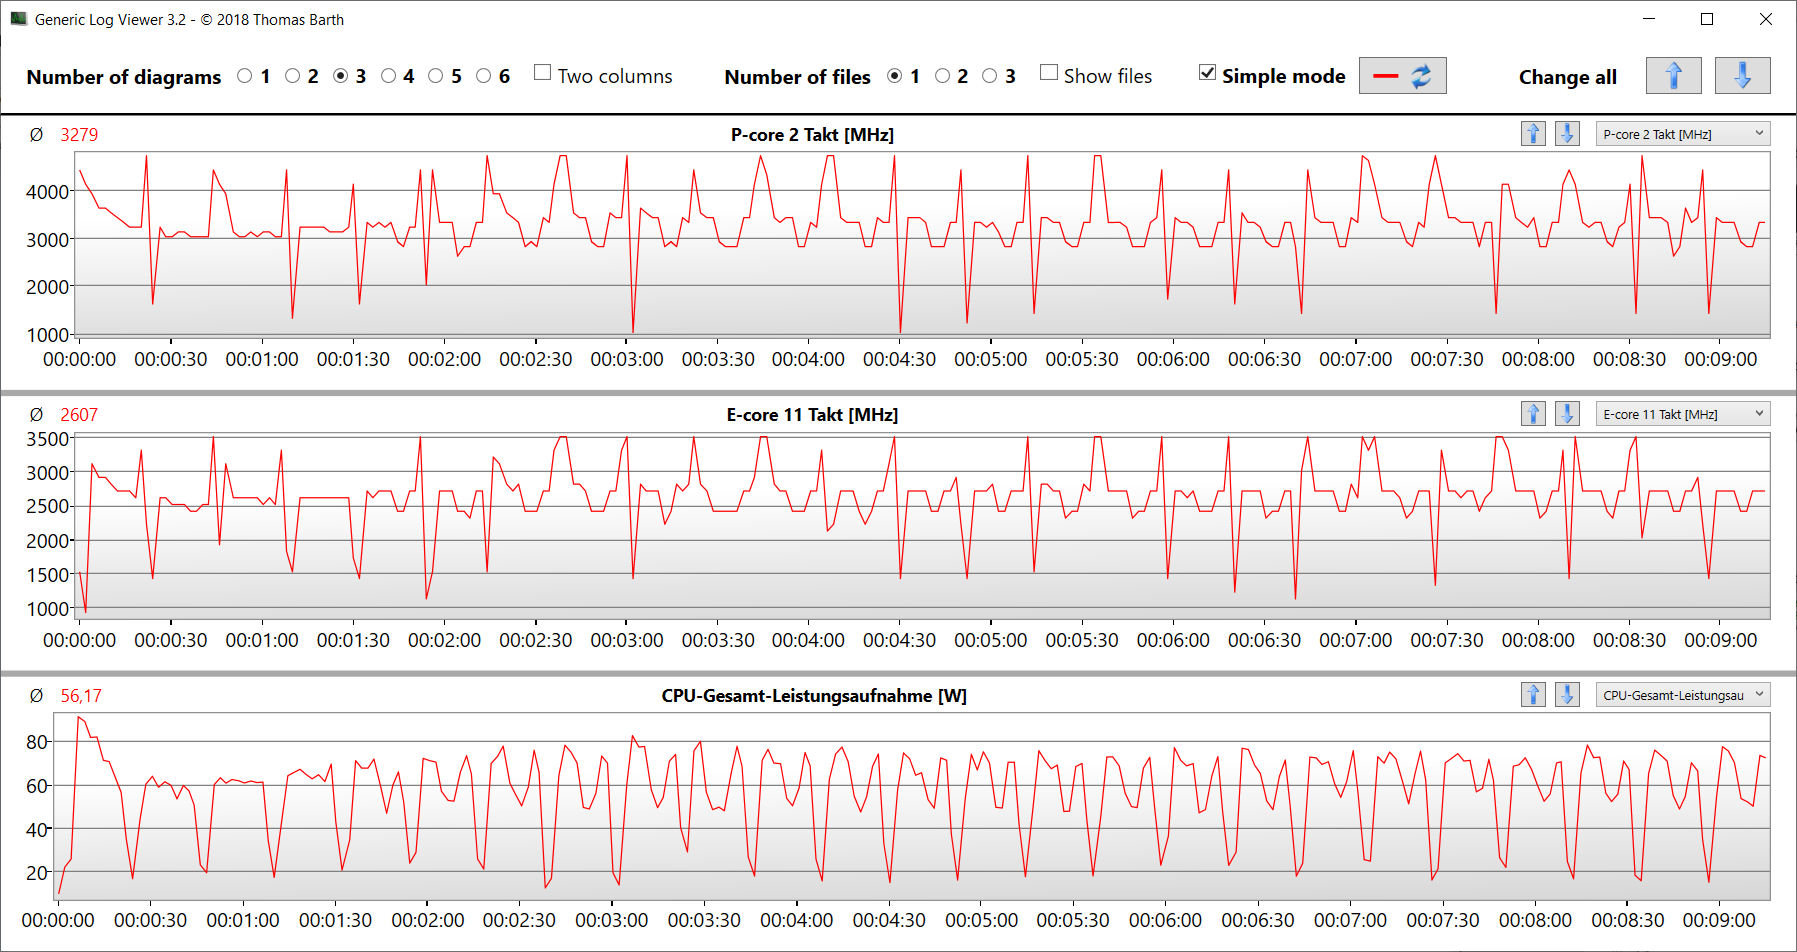
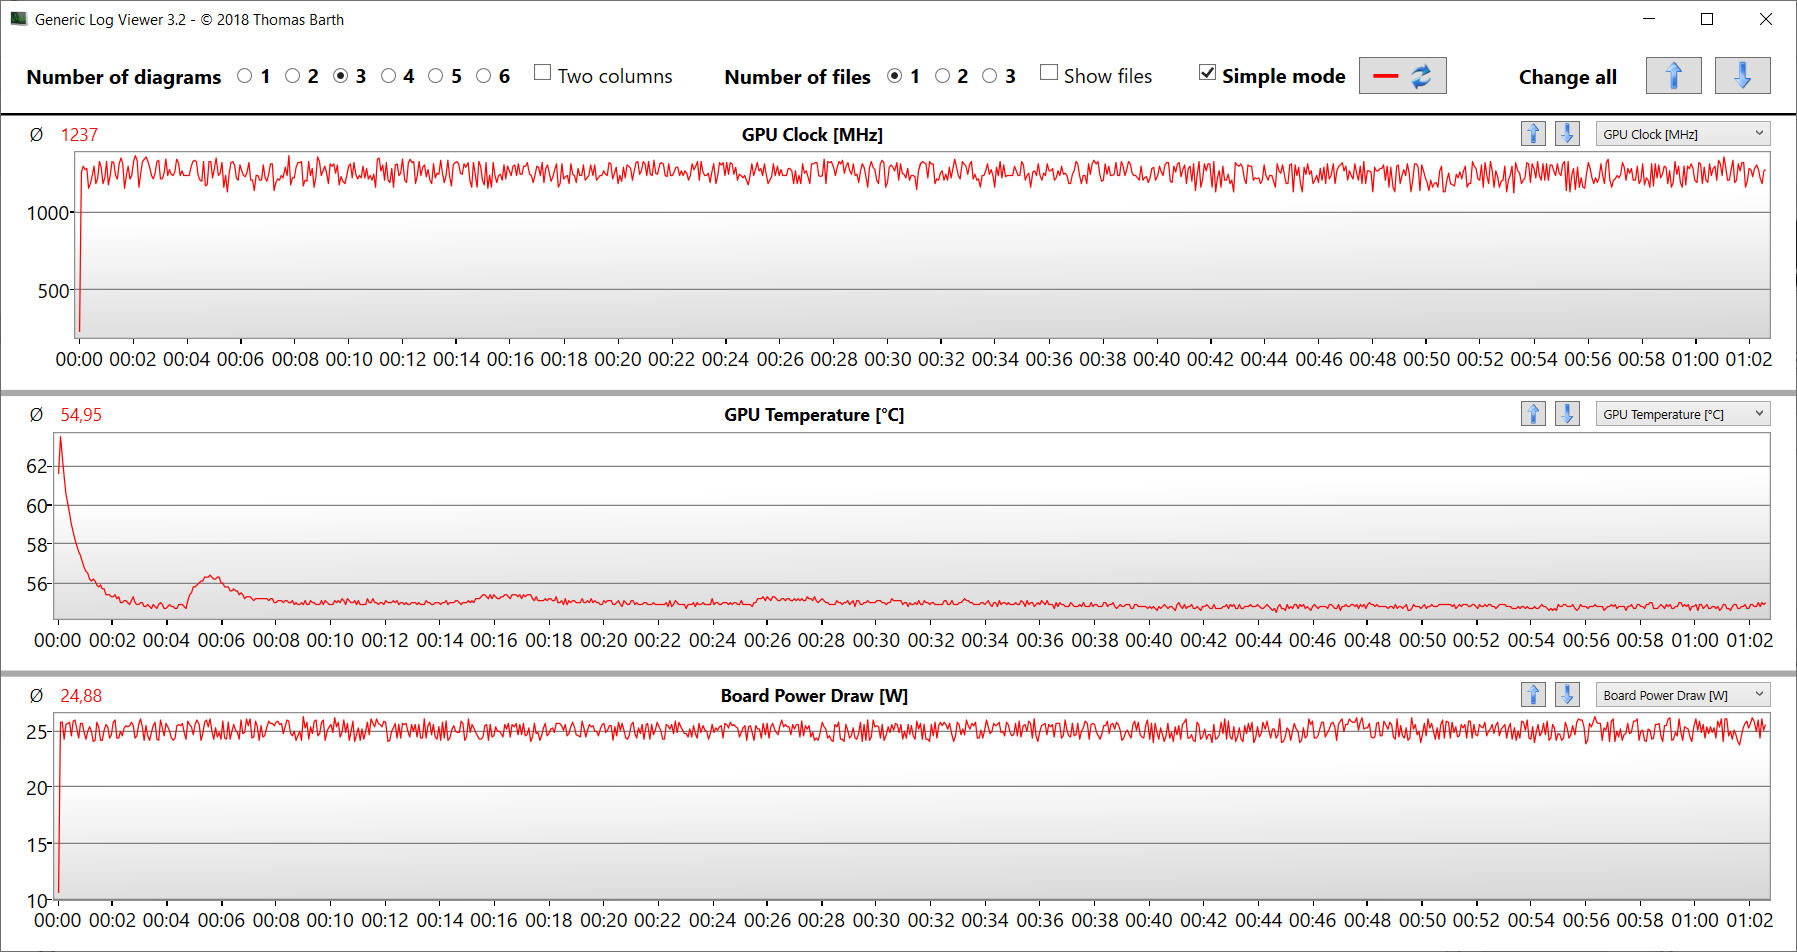
在负载情况下,笔记本电脑确实达到了相当高的温度,但平均而言其温度达到了中等水平。这意味着我们在压力测试中测得的最高温度为55.5℃。然而,在日常使用中,温度通常在可接受的范围内。
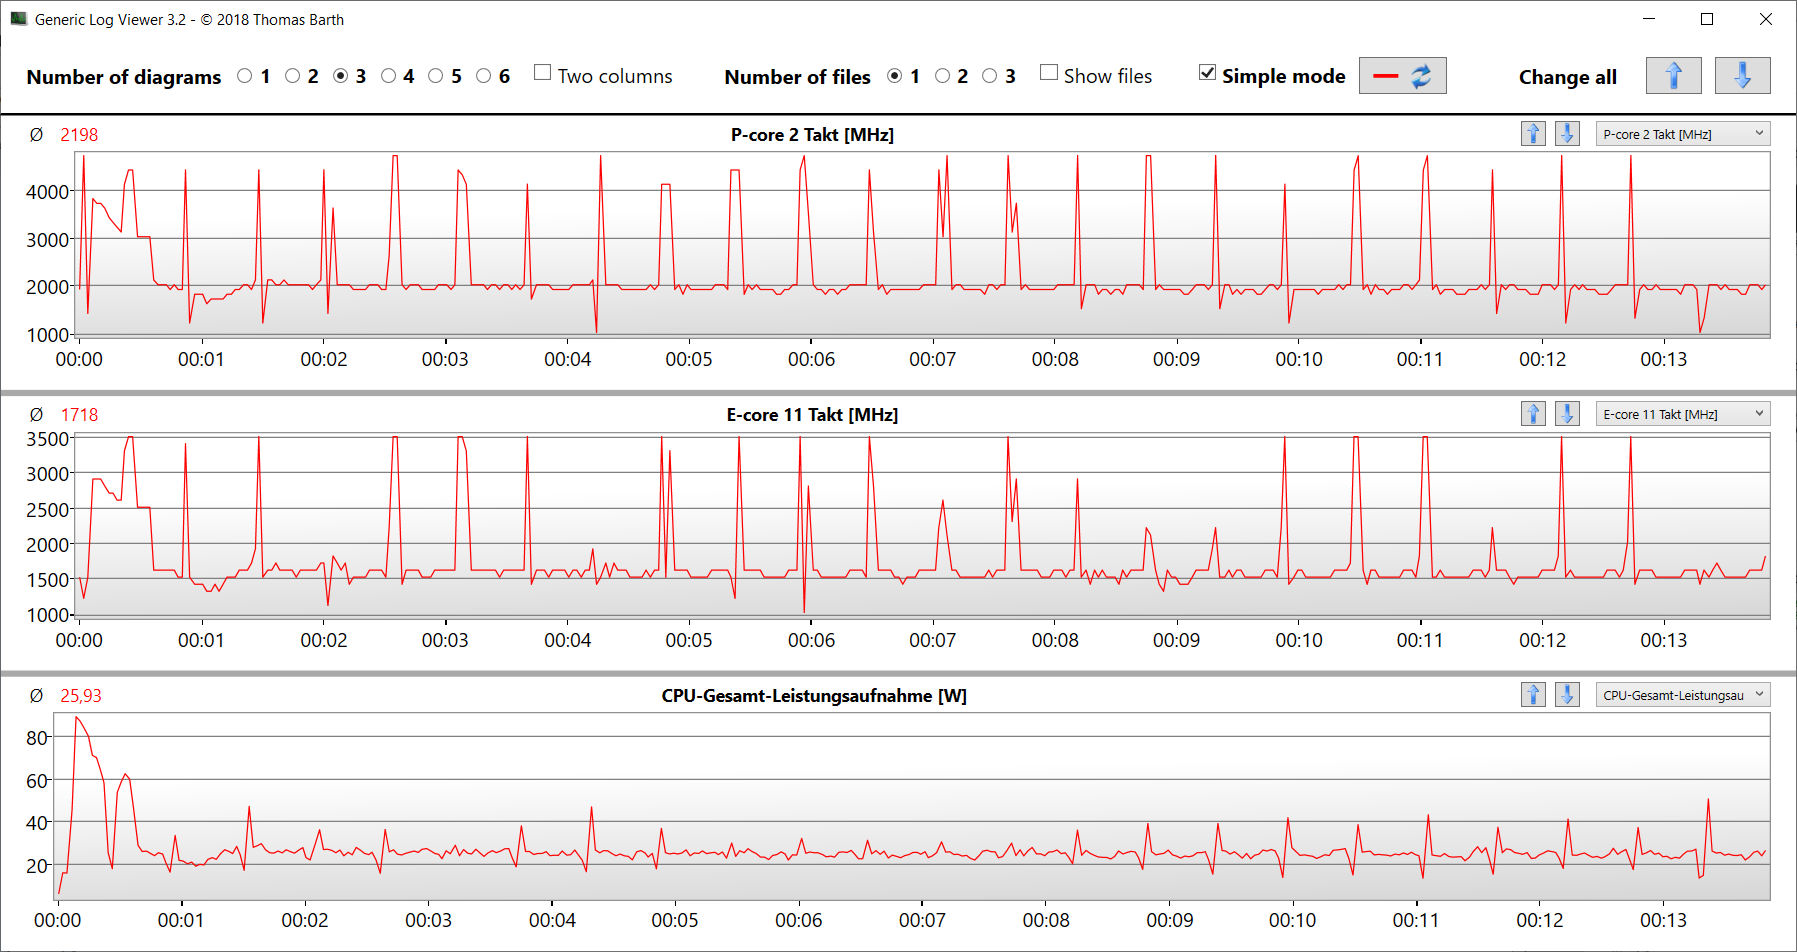
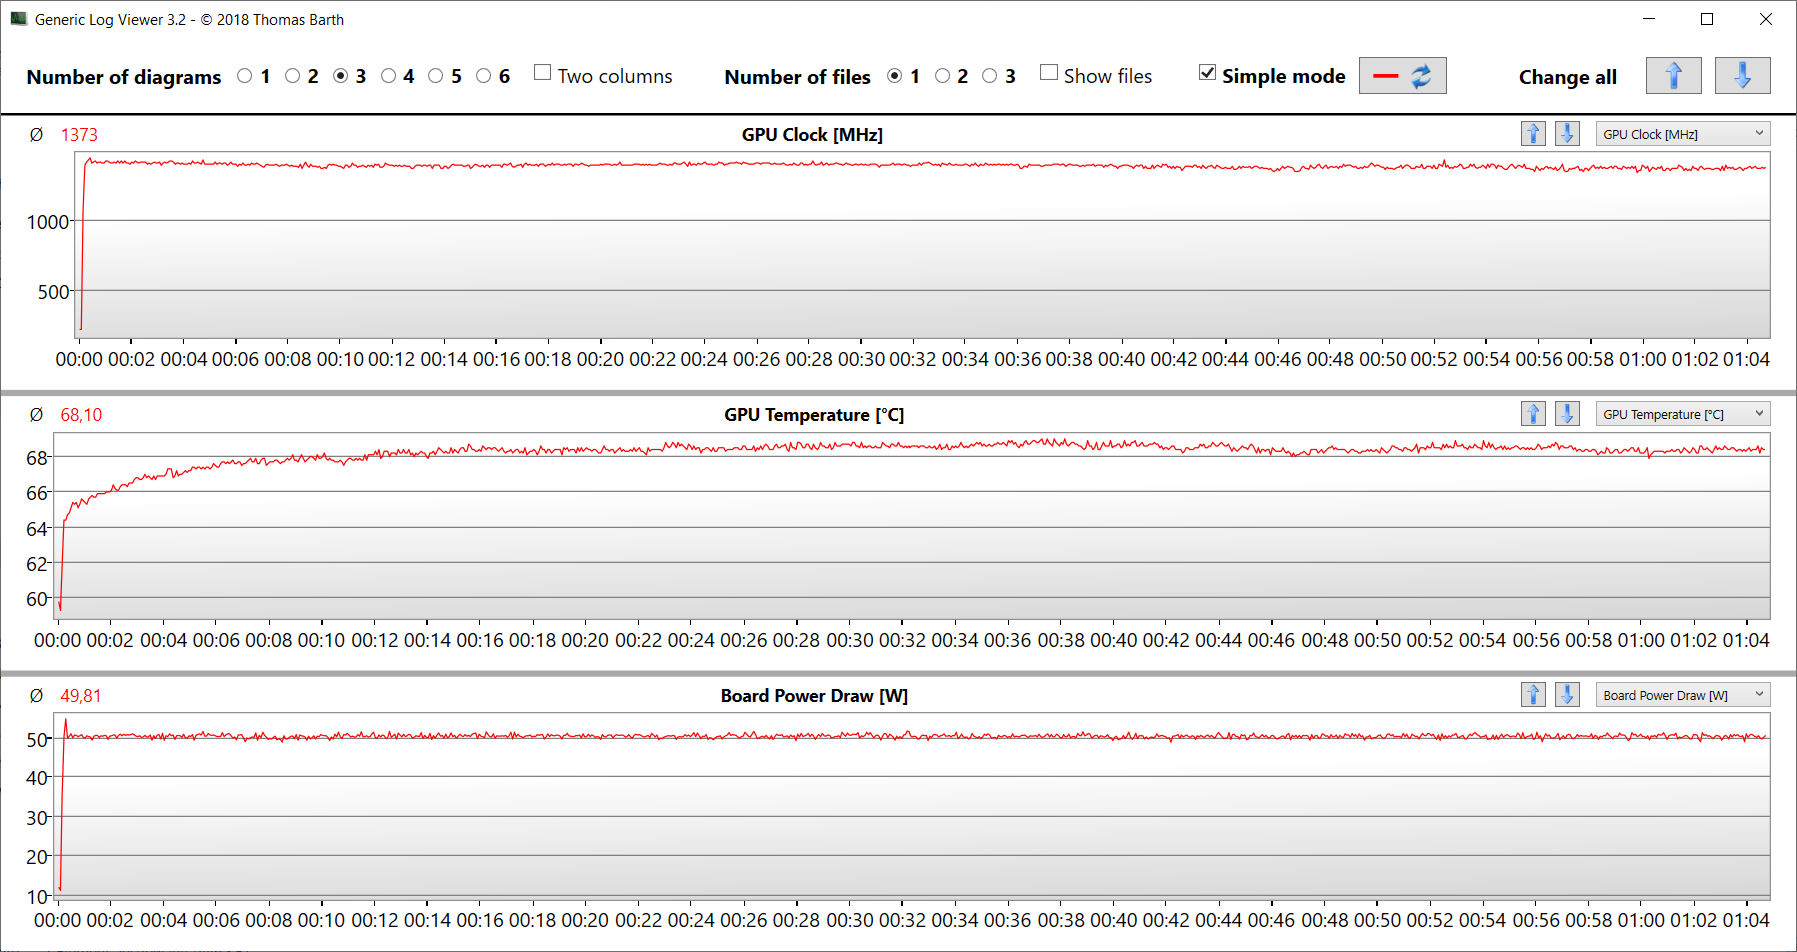
压力测试(连续使用Prime95和Furmark)模拟了一个极端情况,以测试系统在全负荷下的稳定性。在压力测试中,CPU以平均时钟速率开始(P:3.2 - 3.3 GHz;E:2.7 GHz),图形核心的速率为1.1 - 1.4 GHz。虽然CPU的速率在测试过程中下降了,但GPU的时钟速率却上升了一点儿。
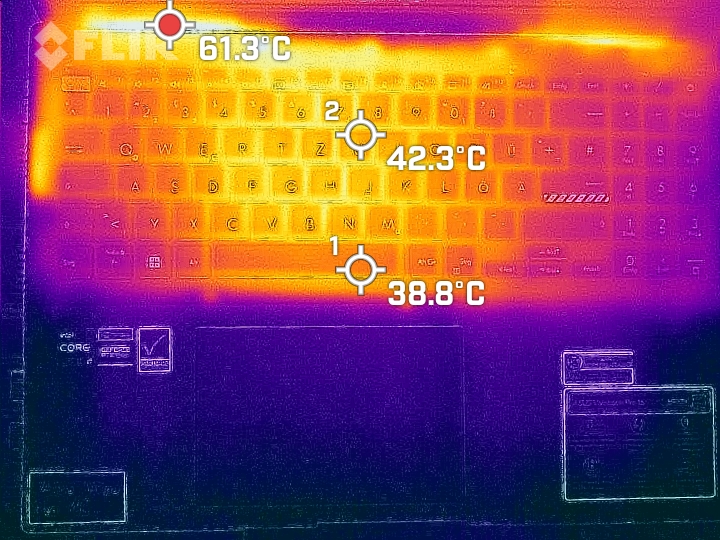
(±) The maximum temperature on the upper side is 44.2 °C / 112 F, compared to the average of 36.8 °C / 98 F, ranging from 21 to 71 °C for the class Multimedia.
(-) The bottom heats up to a maximum of 53 °C / 127 F, compared to the average of 39.1 °C / 102 F
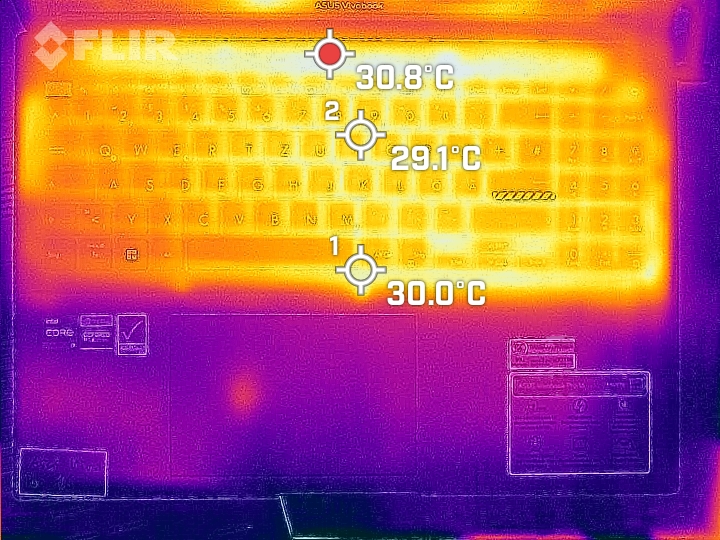
(+) In idle usage, the average temperature for the upper side is 27.9 °C / 82 F, compared to the device average of 31.3 °C / 88 F.
(±) Playing The Witcher 3, the average temperature for the upper side is 33.3 °C / 92 F, compared to the device average of 31.3 °C / 88 F.
(+) The palmrests and touchpad are cooler than skin temperature with a maximum of 23.7 °C / 74.7 F and are therefore cool to the touch.
(+) The average temperature of the palmrest area of similar devices was 28.7 °C / 83.7 F (+5 °C / 9 F).
| Asus VivoBook Pro 16 Intel Core i7-12700H, NVIDIA GeForce RTX 3050 Ti Laptop GPU | Dell Inspiron 16 Plus 7620 Intel Core i7-12700H, NVIDIA GeForce RTX 3050 Ti Laptop GPU | Schenker XMG Fusion 15 (Mid 22) Intel Core i7-11800H, NVIDIA GeForce RTX 3070 Laptop GPU | Acer Swift X SFX16-52G-77RX Intel Core i7-1260P, Intel Arc A370M | |
|---|---|---|---|---|
| Heat | 10% | -13% | 3% | |
| Maximum Upper Side * (°C) | 44.2 | 46 -4% | 52 -18% | 49.4 -12% |
| Maximum Bottom * (°C) | 53 | 45.8 14% | 63 -19% | 55.5 -5% |
| Idle Upper Side * (°C) | 32.1 | 29.2 9% | 37 -15% | 28.4 12% |
| Idle Bottom * (°C) | 38.4 | 31 19% | 38 1% | 32.6 15% |
* ... smaller is better
发言人
立体声扬声器产生了体面的声音,但几乎没有任何低音。
Asus VivoBook Pro 16 audio analysis
(+) | speakers can play relatively loud (88.5 dB)
Bass 100 - 315 Hz
(-) | nearly no bass - on average 20.8% lower than median
(±) | linearity of bass is average (12.8% delta to prev. frequency)
Mids 400 - 2000 Hz
(+) | balanced mids - only 2.2% away from median
(+) | mids are linear (4.7% delta to prev. frequency)
Highs 2 - 16 kHz
(±) | higher highs - on average 7.4% higher than median
(+) | highs are linear (5.9% delta to prev. frequency)
Overall 100 - 16.000 Hz
(±) | linearity of overall sound is average (16.2% difference to median)
Compared to same class
» 41% of all tested devices in this class were better, 7% similar, 51% worse
» The best had a delta of 5%, average was 17%, worst was 45%
Compared to all devices tested
» 26% of all tested devices were better, 6% similar, 68% worse
» The best had a delta of 4%, average was 23%, worst was 134%
Dell Inspiron 16 Plus 7620 audio analysis
(+) | speakers can play relatively loud (87.8 dB)
Bass 100 - 315 Hz
(-) | nearly no bass - on average 22.2% lower than median
(±) | linearity of bass is average (9.7% delta to prev. frequency)
Mids 400 - 2000 Hz
(+) | balanced mids - only 3.3% away from median
(+) | mids are linear (5.3% delta to prev. frequency)
Highs 2 - 16 kHz
(+) | balanced highs - only 2.5% away from median
(+) | highs are linear (4.7% delta to prev. frequency)
Overall 100 - 16.000 Hz
(+) | overall sound is linear (13.4% difference to median)
Compared to same class
» 28% of all tested devices in this class were better, 5% similar, 68% worse
» The best had a delta of 5%, average was 17%, worst was 45%
Compared to all devices tested
» 14% of all tested devices were better, 4% similar, 82% worse
» The best had a delta of 4%, average was 23%, worst was 134%
消耗功率
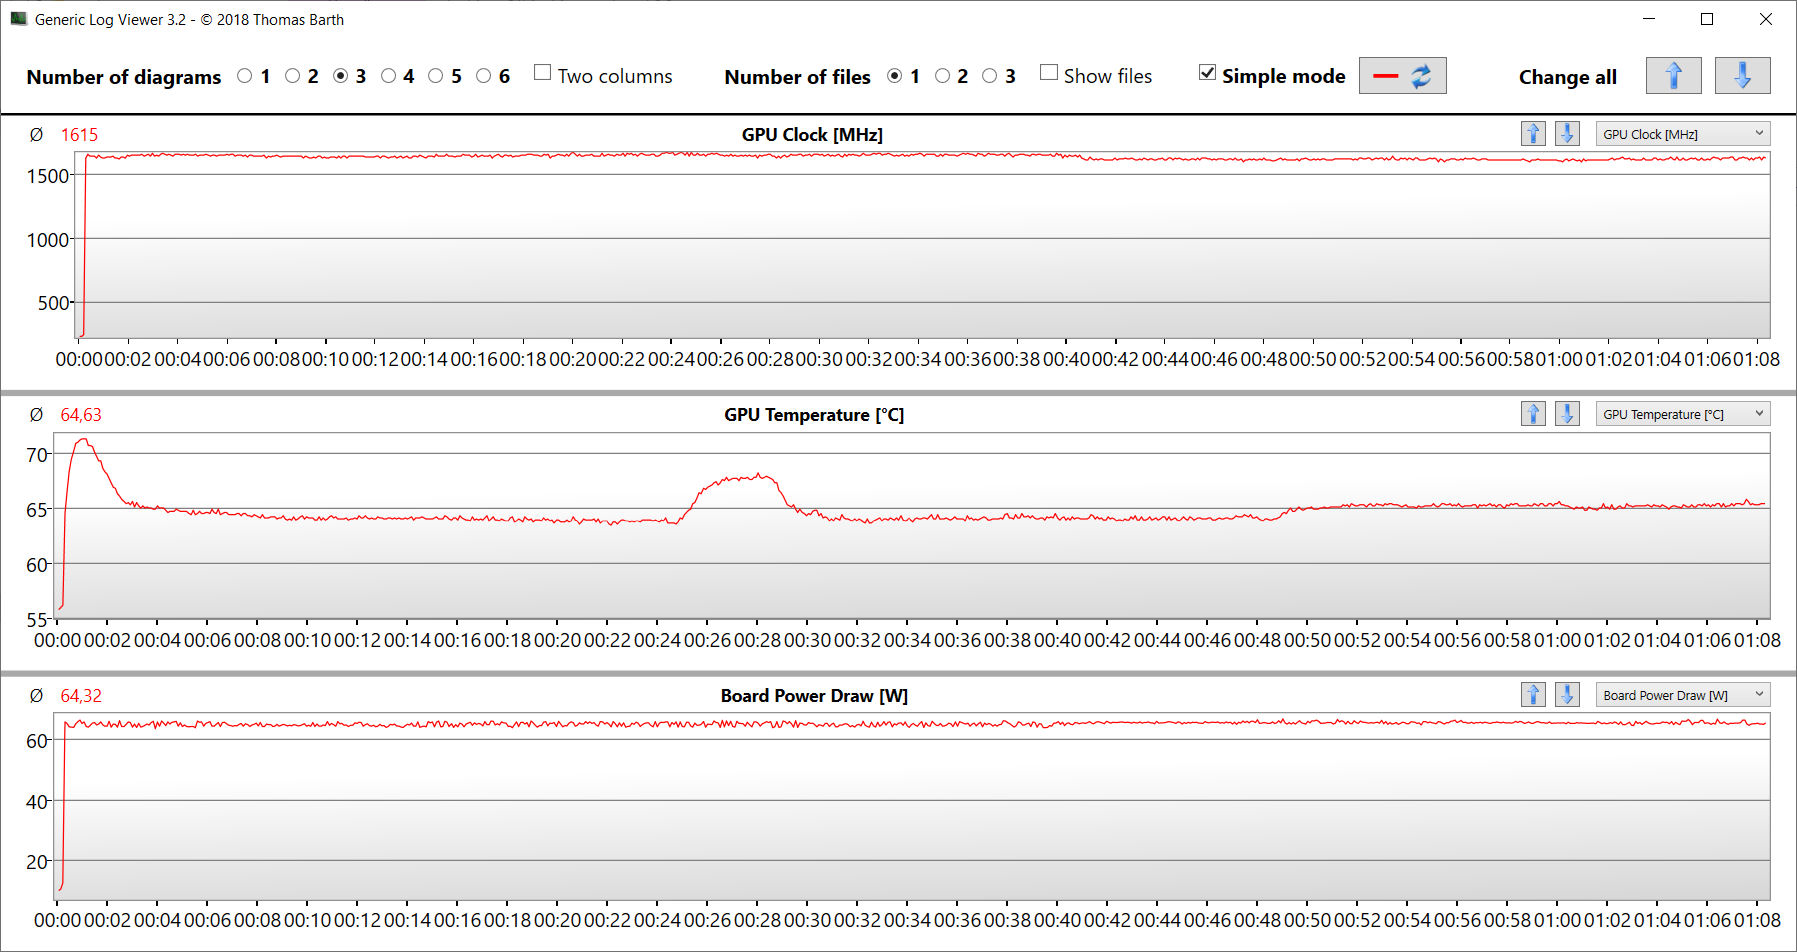
笔记本电脑没有显示任何明显的能源消耗率。我们测量的数值对于所安装的硬件来说处于正常水平。Witcher 3 测试是在恒定功耗下进行的。它的电源(150瓦)的大小足够了。
| Off / Standby | |
| Idle | |
| Load |
|
Key:
min: | |
| Asus VivoBook Pro 16 i7-12700H, GeForce RTX 3050 Ti Laptop GPU, Intel SSD 670p SSDPEKNU010TZ, IPS, 2560x1600, 16" | Dell Inspiron 16 Plus 7620 i7-12700H, GeForce RTX 3050 Ti Laptop GPU, Kioxia BG5 KBG50ZNS512G, IPS, 3072x1920, 16" | Schenker XMG Fusion 15 (Mid 22) i7-11800H, GeForce RTX 3070 Laptop GPU, Samsung SSD 980 Pro 1TB MZ-V8P1T0BW, IPS, 2560x1440, 15.6" | Acer Swift X SFX16-52G-77RX i7-1260P, A370M, WDC PC SN810 1TB, IPS-LED, 2560x1600, 16" | Average NVIDIA GeForce RTX 3050 Ti Laptop GPU | Average of class Multimedia | |
|---|---|---|---|---|---|---|
| Power Consumption | 12% | -26% | 42% | 10% | 32% | |
| Idle Minimum * (Watt) | 8.7 | 6.8 22% | 12 -38% | 3.7 57% | 8.2 ? 6% | 5.72 ? 34% |
| Idle Average * (Watt) | 13.1 | 9.6 27% | 17 -30% | 7.6 42% | 12.6 ? 4% | 10.2 ? 22% |
| Idle Maximum * (Watt) | 18.3 | 17 7% | 24 -31% | 11.1 39% | 17.2 ? 6% | 12.4 ? 32% |
| Load Average * (Watt) | 116 | 117.5 -1% | 106 9% | 70 40% | 92 ? 21% | 65.5 ? 44% |
| Witcher 3 ultra * (Watt) | 117.6 | 113.1 4% | 159.9 -36% | 68.8 41% | ||
| Load Maximum * (Watt) | 162 | 137.4 15% | 208 -28% | 108 33% | 139.1 ? 14% | 114 ? 30% |
* ... smaller is better
power consumption Witcher 3 / stress test
Power consumption with external monitor
电池寿命
在我们的实际WLAN测试中,这台16英寸笔记本电脑的运行时间为7:14小时(通过脚本调用网站时的负载映射)--这是一个体面的,但不是了不起的价值。在比较领域中,VivoBook排在最后。
Pros
Cons
评语 - 一个拥有令人印象深刻的屏幕的多媒体全能型产品
视频和照片编辑、流媒体、渲染和游戏:这些都属于VivoBook Pro 16的核心优势。它的酷睿7-12700H和GeForce RTX 3050 Ti Laptop提供所有必要的动力--这两个组件始终以高时钟速率运行。虽然,它并没有完全发挥其潜力,因为内存只在单通道模式下运行。
华硕的VivoBook Pro 16是一款适合游戏玩家和不太重视拥有最新硬件的创作者的笔记本电脑。
笔记本电脑在负载时只发热一点,但会变得很吵,甚至太吵。一个积极因素:该设备提供了一个耳语模式,可以降低笔记本电脑产生的噪音,而牺牲其性能--这至少可以让人更轻松地工作。
其紧凑的结构、相对较小的重量(1.9公斤)和不错的运行时间(WLAN:7:15小时),使VivoBook成为一款移动设备。一个积极因素:电池可以用USB-C电源充电(最小65瓦,20伏)--两个USB-C端口都支持电源传输。你不必继续使用附带的专有电源。
我们的测试样本没有OLED屏幕,但在VivoBook Pro 16系列内一般都有。你不应该错过它:安装的IPS屏幕(16英寸,2,560 x 1,600像素)采用16:10格式,其亮度、良好的对比度、稳定的可视角度、短的反应时间、出色的色彩描绘和出色的色彩空间覆盖率给人留下深刻印象。
另外,你也可以看一下戴尔 Inspiron 16 Plus 7620:它的性能相当,但运行时间要好得多。一个经济实惠的选择是Acer Swift X 16它的图形性能较低--但它可以提供非常好的运行时间,价格约为1,000美元。
价格和可用性
我们测试的华硕VivoBook Pro 16的版本可以在亚马逊上购买,价格为1247美元。
Asus VivoBook Pro 16
- 05/22/2023 v7 (old)
Sascha Mölck
Transparency
The selection of devices to be reviewed is made by our editorial team. The test sample was provided to the author as a loan by the manufacturer or retailer for the purpose of this review. The lender had no influence on this review, nor did the manufacturer receive a copy of this review before publication. There was no obligation to publish this review. As an independent media company, Notebookcheck is not subjected to the authority of manufacturers, retailers or publishers.
This is how Notebookcheck is testing
Every year, Notebookcheck independently reviews hundreds of laptops and smartphones using standardized procedures to ensure that all results are comparable. We have continuously developed our test methods for around 20 years and set industry standards in the process. In our test labs, high-quality measuring equipment is utilized by experienced technicians and editors. These tests involve a multi-stage validation process. Our complex rating system is based on hundreds of well-founded measurements and benchmarks, which maintains objectivity. Further information on our test methods can be found here.
Price comparison

