


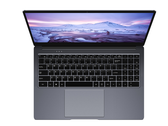
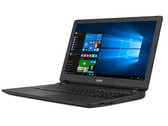
$440的4K笔记本:Chuwi LapBook Plus评测
它具有1000美元的Ultrabook的外观,但只有100美元的上网本的性能。有一个很好的理由使您在市场上看不到很多配备4K UHD显示屏的Intel Atom笔记本电脑。它们实在很不平衡。
Intel Atom x7-E3950, HD Graphics 505, 15.6", 1.5 kg英特尔高清显卡500是Apollo Lake架构处理器搭配的图形处理器单元(如奔腾N4200),在2016年年中发布。这块显卡主要特性为较低的功耗,但表现较弱,远远无法满足最新游戏的要求。作为部分采用Apollo Lake架构的显卡,高清显卡505配有18个执行单元(EU),运行频率最高可达750MHz。这款显卡的技术规格基于英特尔第9代架构,它也用于更高端的SKYLAKE架构系列处理器。
由于缺乏专用显存或eDRAM缓存,HD 500需经由处理器访问主内存(2个64位DDR3L- / LPDDR3-1866,LPDDR4-2400)。
性能
高清显卡500应该比较老的酷睿M的高清显卡 5300稍慢,所以最新游戏(2016年)即使是最低设置下也将几乎无法在流畅运行。
特性
改进后的视频引擎现在可以更加高效地硬件解码H.265 / HEVC。最多三个显示器可以通过 DP/eDP或HDMI(通过HDMI 1.4 4K可能只能达到30赫兹)连接。
功耗
整个赛扬N3450芯片的热设计功率默认是6瓦,因此该显卡主要用于(通常采用被动冷却)上网本或轻薄笔记本。它的TDP也可以减少到4瓦,但是这显然会影响性能。
Gen. 9 Series
| |||||||||||||||||||||||||||||||||||||||||||
| Codename | Apollo Lake | ||||||||||||||||||||||||||||||||||||||||||
| Architecture | Gen. 9 Apollo Lake | ||||||||||||||||||||||||||||||||||||||||||
| iGPU | Integrated Graphics | ||||||||||||||||||||||||||||||||||||||||||
| Pipelines | 18 - unified | ||||||||||||||||||||||||||||||||||||||||||
| Core Speed | 300 - 750 (Boost) MHz | ||||||||||||||||||||||||||||||||||||||||||
| Memory Bus Width | 64/128 Bit | ||||||||||||||||||||||||||||||||||||||||||
| Shared Memory | yes | ||||||||||||||||||||||||||||||||||||||||||
| API | DirectX 12_1, OpenGL 4.4 | ||||||||||||||||||||||||||||||||||||||||||
| Man. Technology | 14 nm | ||||||||||||||||||||||||||||||||||||||||||
| Features | QuickSync | ||||||||||||||||||||||||||||||||||||||||||
| Date of Announcement | 01.09.2016 | ||||||||||||||||||||||||||||||||||||||||||
| ||||||||||||||||
The following benchmarks stem from our benchmarks of review laptops. The performance depends on the used graphics memory, clock rate, processor, system settings, drivers, and operating systems. So the results don't have to be representative for all laptops with this GPU. For detailed information on the benchmark results, click on the fps number.


For more games that might be playable and a list of all games and graphics cards visit our Gaming List
Acer Aspire ES1-332-P91H: Intel Pentium N4200, 13.30", 1.5 kg
Review » 宏碁 Aspire ES1-332-P91H 笔记本电脑简短评测
Asus Chromebook C423NA-EB0243: Intel Pentium N4200, 14.00", 1.2 kg
External Review » Asus Chromebook C423NA-EB0243
Acer Chromebook 514 CB514-1HT-P1BM: Intel Pentium N4200, 14.00", 1.4 kg
External Review » Acer Chromebook 514 CB514-1HT-P1BM
Asus Chromebook Z1500CN-EJ0165: Intel Pentium N4200, 15.60", 1.5 kg
External Review » Asus Chromebook Z1500CN-EJ0165
Asus Chromebook Z1400CN-BV0305: Intel Pentium N4200, 14.00", 1.2 kg
External Review » Asus Chromebook Z1400CN-BV0305
Chuwi LapBook Plus: Intel Atom x7-E3950, 15.60", 1.5 kg
External Review » Chuwi LapBook Plus
Acer Chromebook 14 CB514-1HT-P2D1: Intel Pentium N4200, 14.00", 1.4 kg
External Review » Acer Chromebook 14 CB514-1HT-P2D1
Acer Chromebook 14 CB514-1HT-P1BM: Intel Pentium N4200, 14.00", 1.4 kg
External Review » Acer Chromebook 14 CB514-1HT-P1BM
Trekstor Surfbook A13-P: Intel Pentium N4200, 13.30", 1.2 kg
External Review » Trekstor Surfbook A13-P
Acer Aspire ES1-732-P7YA: Intel Pentium N4200, 17.30", 2.8 kg
External Review » Acer Aspire ES1-732-P7YA
Acer Chromebook Spin 15 CP315-1H: Intel Pentium N4200, 15.60", 1.7 kg
External Review » Acer Chromebook Spin 15 CP315-1H
Acer Chromebook C523NA-IH24T: Intel Pentium N4200, 15.60", 1.4 kg
External Review » Acer Chromebook C523NA-IH24T
Acer Spin 1 SP111-32N-P1PR: Intel Pentium N4200, 11.60", 1.3 kg
External Review » Acer Spin 1 SP111-32N-P1PR
Lenovo IdeaPad 120S-14IAP-81A500EDGE: Intel Pentium N4200, 14.00", 1.4 kg
External Review » Lenovo IdeaPad 120S-14IAP-81A500EDGE
Trekstor Primebook P14B: Intel Pentium N4200, 14.10", 1.4 kg
External Review » Trekstor Primebook P14B
Asus VivoBook Flip 14 TP401NA: Intel Pentium N4200, 14.00", 1.5 kg
External Review » Asus VivoBook Flip 14 TP401NA
Acer Chromebook Spin 15 CP315-1H-P75Z: Intel Pentium N4200, 15.60", 2.1 kg
External Review » Acer Chromebook Spin 15 CP315-1H-P75Z
Acer Chromebook 15 CB515-1HT-P099: Intel Pentium N4200, 15.60", 2 kg
External Review » Acer Chromebook 15 CB515-1HT-P099
Acer Chromebook Spin 15 CP315-1H-P1K8: Intel Pentium N4200, 15.60", 2.2 kg
External Review » Acer Chromebook Spin 15 CP315-1H-P1K8
Asus X540NA-GQ151T: Intel Pentium N4200, 15.60", 2 kg
External Review » Asus X540NA-GQ151T
Acer Aspire ES1-533-P5MS: Intel Pentium N4200, 15.60", 2.4 kg
External Review » Acer Aspire ES1-533-P5MS
Acer Aspire 3 A315-31-P3ZM: Intel Pentium N4200, 15.60", 2.4 kg
External Review » Acer Aspire 3 A315-31-P3ZM
Lenovo Ideapad 320-15IAP-80XR0094GE: Intel Pentium N4200, 15.60", 2.2 kg
External Review » Lenovo Ideapad 320-15IAP-80XR0094GE
Acer Switch 3 SW312-31-P7SF: Intel Pentium N4200, 12.20", 0.9 kg
External Review » Acer Switch 3 SW312-31-P7SF
Acer Chromebook 15 CB515-1HT-P80X: Intel Pentium N4200, 15.60", 1.8 kg
External Review » Acer Chromebook 15 CB515-1HT-P80X
Acer Swift 1 SF113-31-P72F: Intel Pentium N4200, 13.30", 1.3 kg
External Review » Acer Swift 1 SF113-31-P72F
Acer Chromebook 15 CB515-1HT-P39B: Intel Pentium N4200, 15.60", 1.8 kg
External Review » Acer Chromebook 15 CB515-1HT-P39B
Medion Akoya E3216-MD61800: Intel Pentium N4200, 13.30", 1.5 kg
External Review » Medion Akoya E3216-MD61800
Acer Aspire ES1-533-P8BX: Intel Pentium N4200, 15.60", 2.4 kg
External Review » Acer Aspire ES1-533-P8BX
Acer Swift 1 SF113-31-P56D: Intel Pentium N4200, 13.30", 1.4 kg
External Review » Acer Swift 1 SF113-31-P56D
Acer Swift 1 SF113-31-P3P0: Intel Pentium N4200, 13.30", 1.3 kg
External Review » Acer Swift 1 SF113-31-P3P0
Acer Switch 3 SW312-31-P3FT: Intel Pentium N4200, 12.20", 0.9 kg
External Review » Acer Switch 3 SW312-31-P3FT
Asus VivoBook E14 E403NA-GA016T: Intel Pentium N4200, 14.00", 1.5 kg
External Review » Asus VivoBook E403NA-GA016T
Acer Spin 1 SP111-32N-P9VD: Intel Pentium N4200, 11.60", 1.3 kg
External Review » Acer Spin 1 SP111-32N-P9VD
Lenovo IdeaPad V110-15IAP-80TG00W3GE: Intel Pentium N4200, 15.60", 1.9 kg
External Review » Lenovo IdeaPad V110-15IAP-80TG00W3GE
Acer TravelMate Spin B1 B118-RN-P6BE: Intel Pentium N4200, 11.60", 1.5 kg
External Review » Acer TravelMate Spin B1 B118-RN-P6BE
Medion Akoya E3215-MD60794: Intel Pentium N4200, 13.30", 1.5 kg
External Review » Medion Akoya E3215-MD60794
HP Pavilion x360 11-ad051nr: Intel Pentium N4200, 11.60", 1.4 kg
External Review » HP Pavilion x360 11-ad051nr
Acer Switch 3 SW312-31P: Intel Pentium N4200, 12.00", 1.2 kg
External Review » Acer Switch 3 SW312-31P
Acer Swift 1 SF113-31-P5CK: Intel Pentium N4200, 13.30", 1.4 kg
External Review » Acer Swift 1 SF113-31-P5CK
Asus Vivobook E14 L403NA-FA017TS: Intel Pentium N4200, 14.00", 1.4 kg
External Review » Asus Vivobook E14 L403NA-FA017TS
Acer Swift 1 SF113-31-P63H: Intel Pentium N4200, 13.30", 1.4 kg
External Review » Acer Swift 1 SF113-31-P63H
Medion Akoya E3216-MD60900: Intel Pentium N4200, 13.30", 1.5 kg
External Review » Medion Akoya E3216-MD60900
Acer Chromebook 15 CB515-1HT-P58C: Intel Pentium N4200, 15.60", 1.8 kg
External Review » Acer Chromebook 15 CB515-1HT-P58C
BTO Notebooks U-BOOK 14CL23: Intel Pentium N4200, 14.00", 1.8 kg
External Review » BTO Notebooks U-BOOK 14CL23
Asus VivoBook Flip 12 TP203NAH-BP049T: Intel Pentium N4200, 11.60", 1.3 kg
External Review » Asus VivoBook Flip 12 TP203NAH-BP049T
Dell Latitude 3189: Intel Pentium N4200, 11.60", 1.4 kg
External Review » Dell Latitude 3189
Acer Swift 1 SF113-31-P2CP: Intel Pentium N4200, 13.30", 1.4 kg
External Review » Acer Swift 1 SF113-31-P2CP
Acer Aspire ES1-533-P2V5: Intel Pentium N4200, 15.60", 2.4 kg
External Review » Acer Aspire ES1-533-P2V5
Acer Switch 3 SW312-31-P5VG: Intel Pentium N4200, 12.20", 0.9 kg
External Review » Acer Switch 3 SW312-31-P5VG
Acer Aspire A315-31-P72U: Intel Pentium N4200, 15.60", 2.4 kg
External Review » Acer Aspire A315-31-P72U
Acer Aspire ES1-533-P6NL: Intel Pentium N4200, 15.60", 2.4 kg
External Review » Acer Aspire ES1-533-P6NL
Acer Aspire ES1-132-P065: Intel Pentium N4200, 11.60", 1.3 kg
External Review » Acer Aspire ES1-132-P065
Acer Swift 1 SF113-31-P2CP: Intel Pentium N4200, 13.30", 1.4 kg
External Review » Acer Swift 1 SF113-31-P2CP
Acer Aspire ES1-332-P7SA: Intel Pentium N4200, 13.30", 1.7 kg
External Review » Acer Aspire ES1-332-P7SA
Lenovo IdeaPad V110-15IAP-80TG00W8GE: Intel Pentium N4200, 15.60", 1.9 kg
External Review » Lenovo IdeaPad V110-15IAP-80TG00W8GE
Acer Spin 1 SP113-31-P0ZN: Intel Pentium N4200, 13.30", 1.6 kg
External Review » Acer Spin 1 SP113-31-P0ZN
Lenovo IdeaPad V110-15IAP 80TG00W4GE: Intel Pentium N4200, 15.60", 1.9 kg
External Review » Lenovo IdeaPad V110-15IAP 80TG00W4GE
Acer Spin 1 SP111-31-P40B: Intel Pentium N4200, 11.60", 1.5 kg
External Review » Acer Spin 1 SP111-31-P40B
Acer Aspire ES1-533-P591: Intel Pentium N4200, 15.60", 2.4 kg
External Review » Acer Aspire ES1-533-P591
HP ProBook x360 11-G1: Intel Pentium N4200, 11.60", 1.4 kg
External Review » HP ProBook x360 11-G1
» Comparison of GPUs
Detailed list of all laptop GPUs sorted by class and performance.
» Benchmark List
Sort and restrict laptop GPUs based on performance in synthetic benchmarks.
» Notebook Gaming List
Playable games for each graphics card and their average FPS results.
* Approximate position of the graphics adapter
» Notebookcheck多媒体笔记本电脑Top 10排名
» Notebookcheck游戏笔记本电脑Top 10排名
» Notebookcheck低价办公/商务笔记本电脑Top 10排名
» Notebookcheck高端办公/商务笔记本电脑Top 10排名
» Notebookcheck工作站笔记本电脑Top 10排名
» Notebookcheck亚笔记本电脑Top 10排名
» Notebookcheck超级本产品Top 10排名
» Notebookcheck变形本产品Top 10排名
» Notebookcheck平板电脑Top 10排名
» Notebookcheck智能手机Top 10排名
» Notebookcheck评测过最出色的笔记本电脑屏幕
» Notebookcheck售价500欧元以下笔记本电脑Top 10排名
» Notebookcheck售价300欧元以下笔记本电脑Top 10排名