


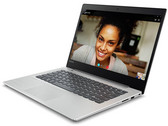
联想 IdeaPad 320s (4415U, HD610) 笔记本电脑简短评测
简洁、实惠。联想推出了一款经济实惠的入门级笔记本IdeaPad 320S。我们测试了最低配置的型号。文中,将会阐述对于500美元价位的笔记本电脑,我们的预期可以多大。
Intel Pentium Gold 4415U, HD Graphics 610, 14", 1.5 kg英特尔HD Graphics 610(GT1)是一款集成显卡,可以在Kaby-Lake一代的低端ULV(超低电压)处理器中找到。Skylake显卡的“GT1”版本提供12个执行单元(EU),时钟频率高达950 MHz(取决于处理器型号)。由于缺乏专用图形内存或eDRAM缓存,HD 610必须访问主内存(2个64位DDR3L-1600 / DDR4-2133)。
性能
根据各种因素,如内存配置,HD Graphics 610应该与旧的Skylake HD Graphics 510类似,因此只能处理要求不高的游戏。例如:《模拟农场17》,《战舰世界》或《Dota 2》可以在低设置播放。
特点
修订后的视频引擎现在支持10位颜色的硬件中的H.265 / HEVC Main10配置文件。此外,Googles VP9编解码器也可以被硬件解码。奔腾芯片应该已经支持HDCP 2.2,因此也支持Netflix 4K。然而,HDMI 2.0仍然只能通过一个外部转换器芯片(LSPCon)来支持。
能耗
HD Graphics 610可以在15瓦特TDP的指定移动处理器中找到,因此适用于小型笔记本电脑和超极本。
Gen. 9 Series
| |||||||||||||||||||||||||||||||||||||||||||
| Codename | Kaby Lake GT1 | ||||||||||||||||||||||||||||||||||||||||||
| Architecture | Gen. 9 Kaby Lake | ||||||||||||||||||||||||||||||||||||||||||
| iGPU | Integrated Graphics | ||||||||||||||||||||||||||||||||||||||||||
| Pipelines | 12 - unified | ||||||||||||||||||||||||||||||||||||||||||
| Core Speed | 300 - 950 (Boost) MHz | ||||||||||||||||||||||||||||||||||||||||||
| Memory Bus Width | 64/128 Bit | ||||||||||||||||||||||||||||||||||||||||||
| Memory Type | DDR3/DDR4 | ||||||||||||||||||||||||||||||||||||||||||
| Shared Memory | yes | ||||||||||||||||||||||||||||||||||||||||||
| API | DirectX 12_1, OpenGL 4.4 | ||||||||||||||||||||||||||||||||||||||||||
| Man. Technology | 14 nm | ||||||||||||||||||||||||||||||||||||||||||
| Features | QuickSync | ||||||||||||||||||||||||||||||||||||||||||
| Date of Announcement | 01.01.2017 | ||||||||||||||||||||||||||||||||||||||||||
| ||||||||||||||||||||||||
The following benchmarks stem from our benchmarks of review laptops. The performance depends on the used graphics memory, clock rate, processor, system settings, drivers, and operating systems. So the results don't have to be representative for all laptops with this GPU. For detailed information on the benchmark results, click on the fps number.


For more games that might be playable and a list of all games and graphics cards visit our Gaming List
Acer Aspire One 14, Pentium Gold 4415U: Intel Pentium Gold 4415U, 14.00", 1.8 kg
External Review » Acer Aspire One 14, Pentium Gold 4415U
Acer TravelMate P2410-M-P87: Intel Pentium Gold 4415U, 14.00", 1.8 kg
External Review » Acer TravelMate P2410-M-P87
HP 15s-fq0899no: Intel Pentium Gold 4417U, 14.00", 1.7 kg
External Review » HP 15s-fq0899no
Toshiba Satellite Pro R40-D-111: Intel Celeron 3865U, 14.00", 1.8 kg
External Review » Toshiba Satellite Pro R40-D-111
Lenovo Ideapad S145-15IWL-81MV007LSP: Intel Celeron 4205U, 15.60", 1.9 kg
External Review » Lenovo Ideapad S145-15IWL-81MV007LSP
HP Chromebook x360 14-da0200nd: Intel Pentium Gold 4415U, 14.00", 1.7 kg
External Review » HP Chromebook x360 14-da0200nd
Lenovo V130-15IKB-81HN00V3SP: Intel Celeron 3865U, 15.60", 2 kg
External Review » Lenovo V130-15IKB-81HN00V3SP
Acer Chromebook 715, Celeron 3867U: unknown, 15.60", 2 kg
External Review » Acer Chromebook 715, Celeron 3867U
Lenovo Ideapad S145-15IWL-81MV001BGE: Intel Pentium Gold 5405U, 15.60", 1.9 kg
External Review » Lenovo Ideapad S145-15IWL-81MV001BGE
HP Pavilion x360 15-cr0001ng: Intel Pentium Gold 4415U, 15.60", 2.1 kg
External Review » HP Pavilion x360 15-cr0001ng
HP Pavilion x360 15-cr0000no: Intel Pentium Gold 4415U, 15.60", 2 kg
External Review » HP Pavilion x360 15-cr0000no
Lenovo Ideapad 330S-15IKB-81F500C1GE: Intel Pentium Gold 4415U, 15.60", 1.9 kg
External Review » Lenovo Ideapad 330S-15IKB-81F500C1GE
Acer Spin 3 SP314-51-P0WG: Intel Pentium Gold 4415U, 14.00", 1.7 kg
External Review » Acer Spin 3 SP314-51-P0WG
Lenovo Ideapad 320s-14IKB-80X400L0GE: Intel Pentium Gold 4415U, 14.00", 1.7 kg
External Review » Lenovo Ideapad 320s-14IKB-80X400L0GE
Lenovo Ideapad 320S-14IKB-80X400HMSP: Intel Pentium Gold 4415U, 13.30", 1.7 kg
External Review » Lenovo Ideapad 320S-14IKB-80X400HMSP
Lenovo Ideapad 320-17IKB 80XM009AMH: Intel Pentium Gold 4415U, 17.30", 2.8 kg
External Review » Lenovo Ideapad 320-17IKB 80XM009AMH
Lenovo Ideapad 320S-14IKB-80X400FKSP: Intel Pentium Gold 4415U, 14.00", 1.7 kg
External Review » Lenovo Ideapad 320S-14IKB-80X400FKSP
Lenovo V110-15IKB-80TH001TGE: Intel Pentium Gold 4415U, 15.60", 1.9 kg
External Review » Lenovo V110-15IKB-80TH001TGE
Lenovo IdeaPad 320s-14IKB: Intel Pentium Gold 4415U, 14.00", 1.5 kg
External Review » Lenovo IdeaPad 320s-14IKB
» Comparison of GPUs
Detailed list of all laptop GPUs sorted by class and performance.
» Benchmark List
Sort and restrict laptop GPUs based on performance in synthetic benchmarks.
» Notebook Gaming List
Playable games for each graphics card and their average FPS results.
* Approximate position of the graphics adapter
» Notebookcheck多媒体笔记本电脑Top 10排名
» Notebookcheck游戏笔记本电脑Top 10排名
» Notebookcheck低价办公/商务笔记本电脑Top 10排名
» Notebookcheck高端办公/商务笔记本电脑Top 10排名
» Notebookcheck工作站笔记本电脑Top 10排名
» Notebookcheck亚笔记本电脑Top 10排名
» Notebookcheck超级本产品Top 10排名
» Notebookcheck变形本产品Top 10排名
» Notebookcheck平板电脑Top 10排名
» Notebookcheck智能手机Top 10排名
» Notebookcheck评测过最出色的笔记本电脑屏幕
» Notebookcheck售价500欧元以下笔记本电脑Top 10排名
» Notebookcheck售价300欧元以下笔记本电脑Top 10排名