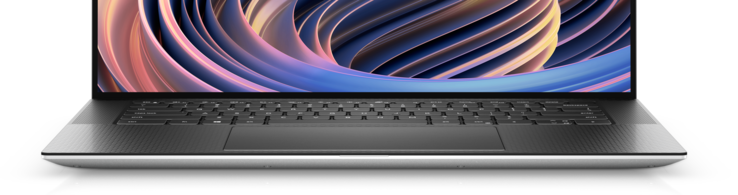
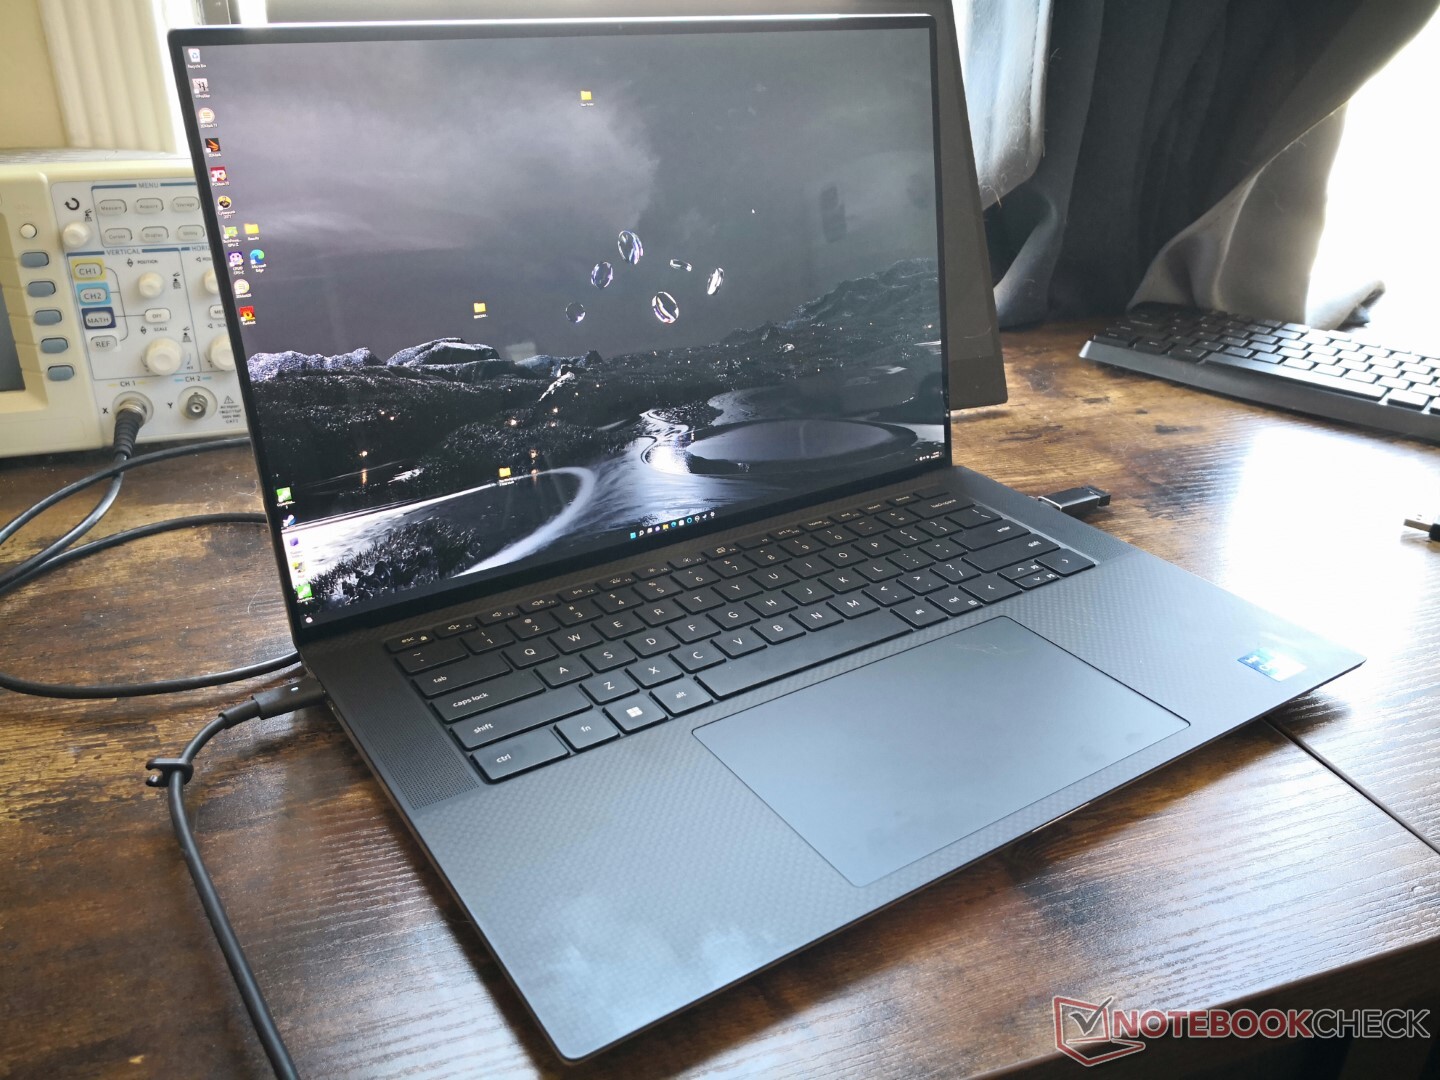
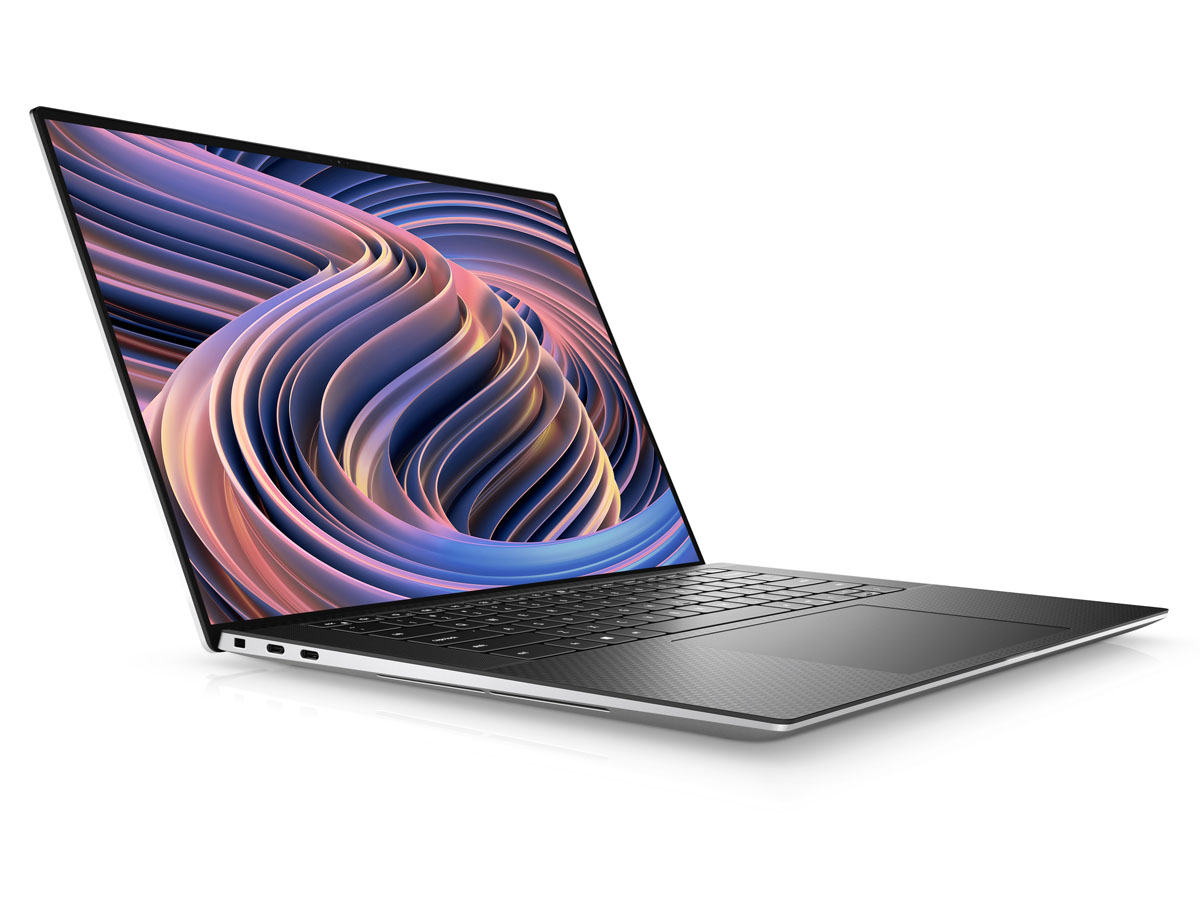
2022年戴尔XPS 15 9520 3.5K OLED笔记本电脑回顾。跳过或购买?
戴尔通过推出全面更新的XPS 15 9500来接替老一代的XPS 15 9500,为这十年拉开序幕。XPS 15 7590系列.该机型将XPS 15家族从16:9转移到16:10,同时采用了全新的机箱设计,配备了英特尔第十代Comet Lake-H CPU和GeForce GTX 1650 Ti GPU。XPS 15 9510采用11代Tiger Lake-H CPU和可选的3.5K OLED面板,使其更进一步。现在,XPS 15 9520是另一个增量更新,采用第12代Alder Lake-H CPU和更快的DDR5内存。
我们建议检查一下 我们对XPS 15 9500的现有评论因为XPS 15 9520的机箱仍然是相同的。本评论页将重点关注XPS 15 9520的性能,以及与以前机型相比,用户可以期待的其他差异。
戴尔XPS 15 9520的替代品包括其他带有独立显卡的高端15.6英寸多媒体笔记本电脑,如 华硕Zenbook Pro 15 OLED, 联想Yoga Creator 7 15, 惠普Spectre x360 15, HP Envy 15, 或 微星创造者15.
更多戴尔评论。
潜在的竞争对手比较
Rating | Date | Model | Weight | Height | Size | Resolution | Price |
|---|---|---|---|---|---|---|---|
| 89.5 % v7 (old) | 05 / 2022 | Dell XPS 15 9520 RTX 3050 Ti i7-12700H, GeForce RTX 3050 Ti Laptop GPU | 1.9 kg | 18 mm | 15.60" | 3456x2160 | |
| 88.4 % v7 (old) | 09 / 2021 | Dell XPS 15 9510 11800H RTX 3050 Ti OLED i7-11800H, GeForce RTX 3050 Ti Laptop GPU | 1.9 kg | 18 mm | 15.60" | 3456x2160 | |
| 85 % v7 (old) | HP Spectre X360 15-5ZV31AV i7-10510U, GeForce MX250 | 2.1 kg | 19.3 mm | 15.60" | 3840x2160 | ||
| 87.7 % v7 (old) | 05 / 2022 | Asus Zenbook Pro 15 OLED UM535Q R9 5900HX, GeForce RTX 3050 Ti Laptop GPU | 1.9 kg | 18 mm | 15.60" | 1920x1080 | |
| 82.4 % v7 (old) | MSI Stealth 15M A11SEK i7-1185G7, GeForce RTX 2060 Max-Q | 1.7 kg | 16.15 mm | 15.60" | 1920x1080 | ||
| 93.2 % v7 (old) | 11 / 2021 | Apple MacBook Pro 16 2021 M1 Pro M1 Pro, M1 Pro 16-Core GPU | 2.2 kg | 16.8 mm | 16.20" | 3456x2234 |
案例
XPS 15 9520机箱尽管已经有两年历史,但仍然是其尺寸类别中最小的设计之一。与Zenbook Pro 15或Spectre x360 15相比,包括下巴在内的所有四面都有非常窄的边框,有助于以更大的幅度减少占用空间。
SD卡阅读器
| SD Card Reader | |
| average JPG Copy Test (av. of 3 runs) | |
| Dell XPS 15 9510 11800H RTX 3050 Ti OLED (AV Pro V60) | |
| Dell XPS 15 9500 Core i7 4K UHD (Toshiba Exceria Pro SDXC 64 GB UHS-II) | |
| MSI Stealth 15M A11SEK (Toshiba Exceria Pro M501 microSDXC 32GB) | |
| Dell XPS 15 9520 RTX 3050 Ti (Toshiba Exceria Pro SDXC 64 GB UHS-II) | |
| HP Spectre X360 15-5ZV31AV (Toshiba Exceria Pro M501 UHS-II) | |
| Asus Zenbook Pro 15 OLED UM535Q (Toshiba Exceria Pro SDXC 64 GB UHS-II) | |
| maximum AS SSD Seq Read Test (1GB) | |
| MSI Stealth 15M A11SEK (Toshiba Exceria Pro M501 microSDXC 32GB) | |
| Dell XPS 15 9510 11800H RTX 3050 Ti OLED (AV Pro V60) | |
| Dell XPS 15 9500 Core i7 4K UHD (Toshiba Exceria Pro SDXC 64 GB UHS-II) | |
| HP Spectre X360 15-5ZV31AV (Toshiba Exceria Pro M501 UHS-II) | |
| Dell XPS 15 9520 RTX 3050 Ti (Toshiba Exceria Pro SDXC 64 GB UHS-II) | |
| Asus Zenbook Pro 15 OLED UM535Q (Toshiba Exceria Pro SDXC 64 GB UHS-II) | |
沟通
英特尔AX211是Wi-Fi 6E和蓝牙5.2连接的标准配置。然而,戴尔已经向我们证实,尽管AX211芯片可以支持6GHz Wi-Fi 6E网络,但XPS 15 9520的设计并不支持。因此,XPS 15 9520的所有者将只能连接到2.4GHz和5GHz网络,直至Wi-Fi 6。
| Networking | |
| iperf3 transmit AX12 | |
| Dell XPS 15 9510 11800H RTX 3050 Ti OLED | |
| Dell XPS 15 9500 Core i7 4K UHD | |
| MSI Stealth 15M A11SEK | |
| Asus Zenbook Pro 15 OLED UM535Q | |
| iperf3 receive AX12 | |
| Dell XPS 15 9500 Core i7 4K UHD | |
| Dell XPS 15 9510 11800H RTX 3050 Ti OLED | |
| MSI Stealth 15M A11SEK | |
| Asus Zenbook Pro 15 OLED UM535Q | |
| iperf3 receive AXE11000 | |
| Dell XPS 15 9520 RTX 3050 Ti | |
| iperf3 transmit AXE11000 | |
| Dell XPS 15 9520 RTX 3050 Ti | |
网络摄像头
与XPS 15 9510或9500相比,戴尔通过分离红外和RGB传感器改善了网络摄像头的色彩。然而,它仍然只有1MP,与其他旗舰型15.6英寸笔记本电脑的2MP相比,如 Razer Blade 15.因此,虽然颜色可能会好一点,但画面仍然是浑浊的。


维护
配件和保修
零售包装盒中包括USB-C交流适配器、文书,以及一个USB-C转全尺寸HDMI和USB-A适配器。后者特别有用,因为该系统只集成了USB-C端口。
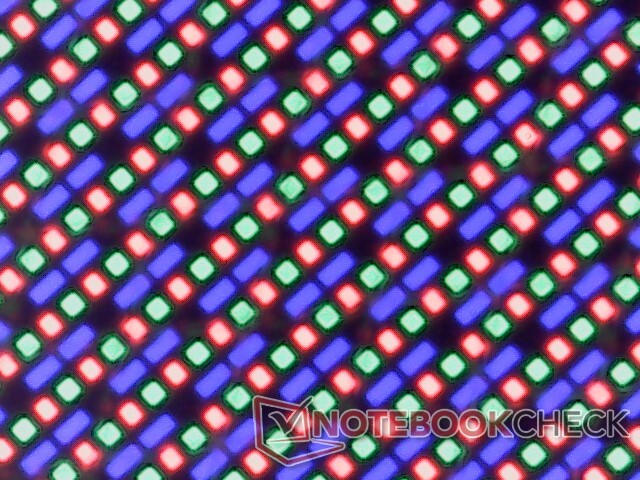
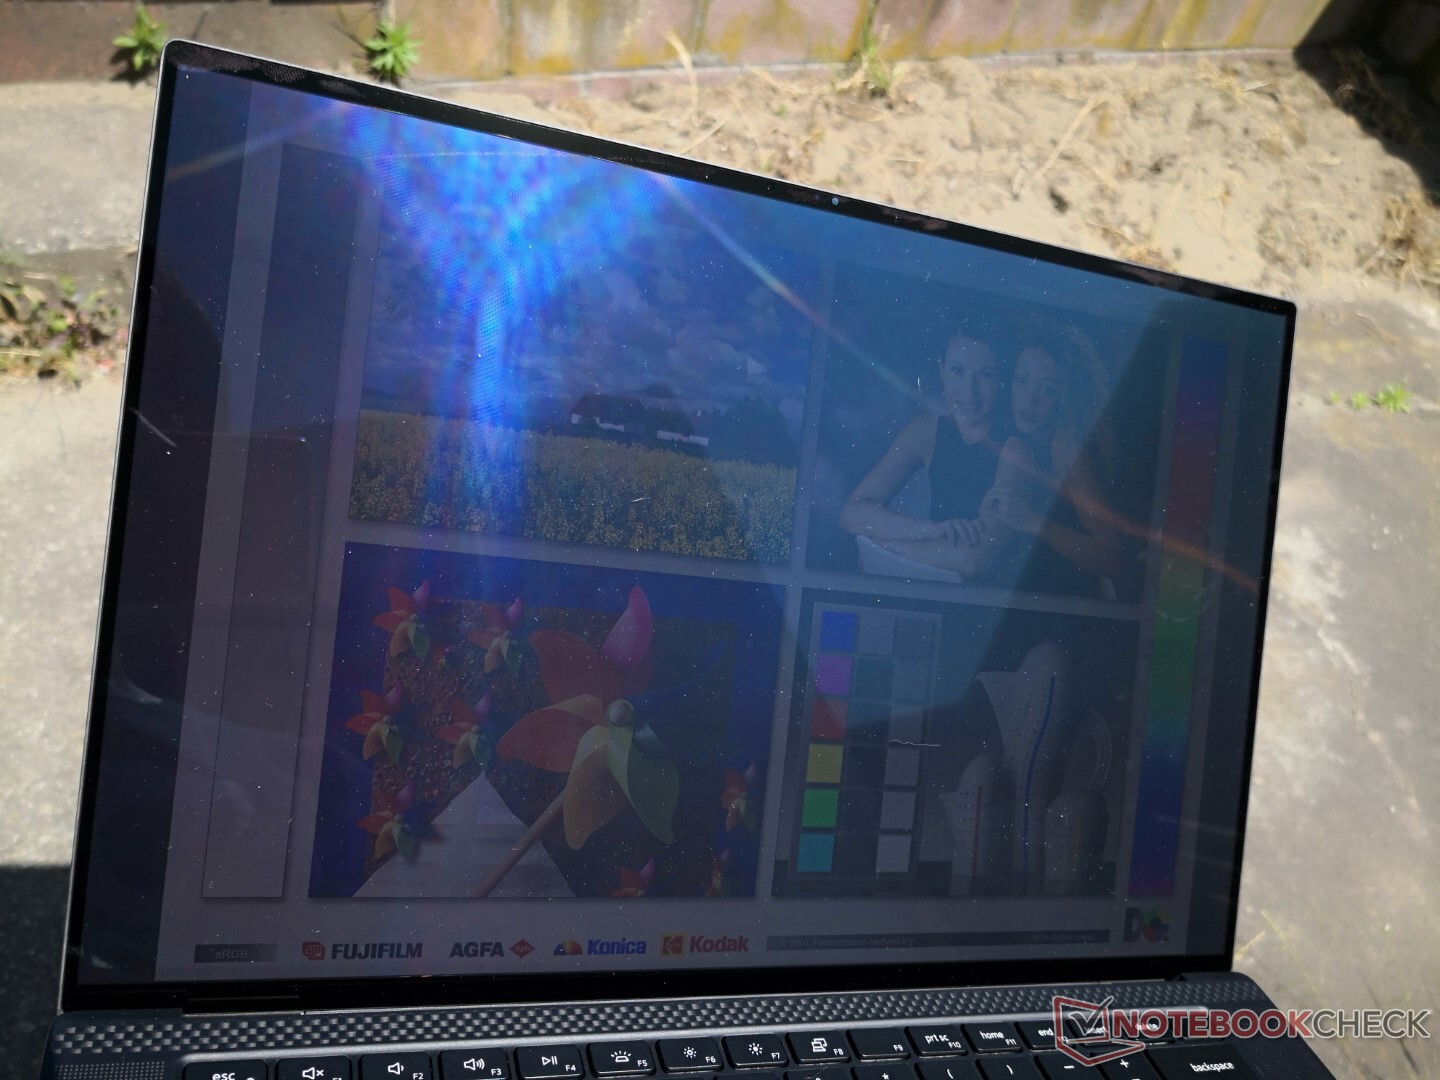
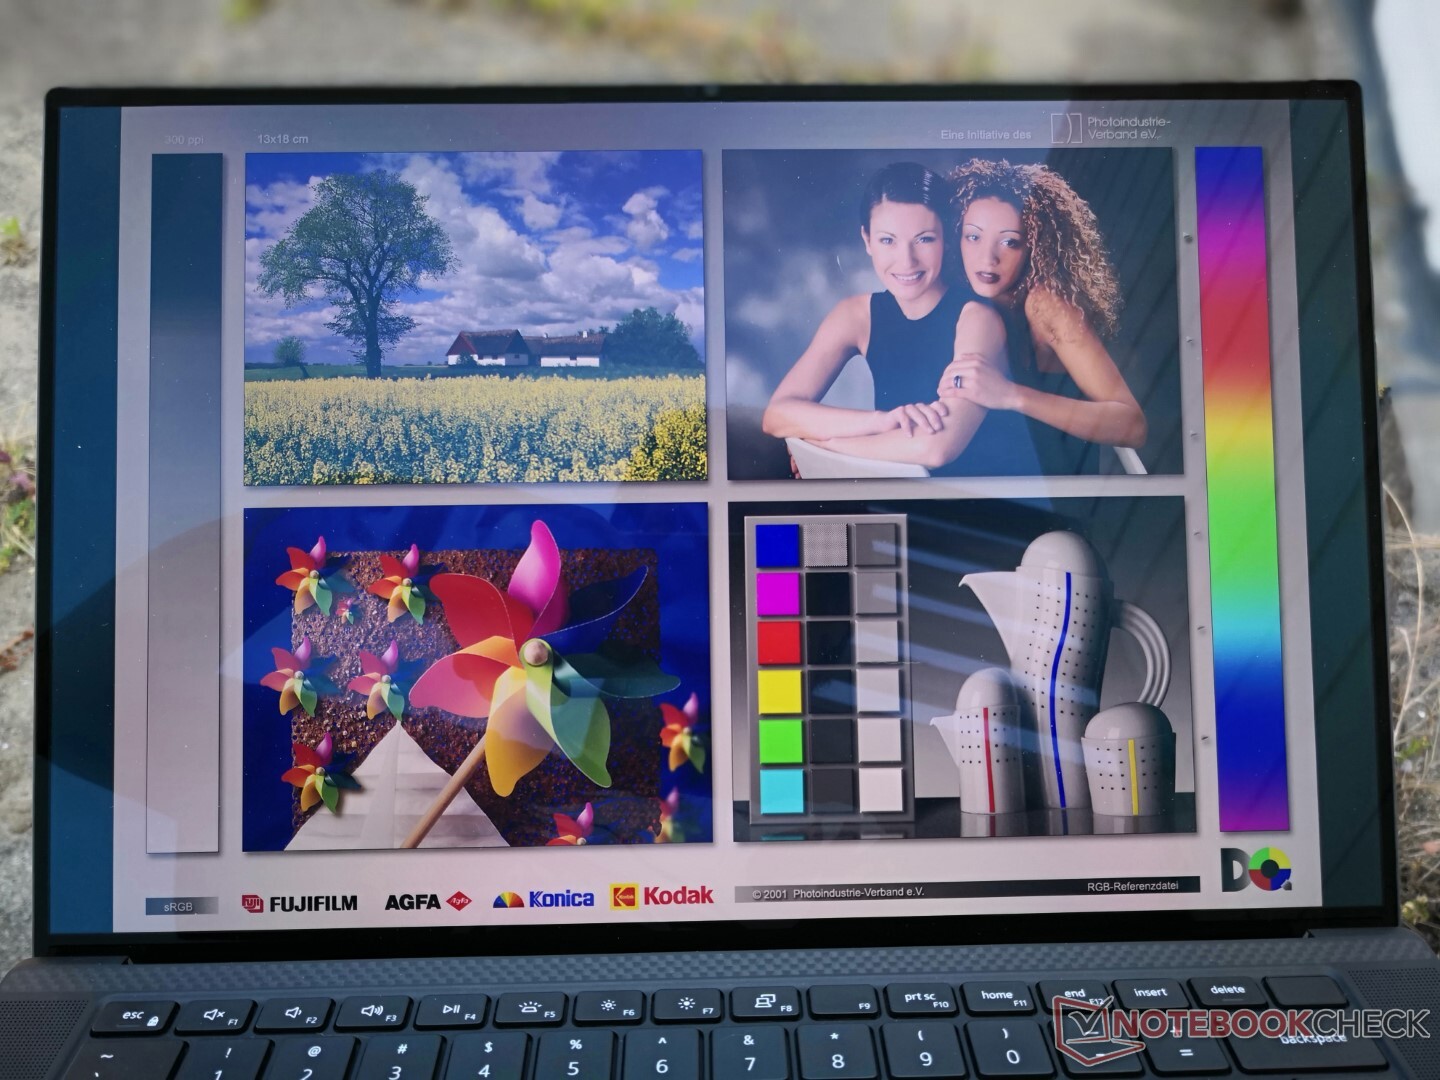
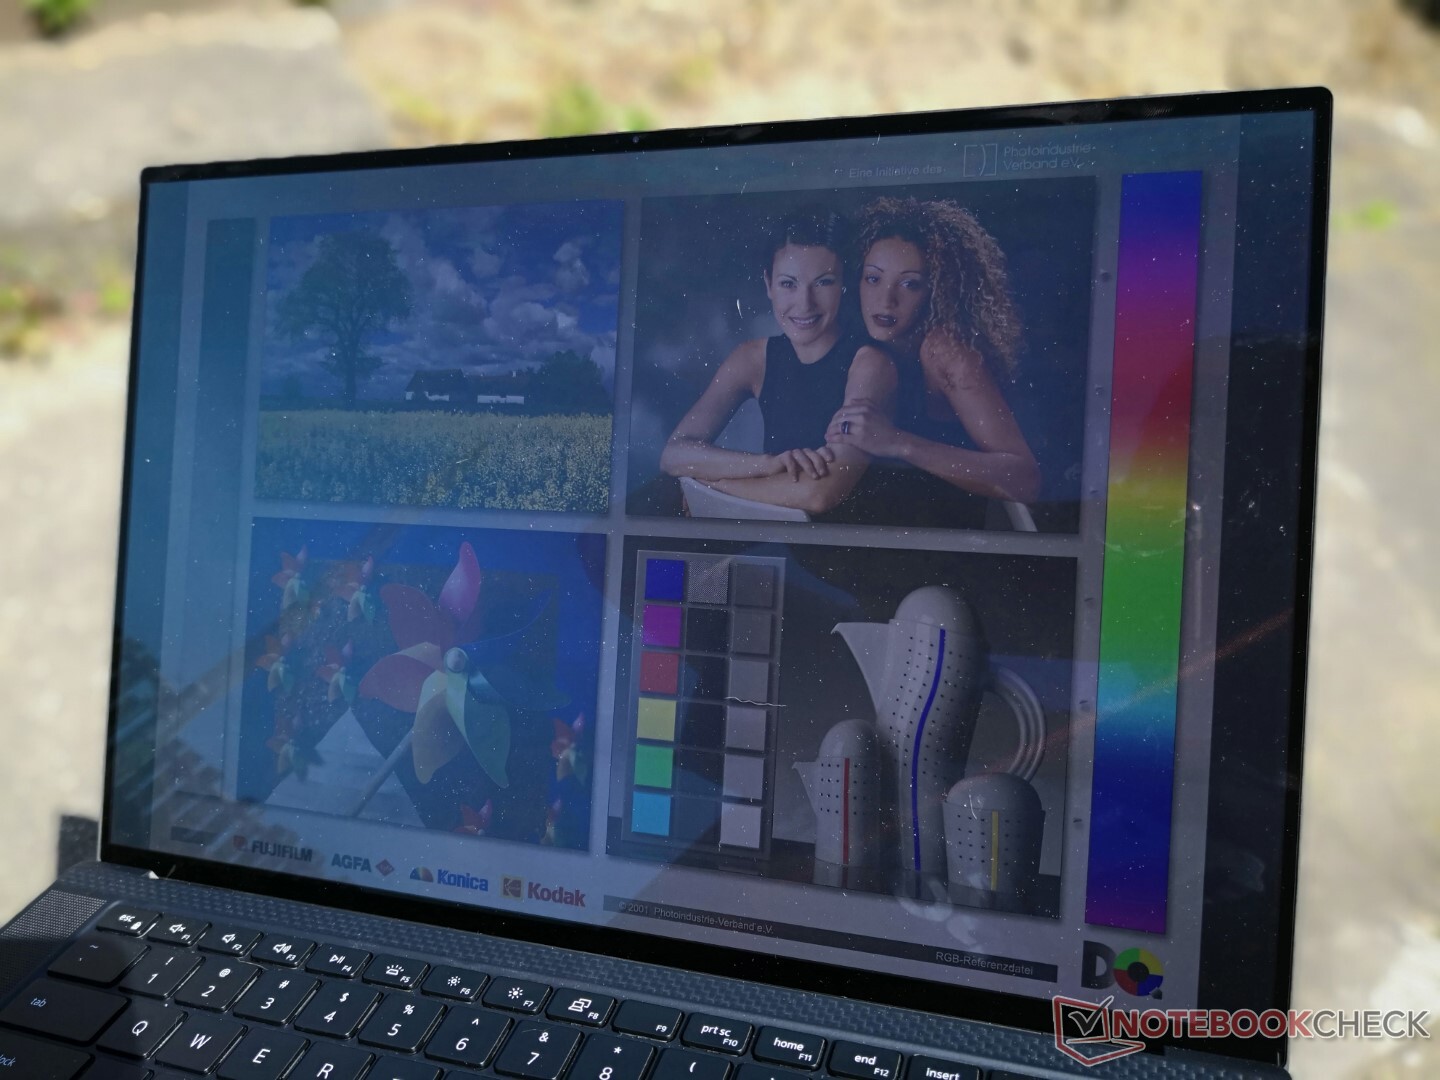
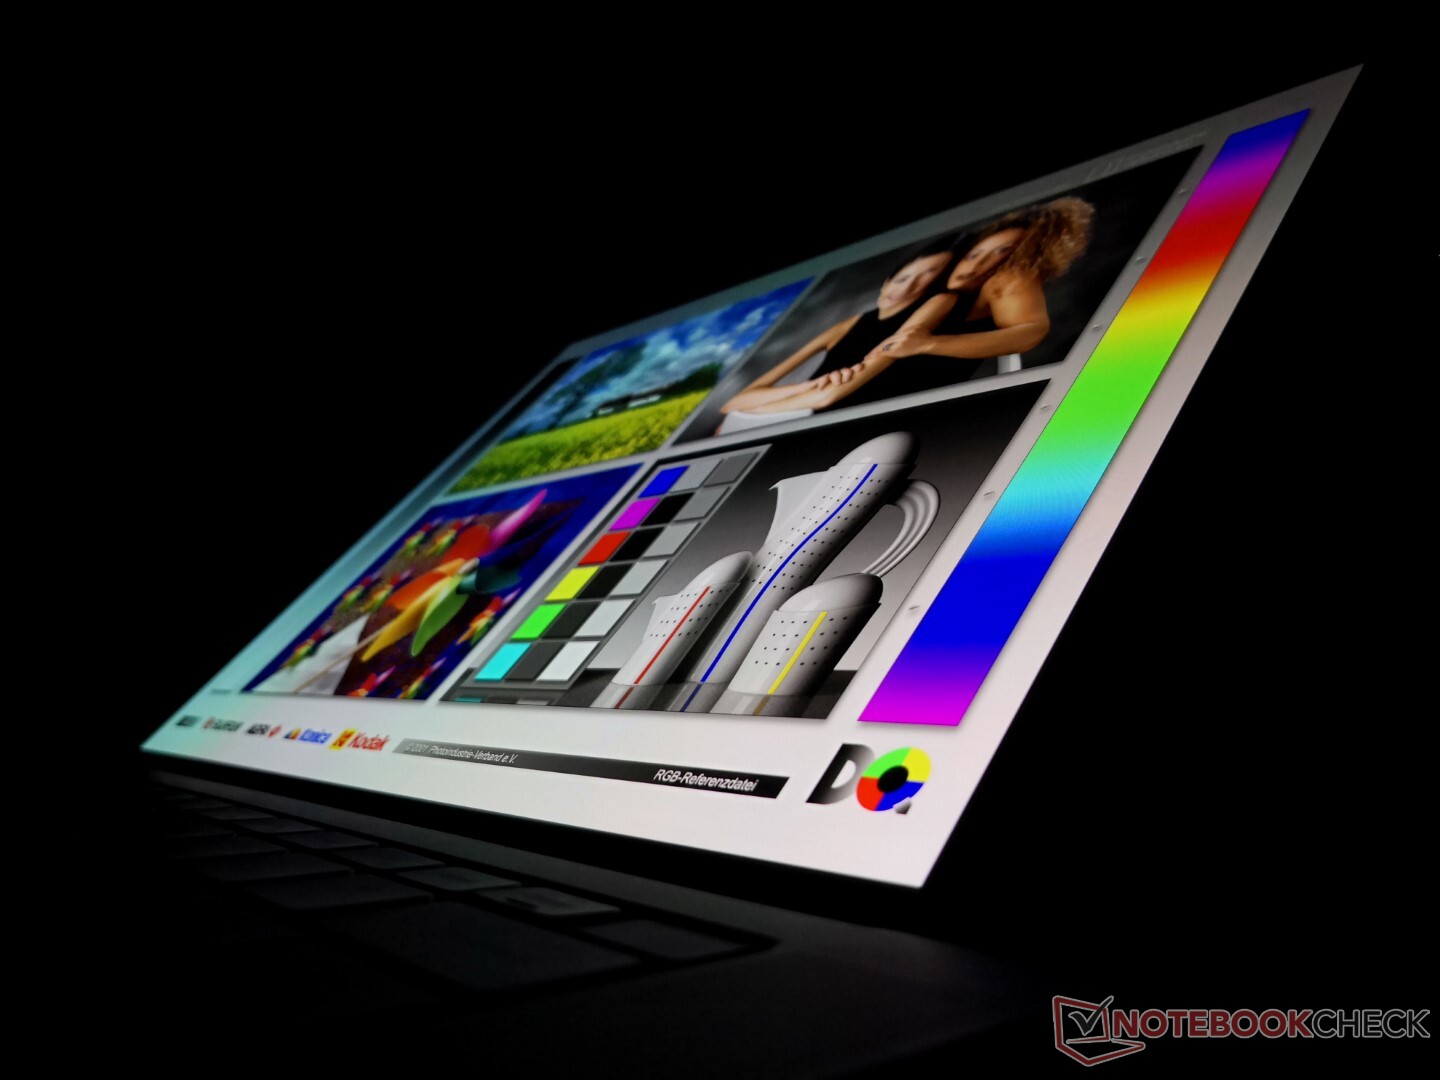
显示器 - 不常见的3.5K OLED
我们的评测单位配备了与去年XPS 15 9510相同的3.5K OLED触摸屏,这意味着视觉体验同比没有变化。也有较低分辨率的1920 x 1200 IPS选项和较高分辨率的3840 x 2400 IPS选项,但不幸的是,所有面板都限制在60赫兹的刷新率。某些超极本,如联想IdeaPad Slim 7i Pro或华硕Vivobook Pro 14,已经配备了更快的90赫兹面板,以获得明显更流畅的用户界面体验。
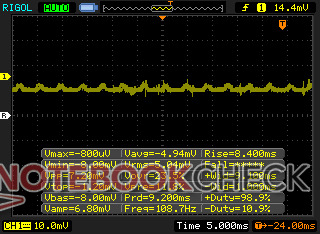
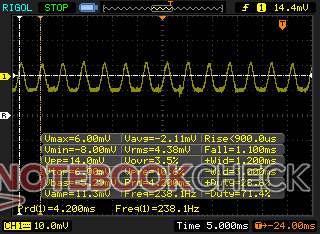
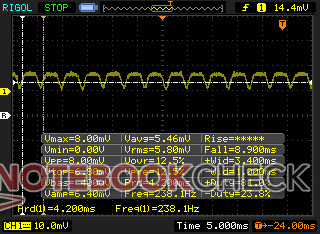
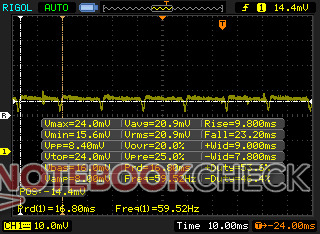
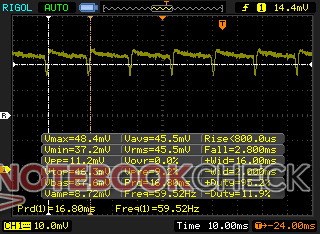
请记住,脉宽调制存在于所有亮度上,从0%到25%的亮度是238赫兹,从26%到100%的亮度是59赫兹。如果屏幕闪烁是一个问题,那么我们建议改用IPS配置。
| |||||||||||||||||||||||||
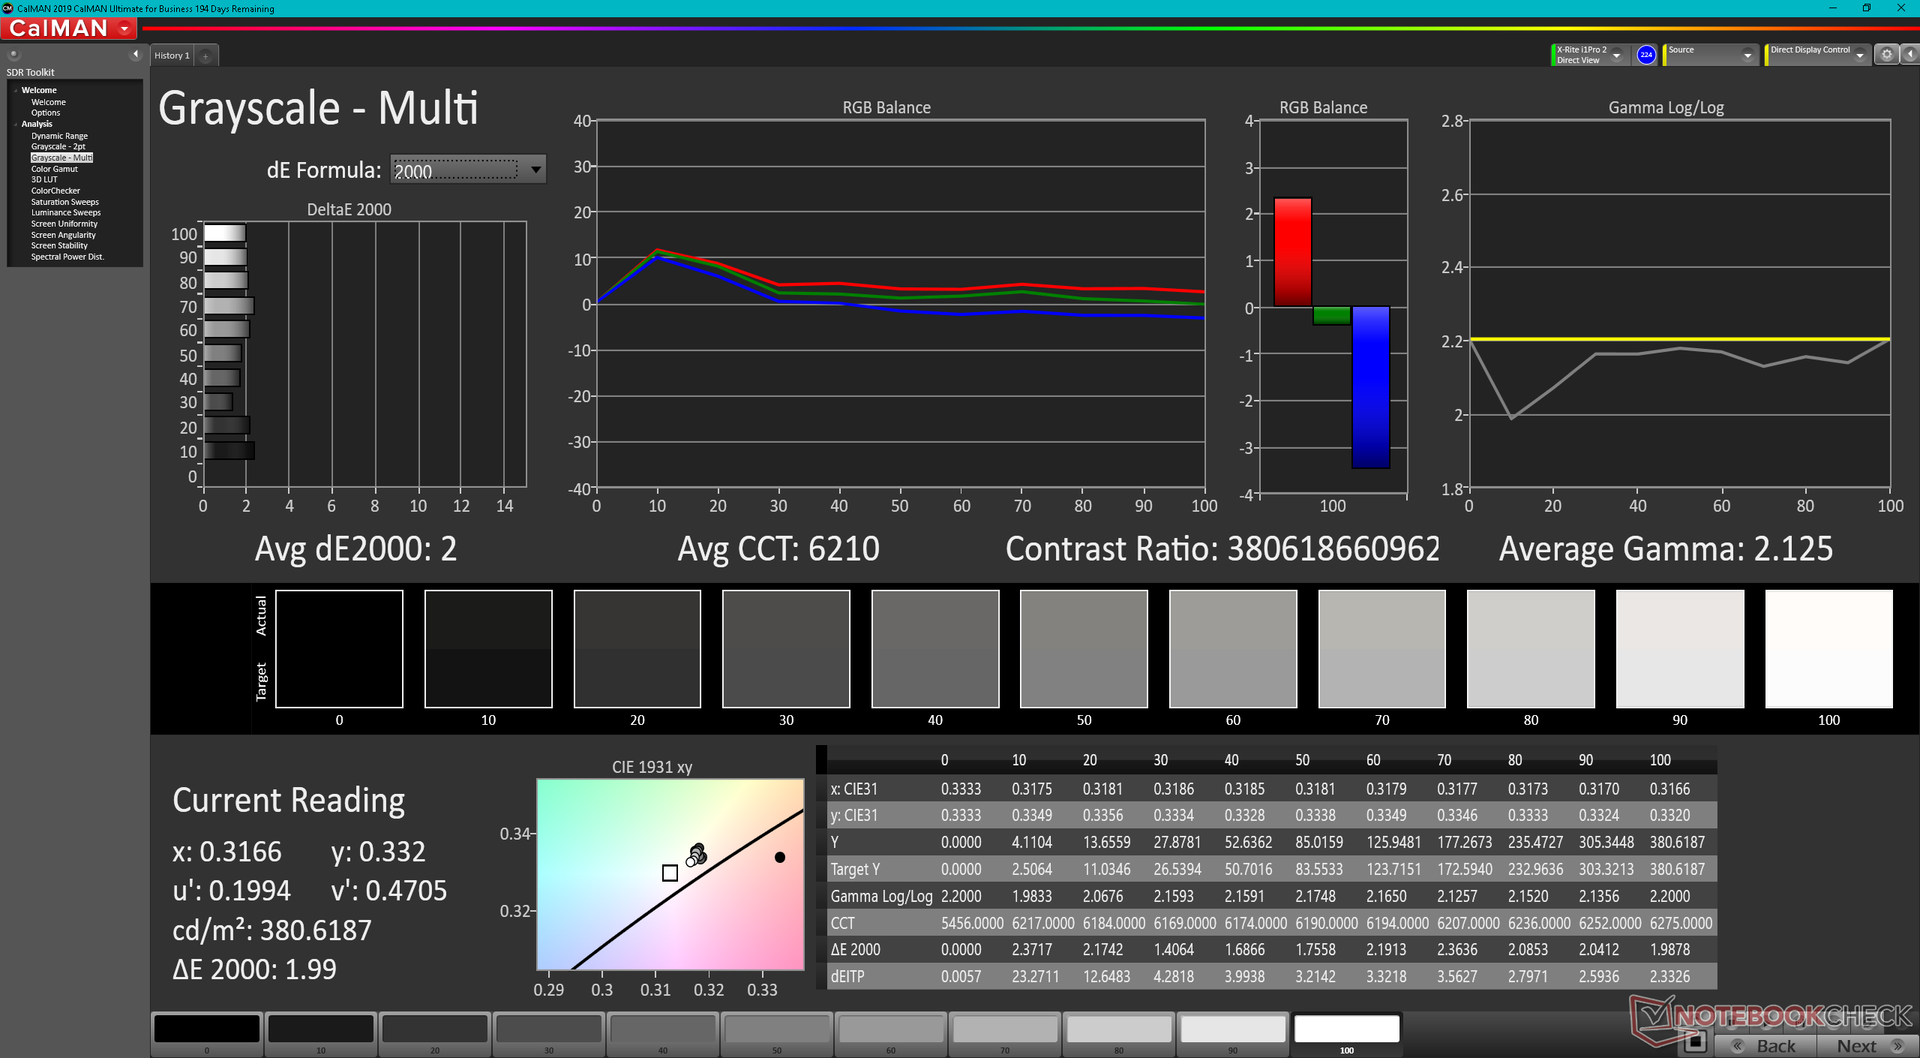
Brightness Distribution: 95 %
Center on Battery: 381.4 cd/m²
Contrast: ∞:1 (Black: 0 cd/m²)
ΔE ColorChecker Calman: 4.34 | ∀{0.5-29.43 Ø4.71}
ΔE Greyscale Calman: 2 | ∀{0.09-98 Ø4.96}
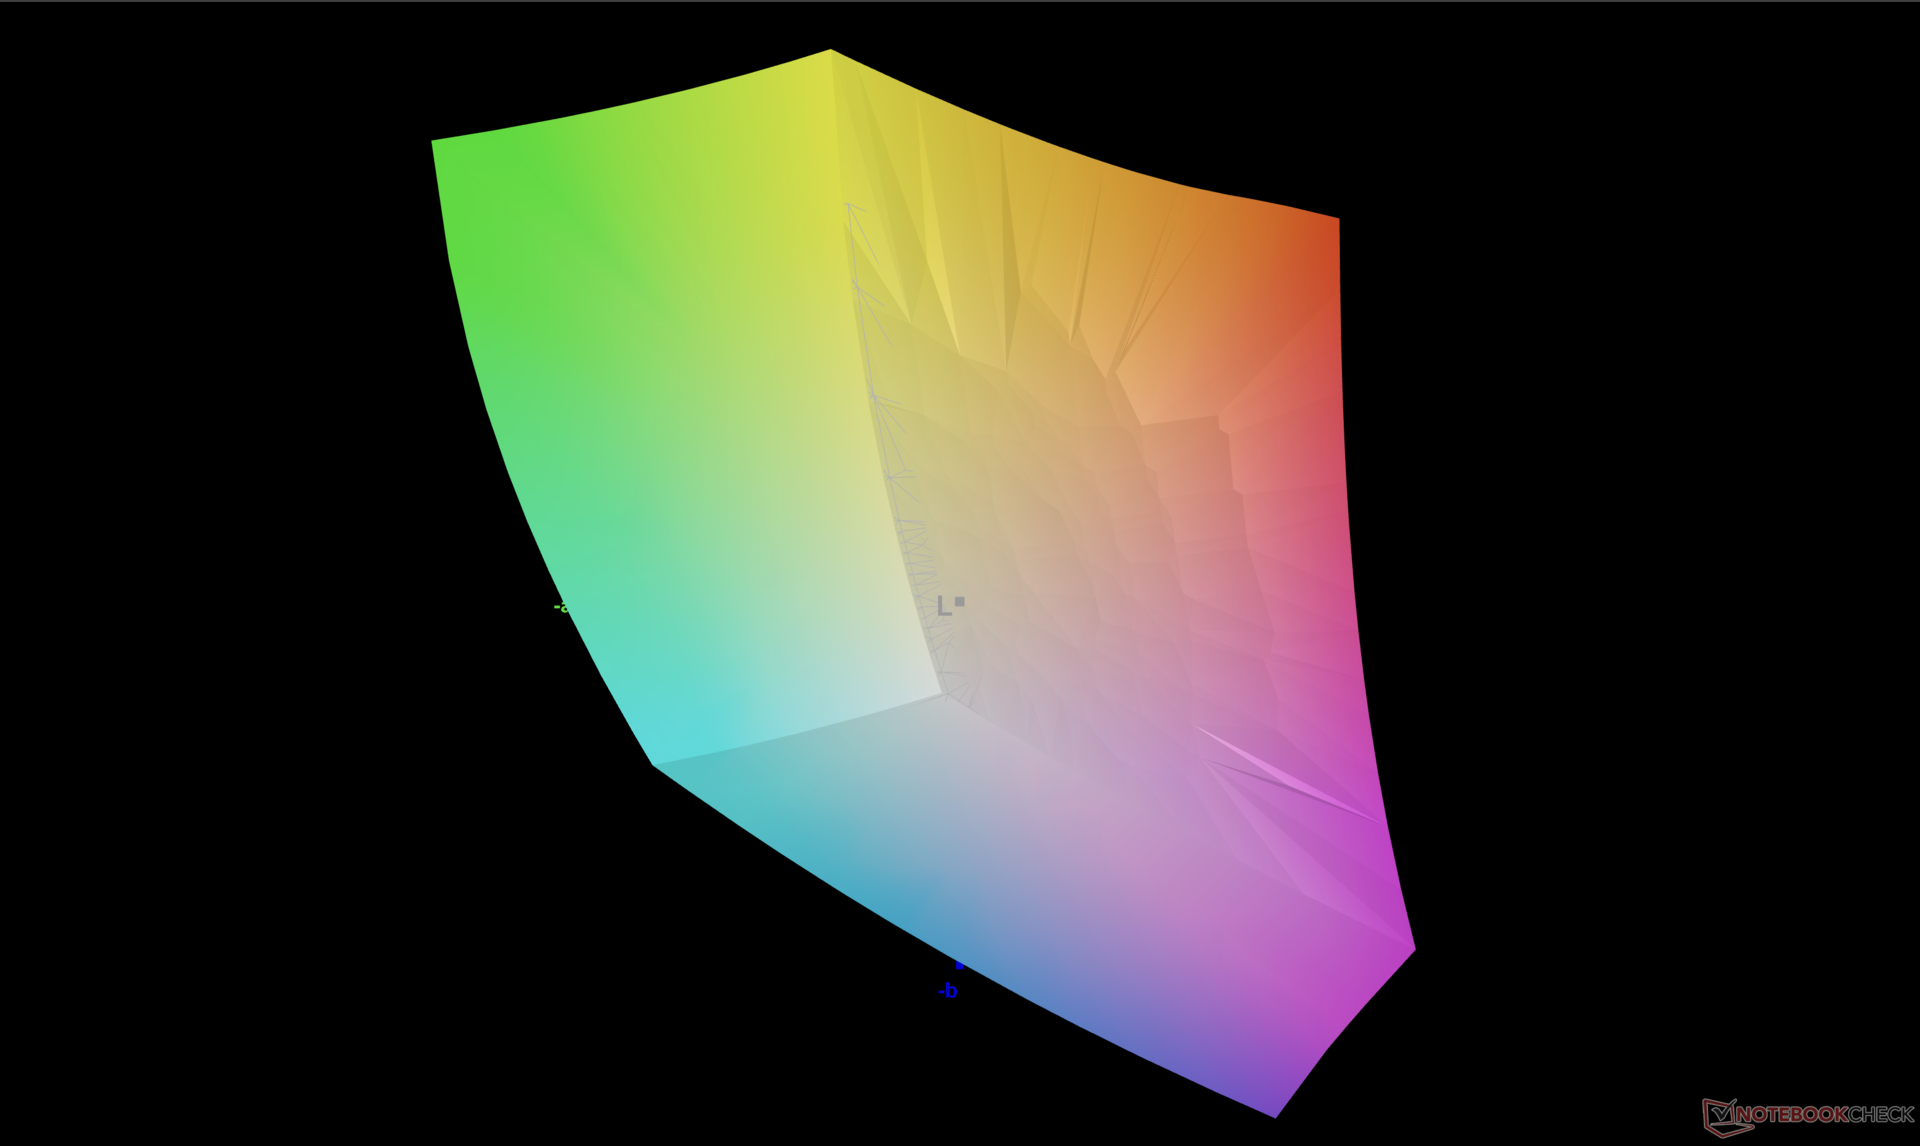
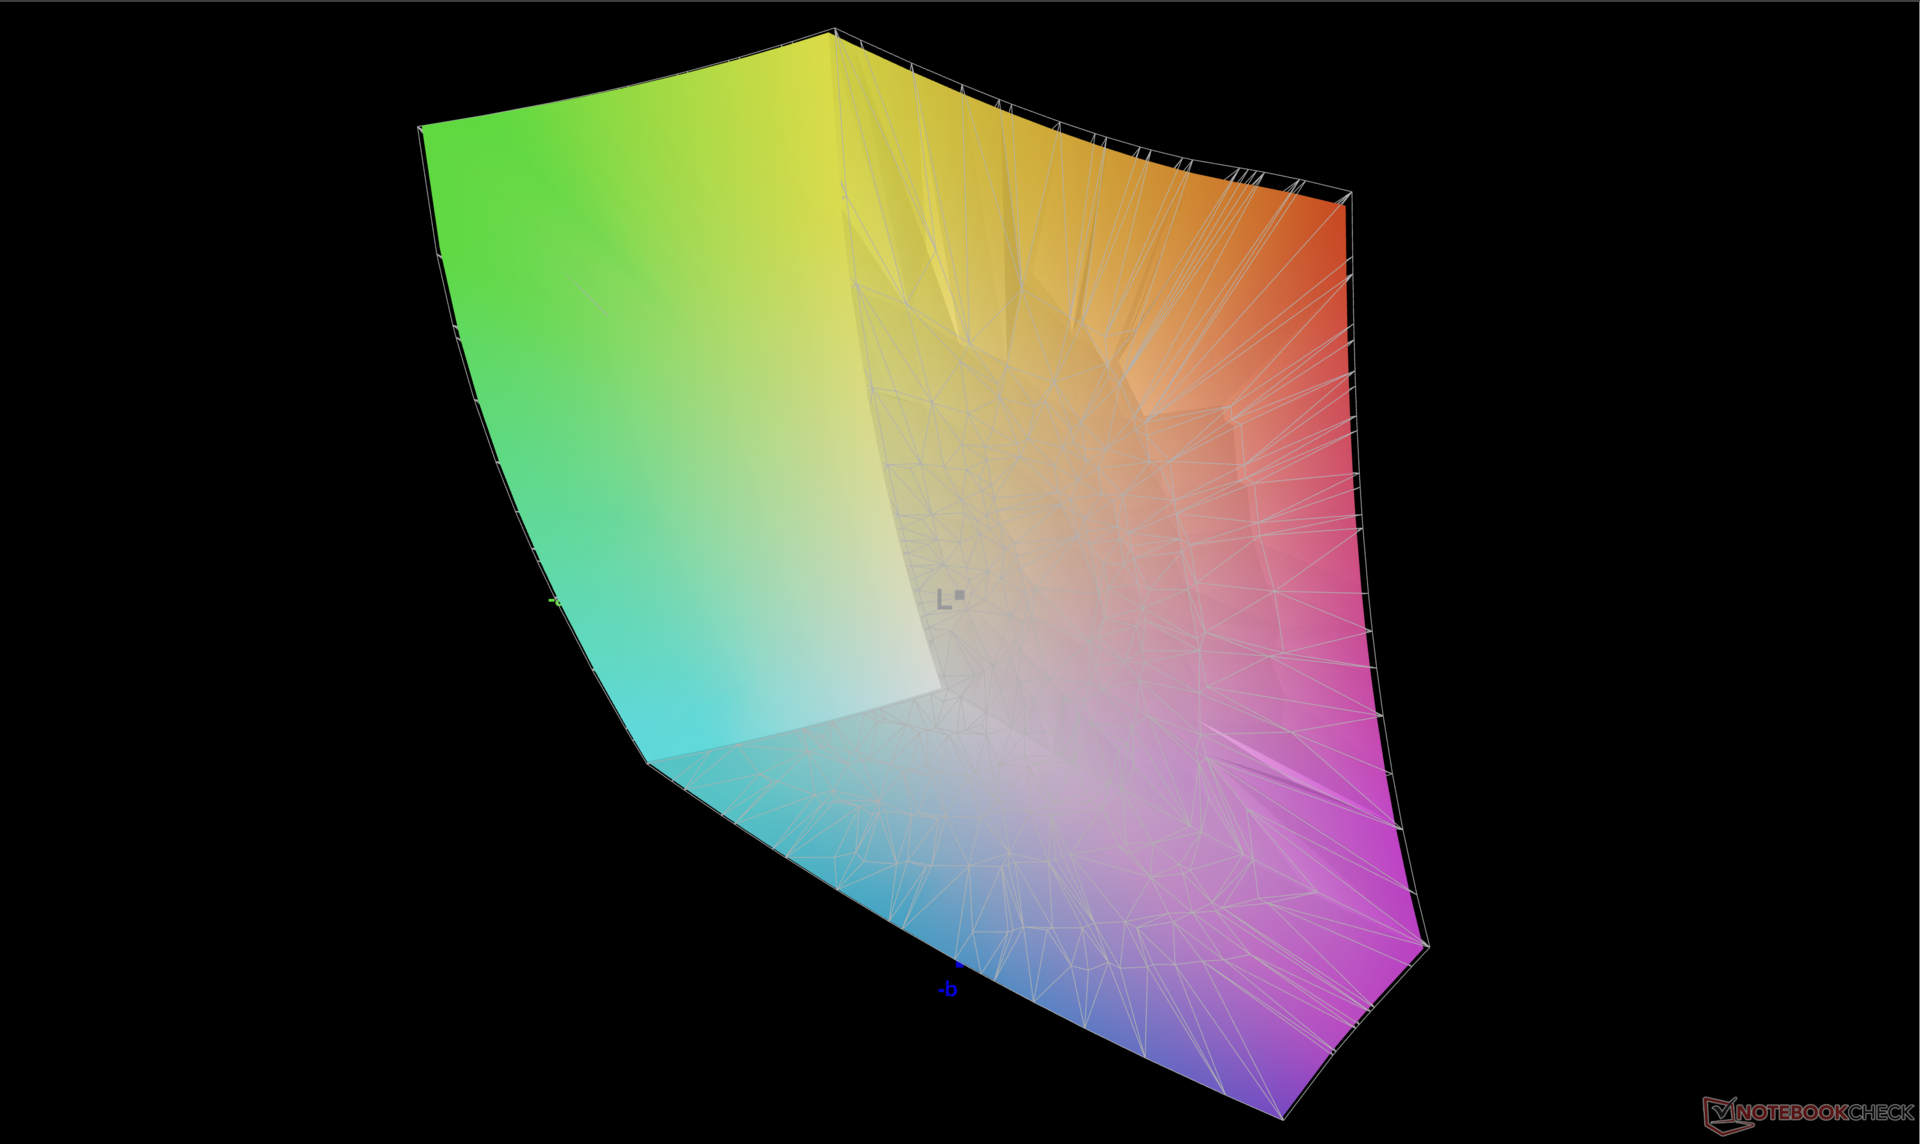
86% AdobeRGB 1998 (Argyll 3D)
99.9% sRGB (Argyll 3D)
97.8% Display P3 (Argyll 3D)
Gamma: 2.13
CCT: 6210 K
| Dell XPS 15 9520 RTX 3050 Ti Samsung 156XG01, OLED, 3456x2160, 15.6" | Dell XPS 15 9510 11800H RTX 3050 Ti OLED SDC414D, OLED, 3456x2160, 15.6" | Dell XPS 15 9500 Core i7 4K UHD Sharp LQ156R1, IPS, 3840x2400, 15.6" | HP Spectre X360 15-5ZV31AV AU Optronics AUO30EB, IPS, 3840x2160, 15.6" | Asus Zenbook Pro 15 OLED UM535Q Samsung ATNA56YX03-0, OLED, 1920x1080, 15.6" | MSI Stealth 15M A11SEK Chi Mei N156HCE-EN1, IPS, 1920x1080, 15.6" | |
|---|---|---|---|---|---|---|
| Display | 5% | 3% | -19% | -7% | -23% | |
| Display P3 Coverage (%) | 97.8 | 99.9 2% | 89.7 -8% | 68.3 -30% | 79.3 -19% | 62 -37% |
| sRGB Coverage (%) | 99.9 | 100 0% | 100 0% | 94.3 -6% | 95.6 -4% | 93.4 -7% |
| AdobeRGB 1998 Coverage (%) | 86 | 98.1 14% | 99.8 16% | 68.4 -20% | 87.3 2% | 64.1 -25% |
| Response Times | -68% | -2195% | -2468% | -16% | -2079% | |
| Response Time Grey 50% / Grey 80% * (ms) | 1.9 ? | 3.6 ? -89% | 54 ? -2742% | 56.8 ? -2889% | 2.1 ? -11% | 47.6 ? -2405% |
| Response Time Black / White * (ms) | 1.9 ? | 2.8 ? -47% | 33.2 ? -1647% | 40.8 ? -2047% | 2.3 ? -21% | 35.2 ? -1753% |
| PWM Frequency (Hz) | 59.52 ? | 59.5 ? | 60.2 | 25000 ? | ||
| Screen | 22% | 5% | -11% | 13% | -4% | |
| Brightness middle (cd/m²) | 381.4 | 362 -5% | 557.9 46% | 284.6 -25% | 342.9 -10% | 279 -27% |
| Brightness (cd/m²) | 384 | 367 -4% | 541 41% | 285 -26% | 346 -10% | 252 -34% |
| Brightness Distribution (%) | 95 | 97 2% | 91 -4% | 85 -11% | 98 3% | 82 -14% |
| Black Level * (cd/m²) | 0.06 | 0.39 | 0.25 | 0.32 | ||
| Colorchecker dE 2000 * | 4.34 | 2.1 52% | 4.54 -5% | 3.52 19% | 2.42 44% | 1.72 60% |
| Colorchecker dE 2000 max. * | 9.24 | 4.1 56% | 7.92 14% | 5.56 40% | 4.05 56% | 5.62 39% |
| Greyscale dE 2000 * | 2 | 1.4 30% | 3.2 -60% | 3.2 -60% | 2.1 -5% | 2.9 -45% |
| Gamma | 2.13 103% | 2.18 101% | 1.99 111% | 2.28 96% | 2.21 100% | 2.3 96% |
| CCT | 6210 105% | 6608 98% | 6451 101% | 7070 92% | 6364 102% | 6700 97% |
| Contrast (:1) | 6033 | 1431 | 1138 | 872 | ||
| Colorchecker dE 2000 calibrated * | 2.5 | 3.82 | 3 | 1.39 | ||
| Color Space (Percent of AdobeRGB 1998) (%) | 89.5 | 61.1 | 59 | |||
| Color Space (Percent of sRGB) (%) | 100 | 93.8 | 93.2 | |||
| Total Average (Program / Settings) | -14% /
1% | -729% /
-395% | -833% /
-460% | -3% /
2% | -702% /
-386% |
* ... smaller is better
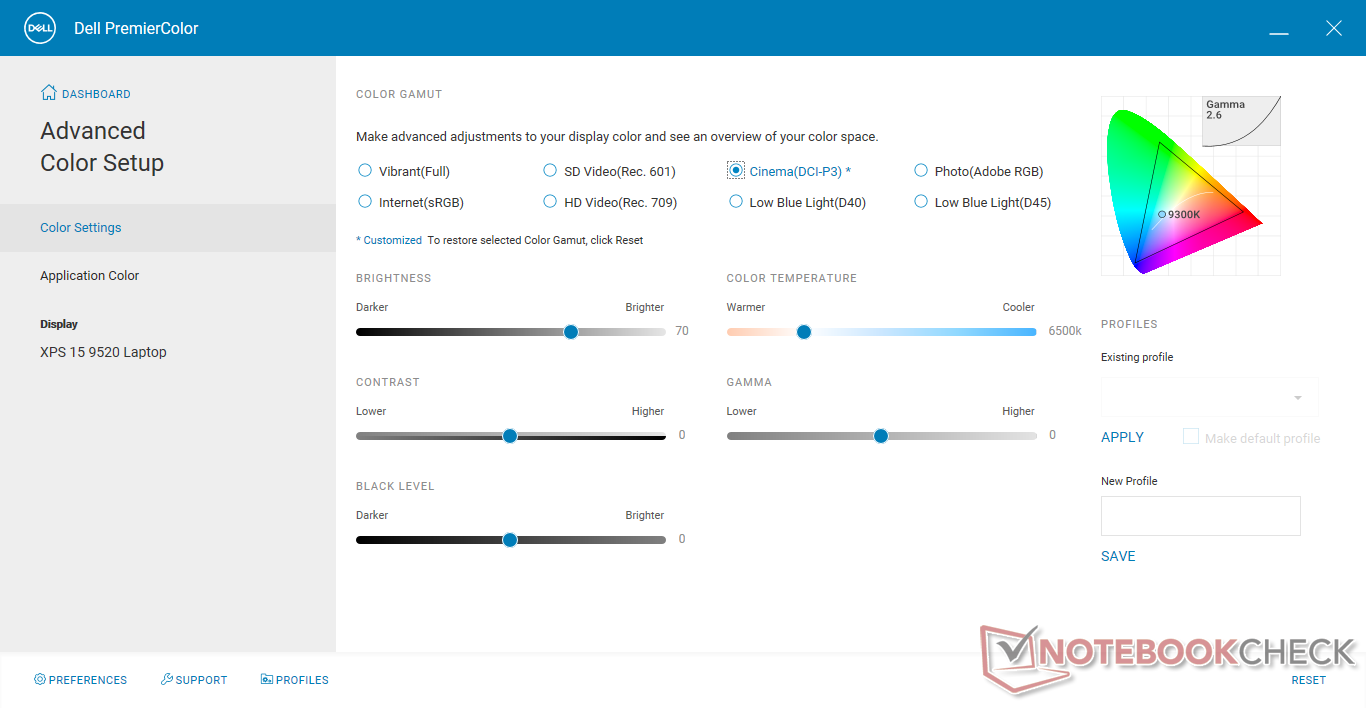
尽管我们可以确认DCI-P3的覆盖率至少为98%,但即使通过PremierColor软件设置为DCI-P3,我们设备上的颜色也没有按照标准进行很好的校准。
Display Response Times
| ↔ Response Time Black to White | ||
|---|---|---|
| 1.9 ms ... rise ↗ and fall ↘ combined | ↗ 1.1 ms rise | 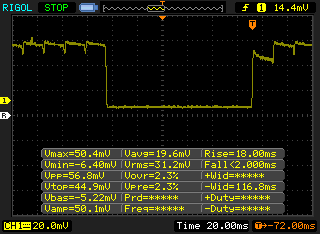 |
| ↘ 0.8 ms fall | ||
| The screen shows very fast response rates in our tests and should be very well suited for fast-paced gaming. In comparison, all tested devices range from 0.1 (minimum) to 240 (maximum) ms. » 11 % of all devices are better. This means that the measured response time is better than the average of all tested devices (19.8 ms). | ||
| ↔ Response Time 50% Grey to 80% Grey | ||
| 1.9 ms ... rise ↗ and fall ↘ combined | ↗ 1.1 ms rise | 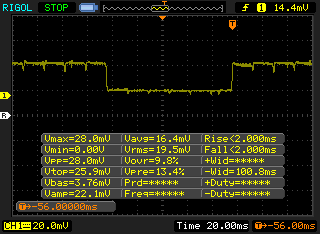 |
| ↘ 0.8 ms fall | ||
| The screen shows very fast response rates in our tests and should be very well suited for fast-paced gaming. In comparison, all tested devices range from 0.165 (minimum) to 636 (maximum) ms. » 9 % of all devices are better. This means that the measured response time is better than the average of all tested devices (31 ms). | ||
Screen Flickering / PWM (Pulse-Width Modulation)
| Screen flickering / PWM detected | 59.52 Hz | ≤ 100 % brightness setting | 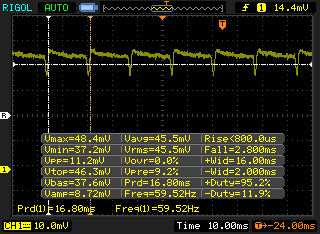 |
The display backlight flickers at 59.52 Hz (worst case, e.g., utilizing PWM) Flickering detected at a brightness setting of 100 % and below. There should be no flickering or PWM above this brightness setting. The frequency of 59.52 Hz is very low, so the flickering may cause eyestrain and headaches after extended use. In comparison: 52 % of all tested devices do not use PWM to dim the display. If PWM was detected, an average of 7754 (minimum: 5 - maximum: 343500) Hz was measured. | |||


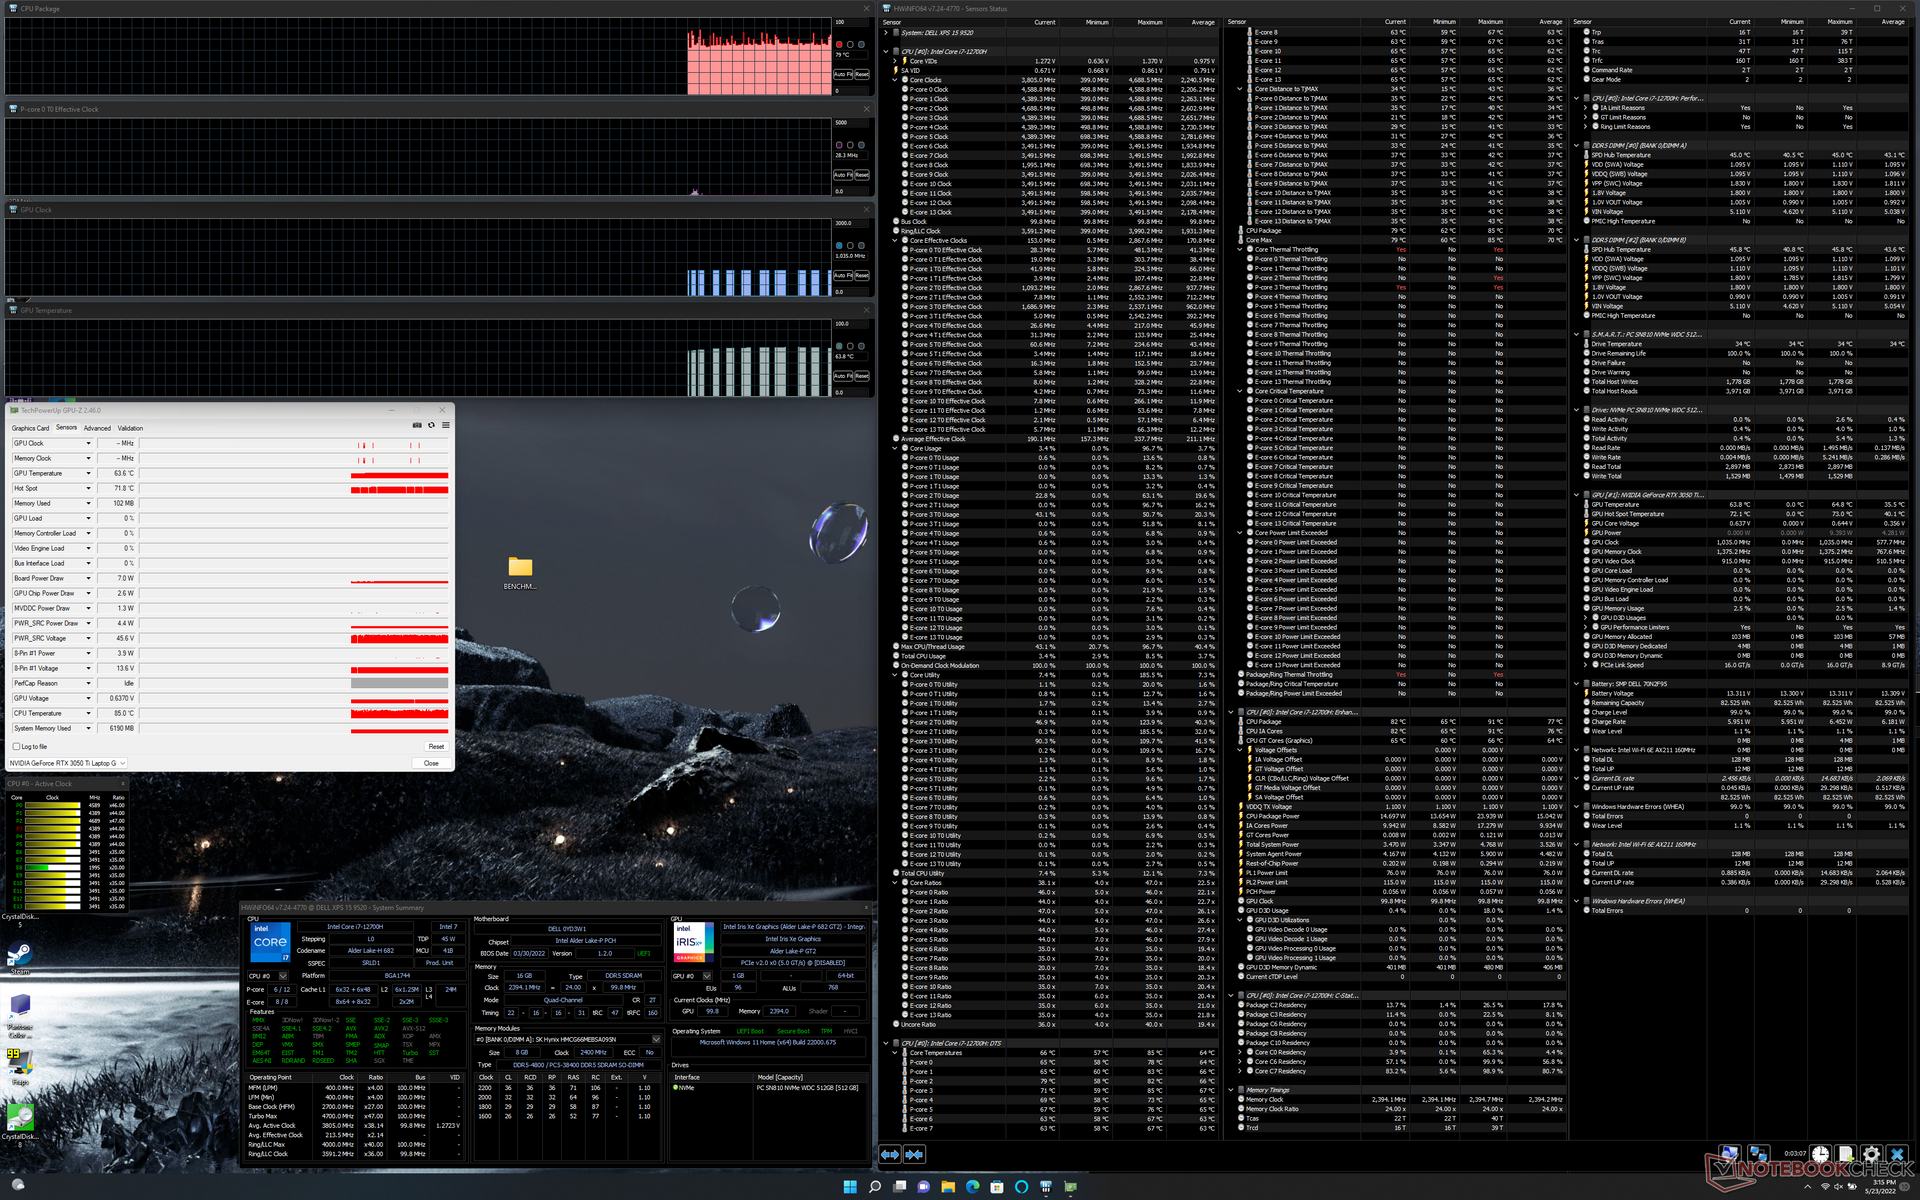
性能 - 英特尔第12代产品选项
测试条件
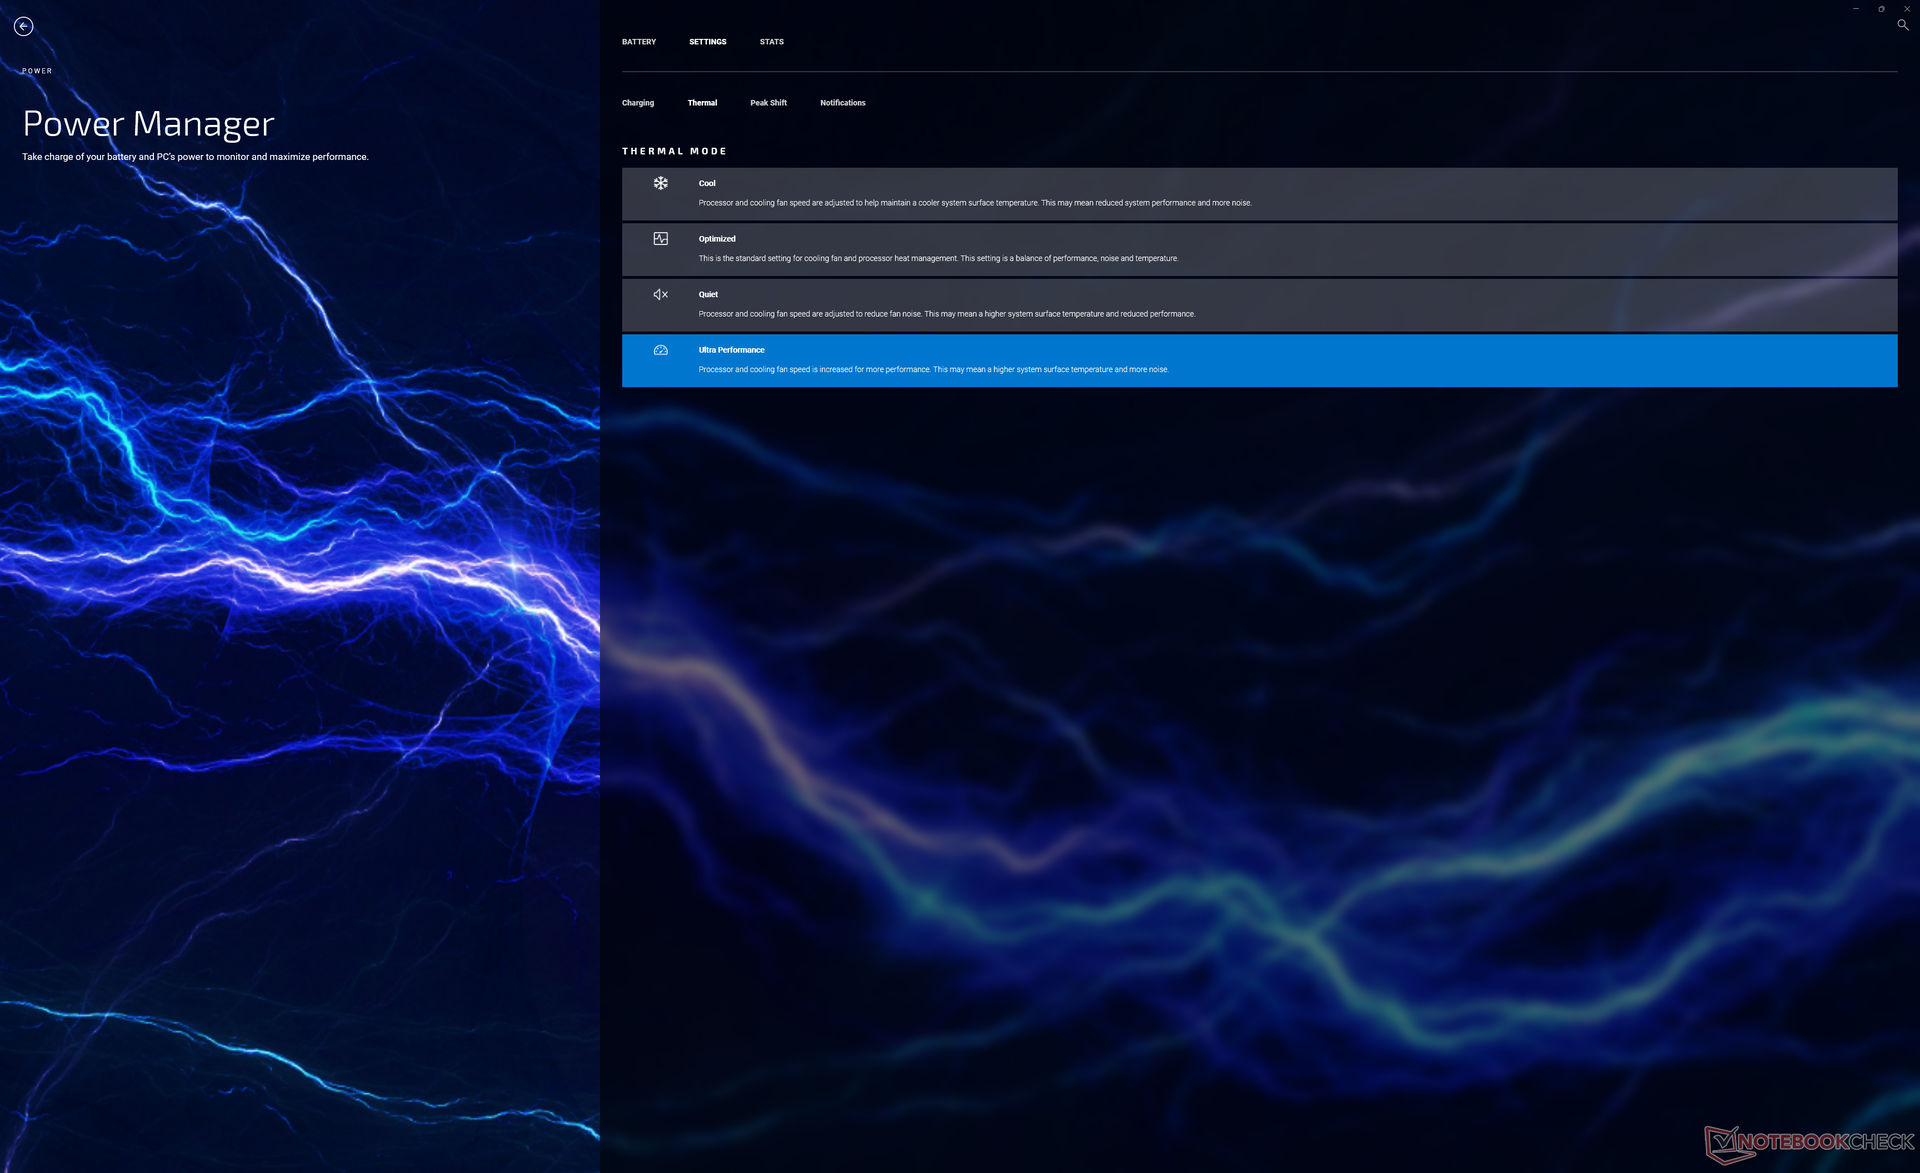
在运行以下任何基准测试之前,我们的设备通过Windows设置为性能模式,通过My Dell应用程序设置为超性能模式,以获得尽可能高的分数。请注意,"我的戴尔 "已经有效地取代了旧的戴尔电源管理器软件。我们建议用户熟悉新的应用程序,因为它是戴尔更新和性能设置的一站式服务。
45 W TGPGeForce RTX 3050 Ti GPU与之前的XPS 15 9510相比没有变化。预计没有MUX开关或自适应同步,因为XPS 15不是为游戏设计的。

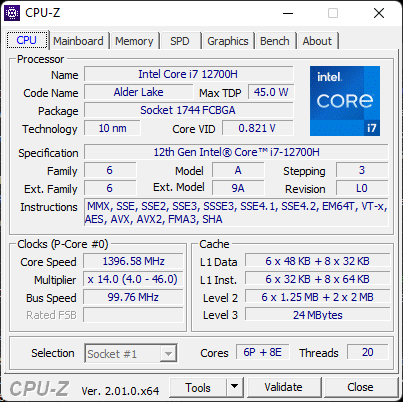
处理器
从XPS 15 9510到9520的CPU性能提升比从XPS 9500到9510的CPU性能提升更为显著。从酷睿i7-11800H到XPS 15 9510的 酷睿i7-12700H将使多线程性能提高35%至40%,单线程性能提高15%至20%。这一跳跃足以推动第12代英特尔CPU略微领先于流行的 Ryzen 7 5800H而后者在多线程工作负载中的表现已经臭名昭著地超过了大多数第11代英特尔Core-H系列CPU。
尽管有上述的同比增长,CPU的性能可能会更好。当与我们迄今为止测试过的其他20多台采用相同的酷睿i7-12700H CPU的笔记本电脑相比,我们的XPS 15 9520中的那台比平均水平慢了大约5%到15%。循环运行CineBench R15 xT显示,戴尔的CPU并不能像其他大多数采用相同处理器的笔记本电脑那样长时间保持高Turbo Boost时钟速率。模型如华硕TUF游戏机F15 FX507ZM可以运行相同的CPU,比我们的戴尔快36%。
Cinebench R15 Multi Loop
Cinebench R23: Multi Core | Single Core
Cinebench R15: CPU Multi 64Bit | CPU Single 64Bit
Blender: v2.79 BMW27 CPU
7-Zip 18.03: 7z b 4 | 7z b 4 -mmt1
Geekbench 5.5: Multi-Core | Single-Core
HWBOT x265 Benchmark v2.2: 4k Preset
LibreOffice : 20 Documents To PDF
R Benchmark 2.5: Overall mean
| Cinebench R20 / CPU (Multi Core) | |
| Corsair One i300 | |
| Asus TUF Gaming F15 FX507ZM | |
| MSI Vector GP66 12UGS | |
| Average Intel Core i7-12700H (1576 - 7407, n=64) | |
| Dell XPS 15 9520 RTX 3050 Ti | |
| Asus Zenbook Pro 15 OLED UM535Q | |
| MSI Alpha 15 B5EEK-008 | |
| Lenovo Legion 5 15ACH6A-82NW0010GE | |
| Dell XPS 15 9510 11800H RTX 3050 Ti OLED | |
| Dell XPS 15 9500 Core i7 4K UHD | |
| MSI Stealth 15M A11SEK | |
| HP Spectre X360 15-5ZV31AV | |
| Cinebench R20 / CPU (Single Core) | |
| Corsair One i300 | |
| MSI Vector GP66 12UGS | |
| Asus TUF Gaming F15 FX507ZM | |
| Dell XPS 15 9520 RTX 3050 Ti | |
| Average Intel Core i7-12700H (300 - 704, n=64) | |
| Dell XPS 15 9510 11800H RTX 3050 Ti OLED | |
| MSI Stealth 15M A11SEK | |
| Asus Zenbook Pro 15 OLED UM535Q | |
| MSI Alpha 15 B5EEK-008 | |
| Lenovo Legion 5 15ACH6A-82NW0010GE | |
| Dell XPS 15 9500 Core i7 4K UHD | |
| HP Spectre X360 15-5ZV31AV | |
| Cinebench R23 / Multi Core | |
| Corsair One i300 | |
| Asus TUF Gaming F15 FX507ZM | |
| MSI Vector GP66 12UGS | |
| Average Intel Core i7-12700H (4032 - 19330, n=64) | |
| Dell XPS 15 9520 RTX 3050 Ti | |
| Asus Zenbook Pro 15 OLED UM535Q | |
| MSI Alpha 15 B5EEK-008 | |
| Dell XPS 15 9510 11800H RTX 3050 Ti OLED | |
| Lenovo Legion 5 15ACH6A-82NW0010GE | |
| MSI Stealth 15M A11SEK | |
| Cinebench R23 / Single Core | |
| Corsair One i300 | |
| MSI Vector GP66 12UGS | |
| Dell XPS 15 9520 RTX 3050 Ti | |
| Asus TUF Gaming F15 FX507ZM | |
| Average Intel Core i7-12700H (778 - 1826, n=63) | |
| MSI Stealth 15M A11SEK | |
| Dell XPS 15 9510 11800H RTX 3050 Ti OLED | |
| Asus Zenbook Pro 15 OLED UM535Q | |
| MSI Alpha 15 B5EEK-008 | |
| Lenovo Legion 5 15ACH6A-82NW0010GE | |
| Cinebench R15 / CPU Multi 64Bit | |
| Corsair One i300 | |
| Asus TUF Gaming F15 FX507ZM | |
| Average Intel Core i7-12700H (1379 - 2916, n=70) | |
| MSI Vector GP66 12UGS | |
| Dell XPS 15 9520 RTX 3050 Ti | |
| Asus Zenbook Pro 15 OLED UM535Q | |
| Dell XPS 15 9510 11800H RTX 3050 Ti OLED | |
| Dell XPS 15 9510 11800H RTX 3050 Ti OLED | |
| MSI Alpha 15 B5EEK-008 | |
| Lenovo Legion 5 15ACH6A-82NW0010GE | |
| Dell XPS 15 9500 Core i7 4K UHD | |
| MSI Stealth 15M A11SEK | |
| HP Spectre X360 15-5ZV31AV | |
| Cinebench R15 / CPU Single 64Bit | |
| Corsair One i300 | |
| MSI Vector GP66 12UGS | |
| Asus TUF Gaming F15 FX507ZM | |
| Average Intel Core i7-12700H (113 - 263, n=65) | |
| Dell XPS 15 9520 RTX 3050 Ti | |
| Asus Zenbook Pro 15 OLED UM535Q | |
| MSI Alpha 15 B5EEK-008 | |
| Dell XPS 15 9510 11800H RTX 3050 Ti OLED | |
| MSI Stealth 15M A11SEK | |
| Lenovo Legion 5 15ACH6A-82NW0010GE | |
| Dell XPS 15 9500 Core i7 4K UHD | |
| HP Spectre X360 15-5ZV31AV | |
| Blender / v2.79 BMW27 CPU | |
| MSI Stealth 15M A11SEK | |
| Dell XPS 15 9500 Core i7 4K UHD | |
| Lenovo Legion 5 15ACH6A-82NW0010GE | |
| Dell XPS 15 9510 11800H RTX 3050 Ti OLED | |
| MSI Alpha 15 B5EEK-008 | |
| Asus Zenbook Pro 15 OLED UM535Q | |
| Dell XPS 15 9520 RTX 3050 Ti | |
| Average Intel Core i7-12700H (168 - 732, n=63) | |
| MSI Vector GP66 12UGS | |
| Asus TUF Gaming F15 FX507ZM | |
| Corsair One i300 | |
| 7-Zip 18.03 / 7z b 4 | |
| Corsair One i300 | |
| Asus TUF Gaming F15 FX507ZM | |
| MSI Vector GP66 12UGS | |
| Dell XPS 15 9520 RTX 3050 Ti | |
| Average Intel Core i7-12700H (22844 - 73067, n=63) | |
| Asus Zenbook Pro 15 OLED UM535Q | |
| MSI Alpha 15 B5EEK-008 | |
| Lenovo Legion 5 15ACH6A-82NW0010GE | |
| Dell XPS 15 9510 11800H RTX 3050 Ti OLED | |
| Dell XPS 15 9500 Core i7 4K UHD | |
| MSI Stealth 15M A11SEK | |
| 7-Zip 18.03 / 7z b 4 -mmt1 | |
| Corsair One i300 | |
| MSI Vector GP66 12UGS | |
| Dell XPS 15 9520 RTX 3050 Ti | |
| Average Intel Core i7-12700H (2743 - 5972, n=63) | |
| Asus Zenbook Pro 15 OLED UM535Q | |
| MSI Alpha 15 B5EEK-008 | |
| Dell XPS 15 9510 11800H RTX 3050 Ti OLED | |
| MSI Stealth 15M A11SEK | |
| Asus TUF Gaming F15 FX507ZM | |
| Dell XPS 15 9500 Core i7 4K UHD | |
| Lenovo Legion 5 15ACH6A-82NW0010GE | |
| Geekbench 5.5 / Multi-Core | |
| Corsair One i300 | |
| MSI Vector GP66 12UGS | |
| Asus TUF Gaming F15 FX507ZM | |
| Dell XPS 15 9520 RTX 3050 Ti | |
| Average Intel Core i7-12700H (5144 - 13745, n=64) | |
| Asus Zenbook Pro 15 OLED UM535Q | |
| MSI Alpha 15 B5EEK-008 | |
| Dell XPS 15 9510 11800H RTX 3050 Ti OLED | |
| Dell XPS 15 9500 Core i7 4K UHD | |
| Lenovo Legion 5 15ACH6A-82NW0010GE | |
| MSI Stealth 15M A11SEK | |
| Geekbench 5.5 / Single-Core | |
| Corsair One i300 | |
| MSI Vector GP66 12UGS | |
| Dell XPS 15 9520 RTX 3050 Ti | |
| Asus TUF Gaming F15 FX507ZM | |
| Average Intel Core i7-12700H (803 - 1851, n=64) | |
| MSI Stealth 15M A11SEK | |
| Dell XPS 15 9510 11800H RTX 3050 Ti OLED | |
| Asus Zenbook Pro 15 OLED UM535Q | |
| MSI Alpha 15 B5EEK-008 | |
| Lenovo Legion 5 15ACH6A-82NW0010GE | |
| Dell XPS 15 9500 Core i7 4K UHD | |
| HWBOT x265 Benchmark v2.2 / 4k Preset | |
| Corsair One i300 | |
| Asus TUF Gaming F15 FX507ZM | |
| MSI Vector GP66 12UGS | |
| Average Intel Core i7-12700H (4.67 - 21.8, n=64) | |
| MSI Alpha 15 B5EEK-008 | |
| Asus Zenbook Pro 15 OLED UM535Q | |
| Dell XPS 15 9520 RTX 3050 Ti | |
| Lenovo Legion 5 15ACH6A-82NW0010GE | |
| Dell XPS 15 9510 11800H RTX 3050 Ti OLED | |
| Dell XPS 15 9500 Core i7 4K UHD | |
| MSI Stealth 15M A11SEK | |
| LibreOffice / 20 Documents To PDF | |
| MSI Alpha 15 B5EEK-008 | |
| Lenovo Legion 5 15ACH6A-82NW0010GE | |
| Dell XPS 15 9500 Core i7 4K UHD | |
| MSI Stealth 15M A11SEK | |
| Asus TUF Gaming F15 FX507ZM | |
| Asus Zenbook Pro 15 OLED UM535Q | |
| Dell XPS 15 9510 11800H RTX 3050 Ti OLED | |
| Average Intel Core i7-12700H (34.2 - 95.3, n=63) | |
| Dell XPS 15 9520 RTX 3050 Ti | |
| MSI Vector GP66 12UGS | |
| Corsair One i300 | |
| R Benchmark 2.5 / Overall mean | |
| Dell XPS 15 9500 Core i7 4K UHD | |
| Dell XPS 15 9510 11800H RTX 3050 Ti OLED | |
| MSI Stealth 15M A11SEK | |
| Lenovo Legion 5 15ACH6A-82NW0010GE | |
| MSI Alpha 15 B5EEK-008 | |
| Asus Zenbook Pro 15 OLED UM535Q | |
| Average Intel Core i7-12700H (0.4441 - 1.052, n=63) | |
| Asus TUF Gaming F15 FX507ZM | |
| Dell XPS 15 9520 RTX 3050 Ti | |
| MSI Vector GP66 12UGS | |
| Corsair One i300 | |
* ... smaller is better
AIDA64: FP32 Ray-Trace | FPU Julia | CPU SHA3 | CPU Queen | FPU SinJulia | FPU Mandel | CPU AES | CPU ZLib | FP64 Ray-Trace | CPU PhotoWorxx
| Performance rating | |
| Asus Zenbook Pro 15 OLED UM535Q | |
| Average Intel Core i7-12700H | |
| Dell XPS 15 9520 RTX 3050 Ti | |
| Dell XPS 15 9500 Core i7 4K UHD | |
| Dell XPS 15 9510 11800H RTX 3050 Ti OLED -9! | |
| AIDA64 / FP32 Ray-Trace | |
| Asus Zenbook Pro 15 OLED UM535Q | |
| Average Intel Core i7-12700H (2585 - 17957, n=64) | |
| Dell XPS 15 9500 Core i7 4K UHD | |
| Dell XPS 15 9520 RTX 3050 Ti | |
| AIDA64 / FPU Julia | |
| Asus Zenbook Pro 15 OLED UM535Q | |
| Dell XPS 15 9500 Core i7 4K UHD | |
| Average Intel Core i7-12700H (12439 - 90760, n=64) | |
| Dell XPS 15 9520 RTX 3050 Ti | |
| AIDA64 / CPU SHA3 | |
| Asus Zenbook Pro 15 OLED UM535Q | |
| Average Intel Core i7-12700H (833 - 4242, n=64) | |
| Dell XPS 15 9500 Core i7 4K UHD | |
| Dell XPS 15 9520 RTX 3050 Ti | |
| AIDA64 / CPU Queen | |
| Asus Zenbook Pro 15 OLED UM535Q | |
| Dell XPS 15 9520 RTX 3050 Ti | |
| Average Intel Core i7-12700H (57923 - 103202, n=63) | |
| Dell XPS 15 9500 Core i7 4K UHD | |
| AIDA64 / FPU SinJulia | |
| Asus Zenbook Pro 15 OLED UM535Q | |
| Dell XPS 15 9500 Core i7 4K UHD | |
| Average Intel Core i7-12700H (3249 - 9939, n=64) | |
| Dell XPS 15 9520 RTX 3050 Ti | |
| AIDA64 / FPU Mandel | |
| Asus Zenbook Pro 15 OLED UM535Q | |
| Dell XPS 15 9500 Core i7 4K UHD | |
| Average Intel Core i7-12700H (7135 - 44760, n=64) | |
| Dell XPS 15 9520 RTX 3050 Ti | |
| AIDA64 / CPU AES | |
| Asus Zenbook Pro 15 OLED UM535Q | |
| Average Intel Core i7-12700H (31839 - 144360, n=64) | |
| Dell XPS 15 9520 RTX 3050 Ti | |
| Dell XPS 15 9500 Core i7 4K UHD | |
| AIDA64 / CPU ZLib | |
| Average Intel Core i7-12700H (305 - 1171, n=64) | |
| Dell XPS 15 9520 RTX 3050 Ti | |
| Asus Zenbook Pro 15 OLED UM535Q | |
| Dell XPS 15 9500 Core i7 4K UHD | |
| Dell XPS 15 9510 11800H RTX 3050 Ti OLED | |
| AIDA64 / FP64 Ray-Trace | |
| Asus Zenbook Pro 15 OLED UM535Q | |
| Average Intel Core i7-12700H (1437 - 9692, n=64) | |
| Dell XPS 15 9520 RTX 3050 Ti | |
| Dell XPS 15 9500 Core i7 4K UHD | |
| AIDA64 / CPU PhotoWorxx | |
| Dell XPS 15 9520 RTX 3050 Ti | |
| Average Intel Core i7-12700H (12863 - 52207, n=64) | |
| Dell XPS 15 9500 Core i7 4K UHD | |
| Asus Zenbook Pro 15 OLED UM535Q | |
系统性能
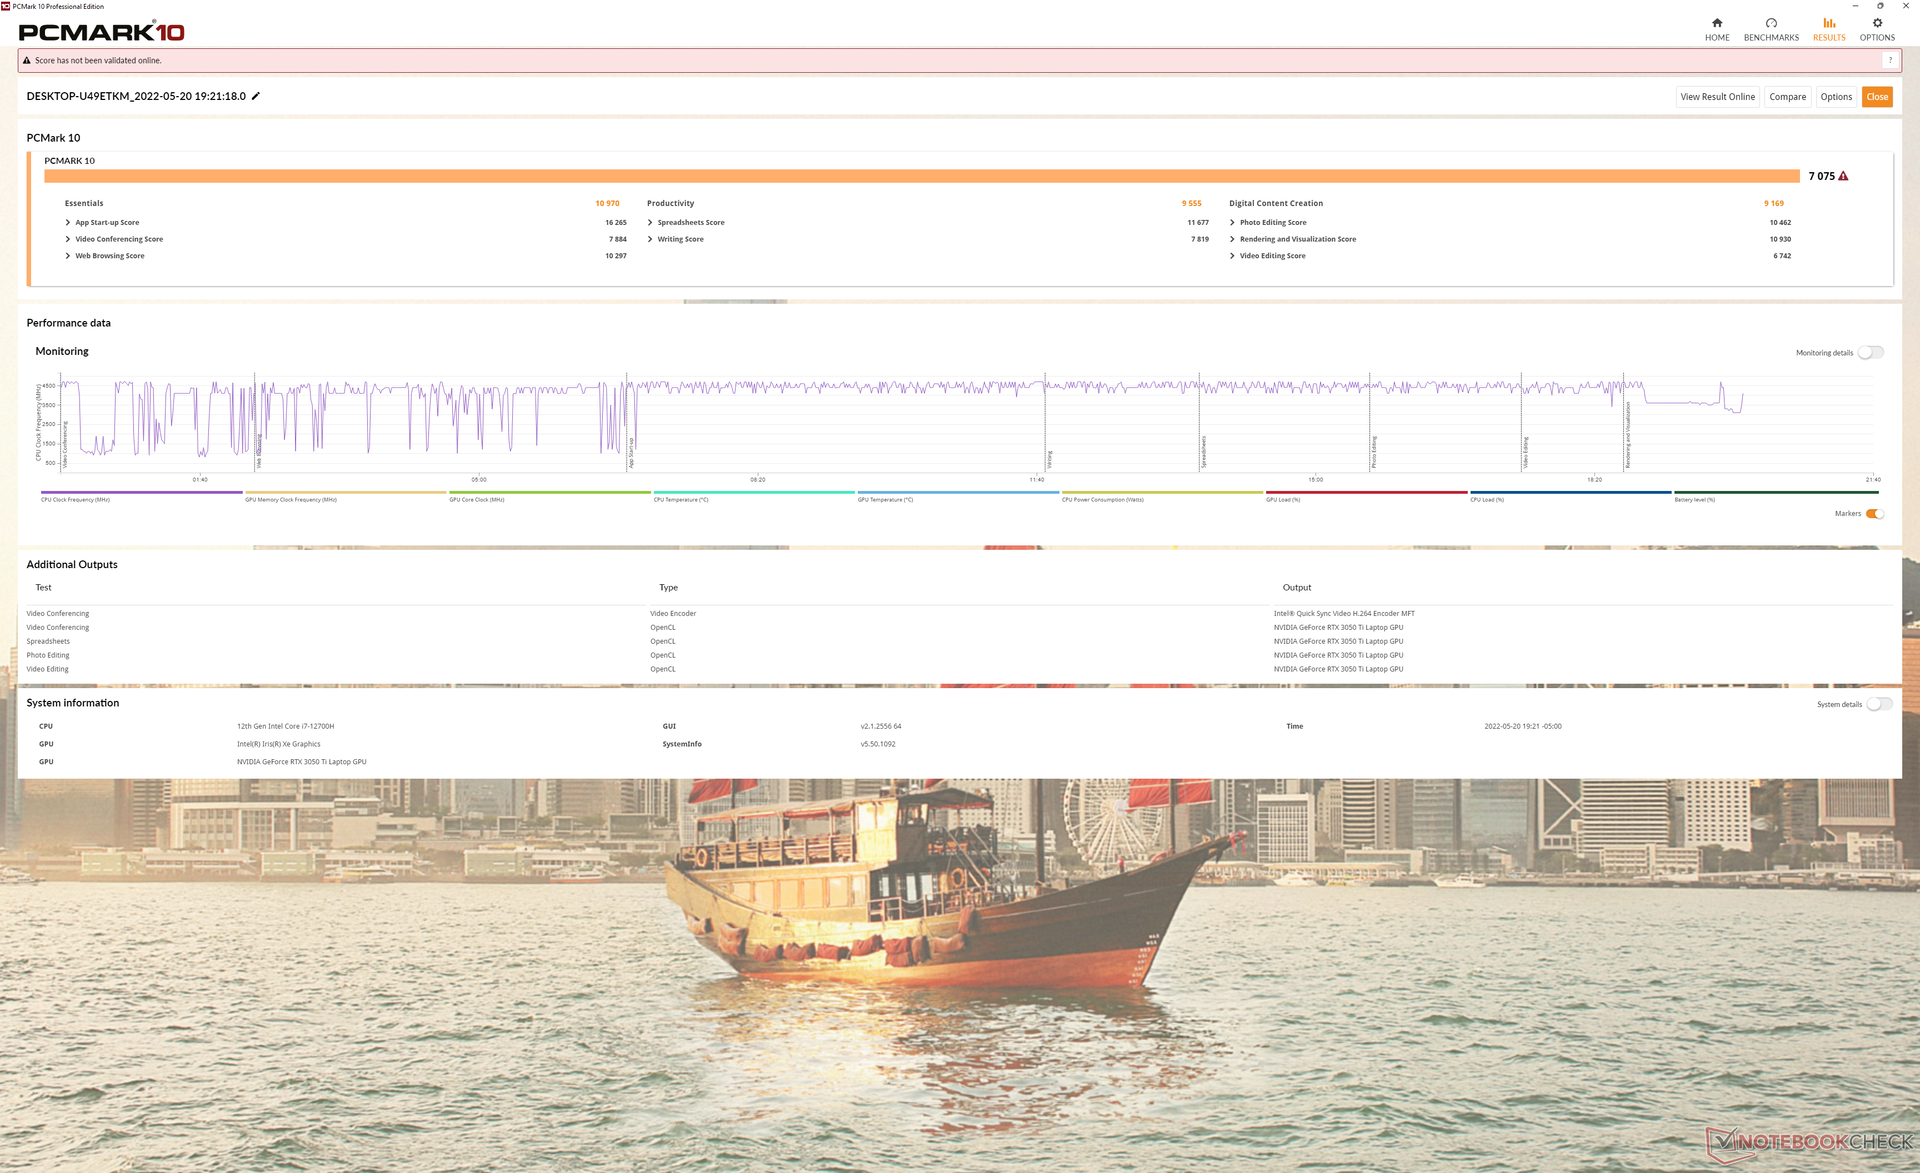
PCMark 10的结果始终高于我们在旧版XPS 15 9510和9500上记录的结果,这主要是由于CPU和SSD性能的提升。
CrossMark: Overall | Productivity | Creativity | Responsiveness
| PCMark 10 / Score | |
| Dell XPS 15 9520 RTX 3050 Ti | |
| Average Intel Core i7-12700H, NVIDIA GeForce RTX 3050 Ti Laptop GPU (6623 - 7075, n=5) | |
| Asus Zenbook Pro 15 OLED UM535Q | |
| Dell XPS 15 9510 11800H RTX 3050 Ti OLED | |
| MSI Stealth 15M A11SEK | |
| Dell XPS 15 9500 Core i7 4K UHD | |
| HP Spectre X360 15-5ZV31AV | |
| PCMark 10 / Essentials | |
| Dell XPS 15 9520 RTX 3050 Ti | |
| Asus Zenbook Pro 15 OLED UM535Q | |
| Average Intel Core i7-12700H, NVIDIA GeForce RTX 3050 Ti Laptop GPU (9540 - 10970, n=5) | |
| Dell XPS 15 9500 Core i7 4K UHD | |
| MSI Stealth 15M A11SEK | |
| Dell XPS 15 9510 11800H RTX 3050 Ti OLED | |
| HP Spectre X360 15-5ZV31AV | |
| PCMark 10 / Productivity | |
| Asus Zenbook Pro 15 OLED UM535Q | |
| Dell XPS 15 9520 RTX 3050 Ti | |
| Average Intel Core i7-12700H, NVIDIA GeForce RTX 3050 Ti Laptop GPU (8530 - 9555, n=5) | |
| MSI Stealth 15M A11SEK | |
| Dell XPS 15 9510 11800H RTX 3050 Ti OLED | |
| Dell XPS 15 9500 Core i7 4K UHD | |
| HP Spectre X360 15-5ZV31AV | |
| PCMark 10 / Digital Content Creation | |
| Average Intel Core i7-12700H, NVIDIA GeForce RTX 3050 Ti Laptop GPU (8855 - 9542, n=5) | |
| Dell XPS 15 9520 RTX 3050 Ti | |
| Asus Zenbook Pro 15 OLED UM535Q | |
| Dell XPS 15 9510 11800H RTX 3050 Ti OLED | |
| MSI Stealth 15M A11SEK | |
| Dell XPS 15 9500 Core i7 4K UHD | |
| HP Spectre X360 15-5ZV31AV | |
| CrossMark / Overall | |
| Dell XPS 15 9520 RTX 3050 Ti | |
| Average Intel Core i7-12700H, NVIDIA GeForce RTX 3050 Ti Laptop GPU (1654 - 1872, n=5) | |
| Asus Zenbook Pro 15 OLED UM535Q | |
| CrossMark / Productivity | |
| Dell XPS 15 9520 RTX 3050 Ti | |
| Average Intel Core i7-12700H, NVIDIA GeForce RTX 3050 Ti Laptop GPU (1595 - 1792, n=5) | |
| Asus Zenbook Pro 15 OLED UM535Q | |
| CrossMark / Creativity | |
| Dell XPS 15 9520 RTX 3050 Ti | |
| Average Intel Core i7-12700H, NVIDIA GeForce RTX 3050 Ti Laptop GPU (1699 - 1993, n=5) | |
| Asus Zenbook Pro 15 OLED UM535Q | |
| CrossMark / Responsiveness | |
| Dell XPS 15 9520 RTX 3050 Ti | |
| Average Intel Core i7-12700H, NVIDIA GeForce RTX 3050 Ti Laptop GPU (1383 - 1768, n=5) | |
| Asus Zenbook Pro 15 OLED UM535Q | |
| PCMark 10 Score | 7075 points | |
Help | ||
| AIDA64 / Memory Copy | |
| Dell XPS 15 9520 RTX 3050 Ti | |
| Average Intel Core i7-12700H (25615 - 80511, n=64) | |
| Asus Zenbook Pro 15 OLED UM535Q | |
| Dell XPS 15 9500 Core i7 4K UHD | |
| AIDA64 / Memory Read | |
| Dell XPS 15 9520 RTX 3050 Ti | |
| Average Intel Core i7-12700H (25586 - 79442, n=64) | |
| Asus Zenbook Pro 15 OLED UM535Q | |
| Dell XPS 15 9500 Core i7 4K UHD | |
| AIDA64 / Memory Write | |
| Dell XPS 15 9520 RTX 3050 Ti | |
| Average Intel Core i7-12700H (23679 - 88660, n=64) | |
| Asus Zenbook Pro 15 OLED UM535Q | |
| Dell XPS 15 9500 Core i7 4K UHD | |
| AIDA64 / Memory Latency | |
| Dell XPS 15 9520 RTX 3050 Ti | |
| Asus Zenbook Pro 15 OLED UM535Q | |
| Average Intel Core i7-12700H (76.2 - 133.9, n=62) | |
| Dell XPS 15 9500 Core i7 4K UHD | |
| Dell XPS 15 9510 11800H RTX 3050 Ti OLED | |
* ... smaller is better
DPC延时
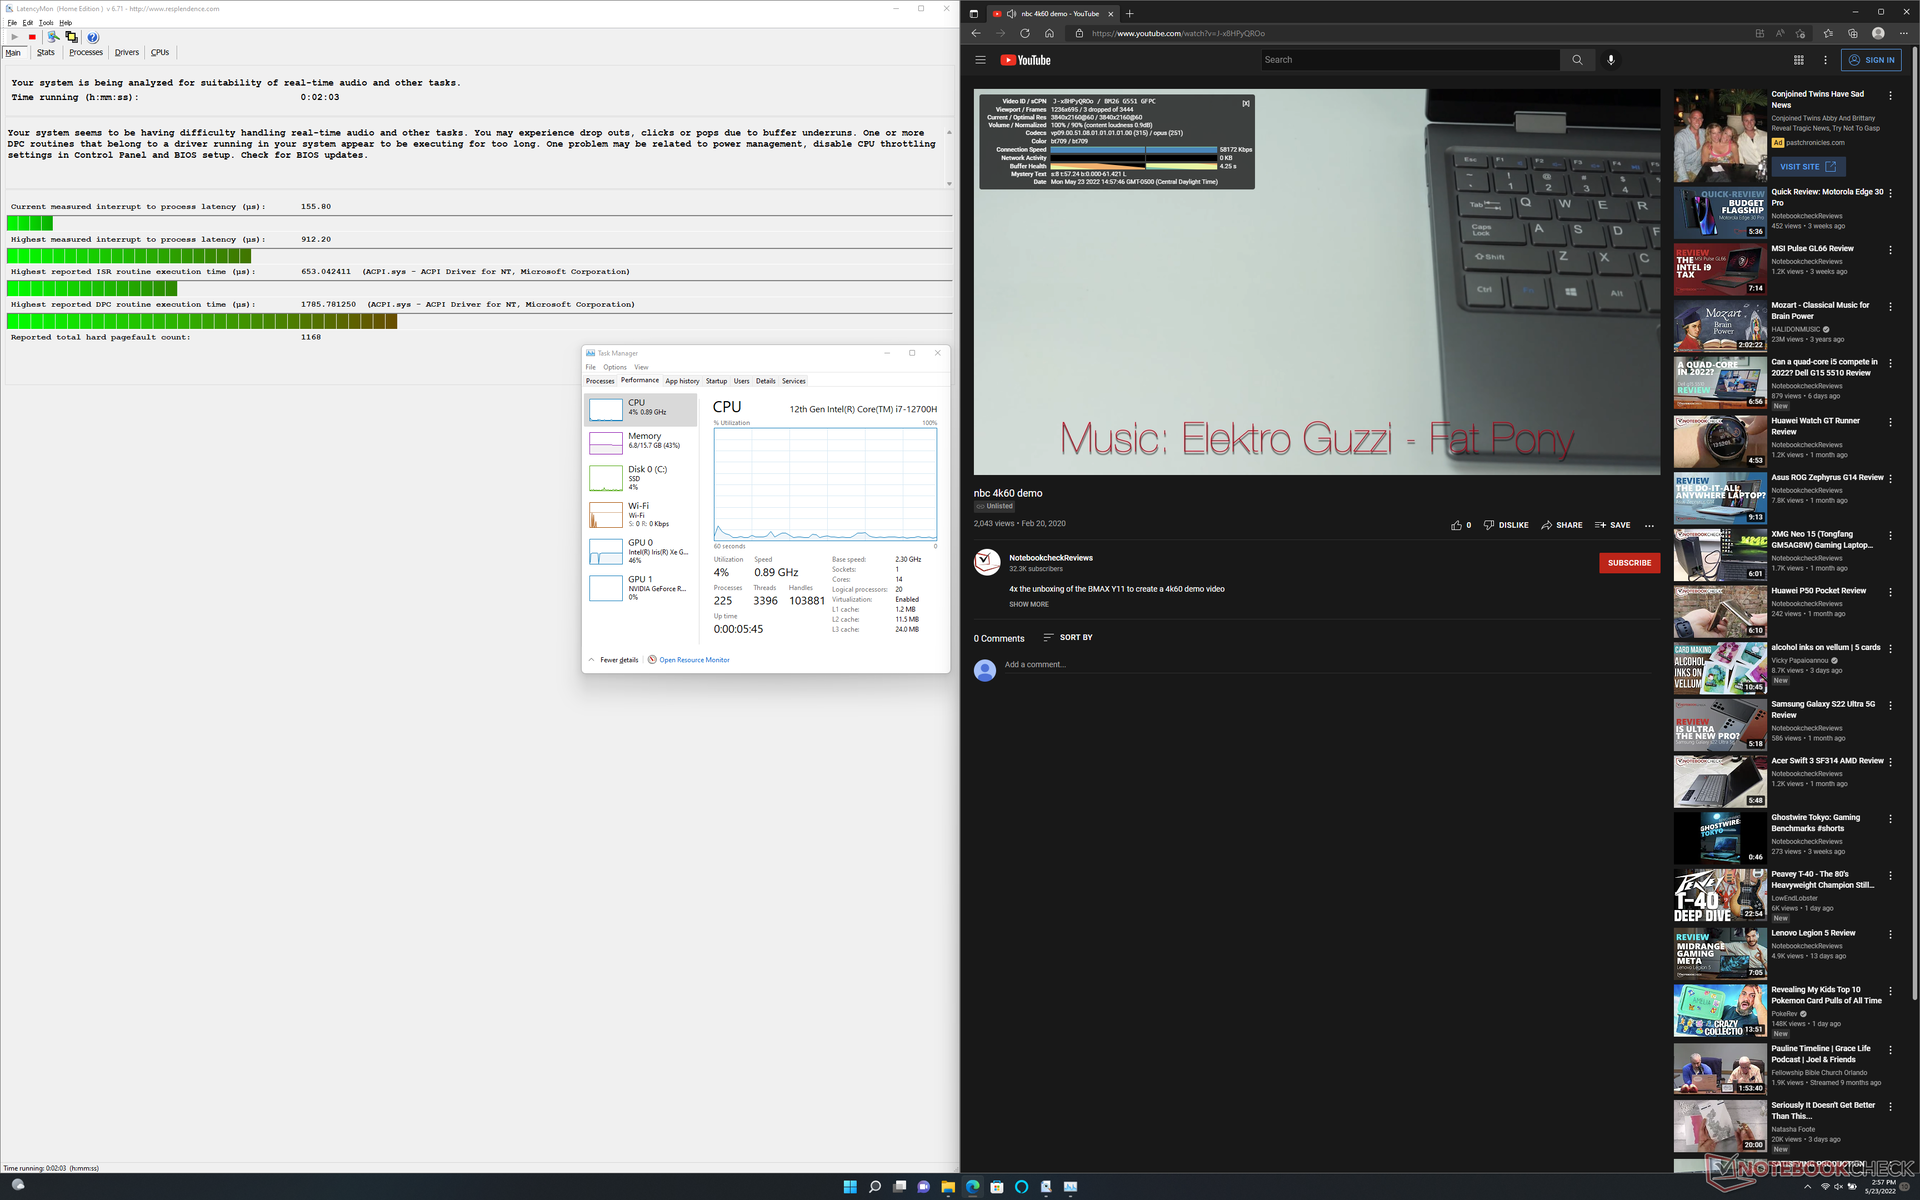
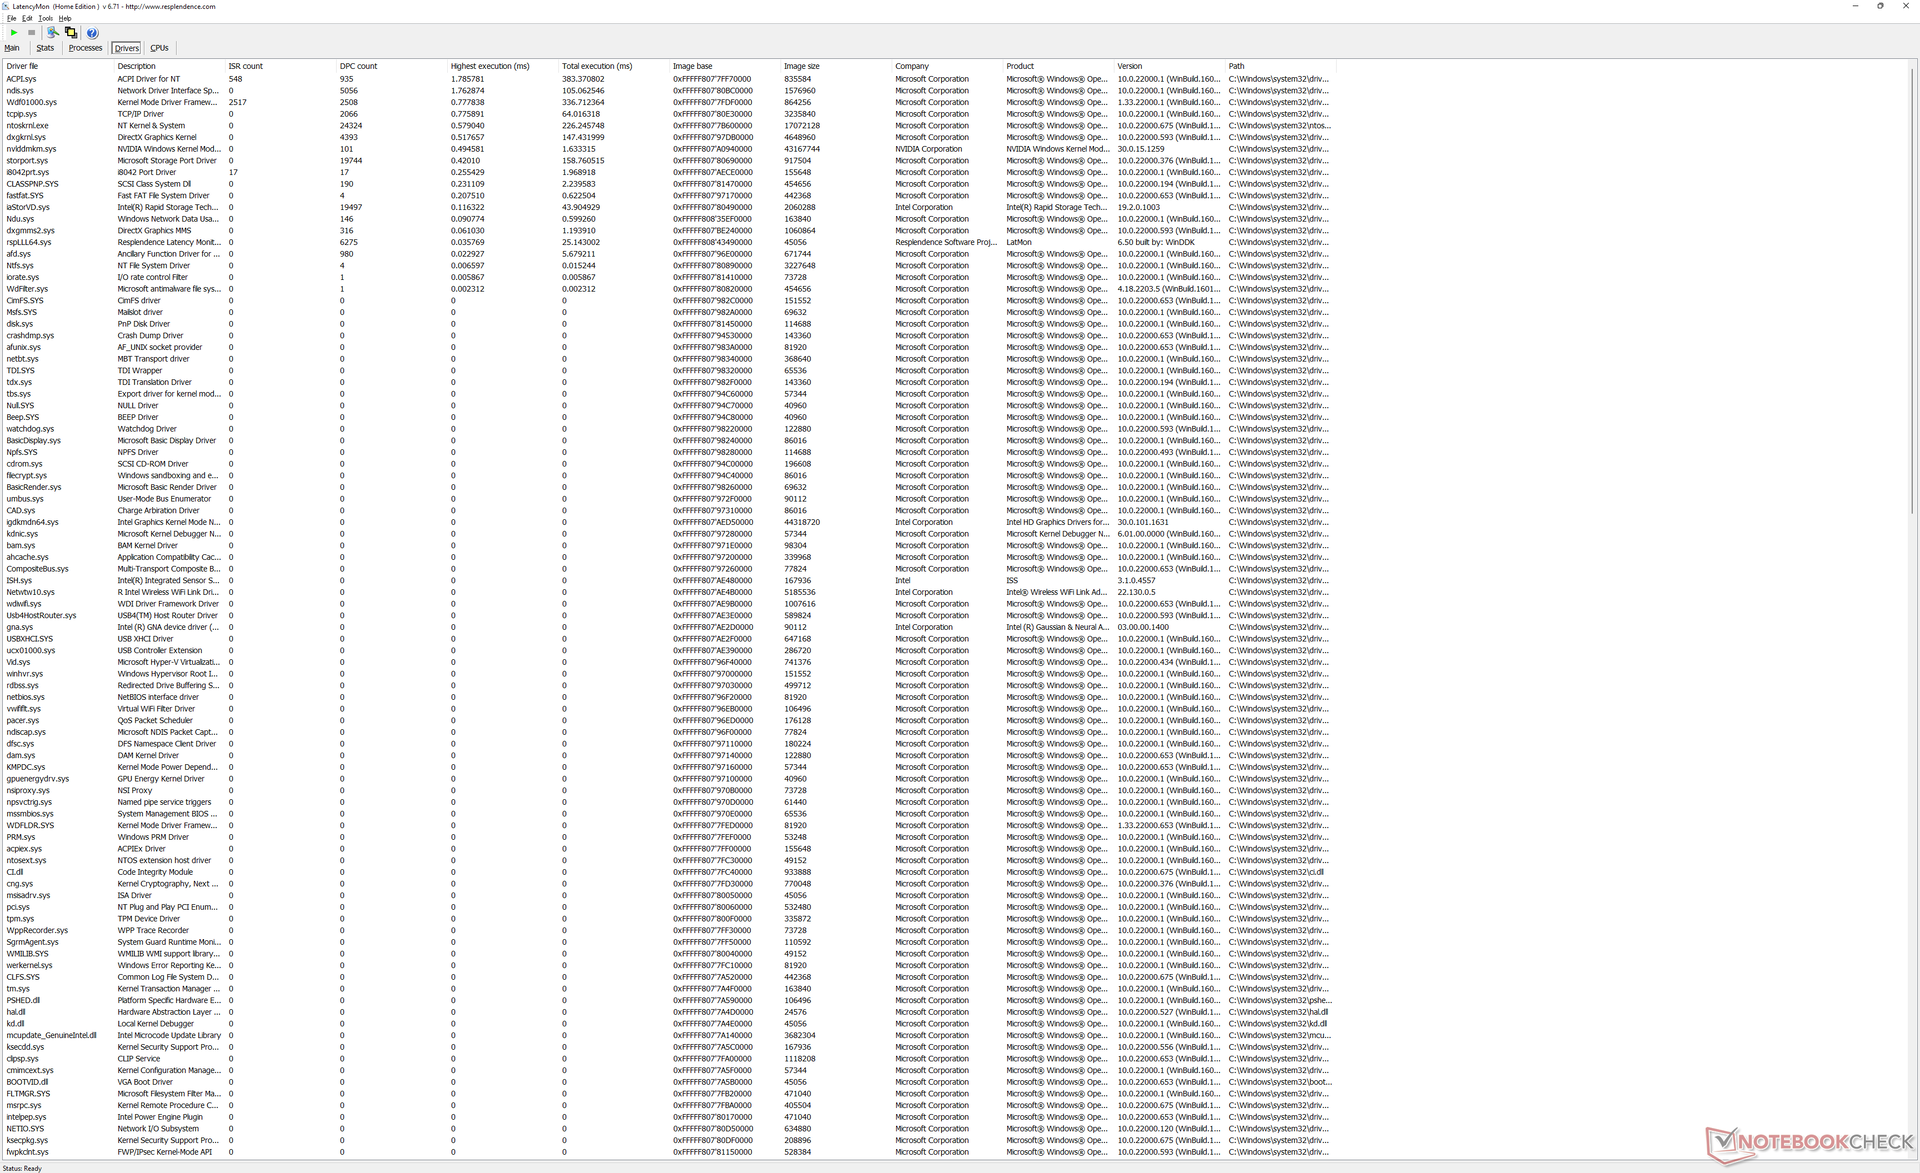
LatencyMon揭示了在我们的主页上打开多个浏览器标签时的轻微DPC问题。在我们长达1分钟的视频测试中,4K视频在60FPS下的播放非常流畅,只有3个丢帧。
| DPC Latencies / LatencyMon - interrupt to process latency (max), Web, Youtube, Prime95 | |
| Dell XPS 15 9500 Core i7 4K UHD | |
| Dell XPS 15 9510 11800H RTX 3050 Ti OLED | |
| Dell XPS 15 9520 RTX 3050 Ti | |
| MSI Stealth 15M A11SEK | |
| Asus Zenbook Pro 15 OLED UM535Q | |
* ... smaller is better
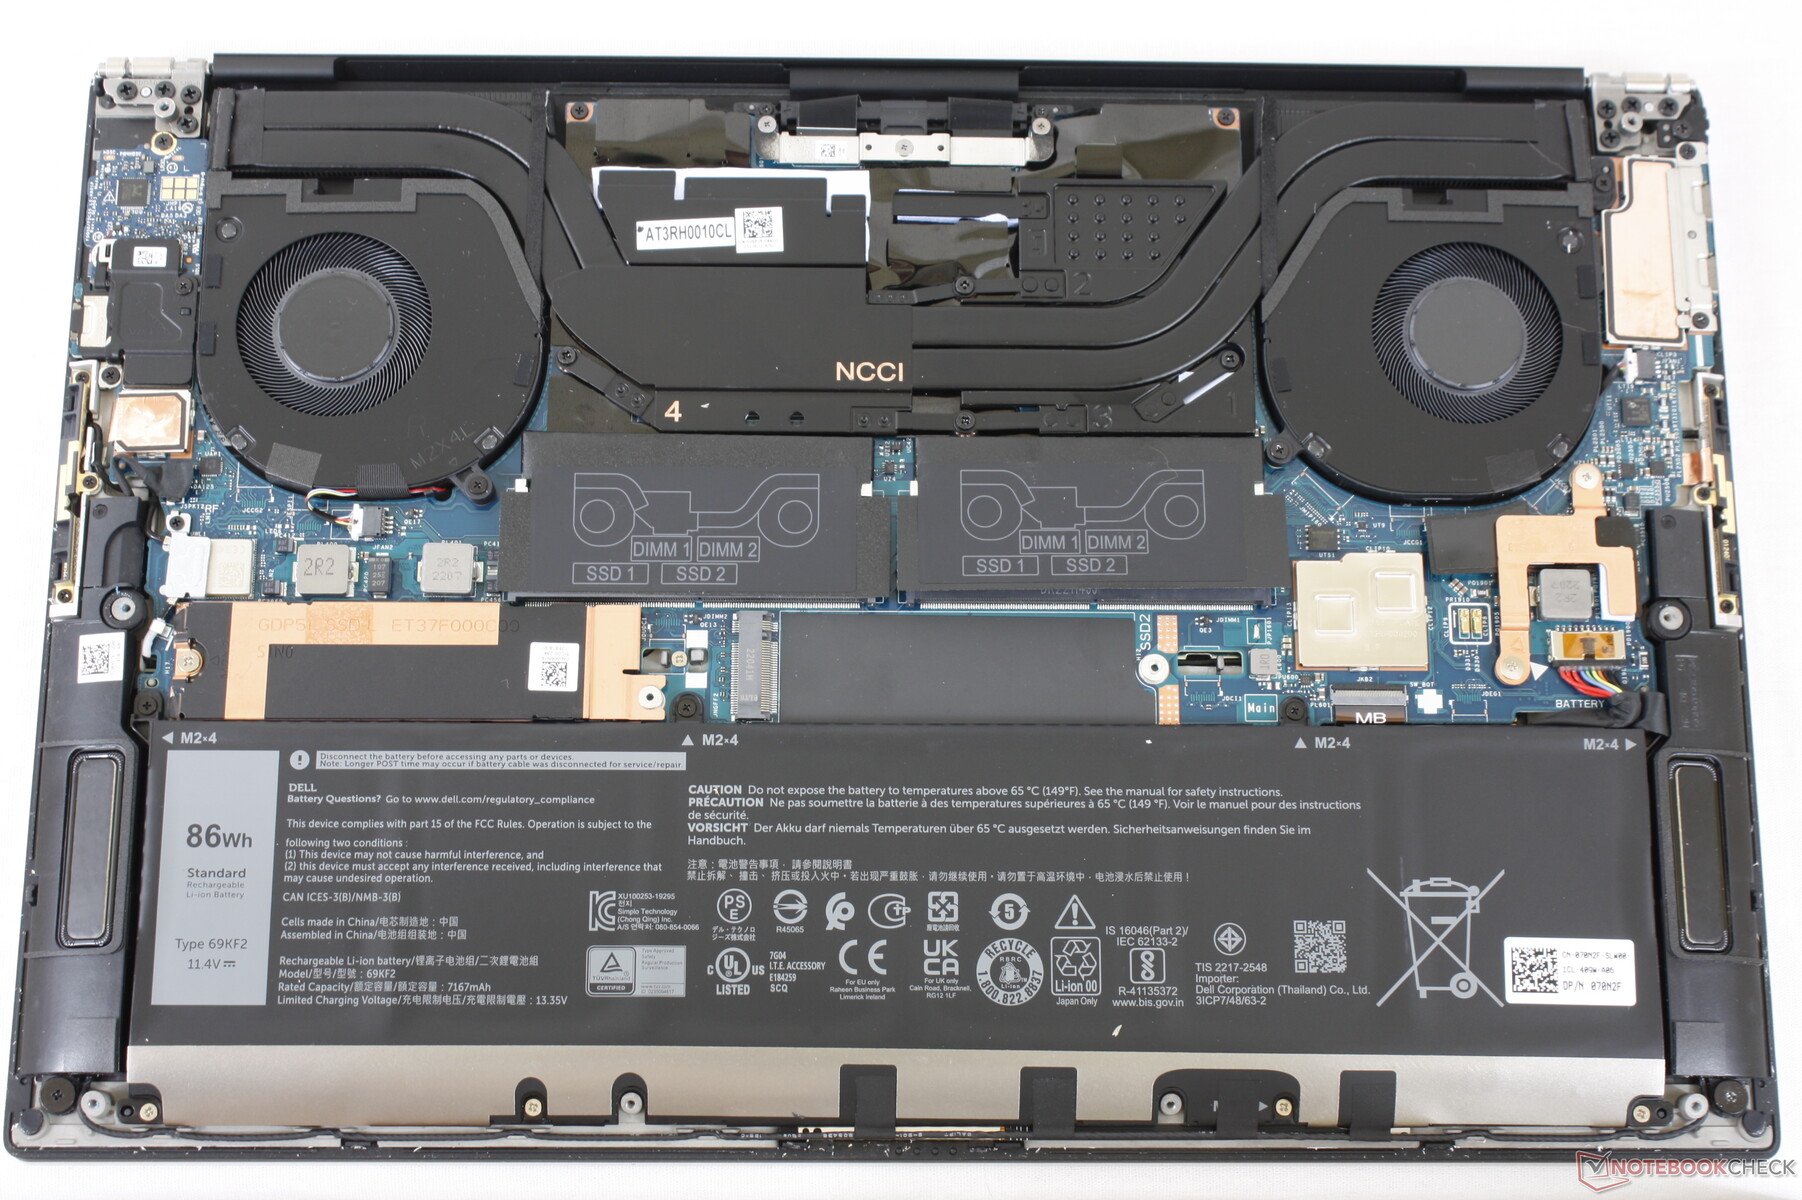
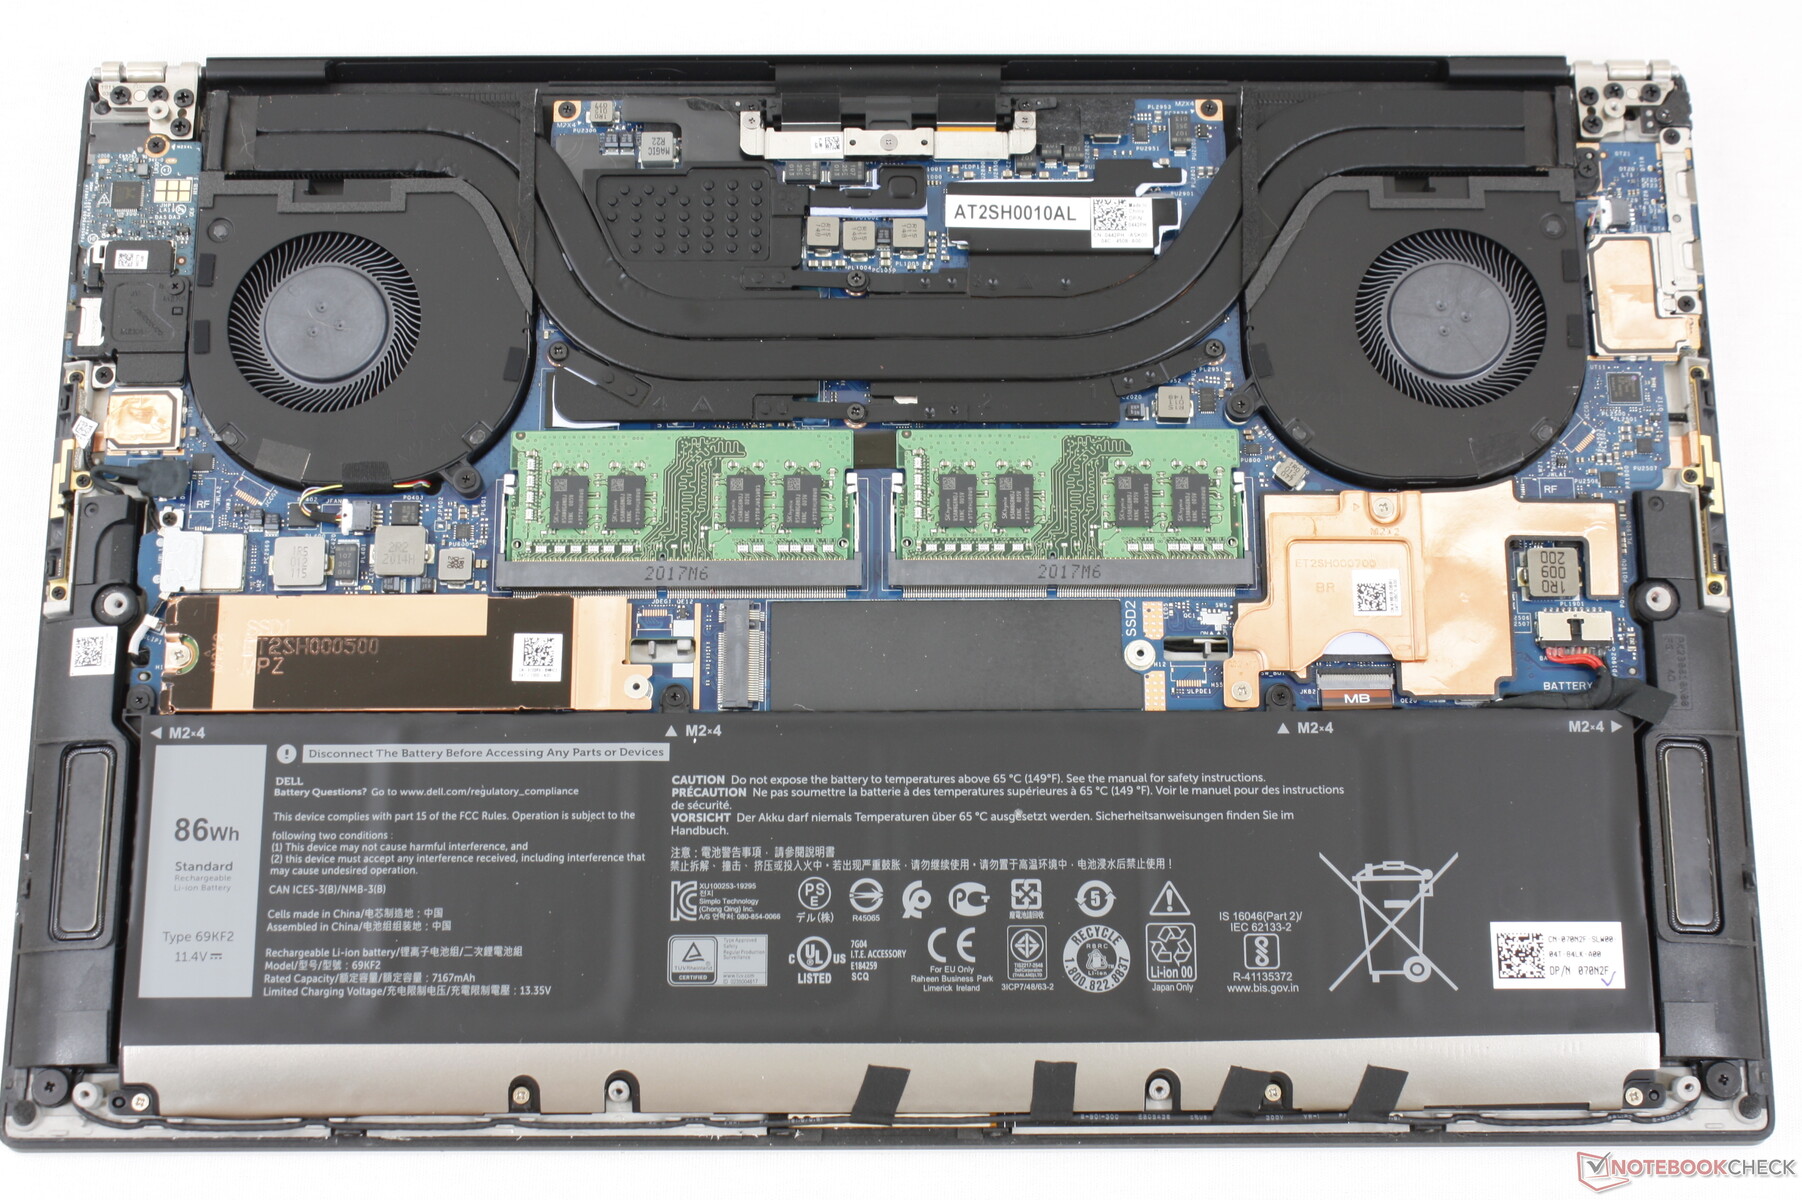
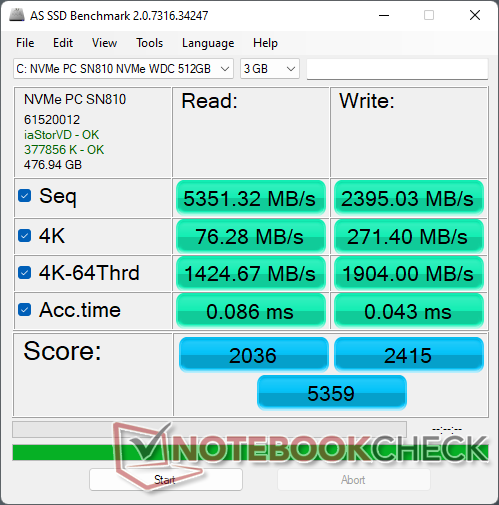
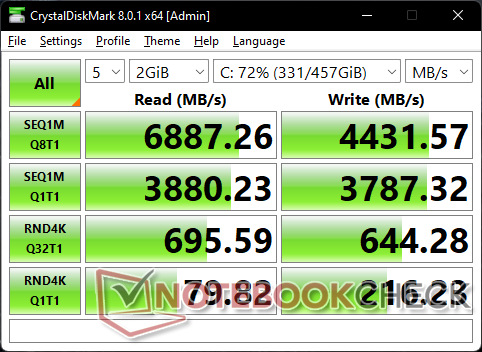
存储设备 - 支持多达两个PCIe4 NVMe固态硬盘
我们的测试装置配备了一个PCIe4 x4的 西部数据SN810 NVMe SSD而不是旧型号的PCIe3 x4解决方案。因此,传输速度明显加快,最高可达6700MB/s,是大多数PCIe3硬盘的两倍以上。在我们的设备中,SN810在DiskSpd的压力下长时间保持其最大传输速率是没有问题的,这表明其具有良好的散热能力。

| Drive Performance rating - Percent | |
| Average WDC PC SN810 512GB | |
| Dell XPS 15 9520 RTX 3050 Ti | |
| Asus Zenbook Pro 15 OLED UM535Q | |
| MSI Stealth 15M A11SEK | |
| Dell XPS 15 9500 Core i7 4K UHD | |
| Dell XPS 15 9510 11800H RTX 3050 Ti OLED | |
| HP Spectre X360 15-5ZV31AV -8! | |
* ... smaller is better
Disk Throttling: DiskSpd Read Loop, Queue Depth 8
GPU性能--GeForce RTX 3050 Ti连续第二年获得该奖项。
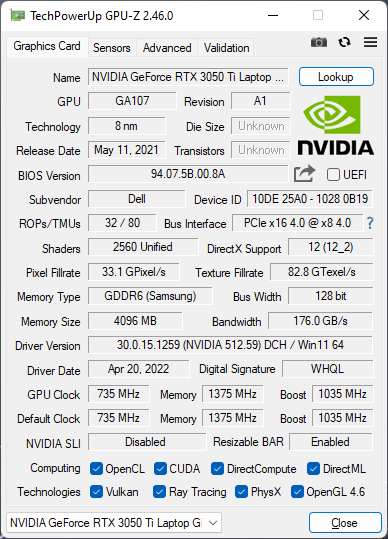
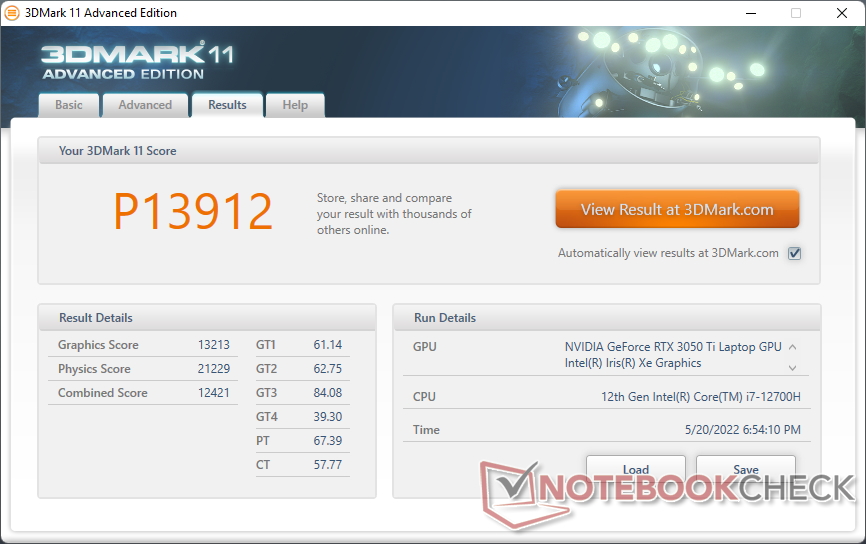
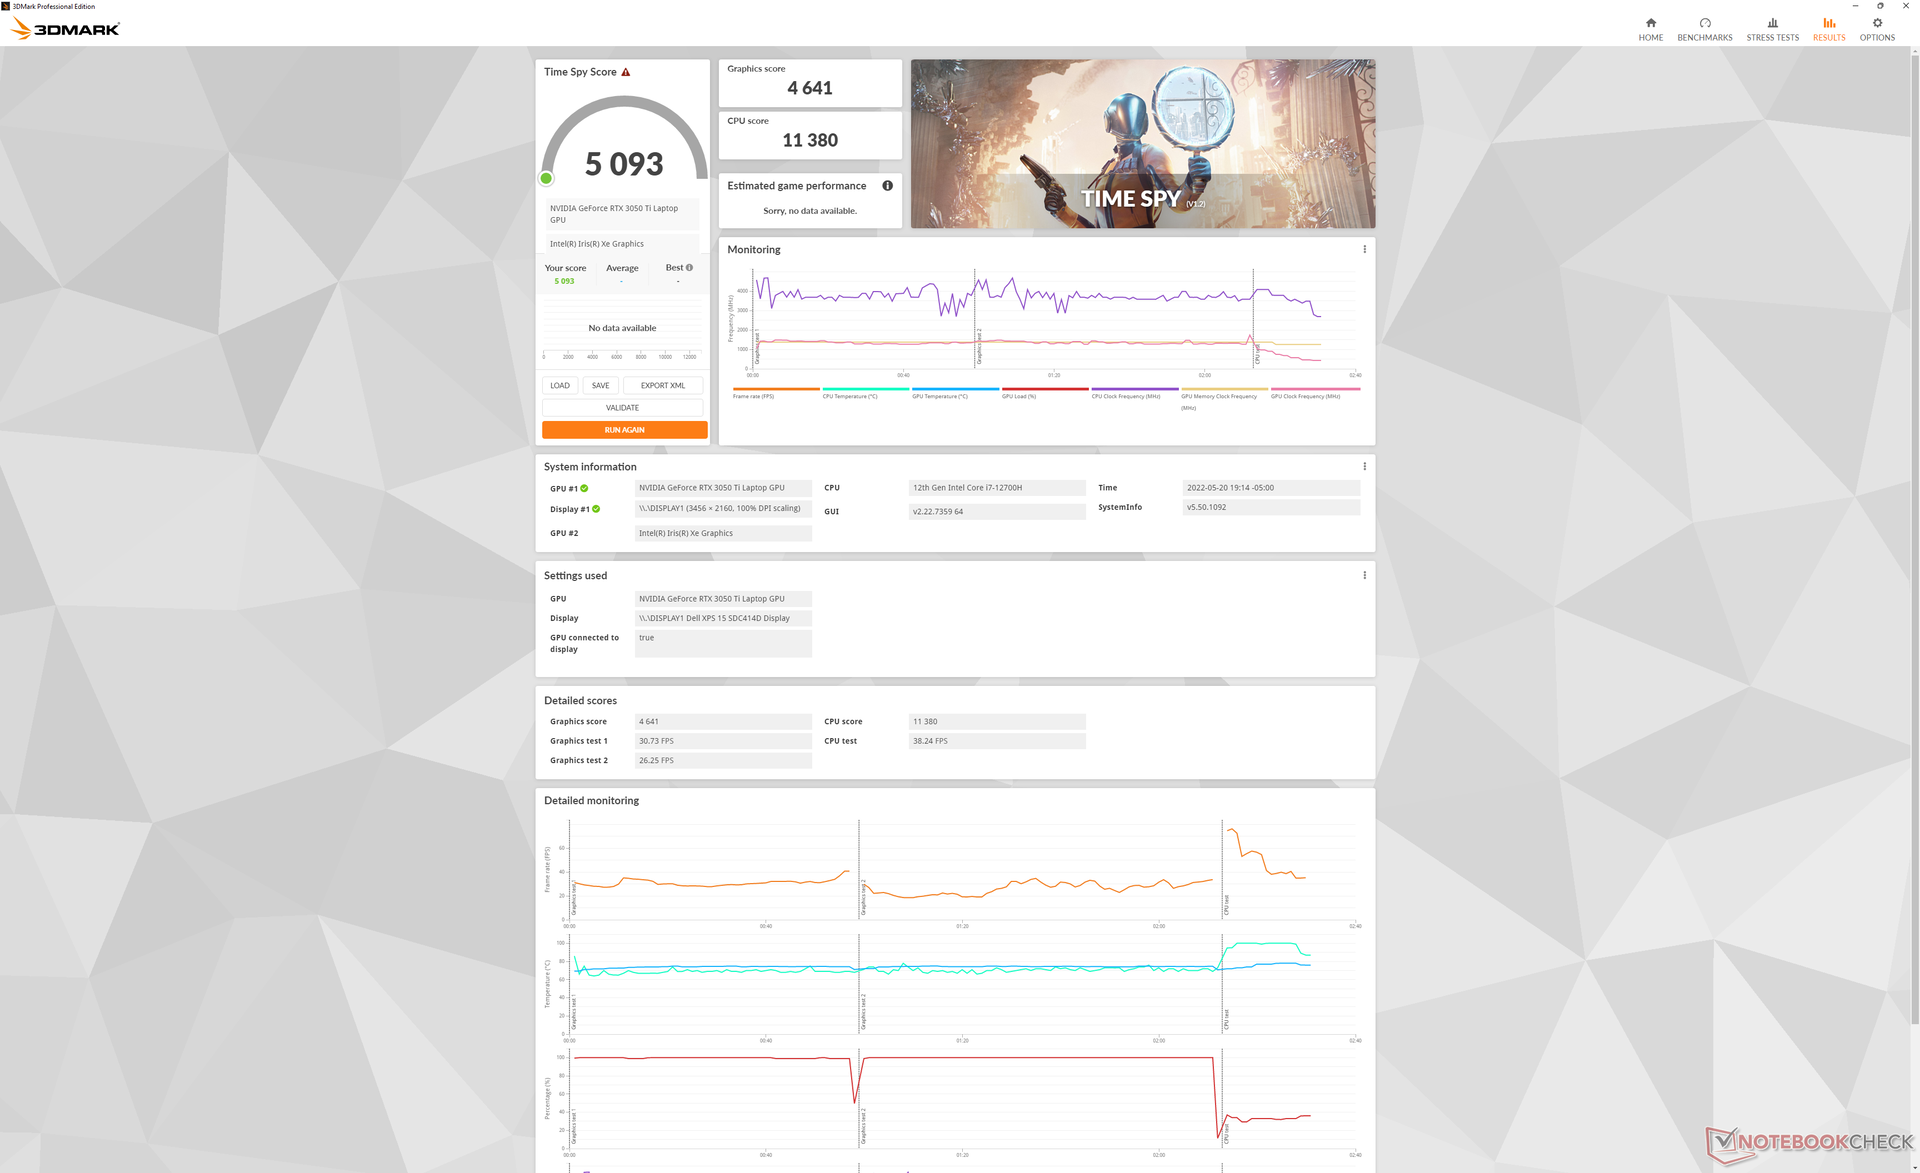
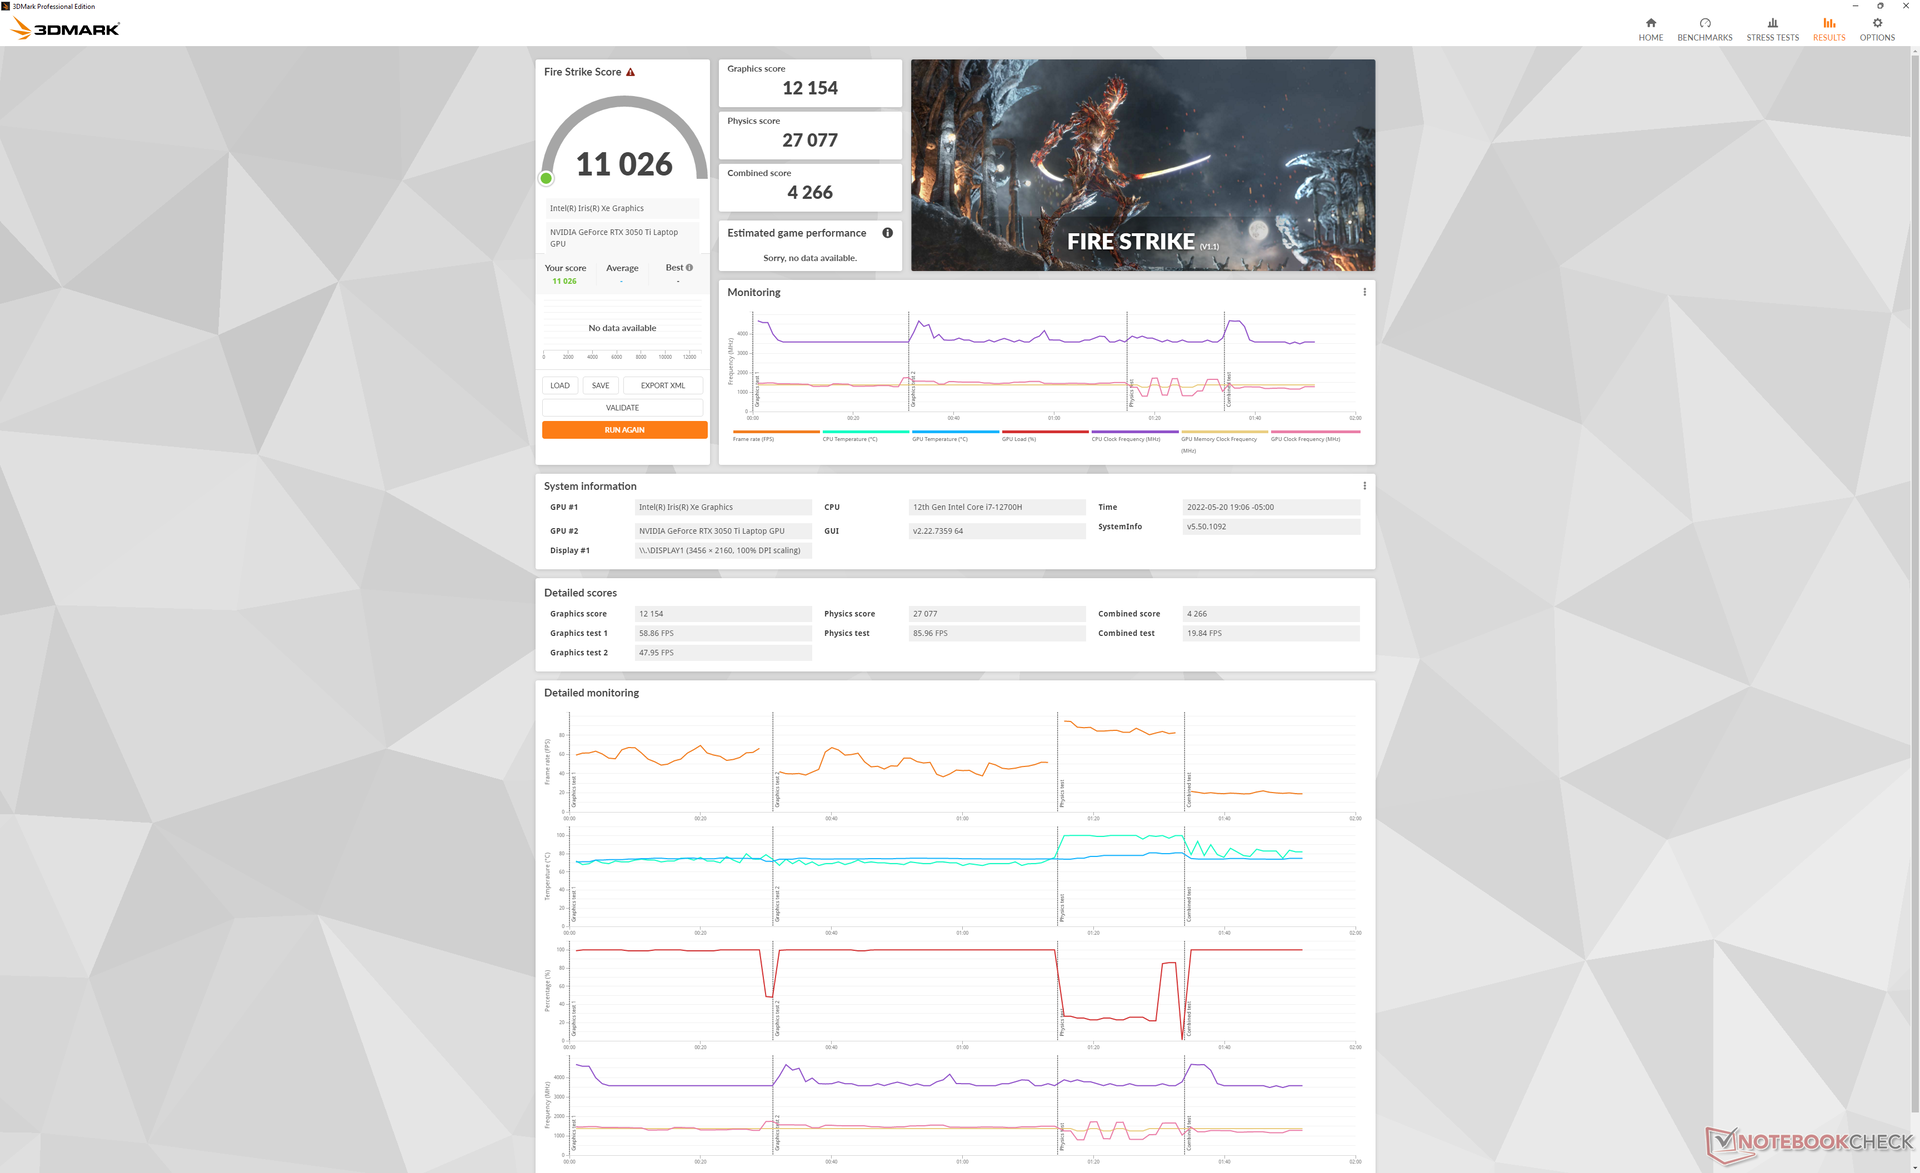
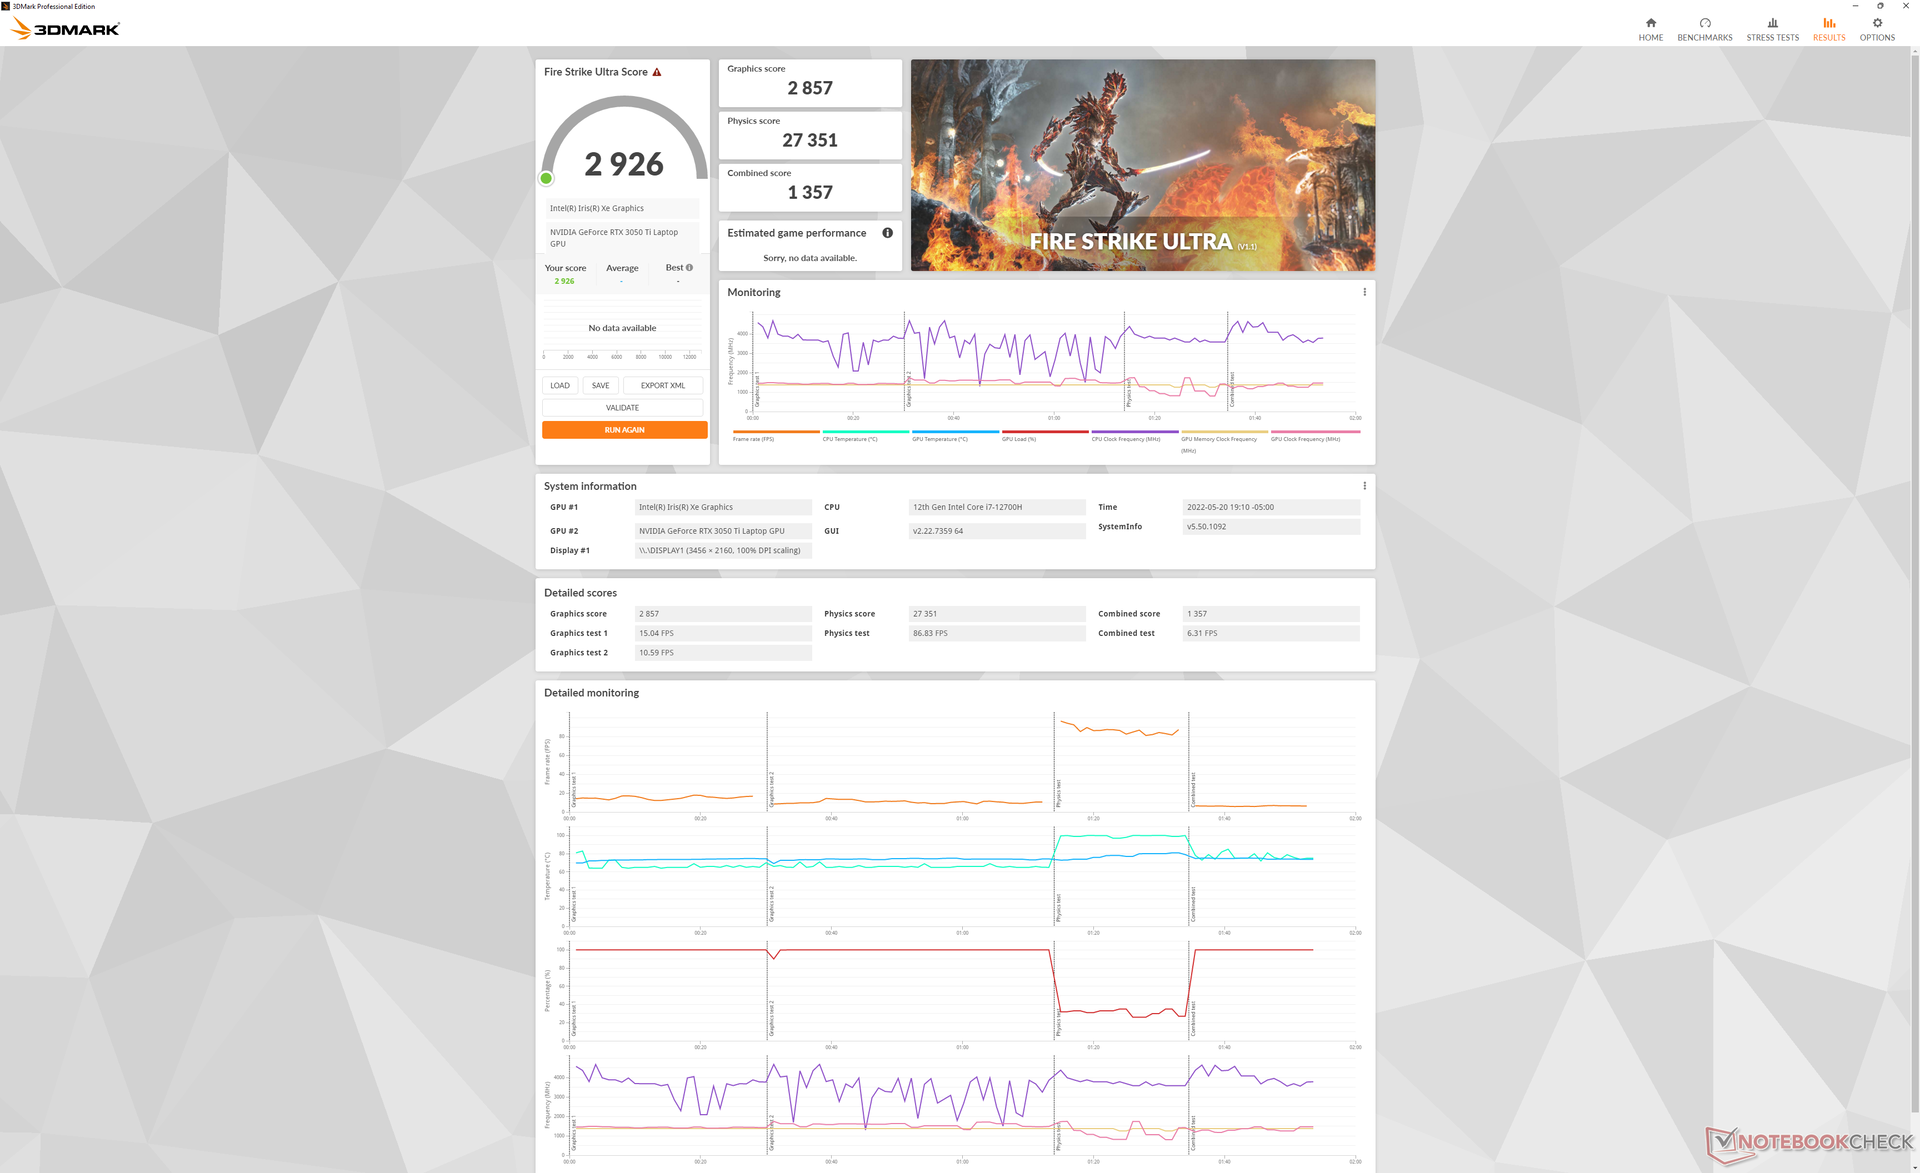
XPS 15 9520配备了比XPS 15 9510更快的内存(DDR5-4800对DDR4-3200),这应该会带来稍快的图形性能。不幸的是,戴尔已经将GPU时钟频率从XPS 15 9510的1530 MHz降至9520的1035 MHz,因此更快的内存带来的任何潜在性能提升都被取消了。 GeForce RTX 3050 Ti因此,XPS 15 9510和9520之间的3DMark结果几乎是相同的。
图形性能仍然比GTX 1650 Ti快20%至30%左右。 GTX 1650 Ti在老款XPS 15 9500上,图形性能仍然比GTX 1650 Ti快20%至30%。
| 3DMark 11 - 1280x720 Performance GPU | |
| Corsair One i300 | |
| MSI Vector GP66 12UGS | |
| Lenovo Legion 5 15ACH6A-82NW0010GE | |
| Asus TUF Gaming F15 FX507ZM | |
| MSI Alpha 15 B5EEK-008 | |
| Asus ROG Zephyrus M15 GU502LU-BI7N4 | |
| MSI Stealth 15M A11SEK | |
| Average NVIDIA GeForce RTX 3050 Ti Laptop GPU (7952 - 20905, n=27) | |
| Asus Zenbook Pro 15 OLED UM535Q | |
| Dell XPS 15 9510 11800H RTX 3050 Ti OLED | |
| Dell XPS 15 9520 RTX 3050 Ti | |
| Dell XPS 15 9500 Core i7 4K UHD | |
| HP Spectre X360 15-5ZV31AV | |
| 3DMark 11 Performance | 13912 points | |
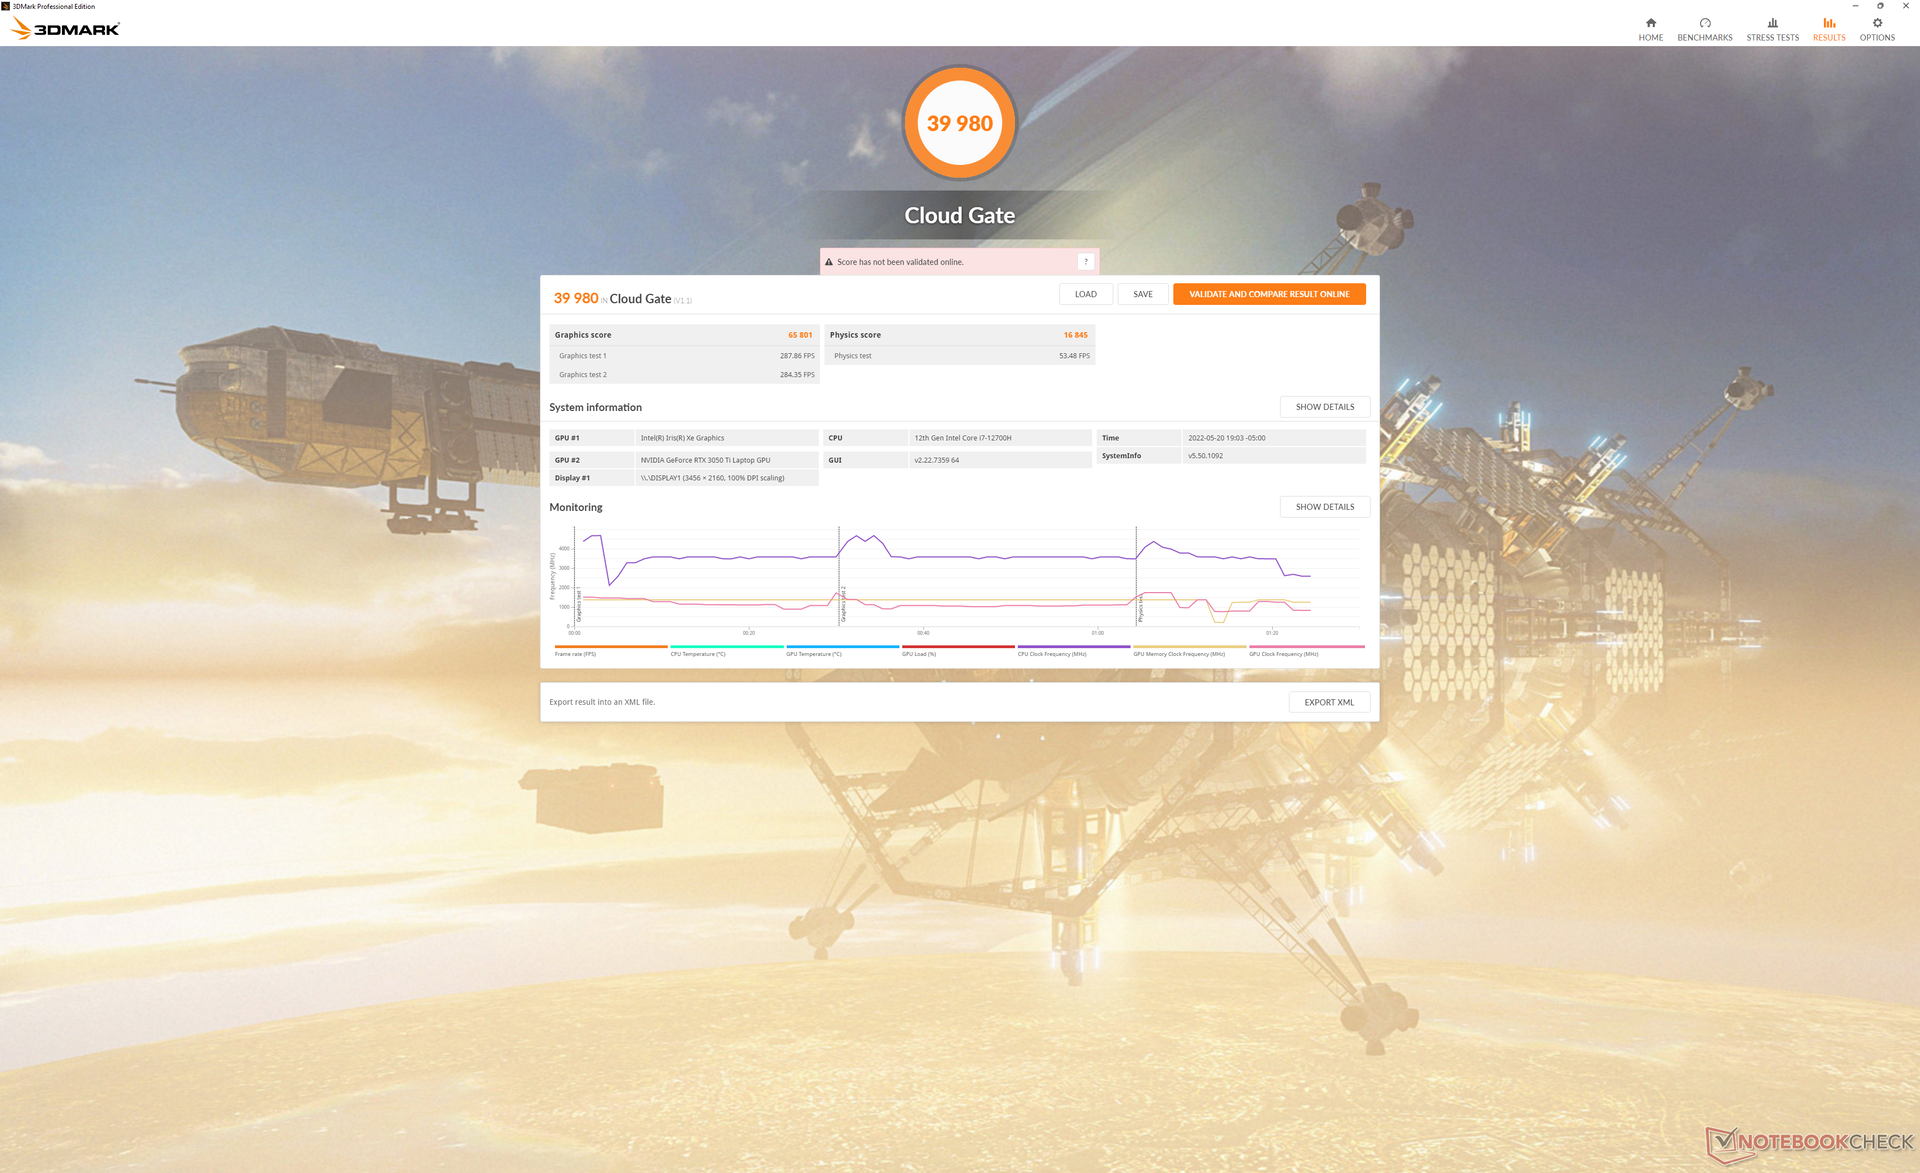
| 3DMark Cloud Gate Standard Score | 39980 points | |
| 3DMark Fire Strike Score | 11026 points | |
| 3DMark Time Spy Score | 5093 points | |
Help | ||
Witcher 3 FPS Chart
| low | med. | high | ultra | QHD | 4K | |
|---|---|---|---|---|---|---|
| GTA V (2015) | 185 | 181.3 | 90.3 | 49.9 | 37.4 | |
| The Witcher 3 (2015) | 226.5 | 127.1 | 62.4 | 34.2 | ||
| Dota 2 Reborn (2015) | 180.3 | 166.1 | 116.1 | 104.5 | 47.1 | |
| Final Fantasy XV Benchmark (2018) | 106.6 | 62.9 | 45.7 | 34.1 | ||
| X-Plane 11.11 (2018) | 137.6 | 117 | 100.6 | 73.7 | ||
| Strange Brigade (2018) | 206 | 109.6 | 91.1 | 79.4 | 60.4 | |
| Cyberpunk 2077 1.6 (2022) | 59.4 | 47.4 | 39.3 | 39.5 | 20.2 |
排放
系统噪音
在承受类似的负载时,风扇噪音似乎比旧的XPS型号更安静。或者说,至少在引入高要求负载时,9520的风扇需要更长的时间来提高转速。例如,在第一个3DMark 06基准场景结束时,风扇噪音仅为31 dB(A),而XPS 15 9510和9500的噪音分别为36 dB(A)和46 dB(A)。即使设置为超性能模式,该系统在大多数条件下仍比预期的要安静。
Noise level
| Idle |
| 22.9 / 22.9 / 22.9 dB(A) |
| Load |
| 30.9 / 44.7 dB(A) |
 | ||
30 dB silent 40 dB(A) audible 50 dB(A) loud |
||
min: | ||
| Dell XPS 15 9520 RTX 3050 Ti GeForce RTX 3050 Ti Laptop GPU, i7-12700H, WDC PC SN810 512GB | Dell XPS 15 9510 11800H RTX 3050 Ti OLED GeForce RTX 3050 Ti Laptop GPU, i7-11800H, Micron 2300 512GB MTFDHBA512TDV | Dell XPS 15 9500 Core i7 4K UHD GeForce GTX 1650 Ti Mobile, i7-10875H, SK Hynix PC611 512GB | HP Spectre X360 15-5ZV31AV GeForce MX250, i7-10510U, Intel SSD 660p 2TB SSDPEKNW020T8 | Asus Zenbook Pro 15 OLED UM535Q GeForce RTX 3050 Ti Laptop GPU, R9 5900HX, WDC PC SN730 SDBPNTY-1T00 | MSI Stealth 15M A11SEK GeForce RTX 2060 Max-Q, i7-1185G7, WDC PC SN530 SDBPNPZ-1T00 | |
|---|---|---|---|---|---|---|
| Noise | -2% | -23% | -17% | -7% | -34% | |
| off / environment * (dB) | 22.8 | 23.8 -4% | 28.4 -25% | 30.1 -32% | 22.8 -0% | 27.5 -21% |
| Idle Minimum * (dB) | 22.9 | 23.8 -4% | 28.4 -24% | 30.1 -31% | 22.9 -0% | 32.3 -41% |
| Idle Average * (dB) | 22.9 | 23.8 -4% | 28.4 -24% | 30.1 -31% | 22.9 -0% | 32.3 -41% |
| Idle Maximum * (dB) | 22.9 | 23.8 -4% | 28.4 -24% | 30.1 -31% | 22.9 -0% | 33.7 -47% |
| Load Average * (dB) | 30.9 | 36 -17% | 46 -49% | 30.1 3% | 33.2 -7% | 46.3 -50% |
| Witcher 3 ultra * (dB) | 37.8 | 36 5% | 42 -11% | 39.7 -5% | 47.3 -25% | 41.3 -9% |
| Load Maximum * (dB) | 44.7 | 38.2 15% | 47.1 -5% | 42 6% | 52.8 -18% | 56.2 -26% |
* ... smaller is better
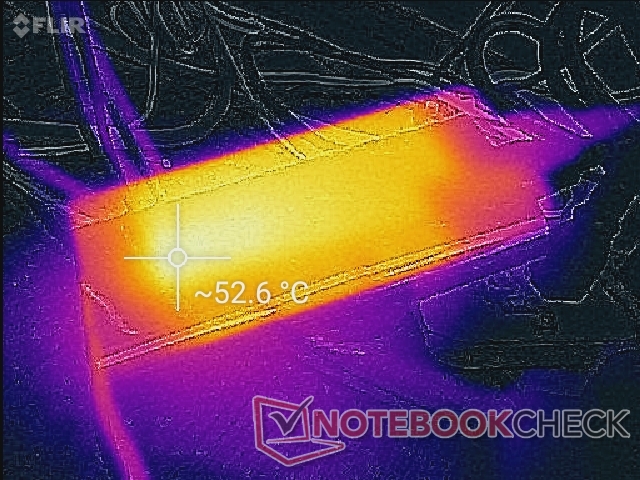
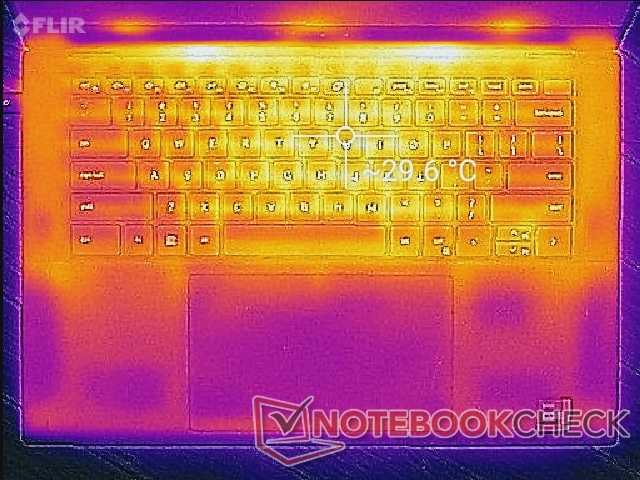
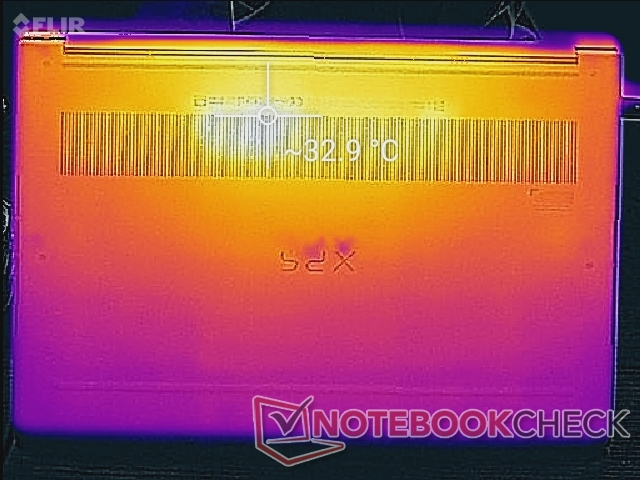
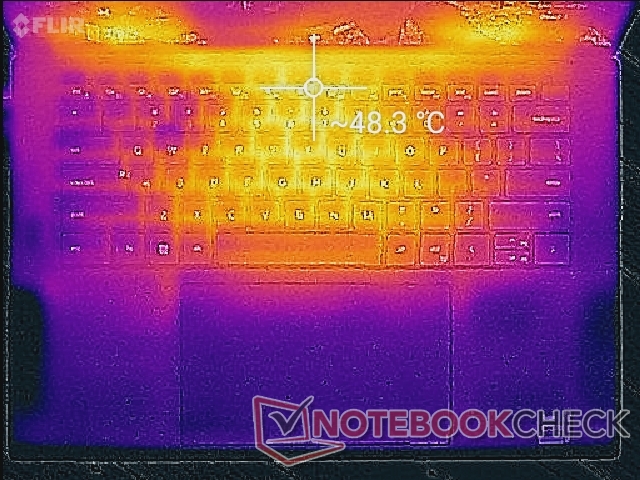
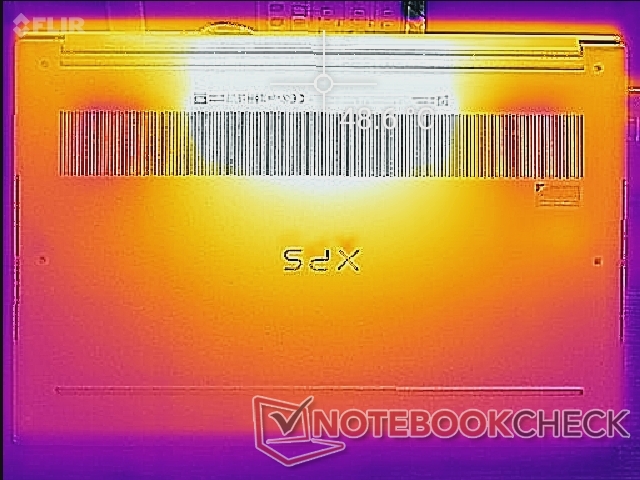
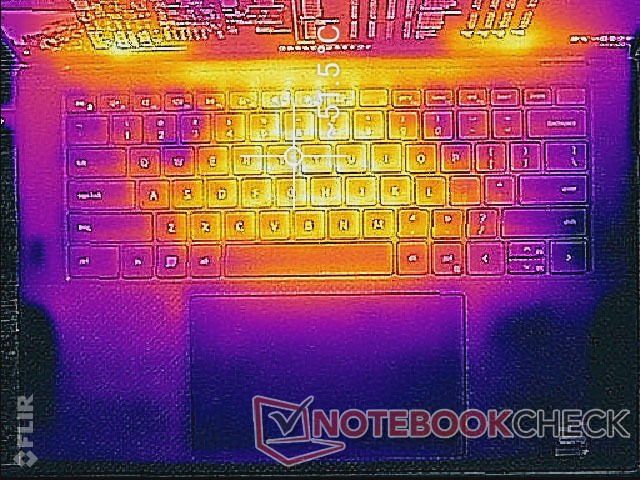
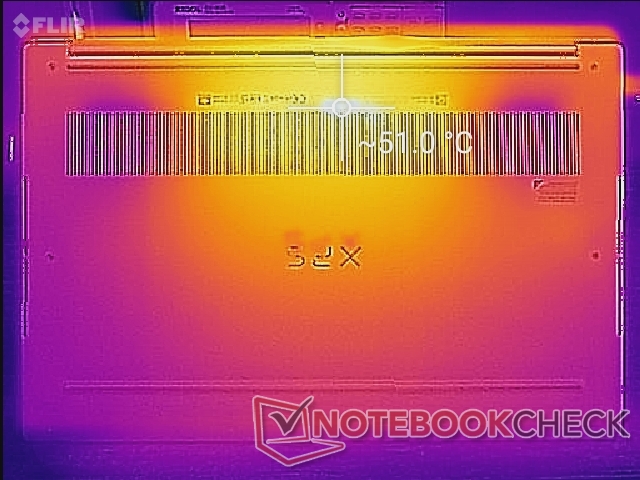
温度--整体略微偏高
负载下的表面温度比我们在旧版XPS 15 9510和9500机型上记录的温度要高。顶部和底部的热点可以分别达到51摄氏度至52摄氏度,而之前的每个版本都是44摄氏度至47摄氏度。在类似条件下,Zenbook Pro 15 OLED等竞争对手的热点温度要低几摄氏度。XPS 9520毕竟是市场上最小的由Core H驱动的15.6英寸笔记本电脑之一。
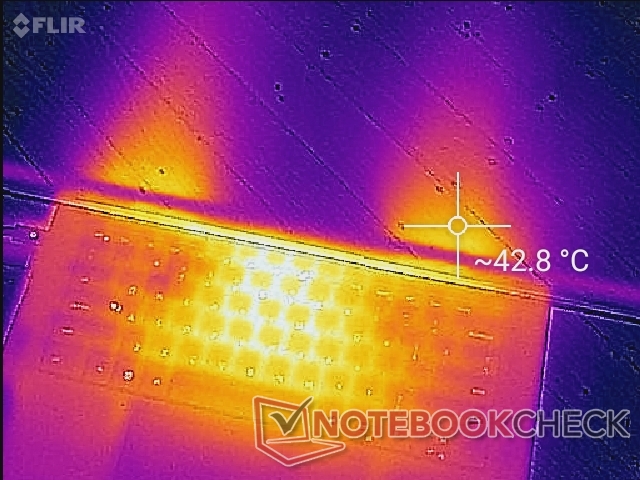
(-) The maximum temperature on the upper side is 51.4 °C / 125 F, compared to the average of 36.8 °C / 98 F, ranging from 21 to 71 °C for the class Multimedia.
(-) The bottom heats up to a maximum of 51 °C / 124 F, compared to the average of 39.1 °C / 102 F
(+) In idle usage, the average temperature for the upper side is 27.8 °C / 82 F, compared to the device average of 31.3 °C / 88 F.
(±) Playing The Witcher 3, the average temperature for the upper side is 35.2 °C / 95 F, compared to the device average of 31.3 °C / 88 F.
(+) The palmrests and touchpad are cooler than skin temperature with a maximum of 31.6 °C / 88.9 F and are therefore cool to the touch.
(-) The average temperature of the palmrest area of similar devices was 28.7 °C / 83.7 F (-2.9 °C / -5.2 F).
| Dell XPS 15 9520 RTX 3050 Ti Intel Core i7-12700H, NVIDIA GeForce RTX 3050 Ti Laptop GPU | Dell XPS 15 9510 11800H RTX 3050 Ti OLED Intel Core i7-11800H, NVIDIA GeForce RTX 3050 Ti Laptop GPU | Dell XPS 15 9500 Core i7 4K UHD Intel Core i7-10875H, NVIDIA GeForce GTX 1650 Ti Mobile | HP Spectre X360 15-5ZV31AV Intel Core i7-10510U, NVIDIA GeForce MX250 | Asus Zenbook Pro 15 OLED UM535Q AMD Ryzen 9 5900HX, NVIDIA GeForce RTX 3050 Ti Laptop GPU | MSI Stealth 15M A11SEK Intel Core i7-1185G7, NVIDIA GeForce RTX 2060 Max-Q | |
|---|---|---|---|---|---|---|
| Heat | 13% | 3% | 17% | -1% | 10% | |
| Maximum Upper Side * (°C) | 51.4 | 45.5 11% | 44 14% | 47 9% | 36 30% | 47.2 8% |
| Maximum Bottom * (°C) | 51 | 44.2 13% | 48.8 4% | 47.4 7% | 47.2 7% | 47.4 7% |
| Idle Upper Side * (°C) | 30 | 27 10% | 33 -10% | 22.8 24% | 37 -23% | 27.2 9% |
| Idle Bottom * (°C) | 33 | 26.7 19% | 32.4 2% | 23.6 28% | 39.2 -19% | 28.2 15% |
* ... smaller is better
压力测试
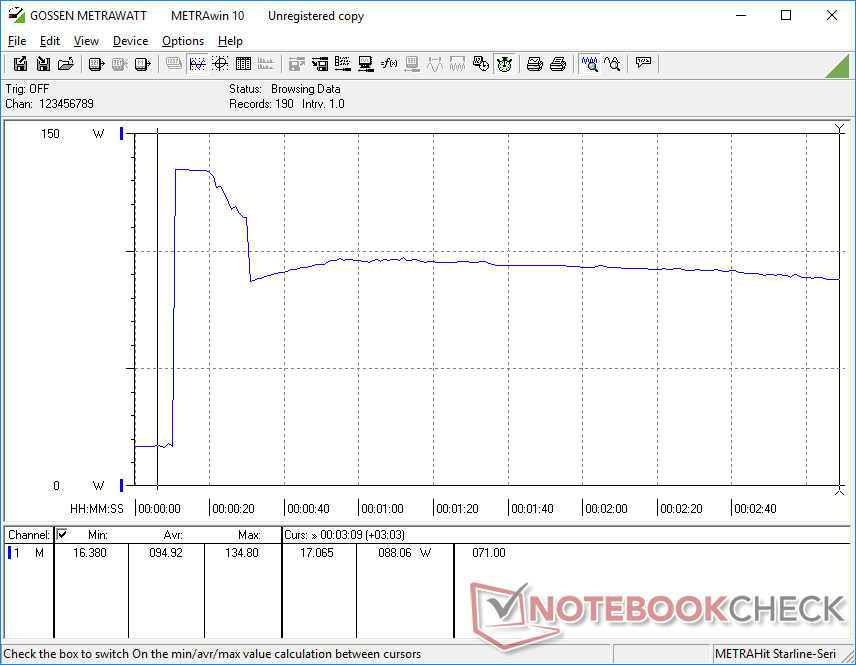
当在Prime95下受压时,CPU会在最初的10秒左右提升到81W、100C和3.3GHz,然后迅速下降并稳定在45W、85C和2.5GHz,以保持温度的控制。在XPS 15 9500上运行同样的测试,相比之下,CPU的稳定温度为73℃。因此,看来XPS 15 9520的运行温度比其前辈高,以便从相同的整体机箱设计中提取更多的处理器性能。
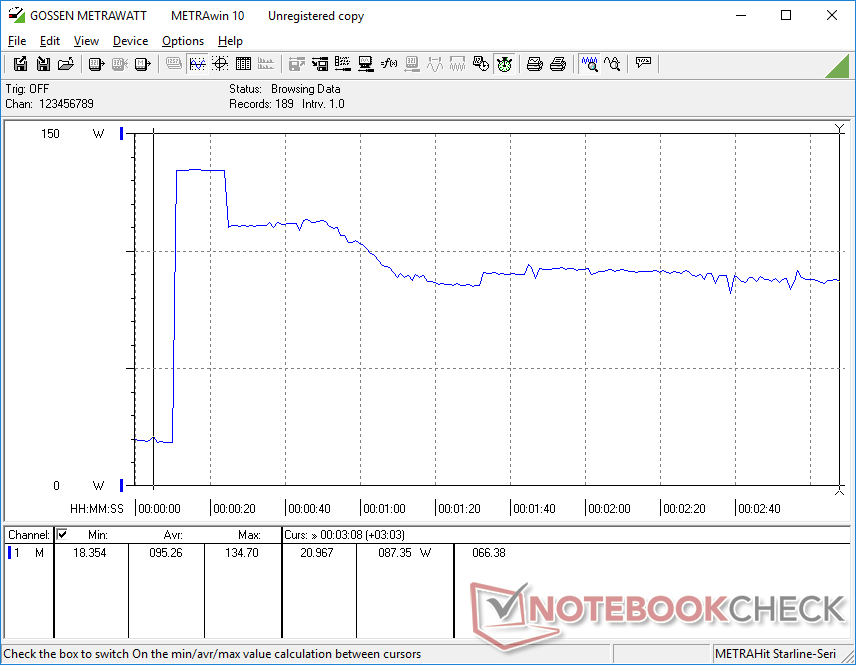
在超性能模式下运行时,GPU的时钟频率、功耗和温度将分别稳定在1477 MHz、46 W和74 C。 Witcher 3在超性能模式下运行时,GPU时钟速率和温度将分别稳定在1477 MHz、46 W和74 C。如下表所示,在优化模式下运行将导致稍低的时钟频率和温度,以及较低的功耗(41W)。如果用户想从GPU中获得尽可能多的性能,必须在超性能模式下运行系统。在XPS 15 9500上运行同样的测试,使用较慢的GeForce GTX 1650 Ti,将导致类似的CPU和GPU温度。
用电池供电运行限制了性能。在电池上进行的Fire Strike 测试将返回物理和图形分数,分别为9450和8332分,而在主电源上则为27077和12154分。
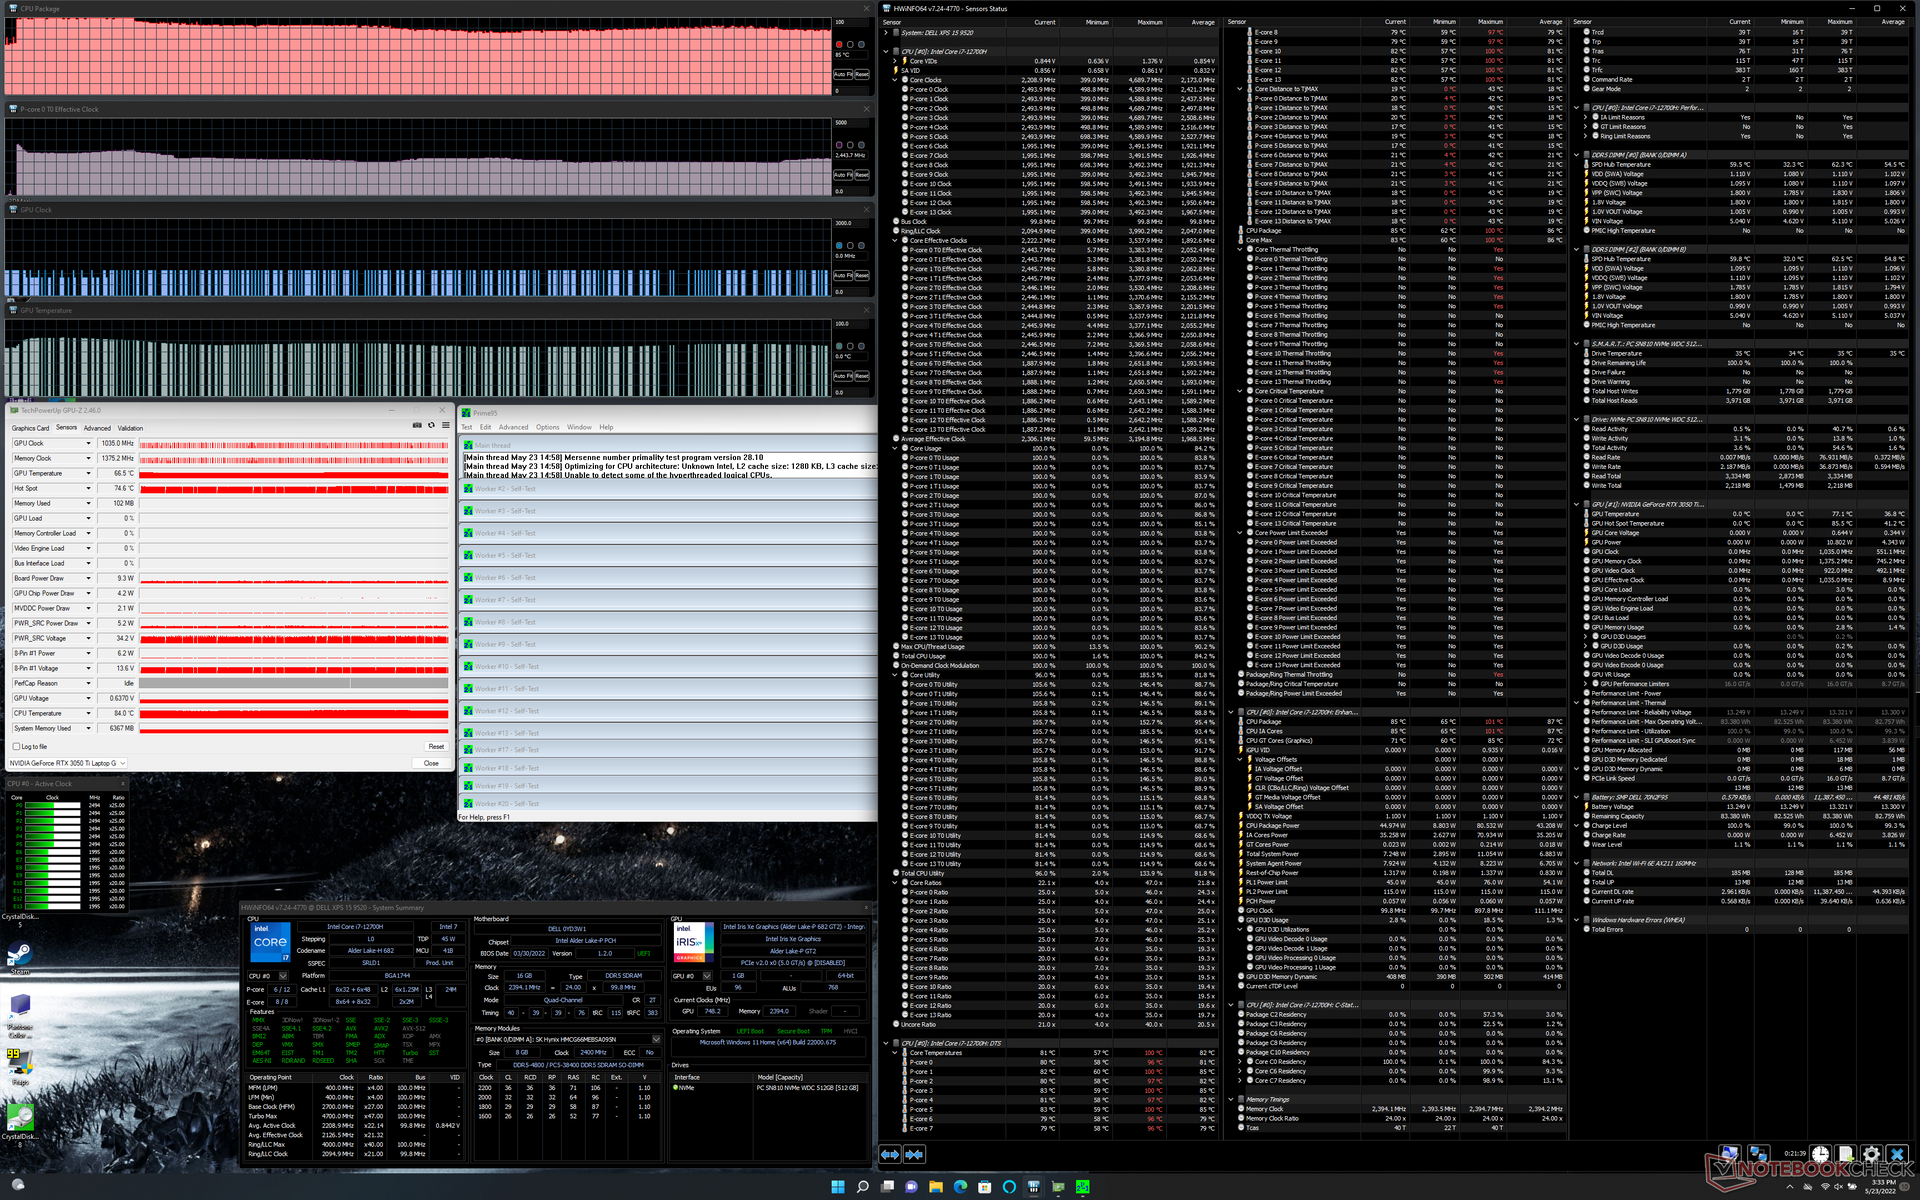
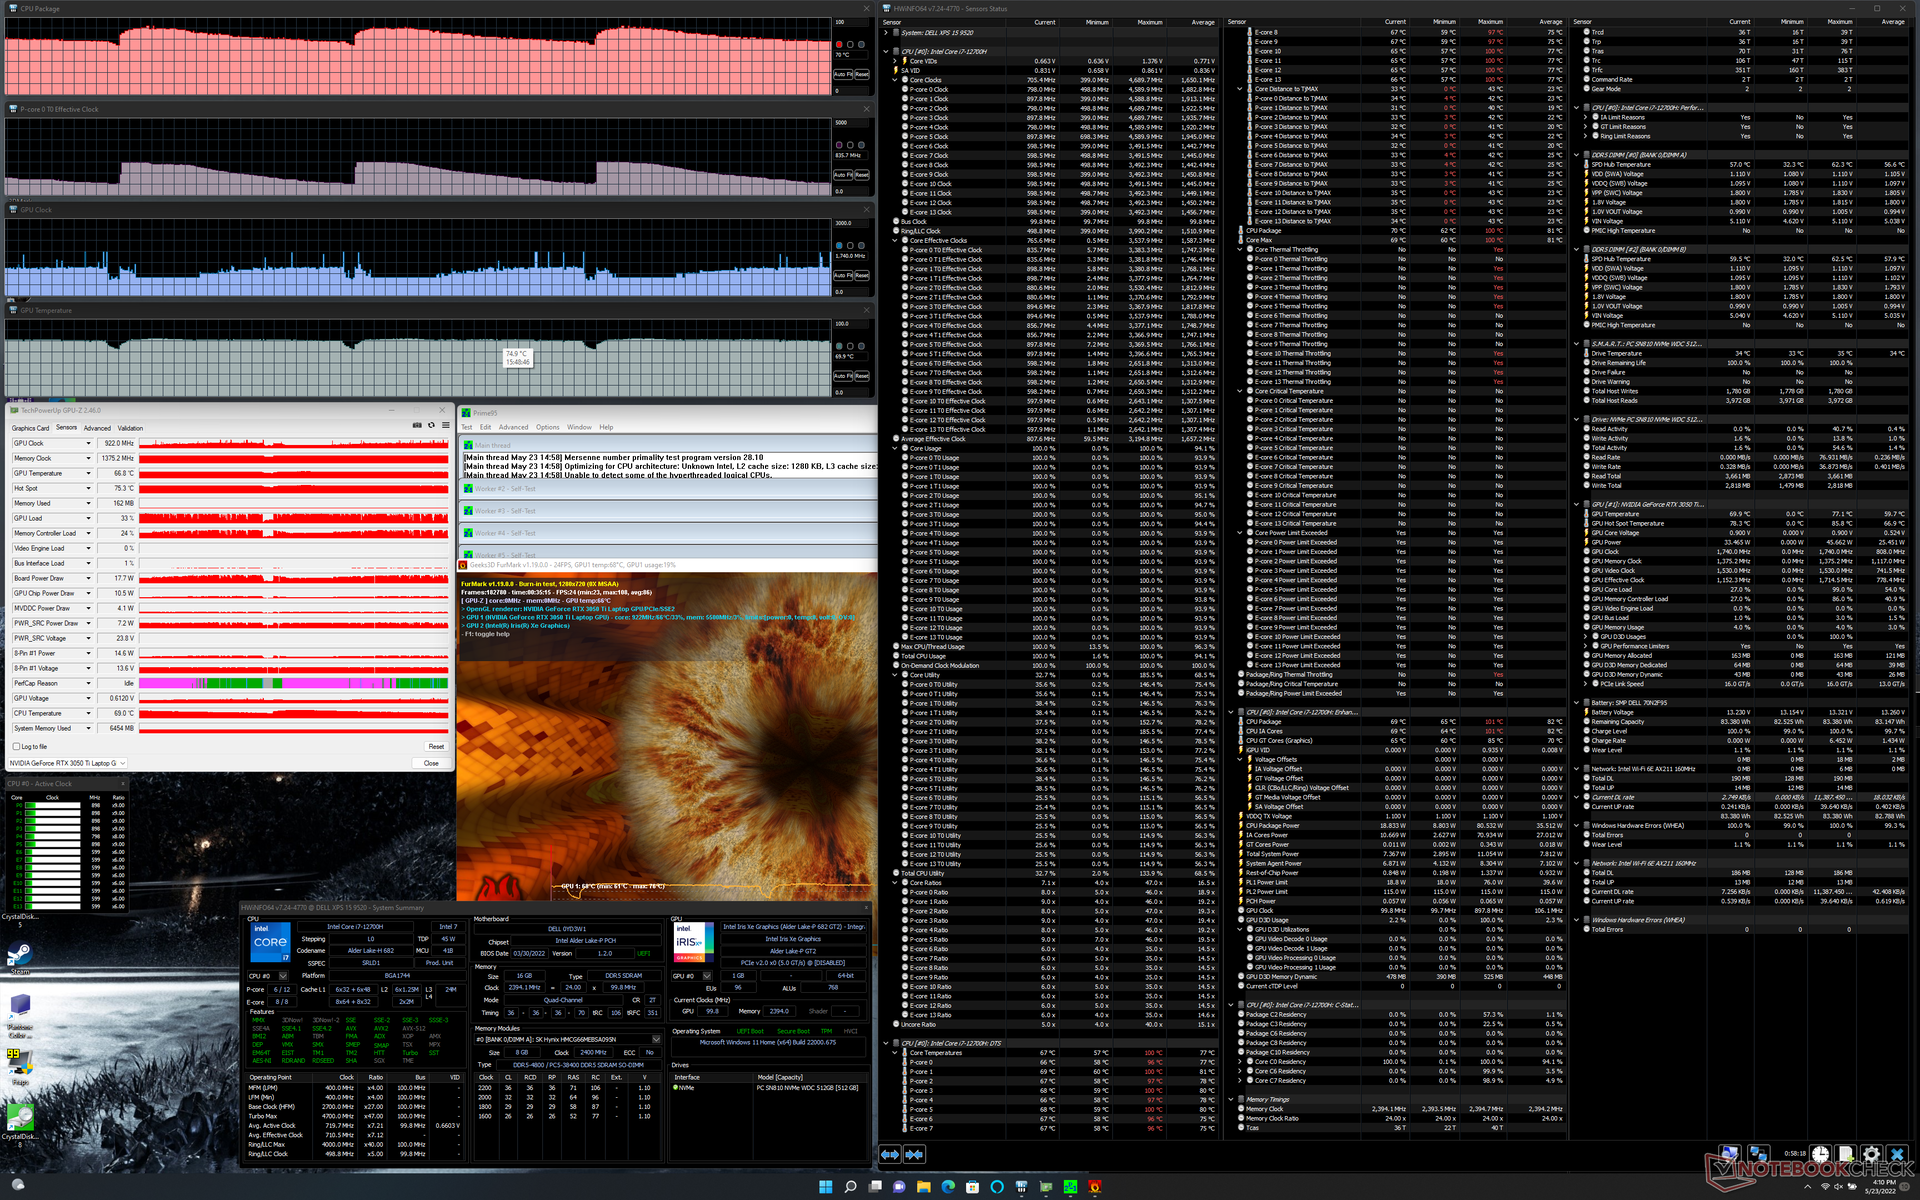
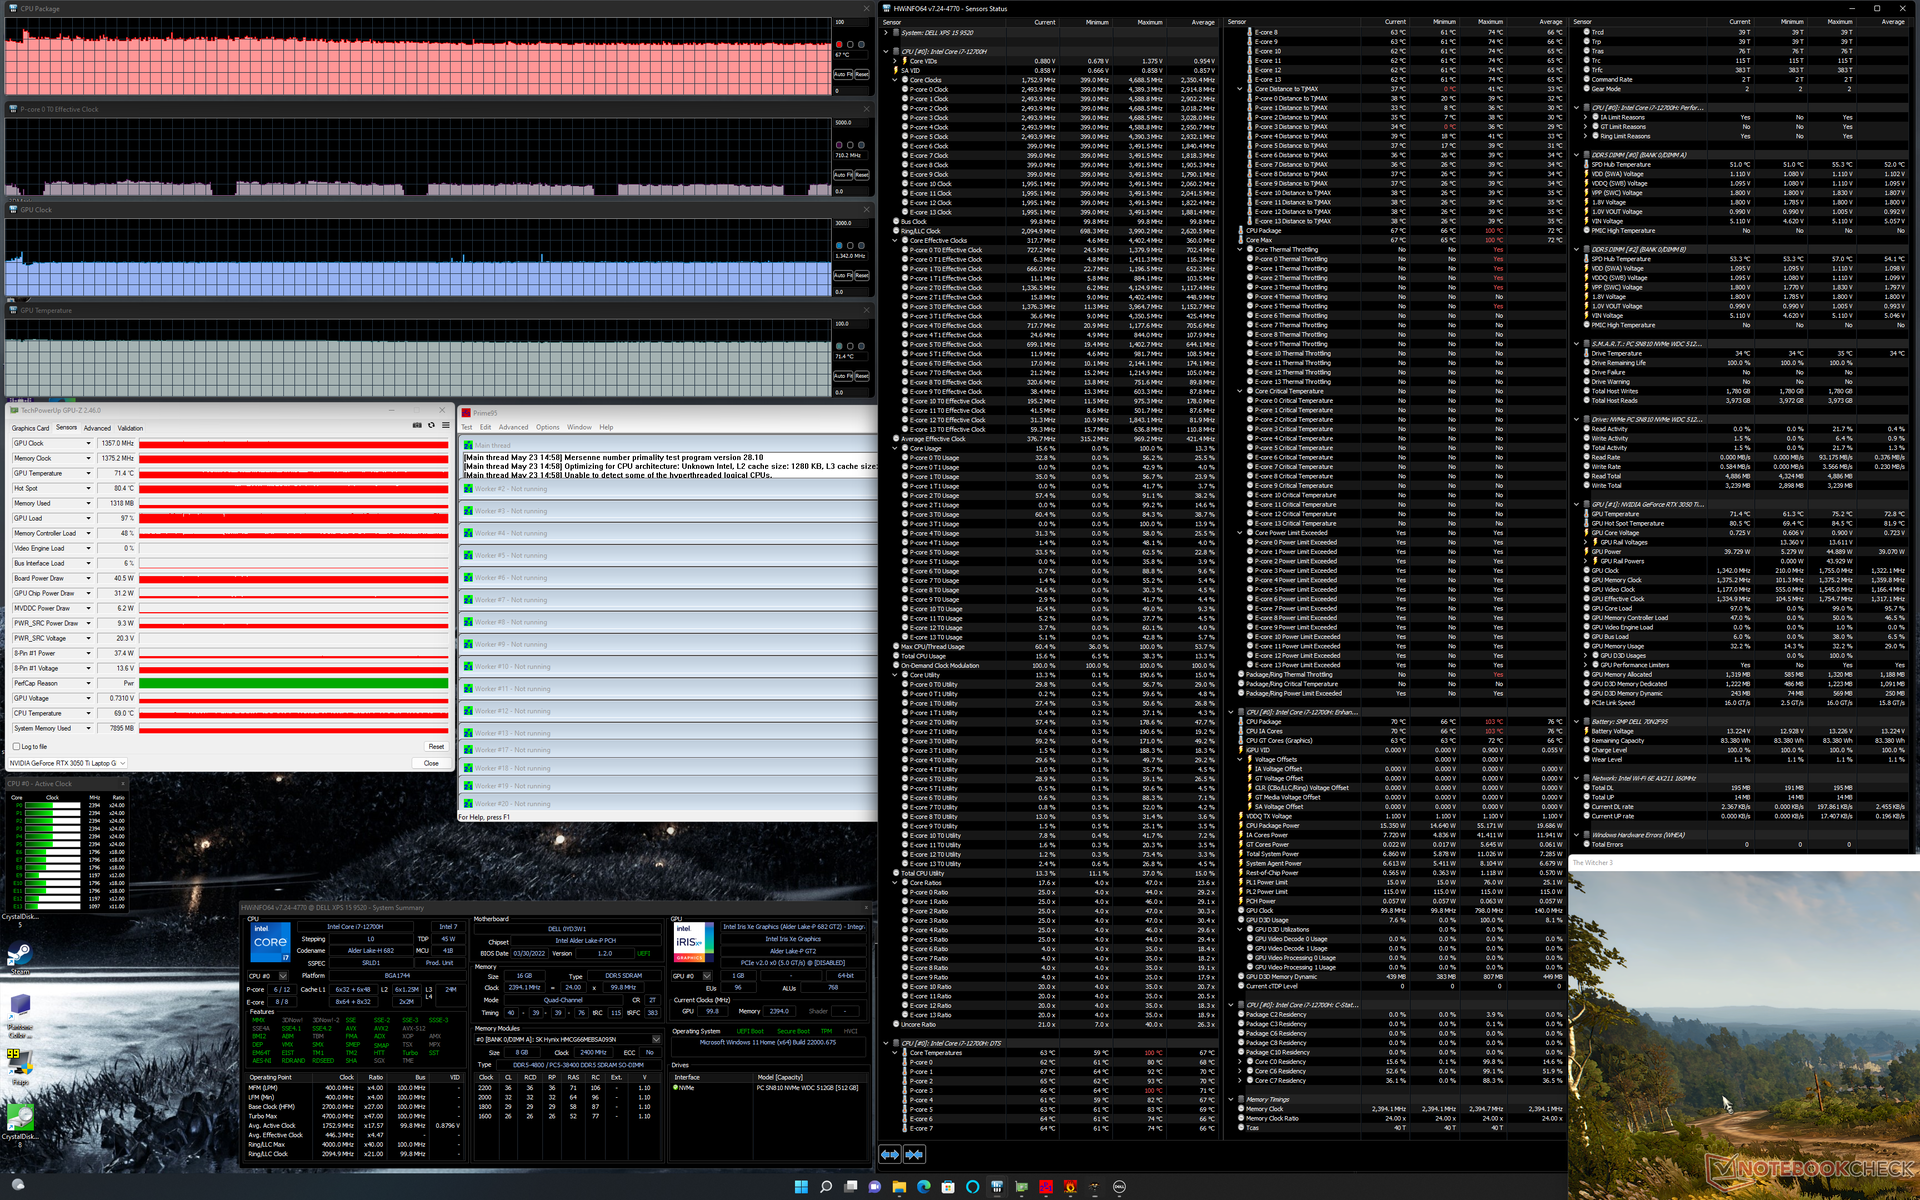
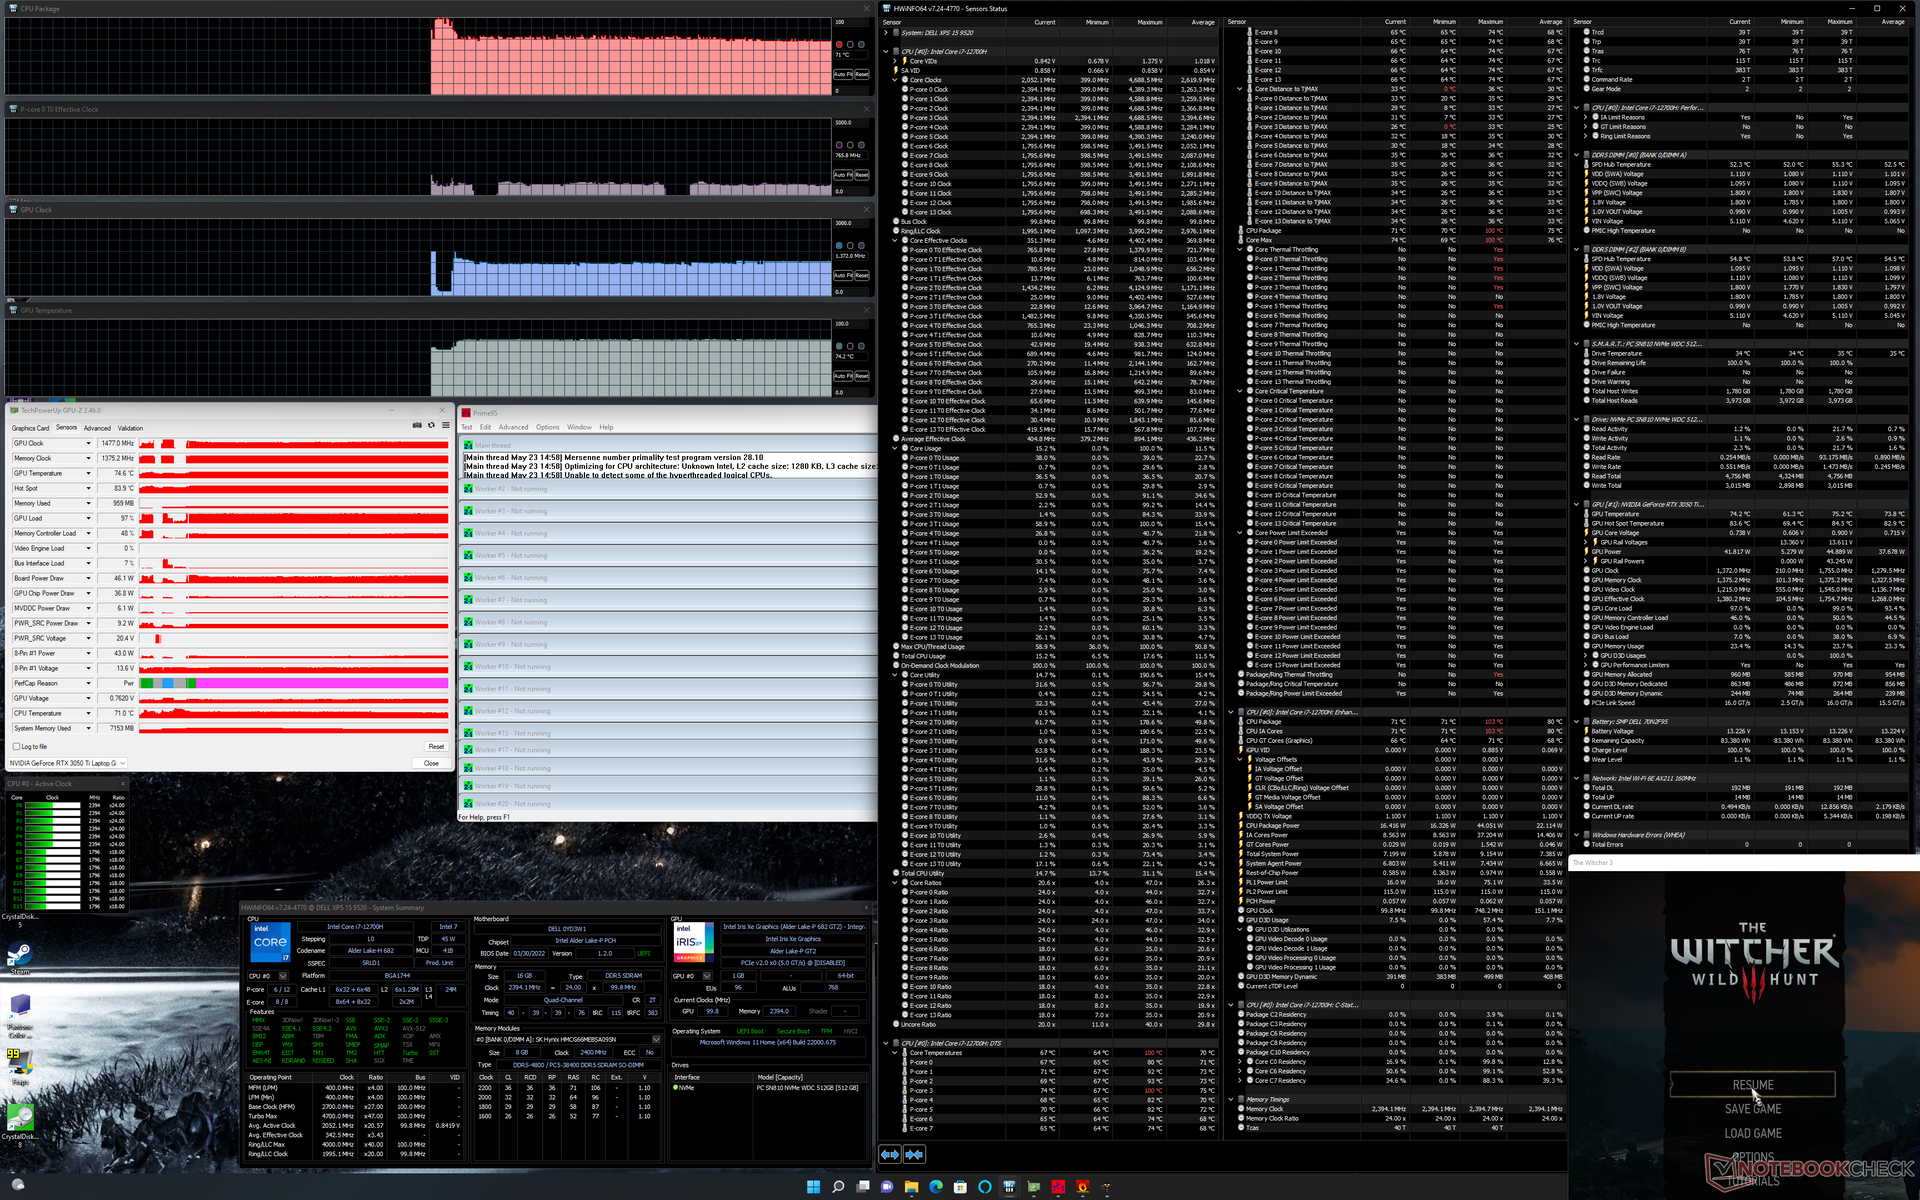
| CPU时钟(GHz) | GPU时钟(MHz) | CPU平均温度(℃) | GPU平均温度(℃) | |
| 系统空闲 | -- | -- | 79 | 64 |
| Prime95压力 | 2.4 | 85 | -- | 67 |
| Prime95 + FurMark压力 | 0.8 - 2.3 | 700 - 1100 | 79 - 86 | 62 - 75 |
| Witcher 3 压力(平衡模式) | 0.7 | 1357 | 67 | 71 |
| Witcher 3 压力(性能模式) | 0.8 | 1477 | 71 | 74 |
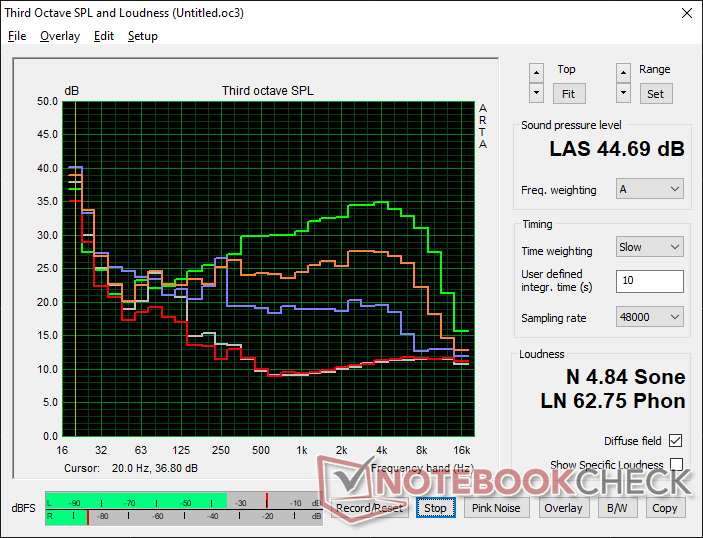
发言人
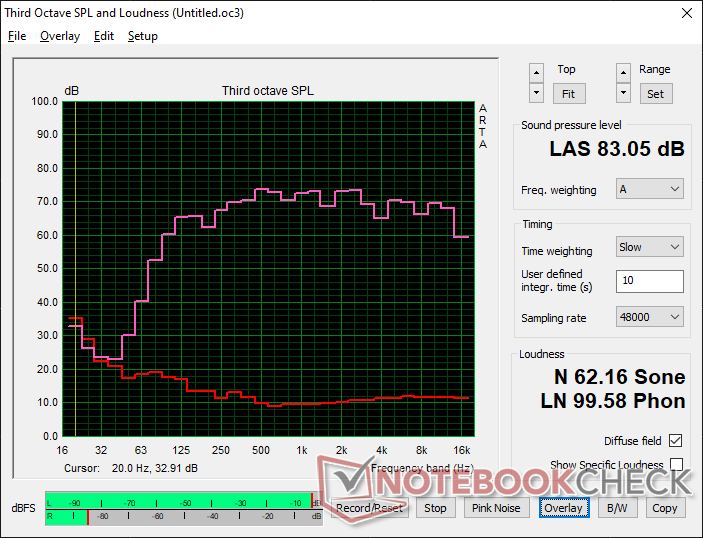
Dell XPS 15 9520 RTX 3050 Ti audio analysis
(+) | speakers can play relatively loud (83.1 dB)
Bass 100 - 315 Hz
(+) | good bass - only 4.4% away from median
(+) | bass is linear (6.8% delta to prev. frequency)
Mids 400 - 2000 Hz
(+) | balanced mids - only 2.6% away from median
(+) | mids are linear (4.1% delta to prev. frequency)
Highs 2 - 16 kHz
(+) | balanced highs - only 1.9% away from median
(+) | highs are linear (5.4% delta to prev. frequency)
Overall 100 - 16.000 Hz
(+) | overall sound is linear (6.4% difference to median)
Compared to same class
» 4% of all tested devices in this class were better, 1% similar, 95% worse
» The best had a delta of 5%, average was 17%, worst was 45%
Compared to all devices tested
» 1% of all tested devices were better, 0% similar, 99% worse
» The best had a delta of 4%, average was 23%, worst was 134%
Apple MacBook Pro 16 2021 M1 Pro audio analysis
(+) | speakers can play relatively loud (84.7 dB)
Bass 100 - 315 Hz
(+) | good bass - only 3.8% away from median
(+) | bass is linear (5.2% delta to prev. frequency)
Mids 400 - 2000 Hz
(+) | balanced mids - only 1.3% away from median
(+) | mids are linear (2.1% delta to prev. frequency)
Highs 2 - 16 kHz
(+) | balanced highs - only 1.9% away from median
(+) | highs are linear (2.7% delta to prev. frequency)
Overall 100 - 16.000 Hz
(+) | overall sound is linear (4.6% difference to median)
Compared to same class
» 0% of all tested devices in this class were better, 0% similar, 100% worse
» The best had a delta of 5%, average was 17%, worst was 45%
Compared to all devices tested
» 0% of all tested devices were better, 0% similar, 100% worse
» The best had a delta of 4%, average was 23%, worst was 134%
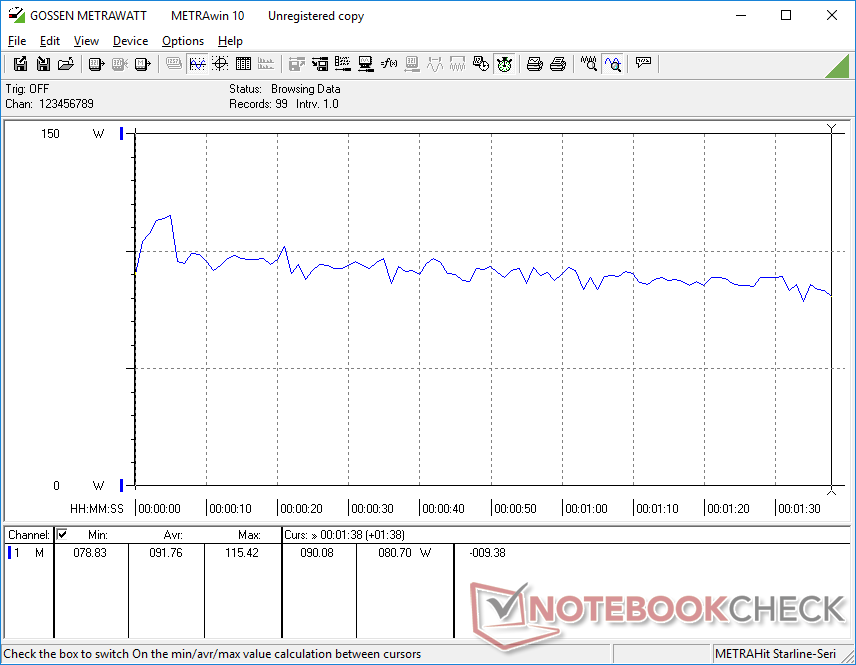
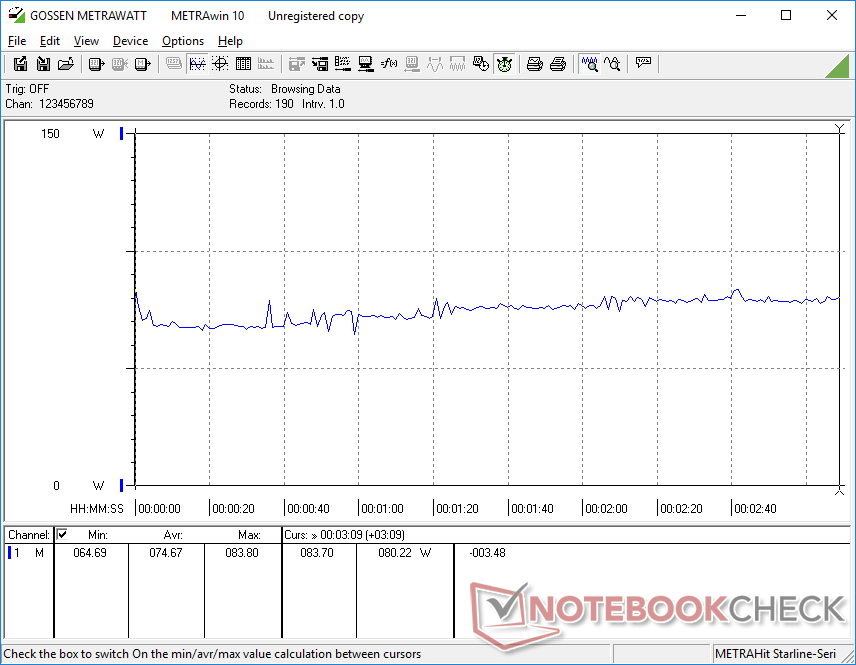
能源管理--更多动力
消耗功率
XPS 15 9500、9510和9520是目前市场上唯一配备130 W USB-C适配器的主要笔记本电脑,超过了USB-IF规定的100 W USB-C Power Delivery限制。更高的开销使电池即使在运行游戏等高要求负载时也能继续以体面的速度充电。还值得注意的是,我们的测试装置不会出现我们在XPS 17 9700上遇到的任何充电问题。 XPS 17 9700.
运行 Witcher 3消耗75W,接近我们在XPS 15 9510或竞争的AMD驱动的Zenbook Pro 15 OLED上的记录。也许更有趣的是,运行Prime95将消耗一个稳定的88W,而在搭载Core 7-11800H的XPS 15 9510上为65W。因此,对于我们上面记录的多线程性能的35%至42%的同比增长,功耗增加了大约35%。普遍较高的功耗与我们在Alder Lake平台上观察到的情况一致。 Alder Lake平台整体上的情况.
XPS 15 9520配备的中小型(约14.3 x 6.6 x 2.3厘米)130瓦USB-C交流适配器与XPS 9500和9510配备的适配器相同。
| Off / Standby | |
| Idle | |
| Load |
|
Key:
min: | |
| Dell XPS 15 9520 RTX 3050 Ti i7-12700H, GeForce RTX 3050 Ti Laptop GPU, WDC PC SN810 512GB, OLED, 3456x2160, 15.6" | Dell XPS 15 9510 11800H RTX 3050 Ti OLED i7-11800H, GeForce RTX 3050 Ti Laptop GPU, Micron 2300 512GB MTFDHBA512TDV, OLED, 3456x2160, 15.6" | Dell XPS 15 9500 Core i7 4K UHD i7-10875H, GeForce GTX 1650 Ti Mobile, SK Hynix PC611 512GB, IPS, 3840x2400, 15.6" | HP Spectre X360 15-5ZV31AV i7-10510U, GeForce MX250, Intel SSD 660p 2TB SSDPEKNW020T8, IPS, 3840x2160, 15.6" | Asus Zenbook Pro 15 OLED UM535Q R9 5900HX, GeForce RTX 3050 Ti Laptop GPU, WDC PC SN730 SDBPNTY-1T00, OLED, 1920x1080, 15.6" | MSI Stealth 15M A11SEK i7-1185G7, GeForce RTX 2060 Max-Q, WDC PC SN530 SDBPNPZ-1T00, IPS, 1920x1080, 15.6" | |
|---|---|---|---|---|---|---|
| Power Consumption | -5% | -27% | 20% | 5% | -25% | |
| Idle Minimum * (Watt) | 5.5 | 7.6 -38% | 5.7 -4% | 5.2 5% | 5.5 -0% | 7.3 -33% |
| Idle Average * (Watt) | 7.2 | 9.9 -38% | 13.5 -88% | 8.5 -18% | 7.4 -3% | 10.1 -40% |
| Idle Maximum * (Watt) | 16 | 10.8 32% | 19.6 -23% | 8.7 46% | 14.9 7% | 17.6 -10% |
| Load Average * (Watt) | 91.8 | 81 12% | 114.1 -24% | 65.6 29% | 78.2 15% | 106.6 -16% |
| Witcher 3 ultra * (Watt) | 74.6 | 76.2 -2% | 93 -25% | 56.5 24% | 80.1 -7% | 105.4 -41% |
| Load Maximum * (Watt) | 134.7 | 131 3% | 135.2 -0% | 92.4 31% | 110.9 18% | 151.2 -12% |
* ... smaller is better
Power Consumption Witcher 3 / Stresstest
Power Consumption external Monitor
电池寿命
在近9个小时的持续实际WLAN使用中,运行时间总体上与我们在XPS 9500上记录的时间相似,比XPS 9510多出近2小时。然而,请记住,由于我们的配置使用的是OLED面板,因此在相同的亮度设置下,白色会比深色多需要几瓦的功率。
使用随附的交流适配器从空电到满电,在空转或低负荷运行时需要大约2至2.5小时。
| Dell XPS 15 9520 RTX 3050 Ti i7-12700H, GeForce RTX 3050 Ti Laptop GPU, 86 Wh | Dell XPS 15 9510 11800H RTX 3050 Ti OLED i7-11800H, GeForce RTX 3050 Ti Laptop GPU, 86 Wh | Dell XPS 15 9500 Core i7 4K UHD i7-10875H, GeForce GTX 1650 Ti Mobile, 86 Wh | HP Spectre X360 15-5ZV31AV i7-10510U, GeForce MX250, 84 Wh | Asus Zenbook Pro 15 OLED UM535Q R9 5900HX, GeForce RTX 3050 Ti Laptop GPU, 96 Wh | MSI Stealth 15M A11SEK i7-1185G7, GeForce RTX 2060 Max-Q, 52 Wh | |
|---|---|---|---|---|---|---|
| Battery runtime | -32% | 7% | 22% | 45% | -42% | |
| Reader / Idle (h) | 14.8 | 23 55% | 22.6 53% | 26.2 77% | 10.5 -29% | |
| WiFi v1.3 (h) | 8.8 | 7 -20% | 9.1 3% | 10.8 23% | 12.8 45% | 6.3 -28% |
| Load (h) | 3.2 | 1.8 -44% | 2 -37% | 2.9 -9% | 3.6 13% | 1 -69% |
| H.264 (h) | 10.4 |
Pros
Cons
结论 - 阿尔德湖的不同之处
如果XPS 15 9500或9510的CPU对于你的特定应用来说太慢,那么9520将值得考虑。它的第12代 酷睿i7-12700H可以提供70%和40%的多线程性能,比第十代 酷睿i7-10875H和第11代酷睿i7-11800H的多线程性能分别提高了70%和40%,而不会对电池寿命产生显著影响。集成图形性能的内在提升也足以满足大多数办公用户,而不需要升级到任何昂贵的独立Nvidia选项。
电力用户将欣赏到处理器性能比英特尔第11代或第10代选项的显著提升。然而,对于更基本或中等的办公任务,第12代系列的额外马力可能不值得价格上涨。
然而,在CPU性能之外,其体验仍然与XPS 9510或甚至 9500.Nvidia GPU已经比9510降频,因此更快的DDR5内存的好处已经降到了最低。我们希望看到的某些变化,如更高刷新率的显示器、更高分辨率的网络摄像头、适当的Wi-Fi 6E支持,或隐私快门,仍然没有出现。如果更快的第12代CPU不吸引人,那么你可以购买XPS 15 9510,它的显示屏和GPU选项与我们的9520完全一样,但价格更低。
价格和可用性
戴尔 戴尔目前正在运送其XPS 15 9520系列,基本型号起价1500美元,如果配置到最大限度,则高达3500美元。
Dell XPS 15 9520 RTX 3050 Ti
- 08/30/2022 v7 (old)
Allen Ngo
Price comparison

