戴尔G15 5510笔记本电脑回顾。经济型120赫兹游戏笔记本面对AMD的同行
在审查了戴尔G15 5515与搭配AMD Ryzen 7 5800H和NvidiaGeForce RTX 3050 Ti笔记本GPU在去年年底,我们将审查戴尔G15 5510。虽然差异不是很大,但正如我们的评论所显示的那样,它们仍然很重要。这个评测单元也提供了来自Nvidia的相同的专用GPU。然而,这款游戏笔记本电脑没有采用AMD的动力,而是采用了英特尔酷睿i5-10200H,价格略低于1,000欧元(约1,061美元)(建议零售价)。英特尔酷睿i5-10200H与引擎盖下的8GB内存相配。
我们的测试结果显示了这对性能的影响。在下面的评论中,我们将只讨论英特尔驱动的戴尔G15 5510与戴尔G15 5515 Ryzen版不同的地方,因为这是一个评论更新。你可以在我们对AMD版本的评论中找到所有其他的 在我们对AMD版本的评论中.
此外,测试候选人必须与这个价格范围内的其他游戏笔记本电脑竞争,包括联想IdeaPad Gaming 3 15 G6具有相同的GPU和一个较新的CPU,以及技嘉G5 GD与 NvidiaGeForce RTX 3050 Laptop GPU和英特尔酷睿i5-11400H.
潜在的竞争对手比较
Rating | Date | Model | Weight | Height | Size | Resolution | Price |
|---|---|---|---|---|---|---|---|
| 79.1 % v7 (old) | 05 / 2022 | Dell G15 5510-43NHT i5-10200H, GeForce RTX 3050 Ti Laptop GPU | 2.5 kg | 23.33 mm | 15.60" | 1920x1080 | |
| 79.7 % v7 (old) | 03 / 2022 | Lenovo Ideapad Gaming 3 15IHU-82K1002RGE i5-11300H, GeForce RTX 3050 Ti Laptop GPU | 2 kg | 24.2 mm | 15.60" | 1920x1080 | |
| 82.7 % v7 (old) | 10 / 2021 | Dell G15 5515 R7 5800H, GeForce RTX 3050 Ti Laptop GPU | 2.4 kg | 24.9 mm | 15.60" | 1920x1080 | |
| 80.5 % v7 (old) | 09 / 2023 | Acer Aspire Nitro 5 AN515-55-57GF i5-10300H, GeForce RTX 3060 Laptop GPU | 2.3 kg | 23.9 mm | 15.60" | 1920x1080 | |
| 81.7 % v7 (old) | 11 / 2021 | Gigabyte G5 GD i5-11400H, GeForce RTX 3050 4GB Laptop GPU | 2.1 kg | 31.6 mm | 15.60" | 1920x1080 |
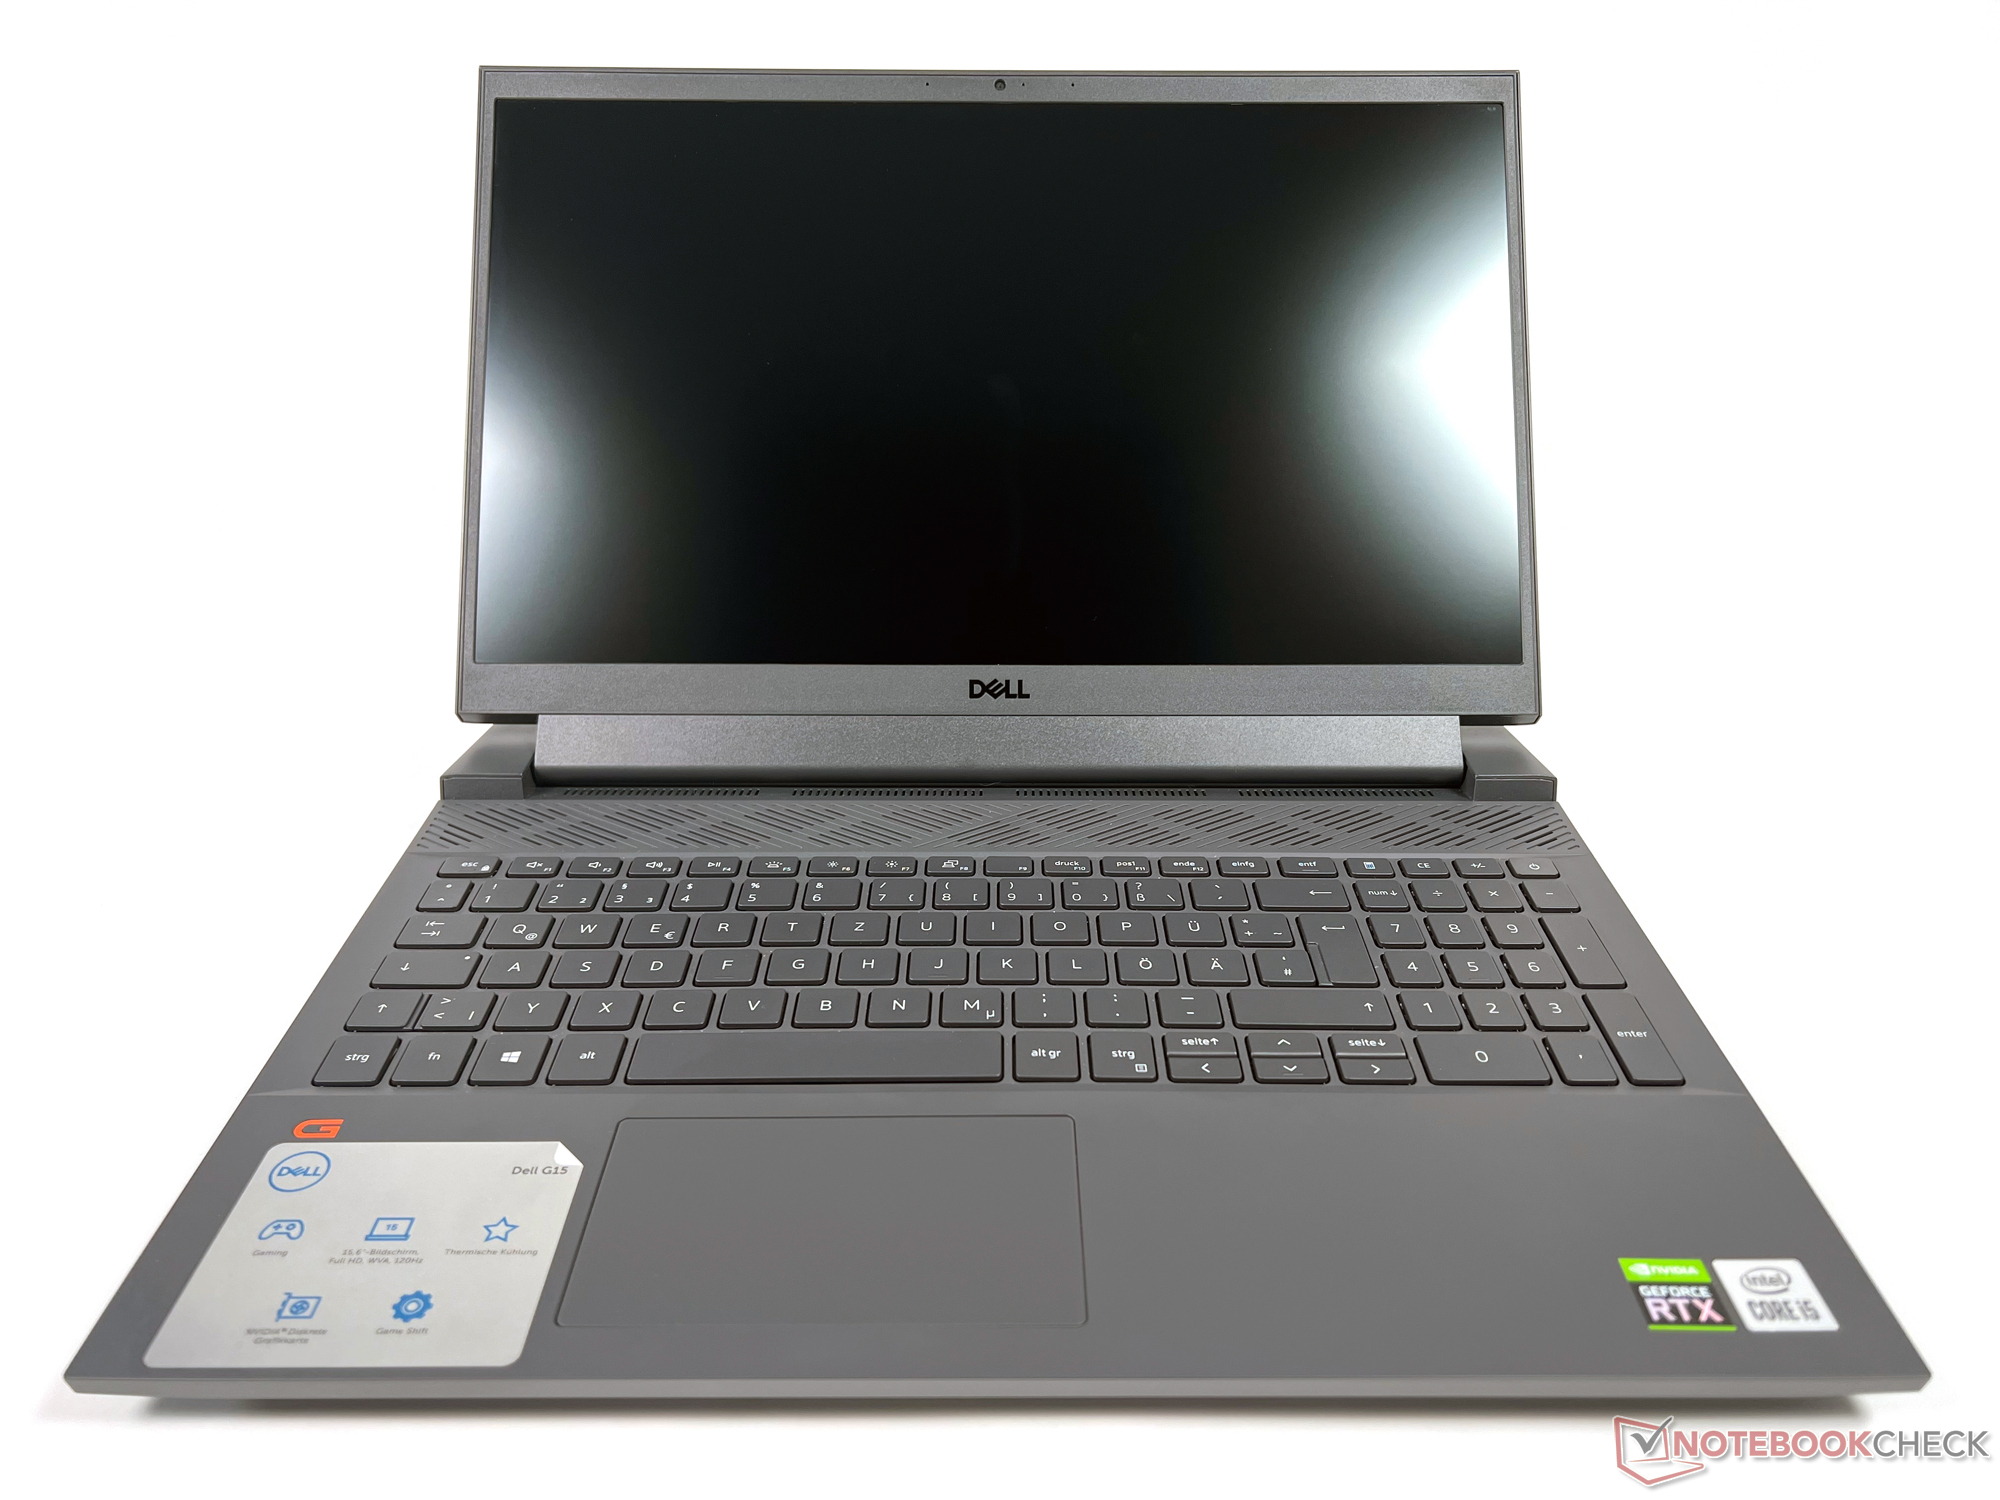
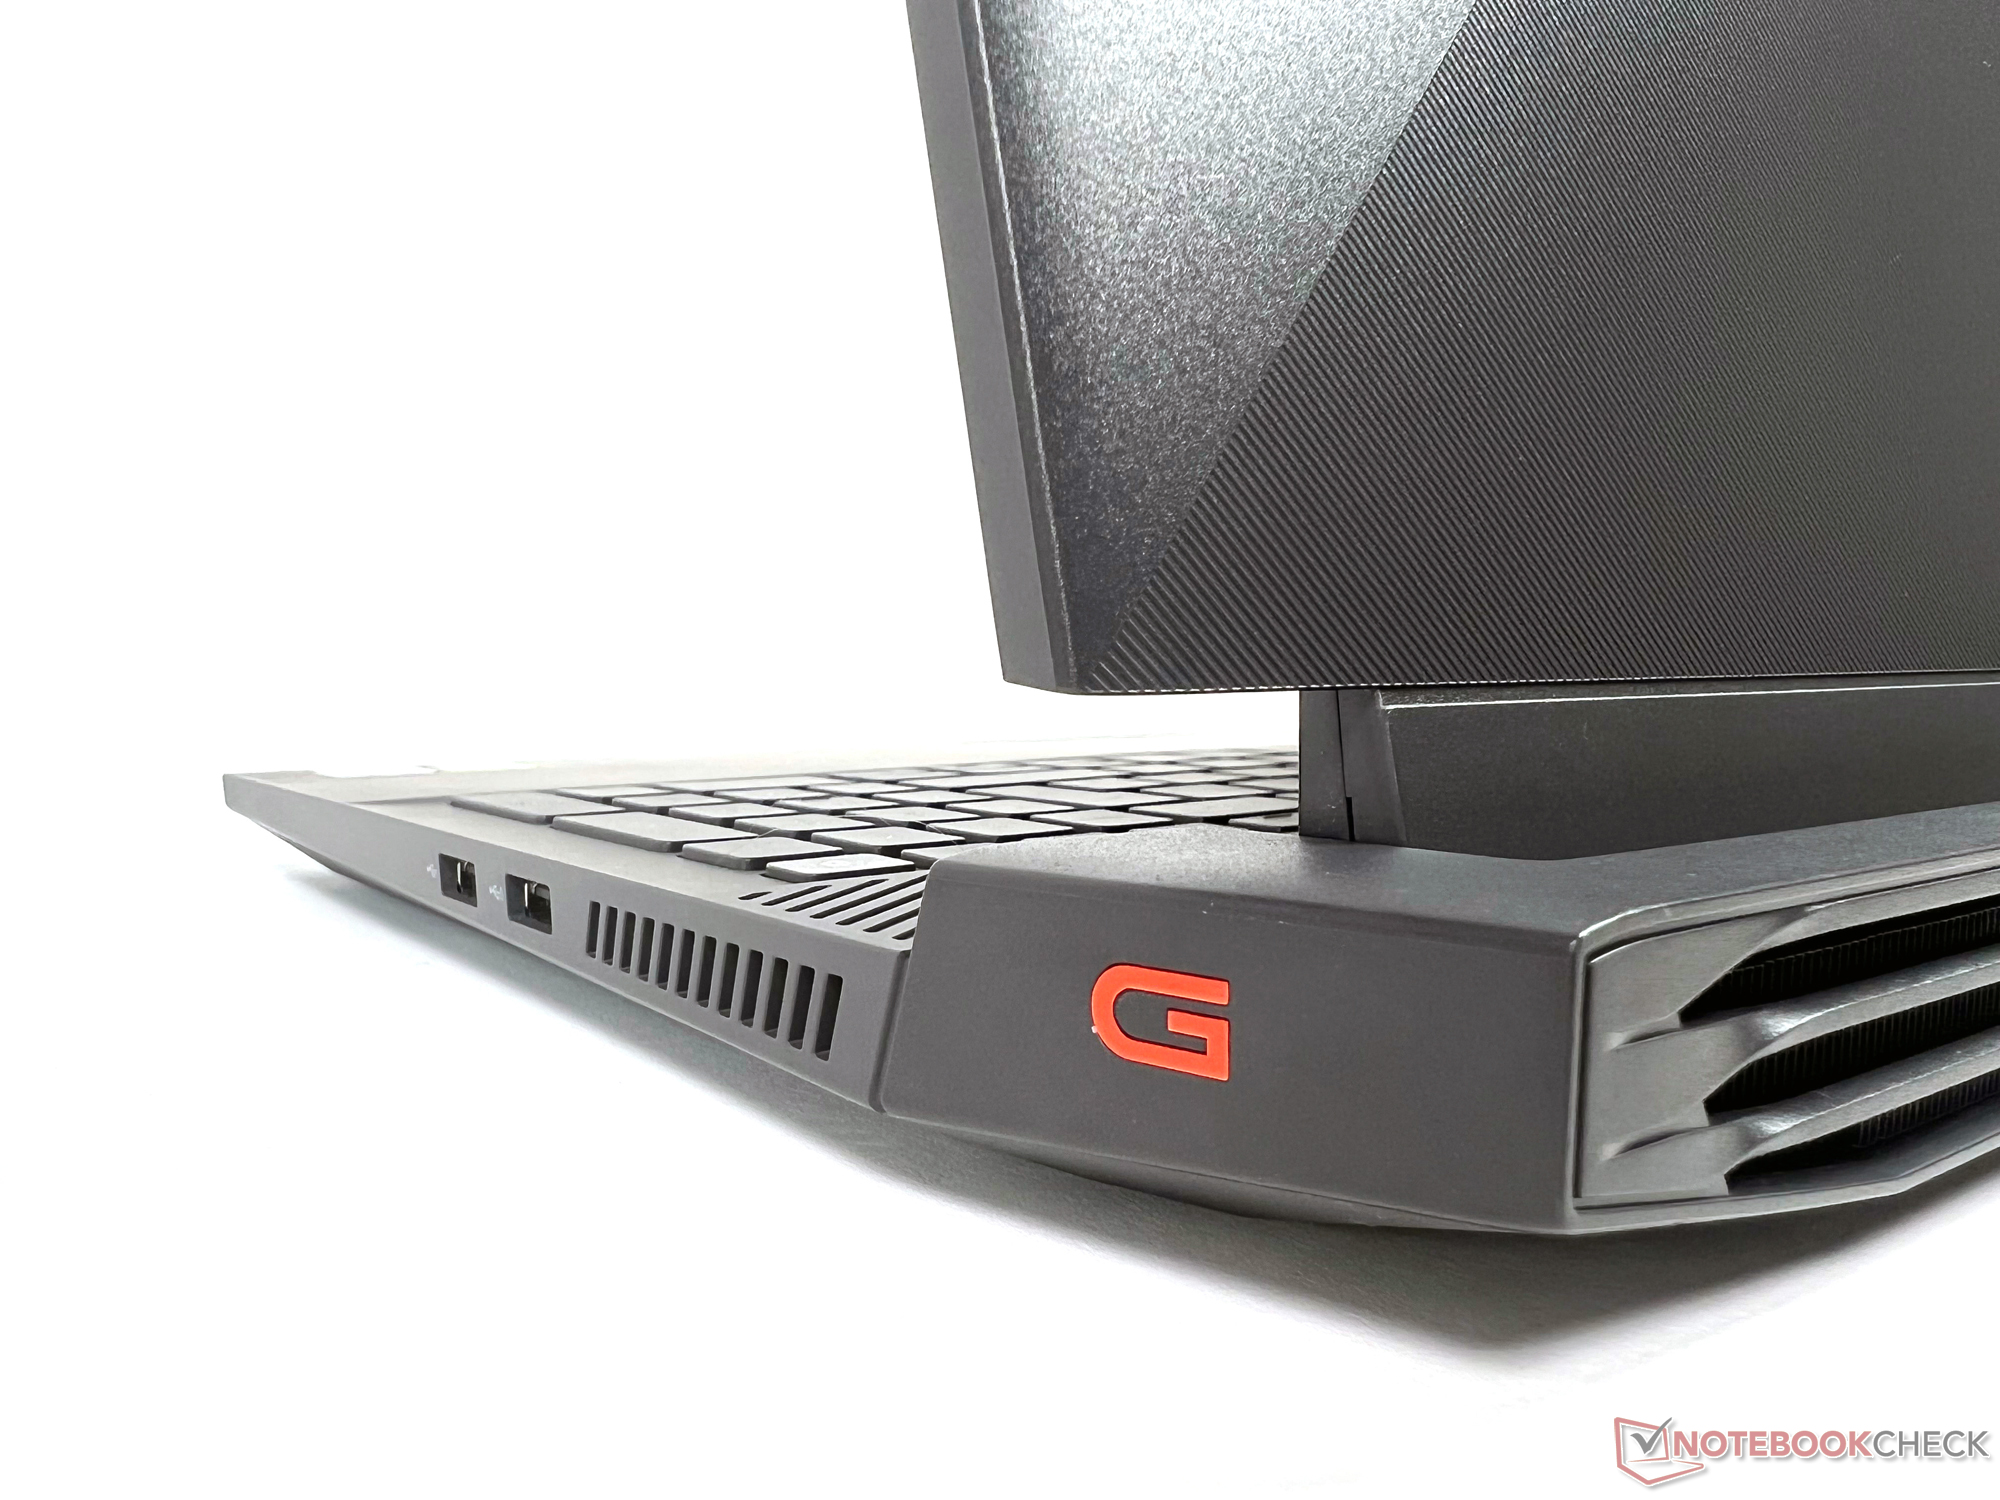
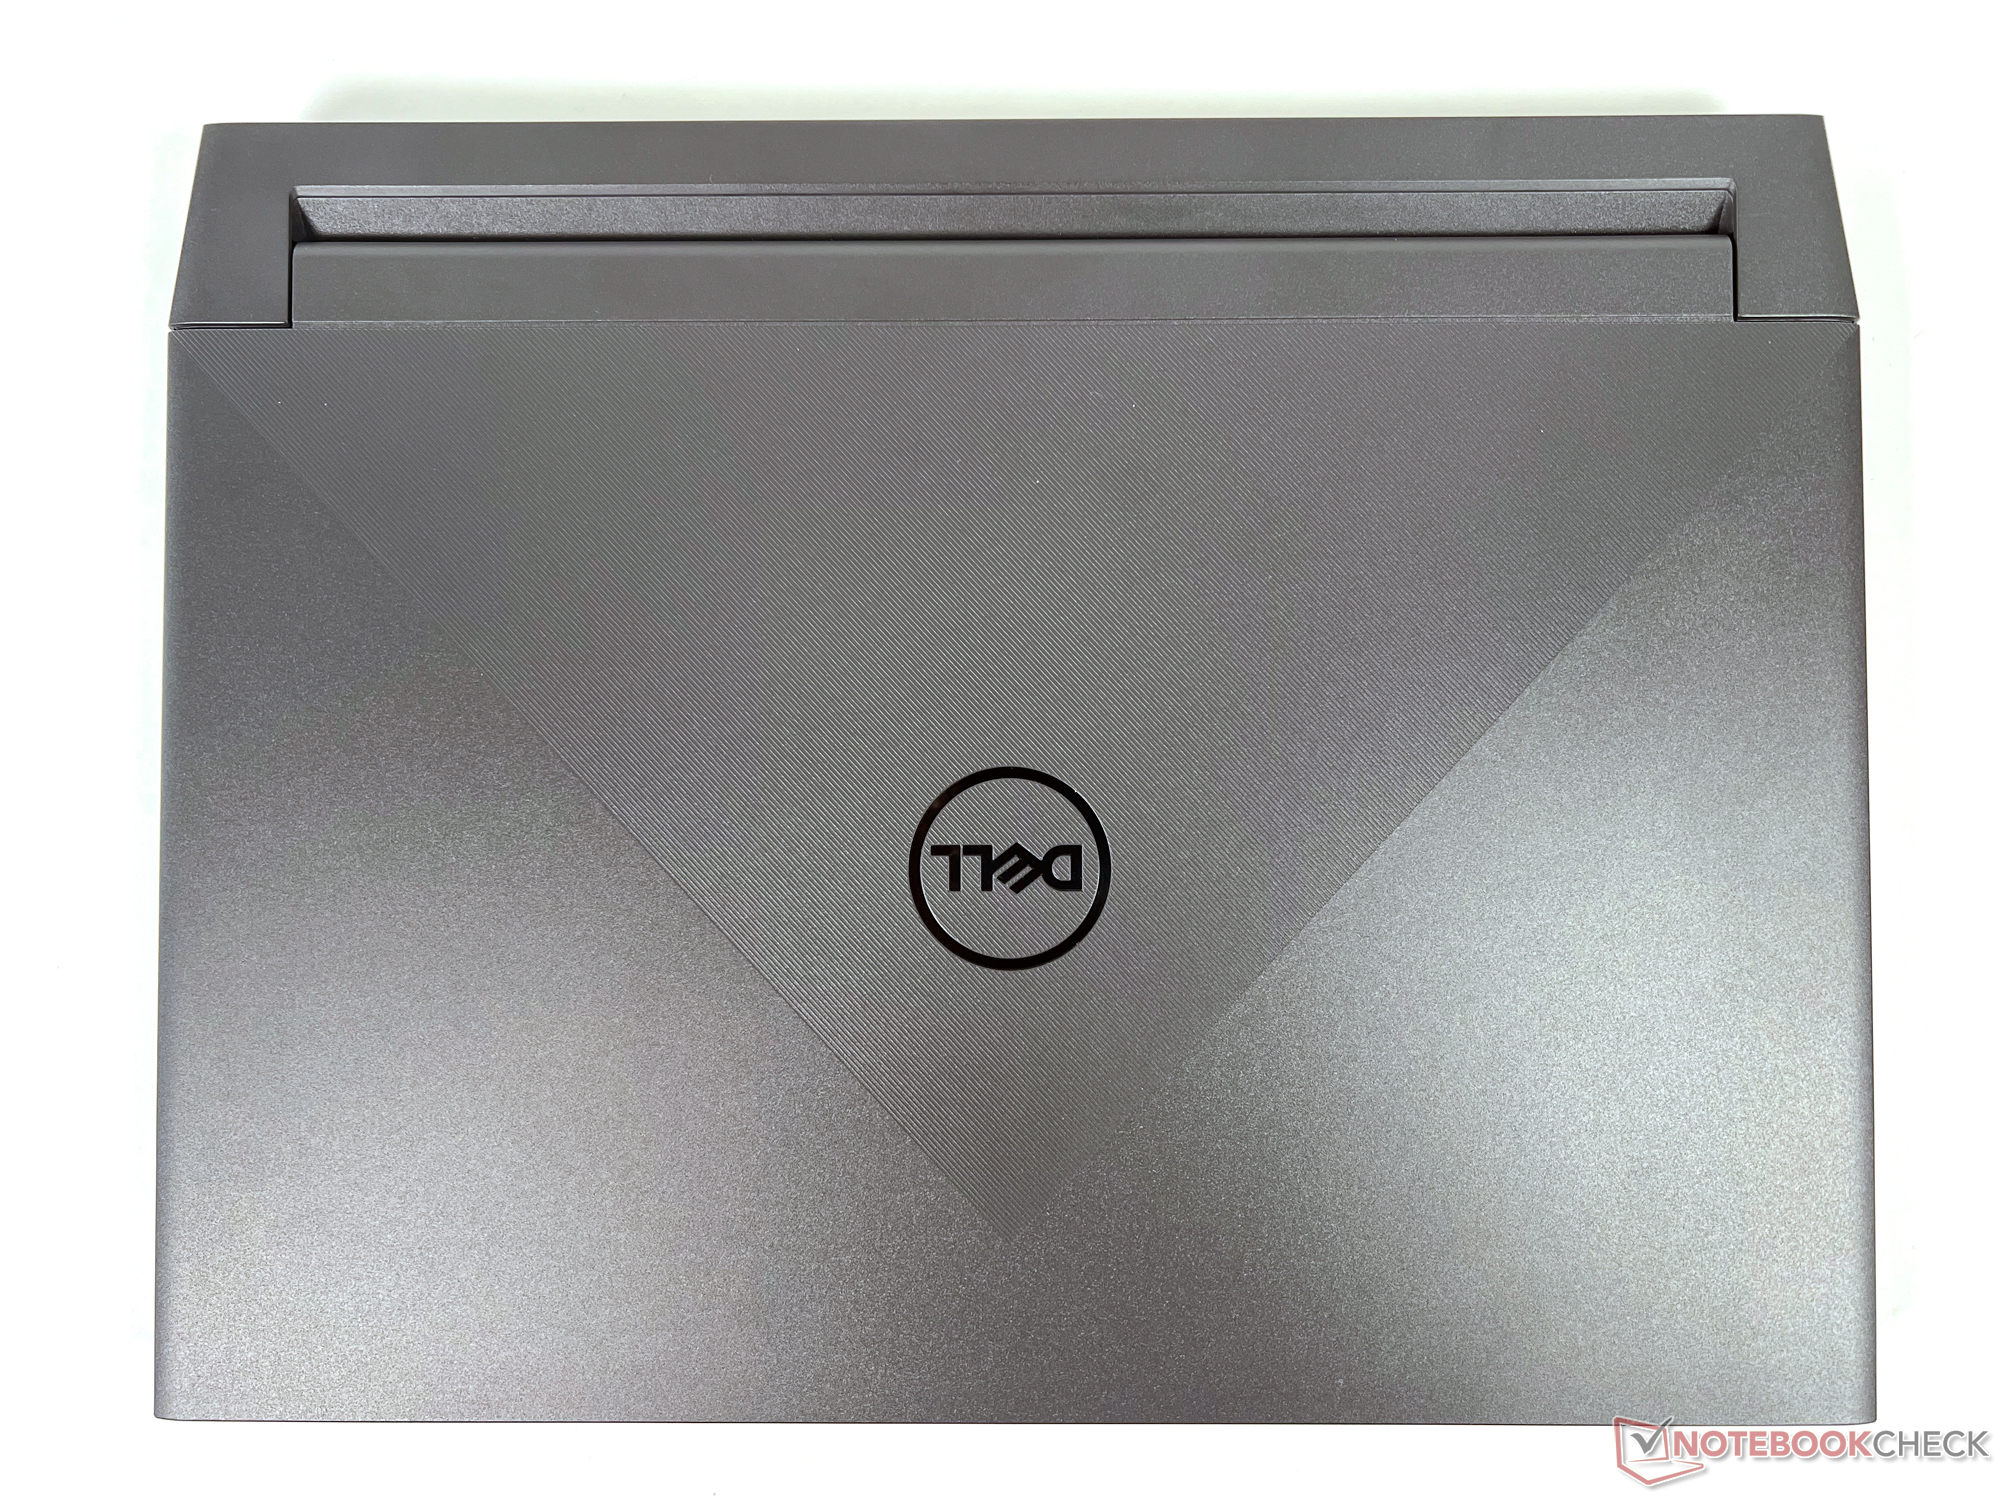
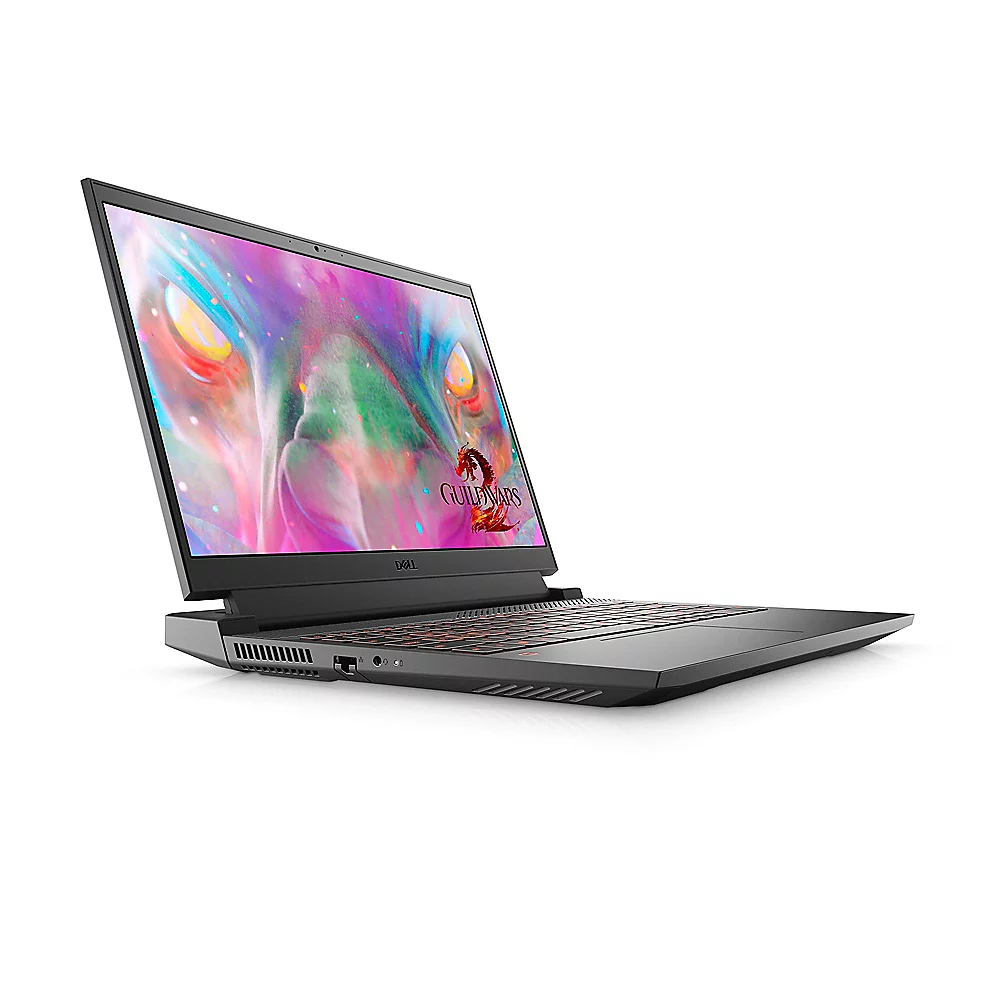
外壳:灰色塑料制成的清醒的游戏笔记本
除了颜色("带斑点的幻影灰 "与 "暗影灰")之外,G15的英特尔和AMD CPU版本在设计上没有任何区别。再一次,外壳制造精良,相当坚固,但它只是由塑料制成。此外,与浅灰色的G15相比,它看起来并不那么时尚。 AMD模型;它反而更加清醒。
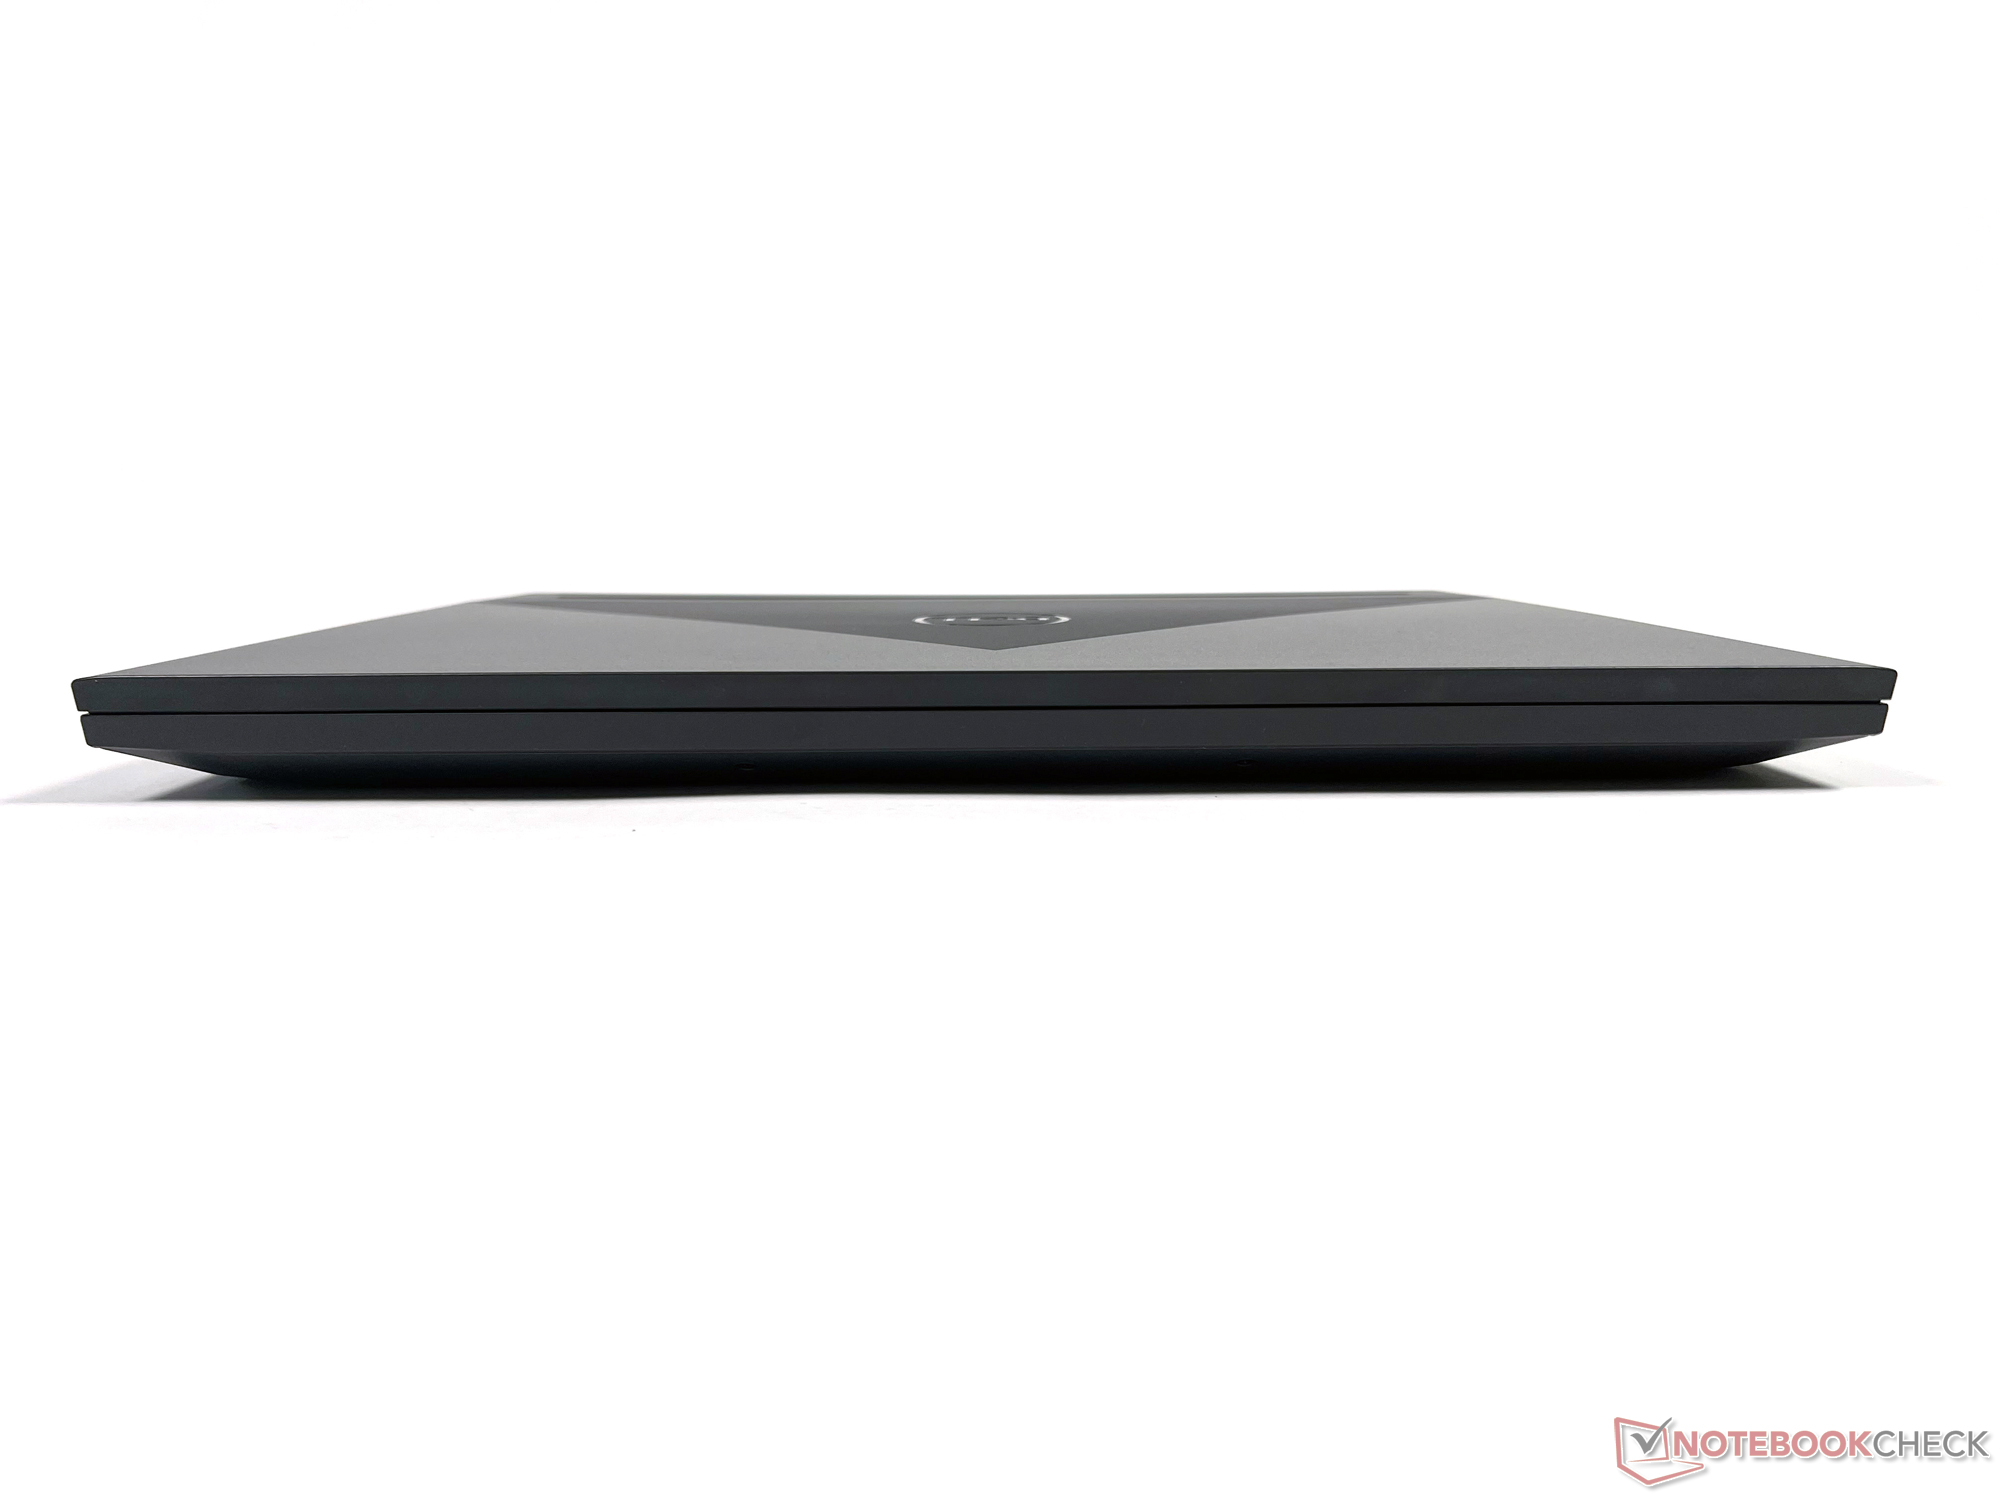
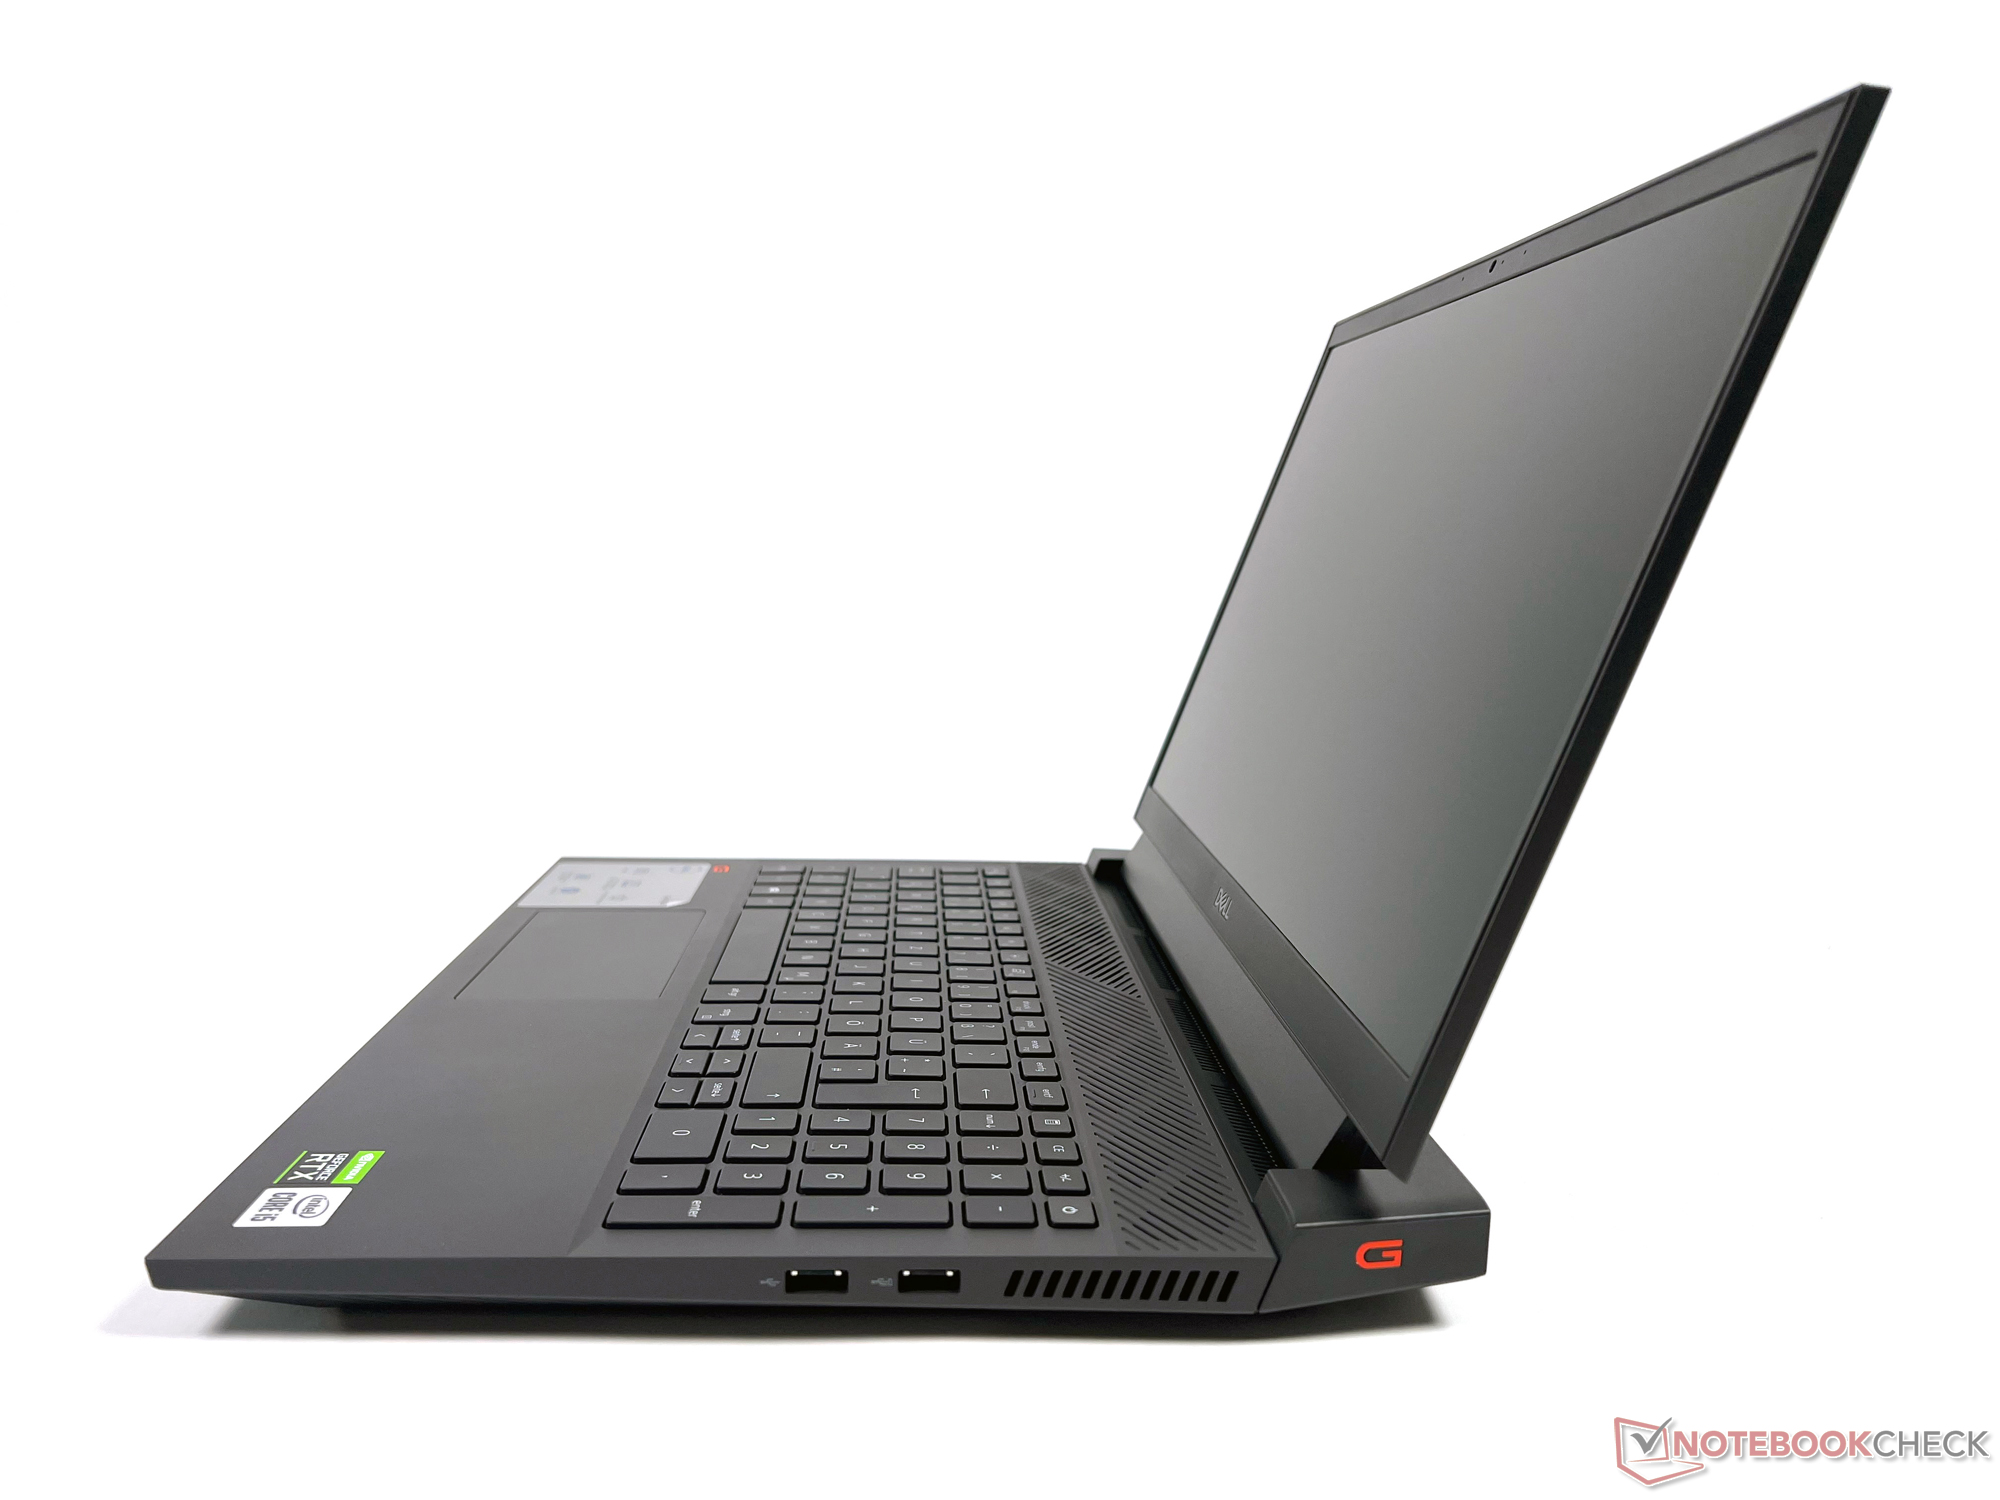
戴尔G15 5510的重量不到2.5公斤,略微重一些。加上重约1公斤的电源适配器,该设备的重量为3.5公斤。作为回报,它略微薄一些,与其他型号相比,它的宽度和厚度相似,但它的深度超过了参加比较的其他制造商的设备。
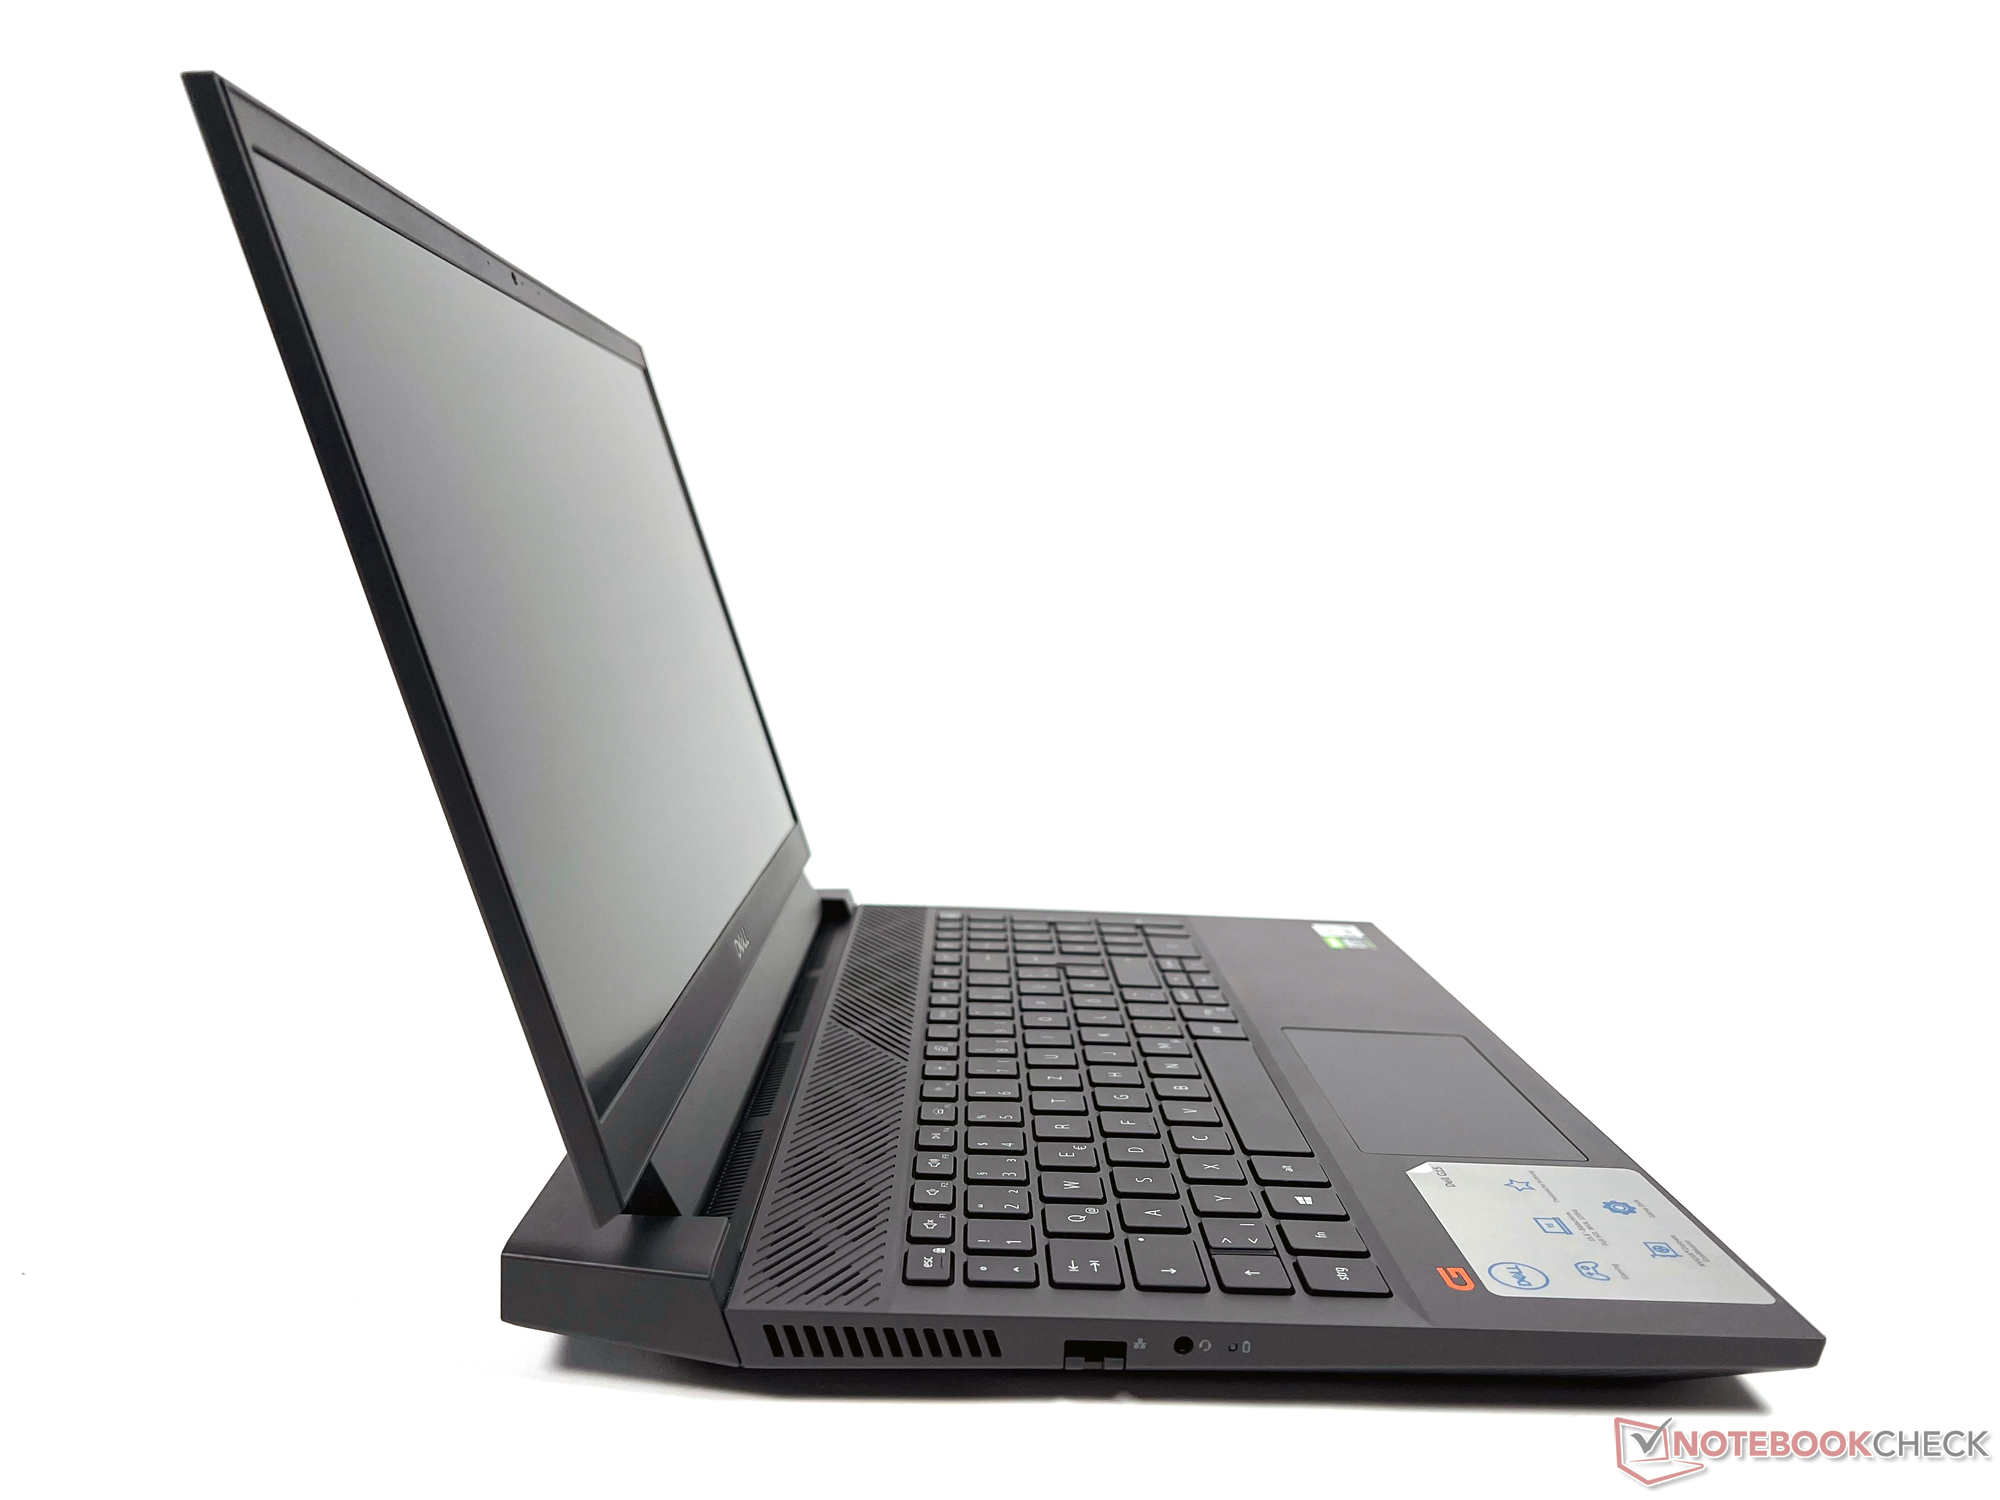
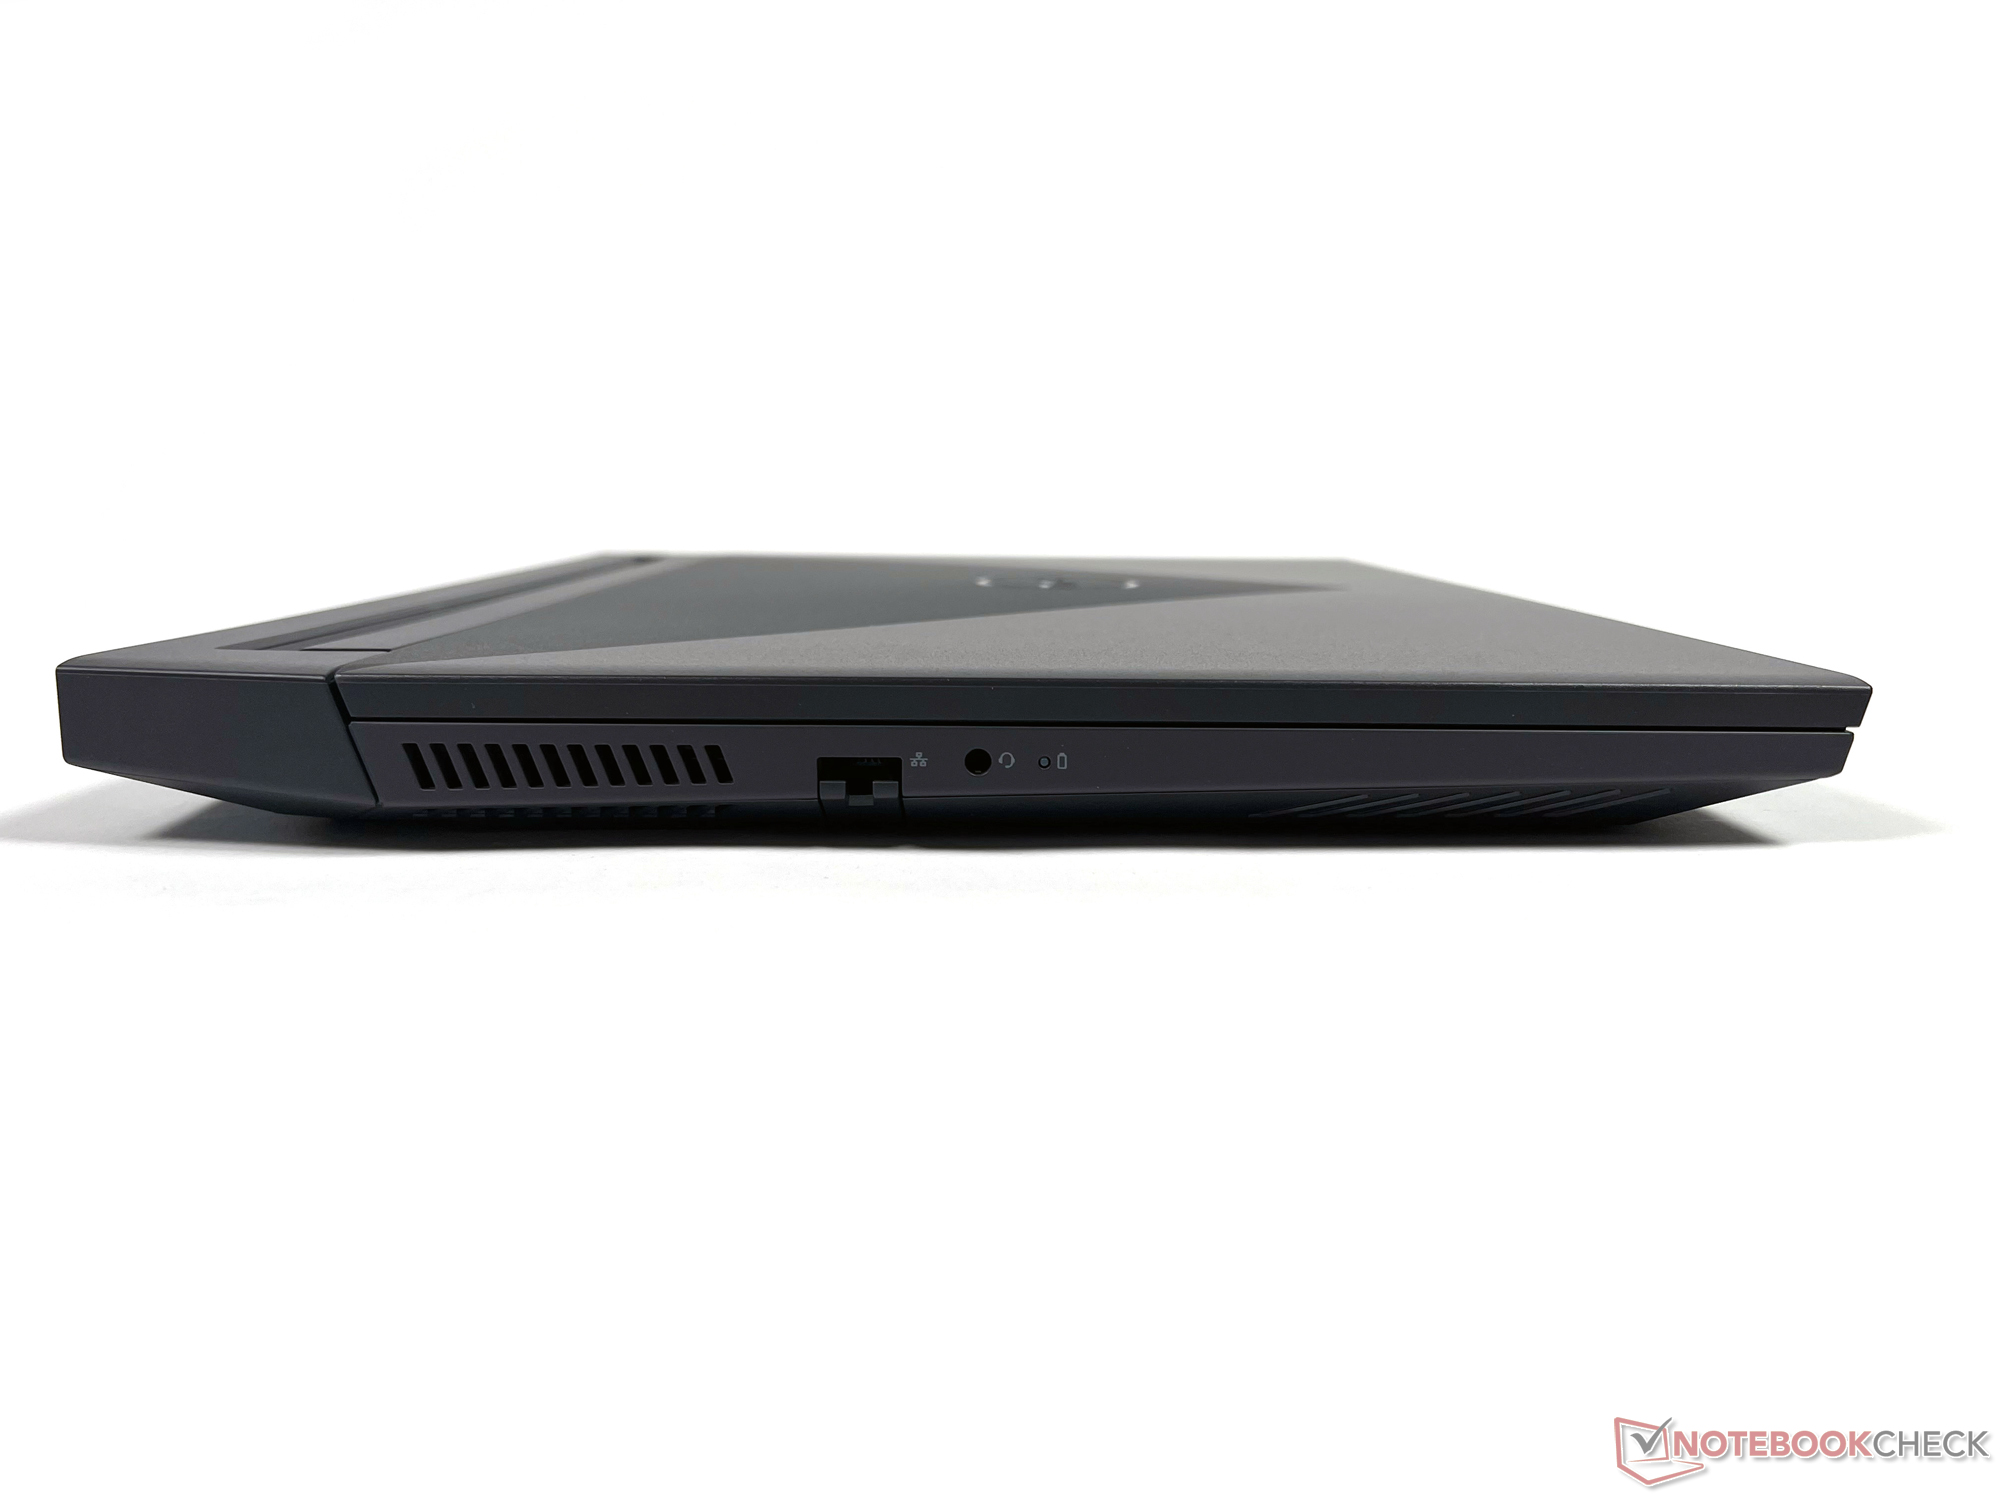
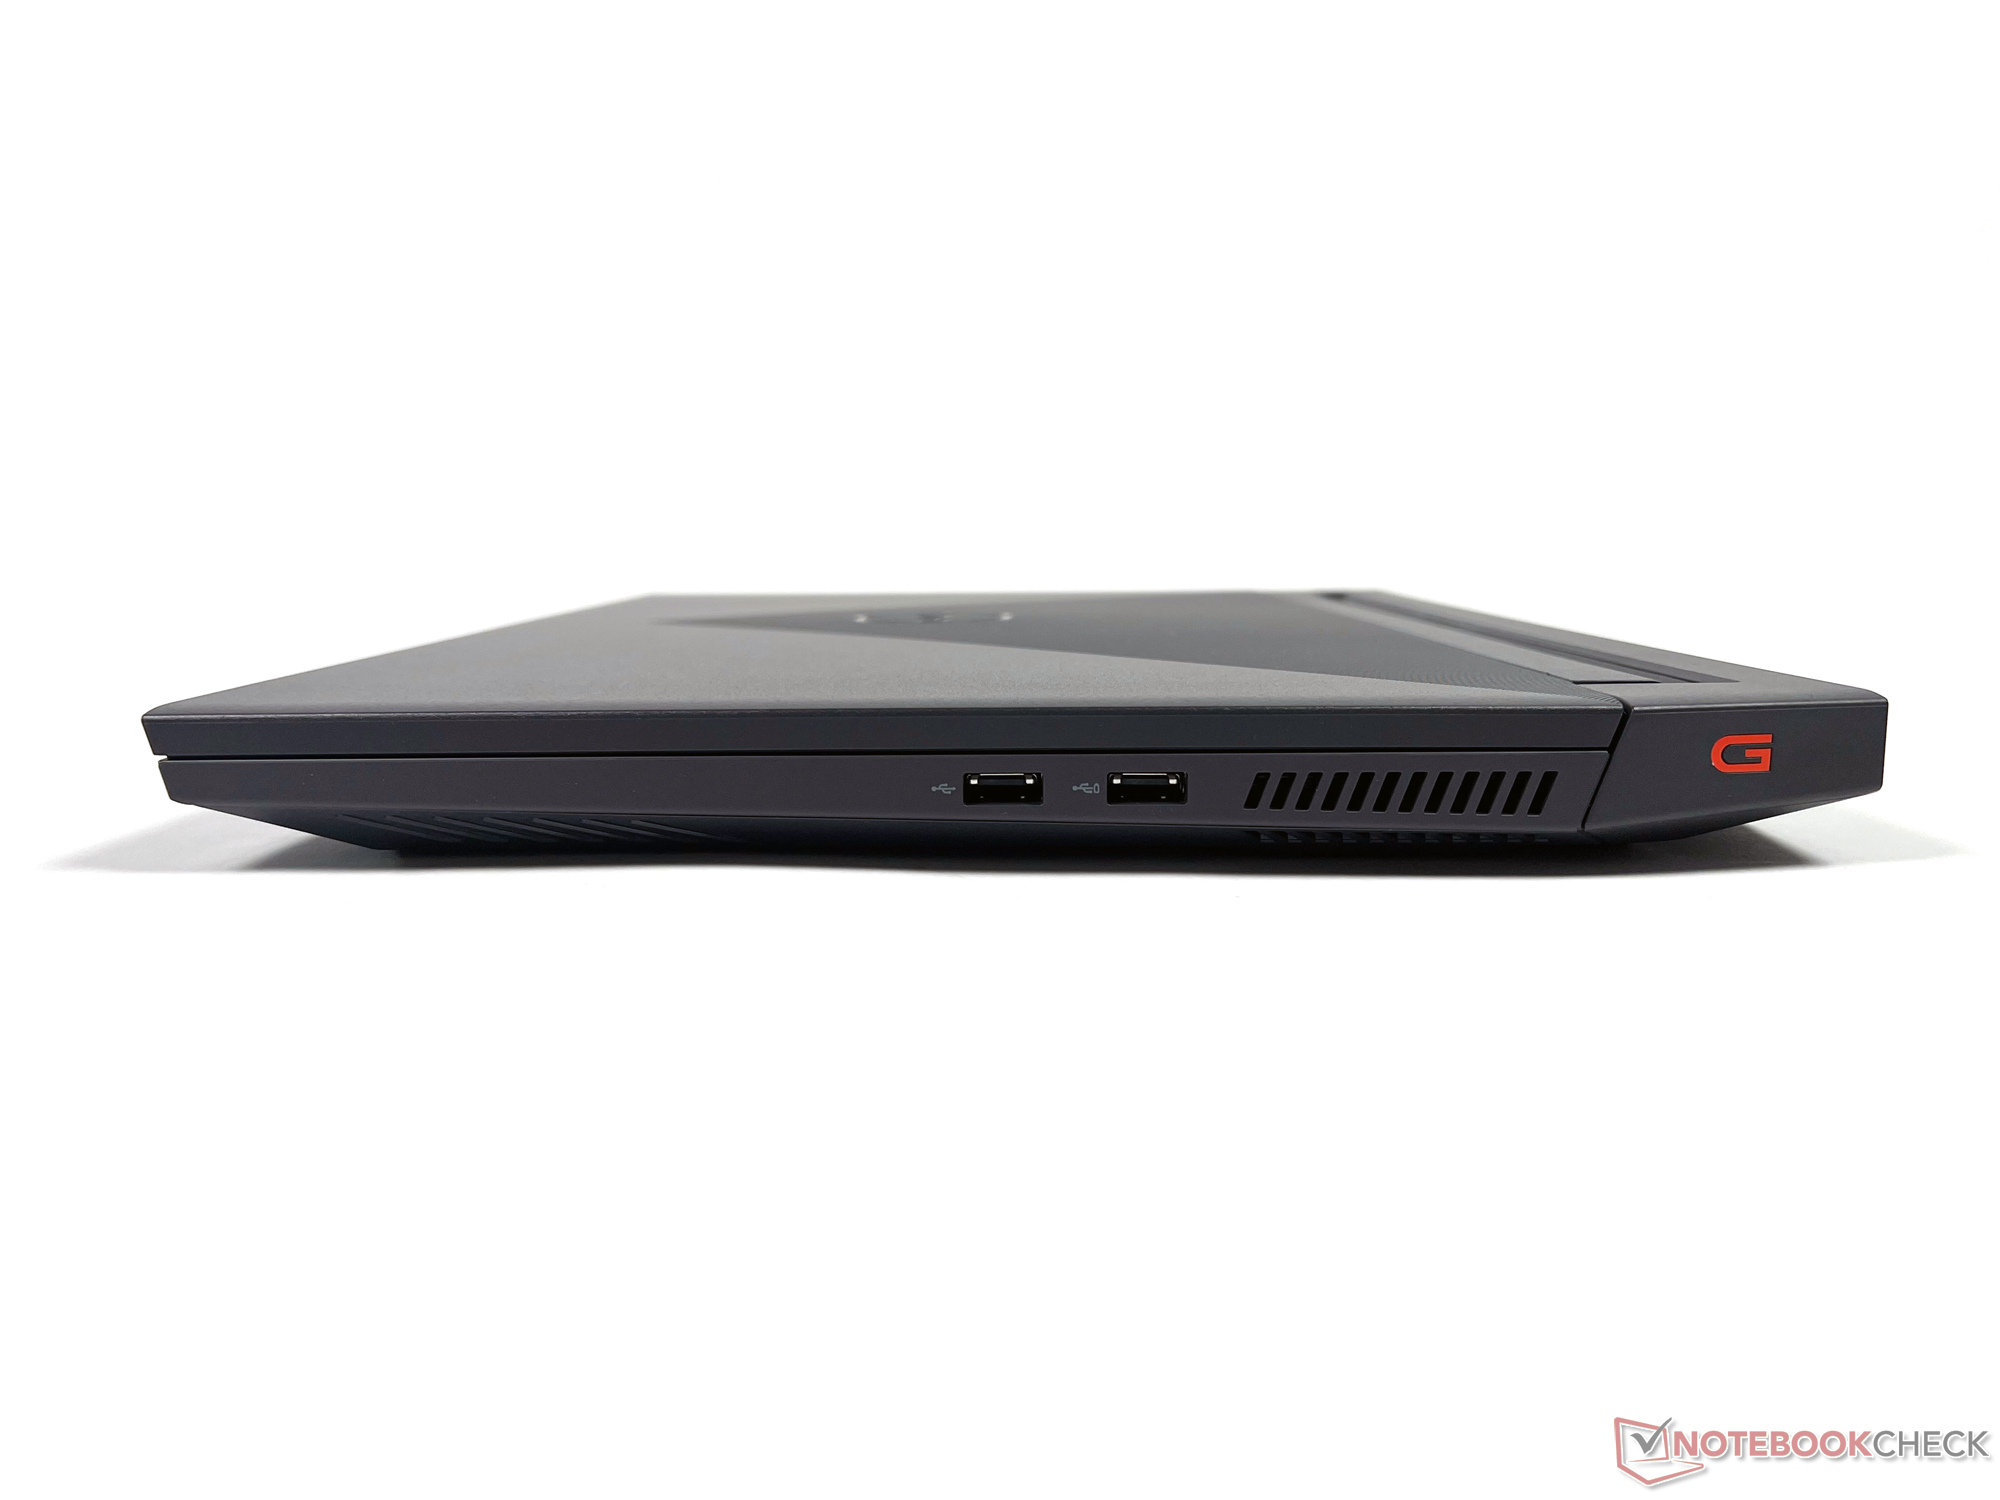
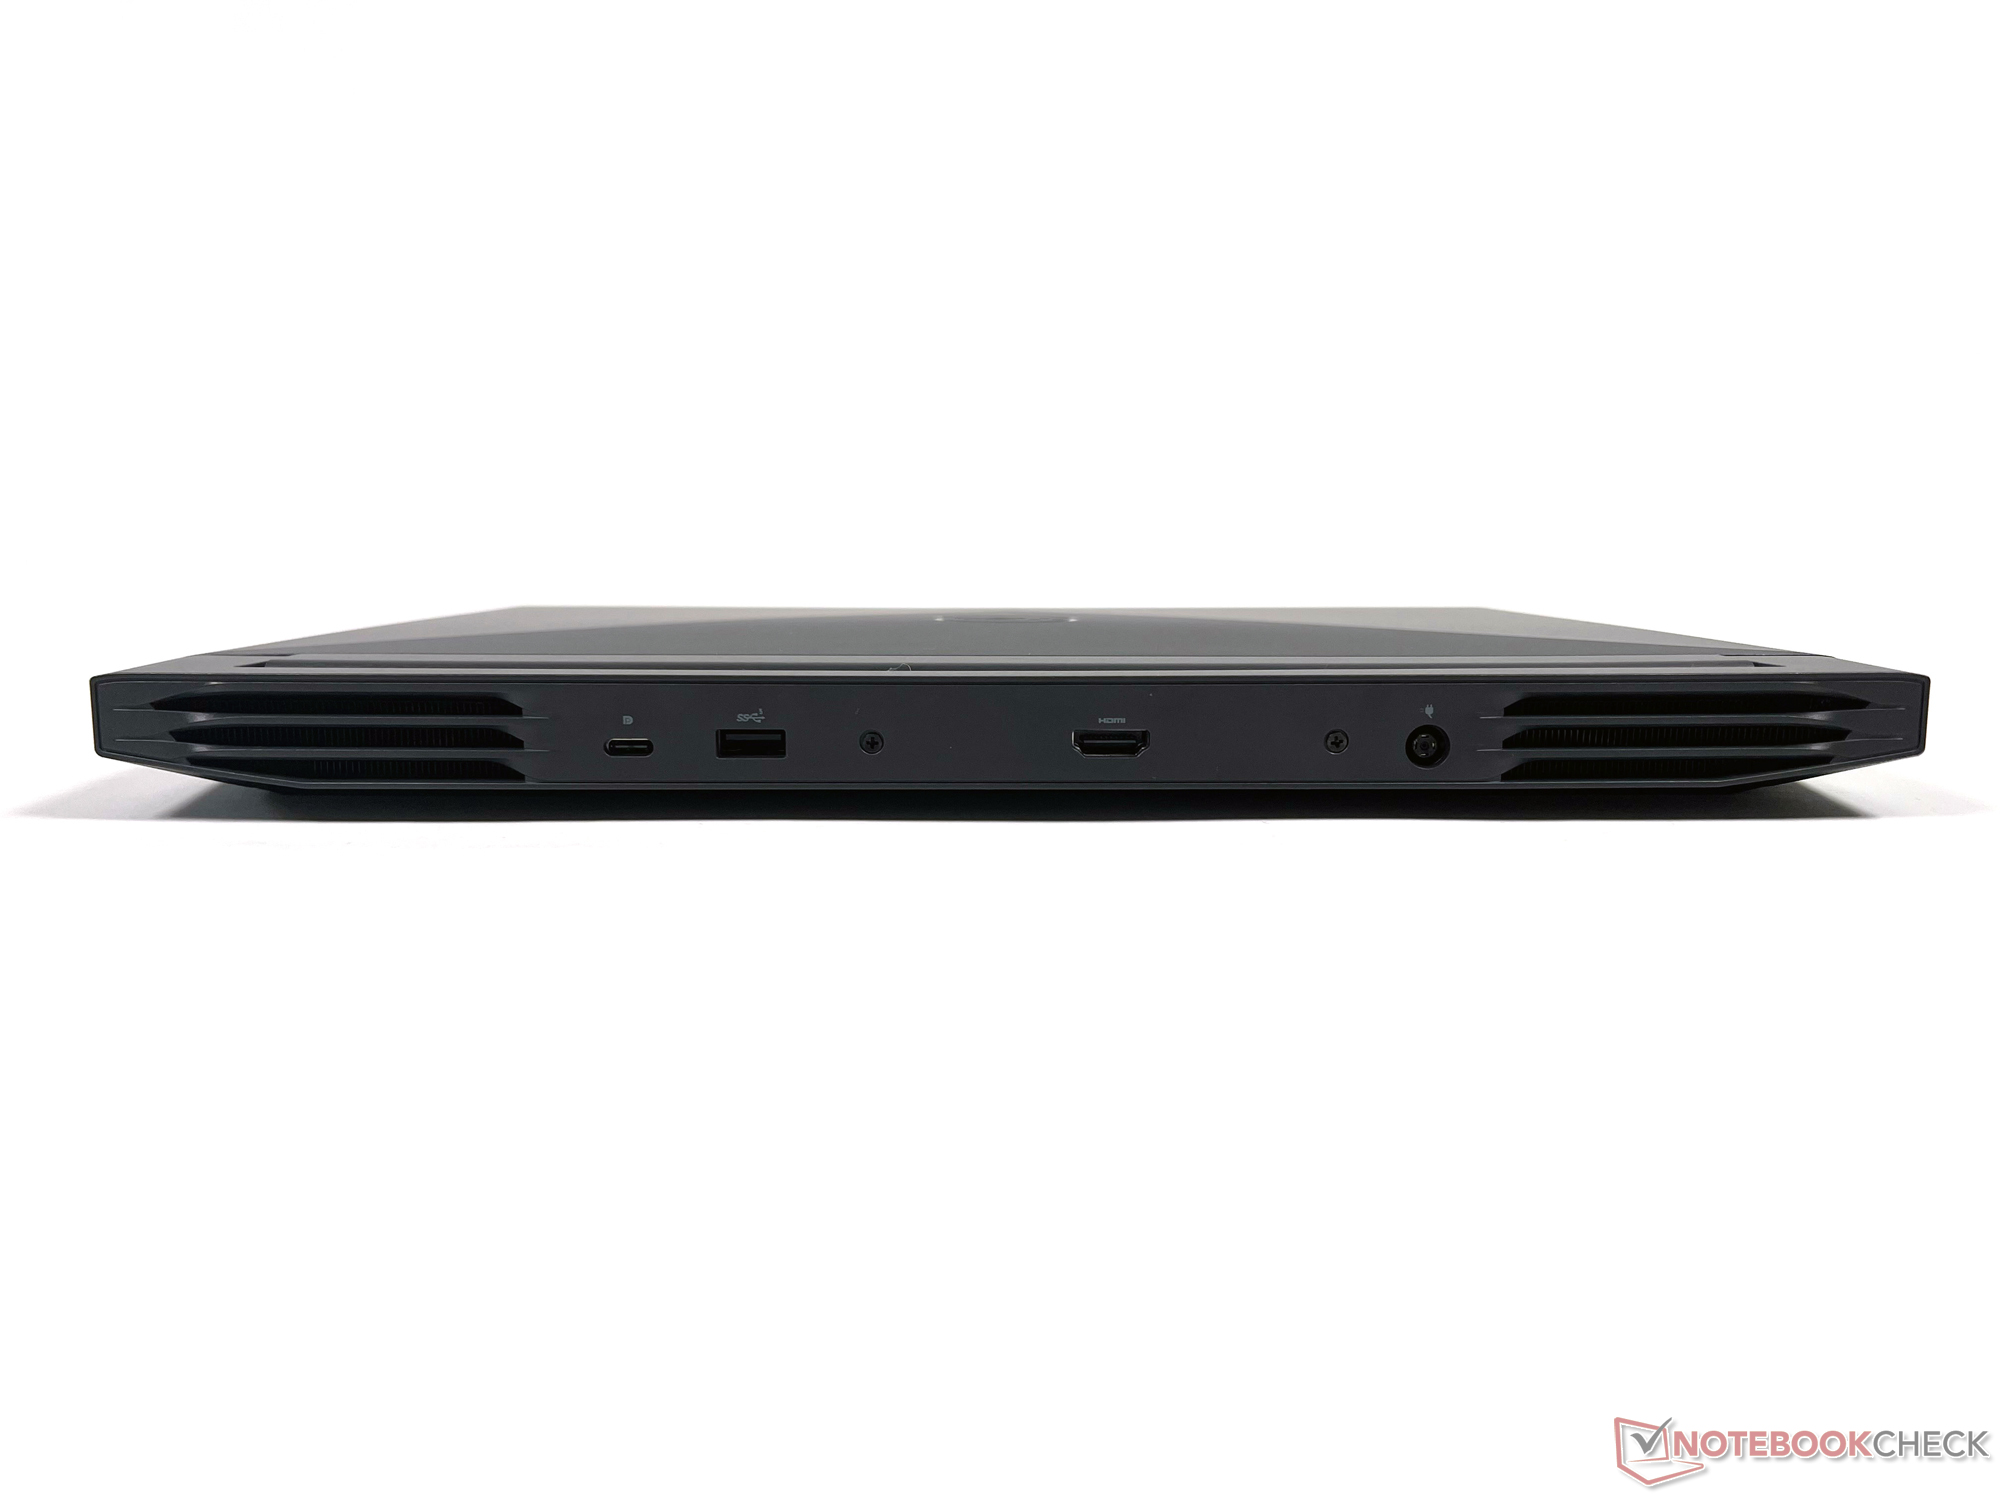
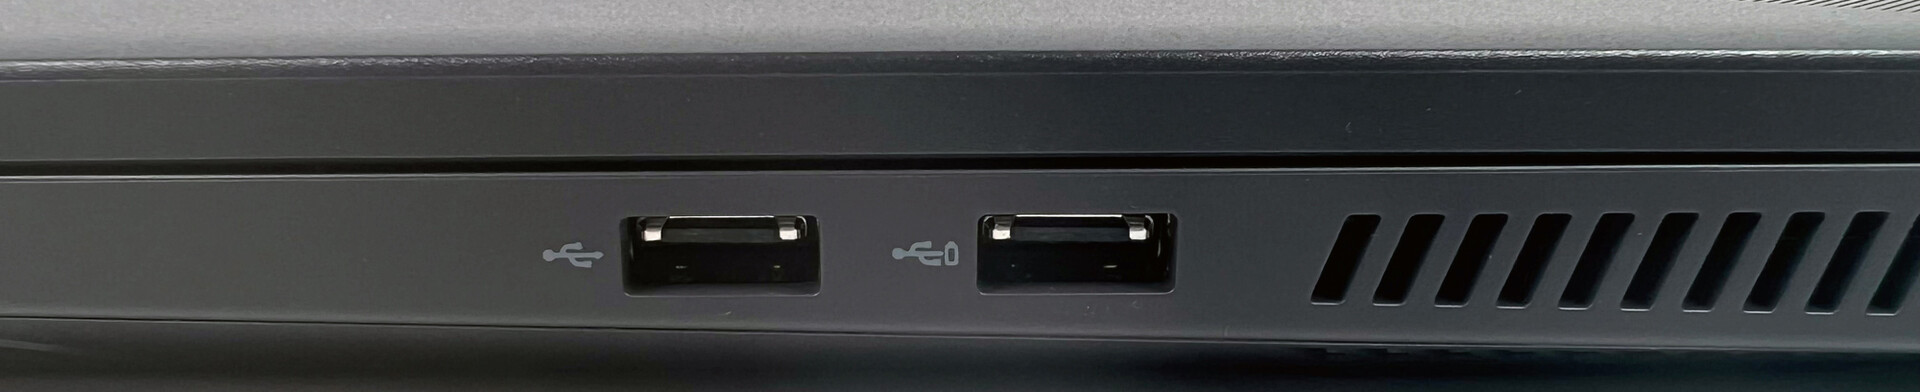
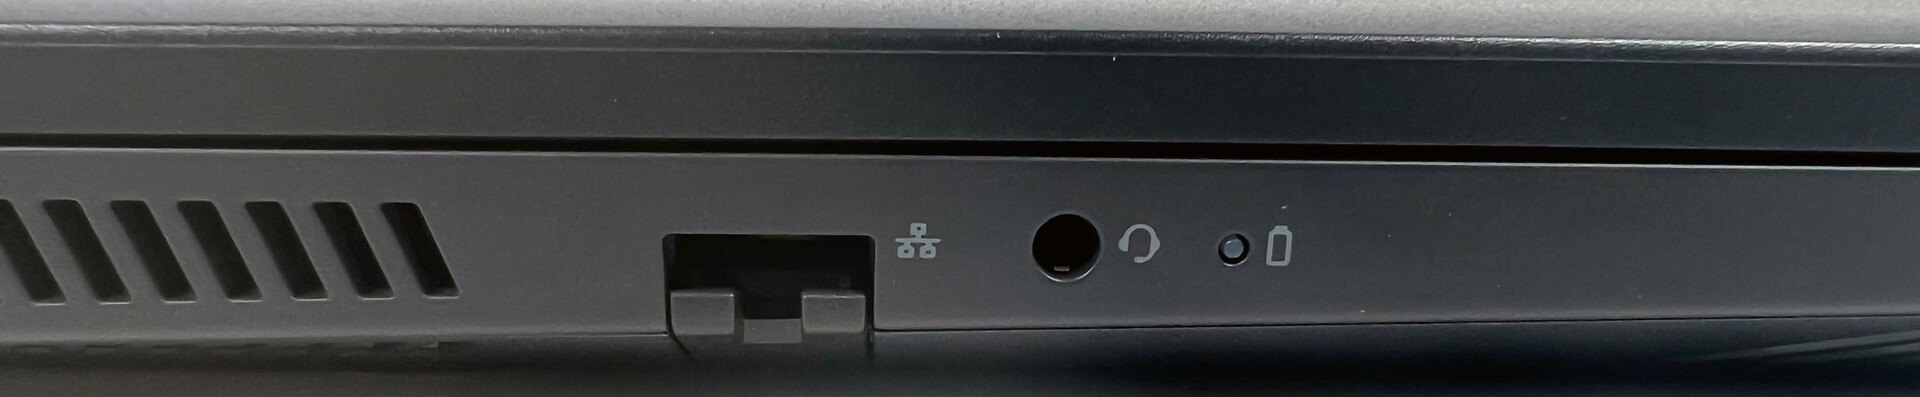
连接性。戴尔G15 5510,三面都有端口
这些端口与 戴尔G15 5515它们分布在机箱的左侧和右侧边缘,以及背面。

沟通
在我们的测试中发送数据时,内置的英特尔Wi-Fi 6 AX201无线局域网模块的表现明显低于平均水平,它不如所有的竞争对手。作为回报,它在接收数据时成功地爬到了第一位,将所有竞争对手甩在了后面。
网络摄像头
正如预期的那样,戴尔G15 5510的网络摄像头的表现与G15 5515相似,在色彩准确性方面,它处于该领域的底部。


辅料
戴尔包括一个240瓦的电源适配器和通常的游戏笔记本电脑的文件。
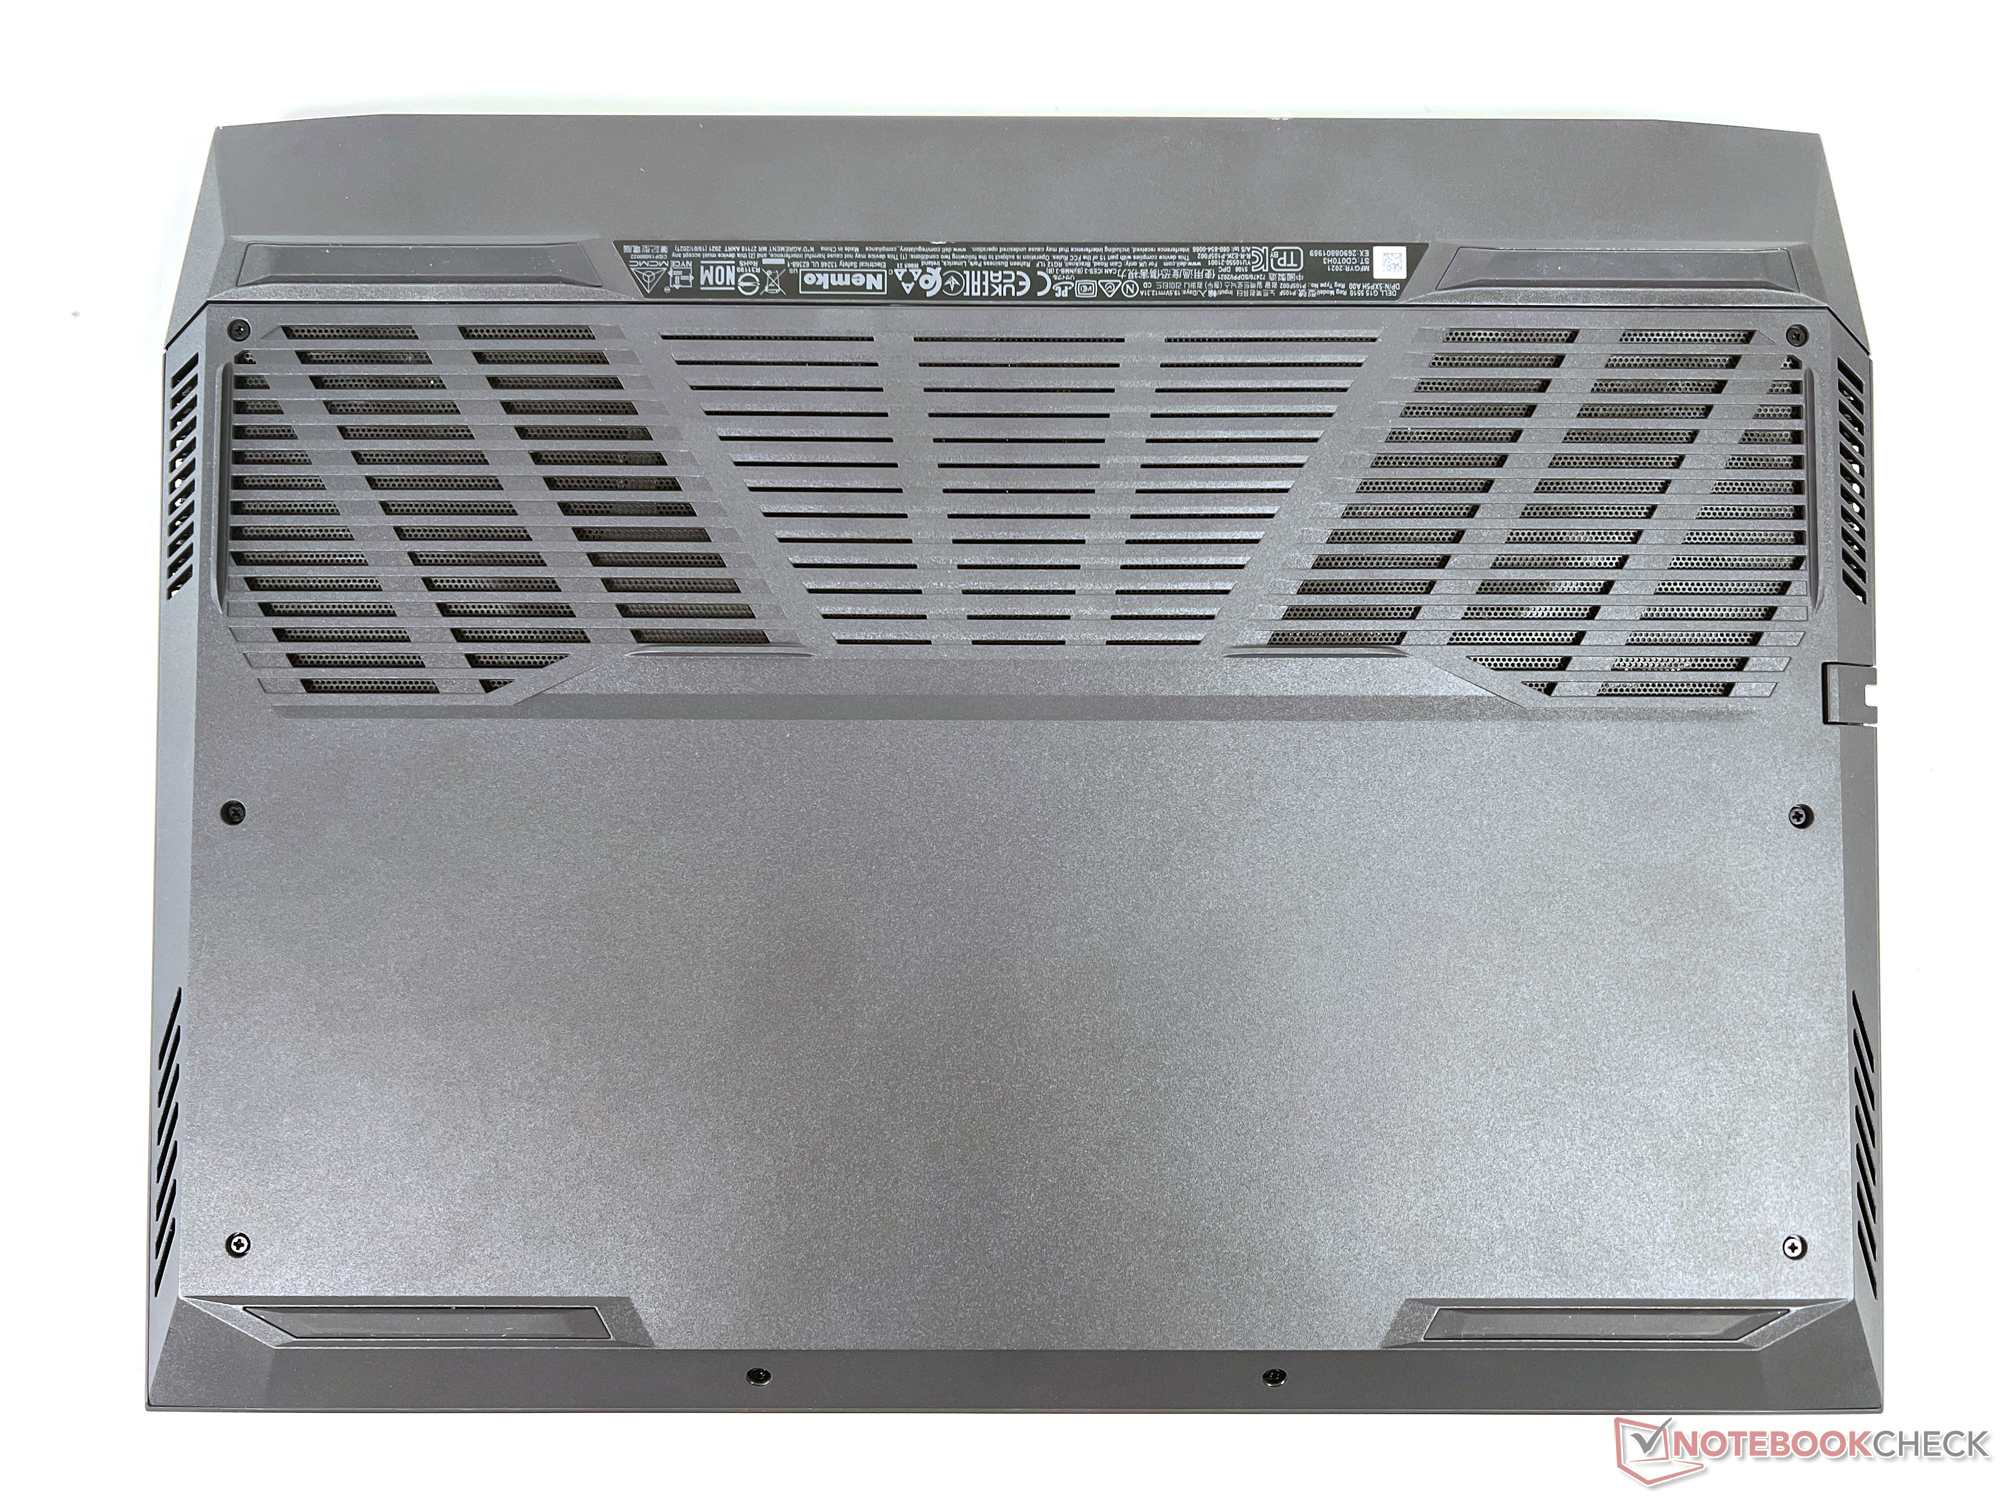
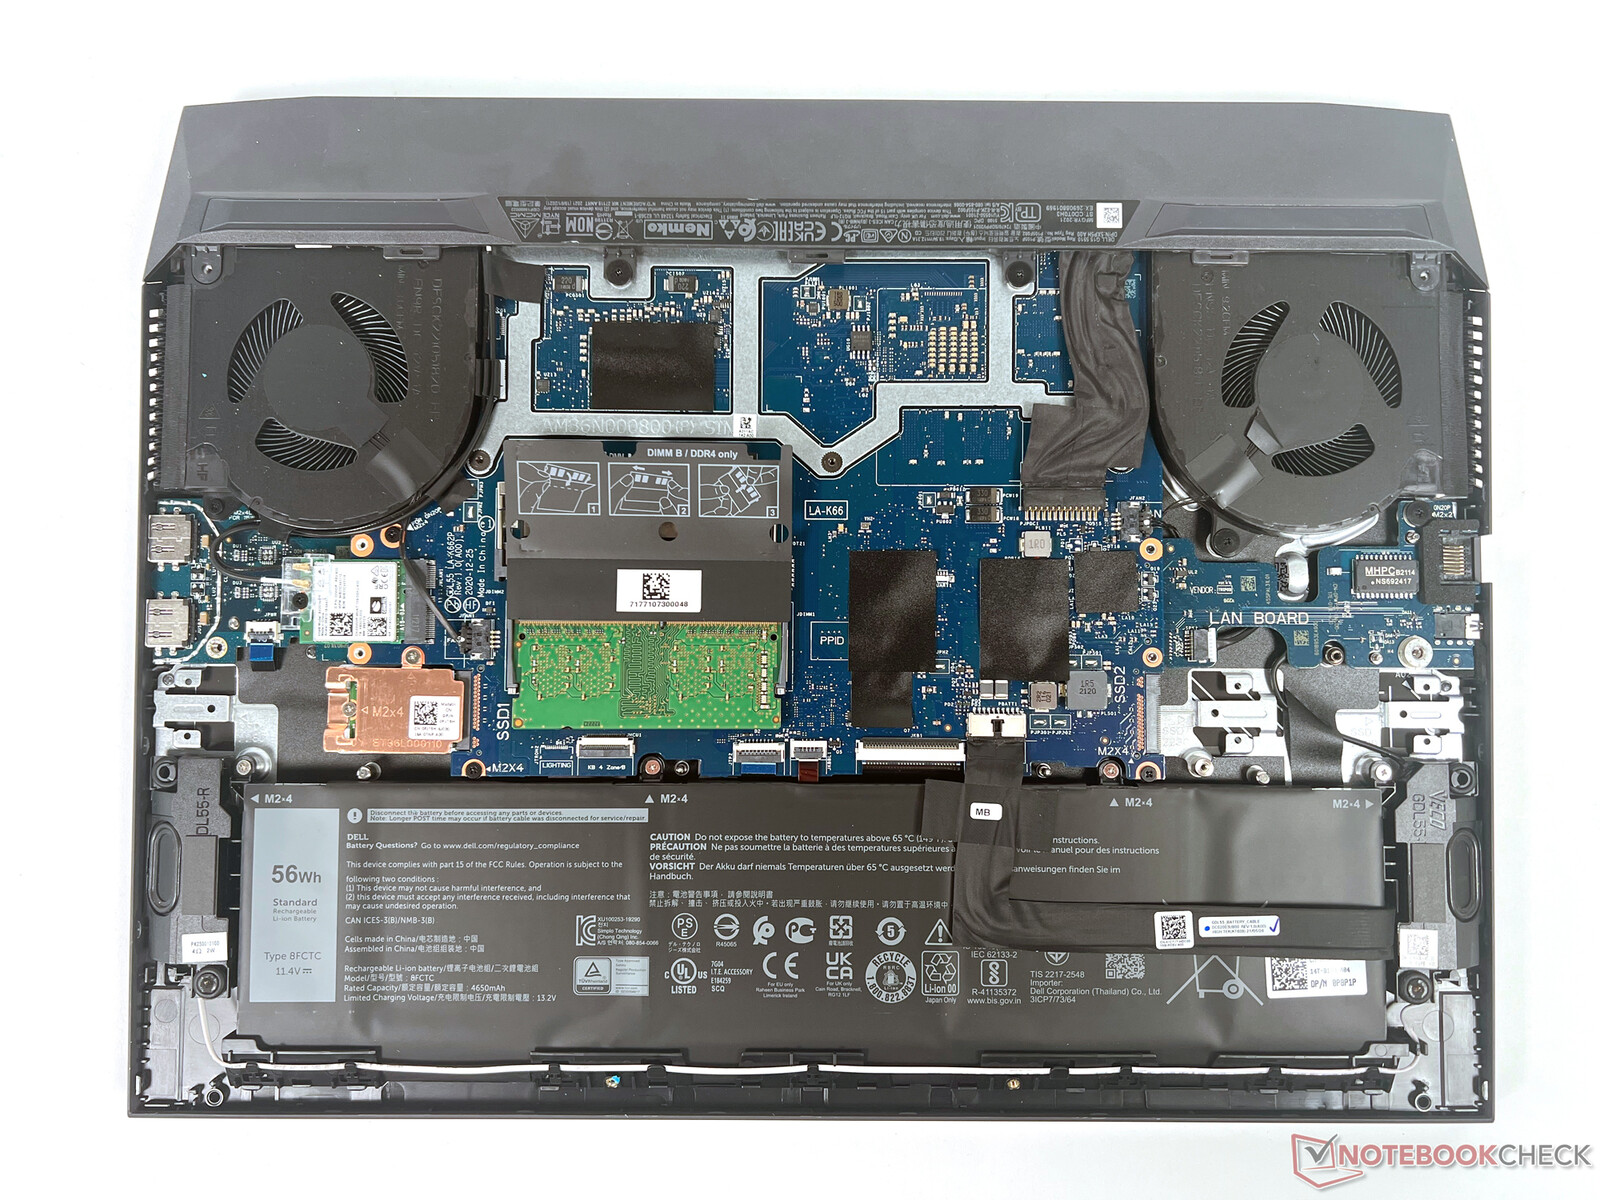
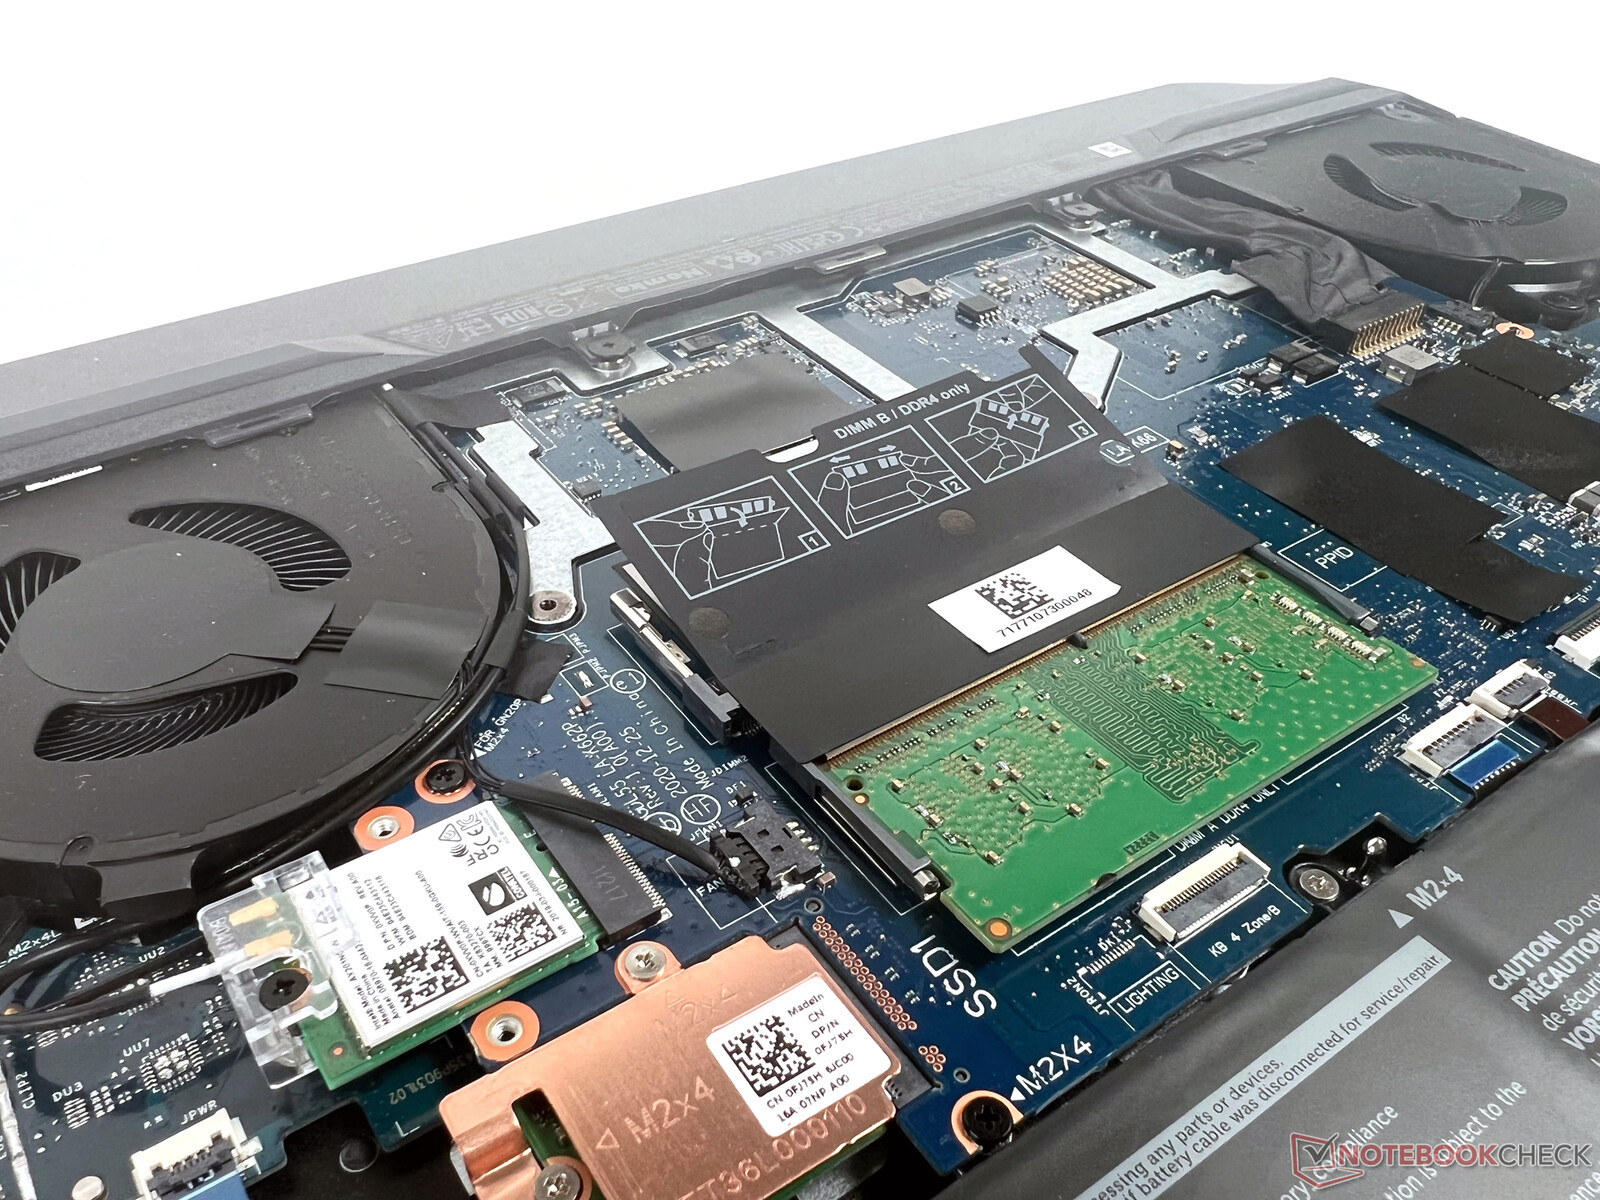
维护
里面的路被八个小十字螺丝挡住。一个内存插槽和一个SSD插槽允许升级内存和存储空间。最多可以安装32GB的内存。
担保
戴尔只提供12个月的保修。不过,可以额外收费购买升级产品。
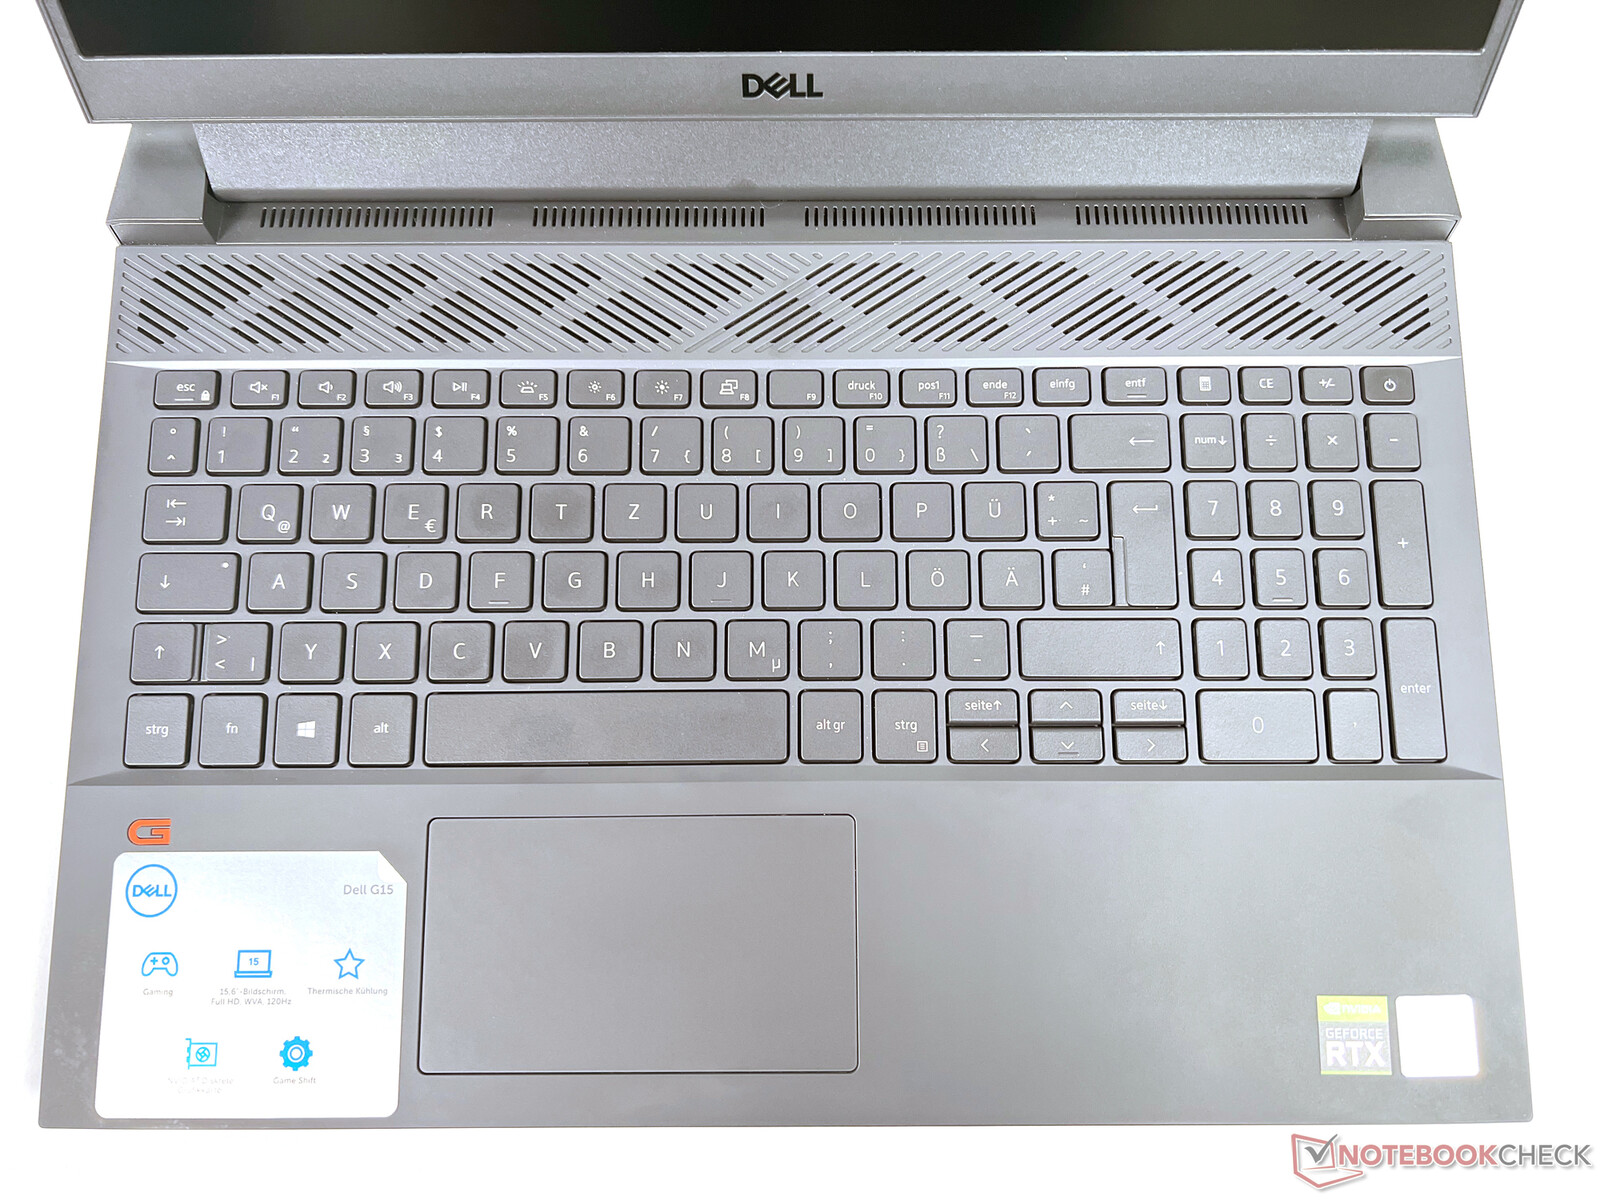
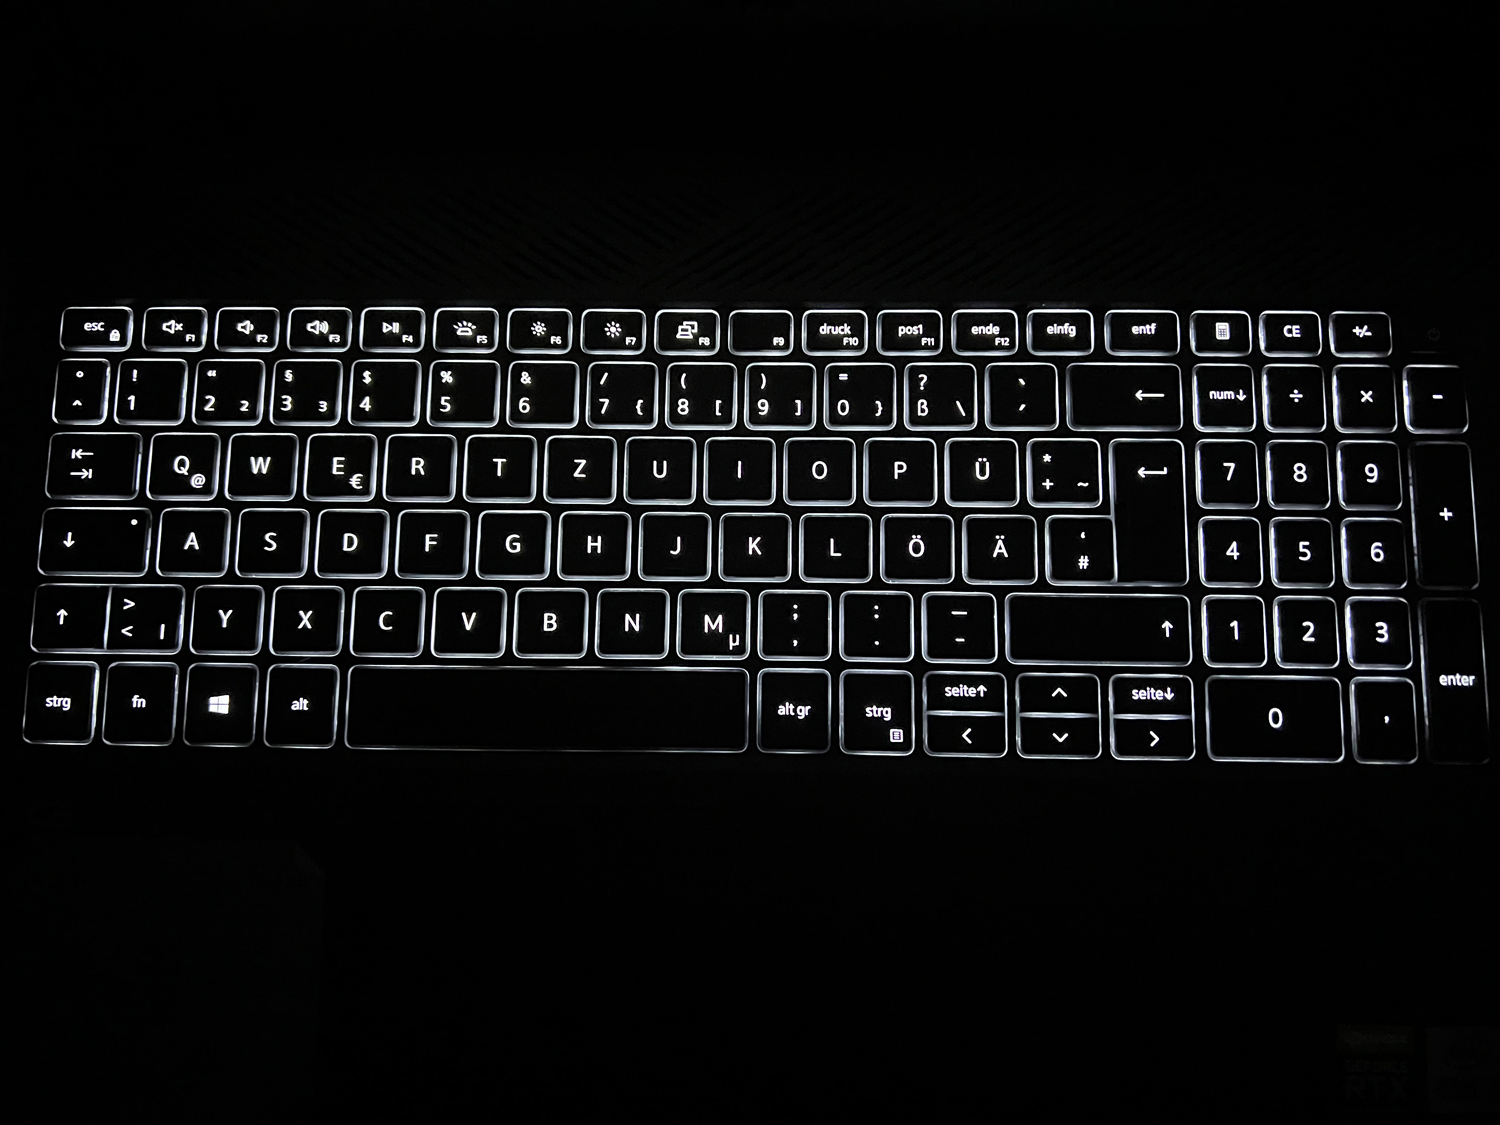
输入设备。键盘和触摸板没有问题
带有数字键盘的背光小册子键盘与Ryzen版相同,这就是为什么我们要参考 后者的评论在这一点上。你可以在那里找到更多关于质量和打字体验以及10.5 x 6厘米触摸板的信息。

显示屏。戴尔游戏笔记本的快速120赫兹显示屏,对比度低


相对于AMD机型的BOE面板,戴尔在这款5510中使用了自己的IPS显示屏。基本规格是相同的:15.6英寸对角线,1,920x1,080像素(全高清),以及120赫兹刷新率。
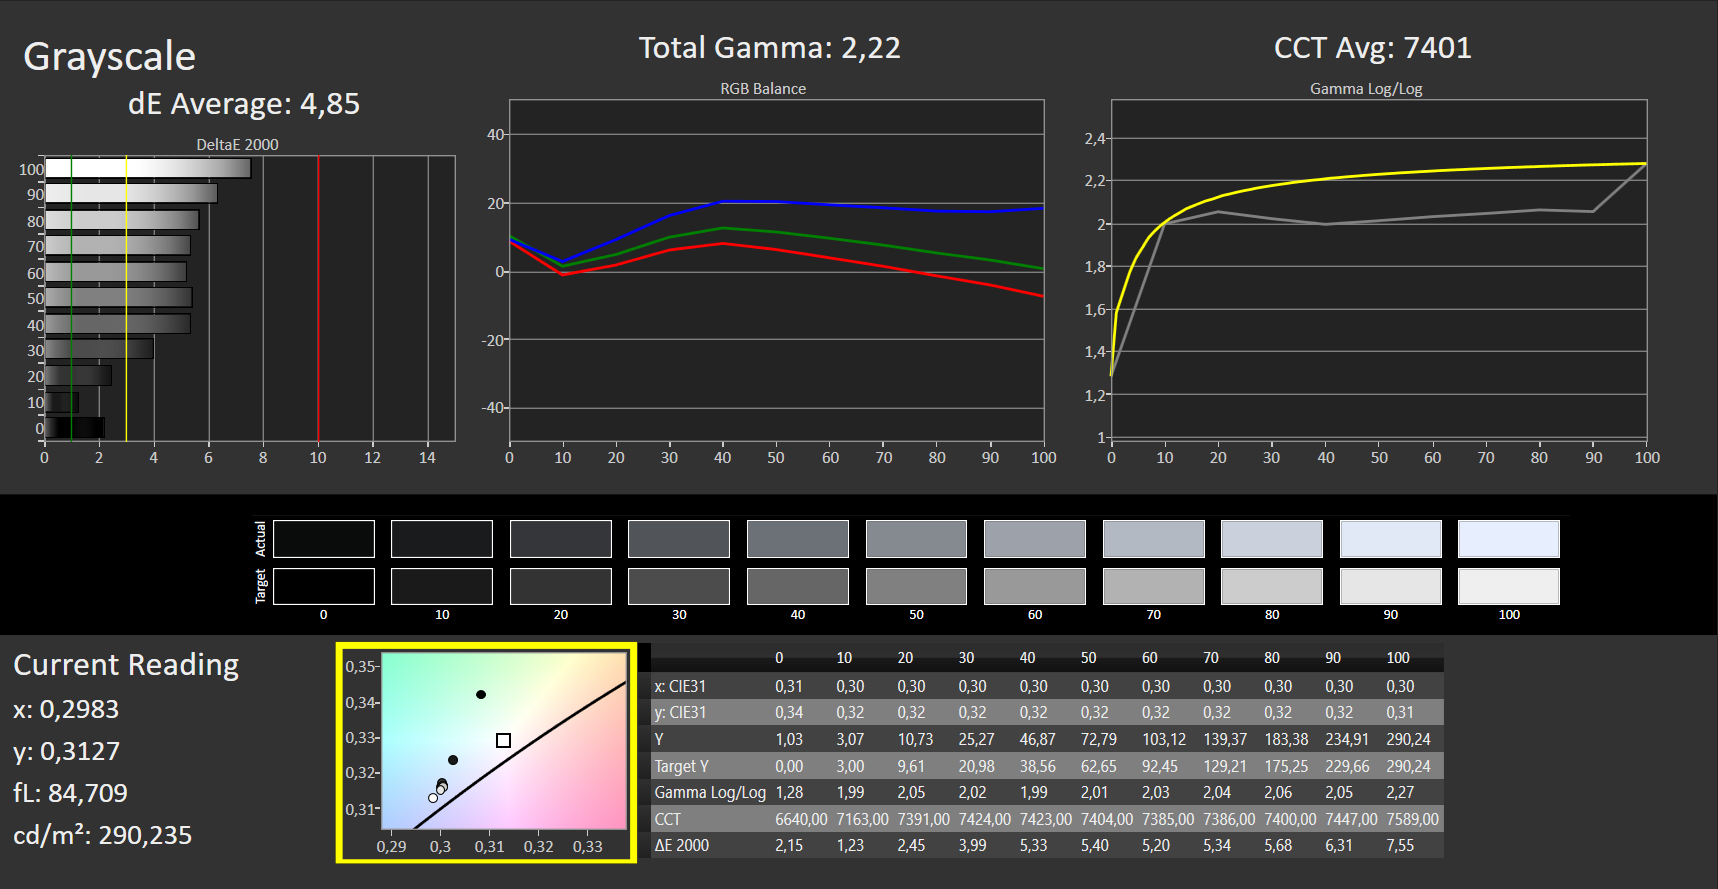
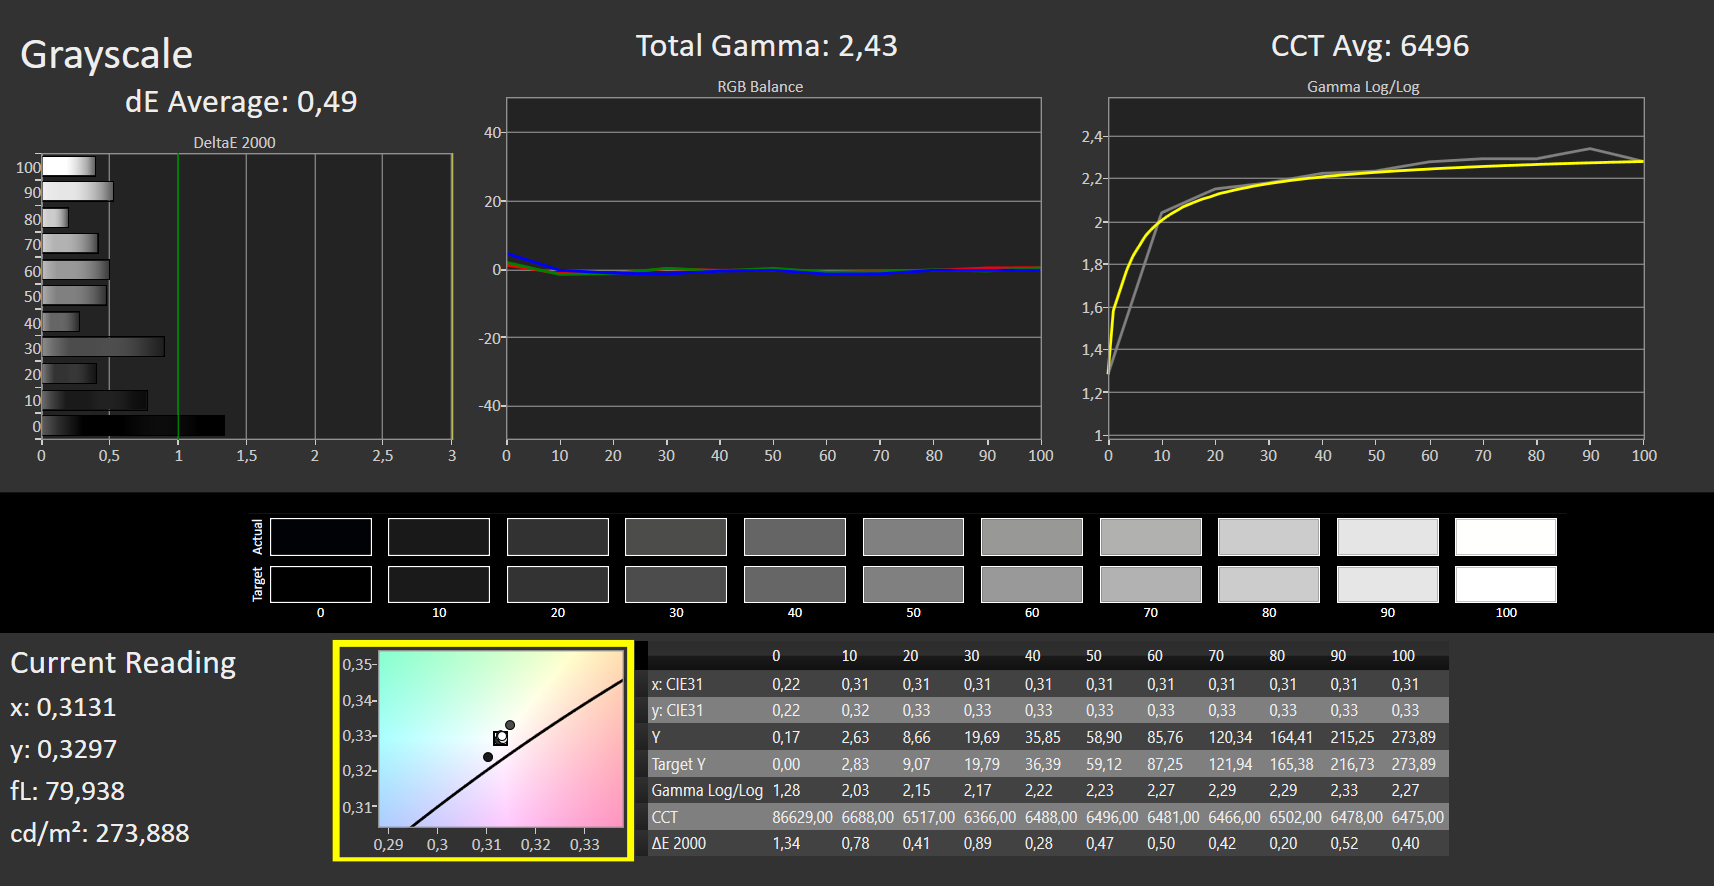
在传统的测量方面,这里安装的面板基本上是一致的。虽然同样的哑光显示屏的亮度值略高,但其他测量结果,如极低的对比度,得分更低。
引人注目的是,戴尔面板的响应时间明显比AMD的变体慢。分别为27毫秒(黑到白)和35毫秒(50%灰到80%灰),它们平均高出10毫秒左右,这对游戏笔记本来说并不理想。这意味着速率总体上低于平均水平,这稍微削弱了120赫兹面板的优势。
| |||||||||||||||||||||||||
Brightness Distribution: 87 %
Center on Battery: 289 cd/m²
Contrast: 267:1 (Black: 1.085 cd/m²)
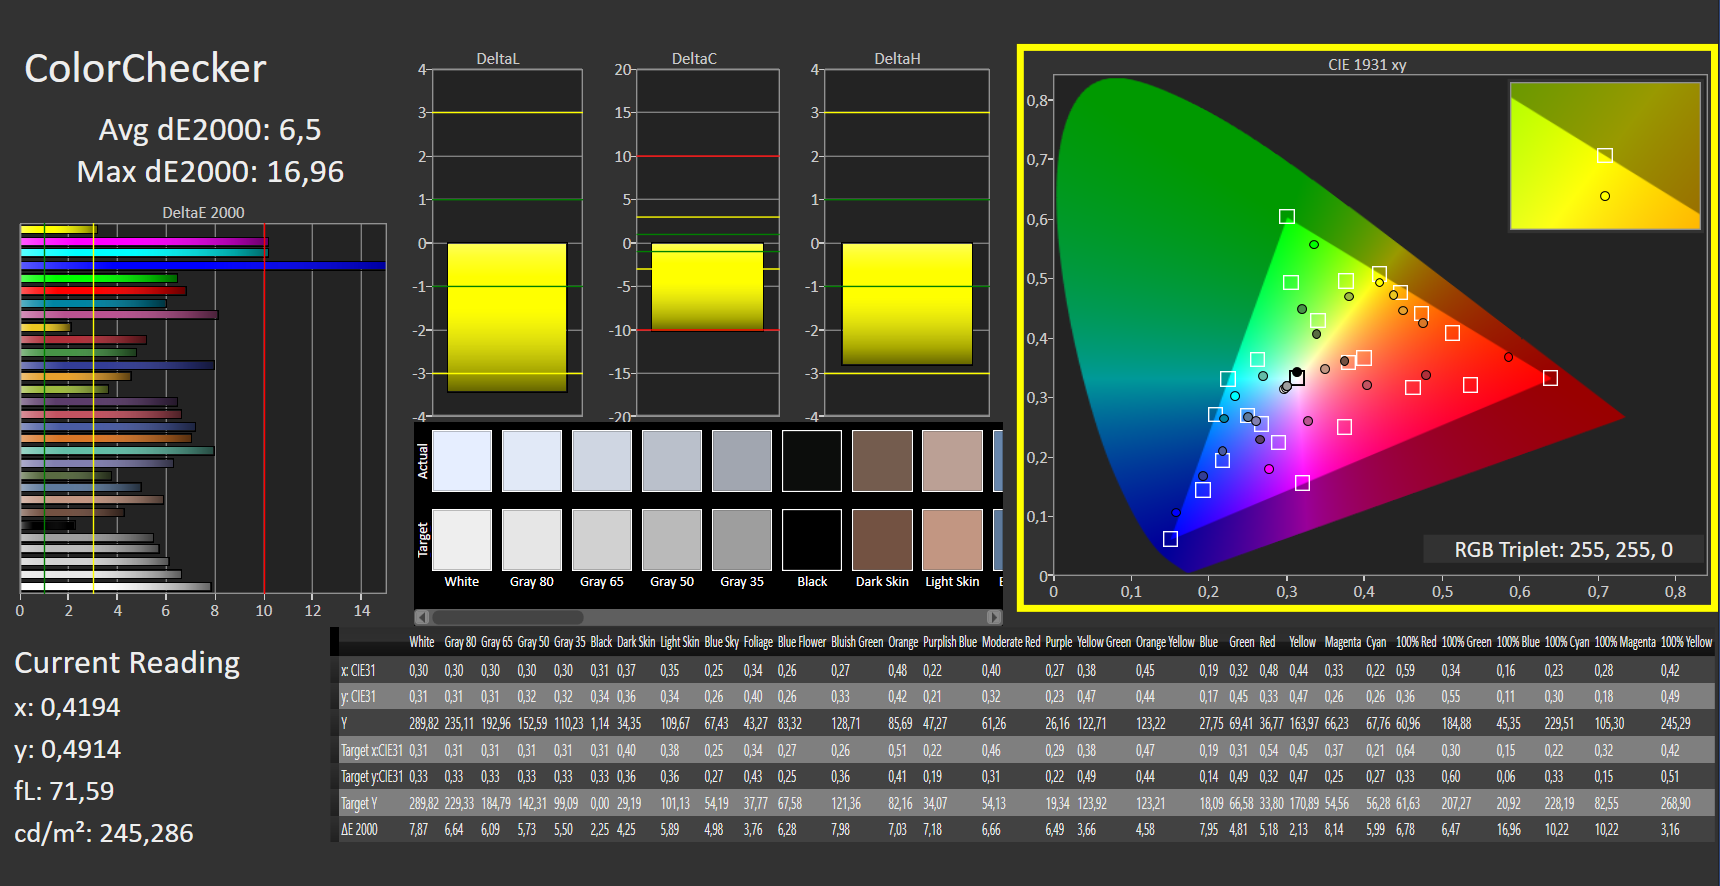
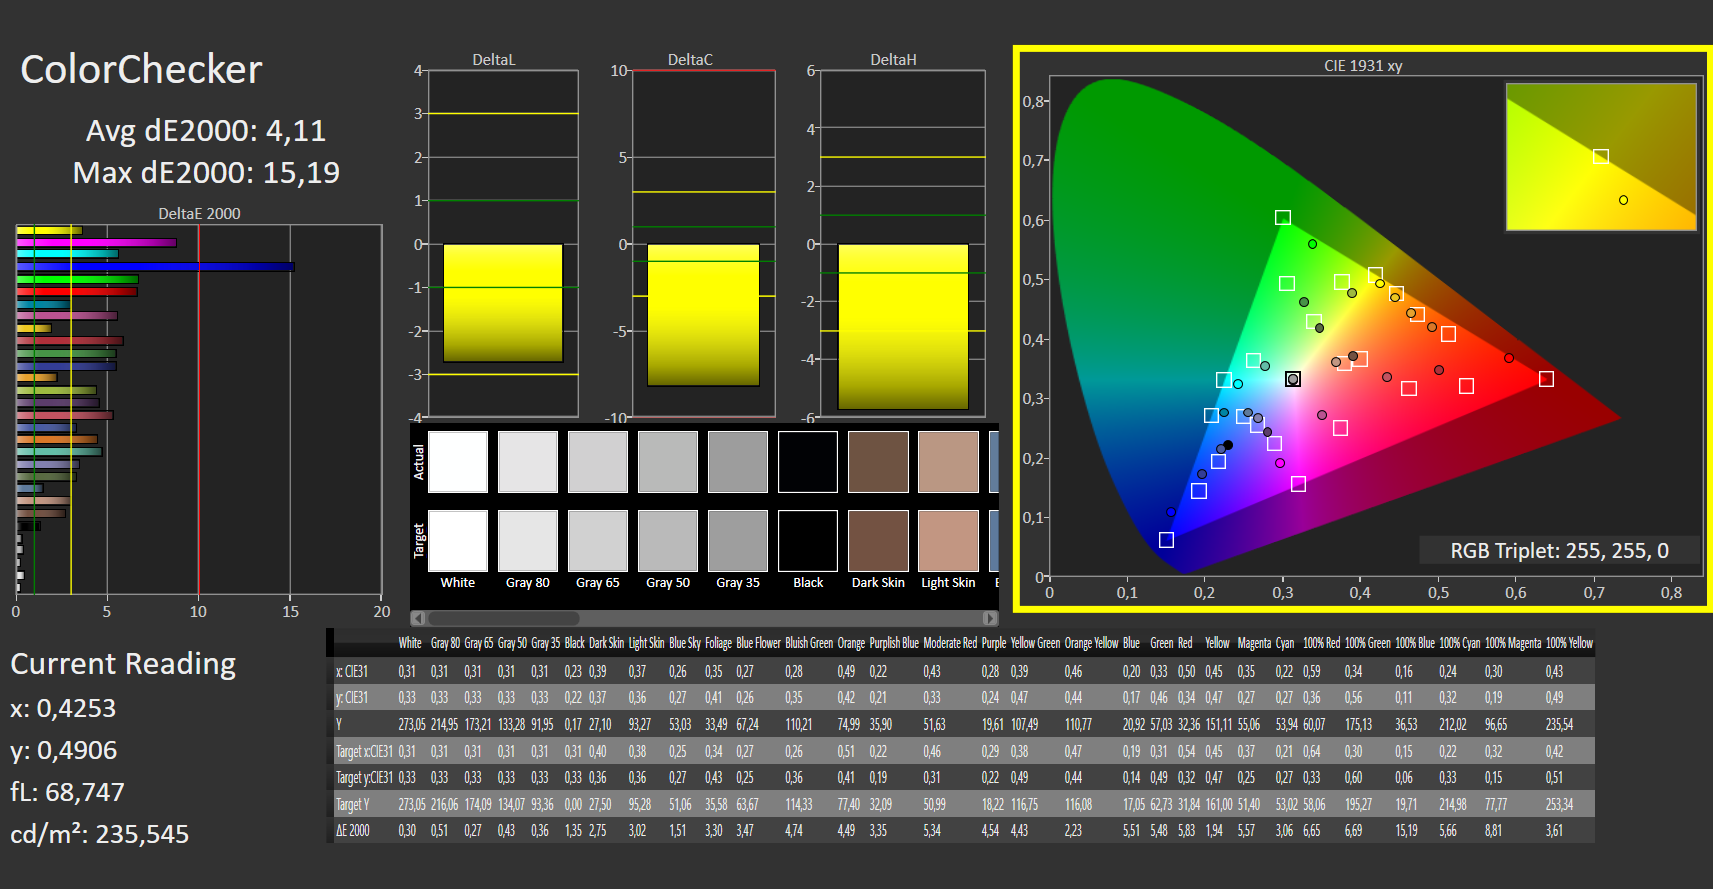
ΔE ColorChecker Calman: 6.5 | ∀{0.5-29.43 Ø4.73}
calibrated: 4.11
ΔE Greyscale Calman: 4.85 | ∀{0.09-98 Ø4.97}
42.2% AdobeRGB 1998 (Argyll 3D)
61.4% sRGB (Argyll 3D)
40.8% Display P3 (Argyll 3D)
Gamma: 2.22
CCT: 7401 K
| Dell G15 5510-43NHT Dell 156GL05, IPS, 1920x1080, 15.6" | Lenovo Ideapad Gaming 3 15IHU-82K1002RGE LEN156FHD, IPS, 1920x1080, 15.6" | Dell G15 5515 BOE092A, IPS, 1920x1080, 15.6" | Acer Aspire Nitro 5 AN515-55-57GF Chi Mei CMN N156HRA-EA1, IPS, 1920x1080, 15.6" | Gigabyte G5 GD Chi Mei N156HRA-EA1, IPS, 1920x1080, 15.6" | |
|---|---|---|---|---|---|
| Display | -3% | -5% | 4% | 2% | |
| Display P3 Coverage (%) | 40.8 | 39.7 -3% | 39.1 -4% | 42.54 4% | 41.8 2% |
| sRGB Coverage (%) | 61.4 | 59.6 -3% | 56.9 -7% | 63.5 3% | 62.3 1% |
| AdobeRGB 1998 Coverage (%) | 42.2 | 41.1 -3% | 40.4 -4% | 44.02 4% | 43.2 2% |
| Response Times | -32% | 33% | 9% | 8% | |
| Response Time Grey 50% / Grey 80% * (ms) | 35 ? | 46.4 ? -33% | 25.2 ? 28% | 33.8 ? 3% | 34.4 ? 2% |
| Response Time Black / White * (ms) | 27 ? | 35.2 ? -30% | 16.8 ? 38% | 23.2 ? 14% | 23.2 ? 14% |
| PWM Frequency (Hz) | 200 ? | ||||
| Screen | 57% | 29% | 67% | 63% | |
| Brightness middle (cd/m²) | 290 | 307 6% | 278 -4% | 288 -1% | 261 -10% |
| Brightness (cd/m²) | 267 | 292 9% | 262 -2% | 262 -2% | 246 -8% |
| Brightness Distribution (%) | 87 | 88 1% | 83 -5% | 88 1% | 87 0% |
| Black Level * (cd/m²) | 1.085 | 0.21 81% | 0.36 67% | 0.21 81% | 0.19 82% |
| Contrast (:1) | 267 | 1462 448% | 772 189% | 1371 413% | 1374 415% |
| Colorchecker dE 2000 * | 6.5 | 5.9 9% | 5.74 12% | 3.61 44% | 3.9 40% |
| Colorchecker dE 2000 max. * | 16.96 | 21.6 -27% | 19.63 -16% | 18.07 -7% | 19.26 -14% |
| Colorchecker dE 2000 calibrated * | 4.11 | 4.8 -17% | 4.7 -14% | 3.12 24% | 3.24 21% |
| Greyscale dE 2000 * | 4.85 | 4.9 -1% | 3.1 36% | 2.4 51% | 2.7 44% |
| Gamma | 2.22 99% | 2.26 97% | 2.011 109% | 2.216 99% | 2.248 98% |
| CCT | 7401 88% | 6504 100% | 6207 105% | 6675 97% | 6828 95% |
| Color Space (Percent of AdobeRGB 1998) (%) | 44 | ||||
| Color Space (Percent of sRGB) (%) | 62 | ||||
| Total Average (Program / Settings) | 7% /
31% | 19% /
22% | 27% /
45% | 24% /
42% |
* ... smaller is better
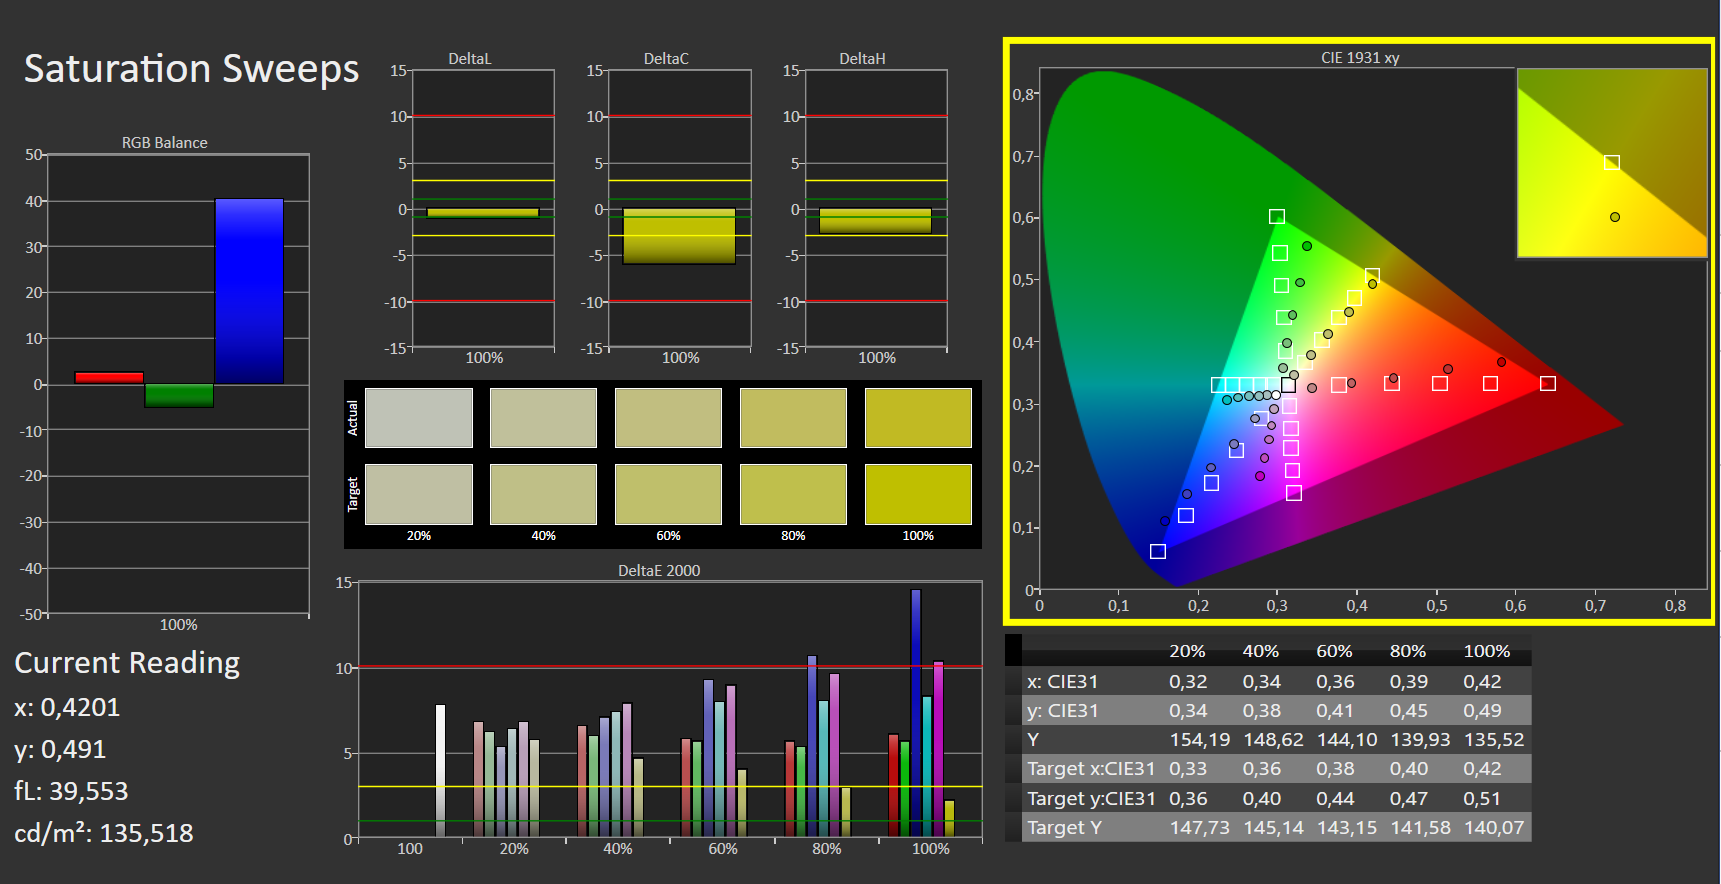
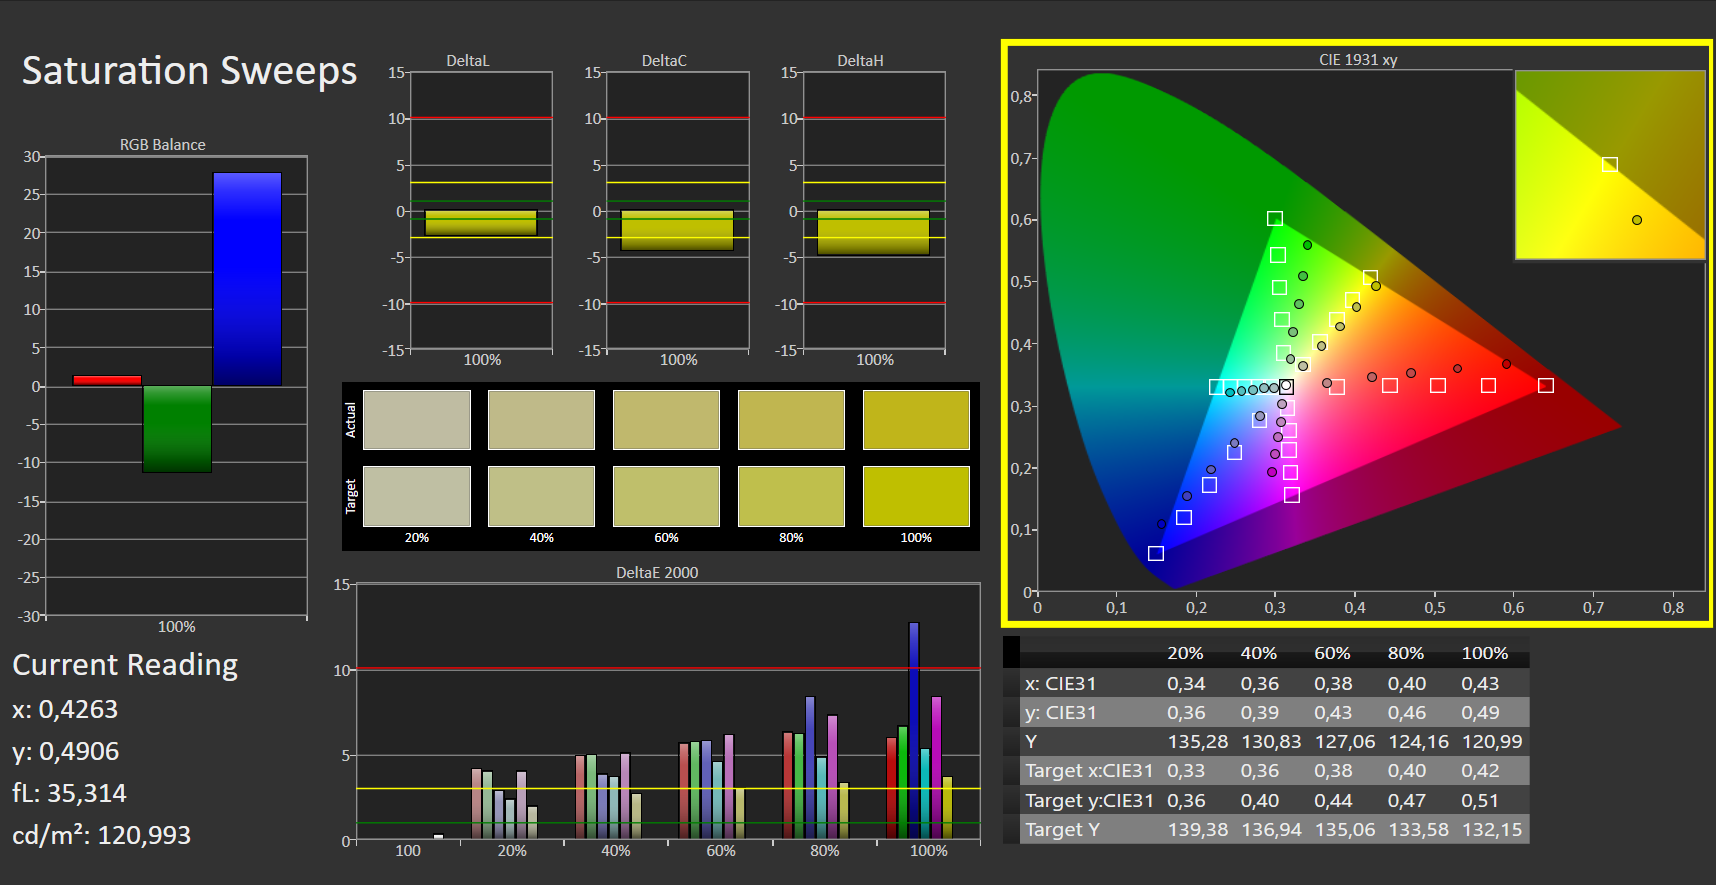
戴尔面板覆盖了AdobeRGB(41%)、sRGB(61%)和DCI-P3(42%)色彩空间,比我们评测单元中的AMD替代品更好。开箱后,色彩还原度低于平均水平,但通过校准可以略微提高。
Display Response Times
| ↔ Response Time Black to White | ||
|---|---|---|
| 27 ms ... rise ↗ and fall ↘ combined | ↗ 14 ms rise |  |
| ↘ 13 ms fall | ||
| The screen shows relatively slow response rates in our tests and may be too slow for gamers. In comparison, all tested devices range from 0.1 (minimum) to 240 (maximum) ms. » 67 % of all devices are better. This means that the measured response time is worse than the average of all tested devices (19.9 ms). | ||
| ↔ Response Time 50% Grey to 80% Grey | ||
| 35 ms ... rise ↗ and fall ↘ combined | ↗ 17 ms rise |  |
| ↘ 18 ms fall | ||
| The screen shows slow response rates in our tests and will be unsatisfactory for gamers. In comparison, all tested devices range from 0.165 (minimum) to 636 (maximum) ms. » 49 % of all devices are better. This means that the measured response time is worse than the average of all tested devices (31.1 ms). | ||
Screen Flickering / PWM (Pulse-Width Modulation)
| Screen flickering / PWM not detected |  | ||
In comparison: 52 % of all tested devices do not use PWM to dim the display. If PWM was detected, an average of 7801 (minimum: 5 - maximum: 343500) Hz was measured. | |||
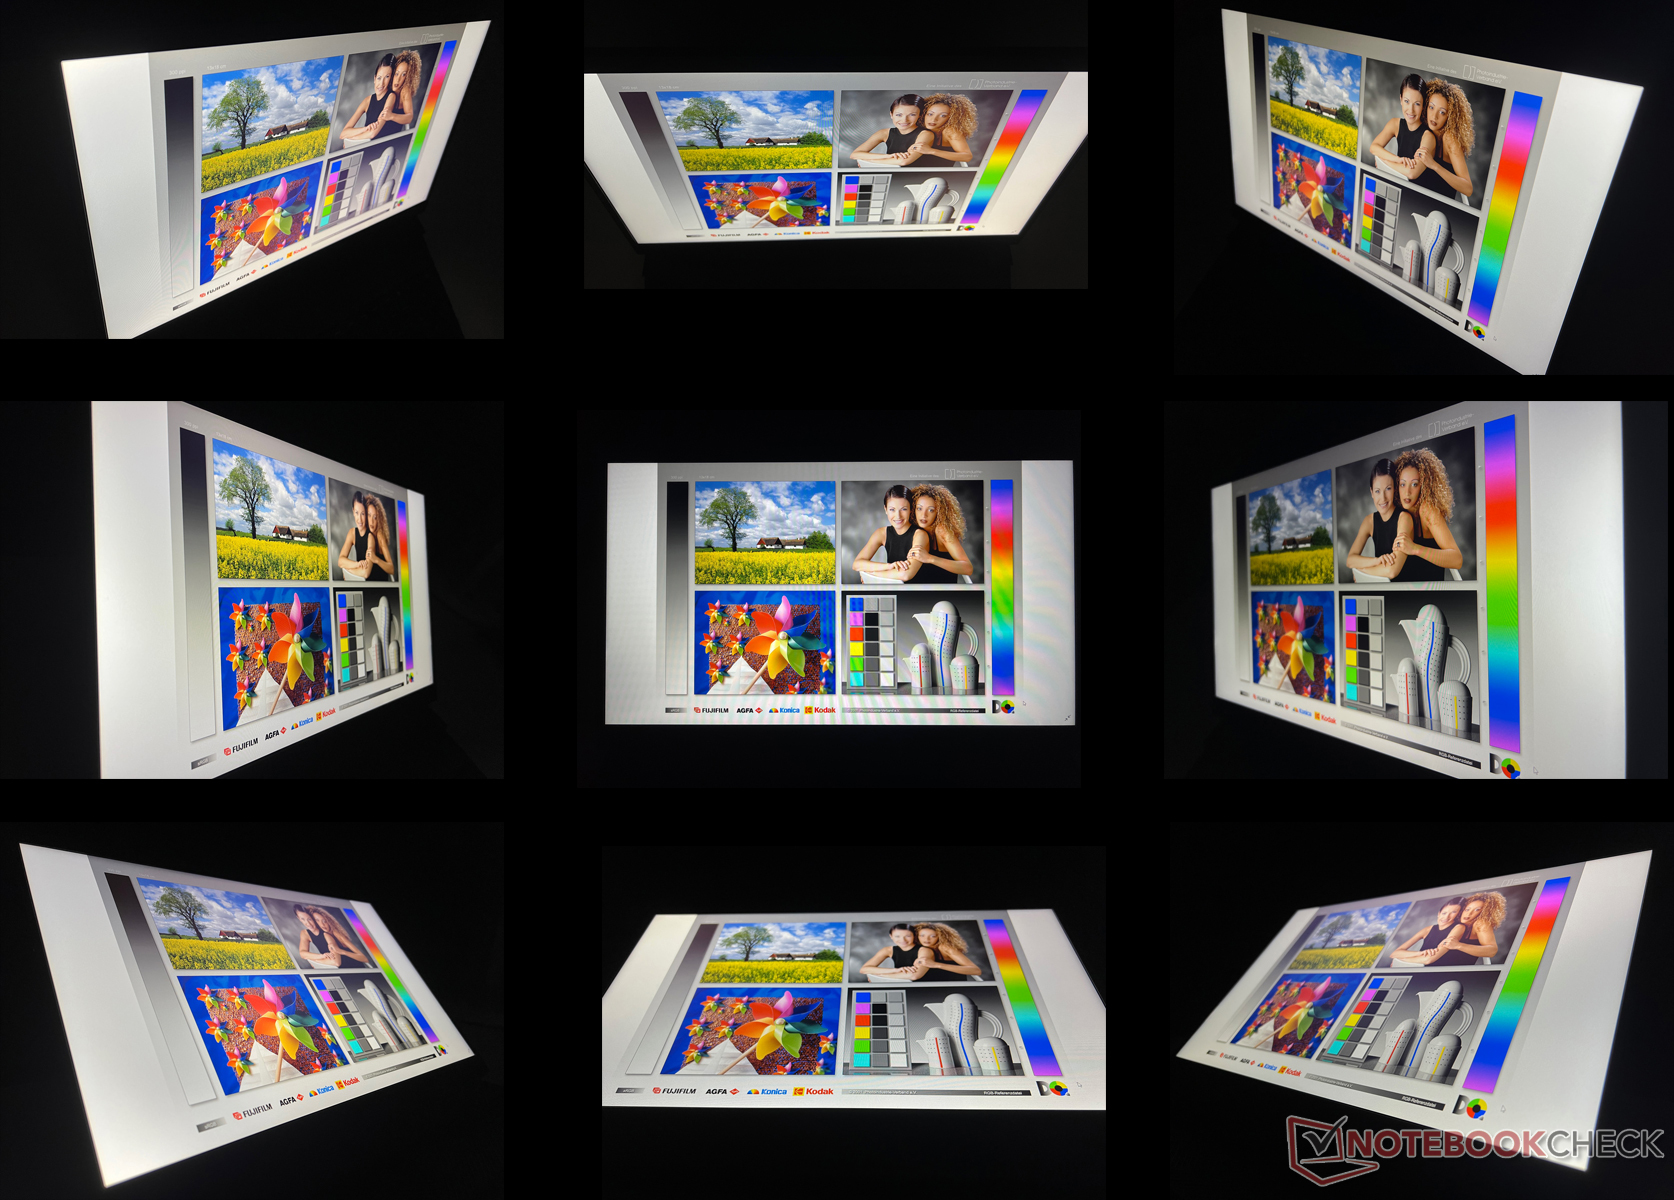
IPS面板提供了预期的高可视角度稳定性。因此,在非常倾斜的视角下,内容也是可读的。然而,显示屏的平均亮度约为270cd/m²,如果你在阴凉处,最多只适合在户外使用该设备。如果面板能更亮就更好了。

性能。正如预期的那样,英特尔的CPU没有任何机会
从根本上说,戴尔G15 5510不同于 5515Ryzen的替代品在CPU方面。从纸面上看,英特尔酷睿i5-10200H的性能大大低于 AMD Ryzen 7 5800H.除此之外,制造商还将内存的数量减少了一半,只有8GB的DDR4-3200 SO-DIMM内存。可以预见的是,在性能测试中,这不会没有后果--尽管两个版本使用相同的 NvidiaGeForce RTX 3050 Ti 笔记本电脑GPU...
另外,戴尔也出售G15 5510,配备了英特尔酷睿i5-10500H额外收取少量费用,而且它现在还提供配备更新的第12代英特尔CPU的机型。
测试条件
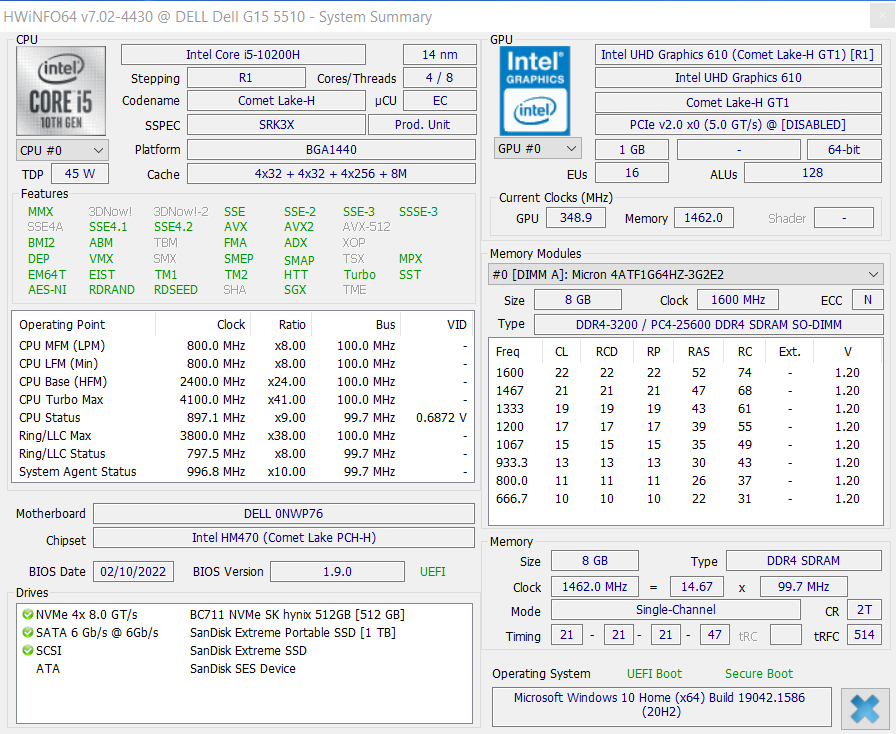
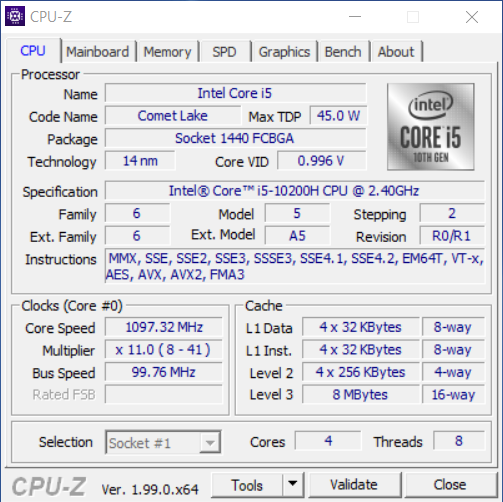
除非另有说明,我们在笔记本电脑插上电源并使用Windows性能模式 "最佳性能 "的情况下进行了基准测试。戴尔为其配置了英特尔酷睿i5-10200H的TDP为45瓦。CPU短时间内的消耗量高达135瓦(PL2),但从长远来看,它的消耗量稳定在45瓦左右(PL1)。
处理器
内置的酷睿i5-10200H是英特尔第十代处理器的一部分,它基于Comet Lake架构(第四代Skylake架构),这意味着它不再是全新的了。它由四个核心(四核CPU)组成,基本时钟速度为2.4GHz,最高速度为4.1GHz。戴尔为它搭配了8GB的DDR4-3200内存。
与之相比AMD Ryzen 7 5800H(Cezanne)相比,在 戴尔G15 5515中发现的AMD Ryzen 7 5800H(Cezanne),其运行速度高达4.3 GHz,由八个核心组成,这里使用的处理器完全不如预期,但它也是老了一代。在Cinebench R15多重耐力测试中,AMD型号取得的分数是其两倍以上。这款CPU至少能够保持其性能不变,几乎可以跟上稍快的英特尔酷睿i5-10300H中发现的 Acer Aspire Nitro 5.它也仅次于 联想IdeaPad Gaming 3,它有一个英特尔酷睿i5-11300H这是新的一代。
其余的CPU基准测试也描述了同样的情况。正如预期的那样,G15 5510由于拥有最弱的CPU,通常在比较模型中占据较低的位置。它没有机会与它的兄弟姐妹模型中的AMD力量抗衡,特别是在多核应用中。英特尔CPU的单核分数平均比AMD的竞争对手低30%左右。在电池供电的情况下,CPU的性能在各种基准测试中下降了10%至50%。
Cinebench R15 Multi endurance test
Cinebench R23: Multi Core | Single Core
Cinebench R20: CPU (Multi Core) | CPU (Single Core)
Cinebench R15: CPU Multi 64Bit | CPU Single 64Bit
Blender: v2.79 BMW27 CPU
7-Zip 18.03: 7z b 4 | 7z b 4 -mmt1
Geekbench 5.5: Multi-Core | Single-Core
HWBOT x265 Benchmark v2.2: 4k Preset
LibreOffice : 20 Documents To PDF
R Benchmark 2.5: Overall mean
| CPU Performance rating | |
| Average of class Gaming | |
| Dell G15 5515 | |
| Gigabyte G5 GD | |
| Lenovo Ideapad Gaming 3 15IHU-82K1002RGE | |
| Acer Aspire Nitro 5 AN515-55-57GF | |
| Average Intel Core i5-10200H | |
| Dell G15 5510-43NHT | |
| Cinebench R23 / Multi Core | |
| Average of class Gaming (10488 - 40970, n=113, last 2 years) | |
| Dell G15 5515 | |
| Gigabyte G5 GD | |
| Lenovo Ideapad Gaming 3 15IHU-82K1002RGE | |
| Dell G15 5510-43NHT | |
| Average Intel Core i5-10200H (n=1) | |
| Acer Aspire Nitro 5 AN515-55-57GF | |
| Cinebench R23 / Single Core | |
| Average of class Gaming (1166 - 2356, n=113, last 2 years) | |
| Gigabyte G5 GD | |
| Dell G15 5515 | |
| Lenovo Ideapad Gaming 3 15IHU-82K1002RGE | |
| Acer Aspire Nitro 5 AN515-55-57GF | |
| Dell G15 5510-43NHT | |
| Average Intel Core i5-10200H (n=1) | |
| Cinebench R20 / CPU (Multi Core) | |
| Average of class Gaming (4029 - 16108, n=112, last 2 years) | |
| Dell G15 5515 | |
| Gigabyte G5 GD | |
| Lenovo Ideapad Gaming 3 15IHU-82K1002RGE | |
| Dell G15 5510-43NHT | |
| Average Intel Core i5-10200H (n=1) | |
| Acer Aspire Nitro 5 AN515-55-57GF | |
| Cinebench R20 / CPU (Single Core) | |
| Average of class Gaming (442 - 895, n=112, last 2 years) | |
| Gigabyte G5 GD | |
| Dell G15 5515 | |
| Lenovo Ideapad Gaming 3 15IHU-82K1002RGE | |
| Acer Aspire Nitro 5 AN515-55-57GF | |
| Dell G15 5510-43NHT | |
| Average Intel Core i5-10200H (n=1) | |
| Cinebench R15 / CPU Multi 64Bit | |
| Average of class Gaming (1578 - 6271, n=113, last 2 years) | |
| Dell G15 5515 | |
| Gigabyte G5 GD | |
| Lenovo Ideapad Gaming 3 15IHU-82K1002RGE | |
| Acer Aspire Nitro 5 AN515-55-57GF | |
| Dell G15 5510-43NHT | |
| Average Intel Core i5-10200H (n=1) | |
| Cinebench R15 / CPU Single 64Bit | |
| Average of class Gaming (188.8 - 343, n=112, last 2 years) | |
| Dell G15 5515 | |
| Gigabyte G5 GD | |
| Lenovo Ideapad Gaming 3 15IHU-82K1002RGE | |
| Acer Aspire Nitro 5 AN515-55-57GF | |
| Dell G15 5510-43NHT | |
| Average Intel Core i5-10200H (n=1) | |
| Blender / v2.79 BMW27 CPU | |
| Acer Aspire Nitro 5 AN515-55-57GF | |
| Dell G15 5510-43NHT | |
| Average Intel Core i5-10200H (n=1) | |
| Lenovo Ideapad Gaming 3 15IHU-82K1002RGE | |
| Gigabyte G5 GD | |
| Dell G15 5515 | |
| Average of class Gaming (80 - 330, n=110, last 2 years) | |
| 7-Zip 18.03 / 7z b 4 | |
| Average of class Gaming (33491 - 148086, n=111, last 2 years) | |
| Dell G15 5515 | |
| Gigabyte G5 GD | |
| Acer Aspire Nitro 5 AN515-55-57GF | |
| Lenovo Ideapad Gaming 3 15IHU-82K1002RGE | |
| Dell G15 5510-43NHT | |
| Average Intel Core i5-10200H (n=1) | |
| 7-Zip 18.03 / 7z b 4 -mmt1 | |
| Average of class Gaming (4199 - 7436, n=111, last 2 years) | |
| Dell G15 5515 | |
| Gigabyte G5 GD | |
| Acer Aspire Nitro 5 AN515-55-57GF | |
| Lenovo Ideapad Gaming 3 15IHU-82K1002RGE | |
| Dell G15 5510-43NHT | |
| Average Intel Core i5-10200H (n=1) | |
| Geekbench 5.5 / Multi-Core | |
| Average of class Gaming (6460 - 27010, n=111, last 2 years) | |
| Dell G15 5515 | |
| Gigabyte G5 GD | |
| Acer Aspire Nitro 5 AN515-55-57GF | |
| Lenovo Ideapad Gaming 3 15IHU-82K1002RGE | |
| Average Intel Core i5-10200H (3564 - 4126, n=2) | |
| Dell G15 5510-43NHT | |
| Geekbench 5.5 / Single-Core | |
| Average of class Gaming (986 - 2474, n=111, last 2 years) | |
| Gigabyte G5 GD | |
| Dell G15 5515 | |
| Lenovo Ideapad Gaming 3 15IHU-82K1002RGE | |
| Acer Aspire Nitro 5 AN515-55-57GF | |
| Dell G15 5510-43NHT | |
| Average Intel Core i5-10200H (1093 - 1095, n=2) | |
| HWBOT x265 Benchmark v2.2 / 4k Preset | |
| Average of class Gaming (11.5 - 44.3, n=111, last 2 years) | |
| Dell G15 5515 | |
| Gigabyte G5 GD | |
| Lenovo Ideapad Gaming 3 15IHU-82K1002RGE | |
| Acer Aspire Nitro 5 AN515-55-57GF | |
| Dell G15 5510-43NHT | |
| Average Intel Core i5-10200H (n=1) | |
| LibreOffice / 20 Documents To PDF | |
| Dell G15 5515 | |
| Dell G15 5510-43NHT | |
| Average Intel Core i5-10200H (n=1) | |
| Acer Aspire Nitro 5 AN515-55-57GF | |
| Lenovo Ideapad Gaming 3 15IHU-82K1002RGE | |
| Average of class Gaming (19 - 88.8, n=111, last 2 years) | |
| Gigabyte G5 GD | |
| R Benchmark 2.5 / Overall mean | |
| Dell G15 5510-43NHT | |
| Average Intel Core i5-10200H (n=1) | |
| Acer Aspire Nitro 5 AN515-55-57GF | |
| Lenovo Ideapad Gaming 3 15IHU-82K1002RGE | |
| Gigabyte G5 GD | |
| Dell G15 5515 | |
| Average of class Gaming (0.3439 - 0.759, n=112, last 2 years) | |
* ... smaller is better
AIDA64: FP32 Ray-Trace | FPU Julia | CPU SHA3 | CPU Queen | FPU SinJulia | FPU Mandel | CPU AES | CPU ZLib | FP64 Ray-Trace | CPU PhotoWorxx
| Performance rating | |
| Average of class Gaming | |
| Dell G15 5515 | |
| Gigabyte G5 GD | |
| Lenovo Ideapad Gaming 3 15IHU-82K1002RGE | |
| Acer Aspire Nitro 5 AN515-55-57GF | |
| Dell G15 5510-43NHT | |
| Average Intel Core i5-10200H | |
| AIDA64 / FP32 Ray-Trace | |
| Average of class Gaming (10227 - 85542, n=110, last 2 years) | |
| Dell G15 5515 | |
| Gigabyte G5 GD | |
| Lenovo Ideapad Gaming 3 15IHU-82K1002RGE | |
| Acer Aspire Nitro 5 AN515-55-57GF | |
| Dell G15 5510-43NHT | |
| Average Intel Core i5-10200H (n=1) | |
| AIDA64 / FPU Julia | |
| Average of class Gaming (51376 - 238426, n=110, last 2 years) | |
| Dell G15 5515 | |
| Gigabyte G5 GD | |
| Acer Aspire Nitro 5 AN515-55-57GF | |
| Lenovo Ideapad Gaming 3 15IHU-82K1002RGE | |
| Dell G15 5510-43NHT | |
| Average Intel Core i5-10200H (n=1) | |
| AIDA64 / CPU SHA3 | |
| Average of class Gaming (2180 - 9817, n=110, last 2 years) | |
| Dell G15 5515 | |
| Gigabyte G5 GD | |
| Lenovo Ideapad Gaming 3 15IHU-82K1002RGE | |
| Acer Aspire Nitro 5 AN515-55-57GF | |
| Dell G15 5510-43NHT | |
| Average Intel Core i5-10200H (n=1) | |
| AIDA64 / CPU Queen | |
| Average of class Gaming (49785 - 173351, n=101, last 2 years) | |
| Dell G15 5515 | |
| Gigabyte G5 GD | |
| Acer Aspire Nitro 5 AN515-55-57GF | |
| Lenovo Ideapad Gaming 3 15IHU-82K1002RGE | |
| Dell G15 5510-43NHT | |
| Average Intel Core i5-10200H (n=1) | |
| AIDA64 / FPU SinJulia | |
| Average of class Gaming (4424 - 33636, n=110, last 2 years) | |
| Dell G15 5515 | |
| Gigabyte G5 GD | |
| Acer Aspire Nitro 5 AN515-55-57GF | |
| Dell G15 5510-43NHT | |
| Average Intel Core i5-10200H (n=1) | |
| Lenovo Ideapad Gaming 3 15IHU-82K1002RGE | |
| AIDA64 / FPU Mandel | |
| Average of class Gaming (25115 - 128721, n=110, last 2 years) | |
| Dell G15 5515 | |
| Gigabyte G5 GD | |
| Lenovo Ideapad Gaming 3 15IHU-82K1002RGE | |
| Acer Aspire Nitro 5 AN515-55-57GF | |
| Dell G15 5510-43NHT | |
| Average Intel Core i5-10200H (n=1) | |
| AIDA64 / CPU AES | |
| Dell G15 5515 | |
| Average of class Gaming (39258 - 247074, n=110, last 2 years) | |
| Gigabyte G5 GD | |
| Lenovo Ideapad Gaming 3 15IHU-82K1002RGE | |
| Acer Aspire Nitro 5 AN515-55-57GF | |
| Dell G15 5510-43NHT | |
| Average Intel Core i5-10200H (n=1) | |
| AIDA64 / CPU ZLib | |
| Average of class Gaming (574 - 2531, n=110, last 2 years) | |
| Dell G15 5515 | |
| Gigabyte G5 GD | |
| Lenovo Ideapad Gaming 3 15IHU-82K1002RGE | |
| Acer Aspire Nitro 5 AN515-55-57GF | |
| Dell G15 5510-43NHT | |
| Average Intel Core i5-10200H (n=1) | |
| AIDA64 / FP64 Ray-Trace | |
| Average of class Gaming (5509 - 45446, n=110, last 2 years) | |
| Dell G15 5515 | |
| Gigabyte G5 GD | |
| Lenovo Ideapad Gaming 3 15IHU-82K1002RGE | |
| Acer Aspire Nitro 5 AN515-55-57GF | |
| Dell G15 5510-43NHT | |
| Average Intel Core i5-10200H (n=1) | |
| AIDA64 / CPU PhotoWorxx | |
| Average of class Gaming (12271 - 89891, n=110, last 2 years) | |
| Gigabyte G5 GD | |
| Acer Aspire Nitro 5 AN515-55-57GF | |
| Dell G15 5515 | |
| Lenovo Ideapad Gaming 3 15IHU-82K1002RGE | |
| Dell G15 5510-43NHT | |
| Average Intel Core i5-10200H (n=1) | |
系统性能
由于CPU速度较慢,内存较少--不能说几乎太少--我们显然期望系统性能明显变差,这在测试结果中也被证明是真的。戴尔G15 5510在所有PCMark 10测试中的得分都比竞争对手差,而且它多次在该领域中排名垫底。
在普通的应用程序中,你不会注意到太多的问题。但是,如果该设备加载了几个或更复杂的程序,其性能很快就会达到极限。
CrossMark: Overall | Productivity | Creativity | Responsiveness
| PCMark 10 / Score | |
| Average of class Gaming (5828 - 11574, n=96, last 2 years) | |
| Dell G15 5515 | |
| Gigabyte G5 GD | |
| Lenovo Ideapad Gaming 3 15IHU-82K1002RGE | |
| Acer Aspire Nitro 5 AN515-55-57GF | |
| Dell G15 5510-43NHT | |
| Average Intel Core i5-10200H, NVIDIA GeForce RTX 3050 Ti Laptop GPU (n=1) | |
| PCMark 10 / Essentials | |
| Average of class Gaming (8810 - 12600, n=100, last 2 years) | |
| Dell G15 5515 | |
| Gigabyte G5 GD | |
| Acer Aspire Nitro 5 AN515-55-57GF | |
| Lenovo Ideapad Gaming 3 15IHU-82K1002RGE | |
| Dell G15 5510-43NHT | |
| Average Intel Core i5-10200H, NVIDIA GeForce RTX 3050 Ti Laptop GPU (n=1) | |
| PCMark 10 / Productivity | |
| Average of class Gaming (6845 - 18766, n=98, last 2 years) | |
| Lenovo Ideapad Gaming 3 15IHU-82K1002RGE | |
| Dell G15 5515 | |
| Gigabyte G5 GD | |
| Acer Aspire Nitro 5 AN515-55-57GF | |
| Dell G15 5510-43NHT | |
| Average Intel Core i5-10200H, NVIDIA GeForce RTX 3050 Ti Laptop GPU (n=1) | |
| PCMark 10 / Digital Content Creation | |
| Average of class Gaming (7602 - 19657, n=98, last 2 years) | |
| Dell G15 5515 | |
| Gigabyte G5 GD | |
| Lenovo Ideapad Gaming 3 15IHU-82K1002RGE | |
| Acer Aspire Nitro 5 AN515-55-57GF | |
| Dell G15 5510-43NHT | |
| Average Intel Core i5-10200H, NVIDIA GeForce RTX 3050 Ti Laptop GPU (n=1) | |
| CrossMark / Overall | |
| Average of class Gaming (1366 - 2409, n=98, last 2 years) | |
| Lenovo Ideapad Gaming 3 15IHU-82K1002RGE | |
| CrossMark / Productivity | |
| Average of class Gaming (1386 - 2254, n=98, last 2 years) | |
| Lenovo Ideapad Gaming 3 15IHU-82K1002RGE | |
| CrossMark / Creativity | |
| Average of class Gaming (1343 - 2729, n=98, last 2 years) | |
| Lenovo Ideapad Gaming 3 15IHU-82K1002RGE | |
| CrossMark / Responsiveness | |
| Average of class Gaming (1226 - 2334, n=98, last 2 years) | |
| Lenovo Ideapad Gaming 3 15IHU-82K1002RGE | |
| PCMark 8 Home Score Accelerated v2 | 3570 points | |
| PCMark 8 Creative Score Accelerated v2 | 6662 points | |
| PCMark 8 Work Score Accelerated v2 | 5120 points | |
| PCMark 10 Score | 4477 points | |
Help | ||
| AIDA64 / Memory Copy | |
| Average of class Gaming (21750 - 129946, n=110, last 2 years) | |
| Gigabyte G5 GD | |
| Dell G15 5515 | |
| Acer Aspire Nitro 5 AN515-55-57GF | |
| Lenovo Ideapad Gaming 3 15IHU-82K1002RGE | |
| Dell G15 5510-43NHT | |
| Average Intel Core i5-10200H (n=1) | |
| AIDA64 / Memory Read | |
| Average of class Gaming (22956 - 118858, n=110, last 2 years) | |
| Gigabyte G5 GD | |
| Dell G15 5515 | |
| Acer Aspire Nitro 5 AN515-55-57GF | |
| Lenovo Ideapad Gaming 3 15IHU-82K1002RGE | |
| Dell G15 5510-43NHT | |
| Average Intel Core i5-10200H (n=1) | |
| AIDA64 / Memory Write | |
| Average of class Gaming (22297 - 135096, n=110, last 2 years) | |
| Gigabyte G5 GD | |
| Acer Aspire Nitro 5 AN515-55-57GF | |
| Dell G15 5515 | |
| Lenovo Ideapad Gaming 3 15IHU-82K1002RGE | |
| Dell G15 5510-43NHT | |
| Average Intel Core i5-10200H (n=1) | |
| AIDA64 / Memory Latency | |
| Average of class Gaming (75.3 - 259, n=110, last 2 years) | |
| Gigabyte G5 GD | |
| Lenovo Ideapad Gaming 3 15IHU-82K1002RGE | |
| Dell G15 5515 | |
| Dell G15 5510-43NHT | |
| Average Intel Core i5-10200H (n=1) | |
| Acer Aspire Nitro 5 AN515-55-57GF | |
* ... smaller is better
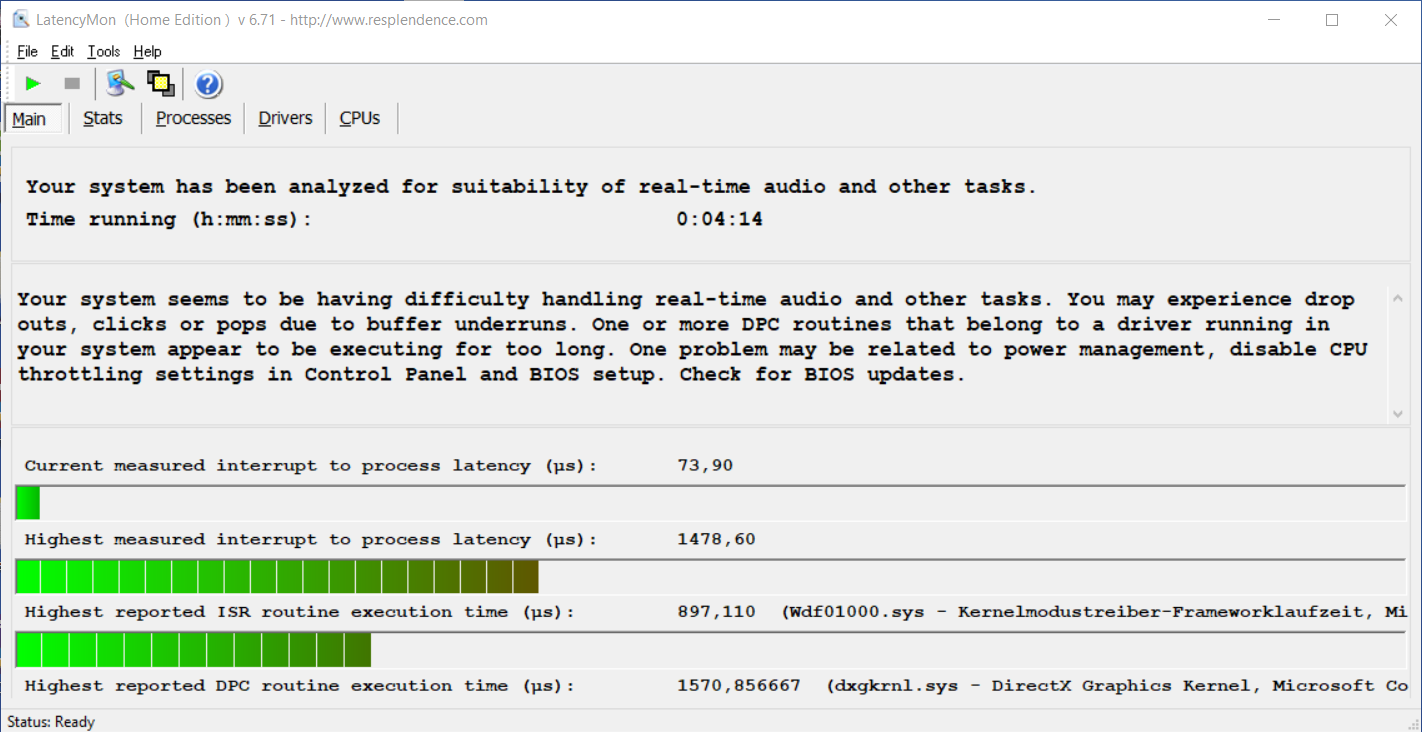
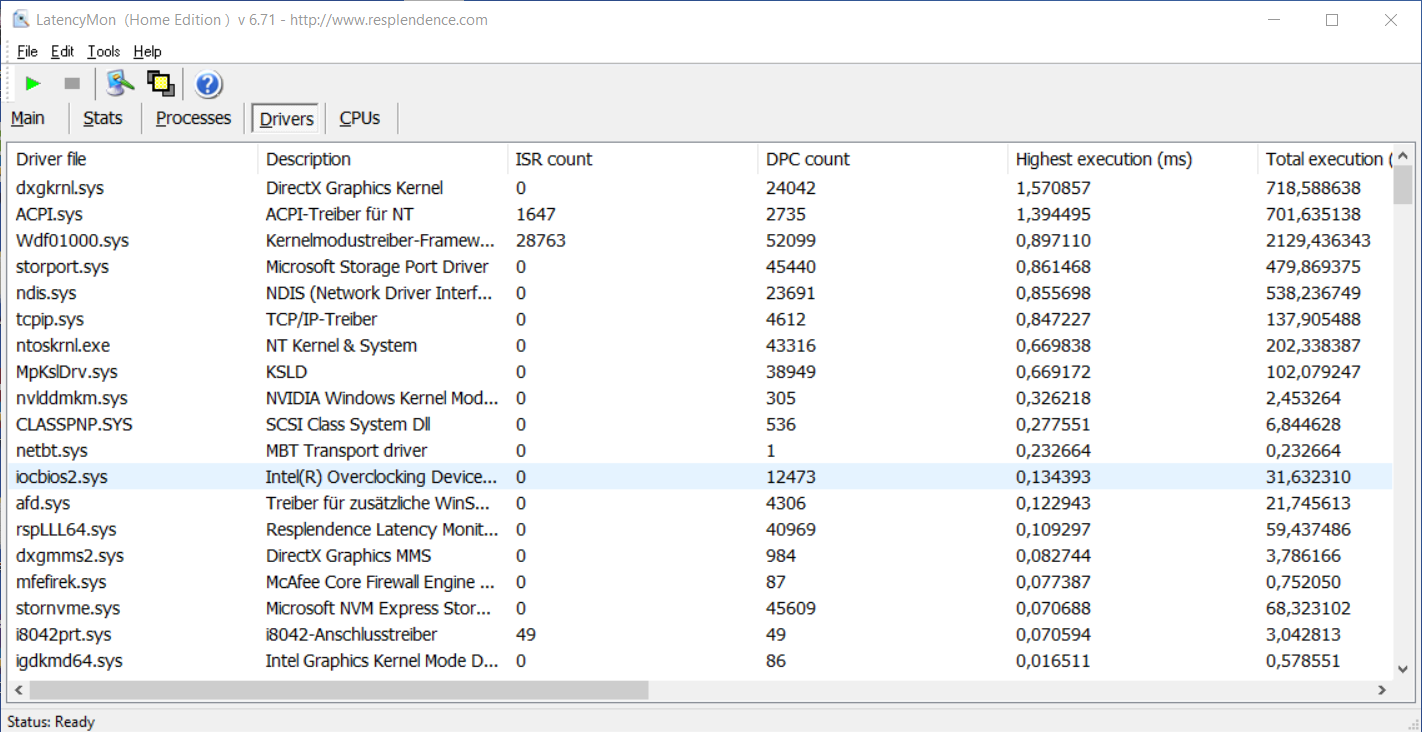
DPC延迟
与测试中的其他型号相比,戴尔G15 5510在DPC延迟方面的得分也最差。这可能表明,该设备对于实时音频和视频编辑来说是相当不足的。也就是说,无论如何,对于密集型程序来说,RAM的数量太少了。此外,需要注意的是,该测试只是一个瞬间的快照。
| DPC Latencies / LatencyMon - interrupt to process latency (max), Web, Youtube, Prime95 | |
| Dell G15 5510-43NHT | |
| Lenovo Ideapad Gaming 3 15IHU-82K1002RGE | |
| Dell G15 5515 | |
| Acer Aspire Nitro 5 AN515-55-57GF | |
| Gigabyte G5 GD | |
* ... smaller is better
储存
至于固态硬盘,它也有512GB,因此,如果你玩几个现代游戏,很快就会满了,戴尔为英特尔型号选择了一个不同的存储驱动器,而不是AMD的替代品。这里安装了SK海力士的M.2 PCIe NVMe固态硬盘,它在大多数基准测试结果中落后于AMD版本的三星硬盘。然而,这在日常使用中并不明显,除非复制了非常大量的数据。

* ... smaller is better
Continuous load read: DiskSpd Read Loop, Queue Depth 8
图形卡
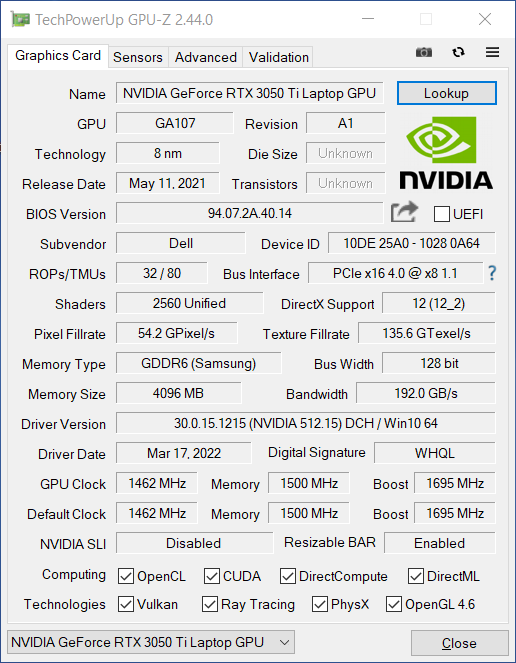
G15 5510唯一能够跟上的方面是G15 5515在性能方面,唯一能赶上G15 5515的是显卡。这并不令人惊讶,因为这两个型号都配备了专用的NvidiaGeForce RTX 3050 Ti Laptop GPU。,它配备了来自三星的4GB快速GDDR6显存;这两款机型的GPU配置方式相同。
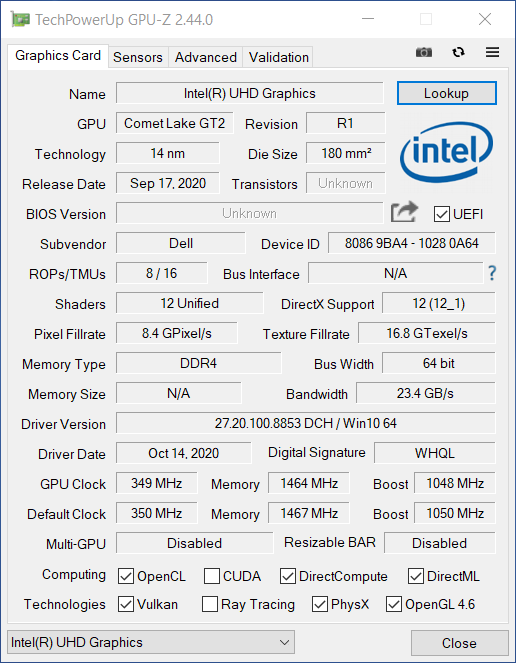
同样,戴尔为专用GPU选择了80瓦的TGP,使其运行频率高达1,695 MHz。这是Nvidia为这个图形解决方案所允许的最高值。此外,CPU的集成GPU,即 UHD Graphics 630这款GPU在图形要求不高时启动,并以省电的方式运行。
该NvidiaGeForce RTX 3050 Ti笔记本GPU在测试中提供了良好的性能,而且它通常可以将自己定位在基准的平均值之上。它的功率是持续可用的,3DMark的Time Spy 压力测试中99.1%的得分证明了这一点。在许多基准测试中,其得分与AMD版本相当,只是在3DMark的Cloud Gate 基准测试中略低一些。
在电池供电时(Windows设置为 "最佳性能"),性能明显下降。例如,3DMark的Fire Strike 基准的图形得分是6900分,比插电时低50%以上。
| 3DMark 11 Performance | 13046 points | |
| 3DMark Ice Storm Standard Score | 56573 points | |
| 3DMark Cloud Gate Standard Score | 22377 points | |
| 3DMark Fire Strike Score | 11989 points | |
| 3DMark Time Spy Score | 5303 points | |
Help | ||
游戏性能
尽管拥有相同的GPU,G15 5510远远不能跟上AMD替代品的游戏性能。在直接比较不同的帧率时可以看出这一点。尽管如此,在几乎所有测试的游戏中,即使在高图形设置下,所显示的性能仍足以达到超过稳定的帧率和流畅的游戏。
之前描述的电池供电时的性能节流导致 Witcher 3,在最高图形设置下,帧率下降到30帧--比插电时减少约45%。GPU时钟速度约为1,000 MHz。这对于这个标题的流畅游戏体验来说刚刚够用,但对于更新和更高要求的标题来说,这不再是真的。
| Dirt 5 | |
| 1280x720 Ultra Low Preset | |
| Dell G15 5515 | |
| Average NVIDIA GeForce RTX 3050 Ti Laptop GPU (59.8 - 162, n=4) | |
| Dell G15 5510-43NHT | |
| 1920x1080 Medium Preset | |
| Dell G15 5515 | |
| Average NVIDIA GeForce RTX 3050 Ti Laptop GPU (58.9 - 84.3, n=5) | |
| Dell G15 5510-43NHT | |
| 1920x1080 High Preset | |
| Dell G15 5515 | |
| Average NVIDIA GeForce RTX 3050 Ti Laptop GPU (51.2 - 69.1, n=5) | |
| Dell G15 5510-43NHT | |
| 1920x1080 Ultra High Preset | |
| Dell G15 5515 | |
| Average NVIDIA GeForce RTX 3050 Ti Laptop GPU (40.5 - 54.3, n=5) | |
| Dell G15 5510-43NHT | |
| F1 2021 | |
| 1280x720 Ultra Low Preset | |
| Gigabyte G5 GD | |
| Dell G15 5515 | |
| Average NVIDIA GeForce RTX 3050 Ti Laptop GPU (105 - 230, n=11) | |
| Lenovo Ideapad Gaming 3 15IHU-82K1002RGE | |
| Dell G15 5510-43NHT | |
| 1920x1080 Medium Preset AA:T AF:16x | |
| Dell G15 5515 | |
| Gigabyte G5 GD | |
| Average NVIDIA GeForce RTX 3050 Ti Laptop GPU (72 - 150, n=11) | |
| Lenovo Ideapad Gaming 3 15IHU-82K1002RGE | |
| Dell G15 5510-43NHT | |
| 1920x1080 High Preset AA:T AF:16x | |
| Dell G15 5515 | |
| Gigabyte G5 GD | |
| Average NVIDIA GeForce RTX 3050 Ti Laptop GPU (68 - 131, n=11) | |
| Lenovo Ideapad Gaming 3 15IHU-82K1002RGE | |
| Dell G15 5510-43NHT | |
| 1920x1080 Ultra High Preset + Raytracing AA:T AF:16x | |
| Dell G15 5515 | |
| Gigabyte G5 GD | |
| Average NVIDIA GeForce RTX 3050 Ti Laptop GPU (44.4 - 69, n=11) | |
| Dell G15 5510-43NHT | |
| Lenovo Ideapad Gaming 3 15IHU-82K1002RGE | |
| New World | |
| 1280x720 Low Video Quality | |
| Dell G15 5515 | |
| Gigabyte G5 GD | |
| Average NVIDIA GeForce RTX 3050 Ti Laptop GPU (40.1 - 99.3, n=3) | |
| Dell G15 5510-43NHT | |
| 1920x1080 Medium Video Quality | |
| Dell G15 5515 | |
| Gigabyte G5 GD | |
| Average NVIDIA GeForce RTX 3050 Ti Laptop GPU (35.1 - 73.6, n=4) | |
| Dell G15 5510-43NHT | |
| 1920x1080 High Video Quality | |
| Dell G15 5515 | |
| Gigabyte G5 GD | |
| Average NVIDIA GeForce RTX 3050 Ti Laptop GPU (33.6 - 68.9, n=4) | |
| Dell G15 5510-43NHT | |
| 1920x1080 Very High Video Quality | |
| Dell G15 5515 | |
| Gigabyte G5 GD | |
| Average NVIDIA GeForce RTX 3050 Ti Laptop GPU (24.9 - 52.2, n=4) | |
| Dell G15 5510-43NHT | |
| Far Cry 6 | |
| 1280x720 Low Graphics Quality | |
| Average of class Gaming (150.2 - 170.9, n=2, last 2 years) | |
| Gigabyte G5 GD | |
| Dell G15 5515 | |
| Average NVIDIA GeForce RTX 3050 Ti Laptop GPU (59 - 107, n=2) | |
| Dell G15 5510-43NHT | |
| 1920x1080 Medium Graphics Quality AA:SM | |
| Average of class Gaming (132.1 - 150.2, n=2, last 2 years) | |
| Dell G15 5515 | |
| Gigabyte G5 GD | |
| Average NVIDIA GeForce RTX 3050 Ti Laptop GPU (48 - 86, n=3) | |
| Dell G15 5510-43NHT | |
| 1920x1080 High Graphics Quality AA:T | |
| Average of class Gaming (120.8 - 136, n=2, last 2 years) | |
| Dell G15 5515 | |
| Gigabyte G5 GD | |
| Average NVIDIA GeForce RTX 3050 Ti Laptop GPU (44 - 79, n=3) | |
| Dell G15 5510-43NHT | |
| 1920x1080 Ultra Graphics Quality + HD Textures AA:T | |
| Average of class Gaming (96.3 - 135.7, n=3, last 2 years) | |
| Gigabyte G5 GD | |
| Average NVIDIA GeForce RTX 3050 Ti Laptop GPU (53 - 62, n=2) | |
| Dell G15 5515 | |
正如在全高清分辨率和最大质量设置下对《Witcher 3》进行的约一小时的负载测试所显示的那样,图形单元不仅充分挖掘了其潜力,而且还能随着时间的推移保持这一速率不变。
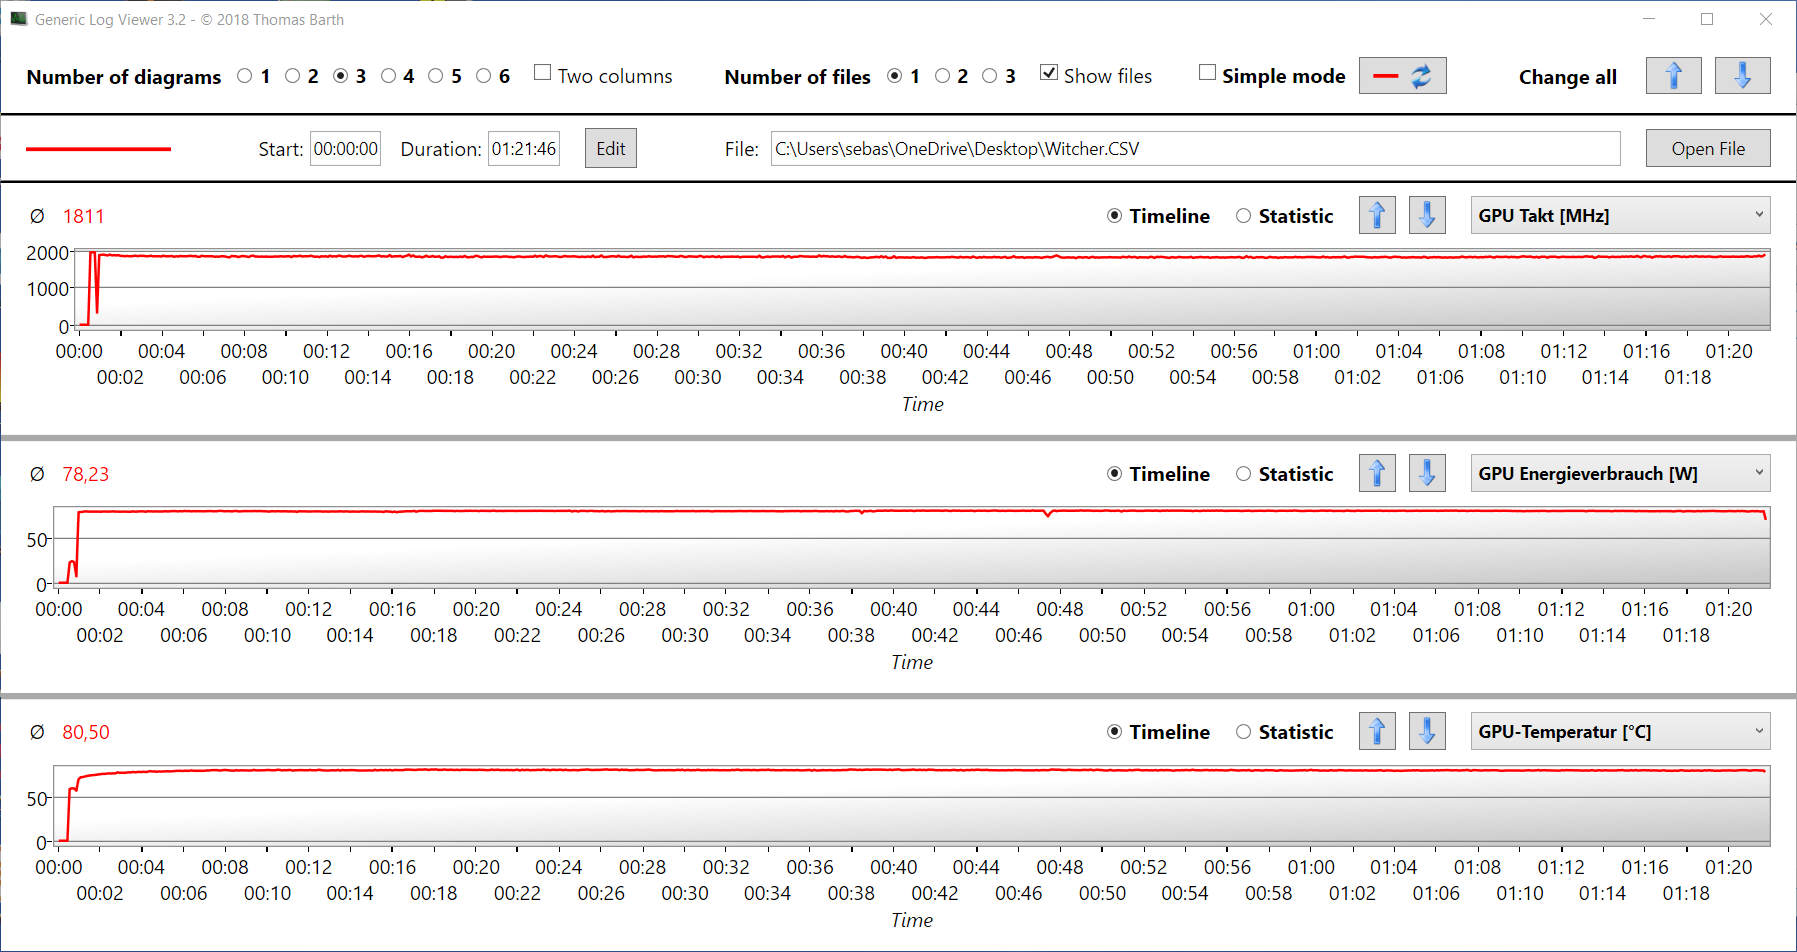
The Witcher 3 FPS diagram
| low | med. | high | ultra | |
|---|---|---|---|---|
| GTA V (2015) | 102.7 | 88.4 | 62.2 | 39.6 |
| The Witcher 3 (2015) | 132.9 | 107.5 | 75.3 | 54.4 |
| Dota 2 Reborn (2015) | 101.5 | 88.8 | 78.8 | 73.7 |
| Final Fantasy XV Benchmark (2018) | 67.2 | 51.5 | 39.1 | |
| X-Plane 11.11 (2018) | 64.9 | 54.6 | 48.8 | |
| Far Cry 5 (2018) | 69 | 54 | 52 | 49 |
| Strange Brigade (2018) | 183.7 | 115.9 | 95.1 | 94.9 |
| Dirt 5 (2020) | 59.8 | 58.9 | 52.7 | 44.9 |
| F1 2021 (2021) | 105 | 72 | 68 | 47 |
| New World (2021) | 40.1 | 35.1 | 33.6 | 24.9 |
| Far Cry 6 (2021) | 59 | 48 | 44 | |
| GRID Legends (2022) | 66.6 | 61.8 | 57.1 | 52.9 |
| Cyberpunk 2077 1.6 (2022) | 48.2 | 48 | 50 | 50.5 |
排放。G15 5510时而安静,时而响亮,时而一般。
噪声排放
戴尔G15 5510在空闲使用和低负载情况下,例如在浏览网页、流媒体或执行办公任务时,仍然谨慎而安静地在后台运行。当它在游戏过程中被投入使用时,两个风扇会启动并以相当一致的音调和音量旋转,最高可达52分贝左右。这比大多数对比机型,如戴尔G15 5515的声音要大,而且随着时间的推移,它变得很烦人;但是,由于音调至少是一致的,所以不会让人感到过分的不舒服。除此以外,评测样本没有发出任何恼人的噪音,如线圈啸叫或类似的声音。
Noise level
| Idle |
| 25 / 25 / 25 dB(A) |
| Load |
| 52.2 / 52.2 dB(A) |
 | ||
30 dB silent 40 dB(A) audible 50 dB(A) loud |
||
min: | ||
| Dell G15 5510-43NHT GeForce RTX 3050 Ti Laptop GPU, i5-10200H, SK Hynix BC711 HFM512GD3HX015N | Lenovo Ideapad Gaming 3 15IHU-82K1002RGE GeForce RTX 3050 Ti Laptop GPU, i5-11300H, Micron 2210 MTFDHBA512QFD | Dell G15 5515 GeForce RTX 3050 Ti Laptop GPU, R7 5800H, Samsung PM991a MZ9LQ512HBLU-00BD1 | Acer Aspire Nitro 5 AN515-55-57GF GeForce RTX 3060 Laptop GPU, i5-10300H, WDC PC SN530 SDBPNPZ-512G | Gigabyte G5 GD GeForce RTX 3050 4GB Laptop GPU, i5-11400H, ESR512GTLG-E6GBTNB4 | |
|---|---|---|---|---|---|
| Noise | 2% | 1% | -6% | -11% | |
| off / environment * (dB) | 25 | 23.9 4% | 24 4% | 25 -0% | 24 4% |
| Idle Minimum * (dB) | 25 | 23.9 4% | 25 -0% | 25 -0% | 29 -16% |
| Idle Average * (dB) | 25 | 26.8 -7% | 26 -4% | 30 -20% | 30 -20% |
| Idle Maximum * (dB) | 25 | 26.8 -7% | 30 -20% | 33 -32% | 32 -28% |
| Load Average * (dB) | 52.2 | 43.5 17% | 44 16% | 46 12% | 53 -2% |
| Load Maximum * (dB) | 52.2 | 53.1 -2% | 48 8% | 50 4% | 54 -3% |
| Witcher 3 ultra * (dB) | 43.5 | 44 | 47 | 52 |
* ... smaller is better
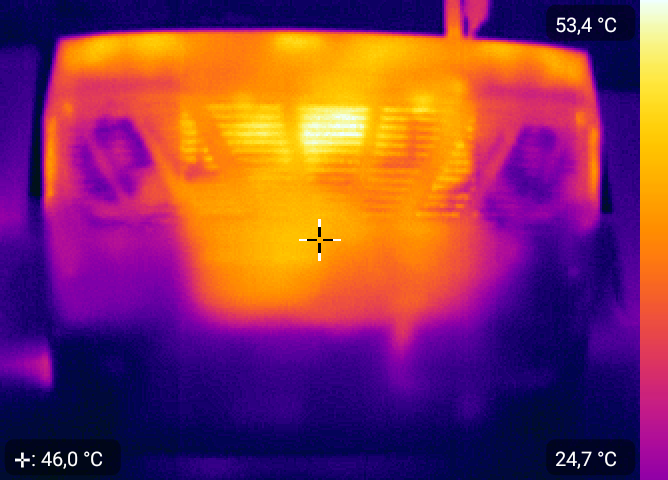
温度
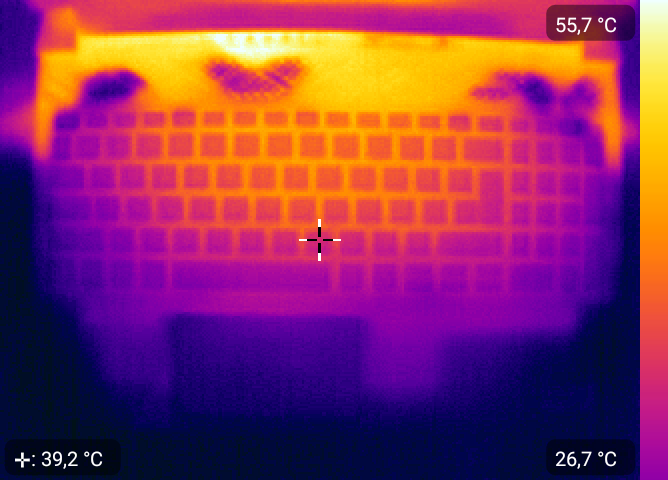
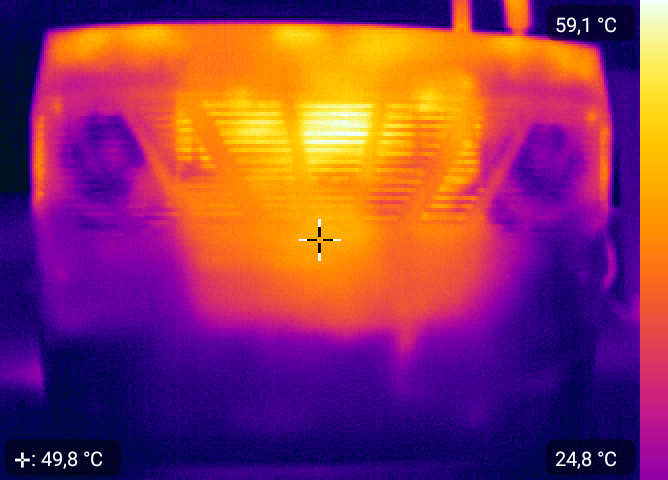
在满负荷的情况下,内部元件的温度达到90℃以上(约194°F)。不言而喻,机箱也受此影响。像往常一样,设备在显示屏前面和后面的区域变得特别热,那里不仅安装了硬件,而且还有风扇的废气出口。特别是在游戏过程中,笔记本的底部达到了50°C(约122°F)以上。穿着短裤和把设备放在腿上进行游戏会很快变得("太")热。
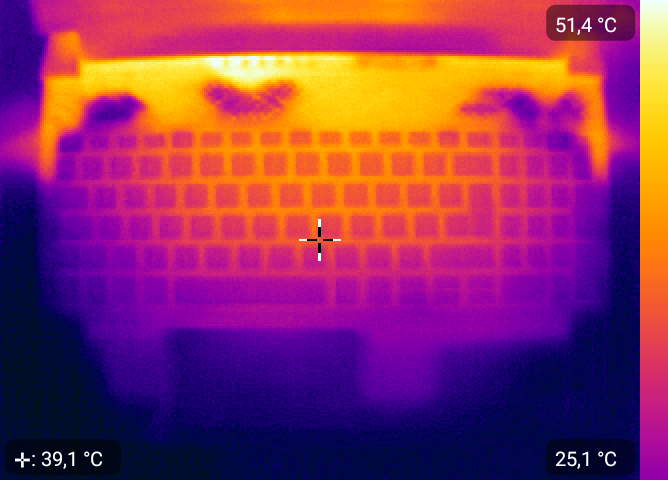
然而,触摸板和键盘区域在任何情况下都保持非常凉爽,可以毫无问题地使用笔记本电脑。在空闲使用时,游戏笔记本电脑的大多数部分几乎不比室温高,但它们总是高于AMD版本的数值。
(-) The maximum temperature on the upper side is 45.9 °C / 115 F, compared to the average of 40.4 °C / 105 F, ranging from 21.2 to 68.8 °C for the class Gaming.
(-) The bottom heats up to a maximum of 51.9 °C / 125 F, compared to the average of 43.2 °C / 110 F
(+) In idle usage, the average temperature for the upper side is 27.2 °C / 81 F, compared to the device average of 33.9 °C / 93 F.
(+) The palmrests and touchpad are cooler than skin temperature with a maximum of 28.3 °C / 82.9 F and are therefore cool to the touch.
(±) The average temperature of the palmrest area of similar devices was 28.8 °C / 83.8 F (+0.5 °C / 0.9 F).
| Dell G15 5510-43NHT Intel Core i5-10200H, NVIDIA GeForce RTX 3050 Ti Laptop GPU | Lenovo Ideapad Gaming 3 15IHU-82K1002RGE Intel Core i5-11300H, NVIDIA GeForce RTX 3050 Ti Laptop GPU | Dell G15 5515 AMD Ryzen 7 5800H, NVIDIA GeForce RTX 3050 Ti Laptop GPU | Acer Aspire Nitro 5 AN515-55-57GF Intel Core i5-10300H, NVIDIA GeForce RTX 3060 Laptop GPU | Gigabyte G5 GD Intel Core i5-11400H, NVIDIA GeForce RTX 3050 4GB Laptop GPU | |
|---|---|---|---|---|---|
| Heat | 10% | 6% | 5% | 3% | |
| Maximum Upper Side * (°C) | 45.9 | 43.2 6% | 50 -9% | 49 -7% | 45 2% |
| Maximum Bottom * (°C) | 51.9 | 47.9 8% | 49 6% | 51 2% | 50 4% |
| Idle Upper Side * (°C) | 30.1 | 24.9 17% | 26 14% | 26 14% | 28 7% |
| Idle Bottom * (°C) | 30.1 | 27 10% | 26 14% | 27 10% | 31 -3% |
* ... smaller is better
压力测试
在压力测试中(Prime95和FurMark至少运行一个小时),CPU在极限的短暂初始峰值后,稳定在3.3GHz左右,温度约为93℃(约199°F)。在平均1,550兆赫的情况下,显卡在恒定水平和略低于85°C(约185°F)的温度下相对刚刚低于其最大值运行。即使在满负荷的情况下,系统也保持稳定。
在电池供电的情况下,CPU时钟速率下降到2.3GHz左右,GPU下降到700MHz左右。自然,这损害了性能,但至少在噪音和热量发展方面是有益的(60至70°C(约140°F至约158°F))。
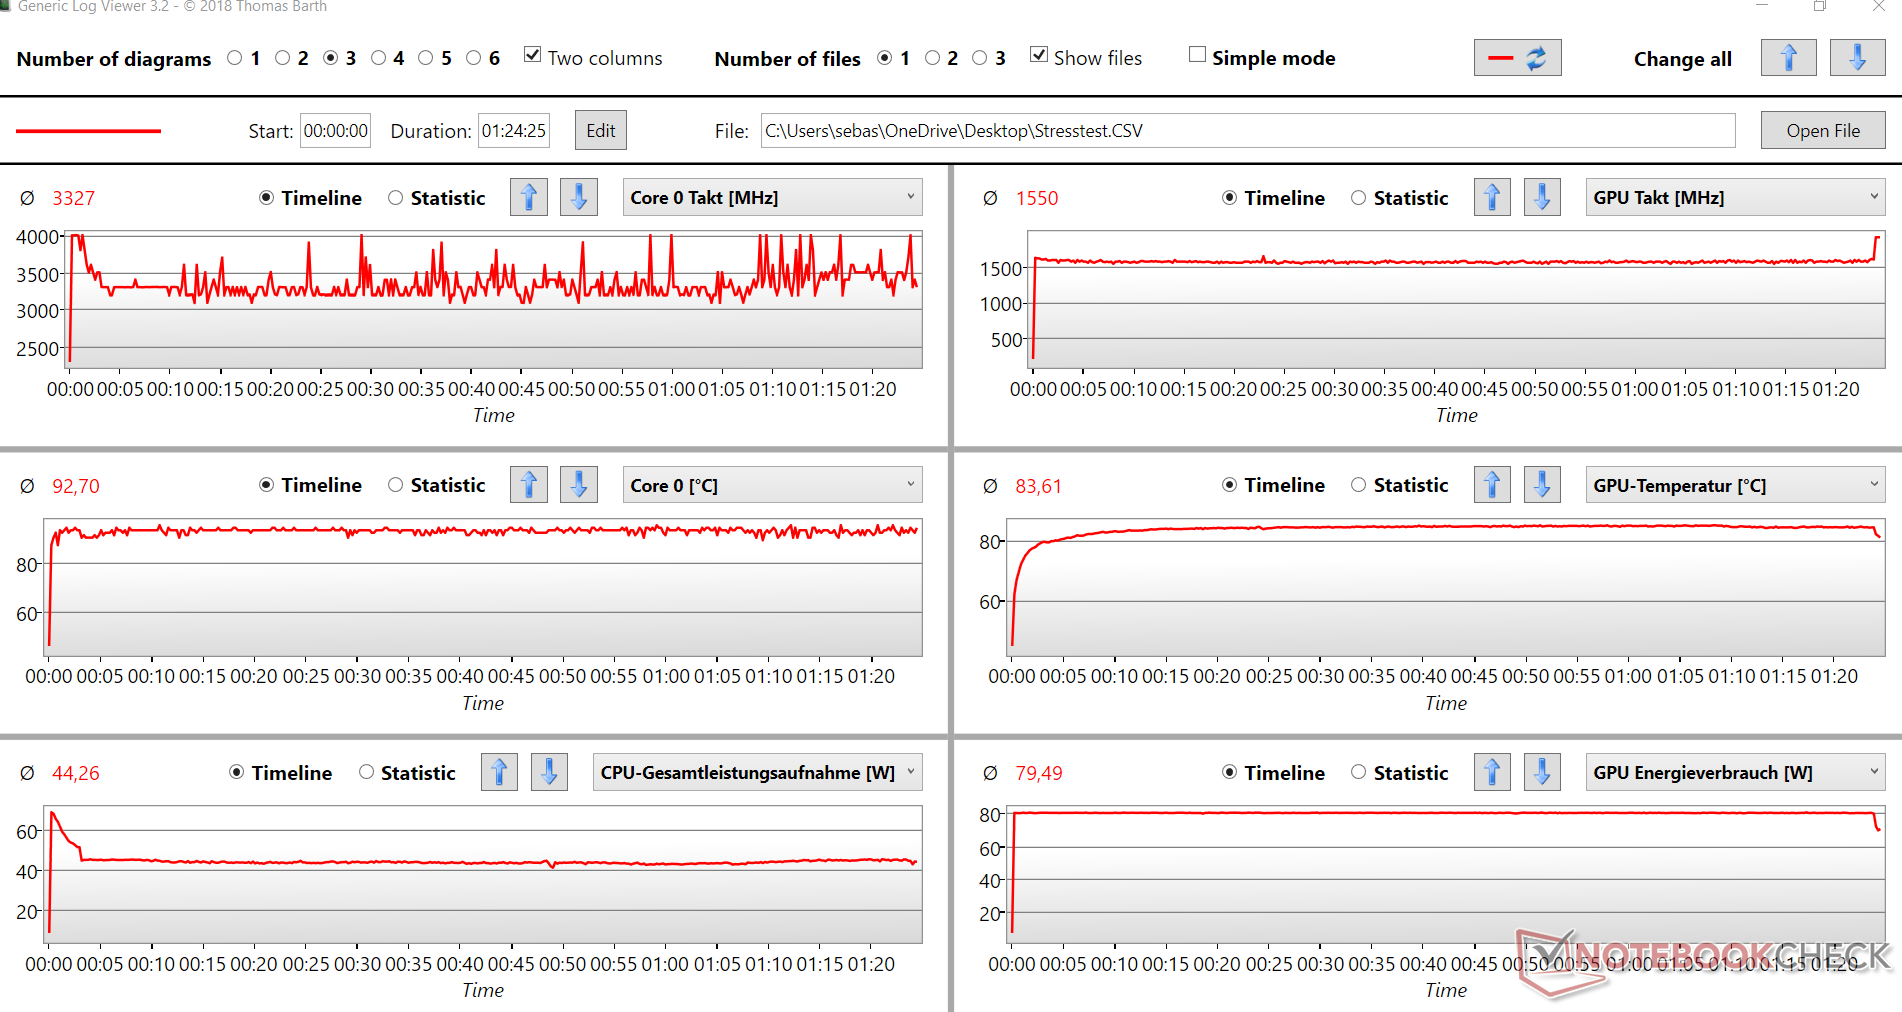
| CPU时钟速度(GHz) | GPU时钟速度(MHz) | CPU平均温度(℃) | GPU平均温度(℃) | |
| 系统空闲 | 1.9 | 0 | 45 | 55 |
| Prime95压力 | 3.7 | 350 | 86 | 57 |
| Prime95 + FurMark压力 | 3.3 | 1,550 | 93 | 93 |
| Witcher 3 的压力 | 3.9 | 1,800 | 87 | 81 |
发言人
内置的扬声器几乎没有提供任何低音,总的来说,声音的再现最多只能算是稳固。对于一个游戏设备来说,更平衡、更饱满的声音是可取的。因此,建议使用外部解决方案,如耳机或扬声器。
Dell G15 5510-43NHT audio analysis
(±) | speaker loudness is average but good (80.6 dB)
Bass 100 - 315 Hz
(-) | nearly no bass - on average 36.3% lower than median
(±) | linearity of bass is average (11% delta to prev. frequency)
Mids 400 - 2000 Hz
(+) | balanced mids - only 4.9% away from median
(+) | mids are linear (5.9% delta to prev. frequency)
Highs 2 - 16 kHz
(+) | balanced highs - only 2.2% away from median
(+) | highs are linear (3.4% delta to prev. frequency)
Overall 100 - 16.000 Hz
(±) | linearity of overall sound is average (21.9% difference to median)
Compared to same class
» 79% of all tested devices in this class were better, 6% similar, 16% worse
» The best had a delta of 6%, average was 18%, worst was 132%
Compared to all devices tested
» 63% of all tested devices were better, 7% similar, 31% worse
» The best had a delta of 4%, average was 24%, worst was 134%
Lenovo Ideapad Gaming 3 15IHU-82K1002RGE audio analysis
(±) | speaker loudness is average but good (80 dB)
Bass 100 - 315 Hz
(-) | nearly no bass - on average 23.8% lower than median
(±) | linearity of bass is average (10.3% delta to prev. frequency)
Mids 400 - 2000 Hz
(±) | higher mids - on average 6.7% higher than median
(+) | mids are linear (6% delta to prev. frequency)
Highs 2 - 16 kHz
(+) | balanced highs - only 3.6% away from median
(±) | linearity of highs is average (7.4% delta to prev. frequency)
Overall 100 - 16.000 Hz
(±) | linearity of overall sound is average (20.7% difference to median)
Compared to same class
» 74% of all tested devices in this class were better, 4% similar, 21% worse
» The best had a delta of 6%, average was 18%, worst was 132%
Compared to all devices tested
» 56% of all tested devices were better, 8% similar, 37% worse
» The best had a delta of 4%, average was 24%, worst was 134%
能源管理。戴尔G15 5515在这里也击败了G15 5510
能源消耗
在空闲使用时,戴尔G15 5510比AMD版本消耗的能量更少。然而,在负载情况下,情况正好相反,G15 5515的运行更加节俭。该设备在同类产品比较中表现出色,但这也是由于按照游戏笔记本电脑的标准,其配置相当简陋。240瓦的电源适配器是无可指责的,并且有足够的额定功率。
| Off / Standby | |
| Idle | |
| Load |
|
Key:
min: | |
| Dell G15 5510-43NHT i5-10200H, GeForce RTX 3050 Ti Laptop GPU, SK Hynix BC711 HFM512GD3HX015N, IPS, 1920x1080, 15.6" | Lenovo Ideapad Gaming 3 15IHU-82K1002RGE i5-11300H, GeForce RTX 3050 Ti Laptop GPU, Micron 2210 MTFDHBA512QFD, IPS, 1920x1080, 15.6" | Dell G15 5515 R7 5800H, GeForce RTX 3050 Ti Laptop GPU, Samsung PM991a MZ9LQ512HBLU-00BD1, IPS, 1920x1080, 15.6" | Acer Aspire Nitro 5 AN515-55-57GF i5-10300H, GeForce RTX 3060 Laptop GPU, WDC PC SN530 SDBPNPZ-512G, IPS, 1920x1080, 15.6" | Gigabyte G5 GD i5-11400H, GeForce RTX 3050 4GB Laptop GPU, ESR512GTLG-E6GBTNB4, IPS, 1920x1080, 15.6" | Average NVIDIA GeForce RTX 3050 Ti Laptop GPU | Average of class Gaming | |
|---|---|---|---|---|---|---|---|
| Power Consumption | 6% | -17% | -6% | -61% | -37% | -108% | |
| Idle Minimum * (Watt) | 4.6 | 4.9 -7% | 5 -9% | 5 -9% | 13 -183% | 8.2 ? -78% | 13.3 ? -189% |
| Idle Average * (Watt) | 6.5 | 8.3 -28% | 9 -38% | 9 -38% | 15 -131% | 12.6 ? -94% | 19 ? -192% |
| Idle Maximum * (Watt) | 10.1 | 8.9 12% | 20 -98% | 13 -29% | 20 -98% | 17.2 ? -70% | 24.5 ? -143% |
| Load Average * (Watt) | 129 | 81 37% | 94 27% | 84 35% | 102 21% | 92 ? 29% | 108.1 ? 16% |
| Witcher 3 ultra * (Watt) | 129 | 119 8% | 123 5% | 125 3% | 124 4% | ||
| Load Maximum * (Watt) | 195 | 172 12% | 172 12% | 190 3% | 148 24% | 139.1 ? 29% | 254 ? -30% |
* ... smaller is better
Energy consumption during The Witcher 3 / stress test
Energy consumption with an external monitor
电池寿命
对于一台游戏笔记本电脑来说,戴尔G15 5510提供了坚实的电池寿命。然而,尽管这两款机型都有相同的56Wh电池,但这些都比AMD的替代品低。我们刚刚解释了其中的原因。AMD的CPU在负载下消耗的电量较少,所以最后一次电池充电的时间更长。
然而,你仍然可以浏览网页6个小时或观看视频8个半小时。然而,在负载情况下,一个多小时后屏幕就会变黑。因此,远离电源插座的大量游戏时间是不可能的。
| Dell G15 5510-43NHT i5-10200H, GeForce RTX 3050 Ti Laptop GPU, 56 Wh | Lenovo Ideapad Gaming 3 15IHU-82K1002RGE i5-11300H, GeForce RTX 3050 Ti Laptop GPU, 45 Wh | Dell G15 5515 R7 5800H, GeForce RTX 3050 Ti Laptop GPU, 56 Wh | Acer Aspire Nitro 5 AN515-55-57GF i5-10300H, GeForce RTX 3060 Laptop GPU, 57.5 Wh | Gigabyte G5 GD i5-11400H, GeForce RTX 3050 4GB Laptop GPU, 41 Wh | Average of class Gaming | |
|---|---|---|---|---|---|---|
| Battery runtime | -2% | 22% | -1% | -36% | 14% | |
| H.264 (h) | 8.6 | 7.7 -10% | 8.8 2% | 6.2 -28% | 3.6 -58% | 8.26 ? -4% |
| WiFi v1.3 (h) | 6.3 | 6.6 5% | 8 27% | 5.7 -10% | 3.1 -51% | 7.01 ? 11% |
| Load (h) | 1.1 | 1.1 0% | 1.5 36% | 1.5 36% | 1.1 0% | 1.47 ? 34% |
| Reader / Idle (h) | 13.5 | 5.7 | 8.71 ? |
Pros
Cons
判决书

戴尔G15 5510的游戏性能当然还不错--特别是考虑到其约1000欧元(约1061美元)的价格。大多数游戏,包括较新的游戏,即使在高图形水平下也能顺利运行,这要归功于现有的图形能力。
不幸的是,专用的GPU是游戏笔记本电脑中唯一实际上比较强大的部件。CPU和内存很快就把设备推到了极限,这也影响了游戏性能。
这款戴尔G15 5515AMD版本提供更好的图形和游戏性能,而且由于更快的CPU和两倍的内存,系统性能也明显提高。
由于戴尔仍然没有为更强大的替代品收取更多费用,所以戴尔G15 5515(Cyberport.de约850欧元(约合901美元))与5510相比绝对是更好的选择。它不仅速度快,而且更安静、更持久,而且它的 "幻影灰加斑点 "颜色看起来更时尚。同样地,最近审查的联想IdeaPad Gaming 3 15 G6由于结合了较新的CPU和相同的GPU,它的性能超过了这个审查样本。
价格和可用性
在写这篇文章的时候,在美国要找到我们对戴尔G15 5510的确切评测配置(Core i5-10200H,GeForce RTX 3050 Ti Laptop GPU, 8 GB内存, 512 GB SSD)有点困难。沃尔玛的网上商店有这个确切的型号,售价1199.99美元.在亚马逊上,你会发现一个带有RTX 3050笔记本GPU的选项,价格为958美元和另一个带有Core i5-10500H和RTX 3050 Ti的型号,售价1197美元.不过,最好的选择可能是在百思买的网上商店提供的,Core i7-11800H和16GB的内存,价格为1199美元。.
Dell G15 5510-43NHT
- 05/01/2022 v7 (old)
Marcus Schwarten
Price comparison

