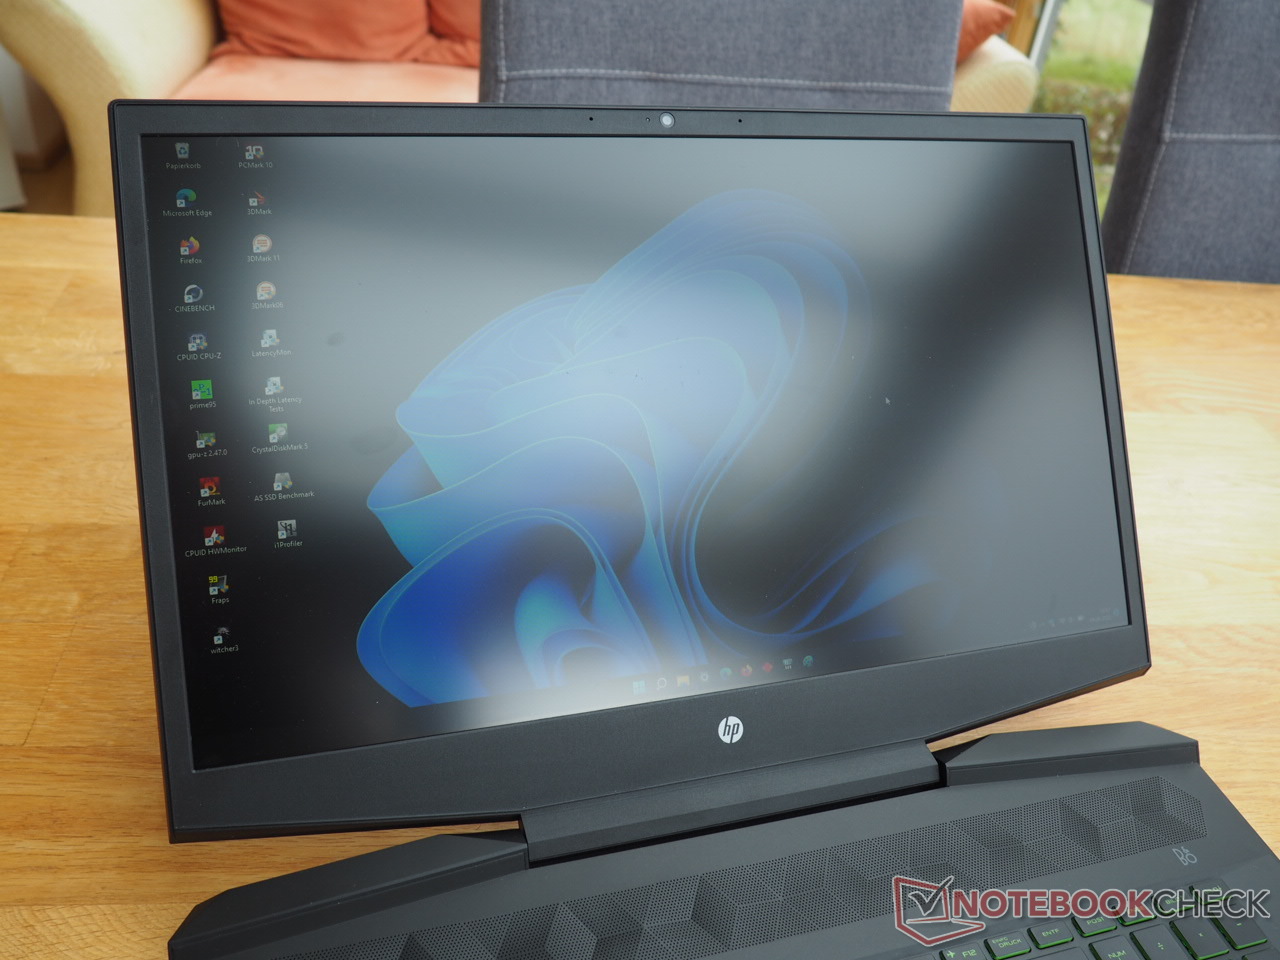
惠普Pavilion Gaming 17笔记本电脑评测。一个好的显示器,一个预算价格
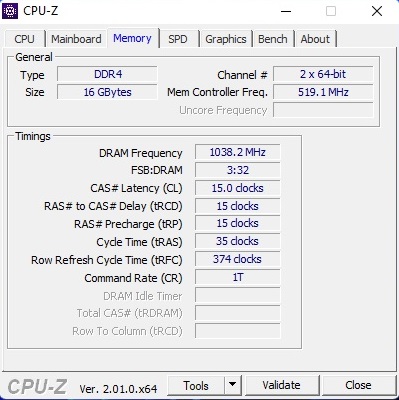
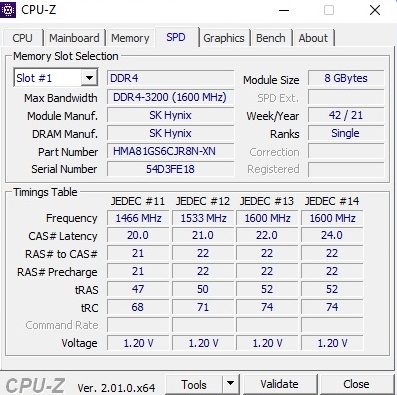
寻找不到1000欧元(约1002美元)的游戏笔记本的用户可能已经遇到了Pavilion Gaming 17。我们审查的cd2146ng型号配备了均衡的中端组件,即一个酷睿i5-11300H和一个GeForce RTX 3050 Ti包括4GB的VRAM。16GB DDR4内存(2x 8GB双通道)和512GB NVMe固态硬盘在这个价格范围内也是不错的。显示屏是比较令人满意的。哑光全高清IPS显示屏支持144赫兹,根据惠普的说法,应该可以达到约300尼特。我们稍后会分析这一说法是否属实。同时,有点遗憾的是,我们的评测机型缺乏一个 "真正的 "操作系统(只有FreeDOS在上面)。然而,兼容的Windows许可证--比如我们后来安装的11专业版的许可证--可以在网上非常便宜地买到。
Pavilion Gaming 17的主要竞争对手包括其他配备GeForce RTX 3050 Ti的15英寸至17英寸预算笔记本电脑,如 戴尔G15 5510,以及 联想IdeaPad Gaming 3 15IHU,以及内部的 惠普Victus 16.后面的每台笔记本电脑都作为对比设备出现在表格中。
潜在的竞争对手比较
Rating | Date | Model | Weight | Height | Size | Resolution | Price |
|---|---|---|---|---|---|---|---|
| 82.7 % v7 (old) | 09 / 2022 | HP Pavilion Gaming 17-cd2146ng i5-11300H, GeForce RTX 3050 Ti Laptop GPU | 2.8 kg | 25 mm | 17.30" | 1920x1080 | |
| 79.1 % v7 (old) | 05 / 2022 | Dell G15 5510-43NHT i5-10200H, GeForce RTX 3050 Ti Laptop GPU | 2.5 kg | 23.33 mm | 15.60" | 1920x1080 | |
| 79.7 % v7 (old) | 03 / 2022 | Lenovo Ideapad Gaming 3 15IHU-82K1002RGE i5-11300H, GeForce RTX 3050 Ti Laptop GPU | 2 kg | 24.2 mm | 15.60" | 1920x1080 | |
| 82.3 % v7 (old) | 05 / 2022 | HP Victus 16-e0145ng R5 5600H, GeForce RTX 3050 Ti Laptop GPU | 2.4 kg | 23.5 mm | 16.10" | 1920x1080 | |
| 81.6 % v7 (old) | 09 / 2019 | HP Pavilion Gaming 17-cd0085cl i7-9750H, GeForce GTX 1660 Ti Max-Q | 2.8 kg | 25 mm | 17.30" | 1920x1080 |
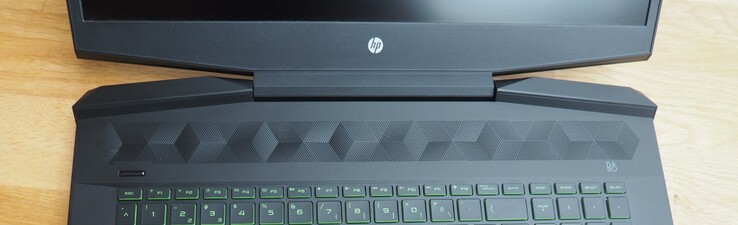
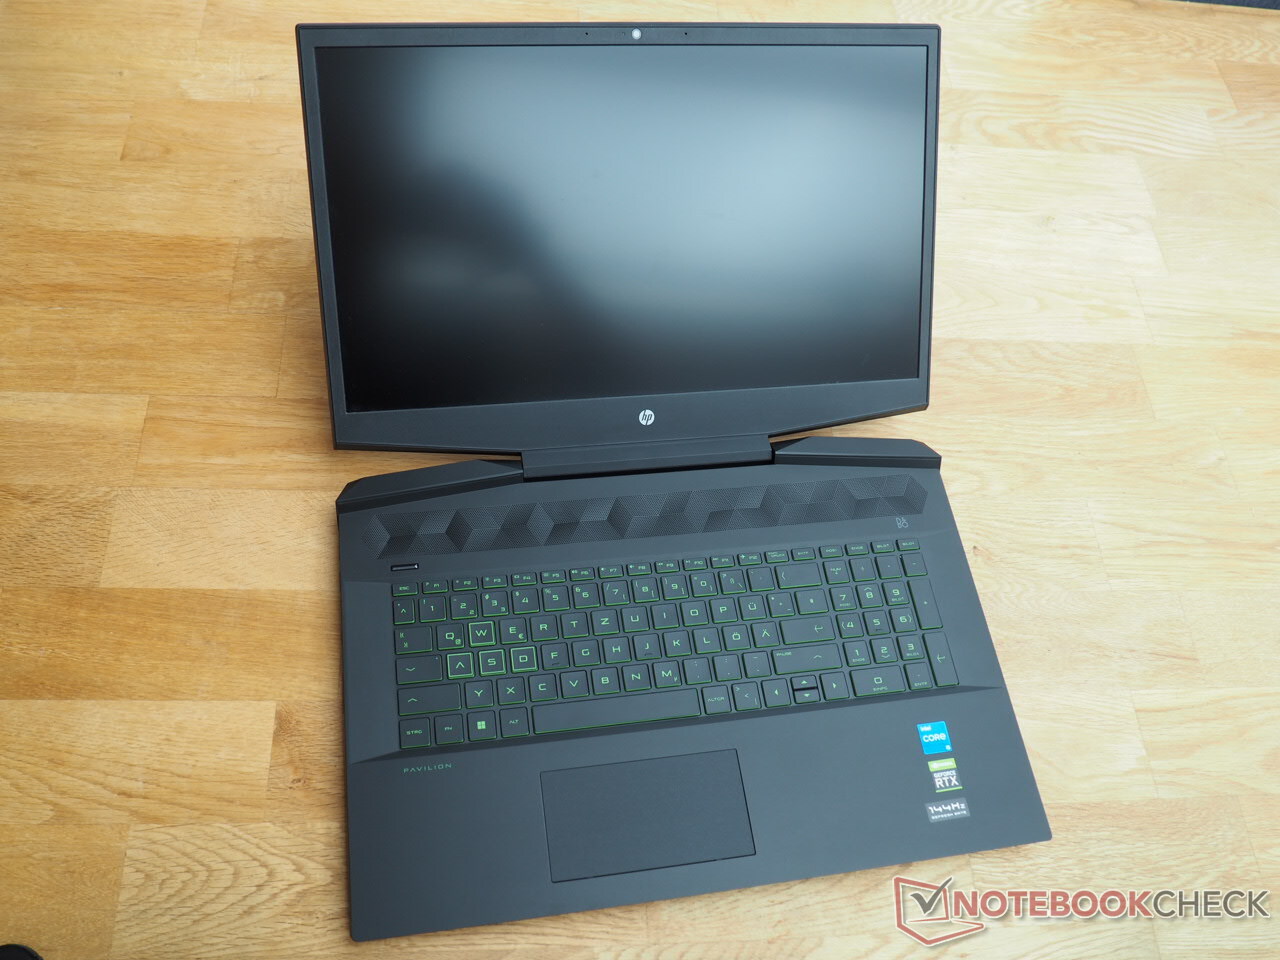
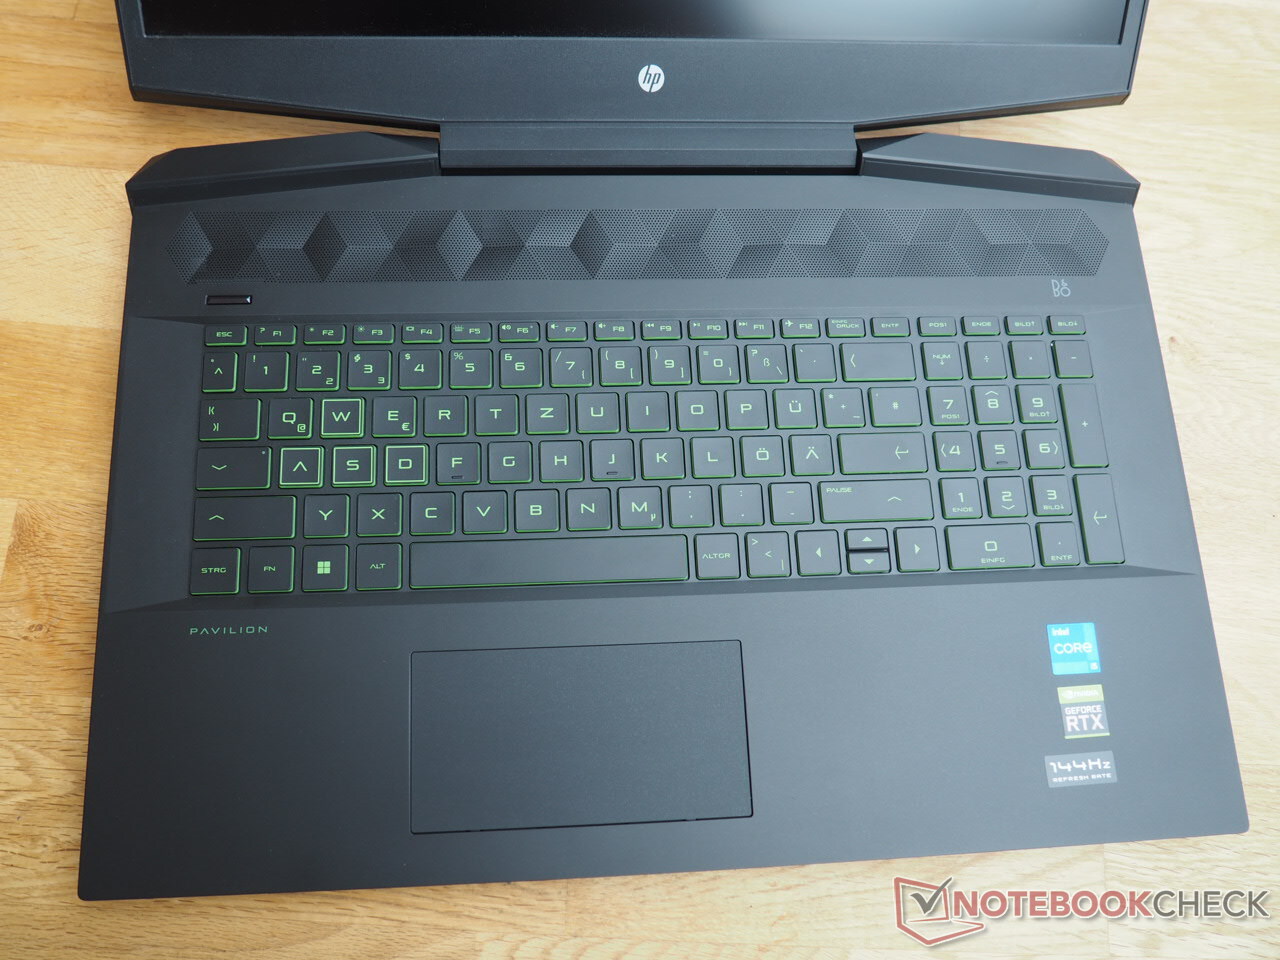
由于机箱在外观上与(前)前身相同,我们不会在本文中再次讨论机箱、输入设备和连接。你可以在我们的评论中找到相应的信息。 Pavilion 游戏17-cd0085cl.
SD卡阅读器
| SD Card Reader - average JPG Copy Test (av. of 3 runs) | |
| Average of class Gaming (20.9 - 210, n=54, last 2 years) | |
| HP Pavilion Gaming 17-cd0085cl (Toshiba Exceria Pro SDXC 64 GB UHS-II) | |
| HP Victus 16-e0145ng (AV PRO microSD 128 GB V60) | |
| HP Pavilion Gaming 17-cd2146ng (AV PRO microSD 128 GB V60) | |
沟通
| Networking - iperf3 receive AXE11000 | |
| Average of class Gaming (680 - 1745, n=88, last 2 years) | |
| HP Pavilion Gaming 17-cd2146ng | |
| Average Realtek RTL8852AE (n=1) | |
| HP Victus 16-e0145ng | |
网络摄像头


显示
如前所述,在低价位游戏笔记本中找到好的显示屏是相当不常见的。幸运的是,Pavilion Gaming 17是少数例外之一。
| |||||||||||||||||||||||||
Brightness Distribution: 94 %
Center on Battery: 328 cd/m²
Contrast: 1426:1 (Black: 0.23 cd/m²)
ΔE ColorChecker Calman: 3.83 | ∀{0.5-29.43 Ø4.71}
calibrated: 0.83
ΔE Greyscale Calman: 4.9 | ∀{0.09-98 Ø4.96}
66.5% AdobeRGB 1998 (Argyll 3D)
96.8% sRGB (Argyll 3D)
64.8% Display P3 (Argyll 3D)
Gamma: 2.177
CCT: 7881 K
| HP Pavilion Gaming 17-cd2146ng LGD0611, IPS, 1920x1080, 17.3" | Dell G15 5510-43NHT Dell 156GL05, IPS, 1920x1080, 15.6" | Lenovo Ideapad Gaming 3 15IHU-82K1002RGE LEN156FHD, IPS, 1920x1080, 15.6" | HP Victus 16-e0145ng CMN1609, IPS, 1920x1080, 16.1" | HP Pavilion Gaming 17-cd0085cl BOE0825, IPS, 1920x1080, 17.3" | |
|---|---|---|---|---|---|
| Display | -37% | -38% | -36% | -4% | |
| Display P3 Coverage (%) | 64.8 | 40.8 -37% | 39.7 -39% | 41.6 -36% | 63.3 -2% |
| sRGB Coverage (%) | 96.8 | 61.4 -37% | 59.6 -38% | 61.9 -36% | 90.2 -7% |
| AdobeRGB 1998 Coverage (%) | 66.5 | 42.2 -37% | 41.1 -38% | 43 -35% | 64.3 -3% |
| Response Times | -193% | -285% | -128% | -137% | |
| Response Time Grey 50% / Grey 80% * (ms) | 12.7 ? | 35 ? -176% | 46.4 ? -265% | 29.6 ? -133% | 31.6 ? -149% |
| Response Time Black / White * (ms) | 8.7 ? | 27 ? -210% | 35.2 ? -305% | 19.4 ? -123% | 19.6 ? -125% |
| PWM Frequency (Hz) | |||||
| Screen | -117% | -77% | -80% | -40% | |
| Brightness middle (cd/m²) | 328 | 290 -12% | 307 -6% | 257 -22% | 299.6 -9% |
| Brightness (cd/m²) | 317 | 267 -16% | 292 -8% | 239 -25% | 285 -10% |
| Brightness Distribution (%) | 94 | 87 -7% | 88 -6% | 88 -6% | 86 -9% |
| Black Level * (cd/m²) | 0.23 | 1.085 -372% | 0.21 9% | 0.25 -9% | 0.33 -43% |
| Contrast (:1) | 1426 | 267 -81% | 1462 3% | 1028 -28% | 908 -36% |
| Colorchecker dE 2000 * | 3.83 | 6.5 -70% | 5.9 -54% | 6.91 -80% | 3.68 4% |
| Colorchecker dE 2000 max. * | 8.51 | 16.96 -99% | 21.6 -154% | 22.27 -162% | 8.05 5% |
| Colorchecker dE 2000 calibrated * | 0.83 | 4.11 -395% | 4.8 -478% | 3.61 -335% | 3.15 -280% |
| Greyscale dE 2000 * | 4.9 | 4.85 1% | 4.9 -0% | 7.5 -53% | 3.8 22% |
| Gamma | 2.177 101% | 2.22 99% | 2.26 97% | 2.125 104% | 2.12 104% |
| CCT | 7881 82% | 7401 88% | 6504 100% | 6025 108% | 7240 90% |
| Color Space (Percent of AdobeRGB 1998) (%) | 58.1 | ||||
| Color Space (Percent of sRGB) (%) | 89.8 | ||||
| Total Average (Program / Settings) | -116% /
-111% | -133% /
-99% | -81% /
-77% | -60% /
-46% |
* ... smaller is better
惠普笔记本电脑的注册sRGB覆盖率为97%,接近制造商的规格,因此,惠普笔记本电脑在竞争中取得了飞跃性的进展。戴尔G15和联想IdeaPad Gaming 3都只达到60%左右,导致无论对比度如何,图像都要苍白得多,这往往只适合办公和互联网浏览,但不适合媒体消费(视频、电影、游戏等)。相比之下,Pavilion 17在每个应用中都能切割出精美的图形。
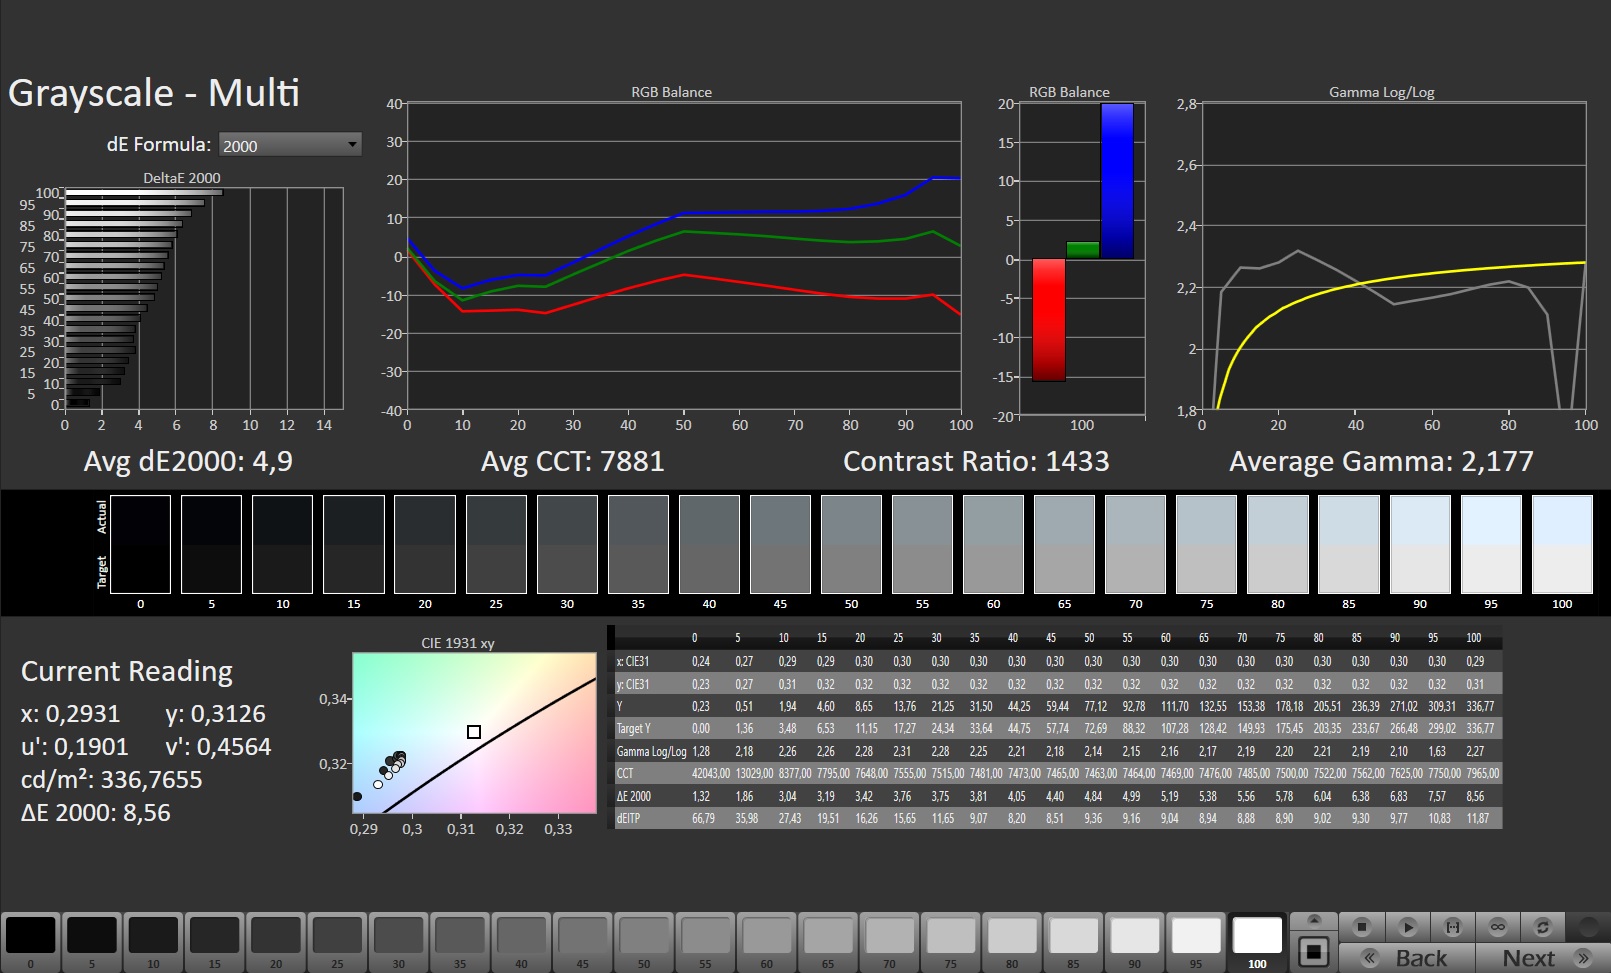
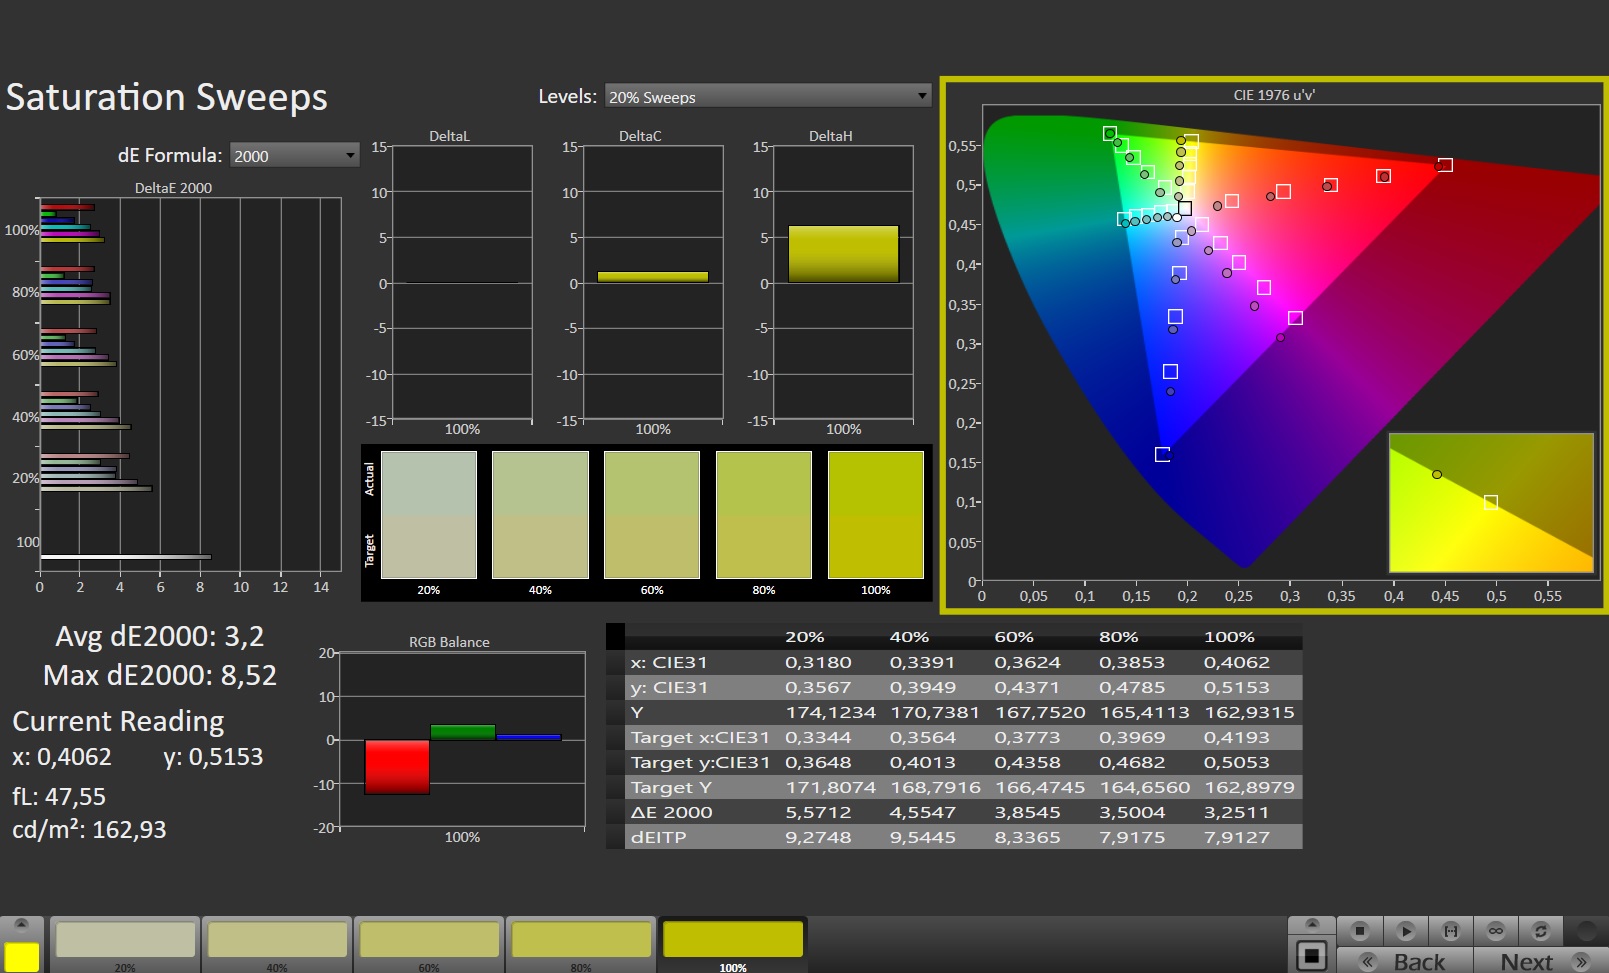
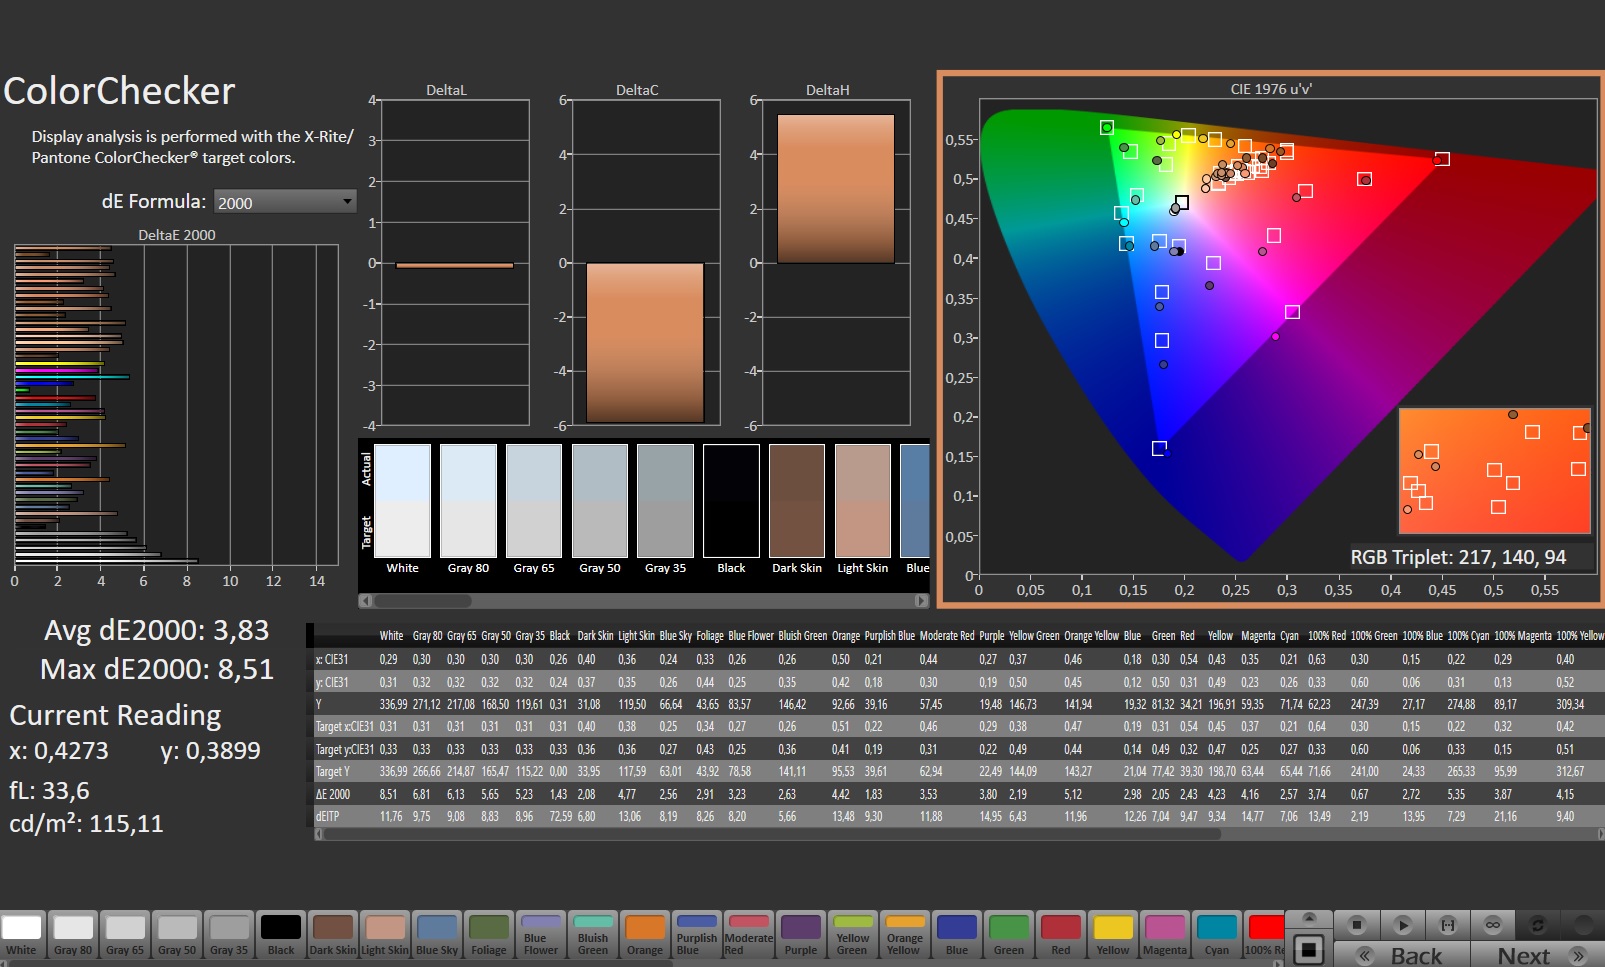
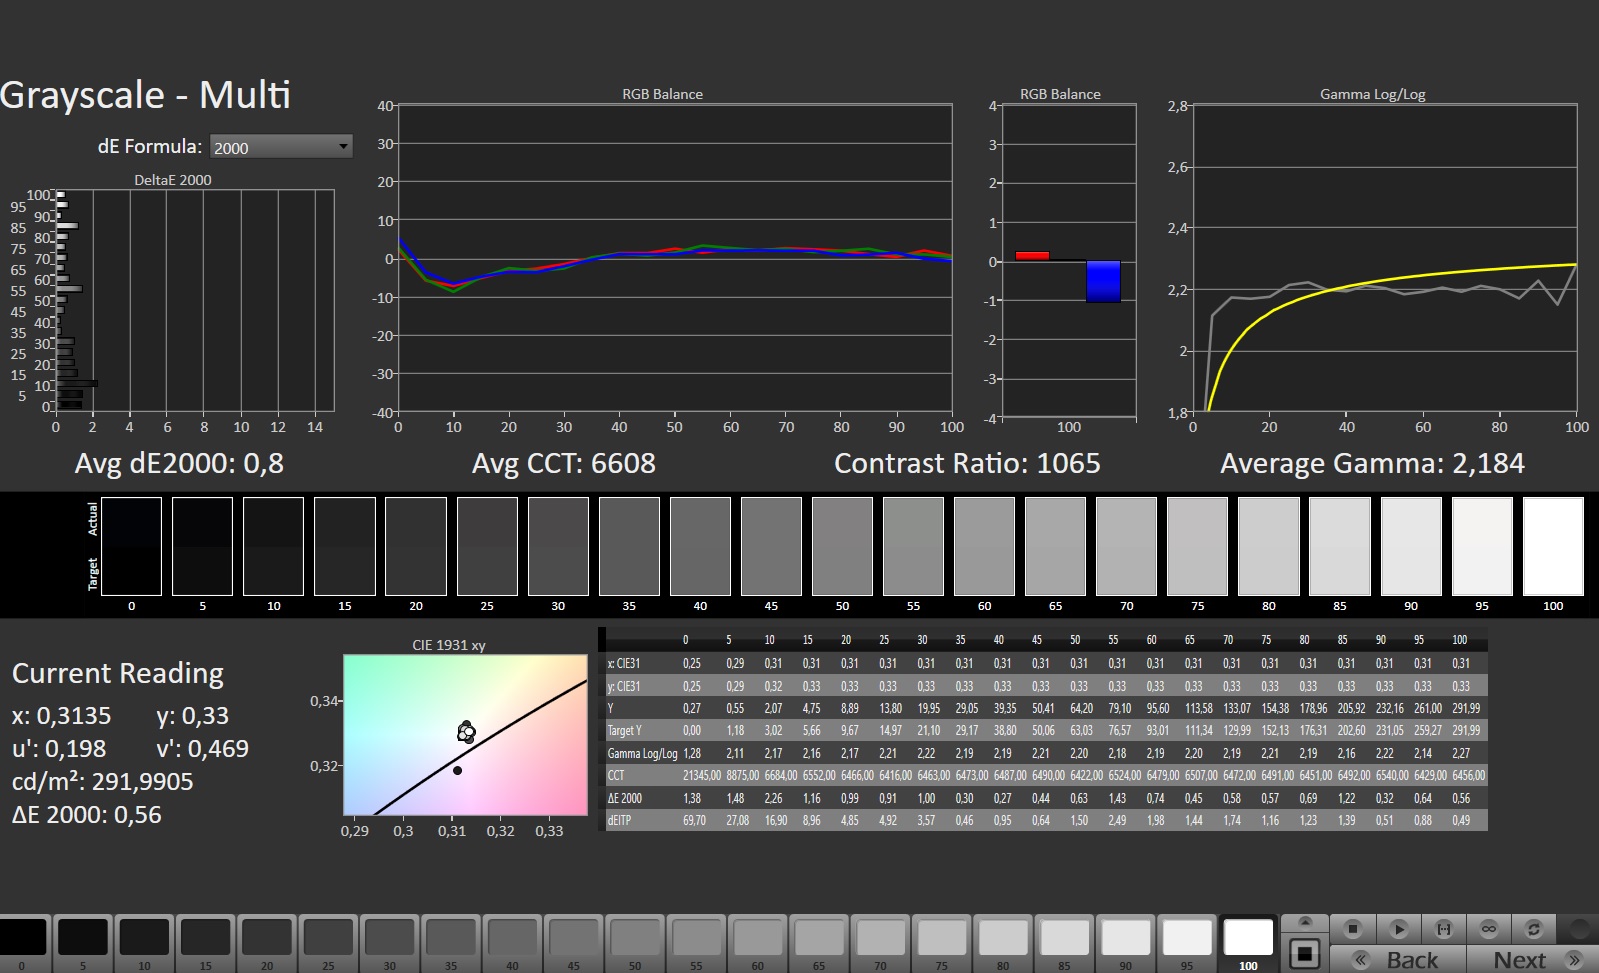
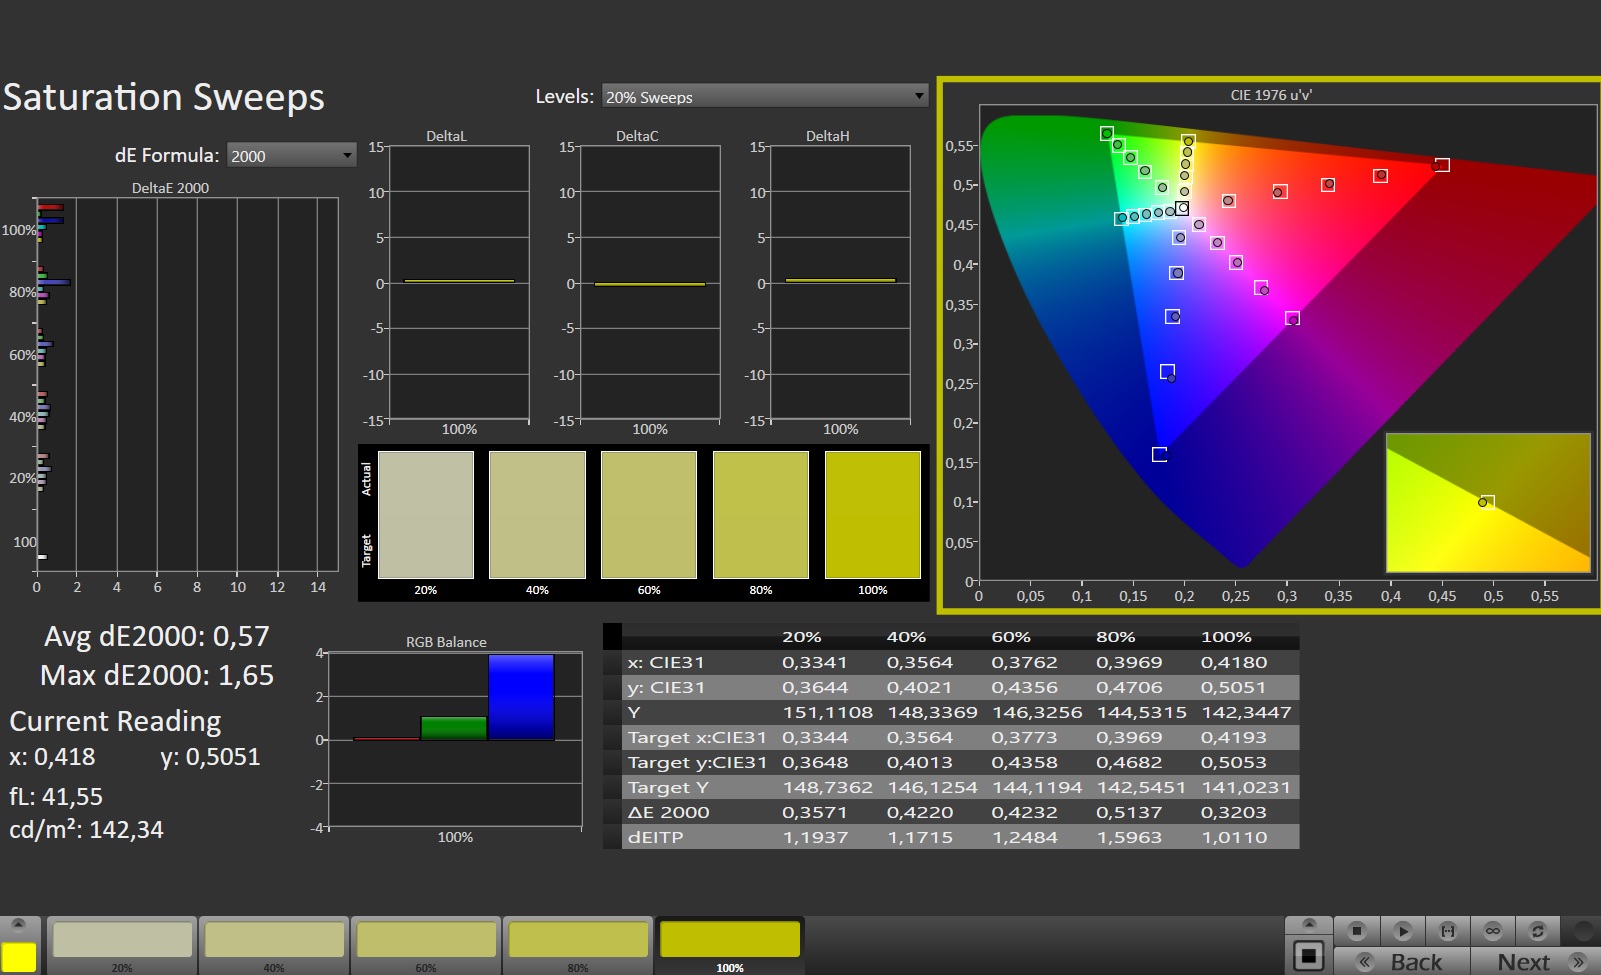
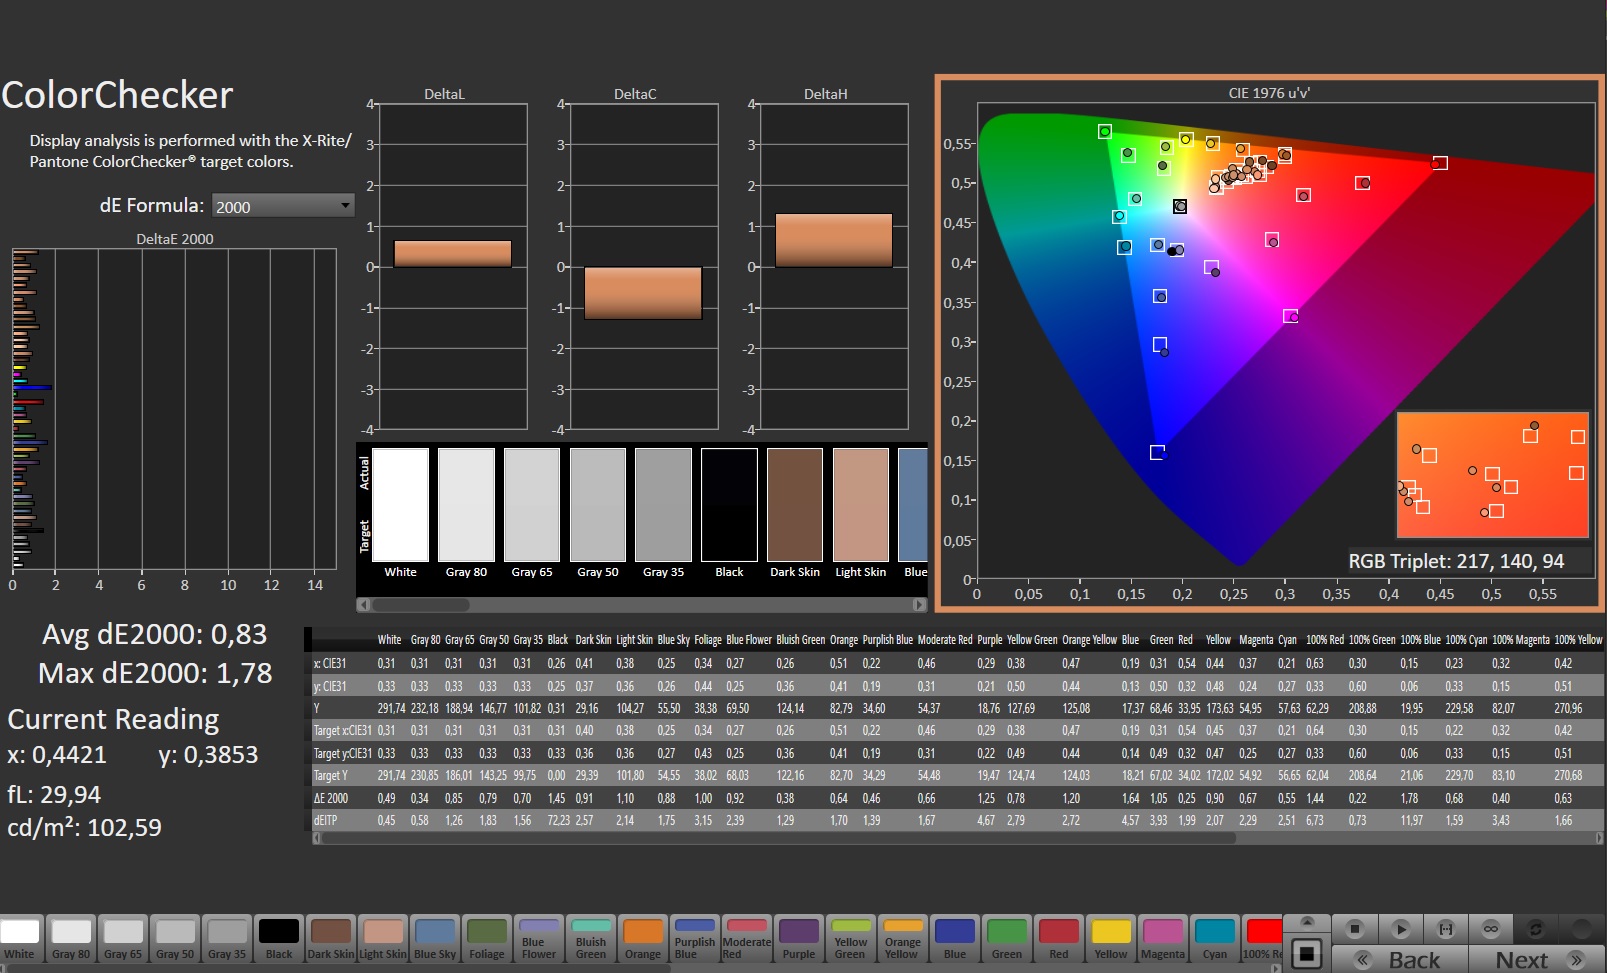
在对比度方面,也没有什么可抱怨的。按照IPS标准,1,426:1是非常高的,这个数值只是刚刚被联想笔记本电脑超过。说到亮度,Pavilion ,再次夺得头筹。平均317cd/m²并不是一个顶级的比率,但只要你避免在特别明亮或有阳光的地方使用,它应该足以满足大多数需求。作为比较。竞争对手的平均亮度仍然低于300cd/m²。
惠普笔记本电脑因其快速响应时间而获得更多分数,这是任何竞争对手都无法比拟的。然而,制造商在色彩准确性方面还需要一些改进。面板开箱后显示出轻微的蓝色色调,这可以通过校准来纠正(在右上角亮度分布图旁边有我们的ICC文件的链接)。视角符合典型的IPS标准。17英寸的设备没有出现过度的屏幕出血或闪烁现象。
Display Response Times
| ↔ Response Time Black to White | ||
|---|---|---|
| 8.7 ms ... rise ↗ and fall ↘ combined | ↗ 4.4 ms rise | 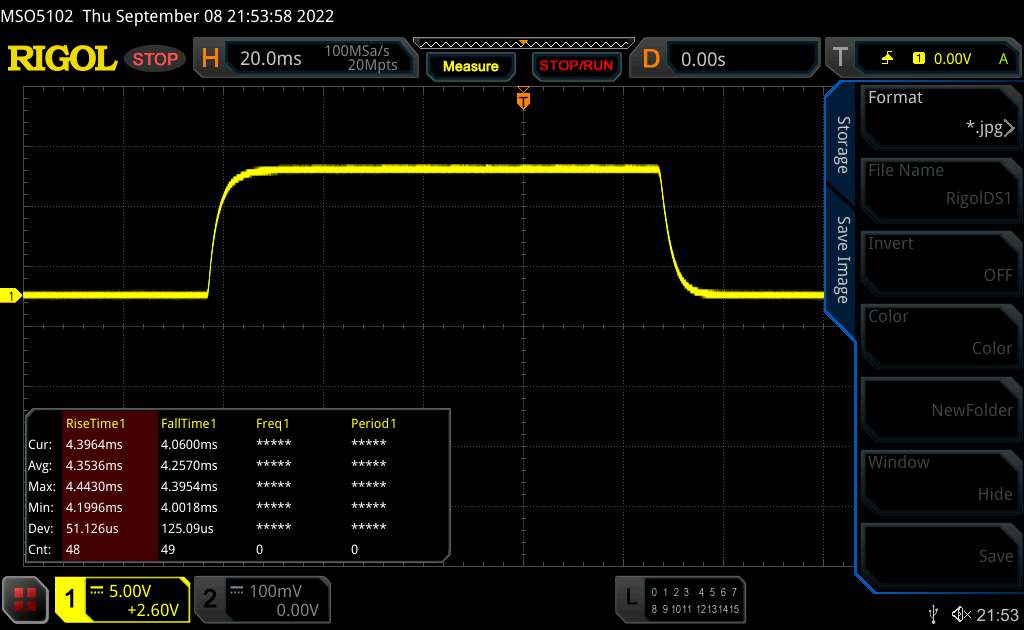 |
| ↘ 4.3 ms fall | ||
| The screen shows fast response rates in our tests and should be suited for gaming. In comparison, all tested devices range from 0.1 (minimum) to 240 (maximum) ms. » 24 % of all devices are better. This means that the measured response time is better than the average of all tested devices (19.8 ms). | ||
| ↔ Response Time 50% Grey to 80% Grey | ||
| 12.7 ms ... rise ↗ and fall ↘ combined | ↗ 6.1 ms rise |  |
| ↘ 6.6 ms fall | ||
| The screen shows good response rates in our tests, but may be too slow for competitive gamers. In comparison, all tested devices range from 0.165 (minimum) to 636 (maximum) ms. » 26 % of all devices are better. This means that the measured response time is better than the average of all tested devices (31 ms). | ||
Screen Flickering / PWM (Pulse-Width Modulation)
| Screen flickering / PWM not detected |  | ||
In comparison: 52 % of all tested devices do not use PWM to dim the display. If PWM was detected, an average of 7747 (minimum: 5 - maximum: 343500) Hz was measured. | |||
业绩
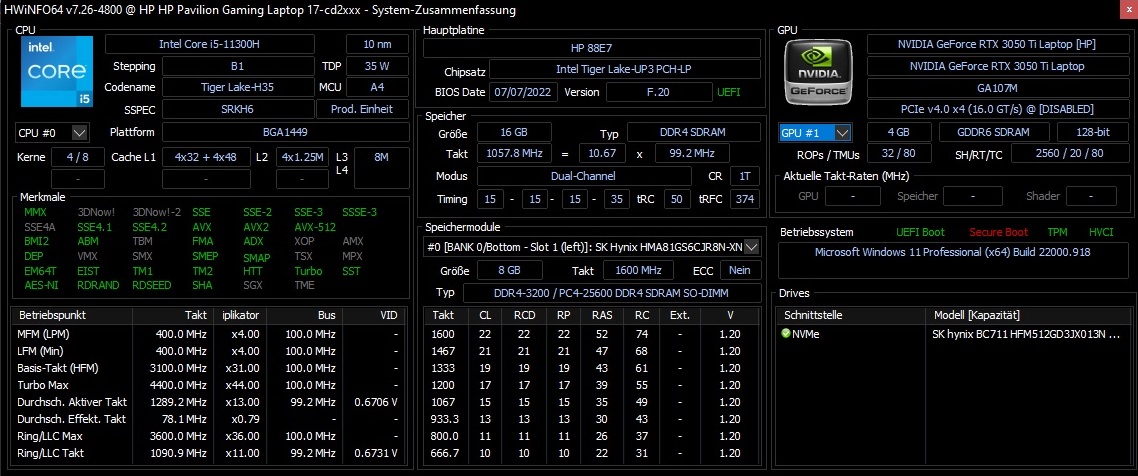
凭借四核CPU和4GB GPU,Pavilion Gaming 17被定位在中端市场。16GB的内存应该足够在未来几年使用。当安装了几个(大型)游戏时,SSD的情况可能会变得紧张。尽管如此,存储和内存可以毫无问题地进行交换。

测试条件
除了Windows自动安装的驱动程序和更新,我们只在设备上安装了Omen Gaming Hub。然而,在Pavilion Gaming 17的情况下,那里没有不同的性能模式可供选择,而其他笔记本电脑则通常如此。
处理器
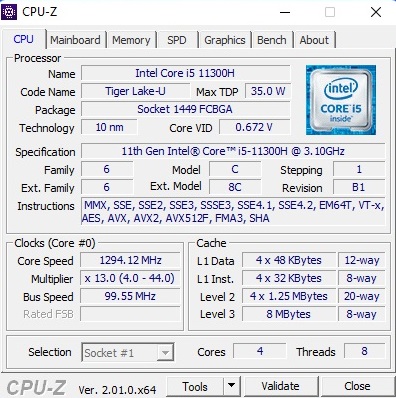
酷睿i5-11300H是一款强大的四核CPU,属于英特尔的Tiger-Lake一代,并不像过去那样全新。这款10纳米的芯片提供8MB的L3缓存,以及多达8个线程,可以通过超线程进行并行处理。该处理器在我们的基准测试过程中表现得没有任何问题。其性能与联想IdeaPad Gaming 3相似,后者也配备了i5-11300H。然而,当涉及到多核应用时,该CPU没有机会与旧的酷睿i7-9750H和Ryzen 5 5600H(各6个核心),尤其是。尽管如此,i5-11300H是一个良好的全能模型。
Cinebench R15 Multi endurance test
* ... smaller is better
AIDA64: FP32 Ray-Trace | FPU Julia | CPU SHA3 | CPU Queen | FPU SinJulia | FPU Mandel | CPU AES | CPU ZLib | FP64 Ray-Trace | CPU PhotoWorxx
| Performance rating | |
| Average of class Gaming | |
| HP Victus 16-e0145ng | |
| Lenovo Ideapad Gaming 3 15IHU-82K1002RGE | |
| Average Intel Core i5-11300H | |
| HP Pavilion Gaming 17-cd2146ng | |
| Dell G15 5510-43NHT | |
| AIDA64 / FP32 Ray-Trace | |
| Average of class Gaming (10227 - 85542, n=105, last 2 years) | |
| HP Victus 16-e0145ng | |
| Lenovo Ideapad Gaming 3 15IHU-82K1002RGE | |
| Average Intel Core i5-11300H (6128 - 8440, n=9) | |
| HP Pavilion Gaming 17-cd2146ng | |
| Dell G15 5510-43NHT | |
| AIDA64 / FPU Julia | |
| Average of class Gaming (51376 - 238426, n=105, last 2 years) | |
| HP Victus 16-e0145ng | |
| Lenovo Ideapad Gaming 3 15IHU-82K1002RGE | |
| Dell G15 5510-43NHT | |
| Average Intel Core i5-11300H (25739 - 33986, n=9) | |
| HP Pavilion Gaming 17-cd2146ng | |
| AIDA64 / CPU SHA3 | |
| Average of class Gaming (2180 - 10115, n=105, last 2 years) | |
| HP Victus 16-e0145ng | |
| Lenovo Ideapad Gaming 3 15IHU-82K1002RGE | |
| Average Intel Core i5-11300H (1773 - 2286, n=9) | |
| HP Pavilion Gaming 17-cd2146ng | |
| Dell G15 5510-43NHT | |
| AIDA64 / CPU Queen | |
| Average of class Gaming (49785 - 173351, n=90, last 2 years) | |
| HP Victus 16-e0145ng | |
| Lenovo Ideapad Gaming 3 15IHU-82K1002RGE | |
| Average Intel Core i5-11300H (41257 - 49312, n=9) | |
| Dell G15 5510-43NHT | |
| HP Pavilion Gaming 17-cd2146ng | |
| AIDA64 / FPU SinJulia | |
| Average of class Gaming (4424 - 33636, n=105, last 2 years) | |
| HP Victus 16-e0145ng | |
| Dell G15 5510-43NHT | |
| Lenovo Ideapad Gaming 3 15IHU-82K1002RGE | |
| Average Intel Core i5-11300H (3925 - 4677, n=9) | |
| HP Pavilion Gaming 17-cd2146ng | |
| AIDA64 / FPU Mandel | |
| Average of class Gaming (25115 - 128721, n=105, last 2 years) | |
| HP Victus 16-e0145ng | |
| Lenovo Ideapad Gaming 3 15IHU-82K1002RGE | |
| Average Intel Core i5-11300H (15820 - 20669, n=9) | |
| HP Pavilion Gaming 17-cd2146ng | |
| Dell G15 5510-43NHT | |
| AIDA64 / CPU AES | |
| Average of class Gaming (39258 - 247074, n=105, last 2 years) | |
| Lenovo Ideapad Gaming 3 15IHU-82K1002RGE | |
| Average Intel Core i5-11300H (37694 - 71519, n=9) | |
| HP Victus 16-e0145ng | |
| HP Pavilion Gaming 17-cd2146ng | |
| Dell G15 5510-43NHT | |
| AIDA64 / CPU ZLib | |
| Average of class Gaming (574 - 2531, n=105, last 2 years) | |
| HP Victus 16-e0145ng | |
| Lenovo Ideapad Gaming 3 15IHU-82K1002RGE | |
| Average Intel Core i5-11300H (269 - 390, n=9) | |
| Dell G15 5510-43NHT | |
| HP Pavilion Gaming 17-cd2146ng | |
| AIDA64 / FP64 Ray-Trace | |
| Average of class Gaming (5509 - 45446, n=105, last 2 years) | |
| HP Victus 16-e0145ng | |
| Lenovo Ideapad Gaming 3 15IHU-82K1002RGE | |
| Average Intel Core i5-11300H (3322 - 4613, n=9) | |
| HP Pavilion Gaming 17-cd2146ng | |
| Dell G15 5510-43NHT | |
| AIDA64 / CPU PhotoWorxx | |
| Average of class Gaming (12271 - 89891, n=105, last 2 years) | |
| HP Pavilion Gaming 17-cd2146ng | |
| Average Intel Core i5-11300H (9705 - 38002, n=9) | |
| HP Victus 16-e0145ng | |
| Lenovo Ideapad Gaming 3 15IHU-82K1002RGE | |
| Dell G15 5510-43NHT | |
系统性能
在系统性能方面,这台17英寸的笔记本电脑在竞争中处于舒适的地位。PCMark 10中的5442分是一个坚实的结果,对于估计的价格来说绝对够用。
CrossMark: Overall | Productivity | Creativity | Responsiveness
| PCMark 10 / Score | |
| Average of class Gaming (5828 - 12414, n=93, last 2 years) | |
| HP Victus 16-e0145ng | |
| Lenovo Ideapad Gaming 3 15IHU-82K1002RGE | |
| Average Intel Core i5-11300H, NVIDIA GeForce RTX 3050 Ti Laptop GPU (5442 - 5641, n=2) | |
| HP Pavilion Gaming 17-cd2146ng | |
| HP Pavilion Gaming 17-cd0085cl | |
| Dell G15 5510-43NHT | |
| PCMark 10 / Essentials | |
| Average of class Gaming (8810 - 11935, n=97, last 2 years) | |
| HP Victus 16-e0145ng | |
| HP Pavilion Gaming 17-cd0085cl | |
| HP Pavilion Gaming 17-cd2146ng | |
| Average Intel Core i5-11300H, NVIDIA GeForce RTX 3050 Ti Laptop GPU (8524 - 8829, n=2) | |
| Lenovo Ideapad Gaming 3 15IHU-82K1002RGE | |
| Dell G15 5510-43NHT | |
| PCMark 10 / Productivity | |
| Average of class Gaming (6845 - 25323, n=95, last 2 years) | |
| Lenovo Ideapad Gaming 3 15IHU-82K1002RGE | |
| Average Intel Core i5-11300H, NVIDIA GeForce RTX 3050 Ti Laptop GPU (7664 - 9112, n=2) | |
| HP Victus 16-e0145ng | |
| HP Pavilion Gaming 17-cd2146ng | |
| HP Pavilion Gaming 17-cd0085cl | |
| Dell G15 5510-43NHT | |
| PCMark 10 / Digital Content Creation | |
| Average of class Gaming (7602 - 19954, n=95, last 2 years) | |
| HP Victus 16-e0145ng | |
| HP Pavilion Gaming 17-cd0085cl | |
| HP Pavilion Gaming 17-cd2146ng | |
| Average Intel Core i5-11300H, NVIDIA GeForce RTX 3050 Ti Laptop GPU (6271 - 6462, n=2) | |
| Lenovo Ideapad Gaming 3 15IHU-82K1002RGE | |
| Dell G15 5510-43NHT | |
| CrossMark / Overall | |
| Average of class Gaming (1366 - 2409, n=94, last 2 years) | |
| Lenovo Ideapad Gaming 3 15IHU-82K1002RGE | |
| Average Intel Core i5-11300H, NVIDIA GeForce RTX 3050 Ti Laptop GPU (n=1) | |
| CrossMark / Productivity | |
| Average of class Gaming (1386 - 2254, n=94, last 2 years) | |
| Lenovo Ideapad Gaming 3 15IHU-82K1002RGE | |
| Average Intel Core i5-11300H, NVIDIA GeForce RTX 3050 Ti Laptop GPU (n=1) | |
| CrossMark / Creativity | |
| Average of class Gaming (1343 - 2786, n=94, last 2 years) | |
| Lenovo Ideapad Gaming 3 15IHU-82K1002RGE | |
| Average Intel Core i5-11300H, NVIDIA GeForce RTX 3050 Ti Laptop GPU (n=1) | |
| CrossMark / Responsiveness | |
| Average of class Gaming (1226 - 2334, n=94, last 2 years) | |
| Lenovo Ideapad Gaming 3 15IHU-82K1002RGE | |
| Average Intel Core i5-11300H, NVIDIA GeForce RTX 3050 Ti Laptop GPU (n=1) | |
| PCMark 10 Score | 5442 points | |
Help | ||
| AIDA64 / Memory Copy | |
| Average of class Gaming (21750 - 129946, n=105, last 2 years) | |
| HP Victus 16-e0145ng | |
| Average Intel Core i5-11300H (19947 - 60141, n=9) | |
| HP Pavilion Gaming 17-cd2146ng | |
| Lenovo Ideapad Gaming 3 15IHU-82K1002RGE | |
| Dell G15 5510-43NHT | |
| AIDA64 / Memory Read | |
| Average of class Gaming (22956 - 118858, n=105, last 2 years) | |
| HP Victus 16-e0145ng | |
| Average Intel Core i5-11300H (22688 - 62684, n=9) | |
| HP Pavilion Gaming 17-cd2146ng | |
| Lenovo Ideapad Gaming 3 15IHU-82K1002RGE | |
| Dell G15 5510-43NHT | |
| AIDA64 / Memory Write | |
| Average of class Gaming (22297 - 135096, n=105, last 2 years) | |
| HP Victus 16-e0145ng | |
| Average Intel Core i5-11300H (20959 - 65245, n=9) | |
| HP Pavilion Gaming 17-cd2146ng | |
| Lenovo Ideapad Gaming 3 15IHU-82K1002RGE | |
| Dell G15 5510-43NHT | |
| AIDA64 / Memory Latency | |
| Average of class Gaming (75.3 - 259, n=105, last 2 years) | |
| Lenovo Ideapad Gaming 3 15IHU-82K1002RGE | |
| HP Pavilion Gaming 17-cd2146ng | |
| Average Intel Core i5-11300H (76.3 - 93.6, n=9) | |
| HP Victus 16-e0145ng | |
| Dell G15 5510-43NHT | |
* ... smaller is better
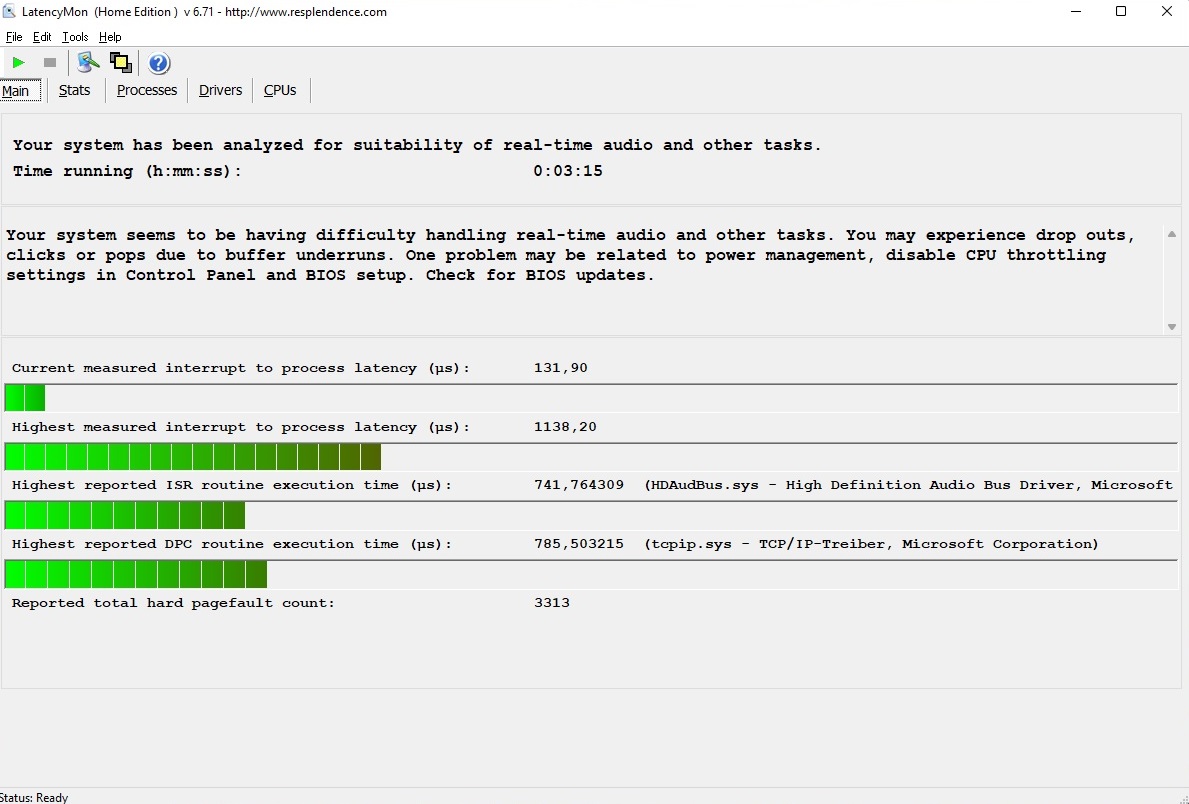
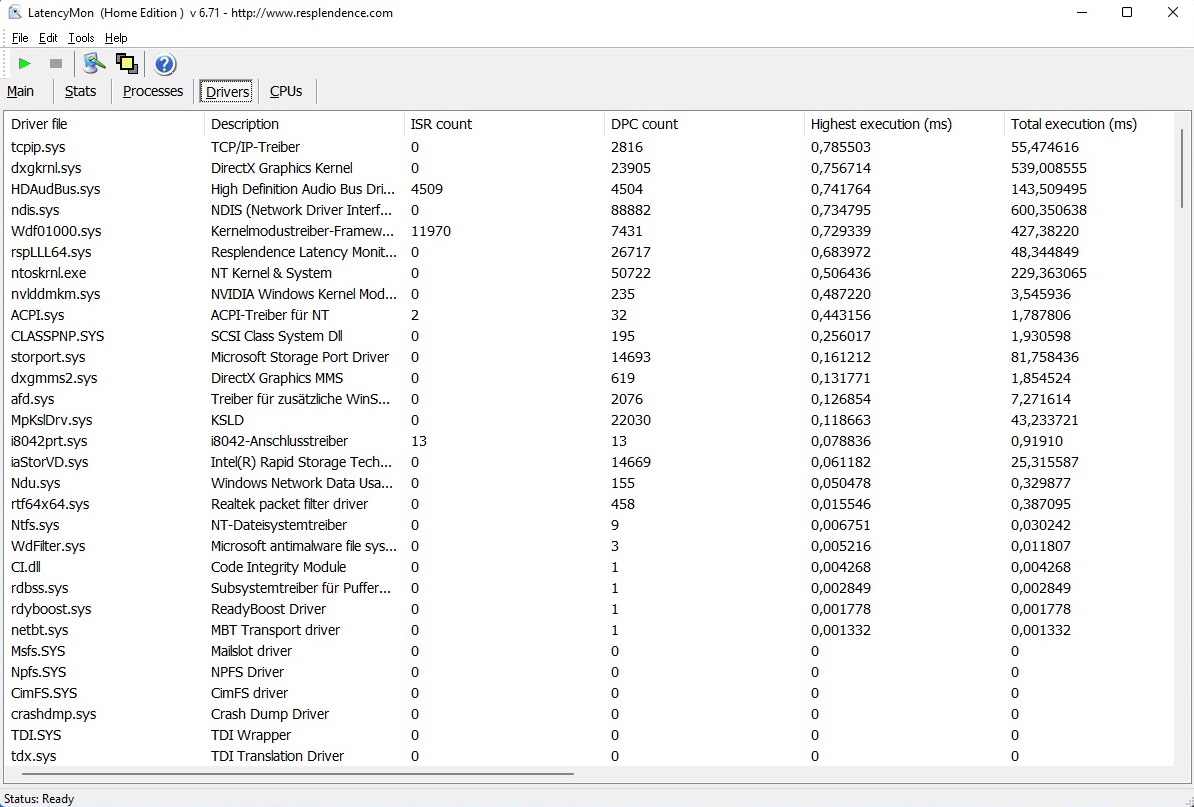
DPC延迟
谈到延迟时,情况并不完全理想。像许多其他笔记本电脑一样,根据LatencyMon工具,Pavilion Gaming 17并不特别适合实时音频和视频编辑。
| DPC Latencies / LatencyMon - interrupt to process latency (max), Web, Youtube, Prime95 | |
| Dell G15 5510-43NHT | |
| HP Pavilion Gaming 17-cd2146ng | |
| Lenovo Ideapad Gaming 3 15IHU-82K1002RGE | |
| HP Victus 16-e0145ng | |
* ... smaller is better
储存
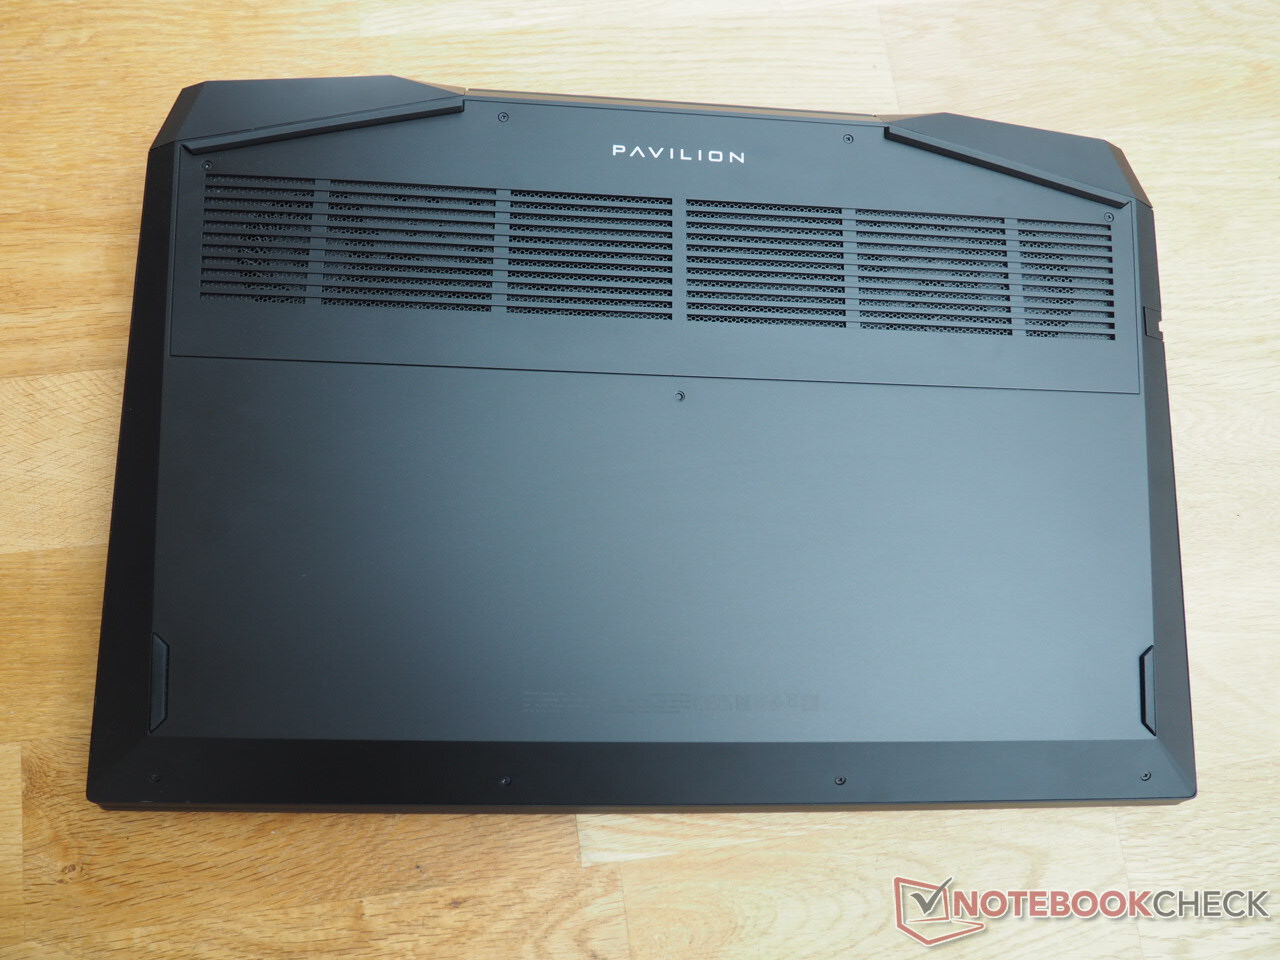
应该正面强调快速存储设备。惠普为我们的评测模型配备了SK海力士(BC711)的512GB PCIe驱动器(M.2 2280),其连续读写速度超过2500MB/s,这是只有惠普Victus 16才能达到的。恼人的是。不幸的是,现有的2.5英寸插槽,包含一个 "硬盘假人",由于没有集成合适的电缆,所以不能使用。

* ... smaller is better
Continuous load read: DiskSpd Read Loop, Queue Depth 8
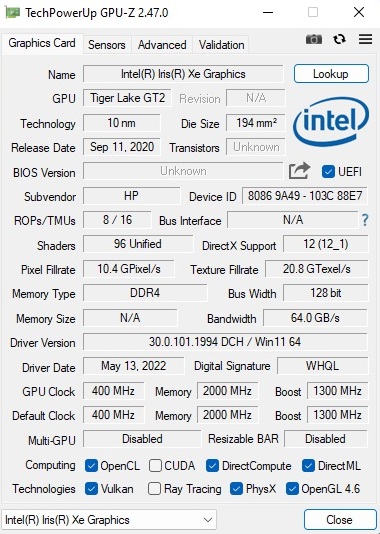
图形卡
来自Nvidia的GeForce RTX 3050 Ti是休闲玩家的理想显卡,他们不一定想以最大的细节玩每一个新的标题。这款8纳米模型基于最新的安培架构,配备了2560个着色器单元。Nvidia芯片的性能在很大程度上取决于指定的TGP,笔记本电脑制造商可以在一定范围内自由选择。在这种情况下,惠普选择了60瓦,这相当于RTX 3050 Ti的一个中等水平。尽管如此,与3050 Ti的平均水平相比,Pavilion Gaming 17在GPU电路方面的表现略好。
| 3DMark 11 Performance | 15245 points | |
| 3DMark Ice Storm Standard Score | 98555 points | |
| 3DMark Cloud Gate Standard Score | 26005 points | |
| 3DMark Fire Strike Score | 11649 points | |
| 3DMark Time Spy Score | 5155 points | |
Help | ||
游戏性能
| The Witcher 3 | |
| 1920x1080 High Graphics & Postprocessing (Nvidia HairWorks Off) | |
| Average of class Gaming (n=1last 2 years) | |
| HP Victus 16-e0145ng | |
| HP Pavilion Gaming 17-cd2146ng | |
| HP Pavilion Gaming 17-cd0085cl | |
| Lenovo Ideapad Gaming 3 15IHU-82K1002RGE | |
| Average NVIDIA GeForce RTX 3050 Ti Laptop GPU (30 - 110, n=26) | |
| Dell G15 5510-43NHT | |
| 1920x1080 Ultra Graphics & Postprocessing (HBAO+) | |
| Average of class Gaming (104.7 - 240, n=6, last 2 years) | |
| HP Victus 16-e0145ng | |
| Dell G15 5510-43NHT | |
| HP Pavilion Gaming 17-cd2146ng | |
| HP Pavilion Gaming 17-cd0085cl | |
| Average NVIDIA GeForce RTX 3050 Ti Laptop GPU (19 - 58.5, n=29) | |
| Lenovo Ideapad Gaming 3 15IHU-82K1002RGE | |
在我们的耐力测试中没有任何不正常的情况(一小时的 个小时)。 Witcher 3).在整个时间跨度内,帧率保持相当稳定。
The Witcher 3 FPS diagram
| low | med. | high | ultra | |
|---|---|---|---|---|
| GTA V (2015) | 156.1 | 119.9 | 66.9 | |
| The Witcher 3 (2015) | 170 | 94.4 | 51.4 | |
| Dota 2 Reborn (2015) | 119.7 | 108.5 | 104.8 | 100.7 |
| Final Fantasy XV Benchmark (2018) | 76 | 53.3 | ||
| X-Plane 11.11 (2018) | 87.5 | 75.3 | 64.3 | |
| Strange Brigade (2018) | 132.8 | 105.8 | 90.3 | |
| God of War (2022) | 60.7 | 48.6 | 30.6 | |
| Rainbow Six Extraction (2022) | 112 | 108 | 83 | |
| Dying Light 2 (2022) | 46.7 | 38.8 | ||
| Elden Ring (2022) | 55.4 | 53.8 | 52.7 | |
| Elex 2 (2022) | 52.2 | 50.9 | 46.1 | |
| F1 22 (2022) | 132 | 93 | 28 | |
| The Quarry (2022) | 63.1 | 51.5 | 39.7 |
排放
噪声排放
当看到上一代产品的酷睿i7-9750H和 GeForce GTX 1660 Ti Max-Q时,我们特别赞扬了较低的噪音发展。虽然新的Pavilion Gaming 17仍然是更安静的游戏笔记本之一,但17英寸的笔记本不再是真正的安静。在负载情况下,我们测得的是39至46分贝(A),而不是34至44分贝(A),这显然是可以听到的,但不令人讨厌。另一方面,尽管风扇从未完全关闭,但该设备在空闲状态下却非常安静,只有27至30分贝(A),令人愉快。然而,后者可以在BIOS中通过禁用 "始终打开 "选项来改变。这导致风扇在简单的任务中有时会被禁用。
Noise level
| Idle |
| 27 / 28 / 30 dB(A) |
| Load |
| 39 / 46 dB(A) |
 | ||
30 dB silent 40 dB(A) audible 50 dB(A) loud |
||
min: | ||
| HP Pavilion Gaming 17-cd2146ng i5-11300H, GeForce RTX 3050 Ti Laptop GPU | Dell G15 5510-43NHT i5-10200H, GeForce RTX 3050 Ti Laptop GPU | Lenovo Ideapad Gaming 3 15IHU-82K1002RGE i5-11300H, GeForce RTX 3050 Ti Laptop GPU | HP Victus 16-e0145ng R5 5600H, GeForce RTX 3050 Ti Laptop GPU | HP Pavilion Gaming 17-cd0085cl i7-9750H, GeForce GTX 1660 Ti Max-Q | |
|---|---|---|---|---|---|
| Noise | -2% | 1% | -7% | 1% | |
| off / environment * (dB) | 25 | 25 -0% | 23.9 4% | 26 -4% | 28.2 -13% |
| Idle Minimum * (dB) | 27 | 25 7% | 23.9 11% | 26 4% | 30.1 -11% |
| Idle Average * (dB) | 28 | 25 11% | 26.8 4% | 28 -0% | 30.1 -8% |
| Idle Maximum * (dB) | 30 | 25 17% | 26.8 11% | 34 -13% | 30.1 -0% |
| Load Average * (dB) | 39 | 52.2 -34% | 43.5 -12% | 44 -13% | 34.2 12% |
| Witcher 3 ultra * (dB) | 44 | 43.5 1% | 48 -9% | 34.2 22% | |
| Load Maximum * (dB) | 46 | 52.2 -13% | 53.1 -15% | 53 -15% | 43.8 5% |
* ... smaller is better
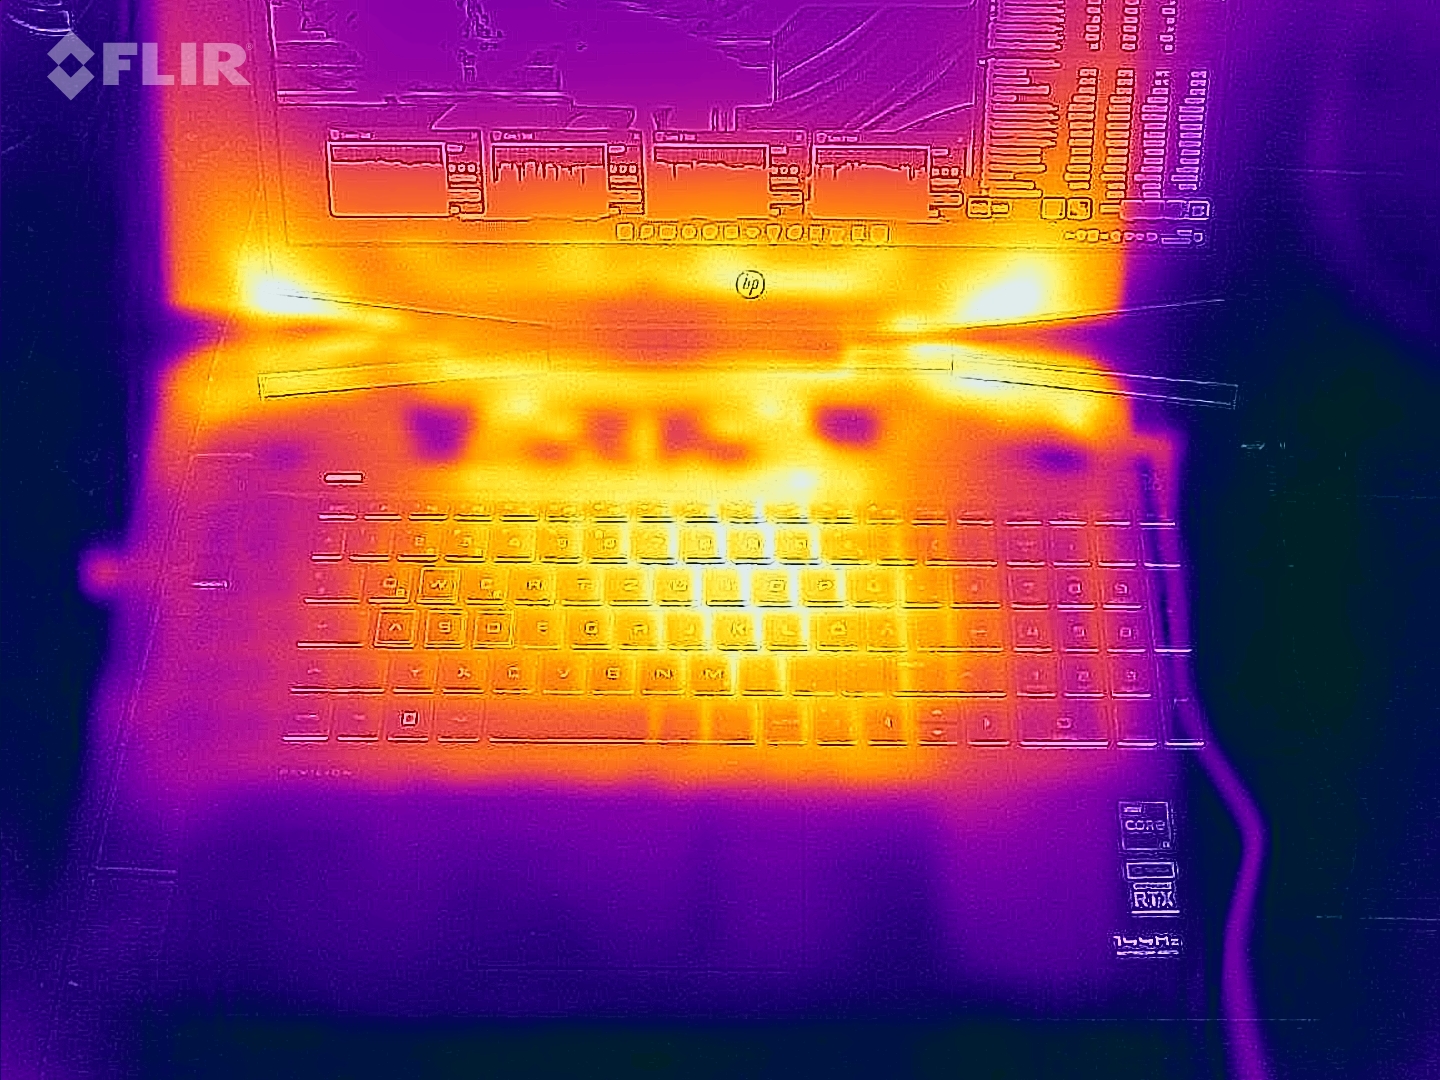
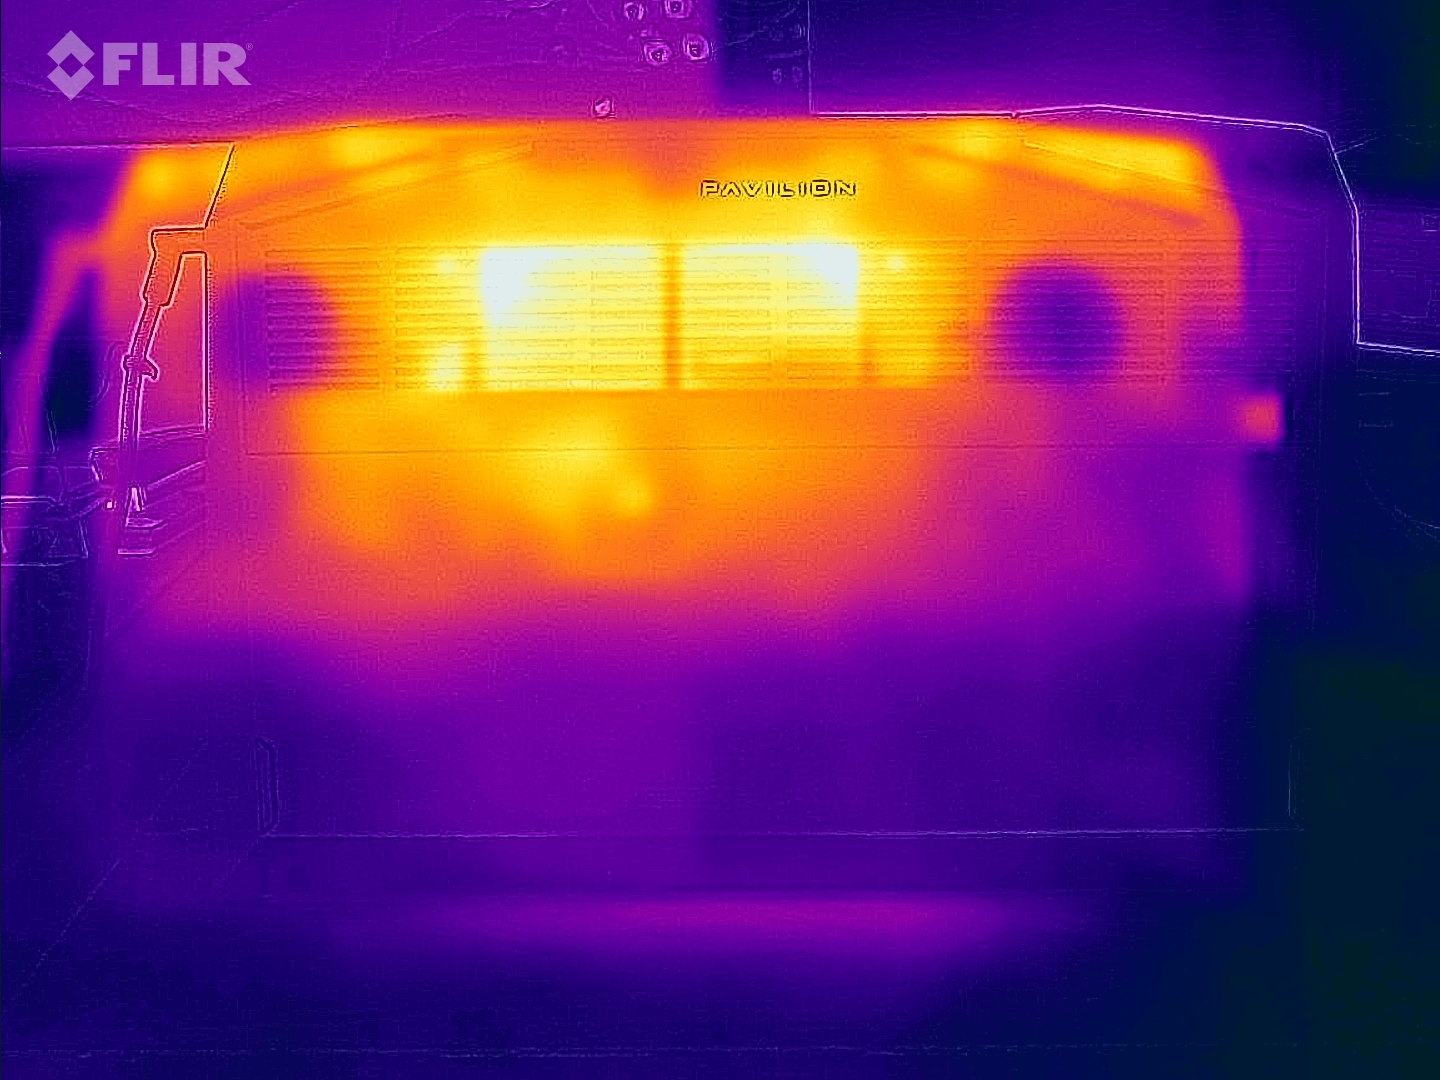
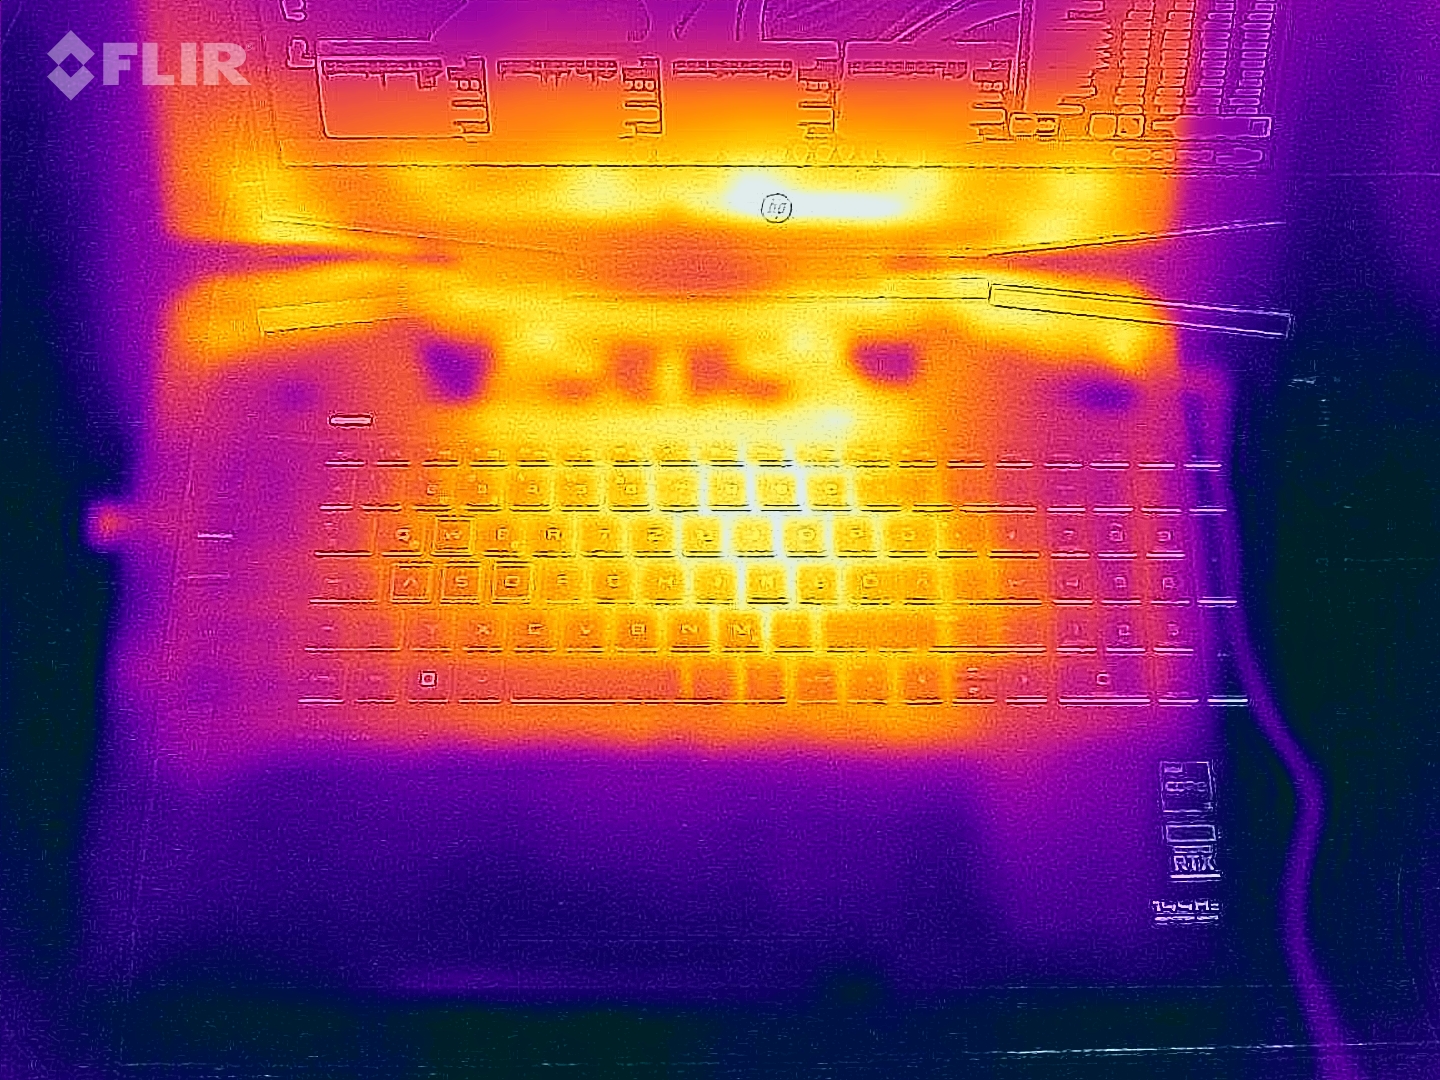
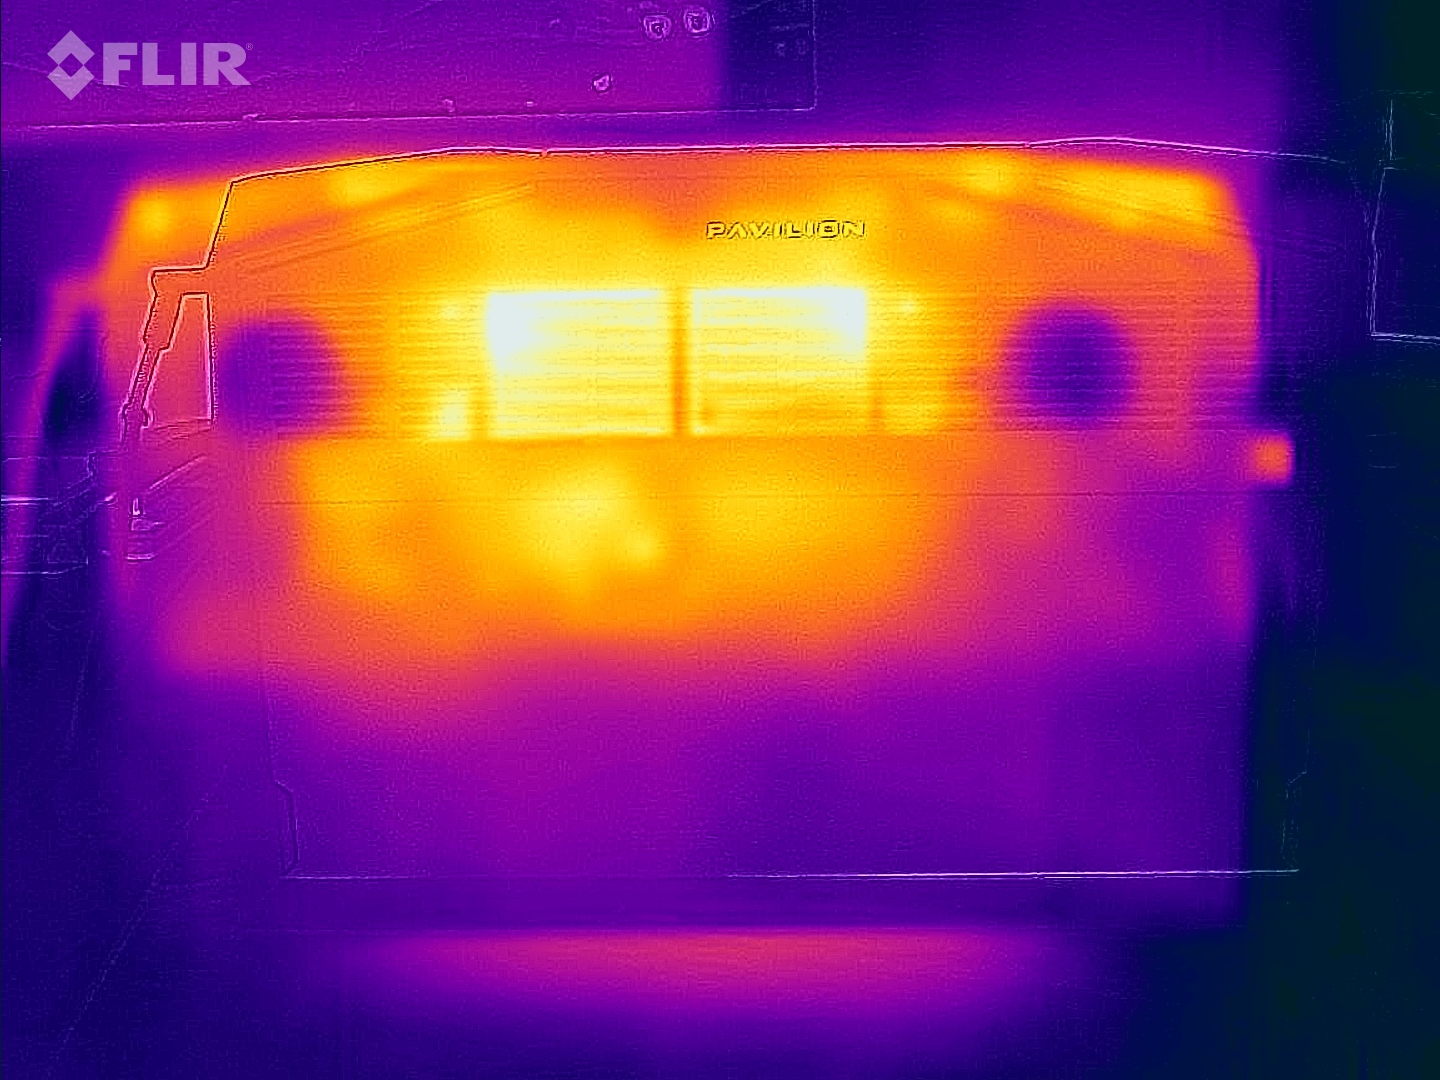
温度
Pavilion Gaming 17的热量发展也没有显示出任何异常。使用FurMark和Prime95工具进行60分钟的压力测试后,顶部最高温度为44°C(约111°F),底部最高温度为48°C(约115°F),这对内置硬件来说是典型的。在空闲使用时,整个机箱保持在30°C(~86°F)以下,这使得它的温度令人愉快。
(±) The maximum temperature on the upper side is 44 °C / 111 F, compared to the average of 40.4 °C / 105 F, ranging from 21.2 to 68.8 °C for the class Gaming.
(-) The bottom heats up to a maximum of 48 °C / 118 F, compared to the average of 43.2 °C / 110 F
(+) In idle usage, the average temperature for the upper side is 26.6 °C / 80 F, compared to the device average of 33.9 °C / 93 F.
(±) Playing The Witcher 3, the average temperature for the upper side is 36.2 °C / 97 F, compared to the device average of 33.9 °C / 93 F.
(+) The palmrests and touchpad are reaching skin temperature as a maximum (34 °C / 93.2 F) and are therefore not hot.
(-) The average temperature of the palmrest area of similar devices was 28.8 °C / 83.8 F (-5.2 °C / -9.4 F).
| HP Pavilion Gaming 17-cd2146ng i5-11300H, GeForce RTX 3050 Ti Laptop GPU | Dell G15 5510-43NHT i5-10200H, GeForce RTX 3050 Ti Laptop GPU | Lenovo Ideapad Gaming 3 15IHU-82K1002RGE i5-11300H, GeForce RTX 3050 Ti Laptop GPU | HP Victus 16-e0145ng R5 5600H, GeForce RTX 3050 Ti Laptop GPU | HP Pavilion Gaming 17-cd0085cl i7-9750H, GeForce GTX 1660 Ti Max-Q | |
|---|---|---|---|---|---|
| Heat | -9% | 3% | -22% | -18% | |
| Maximum Upper Side * (°C) | 44 | 45.9 -4% | 43.2 2% | 54 -23% | 42.6 3% |
| Maximum Bottom * (°C) | 48 | 51.9 -8% | 47.9 -0% | 47 2% | 49 -2% |
| Idle Upper Side * (°C) | 27 | 30.1 -11% | 24.9 8% | 41 -52% | 34 -26% |
| Idle Bottom * (°C) | 27 | 30.1 -11% | 27 -0% | 31 -15% | 39.4 -46% |
* ... smaller is better
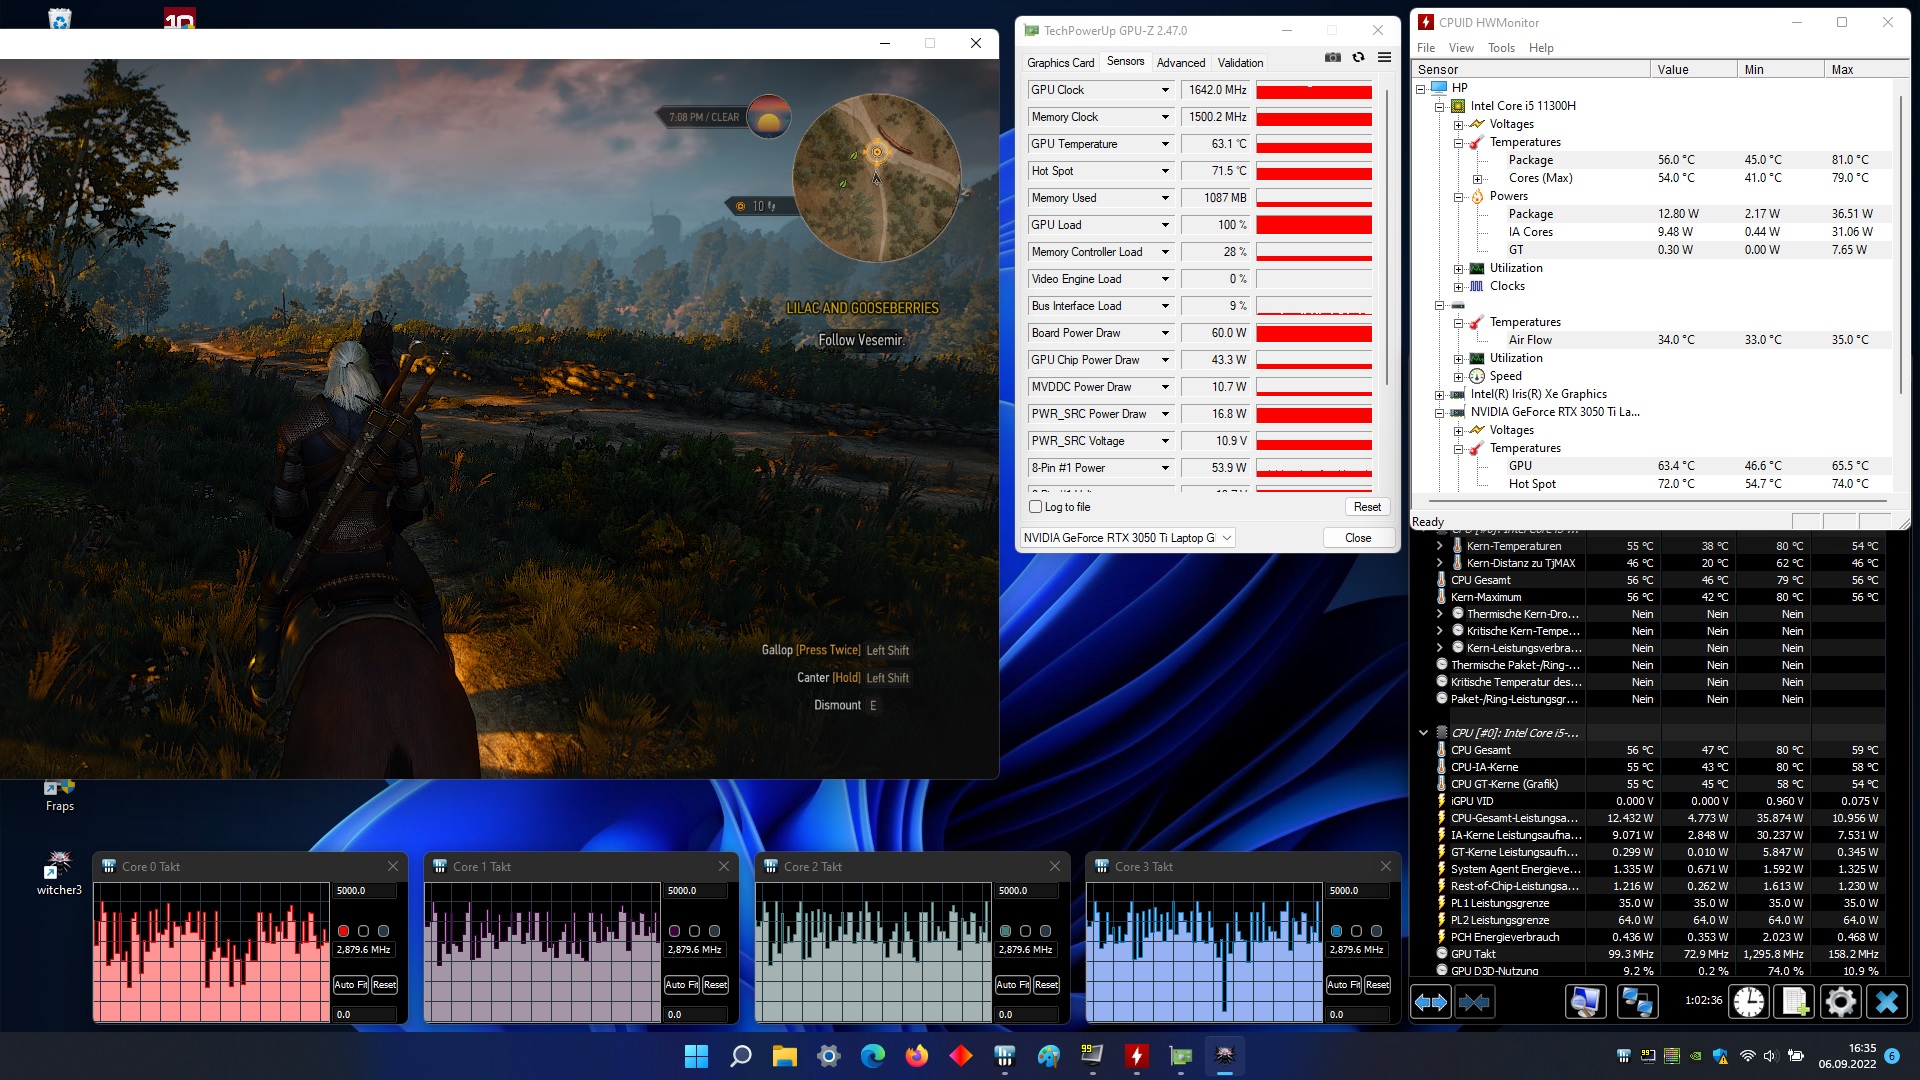
压力测试
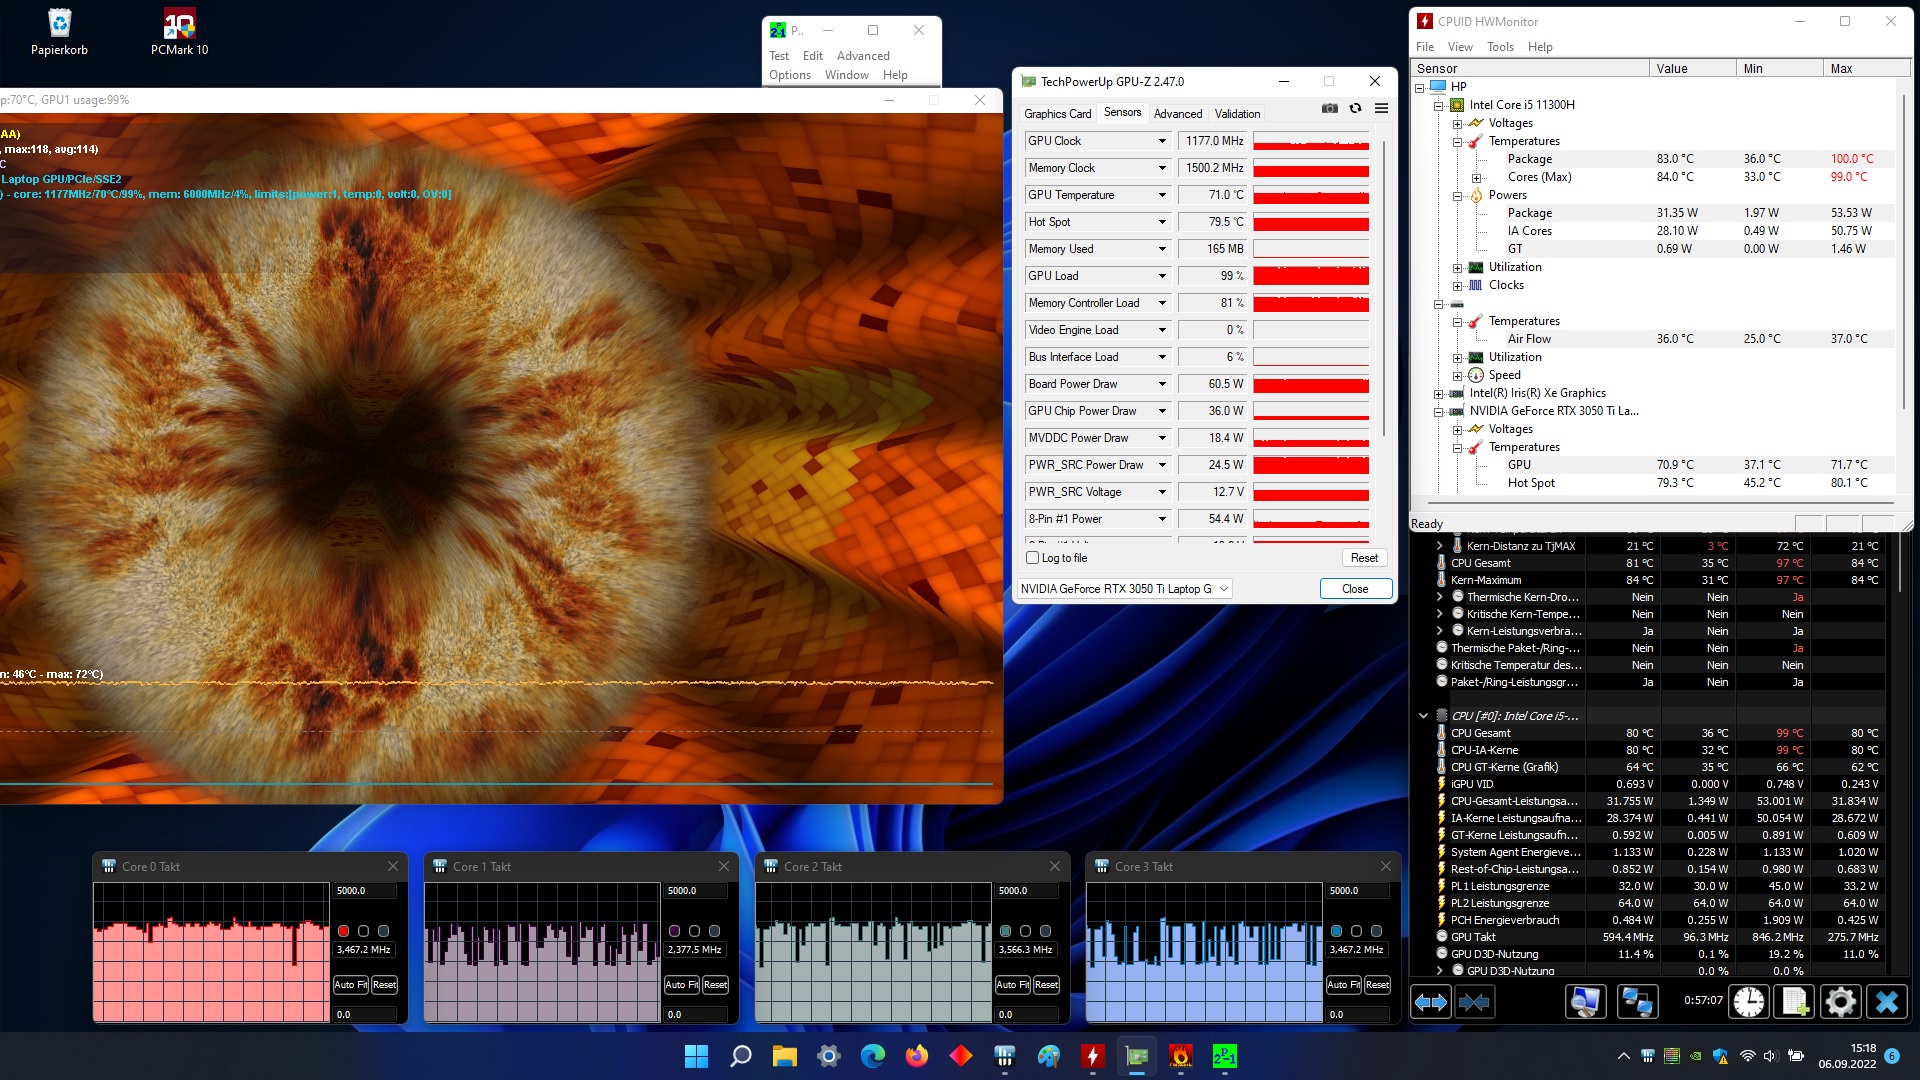
这些组件也没有过热的问题。尽管酷睿i5-11300H在满负荷状态下短暂达到100°C(约212°F)(根据HWMonitor工具),但过了一会儿,温度就稳定在可接受的83°C(约181°F)(在一个合适的时钟速率下)。GeForce RTX 3050 Ti的平均温度达到71 °C(约160 °F),这也是一个可接受的无害值。
发言人
HP Pavilion Gaming 17-cd2146ng audio analysis
(±) | speaker loudness is average but good (80 dB)
Bass 100 - 315 Hz
(-) | nearly no bass - on average 19.5% lower than median
(±) | linearity of bass is average (11.5% delta to prev. frequency)
Mids 400 - 2000 Hz
(+) | balanced mids - only 3.2% away from median
(+) | mids are linear (3.8% delta to prev. frequency)
Highs 2 - 16 kHz
(±) | higher highs - on average 8.6% higher than median
(±) | linearity of highs is average (8% delta to prev. frequency)
Overall 100 - 16.000 Hz
(±) | linearity of overall sound is average (20.5% difference to median)
Compared to same class
» 73% of all tested devices in this class were better, 5% similar, 22% worse
» The best had a delta of 6%, average was 18%, worst was 132%
Compared to all devices tested
» 54% of all tested devices were better, 8% similar, 38% worse
» The best had a delta of 4%, average was 23%, worst was 134%
HP Victus 16-e0145ng audio analysis
(±) | speaker loudness is average but good (79 dB)
Bass 100 - 315 Hz
(-) | nearly no bass - on average 21% lower than median
(±) | linearity of bass is average (12.6% delta to prev. frequency)
Mids 400 - 2000 Hz
(+) | balanced mids - only 1.1% away from median
(+) | mids are linear (3.6% delta to prev. frequency)
Highs 2 - 16 kHz
(+) | balanced highs - only 4.2% away from median
(+) | highs are linear (5.3% delta to prev. frequency)
Overall 100 - 16.000 Hz
(±) | linearity of overall sound is average (16.2% difference to median)
Compared to same class
» 40% of all tested devices in this class were better, 7% similar, 53% worse
» The best had a delta of 6%, average was 18%, worst was 132%
Compared to all devices tested
» 26% of all tested devices were better, 6% similar, 68% worse
» The best had a delta of 4%, average was 23%, worst was 134%
能源管理
| Off / Standby | |
| Idle | |
| Load |
|
Key:
min: | |
| HP Pavilion Gaming 17-cd2146ng i5-11300H, GeForce RTX 3050 Ti Laptop GPU | Dell G15 5510-43NHT i5-10200H, GeForce RTX 3050 Ti Laptop GPU | Lenovo Ideapad Gaming 3 15IHU-82K1002RGE i5-11300H, GeForce RTX 3050 Ti Laptop GPU | HP Victus 16-e0145ng R5 5600H, GeForce RTX 3050 Ti Laptop GPU | HP Pavilion Gaming 17-cd0085cl i7-9750H, GeForce GTX 1660 Ti Max-Q | Average of class Gaming | |
|---|---|---|---|---|---|---|
| Power Consumption | -13% | -4% | -28% | -12% | -110% | |
| Idle Minimum * (Watt) | 3 | 4.6 -53% | 4.9 -63% | 7 -133% | 5.4 -80% | 13 ? -333% |
| Idle Average * (Watt) | 8 | 6.5 19% | 8.3 -4% | 9 -13% | 9.2 -15% | 18.7 ? -134% |
| Idle Maximum * (Watt) | 28 | 10.1 64% | 8.9 68% | 15 46% | 13 54% | 24.3 ? 13% |
| Load Average * (Watt) | 88 | 129 -47% | 81 8% | 93 -6% | 85.9 2% | 110.2 ? -25% |
| Witcher 3 ultra * (Watt) | 98.2 | 129 -31% | 119 -21% | 134.5 -37% | 107.9 -10% | |
| Load Maximum * (Watt) | 152 | 195 -28% | 172 -13% | 185 -22% | 182.2 -20% | 258 ? -70% |
* ... smaller is better
Energy consumption during The Witcher 3 / stress test
Energy consumption with an external monitor
电池寿命
我们不完全理解惠普决定安装一个2.5英寸的插槽而不是一个更大的电池。 52.5瓦特是相当温和的,这在电池运行时间上也变得很明显。在中等亮度下,通过Wi-Fi浏览互联网仅有不到5小时,这在今天已不再是一个值得庆祝的理由。竞争对手在这里略微领先。
| HP Pavilion Gaming 17-cd2146ng i5-11300H, GeForce RTX 3050 Ti Laptop GPU, 52.5 Wh | Dell G15 5510-43NHT i5-10200H, GeForce RTX 3050 Ti Laptop GPU, 56 Wh | Lenovo Ideapad Gaming 3 15IHU-82K1002RGE i5-11300H, GeForce RTX 3050 Ti Laptop GPU, 45 Wh | HP Victus 16-e0145ng R5 5600H, GeForce RTX 3050 Ti Laptop GPU, 70 Wh | HP Pavilion Gaming 17-cd0085cl i7-9750H, GeForce GTX 1660 Ti Max-Q, 52.5 Wh | Average of class Gaming | |
|---|---|---|---|---|---|---|
| Battery runtime | 26% | 32% | 42% | 14% | 42% | |
| WiFi v1.3 (h) | 5 | 6.3 26% | 6.6 32% | 7.1 42% | 5.7 14% | 7.11 ? 42% |
| H.264 (h) | 8.6 | 7.7 | 8.64 ? | |||
| Load (h) | 1.1 | 1.1 | 1 | 1.502 ? | ||
| Reader / Idle (h) | 11.6 | 8.71 ? |
Pros
Cons
判决书
惠普为游戏提供了一个良好的预算笔记本电脑,Pavilion Gaming 17-cd2146ng。
与大多数竞争对手不同的是,这款17英寸的笔记本电脑有一个令人惊讶的好显示屏,不缺乏对比度和色彩空间。亮度和响应时间也相对较好。
这款17英寸的笔记本在其他类别中并没有正面或负面的突出表现--不管是输入设备、外壳、端口、排放还是声音质量。
因此,购买Pavilion Gaming 17,你几乎不会出错。低于1,000欧元(约1,002美元),该设备对于注重价格的游戏玩家来说是一个非常有吸引力和值得推荐的选择。
价格和可用性
在撰写本文时,我们的审查配置似乎没有在美国上市。尽管如此,你可以关注一下 亚马逊并看看该设备是否在这里出现。
HP Pavilion Gaming 17-cd2146ng
- 09/10/2022 v7 (old)
Florian Glaser
Price comparison

