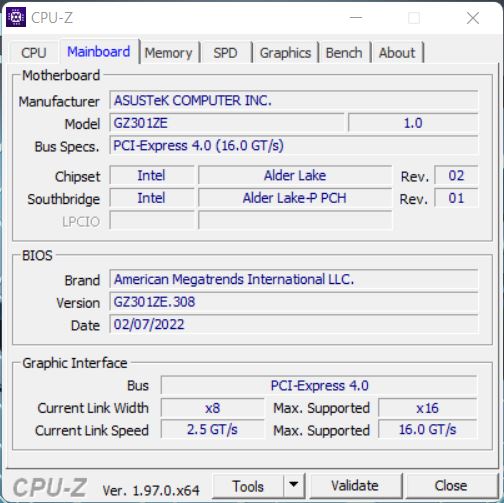
华硕ROG Flow Z13的评论。配备强大的Alder Lake i9处理器的游戏平板电脑
华硕称新的ROG Flow Z13是市场上最强大的游戏平板电脑,看一下规格表绝对支持这一说法。我们的评测样品配备了一个全新的英特尔 Alder Lake Core i9 CPU,一个专用的Nvidia GeForce RTX 3050 Ti,以及16GB的LPDDR5-5200内存。为了能够合理利用组件的性能,制造商在处理器上实施了蒸气室冷却以及液态金属,以改善热传导。此外,还有一个13.4英寸的16:10显示屏,分辨率为1,920x1,200像素,刷新率为120赫兹,以及G-Sync。
可选的是,还有其他配备较弱的i7或i5 CPU的机型,以及普通的RTX 3050,甚至只有Alder Lake处理器的集成Xe图形。如果你不想在旅途中玩游戏,但想使用外部的iGPU,这种配置肯定会很有趣。XG移动电子GPU(NvidiaGeForce RTX 3080或AMD Radeon RX 6850M XT)在家里。我们的测试配置大约为2100欧元(约2367美元)。ROG Flow Z13的直接竞争对手并不多,这就是为什么我们也采用具有类似组件的普通笔记本电脑作为对比设备。
潜在的竞争对手比较
Rating | Date | Model | Weight | Height | Size | Resolution | Price |
|---|---|---|---|---|---|---|---|
| 86.8 % v7 (old) | 03 / 2022 | Asus ROG Flow Z13 GZ301ZE i9-12900H, GeForce RTX 3050 Ti Laptop GPU | 1.2 kg | 12 mm | 13.40" | 1920x1200 | |
| 87.7 % v7 (old) | 01 / 2022 | Schenker Vision 14 i7-11370H, GeForce RTX 3050 Ti Laptop GPU | 1.1 kg | 15.6 mm | 14.00" | 2880x1800 | |
| 82.7 % v7 (old) | 10 / 2021 | Asus Zephyrus G14 GA401QEC R9 5900HS, GeForce RTX 3050 Ti Laptop GPU | 1.7 kg | 19.9 mm | 14.00" | 2560x1440 | |
| 89.1 % v7 (old) | 11 / 2021 | Microsoft Surface Pro 8, i7-1185G7 i7-1185G7, Iris Xe G7 96EUs | 891 g | 8.5 mm | 13.00" | 2880x1920 | |
| 87.5 % v7 (old) | 07 / 2021 | Razer Blade 14 Ryzen 9 RTX 3070 R9 5900HX, GeForce RTX 3070 Laptop GPU | 1.8 kg | 16.8 mm | 14.00" | 2560x1440 | |
| 84.7 % v7 (old) | 02 / 2021 | Asus ROG Flow X13 GV301QH R9 5980HS, GeForce GTX 1650 Max-Q | 1.4 kg | 15.8 mm | 13.40" | 3840x2400 |
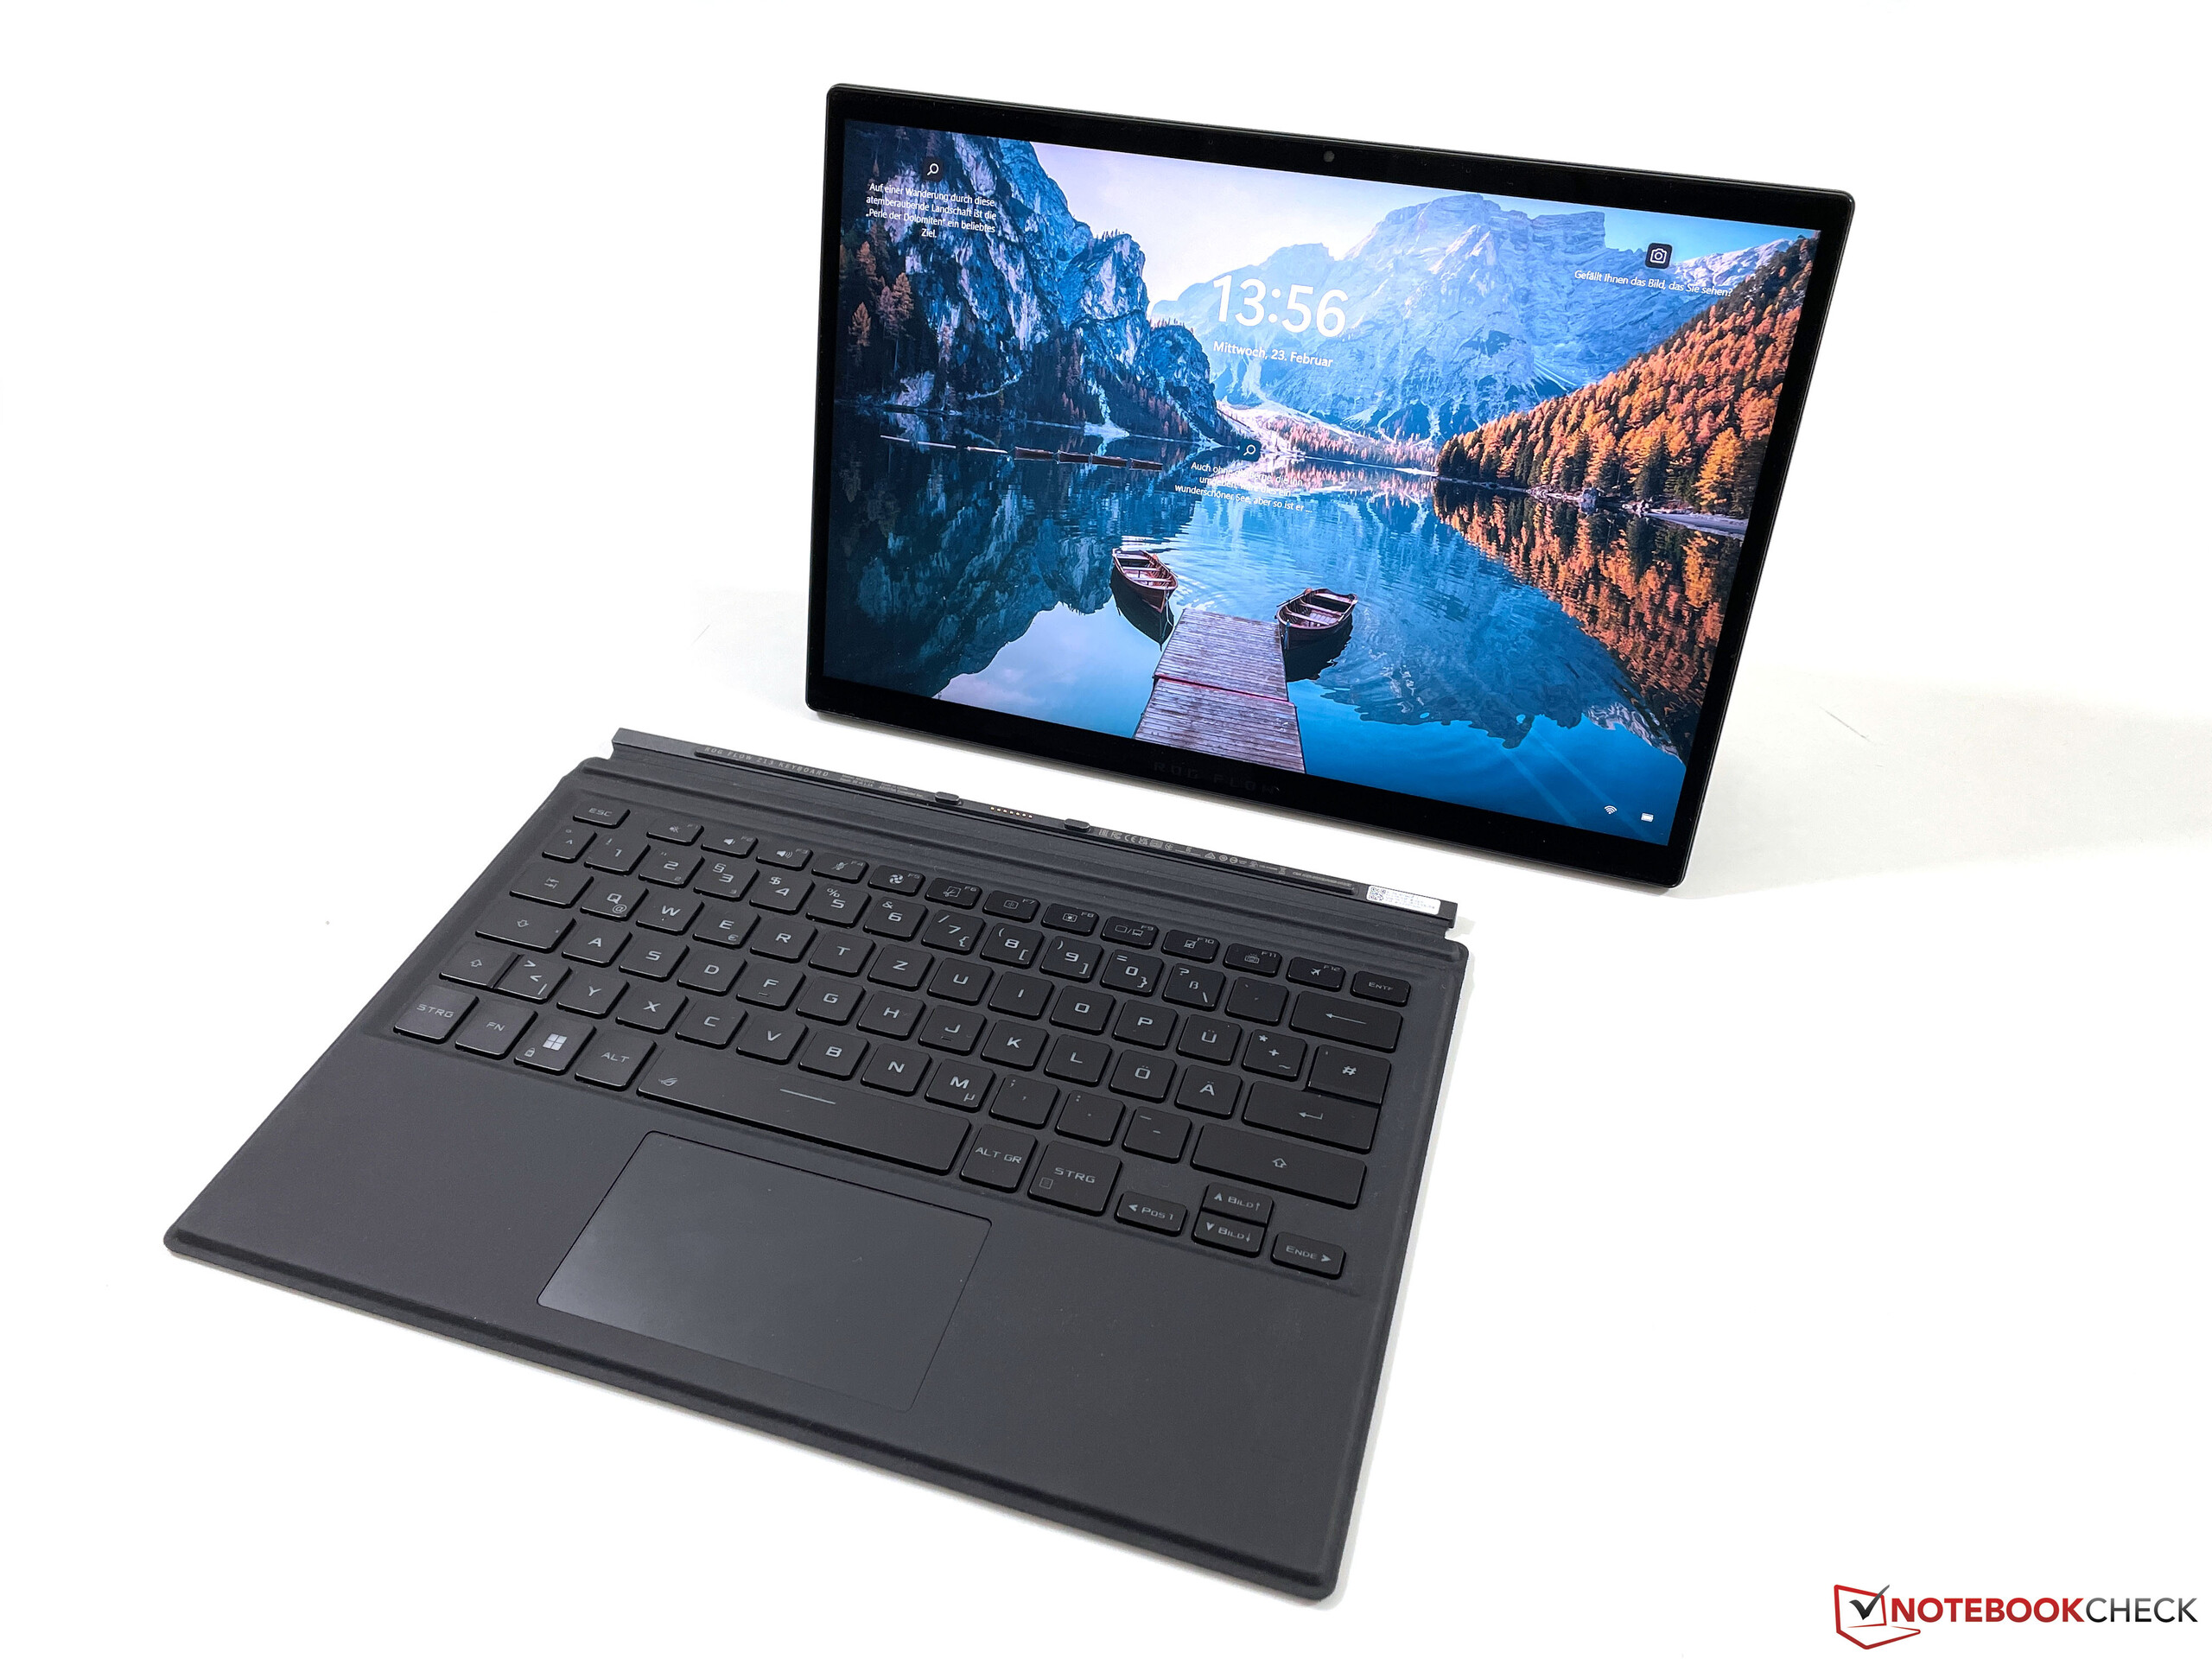
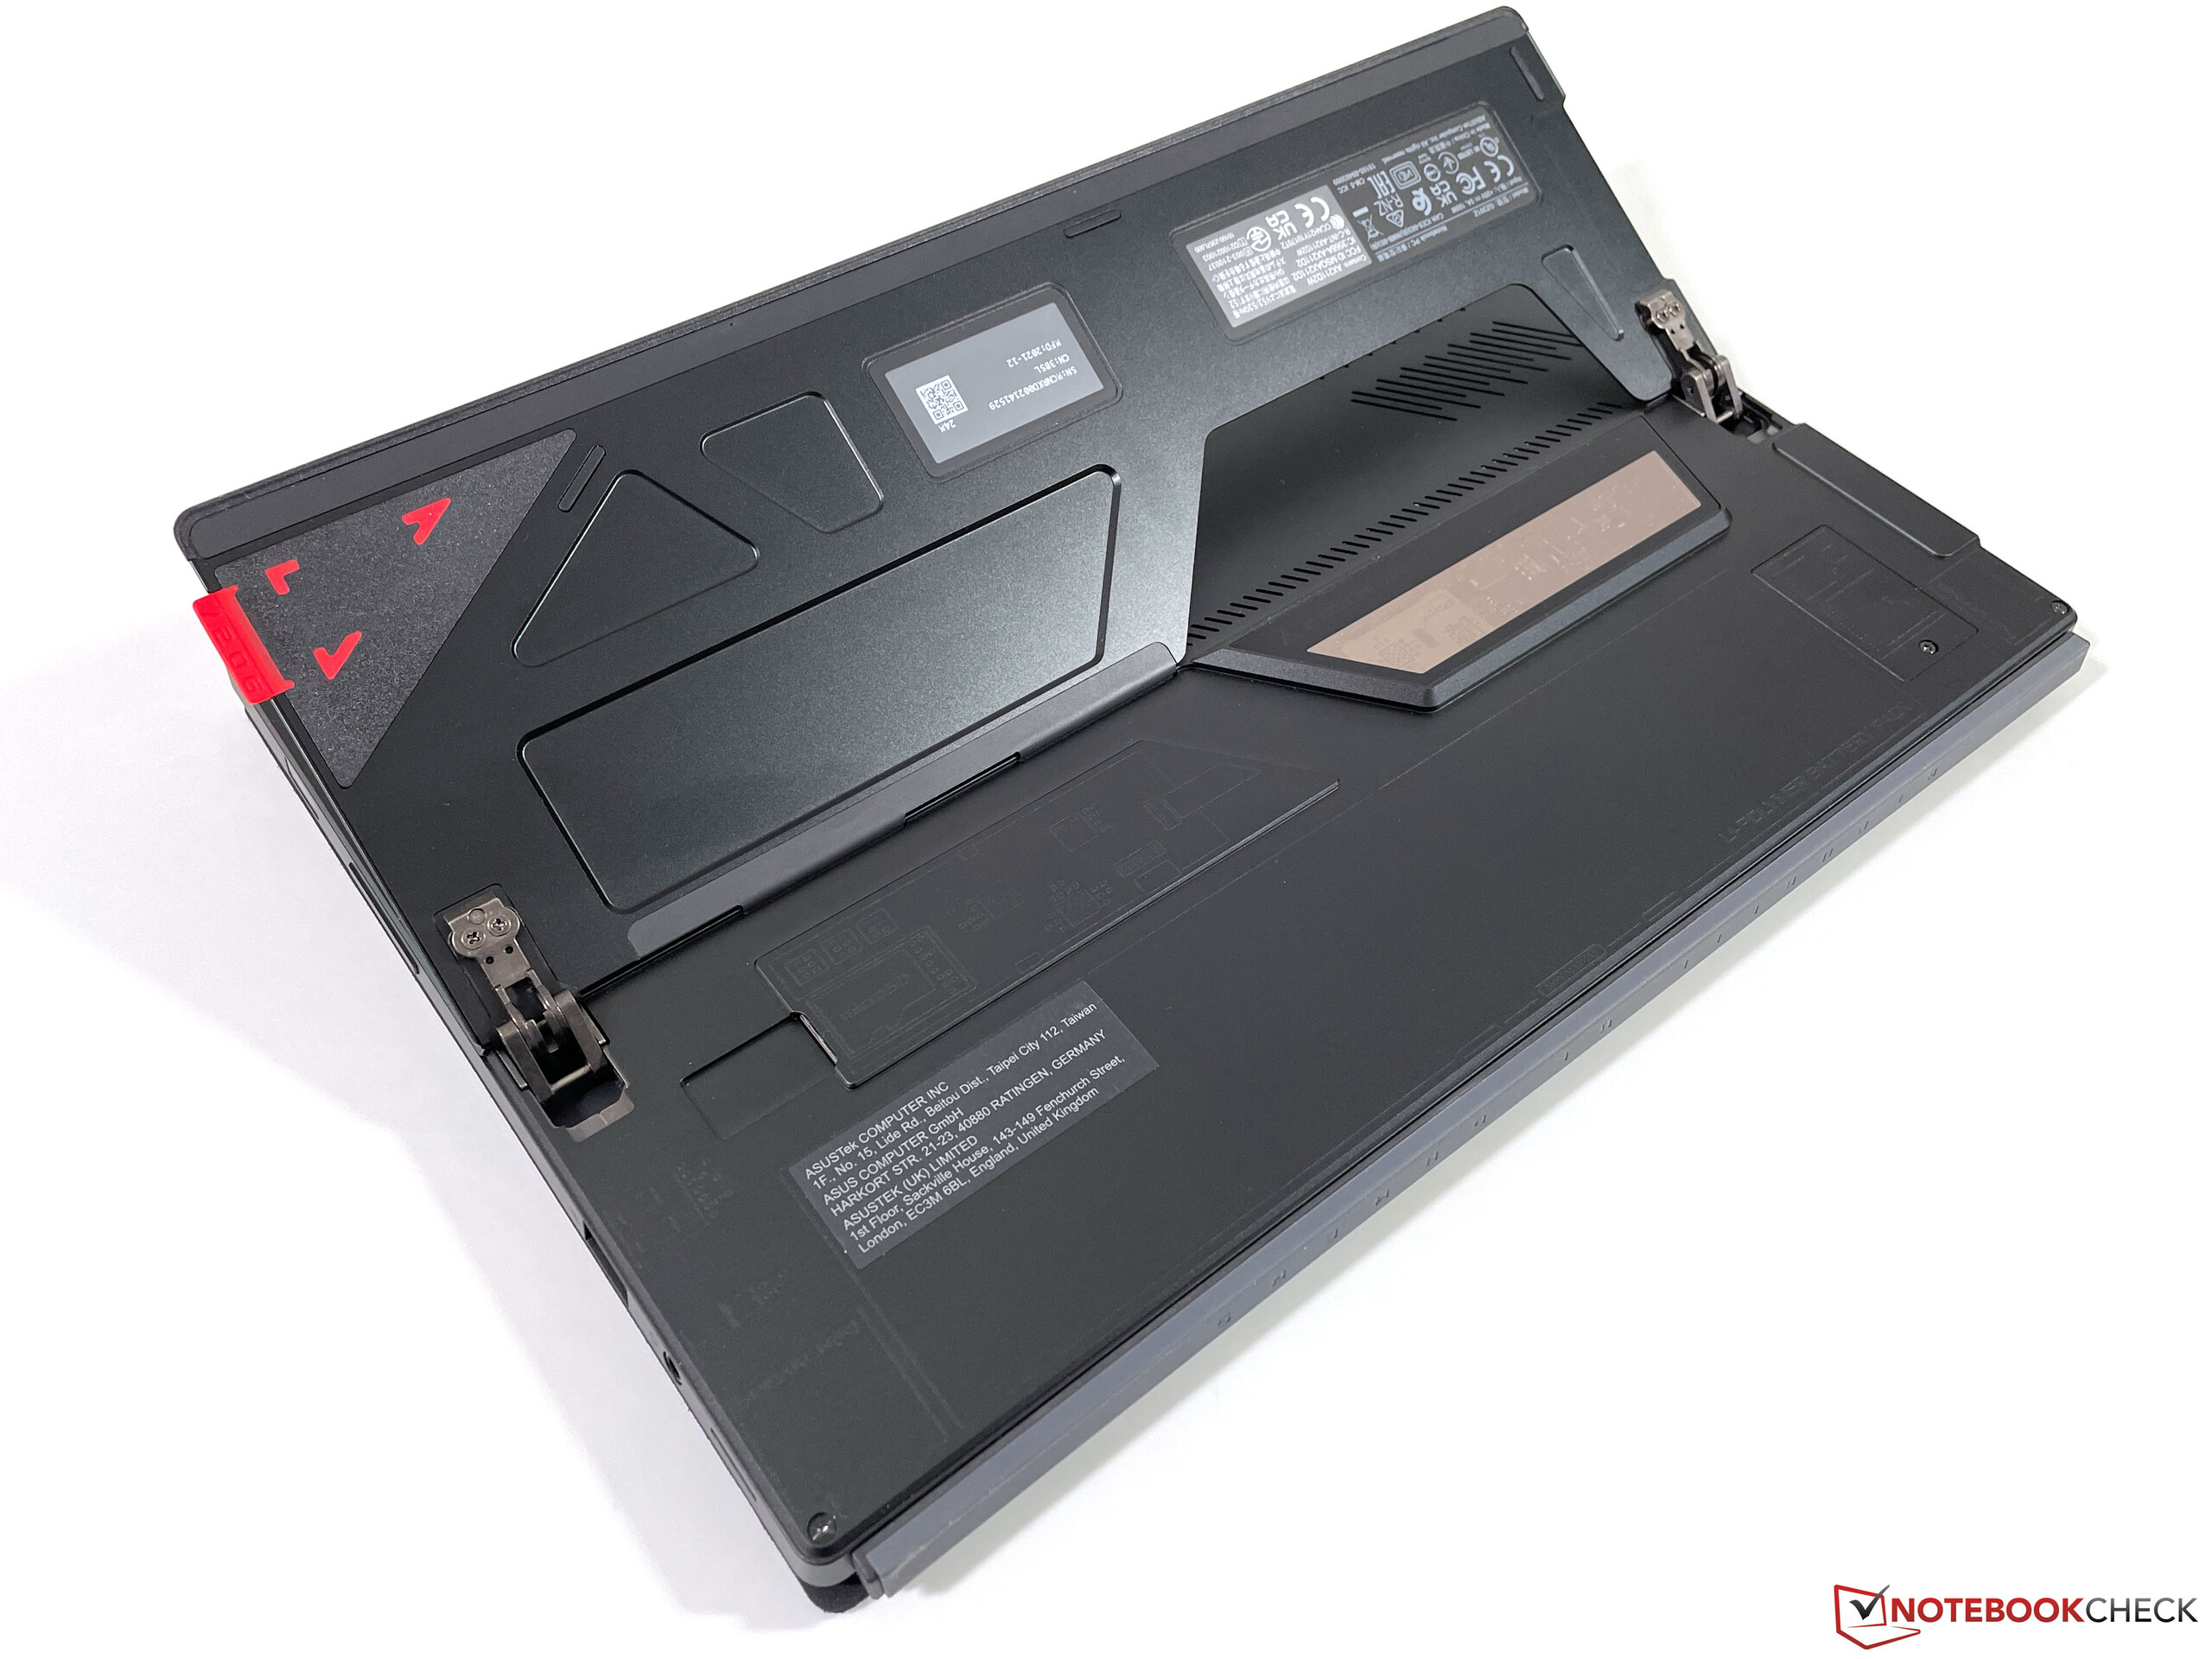
案例--一个被抽空的Surface Pro
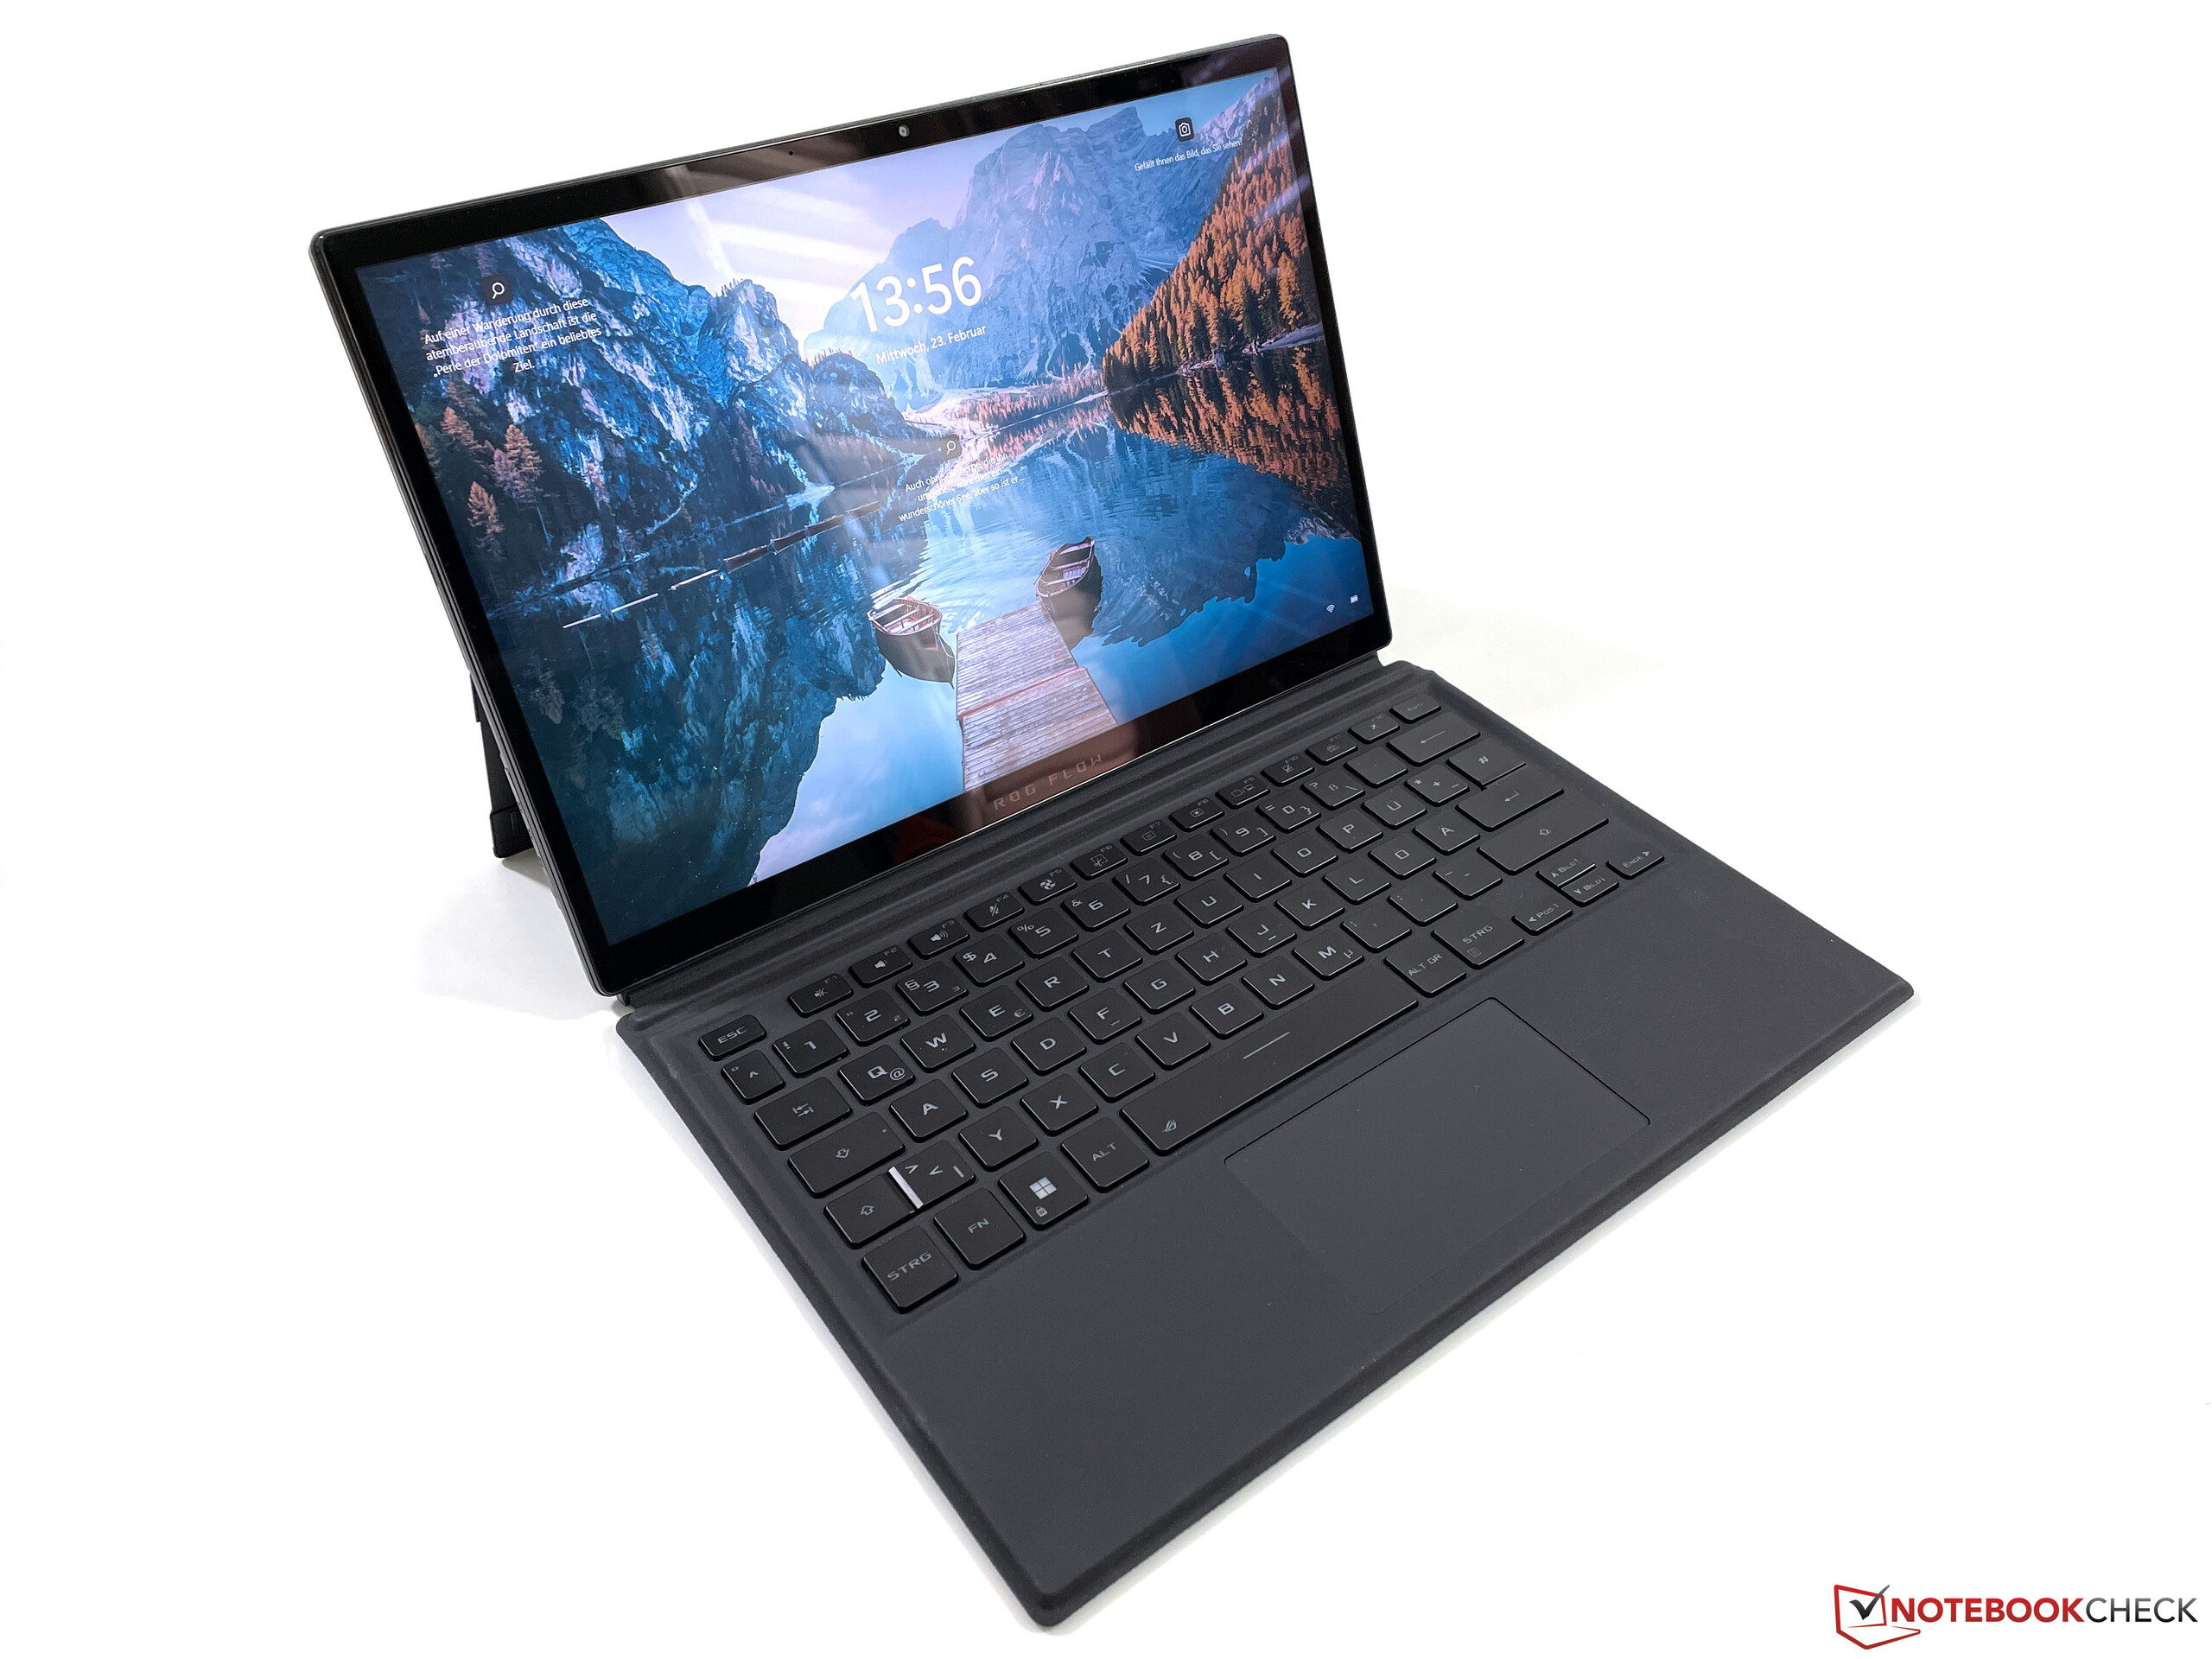
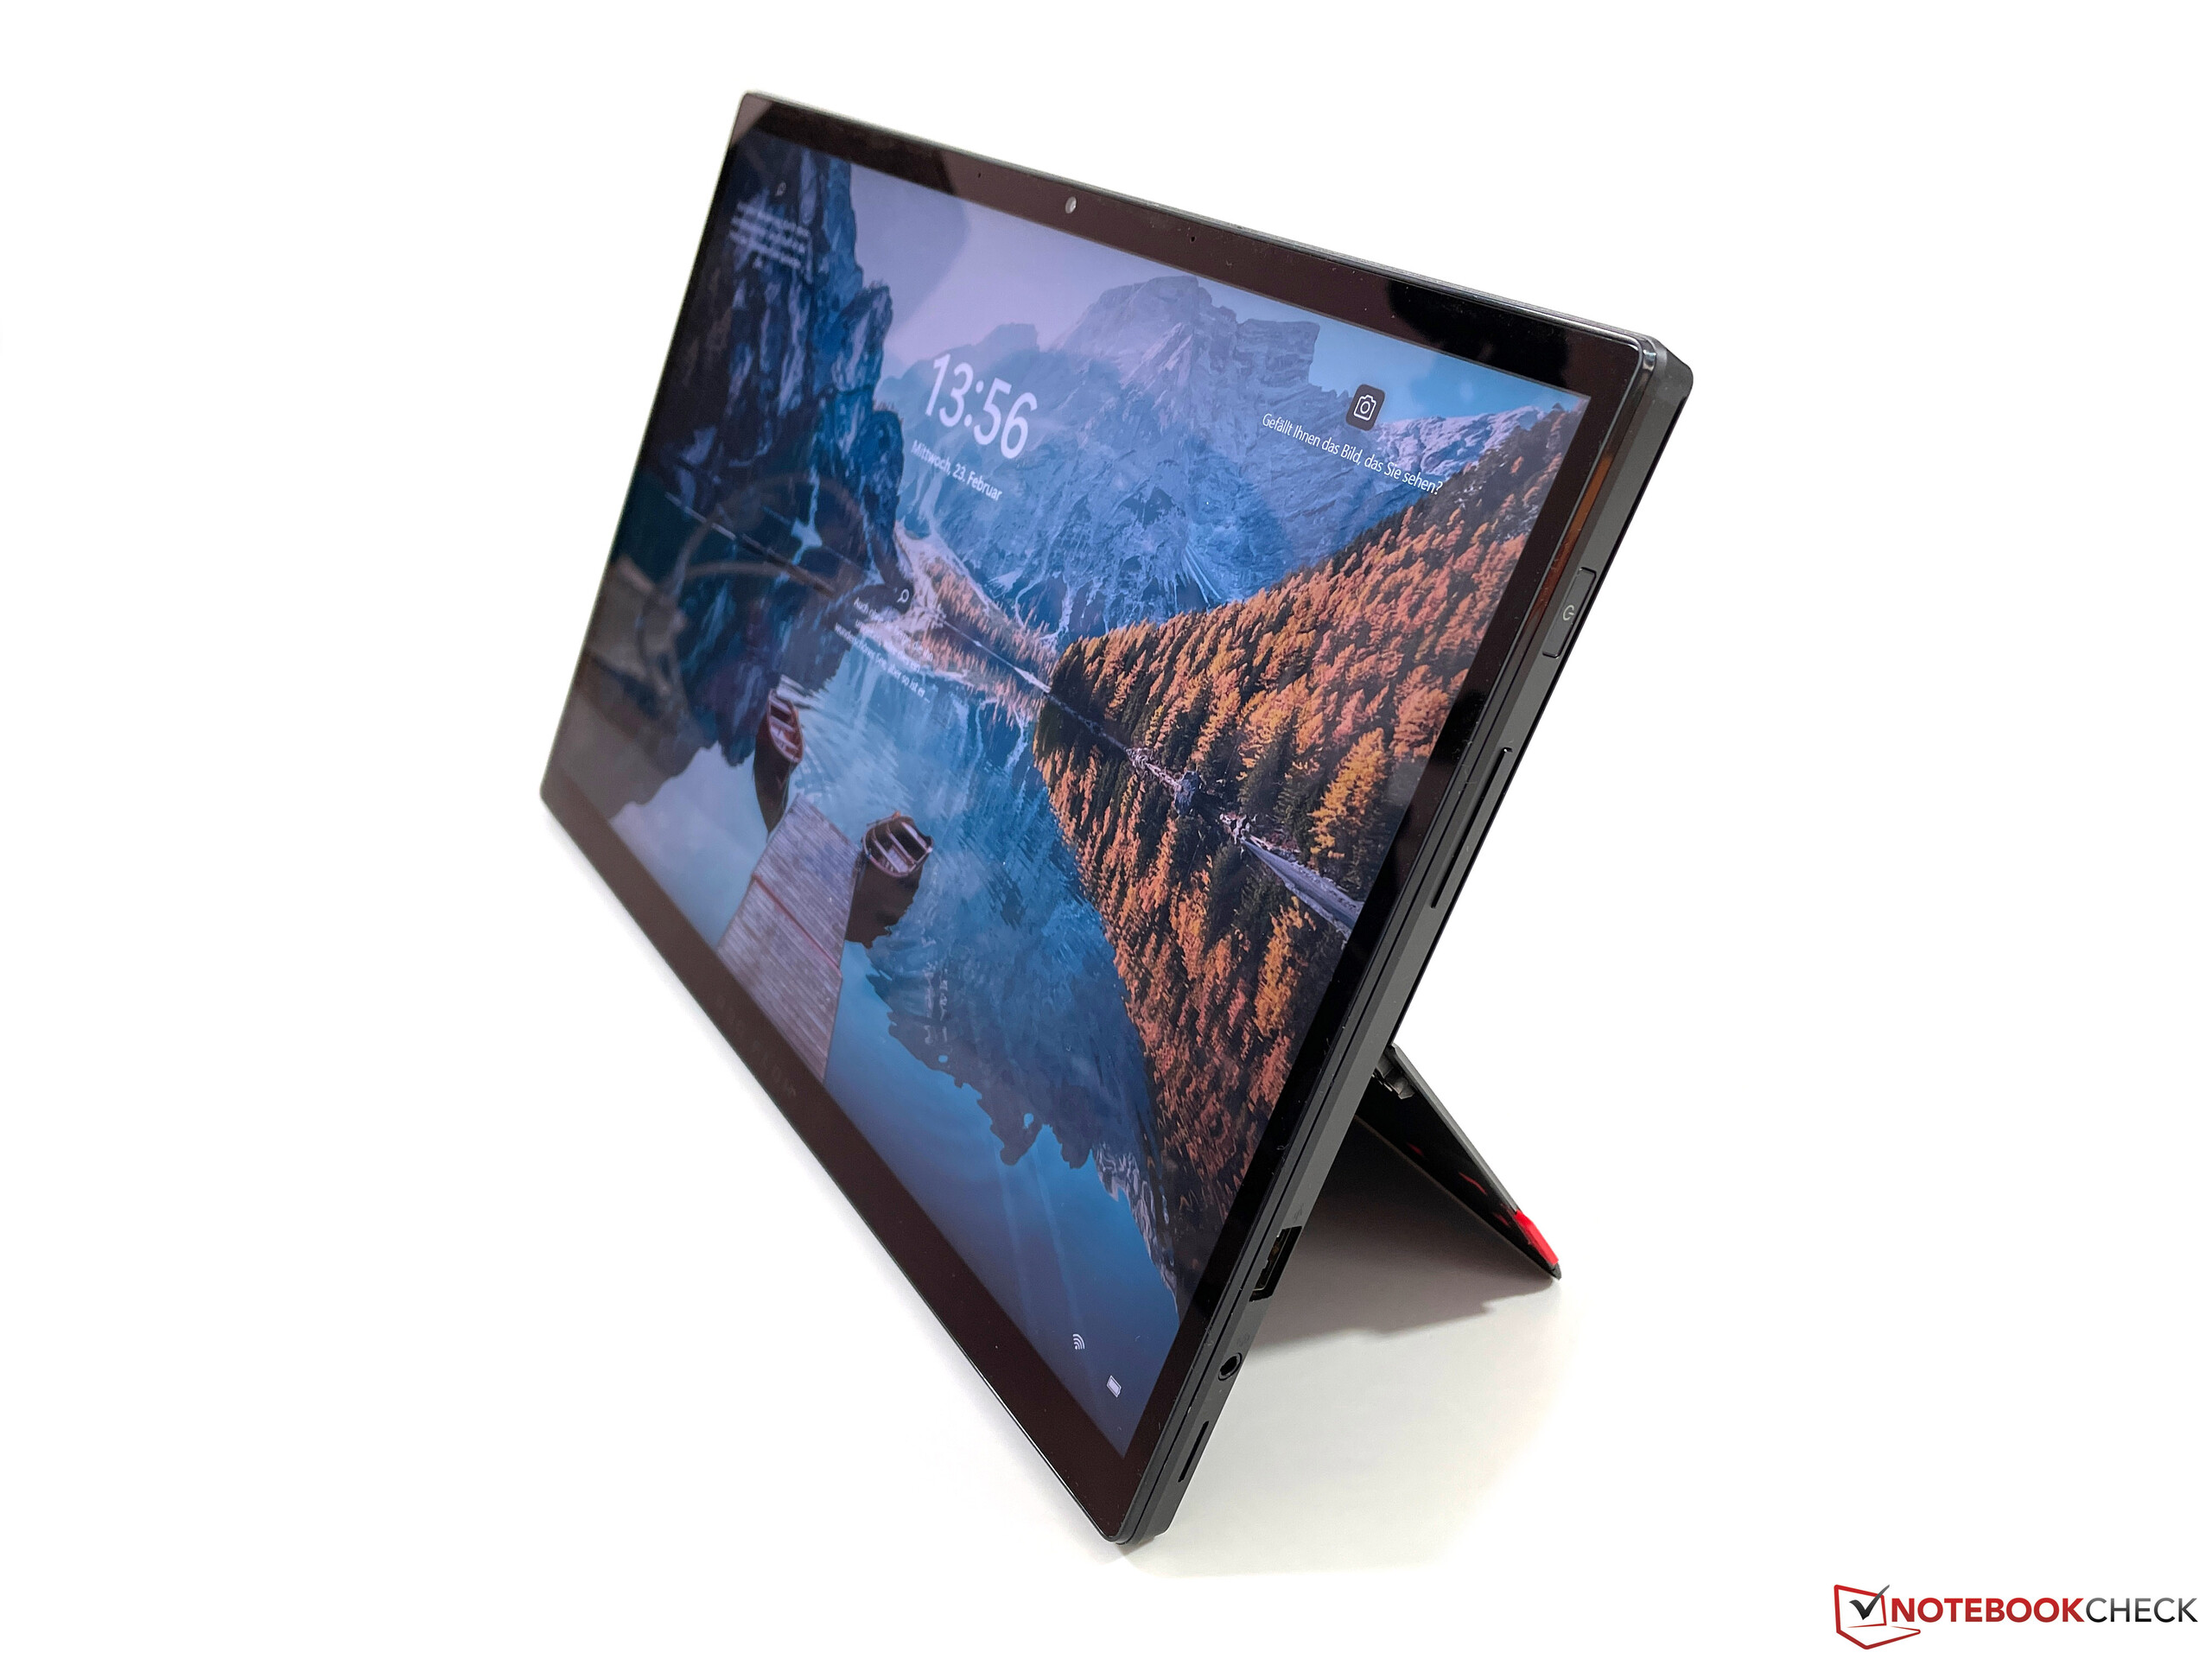
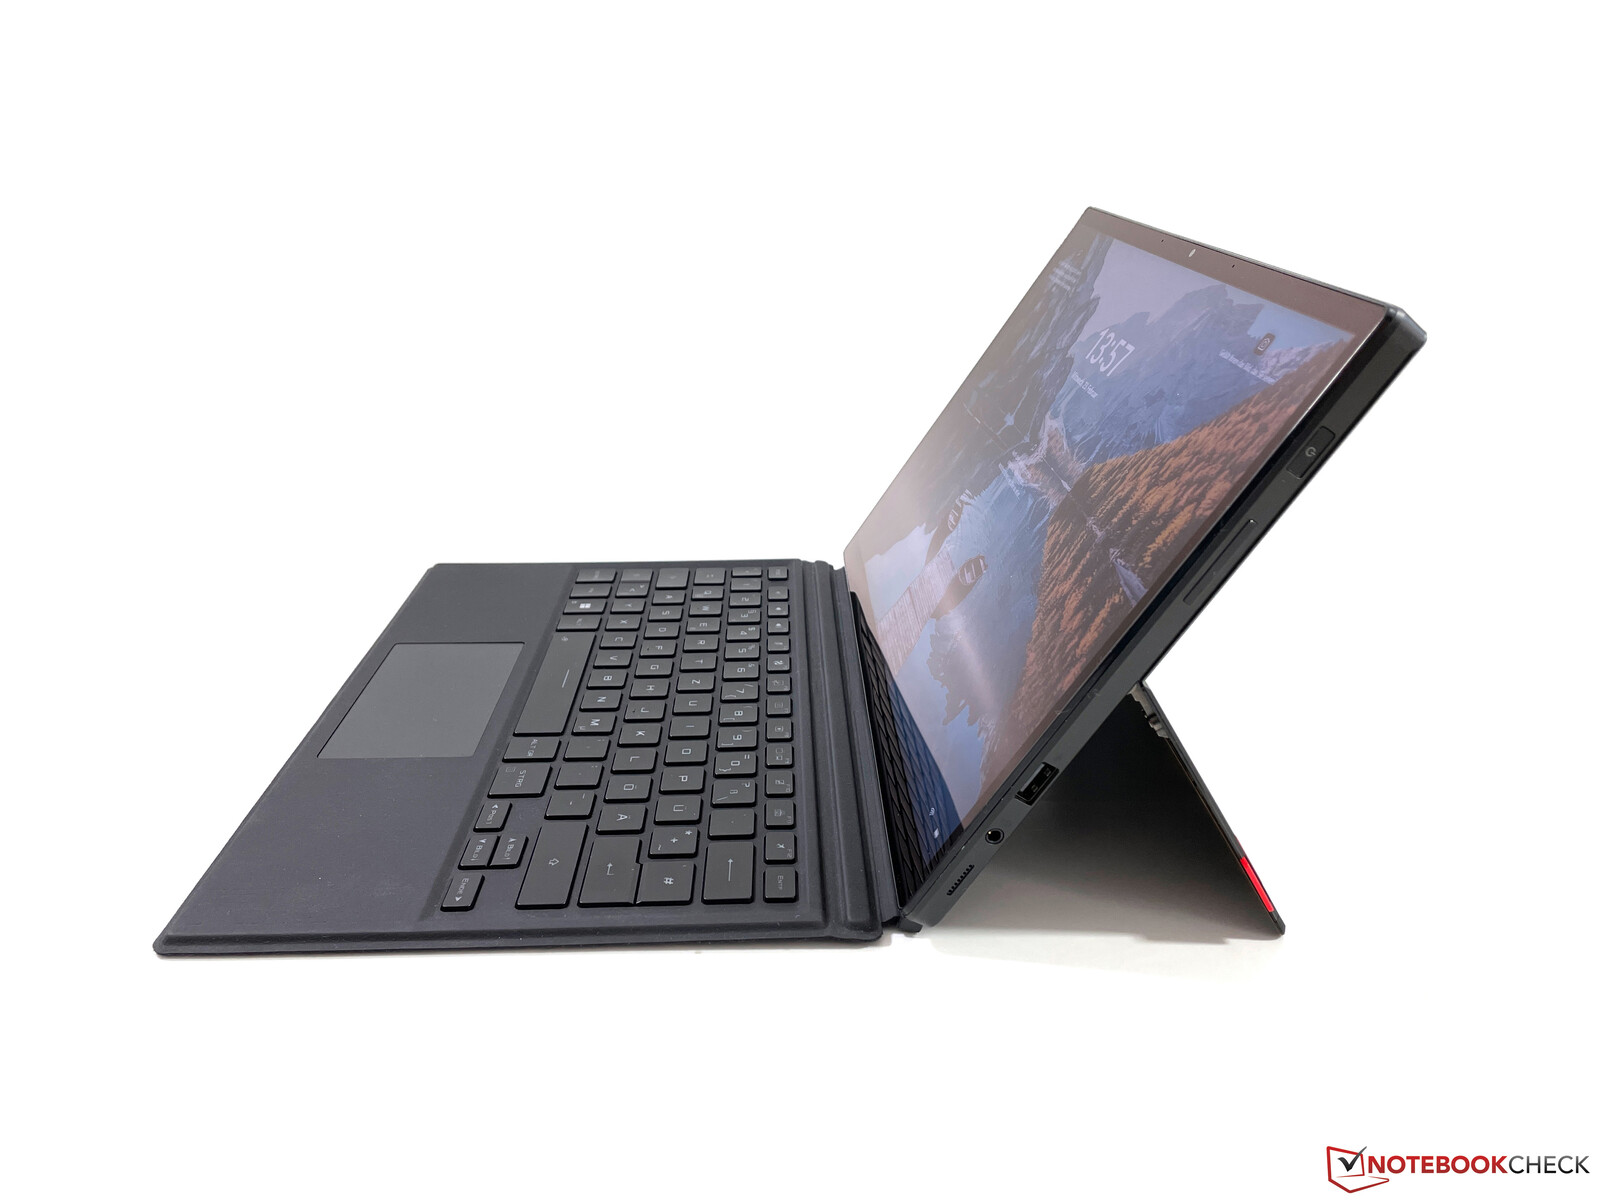
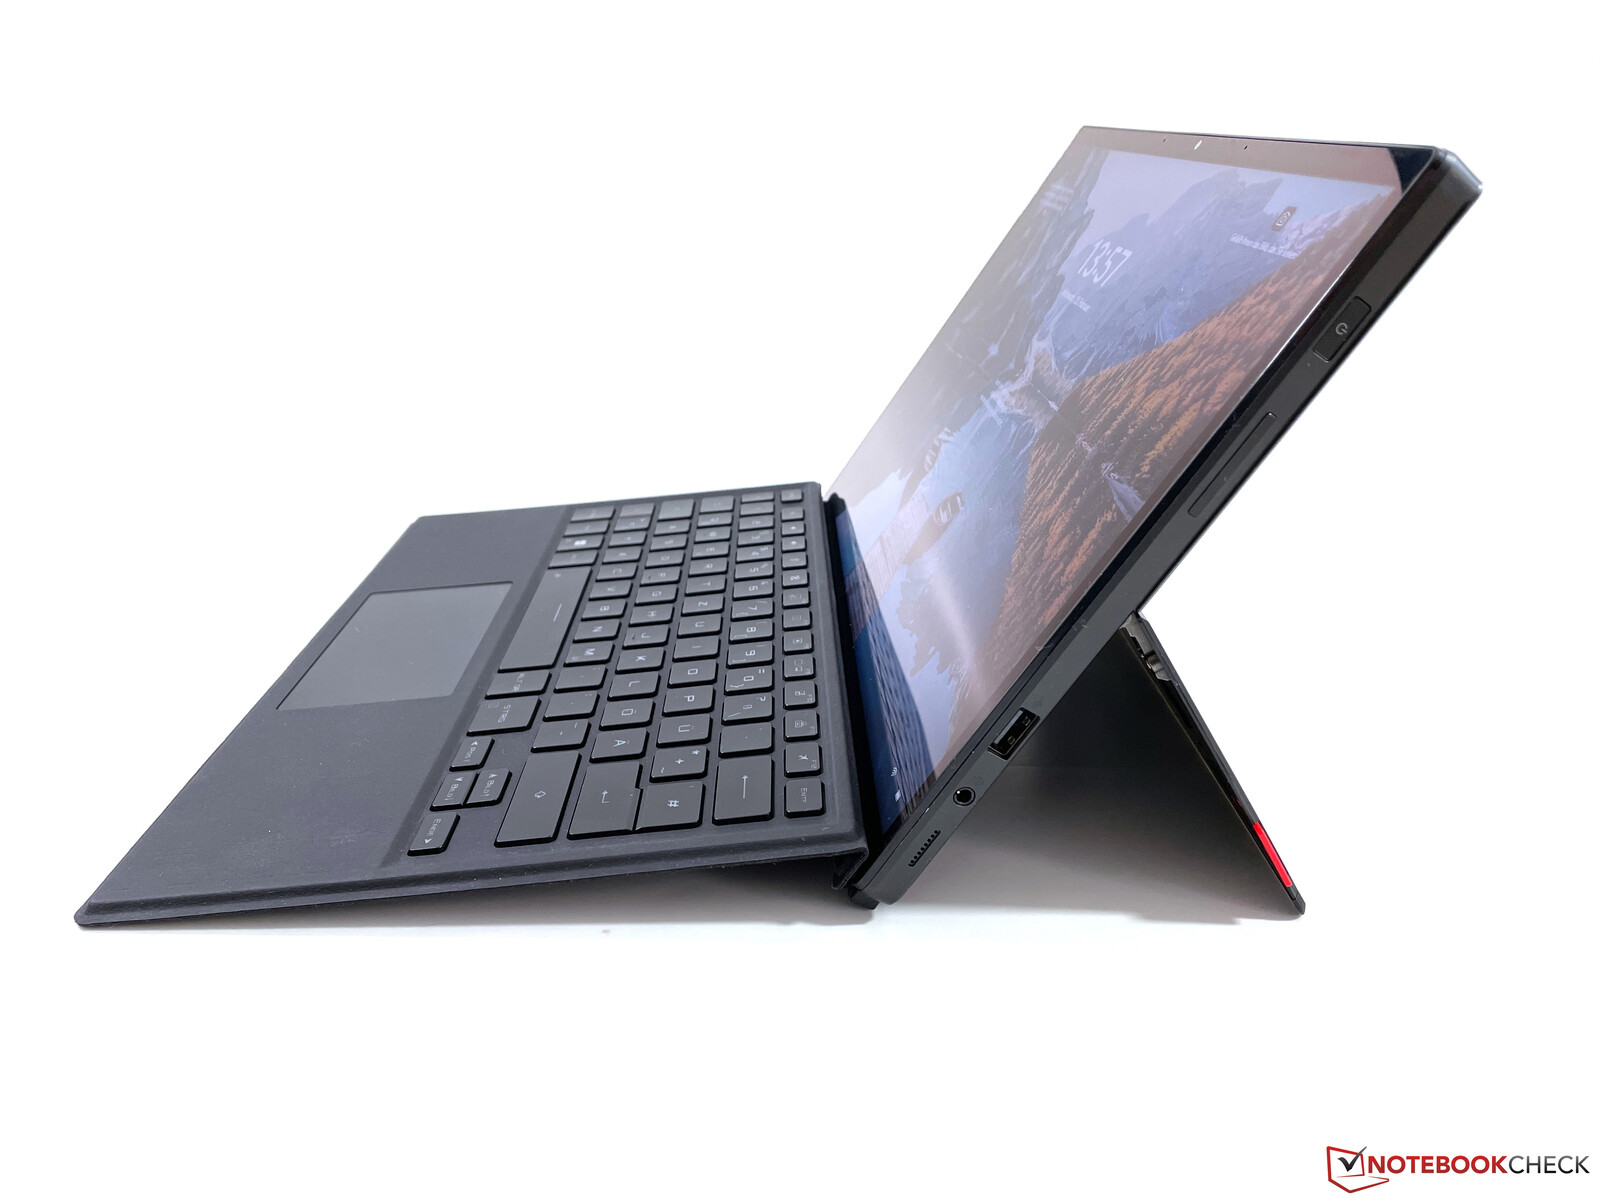
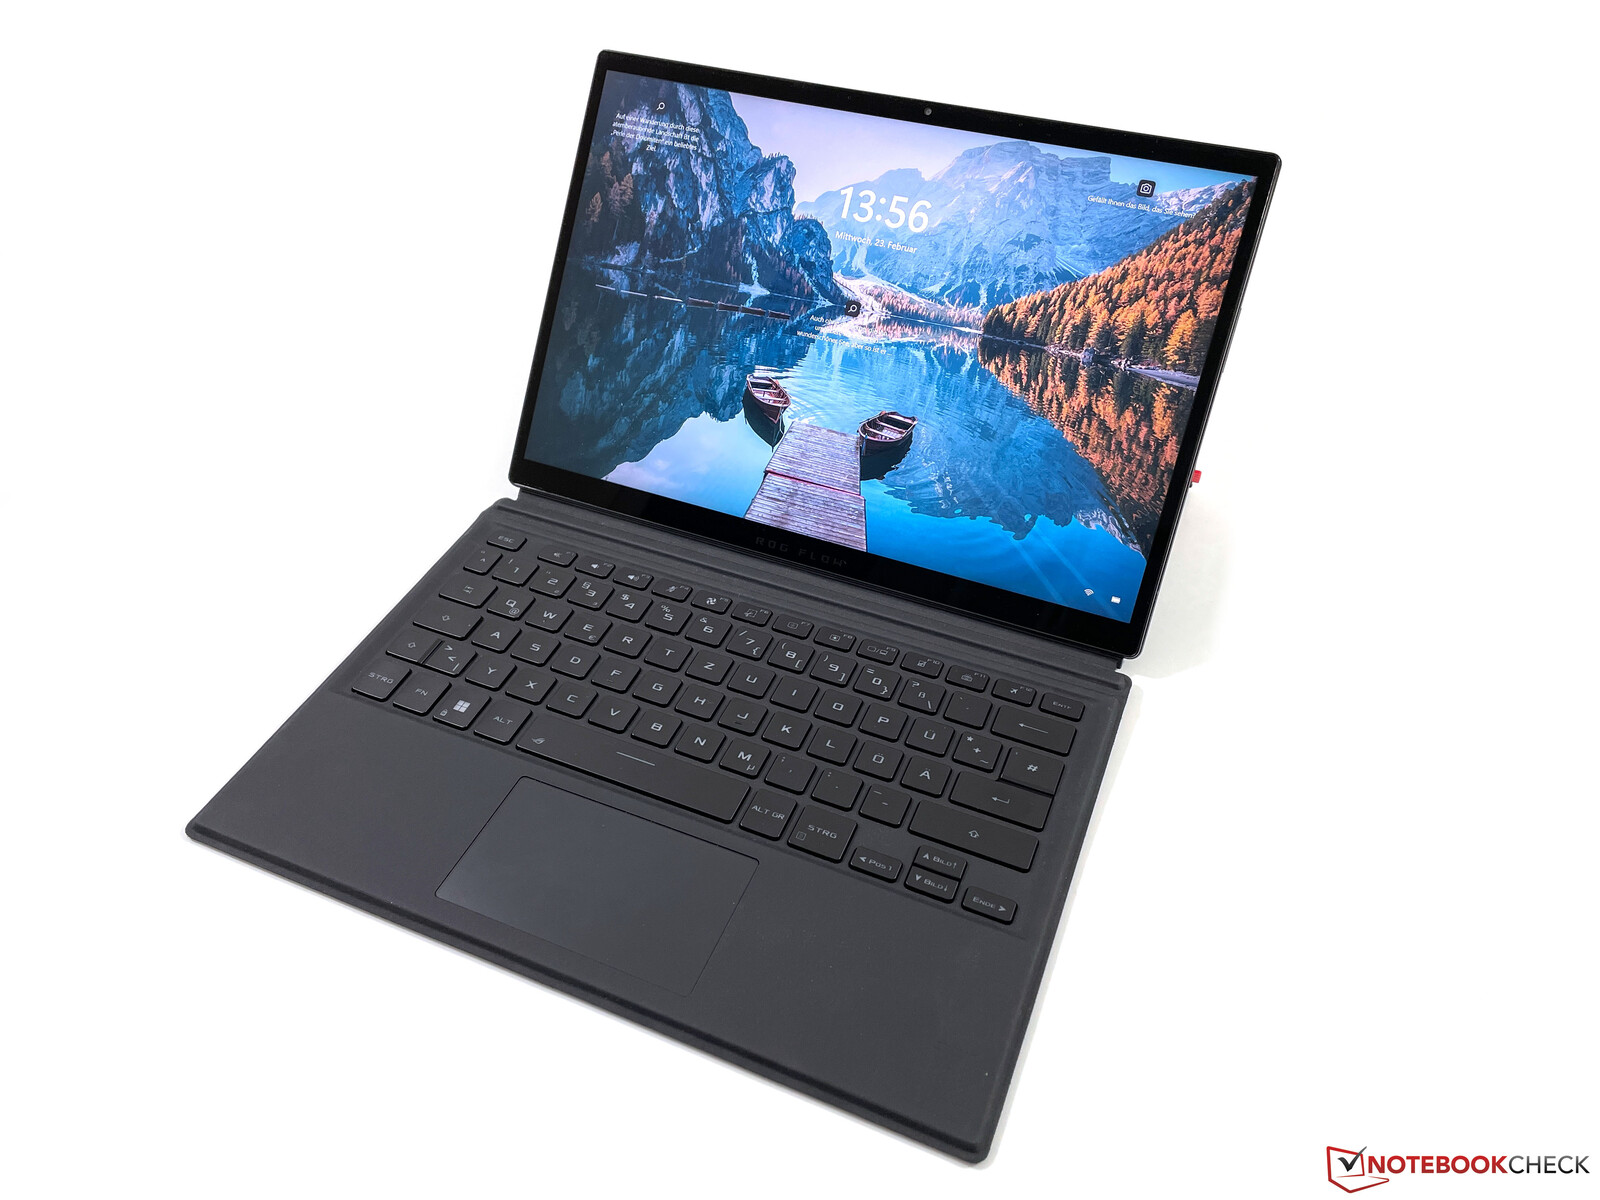
总的来说,ROG Flow Z13是一款普通的敞篷车,有一个集成的脚架和一个可安装的键盘,就像我们在微软Surface Pro中看到的那样。微软Surface Pro中看到的一样。然而,Flow Z13的体积和重量要大得多。不过,由于重量较大,这款敞篷车看起来也很高档,这种印象得到了铝制外壳的稳定性和做工的支持。集成的脚架,允许最大打开角度达170度,看起来也相当高质量。虽然这里的材料非常薄,但当你改变角度时它不会弯曲。两个铰链原则上调整得非常好,只有最低程度的摆动。音量摇杆和电源按钮(包括指纹扫描仪)都整齐地集成在外壳上。
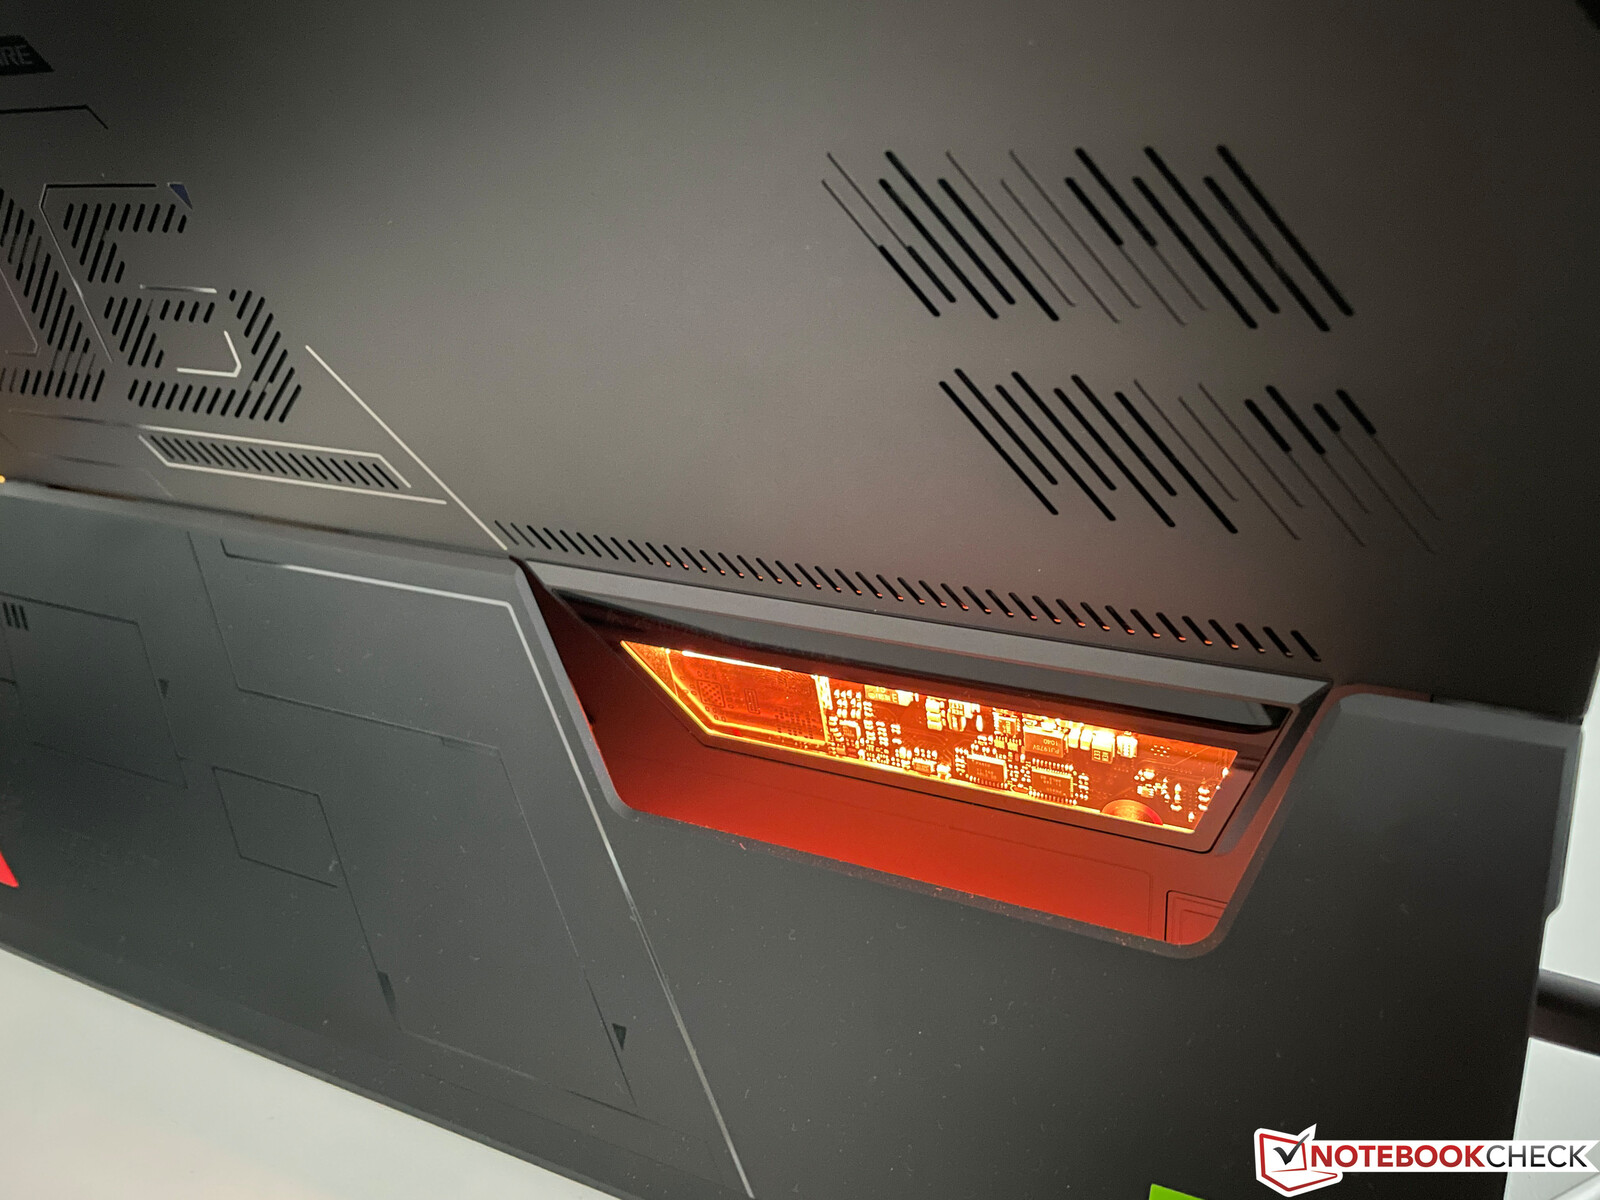
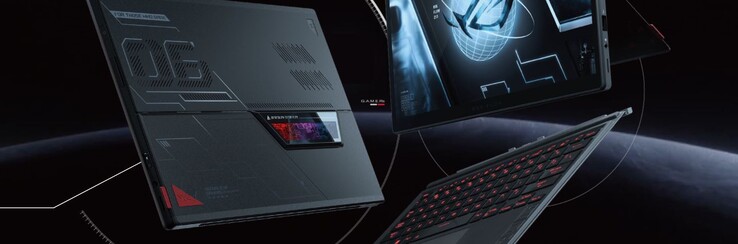
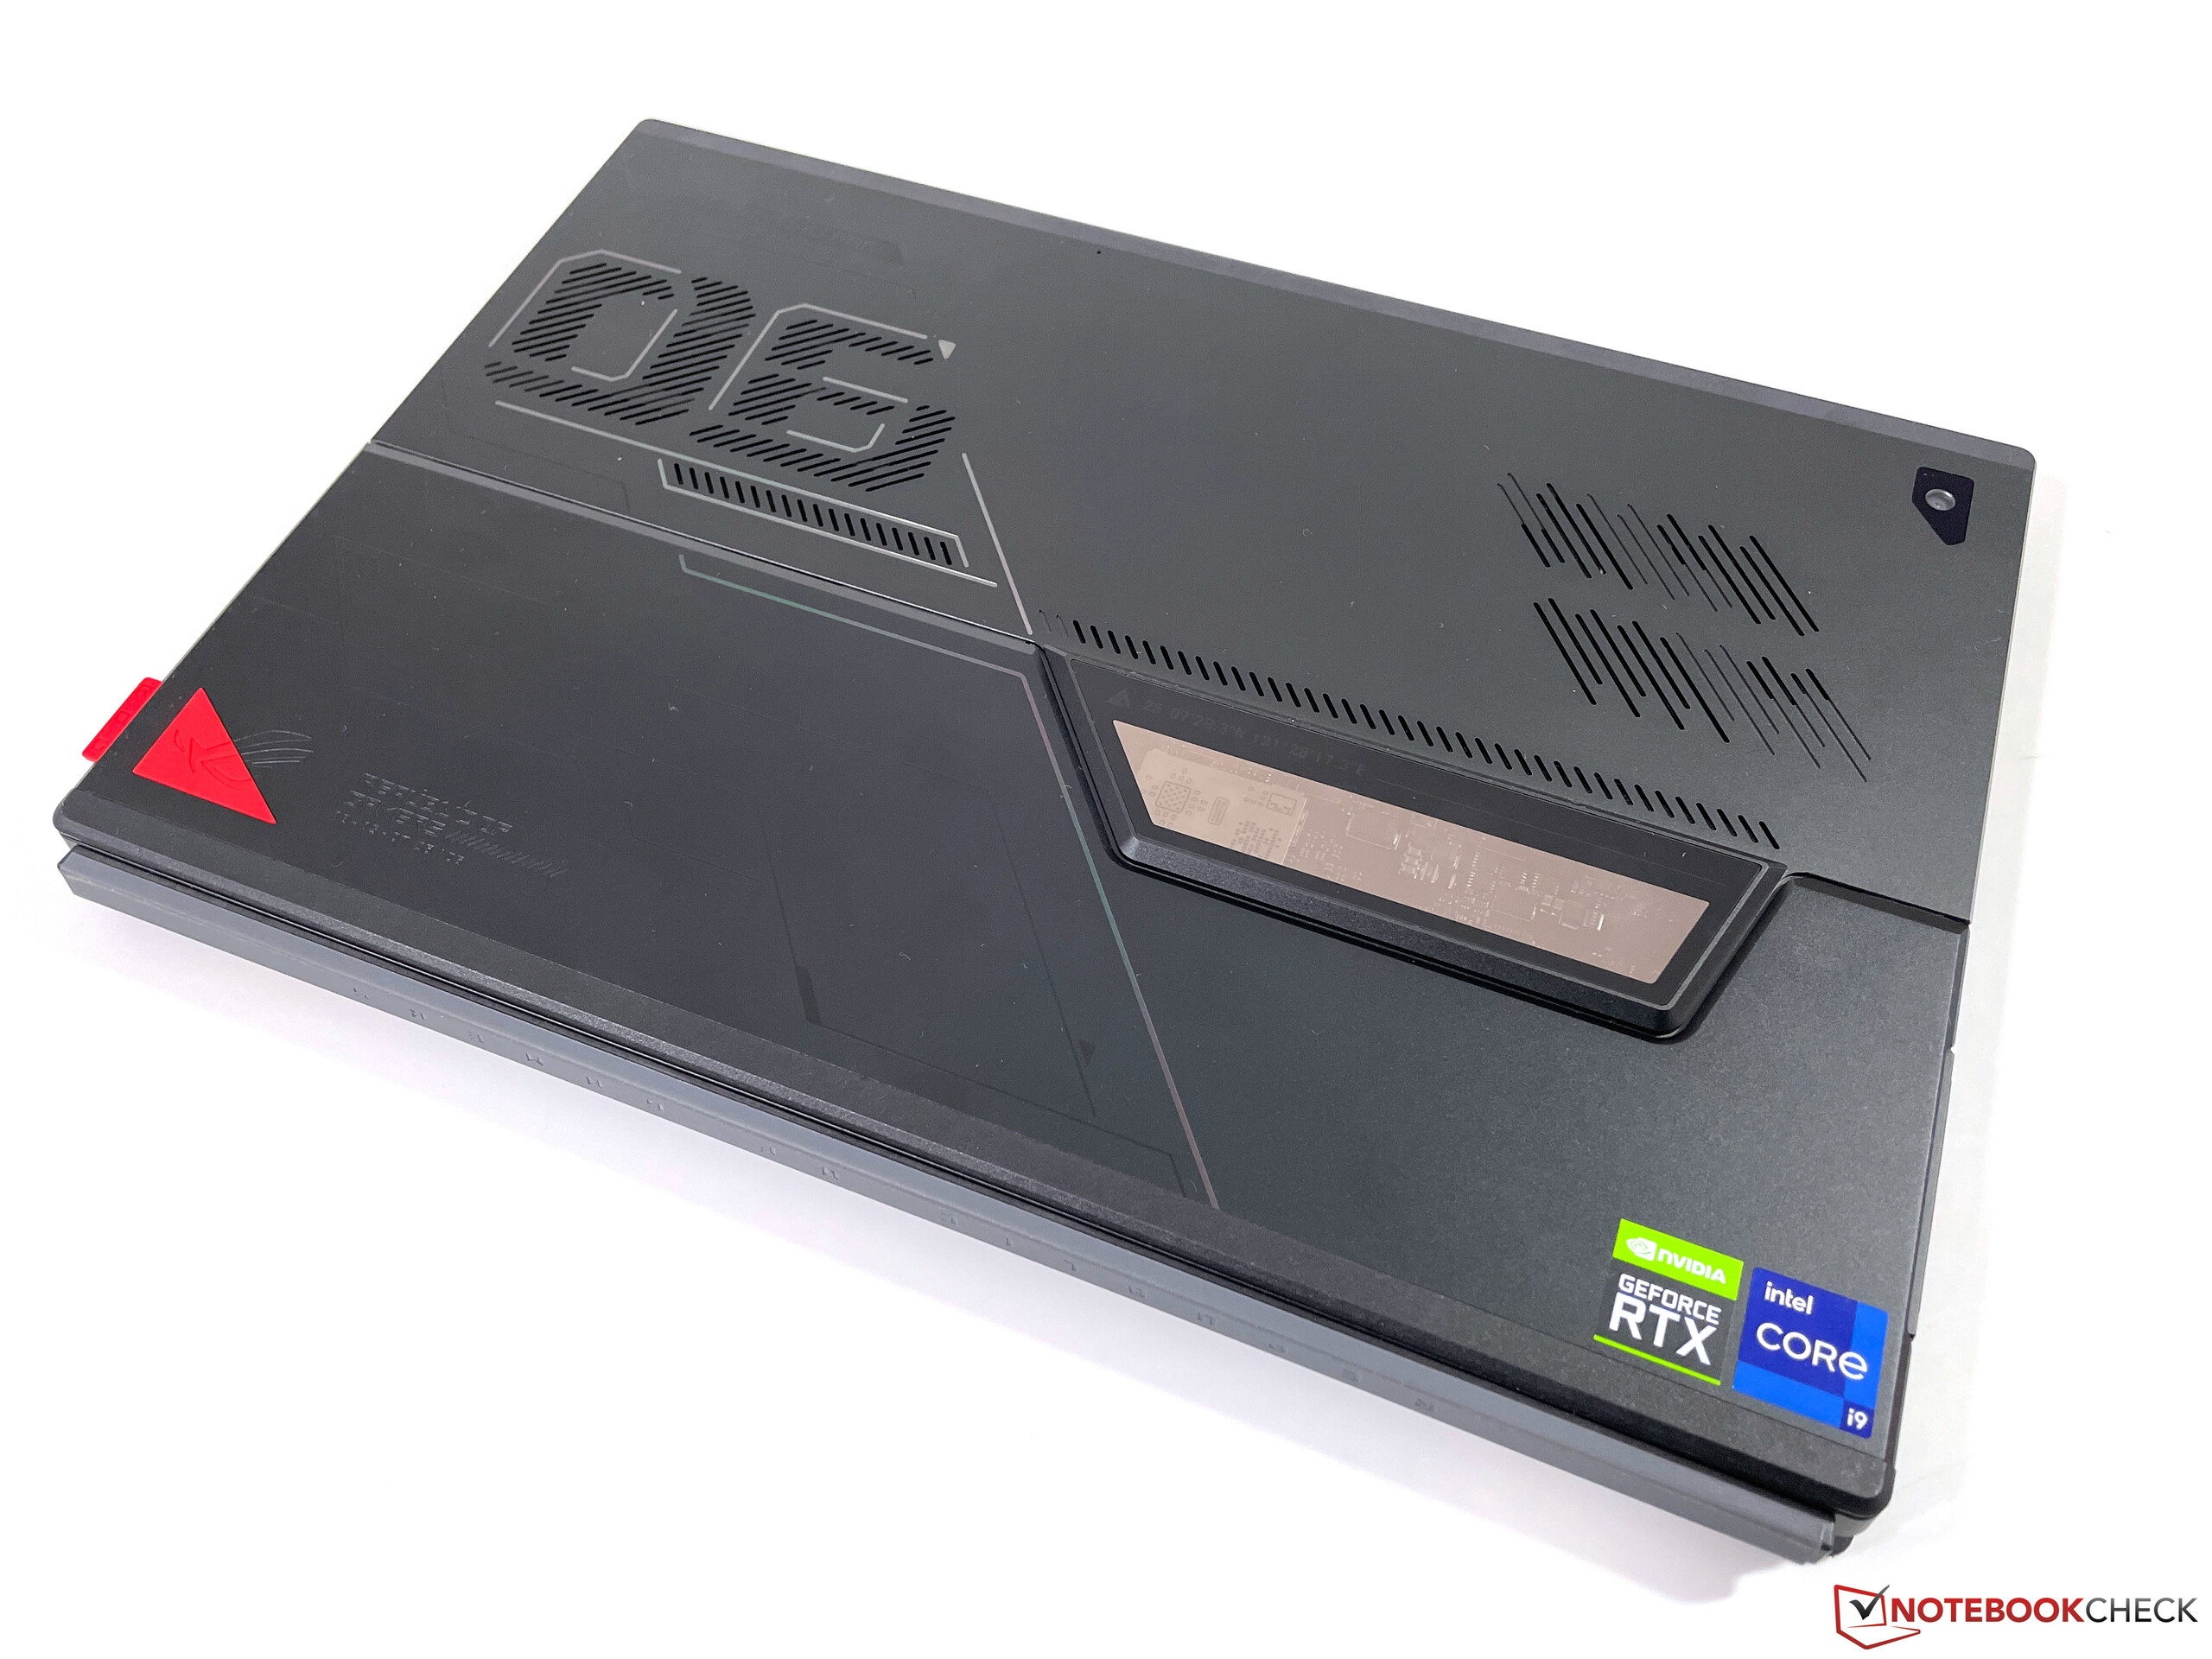
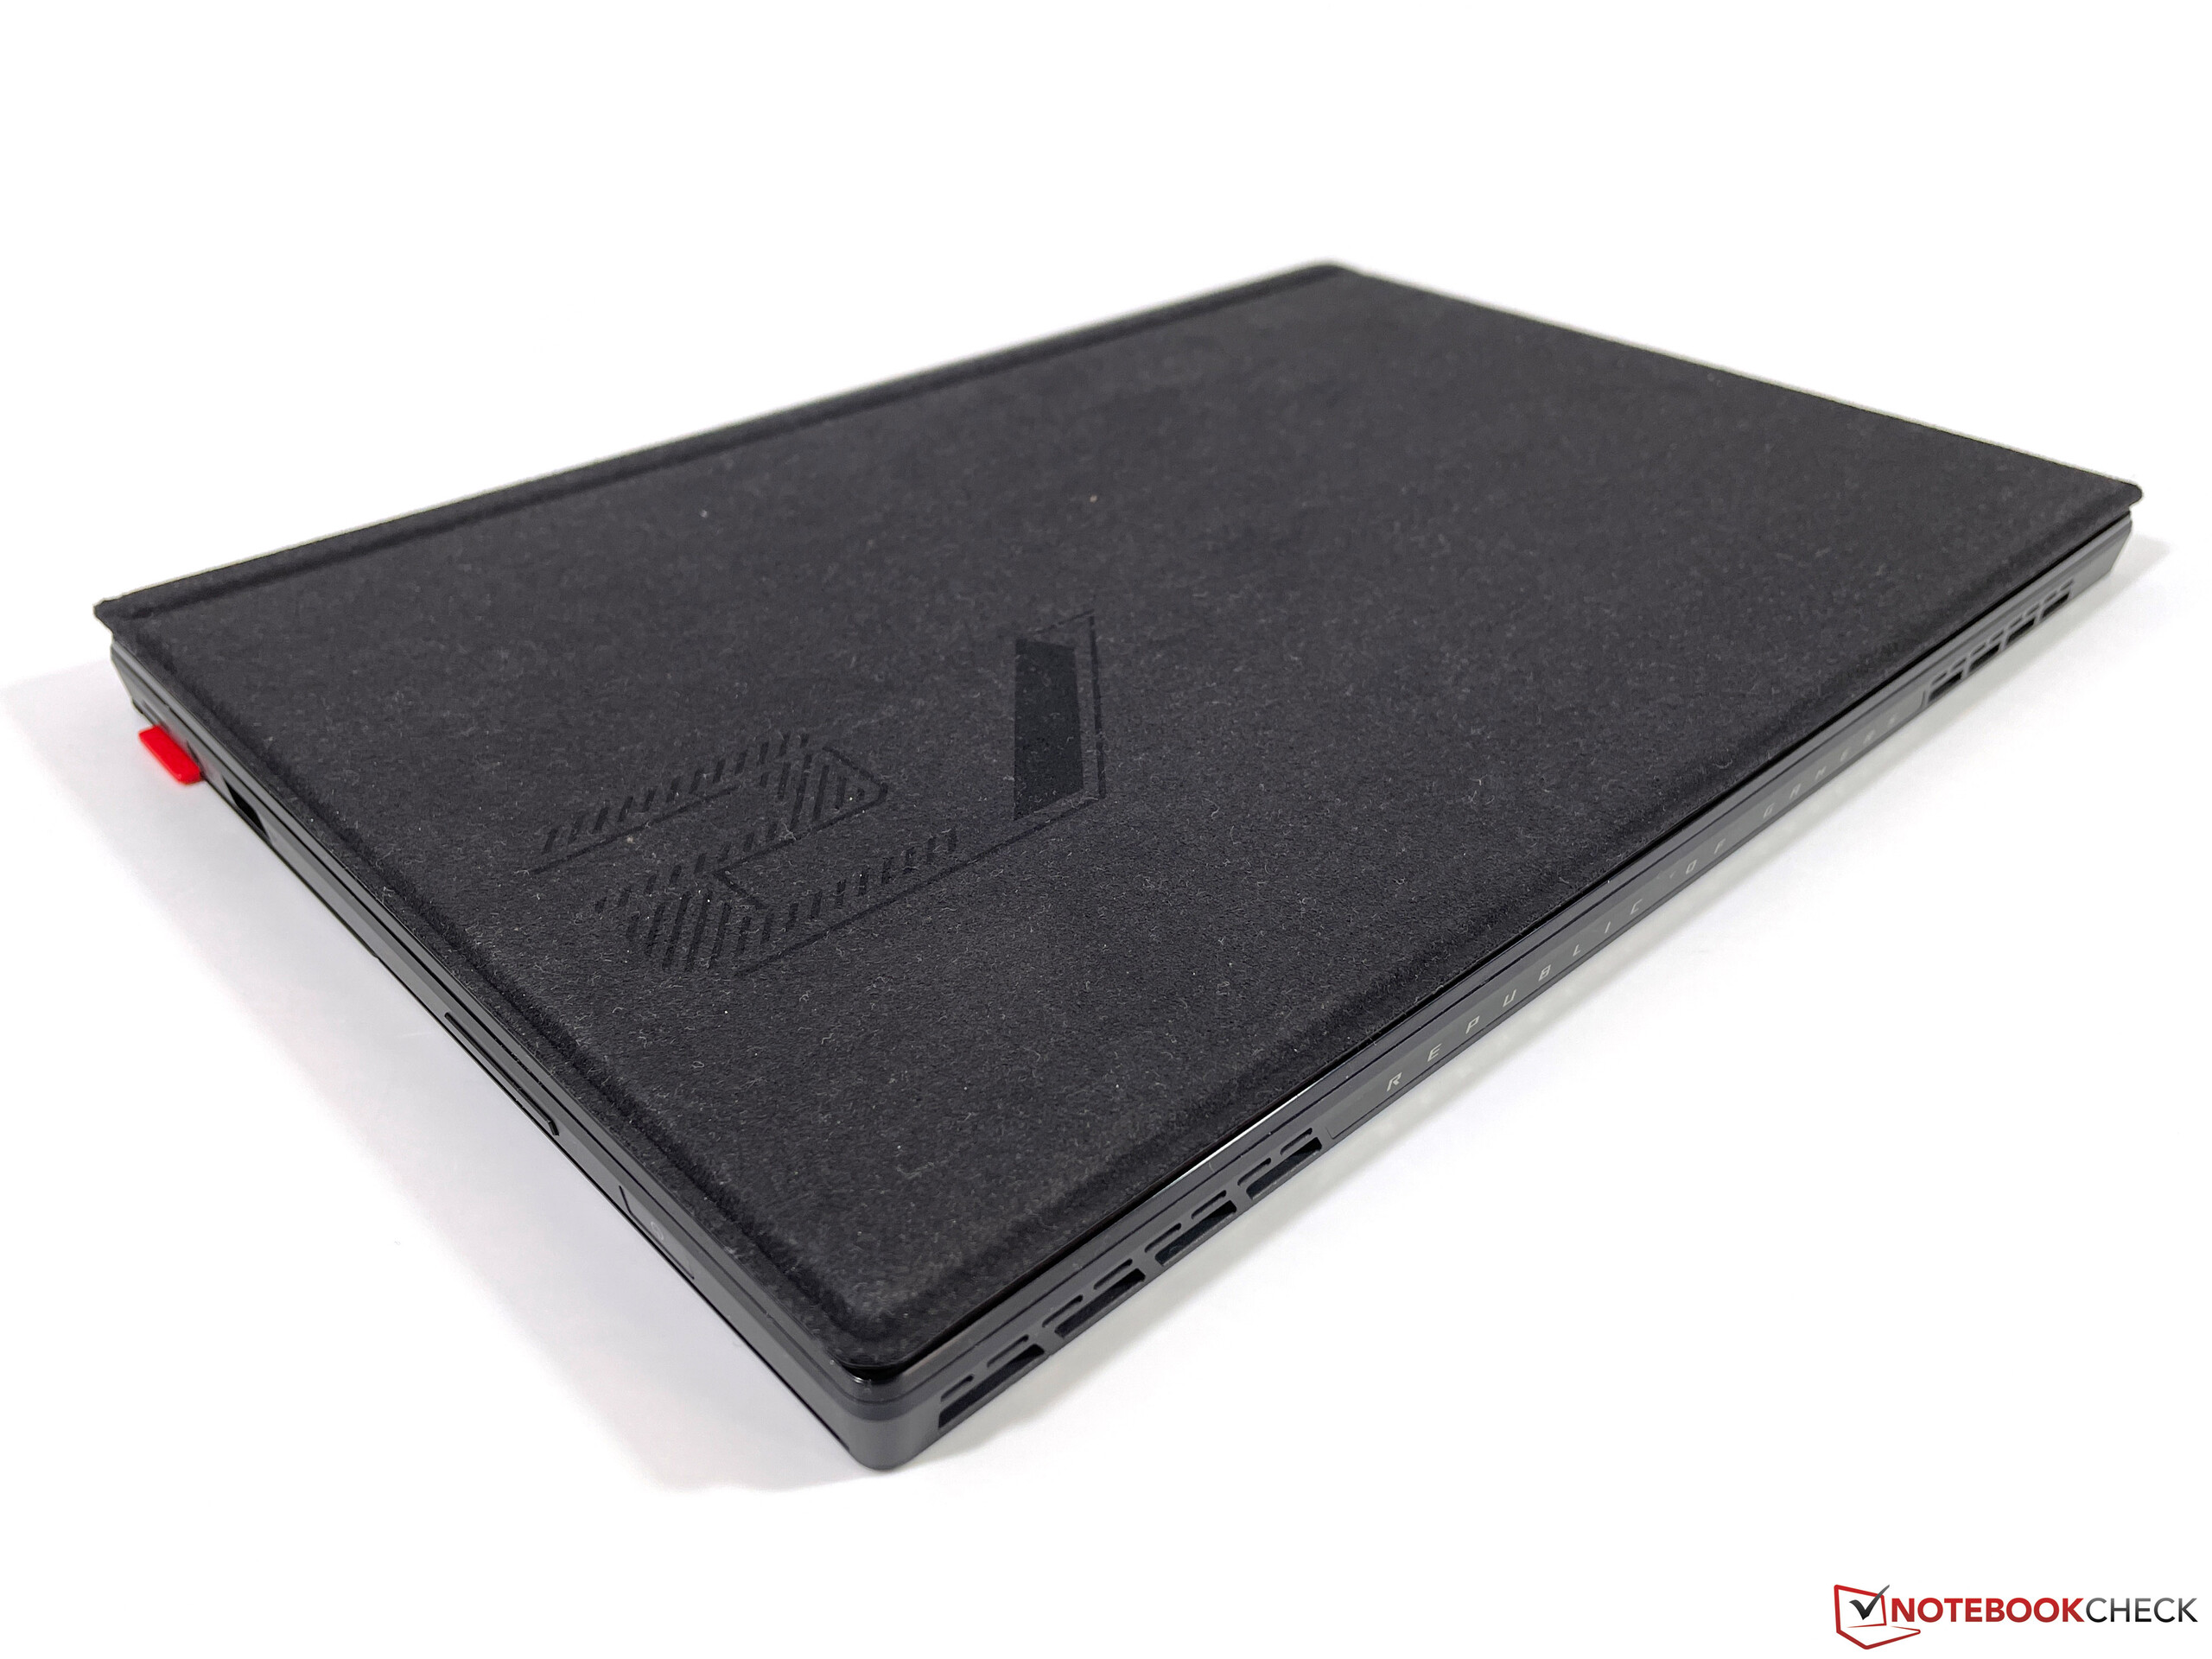
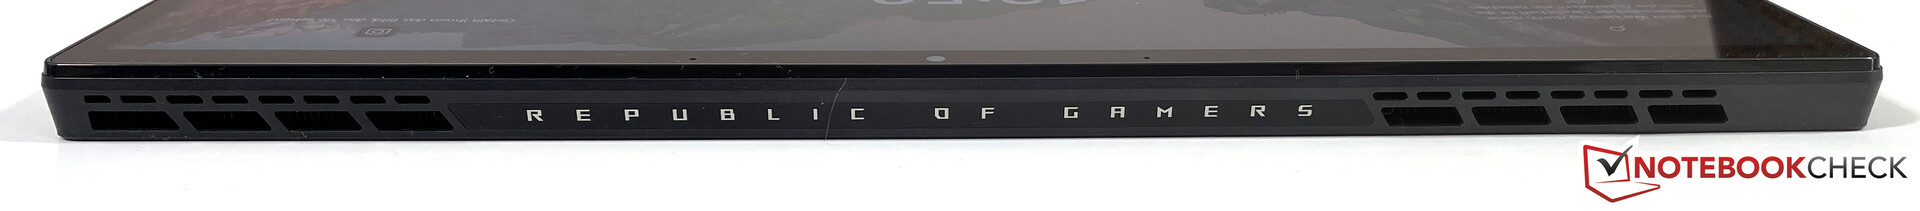
激进的设计语言与ROG笔记本电脑一致,也适合游戏平板电脑。背面的外壳上还有一个小窗口,可以照明,也支持Aura Sync技术(就像键盘背光一样)。然而,这也造成了一个小的驼峰,这就是为什么平板电脑无法平躺在背面,会摇晃。背面的风扇格栅也被作为设计元素实现了,所以它们几乎不引人注意。顶部有一个巨大的Republic of Gamers标志,两边是两个风扇出口。
附带的键盘盖也可以作为一个盖子,在设备不使用时保护显示屏。盖子的背面有某种天鹅绒饰面,触感很好,提供了一个很好的抓地力,但也会很快吸走灰尘和污垢。
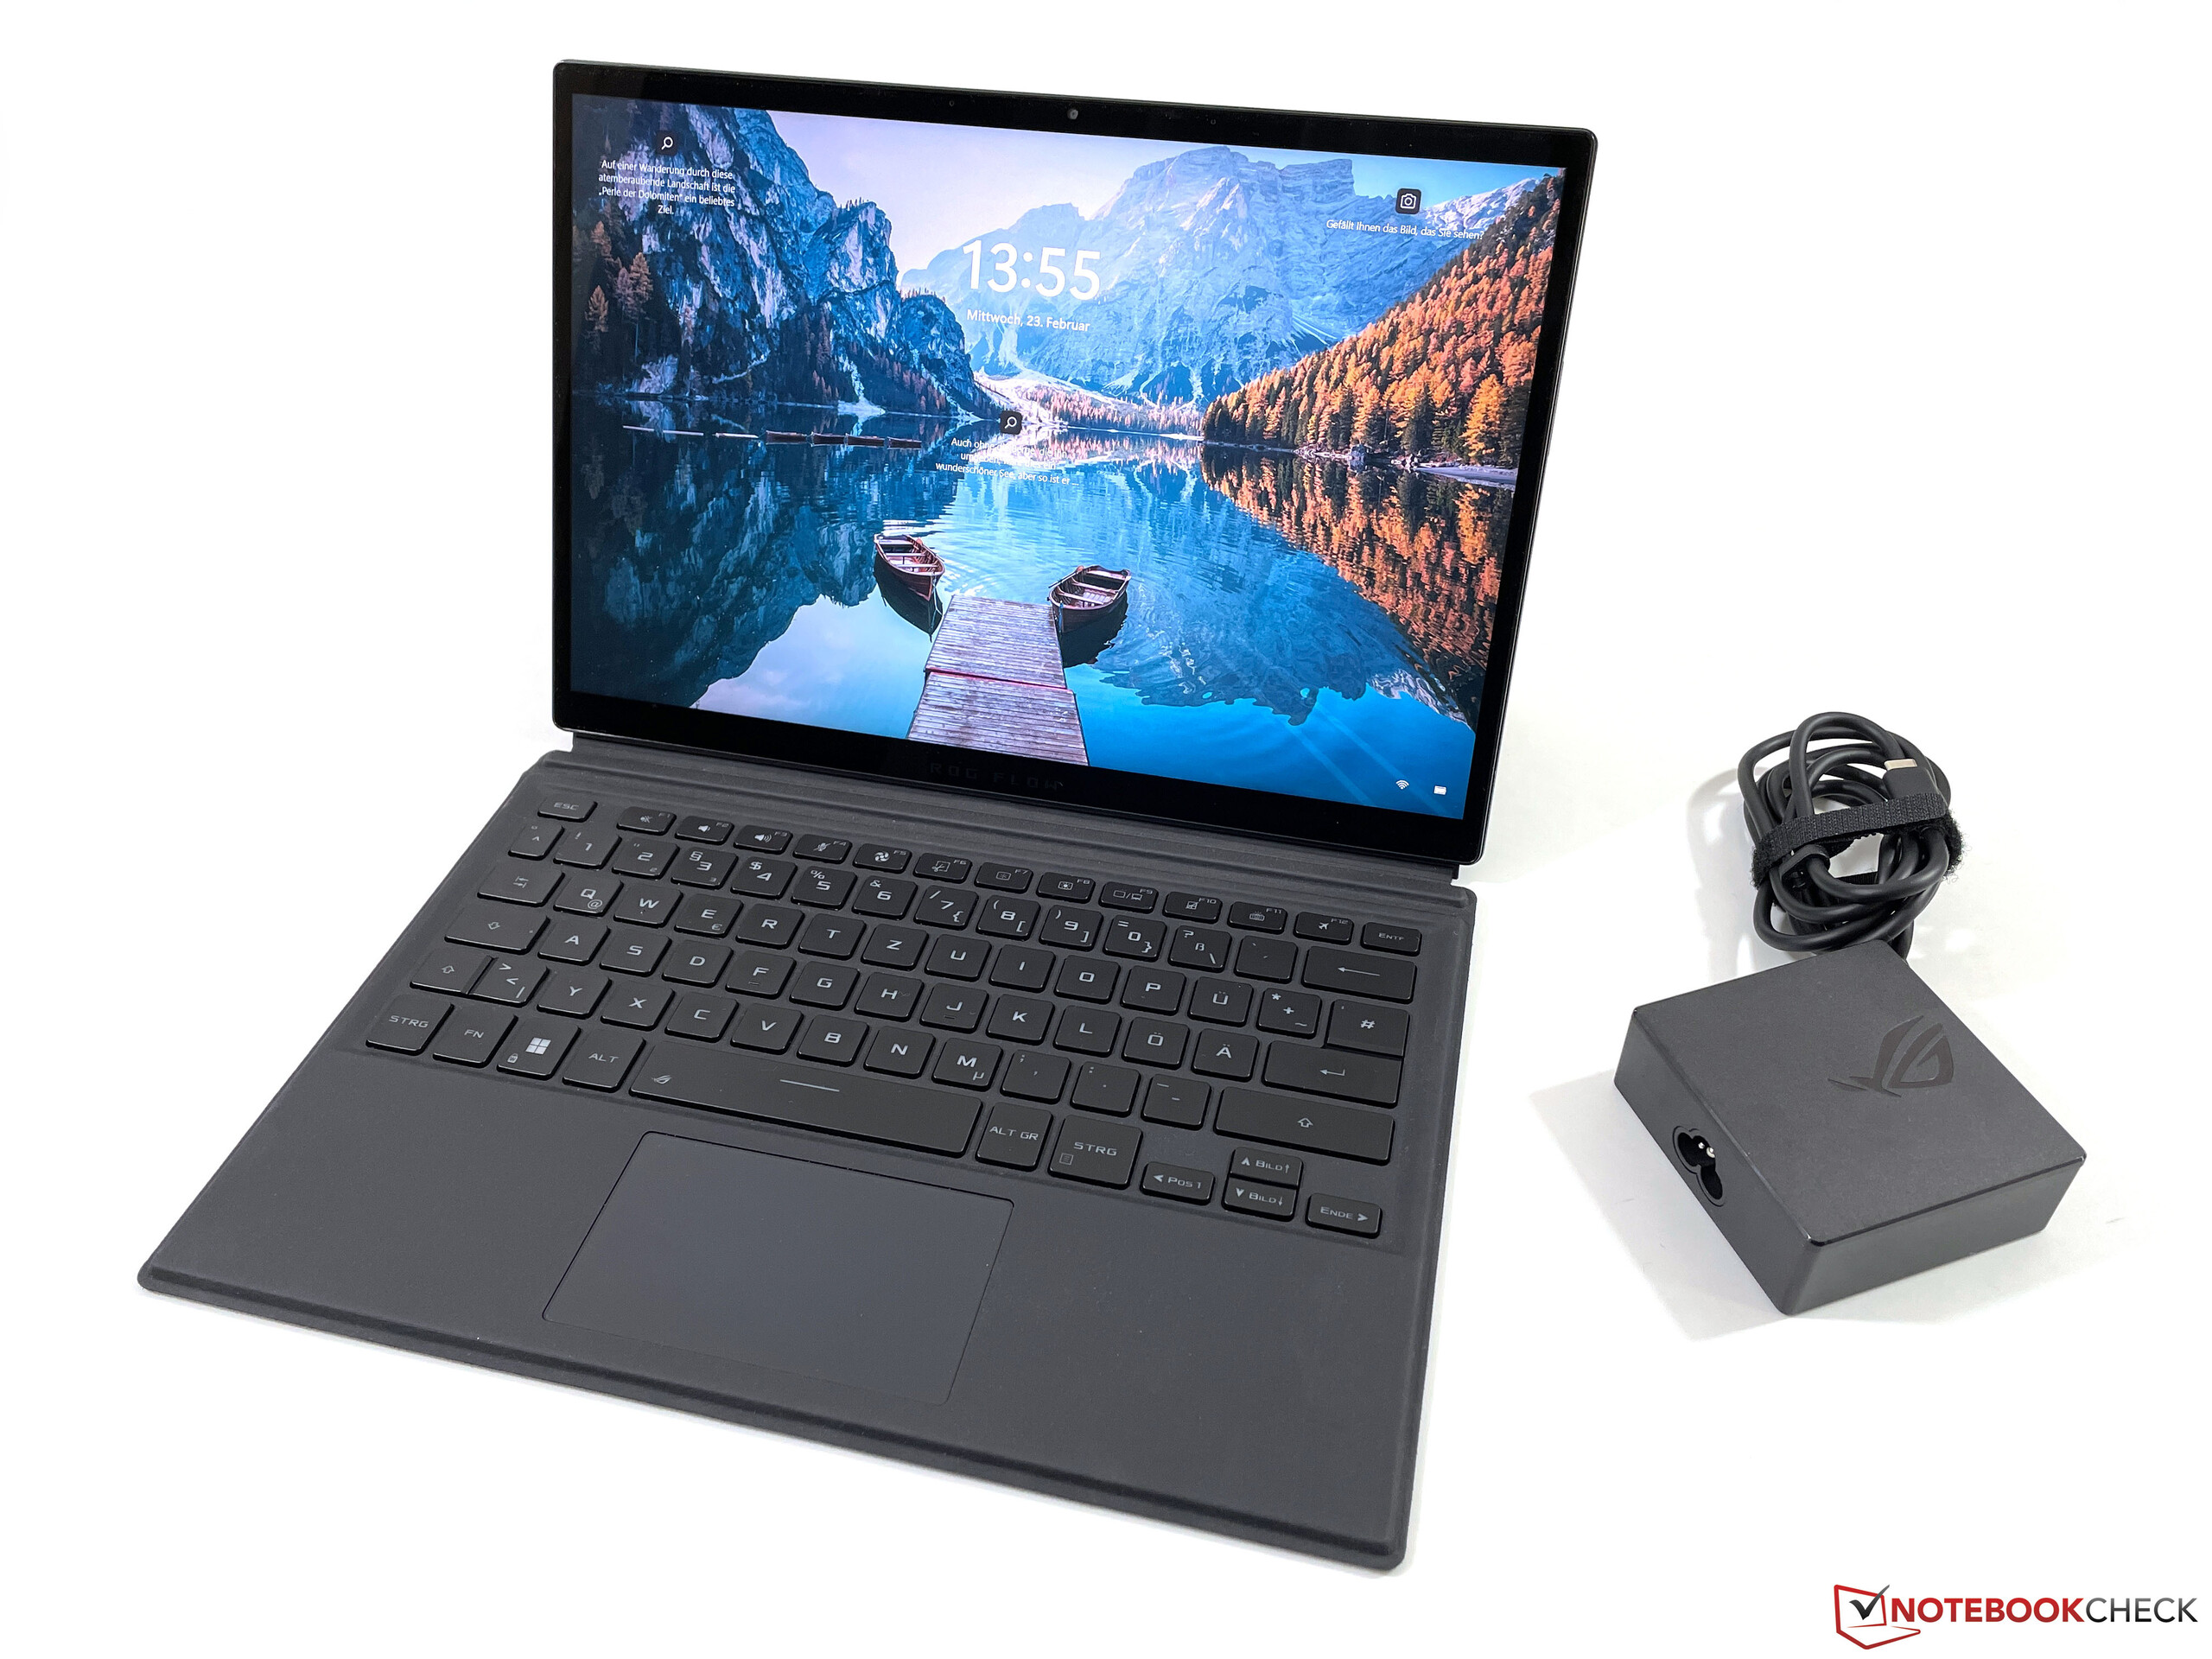
重量为1.185公斤,仅ROG Flow Z13的重量就已经超过了许多超极本,例如 配备RTX 3050 Ti的Schenker Vision 14.加上键盘盖,重量攀升至1.5公斤多一点,而且包装也有近2厘米厚。当然,这仍然使它非常便携,但你可以清楚地注意到与Surface Pro 8等较弱的转换机的区别。 100瓦的电源适配器使重量增加了400多克。
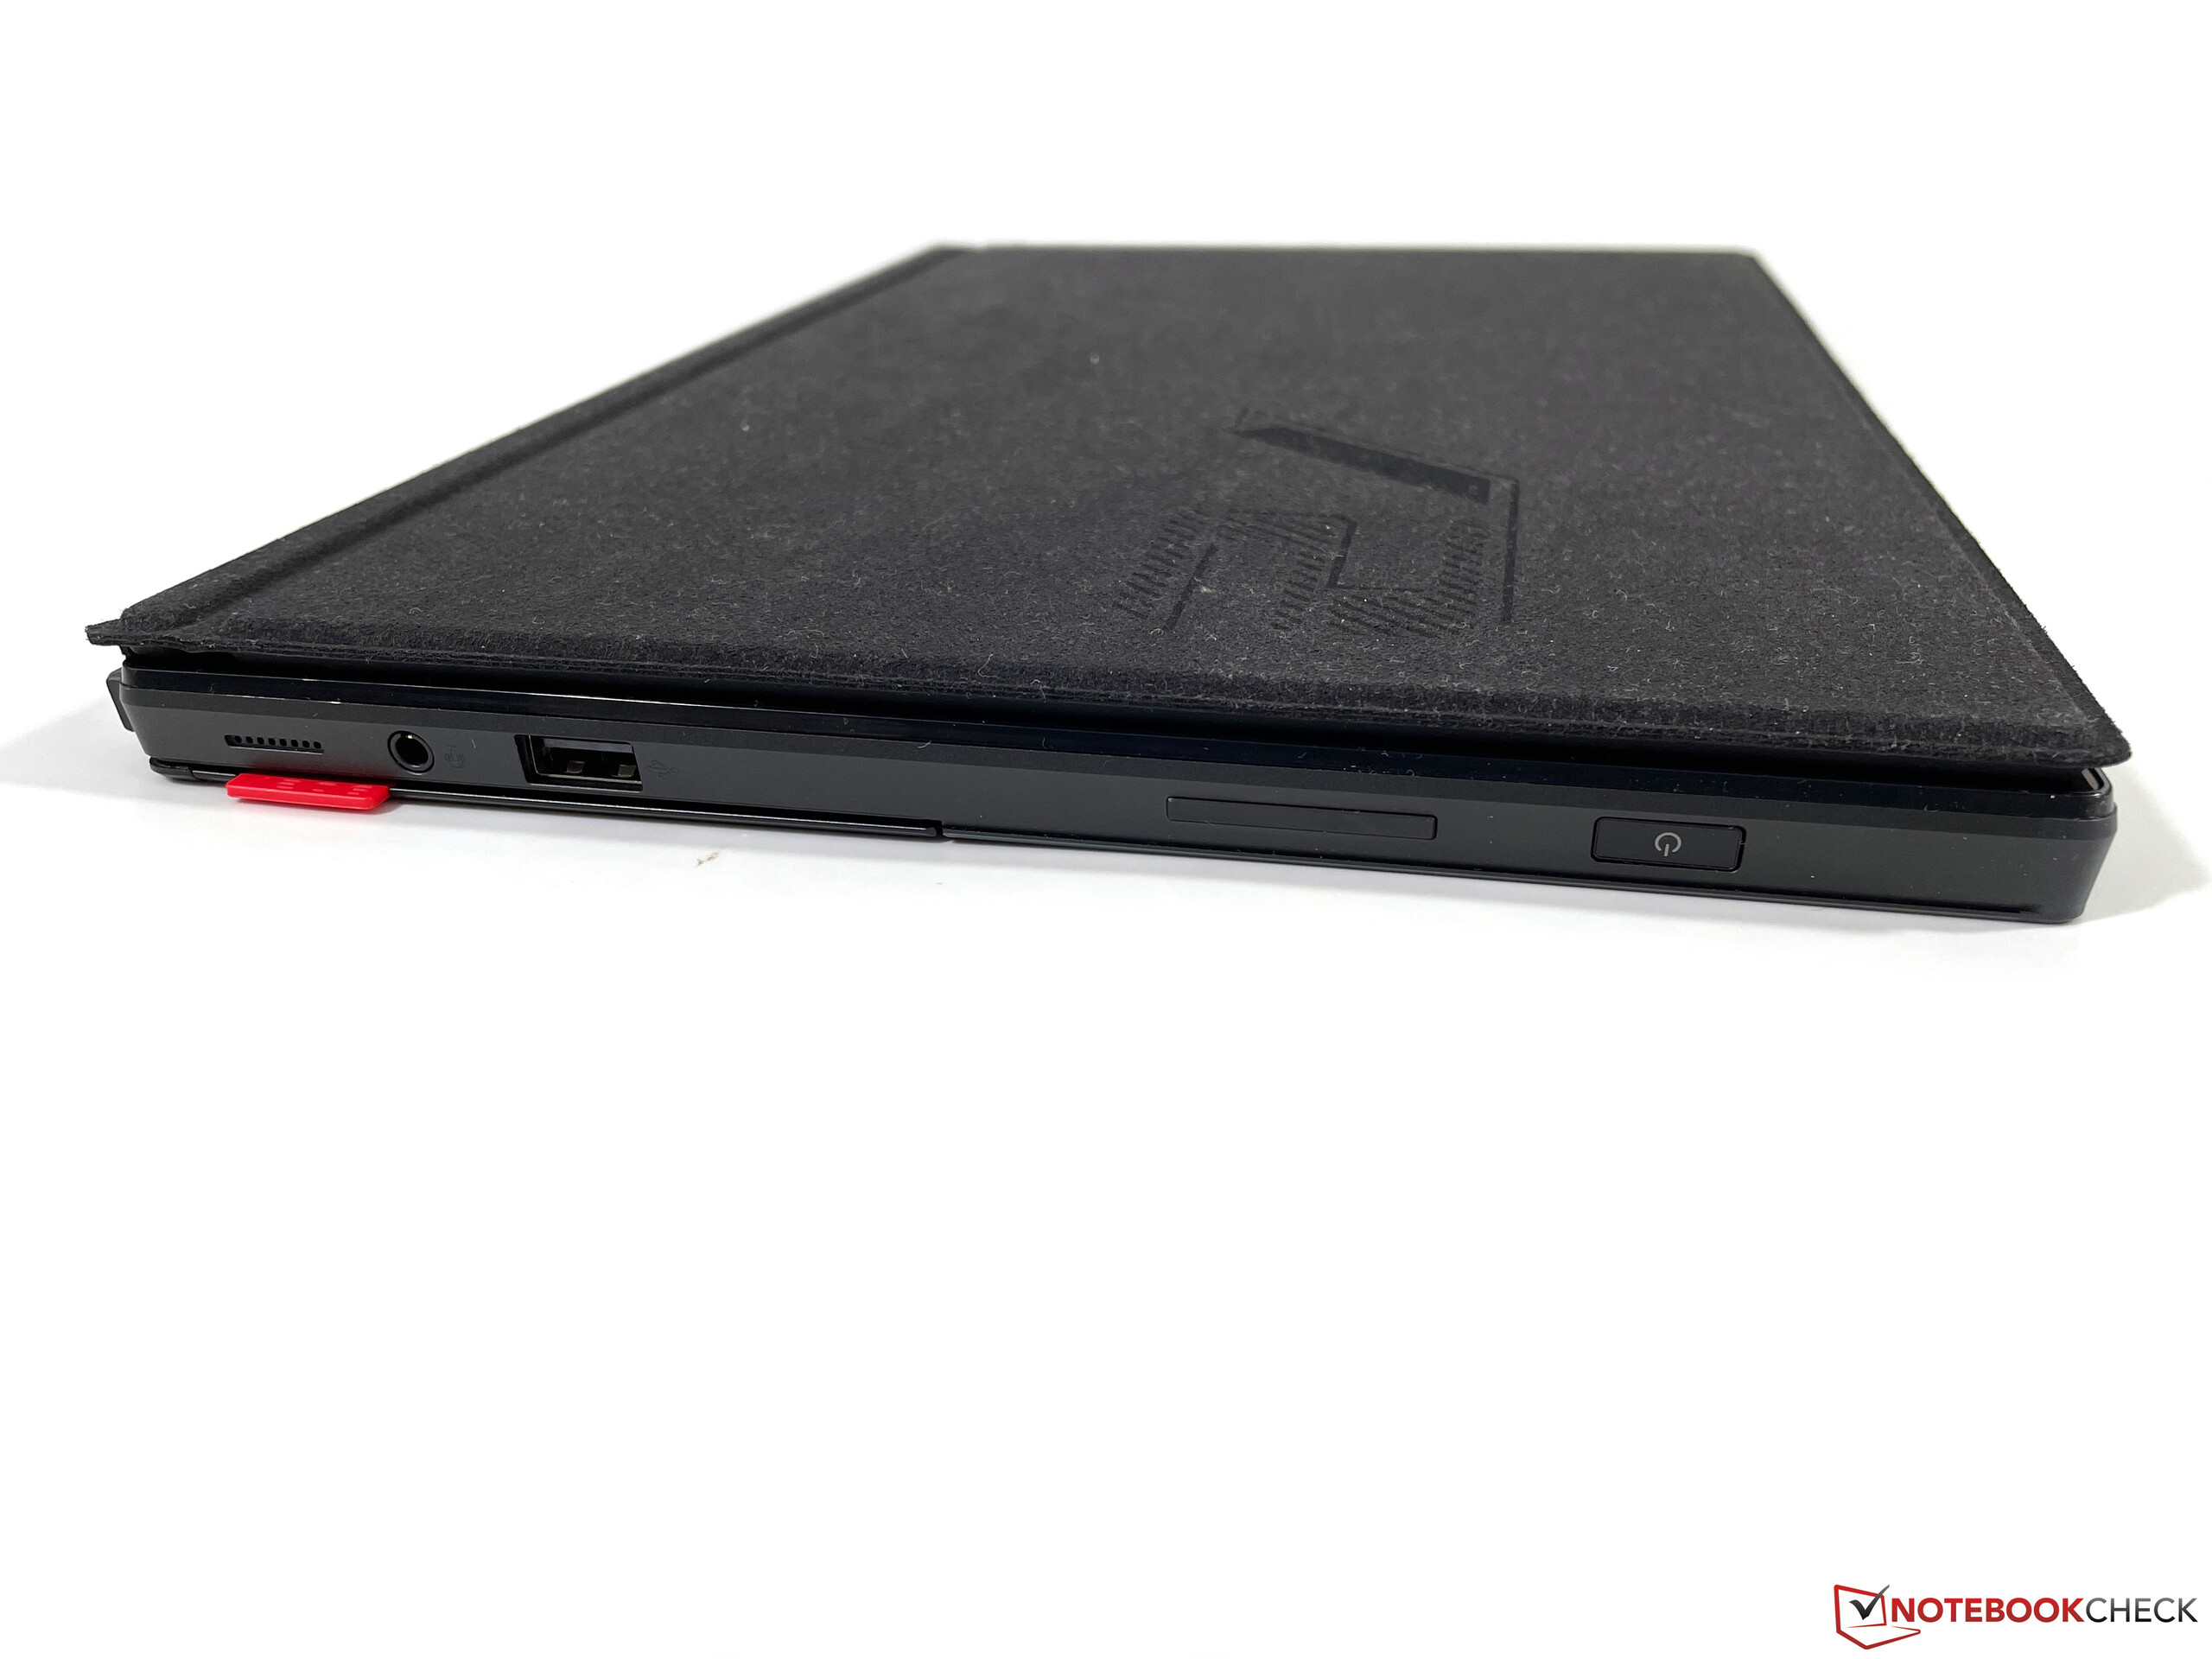
连接性 - Thunderbolt 4与USB 2.0的比较
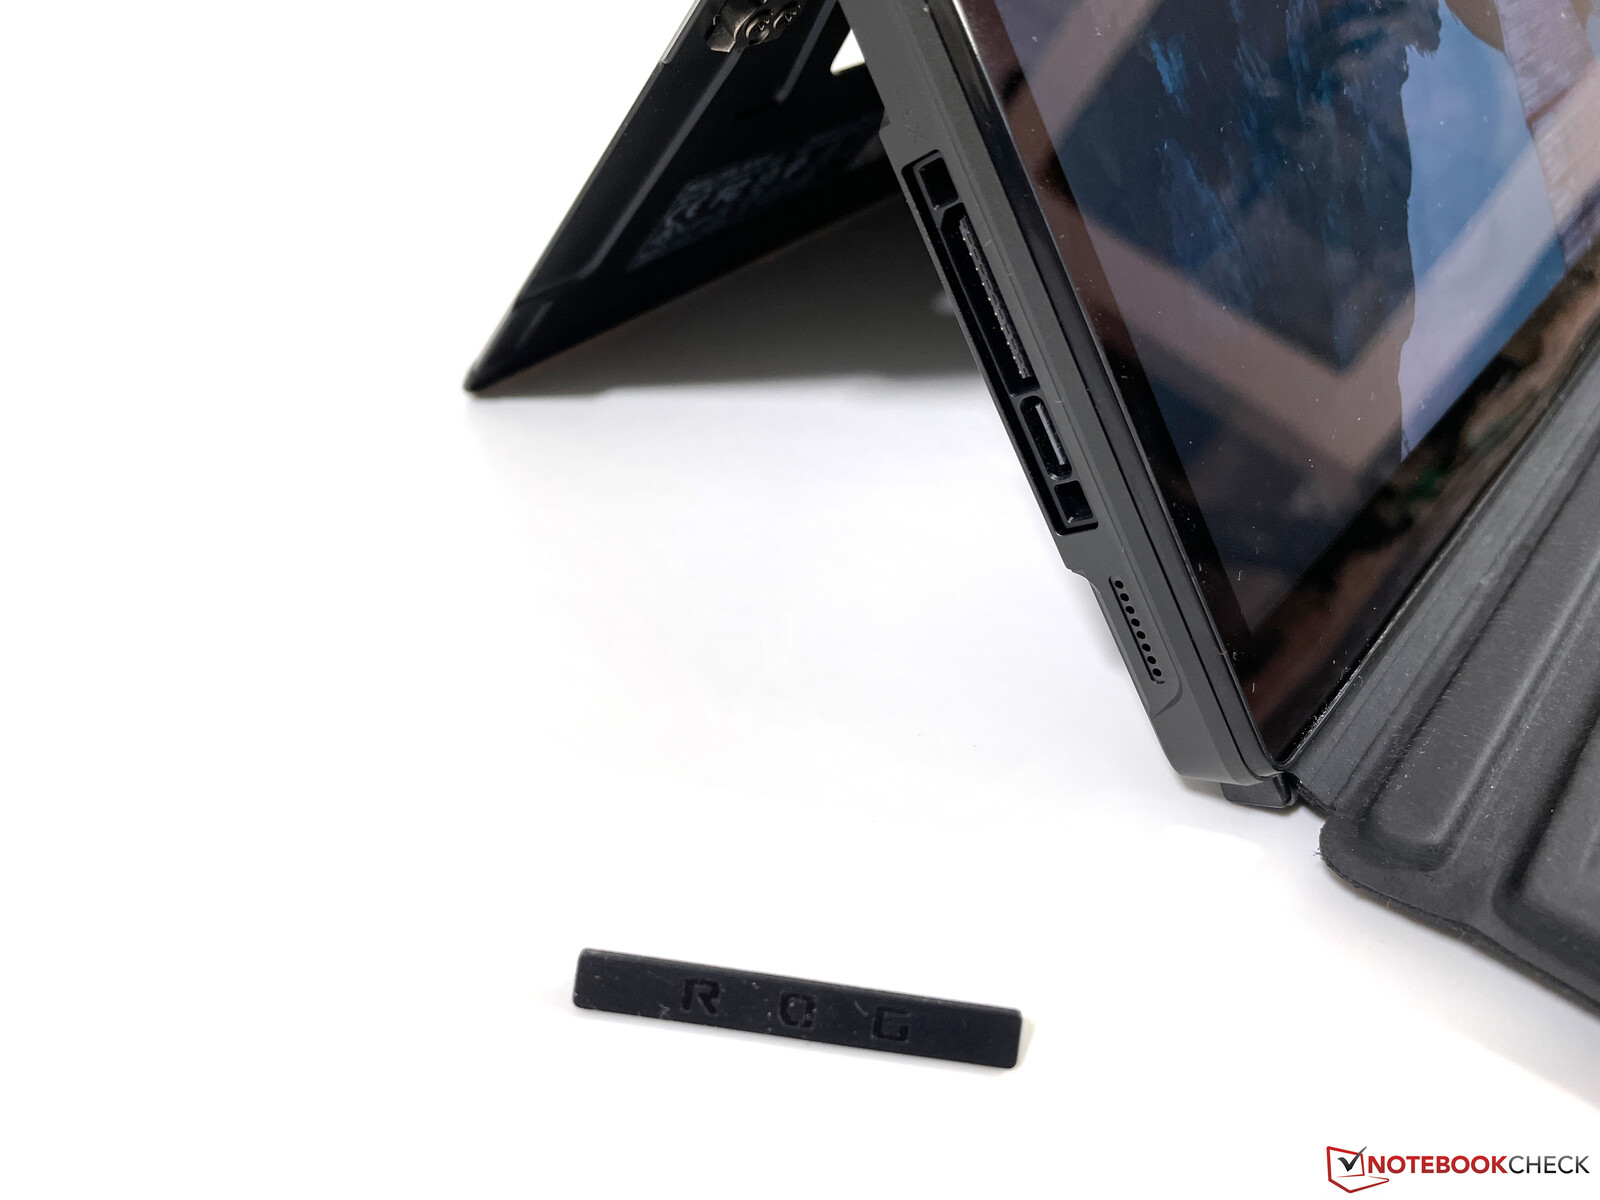
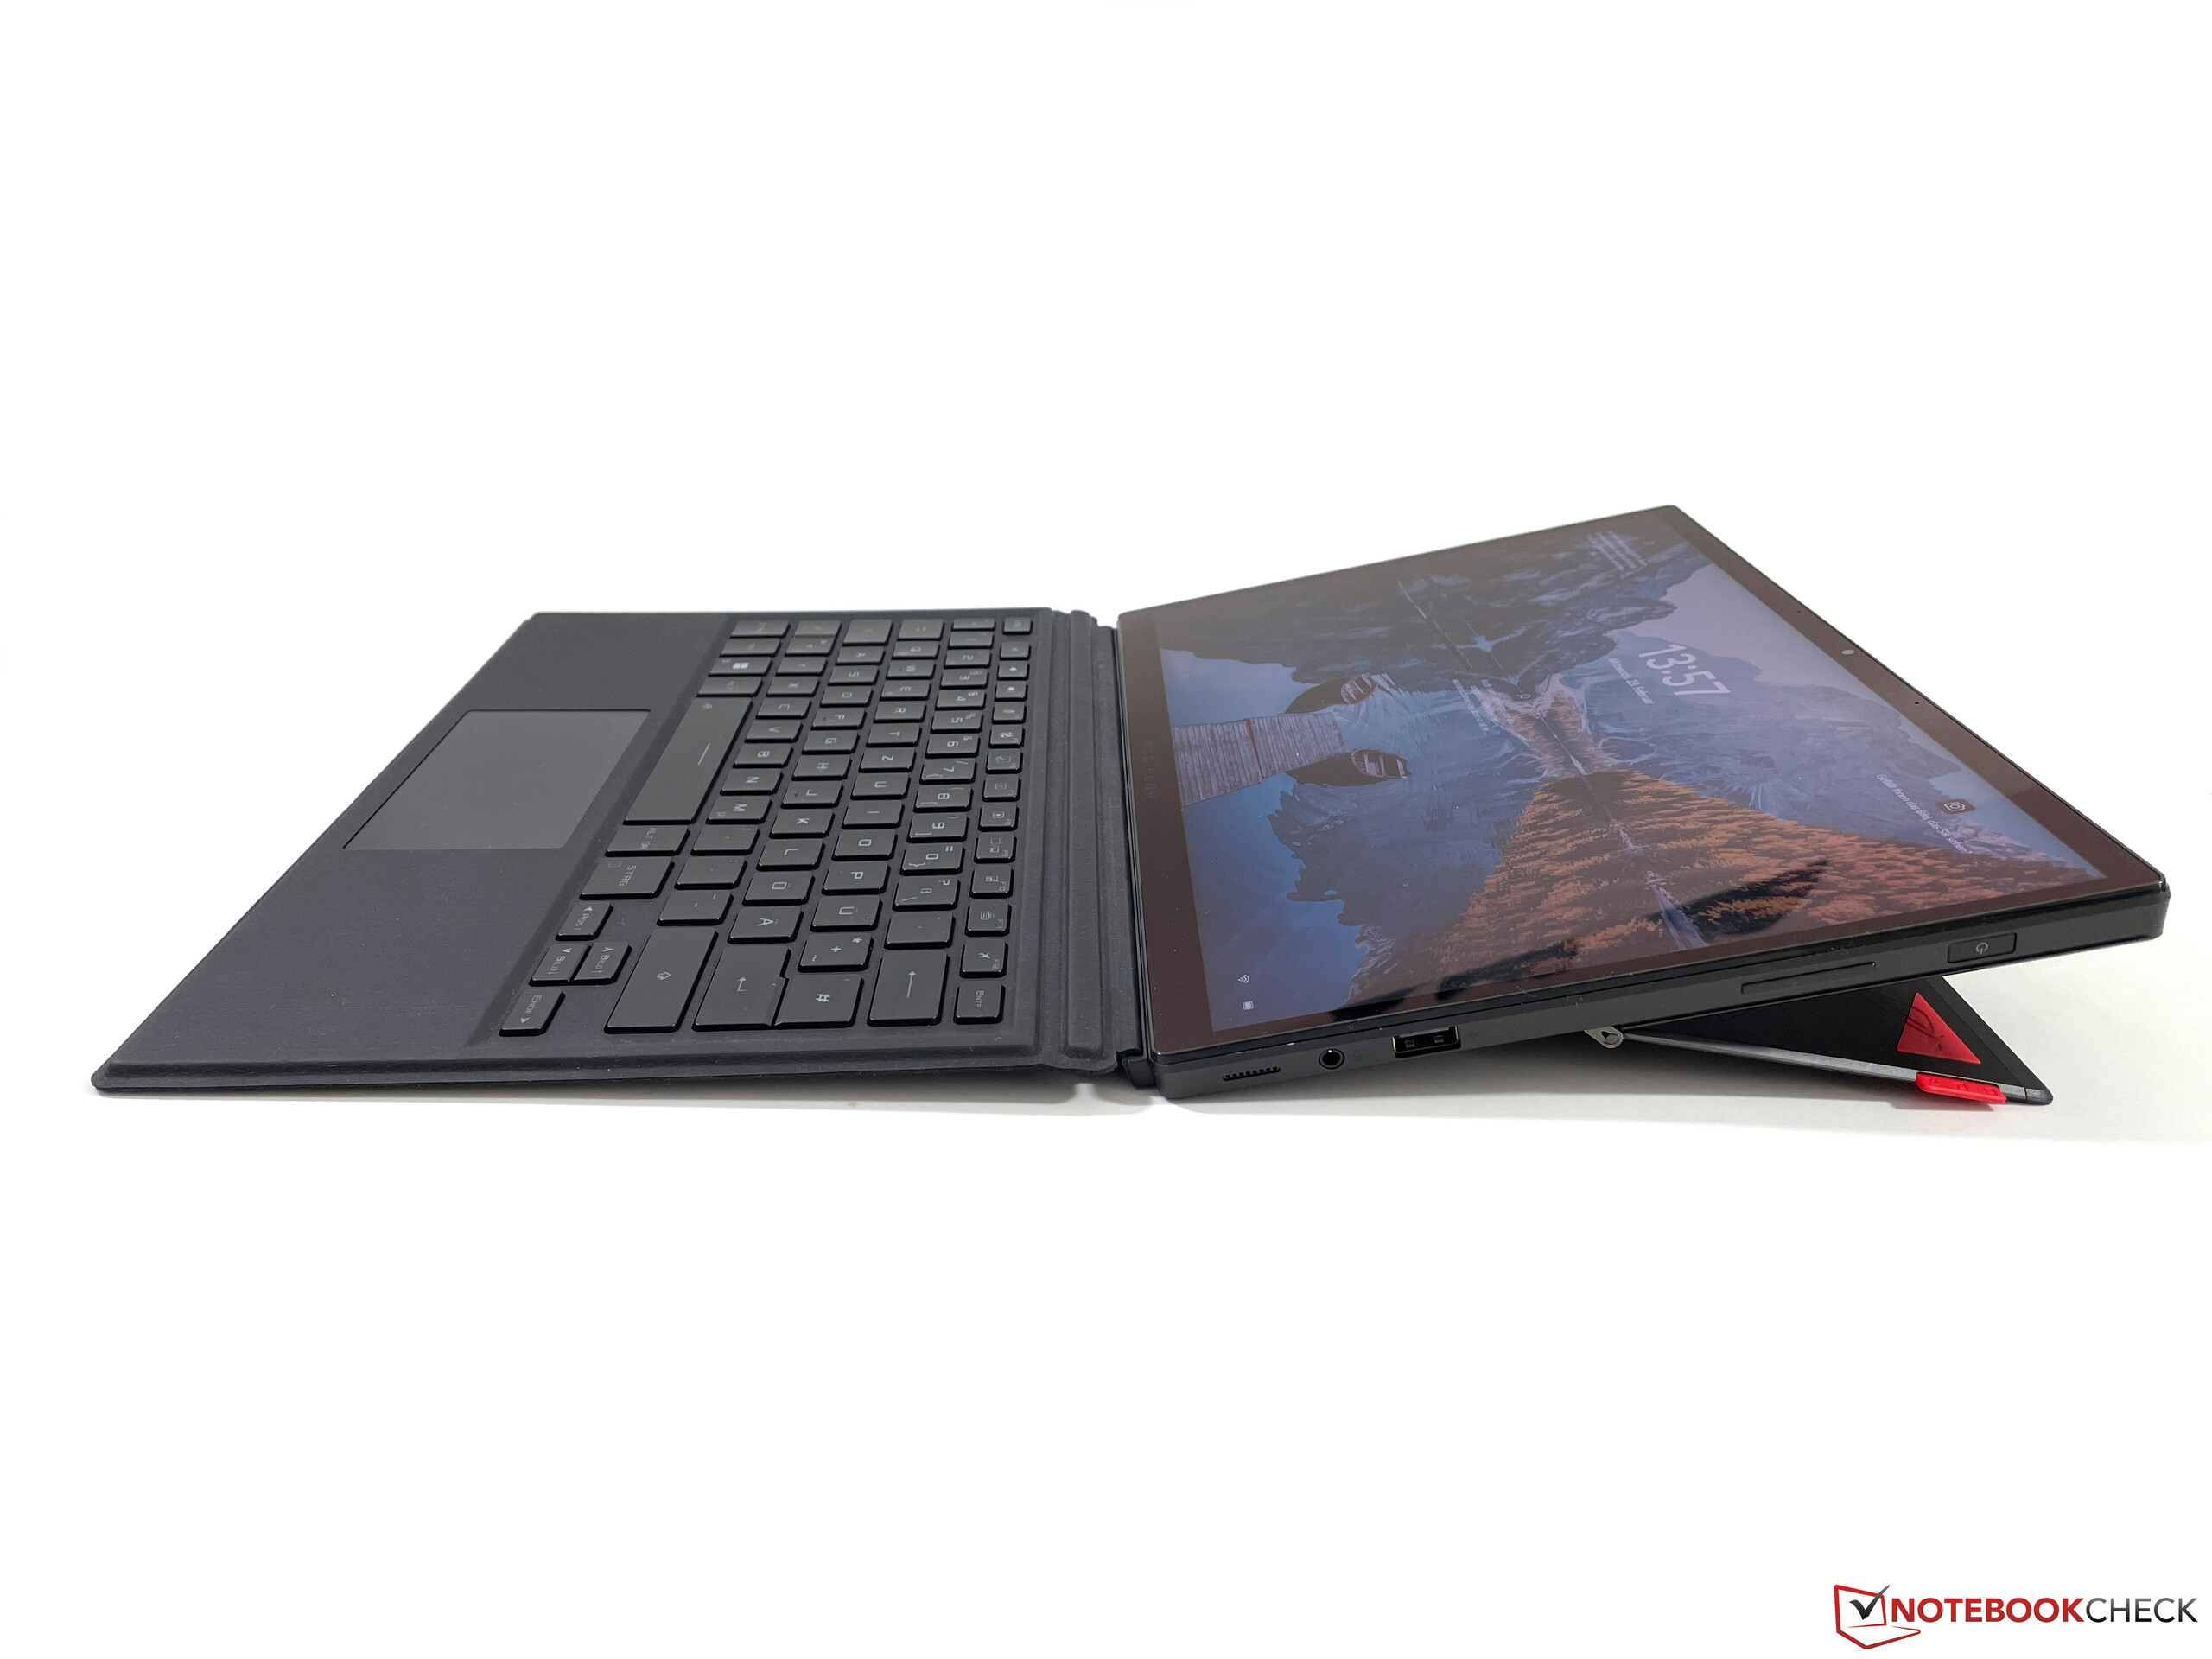
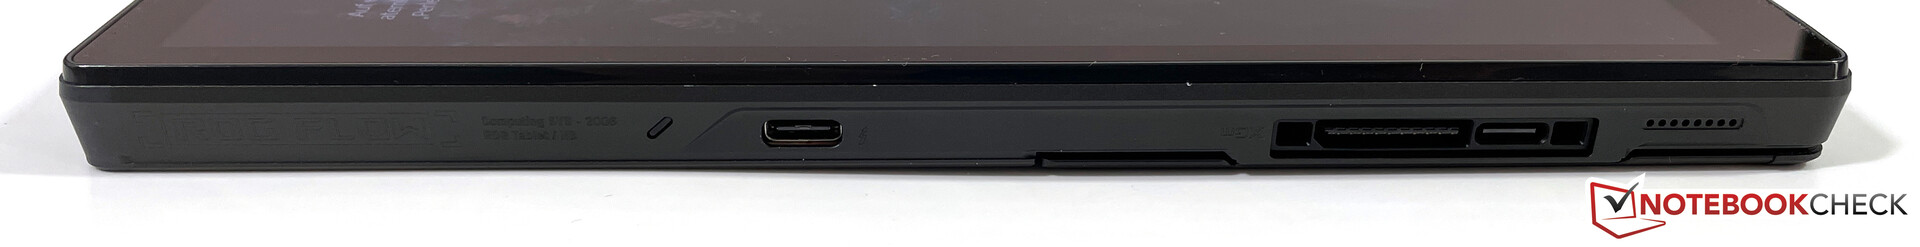
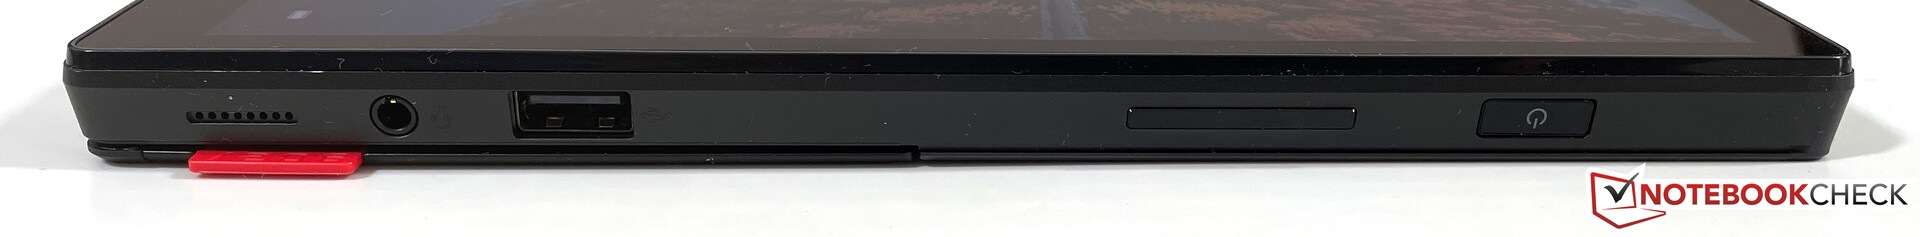
考虑到这是一款平板电脑,可用的端口一点也不差。在左侧,有一个USB-C端口,包括支持Thunderbolt 4,以及一个由USB-C端口和一个具有8个PCIe通道的专有端口组成的小盖子后面的外部图形卡的连接。右侧有一个微型SD读卡器和一个普通的USB-A端口。然而,后者只支持过时的USB 2.0标准,这有点难以理解。
在我们的评测样本中,雷电4端口有问题,因为我们无法通过这个端口给设备充电,无论我们是使用附带的电源适配器还是其他USB-C电源适配器。操作系统只显示一个通知,说设备没有充电,应该使用附带的电源适配器。经过一些研究,我们发现德国机型的雷电4端口不支持充电。我们对此感到非常惊讶,因为充电功能实际上是Thunderbolt 4认证的强制性要求。我们已经就此联系了华硕,一旦收到官方反馈,我们将相应更新这篇文章。
SD卡阅读器
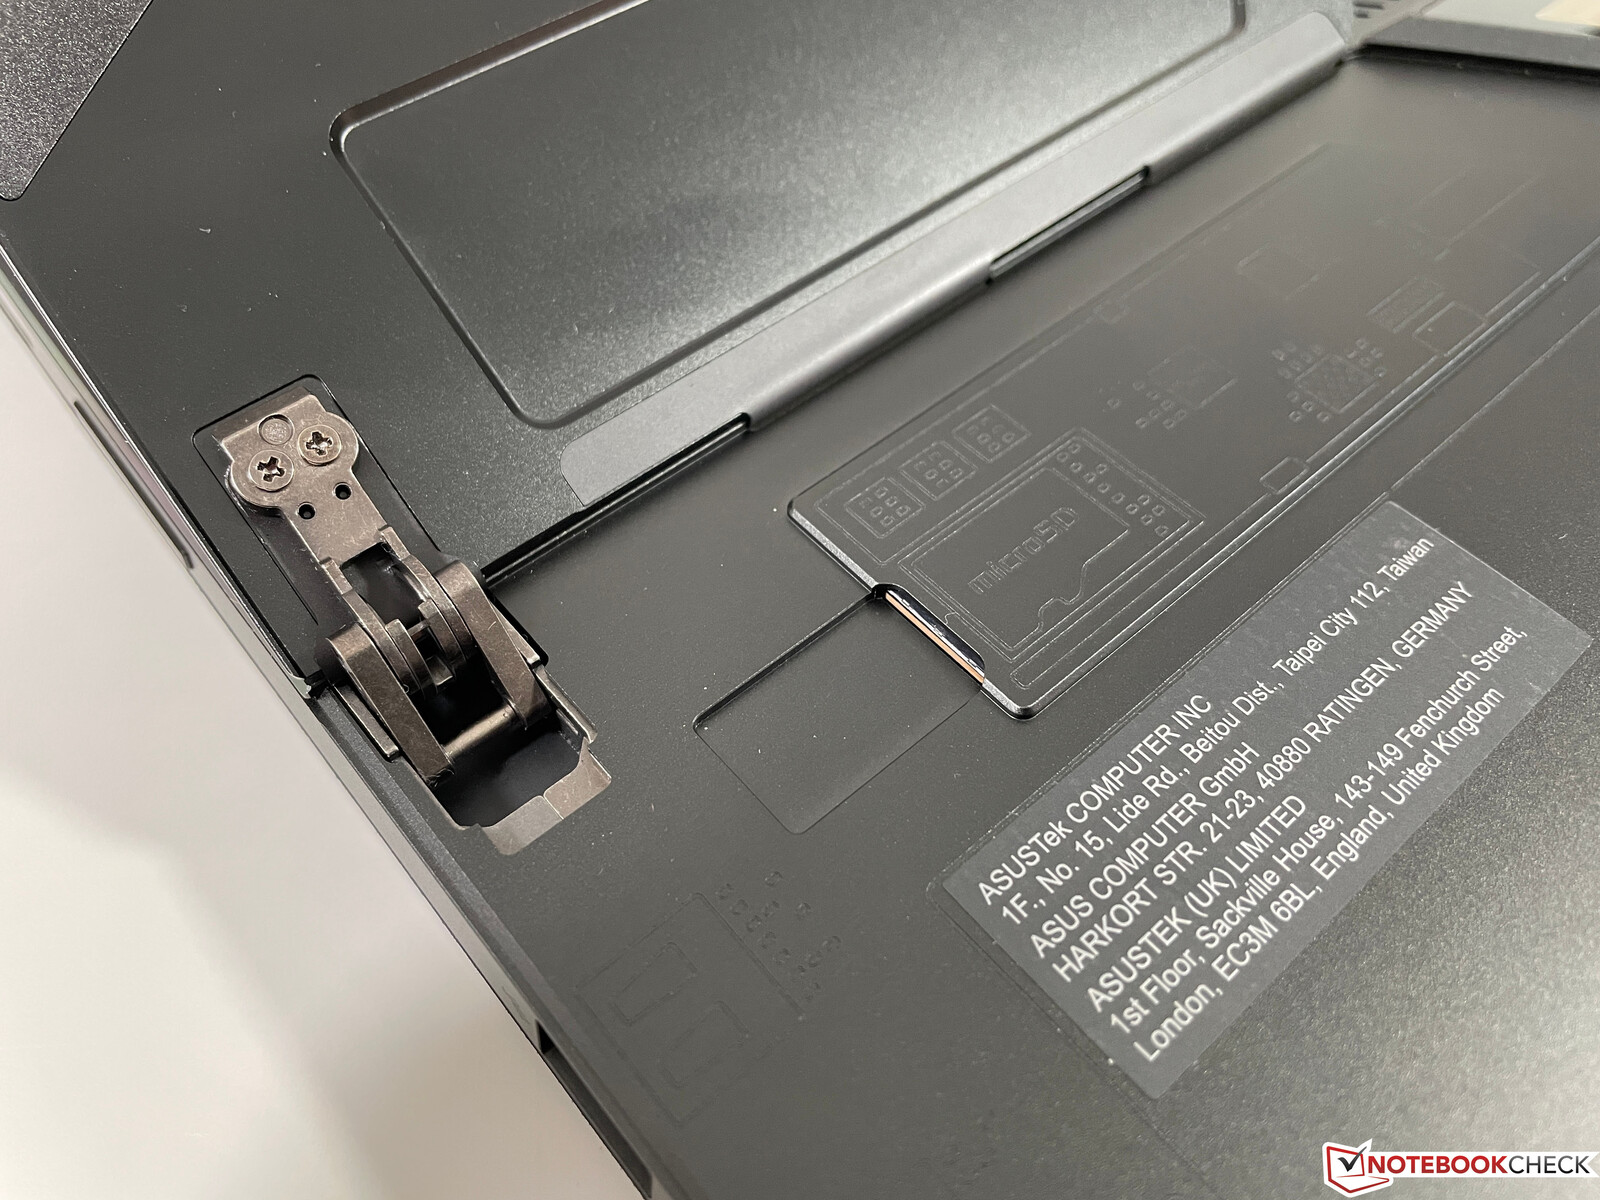
在脚架后面有一个小型microSD读卡器,它能够完全容纳存储卡。读卡器的速度非常快,我们能够用我们的参考卡(Angelbird AV Pro V60)确定一个非常高的最大传输速率,超过260 MB/s。这使Flow Z13在比较领域中稳居榜首。在复制数据时,性能稍低,但超过100MB/s的结果仍然很好。
| SD Card Reader | |
| average JPG Copy Test (av. of 3 runs) | |
| Average of class Gaming (20.9 - 210, n=54, last 2 years) | |
| Asus ROG Flow Z13 GZ301ZE (Angelbird AV Pro V60) | |
| Schenker Vision 14 (Angelbird AV Pro V60) | |
| maximum AS SSD Seq Read Test (1GB) | |
| Asus ROG Flow Z13 GZ301ZE (Angelbird AV Pro V60) | |
| Average of class Gaming (25.5 - 261, n=51, last 2 years) | |
| Schenker Vision 14 (Angelbird AV Pro V60) | |
沟通
华硕集成了英特尔的尖端Wi-Fi 6E模块(AX210E),它支持所有现代标准,包括蓝牙5.2。Wi-Fi 6E在欧洲仍有一些问题,目前你只能用技巧让它工作,但至少你在未来几年有了最佳装备。与我们的参考路由器(Netgear AX12)连接的传输速率非常好,我们在测试期间没有注意到任何信号质量问题,无论是与Wi-Fi 6路由器还是与FritzBox 7490(Wi-Fi 5)。然而,没有集成的LTE或5G调制解调器可用。
网络摄像头
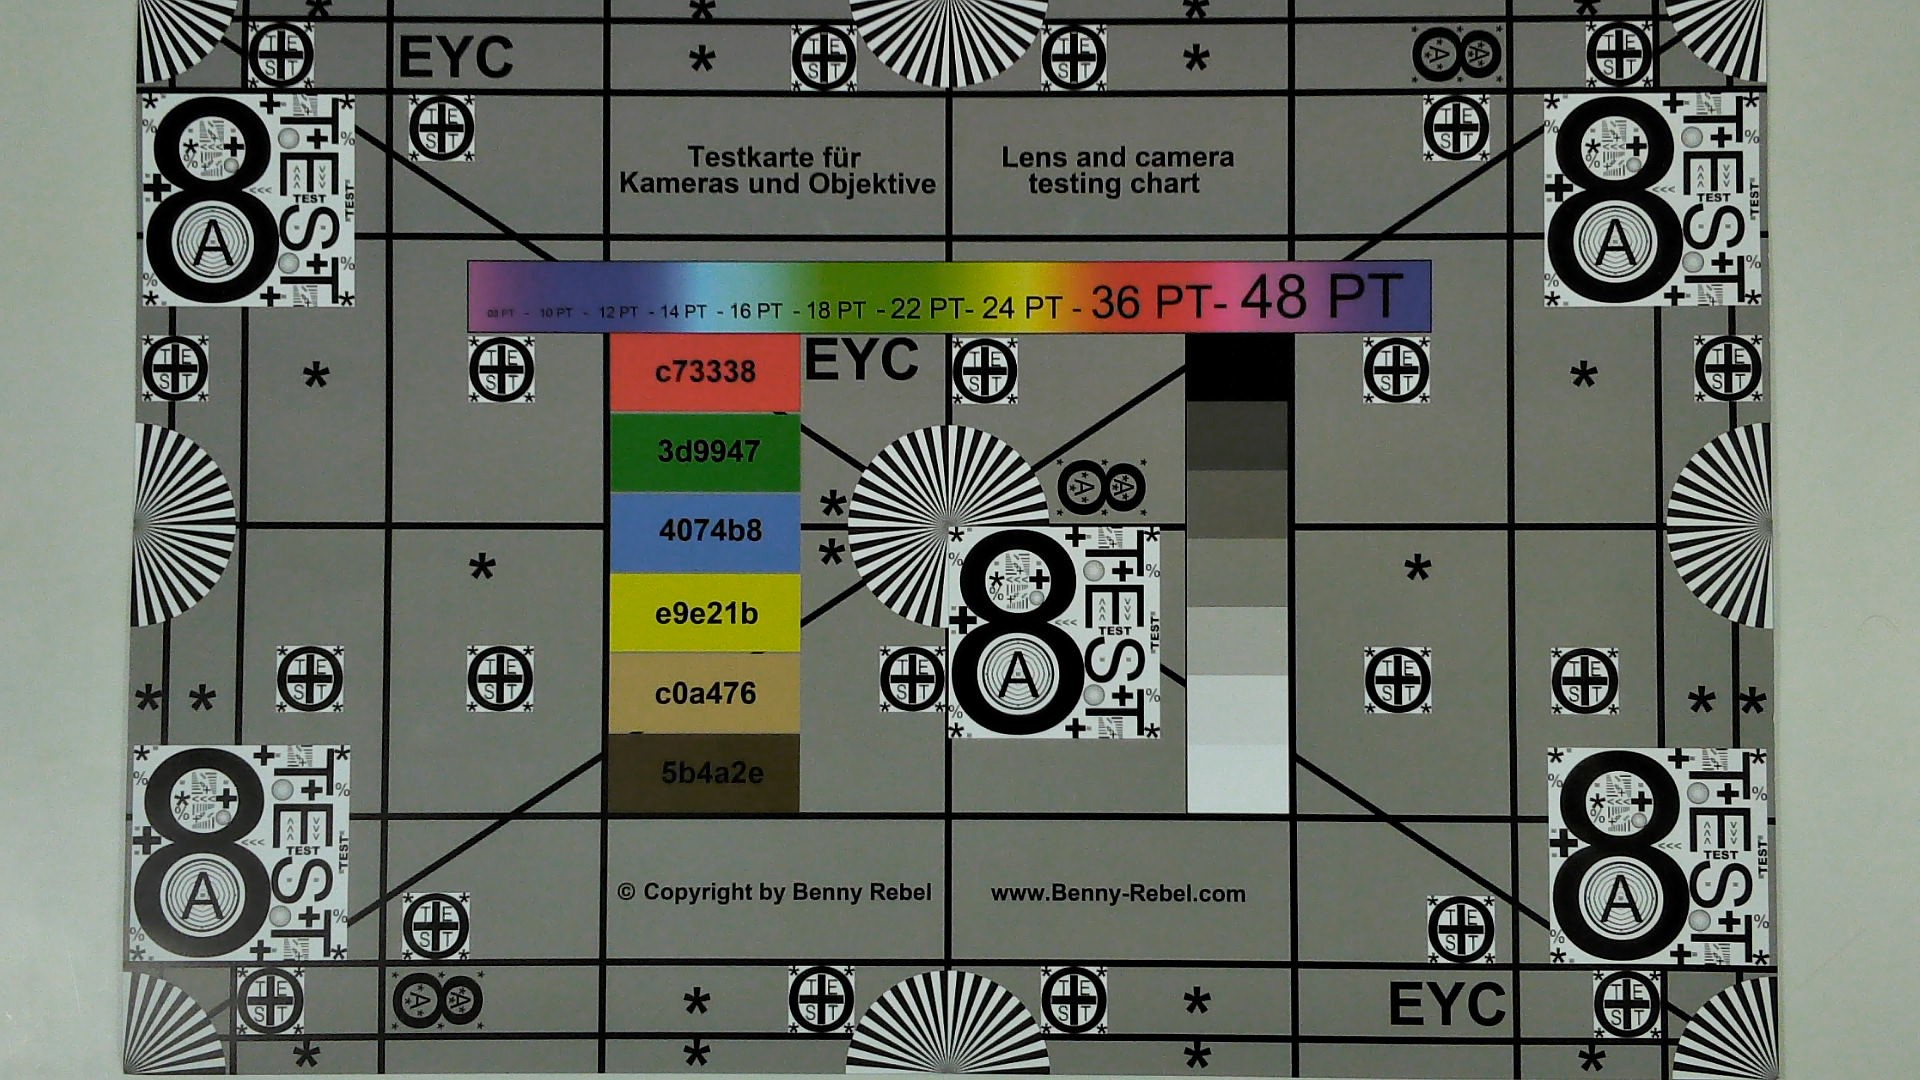
ROG Flow Z13配备了两个摄像头。背面有一个800万像素的传感器,只要曝光正确,就可以拍出非常体面的照片。前面只有720p的传感器(90万像素),但照片相对较好。当然,这里仍有很大的改进空间,但我们也见过更差的720p相机。


辅料
华硕为ROG Flow Z13默认配备了键盘盖,但在诱人的包装中没有包含其他配件。当然,XG Mobile eGPU是可选的,我们已经有机会将其与ROG Flow Z13一起测试。 ROG Flow X13.此外,还有华硕笔和各种输入设备,以及带有ROG品牌的耳机。
维护
ROG Flow Z13的外壳不能被用户打开,而且几乎每个部件也都是焊接的。然而,背面至少有一个小的维护舱口,可以接触到M.2-2230固态硬盘,可以进行更换。但在存储部分会有更多关于这个问题的介绍。
输入设备 - 带有Aura同步功能的摇摆式键盘
键盘
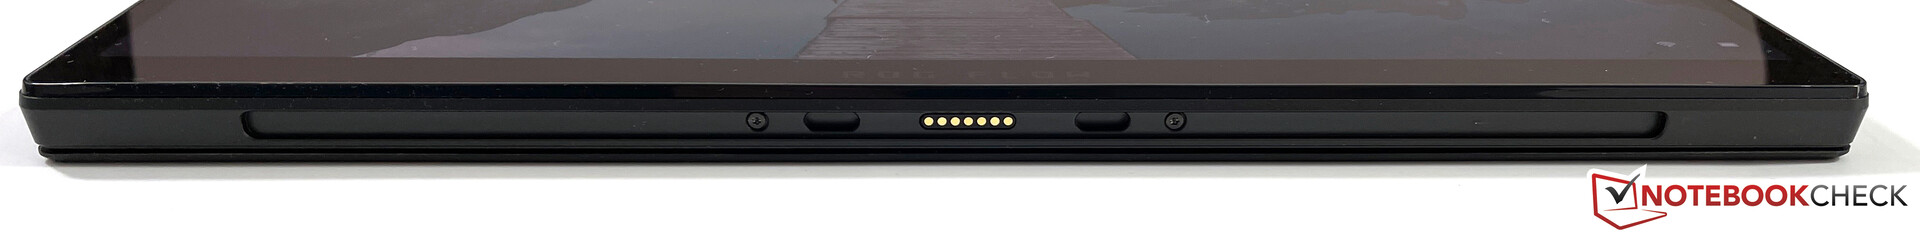
ROG Flow Z13配备了一个键盘盖,该键盘盖使用Pogo引脚磁力吸附在平板电脑的底部,同时也可以供电。与 键盘盖与Surface Pro一样,键盘可以平放或以小角度使用(见图片)。这里的问题是,键盘的材料保留了一点角度,所以键盘从表面略微抬起,打字时就会出现问题,例如,当你想在桌子上再次以平面形式使用它时。这有点影响打字的稳定性,但这是这类键盘套的常态。
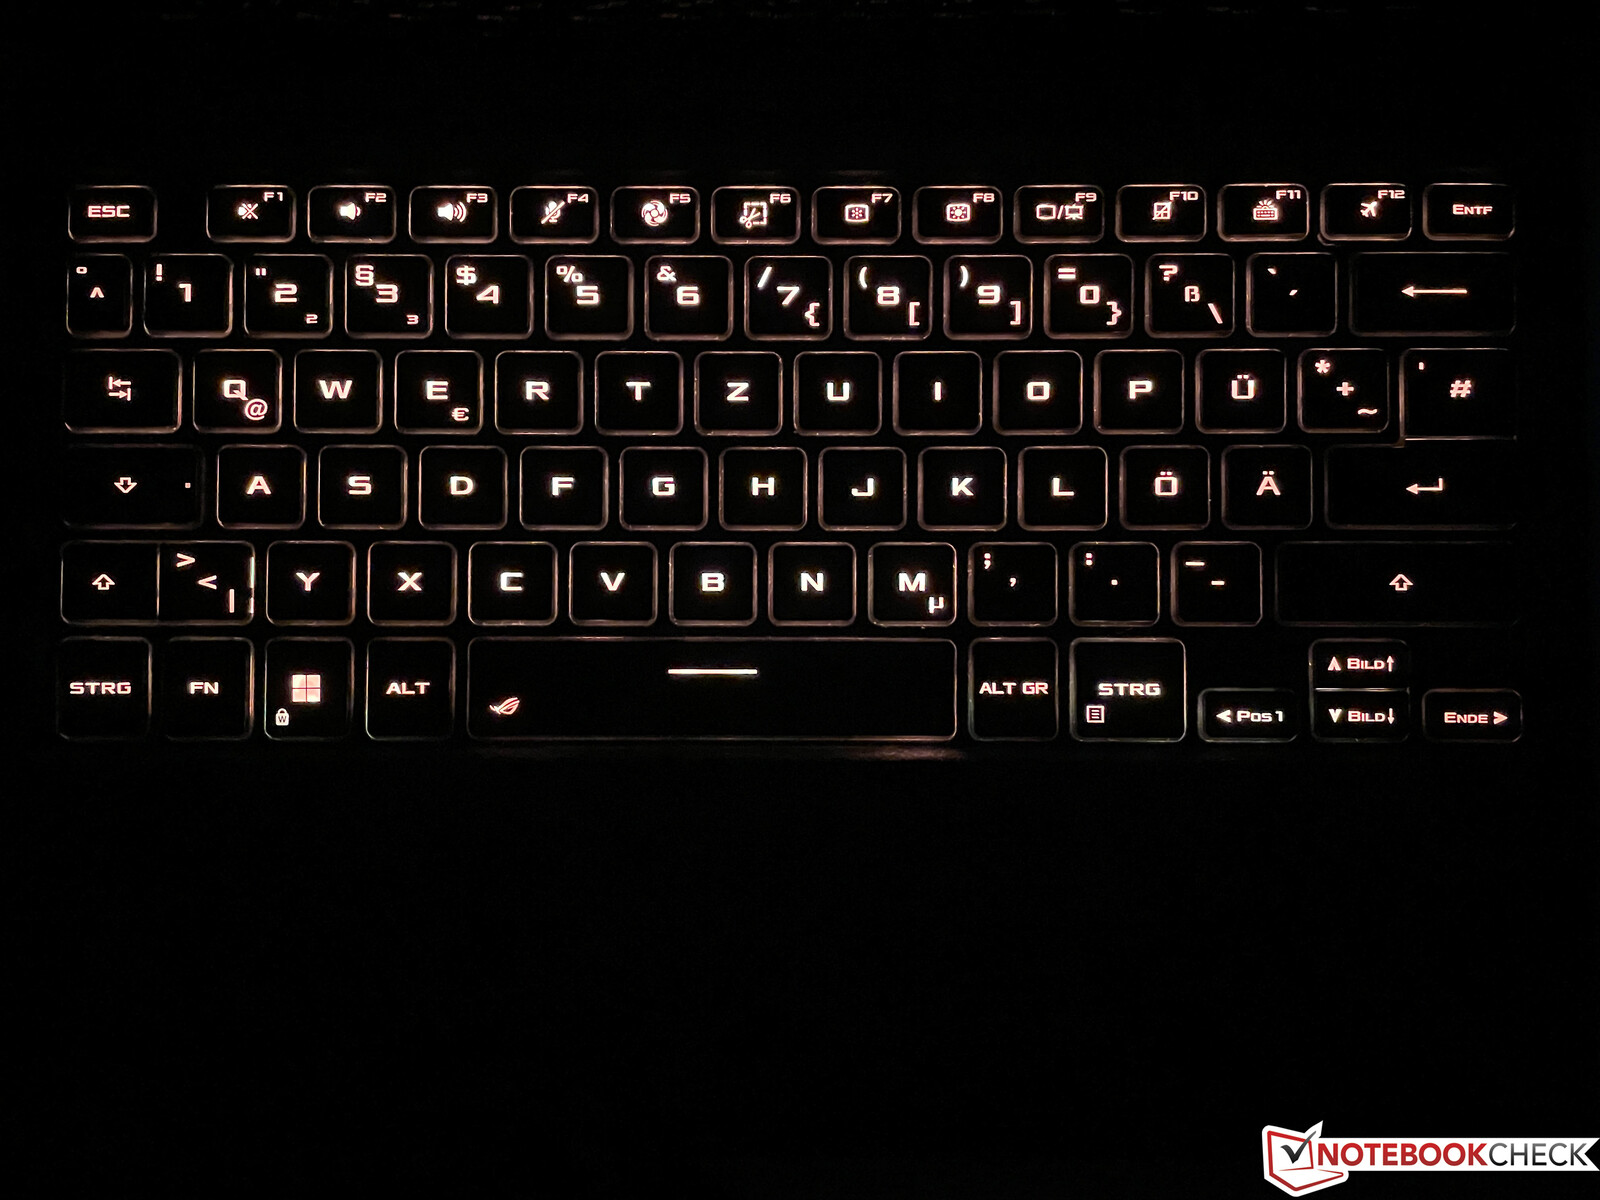
不过,按键本身的机械性能还是不错的。键程不是太短(1.7毫米),而且可以同时注册几个键(N键滚动)。然而,在实践中,你几乎总是需要激活键盘背光(RGB,一个区域,支持Aura Sync),因为黑键和它们的标签之间的对比不是最佳的。键盘提供了德国的QWERTZ布局,但为了实现这一目标,必须做出一些妥协,如单行回车键或小方向键。
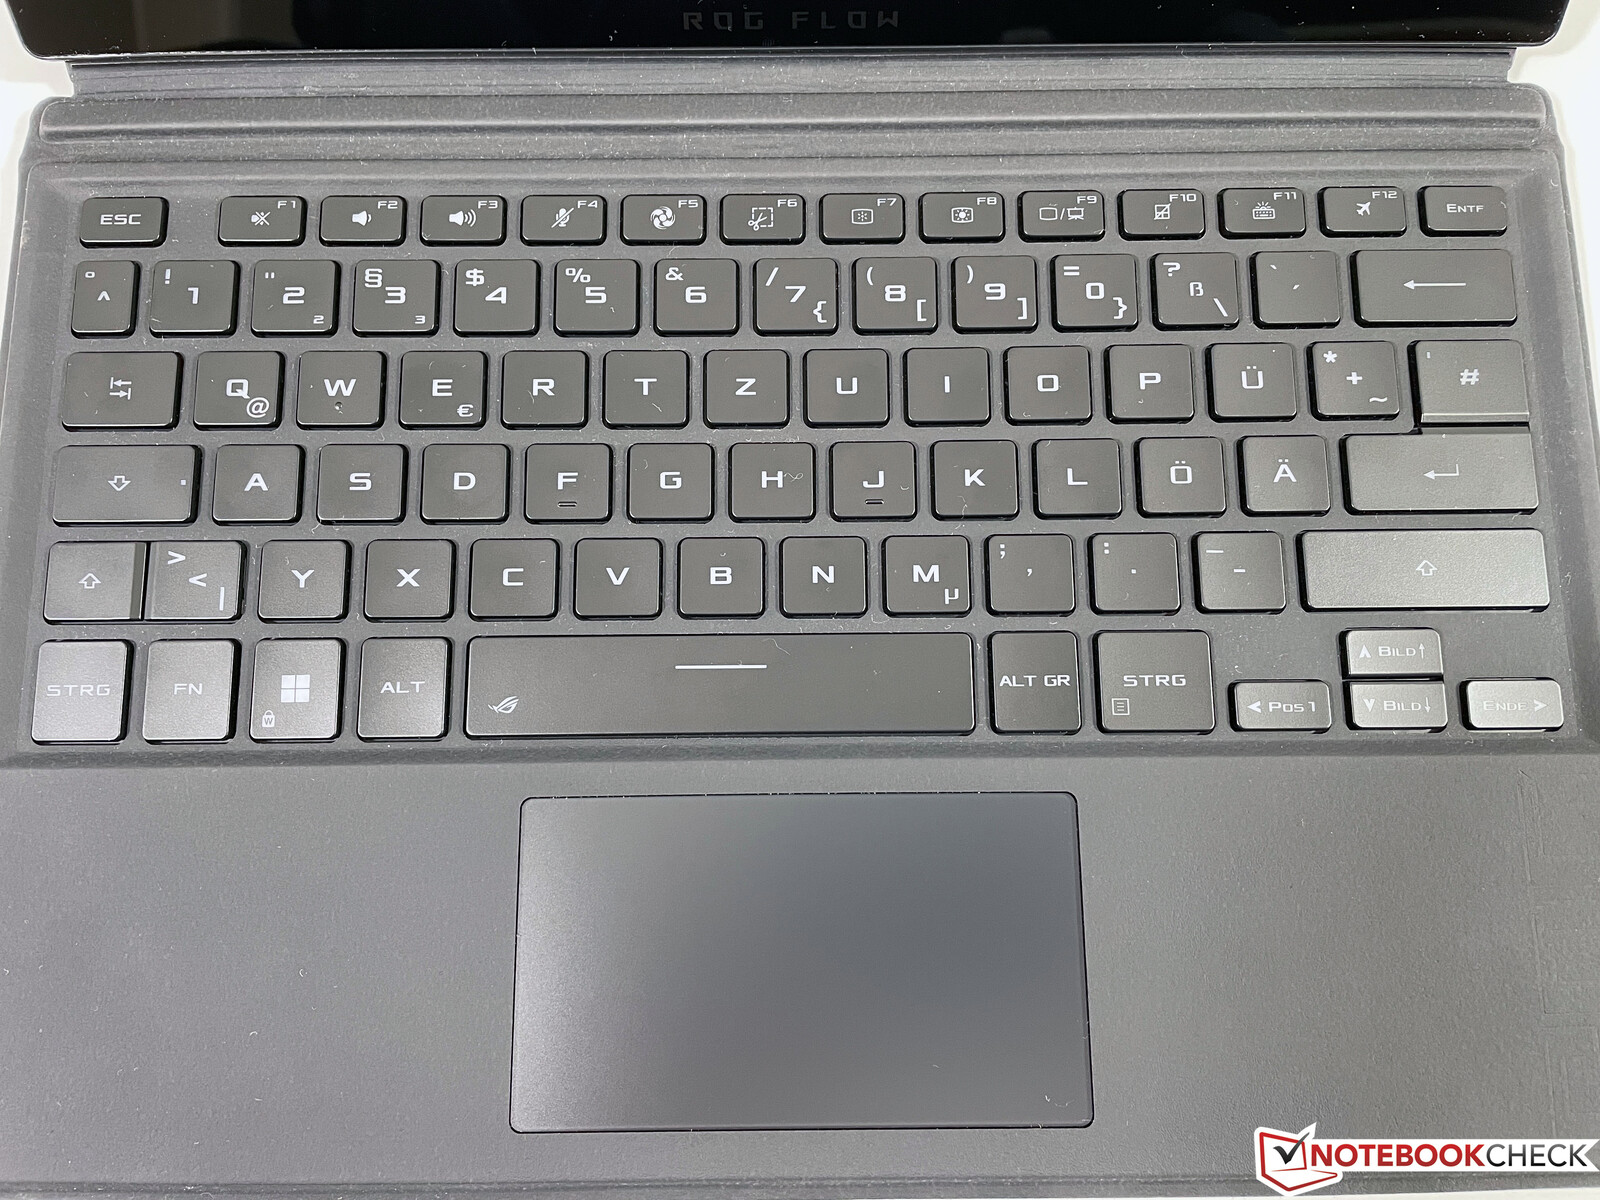
小巧的ClickPad(9.8 x 5.6厘米)提供了良好的滑行性能,鼠标控制也没有问题,但小的表面不是特别适合做手势。鼠标垫的下部也可以被按下,但这时会出现非常响亮的、听起来很廉价的点击噪音。然而,我们推测大多数用户无论如何都会使用外部鼠标,特别是在游戏时。此外,电容式触摸屏仍可用于日常使用,而且效果非常好。
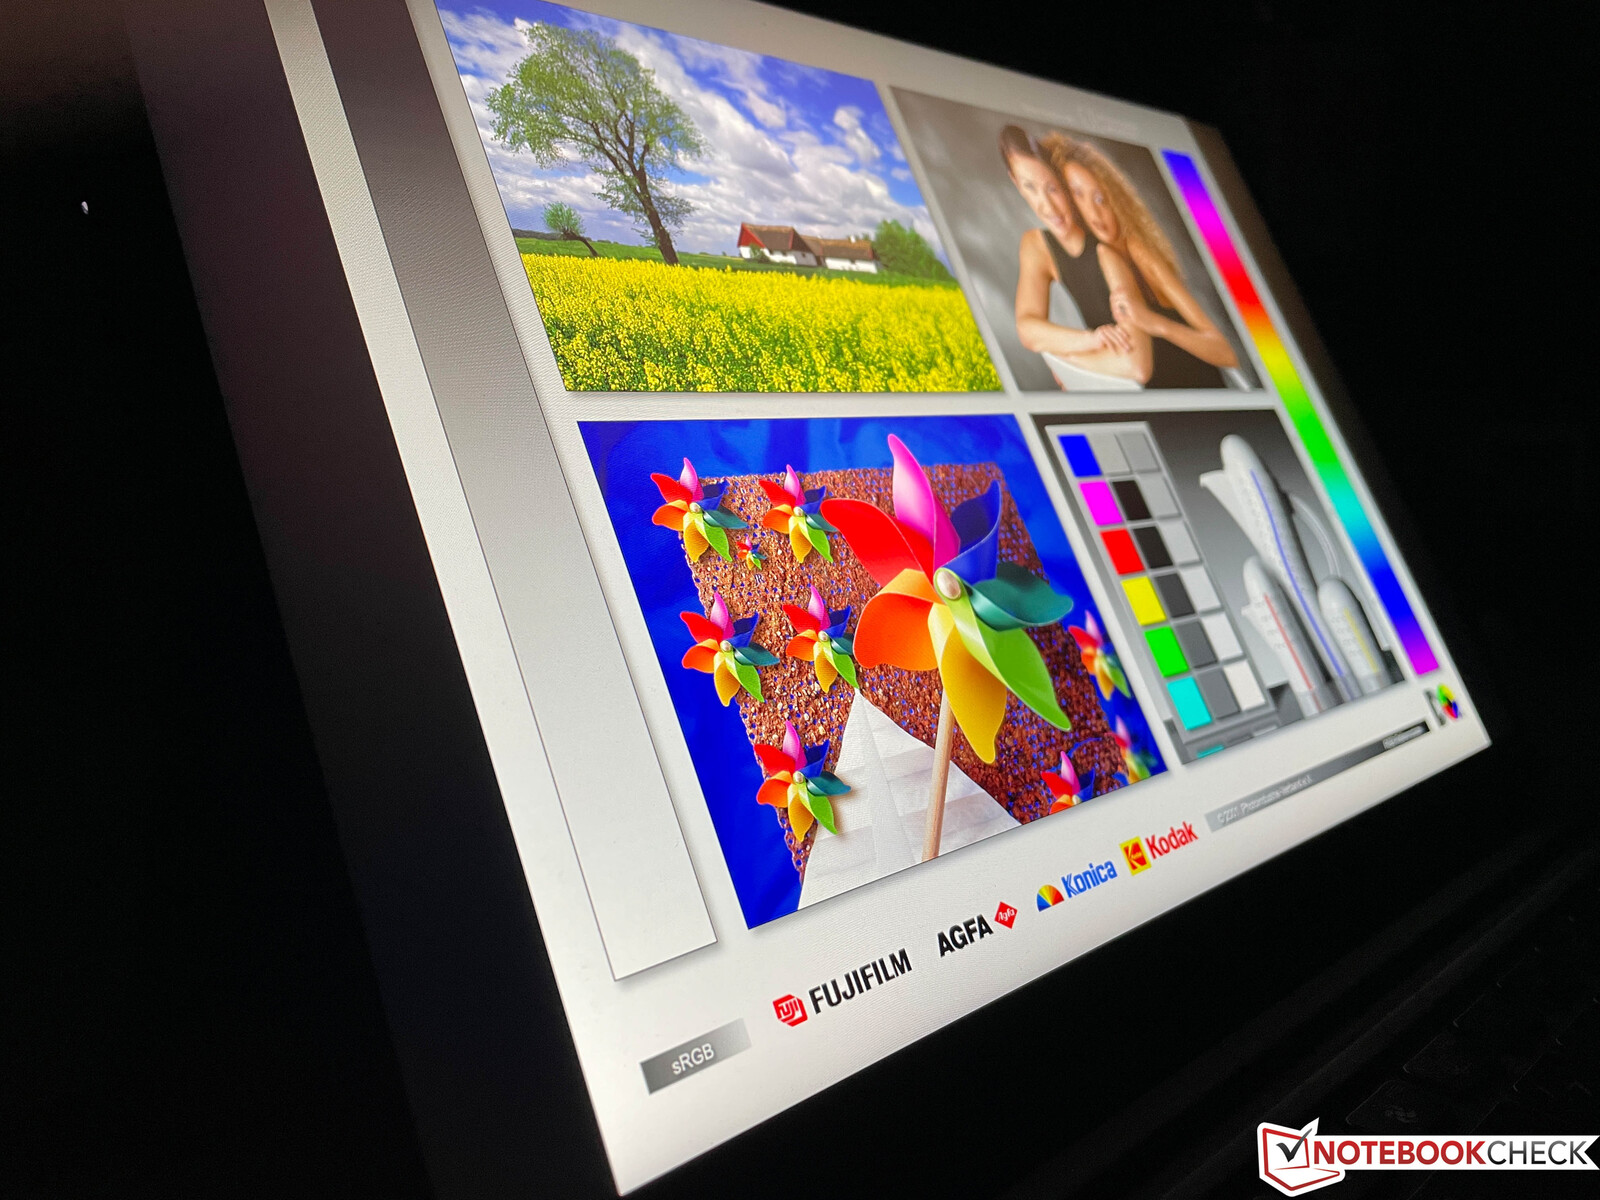
显示屏--华硕为游戏平板电脑提供了全高清或4K显示。

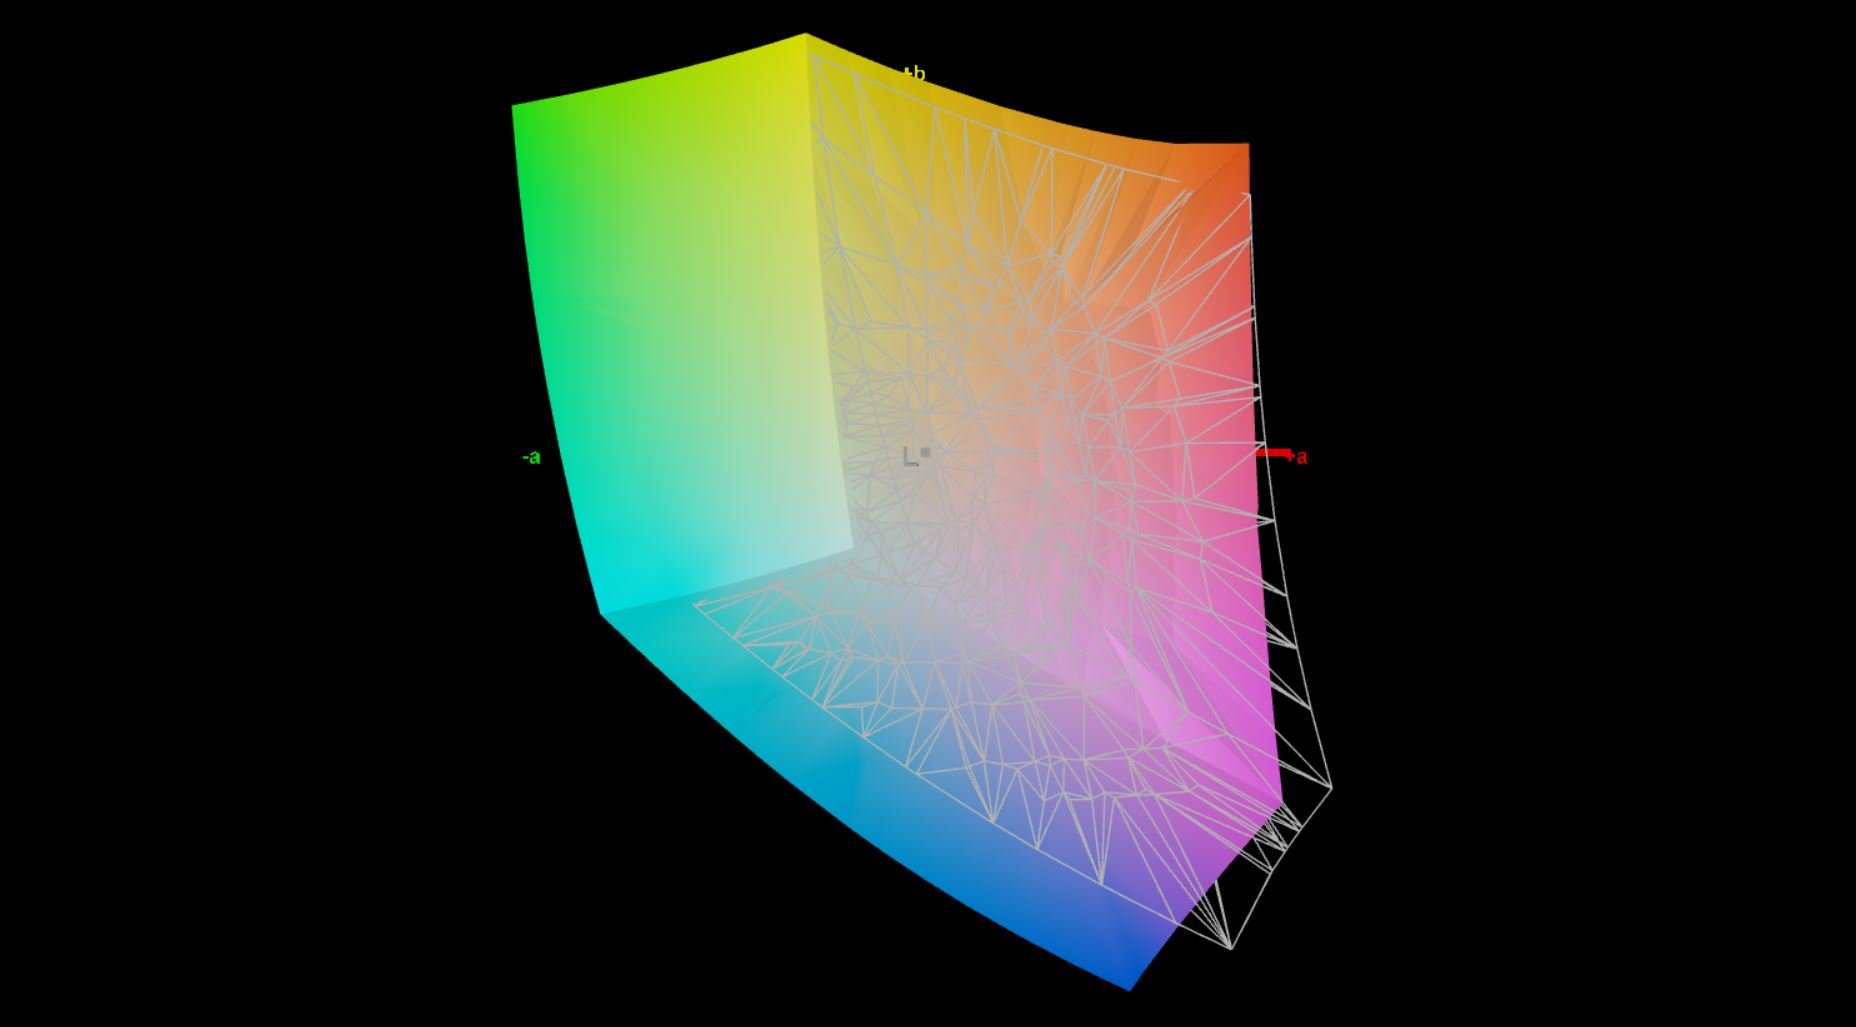
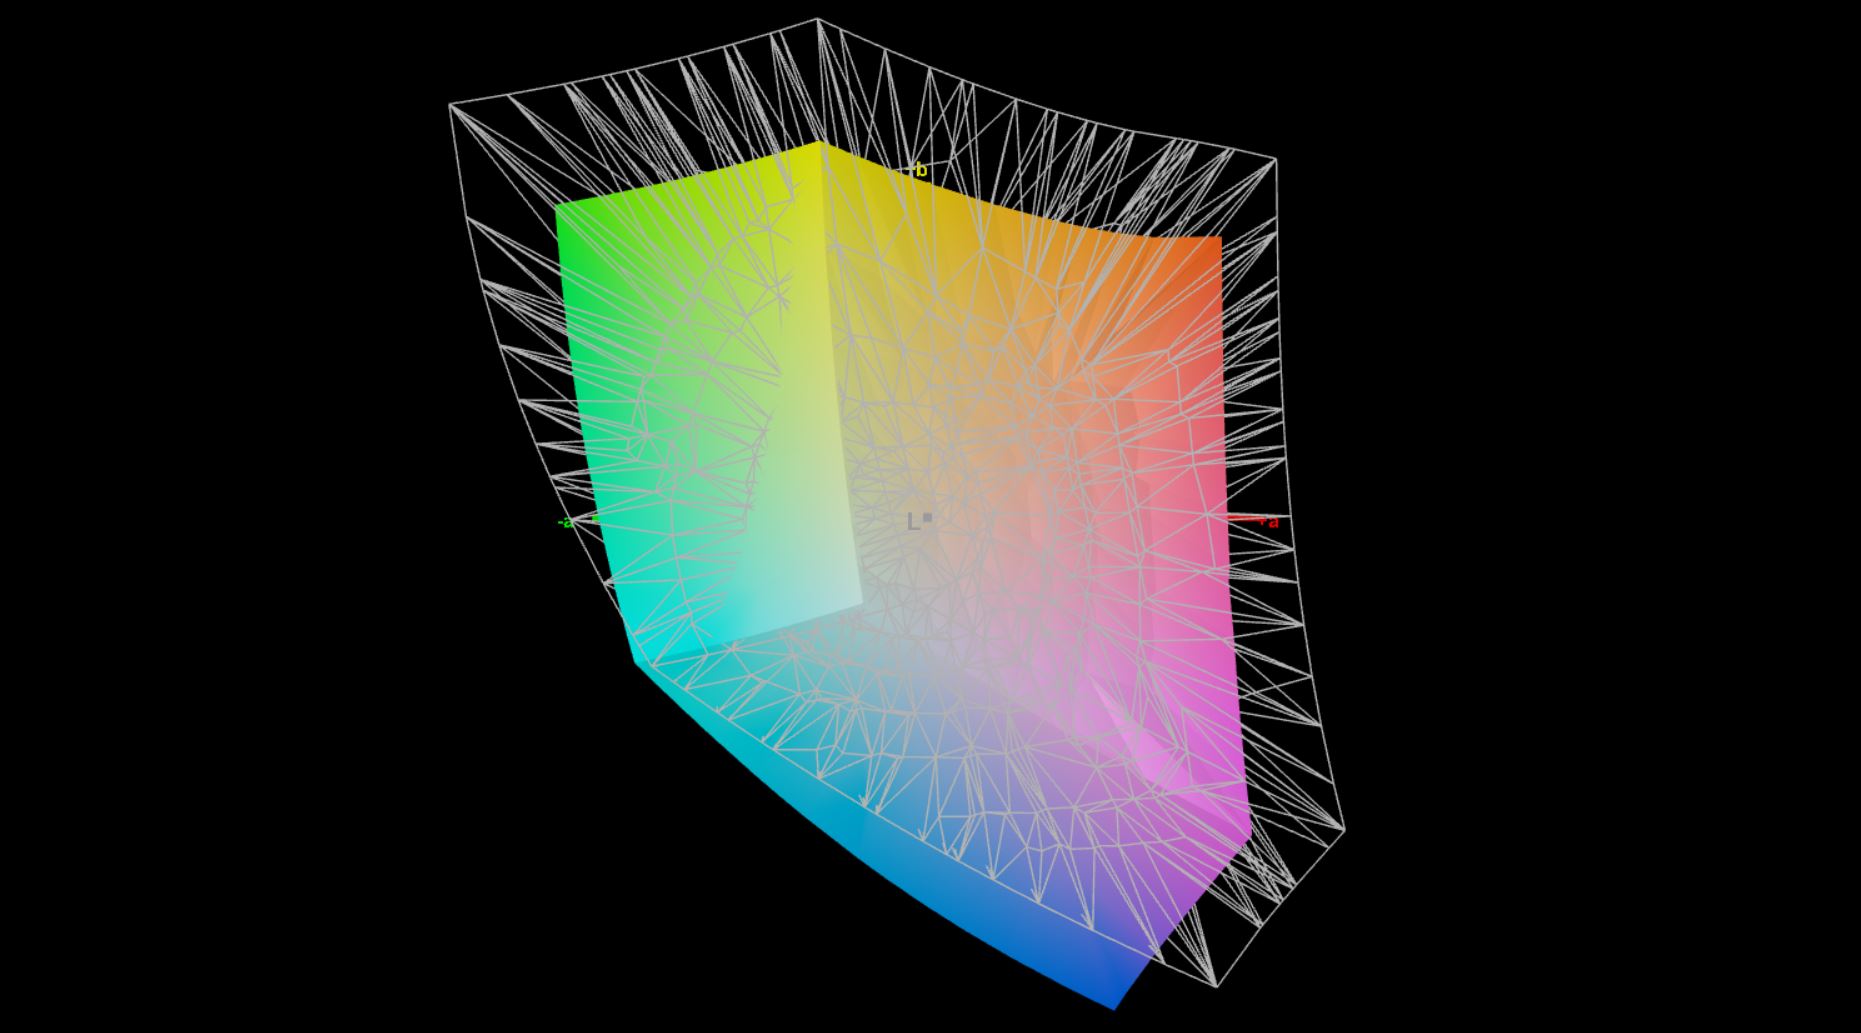
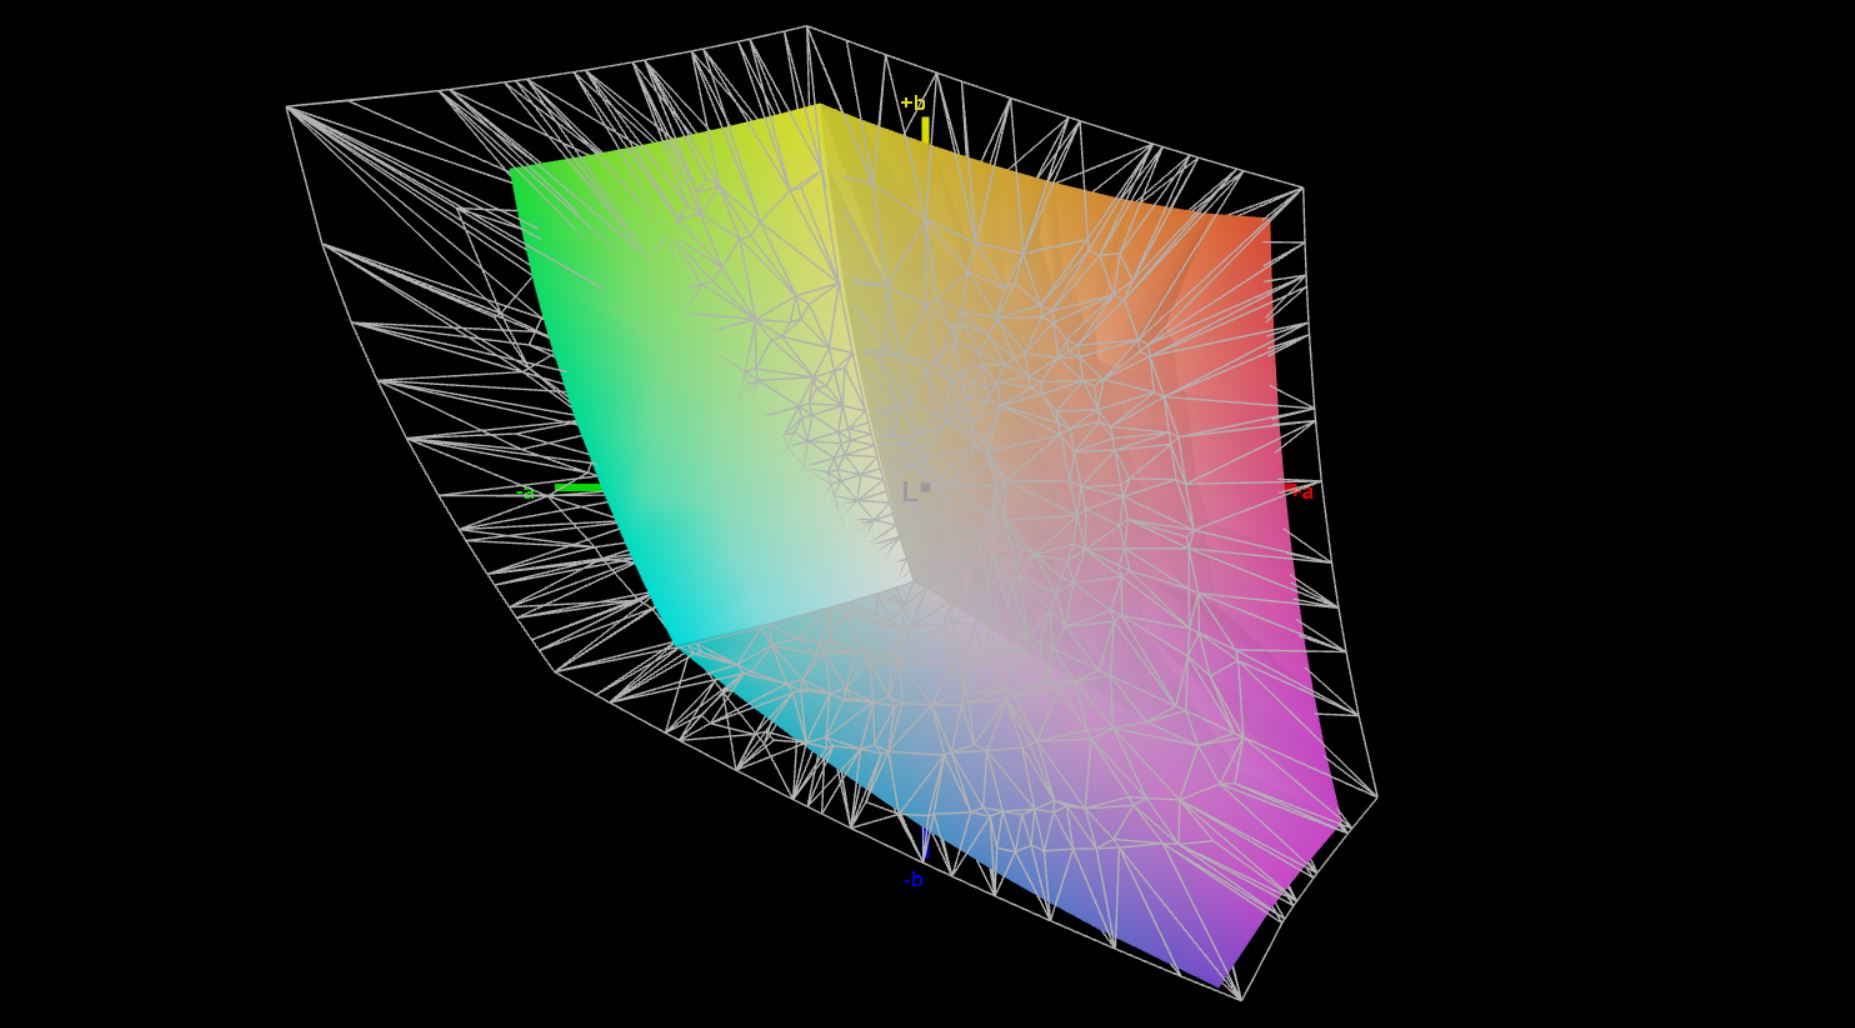
华硕为ROG Flow Z13提供两种不同的13.4英寸IPS触摸屏,长宽比为16:10。除了4K显示屏(3840x2,400像素,WQUXGA,60赫兹,450尼特,P3色彩空间),你还可以选择全高清面板(1920x1,200像素,WUXGA),它只覆盖较小的sRGB色彩空间,但亮度略高(500尼特),刷新率较高,为120赫兹。全高清分辨率也更适合RTX 3050 Ti,所以总体而言,我们认为全高清面板更适合游戏平板。
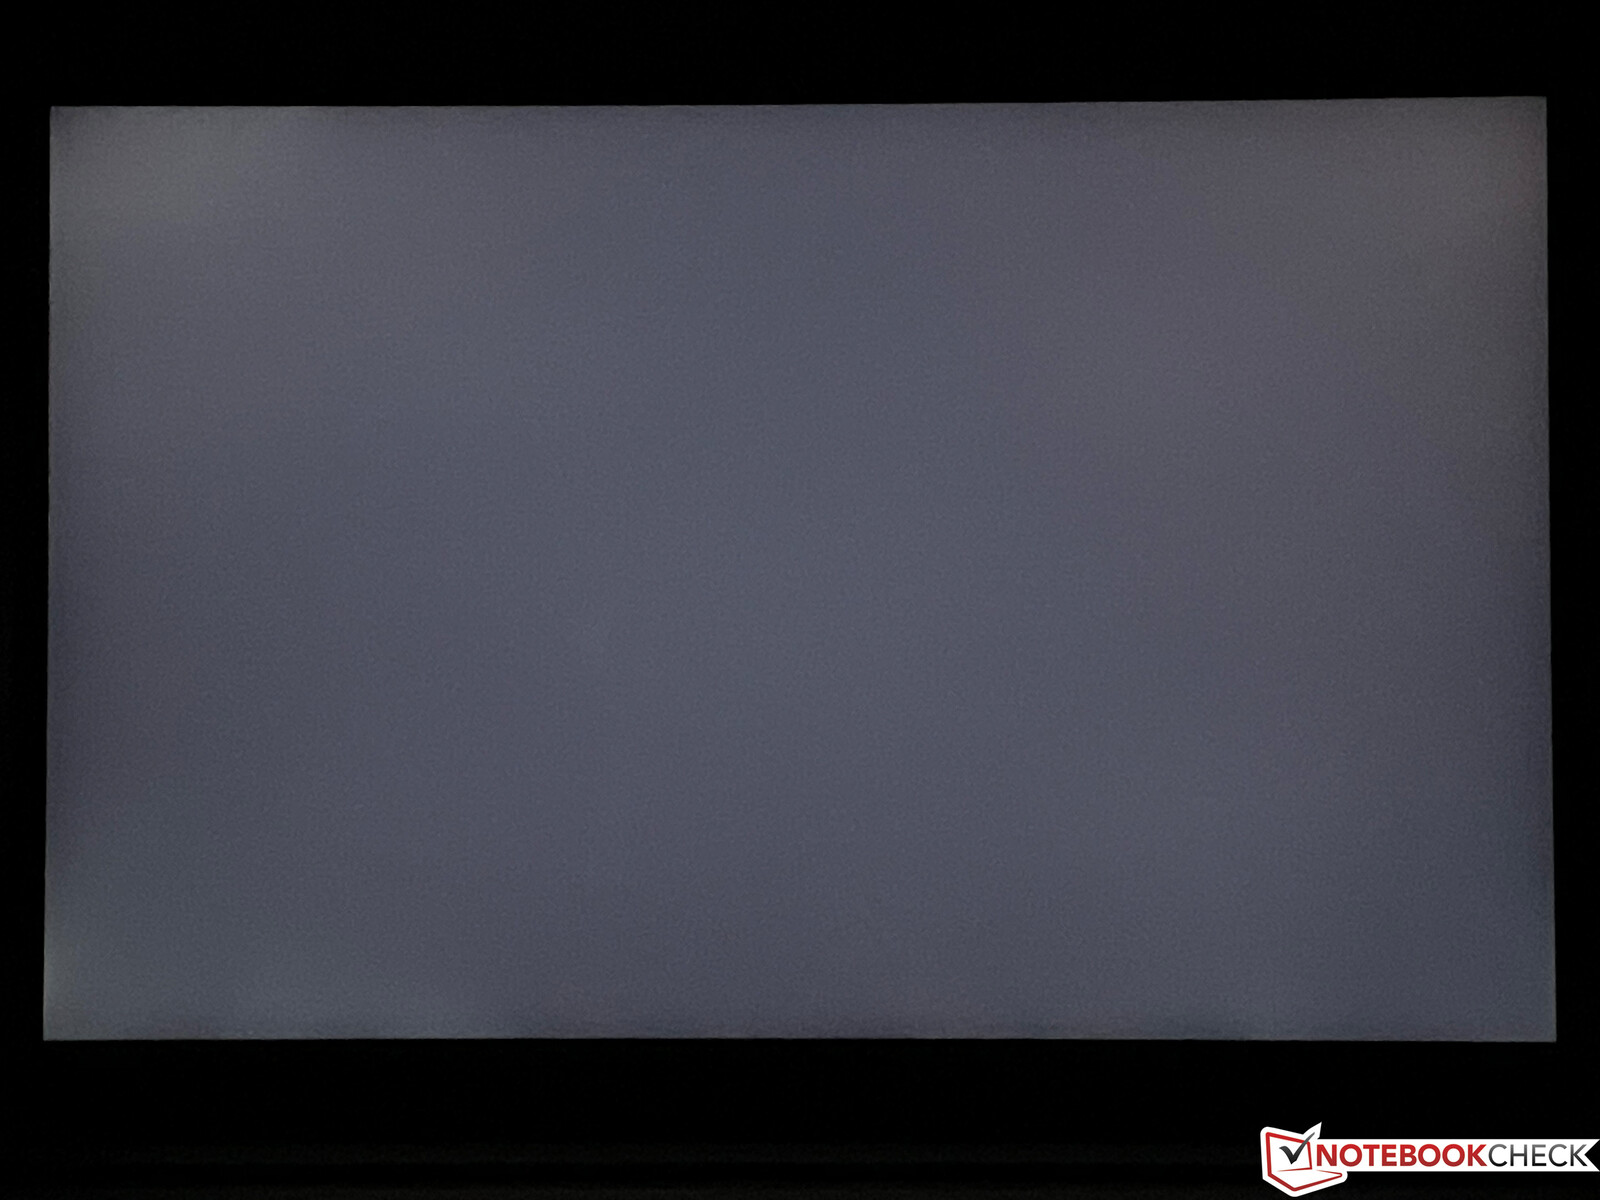
主观的图像印象非常好,即使在较低的全高清分辨率下,一切看起来都非常清晰。颜色看起来也很丰富,对比度高,这一点在我们的测量中也得到了证实。屏幕中心的最大亮度约为515cd/m²,但平均 "只有 "476cd/m²。黑色水平略微提高了0.35cd/m²,但这仍然是一个非常好的对比度,几乎达到1500:1。响应时间没有显示任何问题,即使在全亮度下,屏幕出血也不是一个问题。
| |||||||||||||||||||||||||
Brightness Distribution: 87 %
Center on Battery: 515 cd/m²
Contrast: 1471:1 (Black: 0.35 cd/m²)
ΔE ColorChecker Calman: 1.6 | ∀{0.5-29.43 Ø4.71}
calibrated: 1.2
ΔE Greyscale Calman: 2.5 | ∀{0.09-98 Ø4.96}
69.3% AdobeRGB 1998 (Argyll 3D)
97.1% sRGB (Argyll 3D)
67.5% Display P3 (Argyll 3D)
Gamma: 2.2
CCT: 6939 K
| Asus ROG Flow Z13 GZ301ZE LQ134N1JW54, IPS, 1920x1200, 13.4" | Schenker Vision 14 MNE007ZA1, IPS, 2880x1800, 14" | Asus Zephyrus G14 GA401QEC TL140BDXP01-0, IPS, 2560x1440, 14" | Microsoft Surface Pro 8, i7-1185G7 LP129WT212166, IPS, 2880x1920, 13" | Razer Blade 14 Ryzen 9 RTX 3070 TL140BDXP02-2, IPS, 2560x1440, 14" | Asus ROG Flow X13 GV301QH LQ134R1JW51, IPS, 3840x2400, 13.4" | |
|---|---|---|---|---|---|---|
| Display | 7% | 22% | 10% | 23% | 9% | |
| Display P3 Coverage (%) | 67.5 | 74.3 10% | 94.2 40% | 78.2 16% | 97.2 44% | 77.8 15% |
| sRGB Coverage (%) | 97.1 | 97.6 1% | 99.9 3% | 100 3% | 99.9 3% | 99.5 2% |
| AdobeRGB 1998 Coverage (%) | 69.3 | 75.7 9% | 84.5 22% | 77.6 12% | 85.4 23% | 76.8 11% |
| Response Times | 2% | 61% | -19% | 51% | -46% | |
| Response Time Grey 50% / Grey 80% * (ms) | 44 ? | 40.4 ? 8% | 20 ? 55% | 46.4 ? -5% | 16.4 ? 63% | 48 ? -9% |
| Response Time Black / White * (ms) | 17.6 ? | 18.4 ? -5% | 6 ? 66% | 23.2 ? -32% | 10.8 ? 39% | 32 ? -82% |
| PWM Frequency (Hz) | 29760 ? | |||||
| Screen | -15% | -96% | -10% | -16% | -9% | |
| Brightness middle (cd/m²) | 515 | 407 -21% | 333 -35% | 444 -14% | 331.1 -36% | 359 -30% |
| Brightness (cd/m²) | 476 | 407 -14% | 317 -33% | 451 -5% | 318 -33% | 331 -30% |
| Brightness Distribution (%) | 87 | 94 8% | 89 2% | 91 5% | 91 5% | 86 -1% |
| Black Level * (cd/m²) | 0.35 | 0.25 29% | 0.36 -3% | 0.43 -23% | 0.36 -3% | 0.23 34% |
| Contrast (:1) | 1471 | 1628 11% | 925 -37% | 1033 -30% | 920 -37% | 1561 6% |
| Colorchecker dE 2000 * | 1.6 | 2.6 -63% | 5.58 -249% | 2 -25% | 2.25 -41% | 2.46 -54% |
| Colorchecker dE 2000 max. * | 4 | 4.4 -10% | 10.62 -166% | 3.2 20% | 4.62 -16% | 3.85 4% |
| Colorchecker dE 2000 calibrated * | 1.2 | 2 -67% | 2.88 -140% | 1.7 -42% | 1.6 -33% | |
| Greyscale dE 2000 * | 2.5 | 2.7 -8% | 7.5 -200% | 1.8 28% | 1.7 32% | 1.89 24% |
| Gamma | 2.2 100% | 2.18 101% | 2.28 96% | 2.11 104% | 2.3 96% | 2.38 92% |
| CCT | 6939 94% | 6316 103% | 7220 90% | 6417 101% | 6751 96% | 6835 95% |
| Color Space (Percent of AdobeRGB 1998) (%) | 68.2 | |||||
| Color Space (Percent of sRGB) (%) | 99.4 | |||||
| Total Average (Program / Settings) | -2% /
-8% | -4% /
-48% | -6% /
-7% | 19% /
3% | -15% /
-10% |
* ... smaller is better
设备插电时默认刷新率为120赫兹,但在电池供电时自动切换到60赫兹。因此,当电源适配器插入或拔出时,屏幕会变黑约一秒钟。这可以在Armoury Crate软件中修改,那里有一个叫做 "节能面板 "的选项。只要你停用它,即使在电池供电的情况下,频率也会保持在120赫兹。在日常使用中,120赫兹模式主要导致在滚动浏览文件或网站时有更流畅的图像印象,而且在游戏时也会有好处。

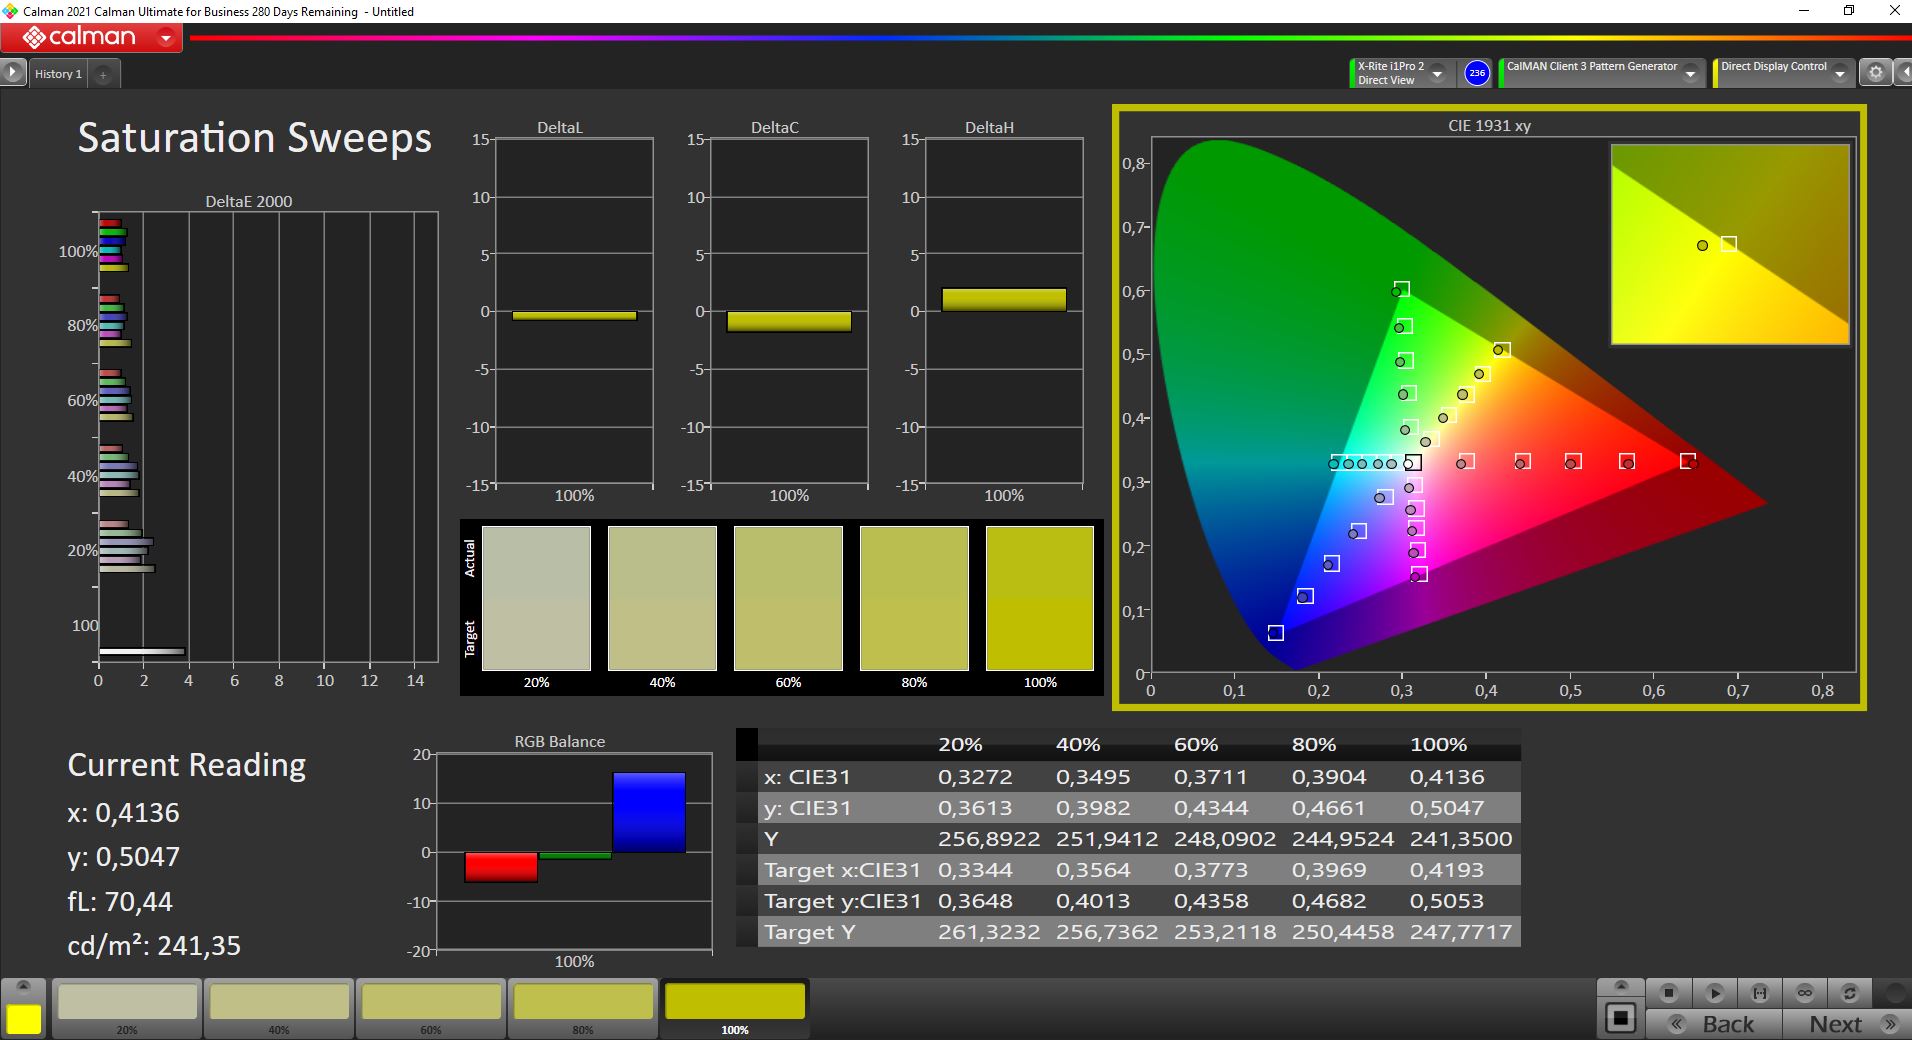
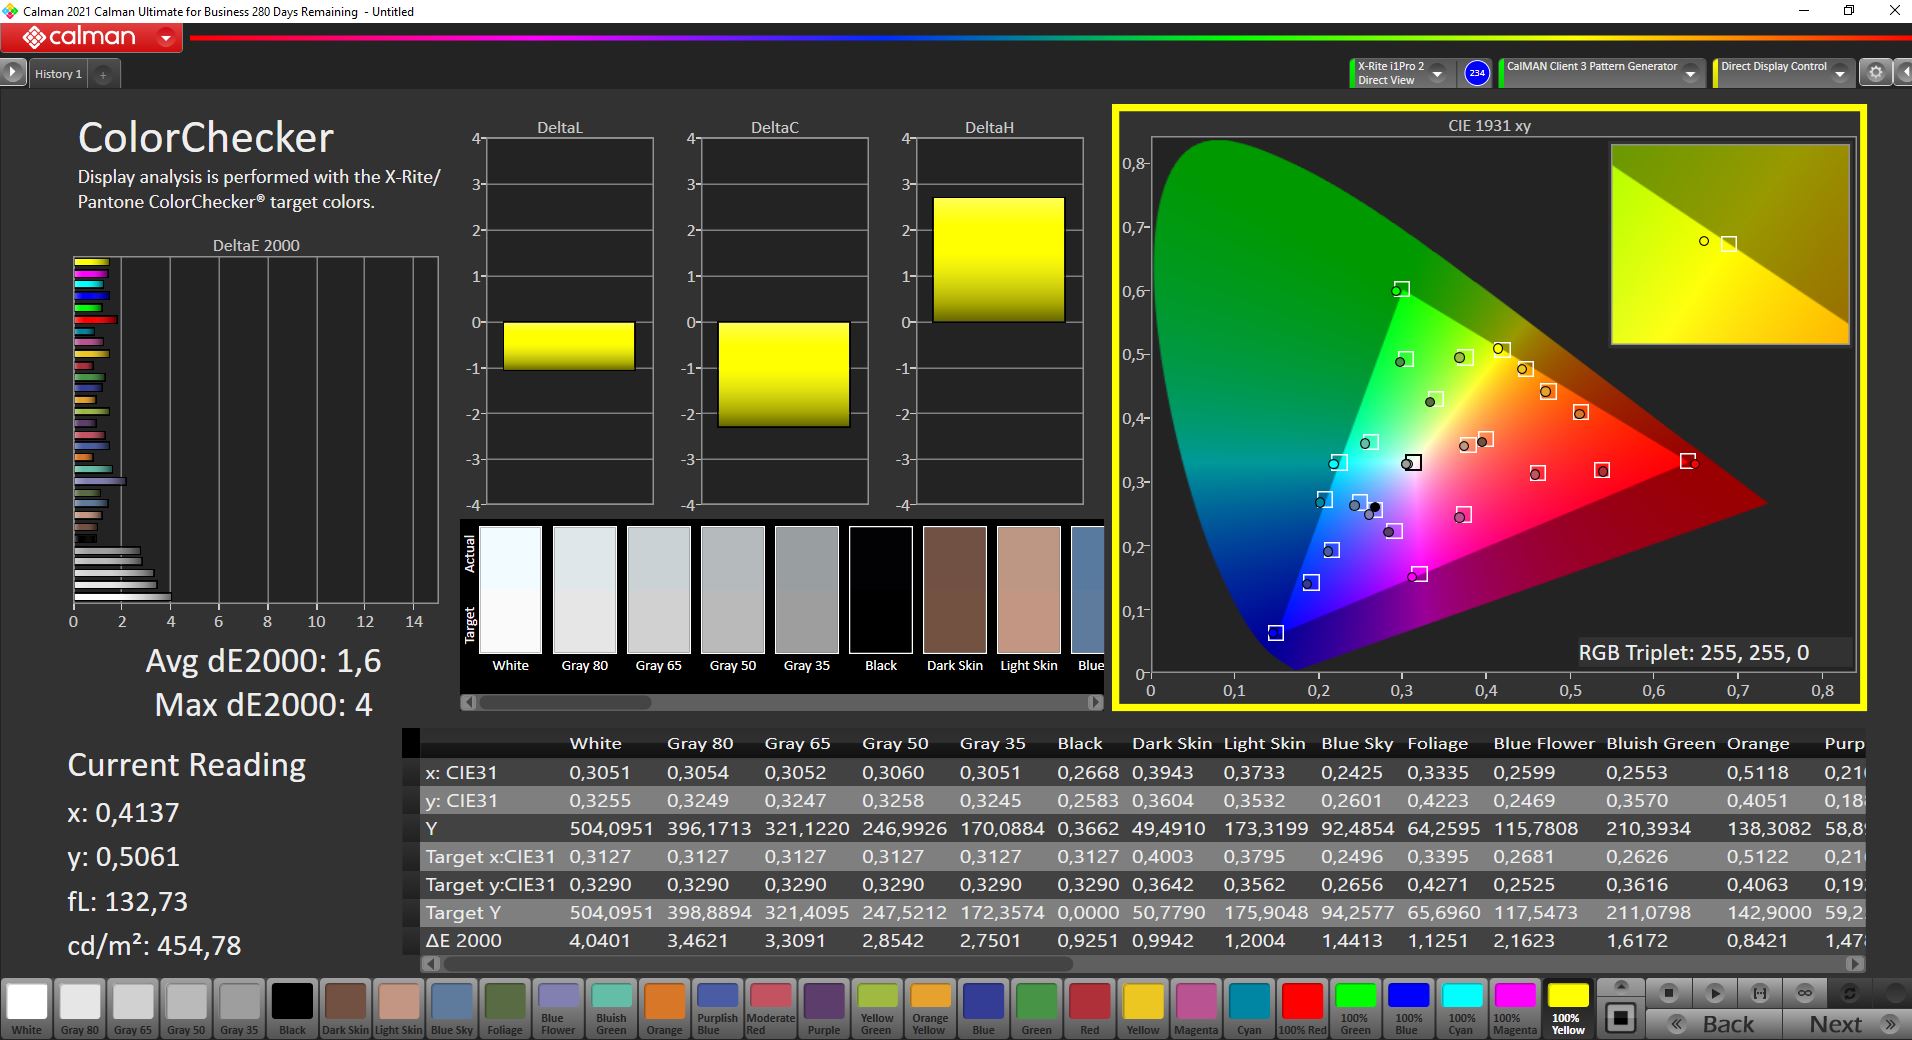
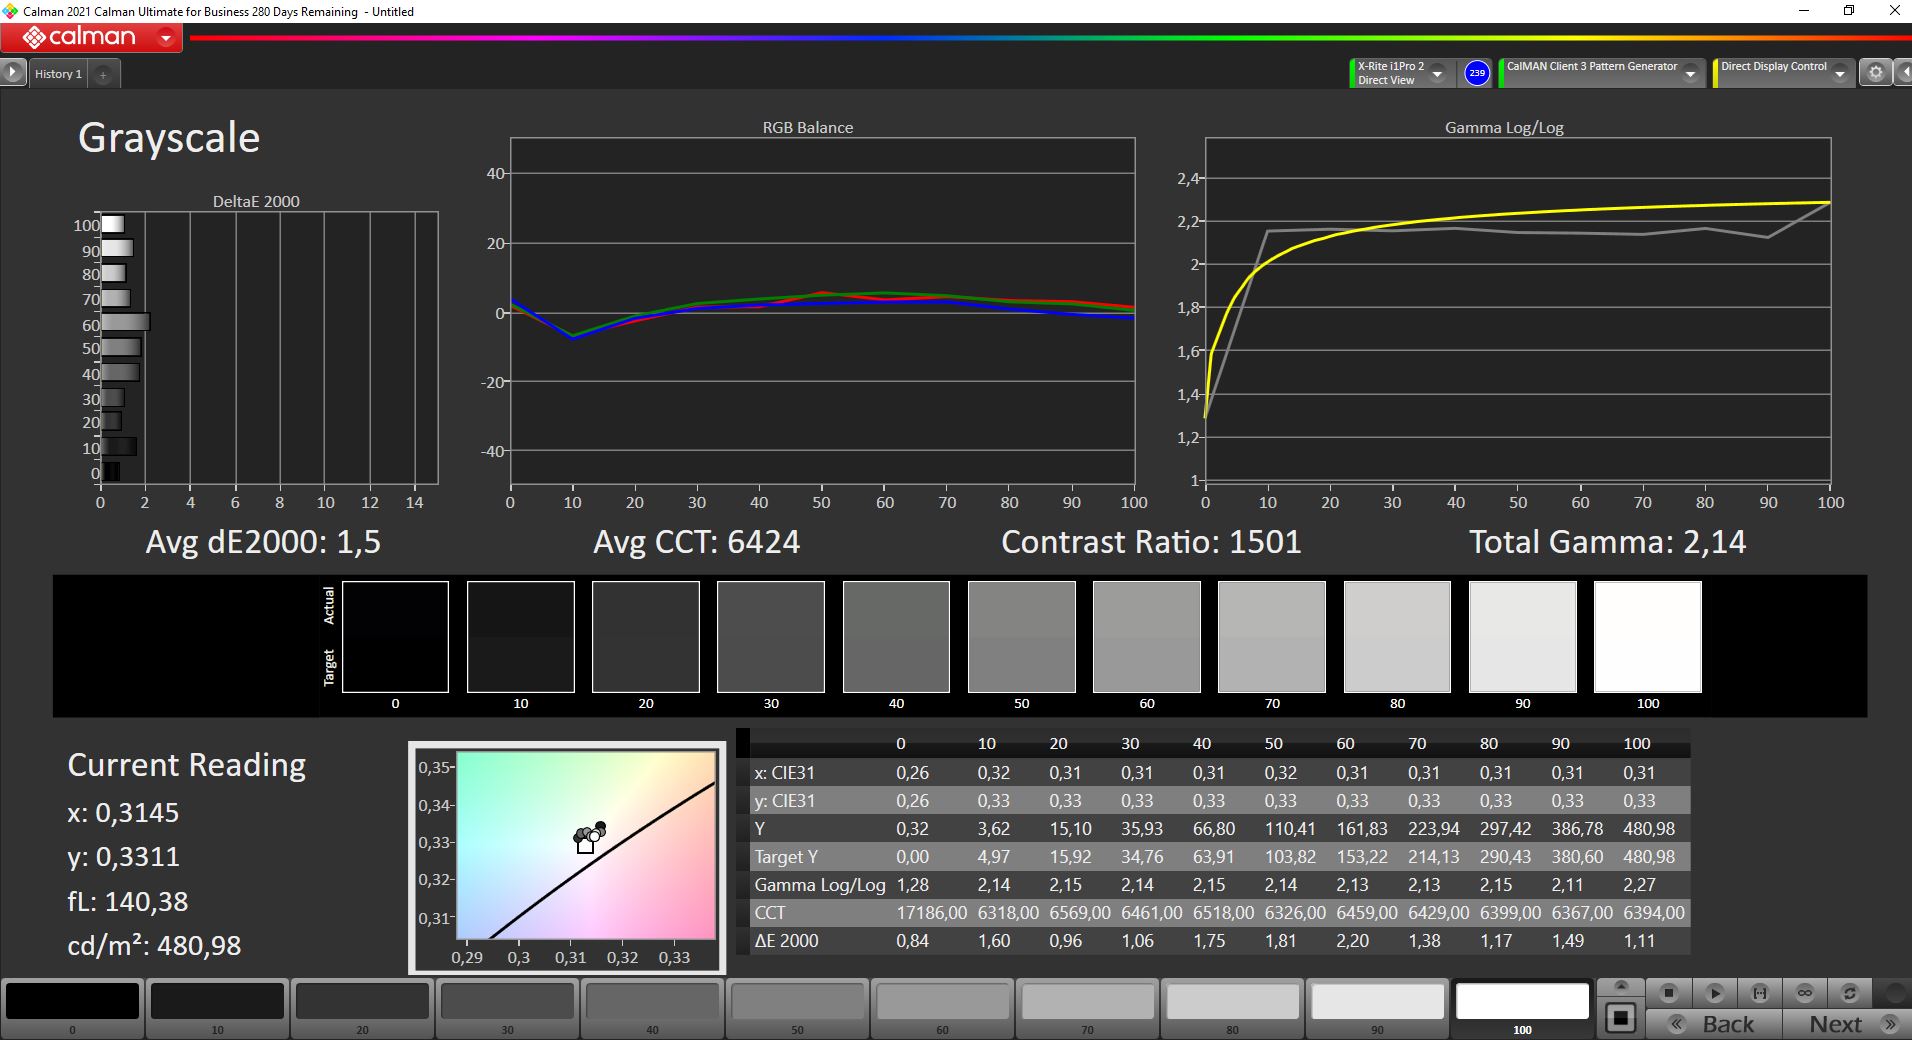
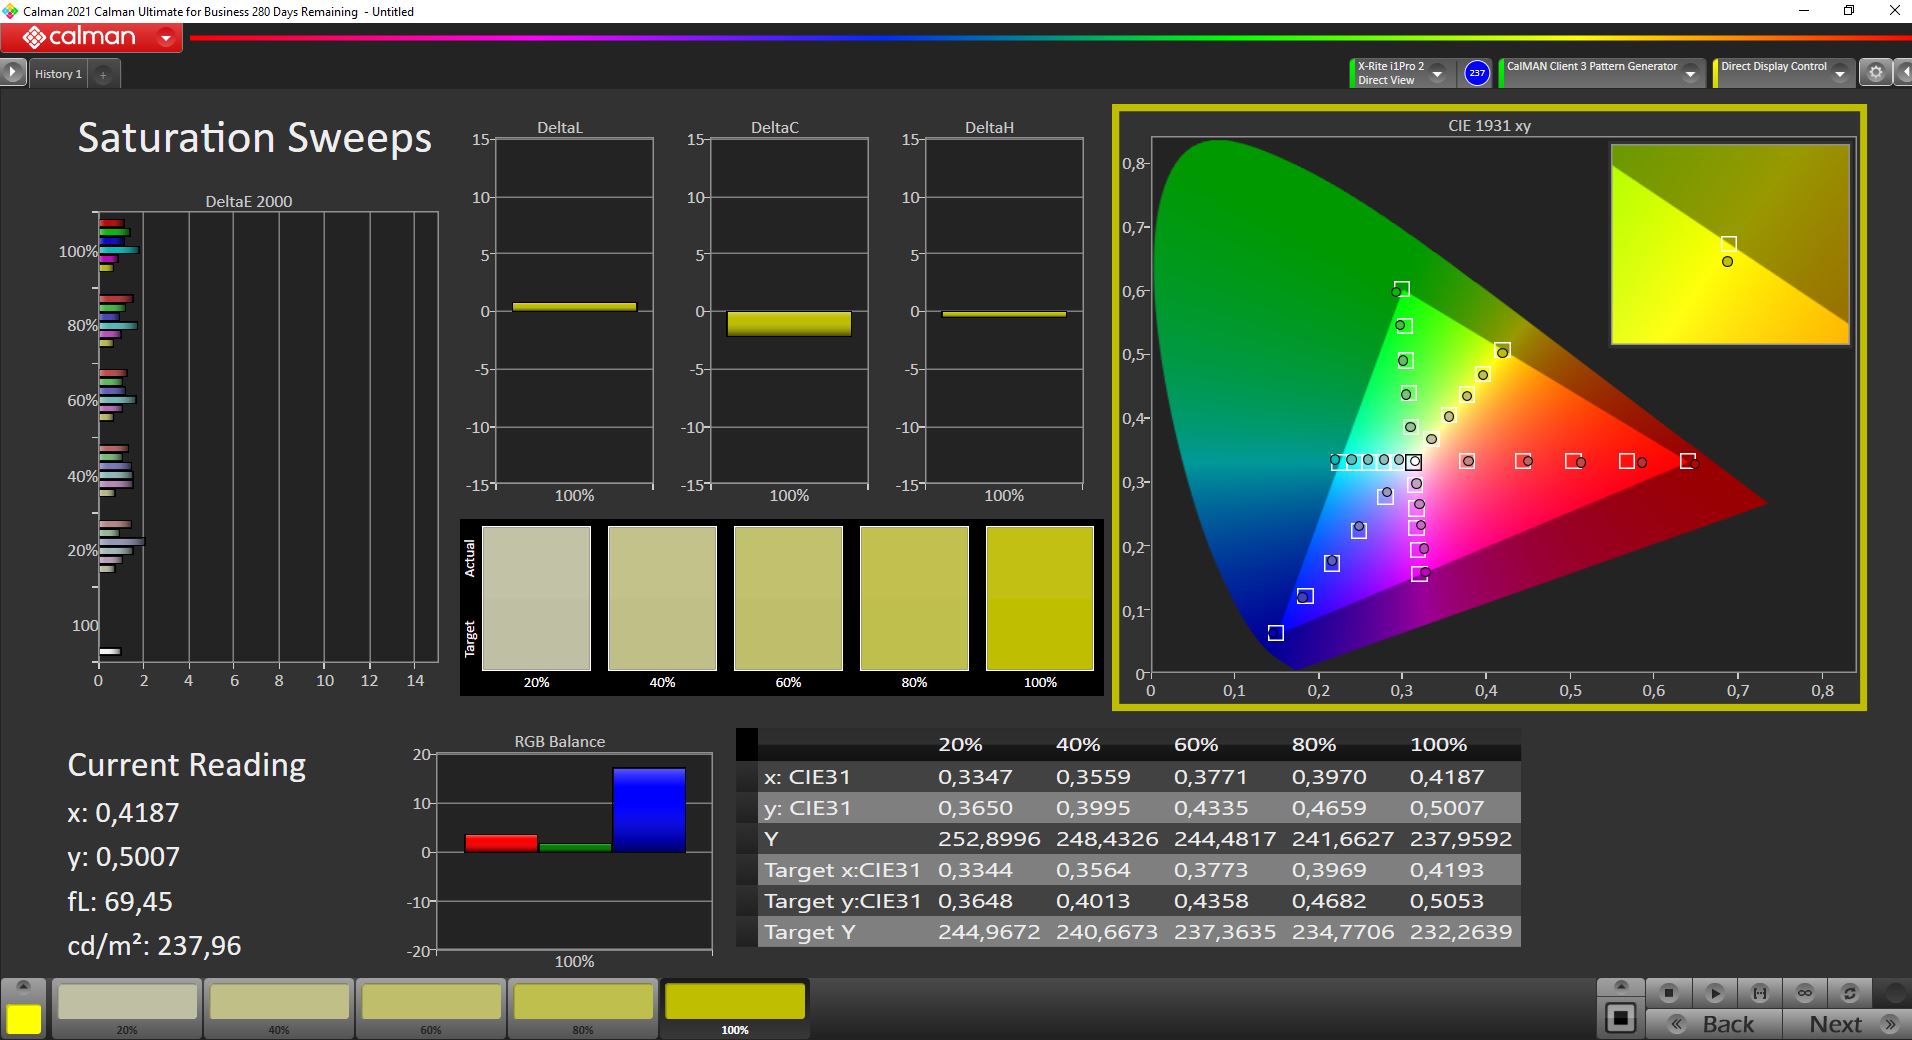
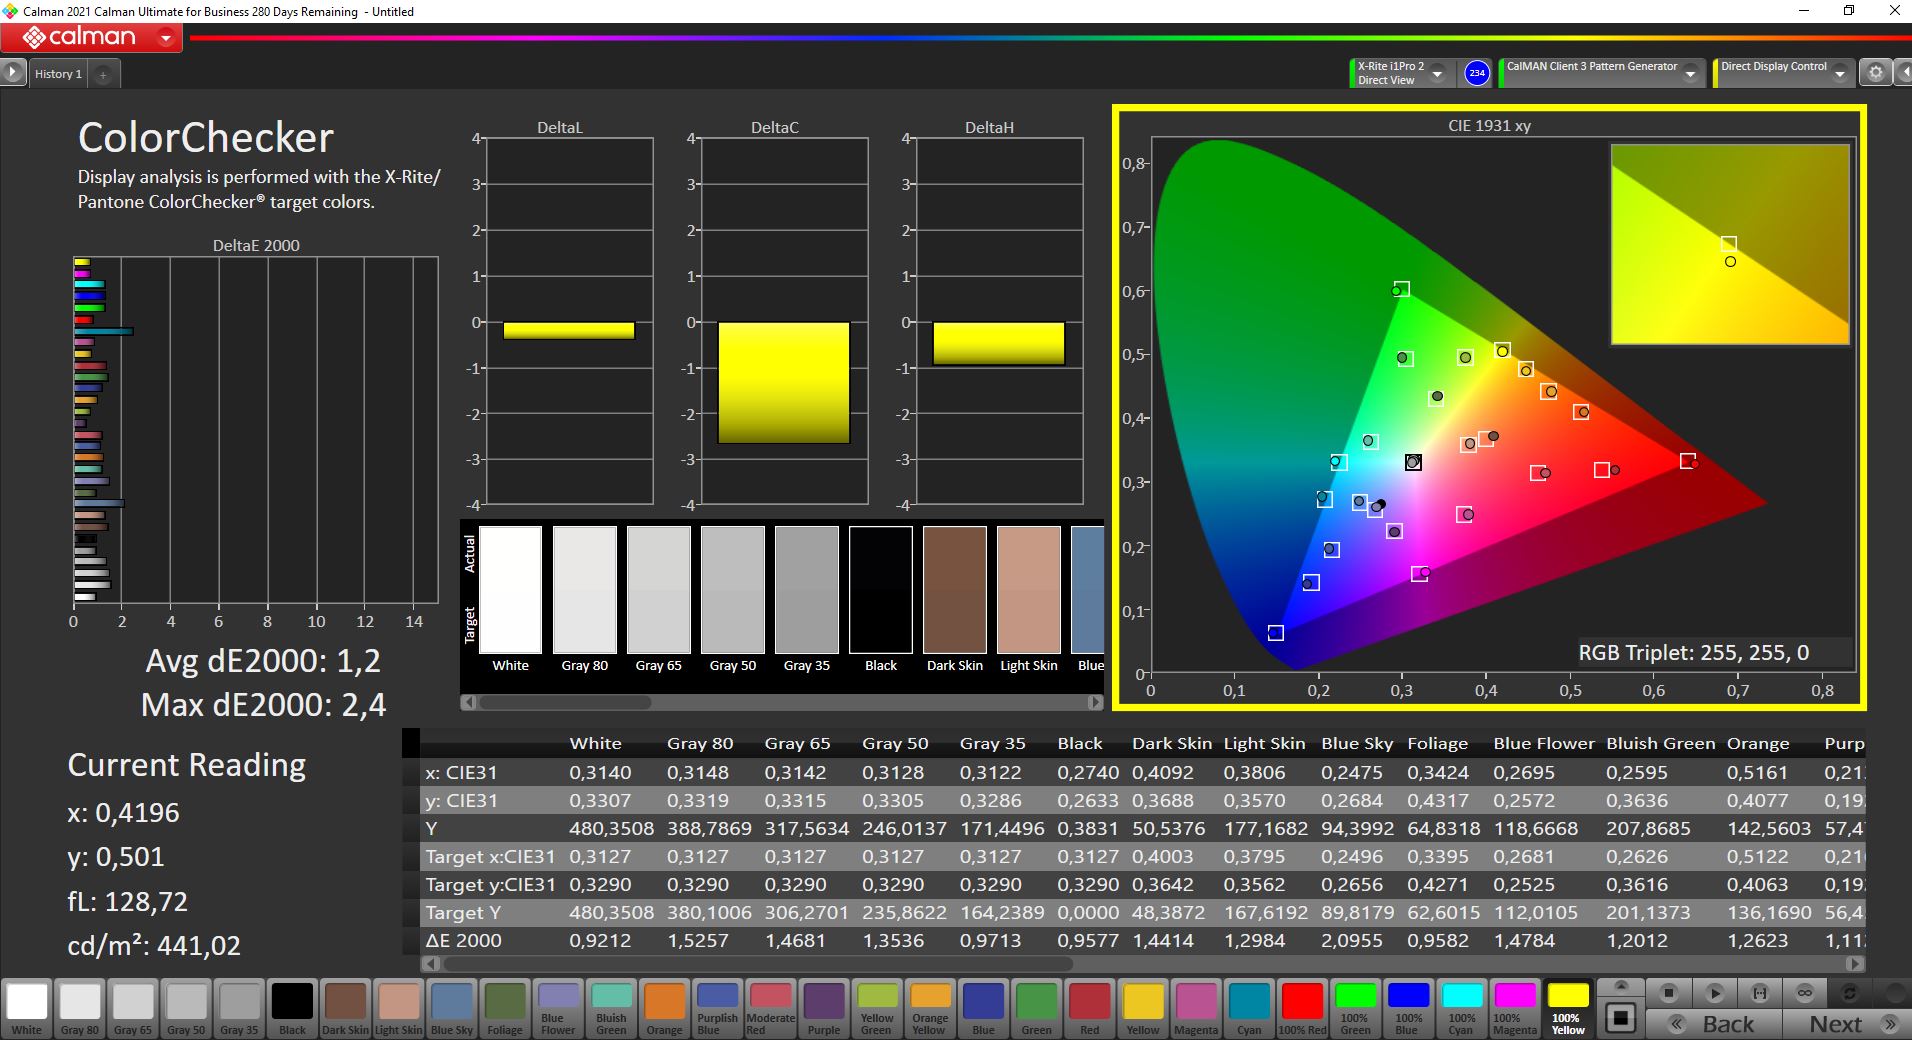
我们用专业的CalMAN软件和X-Rite i1 Pro 2分光光度计分析了显示器。开箱后,我们注意到在灰度上有轻微的色差,朝向绿色/蓝色,再加上略微过冷的色温。这在日常使用中并不发挥主要作用,只有在使用经过校准的显示器时,你才能用肉眼识别它。制造商喜欢使用这种技巧来增加最大亮度。因此,我们的校准配置文件(可在上面免费下载)也导致最大亮度从515cd/m²降低到480cd/m²。然而,由于颜色和灰度的偏差在开箱时就已经非常好了,所以严格来说,校准并不是必须的。全高清显示屏几乎完全覆盖了sRGB色彩空间,这使得它适合编辑图片/视频。
Display Response Times
| ↔ Response Time Black to White | ||
|---|---|---|
| 17.6 ms ... rise ↗ and fall ↘ combined | ↗ 6 ms rise | 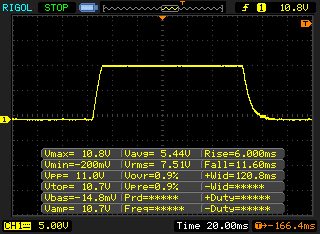 |
| ↘ 11.6 ms fall | ||
| The screen shows good response rates in our tests, but may be too slow for competitive gamers. In comparison, all tested devices range from 0.1 (minimum) to 240 (maximum) ms. » 40 % of all devices are better. This means that the measured response time is better than the average of all tested devices (19.8 ms). | ||
| ↔ Response Time 50% Grey to 80% Grey | ||
| 44 ms ... rise ↗ and fall ↘ combined | ↗ 22 ms rise | 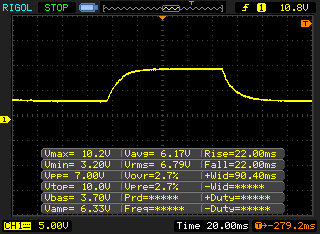 |
| ↘ 22 ms fall | ||
| The screen shows slow response rates in our tests and will be unsatisfactory for gamers. In comparison, all tested devices range from 0.165 (minimum) to 636 (maximum) ms. » 73 % of all devices are better. This means that the measured response time is worse than the average of all tested devices (30.9 ms). | ||
Screen Flickering / PWM (Pulse-Width Modulation)
| Screen flickering / PWM not detected |  | ||
In comparison: 52 % of all tested devices do not use PWM to dim the display. If PWM was detected, an average of 7741 (minimum: 5 - maximum: 343500) Hz was measured. | |||
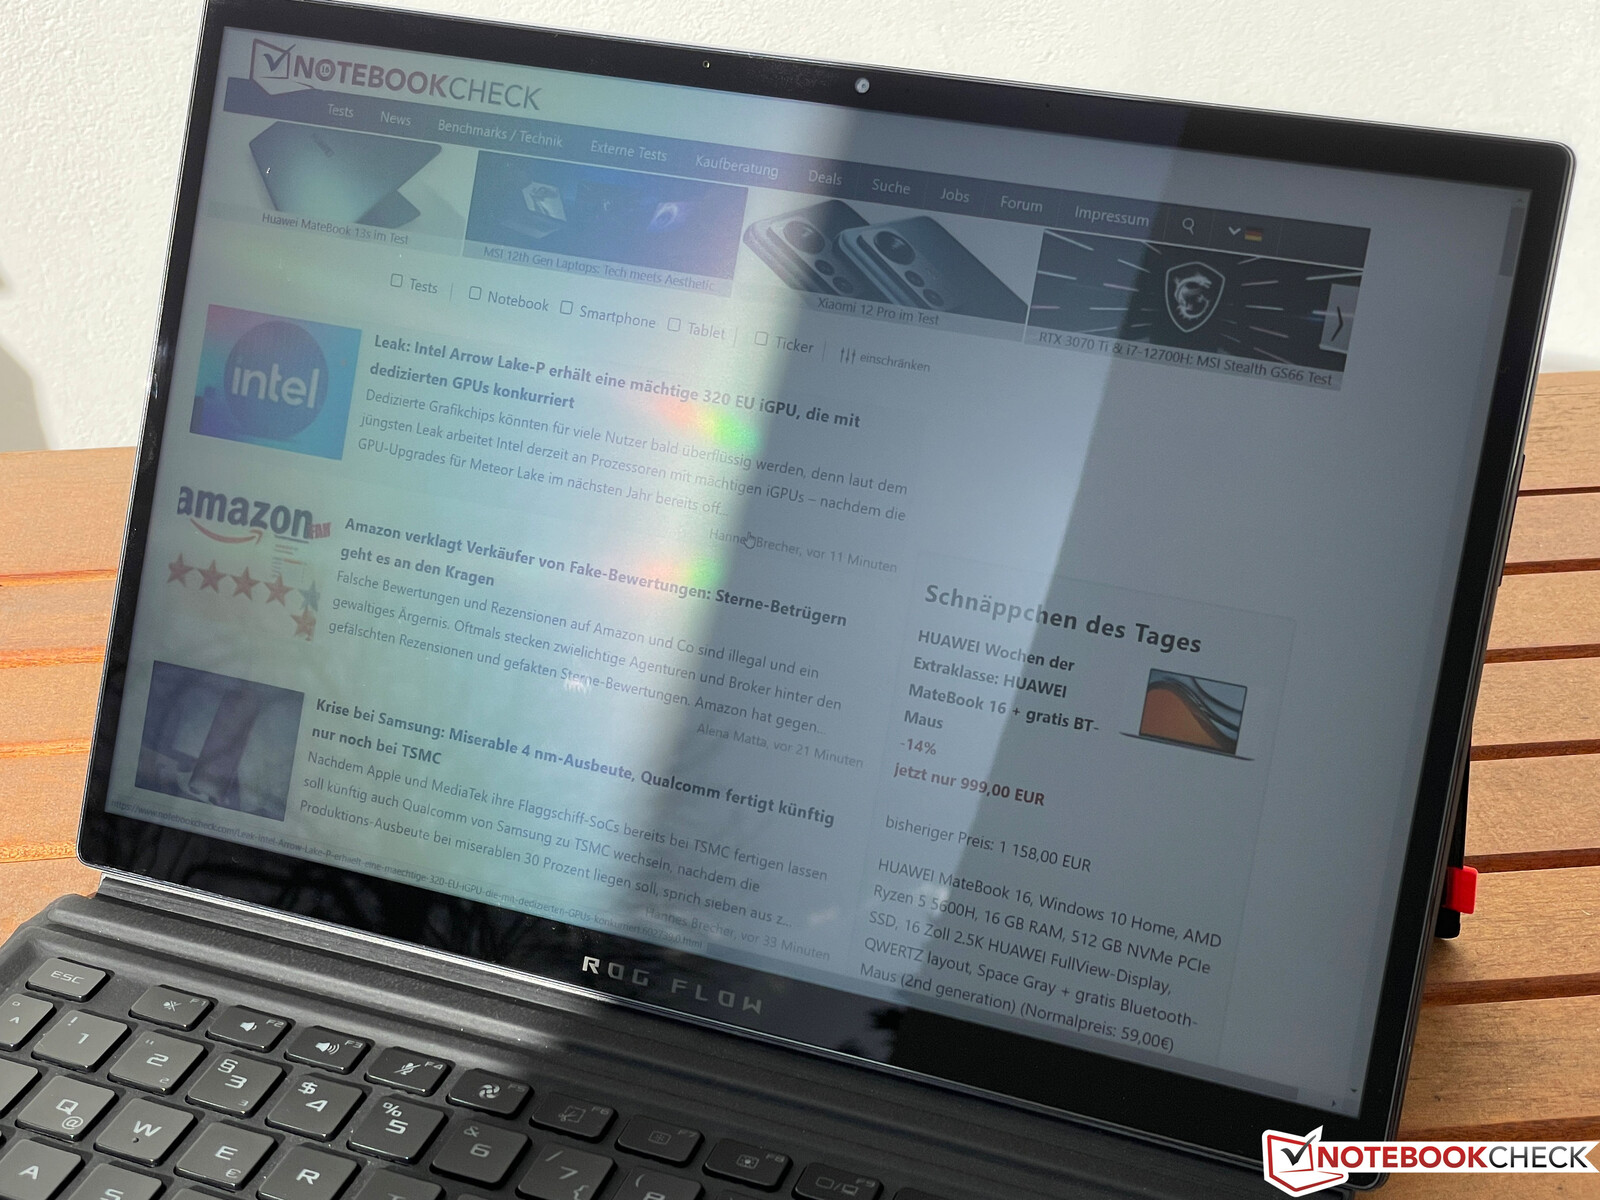
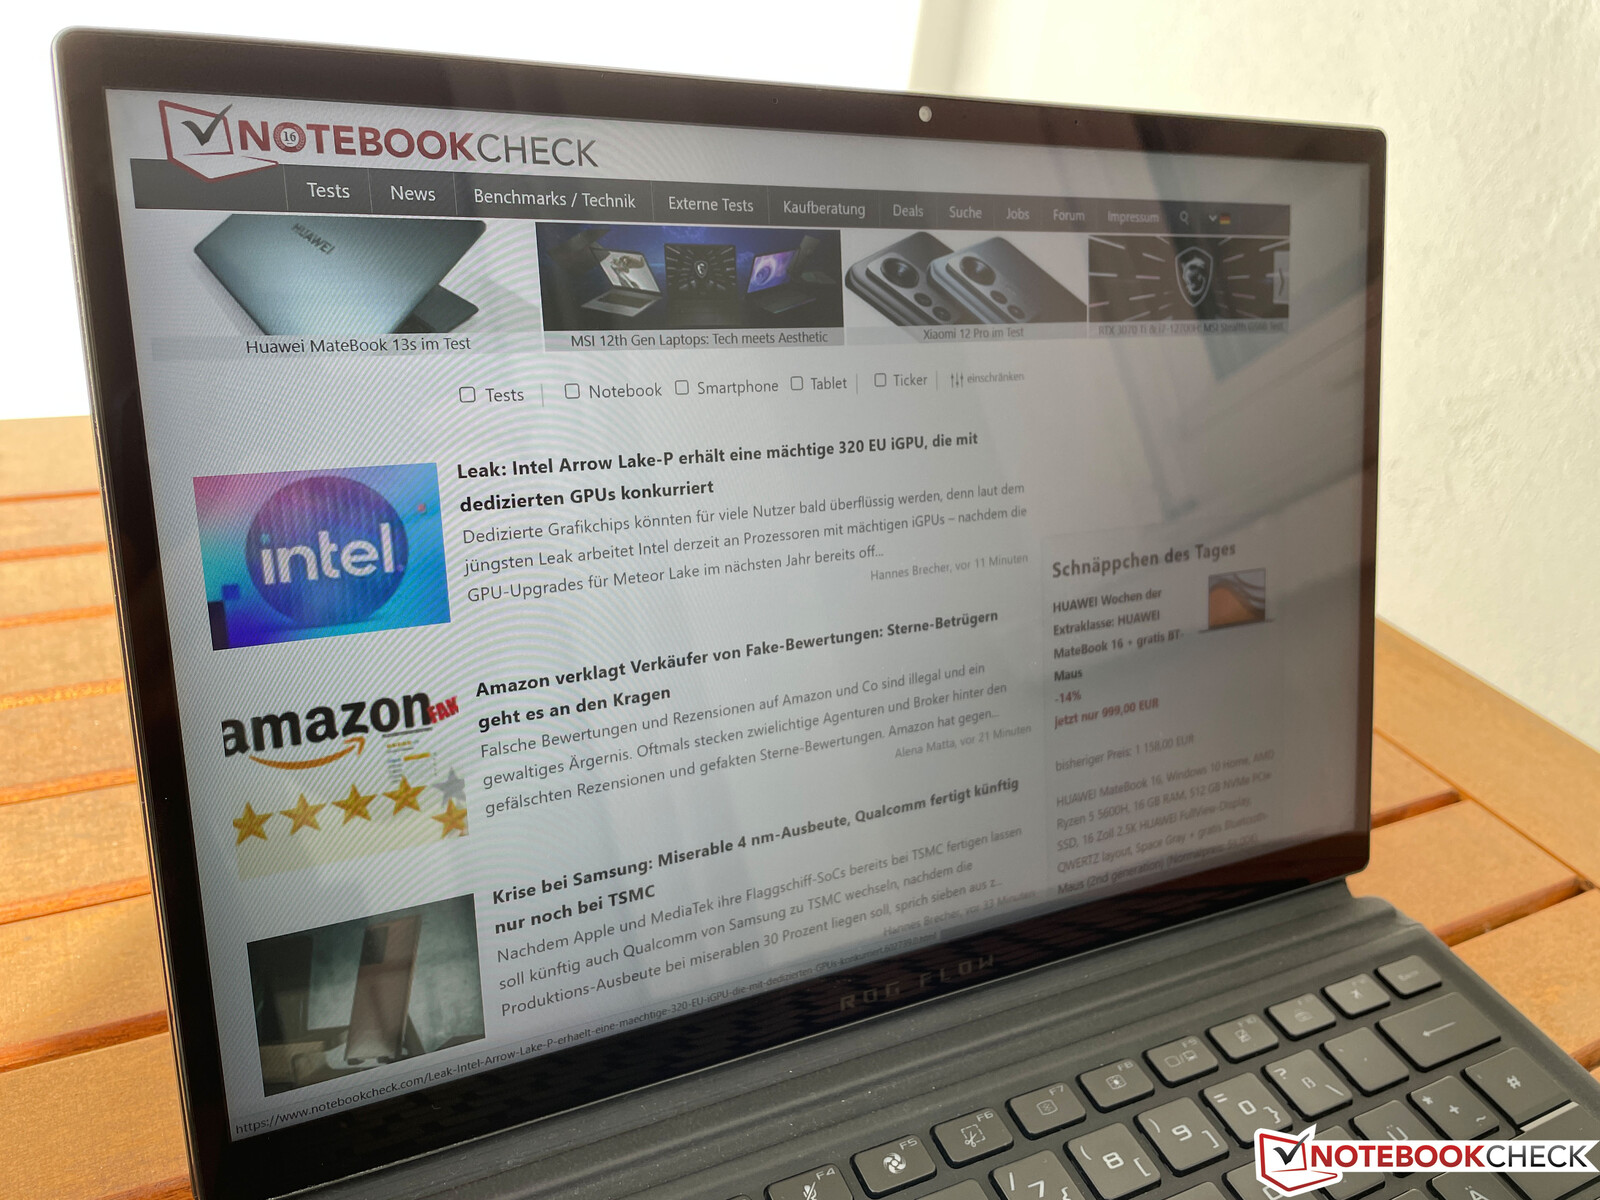
亮度非常高,而且对电池电量没有减少。尽管如此,在光泽的触摸屏上很快就能看到反光。特别是在非常明亮的环境中,内容的可见度因此变得有限。但是,只要位置合适,在阴凉处或阴天应该可以舒适地使用该设备。IPS面板提供了非常稳定的可视角度,没有颜色偏移或强烈的对比度损失。
性能 - ROG Flow Z13的CPU是过剩的
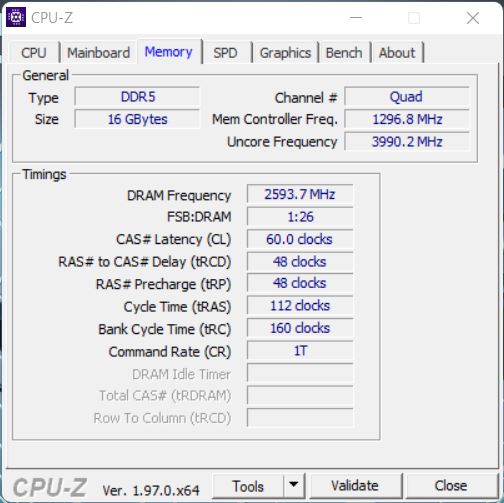
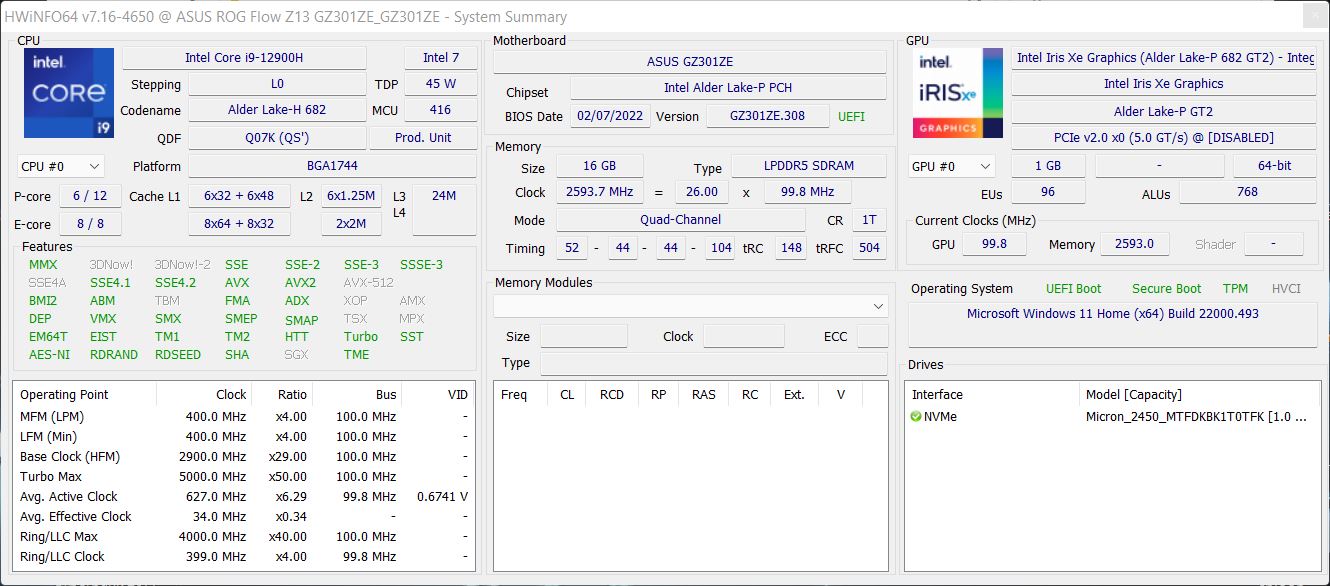
我们的评测配置代表了ROG Flow Z13的最强大型号,并由新的桤木湖酷睿i9-12900H结合专用的 GeForce RTX 3050 Ti这款产品的最大运行功率为40瓦(35瓦+来自处理器的5瓦Dynamic Boost功率)。该套件由16GB的LPDDR5-5200内存(双通道)完成,目前没有32GB内存的型号。我们在下面列出了三种基本型号,但它们在内存配置和内置显示屏方面仍有可能不同。
| 型号 | GZ301ZE | GZ301ZC | GZ301ZA |
|---|---|---|---|
| CPU | Core i9-12900H | Core i7-12700H | Core i5-12500H |
| GPU | GeForce RTX 3050 Ti(40瓦) | GeForce RTX 3050(40瓦) | Iris Xe Graphics |
| 内存 | 16 GB LPDR5 | 16 GB LPDR5 | 16 GB LPDR5 |
在一个紧凑的游戏平板电脑中安装如此强大的酷睿i9 CPU对我们来说并不完全合理,尤其是与RTX 3050 Ti的最慢变体相结合。这里当然有一点不平衡,酷睿i7 CPU在ROG Flow Z13中运行的速度不太可能明显变慢(核心数量相同,但涡轮频率较低)。
测试条件
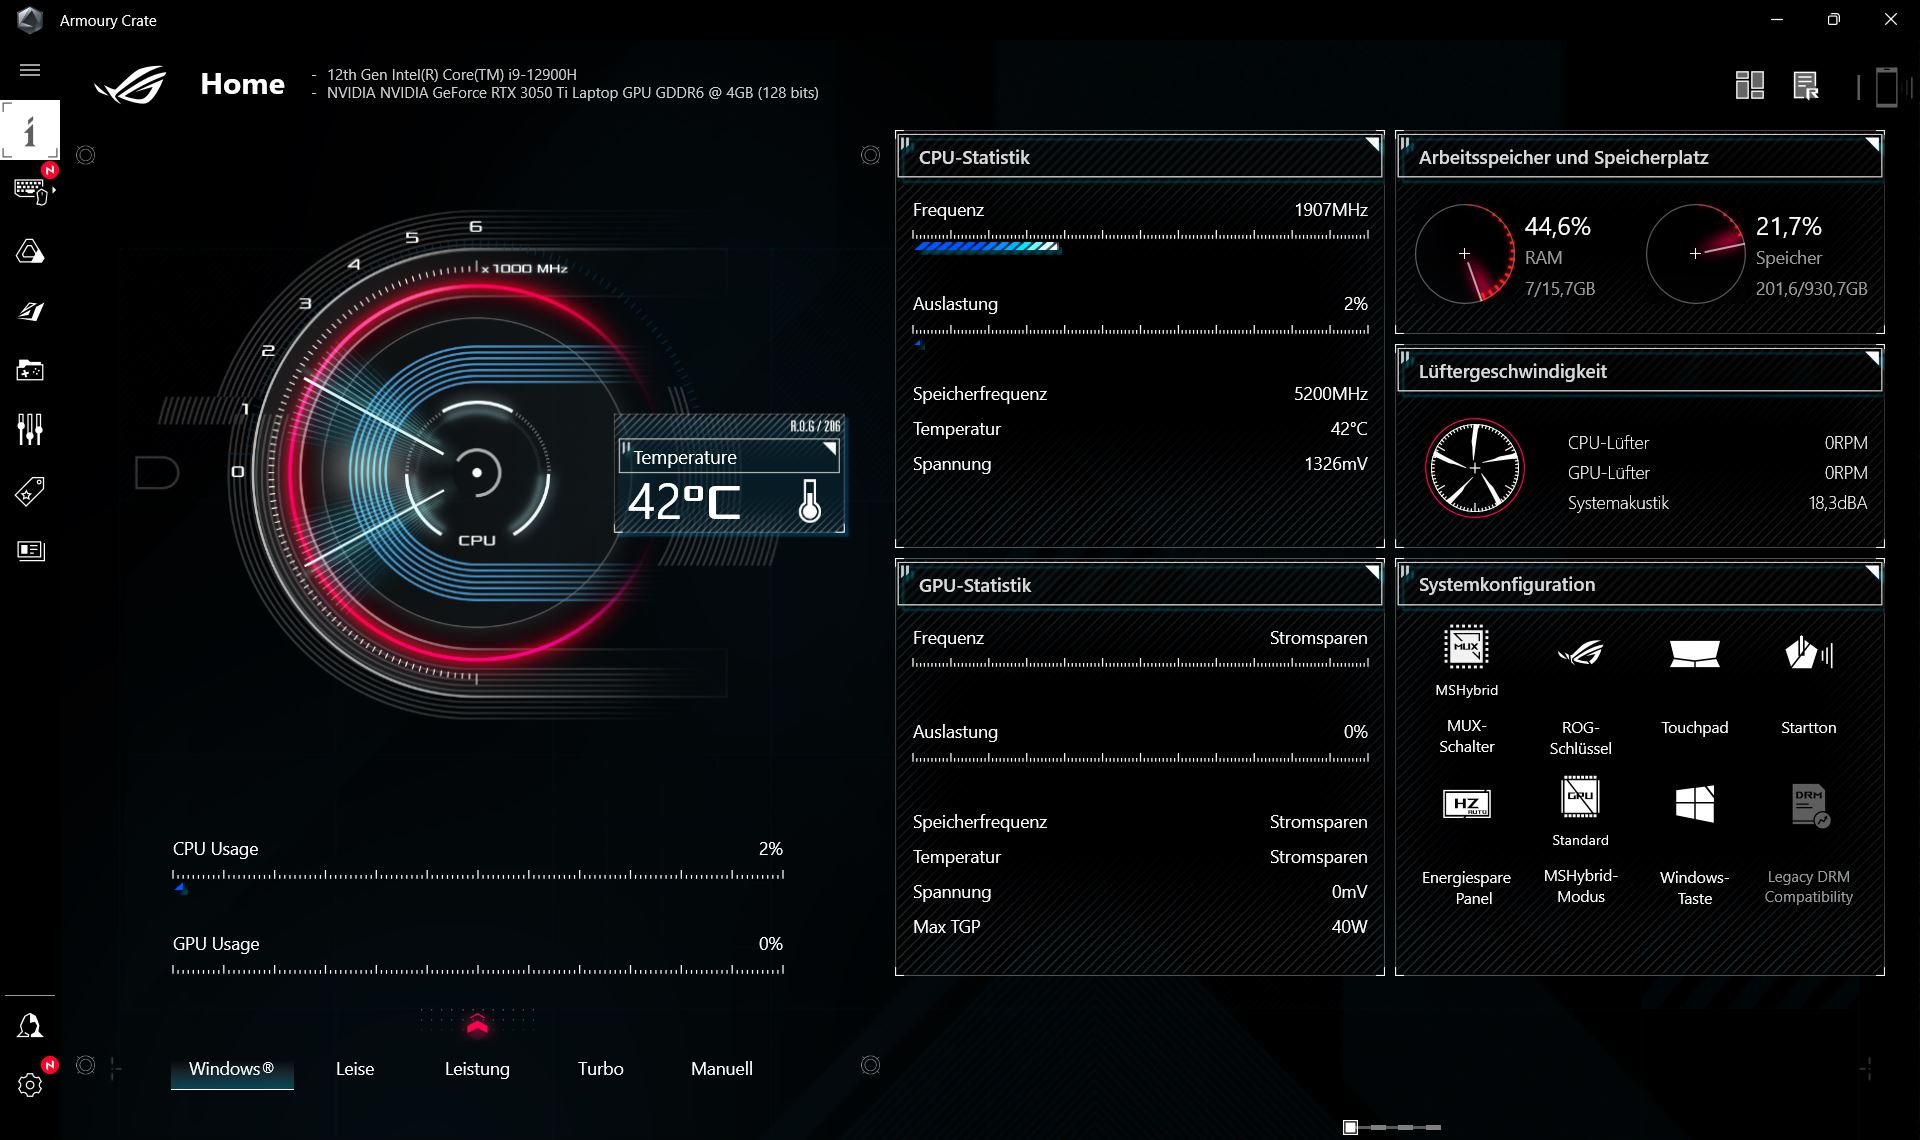
要找到正确的测试设置并不那么容易,因为除了正常的Windows设置外,在预装的Armoury Crate软件中还有一系列额外的能源设置,反正也是覆盖了Windows的节能计划。此外,还有通过MUX开关完全禁用集成GPU的选项,但这需要重新启动。此外,还有各种混合图形的设置。例如,你可以将专用GPU配置为只在设备插电时使用。总而言之,有这么多选项可以根据你的需要调整设备,但也有可能会有点混乱,可能没有使用最佳设置。
我们尝试了所有合理的组合,并能够通过常规的Windows "平衡 "电源计划以及Armoury Crate软件中的Windows设置和Windows性能滑块设置为 "最佳性能 "获得最佳结果(有点令人惊讶)。可能仍有更新,但我们目前没有看到额外的能源计划有任何优势。
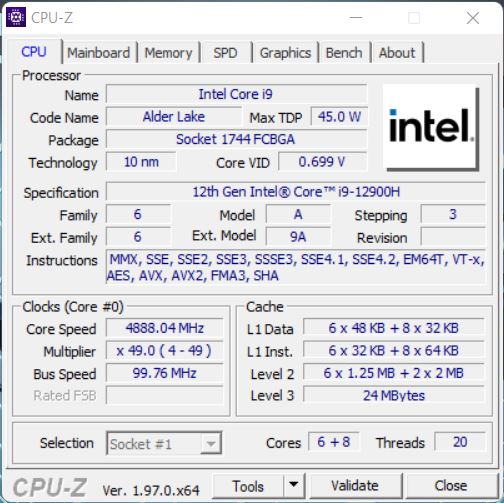
处理器 - 酷睿i9-12900H
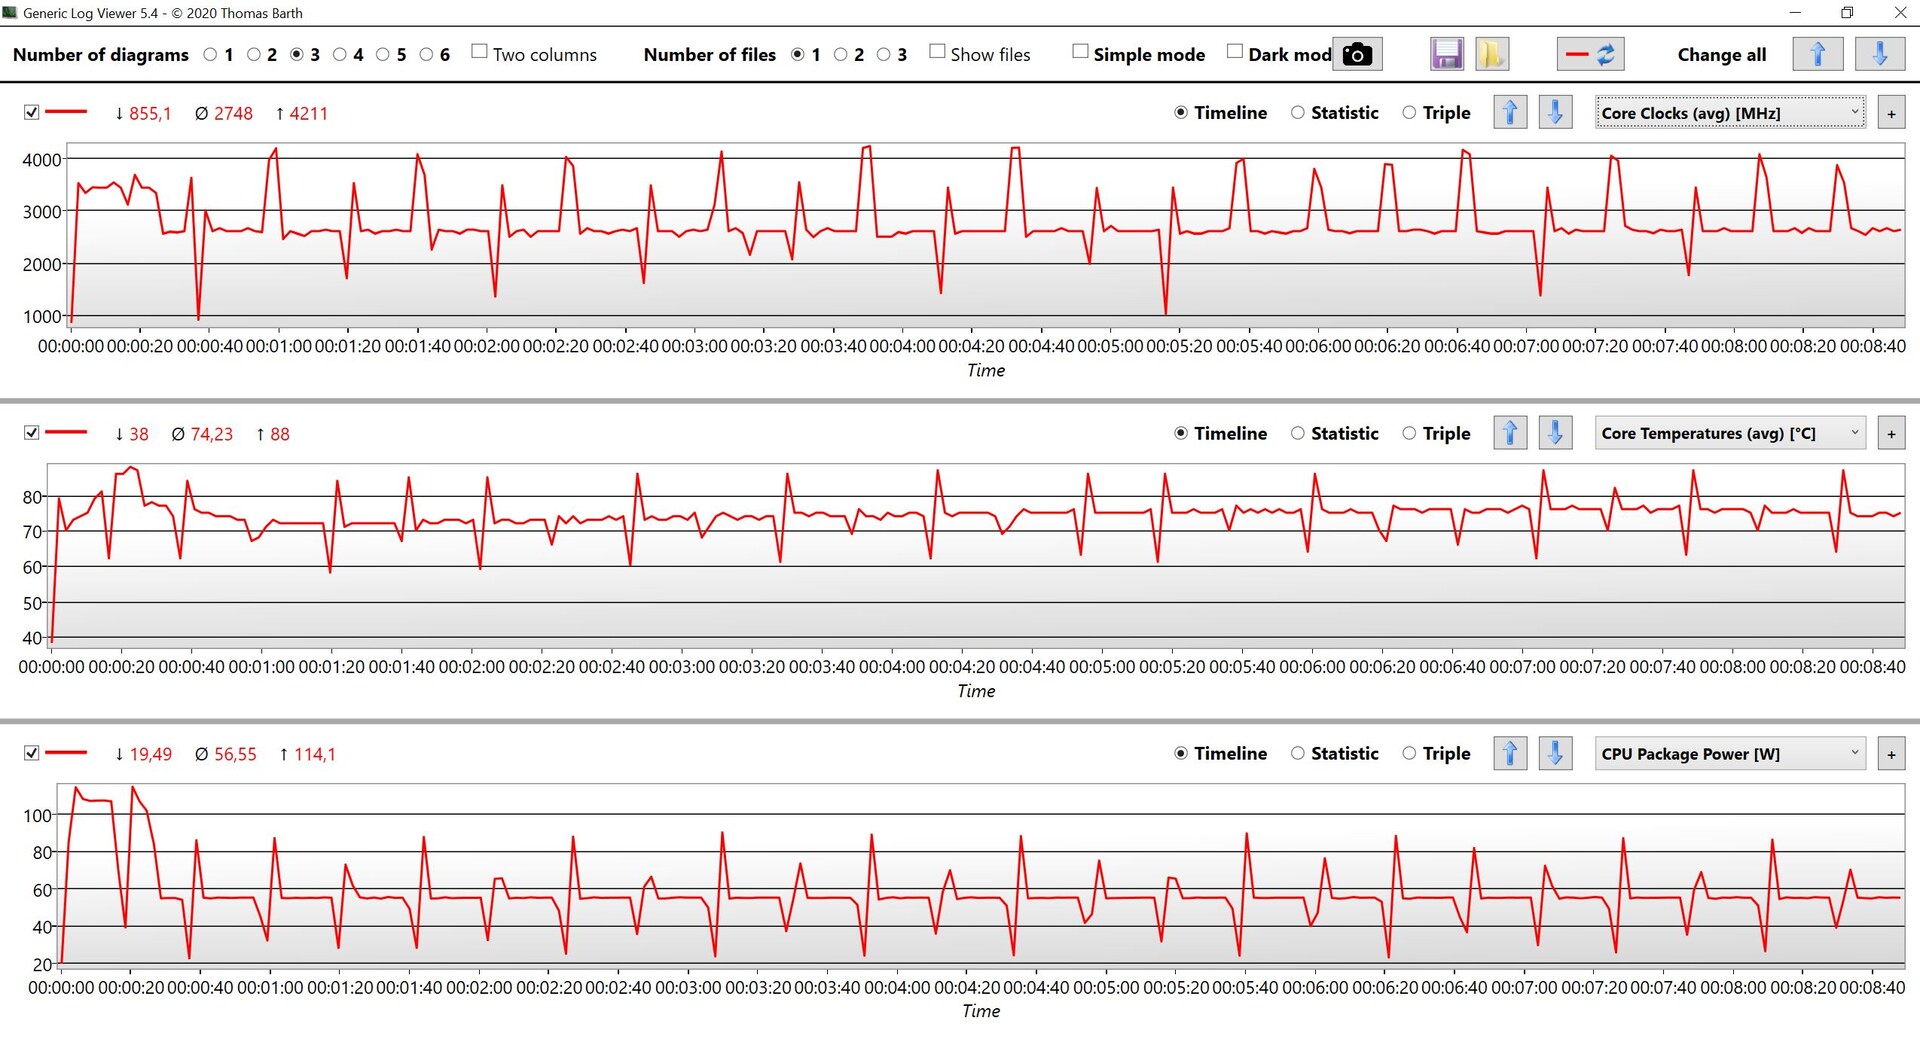
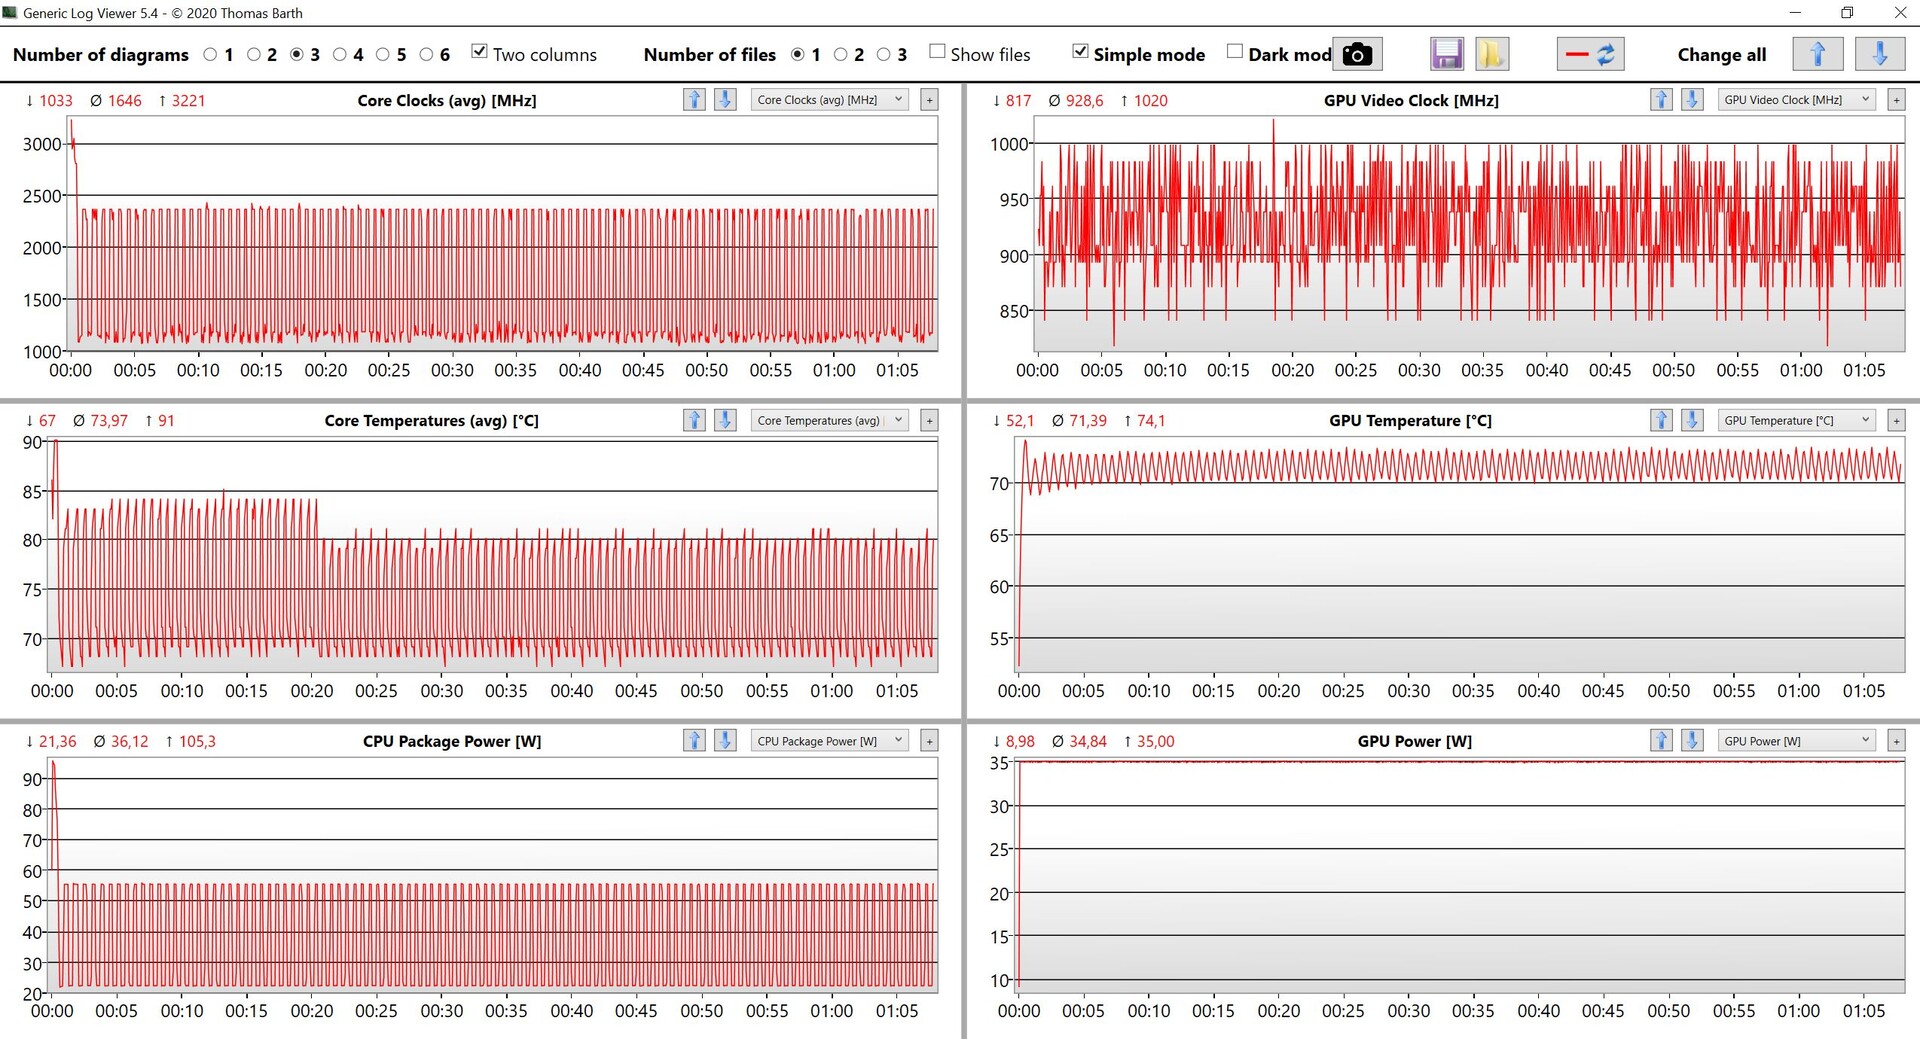
新的酷睿i9-12900H来自英特尔Alder Lake系列(第12代)的新酷睿i9-12900H是目前市场上最快的移动芯片之一,它提供了总共14个核心(6个超线程性能核心和8个效率核心)和20个线程,以及高达5.0 GHz的最大时钟速率。你可能会期望这样的CPU出现在高端游戏笔记本电脑中,当然不会出现在一个紧凑的游戏平板电脑中。标称的TDP仍然是45瓦,但华硕在实践中并没有限制消耗,我们看到在多核测试的前30秒,消耗量高达114瓦(!!!),之后消耗量平缓在55瓦。这意味着,特别是在短时间的负载高峰期(也是在许多基准测试中),ROG Flow Z13提供了出色的性能。然而,这款平板电脑总是短暂地使用内部电池,因为正如我们稍后看到的,电源适配器最多只能提供103瓦的能量。
Cinebench R15 Multi endurance test
因此,在CPU基准测试中,评测样本实际上总是处于比较领域的顶端。在Cinebench循环中,你可以清楚地看到,在第三次运行中,功耗已经稳定在55瓦,所以与第一次运行相比,性能降低了20%以上。尽管如此,英特尔芯片在55瓦的情况下仍然具有竞争力,它的性能与目前Ryzen 9 5000芯片的性能相当,在 华硕Zephyrus G14或 Razer Blade 14,在这些设备中分别以75瓦和80瓦的功率运行。目前Tiger Lake H35芯片,目前仍用于许多紧凑型笔记本电脑,其4个核心在这里完全没有机会。
55瓦的高持续消耗量对XG移动电子GPU的用户来说也是个好消息,因为这意味着CPU不会成为瓶颈。然而,在电池供电的情况下,功耗被大大限制在30瓦,但这仍能实现非常好的基准测试结果。尽管如此,必须明确指出的是,酷睿i7-12700H(相同的内核数量,略低的时钟频率)在这种情况下会取得几乎相同的性能(特别是当55瓦的限制开始生效时),而酷睿i9不会提供明显的优势。其他基准测试可在我们各自的 CPU基准测试文章.
Cinebench R23: Multi Core | Single Core
Cinebench R20: CPU (Multi Core) | CPU (Single Core)
Cinebench R15: CPU Multi 64Bit | CPU Single 64Bit
Blender: v2.79 BMW27 CPU
7-Zip 18.03: 7z b 4 | 7z b 4 -mmt1
Geekbench 5.5: Multi-Core | Single-Core
HWBOT x265 Benchmark v2.2: 4k Preset
LibreOffice : 20 Documents To PDF
R Benchmark 2.5: Overall mean
| CPU Performance rating | |
| Average of class Gaming | |
| Asus ROG Flow Z13 GZ301ZE | |
| Average Intel Core i9-12900H | |
| Asus Zephyrus G14 GA401QEC | |
| Asus ROG Flow X13 GV301QH | |
| Razer Blade 14 Ryzen 9 RTX 3070 -2! | |
| Schenker Vision 14 | |
| Microsoft Surface Pro 8, i7-1185G7 | |
| Cinebench R23 / Multi Core | |
| Average of class Gaming (10488 - 42661, n=104, last 2 years) | |
| Asus ROG Flow Z13 GZ301ZE | |
| Average Intel Core i9-12900H (7359 - 19648, n=28) | |
| Asus Zephyrus G14 GA401QEC | |
| Razer Blade 14 Ryzen 9 RTX 3070 | |
| Asus ROG Flow X13 GV301QH | |
| Schenker Vision 14 | |
| Microsoft Surface Pro 8, i7-1185G7 | |
| Cinebench R23 / Single Core | |
| Average of class Gaming (1601 - 2415, n=104, last 2 years) | |
| Asus ROG Flow Z13 GZ301ZE | |
| Average Intel Core i9-12900H (1634 - 1930, n=28) | |
| Asus ROG Flow X13 GV301QH | |
| Microsoft Surface Pro 8, i7-1185G7 | |
| Asus Zephyrus G14 GA401QEC | |
| Schenker Vision 14 | |
| Razer Blade 14 Ryzen 9 RTX 3070 | |
| Cinebench R20 / CPU (Multi Core) | |
| Average of class Gaming (4029 - 16433, n=103, last 2 years) | |
| Average Intel Core i9-12900H (2681 - 7471, n=28) | |
| Asus ROG Flow Z13 GZ301ZE | |
| Asus Zephyrus G14 GA401QEC | |
| Asus ROG Flow X13 GV301QH | |
| Razer Blade 14 Ryzen 9 RTX 3070 | |
| Schenker Vision 14 | |
| Microsoft Surface Pro 8, i7-1185G7 | |
| Cinebench R20 / CPU (Single Core) | |
| Average of class Gaming (622 - 913, n=103, last 2 years) | |
| Asus ROG Flow Z13 GZ301ZE | |
| Average Intel Core i9-12900H (624 - 738, n=28) | |
| Asus ROG Flow X13 GV301QH | |
| Schenker Vision 14 | |
| Asus Zephyrus G14 GA401QEC | |
| Microsoft Surface Pro 8, i7-1185G7 | |
| Razer Blade 14 Ryzen 9 RTX 3070 | |
| Cinebench R15 / CPU Multi 64Bit | |
| Average of class Gaming (1578 - 6330, n=102, last 2 years) | |
| Asus ROG Flow Z13 GZ301ZE | |
| Average Intel Core i9-12900H (1395 - 3077, n=28) | |
| Asus Zephyrus G14 GA401QEC | |
| Asus ROG Flow X13 GV301QH | |
| Razer Blade 14 Ryzen 9 RTX 3070 | |
| Schenker Vision 14 | |
| Schenker Vision 14 | |
| Microsoft Surface Pro 8, i7-1185G7 | |
| Cinebench R15 / CPU Single 64Bit | |
| Average of class Gaming (188.8 - 350, n=103, last 2 years) | |
| Asus ROG Flow Z13 GZ301ZE | |
| Average Intel Core i9-12900H (235 - 277, n=29) | |
| Asus ROG Flow X13 GV301QH | |
| Asus Zephyrus G14 GA401QEC | |
| Schenker Vision 14 | |
| Microsoft Surface Pro 8, i7-1185G7 | |
| Razer Blade 14 Ryzen 9 RTX 3070 | |
| Blender / v2.79 BMW27 CPU | |
| Microsoft Surface Pro 8, i7-1185G7 | |
| Schenker Vision 14 | |
| Razer Blade 14 Ryzen 9 RTX 3070 | |
| Asus ROG Flow X13 GV301QH | |
| Average Intel Core i9-12900H (160 - 451, n=28) | |
| Asus Zephyrus G14 GA401QEC | |
| Asus ROG Flow Z13 GZ301ZE | |
| Average of class Gaming (79 - 330, n=101, last 2 years) | |
| 7-Zip 18.03 / 7z b 4 | |
| Average of class Gaming (33491 - 148086, n=102, last 2 years) | |
| Asus ROG Flow Z13 GZ301ZE | |
| Average Intel Core i9-12900H (34684 - 76677, n=28) | |
| Asus Zephyrus G14 GA401QEC | |
| Asus ROG Flow X13 GV301QH | |
| Razer Blade 14 Ryzen 9 RTX 3070 | |
| Schenker Vision 14 | |
| Microsoft Surface Pro 8, i7-1185G7 | |
| 7-Zip 18.03 / 7z b 4 -mmt1 | |
| Average of class Gaming (4824 - 7436, n=102, last 2 years) | |
| Asus ROG Flow Z13 GZ301ZE | |
| Average Intel Core i9-12900H (5302 - 6289, n=28) | |
| Asus Zephyrus G14 GA401QEC | |
| Asus ROG Flow X13 GV301QH | |
| Schenker Vision 14 | |
| Microsoft Surface Pro 8, i7-1185G7 | |
| Razer Blade 14 Ryzen 9 RTX 3070 | |
| Geekbench 5.5 / Multi-Core | |
| Average of class Gaming (6460 - 28263, n=102, last 2 years) | |
| Asus ROG Flow Z13 GZ301ZE | |
| Average Intel Core i9-12900H (8519 - 14376, n=31) | |
| Asus ROG Flow X13 GV301QH | |
| Asus Zephyrus G14 GA401QEC | |
| Schenker Vision 14 | |
| Microsoft Surface Pro 8, i7-1185G7 | |
| Geekbench 5.5 / Single-Core | |
| Average of class Gaming (1403 - 2474, n=102, last 2 years) | |
| Asus ROG Flow Z13 GZ301ZE | |
| Average Intel Core i9-12900H (1631 - 1897, n=31) | |
| Schenker Vision 14 | |
| Microsoft Surface Pro 8, i7-1185G7 | |
| Asus Zephyrus G14 GA401QEC | |
| Asus ROG Flow X13 GV301QH | |
| HWBOT x265 Benchmark v2.2 / 4k Preset | |
| Average of class Gaming (11.5 - 44.4, n=102, last 2 years) | |
| Asus ROG Flow Z13 GZ301ZE | |
| Average Intel Core i9-12900H (8.05 - 22.5, n=28) | |
| Asus Zephyrus G14 GA401QEC | |
| Razer Blade 14 Ryzen 9 RTX 3070 | |
| Asus ROG Flow X13 GV301QH | |
| Schenker Vision 14 | |
| Microsoft Surface Pro 8, i7-1185G7 | |
| LibreOffice / 20 Documents To PDF | |
| Asus ROG Flow X13 GV301QH | |
| Razer Blade 14 Ryzen 9 RTX 3070 | |
| Asus Zephyrus G14 GA401QEC | |
| Microsoft Surface Pro 8, i7-1185G7 | |
| Average of class Gaming (33.2 - 88.8, n=102, last 2 years) | |
| Schenker Vision 14 | |
| Average Intel Core i9-12900H (36.8 - 59.8, n=28) | |
| Asus ROG Flow Z13 GZ301ZE | |
| R Benchmark 2.5 / Overall mean | |
| Razer Blade 14 Ryzen 9 RTX 3070 | |
| Microsoft Surface Pro 8, i7-1185G7 | |
| Schenker Vision 14 | |
| Asus Zephyrus G14 GA401QEC | |
| Asus ROG Flow X13 GV301QH | |
| Average Intel Core i9-12900H (0.4218 - 0.506, n=28) | |
| Asus ROG Flow Z13 GZ301ZE | |
| Average of class Gaming (0.3439 - 0.59, n=102, last 2 years) | |
* ... smaller is better
AIDA64: FP32 Ray-Trace | FPU Julia | CPU SHA3 | CPU Queen | FPU SinJulia | FPU Mandel | CPU AES | CPU ZLib | FP64 Ray-Trace | CPU PhotoWorxx
| Performance rating | |
| Average of class Gaming | |
| Asus Zephyrus G14 GA401QEC | |
| Razer Blade 14 Ryzen 9 RTX 3070 | |
| Average Intel Core i9-12900H | |
| Asus ROG Flow Z13 GZ301ZE | |
| Schenker Vision 14 | |
| Microsoft Surface Pro 8, i7-1185G7 | |
| AIDA64 / FP32 Ray-Trace | |
| Average of class Gaming (10227 - 85542, n=102, last 2 years) | |
| Asus Zephyrus G14 GA401QEC | |
| Razer Blade 14 Ryzen 9 RTX 3070 | |
| Average Intel Core i9-12900H (4074 - 18289, n=29) | |
| Schenker Vision 14 | |
| Asus ROG Flow Z13 GZ301ZE | |
| Microsoft Surface Pro 8, i7-1185G7 | |
| AIDA64 / FPU Julia | |
| Average of class Gaming (51376 - 372155, n=102, last 2 years) | |
| Asus Zephyrus G14 GA401QEC | |
| Razer Blade 14 Ryzen 9 RTX 3070 | |
| Average Intel Core i9-12900H (22307 - 93236, n=29) | |
| Asus ROG Flow Z13 GZ301ZE | |
| Schenker Vision 14 | |
| Microsoft Surface Pro 8, i7-1185G7 | |
| AIDA64 / CPU SHA3 | |
| Average of class Gaming (2180 - 10115, n=102, last 2 years) | |
| Asus Zephyrus G14 GA401QEC | |
| Razer Blade 14 Ryzen 9 RTX 3070 | |
| Average Intel Core i9-12900H (1378 - 4215, n=29) | |
| Asus ROG Flow Z13 GZ301ZE | |
| Schenker Vision 14 | |
| Microsoft Surface Pro 8, i7-1185G7 | |
| AIDA64 / CPU Queen | |
| Average of class Gaming (49785 - 173351, n=86, last 2 years) | |
| Asus ROG Flow Z13 GZ301ZE | |
| Asus Zephyrus G14 GA401QEC | |
| Average Intel Core i9-12900H (78172 - 111241, n=28) | |
| Razer Blade 14 Ryzen 9 RTX 3070 | |
| Schenker Vision 14 | |
| Microsoft Surface Pro 8, i7-1185G7 | |
| AIDA64 / FPU SinJulia | |
| Average of class Gaming (4424 - 33636, n=102, last 2 years) | |
| Asus Zephyrus G14 GA401QEC | |
| Razer Blade 14 Ryzen 9 RTX 3070 | |
| Asus ROG Flow Z13 GZ301ZE | |
| Average Intel Core i9-12900H (5709 - 10410, n=29) | |
| Schenker Vision 14 | |
| Microsoft Surface Pro 8, i7-1185G7 | |
| AIDA64 / FPU Mandel | |
| Average of class Gaming (25115 - 196829, n=102, last 2 years) | |
| Asus Zephyrus G14 GA401QEC | |
| Razer Blade 14 Ryzen 9 RTX 3070 | |
| Average Intel Core i9-12900H (11257 - 45581, n=29) | |
| Asus ROG Flow Z13 GZ301ZE | |
| Schenker Vision 14 | |
| Microsoft Surface Pro 8, i7-1185G7 | |
| AIDA64 / CPU AES | |
| Asus Zephyrus G14 GA401QEC | |
| Razer Blade 14 Ryzen 9 RTX 3070 | |
| Average of class Gaming (39258 - 247074, n=102, last 2 years) | |
| Average Intel Core i9-12900H (31935 - 151546, n=29) | |
| Asus ROG Flow Z13 GZ301ZE | |
| Schenker Vision 14 | |
| Microsoft Surface Pro 8, i7-1185G7 | |
| AIDA64 / CPU ZLib | |
| Average of class Gaming (574 - 2531, n=102, last 2 years) | |
| Average Intel Core i9-12900H (449 - 1193, n=29) | |
| Asus ROG Flow Z13 GZ301ZE | |
| Asus Zephyrus G14 GA401QEC | |
| Razer Blade 14 Ryzen 9 RTX 3070 | |
| Schenker Vision 14 | |
| Microsoft Surface Pro 8, i7-1185G7 | |
| AIDA64 / FP64 Ray-Trace | |
| Average of class Gaming (5509 - 45446, n=102, last 2 years) | |
| Razer Blade 14 Ryzen 9 RTX 3070 | |
| Asus Zephyrus G14 GA401QEC | |
| Average Intel Core i9-12900H (2235 - 10511, n=29) | |
| Schenker Vision 14 | |
| Asus ROG Flow Z13 GZ301ZE | |
| Microsoft Surface Pro 8, i7-1185G7 | |
| AIDA64 / CPU PhotoWorxx | |
| Average of class Gaming (12271 - 89891, n=102, last 2 years) | |
| Asus ROG Flow Z13 GZ301ZE | |
| Microsoft Surface Pro 8, i7-1185G7 | |
| Average Intel Core i9-12900H (20960 - 48269, n=30) | |
| Schenker Vision 14 | |
| Razer Blade 14 Ryzen 9 RTX 3070 | |
| Asus Zephyrus G14 GA401QEC | |
系统性能
ROG Flow Z13是一个非常强大的系统,这也被良好的基准测试结果所证实。然而,在测试过程中,我们不时遇到轻微的卡顿,例如在打开Windows设置时。我们还不知道其原因,但这似乎不是图形切换功能的问题。这可能与Armoury Crate软件有关,也可能与处理器内核的新混合结构有关。尽管如此,在我们的测试中,卡顿只是很少发生,因此并不是一个真正的问题。除此之外,主观的性能印象也非常好。
CrossMark: Overall | Productivity | Creativity | Responsiveness
| PCMark 10 / Score | |
| Average of class Gaming (5828 - 12414, n=93, last 2 years) | |
| Razer Blade 14 Ryzen 9 RTX 3070 | |
| Asus Zephyrus G14 GA401QEC | |
| Asus ROG Flow Z13 GZ301ZE | |
| Average Intel Core i9-12900H, NVIDIA GeForce RTX 3050 Ti Laptop GPU (n=1) | |
| Asus ROG Flow X13 GV301QH | |
| Schenker Vision 14 | |
| Microsoft Surface Pro 8, i7-1185G7 | |
| PCMark 10 / Essentials | |
| Asus ROG Flow Z13 GZ301ZE | |
| Average Intel Core i9-12900H, NVIDIA GeForce RTX 3050 Ti Laptop GPU (n=1) | |
| Average of class Gaming (8810 - 11935, n=97, last 2 years) | |
| Razer Blade 14 Ryzen 9 RTX 3070 | |
| Asus Zephyrus G14 GA401QEC | |
| Asus ROG Flow X13 GV301QH | |
| Microsoft Surface Pro 8, i7-1185G7 | |
| Schenker Vision 14 | |
| PCMark 10 / Productivity | |
| Average of class Gaming (6845 - 25323, n=95, last 2 years) | |
| Asus ROG Flow Z13 GZ301ZE | |
| Average Intel Core i9-12900H, NVIDIA GeForce RTX 3050 Ti Laptop GPU (n=1) | |
| Asus Zephyrus G14 GA401QEC | |
| Razer Blade 14 Ryzen 9 RTX 3070 | |
| Schenker Vision 14 | |
| Asus ROG Flow X13 GV301QH | |
| Microsoft Surface Pro 8, i7-1185G7 | |
| PCMark 10 / Digital Content Creation | |
| Average of class Gaming (7602 - 19954, n=95, last 2 years) | |
| Razer Blade 14 Ryzen 9 RTX 3070 | |
| Asus Zephyrus G14 GA401QEC | |
| Asus ROG Flow X13 GV301QH | |
| Schenker Vision 14 | |
| Asus ROG Flow Z13 GZ301ZE | |
| Average Intel Core i9-12900H, NVIDIA GeForce RTX 3050 Ti Laptop GPU (n=1) | |
| Microsoft Surface Pro 8, i7-1185G7 | |
| CrossMark / Overall | |
| Asus ROG Flow Z13 GZ301ZE | |
| Average Intel Core i9-12900H, NVIDIA GeForce RTX 3050 Ti Laptop GPU (n=1) | |
| Average of class Gaming (1366 - 2409, n=94, last 2 years) | |
| Schenker Vision 14 | |
| Microsoft Surface Pro 8, i7-1185G7 | |
| CrossMark / Productivity | |
| Asus ROG Flow Z13 GZ301ZE | |
| Average Intel Core i9-12900H, NVIDIA GeForce RTX 3050 Ti Laptop GPU (n=1) | |
| Average of class Gaming (1386 - 2254, n=94, last 2 years) | |
| Schenker Vision 14 | |
| Microsoft Surface Pro 8, i7-1185G7 | |
| CrossMark / Creativity | |
| Average of class Gaming (1343 - 2786, n=94, last 2 years) | |
| Asus ROG Flow Z13 GZ301ZE | |
| Average Intel Core i9-12900H, NVIDIA GeForce RTX 3050 Ti Laptop GPU (n=1) | |
| Microsoft Surface Pro 8, i7-1185G7 | |
| Schenker Vision 14 | |
| CrossMark / Responsiveness | |
| Asus ROG Flow Z13 GZ301ZE | |
| Average Intel Core i9-12900H, NVIDIA GeForce RTX 3050 Ti Laptop GPU (n=1) | |
| Average of class Gaming (1226 - 2334, n=94, last 2 years) | |
| Schenker Vision 14 | |
| Microsoft Surface Pro 8, i7-1185G7 | |
| PCMark 10 Score | 6335 points | |
Help | ||
| AIDA64 / Memory Copy | |
| Asus ROG Flow Z13 GZ301ZE | |
| Average of class Gaming (21750 - 129946, n=102, last 2 years) | |
| Microsoft Surface Pro 8, i7-1185G7 | |
| Average Intel Core i9-12900H (34438 - 74264, n=29) | |
| Schenker Vision 14 | |
| Asus Zephyrus G14 GA401QEC | |
| Razer Blade 14 Ryzen 9 RTX 3070 | |
| AIDA64 / Memory Read | |
| Average of class Gaming (22956 - 118858, n=102, last 2 years) | |
| Asus ROG Flow Z13 GZ301ZE | |
| Average Intel Core i9-12900H (36365 - 74642, n=29) | |
| Microsoft Surface Pro 8, i7-1185G7 | |
| Schenker Vision 14 | |
| Asus Zephyrus G14 GA401QEC | |
| Razer Blade 14 Ryzen 9 RTX 3070 | |
| AIDA64 / Memory Write | |
| Average of class Gaming (22297 - 135096, n=102, last 2 years) | |
| Asus ROG Flow Z13 GZ301ZE | |
| Microsoft Surface Pro 8, i7-1185G7 | |
| Average Intel Core i9-12900H (32276 - 67858, n=29) | |
| Schenker Vision 14 | |
| Razer Blade 14 Ryzen 9 RTX 3070 | |
| Asus Zephyrus G14 GA401QEC | |
| AIDA64 / Memory Latency | |
| Asus ROG Flow Z13 GZ301ZE | |
| Average of class Gaming (75.3 - 165.4, n=102, last 2 years) | |
| Microsoft Surface Pro 8, i7-1185G7 | |
| Average Intel Core i9-12900H (74.7 - 118.1, n=28) | |
| Razer Blade 14 Ryzen 9 RTX 3070 | |
| Asus Zephyrus G14 GA401QEC | |
| Schenker Vision 14 | |
* ... smaller is better
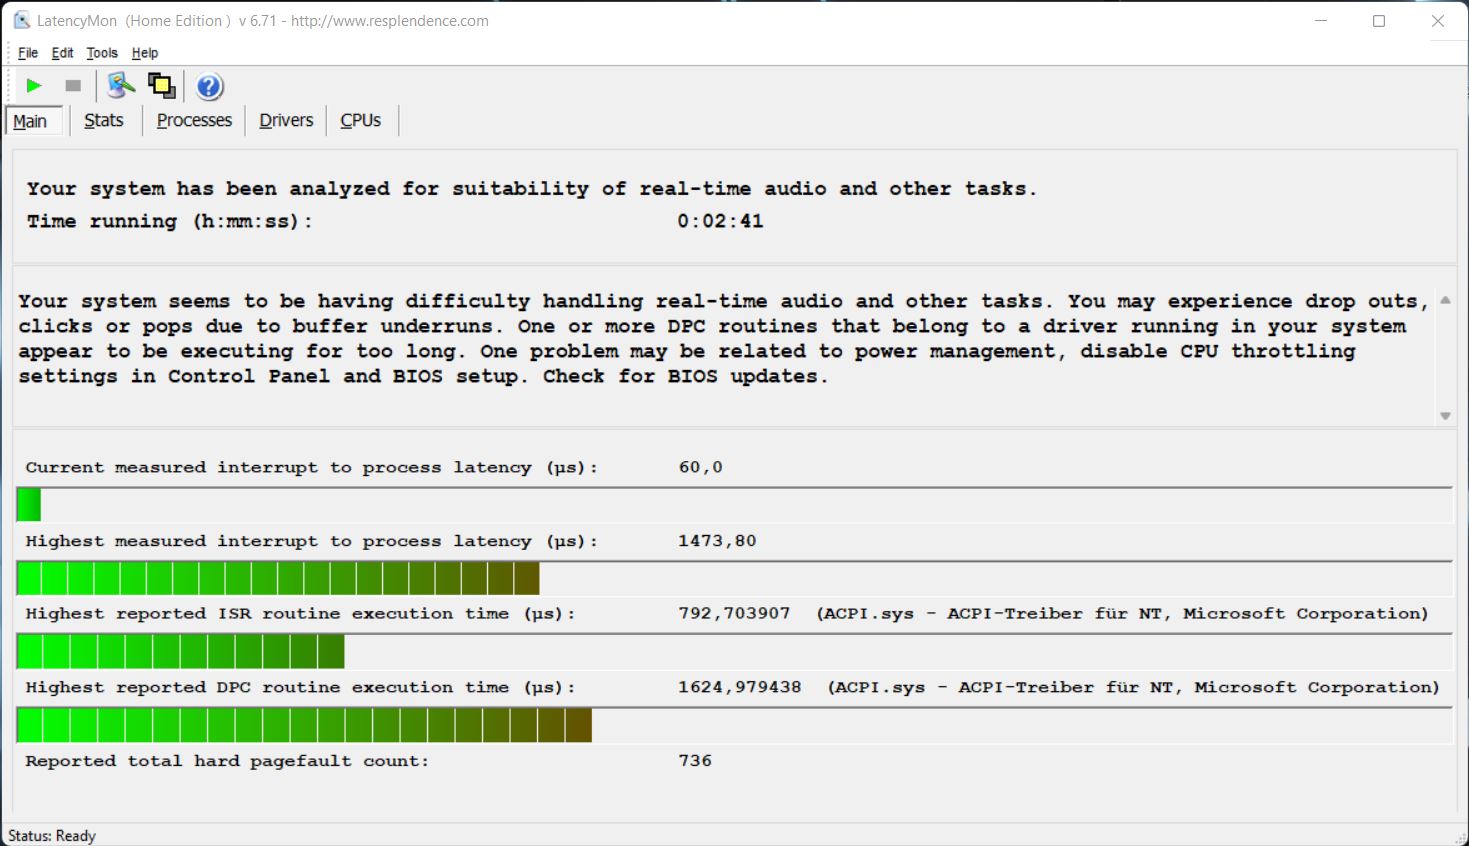
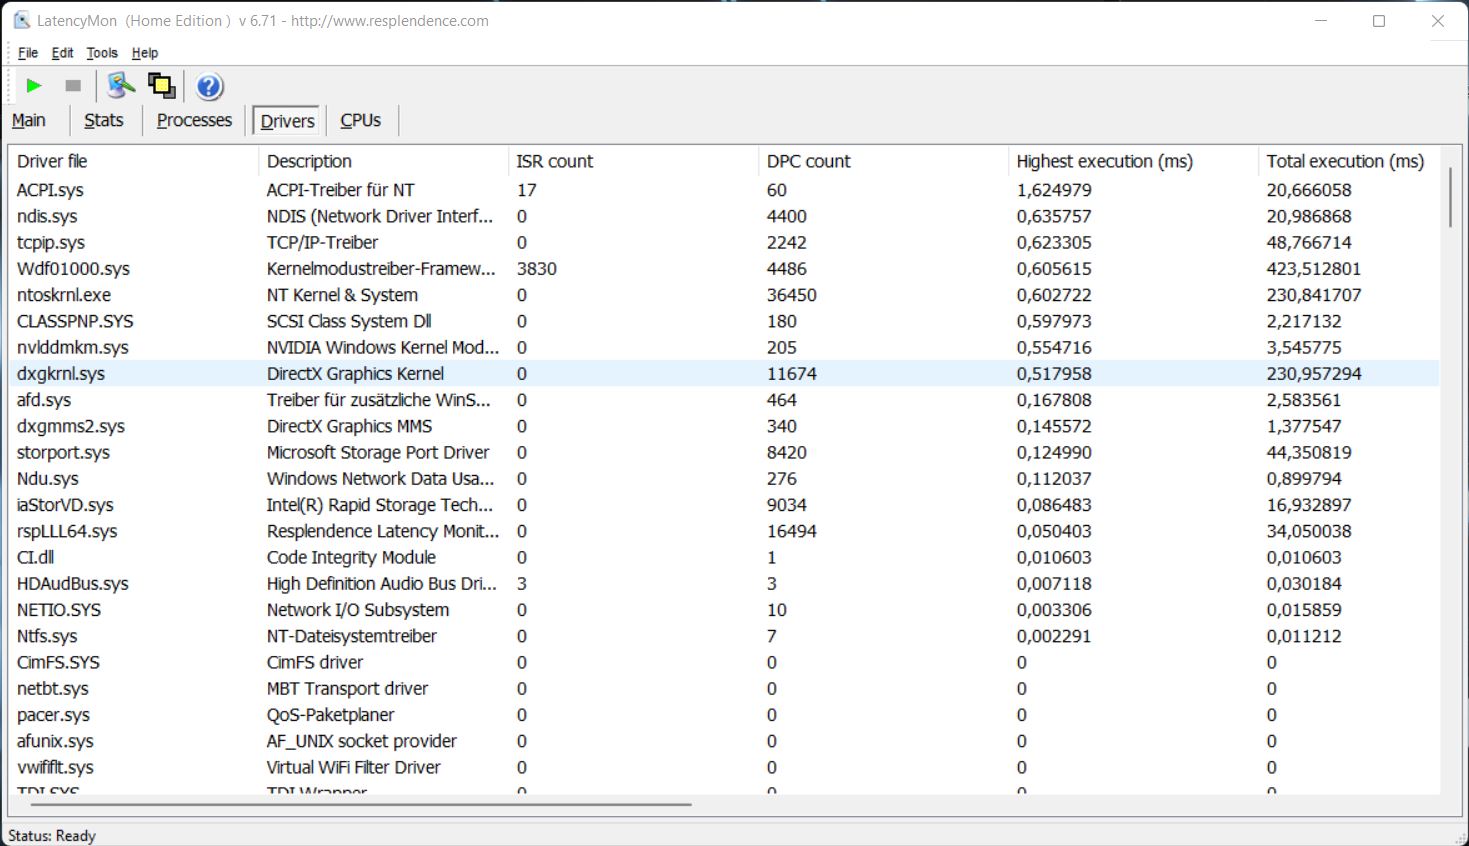
DPC延迟
在我们的标准化延迟测试中(网页浏览、YouTube 4K播放、CPU负载),Flow Z13表现出升高的延迟。因此,在目前的BIOS版本下,这款游戏平板电脑只适合在有限范围内使用实时音频软件。
| DPC Latencies / LatencyMon - interrupt to process latency (max), Web, Youtube, Prime95 | |
| Asus ROG Flow X13 GV301QH | |
| Asus ROG Flow Z13 GZ301ZE | |
| Schenker Vision 14 | |
| Asus Zephyrus G14 GA401QEC | |
| Microsoft Surface Pro 8, i7-1185G7 | |
| Razer Blade 14 Ryzen 9 RTX 3070 | |
* ... smaller is better
储存
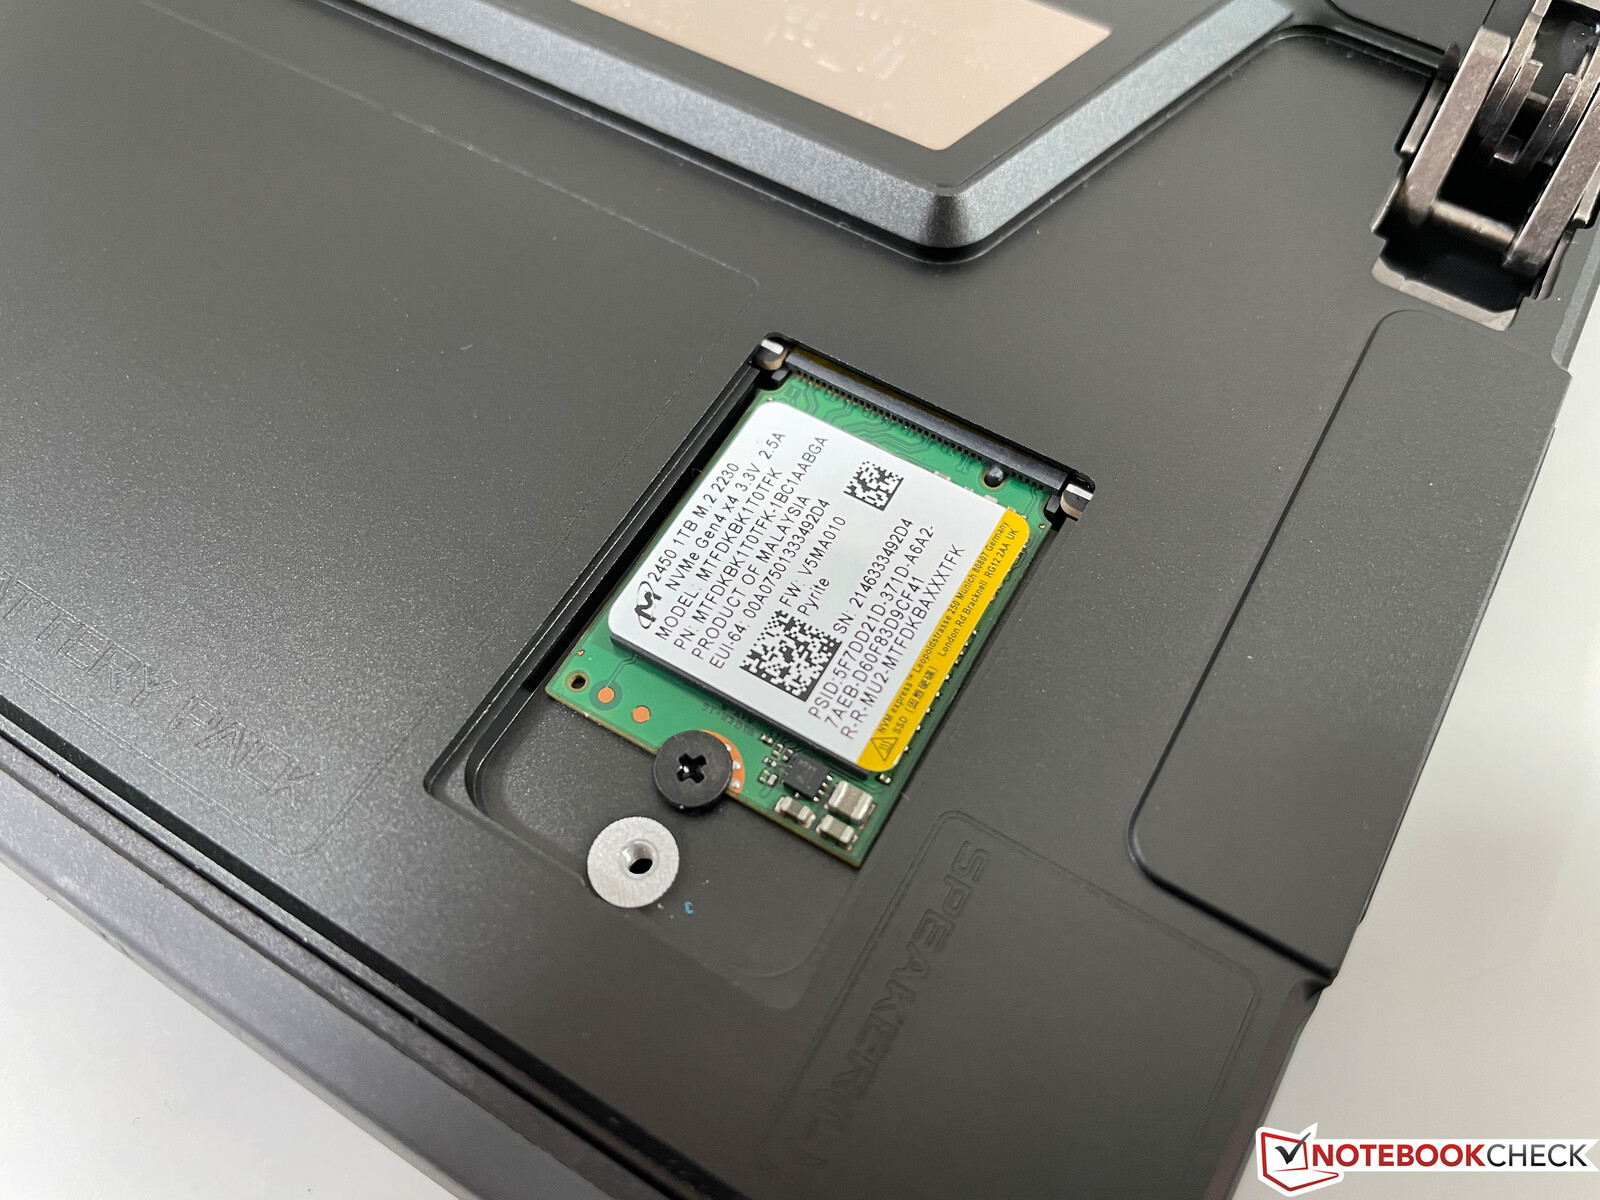
华硕选择使用一个紧凑的M.2-2230固态硬盘,通过背面的小舱门也非常容易进入。尽管尺寸很小,但这是一款PCIe 4.0固态硬盘,在我们的案例中,它来自美光,提供1TB的存储容量。其中875GB在第一次启动后仍然可用。基准测试结果绝对不差,在日常使用或游戏中没有问题,但最大的连续传输率更符合快速PCIe 3.0 x4驱动器。作为交换,美光SSD在4K测试中提供了非常好的性能。更多的SSD基准测试可在 这里.

* ... smaller is better
Continuous load read: DiskSpd Read Loop, Queue Depth 8
显卡 -GeForce RTX 3050 Ti
在日常使用中,该处理器的高效Iris Xe Graphics G7通常负责图形处理。这是有96个EU的版本,我们已经从上一代Tiger Lake U的酷睿i7处理器中熟悉了这个版本(例如: 酷睿i7-1165G7).对于要求更高的应用,如游戏,专用的NvidiaGeForce RTX 3050 Ti是由Optimus技术自动启用的。正如我们之前提到的,这是RTX 3050 Ti的最慢版本,TGP只有35瓦,其中处理器仍然可以根据使用情况提供5瓦,这要感谢动态提升。我们在基准测试中观察到最大的核心时钟频率为1,297 MHz,并且有4GB的GDDR6 VRAM可用。
合成基准测试再次表明,这是RTX 3050 Ti最慢的版本之一,因为ROG Flow Z13比我们数据库中RTX 3050 Ti的平均结果落后约20%。然而,在长时间的负载下,性能仍然稳定,3DMarkTime Spy 压力测试以97%的比例完成。在电池供电方面,消耗量最初被限制在35瓦。当电池电量降到50%以下时,最大仍为26瓦。其他GPU基准测试可在 这里.
| 3DMark 11 Performance | 14864 points | |
| 3DMark Fire Strike Score | 9794 points | |
| 3DMark Time Spy Score | 4530 points | |
Help | ||
游戏性能
由于内置的MUX开关,集成显卡可以被完全禁用,这可能会导致延迟的改善和更高的游戏性能。然而,在我们的测试中,无论我们是运行合成3DMarks还是游戏测试,都无法检测到性能的提高。这当然是你可以试验一下的东西,但一般来说,我们会建议简单地让混合图形处于启用状态,因为Nvidia的Optimus技术工作得非常好。
在现代游戏中,RTX 3050 Ti的游戏性能往往只满足于中等细节,但至少要求不高或较老的游戏往往可以在高细节下玩。我们在去年审查了外部XG Mobile eGPU 与ROG Flow X13的组合。,但那时你最好在外部显示器上玩,因为否则性能会受到影响。在任何情况下,150瓦版本的移动GeForce RTX 3080提供了一个可观的性能提升。
| The Witcher 3 | |
| 1920x1080 High Graphics & Postprocessing (Nvidia HairWorks Off) | |
| Average of class Gaming (341 - 404, n=2, last 2 years) | |
| Razer Blade 14 Ryzen 9 RTX 3070 | |
| Asus Zephyrus G14 GA401QEC | |
| Average NVIDIA GeForce RTX 3050 Ti Laptop GPU (30 - 110, n=26) | |
| Asus ROG Flow Z13 GZ301ZE | |
| Schenker Vision 14 | |
| Asus ROG Flow X13 GV301QH | |
| Microsoft Surface Pro 8, i7-1185G7 | |
| 1920x1080 Ultra Graphics & Postprocessing (HBAO+) | |
| Average of class Gaming (104.7 - 240, n=7, last 2 years) | |
| Razer Blade 14 Ryzen 9 RTX 3070 | |
| Asus Zephyrus G14 GA401QEC | |
| Average NVIDIA GeForce RTX 3050 Ti Laptop GPU (19 - 58.5, n=29) | |
| Schenker Vision 14 | |
| Asus ROG Flow Z13 GZ301ZE | |
| Asus ROG Flow X13 GV301QH | |
| Microsoft Surface Pro 8, i7-1185G7 | |
| F1 2021 | |
| 1920x1080 High Preset AA:T AF:16x | |
| Asus Zephyrus G14 GA401QEC | |
| Average NVIDIA GeForce RTX 3050 Ti Laptop GPU (68 - 131, n=11) | |
| Schenker Vision 14 | |
| Asus ROG Flow Z13 GZ301ZE | |
| 1920x1080 Ultra High Preset + Raytracing AA:T AF:16x | |
| Asus Zephyrus G14 GA401QEC | |
| Average NVIDIA GeForce RTX 3050 Ti Laptop GPU (44.4 - 69, n=11) | |
| Asus ROG Flow Z13 GZ301ZE | |
| Schenker Vision 14 | |
| Cyberpunk 2077 1.0 | |
| 1920x1080 Medium Preset | |
| Average NVIDIA GeForce RTX 3050 Ti Laptop GPU (39 - 45.6, n=4) | |
| Asus ROG Flow Z13 GZ301ZE | |
| 1920x1080 High Preset | |
| Average NVIDIA GeForce RTX 3050 Ti Laptop GPU (32 - 36.2, n=4) | |
| Asus ROG Flow Z13 GZ301ZE | |
原则上,你仍然可以用电池供电进行游戏,但你应该记住,当电池电量低于50%时,性能会下降一些(此时TGP只有26瓦而不是35瓦)。在我们对《Witcher 3》的测试中,帧率从37FPS下降到27FPS,使游戏看起来有点不流畅,并要求你降低一点细节水平。无论如何,游戏期间的电池运行时间非常短,只有47分钟。进一步的游戏基准测试可在我们的 游戏基准测试文章.
The Witcher 3 FPS diagram
| low | med. | high | ultra | |
|---|---|---|---|---|
| GTA V (2015) | 181 | 174 | 114 | 54.9 |
| The Witcher 3 (2015) | 225 | 142 | 74 | 37.1 |
| Dota 2 Reborn (2015) | 187 | 172 | 151 | 137 |
| Final Fantasy XV Benchmark (2018) | 106 | 106 | ||
| X-Plane 11.11 (2018) | 134 | 114 | 92.5 | |
| Far Cry 5 (2018) | 132 | 70 | 65 | 59 |
| Strange Brigade (2018) | 232 | 100 | 79.2 | 68 |
| Cyberpunk 2077 1.0 (2020) | 75 | 39 | 32 | 26 |
| F1 2021 (2021) | 224 | 118 | 93.9 | 47.1 |
排放--具有令人惊讶的安静冷却效果的游戏平板电脑
噪声排放
华硕为其游戏平板电脑使用了高质量的冷却解决方案,为处理器选择了液态金属,以及带有两个风扇的蒸汽室冷却。考虑到高性能,我们对其噪音水平感到非常惊讶。在日常使用中,该设备通常是完全无声的,风扇根本不运行或根本听不见。然而,在负载情况下,风扇会迅速转动起来。一旦你将显卡置于负载之下(例如游戏时),噪音水平很快就会达到41 dB(A),但这一点也不令人感到困扰。你可以在背景中听到它,但你仍然可以毫无问题地进行游戏,并实际使用扬声器来播放游戏声音。如果你只对处理器施加压力(例如在使用XG Mobile eGPU时),ROG Flow Z13仍然更安静,为37.5 dB(A)。当负载结束时,风扇速度也会很快降低(逐渐在31.9和29.6 dB(A)之间),而且它们也会很快再次变得不可闻。可选的涡轮模式并没有提供更高的性能,但噪音水平增加到44dB(A)左右。但正如我们稍后看到的,无论如何,温度并不关键,所以涡轮模式并没有真正意义。
我们在合成的GPU基准测试中注意到一些轻微的电子噪音,但在实际游戏和日常任务中没有问题。
Noise level
| Idle |
| 24.5 / 24.5 / 24.5 dB(A) |
| Load |
| 41 / 41 dB(A) |
 | ||
30 dB silent 40 dB(A) audible 50 dB(A) loud |
||
min: | ||
| Asus ROG Flow Z13 GZ301ZE GeForce RTX 3050 Ti Laptop GPU, i9-12900H, Micron 2450 1TB MTFDKBK1T0TFK | Schenker Vision 14 GeForce RTX 3050 Ti Laptop GPU, i7-11370H, Samsung SSD 980 Pro 1TB MZ-V8P1T0BW | Asus Zephyrus G14 GA401QEC GeForce RTX 3050 Ti Laptop GPU, R9 5900HS, Samsung PM991 MZVLQ1T0HALB | Microsoft Surface Pro 8, i7-1185G7 Iris Xe G7 96EUs, i7-1185G7, Toshiba KBG40ZNS256G NVMe | Razer Blade 14 Ryzen 9 RTX 3070 GeForce RTX 3070 Laptop GPU, R9 5900HX, Samsung PM981a MZVLB1T0HBLR | Asus ROG Flow X13 GV301QH GeForce GTX 1650 Max-Q, R9 5980HS, WDC PC SN530 SDBPNPZ-1T00 | |
|---|---|---|---|---|---|---|
| Noise | -6% | -23% | 1% | -3% | -16% | |
| off / environment * (dB) | 24.5 | 24.3 1% | 30.5 -24% | 24.7 -1% | 25.1 -2% | 30.5 -24% |
| Idle Minimum * (dB) | 24.5 | 24.3 1% | 33.3 -36% | 24.7 -1% | 25.2 -3% | 30.5 -24% |
| Idle Average * (dB) | 24.5 | 24.3 1% | 33.3 -36% | 24.7 -1% | 25.2 -3% | 30.5 -24% |
| Idle Maximum * (dB) | 24.5 | 25.9 -6% | 33.3 -36% | 24.7 -1% | 25.2 -3% | 32.1 -31% |
| Load Average * (dB) | 41 | 43.3 -6% | 36.1 12% | 36.8 10% | 31 24% | 43 -5% |
| Witcher 3 ultra * (dB) | 41 | 44.6 -9% | 36.8 10% | 44 -7% | 42.8 -4% | |
| Load Maximum * (dB) | 41 | 49.5 -21% | 48.6 -19% | 43.8 -7% | 51.7 -26% | 41.3 -1% |
* ... smaller is better
温度
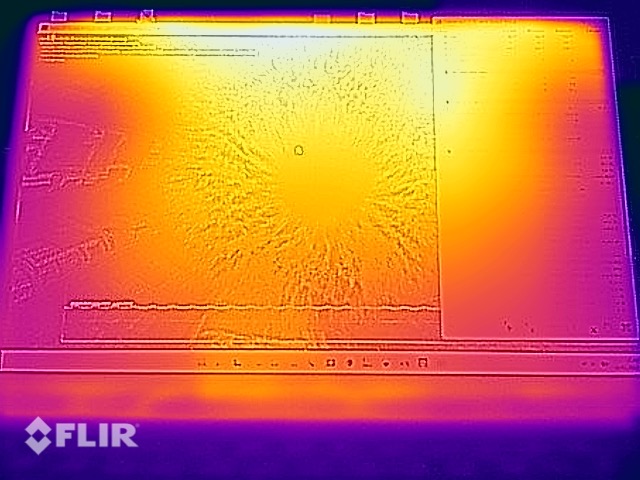
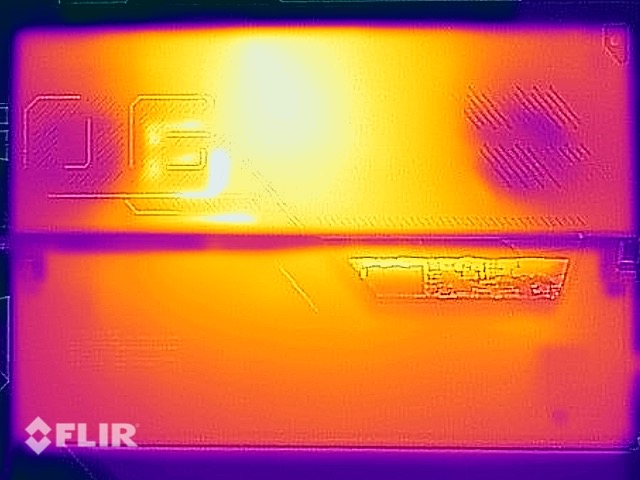
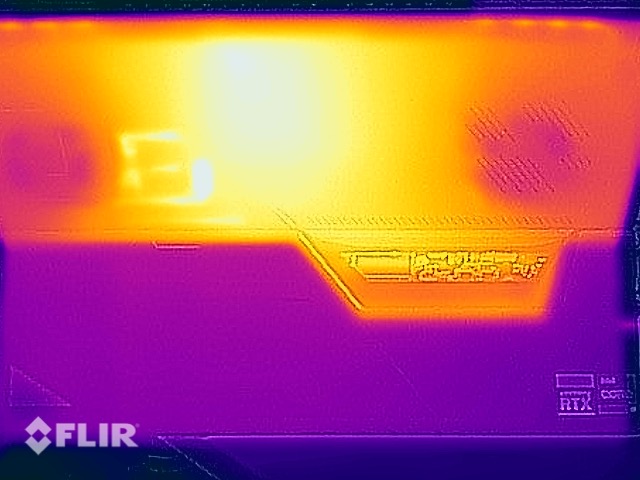
尽管噪音水平相当低,ROG Flow Z13在游戏过程中并没有变得特别热,因为我们可以在这里的背面记录到最高约44℃(约111°F)。即使在压力测试中,也没有超过50°C(约122°F)的标志。然而,由于你在游戏(要求高的游戏)时几乎不会把平板电脑拿在手里,所以你在这里不会有任何问题。此外,热空气被向上疏散,所以它不会成为一个麻烦。在日常工作中,机箱温度甚至没有达到30℃(约86°F)。
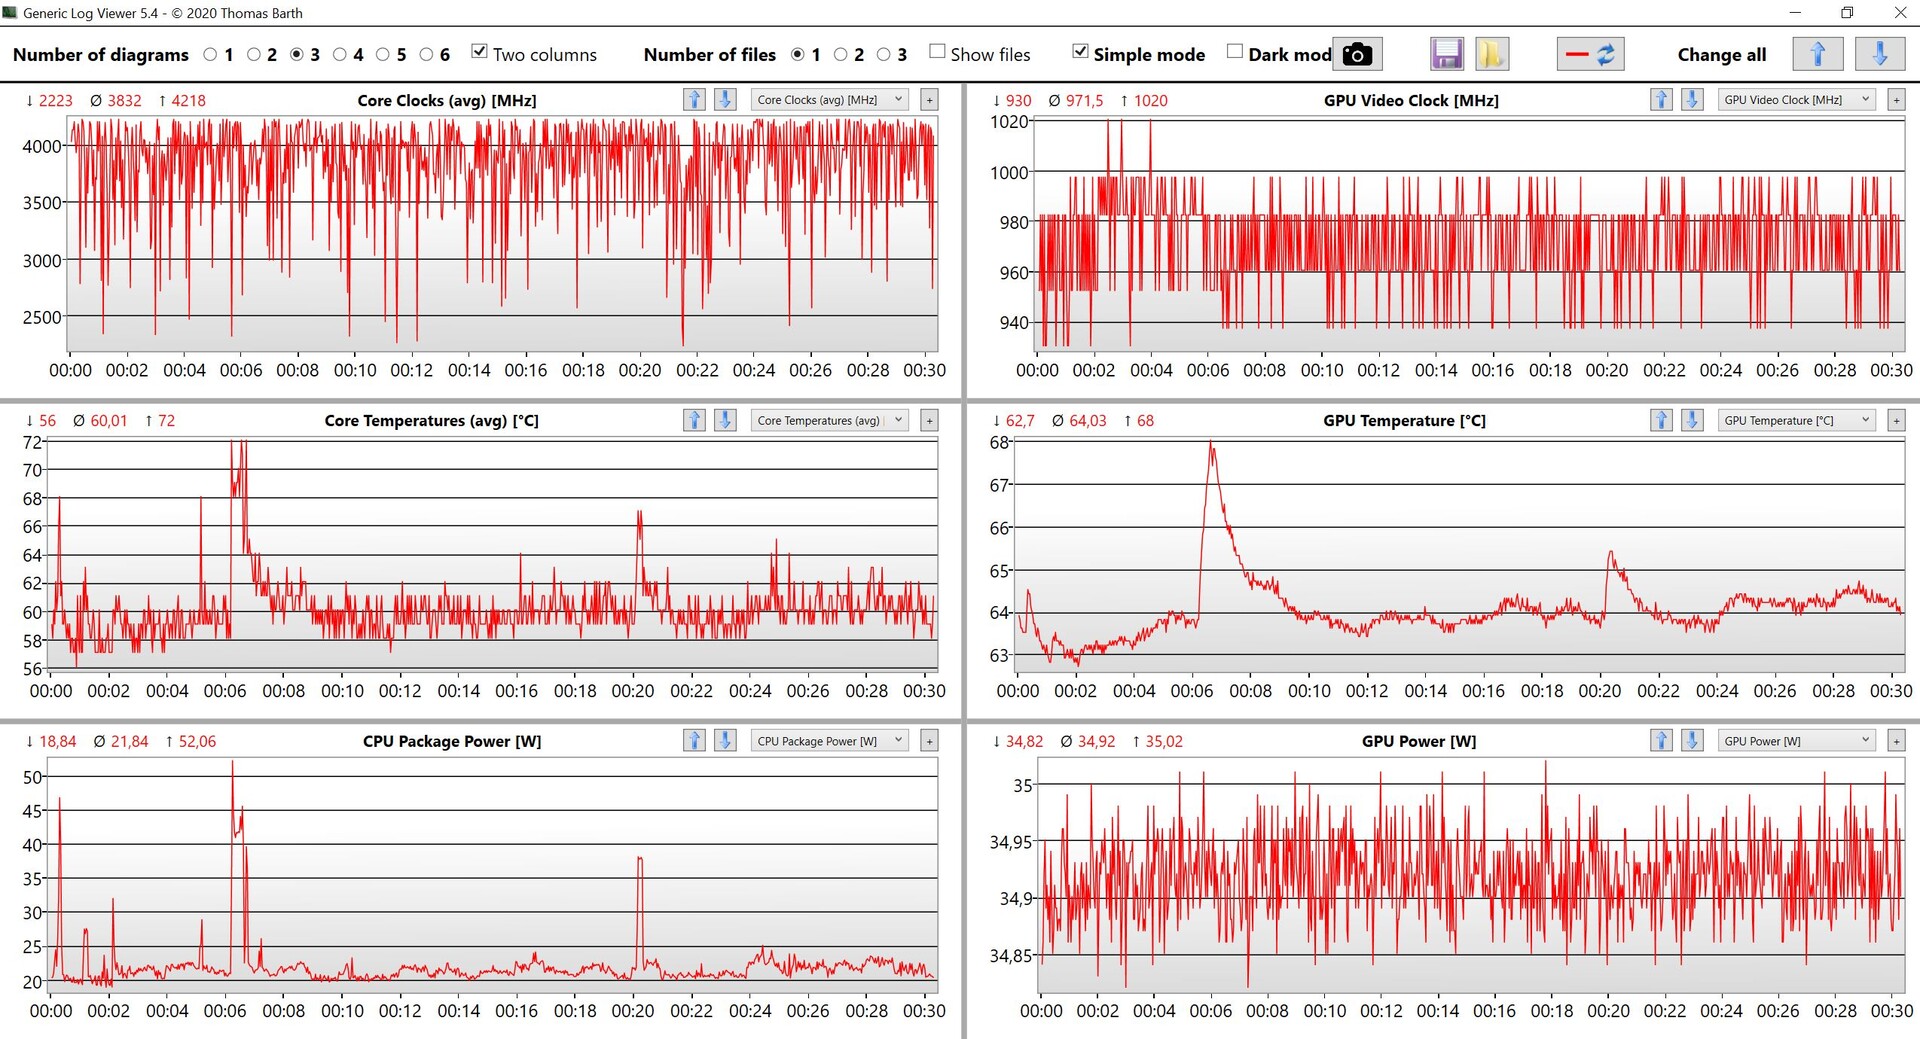
压力测试显示了一个有趣的情况。GPU的性能在35瓦时完全稳定,但处理器在最初的105瓦峰值消耗后,总是在23瓦和55瓦之间波动。55瓦的间隔在20分钟后变得更短,这也解释了从这时开始CPU温度降低的原因。这种CPU行为在Armoury Crate软件的所有性能模式下都是相同的,这意味着华硕应该在这里做更多的工作,因为我们更希望CPU性能恒定。测试结束后没有立即出现性能下降。
(-) The maximum temperature on the upper side is 45.3 °C / 114 F, compared to the average of 40.4 °C / 105 F, ranging from 21.2 to 68.8 °C for the class Gaming.
(-) The bottom heats up to a maximum of 48.3 °C / 119 F, compared to the average of 43.2 °C / 110 F
(+) In idle usage, the average temperature for the upper side is 27.9 °C / 82 F, compared to the device average of 33.9 °C / 93 F.
(-) Playing The Witcher 3, the average temperature for the upper side is 38.6 °C / 101 F, compared to the device average of 33.9 °C / 93 F.
(±) The palmrests and touchpad can get very hot to the touch with a maximum of 37.8 °C / 100 F.
(-) The average temperature of the palmrest area of similar devices was 28.8 °C / 83.8 F (-9 °C / -16.2 F).
| Asus ROG Flow Z13 GZ301ZE Intel Core i9-12900H, NVIDIA GeForce RTX 3050 Ti Laptop GPU | Schenker Vision 14 Intel Core i7-11370H, NVIDIA GeForce RTX 3050 Ti Laptop GPU | Asus Zephyrus G14 GA401QEC AMD Ryzen 9 5900HS, NVIDIA GeForce RTX 3050 Ti Laptop GPU | Microsoft Surface Pro 8, i7-1185G7 Intel Core i7-1185G7, Intel Iris Xe Graphics G7 96EUs | Razer Blade 14 Ryzen 9 RTX 3070 AMD Ryzen 9 5900HX, NVIDIA GeForce RTX 3070 Laptop GPU | Asus ROG Flow X13 GV301QH AMD Ryzen 9 5980HS, NVIDIA GeForce GTX 1650 Max-Q | |
|---|---|---|---|---|---|---|
| Heat | -7% | -30% | 11% | -15% | -19% | |
| Maximum Upper Side * (°C) | 45.3 | 49.7 -10% | 53.6 -18% | 45 1% | 45 1% | 51.8 -14% |
| Maximum Bottom * (°C) | 48.3 | 56 -16% | 49.9 -3% | 47.2 2% | 44.4 8% | 52.8 -9% |
| Idle Upper Side * (°C) | 29.2 | 28.8 1% | 44.8 -53% | 24.1 17% | 40.2 -38% | 37.3 -28% |
| Idle Bottom * (°C) | 30 | 30.6 -2% | 44.1 -47% | 23.4 22% | 39.2 -31% | 37.7 -26% |
* ... smaller is better
发言人
华硕集成了两个所谓的智能AMP扬声器,它们位于两侧的下部区域,向两侧投射声音。尽管机箱宽度很窄,但这实际上创造了一个轻微的立体声效果,而且扬声器总体上提供了一个体面的性能,但它们根本缺乏力度。这也被我们的音频测量所证实。麦克风也令人满意地完成了它们的工作,但大多数游戏者可能无论如何都会使用一个耳机。
Asus ROG Flow Z13 GZ301ZE audio analysis
(±) | speaker loudness is average but good (76.6 dB)
Bass 100 - 315 Hz
(-) | nearly no bass - on average 16.4% lower than median
(±) | linearity of bass is average (10.6% delta to prev. frequency)
Mids 400 - 2000 Hz
(+) | balanced mids - only 3.3% away from median
(+) | mids are linear (5.5% delta to prev. frequency)
Highs 2 - 16 kHz
(+) | balanced highs - only 3.1% away from median
(+) | highs are linear (4.9% delta to prev. frequency)
Overall 100 - 16.000 Hz
(±) | linearity of overall sound is average (16.5% difference to median)
Compared to same class
» 42% of all tested devices in this class were better, 7% similar, 51% worse
» The best had a delta of 6%, average was 18%, worst was 132%
Compared to all devices tested
» 28% of all tested devices were better, 6% similar, 66% worse
» The best had a delta of 4%, average was 23%, worst was 134%
Microsoft Surface Pro 8, i7-1185G7 audio analysis
(±) | speaker loudness is average but good (81.9 dB)
Bass 100 - 315 Hz
(±) | reduced bass - on average 13.1% lower than median
(±) | linearity of bass is average (10.5% delta to prev. frequency)
Mids 400 - 2000 Hz
(+) | balanced mids - only 4.3% away from median
(+) | mids are linear (3.8% delta to prev. frequency)
Highs 2 - 16 kHz
(+) | balanced highs - only 4.4% away from median
(+) | highs are linear (3.6% delta to prev. frequency)
Overall 100 - 16.000 Hz
(+) | overall sound is linear (13.7% difference to median)
Compared to same class
» 18% of all tested devices in this class were better, 5% similar, 77% worse
» The best had a delta of 6%, average was 20%, worst was 57%
Compared to all devices tested
» 15% of all tested devices were better, 4% similar, 81% worse
» The best had a delta of 4%, average was 23%, worst was 134%
能源管理--华硕耗尽电池
能源消耗
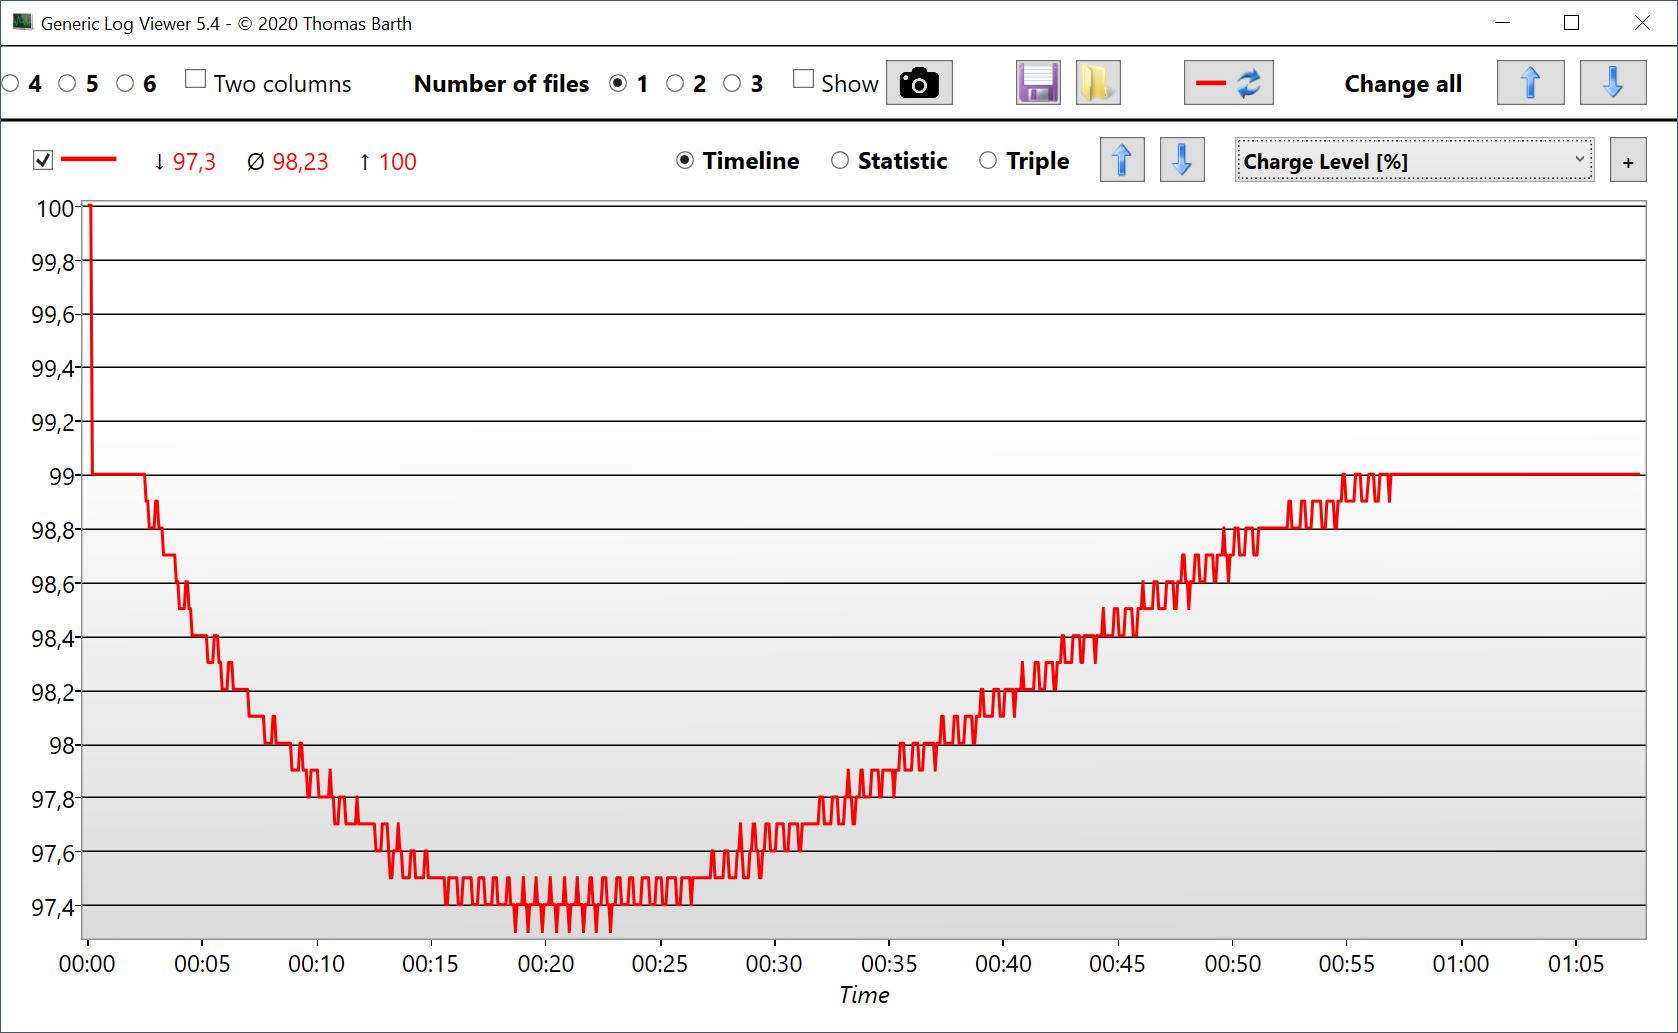
当你看一下处理器的功耗,然后考虑专用的GPU和其他组件,你会很快注意到,附带的100瓦电源适配器不足以满足高峰负荷时的电力需求。在压力测试中,我们在开始时测得的最大消耗为103瓦,因为电源适配器根本无法提供更多。在这些情况下,剩余的~40-50瓦都是从电池中提取的,这也可以从我们压力测试中的电池电量的下图中看出。随着处理器迅速被限制在55瓦(+35瓦的DGPU和系统其他部分),我们仍然测量到103瓦的消耗,而且电池仍然被使用了一些。因此,这个限制完全是由设备的电源适配器造成的;冷却系统当然可以处理更多(例如,更强大的图形卡版本)。
正如我们在压力测试中看到的,处理器的TDP总是周期性地波动,类似地,在压力测试中,功耗也在80-103瓦之间波动。在压力测试中大约20分钟后,处理器以55瓦运行的时间变得更短,这就是为什么电池电量再次增加。由于电池只在负载高峰期或只在非常短暂的时间内被 "耗尽",这对设备的运行没有影响,但这是否对电池的寿命有好处是另一回事。
闲置率也相当高,这是由于屏幕亮度高的缘故。2.5瓦的待机消耗绝对是太高了;华硕应该在这里做出改进。
| Off / Standby | |
| Idle | |
| Load |
|
Key:
min: | |
| Asus ROG Flow Z13 GZ301ZE i9-12900H, GeForce RTX 3050 Ti Laptop GPU, Micron 2450 1TB MTFDKBK1T0TFK, IPS, 1920x1200, 13.4" | Schenker Vision 14 i7-11370H, GeForce RTX 3050 Ti Laptop GPU, Samsung SSD 980 Pro 1TB MZ-V8P1T0BW, IPS, 2880x1800, 14" | Asus Zephyrus G14 GA401QEC R9 5900HS, GeForce RTX 3050 Ti Laptop GPU, Samsung PM991 MZVLQ1T0HALB, IPS, 2560x1440, 14" | Microsoft Surface Pro 8, i7-1185G7 i7-1185G7, Iris Xe G7 96EUs, Toshiba KBG40ZNS256G NVMe, IPS, 2880x1920, 13" | Razer Blade 14 Ryzen 9 RTX 3070 R9 5900HX, GeForce RTX 3070 Laptop GPU, Samsung PM981a MZVLB1T0HBLR, IPS, 2560x1440, 14" | Asus ROG Flow X13 GV301QH R9 5980HS, GeForce GTX 1650 Max-Q, WDC PC SN530 SDBPNPZ-1T00, IPS, 3840x2400, 13.4" | Average NVIDIA GeForce RTX 3050 Ti Laptop GPU | Average of class Gaming | |
|---|---|---|---|---|---|---|---|---|
| Power Consumption | -6% | -20% | 38% | -53% | 9% | -19% | -81% | |
| Idle Minimum * (Watt) | 8.8 | 6.7 24% | 8.1 8% | 3.9 56% | 9.4 -7% | 7.4 16% | 8.2 ? 7% | 13.1 ? -49% |
| Idle Average * (Watt) | 12.1 | 12.6 -4% | 12.9 -7% | 8.5 30% | 15.8 -31% | 10.3 15% | 12.6 ? -4% | 19 ? -57% |
| Idle Maximum * (Watt) | 12.7 | 15.4 -21% | 16.1 -27% | 9.8 23% | 24.1 -90% | 13.4 -6% | 17.2 ? -35% | 24.6 ? -94% |
| Load Average * (Watt) | 72.3 | 85.7 -19% | 102.4 -42% | 48 34% | 76.8 -6% | 75.9 -5% | 92 ? -27% | 111.3 ? -54% |
| Witcher 3 ultra * (Watt) | 77.3 | 83 -7% | 41.5 46% | 154 -99% | ||||
| Load Maximum * (Watt) | 103.1 | 110.9 -8% | 135.8 -32% | 63 39% | 189.7 -84% | 78 24% | 139.1 ? -35% | 260 ? -152% |
* ... smaller is better
Energy consumption during our The Witcher 3 test / stress test
Energy consumption with an external monitor
电池寿命
56Wh的电池和相对较高的消耗率的结合并不预示着特别长的电池运行时间,这也被我们的测试所证实。在调整亮度为150cd/m²(相当于我们测试设备最大亮度的35%)的情况下,我们在Wi-Fi或视频模式下获得了5:30至6小时。相比之下,我们的Wi-Fi测试在最大亮度下只运行了4小时多一点。顺便说一下,在我们的测试中,120赫兹模式并不影响运行时间。鉴于这些结果,我们不会推荐可选的4K面板,因为它可能会消耗更多的电力。
在设备开启的情况下,充满电需要大约100分钟,但在不到28分钟后,50%的容量又可以使用。
| Asus ROG Flow Z13 GZ301ZE i9-12900H, GeForce RTX 3050 Ti Laptop GPU, 56 Wh | Schenker Vision 14 i7-11370H, GeForce RTX 3050 Ti Laptop GPU, 53 Wh | Asus Zephyrus G14 GA401QEC R9 5900HS, GeForce RTX 3050 Ti Laptop GPU, 76 Wh | Microsoft Surface Pro 8, i7-1185G7 i7-1185G7, Iris Xe G7 96EUs, 51.5 Wh | Razer Blade 14 Ryzen 9 RTX 3070 R9 5900HX, GeForce RTX 3070 Laptop GPU, 62 Wh | Asus ROG Flow X13 GV301QH R9 5980HS, GeForce GTX 1650 Max-Q, 62 Wh | Average of class Gaming | |
|---|---|---|---|---|---|---|---|
| Battery runtime | 9% | 99% | 35% | 19% | 23% | 30% | |
| H.264 (h) | 6 | 6.8 13% | 10.3 72% | 10.1 68% | 6.9 15% | 8.27 ? 38% | |
| WiFi v1.3 (h) | 5.6 | 5.5 -2% | 11.2 100% | 7.6 36% | 7.3 30% | 5.8 4% | 7.08 ? 26% |
| Witcher 3 ultra (h) | 0.8 | ||||||
| Load (h) | 1.2 | 1.4 17% | 2.7 125% | 1.2 0% | 1.3 8% | 1.8 50% | 1.496 ? 25% |
| Reader / Idle (h) | 19.1 | 13.8 | 10.4 | 7.84 ? |
Pros
Cons
结论 - ROG Flow Z13以其良好的冷却效果给人留下深刻印象
新的华硕ROG Flow Z13是一款游戏平板电脑,也是目前市场上相当无敌的可转换产品。经过我们的审查,印象主要是正面的。除了非常快的Alder Lake CPU和稳定的游戏性能外,特别是冷却系统令人惊讶地有效和安静。你可以在游戏中使用集成的扬声器,没有任何问题。16:10格式的1200p显示屏也以良好的色彩还原和高亮度给人留下深刻印象。由于电池运行时间不是特别长,我们不建议使用可选的4K面板。
然而,也有一些地方有改进的余地。首先,CPU/GPU的组合相对不平衡,因为高端i9 CPU与最慢版本的GeForce RTX 3050 Ti相结合。酷睿i9提供了极高的性能,特别是在短时间的负载高峰和单核基准测试中,但酷睿i7-12700H在日常使用中会提供同样的性能,特别是一旦功率限制在55瓦时启动。此外,该处理器在负载高峰期需要高达114瓦的功率,除了100瓦的电源适配器外,该设备还必须借助于电池来提供足够的能量。有了可选的XG Mobile eGPU(RTX 3080或RX 6850M XT),图形性能可以大幅提高,而且由于良好的CPU性能,平板电脑在这里也不会出现瓶颈。在这方面,带有Core i5和iGPU的配置也很有趣,但不幸的是,它并没有在所有地区提供。
终于有了一款合适的游戏平板电脑。华硕通过ROG Flow Z13提供了一款强大的游戏平板电脑,具有良好的冷却效果。然而,桤木湖酷睿i9处理器有点矫枉过正,我们更希望看到更快的RTX 3050 Ti版本。
在配置方面也有改进的余地。除了PCIe 4.0和Thunderbolt 4等现代接口,一个缓慢的USB 2.0端口不知何故进入了Flow Z13。此外,在德国型号中,通过Thunderbolt 4端口供电也有问题。我们正在与制造商联系,一旦收到官方声明,我们将立即更新评论。此外,Armoury Crate软件的额外配置文件目前并没有真正增加任何价值;华硕应该再看看这里。
最后,还有德国的价格,2,100欧元(美国为1,899美元),这个价格并不低。与XG Mobile eGPU(RTX 3080)捆绑的价格甚至达到了令人印象深刻的3500欧元(约3920美元,目前在美国没有)。对于这个价格,强大的游戏笔记本电脑如Razer Blade 14已经可以买到了,你也可以买一个普通的平板电脑用于随身使用。偶尔在家玩游戏的用户也可以使用几乎所有的敞篷电脑,比如说 Surface Pro 8,例如,用雷电接口连接外部GPU,尽管CPU性能肯定没有那么高。
Asus ROG Flow Z13 GZ301ZE
- 02/25/2022 v7 (old)
Andreas Osthoff
Price comparison

