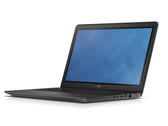
Notebookcheck Logo

NVIDIA GeForce 830M

NVIDIA GeForce 830M

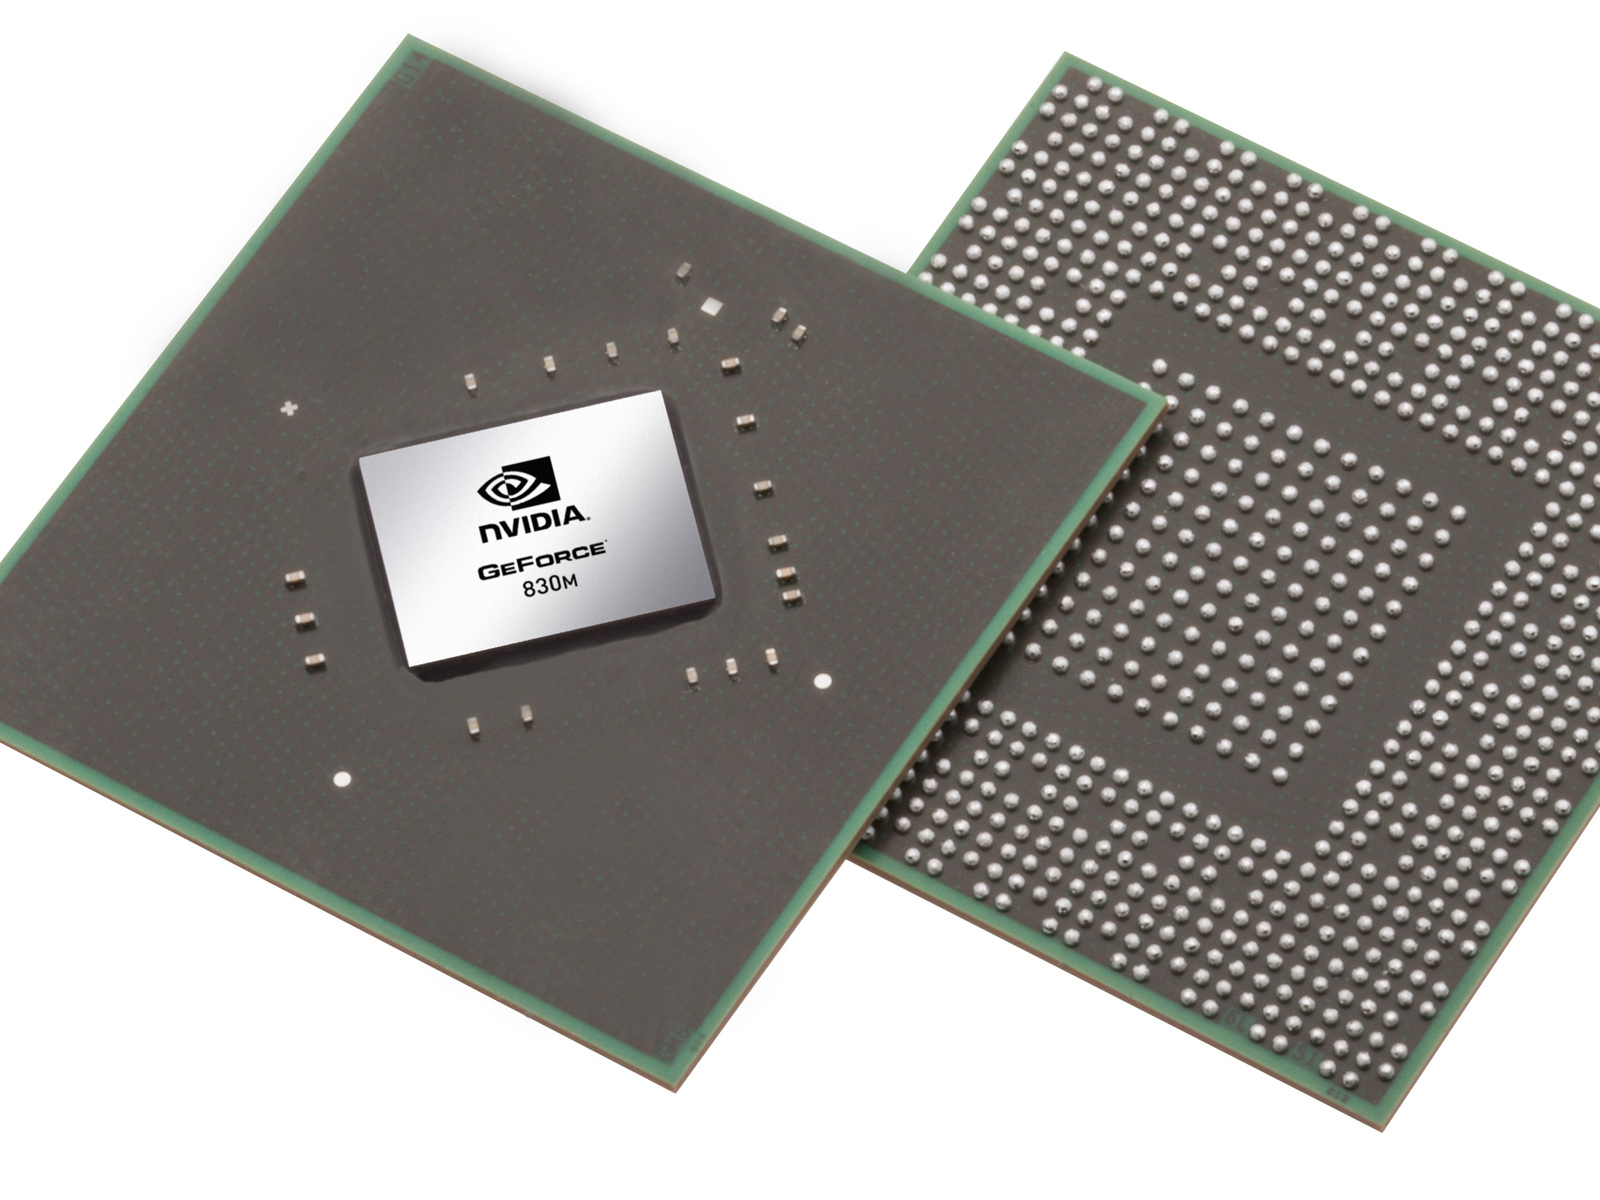
最早发布与2014年3月的NVIDIA GeForce 830M是一款支持DirectX 11的中低端显卡。它是最早一批基于Nvidia的新Maxwell架构(GM108核心)的显卡之一,但仍使用了28纳米制程技术制造。830M提供了频率为1029MHz(+加速)的256个着色器单元,和2GB DDR3显存(64位显存位宽,2000MHz有效频率)。


架构


相对于Kepler架构,Maxwell架构提供了一些细节优化改进,提供了更高的功效。一个更小的只使用了128个ALU算数逻辑单元(Kepler为192个)的流处理器(SMM)和一个优化了的调度器应该可以提高着色器的使用效率。Nvidia称Maxwell的128个算数逻辑单元流处理器可以提供Kepler的192算数逻辑单元SMX的90%性能。830M可能配备了一颗部分禁用的GM108核心,仅3个SMM中的2个激活(256个着色器核心,16个TMU,和8个ROP,64bit位宽)。


另外一个优化是大幅提高的二级缓存容量。更大的缓存容量可以提供对显存数据的更好管理,从而并不会因显存带宽相对较窄而性能明显降低。


与GM107核心相似,GM108核心支持DirectX 11.2。


性能


根据Nvidia提供的信息,GeForce 830M的性能超过前代的GT 730M约25%。实际使用中这个优势较小,它的性能表现与较老的GT 740M相近。很多2013和2014年的游戏可以在WXGA(1366x768)分辨率和中细节设定下流畅运行。不过,非常大型的游戏如孤岛危机3和战地4则必须进一步降低分辨率或设定运行。


特性


GM108核心集成了第六代的PureVideo HD视频引擎(VP6),提供了对H.264和MPEG-2视频的更好解码性能。当然,VP6支持所有前代的功能(4K支持,PIP,VCENC API视频编码)。遗憾的是,它仍未提供对HDMI 2.0的支持。


功耗


GeForce 830M约为25W或更低。因此适合13寸或更大的笔记本电脑。800M系列同样支持Optimus技术,笔记本可以在CPU的集成显卡和Nvidia独立显卡间自动切换。

GeForce 800M Series

GeForce 845M 384 @ 1.07 - 1.15 GHz64/128 Bit @ 2000 - 5000 MHz
GeForce 840M 384 @ 1.03 GHz64 Bit @ 2000 MHz
GeForce 830M 256 @ 1.03 - 1.15 GHz64 Bit @ 1800 MHz
GeForce 825M 384 @ 0.85 GHz64 Bit @ 1800 MHz
GeForce 820M 96 @ 0.78 GHz64 Bit @ 1800 MHz
CodenameN15?
ArchitectureMaxwell
Pipelines256 - unified
Core Speed1029 - 1150 (Boost) MHz
Memory Speed1800 MHz
Memory Bus Width64 Bit
Memory TypeDDR3
Max. Amount of Memory2048 MB
Shared Memoryno
APIDirectX 12 (FL 11_0), Shader 5.0, OpenGL 4.4
technology28 nm
FeaturesGPU Boost 2.0, Optimus, PhysX, CUDA, GeForce Experience
Date of Announcement12.03.2014

Benchmarks

Performance Rating - 3DMark 11 + Fire Strike + Time Spy
0.6 pt (2%)
AMD Radeon HD 8180
0.06605 -90%
...
AMD Radeon R7 M270
0.573 -9%
0.581 -8%
AMD Radeon R5 (Bristol Ridge)
0.585 -7%
0.59 -7%
AMD Radeon HD 8550G + HD 8750M Dual Graphics
0.594 -6%
0.601 -5%
0.609 -4%
NVIDIA Quadro K1100M
0.611 -3%
Intel Iris Pro Graphics 5200
0.629 0%
NVIDIA GeForce 830M
0.632
AMD Radeon R7 M260X
0.636 1%
0.647 2%
0.66 4%
Intel Iris Graphics 540
0.66 4%
0.665 5%
AMD Radeon R6 M340DX
0.671 6%
Intel UHD Graphics G1 (Ice Lake 32 EU)
0.693 10%
NVIDIA GeForce GT 745M
0.697 10%
0.702 11%
...
21.1 3239%
max:
33.3 5169%
0%
100%
3DMark - 3DMark Cloud Gate Score
min: 4817     avg: 5810     median: 6044 (6%)     max: 6336 Points
3DMark - 3DMark Cloud Gate Graphics
min: 7966     avg: 8103     median: 8104.5 (2%)     max: 8238 Points
3DMark - 3DMark Fire Strike Standard Score
min: 1209     avg: 1222     median: 1215 (2%)     max: 1250 Points
3DMark - 3DMark Fire Strike Standard Graphics
min: 1360     avg: 1388     median: 1386.5 (2%)     max: 1420 Points
3DMark - 3DMark Ice Storm Graphics
min: 44269     avg: 52330     median: 50861.5 (6%)     max: 63329 Points
3DMark 11 - 3DM11 Performance Score
min: 1995     avg: 2062     median: 2094 (3%)     max: 2097 Points
3DMark 11 - 3DM11 Performance GPU
min: 1949     avg: 1969     median: 1961 (2%)     max: 1998 Points
171.8 -91%
...
AMD Radeon R7 M260
1891 -4%
AMD Radeon R7 M260X
1903 -3%
1913 -3%
Intel Iris Pro Graphics 5200
1916 -3%
1926 -2%
Qualcomm Adreno 685
1927 -2%
1934 -2%
Qualcomm Adreno 680
1936 -2%
AMD Radeon HD 8550G + HD 8670M Dual Graphics
1942 -1%
NVIDIA GeForce 830M
1969
1981 1%
NVIDIA GeForce GT 740M
1985 1%
2003 2%
AMD Radeon HD 8650G + HD 8570M Dual Graphics
2004 2%
AMD Radeon R7 M360
2014 2%
2017 2%
2085 6%
2092 6%
2104 7%
...
59943 2944%
max:
106023 5285%
0%
100%
3DMark Vantage
3DM Vant. Perf. total +
3DMark Vantage - 3DM Vant. Perf. total
6163 Points (2%)
3DM Vant. Perf. GPU no PhysX +
3DMark Vantage - 3DM Vant. Perf. GPU no PhysX
5957 Points (3%)
ATI Radeon HD 3200
62 -99%
...
NVIDIA GeForce GTX 285M
5631 -5%
5698 -4%
5717 -4%
NVIDIA GeForce GT 740M
5735 -4%
5833 -2%
5870 -1%
5896 -1%
5926 -1%
5948 0%
NVIDIA GeForce 830M
5957
AMD Radeon HD 8550G + HD 8750M Dual Graphics
5961 0%
5977 0%
5987 1%
NVIDIA GeForce 8800M GTX SLI
5995 1%
AMD Radeon R7 M445
6000 1%
AMD Radeon R7 M270
6027 1%
AMD Radeon 610M
6032 1%
6111 3%
ATI Mobility Radeon HD 4870
6139 3%
...
132443 2123%
max:
170928 2769%
0%
100%
3DMark 05 - 3DMark 05 - Standard
13441 Points (15%)
Intel Graphics Media Accelerator (GMA) 500
133.4 -99%
...
12762 -5%
ATI Mobility Radeon HD 3870
12885 -4%
NVIDIA GeForce 8600M GT SLI
12932 -4%
12975 -3%
NVIDIA GeForce 9700M GTS
13125 -2%
13125 -2%
13217 -2%
13284 -1%
13307 -1%
NVIDIA GeForce 830M
13441
NVIDIA GeForce 9800M GS
13587 1%
13620 1%
13666 2%
NVIDIA GeForce GTS 160M
13775 2%
13817 3%
Intel HD Graphics 530
13920 4%
NVIDIA Quadro FX 3600M
13950 4%
NVIDIA GeForce GT 720M
13952 4%
14036 4%
...
61850 360%
max:
87172 549%
0%
100%
3DMark 06 3DMark 06 - Standard 1280x1024 +
3DMark 06
min: 9170     avg: 10223     median: 10222.5 (13%)     max: 11275 Points
SPECviewperf 11
specvp11 snx-01 +
SPECviewperf 11 - specvp11 snx-01
4.6 fps (3%)
specvp11 tcvis-02 +
SPECviewperf 11 - specvp11 tcvis-02
1.4 fps (1%)
specvp11 sw-02 +
SPECviewperf 11 - specvp11 sw-02
8.7 fps (7%)
specvp11 proe-05 +
SPECviewperf 11 - specvp11 proe-05
1.9 fps (2%)
specvp11 maya-03 +
SPECviewperf 11 - specvp11 maya-03
6.9 fps (5%)
specvp11 lightwave-01 +
SPECviewperf 11 - specvp11 lightwave-01
16.5 fps (18%)
specvp11 ensight-04 +
SPECviewperf 11 - specvp11 ensight-04
17.2 fps (8%)
specvp11 catia-03 +
SPECviewperf 11 - specvp11 catia-03
9.4 fps (5%)
Cinebench R10 Cinebench R10 Shading (32bit) +
Cinebench R10 - Cinebench R10 Shading (32bit)
min: 4172     avg: 5388     median: 5855 (4%)     max: 6138 points
Cinebench R11.5 Cinebench R11.5 OpenGL 64 Bit +
Cinebench R11.5 - Cinebench R11.5 OpenGL 64 Bit
min: 37.84     avg: 40     median: 39.7 (14%)     max: 42.5 fps
Cinebench R15
Cinebench R15 OpenGL 64 Bit +
Cinebench R15 - Cinebench R15 OpenGL 64 Bit
min: 45.76     avg: 49.5     median: 50.6 (3%)     max: 52 fps
Cinebench R15 OpenGL Ref. Match 64 Bit +
Cinebench R15 - Cinebench R15 OpenGL Ref. Match 64 Bit
99.6 % (100%)
LuxMark v2.0 64Bit - LuxMark v2.0 Room GPU
332 Samples/s (1%)
LuxMark v2.0 64Bit - LuxMark v2.0 Sala GPU
597 Samples/s (1%)
ComputeMark v2.1 - ComputeMark v2.1 Result
1123 points (1%)
- Range of benchmark values for this graphics card
- Average benchmark values for this graphics card
* Smaller numbers mean a higher performance

Game Benchmarks

The following benchmarks stem from our benchmarks of review laptops. The performance depends on the used graphics memory, clock rate, processor, system settings, drivers, and operating systems. So the results don't have to be representative for all laptops with this GPU. For detailed information on the benchmark results, click on the fps number.

FIFA 16

FIFA 16

2015
low 1280x720
92.6  fps    + Compare
high 1366x768
50  fps    + Compare
ultra 1920x1080
34.1  fps    + Compare
» With all tested laptops playable in detail settings high.
low 1366x768
48.4  fps    + Compare
med. 1366x768
37.6  fps    + Compare
high 1920x1080
20.2  fps    + Compare
ultra 1920x1080
13.8  fps    + Compare
» With all tested laptops playable in detail settings med..
low 1024x768
60  fps    + Compare
med. 1366x768
48.2  fps    + Compare
high 1920x1080
16.9  fps    + Compare
ultra 1920x1080
11.5  fps    + Compare
» With all tested laptops playable in detail settings med..
Mad Max

Mad Max

2015
med. 1366x768
32  fps    + Compare
high 1920x1080
15.7  fps    + Compare
ultra 1920x1080
14.5  fps    + Compare
» The benchmarks indicate that the game is not playable in the tested settings.
low 1280x720
23  fps    + Compare
med. 1366x768
19  fps    + Compare
high 1920x1080
7  fps    + Compare
ultra 1920x1080
5  fps    + Compare
» The benchmarks indicate that the game is not playable in the tested settings.
low 1024x768
24.5  fps    + Compare
med. 1366x768
15  fps    + Compare
high 1920x1080
7.3  fps    + Compare
ultra 1920x1080
5.9  fps    + Compare
» The benchmarks indicate that the game is not playable in the tested settings.
low 1024x768
165.4  fps    + Compare
med. 1366x768
45.6  fps    + Compare
high 1920x1080
25.5  fps    + Compare
ultra 1920x1080
12.5  fps    + Compare
» With all tested laptops playable in detail settings med..
GTA V

GTA V

2015
low 1024x768
55.3  fps    + Compare
med. 1366x768
50.3  fps    + Compare
high 1920x1080
12.7  fps    + Compare
ultra 1920x1080
9.3  fps    + Compare
» With all tested laptops playable in detail settings med..
low 1024x768
51.9 65.2 ~ 59 fps    + Compare
med. 1366x768
36.5 46.1 ~ 41 fps    + Compare
high 1920x1080
15.1 16.7 ~ 16 fps    + Compare
ultra 1920x1080
9 9.9 ~ 9 fps    + Compare
» With all tested laptops playable in detail settings med..
Evolve

Evolve

2015
low 1024x768
29.5  fps    + Compare
med. 1366x768
21.5  fps    + Compare
high 1920x1080
11.2  fps    + Compare
ultra 1920x1080
8.1  fps    + Compare
» The benchmarks indicate that the game is not playable in the tested settings.
The Crew

The Crew

2014
low 1280x720
39.3  fps    + Compare
med. 1366x768
29.4  fps    + Compare
high 1920x1080
11.9  fps    + Compare
ultra 1920x1080
6.1  fps    + Compare
» With all tested laptops playable in detail settings low.
low 1024x768
39.4 44.7 ~ 42 fps    + Compare
med. 1366x768
22.2 29.7 ~ 26 fps    + Compare
high 1920x1080
10.3 18.8 ~ 15 fps    + Compare
ultra 1920x1080
7.1 12.7 ~ 10 fps    + Compare
» With all tested laptops playable in detail settings low.
Far Cry 4

Far Cry 4

2014
low 1024x768
36.6  fps    + Compare
med. 1366x768
25.8  fps    + Compare
high 1920x1080
11.9  fps    + Compare
ultra 1920x1080
10.8  fps    + Compare
» With all tested laptops playable in detail settings low.
low 1024x768
24.7  fps    + Compare
med. 1366x768
15.9  fps    + Compare
high 1920x1080
9.6  fps    + Compare
ultra 1920x1080
3.1  fps    + Compare
» The benchmarks indicate that the game is not playable in the tested settings.
low 1024x768
53.9  fps    + Compare
med. 1366x768
34.1  fps    + Compare
high 1920x1080
19.7  fps    + Compare
ultra 1920x1080
10.1  fps    + Compare
» With all tested laptops playable in detail settings low.
low 1024x768
50.6  fps    + Compare
med. 1366x768
21.2  fps    + Compare
high 1920x1080
14.9  fps    + Compare
ultra 1920x1080
12.5  fps    + Compare
» With all tested laptops playable in detail settings low.
F1 2014

F1 2014

2014
low 1024x768
97 117 ~ 107 fps    + Compare
med. 1366x768
75 85 ~ 80 fps    + Compare
high 1920x1080
53 54 ~ 54 fps    + Compare
ultra 1920x1080
31 35 ~ 33 fps    + Compare
» With all tested laptops playable in detail settings high.
low 1024x768
32.2  fps    + Compare
med. 1366x768
21.6  fps    + Compare
high 1920x1080
12.7  fps    + Compare
» The benchmarks indicate that the game is not playable in the tested settings.
low 1024x768
30.3  fps    + Compare
med. 1366x768
20.6  fps    + Compare
high 1920x1080
9.2  fps    + Compare
ultra 1920x1080
6.7  fps    + Compare
» The benchmarks indicate that the game is not playable in the tested settings.
low 1024x768
60.3  fps    + Compare
med. 1366x768
41.3  fps    + Compare
high 1920x1080
20.7  fps    + Compare
ultra 1920x1080
14.8  fps    + Compare
» With all tested laptops playable in detail settings med..
low 1280x720
36.6  fps    + Compare
med. 1344x756
23.2  fps    + Compare
high 1920x1080
12.8  fps    + Compare
ultra 1920x1080
9.5  fps    + Compare
» With all tested laptops playable in detail settings low.
Fifa 15

Fifa 15

2014
low 1280x720
70.5  fps    + Compare
high 1366x768
62.8  fps    + Compare
ultra 1920x1080
42.1  fps    + Compare
» With all tested laptops playable in detail settings ultra.
Sims 4

Sims 4

2014
low 1024x768
142.1  fps    + Compare
med. 1366x768
60.5  fps    + Compare
high 1920x1080
27.2  fps    + Compare
ultra 1920x1080
23.6  fps    + Compare
» With all tested laptops playable in detail settings med..
low 1024x768
50  fps    + Compare
med. 1366x768
28.1  fps    + Compare
high 1920x1080
12.4  fps    + Compare
ultra 1920x1080
10.6  fps    + Compare
» With all tested laptops playable in detail settings low.
low 1024x768
80.3 164 ~ 122 fps    + Compare
med. 1366x768
54.6 66.1 ~ 60 fps    + Compare
high 1920x1080
26.5 31.3 ~ 29 fps    + Compare
ultra 1920x1080
14.2 15.3 ~ 15 fps    + Compare
» With all tested laptops playable in detail settings med..
low 1024x768
18.8  fps    + Compare
med. 1366x768
14.9  fps    + Compare
» The benchmarks indicate that the game is not playable in the tested settings.
low 1280x720
35.1  fps    + Compare
med. 1280x720
32.3  fps    + Compare
high 1920x1080
14.1  fps    + Compare
» With all tested laptops playable in detail settings low.
Thief

Thief

2014
low 1024x768
29.7  fps    + Compare
med. 1366x768
19.9  fps    + Compare
high 1366x768
16.3  fps    + Compare
» The benchmarks indicate that the game is not playable in the tested settings.
low 1024x768
39  fps    + Compare
med. 1366x768
27.2  fps    + Compare
high 1366x768
15.1  fps    + Compare
» With all tested laptops playable in detail settings low.
low 1024x768
54.6  fps    + Compare
med. 1366x768
27.4  fps    + Compare
high 1366x768
14.1  fps    + Compare
» With all tested laptops playable in detail settings low.
low 1024x768
30  fps    + Compare
med. 1366x768
30  fps    + Compare
high 1366x768
25.9  fps    + Compare
» The benchmarks indicate that the game is not playable in the tested settings.
low 1024x768
54.3  fps    + Compare
med. 1366x768
36.8  fps    + Compare
high 1366x768
25.6  fps    + Compare
ultra 1920x1080
9.5  fps    + Compare
» With all tested laptops playable in detail settings med..
low 1024x768
87  fps    + Compare
med. 1366x768
52  fps    + Compare
high 1366x768
24  fps    + Compare
» With all tested laptops playable in detail settings med..
F1 2013

F1 2013

2013
low 1024x768
71  fps    + Compare
med. 1366x768
63  fps    + Compare
high 1366x768
60  fps    + Compare
ultra 1920x1080
34  fps    + Compare
» With all tested laptops playable in detail settings high.
low 1024x768
55  fps    + Compare
med. 1366x768
42.3  fps    + Compare
high 1366x768
35  fps    + Compare
ultra 1920x1080
8.1  fps    + Compare
» With all tested laptops playable in detail settings med..
low 1280x720
46.9  fps    + Compare
med. 1366x768
39.5  fps    + Compare
high 1366x768
15.9  fps    + Compare
» With all tested laptops playable in detail settings med..
low 1024x768
45.7  fps    + Compare
med. 1366x768
39.7  fps    + Compare
high 1366x768
26.9  fps    + Compare
» With all tested laptops playable in detail settings med..
low 1024x768
44.1  fps    + Compare
med. 1366x768
39  fps    + Compare
high 1366x768
18.6  fps    + Compare
» With all tested laptops playable in detail settings med..
Dota 2

Dota 2

2013
low 1024x768
62.4  fps    + Compare
med. 1366x768
47.9  fps    + Compare
ultra 1920x1080
26.1  fps    + Compare
» With all tested laptops playable in detail settings med..
low 1024x768
26.9  fps    + Compare
med. 1366x768
22.6  fps    + Compare
high 1366x768
12.6  fps    + Compare
» The benchmarks indicate that the game is not playable in the tested settings.
GRID 2

GRID 2

2013
low 1024x768
100.7  fps    + Compare
med. 1366x768
69.8  fps    + Compare
high 1366x768
49.8  fps    + Compare
ultra 1920x1080
15.9  fps    + Compare
» With all tested laptops playable in detail settings high.
low 1024x768
35.9  fps    + Compare
med. 1366x768
29  fps    + Compare
high 1366x768
18.8  fps    + Compare
» With all tested laptops playable in detail settings low.
low 1280x720
74.7  fps    + Compare
med. 1366x768
43.8  fps    + Compare
high 1366x768
35.3  fps    + Compare
ultra 1920x1080
12.3  fps    + Compare
» With all tested laptops playable in detail settings high.
low 1024x768
127.2 168.9 ~ 148 fps    + Compare
med. 1366x768
56.7 79 ~ 68 fps    + Compare
high 1366x768
41 46.3 ~ 44 fps    + Compare
ultra 1920x1080
14.3 16.2 ~ 15 fps    + Compare
» With all tested laptops playable in detail settings high.
low 1024x768
108.7 109.2 110.1 ~ 109 fps    + Compare
med. 1366x768
53.5 55.3 55.4 ~ 55 fps    + Compare
high 1366x768
28.3 31.1 31.3 ~ 30 fps    + Compare
ultra 1920x1080
13.9 14.7 15.1 ~ 15 fps    + Compare
» With all tested laptops playable in detail settings med..
Crysis 3

Crysis 3

2013
low 1024x768
36.6  fps    + Compare
med. 1366x768
21.4  fps    + Compare
high 1366x768
15.3  fps    + Compare
» With all tested laptops playable in detail settings low.
low 1024x768
114.2  fps    + Compare
med. 1366x768
57.1  fps    + Compare
high 1366x768
45.3  fps    + Compare
ultra 1920x1080
26.5  fps    + Compare
» With all tested laptops playable in detail settings high.
low 1024x768
38  fps    + Compare
med. 1366x768
32  fps    + Compare
high 1366x768
15.2  fps    + Compare
» With all tested laptops playable in detail settings low.
low 1024x768
57.6  fps    + Compare
med. 1366x768
39.1  fps    + Compare
high 1366x768
31.8  fps    + Compare
» With all tested laptops playable in detail settings med..
low 1024x768
100.6 129.6 ~ 115 fps    + Compare
med. 1366x768
67.1 78.8 ~ 73 fps    + Compare
high 1366x768
55 62.6 ~ 59 fps    + Compare
ultra 1920x1080
34.4 41.2 ~ 38 fps    + Compare
» With most tested laptops playable in detail settings ultra.
Anno 2070

Anno 2070

2011
low 1024x768
111.5  fps    + Compare
med. 1366x768
53.3  fps    + Compare
high 1366x768
33  fps    + Compare
» With all tested laptops playable in detail settings med..
low 1280x720
60.1 69.8 ~ 65 fps    + Compare
med. 1366x768
39.7 44.1 ~ 42 fps    + Compare
high 1366x768
29.9 32.9 ~ 31 fps    + Compare
ultra 1920x1080
15.3 18.9 ~ 17 fps    + Compare
» With all tested laptops playable in detail settings med..
low 1024x768
106.4  fps    + Compare
high 1366x768
54.5  fps    + Compare
ultra 1920x1080
25.3  fps    + Compare
» With all tested laptops playable in detail settings high.
lowmed.highultraQHD4K
FIFA 1692.65034.1
World of Warships48.437.620.213.8
Metal Gear Solid V6048.216.911.5
Mad Max3215.714.5
Batman: Arkham Knight231975
The Witcher 324.5157.35.9
Dirt Rally165.445.625.512.5
GTA V55.350.312.79.3
Battlefield Hardline5941169
Evolve29.521.511.28.1
The Crew39.329.411.96.1
Dragon Age: Inquisition42261510
Far Cry 436.625.811.910.8
Assassin's Creed Unity24.715.99.63.1
Call of Duty: Advanced Warfare53.934.119.710.1
Civilization: Beyond Earth50.621.214.912.5
F1 2014107805433
The Evil Within32.221.612.7
Ryse: Son of Rome30.320.69.26.7
Alien: Isolation60.341.320.714.8
Middle-earth: Shadow of Mordor36.623.212.89.5
Fifa 1570.562.842.1
Sims 4142.160.527.223.6
Risen 3: Titan Lords5028.112.410.6
GRID: Autosport122602915
Watch Dogs18.814.9
Wolfenstein: The New Order35.132.314.1
Thief29.719.916.3
Assassin´s Creed IV: Black Flag3927.215.1
X-Plane 10.2554.627.414.1
Need for Speed: Rivals303025.9
Battlefield 454.336.825.69.5
Batman: Arkham Origins875224
F1 201371636034
Total War: Rome II5542.3358.1
Saints Row IV46.939.515.9
The Bureau: XCOM Declassified45.739.726.9
Splinter Cell: Blacklist44.13918.6
Dota 262.447.926.1
Company of Heroes 226.922.612.6
GRID 2100.769.849.815.9
Metro: Last Light35.92918.8
BioShock Infinite74.743.835.312.3
StarCraft II: Heart of the Swarm148684415
Tomb Raider109553015
Crysis 336.621.415.3
Dead Space 3114.257.145.326.5
Hitman: Absolution383215.2
Medal of Honor: Warfighter57.639.131.8
Diablo III115735938
Anno 2070111.553.333
The Elder Scrolls V: Skyrim65423117
Deus Ex Human Revolution106.454.525.3
< 30 fps
< 60 fps
< 120 fps
≥ 120 fps
7
25
16
4
19
24
7
36
13
2
31
5


For more games that might be playable and a list of all games and graphics cards visit our Gaming List

v1.26
log 12. 15:55:58

#0 no ids found in url (should be separated by "_") +0s ... 0s

#1 not redirecting to Ajax server +0s ... 0s

#2 did not recreate cache, as it is less than 5 days old! Created at Wed, 10 Apr 2024 05:36:42 +0200 +0.001s ... 0.001s

#3 no comparison url found in template nbc.compare_page_1 needed +0.095s ... 0.096s

#4 no comparison url found in template nbc.compare_page_1 needed +0s ... 0.096s

#5 no comparison url found in template nbc.compare_page_1 needed +0s ... 0.097s

#6 no comparison url found in template nbc.compare_page_1 needed +0s ... 0.097s

#7 composed specs +0s ... 0.097s

#8 did output specs +0s ... 0.097s

#9 start showIntegratedCPUs +0s ... 0.097s

#10 getting avg benchmarks for device 5183 +0.037s ... 0.134s

#11 got single benchmarks 5183 +0.02s ... 0.154s

#12 got avg benchmarks for devices +0s ... 0.154s

#13 min, max, avg, median took s +0.713s ... 0.867s

#14 before gaming benchmark output +0s ... 0.867s

#15 Got 225 rows for game benchmarks. +0.027s ... 0.894s

#16 composed SQL query for gamebenchmarks +0s ... 0.894s

#17 got data and put it in $dataArray +0.045s ... 0.939s

#18 benchmarks composed for output. +2.395s ... 3.334s

#19 no comparison url found in template nbc.compare_page_1 needed +0.005s ... 3.339s

#20 return log +0s ... 3.339s

Please share our article, every link counts!

» Comparison of GPUs
Detailed list of all laptop GPUs sorted by class and performance.

» Benchmark List
Sort and restrict laptop GPUs based on performance in synthetic benchmarks.

» Notebook Gaming List
Playable games for each graphics card and their average FPS results.

Class 1

GeForce RTX 2080 Super Mobile

Class 2

M1 Max 32-Core GPU *
GeForce RTX 2070 Super Mobile
M1 Max 24-Core GPU *
Quadro RTX 5000 Max-Q
Radeon RX 5700M *
GeForce GTX 1080 Mobile
Quadro RTX 4000 (Laptop)
M1 Pro 16-Core GPU *
Radeon PRO W6600M *
GeForce RTX 2070 Super Max-Q
Quadro RTX 4000 Max-Q *
M1 Pro 14-Core GPU *
Quadro P5200
Quadro RTX 3000 Max-Q *
Quadro P4200
Quadro P5000 Max-Q *
GeForce GTX 980 (Laptop)
Quadro P4000
Quadro P4000 Max-Q
Quadro P3200
Radeon RX 580X (Laptop) *
Radeon RX 580 (Laptop)
Radeon Pro 5300M
Radeon RX 5300M
Quadro P3000 Max-Q *
Quadro T2000 Max-Q *
Radeon Pro WX 7100 *
Radeon RX 570X (Laptop) *
Radeon RX 570 (Laptop) *
Radeon RX 470 (Laptop) *
Quadro T1000 Max-Q *

Class 3

Vega M GH
Quadro M5000M
GeForce GTX 1050 Ti Mobile
Radeon 680M
Quadro P2000
Quadro P2000 Max-Q
Quadro M4000M
T500 Laptop GPU *
Radeon R9 M395X
GeForce GTX 1050 Ti Max-Q *
Radeon Pro Vega 16
WX Vega M GL
Radeon R9 M485X
Quadro M3000M
FirePro W7170M
Radeon R9 M395
GeForce GTX 1050 Max-Q *
Radeon 660M
Radeon Pro WX 4150 *
Radeon RX 560X (Laptop)
Radeon RX 560 (Laptop)
Radeon RX 460 (Laptop)
Quadro P1000
Radeon R9 M390
Xe MAX
Radeon Pro 560X
Radeon Pro 560
Radeon Pro 460
Radeon Pro WX 4130 *
GeForce GTX 960M
Quadro P620 *
Radeon RX 550X (Laptop)
Radeon Pro WX 3200 *
Radeon Pro 555X
Radeon Pro 555
Radeon Pro 455
Quadro P600
Quadro M2000M
Radeon RX 540X *
Radeon Pro WX 2100 *
Radeon Pro WX 3100 *
GeForce GTX 950M
Radeon Pro 450
Radeon 630
Radeon 540X *
Radeon R9 M385X
Quadro P520
Quadro M1000M
GeForce 945M
Quadro P500 *
Iris Plus Graphics G7 (Ice Lake 64 EU) *
Vega 10 *
Iris Pro Graphics 580
FirePro W5170M *
Radeon R9 M370X
Vega 9
FirePro W5130M
UHD Graphics Xe G4 48EUs *
UHD Graphics 32EUs
UHD Graphics Xe 32EUs (Tiger Lake-H) *
UHD Graphics 750
Vega 7
Radeon R7 M465
Iris Pro Graphics 6200
Vega 8
GeForce 940M
Iris Plus Graphics G4 (Ice Lake 48 EU)
Quadro M600M
FirePro W4190M
Radeon R9 M375
Radeon R7 M445
Iris Plus Graphics 650
Iris Graphics 550
Radeon 625
Vega 6 *
Iris Plus Graphics 640
Iris Graphics 540
UHD Graphics 24EUs (Alder Lake-N) *
Radeon R7 M360
GeForce 920M
Radeon 620
Radeon R7 M340
Radeon 610
Radeon 610M *
Vega 6 *
UHD Graphics G1 (Ice Lake 32 EU)
UHD Graphics Xe 16EUs (Tiger Lake-H) *
HD Graphics 530
Radeon R5 (Bristol Ridge)
Adreno 690 *
Adreno 685 *
Adreno 680 *
Radeon R5 M330
GeForce 910M
HD Graphics 520

Class 4

UHD Graphics 730
Radeon R5 M320 *
Radeon R5 M315 *
Radeon R5 M420 *
Vega 2 *
UHD Graphics 617
UHD Graphics 615
HD Graphics 515
UHD Graphics 610
HD Graphics 510
UHD Graphics 605
Radeon R4 (Stoney Ridge)
Radeon R2 (Stoney Ridge)
HD Graphics (Broadwell)
UHD Graphics 600
HD Graphics (Braswell)

Class 5

* Approximate position of the graphics adapter