华硕 Zenbook UX3430UQ (7500U, 940MX, 512 GB) 笔记本电脑简短评测

| SD Card Reader | |
| average JPG Copy Test (av. of 3 runs) | |
| Lenovo IdeaPad 710S Plus-13IKB | |
| Dell XPS 15 2017 9560 (7300HQ, Full-HD) | |
| Asus Zenbook UX3430UQ-GV012T | |
| Asus Zenbook UX3410UQ-GV077T | |
| maximum AS SSD Seq Read Test (1GB) | |
| Dell XPS 15 2017 9560 (7300HQ, Full-HD) | |
| Lenovo IdeaPad 710S Plus-13IKB | |
| Asus Zenbook UX3430UQ-GV012T | |
| Asus Zenbook UX3410UQ-GV077T | |
| |||||||||||||||||||||||||
Brightness Distribution: 88 %
Center on Battery: 377 cd/m²
Contrast: 1038:1 (Black: 0.34 cd/m²)
ΔE ColorChecker Calman: 2.88 | ∀{0.5-29.43 Ø4.73}
ΔE Greyscale Calman: 4.24 | ∀{0.09-98 Ø4.97}
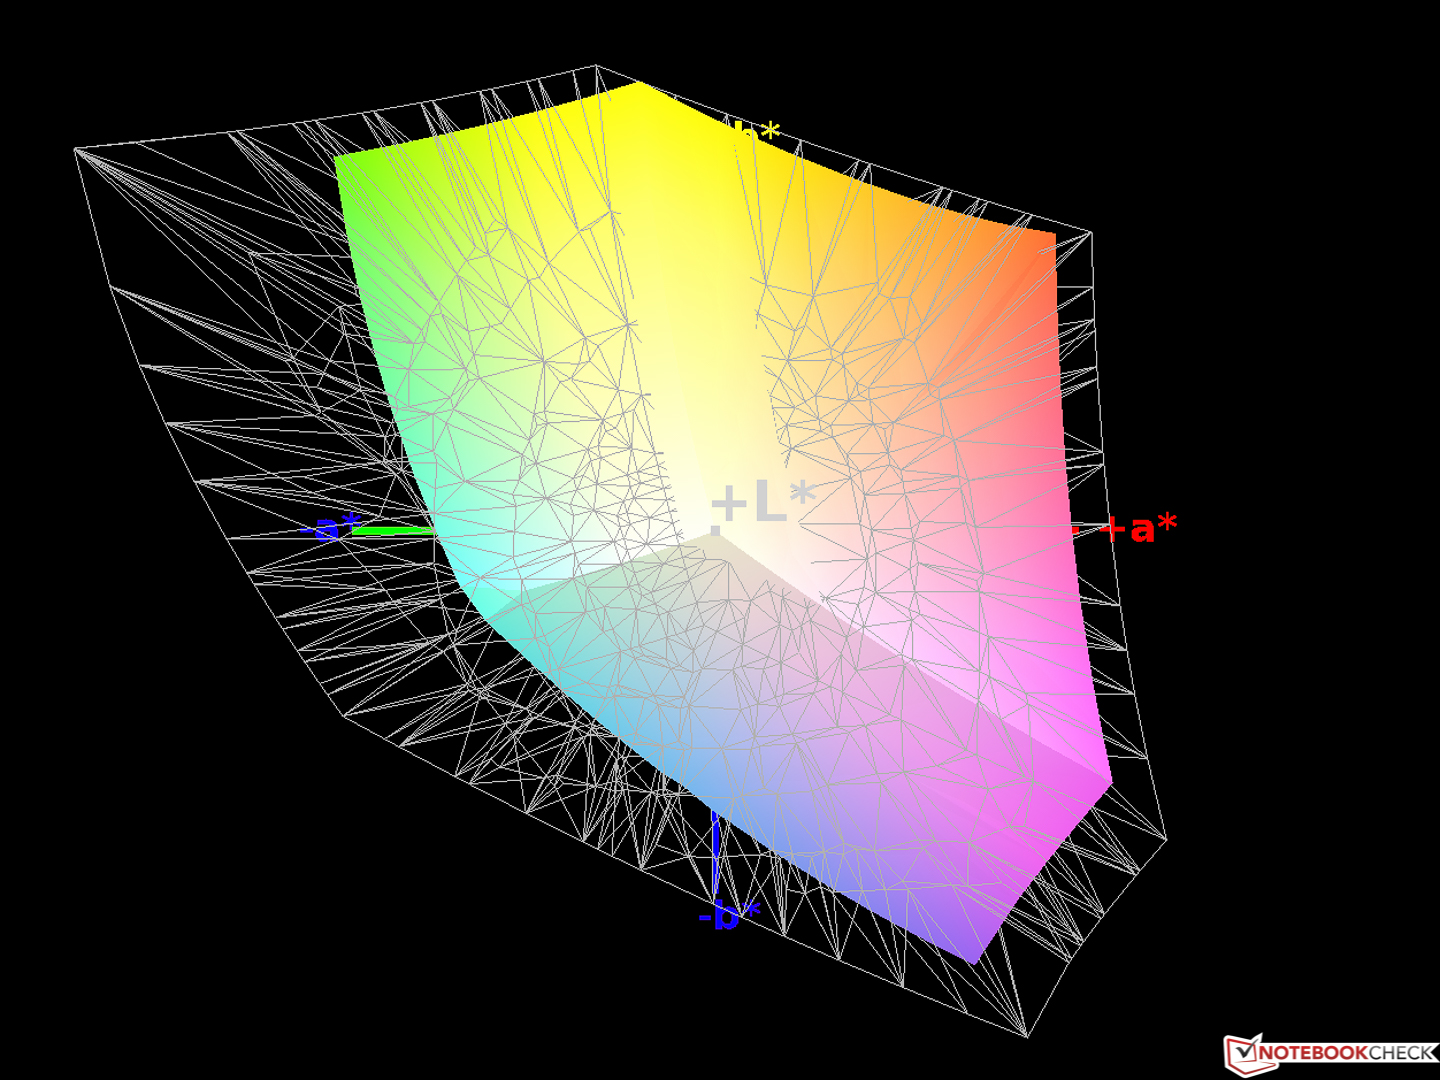
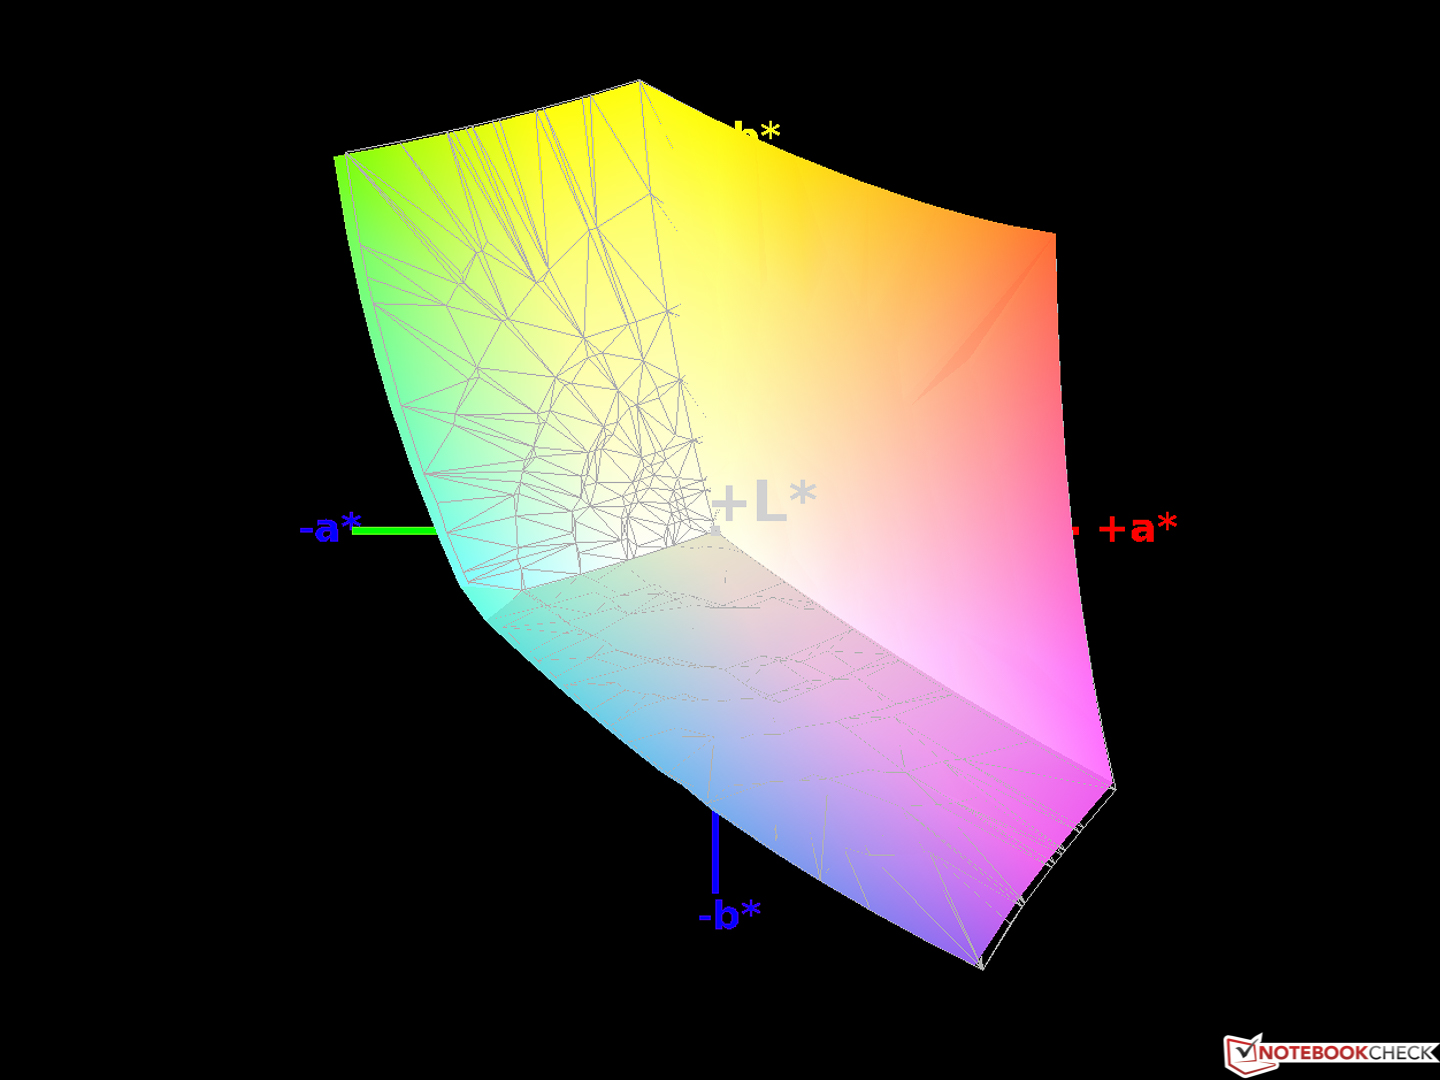
99% sRGB (Argyll 1.6.3 3D)
64% AdobeRGB 1998 (Argyll 1.6.3 3D)
69.3% AdobeRGB 1998 (Argyll 3D)
98.7% sRGB (Argyll 3D)
67.1% Display P3 (Argyll 3D)
Gamma: 2.38
CCT: 7380 K
| Asus Zenbook UX3430UQ-GV012T Chi Mei CMN14D2 / N140HCE-EN1, , 1920x1080, 14" | Lenovo IdeaPad 710S Plus-13IKB LG Philips LP133WF4-SPB1 (LGD04EF), , 1920x1080, 13.3" | Asus Zenbook UX3410UQ-GV077T Chi Mei N140HCE-EN1, , 1920x1080, 14" | Dell XPS 15 2017 9560 (7300HQ, Full-HD) Sharp SHP1453 LQ156M1, , 1920x1080, 15.6" | |
|---|---|---|---|---|
| Display | -11% | 0% | 2% | |
| Display P3 Coverage (%) | 67.1 | 65.3 -3% | 67.2 0% | 68.9 3% |
| sRGB Coverage (%) | 98.7 | 82.9 -16% | 99.2 1% | 98.9 0% |
| AdobeRGB 1998 Coverage (%) | 69.3 | 60.6 -13% | 69.3 0% | 70.9 2% |
| Response Times | -9% | -7% | -61% | |
| Response Time Grey 50% / Grey 80% * (ms) | 40 ? | 45 ? -13% | 44 ? -10% | 54 ? -35% |
| Response Time Black / White * (ms) | 28 ? | 29 ? -4% | 29 ? -4% | 52.4 ? -87% |
| PWM Frequency (Hz) | 60 ? | |||
| Screen | -12% | 2% | -11% | |
| Brightness middle (cd/m²) | 353 | 343 -3% | 381 8% | 400 13% |
| Brightness (cd/m²) | 366 | 306 -16% | 368 1% | 392 7% |
| Brightness Distribution (%) | 88 | 81 -8% | 84 -5% | 89 1% |
| Black Level * (cd/m²) | 0.34 | 0.3 12% | 0.3 12% | 0.26 24% |
| Contrast (:1) | 1038 | 1143 10% | 1270 22% | 1538 48% |
| Colorchecker dE 2000 * | 2.88 | 4.73 -64% | 2.84 1% | 4.9 -70% |
| Colorchecker dE 2000 max. * | 6.61 | 9.05 -37% | 6.5 2% | 11 -66% |
| Greyscale dE 2000 * | 4.24 | 3.29 22% | 4.02 5% | 7.2 -70% |
| Gamma | 2.38 92% | 2.36 93% | 2.42 91% | 2.11 104% |
| CCT | 7380 88% | 6437 101% | 7430 87% | 6911 94% |
| Color Space (Percent of AdobeRGB 1998) (%) | 64 | 54 -16% | 56 -12% | 64.2 0% |
| Color Space (Percent of sRGB) (%) | 99 | 83 -16% | 86 -13% | 98.9 0% |
| Total Average (Program / Settings) | -11% /
-11% | -2% /
1% | -23% /
-15% |
* ... smaller is better
Display Response Times
| ↔ Response Time Black to White | ||
|---|---|---|
| 28 ms ... rise ↗ and fall ↘ combined | ↗ 17 ms rise | 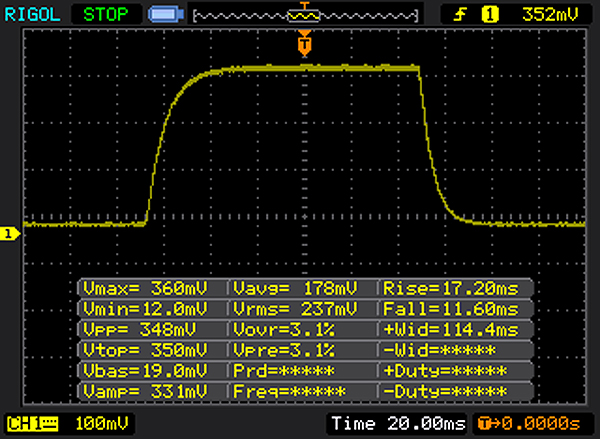 |
| ↘ 11 ms fall | ||
| The screen shows relatively slow response rates in our tests and may be too slow for gamers. In comparison, all tested devices range from 0.1 (minimum) to 240 (maximum) ms. » 71 % of all devices are better. This means that the measured response time is worse than the average of all tested devices (19.9 ms). | ||
| ↔ Response Time 50% Grey to 80% Grey | ||
| 40 ms ... rise ↗ and fall ↘ combined | ↗ 20 ms rise | 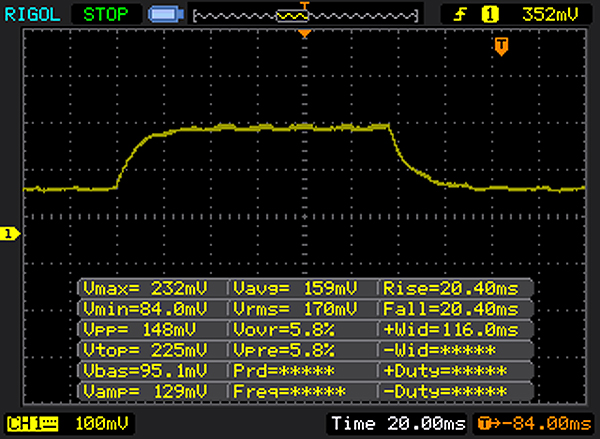 |
| ↘ 20 ms fall | ||
| The screen shows slow response rates in our tests and will be unsatisfactory for gamers. In comparison, all tested devices range from 0.165 (minimum) to 636 (maximum) ms. » 61 % of all devices are better. This means that the measured response time is worse than the average of all tested devices (31.1 ms). | ||
Screen Flickering / PWM (Pulse-Width Modulation)
| Screen flickering / PWM not detected | ||
In comparison: 52 % of all tested devices do not use PWM to dim the display. If PWM was detected, an average of 7798 (minimum: 5 - maximum: 343500) Hz was measured. | ||
| PCMark 8 | |
| Home Score Accelerated v2 | |
| Asus Zenbook UX3410UQ-GV077T | |
| Asus Zenbook UX3430UQ-GV012T | |
| Dell XPS 15 2017 9560 (7300HQ, Full-HD) | |
| Lenovo IdeaPad 710S Plus-13IKB | |
| Work Score Accelerated v2 | |
| Dell XPS 15 2017 9560 (7300HQ, Full-HD) | |
| Asus Zenbook UX3430UQ-GV012T | |
| Lenovo IdeaPad 710S Plus-13IKB | |
| PCMark 8 Home Score Accelerated v2 | 3913 points | |
| PCMark 8 Work Score Accelerated v2 | 4812 points | |
Help | ||
| Asus Zenbook UX3430UQ-GV012T SanDisk SD8SN8U512G1002 | Lenovo IdeaPad 710S Plus-13IKB Samsung PM961 NVMe MZVLW512HMJP | Asus Zenbook UX3410UQ-GV077T SanDisk SD8SNAT256G1002 | Dell XPS 15 2017 9560 (7300HQ, Full-HD) WDC WD10SPCX-75KHST0 + SanDisk Z400s M.2 2242 32 GB Cache | |
|---|---|---|---|---|
| CrystalDiskMark 3.0 | 143% | -14% | -82% | |
| Read Seq (MB/s) | 500 | 1577 215% | 497 -1% | 123 -75% |
| Write Seq (MB/s) | 457.4 | 1472 222% | 323.7 -29% | 74.2 -84% |
| Read 512 (MB/s) | 345.6 | 1165 237% | 289 -16% | 101.7 -71% |
| Write 512 (MB/s) | 415 | 1244 200% | 288 -31% | 42.51 -90% |
| Read 4k (MB/s) | 28.34 | 54.8 93% | 22.78 -20% | 10.84 -62% |
| Write 4k (MB/s) | 56.8 | 121.5 114% | 79.5 40% | 1.021 -98% |
| Read 4k QD32 (MB/s) | 311.3 | 407.5 31% | 147 -53% | 69.8 -78% |
| Write 4k QD32 (MB/s) | 251.1 | 321.4 28% | 257.2 2% | 1.057 -100% |

| 3DMark 11 - 1280x720 Performance GPU | |
| Dell XPS 15 2017 9560 (7300HQ, Full-HD) | |
| Lenovo IdeaPad 710S Plus-13IKB | |
| Asus Zenbook UX3430UQ-GV012T | |
| Asus Zenbook UX3410UQ-GV077T | |
| Asus Zenbook UX3410UA | |
| 3DMark - 1920x1080 Fire Strike Graphics | |
| Dell XPS 15 2017 9560 (7300HQ, Full-HD) | |
| Lenovo IdeaPad 710S Plus-13IKB | |
| Asus Zenbook UX3430UQ-GV012T | |
| Asus Zenbook UX3410UA | |
| 3DMark 11 Performance | 2335 points | |
| 3DMark Cloud Gate Standard Score | 6852 points | |
| 3DMark Fire Strike Score | 1373 points | |
Help | ||
| low | med. | high | ultra | |
|---|---|---|---|---|
| Diablo III (2012) | 70.2 | 66.8 | 41.7 | |
| The Witcher 3 (2015) | 27.8 | 17.3 | ||
| Farming Simulator 17 (2016) | 79.7 | 34.1 | 23.3 |
Noise level
| Idle |
| 30.8 / 30.8 / 32.4 dB(A) |
| Load |
| 35.1 / 38.4 dB(A) |
 | ||
30 dB silent 40 dB(A) audible 50 dB(A) loud |
||
min: | ||
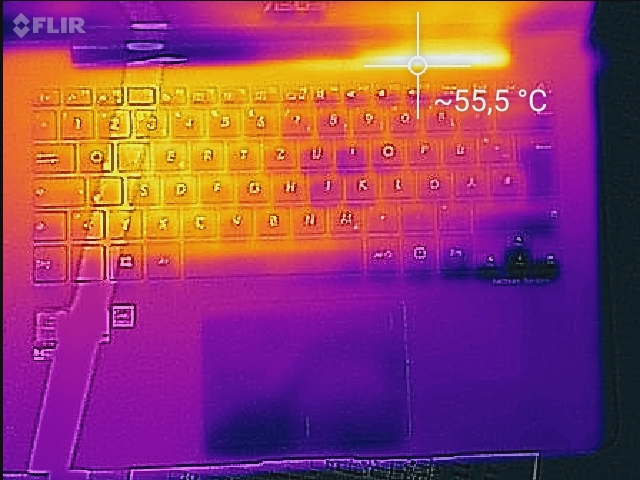
(±) The maximum temperature on the upper side is 44 °C / 111 F, compared to the average of 35.9 °C / 97 F, ranging from 21.4 to 59 °C for the class Subnotebook.
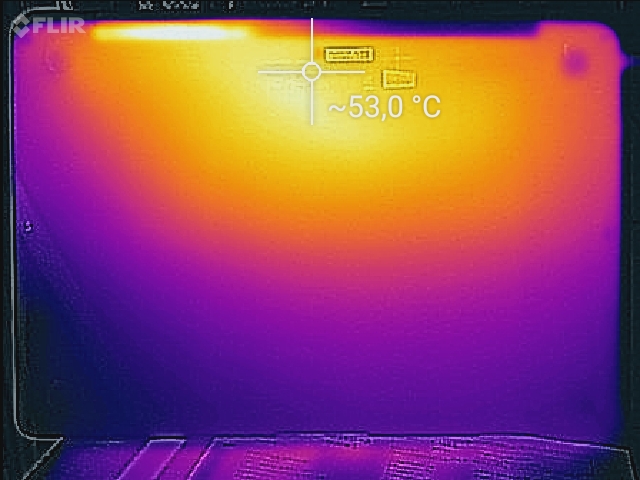
(-) The bottom heats up to a maximum of 50.2 °C / 122 F, compared to the average of 39.2 °C / 103 F
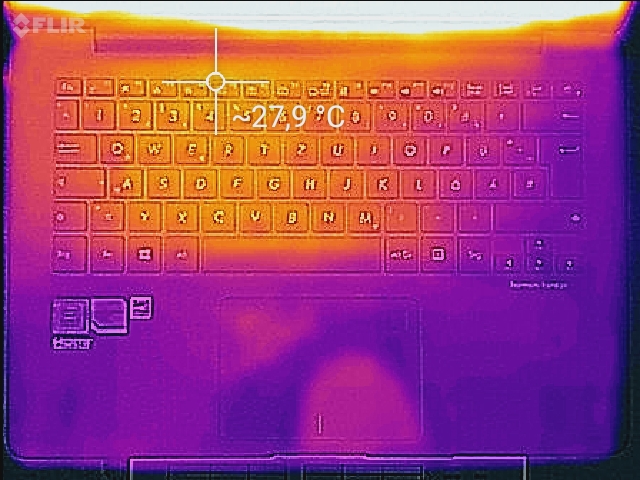
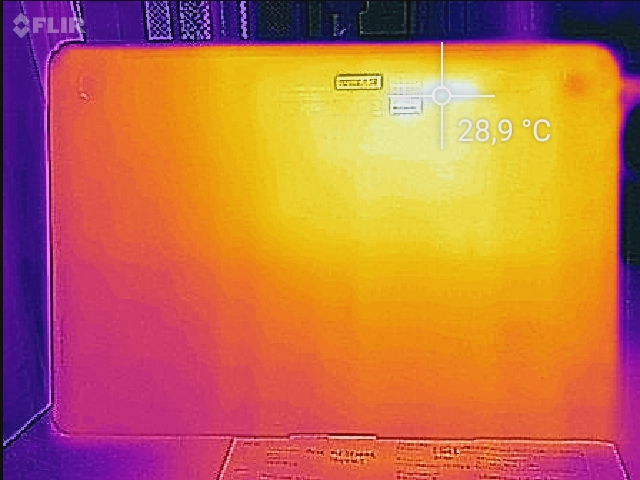
(+) In idle usage, the average temperature for the upper side is 25.5 °C / 78 F, compared to the device average of 30.8 °C / 87 F.
(+) The palmrests and touchpad are reaching skin temperature as a maximum (33.4 °C / 92.1 F) and are therefore not hot.
(-) The average temperature of the palmrest area of similar devices was 28.2 °C / 82.8 F (-5.2 °C / -9.3 F).
Asus Zenbook UX3430UQ-GV012T audio analysis
(±) | speaker loudness is average but good (75 dB)
Bass 100 - 315 Hz
(-) | nearly no bass - on average 18.9% lower than median
(±) | linearity of bass is average (12.2% delta to prev. frequency)
Mids 400 - 2000 Hz
(+) | balanced mids - only 3.4% away from median
(+) | mids are linear (6.9% delta to prev. frequency)
Highs 2 - 16 kHz
(+) | balanced highs - only 2.7% away from median
(+) | highs are linear (5% delta to prev. frequency)
Overall 100 - 16.000 Hz
(±) | linearity of overall sound is average (20.4% difference to median)
Compared to same class
» 65% of all tested devices in this class were better, 8% similar, 27% worse
» The best had a delta of 5%, average was 18%, worst was 53%
Compared to all devices tested
» 53% of all tested devices were better, 8% similar, 39% worse
» The best had a delta of 4%, average was 24%, worst was 134%
Lenovo IdeaPad 710S Plus-13IKB audio analysis
(±) | speaker loudness is average but good (73 dB)
Bass 100 - 315 Hz
(-) | nearly no bass - on average 21.4% lower than median
(±) | linearity of bass is average (12.2% delta to prev. frequency)
Mids 400 - 2000 Hz
(±) | higher mids - on average 6.7% higher than median
(±) | linearity of mids is average (10.6% delta to prev. frequency)
Highs 2 - 16 kHz
(+) | balanced highs - only 2.2% away from median
(+) | highs are linear (6.9% delta to prev. frequency)
Overall 100 - 16.000 Hz
(±) | linearity of overall sound is average (24.4% difference to median)
Compared to same class
» 82% of all tested devices in this class were better, 4% similar, 13% worse
» The best had a delta of 5%, average was 18%, worst was 53%
Compared to all devices tested
» 74% of all tested devices were better, 6% similar, 20% worse
» The best had a delta of 4%, average was 24%, worst was 134%
Asus Zenbook UX3410UQ-GV077T audio analysis
(±) | speaker loudness is average but good (73 dB)
Bass 100 - 315 Hz
(±) | reduced bass - on average 12% lower than median
(+) | bass is linear (4.5% delta to prev. frequency)
Mids 400 - 2000 Hz
(±) | higher mids - on average 6.5% higher than median
(+) | mids are linear (6.7% delta to prev. frequency)
Highs 2 - 16 kHz
(+) | balanced highs - only 3.9% away from median
(+) | highs are linear (4.8% delta to prev. frequency)
Overall 100 - 16.000 Hz
(±) | linearity of overall sound is average (17% difference to median)
Compared to same class
» 43% of all tested devices in this class were better, 8% similar, 49% worse
» The best had a delta of 5%, average was 18%, worst was 53%
Compared to all devices tested
» 30% of all tested devices were better, 8% similar, 62% worse
» The best had a delta of 4%, average was 24%, worst was 134%
Dell XPS 15 2017 9560 (7300HQ, Full-HD) audio analysis
(+) | speakers can play relatively loud (87 dB)
Bass 100 - 315 Hz
(-) | nearly no bass - on average 15.8% lower than median
(±) | linearity of bass is average (13.9% delta to prev. frequency)
Mids 400 - 2000 Hz
(+) | balanced mids - only 4.3% away from median
(±) | linearity of mids is average (7.1% delta to prev. frequency)
Highs 2 - 16 kHz
(+) | balanced highs - only 3.1% away from median
(±) | linearity of highs is average (7.9% delta to prev. frequency)
Overall 100 - 16.000 Hz
(+) | overall sound is linear (13.5% difference to median)
Compared to same class
» 29% of all tested devices in this class were better, 4% similar, 67% worse
» The best had a delta of 5%, average was 17%, worst was 45%
Compared to all devices tested
» 14% of all tested devices were better, 4% similar, 82% worse
» The best had a delta of 4%, average was 24%, worst was 134%
| Off / Standby | |
| Idle | |
| Load |
|
Key:
min: | |
| Asus Zenbook UX3430UQ-GV012T i7-7500U, GeForce 940MX, SanDisk SD8SN8U512G1002, IPS, 1920x1080, 14" | Lenovo IdeaPad 710S Plus-13IKB i7-7500U, GeForce 940MX, Samsung PM961 NVMe MZVLW512HMJP, IPS, 1920x1080, 13.3" | Asus Zenbook UX3410UQ-GV077T i7-7500U, GeForce 940MX, SanDisk SD8SNAT256G1002, IPS, 1920x1080, 14" | Dell XPS 15 2017 9560 (7300HQ, Full-HD) i5-7300HQ, GeForce GTX 1050 Mobile, WDC WD10SPCX-75KHST0 + SanDisk Z400s M.2 2242 32 GB Cache, LED IGZO IPS InfinityEdge, 1920x1080, 15.6" | |
|---|---|---|---|---|
| Power Consumption | -19% | -15% | -109% | |
| Idle Minimum * (Watt) | 2.6 | 3.6 -38% | 3.5 -35% | 6.6 -154% |
| Idle Average * (Watt) | 5.9 | 7.4 -25% | 6.6 -12% | 9 -53% |
| Idle Maximum * (Watt) | 6.25 | 8.7 -39% | 7.1 -14% | 10.7 -71% |
| Load Average * (Watt) | 42 | 43 -2% | 30 29% | 77.5 -85% |
| Load Maximum * (Watt) | 46 | 42 9% | 65 -41% | 130 -183% |
* ... smaller is better
| Asus Zenbook UX3430UQ-GV012T i7-7500U, GeForce 940MX, 50 Wh | Lenovo IdeaPad 710S Plus-13IKB i7-7500U, GeForce 940MX, 46 Wh | Asus Zenbook UX3410UQ-GV077T i7-7500U, GeForce 940MX, 48 Wh | Dell XPS 15 2017 9560 (7300HQ, Full-HD) i5-7300HQ, GeForce GTX 1050 Mobile, 56 Wh | |
|---|---|---|---|---|
| Battery runtime | -35% | -3% | -35% | |
| Reader / Idle (h) | 21.5 | 7.8 -64% | 9.4 -56% | |
| WiFi v1.3 (h) | 8.8 | 5.6 -36% | 8.5 -3% | 5.6 -36% |
| Load (h) | 1.6 | 1.5 -6% | 1.4 -13% |
Pros
Cons
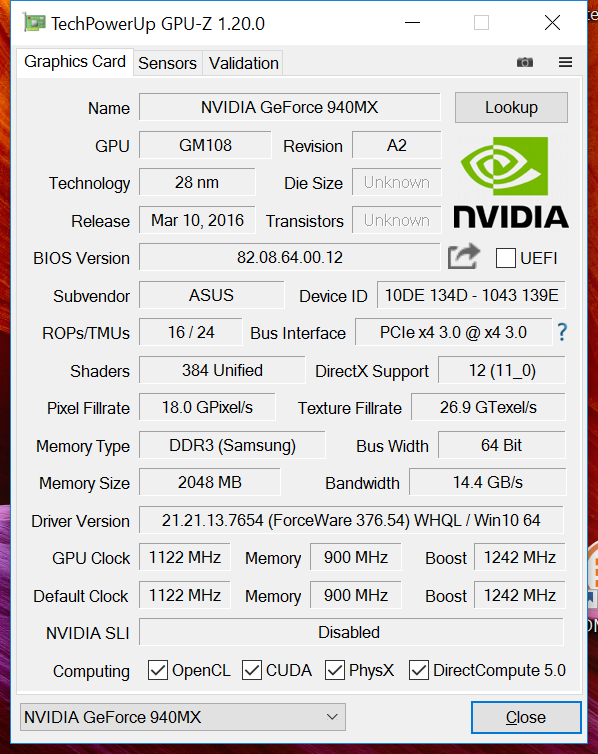
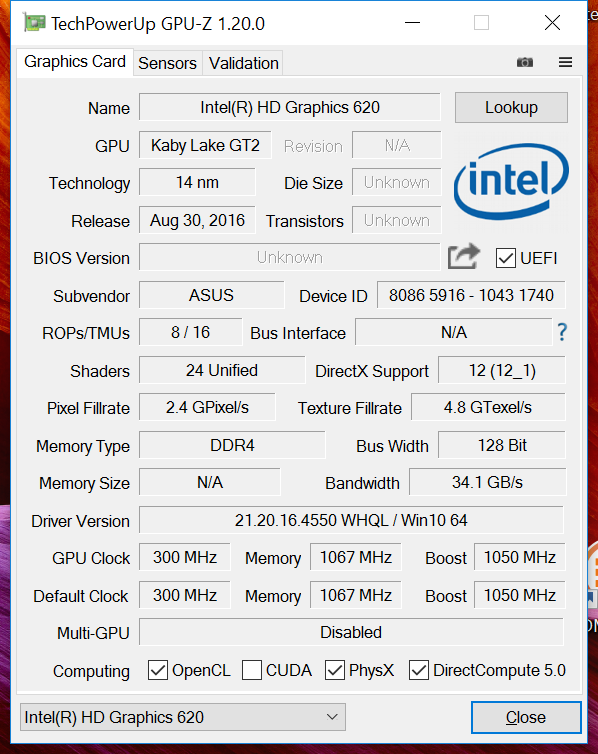
为什么啊为什么华硕选择了已经十分过时的前代GeForce 940MX显卡?又是为什么他们没有有效地利用这款已经十分成熟的显卡?请注意,在这台Zenbook中的940MX相比集成英特尔高清显卡620仅快30%。能够支持“多媒体”这个形容词的功能只剩这台笔记本电脑的出色屏幕了。多媒体笔记本电脑?当然不算。
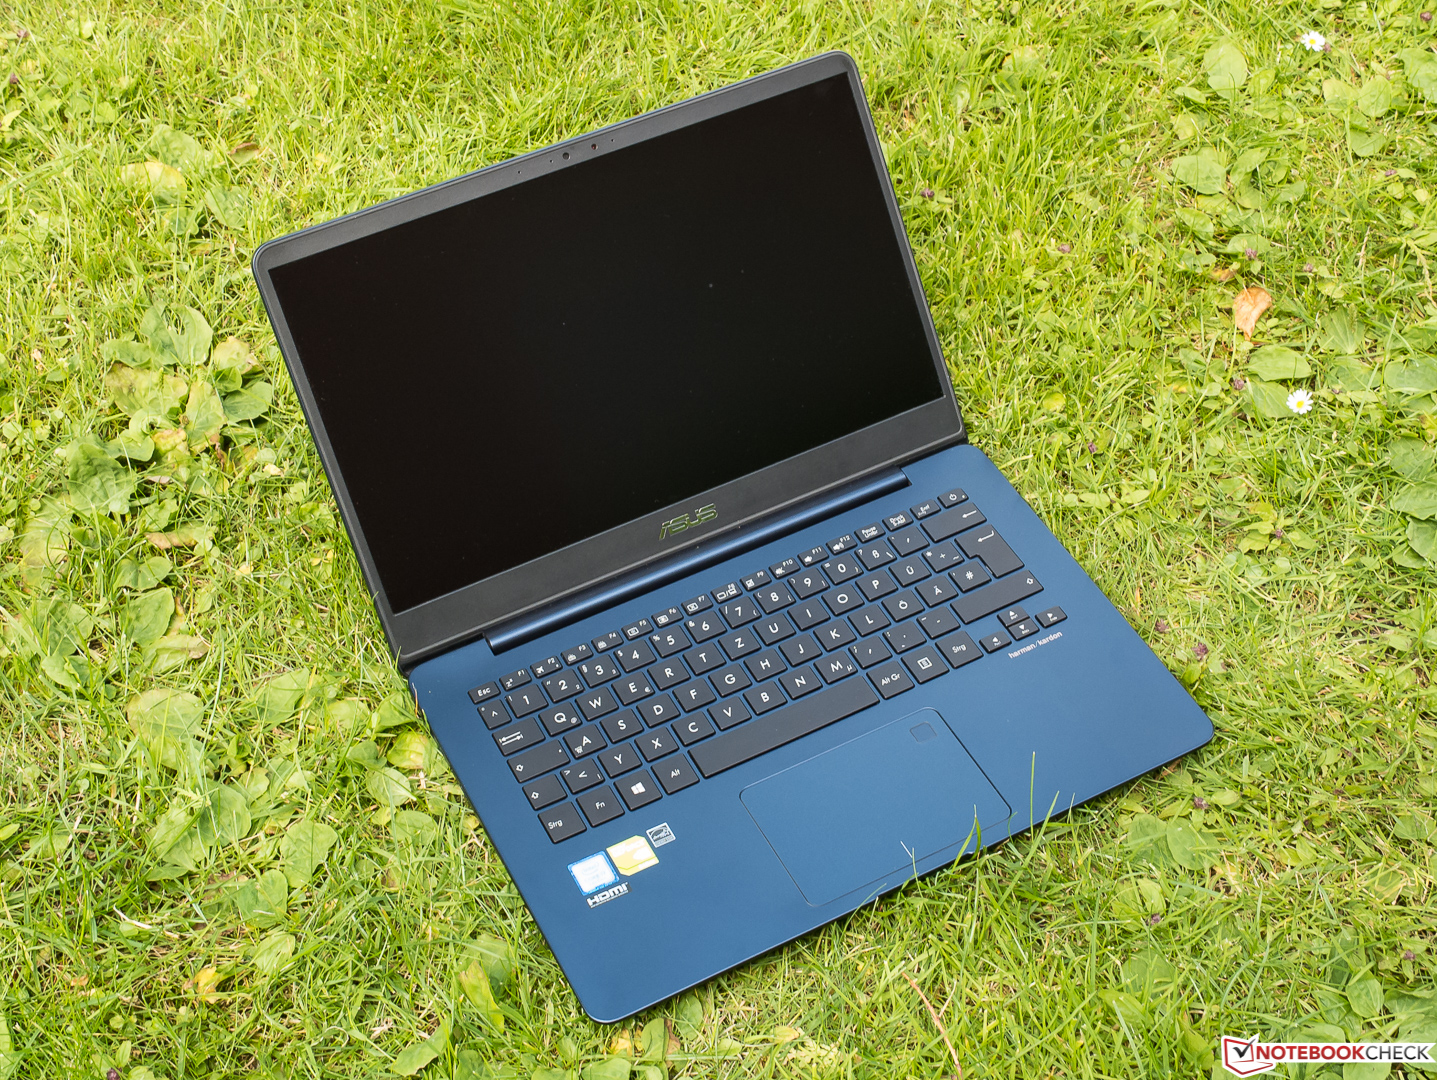
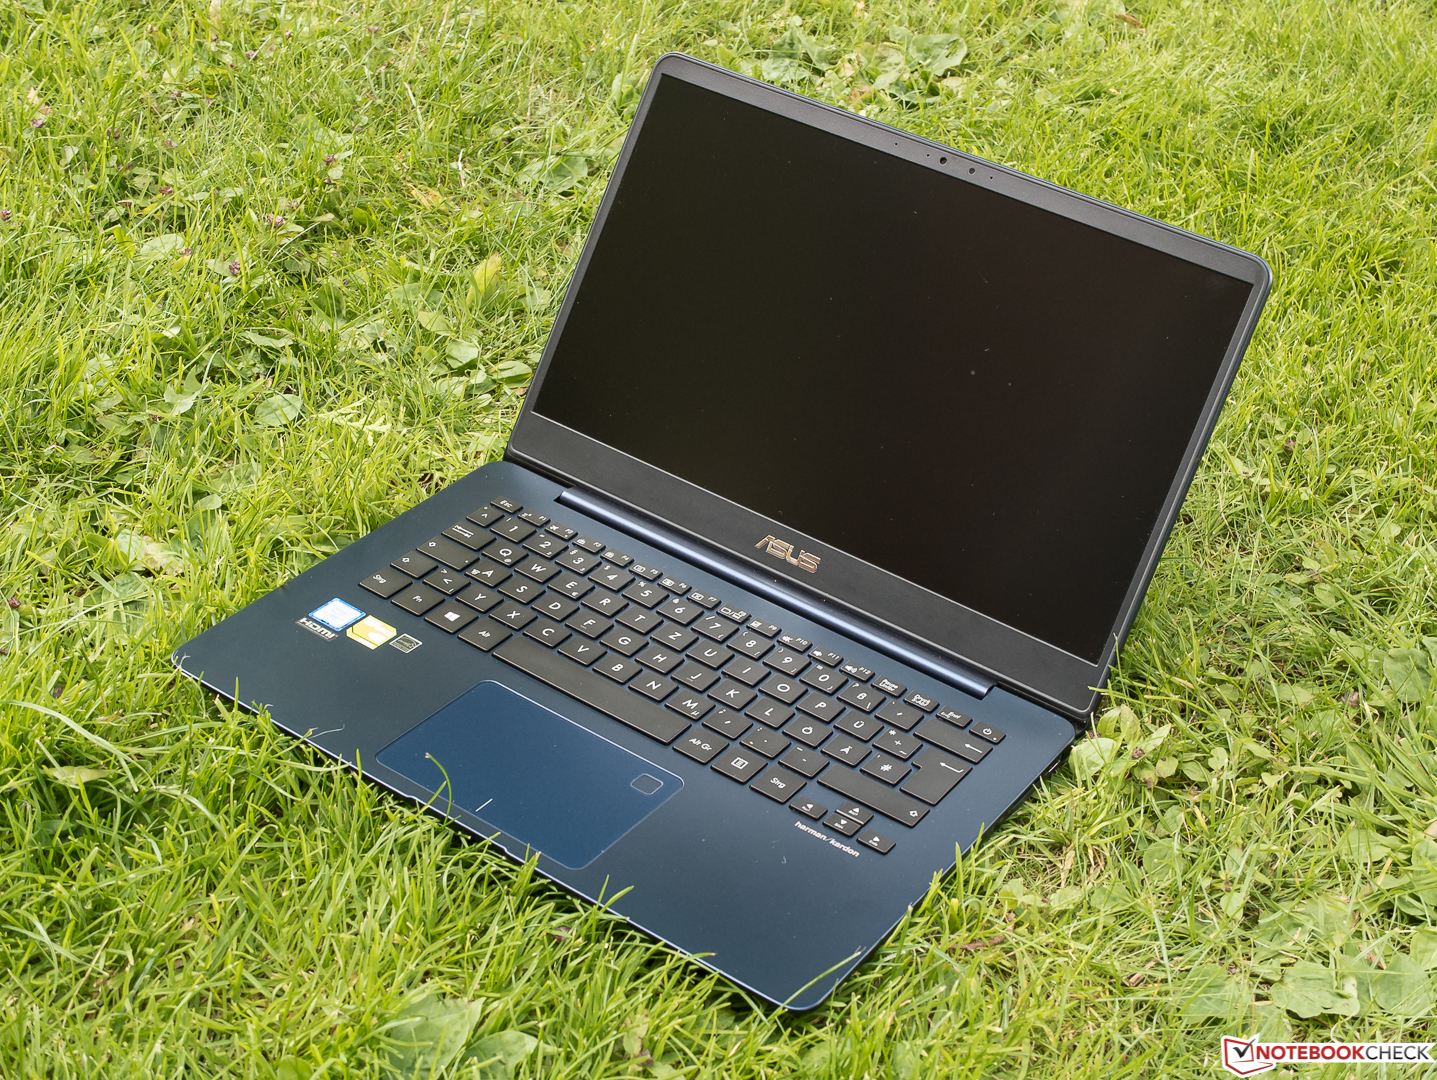
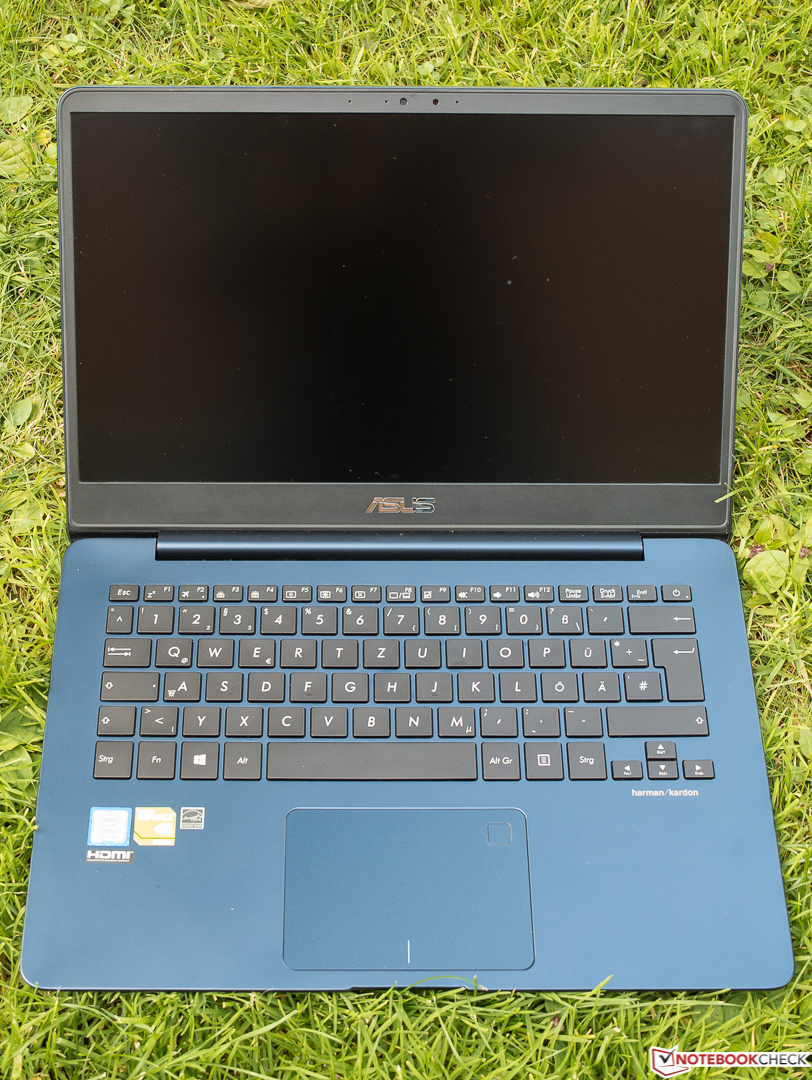
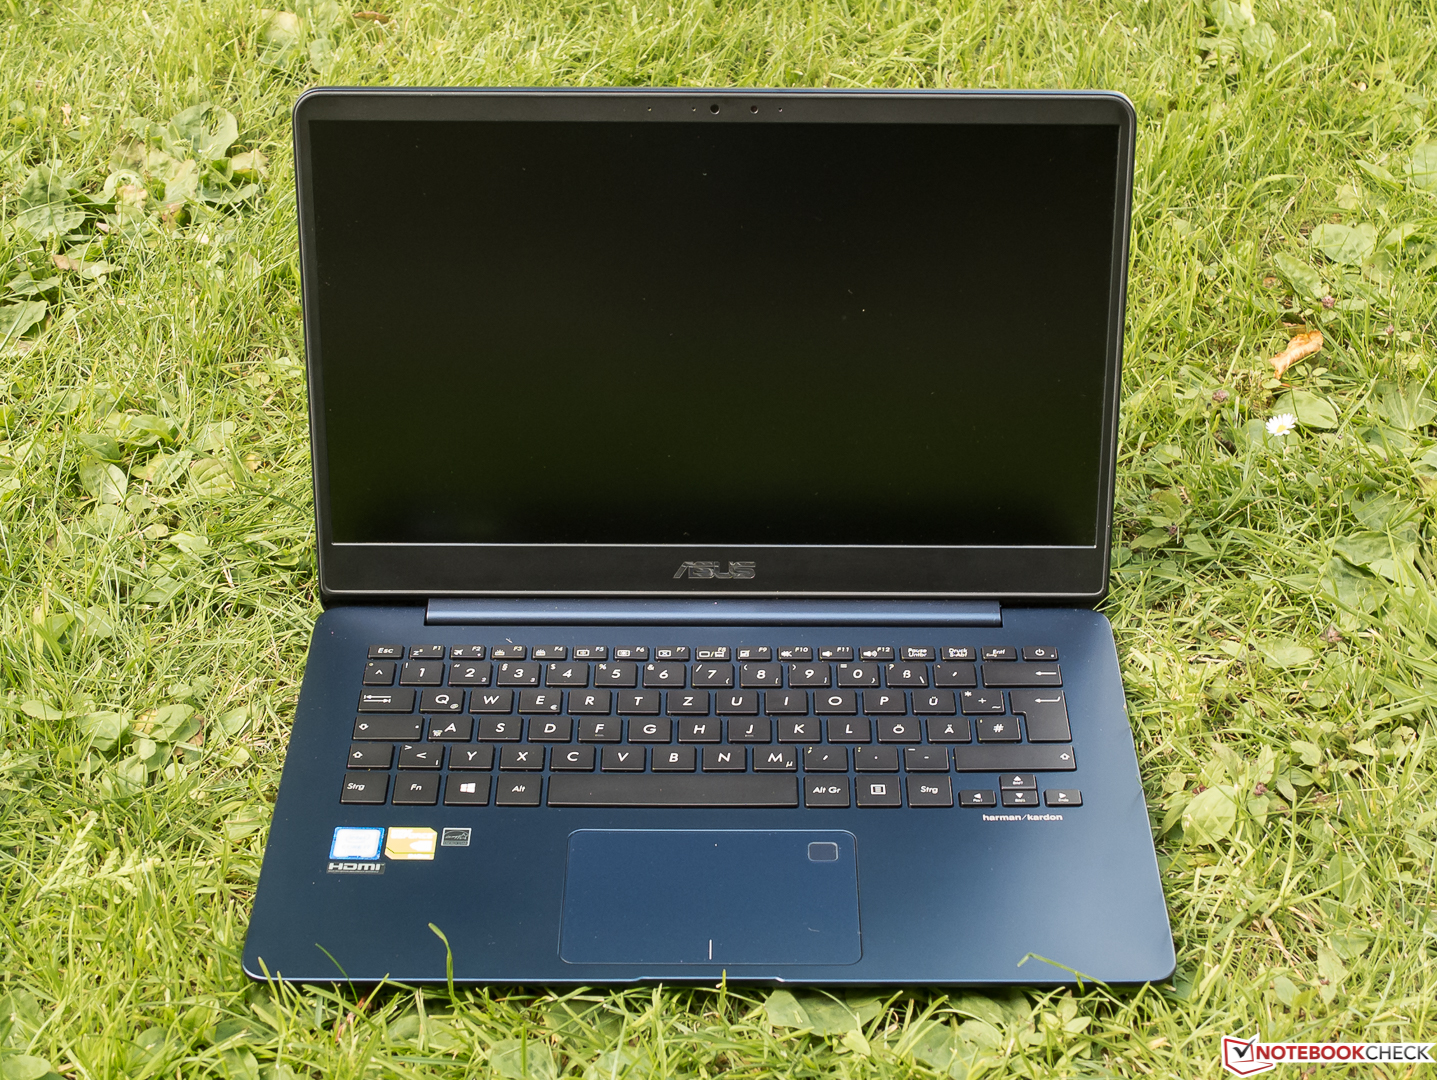
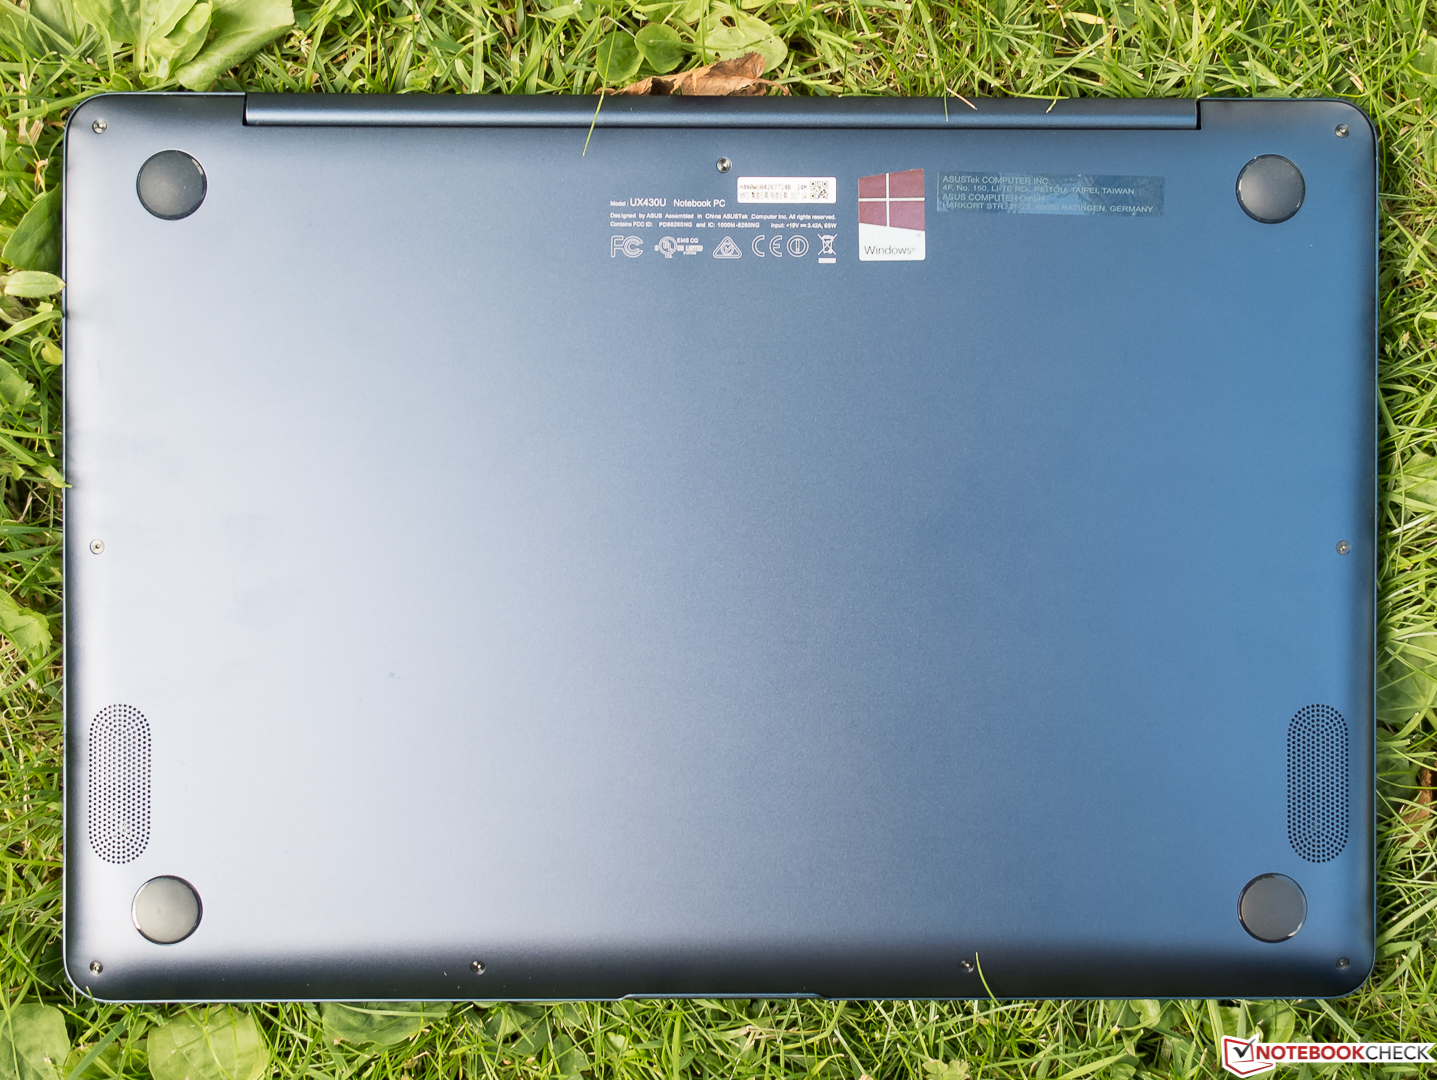
商务笔记本电脑?显然是的。华硕Zenbook UX3430UQ更接近于一台商务办公设备,也同样可以适合非专业图片处理爱好者使用。由于采用超薄边框设计,工艺优秀的14寸机身相对十分小巧。超长的电池续航和各种安全功能也让它变得非常便携。如果不是键盘较响的打字声的话,它也会是一台非常安静的设备。考虑到各个方面,它的输入设备应该可以满足文字处理工作者。正在寻找一台高品质便携笔记本电脑的办公和商务用户将是这台设备的主攻消费群体。游戏玩家,则需要另觅他处了。
目前UX3430UQ 1500美元(GV010T)或1600美元(GV012T)的零售价相对较高。如果等待一段时间,它将会有更高的性价比带给耐心的消费者。
注:本文是基于完整评测的缩减版本,阅读完整的英文评测,请点击这里。
Asus Zenbook UX3430UQ-GV012T
- 07/05/2017 v6 (old)
Sven Kloevekorn
Price comparison
