Notebookcheck Logo

AMD Radeon R5 (Stoney Ridge)

AMD Radeon R5 (Stoney Ridge)

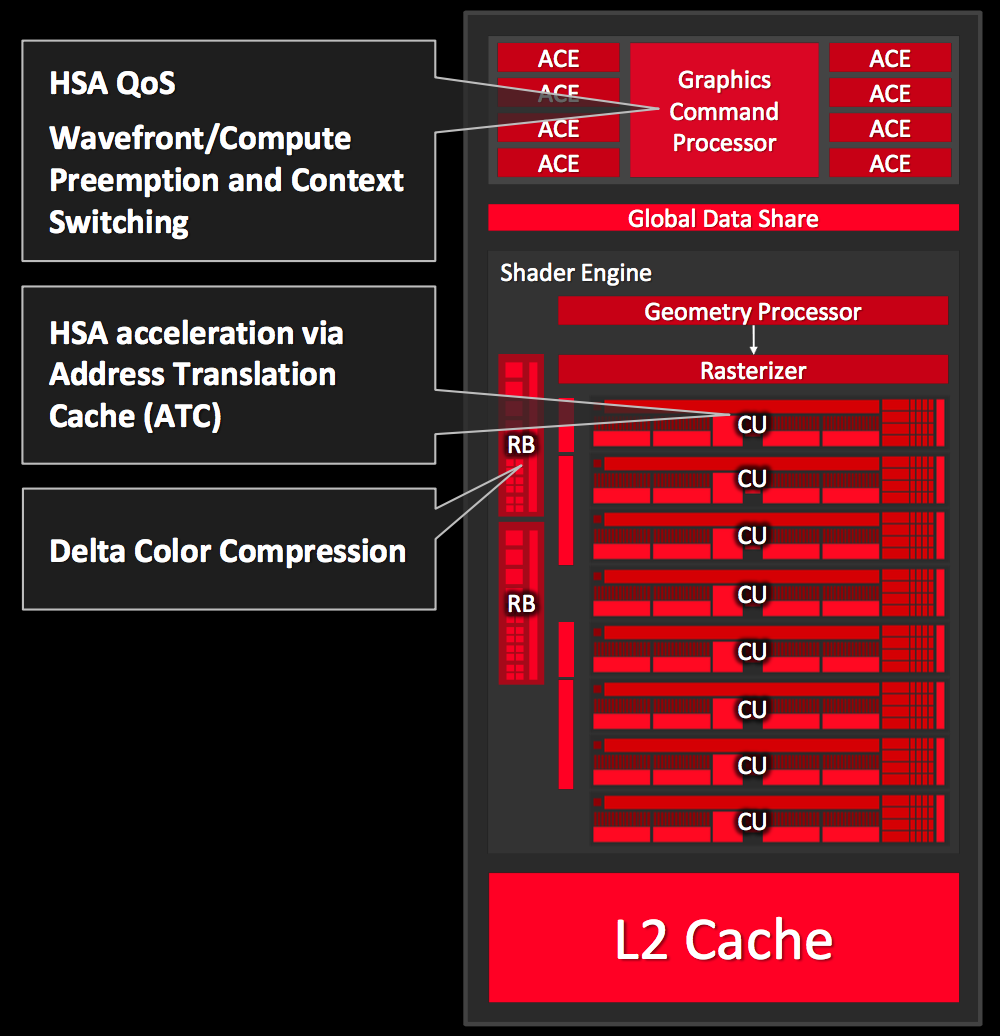
AMD Radeon R5(Stoney Ridge)是移动双核Stoney Ridge架构APU集成显卡中较弱的一款。在其推出时,它集成于AMD A9-9410中,采用3个激活的计算核心(384个着色器)。根据型号的不同,最高时钟频率为800MHz。根据热设计功率和内存配置的不同,它的性能会区别很大。相比于从Bristol Ridge系列的Radeon R5,它只有3个而不是6个GCN核心(且是Stoney Ridge芯片的完整配置)。

架构和特性

Radeon R5配备3个第三代GCN架构(通常称为GCN 1.2或2.0)的运算核心。这意味着它与Tonga桌面式芯片非常相似,支持DirectX 12(FL 12_0),但图形核心也可以通过Mantle,OpenGL和OpenCL访问。该显卡也支持HSA 1.0标准,因此可以高效地与处理器核心交换数据。它的技术规格和Carrizo前代型号相同。

视频单元包括UVD 6(统一视频解码器),支持硬件解码HEVC / H.265格式的4K视频。更多详情请见我们的Stoney Ridge架构处理器评测文章。

功耗

根据型号不同,和可定制热设计功率(CTDP),这块28纳米制程技术芯片功耗从10到25瓦不等。这意味着它可以也可以用于轻薄笔记本。

Radeon R (Stoney / Bristol Ridge) Series

Radeon R7 (Bristol Ridge) 512 @ 0.9 GHz64/128 Bit
Radeon R5 (Bristol Ridge) 384 @ 0.8 GHz64/128 Bit
Radeon R5 (Stoney Ridge) 192 @ 0.8 GHz64 Bit
Radeon R4 (Stoney Ridge) 192 @ 0.6 GHz64 Bit
Radeon R2 (Stoney Ridge) 128 @ 0.6 GHz64 Bit
CodenameStoney Ridge
ArchitectureGCN 1.2/2.0
Pipelines192 - unified
Core Speed800 (Boost) MHz
Memory Bus Width64 Bit
Shared Memoryyes
APIDirectX 12 (FL 12_0), OpenGL 4.4
Power Consumption12-45 Watt
technology28 nm
FeaturesUVD 6, VCE
Notebook Sizemedium sized
Date of Announcement01.06.2016
CPU in Radeon R5 (Stoney Ridge)GPU Base SpeedGPU Boost / Turbo
AMD A9-94252 x 3100 MHz, 15 W? MHz900 MHz
AMD A9-9420e2 x ? MHz? MHz? MHz
AMD A9-94202 x 3000 MHz, 10-25 W? MHz800 MHz
min. - max.? MHz720 - 900 MHz

Benchmarks

Performance Rating - 3DMark 11 + Fire Strike + Time Spy
0.4 pt (1%)
AMD Radeon HD 8180
0.06605 -81%
...
Intel HD Graphics 5000
0.3259 -7%
0.3262 -7%
0.3275 -7%
0.3325 -5%
0.336 -4%
NVIDIA Quadro K610M
0.3442 -2%
0.3501 0%
0.351 0%
AMD Radeon R5 M230
0.3512 0%
AMD Radeon R5 (Stoney Ridge)
0.3517
AMD Radeon HD 6620G + HD 7670M Dual Graphics
0.354 1%
0.3599 2%
AMD Radeon HD 8550G
0.3608 3%
Intel HD Graphics 520
0.366 4%
Intel UHD Graphics 615
0.3731 6%
NVIDIA GeForce GT 720M
0.3744 6%
0.3754 7%
0.3776 7%
AMD Radeon HD 8650G + HD 8670M Dual Graphics
0.3849 9%
...
21.1 5899%
max:
33.3 9368%
0%
100%
3DMark - 3DMark Time Spy Score
min: 274     avg: 281.5     median: 281.5 (1%)     max: 289 Points
3DMark - 3DMark Time Spy Graphics
min: 247     avg: 254.5     median: 254.5 (1%)     max: 262 Points
Intel UHD Graphics 605
113 -56%
...
Intel UHD Graphics 600
107.5 -58%
Intel UHD Graphics 605
113 -56%
168.2 -34%
Intel UHD Graphics 610
194 -24%
194.5 -24%
AMD Radeon R4 (Stoney Ridge)
205 -19%
Intel HD Graphics 530
235 -8%
243.7 -4%
Intel UHD Graphics 615
244.7 -4%
AMD Radeon R5 (Stoney Ridge)
254.5
255 0%
Intel HD Graphics 520
263 3%
AMD Radeon R6 (Carrizo)
274 8%
281 10%
Intel UHD Graphics 617
299 17%
312 23%
320 26%
328.8 29%
NVIDIA GeForce 920M
329 29%
...
19434 7536%
max:
36485 14236%
0%
100%
3DMark - 3DMark Ice Storm Unlimited Graphics
min: 46978     avg: 50907     median: 51382 (6%)     max: 54361 Points
3DMark - 3DMark Ice Storm Extreme Graphics
min: 32172     avg: 33058     median: 33057.5 (4%)     max: 33943 Points
3DMark - 3DMark Cloud Gate Score
min: 2673     avg: 2893     median: 2995 (3%)     max: 3010 Points
3DMark - 3DMark Cloud Gate Graphics
min: 3661     avg: 4439     median: 4755 (1%)     max: 4902 Points
3DMark - 3DMark Fire Strike Standard Score
min: 596     avg: 688     median: 712 (1%)     max: 757 Points
3DMark - 3DMark Fire Strike Standard Graphics
min: 642     avg: 765     median: 772 (1%)     max: 881 Points
3DMark - 3DMark Ice Storm Graphics
min: 49964     avg: 51392     median: 51392 (6%)     max: 52820 Points
3DMark 11 - 3DM11 Performance Score
min: 1103     avg: 1254     median: 1263 (2%)     max: 1387 Points
3DMark 11 - 3DM11 Performance GPU
min: 1096     avg: 1245     median: 1264 (1%)     max: 1356 Points
171.8 -86%
...
1148 -8%
1152 -7%
1161 -7%
Intel UHD Graphics 615
1175 -6%
AMD Radeon HD 8550G
1179 -5%
1179 -5%
AMD Radeon R5 M230
1203 -3%
1233 -1%
1233 -1%
AMD Radeon R5 (Stoney Ridge)
1245
1259 1%
1261 1%
1286 3%
Intel HD Graphics 520
1296 4%
1307 5%
1328 7%
1346 8%
1349 8%
1350 8%
...
59943 4715%
max:
106023 8416%
0%
100%
3DMark Vantage
3DM Vant. Perf. total +
3DMark Vantage - 3DM Vant. Perf. total
3346 Points (1%)
3DM Vant. Perf. GPU no PhysX +
3DMark Vantage - 3DM Vant. Perf. GPU no PhysX
3044 Points (2%)
ATI Radeon HD 3200
62 -98%
...
2801 -8%
2803 -8%
2865 -6%
2914 -4%
2927 -4%
NVIDIA GeForce 9800M GS
2955 -3%
2969 -2%
2974 -2%
Intel HD Graphics 4400
3005 -1%
AMD Radeon R5 (Stoney Ridge)
3044
3055 0%
3061 1%
3079 1%
3103 2%
3112 2%
Intel HD Graphics 510
3125 3%
NVIDIA GeForce GTS 250M
3128 3%
3153 4%
3164 4%
...
132443 4251%
max:
170928 5515%
0%
100%
3DMark 06 3DMark 06 - Standard 1280x1024 +
3DMark 06
min: 5141     avg: 5174     median: 5174 (7%)     max: 5207 Points
Unigine Heaven 3.0 - Unigine Heaven 3.0 DX 11
13.7 fps (5%)
Unigine Heaven 3.0 - Unigine Heaven 3.0 OpenGL
10.5 fps (5%)
Unigine Heaven 2.1 - Heaven 2.1 high
10.8 fps (2%)
0.6 -94%
...
AMD Radeon HD 8550G
9.8 -9%
9.9 -8%
10.05 -7%
10.1 -6%
10.1 -6%
10.3 -5%
10.45 -3%
10.63 -2%
AMD Radeon HD 8650G
10.7 -1%
AMD Radeon R5 (Stoney Ridge)
10.8
10.8 0%
Intel HD Graphics 4400
10.87 1%
Intel HD Graphics (Broadwell)
10.9 1%
11.1 3%
11.13 3%
11.3 5%
11.4 6%
11.4 6%
11.53 7%
...
532 4826%
0%
100%
Cinebench R10 Cinebench R10 Shading (32bit) +
Cinebench R10 - Cinebench R10 Shading (32bit)
min: 2752     avg: 3847     median: 3773 (3%)     max: 5088 points
Cinebench R11.5 Cinebench R11.5 OpenGL 64 Bit +
Cinebench R11.5 - Cinebench R11.5 OpenGL 64 Bit
min: 16.4     avg: 17.8     median: 16.6 (6%)     max: 20.39 fps
Cinebench R15
Cinebench R15 OpenGL 64 Bit +
Cinebench R15 - Cinebench R15 OpenGL 64 Bit
min: 19.66     avg: 22.3     median: 23 (1%)     max: 23.42 fps
Cinebench R15 OpenGL Ref. Match 64 Bit +
Cinebench R15 - Cinebench R15 OpenGL Ref. Match 64 Bit
98 % (98%)
GFXBench - GFXBench Car Chase Offscreen
15.6 fps (2%)
GFXBench 3.1 - GFXBench Manhattan ES 3.1 Offscreen
20.4 fps (0%)
GFXBench 3.0 - GFXBench 3.0 Manhattan Offscreen
21.8 fps (1%)
GFXBench (DX / GLBenchmark) 2.7
GFXBench T-Rex HD Offscreen C24Z16 +
GFXBench (DX / GLBenchmark) 2.7 - GFXBench T-Rex HD Offscreen C24Z16
67.8 fps (1%)
LuxMark v2.0 64Bit - LuxMark v2.0 Room GPU
92 Samples/s (0%)
LuxMark v2.0 64Bit - LuxMark v2.0 Sala GPU
124 Samples/s (0%)
ComputeMark v2.1 - ComputeMark v2.1 Result
min: 458     avg: 597     median: 597 (1%)     max: 736 points
- Range of benchmark values for this graphics card
- Average benchmark values for this graphics card
* Smaller numbers mean a higher performance

Game Benchmarks

The following benchmarks stem from our benchmarks of review laptops. The performance depends on the used graphics memory, clock rate, processor, system settings, drivers, and operating systems. So the results don't have to be representative for all laptops with this GPU. For detailed information on the benchmark results, click on the fps number.

low 1280x720
30.9  fps    + Compare
med. 1920x1080
9.9  fps    + Compare
» The benchmarks indicate that the game is not playable in the tested settings.
low 1280x720
6  fps    + Compare
med. 1920x1080
2  fps    + Compare
» The benchmarks indicate that the game is not playable in the tested settings.
low 1280x720
8.4  fps    + Compare
med. 1920x1080
4.3  fps    + Compare
» The benchmarks indicate that the game is not playable in the tested settings.
low 1280x720
15.4  fps    + Compare
med. 1920x1080
7  fps    + Compare
» The benchmarks indicate that the game is not playable in the tested settings.
low 1280x720
12.3  fps    + Compare
med. 1920x1080
7  fps    + Compare
» The benchmarks indicate that the game is not playable in the tested settings.
low 1280x720
22.5  fps    + Compare
med. 1920x1080
11.8  fps    + Compare
» The benchmarks indicate that the game is not playable in the tested settings.
low 1280x720
39  fps    + Compare
med. 1920x1080
14  fps    + Compare
» With all tested laptops playable in detail settings low.
Hitman 2

Hitman 2

2018
low 1280x720
7.4  fps    + Compare
med. 1920x1080
3.5  fps    + Compare
» The benchmarks indicate that the game is not playable in the tested settings.
low 1280x720
10  fps    + Compare
med. 1920x1080
4  fps    + Compare
» The benchmarks indicate that the game is not playable in the tested settings.
low 1280x720
13  fps    + Compare
med. 1920x1080
5  fps    + Compare
» The benchmarks indicate that the game is not playable in the tested settings.
low 1280x720
13  fps    + Compare
med. 1920x1080
4  fps    + Compare
» The benchmarks indicate that the game is not playable in the tested settings.
F1 2018

F1 2018

2018
low 1280x720
12  fps    + Compare
med. 1920x1080
12  fps    + Compare
» The benchmarks indicate that the game is not playable in the tested settings.
low 1280x720
4  fps    + Compare
med. 1920x1080
1  fps    + Compare
» The benchmarks indicate that the game is not playable in the tested settings.
Far Cry 5

Far Cry 5

2018
low 1280x720
4  fps    + Compare
med. 1920x1080
1  fps    + Compare
» The benchmarks indicate that the game is not playable in the tested settings.
low 1280x720
13.7  fps    + Compare
med. 1920x1080
9.4  fps    + Compare
» The benchmarks indicate that the game is not playable in the tested settings.
low 1280x720
7.5  fps    + Compare
med. 1920x1080
3  fps    + Compare
» The benchmarks indicate that the game is not playable in the tested settings.
low 1280x720
8.1  fps    + Compare
med. 1920x1080
4.3  fps    + Compare
» The benchmarks indicate that the game is not playable in the tested settings.
Fortnite

Fortnite

2018
low 1280x720
28  fps    + Compare
med. 1920x1080
7  fps    + Compare
» The benchmarks indicate that the game is not playable in the tested settings.
Destiny 2

Destiny 2

2017
low 1280x720
10  fps    + Compare
» The benchmarks indicate that the game is not playable in the tested settings.
ELEX

ELEX

2017
low 1280x720
6  fps    + Compare
» The benchmarks indicate that the game is not playable in the tested settings.
low 1280x720
6  fps    + Compare
» The benchmarks indicate that the game is not playable in the tested settings.
low 1280x720
8  fps    + Compare
» The benchmarks indicate that the game is not playable in the tested settings.
FIFA 18

FIFA 18

2017
low 1280x720
42.6  fps    + Compare
med. 1920x1080
19.4  fps    + Compare
» With all tested laptops playable in detail settings low.
low 1280x720
15  fps    + Compare
med. 1920x1080
6.2  fps    + Compare
» The benchmarks indicate that the game is not playable in the tested settings.
F1 2017

F1 2017

2017
low 1280x720
18  fps    + Compare
med. 1920x1080
13  fps    + Compare
high 1920x1080
10  fps    + Compare
» The benchmarks indicate that the game is not playable in the tested settings.
low 1280x720
12.1  fps    + Compare
» The benchmarks indicate that the game is not playable in the tested settings.
low 1280x720
35.2  fps    + Compare
med. 1366x768
32.8  fps    + Compare
» With all tested laptops playable in detail settings low.
Dirt 4

Dirt 4

2017
low 1280x720
32.8  fps    + Compare
» The benchmarks indicate that the game is not playable in the tested settings.
low 1280x720
41.4 47.8 ~ 45 fps    + Compare
med. 1920x1080
19.9 25.6 ~ 23 fps    + Compare
high 1920x1080
16.3  fps    + Compare
» With all tested laptops playable in detail settings low.
Prey

Prey

2017
low 1280x720
21.5  fps    + Compare
» The benchmarks indicate that the game is not playable in the tested settings.
low 1280x720
12.2  fps    + Compare
» The benchmarks indicate that the game is not playable in the tested settings.
low 1280x720
10.9  fps    + Compare
med. 1920x1080
5.2  fps    + Compare
» The benchmarks indicate that the game is not playable in the tested settings.
For Honor

For Honor

2017
low 1280x720
19.9  fps    + Compare
med. 1920x1080
7.3  fps    + Compare
» The benchmarks indicate that the game is not playable in the tested settings.
Additional Benchmarks
Medium Preset 4xAF TAA 1366x768
11.9
low 1280x720
28.6  fps    + Compare
med. 1920x1080
13.2  fps    + Compare
» The benchmarks indicate that the game is not playable in the tested settings.
Additional Benchmarks
Medium / Off FXAA 1366x768
17.1
low 1280x720
53.4  fps    + Compare
med. 1366x768
36.1  fps    + Compare
» With all tested laptops playable in detail settings med..
low 1024x768
29.4  fps    + Compare
med. 1366x768
12.1  fps    + Compare
» The benchmarks indicate that the game is not playable in the tested settings.
Overwatch

Overwatch

2016
low 1280x720
30.4  fps    + Compare
med. 1366x768
24.6  fps    + Compare
» The benchmarks indicate that the game is not playable in the tested settings.
low 1280x768
7  fps    + Compare
» The benchmarks indicate that the game is not playable in the tested settings.
low 1280x720
4  fps    + Compare
med. 1366x768
2  fps    + Compare
» The benchmarks indicate that the game is not playable in the tested settings.
low 1280x720
18.2  fps    + Compare
med. 1366x768
11.3  fps    + Compare
» The benchmarks indicate that the game is not playable in the tested settings.
low 1024x768
14 16.1 ~ 15 fps    + Compare
med. 1366x768
8 10.4 ~ 9 fps    + Compare
» The benchmarks indicate that the game is not playable in the tested settings.
low 1024x768
26.9  fps    + Compare
med. 1366x768
21.6  fps    + Compare
» The benchmarks indicate that the game is not playable in the tested settings.
low 1366x768
37.7  fps    + Compare
med. 1366x768
28.8  fps    + Compare
» With all tested laptops playable in detail settings low.
low 1024x768
34.1  fps    + Compare
med. 1366x768
24.9  fps    + Compare
» The benchmarks indicate that the game is not playable in the tested settings.
low 1280x720
33.1 35.2 ~ 34 fps    + Compare
med. 1366x768
19.2 23.2 ~ 21 fps    + Compare
» The benchmarks indicate that the game is not playable in the tested settings.
low 1280x720
8  fps    + Compare
med. 1366x768
5  fps    + Compare
» The benchmarks indicate that the game is not playable in the tested settings.
low 1024x768
9  fps    + Compare + 📈 Graph
» The benchmarks indicate that the game is not playable in the tested settings.
low 1024x768
59.7  fps    + Compare
med. 1366x768
22  fps    + Compare
» With all tested laptops playable in detail settings low.
low 1024x768
19.3  fps    + Compare
med. 1366x768
14.8  fps    + Compare
» The benchmarks indicate that the game is not playable in the tested settings.
low 1024x768
12  fps    + Compare
» The benchmarks indicate that the game is not playable in the tested settings.
F1 2014

F1 2014

2014
low 1024x768
39  fps    + Compare
med. 1366x768
30  fps    + Compare
» With all tested laptops playable in detail settings low.
low 1024x768
27  fps    + Compare
med. 1366x768
17  fps    + Compare
» The benchmarks indicate that the game is not playable in the tested settings.
low 1280x720
16 22.3 ~ 19 fps    + Compare
med. 1344x756
11 13.8 ~ 12 fps    + Compare
» The benchmarks indicate that the game is not playable in the tested settings.
Sims 4

Sims 4

2014
low 1024x768
111.9  fps    + Compare
med. 1366x768
34.3  fps    + Compare
» With all tested laptops playable in detail settings low.
low 1024x768
20.9  fps    + Compare
med. 1366x768
12.9  fps    + Compare
» The benchmarks indicate that the game is not playable in the tested settings.
low 1024x768
65.1  fps    + Compare
med. 1366x768
29.7  fps    + Compare
» With all tested laptops playable in detail settings low.
low 1024x768
31.7  fps    + Compare
med. 1366x768
17.7  fps    + Compare
high 1366x768
9.6  fps    + Compare
» The benchmarks indicate that the game is not playable in the tested settings.
low 1024x768
44  fps    + Compare
med. 1366x768
26  fps    + Compare
high 1366x768
14  fps    + Compare
» With all tested laptops playable in detail settings low.
low 1024x768
13  fps    + Compare
med. 1366x768
10  fps    + Compare
high 1366x768
5  fps    + Compare
» The benchmarks indicate that the game is not playable in the tested settings.
GRID 2

GRID 2

2013
low 1024x768
52.9  fps    + Compare
med. 1366x768
31.8  fps    + Compare
high 1366x768
26  fps    + Compare
ultra 1920x1080
12.5  fps    + Compare
» With all tested laptops playable in detail settings low.
low 1024x768
13  fps    + Compare
med. 1366x768
10  fps    + Compare
high 1366x768
6  fps    + Compare
» The benchmarks indicate that the game is not playable in the tested settings.
low 1280x720
38 43.4 43.5 47.3 ~ 43 fps    + Compare
med. 1366x768
0 (!) 22 26.9 28 ~ 19 fps    + Compare
high 1366x768
0 (!) 18 22.2 23 ~ 16 fps    + Compare
ultra 1920x1080
0 (!) 7.5 ~ 4 fps    + Compare
» With all tested laptops playable in detail settings low.
low 1024x768
51.9  fps    + Compare
med. 1366x768
25.7  fps    + Compare
high 1366x768
18.2  fps    + Compare
» With all tested laptops playable in detail settings low.
low 1024x768
63.9  fps    + Compare
med. 1366x768
31  fps    + Compare
high 1366x768
26.6  fps    + Compare
» With all tested laptops playable in detail settings low.
low 1024x768
39.2  fps    + Compare
med. 1366x768
28.5  fps    + Compare
high 1366x768
25  fps    + Compare
» With all tested laptops playable in detail settings low.
low 1024x768
59.6  fps    + Compare
med. 1366x768
41.8  fps    + Compare
high 1366x768
33.6  fps    + Compare
» With all tested laptops playable in detail settings med..
low 1280x720
32.7  fps    + Compare
med. 1366x768
22.2  fps    + Compare
high 1366x768
15.4  fps    + Compare
» The benchmarks indicate that the game is not playable in the tested settings.
low 1024x768
35  fps    + Compare
med. 1366x768
27  fps    + Compare
high 1366x768
13  fps    + Compare
» The benchmarks indicate that the game is not playable in the tested settings.
low 1024x768
62.4  fps    + Compare
high 1366x768
29  fps    + Compare
» With all tested laptops playable in detail settings low.
Mafia 2

Mafia 2

2010
low 800x600
26  fps    + Compare
med. 1024x768
21  fps    + Compare
high 1360x768
17  fps    + Compare
» The benchmarks indicate that the game is not playable in the tested settings.
low 1024x768
81.4  fps    + Compare
med. 1360x768
24.3  fps    + Compare
high 1360x768
18.6  fps    + Compare
ultra 1920x1080
12.4  fps    + Compare
» With all tested laptops playable in detail settings low.
World of Warcraft

World of Warcraft

2005
low 800x600
82.6  fps    + Compare
med. 1024x768
43.7  fps    + Compare
» With all tested laptops playable in detail settings med..
lowmed.highultraQHD4K
Dirt Rally 2.030.99.9
Far Cry New Dawn62
Metro Exodus8.44.3
Apex Legends15.47
Just Cause 412.37
Darksiders III22.511.8
Farming Simulator 193914
Hitman 27.43.5
Assassin´s Creed Odyssey104
Forza Horizon 4135
Shadow of the Tomb Raider134
F1 20181212
Monster Hunter World41
Far Cry 541
X-Plane 11.1113.79.4
Kingdom Come: Deliverance7.53
Final Fantasy XV Benchmark8.14.3
Fortnite287
Destiny 210
ELEX6
The Evil Within 26
Middle-earth: Shadow of War8
FIFA 1842.619.4
Ark Survival Evolved156.2
F1 2017181310
Playerunknown's Battlegrounds (PUBG)12.1
Team Fortress 235.232.8
Dirt 432.8
Rocket League452316.3
Prey21.5
Mass Effect Andromeda12.2
Ghost Recon Wildlands10.95.2
For Honor19.97.3
Resident Evil 728.613.2
Farming Simulator 1753.436.1
Civilization VI29.412.1
Overwatch30.424.6
Ashes of the Singularity7
Hitman 201642
The Division18.211.3
Rise of the Tomb Raider159
Rainbow Six Siege26.921.6
World of Warships37.728.8
Metal Gear Solid V34.124.9
Dota 2 Reborn3421
Batman: Arkham Knight85
The Witcher 39
Dirt Rally59.722
Dragon Age: Inquisition19.314.8
Call of Duty: Advanced Warfare12
F1 20143930
Alien: Isolation2717
Middle-earth: Shadow of Mordor1912
Sims 4111.934.3
Risen 3: Titan Lords20.912.9
GRID: Autosport65.129.7
X-Plane 10.2531.717.79.6
Batman: Arkham Origins442614
Company of Heroes 213105
GRID 252.931.82612.5
Metro: Last Light13106
BioShock Infinite4319164
Tomb Raider51.925.718.2
Dead Space 363.93126.6
Counter-Strike: GO39.228.525
Diablo III59.641.833.6
The Elder Scrolls V: Skyrim32.722.215.4
Batman: Arkham City352713
Deus Ex Human Revolution62.429
Mafia 2262117
StarCraft 281.424.318.612.4
World of Warcraft82.643.7
< 30 fps
< 60 fps
< 120 fps
≥ 120 fps
44
22
6
52
8

16
1

3


For more games that might be playable and a list of all games and graphics cards visit our Gaming List

v1.26
log 24. 16:56:07

#0 no ids found in url (should be separated by "_") +0s ... 0s

#1 not redirecting to Ajax server +0s ... 0s

#2 did not recreate cache, as it is less than 5 days old! Created at Mon, 22 Apr 2024 05:40:21 +0200 +0.001s ... 0.001s

#3 no comparison url found in template nbc.compare_page_1 needed +0.04s ... 0.041s

#4 no comparison url found in template nbc.compare_page_1 needed +0s ... 0.041s

#5 no comparison url found in template nbc.compare_page_1 needed +0s ... 0.041s

#6 no comparison url found in template nbc.compare_page_1 needed +0s ... 0.041s

#7 composed specs +0s ... 0.041s

#8 did output specs +0s ... 0.041s

#9 start showIntegratedCPUs +0s ... 0.041s

#10 getting avg benchmarks for device 7447 +0.034s ... 0.075s

#11 got single benchmarks 7447 +0.031s ... 0.106s

#12 got avg benchmarks for devices +0s ... 0.106s

#13 min, max, avg, median took s +0.642s ... 0.747s

#14 before gaming benchmark output +0s ... 0.747s

#15 Got 170 rows for game benchmarks. +0.014s ... 0.761s

#16 composed SQL query for gamebenchmarks +0s ... 0.761s

#17 got data and put it in $dataArray +0.059s ... 0.82s

#18 benchmarks composed for output. +1.451s ... 2.271s

#19 no comparison url found in template nbc.compare_page_1 needed +0.004s ... 2.275s

#20 return log +0s ... 2.275s

Notebook reviews with AMD Radeon R5 (Stoney Ridge) graphics card

惠普 15-BW077AX (A9-9420, Radeon R5) 笔记本电脑简短评测

惠普 15-BW077AX (A9-9420, Radeon R5) 笔记本电脑简短评测

迟缓而坚固。 惠普15-BW077AX是一台来自惠普的搭配AMD最新A9处理器的入门级笔记本电脑。尽管它年纪轻轻,但这块处理器让我们感觉落后于竞争对手数年之久,整个笔记本电脑能够给用户带来的功能也十分有限。...
AMD A9-9420 | AMD Radeon R5 (Stoney Ridge) | 15.60" | 1.9 kg
联想 Yoga 510-14AST (A9-9410, HD) 变形本简短评测

联想 Yoga 510-14AST (A9-9410, HD) 变形本简短评测

令人失望的屏幕。 联想的14寸变形本售价约为500欧元(约合533美元)。买家将会得到Stoney Ridge APU以及固态硬盘,4GB运行内存。因为一块可视角度欠佳的TN屏幕,使得联想留下的好印象全毁了。...
AMD A9-9410 | AMD Radeon R5 (Stoney Ridge) | 14.00" | 1.8 kg

Lenovo Chromebook 3 11, A6-9220C: AMD A6-9220C, 11.60", 1.1 kg
  External Review » Lenovo Chromebook 3 11, A6-9220C

HP 14-BW017AU : AMD A9-9420, 14.00", 1.9 kg
  External Review » HP 14-BW017AU

Asus K543BA-GQ749: AMD A9-9425, 15.60", 2 kg
  External Review » Asus K543BA-GQ749

HP 14-dk0013ns: AMD A9-9425, 14.00", 1.5 kg
  External Review » HP 14-dk0013ns

Lenovo Ideapad S145-14AST-81ST002BMH: AMD A9-9425, 14.00", 1.6 kg
  External Review » Lenovo Ideapad S145-14AST-81ST002BMH

HP 15-DB0109N: AMD A9-9425, 15.60", 1.8 kg
  External Review » HP 15-DB0109N

Dell Inspiron 11 3195 2-in-1: AMD A9-9420e, 11.60", 1.2 kg
  External Review » Dell Inspiron 11 3195 2-in-1

HP 14-cm0002ns: AMD A9-9425, 14.00", 1.5 kg
  External Review » HP 14-cm0002ns

Lenovo 14w (no touch): AMD A6-9220C, 14.00", 1.5 kg
  External Review » Lenovo 14w (no touch)

Lenovo Ideapad 320-15AST-80XV00V2SP: AMD A9-9420, 15.60", 2.2 kg
  External Review » Lenovo Ideapad 320-15AST-80XV00V2SP

Lenovo Ideapad 320-15AST-80XV00V4SP: AMD A9-9420, 15.60", 2.2 kg
  External Review » Lenovo Ideapad 320-15AST-80XV00V4SP

Lenovo Ideapad 320-15AST-80XV0100SP: AMD A9-9420, 15.60", 2.2 kg
  External Review » Lenovo Ideapad 320-15AST-80XV0100SP

Lenovo Ideapad 320-15AST-80XV00V3SP: AMD A9-9420, 15.60", 2.2 kg
  External Review » Lenovo Ideapad 320-15AST-80XV00V3SP

Lenovo Yoga 510-14AST: AMD A9-9410, 14.00", 1.8 kg
  External Review » Lenovo Yoga 510-14AST

HP 15-bw077ax: AMD A9-9420, 15.60", 1.9 kg
  External Review » HP 15-bw077ax

Dell Inspiron 15 3565-7923: AMD A9-9410, 15.60", 2.3 kg
  External Review » Dell Inspiron 15 3565-7923

HP 15-ba110ur: AMD A9-9410, 15.60", 2 kg
  External Review » HP 15-ba110ur

HP Envy x360 15-ar002na: AMD A9-9410, 15.60", 2 kg
  External Review » HP Envy x360 15-ar002na

Please share our article, every link counts!

» Comparison of GPUs
Detailed list of all laptop GPUs sorted by class and performance.

» Benchmark List
Sort and restrict laptop GPUs based on performance in synthetic benchmarks.

» Notebook Gaming List
Playable games for each graphics card and their average FPS results.

Class 1

GeForce RTX 2080 Super Mobile

Class 2

M1 Max 32-Core GPU *
GeForce RTX 2070 Super Mobile
M1 Max 24-Core GPU *
Quadro RTX 5000 Max-Q
Radeon RX 5700M *
GeForce GTX 1080 Mobile
Quadro RTX 4000 (Laptop)
M1 Pro 16-Core GPU *
Radeon PRO W6600M *
GeForce RTX 2070 Super Max-Q
Quadro RTX 4000 Max-Q *
M1 Pro 14-Core GPU *
Quadro P5200
Quadro RTX 3000 Max-Q *
Quadro P4200
Quadro P5000 Max-Q *
GeForce GTX 980 (Laptop)
Quadro P4000
Quadro P4000 Max-Q
Quadro P3200
Radeon RX 580X (Laptop) *
Radeon RX 580 (Laptop)
Radeon Pro 5300M
Radeon RX 5300M
Quadro P3000 Max-Q *
Quadro T2000 Max-Q *
Radeon Pro WX 7100 *
Radeon RX 570X (Laptop) *
Radeon RX 570 (Laptop) *
Radeon RX 470 (Laptop) *
Quadro T1000 Max-Q *

Class 3

Vega M GH
Quadro M5000M
GeForce GTX 1050 Ti Mobile
Radeon 680M
Quadro P2000
Quadro P2000 Max-Q
Quadro M4000M
T500 Laptop GPU *
Radeon R9 M395X
GeForce GTX 1050 Ti Max-Q *
Radeon Pro Vega 16
WX Vega M GL
Radeon R9 M485X
Quadro M3000M
FirePro W7170M
Radeon R9 M395
GeForce GTX 1050 Max-Q *
Radeon 660M
Radeon Pro WX 4150 *
Radeon RX 560X (Laptop)
Radeon RX 560 (Laptop)
Radeon RX 460 (Laptop)
Quadro P1000
Radeon R9 M390
Xe MAX
Radeon Pro 560X
Radeon Pro 560
Radeon Pro 460
Radeon Pro WX 4130 *
GeForce GTX 960M
Quadro P620 *
Radeon RX 550X (Laptop)
Radeon Pro WX 3200 *
Radeon Pro 555X
Radeon Pro 555
Radeon Pro 455
Quadro P600
Quadro M2000M
Radeon RX 540X *
Radeon Pro WX 2100 *
Radeon Pro WX 3100 *
GeForce GTX 950M
Radeon Pro 450
Radeon 630
Radeon 540X *
Radeon R9 M385X
Quadro P520
Quadro M1000M
GeForce 945M
Quadro P500 *
Iris Plus Graphics G7 (Ice Lake 64 EU) *
Vega 10 *
Iris Pro Graphics 580
FirePro W5170M *
Radeon R9 M370X
Vega 9
FirePro W5130M
UHD Graphics Xe G4 48EUs *
UHD Graphics 32EUs
UHD Graphics Xe 32EUs (Tiger Lake-H) *
UHD Graphics 750
Vega 7
Radeon R7 M465
Iris Pro Graphics 6200
Vega 8
GeForce 940M
Iris Plus Graphics G4 (Ice Lake 48 EU)
Quadro M600M
FirePro W4190M
Radeon R9 M375
Radeon R7 M445
Iris Plus Graphics 650
Iris Graphics 550
Radeon 625
Vega 6 *
Iris Plus Graphics 640
Iris Graphics 540
UHD Graphics 24EUs (Alder Lake-N) *
Radeon R7 M360
GeForce 920M
Radeon 620
Radeon R7 M340
Radeon 610
Radeon 610M *
Vega 6 *
UHD Graphics G1 (Ice Lake 32 EU)
UHD Graphics Xe 16EUs (Tiger Lake-H) *
HD Graphics 530
Radeon R5 (Bristol Ridge)
Adreno 690 *
Adreno 685 *
Adreno 680 *
Radeon R5 M330
GeForce 910M
HD Graphics 520

Class 4

UHD Graphics 730
Radeon R5 M320 *
Radeon R5 M315 *
Radeon R5 M420 *
Vega 2 *
UHD Graphics 617
UHD Graphics 615
HD Graphics 515
UHD Graphics 610
HD Graphics 510
UHD Graphics 605
Radeon R4 (Stoney Ridge)
Radeon R2 (Stoney Ridge)
HD Graphics (Broadwell)
UHD Graphics 600
HD Graphics (Braswell)

Class 5

* Approximate position of the graphics adapter