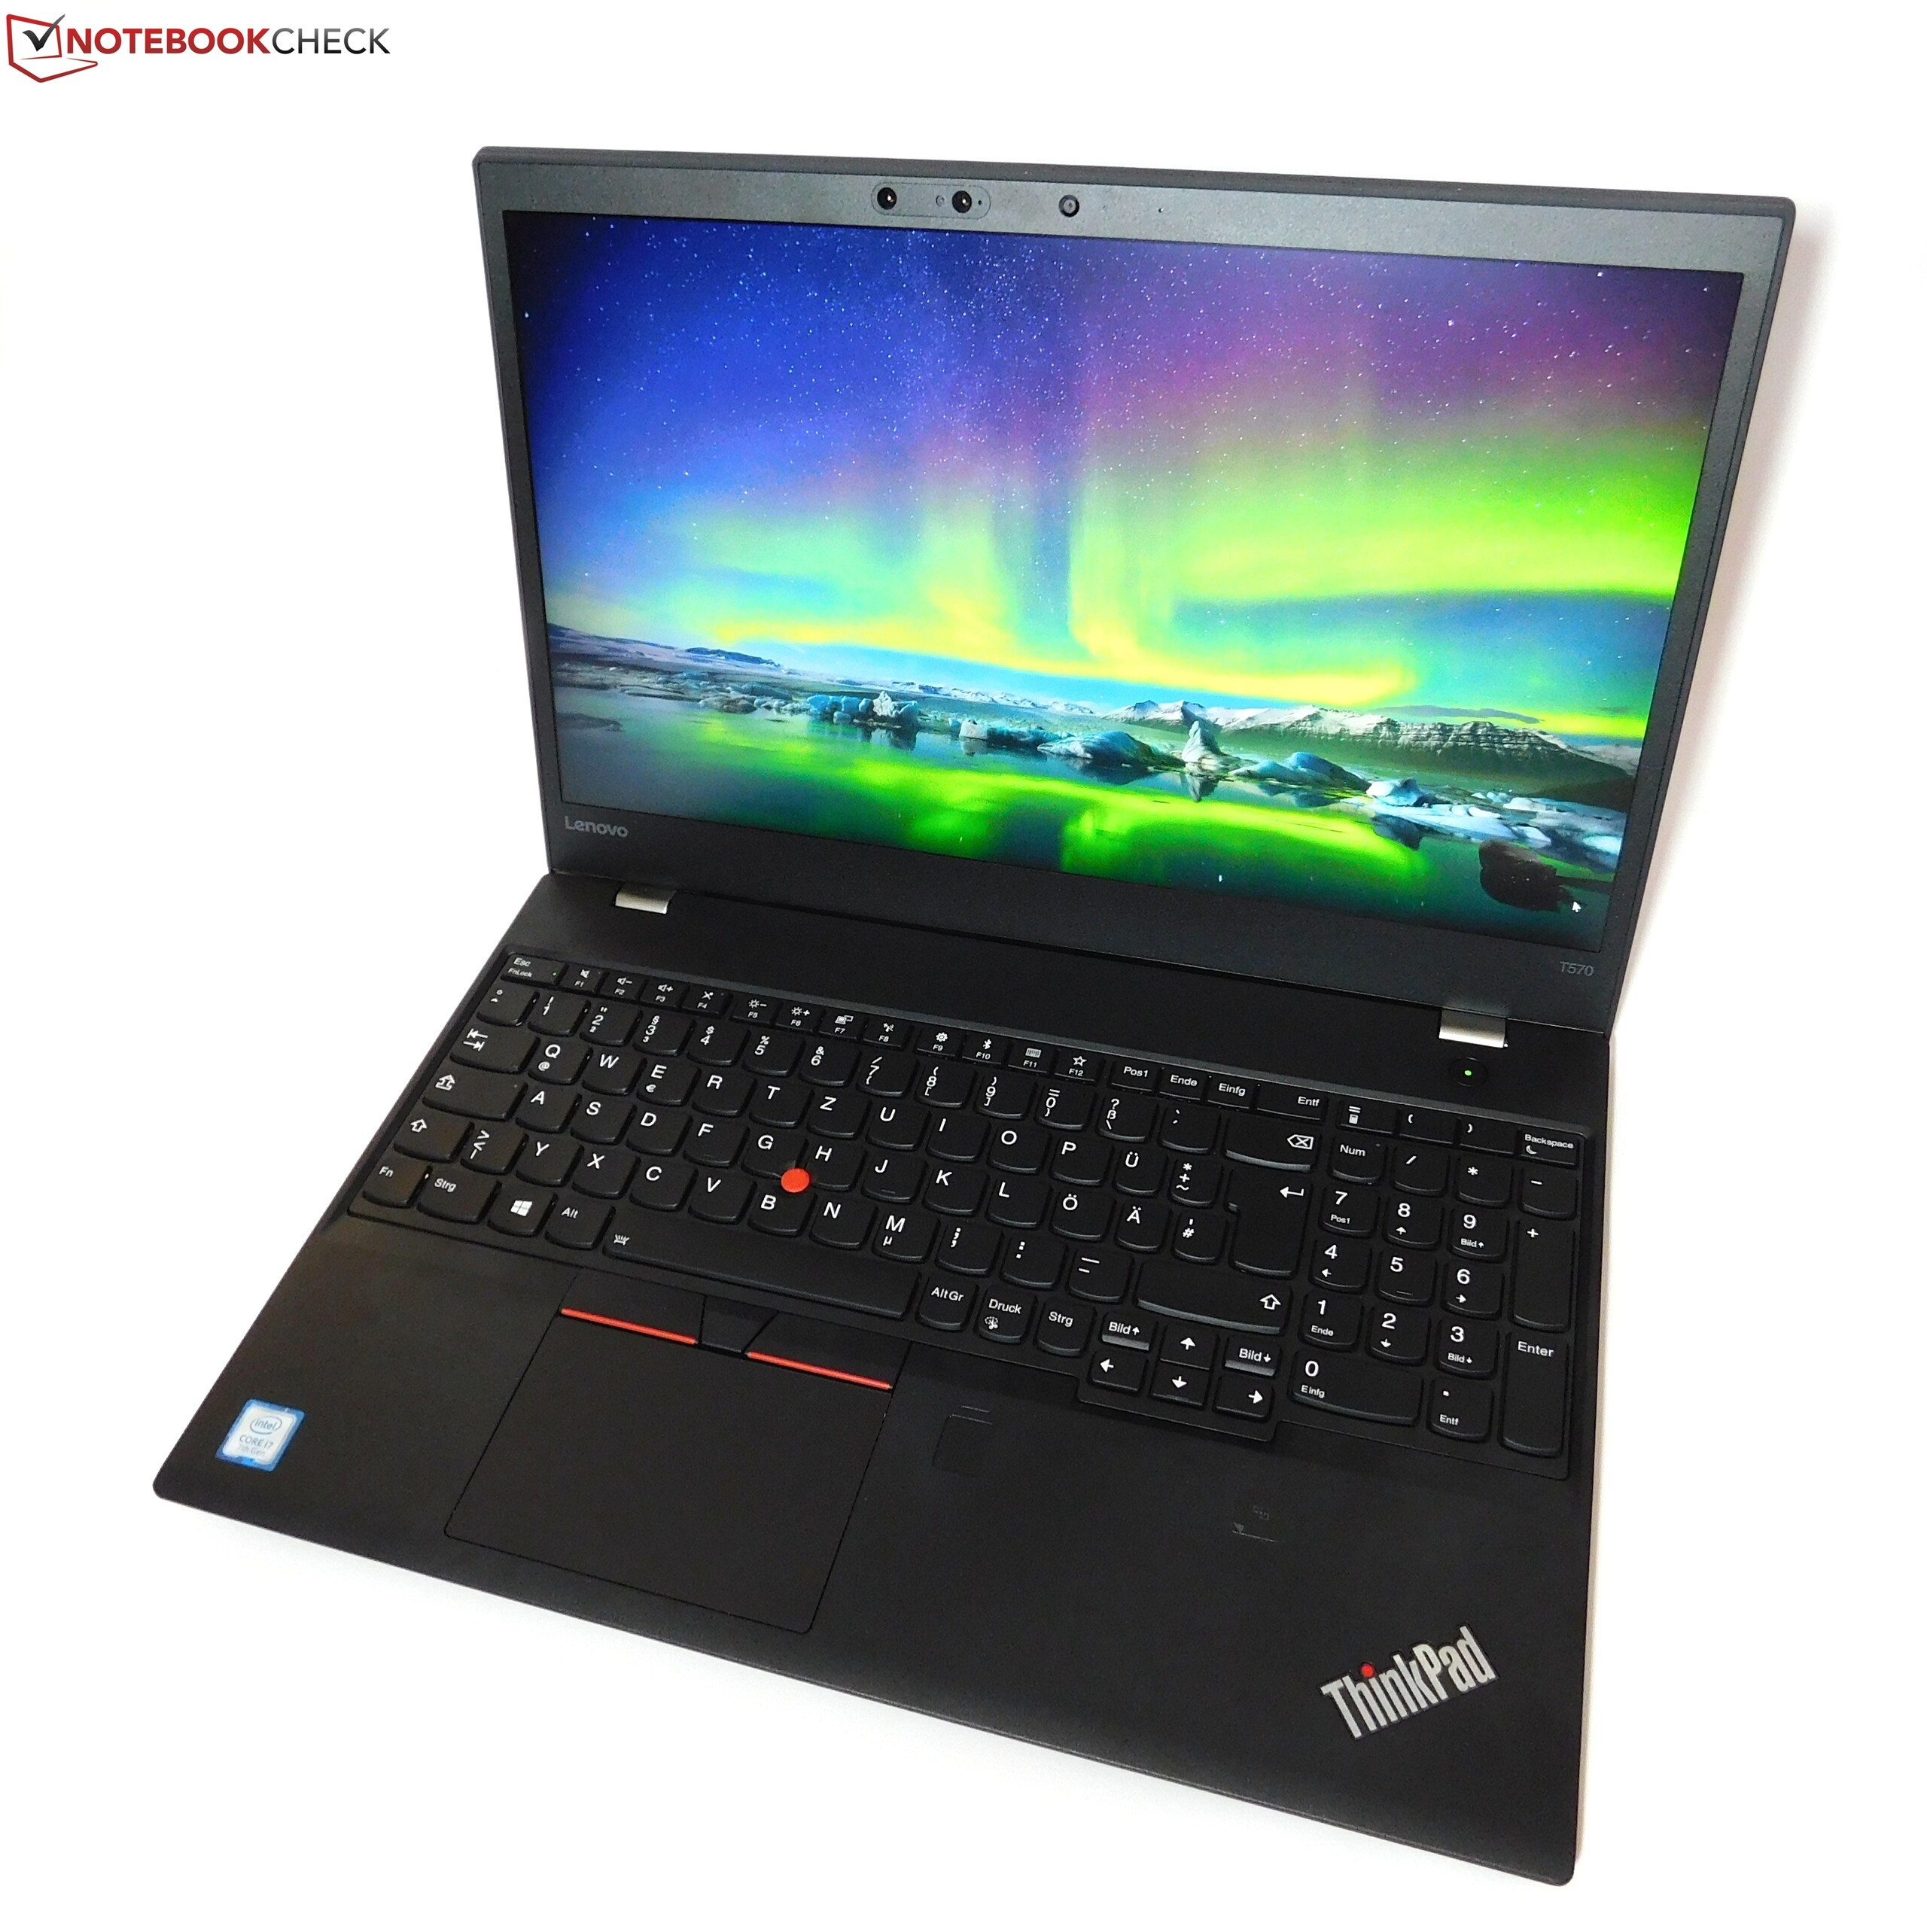
联想 ThinkPad T570 (Core i7, 4K, 940MX) 笔记本简短评测
| SD Card Reader | |
| average JPG Copy Test (av. of 3 runs) | |
| Lenovo ThinkPad T570-20HAS01E00 | |
| Fujitsu LifeBook U757 | |
| HP EliteBook 850 G4-Z2W86ET | |
| Dell XPS 15 2017 9560 (7300HQ, Full-HD) | |
| maximum AS SSD Seq Read Test (1GB) | |
| Dell XPS 15 2017 9560 (7300HQ, Full-HD) | |
| Lenovo ThinkPad T570-20HAS01E00 | |
| HP EliteBook 850 G4-Z2W86ET | |
| Fujitsu LifeBook U757 | |
| |||||||||||||||||||||||||
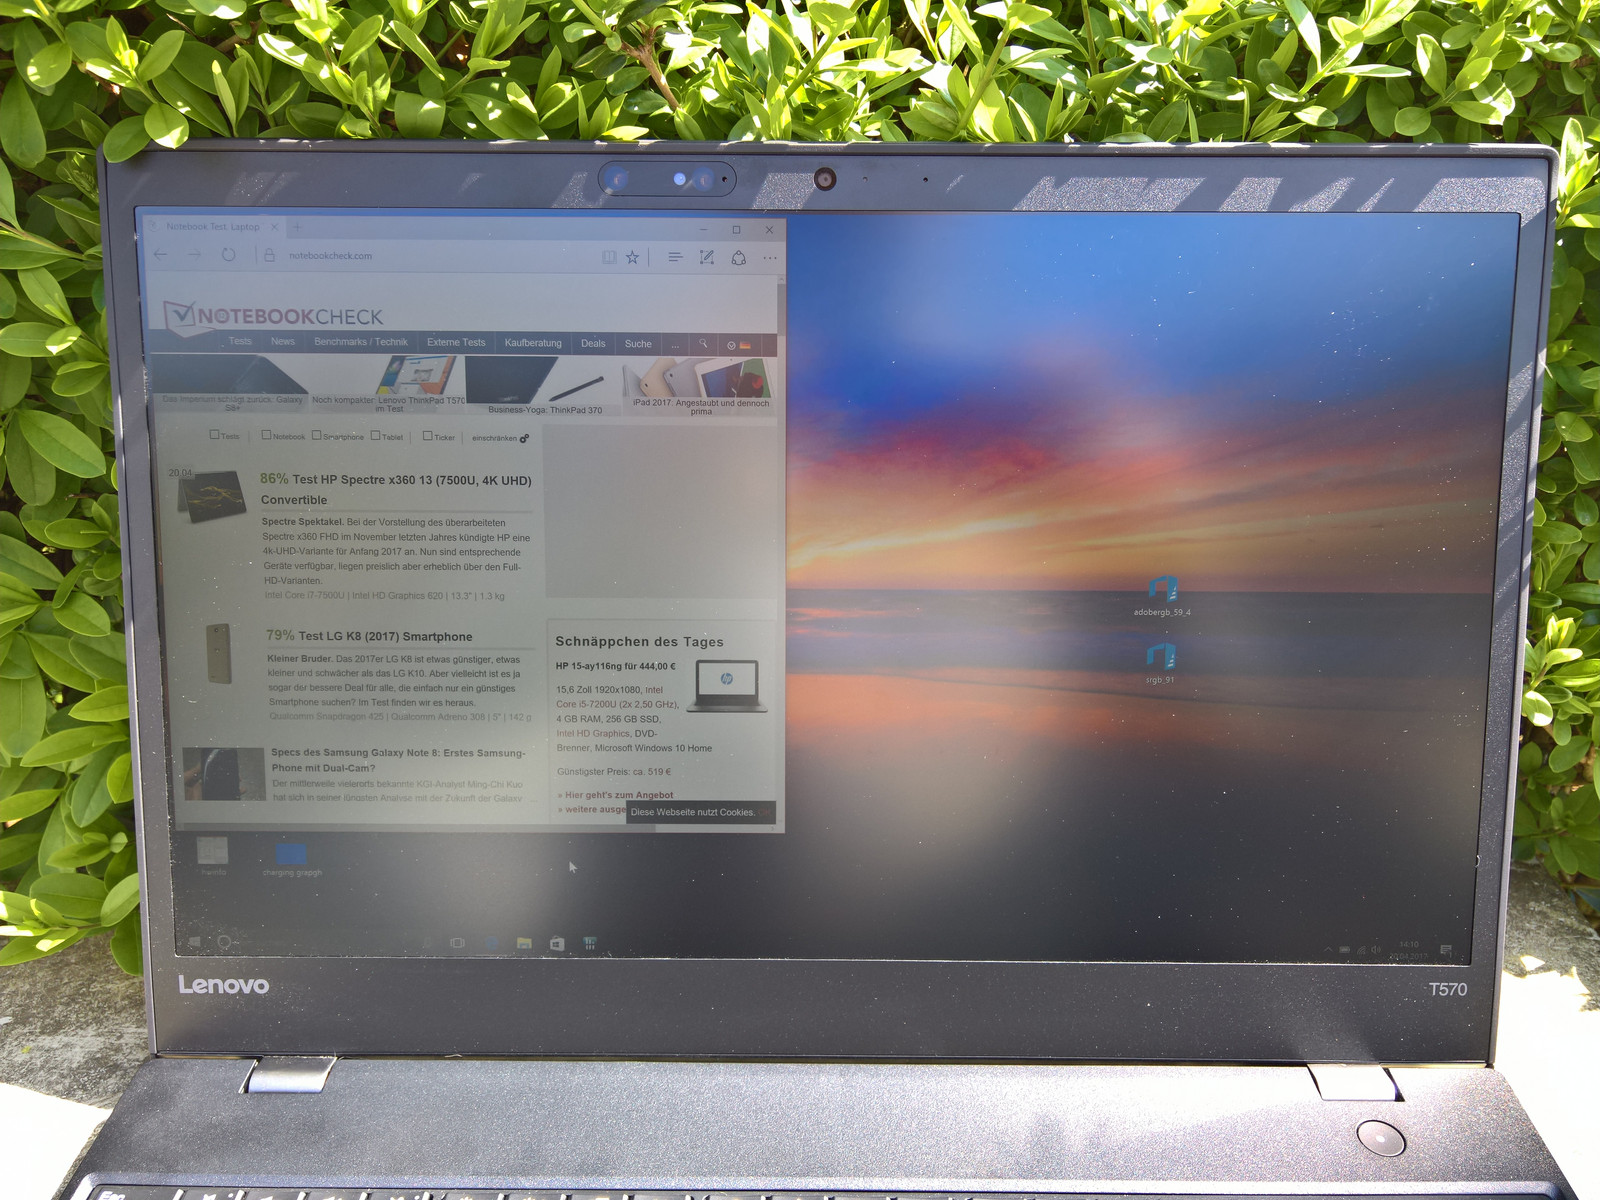
Brightness Distribution: 89 %
Center on Battery: 339 cd/m²
Contrast: 942:1 (Black: 0.36 cd/m²)
ΔE ColorChecker Calman: 4.2 | ∀{0.5-29.43 Ø4.71}
ΔE Greyscale Calman: 5.1 | ∀{0.09-98 Ø4.96}
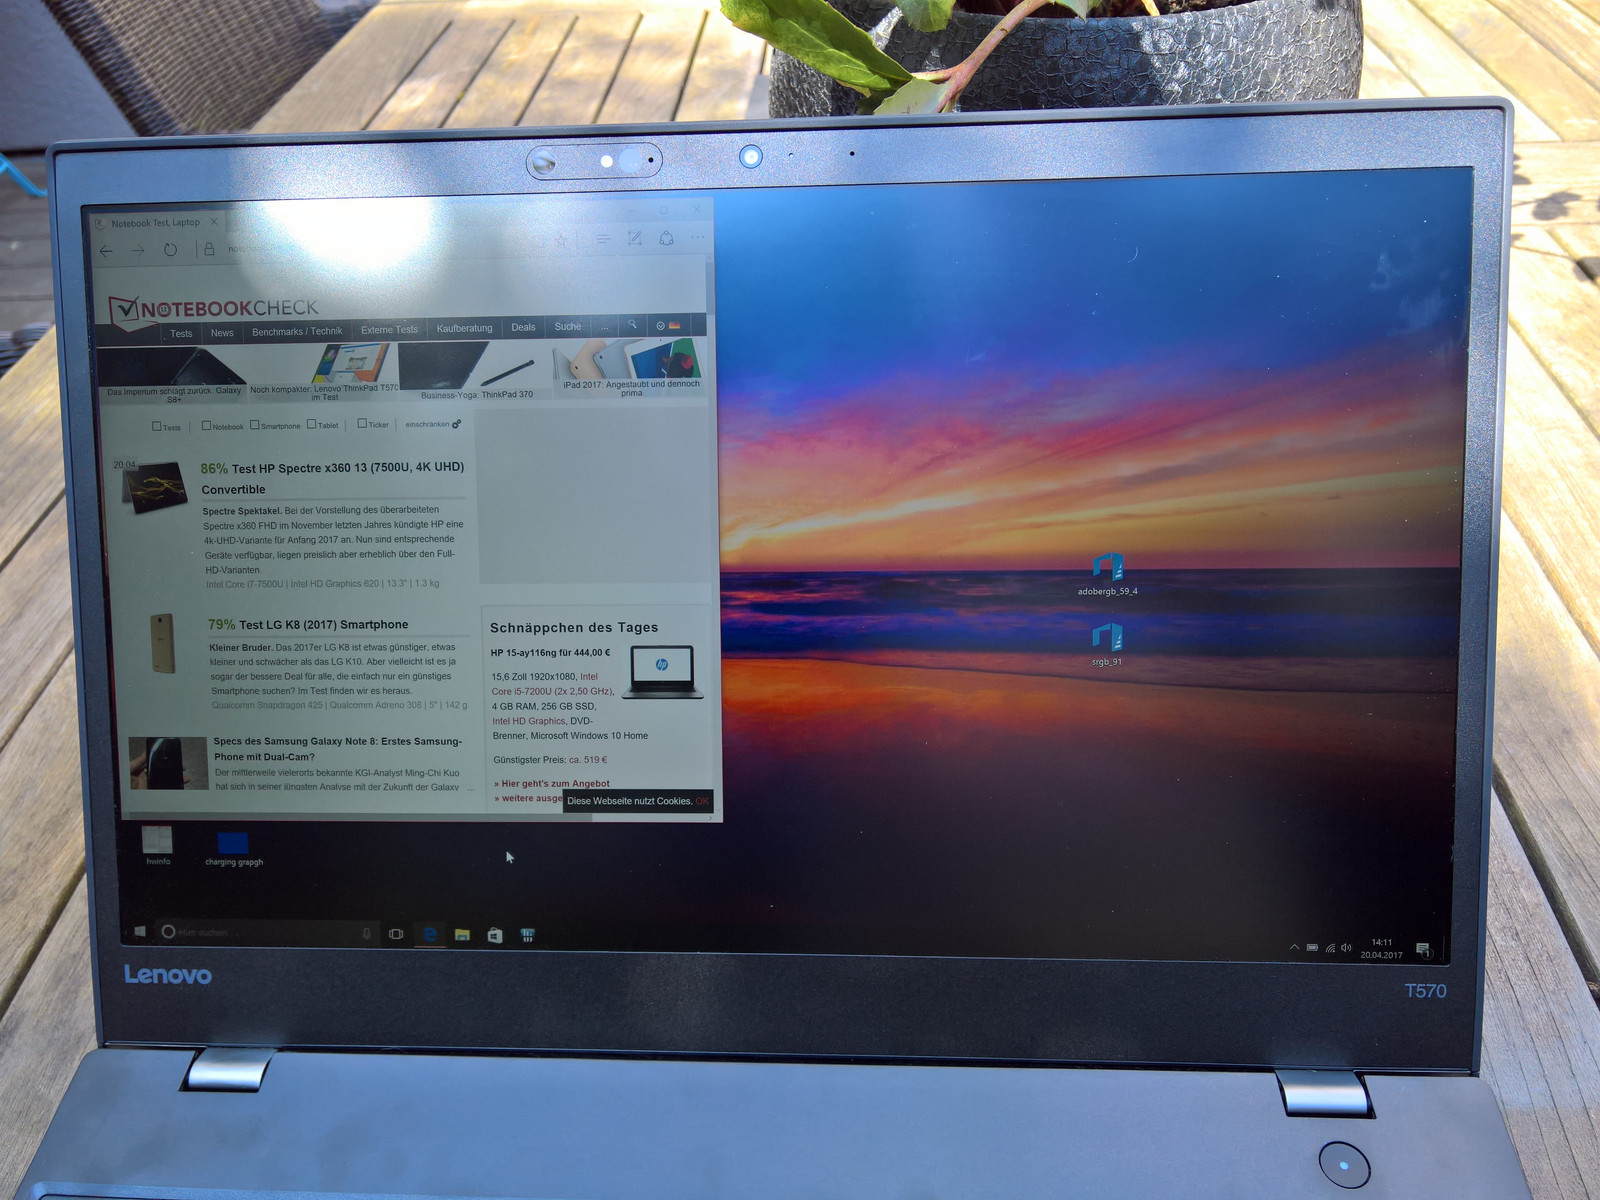
91% sRGB (Argyll 1.6.3 3D)
59.4% AdobeRGB 1998 (Argyll 1.6.3 3D)
66.7% AdobeRGB 1998 (Argyll 3D)
91.1% sRGB (Argyll 3D)
70% Display P3 (Argyll 3D)
Gamma: 2.16
CCT: 6569 K
Screen Flickering / PWM (Pulse-Width Modulation)
| Screen flickering / PWM detected | 926 Hz | ≤ 90 % brightness setting | 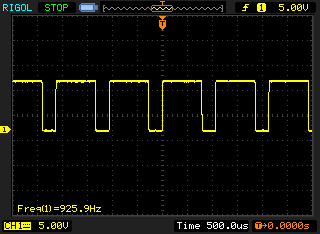 |
The display backlight flickers at 926 Hz (worst case, e.g., utilizing PWM) Flickering detected at a brightness setting of 90 % and below. There should be no flickering or PWM above this brightness setting. The frequency of 926 Hz is quite high, so most users sensitive to PWM should not notice any flickering. In comparison: 52 % of all tested devices do not use PWM to dim the display. If PWM was detected, an average of 7748 (minimum: 5 - maximum: 343500) Hz was measured. | |||
| Lenovo ThinkPad T570-20HAS01E00 BOE NV156QUM-N44, , 3840x2160, 15.6" | Lenovo ThinkPad T570-20H90002GE N156HCA-EAA, , 1920x1080, 15.6" | Lenovo ThinkPad T560-20FH002RGE Panasonic VVX16T028J00, , 2880x1620, 15.6" | HP EliteBook 850 G4-Z2W86ET AUO35ED, , 1920x1080, 15.6" | Fujitsu LifeBook U757 LP156WF6-SPP1, , 1920x1080, 15.6" | Apple MacBook Pro 15 2016 (2.6 GHz, 450) 2880x1800, 15.4" | Dell XPS 15 9560 (i7-7700HQ, UHD) 3840x2160, 15.6" | |
|---|---|---|---|---|---|---|---|
| Display | -32% | -5% | -13% | -7% | 29% | ||
| Display P3 Coverage (%) | 70 | 44.08 -37% | 64.4 -8% | 56.8 -19% | 65.8 -6% | 89.7 28% | |
| sRGB Coverage (%) | 91.1 | 65.6 -28% | 87.8 -4% | 83.7 -8% | 84.8 -7% | 100 10% | |
| AdobeRGB 1998 Coverage (%) | 66.7 | 45.66 -32% | 64.1 -4% | 58.7 -12% | 62 -7% | 100 50% | |
| Response Times | -19% | -13% | -7% | -31% | -60% | -98% | |
| Response Time Grey 50% / Grey 80% * (ms) | 41.6 ? | 41.6 ? -0% | 32.8 ? 21% | 47.2 ? -13% | 36 ? 13% | 47.3 ? -14% | 57.2 ? -38% |
| Response Time Black / White * (ms) | 15.2 ? | 20.8 ? -37% | 22.4 ? -47% | 15.2 ? -0% | 26.4 ? -74% | 31.2 ? -105% | 39.2 ? -158% |
| PWM Frequency (Hz) | 926 ? | 26040 ? | 220 ? | 199.2 ? | 117000 ? | 962 | |
| Screen | -6% | -11% | -65% | -1% | 45% | 4% | |
| Brightness middle (cd/m²) | 339 | 262 -23% | 339 0% | 338 0% | 313 -8% | 483 42% | 370.1 9% |
| Brightness (cd/m²) | 314 | 245 -22% | 322 3% | 341 9% | 294 -6% | 465 48% | 356 13% |
| Brightness Distribution (%) | 89 | 89 0% | 88 -1% | 90 1% | 84 -6% | 92 3% | 87 -2% |
| Black Level * (cd/m²) | 0.36 | 0.24 33% | 0.32 11% | 0.81 -125% | 0.27 25% | 0.33 8% | 0.37 -3% |
| Contrast (:1) | 942 | 1092 16% | 1059 12% | 417 -56% | 1159 23% | 1464 55% | 1000 6% |
| Colorchecker dE 2000 * | 4.2 | 4.5 -7% | 5.88 -40% | 10.9 -160% | 4.5 -7% | 1.4 67% | 5.3 -26% |
| Colorchecker dE 2000 max. * | 7.8 | 10.5 -35% | 11.08 -42% | 18.7 -140% | 10.5 -35% | 3 62% | 9.9 -27% |
| Greyscale dE 2000 * | 5.1 | 3.5 31% | 7.41 -45% | 13.3 -161% | 4 22% | 1.5 71% | 4.6 10% |
| Gamma | 2.16 102% | 2.32 95% | 2.36 93% | 2.11 104% | 2.24 98% | 2.34 94% | 2.31 95% |
| CCT | 6569 99% | 6524 100% | 6036 108% | 16030 41% | 6387 102% | 6650 98% | 6284 103% |
| Color Space (Percent of AdobeRGB 1998) (%) | 59.4 | 42.04 -29% | 57.14 -4% | 53.8 -9% | 55.3 -7% | 88.3 49% | |
| Color Space (Percent of sRGB) (%) | 91 | 65.4 -28% | 87.68 -4% | 83.4 -8% | 84.74 -7% | 100 10% | |
| Total Average (Program / Settings) | -19% /
-13% | -10% /
-10% | -28% /
-47% | -13% /
-6% | -8% /
24% | -22% /
-5% |
* ... smaller is better
Display Response Times
| ↔ Response Time Black to White | ||
|---|---|---|
| 15.2 ms ... rise ↗ and fall ↘ combined | ↗ 2 ms rise | 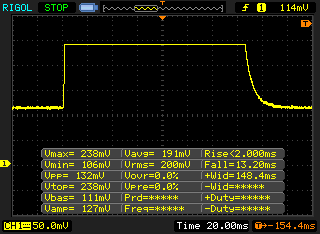 |
| ↘ 13.2 ms fall | ||
| The screen shows good response rates in our tests, but may be too slow for competitive gamers. In comparison, all tested devices range from 0.1 (minimum) to 240 (maximum) ms. » 37 % of all devices are better. This means that the measured response time is better than the average of all tested devices (19.8 ms). | ||
| ↔ Response Time 50% Grey to 80% Grey | ||
| 41.6 ms ... rise ↗ and fall ↘ combined | ↗ 13.2 ms rise | 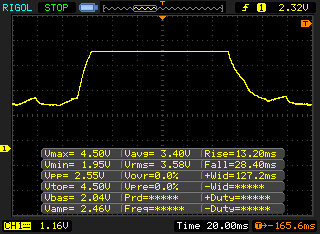 |
| ↘ 28.4 ms fall | ||
| The screen shows slow response rates in our tests and will be unsatisfactory for gamers. In comparison, all tested devices range from 0.165 (minimum) to 636 (maximum) ms. » 67 % of all devices are better. This means that the measured response time is worse than the average of all tested devices (30.9 ms). | ||
| PCMark 8 Home Score Accelerated v2 | 3049 points | |
| PCMark 8 Work Score Accelerated v2 | 3892 points | |
Help | ||
| Lenovo ThinkPad T570-20HAS01E00 Samsung PM961 NVMe MZVLW512HMJP | Lenovo ThinkPad T560-20FH002RGE Samsung SSD PM871 MZ7LN256HCHP | HP EliteBook 850 G4-Z2W86ET Samsung PM951 NVMe MZVLV256 | Fujitsu LifeBook U757 Samsung CM871a MZNTY256HDHP | Apple MacBook Pro 15 2016 (2.6 GHz, 450) Apple SSD SM0256L | Dell XPS 15 9560 (i7-7700HQ, UHD) Lite-On CX2-8B512-Q11 | Lenovo ThinkPad T470s-20HGS00V00 Samsung SSD PM961 1TB M.2 PCIe 3.0 x4 NVMe (MZVLW1T0) | |
|---|---|---|---|---|---|---|---|
| CrystalDiskMark 3.0 | -50% | -29% | -47% | -16% | 4% | 18% | |
| Read Seq (MB/s) | 1210 | 513 -58% | 1245 3% | 509 -58% | 1298 7% | 1684 39% | 1760 45% |
| Write Seq (MB/s) | 1134 | 306.1 -73% | 298.6 -74% | 488.4 -57% | 1343 18% | 1106 -2% | 1666 47% |
| Read 512 (MB/s) | 789 | 450.6 -43% | 673 -15% | 414.3 -47% | 842 7% | 977 24% | 832 5% |
| Write 512 (MB/s) | 903 | 305.5 -66% | 298.8 -67% | 321.7 -64% | 945 5% | 1119 24% | 1064 18% |
| Read 4k (MB/s) | 58.4 | 33.4 -43% | 41.79 -28% | 36.43 -38% | 9.8 -83% | 45.14 -23% | 53.2 -9% |
| Write 4k (MB/s) | 144.1 | 85.6 -41% | 138.4 -4% | 88.4 -39% | 13 -91% | 134.1 -7% | 167.4 16% |
| Read 4k QD32 (MB/s) | 559 | 346.9 -38% | 495 -11% | 402.8 -28% | 630 13% | 509 -9% | 630 13% |
| Write 4k QD32 (MB/s) | 474.4 | 278.9 -41% | 297.5 -37% | 256.7 -46% | 443 -7% | 398.1 -16% | 533 12% |

| 3DMark 11 Performance | 2931 points | |
| 3DMark Cloud Gate Standard Score | 8308 points | |
| 3DMark Fire Strike Score | 2098 points | |
Help | ||
| BioShock Infinite - 1366x768 High Preset | |
| Dell XPS 15 9560 (i7-7700HQ, UHD) | |
| Lenovo ThinkPad T570-20HAS01E00 | |
| Lenovo ThinkPad T560-20FH002RGE | |
| HP EliteBook 850 G4-Z2W86ET | |
| Lenovo ThinkPad T570-20H90002GE | |
| low | med. | high | ultra | 4K | |
|---|---|---|---|---|---|
| BioShock Infinite (2013) | 137.9 | 72.4 | 64.3 | 21.5 | |
| The Witcher 3 (2015) | 42.5 | 25.7 | 11.5 | ||
| Civilization 6 (2016) | 52.1 | 30.7 | 16.4 | 12.6 | 10.1 |
Noise level
| Idle |
| 29.3 / 29.3 / 31.1 dB(A) |
| Load |
| 35.2 / 41.3 dB(A) |
 | ||
30 dB silent 40 dB(A) audible 50 dB(A) loud |
||
min: | ||
(±) The maximum temperature on the upper side is 43.1 °C / 110 F, compared to the average of 34.3 °C / 94 F, ranging from 21.2 to 62.5 °C for the class Office.
(-) The bottom heats up to a maximum of 55.4 °C / 132 F, compared to the average of 36.8 °C / 98 F
(+) In idle usage, the average temperature for the upper side is 24 °C / 75 F, compared to the device average of 29.5 °C / 85 F.
(±) The palmrests and touchpad can get very hot to the touch with a maximum of 39.6 °C / 103.3 F.
(-) The average temperature of the palmrest area of similar devices was 27.5 °C / 81.5 F (-12.1 °C / -21.8 F).
| Off / Standby | |
| Idle | |
| Load |
|
Key:
min: | |
| Lenovo ThinkPad T570-20HAS01E00 i7-7500U, GeForce 940MX, Samsung PM961 NVMe MZVLW512HMJP, IPS, 3840x2160, 15.6" | Lenovo ThinkPad T570-20H90002GE i5-7200U, HD Graphics 620, Samsung PM961 MZVLW256HEHP, IPS, 1920x1080, 15.6" | HP EliteBook 850 G4-Z2W86ET i5-7200U, HD Graphics 620, Samsung PM951 NVMe MZVLV256, TN LED, 1920x1080, 15.6" | Fujitsu LifeBook U757 i5-7200U, HD Graphics 620, Samsung CM871a MZNTY256HDHP, IPS LED, 1920x1080, 15.6" | Apple MacBook Pro 15 2016 (2.6 GHz, 450) 6700HQ, Radeon Pro 450, Apple SSD SM0256L, IPS, 2880x1800, 15.4" | Dell XPS 15 9560 (i7-7700HQ, UHD) i7-7700HQ, GeForce GTX 1050 Mobile, Lite-On CX2-8B512-Q11, IGZO IPS, 3840x2160, 15.6" | |
|---|---|---|---|---|---|---|
| Power Consumption | 31% | 39% | 33% | 2% | -83% | |
| Idle Minimum * (Watt) | 4.7 | 3.6 23% | 3.58 24% | 3.96 16% | 2.9 38% | 11.9 -153% |
| Idle Average * (Watt) | 9.9 | 7.7 22% | 5.97 40% | 7.74 22% | 9.7 2% | 17.1 -73% |
| Idle Maximum * (Watt) | 10.9 | 8.2 25% | 6.81 38% | 8.64 21% | 10.1 7% | 17.3 -59% |
| Load Average * (Watt) | 56.1 | 30.8 45% | 29.4 48% | 28.8 49% | 65 -16% | 94.7 -69% |
| Load Maximum * (Watt) | 75 | 46.1 39% | 39.7 47% | 32 57% | 89.5 -19% | 122 -63% |
| Witcher 3 ultra * (Watt) | 104.8 |
* ... smaller is better
| Lenovo ThinkPad T570-20HAS01E00 i7-7500U, GeForce 940MX, 56 Wh | Lenovo ThinkPad T570-20H90002GE i5-7200U, HD Graphics 620, 56 Wh | HP EliteBook 850 G4-Z2W86ET i5-7200U, HD Graphics 620, 51 Wh | Fujitsu LifeBook U757 i5-7200U, HD Graphics 620, 50 Wh | Apple MacBook Pro 15 2016 (2.6 GHz, 450) 6700HQ, Radeon Pro 450, 76 Wh | Dell XPS 15 9560 (i7-7700HQ, UHD) i7-7700HQ, GeForce GTX 1050 Mobile, 97 Wh | |
|---|---|---|---|---|---|---|
| Battery runtime | 24% | 22% | 6% | -6% | -11% | |
| Reader / Idle (h) | 13.3 | 19.5 47% | 18 35% | 13.9 5% | ||
| H.264 (h) | 8.1 | 9.8 21% | 10.6 31% | 8.6 6% | ||
| WiFi v1.3 (h) | 6.9 | 7.6 10% | 8.8 28% | 7.3 6% | 10 45% | 7.2 4% |
| Load (h) | 2.9 | 3.4 17% | 2.7 -7% | 0.9 -69% | 1.7 -41% |
Pros
Cons
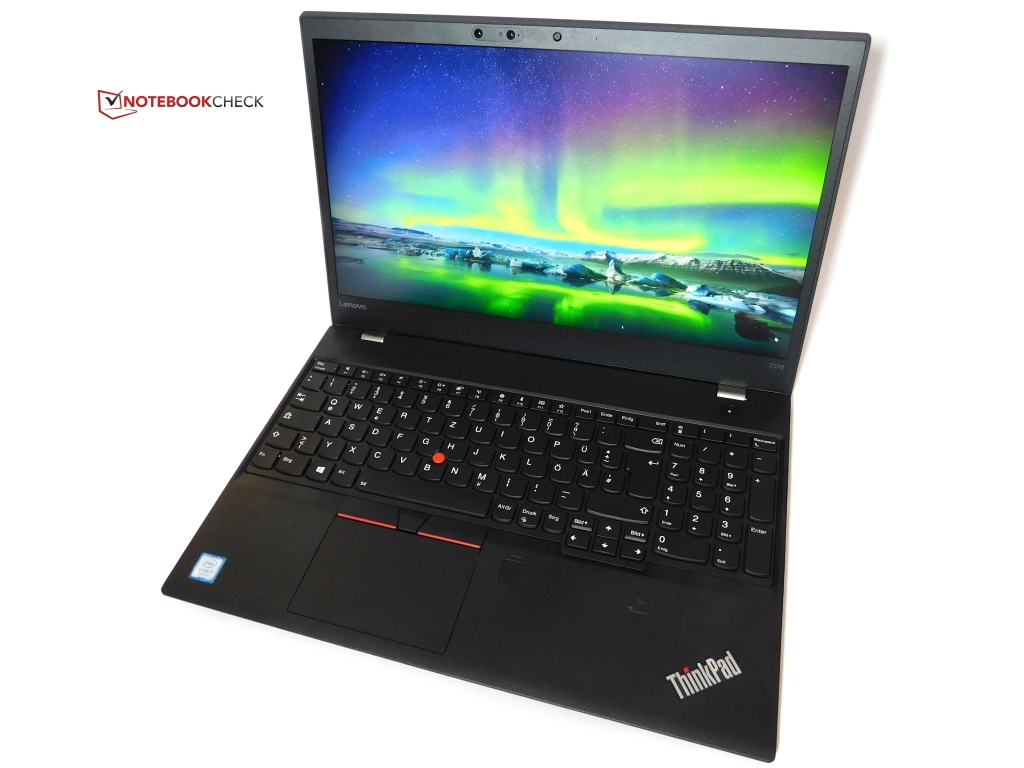
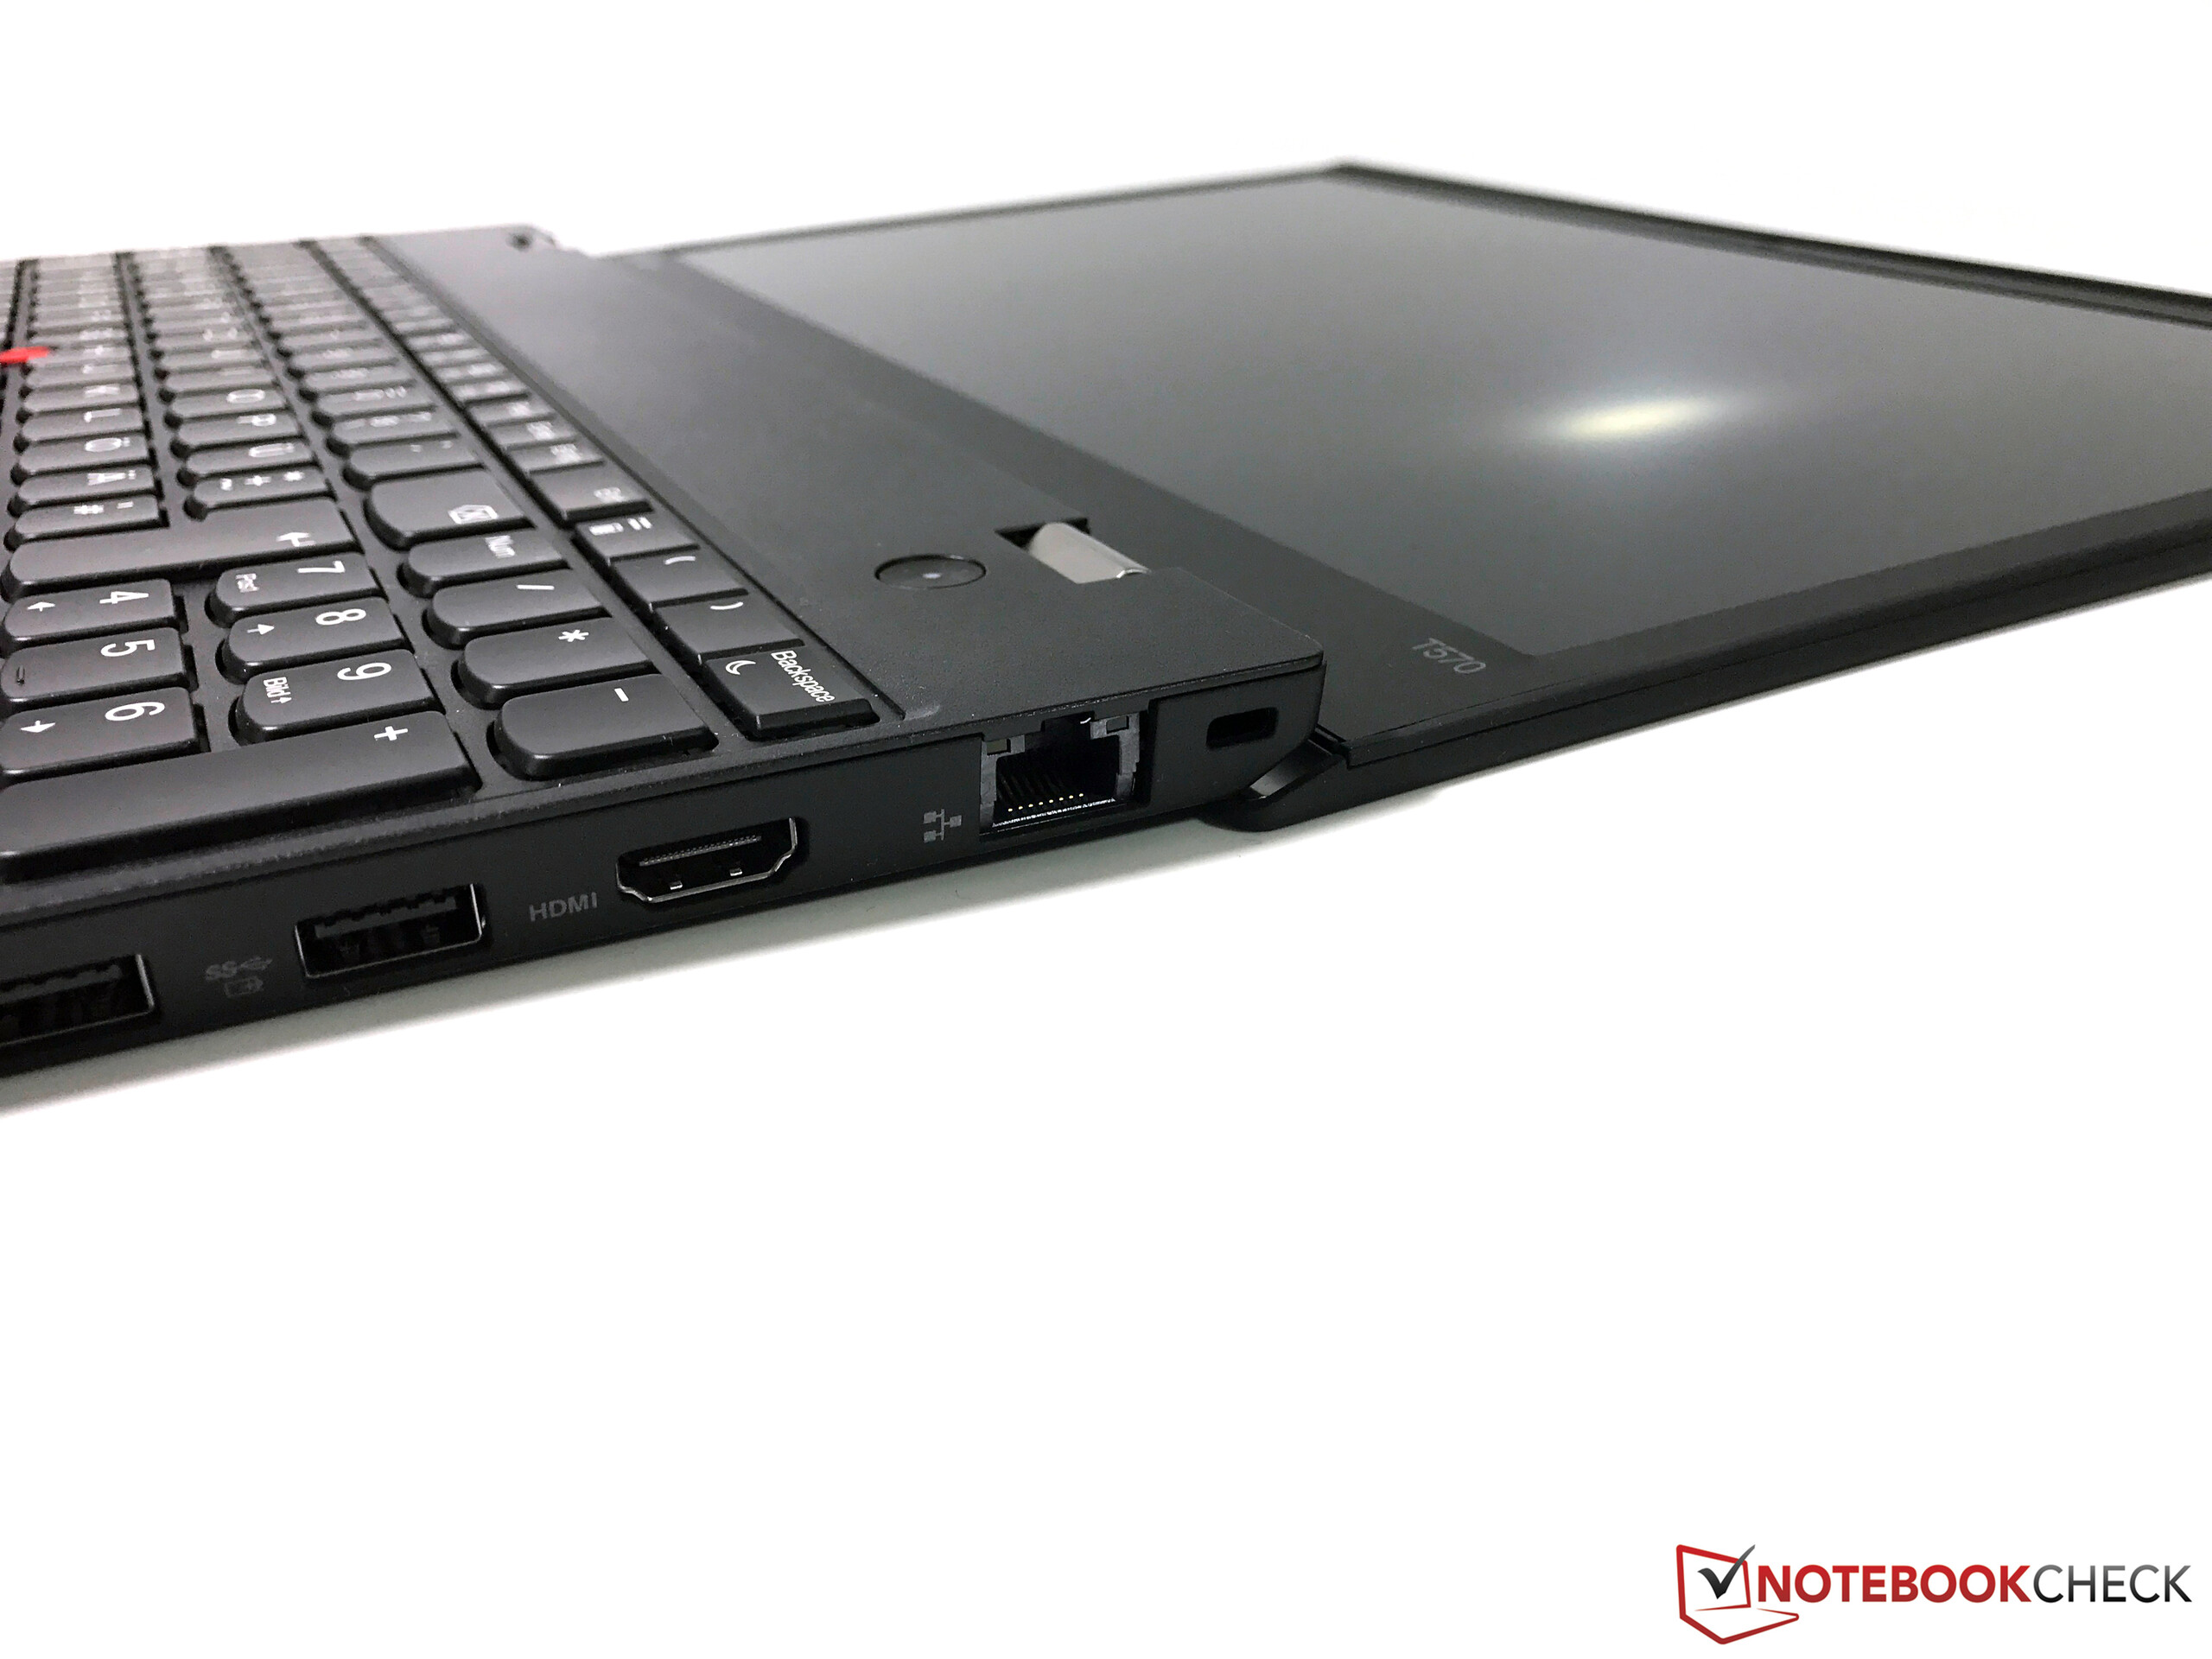
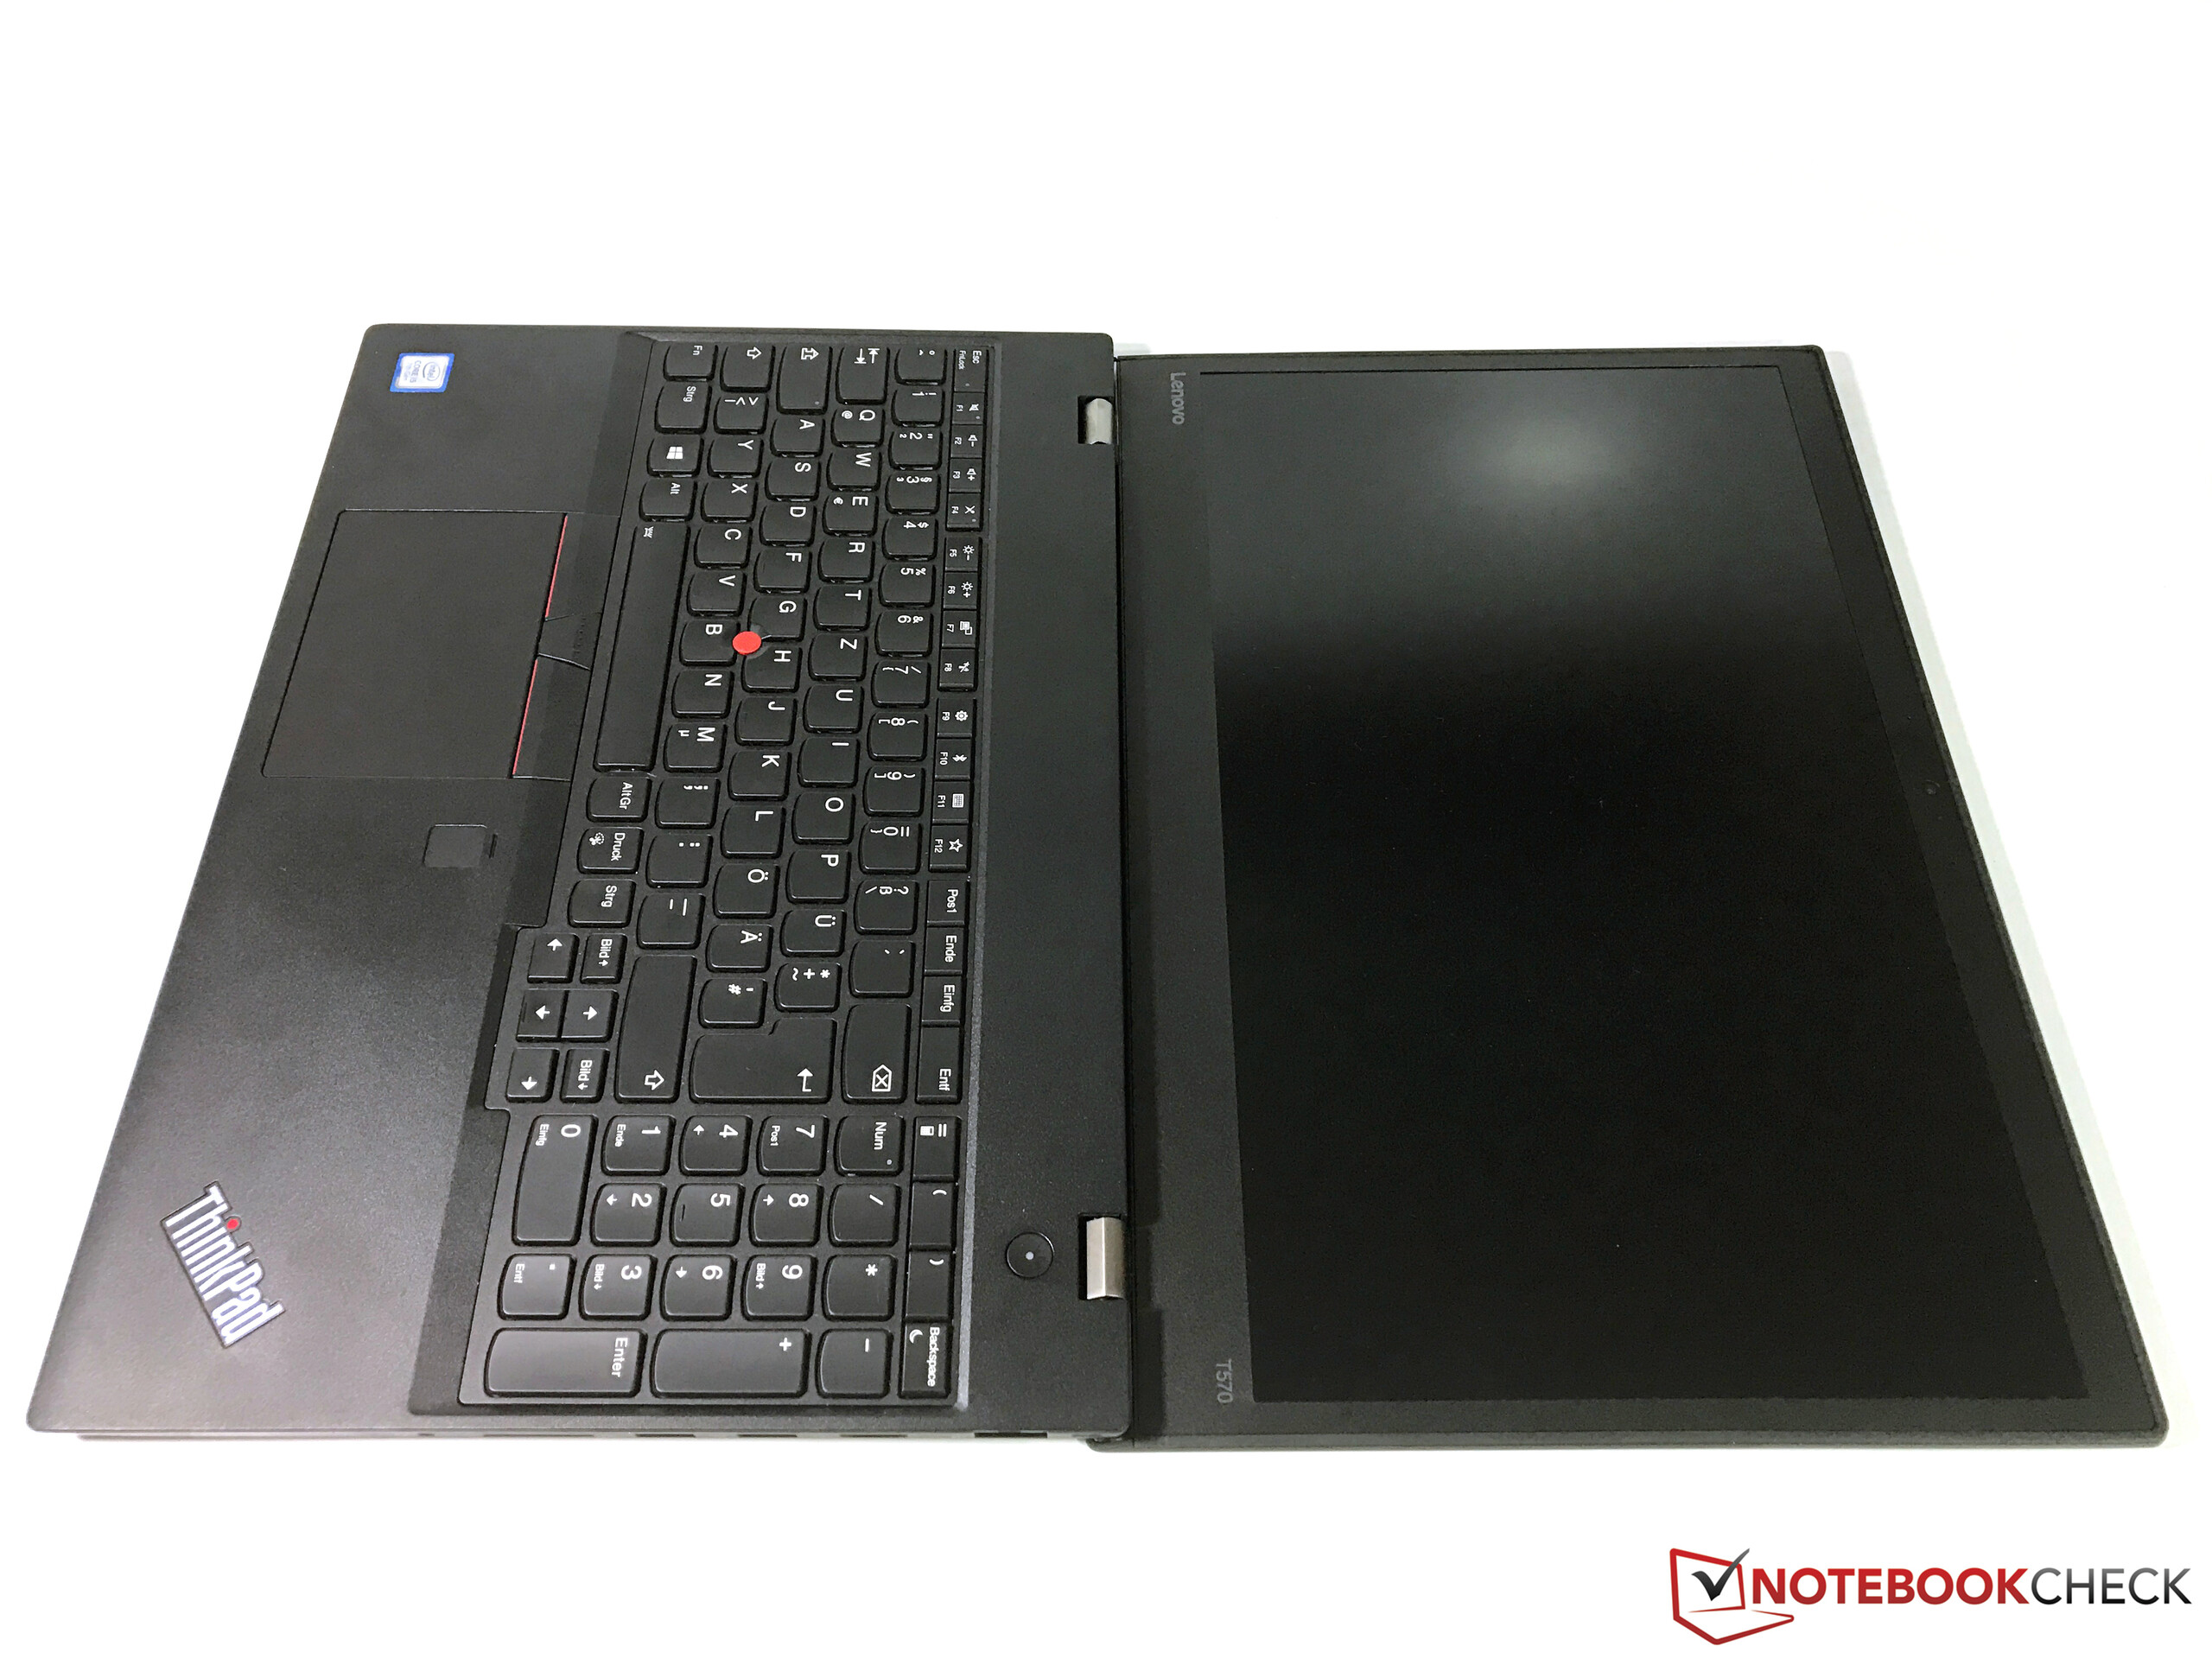
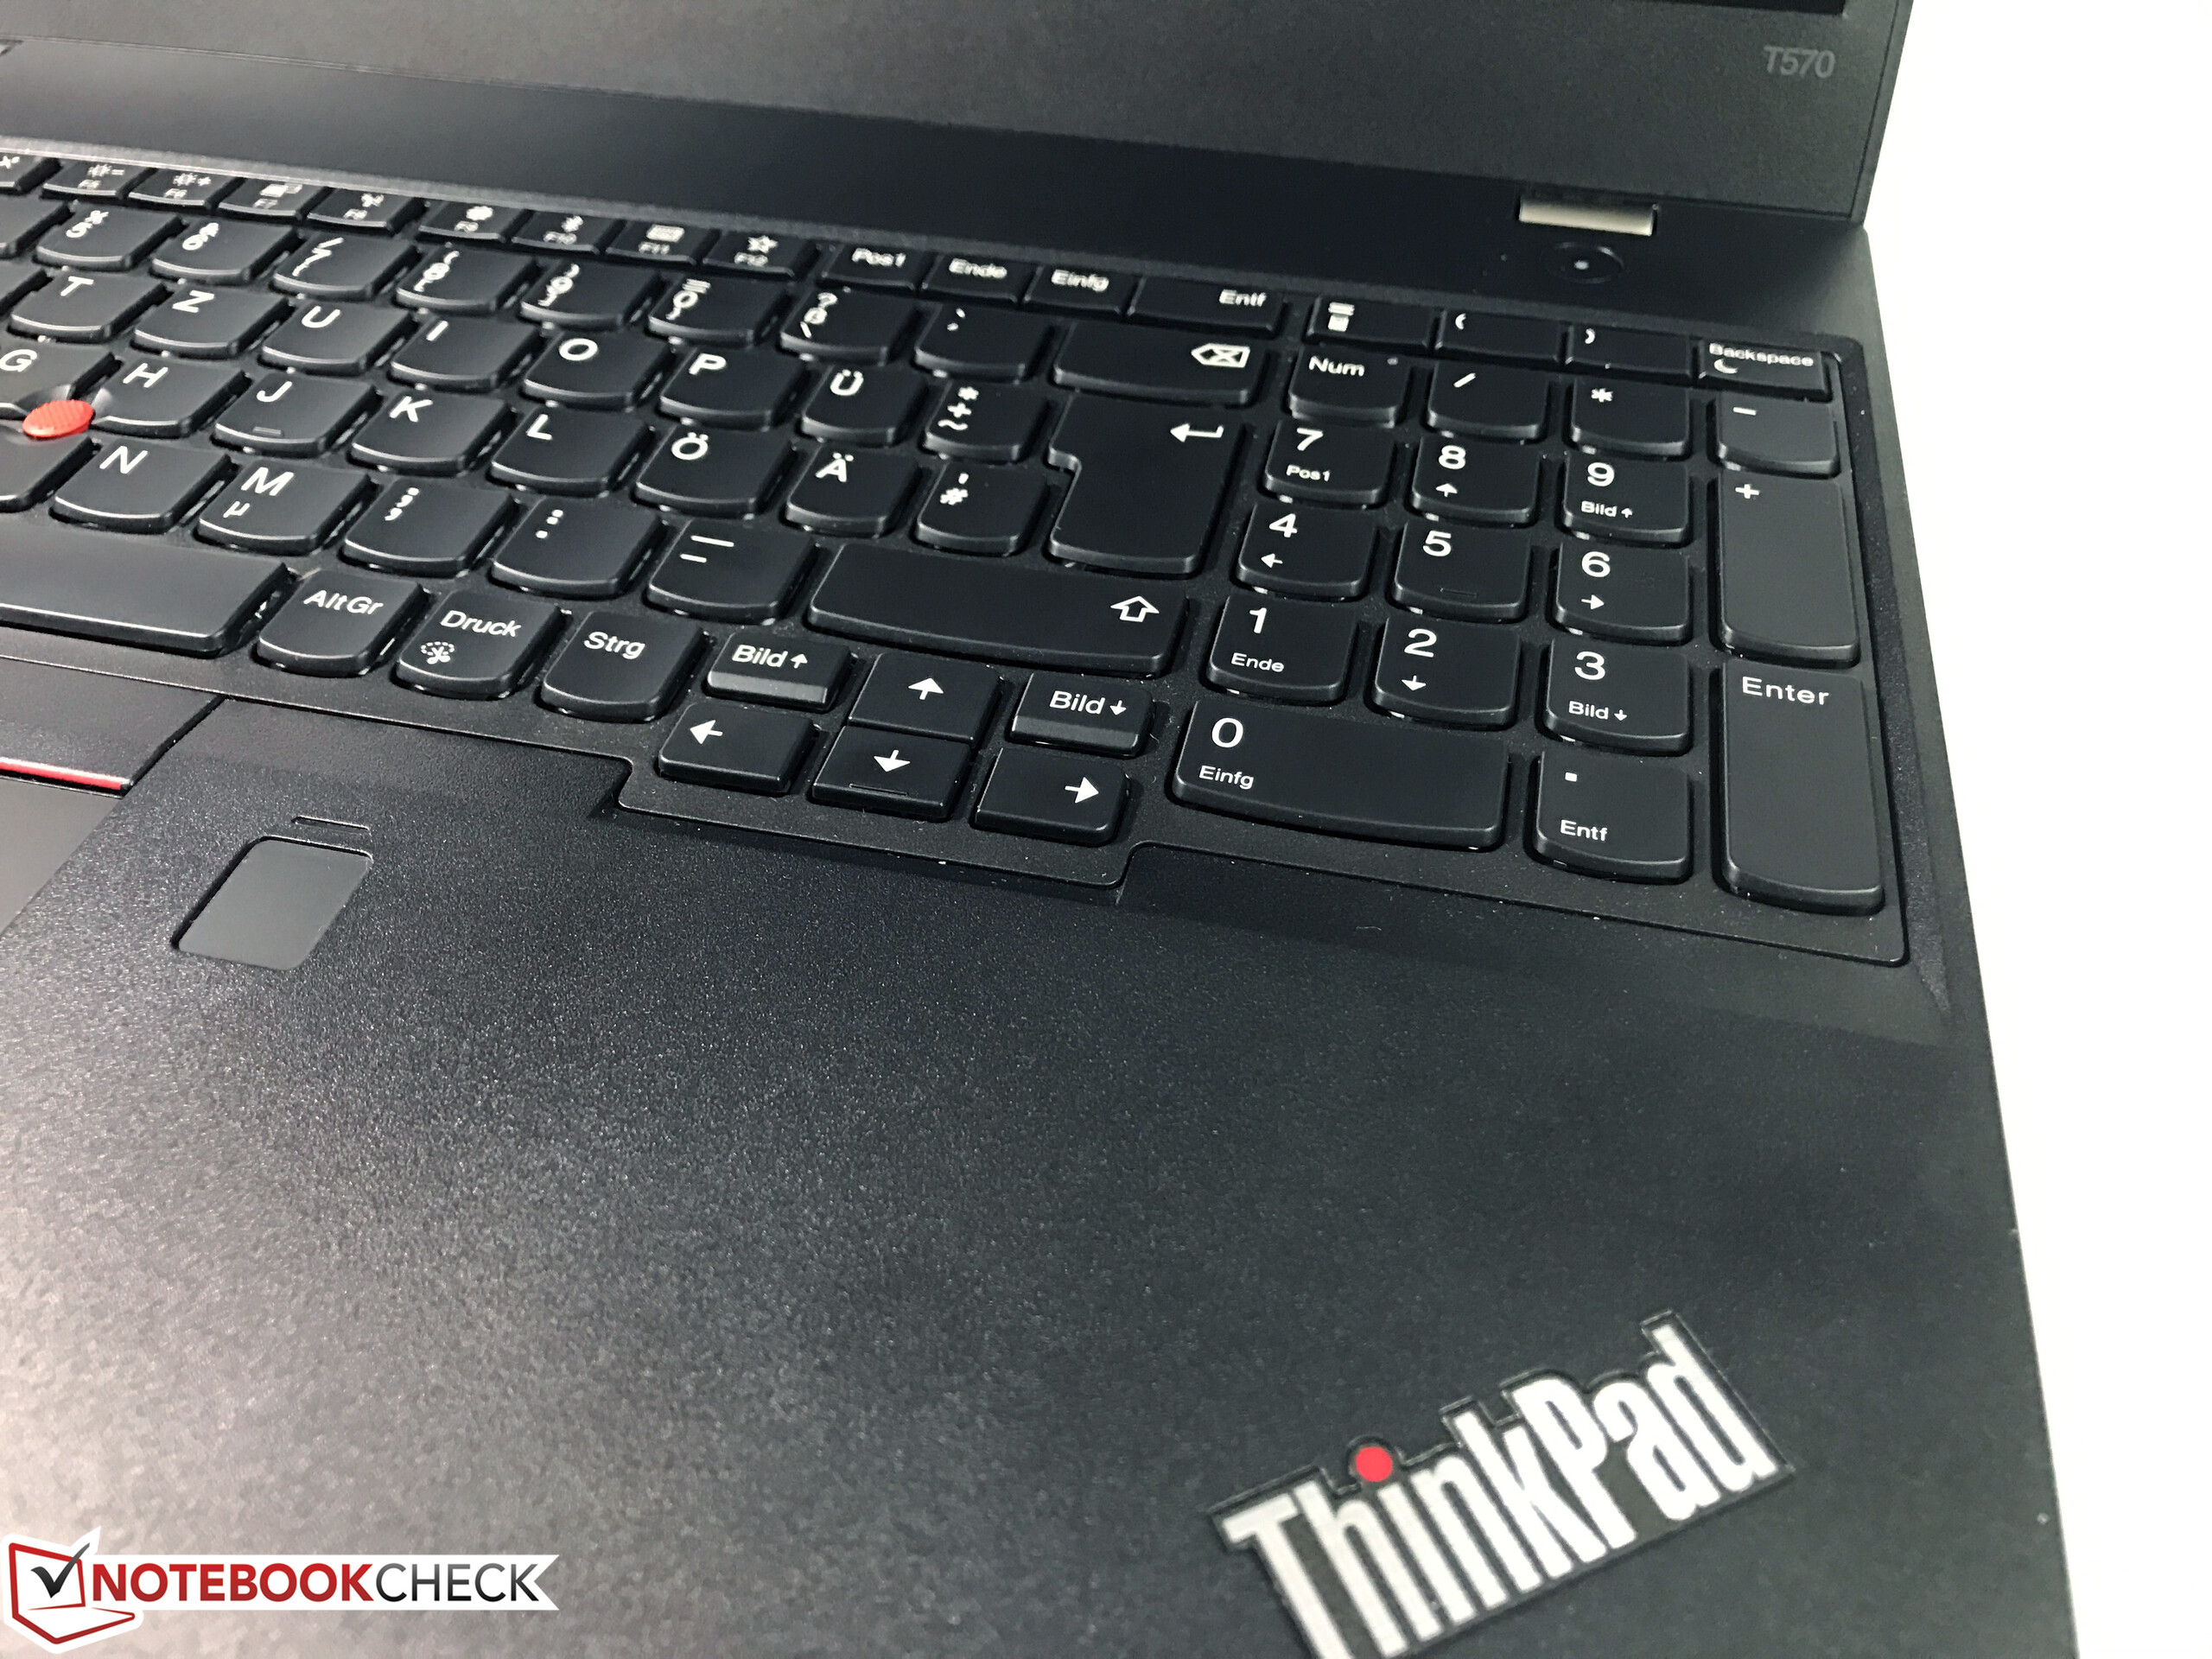
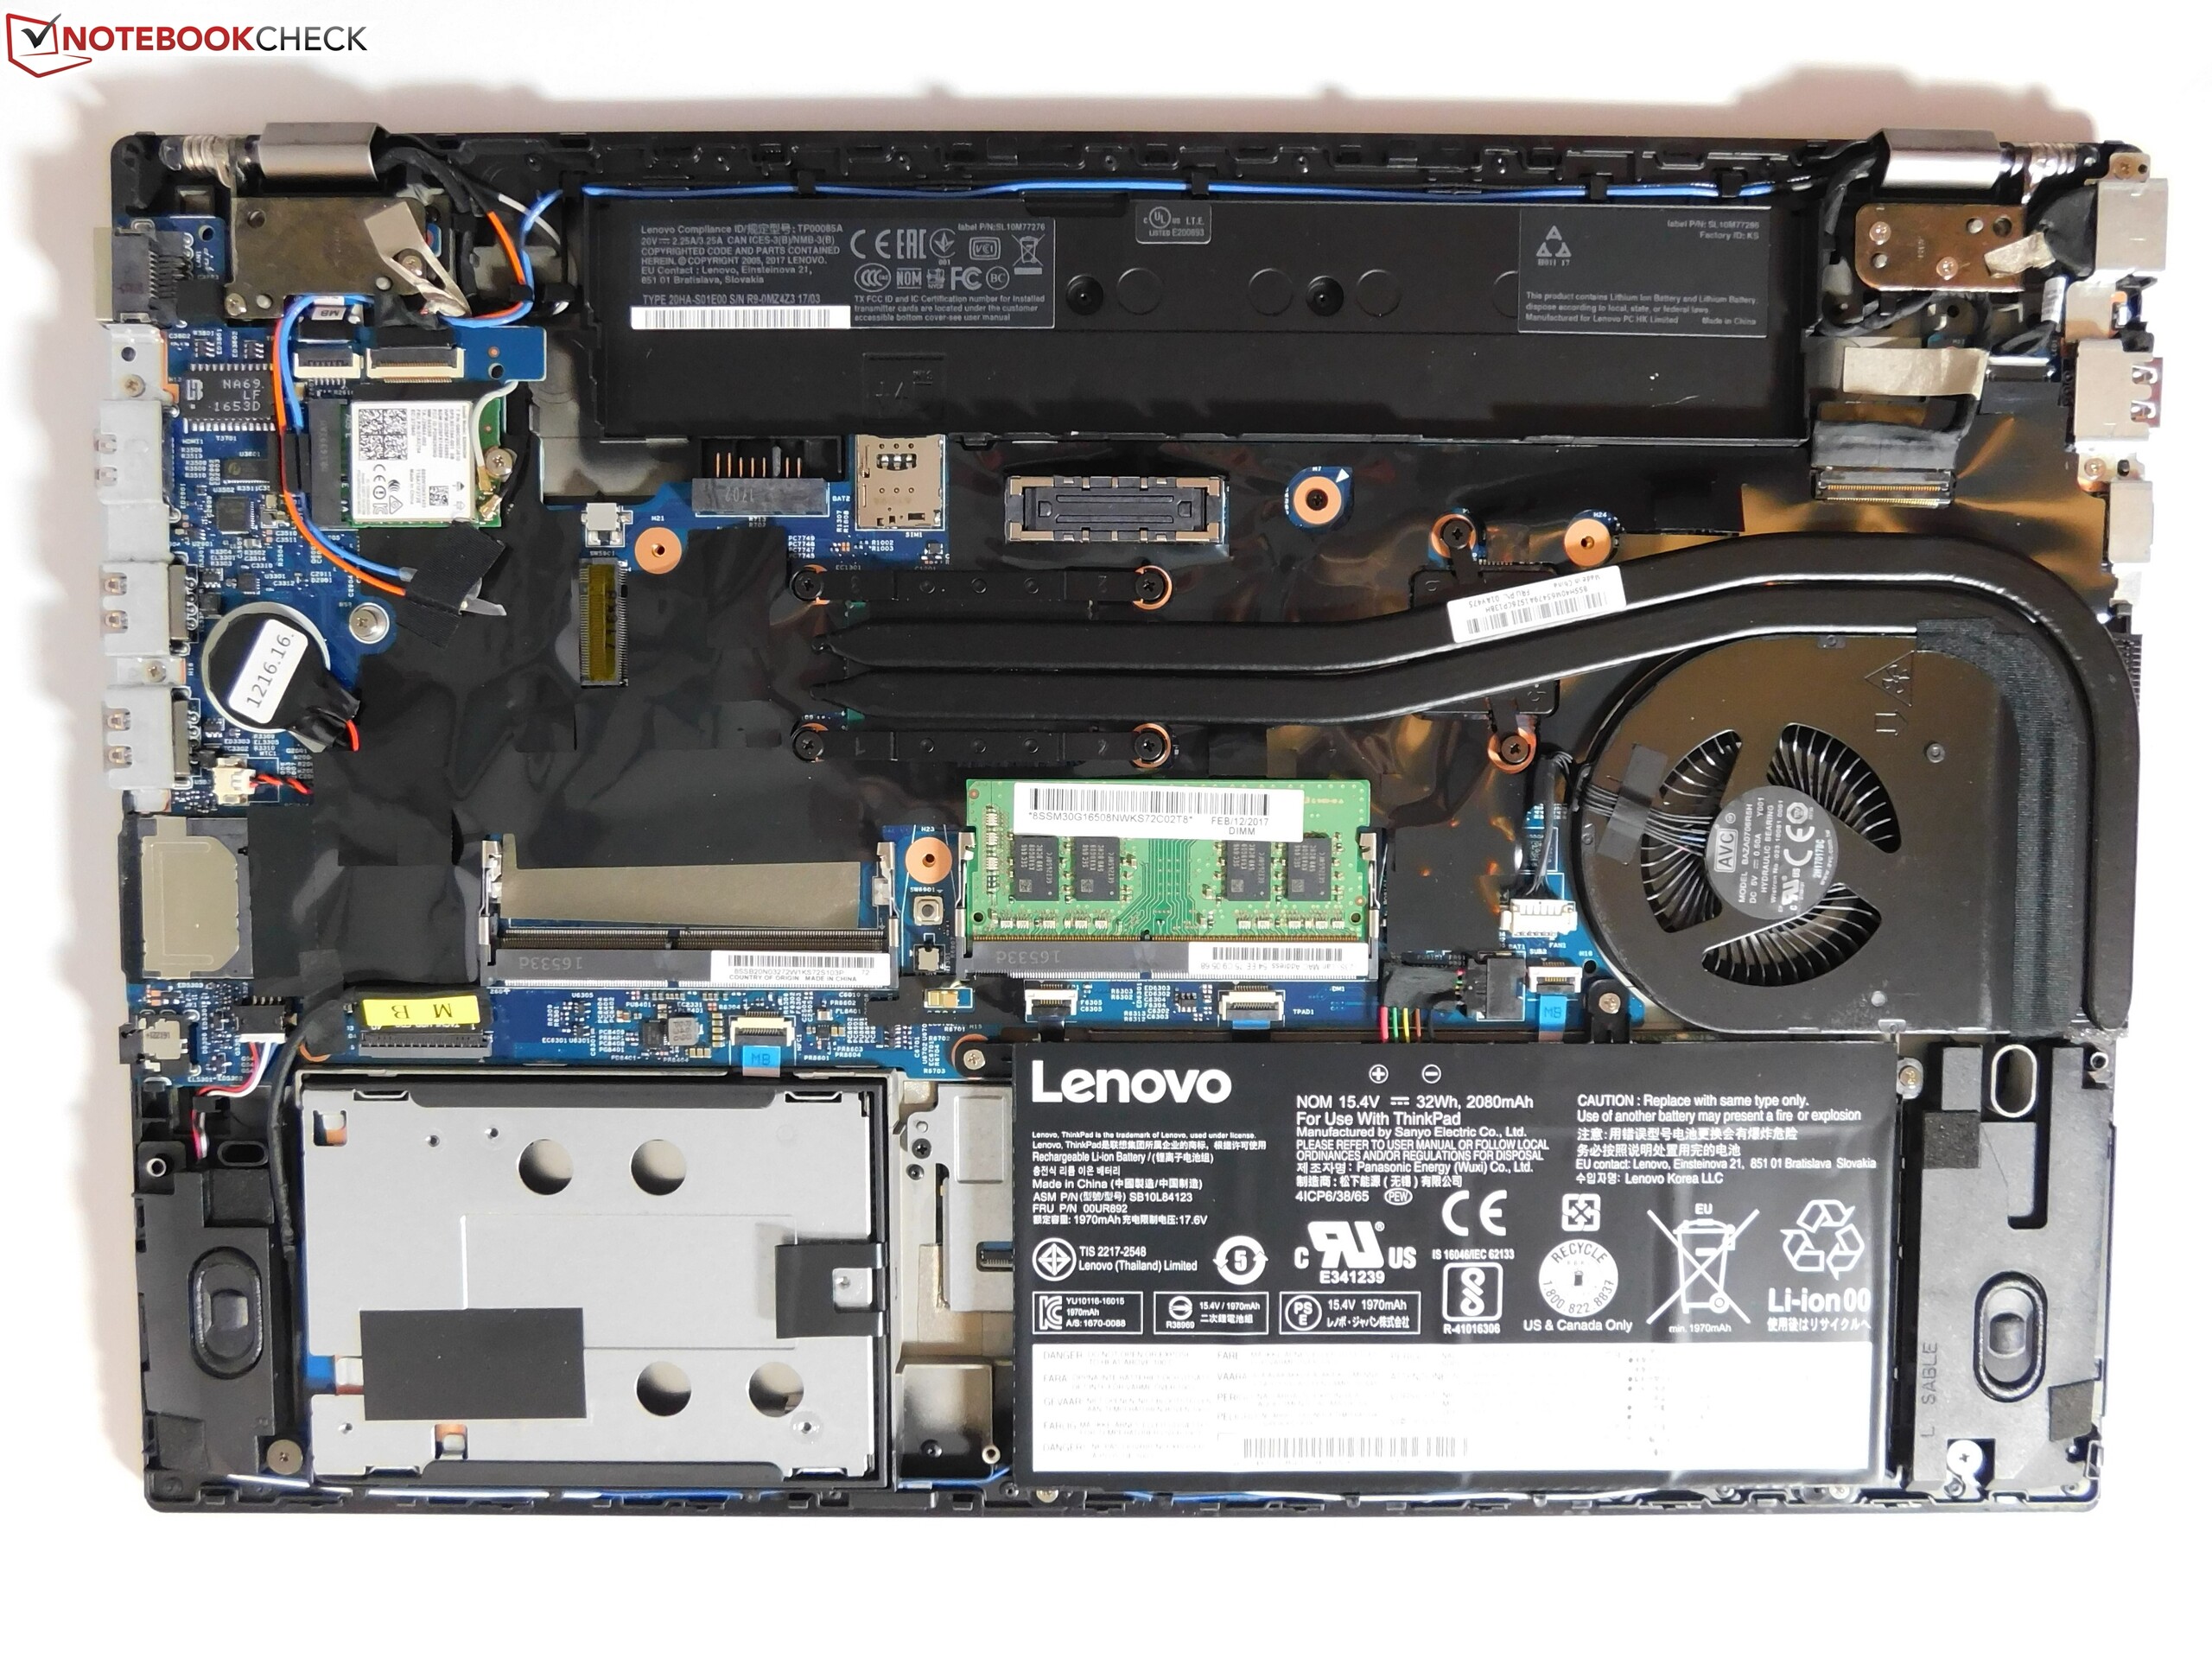
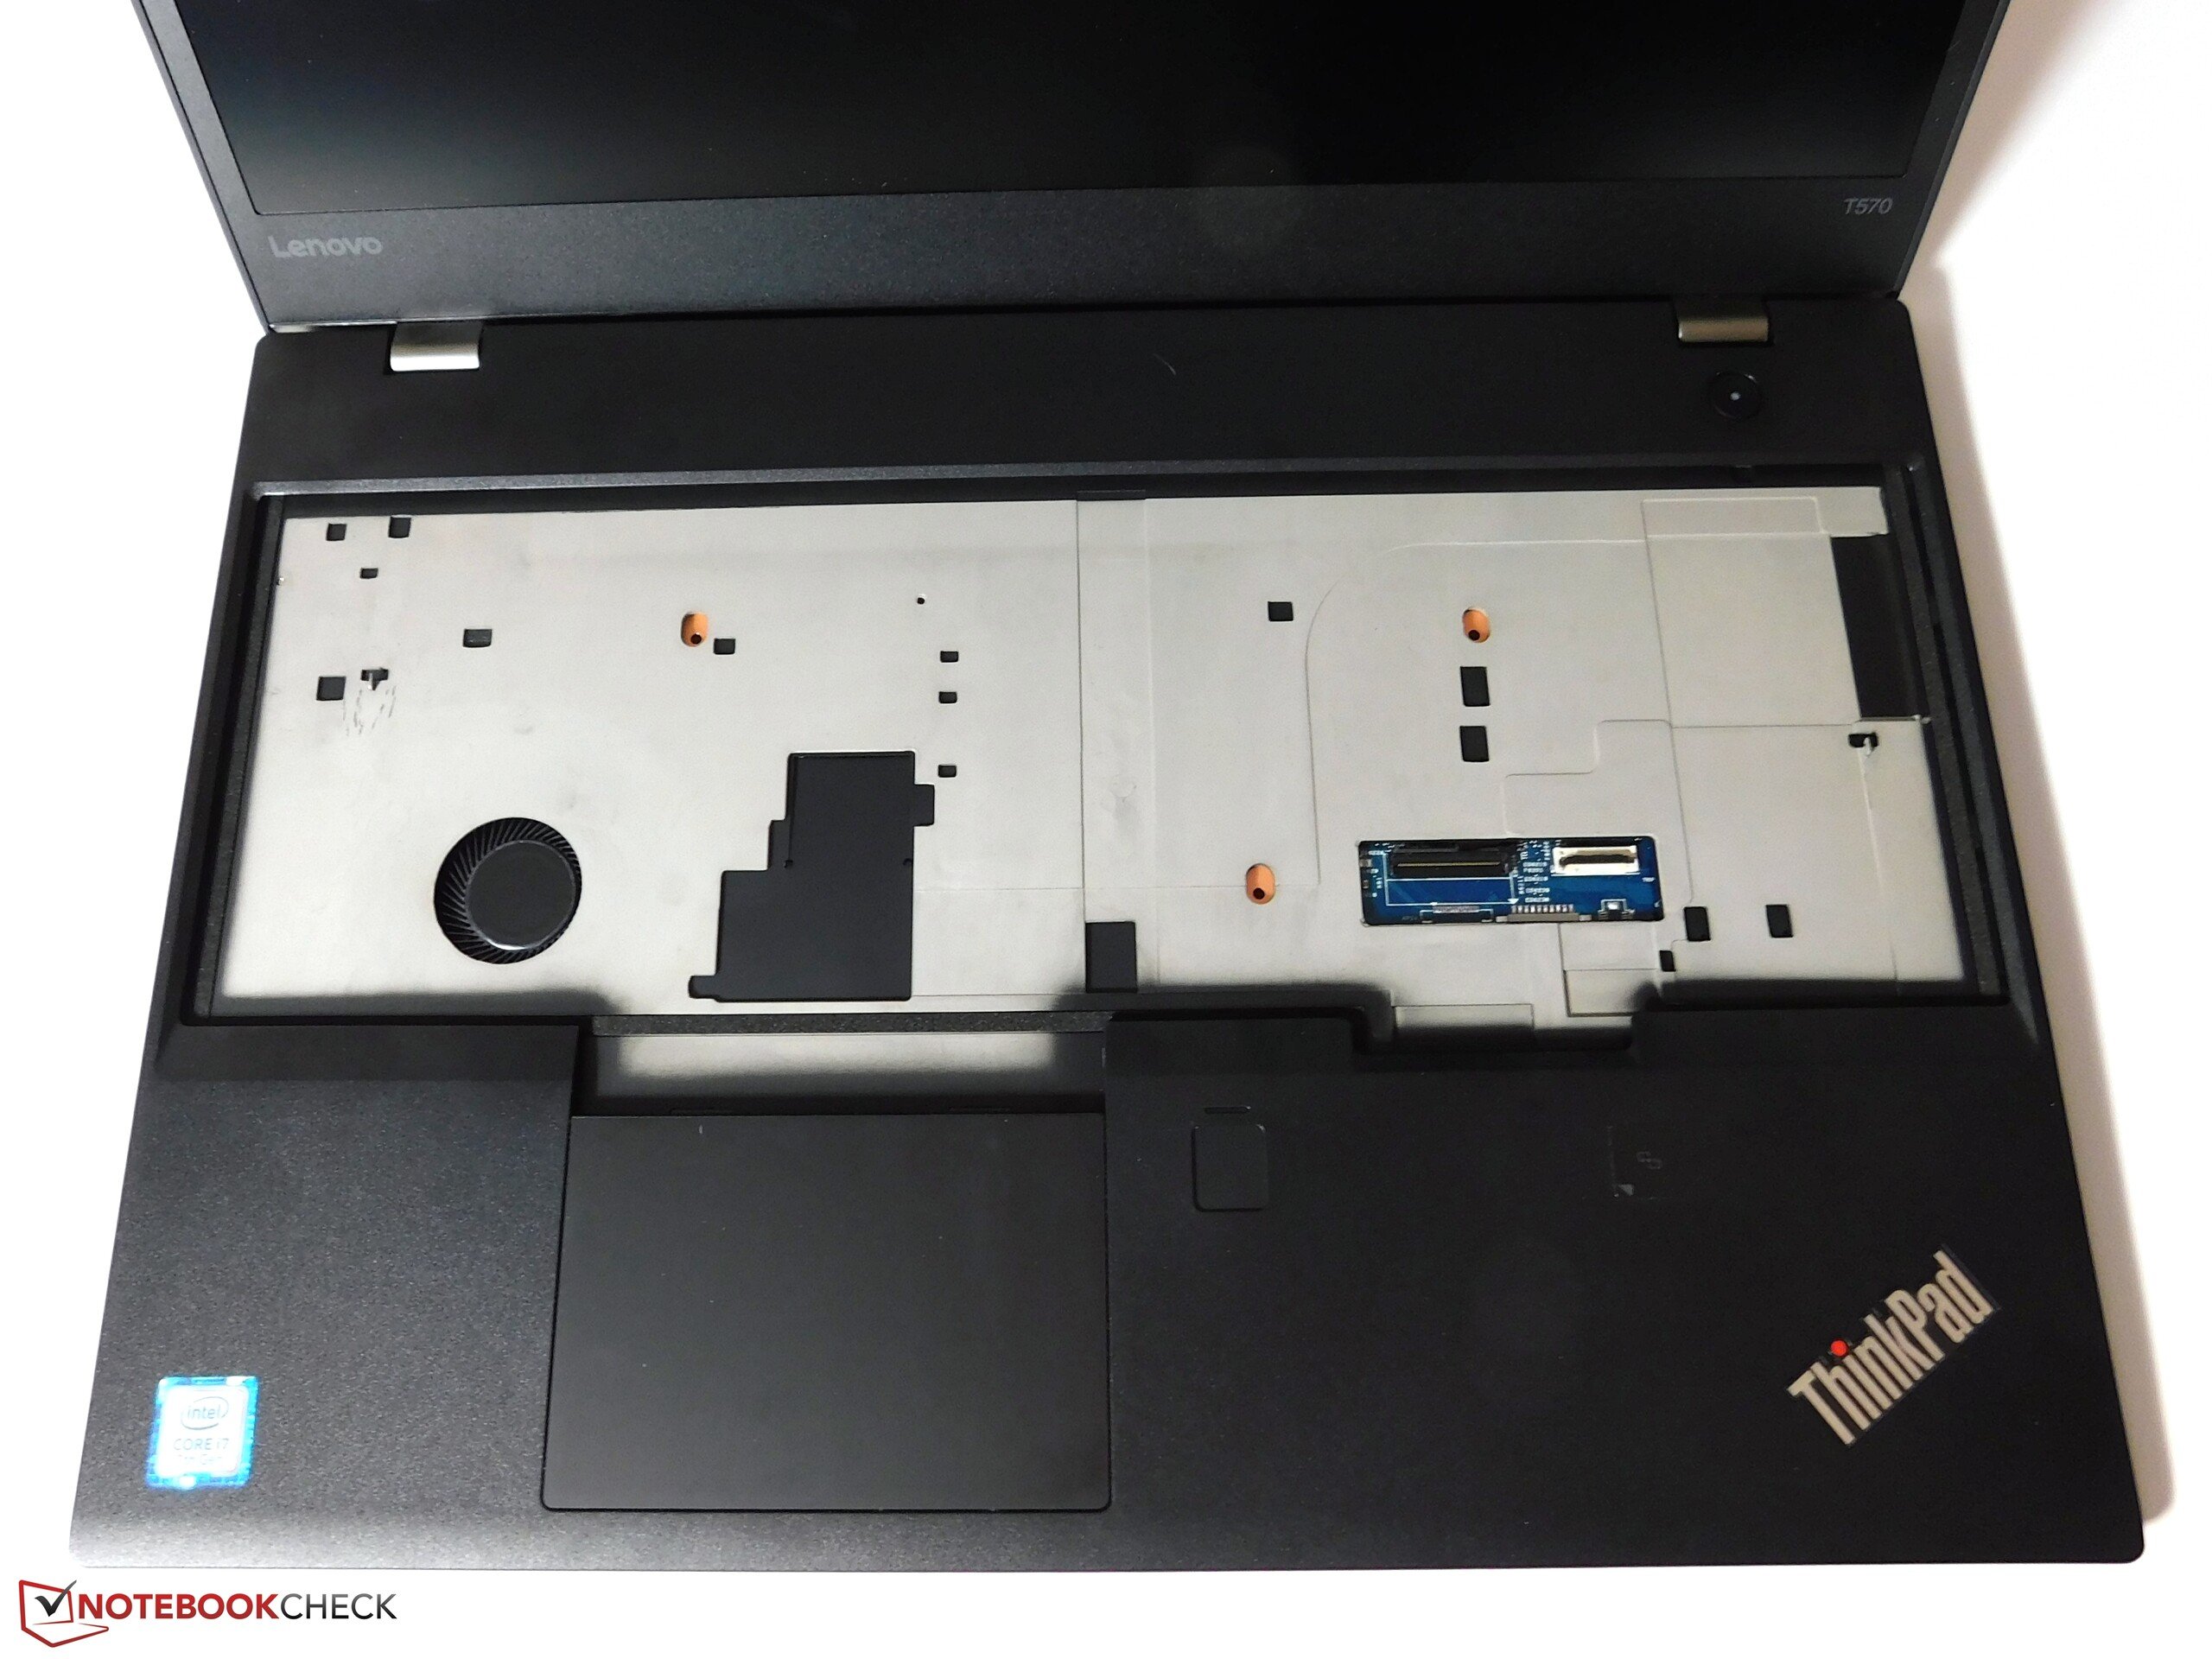
我们对更加昂贵的T570仅仅和低端配置版一样。它拥有很多和一开始的测试型号一样的优点:坚固且相对紧凑的的外壳,舒适的输入设备,以及众多的接口。实用的功能例如PowerBridge或是红外相机使得T570成为了一台十分方便的笔记本。在这些实惠型号的有点之外,这台评测型号也带有显示质量令人满意的4K分辨率屏幕以及英伟达显卡,虽然是老旧的型号,但依然比英特尔的集显性能上要强得多。
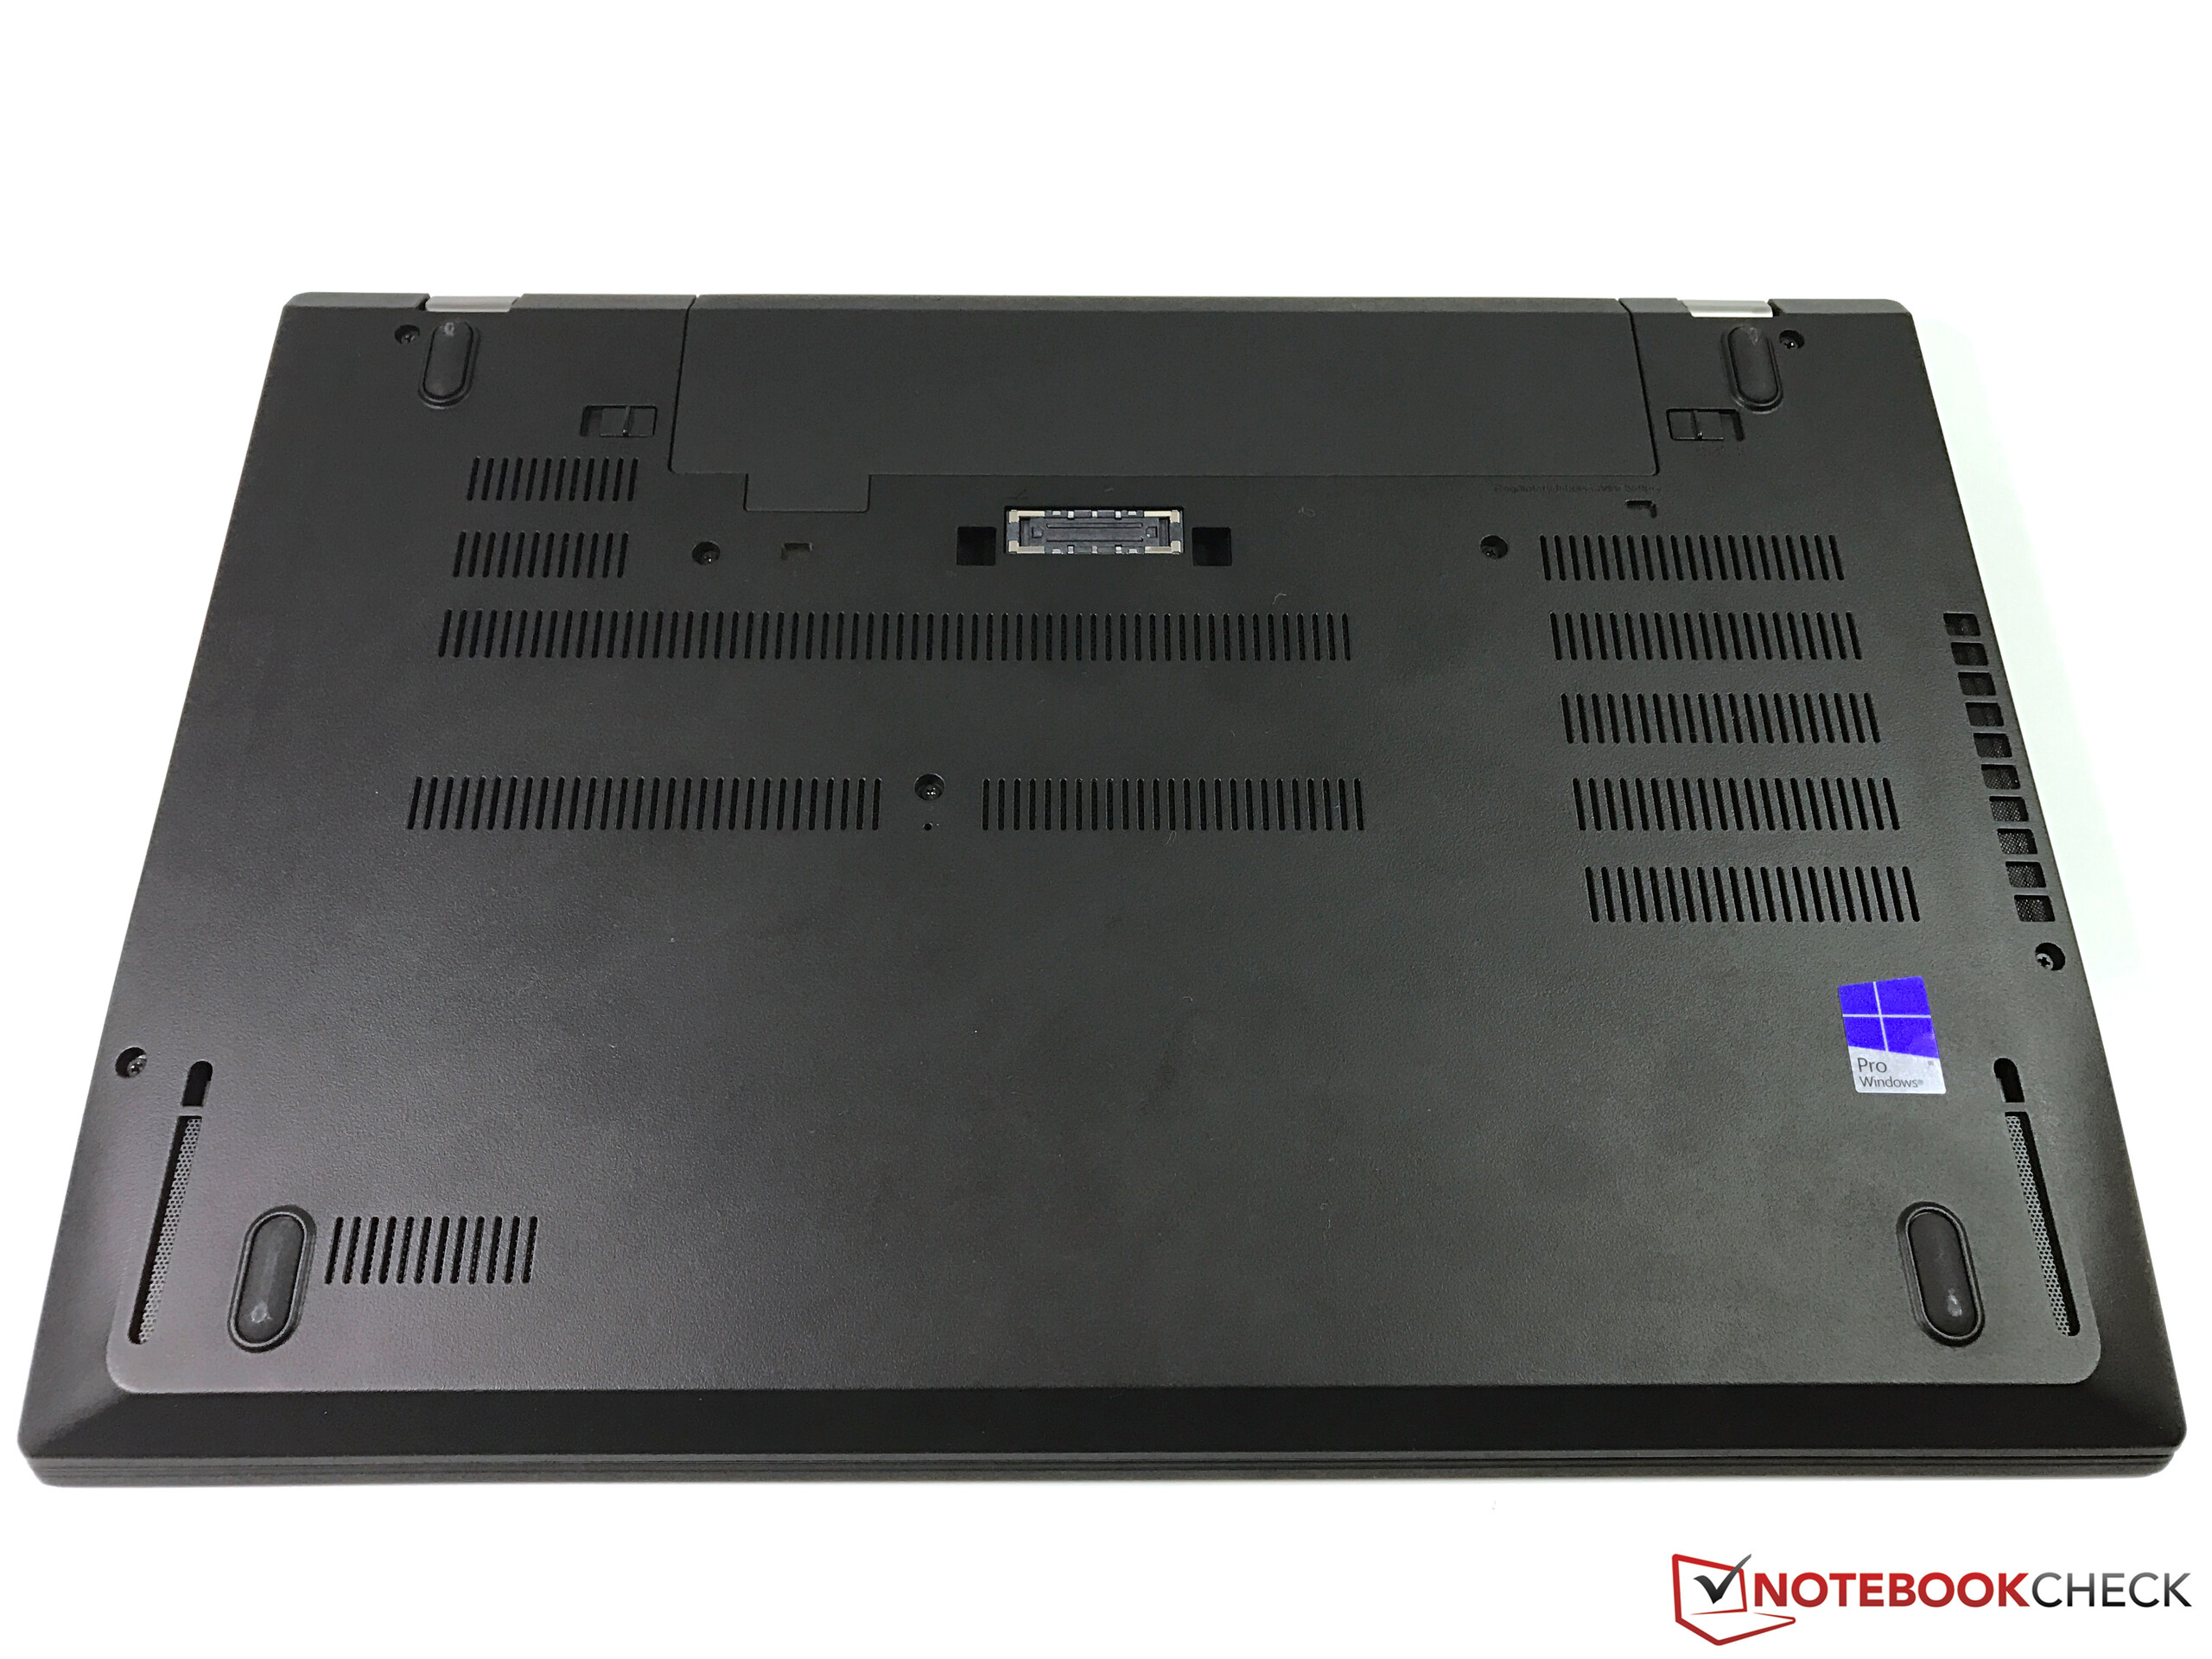
但是,测试型号仍然不是完美的。我们最大的抱怨在于在电池供电模式下CPU更糟糕的性能衰减。在主要的测试中,通过一些设置的调整,在这个型号上我们能够避免性能下降问题的发生,但在电池供电的测试中这个方法就失去了作用。再者,新的问题在于底面的发热,可能是因为英伟达显卡的存在。对于这个问题来说,T560做的更好一些,可能是因为它更厚更大的外壳。而且,非学生版的带有4K屏及英伟达显卡并不便宜,而且电源适配器的功率并不足以供应负载时的功耗。
带有4K屏的T570整体上是优秀的,是15.6英寸市场的有利竞品,因为它将商务本以及多媒体本的特点有机结合起来。
作为总结,4K屏款T570显然是值得被推荐的。由于屏幕的关系,他在最初的测试型号做的最差的方面有了显著的改善。如果没有在电池模式下的性能衰减的话,它将会获得“十分出色”的推荐。我们为这个问题减去两分。这台测试型号的性能衰减比最初的型号要好一些,因为GPU并不收到性能衰减的影响而且在供电模式下表现稳定。
有许多的带有15.6英寸显示屏的竞品,而商务本大多属于14寸这个屏幕尺寸。MacBook Pro 14以及戴尔XPS15都是强有力的竞品,虽然不提供T570的商务本的特性以及极其出色的键盘,但却又着强得多的GPU及CPU选项。
注:本文是基于完整评测的缩减版本,阅读完整的英文评测,请点击这里。
Lenovo ThinkPad T570-20HAS01E00
- 04/25/2017 v6 (old)
Benjamin Herzig