惠普 Pavilion 15t-au100 (W0P31AV) 笔记本电脑简短评测
| SD Card Reader | |
| average JPG Copy Test (av. of 3 runs) | |
| Dell XPS 15-9550 i7 | |
| HP Pavilion 15t-au100 CTO (W0P31AV) | |
| Lenovo IdeaPad 510-15IKB 80SV0087GE | |
| Acer Aspire E5-575G-549D | |
| Asus Zenbook UX510UW-CN044T | |
| maximum AS SSD Seq Read Test (1GB) | |
| Dell XPS 15-9550 i7 | |
| HP Pavilion 15t-au100 CTO (W0P31AV) | |
| Acer Aspire E5-575G-549D | |
| Asus Zenbook UX510UW-CN044T | |
| Lenovo IdeaPad 510-15IKB 80SV0087GE | |
| Networking | |
| Wi-Fi Client 1m 512KB | |
| Wi-Fi Server 1m 512KB |
| |||||||||||||||||||||||||
Brightness Distribution: 69 %
Center on Battery: 186.5 cd/m²
Contrast: 1036:1 (Black: 0.18 cd/m²)
ΔE ColorChecker Calman: 5.7 | ∀{0.5-29.43 Ø4.72}
ΔE Greyscale Calman: 4.4 | ∀{0.09-98 Ø4.97}
64.95% sRGB (Argyll 1.6.3 3D)
44.71% AdobeRGB 1998 (Argyll 1.6.3 3D)
44.71% AdobeRGB 1998 (Argyll 3D)
64.9% sRGB (Argyll 3D)
43.27% Display P3 (Argyll 3D)
Gamma: 2.35
CCT: 6963 K
| HP Pavilion 15t-au100 CTO (W0P31AV) BOE0693, IPS, 15.6", 1920x1080 | Asus Zenbook UX510UW-CN044T LG Philips LP156WF6-SPB6, IPS, 15.6", 1920x1080 | Lenovo IdeaPad 510-15IKB 80SV0087GE BOE HF NV156FHM-N42, IPS, 15.6", 1920x1080 | Acer Aspire E5-575G-549D Chi Mei CMN15C4, TN, 15.6", 1920x1080 | HP Pavilion 15 UHD T9Y85AV SDC5958, IPS, 15.6", 3840x2160 | |
|---|---|---|---|---|---|
| Display | 33% | -1% | -11% | 36% | |
| Display P3 Coverage (%) | 43.27 | 61.5 42% | 42.66 -1% | 38.57 -11% | 60 39% |
| sRGB Coverage (%) | 64.9 | 80.4 24% | 64.1 -1% | 57.4 -12% | 85.8 32% |
| AdobeRGB 1998 Coverage (%) | 44.71 | 58.8 32% | 44.08 -1% | 39.89 -11% | 61.8 38% |
| Response Times | 14% | -17% | 18% | 13% | |
| Response Time Grey 50% / Grey 80% * (ms) | 42 ? | 40 ? 5% | 51 ? -21% | 39 ? 7% | 39.6 ? 6% |
| Response Time Black / White * (ms) | 33.6 ? | 26 ? 23% | 38 ? -13% | 24 ? 29% | 27.2 ? 19% |
| PWM Frequency (Hz) | 198.4 | 50 ? | 1282 ? | ||
| Screen | 16% | 21% | -35% | 10% | |
| Brightness middle (cd/m²) | 186.5 | 326 75% | 291 56% | 176 -6% | 336.2 80% |
| Brightness (cd/m²) | 174 | 316 82% | 265 52% | 169 -3% | 323 86% |
| Brightness Distribution (%) | 69 | 80 16% | 86 25% | 91 32% | 87 26% |
| Black Level * (cd/m²) | 0.18 | 0.35 -94% | 0.23 -28% | 0.47 -161% | 0.629 -249% |
| Contrast (:1) | 1036 | 931 -10% | 1265 22% | 374 -64% | 534 -48% |
| Colorchecker dE 2000 * | 5.7 | 5.49 4% | 4.78 16% | 8.83 -55% | 3.32 42% |
| Colorchecker dE 2000 max. * | 22.5 | 11.36 50% | 9.51 58% | 14.01 38% | 7.4 67% |
| Greyscale dE 2000 * | 4.4 | 4.84 -10% | 3.49 21% | 8.97 -104% | 2.88 35% |
| Gamma | 2.35 94% | 2.23 99% | 2.58 85% | 2.43 91% | 2.34 94% |
| CCT | 6963 93% | 5971 109% | 6013 108% | 10234 64% | 6279 104% |
| Color Space (Percent of AdobeRGB 1998) (%) | 44.71 | 53 19% | 40 -11% | 36.8 -18% | 55.3 24% |
| Color Space (Percent of sRGB) (%) | 64.95 | 80 23% | 64 -1% | 57.3 -12% | 85.5 32% |
| Total Average (Program / Settings) | 21% /
19% | 1% /
12% | -9% /
-23% | 20% /
15% |
* ... smaller is better
Display Response Times
| ↔ Response Time Black to White | ||
|---|---|---|
| 33.6 ms ... rise ↗ and fall ↘ combined | ↗ 7.6 ms rise | 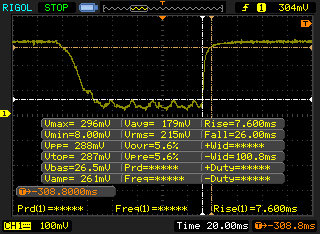 |
| ↘ 26 ms fall | ||
| The screen shows slow response rates in our tests and will be unsatisfactory for gamers. In comparison, all tested devices range from 0.1 (minimum) to 240 (maximum) ms. » 90 % of all devices are better. This means that the measured response time is worse than the average of all tested devices (19.8 ms). | ||
| ↔ Response Time 50% Grey to 80% Grey | ||
| 42 ms ... rise ↗ and fall ↘ combined | ↗ 13.2 ms rise | 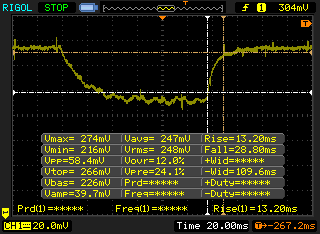 |
| ↘ 28.8 ms fall | ||
| The screen shows slow response rates in our tests and will be unsatisfactory for gamers. In comparison, all tested devices range from 0.165 (minimum) to 636 (maximum) ms. » 67 % of all devices are better. This means that the measured response time is worse than the average of all tested devices (31 ms). | ||
Screen Flickering / PWM (Pulse-Width Modulation)
| Screen flickering / PWM detected | 198.4 Hz | 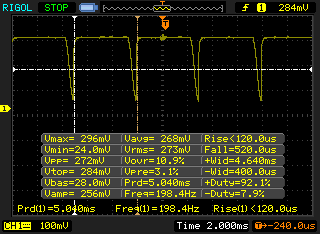 | |
The display backlight flickers at 198.4 Hz (worst case, e.g., utilizing PWM) . The frequency of 198.4 Hz is relatively low, so sensitive users will likely notice flickering and experience eyestrain at the stated brightness setting and below. In comparison: 52 % of all tested devices do not use PWM to dim the display. If PWM was detected, an average of 7763 (minimum: 5 - maximum: 343500) Hz was measured. | |||
| wPrime 2.10 - 1024m | |
| HP Pavilion 15t-au100 CTO (W0P31AV) | |
| Acer Aspire E5-575G-549D | |
| Dell XPS 15 9550 i7 FHD | |
| HP Pavilion 15 UHD T9Y85AV | |
| Super Pi Mod 1.5 XS 32M - 32M | |
| Acer Aspire E5-575G-549D | |
| HP Pavilion 15t-au100 CTO (W0P31AV) | |
| Dell XPS 15 9550 i7 FHD | |
| HP Pavilion 15 UHD T9Y85AV | |
* ... smaller is better
| PCMark 8 Home Score Accelerated v2 | 3424 points | |
| PCMark 8 Creative Score Accelerated v2 | 4089 points | |
| PCMark 8 Work Score Accelerated v2 | 4340 points | |
Help | ||
| HP Pavilion 15t-au100 CTO (W0P31AV) Toshiba MQ01ABD100 | Acer Aspire E5-575G-549D Toshiba MQ01ABD100 | Lenovo IdeaPad 510-15IKB 80SV0087GE Liteonit CV3-DE256 | Asus Zenbook UX510UW-CN044T SanDisk SD8SNAT256G1002 | Dell XPS 15 9550 i7 FHD Samsung PM951 NVMe 512 GB | HP Pavilion 15 UHD T9Y85AV SanDisk Z400s SD8SNAT-128G | |
|---|---|---|---|---|---|---|
| CrystalDiskMark 3.0 | -20% | 10956% | 7338% | 16558% | 6457% | |
| Read Seq (MB/s) | 109.5 | 95.3 -13% | 469.2 328% | 459.3 319% | 1291 1079% | 484.6 343% |
| Write Seq (MB/s) | 105.2 | 85.6 -19% | 431.5 310% | 325.5 209% | 590 461% | 185.2 76% |
| Read 512 (MB/s) | 34.08 | 29.32 -14% | 338.3 893% | 279.2 719% | 632 1754% | 307.6 803% |
| Write 512 (MB/s) | 40.02 | 25.93 -35% | 297.9 644% | 280.1 600% | 588 1369% | 180 350% |
| Read 4k (MB/s) | 0.429 | 0.366 -15% | 28.68 6585% | 22.43 5128% | 41.4 9550% | 22.08 5047% |
| Write 4k (MB/s) | 1.008 | 0.726 -28% | 66.8 6527% | 74.9 7331% | 132.4 13035% | 77.7 7608% |
| Read 4k QD32 (MB/s) | 0.81 | 0.647 -20% | 364.7 44925% | 149 18295% | 542 66814% | 143.7 17641% |
| Write 4k QD32 (MB/s) | 0.893 | 0.722 -19% | 245.9 27436% | 234 26104% | 343.8 38399% | 177.6 19788% |

| 3DMark | |
| 1280x720 Cloud Gate Standard Graphics | |
| Dell XPS 15 9550 i7 FHD | |
| HP Pavilion 15 UHD T9Y85AV | |
| Asus Zenbook UX510UW-CN044T | |
| Acer Aspire E5-575G-549D | |
| HP Pavilion 15t-au100 CTO (W0P31AV) | |
| 1920x1080 Fire Strike Graphics | |
| HP Pavilion 15 UHD T9Y85AV | |
| Dell XPS 15 9550 i7 FHD | |
| Asus Zenbook UX510UW-CN044T | |
| Acer Aspire E5-575G-549D | |
| HP Pavilion 15t-au100 CTO (W0P31AV) | |
| 1920x1080 Ice Storm Extreme Graphics | |
| Dell XPS 15 9550 i7 FHD | |
| Asus Zenbook UX510UW-CN044T | |
| HP Pavilion 15 UHD T9Y85AV | |
| 3DMark 11 Performance | 2622 points | |
| 3DMark Cloud Gate Standard Score | 7017 points | |
| 3DMark Fire Strike Score | 1538 points | |
| 3DMark Fire Strike Extreme Score | 777 points | |
Help | ||
| Rise of the Tomb Raider | |
| 1024x768 Lowest Preset (sort by value) | |
| HP Pavilion 15t-au100 CTO (W0P31AV) | |
| Acer Aspire E5-575G-549D | |
| 1366x768 Medium Preset AF:2x (sort by value) | |
| HP Pavilion 15t-au100 CTO (W0P31AV) | |
| Acer Aspire E5-575G-549D | |
| 1920x1080 High Preset AA:FX AF:4x (sort by value) | |
| HP Pavilion 15t-au100 CTO (W0P31AV) | |
| Acer Aspire E5-575G-549D | |
| Dell XPS 15 9550 i7 FHD | |
| HP Pavilion 15 UHD T9Y85AV | |
| 1920x1080 Very High Preset AA:FX AF:16x (sort by value) | |
| HP Pavilion 15t-au100 CTO (W0P31AV) | |
| Acer Aspire E5-575G-549D | |
| Dell XPS 15 9550 i7 FHD | |
| HP Pavilion 15 UHD T9Y85AV | |
| GRID 2 | |
| 1024x768 Ultra Low Preset (sort by value) | |
| HP Pavilion 15t-au100 CTO (W0P31AV) | |
| 1366x768 Medium Preset (sort by value) | |
| HP Pavilion 15t-au100 CTO (W0P31AV) | |
| 1366x768 High Preset AA:2xMS (sort by value) | |
| HP Pavilion 15t-au100 CTO (W0P31AV) | |
| 1920x1080 Ultra Preset AA:4xMS (sort by value) | |
| HP Pavilion 15t-au100 CTO (W0P31AV) | |
| Metro: Last Light | |
| 1024x768 Low (DX10) AF:4x (sort by value) | |
| HP Pavilion 15t-au100 CTO (W0P31AV) | |
| 1366x768 Medium (DX10) AF:4x (sort by value) | |
| HP Pavilion 15t-au100 CTO (W0P31AV) | |
| 1366x768 High (DX11) AF:16x (sort by value) | |
| HP Pavilion 15t-au100 CTO (W0P31AV) | |
| Dell XPS 15 9550 i7 FHD | |
| HP Pavilion 15 UHD T9Y85AV | |
| 1920x1080 Very High (DX11) AF:16x (sort by value) | |
| HP Pavilion 15t-au100 CTO (W0P31AV) | |
| Dell XPS 15 9550 i7 FHD | |
| HP Pavilion 15 UHD T9Y85AV | |
| Tomb Raider | |
| 1024x768 Low Preset (sort by value) | |
| HP Pavilion 15t-au100 CTO (W0P31AV) | |
| Asus Zenbook UX510UW-CN044T | |
| 1366x768 Normal Preset AA:FX AF:4x (sort by value) | |
| HP Pavilion 15t-au100 CTO (W0P31AV) | |
| Asus Zenbook UX510UW-CN044T | |
| 1366x768 High Preset AA:FX AF:8x (sort by value) | |
| HP Pavilion 15t-au100 CTO (W0P31AV) | |
| Asus Zenbook UX510UW-CN044T | |
| Dell XPS 15 9550 i7 FHD | |
| 1920x1080 Ultra Preset AA:FX AF:16x (sort by value) | |
| HP Pavilion 15t-au100 CTO (W0P31AV) | |
| Asus Zenbook UX510UW-CN044T | |
| Dell XPS 15 9550 i7 FHD | |
| Company of Heroes 2 | |
| 1024x768 Minimum / Low / Off AA:Off (sort by value) | |
| HP Pavilion 15t-au100 CTO (W0P31AV) | |
| 1366x768 Medium AA:Off (sort by value) | |
| HP Pavilion 15t-au100 CTO (W0P31AV) | |
| 1366x768 High AA:Medium (sort by value) | |
| HP Pavilion 15t-au100 CTO (W0P31AV) | |
| 1920x1080 Maximum / Higher / High AA:High (sort by value) | |
| HP Pavilion 15t-au100 CTO (W0P31AV) | |
| Sleeping Dogs | |
| 1024x768 Low Preset AA:Normal (sort by value) | |
| HP Pavilion 15t-au100 CTO (W0P31AV) | |
| 1366x768 Medium Preset AA:Normal (sort by value) | |
| HP Pavilion 15t-au100 CTO (W0P31AV) | |
| 1366x768 High Preset AA:High (sort by value) | |
| HP Pavilion 15t-au100 CTO (W0P31AV) | |
| Dell XPS 15 9550 i7 FHD | |
| HP Pavilion 15 UHD T9Y85AV | |
| 1920x1080 Extreme Preset AA:Extreme (sort by value) | |
| HP Pavilion 15t-au100 CTO (W0P31AV) | |
| Dell XPS 15 9550 i7 FHD | |
| HP Pavilion 15 UHD T9Y85AV | |
| low | med. | high | ultra | |
|---|---|---|---|---|
| Dirt 3 (2011) | 67.8 | 48.7 | 41.6 | 28.9 |
| Anno 2070 (2011) | 130.4 | 66.8 | 42.5 | 21 |
| Sleeping Dogs (2012) | 92.9 | 69.9 | 34 | 9 |
| Hitman: Absolution (2012) | 61.3 | 38.3 | 17.8 | 6.6 |
| Tomb Raider (2013) | 137 | 66.4 | 37.4 | 18.3 |
| BioShock Infinite (2013) | 90.3 | 62.4 | 42.7 | 14.6 |
| Metro: Last Light (2013) | 49.3 | 38.4 | 23.5 | 11.6 |
| GRID 2 (2013) | 125.4 | 89.8 | 60.3 | 21.2 |
| Company of Heroes 2 (2013) | 36.1 | 29.5 | 21 | 7.2 |
| F1 2013 (2013) | 120 | 81 | 41 | 31 |
| Rise of the Tomb Raider (2016) | 34.7 | 22.1 | 13.2 | 10.1 |
Noise level
| Idle |
| 32.2 / 32.2 / 33.7 dB(A) |
| Load |
| 39.4 / 42.2 dB(A) |
 | ||
30 dB silent 40 dB(A) audible 50 dB(A) loud |
||
min: | ||
| HP Pavilion 15t-au100 CTO (W0P31AV) GeForce 940MX, i7-7500U, Toshiba MQ01ABD100 | Asus Zenbook UX510UW-CN044T GeForce GTX 960M, 6500U, SanDisk SD8SNAT256G1002 | Lenovo IdeaPad 510-15IKB 80SV0087GE GeForce 940MX, i7-7500U, Liteonit CV3-DE256 | Acer Aspire E5-575G-549D GeForce GTX 950M, i5-7200U, Toshiba MQ01ABD100 | Dell XPS 15 9550 i7 FHD GeForce GTX 960M, 6700HQ, Samsung PM951 NVMe 512 GB | HP Pavilion 15 UHD T9Y85AV GeForce GTX 960M, 6700HQ, SanDisk Z400s SD8SNAT-128G | |
|---|---|---|---|---|---|---|
| Noise | -1% | 5% | 7% | 5% | -4% | |
| Idle Minimum * (dB) | 32.2 | 31.6 2% | 32.6 -1% | 30.8 4% | 29.2 9% | 32.3 -0% |
| Idle Average * (dB) | 32.2 | 31.6 2% | 32.6 -1% | 30.8 4% | 29.3 9% | 32.4 -1% |
| Idle Maximum * (dB) | 33.7 | 33.4 1% | 32.6 3% | 30.8 9% | 29.5 12% | 32.4 4% |
| Load Average * (dB) | 39.4 | 41.7 -6% | 35.3 10% | 33.4 15% | 36.5 7% | 40.5 -3% |
| Load Maximum * (dB) | 42.2 | 44.8 -6% | 37.1 12% | 40.1 5% | 47.7 -13% | 50.3 -19% |
| off / environment * (dB) | 31.6 | 31.6 | 28.9 | 29.5 |
* ... smaller is better
(±) The maximum temperature on the upper side is 40 °C / 104 F, compared to the average of 36.8 °C / 98 F, ranging from 21 to 71 °C for the class Multimedia.
(+) The bottom heats up to a maximum of 34.8 °C / 95 F, compared to the average of 39.1 °C / 102 F
(+) In idle usage, the average temperature for the upper side is 24.4 °C / 76 F, compared to the device average of 31.3 °C / 88 F.
(+) The palmrests and touchpad are cooler than skin temperature with a maximum of 27.2 °C / 81 F and are therefore cool to the touch.
(±) The average temperature of the palmrest area of similar devices was 28.7 °C / 83.7 F (+1.5 °C / 2.7 F).
HP Pavilion 15t-au100 CTO (W0P31AV) audio analysis
(-) | not very loud speakers (58 dB)
Bass 100 - 315 Hz
(±) | reduced bass - on average 14.1% lower than median
(±) | linearity of bass is average (12.4% delta to prev. frequency)
Mids 400 - 2000 Hz
(±) | higher mids - on average 5.6% higher than median
(±) | linearity of mids is average (7.2% delta to prev. frequency)
Highs 2 - 16 kHz
(+) | balanced highs - only 3.1% away from median
(+) | highs are linear (6.6% delta to prev. frequency)
Overall 100 - 16.000 Hz
(-) | overall sound is not linear (32.9% difference to median)
Compared to same class
» 97% of all tested devices in this class were better, 1% similar, 2% worse
» The best had a delta of 5%, average was 17%, worst was 45%
Compared to all devices tested
» 92% of all tested devices were better, 1% similar, 7% worse
» The best had a delta of 4%, average was 23%, worst was 134%
Apple MacBook 12 (Early 2016) 1.1 GHz audio analysis
(+) | speakers can play relatively loud (83.6 dB)
Bass 100 - 315 Hz
(±) | reduced bass - on average 11.3% lower than median
(±) | linearity of bass is average (14.2% delta to prev. frequency)
Mids 400 - 2000 Hz
(+) | balanced mids - only 2.4% away from median
(+) | mids are linear (5.5% delta to prev. frequency)
Highs 2 - 16 kHz
(+) | balanced highs - only 2% away from median
(+) | highs are linear (4.5% delta to prev. frequency)
Overall 100 - 16.000 Hz
(+) | overall sound is linear (10.2% difference to median)
Compared to same class
» 7% of all tested devices in this class were better, 2% similar, 91% worse
» The best had a delta of 5%, average was 18%, worst was 53%
Compared to all devices tested
» 5% of all tested devices were better, 1% similar, 94% worse
» The best had a delta of 4%, average was 23%, worst was 134%
| Off / Standby | |
| Idle | |
| Load |
|
Key:
min: | |
| HP Pavilion 15t-au100 CTO (W0P31AV) i7-7500U, GeForce 940MX, Toshiba MQ01ABD100, IPS, 1920x1080, 15.6" | Asus Zenbook UX510UW-CN044T 6500U, GeForce GTX 960M, SanDisk SD8SNAT256G1002, IPS, 1920x1080, 15.6" | Lenovo IdeaPad 510-15IKB 80SV0087GE i7-7500U, GeForce 940MX, Liteonit CV3-DE256, IPS, 1920x1080, 15.6" | Acer Aspire E5-575G-549D i5-7200U, GeForce GTX 950M, Toshiba MQ01ABD100, TN, 1920x1080, 15.6" | HP Pavilion 15 UHD T9Y85AV 6700HQ, GeForce GTX 960M, SanDisk Z400s SD8SNAT-128G, IPS, 3840x2160, 15.6" | |
|---|---|---|---|---|---|
| Power Consumption | -18% | 15% | -10% | -69% | |
| Idle Minimum * (Watt) | 6.16 | 5 19% | 3.9 37% | 6 3% | 8.3 -35% |
| Idle Average * (Watt) | 8.48 | 8.9 -5% | 7.4 13% | 8.1 4% | 14.8 -75% |
| Idle Maximum * (Watt) | 9.62 | 11.8 -23% | 9.5 1% | 9.8 -2% | 16.8 -75% |
| Load Average * (Watt) | 41.63 | 55 -32% | 41 2% | 52.5 -26% | 71 -71% |
| Load Maximum * (Watt) | 63.22 | 93 -47% | 48 24% | 81.6 -29% | 119.2 -89% |
* ... smaller is better
| HP Pavilion 15t-au100 CTO (W0P31AV) i7-7500U, GeForce 940MX, 41 Wh | Asus Zenbook UX510UW-CN044T 6500U, GeForce GTX 960M, 48 Wh | Lenovo IdeaPad 510-15IKB 80SV0087GE i7-7500U, GeForce 940MX, 30 Wh | Acer Aspire E5-575G-549D i5-7200U, GeForce GTX 950M, 62 Wh | Dell XPS 15 9550 i7 FHD 6700HQ, GeForce GTX 960M, 84 Wh | HP Pavilion 15 UHD T9Y85AV 6700HQ, GeForce GTX 960M, 61.5 Wh | |
|---|---|---|---|---|---|---|
| Battery runtime | 57% | 24% | 50% | 90% | 8% | |
| Reader / Idle (h) | 7.3 | 13.6 86% | 12.8 75% | 16.3 123% | 8.5 16% | |
| WiFi v1.3 (h) | 3.7 | 7.2 95% | 4.6 24% | 7.5 103% | 9.1 146% | 4.4 19% |
| Load (h) | 1.8 | 1.6 -11% | 1.3 -28% | 1.8 0% | 1.6 -11% |
Pros
Cons

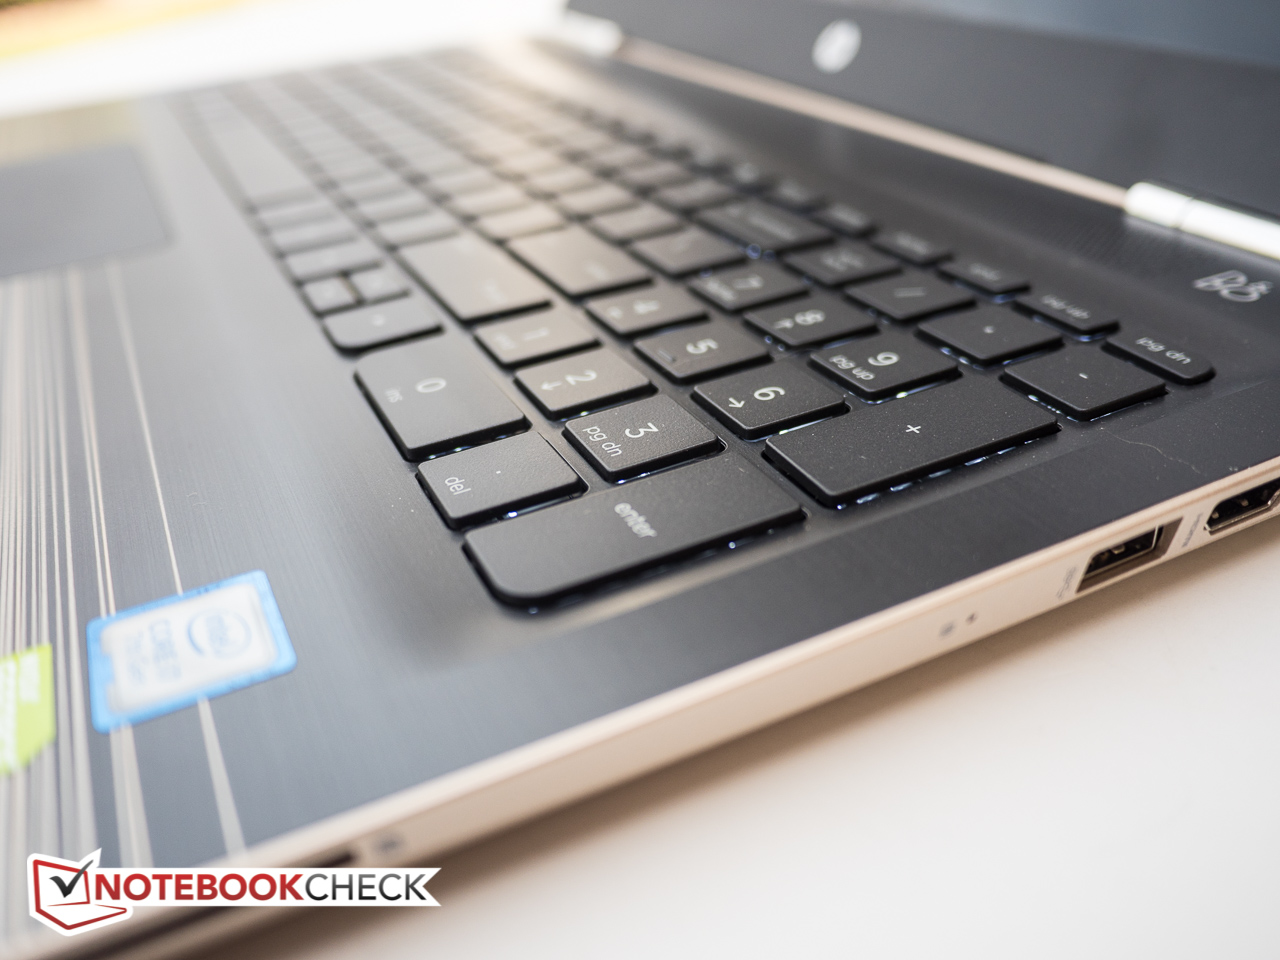
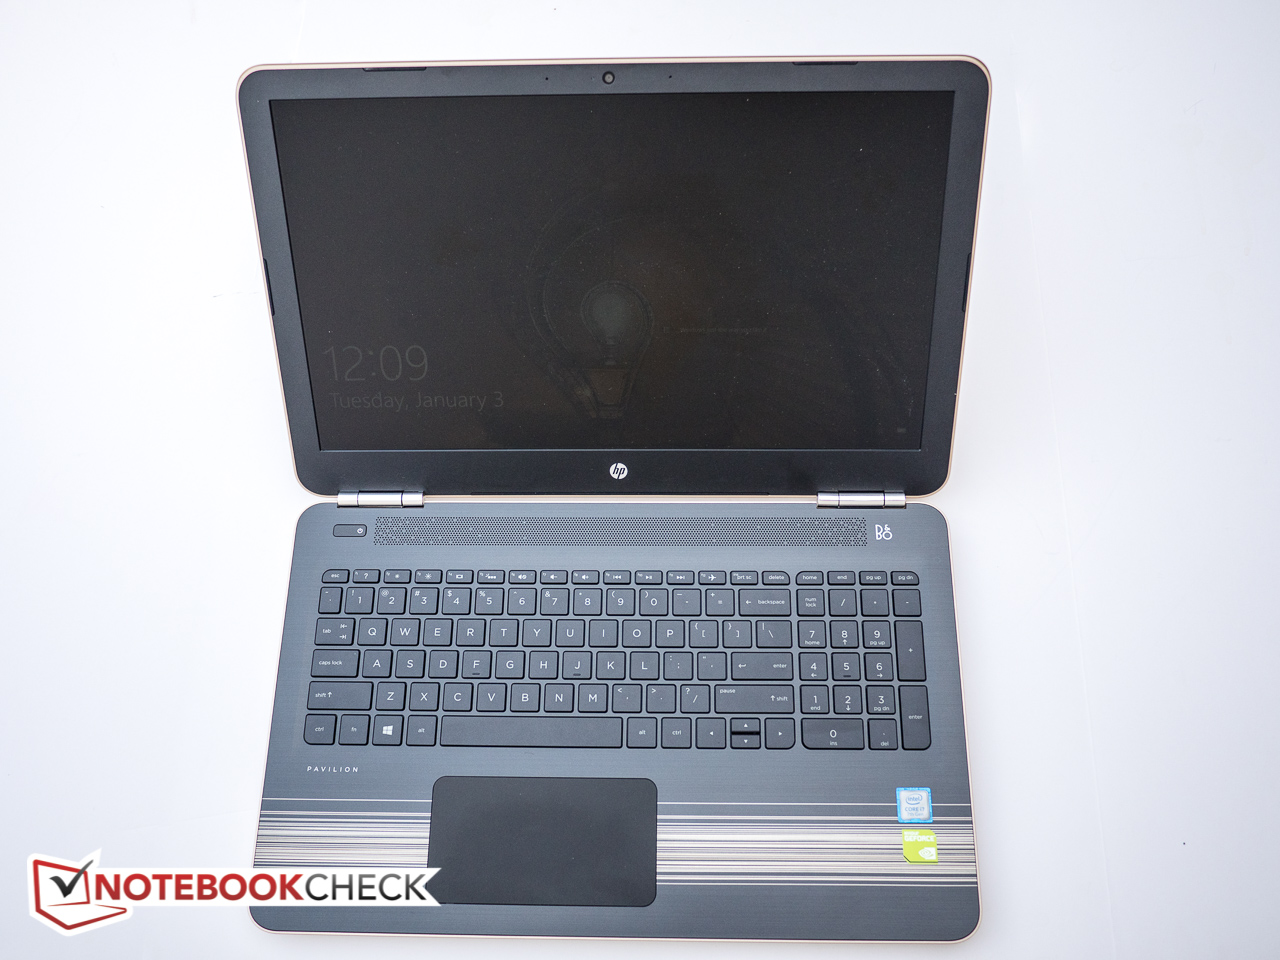
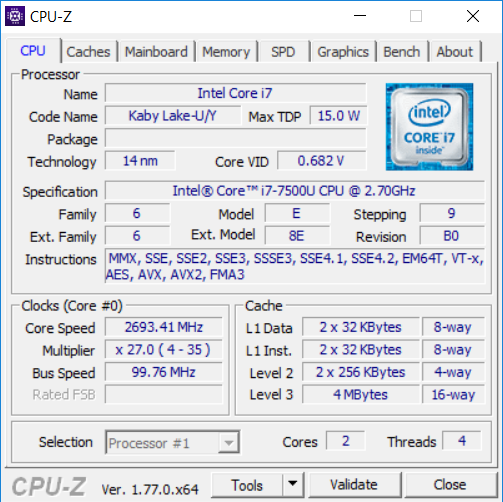
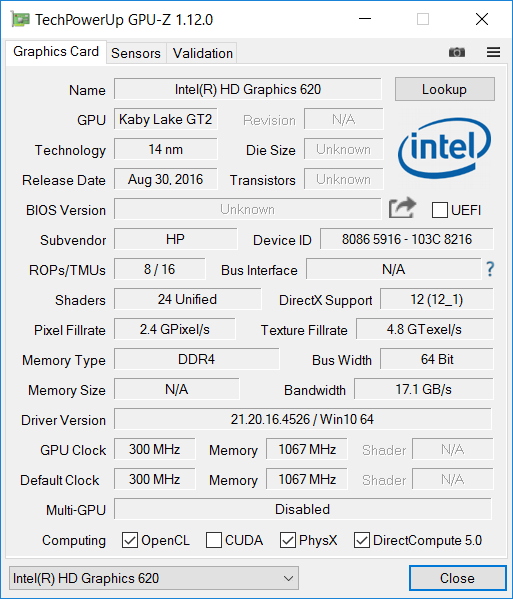
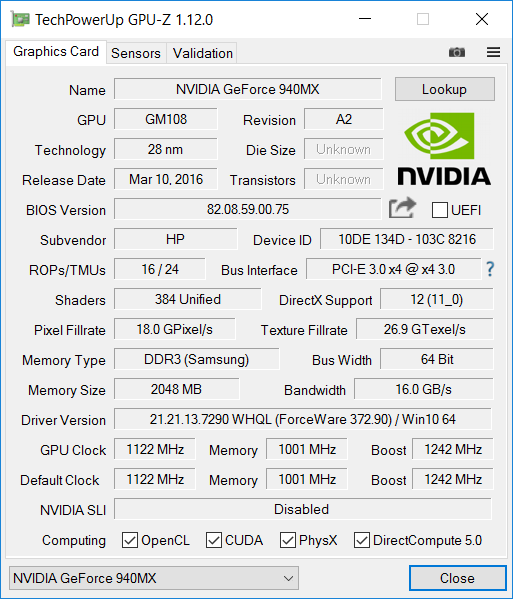
惠普Pavilion 15t-au100是一款富有吸引力的15.6英寸笔记本电脑,具有足够的性能来应对日常工作。配备了新一代双核i7处理器,8GB内存和专用的中端显卡GeForce 940MX,即使是轻量级到中等的游戏也不在话下。虽然整体性能非常体面,但该机型的瓶颈毫无疑问是在机械硬盘驱动器上,它的转速在5400RPM。该笔记本电脑没有使用固态驱动器的竞争对手那么快。幸运的是,该系列的一些型号配备了PCIe NVMe M.2固态硬盘,甚至可以配备固态硬盘和常规SATA驱动器,以提高性能,同时保持存储成本的低廉。
另一个缺点在于屏幕,它非常昏暗还带有眩光问题。这两个问题使得,在户外或是明亮的环境中工作成为一个挑战。最后,电池续航时间也有限。有些竞争对手甚至拥有它两倍的续航时间。
惠普Pavilion 15t提供了不错的性能,但仍然受制于机械硬盘驱动器,屏幕以及短暂的电池续航。除非惠普提高全高清机型的亮度,否则我们宁愿选择带有固态硬盘驱动器和更强的图形的超高清机型。
注:本文是基于完整评测的缩减版本,阅读完整的英文评测,请点击这里。
HP Pavilion 15t-au100 CTO (W0P31AV)
- 01/07/2017 v6 (old)
Bernhard Pechlaner
Price comparison
