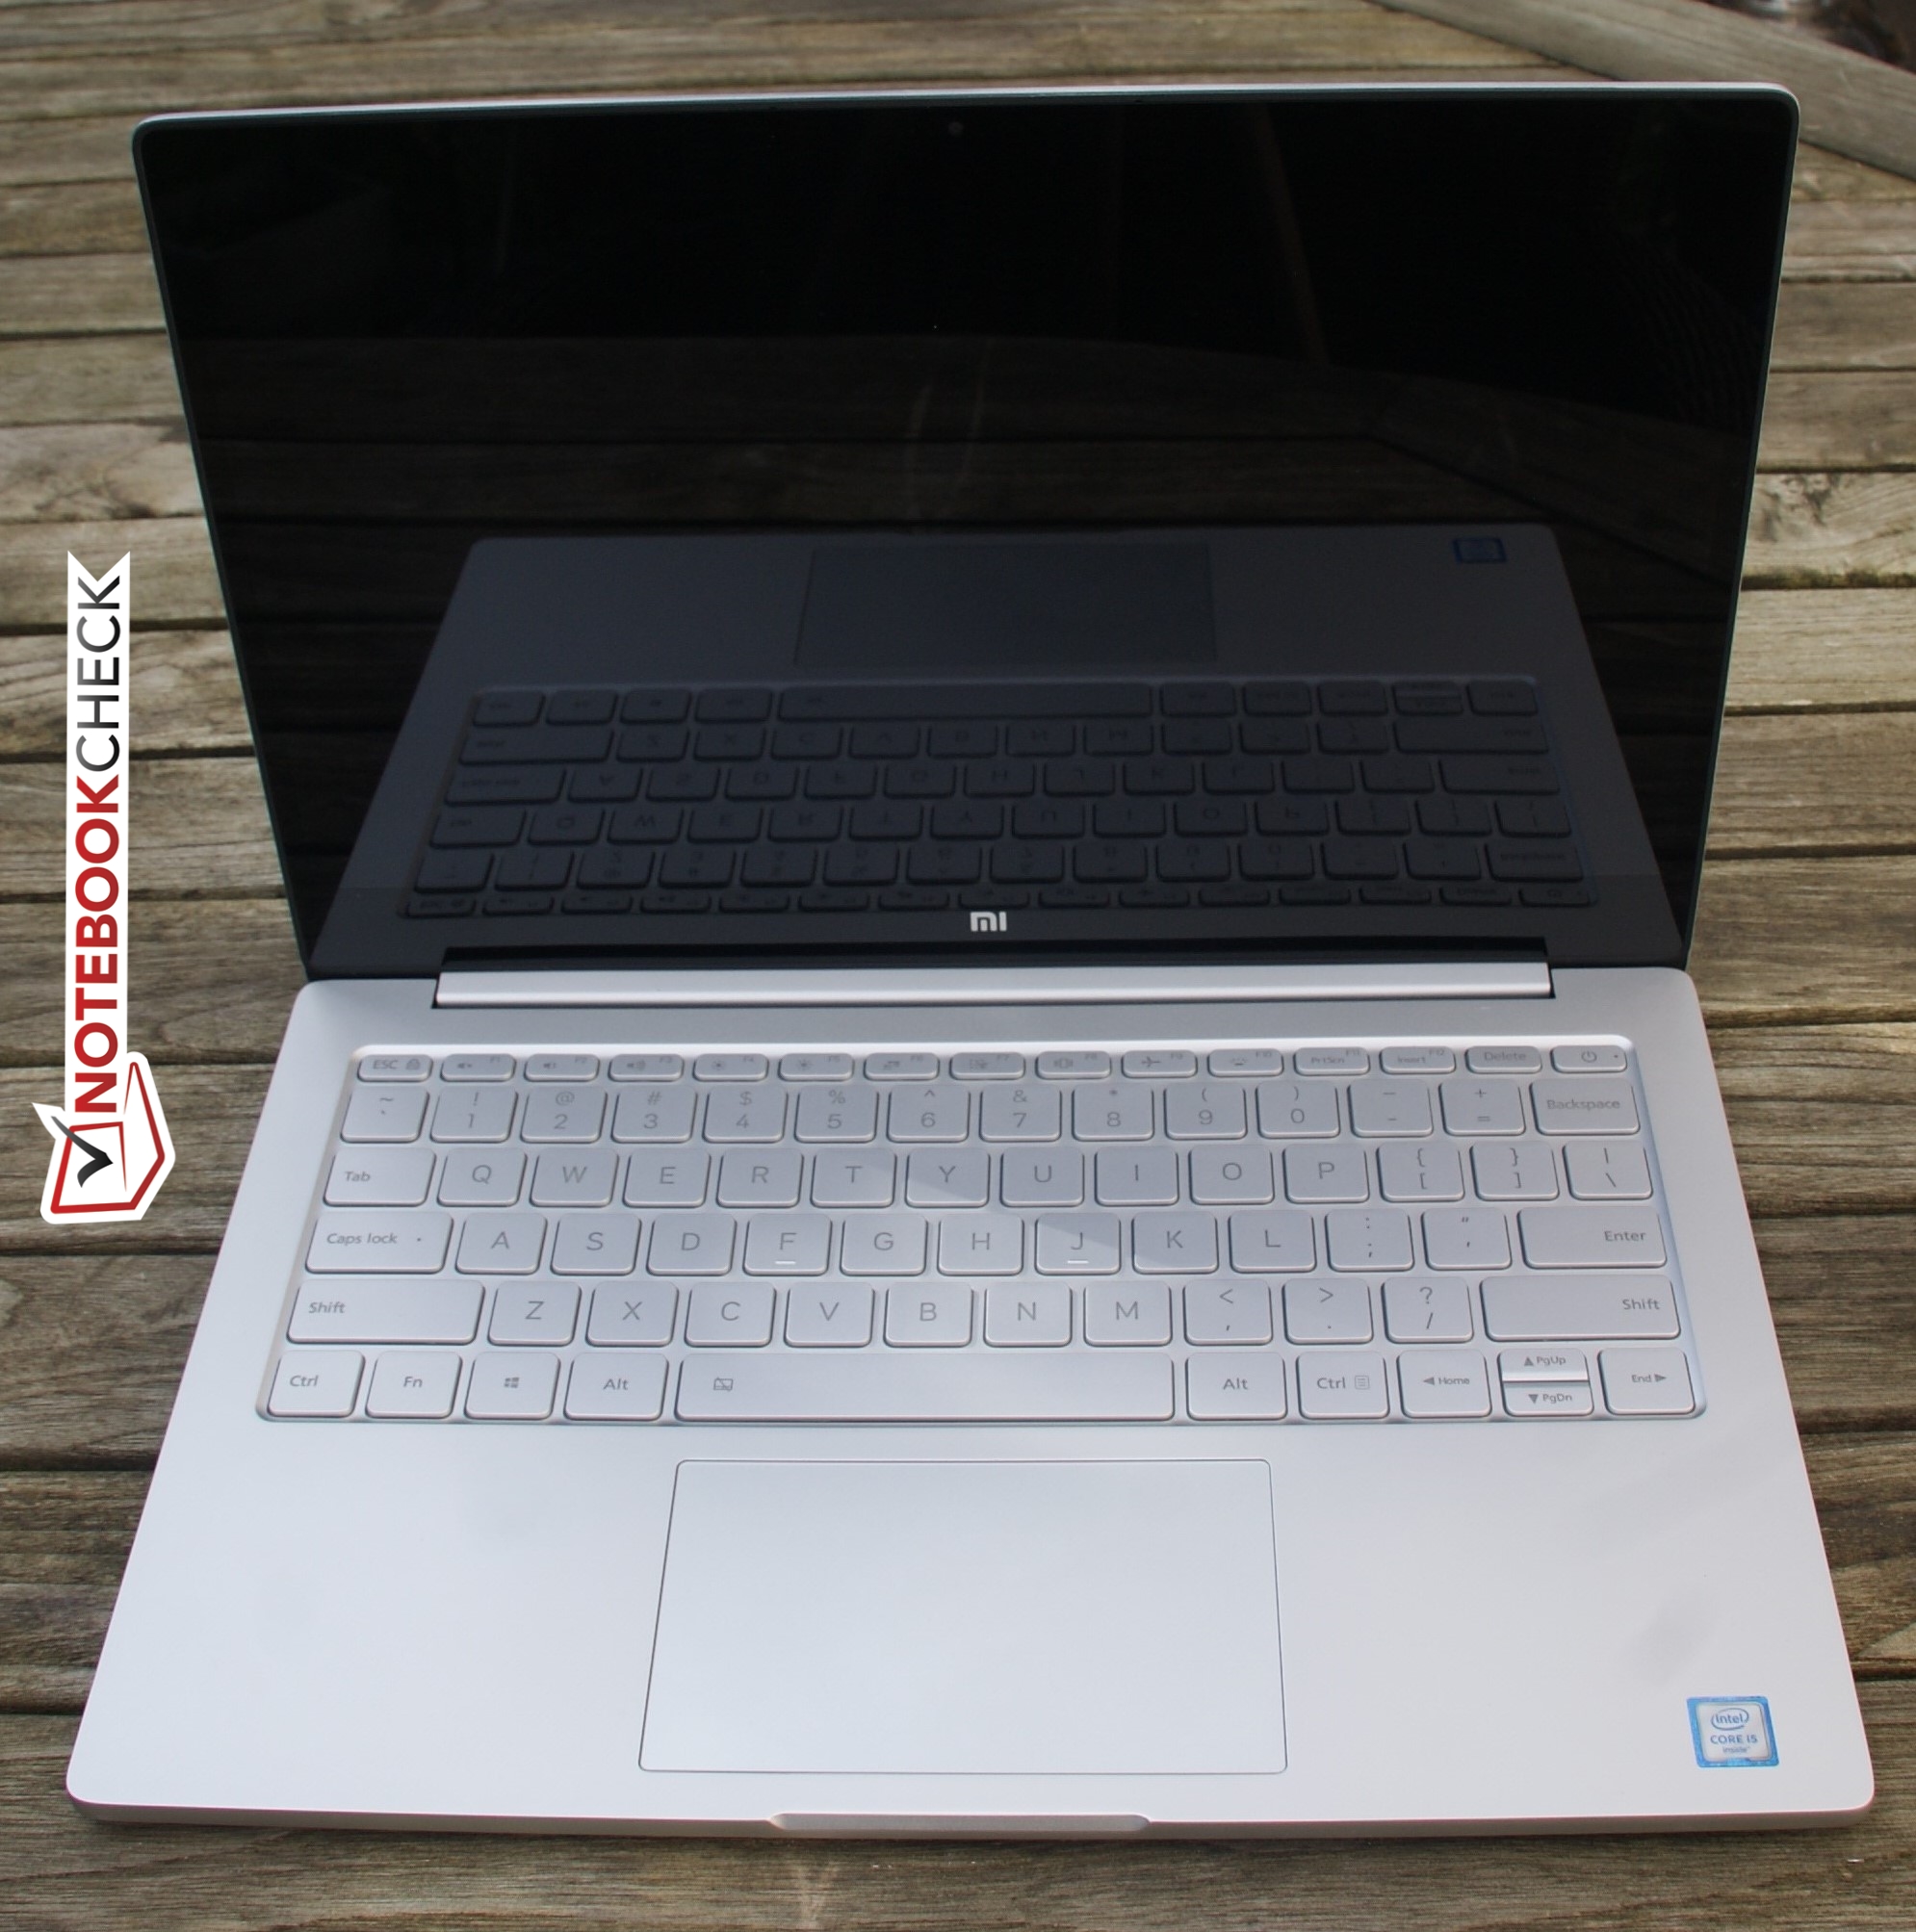
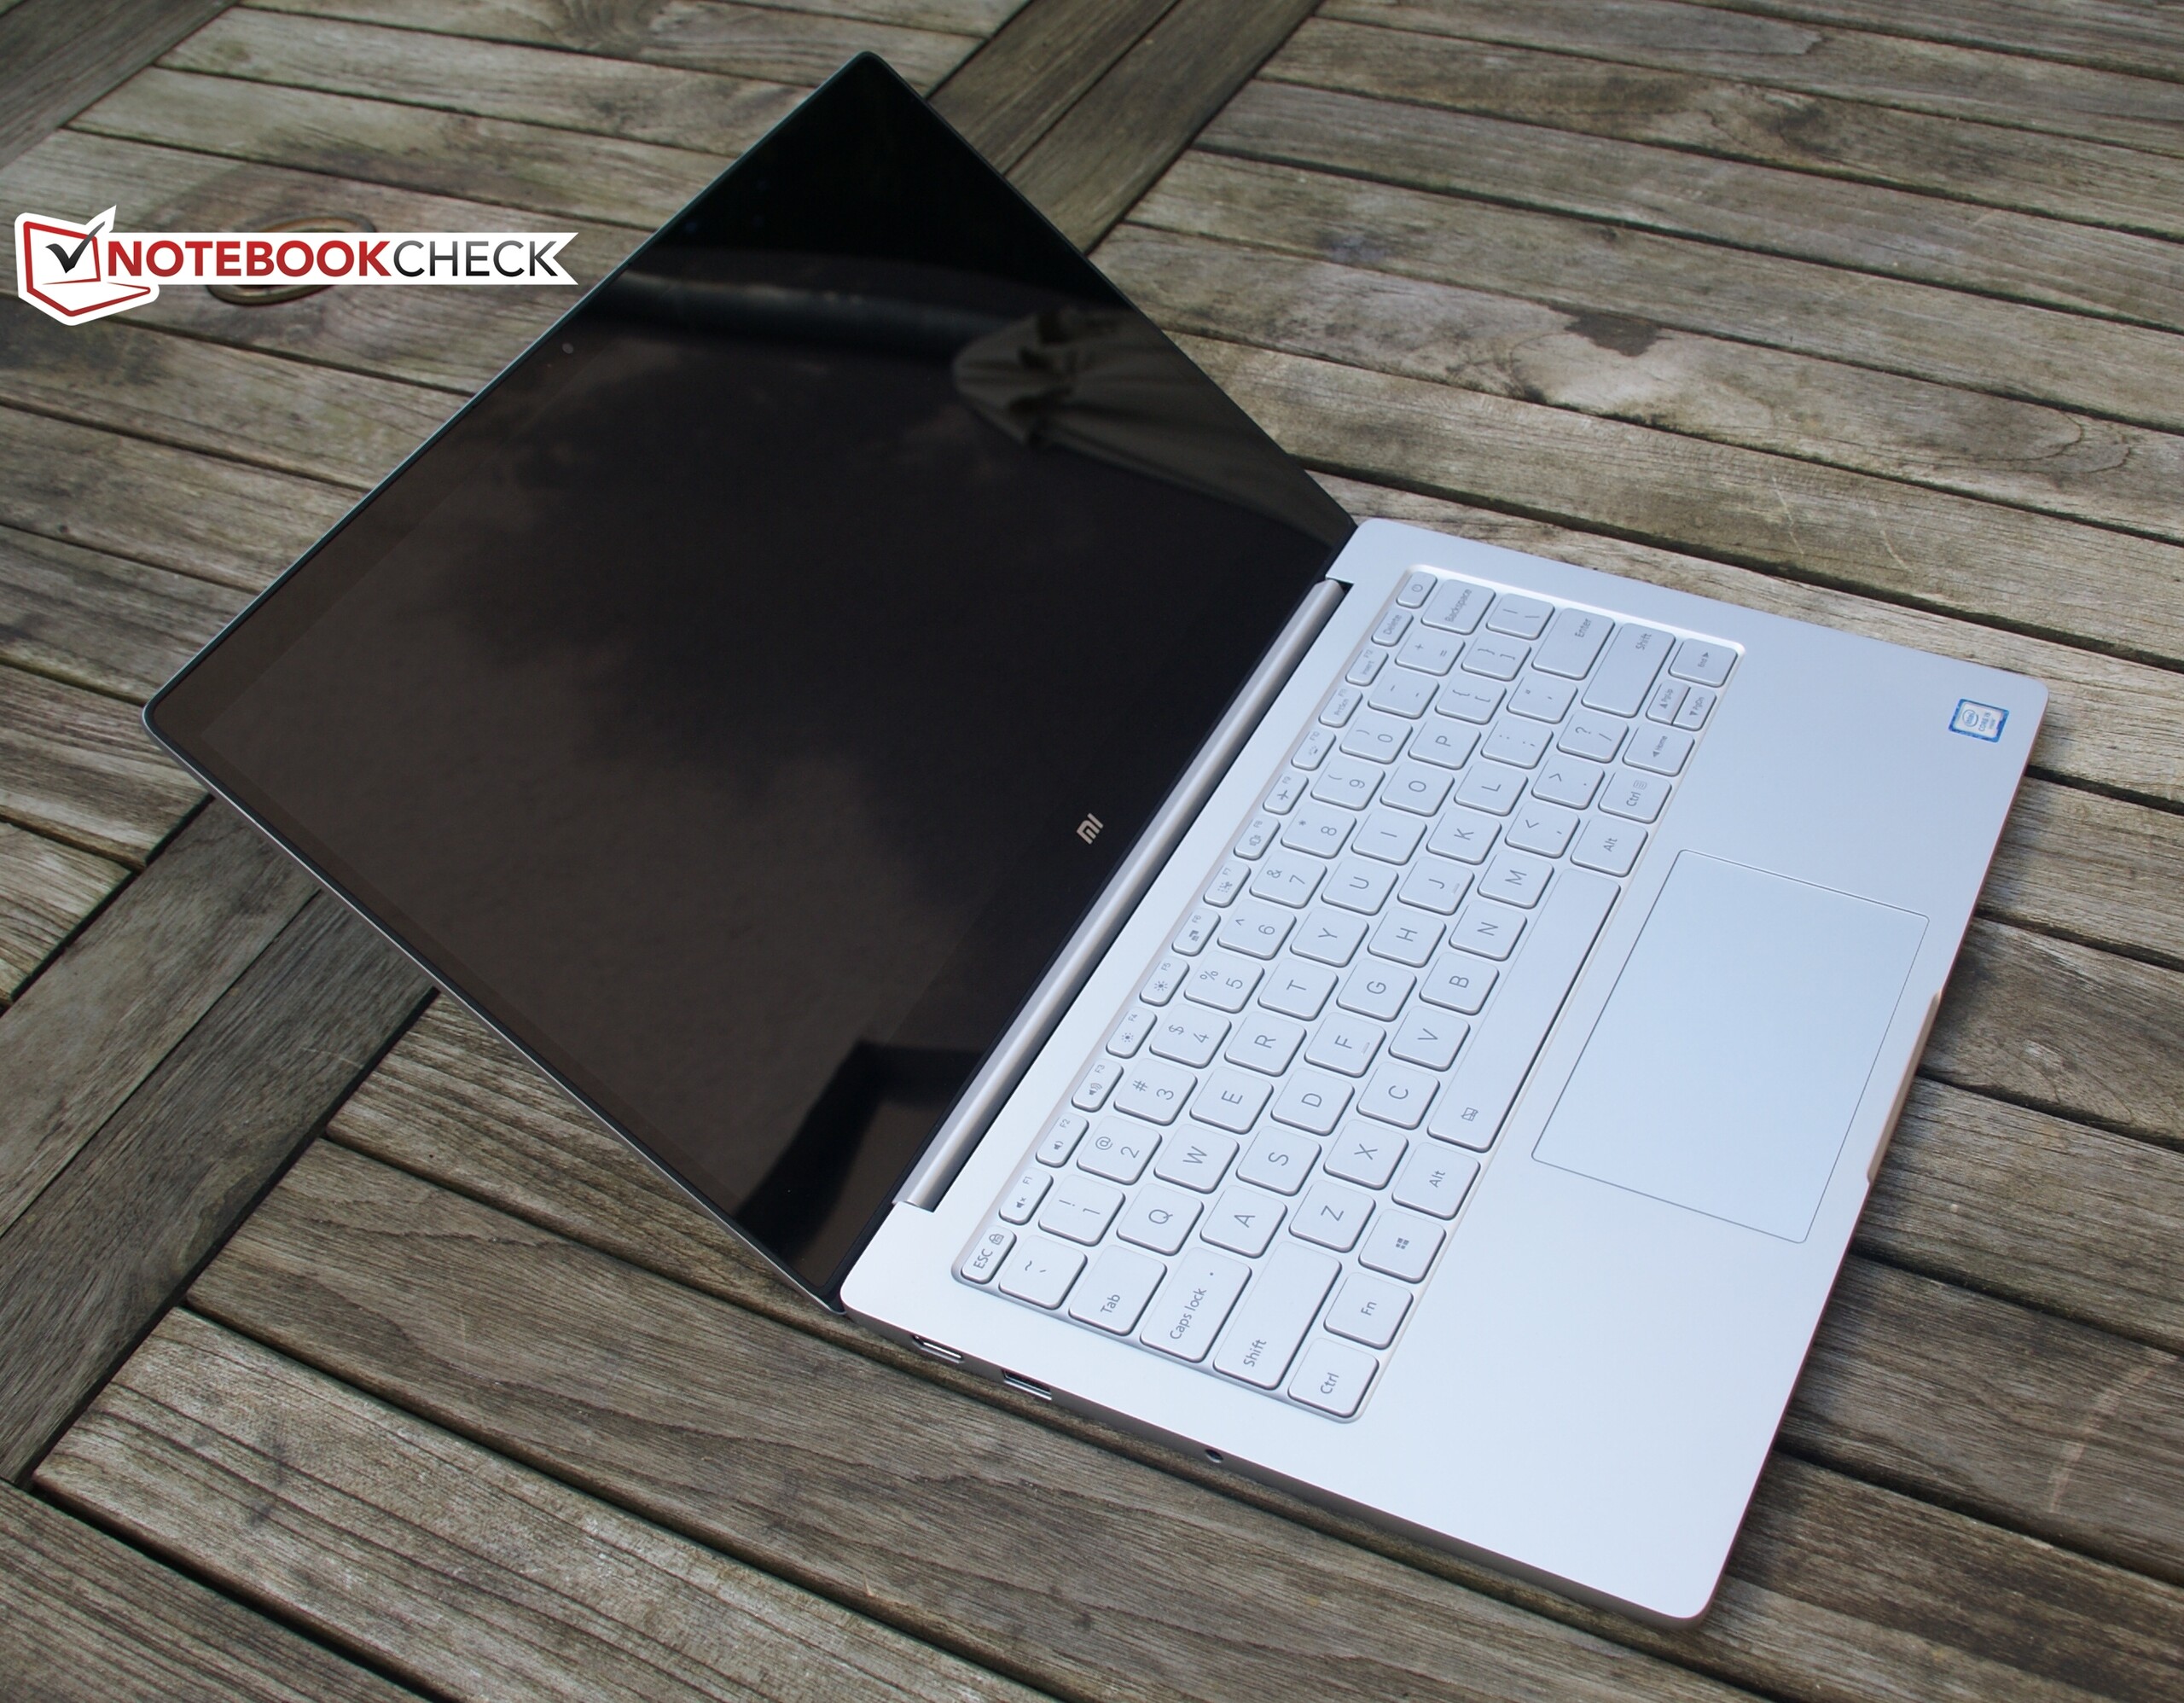
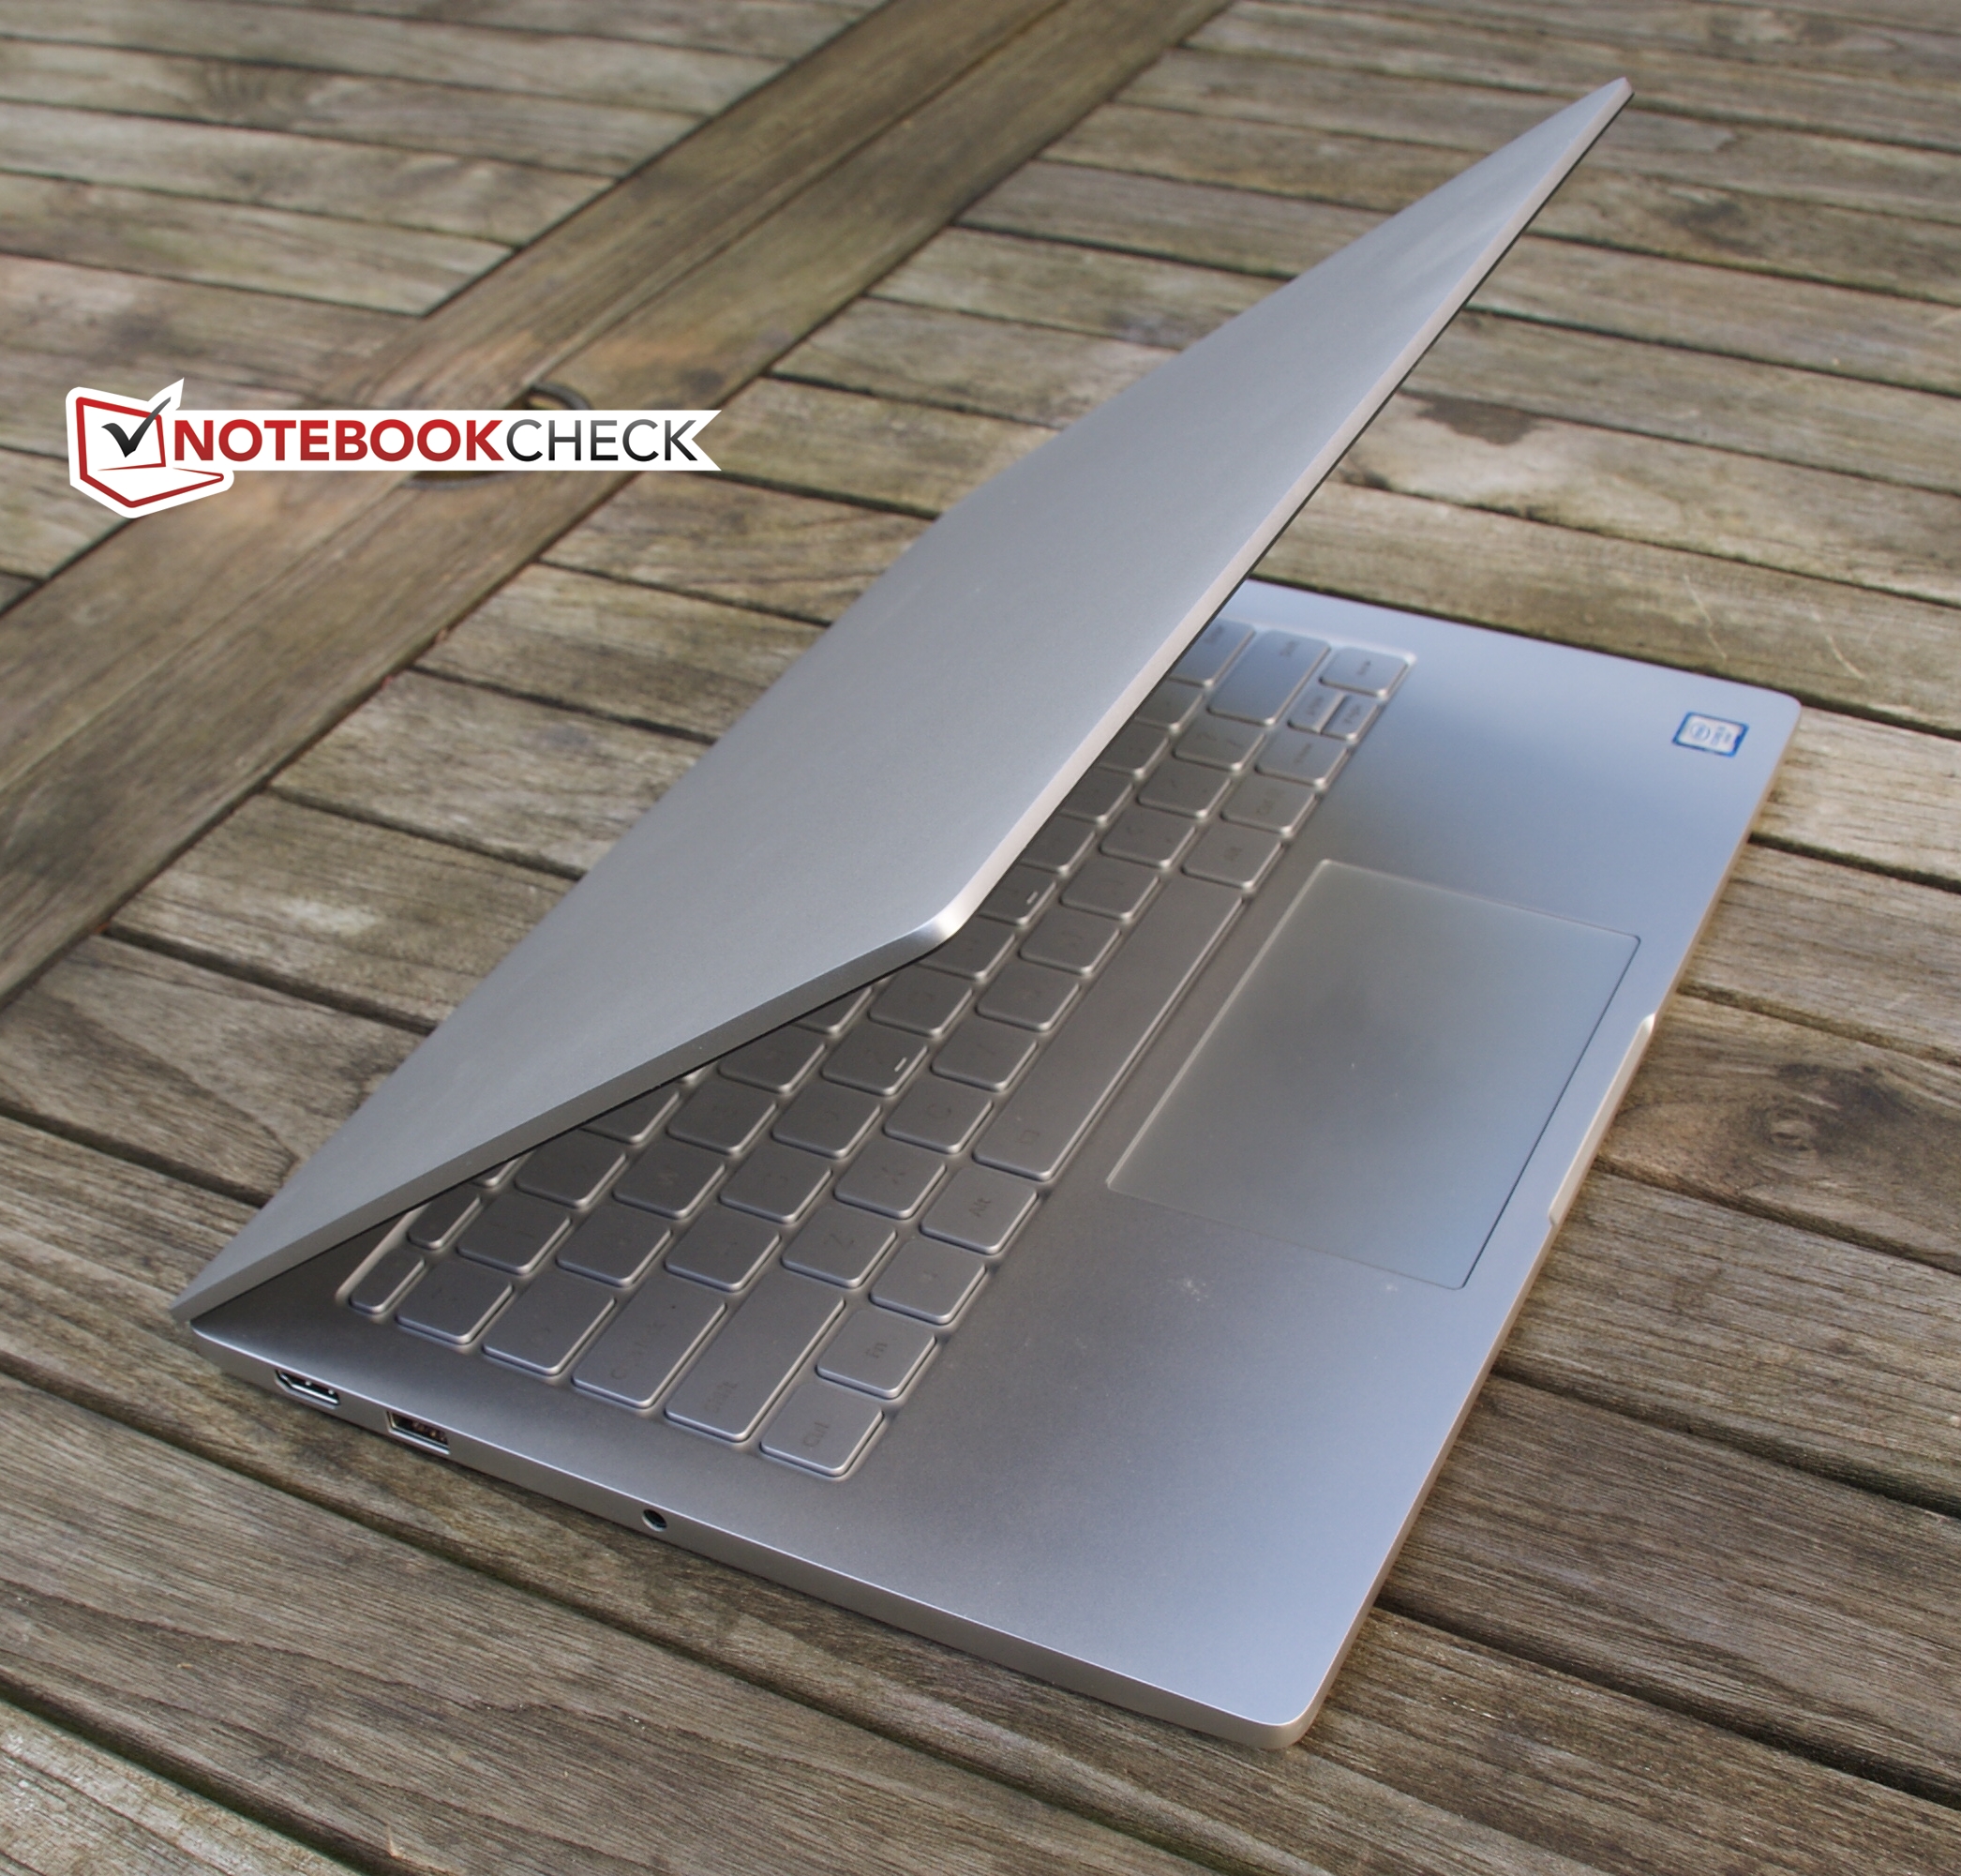
小米 Mi Air (13.3寸) 笔记本电脑简短评测
| Networking | |
| iperf Server (receive) TCP 1 m | |
| Xiaomi Mi Notebook Air 13.3 2016 | |
| Acer TravelMate X3 X349-M-7261 (jseb) | |
| Medion Akoya S3409-MD60234 (jseb) | |
| iperf Client (transmit) TCP 1 m | |
| Acer TravelMate X3 X349-M-7261 (jseb) | |
| Xiaomi Mi Notebook Air 13.3 2016 | |
| Medion Akoya S3409-MD60234 (jseb) | |
| |||||||||||||||||||||||||
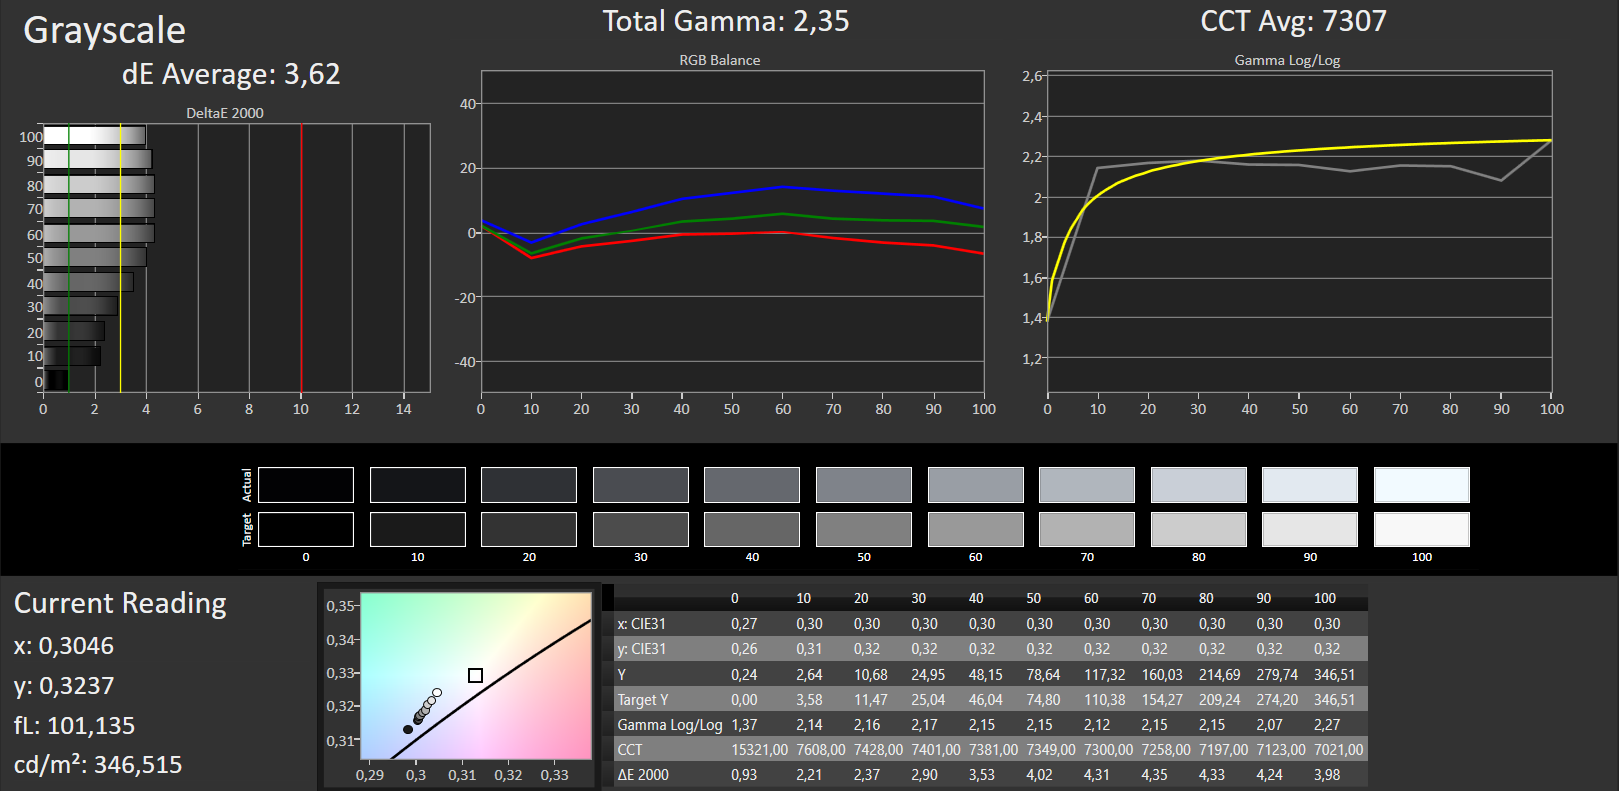
Brightness Distribution: 80 %
Center on Battery: 347 cd/m²
Contrast: 1285:1 (Black: 0.27 cd/m²)
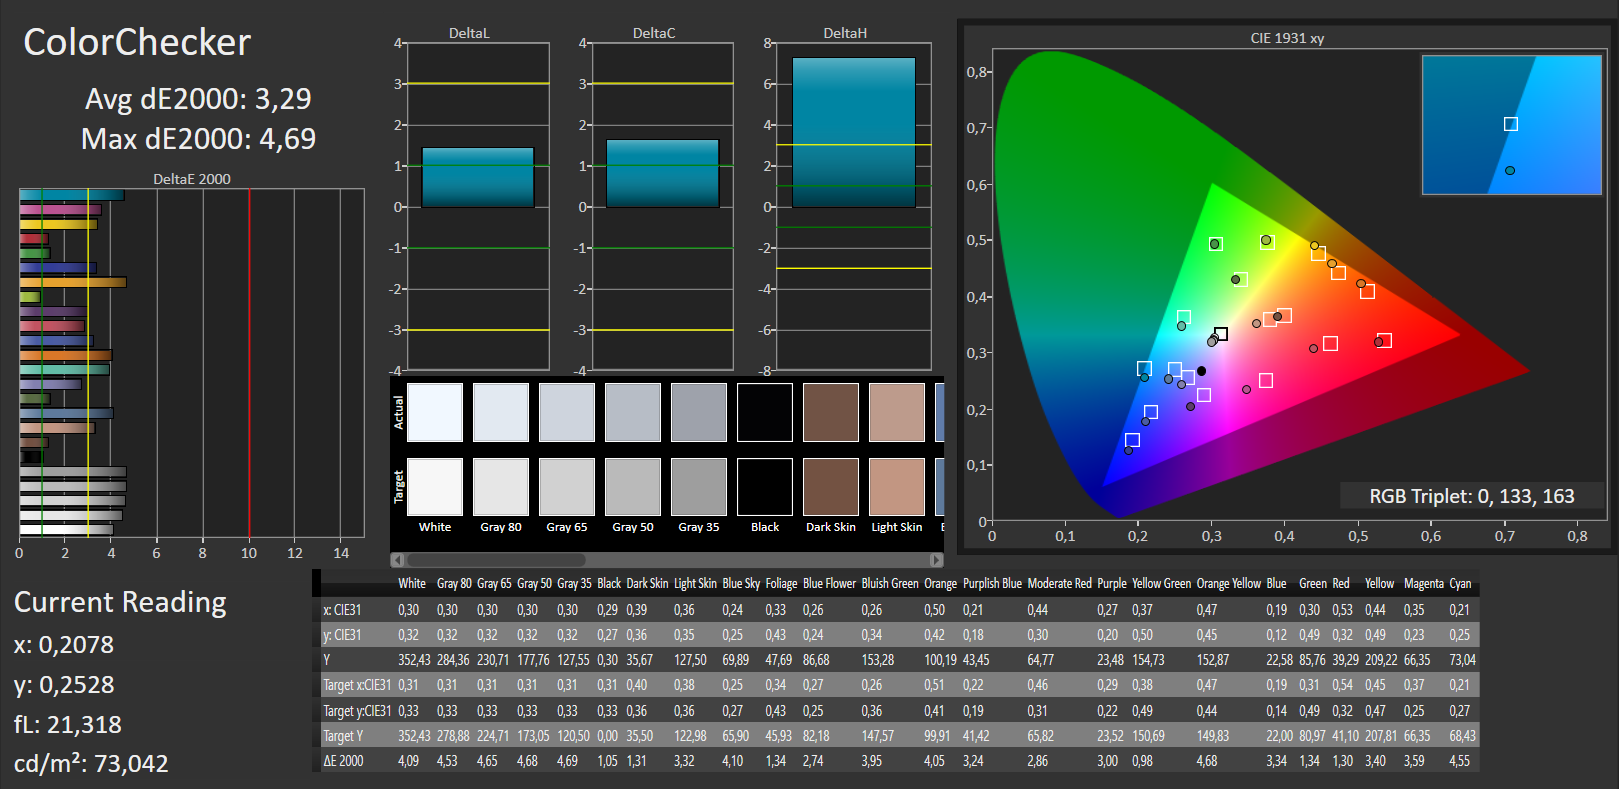
ΔE ColorChecker Calman: 3.29 | ∀{0.5-29.43 Ø4.71}
ΔE Greyscale Calman: 3.62 | ∀{0.09-98 Ø4.96}
95% sRGB (Argyll 1.6.3 3D)
62% AdobeRGB 1998 (Argyll 1.6.3 3D)
67.8% AdobeRGB 1998 (Argyll 3D)
95.5% sRGB (Argyll 3D)
66% Display P3 (Argyll 3D)
Gamma: 2.23
CCT: 7307 K
| Xiaomi Mi Notebook Air 13.3 2016 Samsung LTN133HL09-M01, , 1920x1080, 13.3" | Dell XPS 13 2016 9350 (FHD, i7-6560U) Sharp SHP1449 LQ133M1, , 1920x1080, 13.3" | Dell XPS 13 9360 QHD+ i5 Sharp SHP144A, , 3200x1800, 13.3" | Apple MacBook Air 13 inch 2015-03 Apple APP9CF0, , 1440x900, 13.3" | Apple MacBook Pro Retina 13 inch 2015-03 APPA02A, , 2560x1600, 13.3" | Lenovo IdeaPad 710S-13ISK 80SW0031US Sharp SHP 1447 / LQ133M1JW15, , 1920x1080, 13.3" | |
|---|---|---|---|---|---|---|
| Display | -16% | -3% | -38% | 0% | 1% | |
| Display P3 Coverage (%) | 66 | 54.8 -17% | 64.6 -2% | 40.1 -39% | 65.9 0% | 65.9 0% |
| sRGB Coverage (%) | 95.5 | 82.3 -14% | 91.6 -4% | 59.8 -37% | 97 2% | 97 2% |
| AdobeRGB 1998 Coverage (%) | 67.8 | 56.6 -17% | 66.5 -2% | 41.51 -39% | 67.4 -1% | 68 0% |
| Response Times | 11% | 11% | -39% | |||
| Response Time Grey 50% / Grey 80% * (ms) | 49 ? | 42.8 ? 13% | 31 ? 37% | 56 ? -14% | ||
| Response Time Black / White * (ms) | 27 ? | 24.8 ? 8% | 31.2 ? -16% | 44 ? -63% | ||
| PWM Frequency (Hz) | 50 ? | 219.3 ? | ||||
| Screen | 1% | -4% | -25% | 8% | -37% | |
| Brightness middle (cd/m²) | 347 | 385 11% | 444 28% | 329 -5% | 361 4% | 349 1% |
| Brightness (cd/m²) | 334 | 350 5% | 393 18% | 310 -7% | 342 2% | 339 1% |
| Brightness Distribution (%) | 80 | 86 8% | 82 2% | 82 2% | 81 1% | 88 10% |
| Black Level * (cd/m²) | 0.27 | 0.17 37% | 0.33 -22% | 0.405 -50% | 0.361 -34% | 0.393 -46% |
| Contrast (:1) | 1285 | 2265 76% | 1345 5% | 812 -37% | 1000 -22% | 888 -31% |
| Colorchecker dE 2000 * | 3.29 | 4.17 -27% | 4 -22% | 3.96 -20% | 1.82 45% | 6.85 -108% |
| Colorchecker dE 2000 max. * | 4.69 | 7.61 -62% | 7.7 -64% | 7.51 -60% | 3.26 30% | 10.27 -119% |
| Greyscale dE 2000 * | 3.62 | 5.39 -49% | 2.83 22% | 3.51 3% | 1.8 50% | 6.43 -78% |
| Gamma | 2.23 99% | 2.12 104% | 2.05 107% | 3.83 57% | 2.49 88% | 1.83 120% |
| CCT | 7307 89% | 7404 88% | 6963 93% | 6711 97% | 6417 101% | 7820 83% |
| Color Space (Percent of AdobeRGB 1998) (%) | 62 | 62.7 1% | 59.3 -4% | 38.4 -38% | 61.9 0% | 61.9 0% |
| Color Space (Percent of sRGB) (%) | 95 | 99.8 5% | 91.4 -4% | 59.8 -37% | 96.9 2% | 97.3 2% |
| Total Average (Program / Settings) | -1% /
-1% | 1% /
-2% | -32% /
-28% | 4% /
6% | -25% /
-30% |
* ... smaller is better
Display Response Times
| ↔ Response Time Black to White | ||
|---|---|---|
| 27 ms ... rise ↗ and fall ↘ combined | ↗ 8 ms rise | 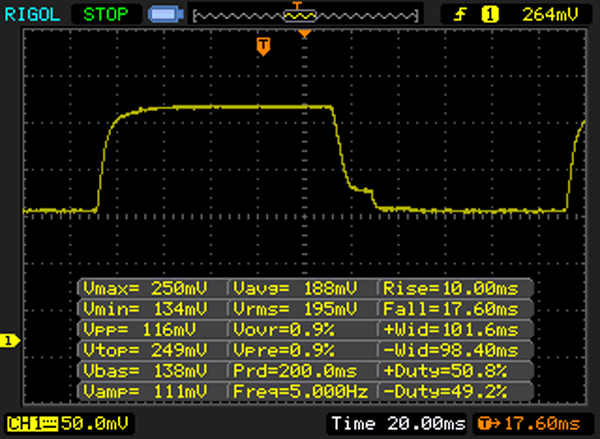 |
| ↘ 19 ms fall | ||
| The screen shows relatively slow response rates in our tests and may be too slow for gamers. In comparison, all tested devices range from 0.1 (minimum) to 240 (maximum) ms. » 67 % of all devices are better. This means that the measured response time is worse than the average of all tested devices (19.8 ms). | ||
| ↔ Response Time 50% Grey to 80% Grey | ||
| 49 ms ... rise ↗ and fall ↘ combined | ↗ 20 ms rise | 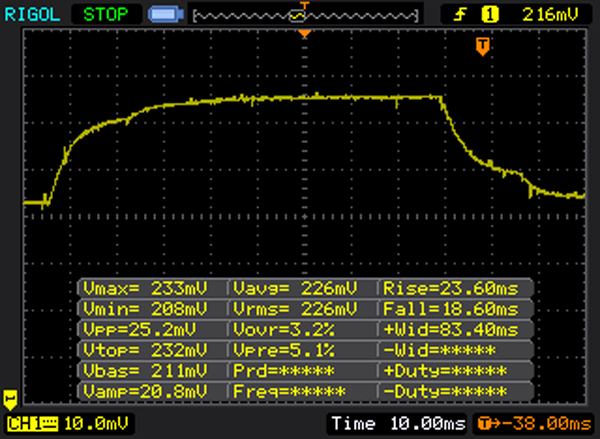 |
| ↘ 29 ms fall | ||
| The screen shows slow response rates in our tests and will be unsatisfactory for gamers. In comparison, all tested devices range from 0.165 (minimum) to 636 (maximum) ms. » 85 % of all devices are better. This means that the measured response time is worse than the average of all tested devices (31 ms). | ||
Screen Flickering / PWM (Pulse-Width Modulation)
| Screen flickering / PWM detected | 50 Hz | ≤ 30 % brightness setting | 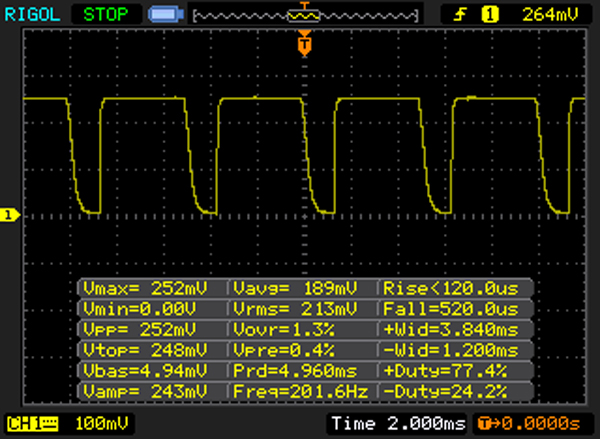 |
The display backlight flickers at 50 Hz (worst case, e.g., utilizing PWM) Flickering detected at a brightness setting of 30 % and below. There should be no flickering or PWM above this brightness setting. The frequency of 50 Hz is very low, so the flickering may cause eyestrain and headaches after extended use. In comparison: 52 % of all tested devices do not use PWM to dim the display. If PWM was detected, an average of 7757 (minimum: 5 - maximum: 343500) Hz was measured. | |||
| Cinebench R15 | |
| CPU Single 64Bit | |
| Lenovo ThinkPad T460s 20FA003FPB | |
| Xiaomi Mi Notebook Air 13.3 2016 | |
| Dell XPS 13-9350 | |
| Lenovo ThinkPad T460s-20F9003SGE | |
| Apple MacBook Air 13 inch 2015-03 | |
| Lenovo IdeaPad 710S-13ISK 80SW0031US | |
| CPU Multi 64Bit | |
| Lenovo ThinkPad T460s 20FA003FPB | |
| Apple MacBook Air 13 inch 2015-03 | |
| Xiaomi Mi Notebook Air 13.3 2016 | |
| Lenovo ThinkPad T460s-20F9003SGE | |
| Dell XPS 13-9350 | |
| Lenovo IdeaPad 710S-13ISK 80SW0031US | |
| PCMark 8 | |
| Home Score Accelerated v2 | |
| Apple MacBook Air 13 inch 2015-03 | |
| Lenovo IdeaPad 710S-13ISK 80SW0031US | |
| Xiaomi Mi Notebook Air 13.3 2016 | |
| Lenovo ThinkPad T460s-20F9003SGE | |
| Lenovo Yoga 900-13ISK 80MK | |
| Dell XPS 13 9360 QHD+ i5 | |
| Work Score Accelerated v2 | |
| Apple MacBook Air 13 inch 2015-03 | |
| Lenovo IdeaPad 710S-13ISK 80SW0031US | |
| Xiaomi Mi Notebook Air 13.3 2016 | |
| Lenovo ThinkPad T460s-20F9003SGE | |
| Lenovo Yoga 900-13ISK 80MK | |
| PCMark 8 Home Score Accelerated v2 | 3144 points | |
| PCMark 8 Work Score Accelerated v2 | 4274 points | |
Help | ||
| Xiaomi Mi Notebook Air 13.3 2016 Samsung PM951 NVMe MZVLV256 | Dell XPS 13 9360 QHD+ i5 Toshiba NVMe THNSN5256GPUK | Lenovo Yoga 900-13ISK 80MK Samsung SSD PM871 MZNLN512HCJH | Lenovo ThinkPad T460s-20F9003SGE Samsung CM871 MZ7LF192HCGS | Lenovo IdeaPad 710S-13ISK 80SW0031US Samsung MZNLN128HCGR-000L2 | |
|---|---|---|---|---|---|
| CrystalDiskMark 3.0 | -4% | -28% | -74% | -38% | |
| Read Seq (MB/s) | 1209 | 1168 -3% | 514 -57% | 446.5 -63% | 524 -57% |
| Write Seq (MB/s) | 314 | 329 5% | 459.5 46% | 171.1 -46% | 157.5 -50% |
| Read 512 (MB/s) | 1015 | 413.4 | 259.2 | 398.9 | |
| Write 512 (MB/s) | 307 | 424.5 | 167.2 | 157.7 | |
| Read 4k (MB/s) | 43.4 | 33 -24% | 36.34 -16% | 5.78 -87% | 36.57 -16% |
| Write 4k (MB/s) | 153.4 | 132 -14% | 100.1 -35% | 35.47 -77% | 99.4 -35% |
| Read 4k QD32 (MB/s) | 487.6 | 525 8% | 313.8 -36% | 94.9 -81% | 397.5 -18% |
| Write 4k QD32 (MB/s) | 312.2 | 325 4% | 96.8 -69% | 36.43 -88% | 157 -50% |

| 3DMark 11 Performance | 2578 points | |
| 3DMark Cloud Gate Standard Score | 7168 points | |
| 3DMark Fire Strike Score | 1832 points | |
Help | ||
| BioShock Infinite | |
| 1920x1080 Ultra Preset, DX11 (DDOF) | |
| Xiaomi Mi Notebook Air 13.3 2016 | |
| Dell Inspiron 17 7778 | |
| Lenovo Yoga 710-14ISK | |
| 1366x768 High Preset | |
| Xiaomi Mi Notebook Air 13.3 2016 | |
| Dell Inspiron 17 7778 | |
| Lenovo Yoga 710-14ISK | |
| 1366x768 Medium Preset | |
| Xiaomi Mi Notebook Air 13.3 2016 | |
| Dell Inspiron 17 7778 | |
| Lenovo Yoga 710-14ISK | |
| 1280x720 Very Low Preset | |
| Dell Inspiron 17 7778 | |
| Xiaomi Mi Notebook Air 13.3 2016 | |
| Lenovo Yoga 710-14ISK | |
| low | med. | high | ultra | |
|---|---|---|---|---|
| Civilization 5 (2010) | 70.9 | 20.7 | ||
| BioShock Infinite (2013) | 106.5 | 65.6 | 57.1 | 19.82 |
| Company of Heroes 2 (2013) | 37.1 | 29.3 | 16.46 | |
| Total War: Rome II (2013) | 82.7 | 64.8 | 56 | 14.1 |
| Rise of the Tomb Raider (2016) | 35.7 | 23.2 | 13.2 | |
| Ashes of the Singularity (2016) | 23.5 | |||
| Doom (2016) | 26.75 | 11.97 |
Noise level
| Idle |
| 31.15 / 31.15 / 31.15 dB(A) |
| HDD |
| 31.15 dB(A) |
| Load |
| 38.2 / 41.7 dB(A) |
 | ||
30 dB silent 40 dB(A) audible 50 dB(A) loud |
||
min: | ||
(-) The maximum temperature on the upper side is 51 °C / 124 F, compared to the average of 35.9 °C / 97 F, ranging from 21.4 to 59 °C for the class Subnotebook.
(-) The bottom heats up to a maximum of 47 °C / 117 F, compared to the average of 39.2 °C / 103 F
(+) In idle usage, the average temperature for the upper side is 23.8 °C / 75 F, compared to the device average of 30.8 °C / 87 F.
(+) The palmrests and touchpad are cooler than skin temperature with a maximum of 29.9 °C / 85.8 F and are therefore cool to the touch.
(±) The average temperature of the palmrest area of similar devices was 28.2 °C / 82.8 F (-1.7 °C / -3 F).
| Off / Standby | |
| Idle | |
| Load |
|
Key:
min: | |
| Xiaomi Mi Notebook Air 13.3 2016 6200U, GeForce 940MX, Samsung PM951 NVMe MZVLV256, IPS, 1920x1080, 13.3" | Dell XPS 13 9360 QHD+ i5 i5-7200U, HD Graphics 620, Toshiba NVMe THNSN5256GPUK, , 3200x1800, 13.3" | Lenovo IdeaPad 710S-13ISK 6560U, Iris Graphics 540, Samsung PM951 NVMe MZVLV256, IPS, 1920x1080, 13.3" | Microsoft Surface Book Core i7 6600U, Maxwell GPU (940M, GDDR5), Samsung MZFLV512 NVMe, IPS, 3000x2000, 13.5" | Apple MacBook Pro Retina 13 inch 2015-03 5257U, Iris Graphics 6100, Apple SSD SM0128G, IPS-Panel, 2560x1600, 13.3" | Lenovo ThinkPad T460s-20F9003SGE 6200U, HD Graphics 520, Samsung CM871 MZ7LF192HCGS, IPS, 1920x1080, 14" | |
|---|---|---|---|---|---|---|
| Power Consumption | 19% | 5% | -29% | -9% | 15% | |
| Idle Minimum * (Watt) | 4 | 3.7 7% | 3.3 17% | 4.5 -13% | 2.8 30% | 3.7 7% |
| Idle Average * (Watt) | 6.6 | 6.1 8% | 7.4 -12% | 9.8 -48% | 7.8 -18% | 6.8 -3% |
| Idle Maximum * (Watt) | 7.4 | 6.5 12% | 8.2 -11% | 12.2 -65% | 8.1 -9% | 7.3 1% |
| Load Average * (Watt) | 41.7 | 29.5 29% | 36.5 12% | 46 -10% | 52.4 -26% | 26.3 37% |
| Load Maximum * (Watt) | 52.4 | 33 37% | 43.7 17% | 56 -7% | 62.8 -20% | 34.6 34% |
* ... smaller is better
| Xiaomi Mi Notebook Air 13.3 2016 6200U, GeForce 940MX, 40 Wh | Lenovo IdeaPad 710S-13ISK 6560U, Iris Graphics 540, 46 Wh | Lenovo Yoga 900-13ISK 80MK 6500U, HD Graphics 520, 66 Wh | Lenovo ThinkPad T460s-20F9003SGE 6200U, HD Graphics 520, 49 Wh | Dell XPS 13 9360 QHD+ i5 i5-7200U, HD Graphics 620, 60 Wh | Apple MacBook Air 13 inch 2015-03 5650U, HD Graphics 6000, 54 Wh | |
|---|---|---|---|---|---|---|
| Battery runtime | 11% | 24% | 23% | 42% | 63% | |
| Reader / Idle (h) | 12 | 13.5 13% | 14.1 18% | 15.3 28% | 26.2 118% | |
| H.264 (h) | 7.1 | 8.1 14% | 8.9 25% | 9.1 28% | ||
| WiFi v1.3 (h) | 6.5 | 7 8% | 6.7 3% | 6.6 2% | 8.8 35% | 10.3 58% |
| Load (h) | 1.4 | 1.5 7% | 2.1 50% | 1.9 36% | 2.3 64% | 1.6 14% |
Pros
Cons

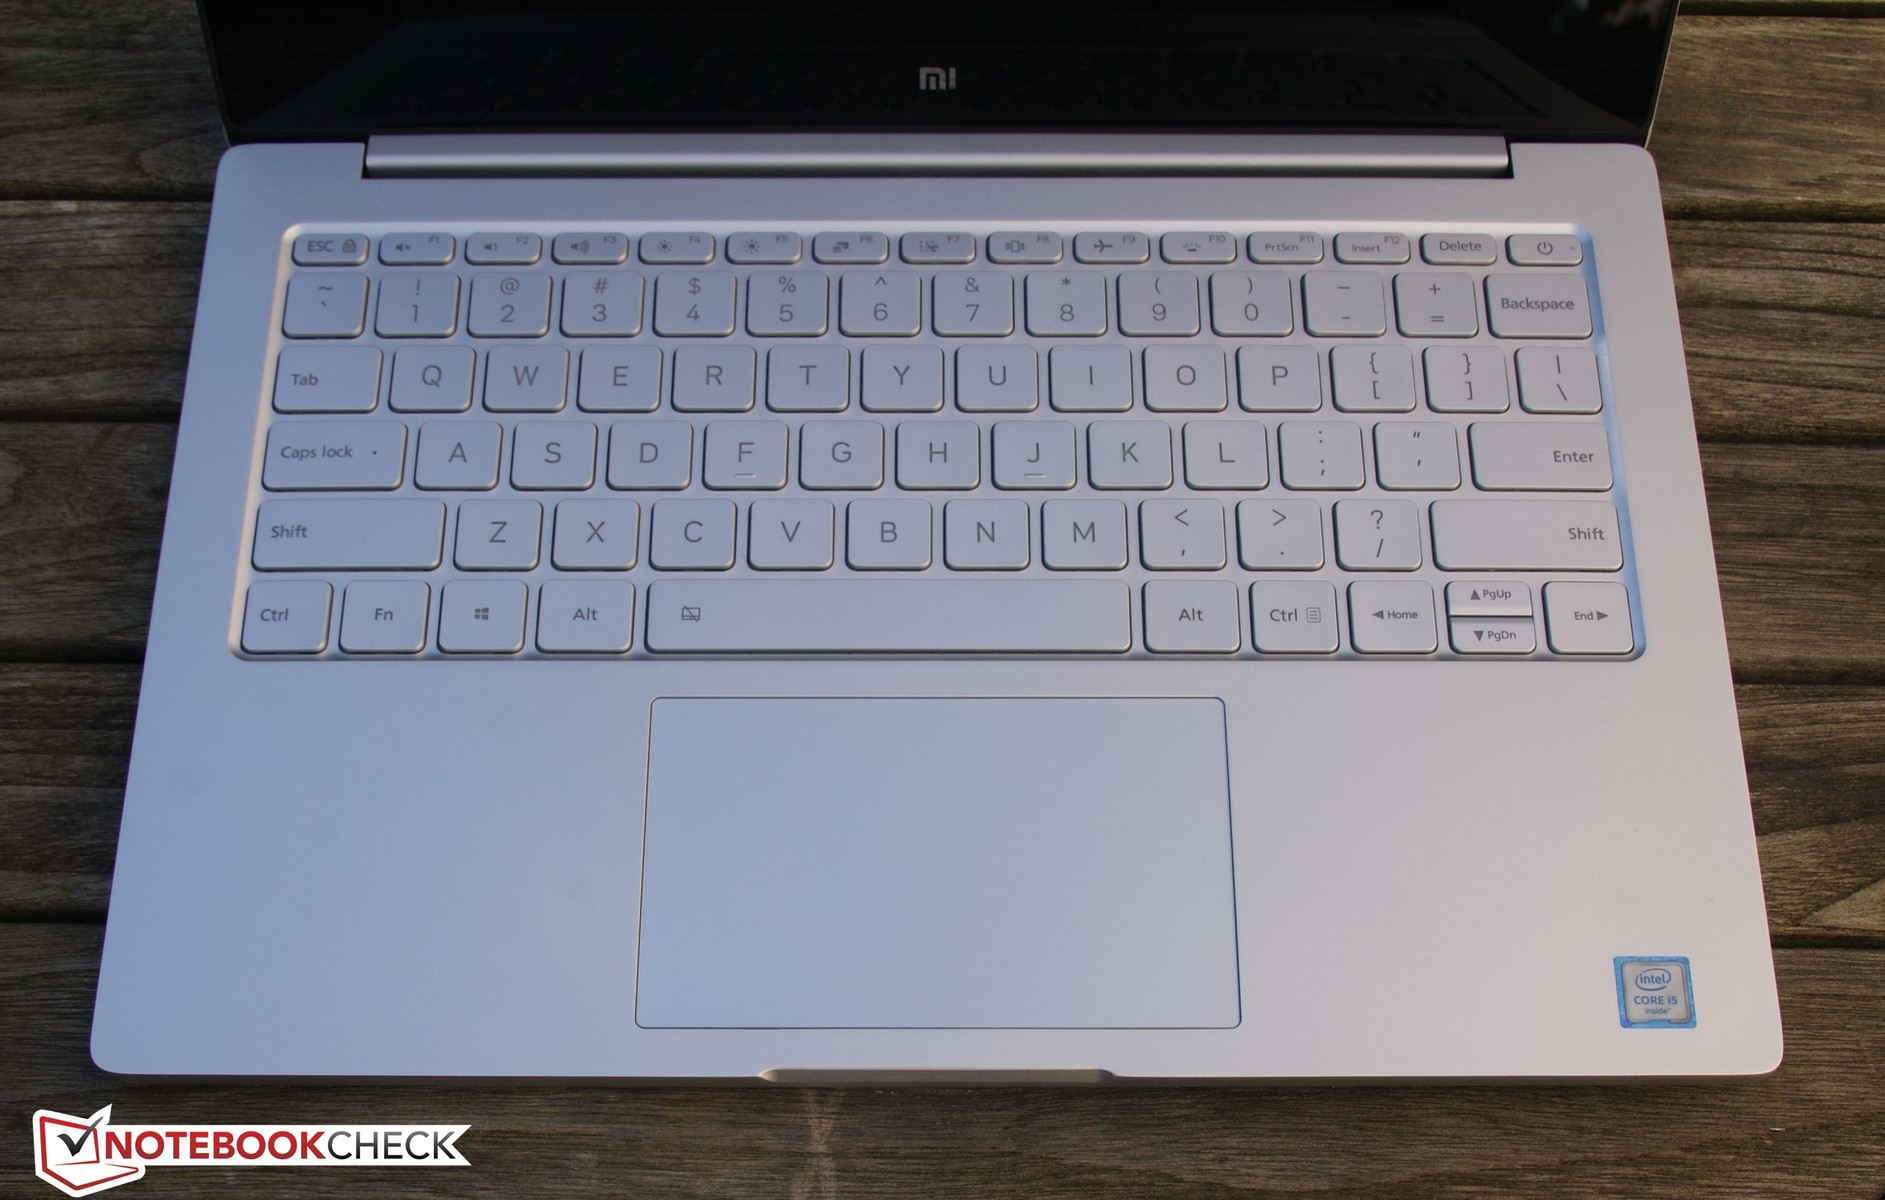
Mi Notebook Air标志着小米在笔记本市场的成功登场。生产商的成功设计让它几乎没有弱点。而优势则包括了非常优秀的屏幕,高品质一体式机身,高效冷却系统(也受到一定限制),优秀的输入设备和强劲的性能——它搭配了一块英伟达独立显卡,在同类设备中几乎独一无二。
它的一些瑕疵在于细节中:这台设备没有搭配SD读卡器,采用镜面屏幕,同时在负载下机身会变得很热。让我们最失望的是它的电池:Mi Notebook Air的续航时间只能算是一般水平。其他生产商在这方面做得更加出色,比如戴尔的XPS 13。另外,感兴趣的用户可以参考一下即将上市的Kaby Lake架构超极本,如惠普 Spectre x360和联想 Yoga 910。它们实际上都是变形本,可能并不会让所有用户感兴趣。同时它们也相比XPS和Mi Notebook Air更笨重。
小米的首台笔记本电脑提供了优秀的性能;生产商没有犯任何重大错误。目前唯一的问题是它需要通过进口渠道才能得到。
可能Mi Notebook Air最大的优势在于价位,所有之前提到的竞争机型都昂贵很多。价位相近的联想 IdeaPad 710S可能会是个值得考虑的选择。
Mi Notebook Air值得推荐吗?是的,不过它目前并没有在德国正式上市。这会带来一些问题,如英语键盘,无CE认证,或难以得到保修服务。其他的信息请参考我们的文章“CE认证和进口”。如果小米会在德国正式推出Mi Notebook Air的话,它将无疑成为一款成功的产品。
注:本文是基于完整评测的缩减版本,阅读完整的英文评测,请点击这里。
Xiaomi Mi Notebook Air 13.3 2016
- 10/15/2016 v5.1 (old)
Benjamin Herzig