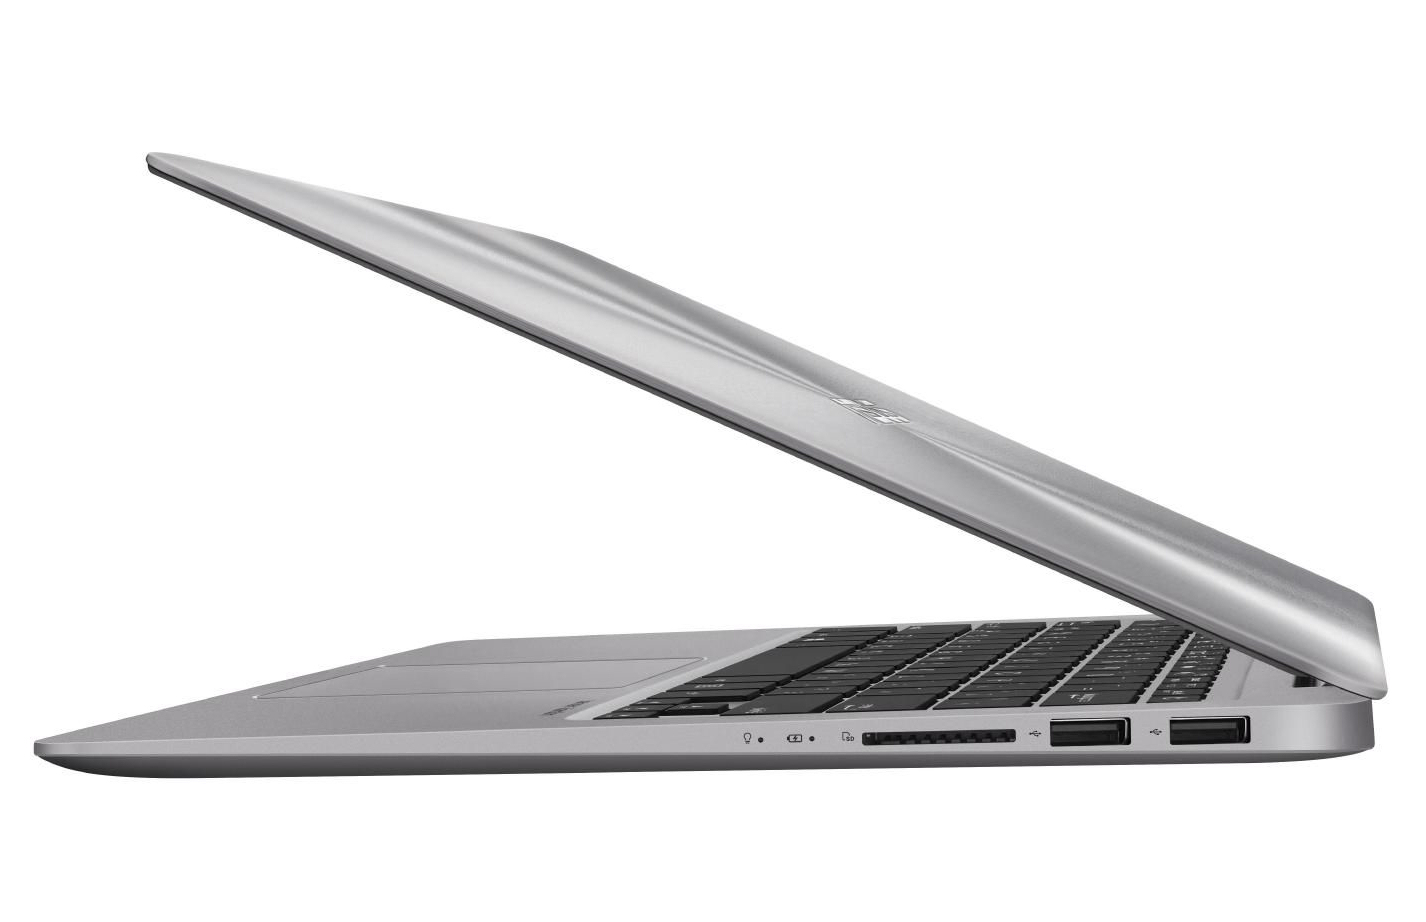
华硕 ZenBook UX3410UQ (7500U, 940MX, 全高清) 笔记本电脑简短评测
| SD Card Reader | |
| average JPG Copy Test (av. of 3 runs) | |
| Acer Swift 5 SF514-51-59AV | |
| Lenovo ThinkPad X1 Carbon 2017-20HQS03P00 | |
| Asus Zenbook UX3410UQ-GV077T | |
| Asus UX310UQ-FC396T | |
| Asus Zenbook UX3410UA | |
| Acer TravelMate X349-G2 | |
| maximum AS SSD Seq Read Test (1GB) | |
| Acer Swift 5 SF514-51-59AV | |
| Lenovo ThinkPad X1 Carbon 2017-20HQS03P00 | |
| Asus Zenbook UX3410UQ-GV077T | |
| Asus Zenbook UX3410UA | |
| Asus UX310UQ-FC396T | |
| Acer TravelMate X349-G2 | |
| Networking | |
| iperf3 transmit AX12 | |
| Acer TravelMate X349-G2 | |
| HP Spectre 13-v131ng | |
| Asus UX310UQ-FC396T (jseb) | |
| Apple MacBook Pro 13 2016 (Klaus I211) | |
| Lenovo ThinkPad X1 Carbon 2017-20HQS03P00 | |
| Asus Zenbook UX3410UQ-GV077T | |
| Asus Zenbook UX3410UA | |
| iperf3 receive AX12 | |
| Apple MacBook Pro 13 2016 (Klaus I211) | |
| Asus Zenbook UX3410UQ-GV077T | |
| Lenovo ThinkPad X1 Carbon 2017-20HQS03P00 | |
| Acer TravelMate X349-G2 | |
| Asus UX310UQ-FC396T (jseb) | |
| HP Spectre 13-v131ng | |
| Asus Zenbook UX3410UA | |
| |||||||||||||||||||||||||
Brightness Distribution: 84 %
Center on Battery: 381 cd/m²
Contrast: 1270:1 (Black: 0.3 cd/m²)
ΔE ColorChecker Calman: 2.84 | ∀{0.5-29.43 Ø4.73}
ΔE Greyscale Calman: 4.02 | ∀{0.09-98 Ø4.97}
86% sRGB (Argyll 1.6.3 3D)
56% AdobeRGB 1998 (Argyll 1.6.3 3D)
69.3% AdobeRGB 1998 (Argyll 3D)
99.2% sRGB (Argyll 3D)
67.2% Display P3 (Argyll 3D)
Gamma: 2.42
CCT: 7430 K
| Asus Zenbook UX3410UQ-GV077T IPS, 1920x1080, 14" | Asus Zenbook UX3410UA IPS, 1920x1080, 14" | Acer TravelMate X349-G2 IPS, 1920x1080, 14" | Acer Swift 5 SF514-51-59AV IPS, 1920x1080, 14" | Lenovo ThinkPad X1 Carbon 2017-20HQS03P00 IPS, 1920x1080, 14" | Apple MacBook Pro 13 2016 2560x1600, 13.3" | HP Spectre 13-v131ng IPS UWVA, 1920x1080, 13.3" | |
|---|---|---|---|---|---|---|---|
| Display | 0% | -38% | -7% | -11% | 23% | -7% | |
| Display P3 Coverage (%) | 67.2 | 67.7 1% | 41.81 -38% | 62.8 -7% | 61.4 -9% | 97.1 44% | 64.6 -4% |
| sRGB Coverage (%) | 99.2 | 99.1 0% | 62.3 -37% | 91.3 -8% | 85.9 -13% | 99.8 1% | 88.8 -10% |
| AdobeRGB 1998 Coverage (%) | 69.3 | 69.4 0% | 43.26 -38% | 64.3 -7% | 62.4 -10% | 86.7 25% | 64.8 -6% |
| Response Times | 4% | -4% | -7% | -2% | -43% | -10% | |
| Response Time Grey 50% / Grey 80% * (ms) | 44 ? | 33 ? 25% | 43 ? 2% | 51 ? -16% | 41.6 ? 5% | 47.2 ? -7% | 46 ? -5% |
| Response Time Black / White * (ms) | 29 ? | 34 ? -17% | 32 ? -10% | 28 ? 3% | 31.6 ? -9% | 51.6 ? -78% | 33 ? -14% |
| PWM Frequency (Hz) | 60 ? | 25000 ? | |||||
| Screen | -2% | -36% | -26% | -20% | 21% | -20% | |
| Brightness middle (cd/m²) | 381 | 376 -1% | 271 -29% | 393 3% | 311 -18% | 600 57% | 404 6% |
| Brightness (cd/m²) | 368 | 355 -4% | 253 -31% | 338 -8% | 288 -22% | 564 53% | 382 4% |
| Brightness Distribution (%) | 84 | 87 4% | 83 -1% | 79 -6% | 85 1% | 89 6% | 91 8% |
| Black Level * (cd/m²) | 0.3 | 0.32 -7% | 0.35 -17% | 0.29 3% | 0.24 20% | 0.57 -90% | 0.35 -17% |
| Contrast (:1) | 1270 | 1175 -7% | 774 -39% | 1355 7% | 1296 2% | 1053 -17% | 1154 -9% |
| Colorchecker dE 2000 * | 2.84 | 3.2 -13% | 5.05 -78% | 6.17 -117% | 5.5 -94% | 1.5 47% | 5.37 -89% |
| Colorchecker dE 2000 max. * | 6.5 | 7.1 -9% | 11.74 -81% | 11.21 -72% | 9 -38% | 2.9 55% | 9.46 -46% |
| Greyscale dE 2000 * | 4.02 | 4.4 -9% | 4.3 -7% | 6.8 -69% | 6.2 -54% | 2 50% | 6.44 -60% |
| Gamma | 2.42 91% | 2.12 104% | 2.44 90% | 2.27 97% | 2.02 109% | 2.27 97% | 2.52 87% |
| CCT | 7430 87% | 7440 87% | 6726 97% | 6873 95% | 5950 109% | 6855 95% | 6738 96% |
| Color Space (Percent of AdobeRGB 1998) (%) | 56 | 63.78 14% | 42 -25% | 51 -9% | 55.96 0% | 77 38% | 58 4% |
| Color Space (Percent of sRGB) (%) | 86 | 98.98 15% | 39 -55% | 91 6% | 85.77 0% | 92 7% | 89 3% |
| Total Average (Program / Settings) | 1% /
-1% | -26% /
-32% | -13% /
-20% | -11% /
-16% | 0% /
13% | -12% /
-16% |
* ... smaller is better
Screen Flickering / PWM (Pulse-Width Modulation)
| Screen flickering / PWM detected | 60 Hz | ≤ 30 % brightness setting | 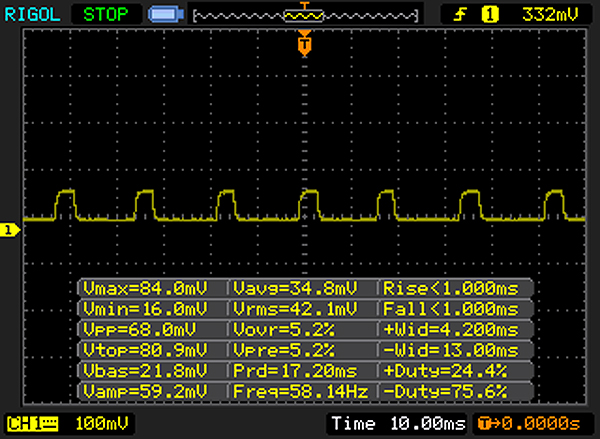 |
The display backlight flickers at 60 Hz (worst case, e.g., utilizing PWM) Flickering detected at a brightness setting of 30 % and below. There should be no flickering or PWM above this brightness setting. The frequency of 60 Hz is very low, so the flickering may cause eyestrain and headaches after extended use. In comparison: 52 % of all tested devices do not use PWM to dim the display. If PWM was detected, an average of 7798 (minimum: 5 - maximum: 343500) Hz was measured. | |||
Display Response Times
| ↔ Response Time Black to White | ||
|---|---|---|
| 29 ms ... rise ↗ and fall ↘ combined | ↗ 17 ms rise | 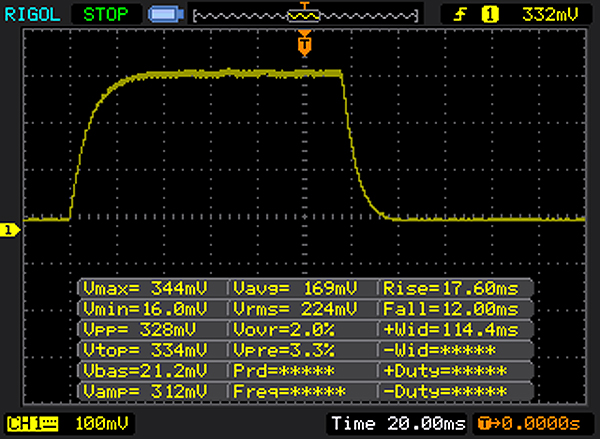 |
| ↘ 12 ms fall | ||
| The screen shows relatively slow response rates in our tests and may be too slow for gamers. In comparison, all tested devices range from 0.1 (minimum) to 240 (maximum) ms. » 77 % of all devices are better. This means that the measured response time is worse than the average of all tested devices (19.9 ms). | ||
| ↔ Response Time 50% Grey to 80% Grey | ||
| 44 ms ... rise ↗ and fall ↘ combined | ↗ 24 ms rise | 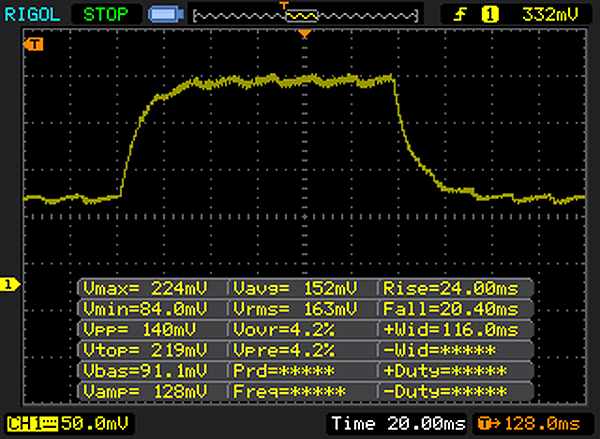 |
| ↘ 20 ms fall | ||
| The screen shows slow response rates in our tests and will be unsatisfactory for gamers. In comparison, all tested devices range from 0.165 (minimum) to 636 (maximum) ms. » 73 % of all devices are better. This means that the measured response time is worse than the average of all tested devices (31.1 ms). | ||
| Cinebench R10 | |
| Rendering Multiple CPUs 32Bit | |
| Asus UX310UQ-FC396T | |
| Asus Zenbook UX3410UQ-GV077T | |
| HP Spectre 13-v131ng | |
| Apple MacBook Pro 13 2016 | |
| Rendering Single 32Bit | |
| Asus Zenbook UX3410UQ-GV077T | |
| HP Spectre 13-v131ng | |
| Asus UX310UQ-FC396T | |
| Apple MacBook Pro 13 2016 | |
| Geekbench 3 | |
| 32 Bit Multi-Core Score | |
| Asus Zenbook UX3410UQ-GV077T | |
| 32 Bit Single-Core Score | |
| Asus Zenbook UX3410UQ-GV077T | |
| Geekbench 4.0 | |
| 64 Bit Multi-Core Score | |
| Asus Zenbook UX3410UQ-GV077T | |
| Apple MacBook Pro 13 2016 | |
| Apple MacBook Pro 13 2016 | |
| 64 Bit Single-Core Score | |
| Asus Zenbook UX3410UQ-GV077T | |
| Apple MacBook Pro 13 2016 | |
| Apple MacBook Pro 13 2016 | |
| Geekbench 4.4 | |
| 64 Bit Multi-Core Score | |
| Asus Zenbook UX3410UQ-GV077T | |
| 64 Bit Single-Core Score | |
| Asus Zenbook UX3410UQ-GV077T | |
| PCMark 8 Home Score Accelerated v2 | 3923 points | |
Help | ||

| Asus Zenbook UX3410UQ-GV077T SanDisk SD8SNAT256G1002 | Asus Zenbook UX3410UA SanDisk SD8SN8U512G1002 | Acer TravelMate X349-G2 Intel SSD 600p SSDPEKKW512G7 | Acer Swift 5 SF514-51-59AV SK Hynix HFS256G39TND-N210A | Lenovo ThinkPad X1 Carbon 2017-20HQS03P00 Samsung PM961 NVMe MZVLW512HMJP | Apple MacBook Pro 13 2016 Apple SSD AP0256 | HP Spectre 13-v131ng Samsung PM961 NVMe MZVLW512HMJP | |
|---|---|---|---|---|---|---|---|
| CrystalDiskMark 3.0 | 29% | 125% | 13% | 218% | 168% | 158% | |
| Read Seq (MB/s) | 497 | 494.5 -1% | 1818 266% | 517 4% | 1827 268% | 1345 171% | 1090 119% |
| Write Seq (MB/s) | 323.7 | 461.7 43% | 582 80% | 258.1 -20% | 1383 327% | 1320 308% | 1088 236% |
| Read 512 (MB/s) | 289 | 328 13% | 1134 292% | 355 23% | 814 182% | 831 188% | 753 161% |
| Write 512 (MB/s) | 288 | 419.7 46% | 586 103% | 258.5 -10% | 1098 281% | 1486 416% | 911 216% |
| Read 4k (MB/s) | 22.78 | 27.53 21% | 34.93 53% | 29.65 30% | 61 168% | 31.68 39% | 57.5 152% |
| Write 4k (MB/s) | 79.5 | 56.5 -29% | 133.4 68% | 77.3 -3% | 172.2 117% | 11.02 -86% | 140.2 76% |
| Read 4k QD32 (MB/s) | 147 | 351 139% | 373.7 154% | 277.1 89% | 601 309% | 533 263% | 497.1 238% |
| Write 4k QD32 (MB/s) | 257.2 | 249.3 -3% | 210.8 -18% | 242.5 -6% | 495.6 93% | 362 41% | 416 62% |
| 3DMark 11 Performance | 2205 points | |
Help | ||
| low | med. | high | ultra | |
|---|---|---|---|---|
| BioShock Infinite (2013) | 83.8 | 45.4 | 37.4 | 13.2 |
Noise level
| Idle |
| 30 / 30 / 31.1 dB(A) |
| HDD |
| 31 dB(A) |
| Load |
| 32.2 / 37.6 dB(A) |
 | ||
30 dB silent 40 dB(A) audible 50 dB(A) loud |
||
min: | ||
(+) The maximum temperature on the upper side is 34.1 °C / 93 F, compared to the average of 35.9 °C / 97 F, ranging from 21.4 to 59 °C for the class Subnotebook.
(+) The bottom heats up to a maximum of 38.3 °C / 101 F, compared to the average of 39.2 °C / 103 F
(+) In idle usage, the average temperature for the upper side is 21.4 °C / 71 F, compared to the device average of 30.8 °C / 87 F.
(+) The palmrests and touchpad are cooler than skin temperature with a maximum of 28.2 °C / 82.8 F and are therefore cool to the touch.
(±) The average temperature of the palmrest area of similar devices was 28.2 °C / 82.8 F (0 °C / 0 F).
Asus Zenbook UX3410UQ-GV077T audio analysis
(±) | speaker loudness is average but good (73 dB)
Bass 100 - 315 Hz
(±) | reduced bass - on average 12% lower than median
(+) | bass is linear (4.5% delta to prev. frequency)
Mids 400 - 2000 Hz
(±) | higher mids - on average 6.5% higher than median
(+) | mids are linear (6.7% delta to prev. frequency)
Highs 2 - 16 kHz
(+) | balanced highs - only 3.9% away from median
(+) | highs are linear (4.8% delta to prev. frequency)
Overall 100 - 16.000 Hz
(±) | linearity of overall sound is average (17% difference to median)
Compared to same class
» 43% of all tested devices in this class were better, 8% similar, 49% worse
» The best had a delta of 5%, average was 18%, worst was 53%
Compared to all devices tested
» 30% of all tested devices were better, 8% similar, 62% worse
» The best had a delta of 4%, average was 24%, worst was 134%
Apple MacBook 12 (Early 2016) 1.1 GHz audio analysis
(+) | speakers can play relatively loud (83.6 dB)
Bass 100 - 315 Hz
(±) | reduced bass - on average 11.3% lower than median
(±) | linearity of bass is average (14.2% delta to prev. frequency)
Mids 400 - 2000 Hz
(+) | balanced mids - only 2.4% away from median
(+) | mids are linear (5.5% delta to prev. frequency)
Highs 2 - 16 kHz
(+) | balanced highs - only 2% away from median
(+) | highs are linear (4.5% delta to prev. frequency)
Overall 100 - 16.000 Hz
(+) | overall sound is linear (10.2% difference to median)
Compared to same class
» 7% of all tested devices in this class were better, 2% similar, 91% worse
» The best had a delta of 5%, average was 18%, worst was 53%
Compared to all devices tested
» 5% of all tested devices were better, 1% similar, 94% worse
» The best had a delta of 4%, average was 24%, worst was 134%
| Off / Standby | |
| Idle | |
| Load |
|
Key:
min: | |
Pros
Cons
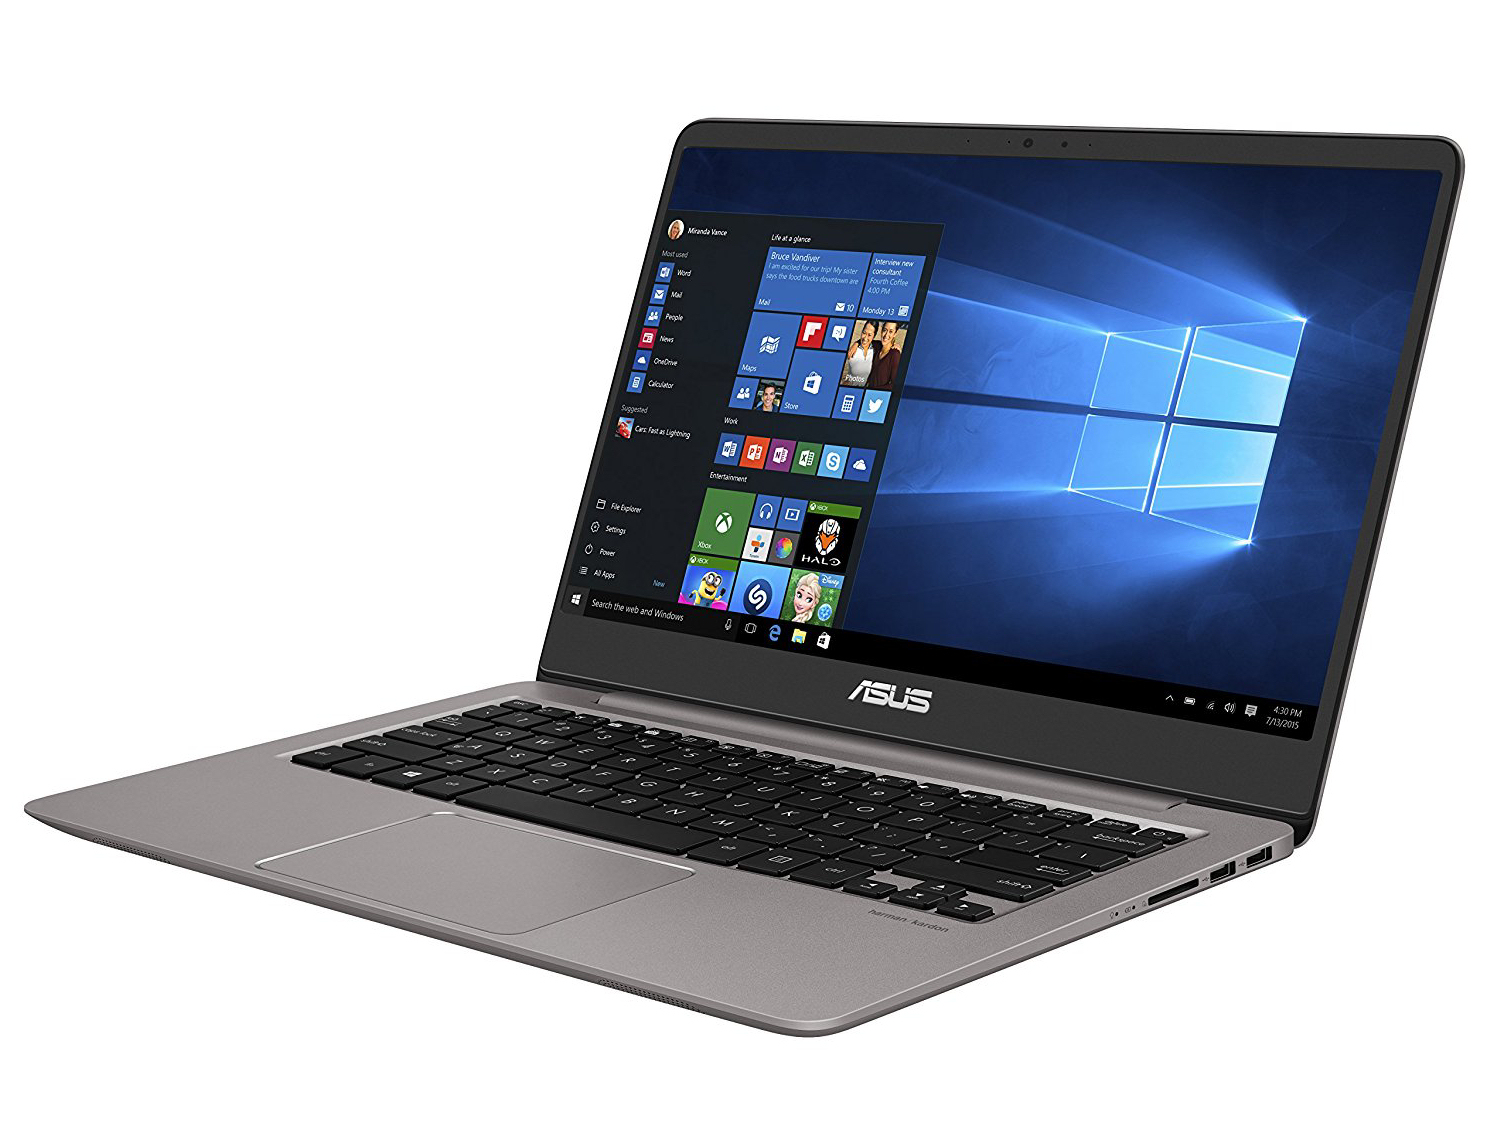
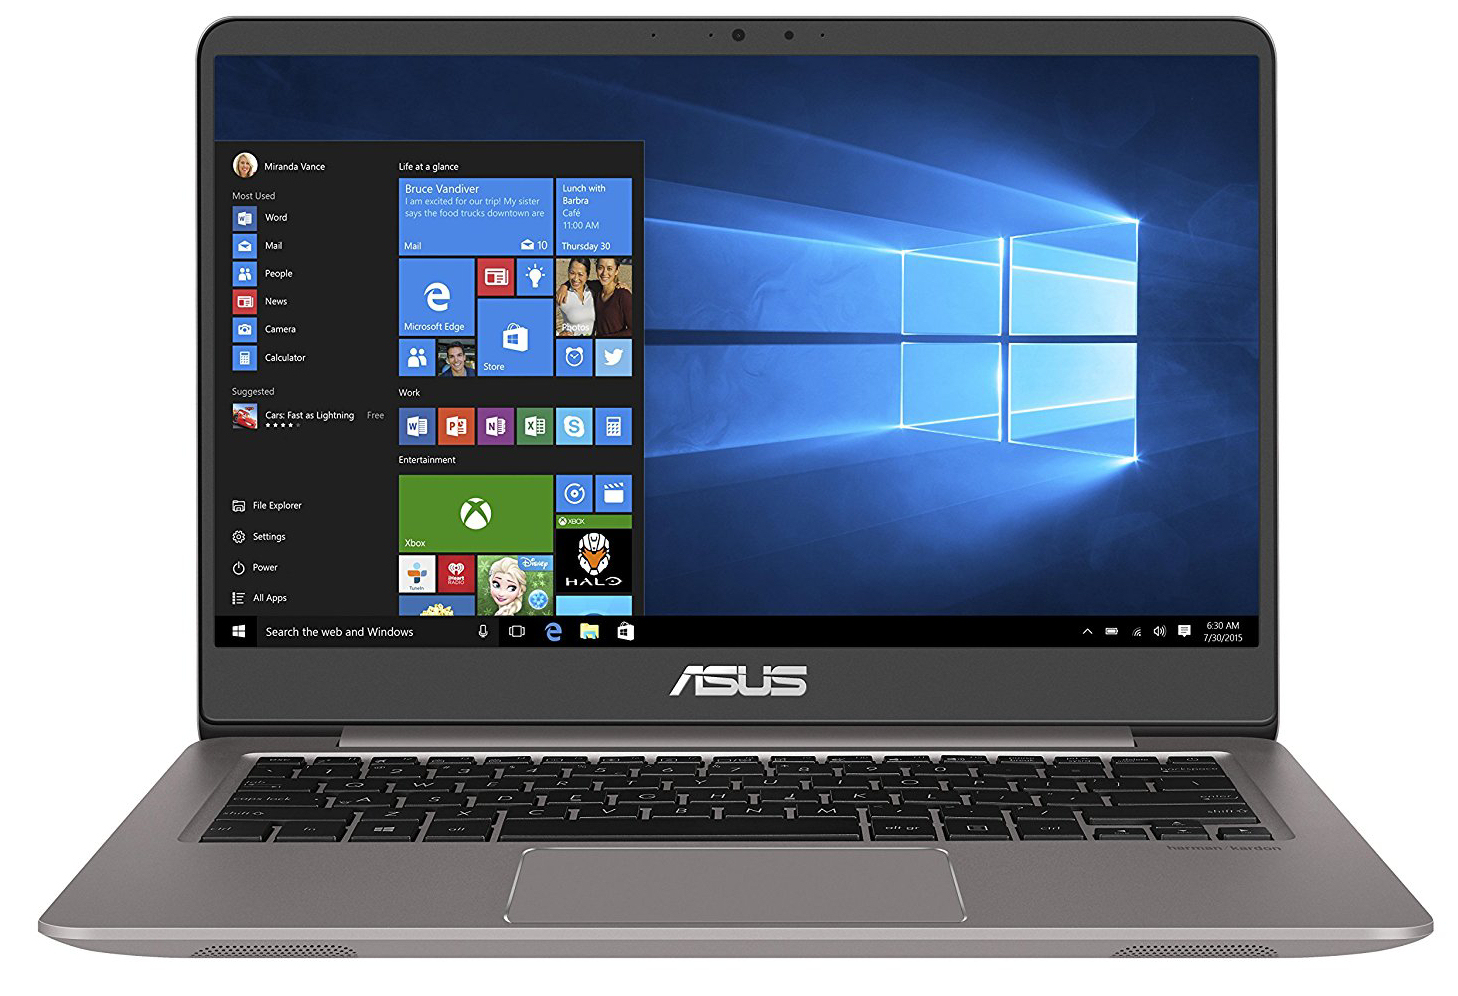
华硕为ZenBook配备了新一代的酷睿i7 Kaby-Lake的处理器。结合GeForce 940MX显卡,即使是运行商务和上网功能之外的程序,计算机也能提供足够的性能。内置的GeForce显卡,是它与ZenBook UX3410UA 的不同之处,后者我们已经进行了测验。
您可能会担心额外的显卡会导致噪音的增加和电池续航时间的缩短。这点我们无法确认。
总体而言,UX3410UQ比UX3410UA更安静,在我们实际的无线局域网测试中,也实现了更长的续航时间。
固态硬盘确保了系统的快速运行。此外,还有一个常规的2.5英寸机械硬盘(1 TB)用作数据存储。用户可以切换两种存储介质。 但是要做到这一点,必须拆开外壳。此外,哑光IPS显示屏具有较高的亮度和对比度,以及稳定的视角。最低价格大约是11500元。
注:本文是基于完整评测的缩减版本,阅读完整的英文评测,请点击这里。
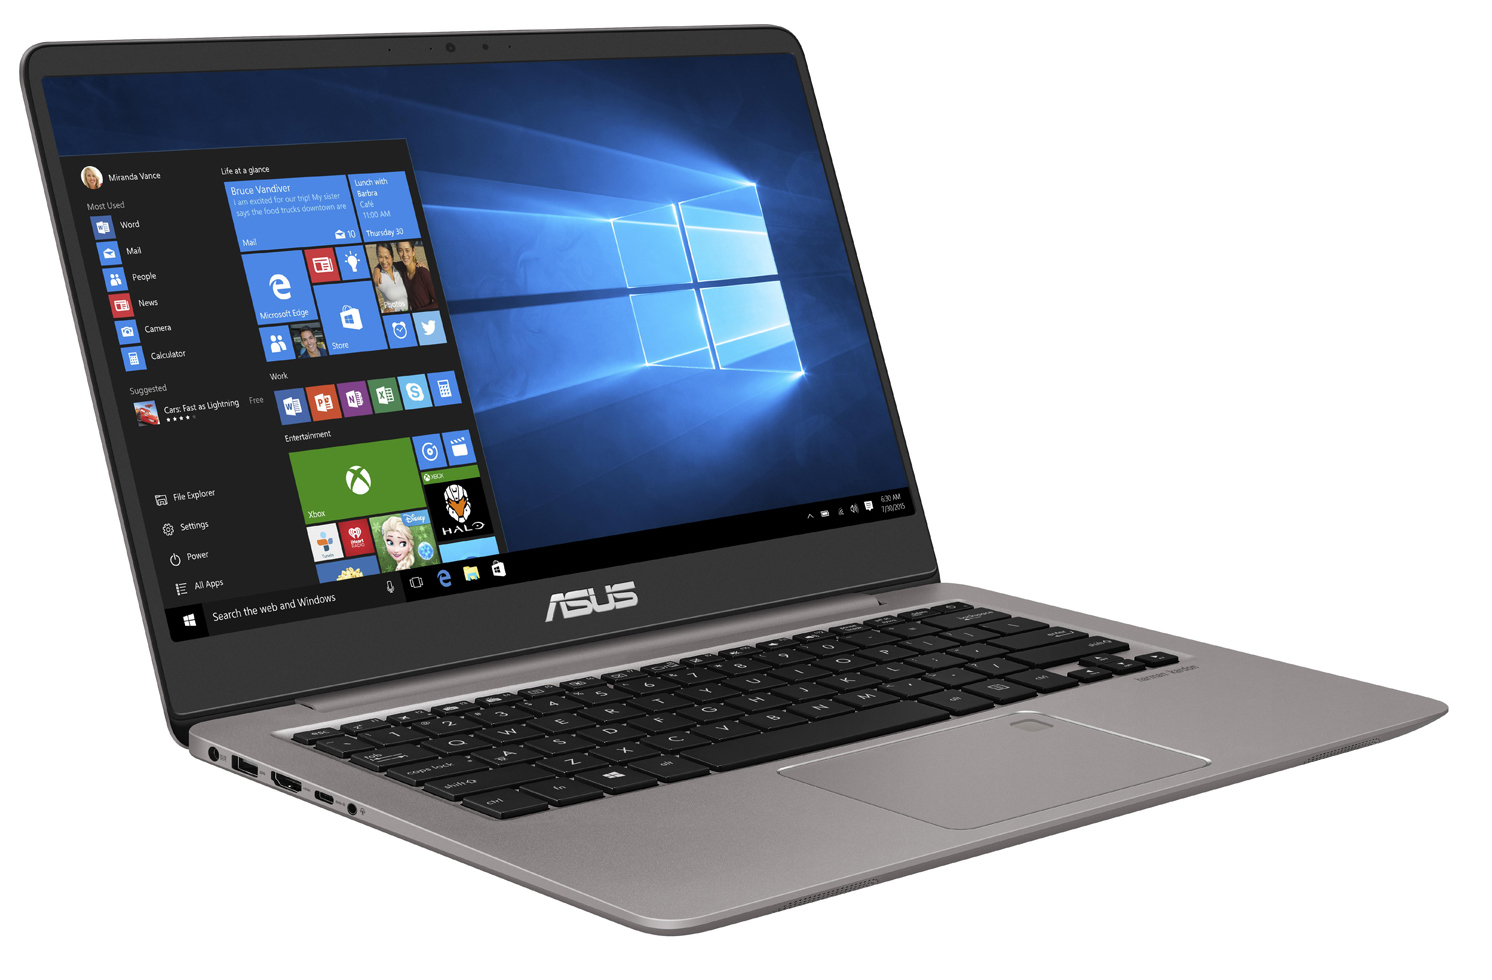
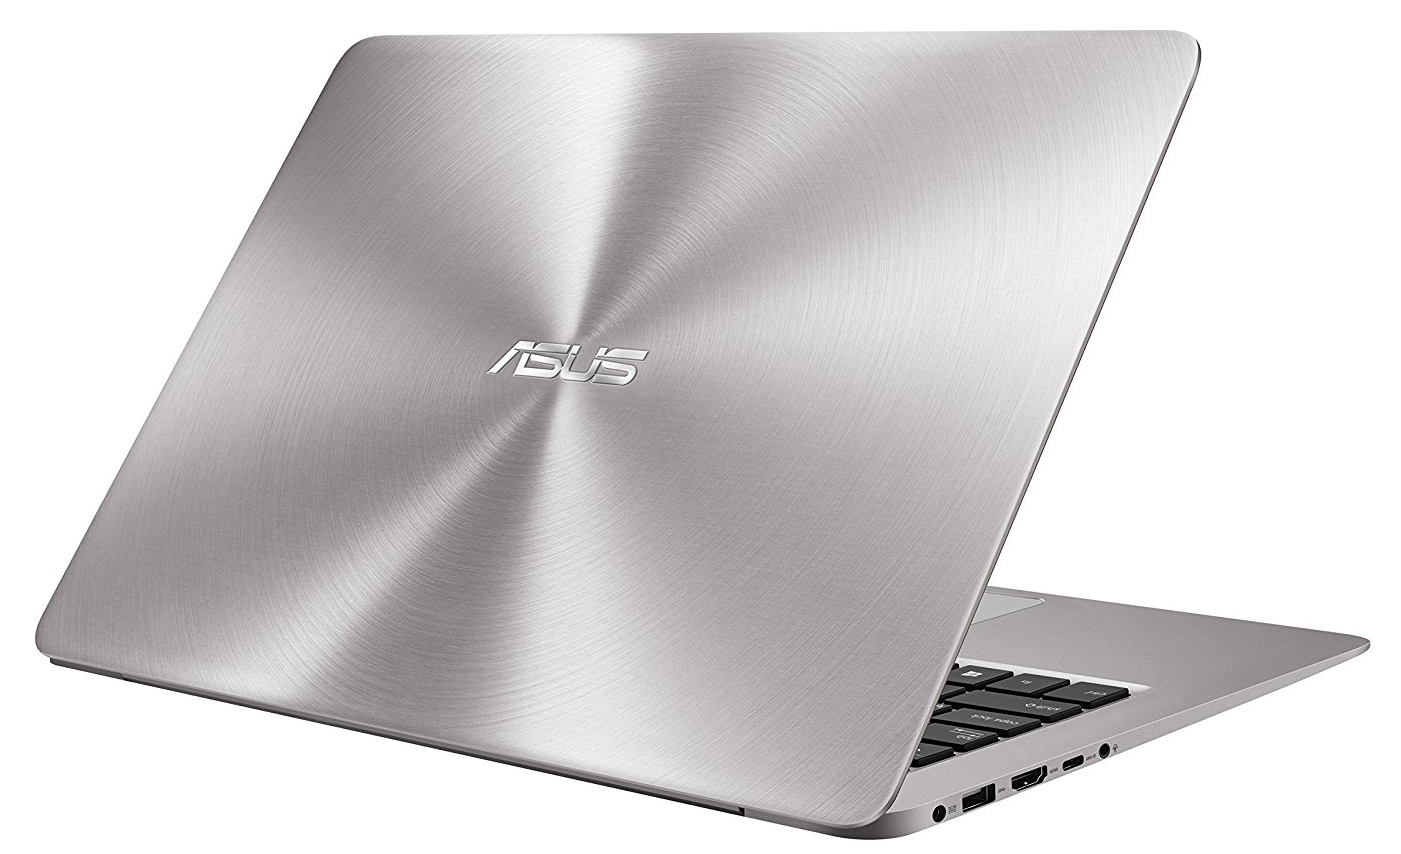
Asus Zenbook UX3410UQ-GV077T
- 05/17/2017 v6 (old)
Sascha Mölck