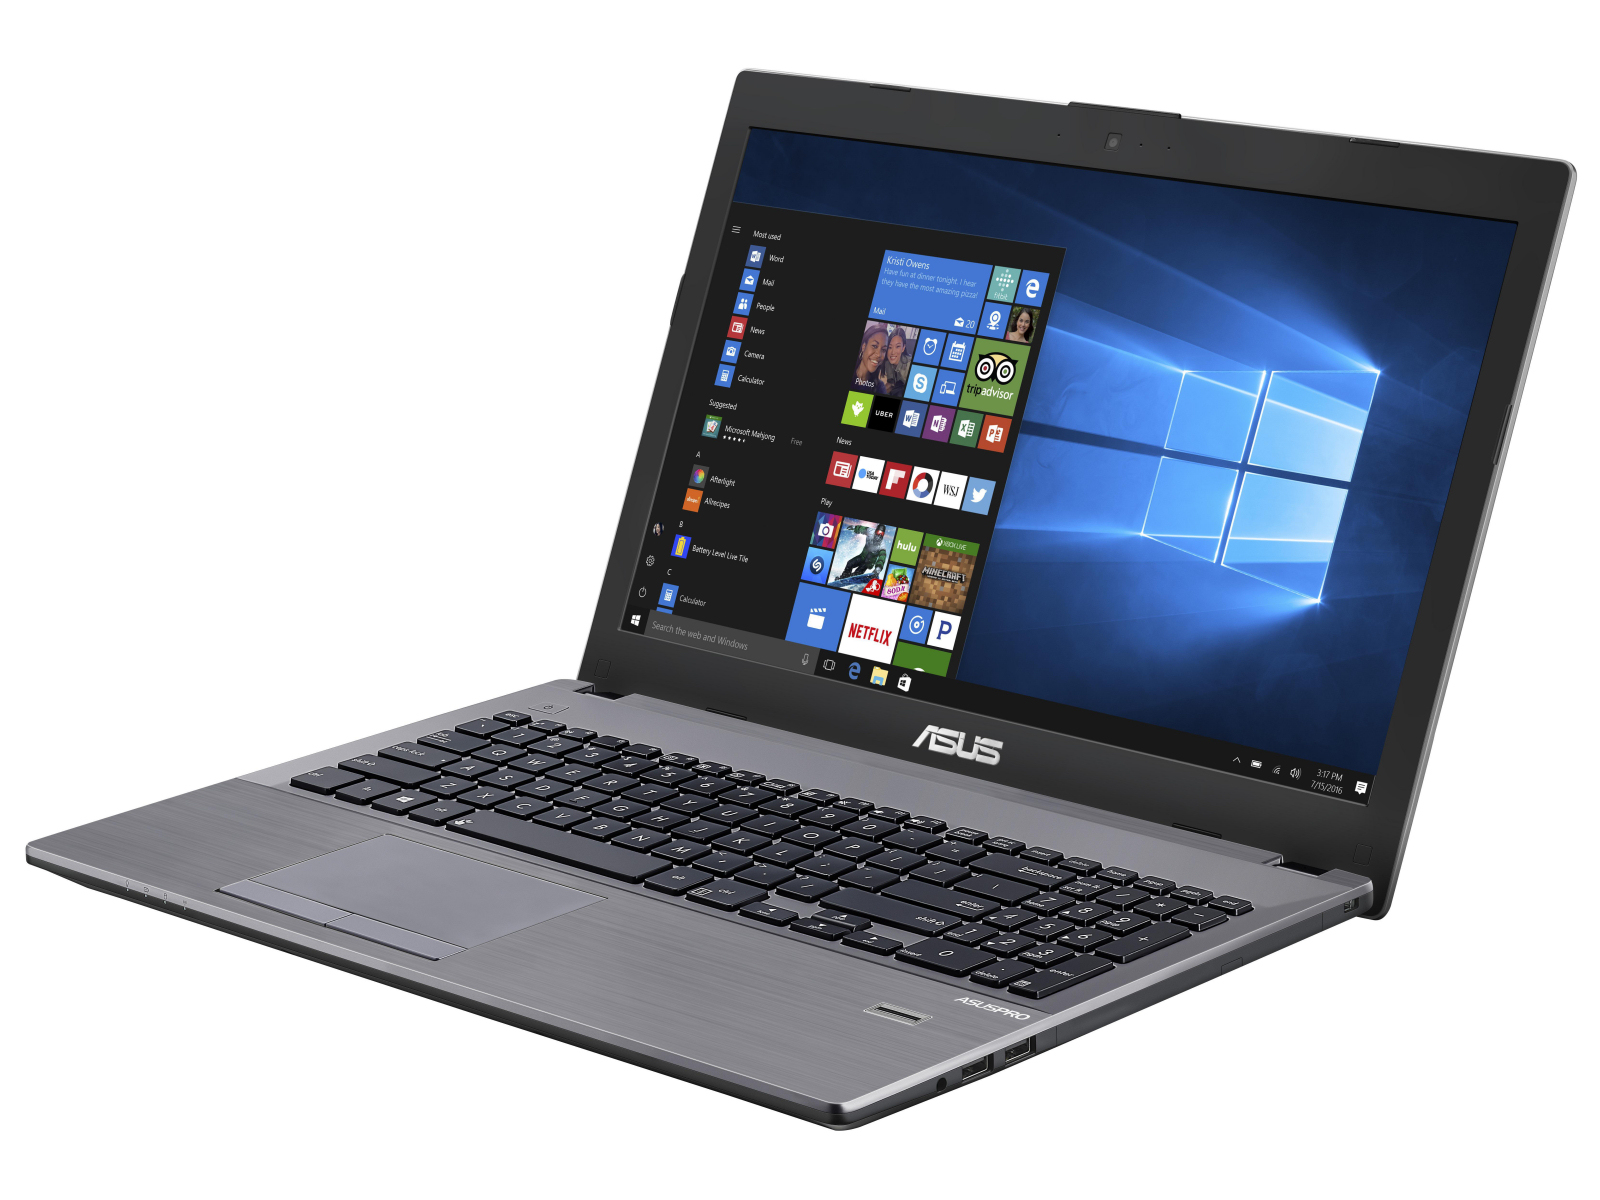
华硕 ASUSPRO P4540UQ (7200U, 940MX, 全高清) 笔记本电脑简短评测
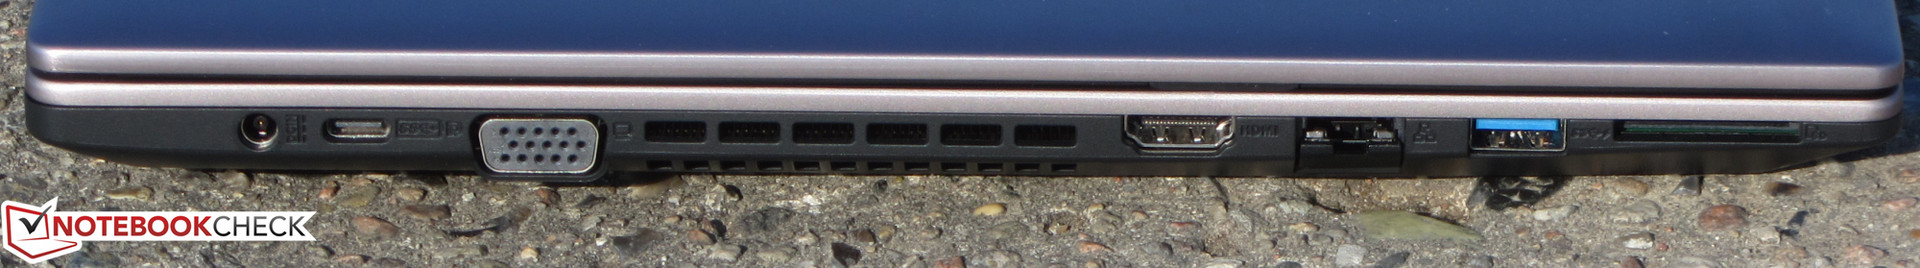
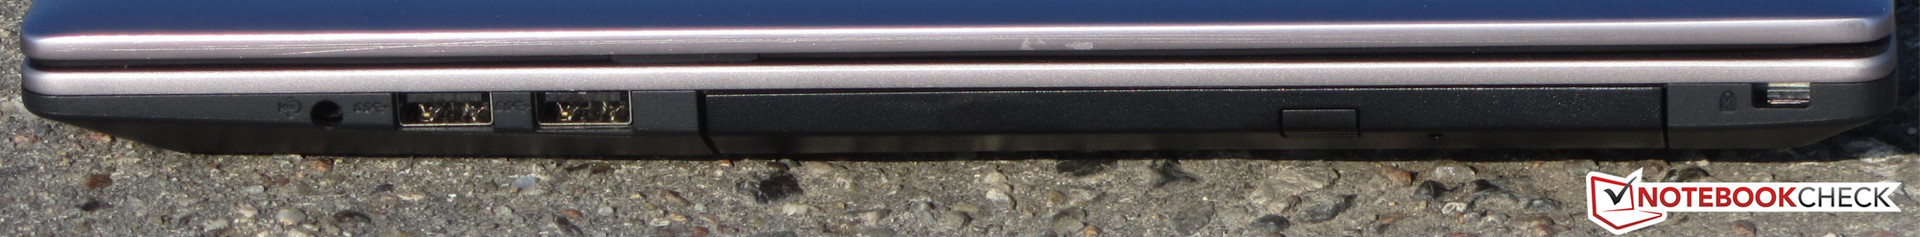
Connectivity
| SD Card Reader | |
| average JPG Copy Test (av. of 3 runs) | |
| HP ProBook 450 G4 Y8B60EA | |
| Asus AsusPro P4540UQ-FY0056R | |
| Acer TravelMate P259-MG-71UU | |
| Lenovo ThinkPad E570-20H6S00000 | |
| Dell Vostro 15-5568 | |
| maximum AS SSD Seq Read Test (1GB) | |
| HP ProBook 450 G4 Y8B60EA | |
| Lenovo ThinkPad E570-20H6S00000 | |
| Dell Vostro 15-5568 | |
| |||||||||||||||||||||||||
Brightness Distribution: 85 %
Center on Battery: 296 cd/m²
Contrast: 1022:1 (Black: 0.27 cd/m²)
ΔE ColorChecker Calman: 3.92 | ∀{0.5-29.43 Ø4.72}
ΔE Greyscale Calman: 2.6 | ∀{0.09-98 Ø4.97}
83.7% sRGB (Argyll 1.6.3 3D)
54.5% AdobeRGB 1998 (Argyll 1.6.3 3D)
61.1% AdobeRGB 1998 (Argyll 3D)
83.6% sRGB (Argyll 3D)
63.3% Display P3 (Argyll 3D)
Gamma: 2.53
CCT: 6561 K
| Asus AsusPro P4540UQ-FY0056R IPS, 1920x1080, 15.6" | HP ProBook 450 G4 Y8B60EA TN LED, 1920x1080, 15.6" | Lenovo ThinkPad E570-20H6S00000 IPS LED, 1920x1080, 15.6" | Acer TravelMate P259-MG-71UU TN LED, 1920x1080, 15.6" | Dell Vostro 15-5568 TN LED, 1920x1080, 15.6" | |
|---|---|---|---|---|---|
| Display | -33% | -35% | -35% | ||
| Display P3 Coverage (%) | 63.3 | 39.89 -37% | 38.65 -39% | 38.58 -39% | |
| sRGB Coverage (%) | 83.6 | 59.5 -29% | 58 -31% | 58 -31% | |
| AdobeRGB 1998 Coverage (%) | 61.1 | 41.24 -33% | 39.94 -35% | 39.85 -35% | |
| Response Times | -19% | -3% | 6% | -10% | |
| Response Time Grey 50% / Grey 80% * (ms) | 38 ? | 51 ? -34% | 44.8 ? -18% | 43 ? -13% | 47.6 ? -25% |
| Response Time Black / White * (ms) | 29 ? | 30 ? -3% | 25.6 ? 12% | 22 ? 24% | 27.2 ? 6% |
| PWM Frequency (Hz) | 21000 ? | 50 ? | |||
| Screen | -84% | -15% | -84% | -82% | |
| Brightness middle (cd/m²) | 276 | 214 -22% | 242 -12% | 180 -35% | 229 -17% |
| Brightness (cd/m²) | 283 | 201 -29% | 243 -14% | 178 -37% | 222 -22% |
| Brightness Distribution (%) | 85 | 77 -9% | 75 -12% | 93 9% | 82 -4% |
| Black Level * (cd/m²) | 0.27 | 0.43 -59% | 0.24 11% | 0.45 -67% | 0.56 -107% |
| Contrast (:1) | 1022 | 498 -51% | 1008 -1% | 400 -61% | 409 -60% |
| Colorchecker dE 2000 * | 3.92 | 10.68 -172% | 4.65 -19% | 9.91 -153% | 10.36 -164% |
| Colorchecker dE 2000 max. * | 9.13 | 18.07 -98% | 9.64 -6% | 18.19 -99% | 14.95 -64% |
| Greyscale dE 2000 * | 2.6 | 11.32 -335% | 3.39 -30% | 11.25 -333% | 10.9 -319% |
| Gamma | 2.53 87% | 2.26 97% | 2.7 81% | 2.35 94% | 2.21 100% |
| CCT | 6561 99% | 12204 53% | 6246 104% | 12115 54% | 10084 64% |
| Color Space (Percent of AdobeRGB 1998) (%) | 54.5 | 38 -30% | 36.69 -33% | 37 -32% | 37.69 -31% |
| Color Space (Percent of sRGB) (%) | 83.7 | 59 -30% | 57.66 -31% | 58 -31% | 57.92 -31% |
| Total Average (Program / Settings) | -45% /
-65% | -18% /
-17% | -38% /
-62% | -46% /
-70% |
* ... smaller is better
Screen Flickering / PWM (Pulse-Width Modulation)
| Screen flickering / PWM detected | 21000 Hz | ≤ 90 % brightness setting | 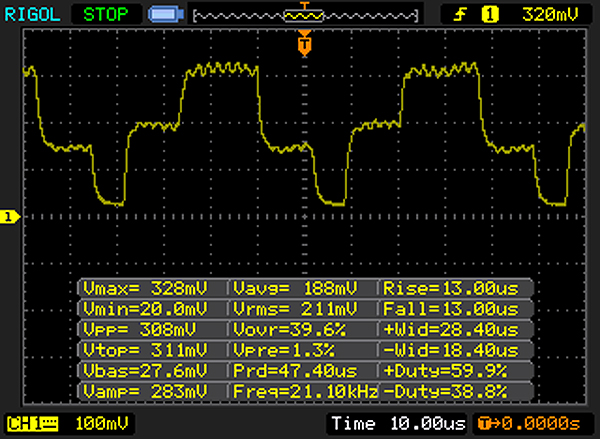 |
The display backlight flickers at 21000 Hz (worst case, e.g., utilizing PWM) Flickering detected at a brightness setting of 90 % and below. There should be no flickering or PWM above this brightness setting. The frequency of 21000 Hz is quite high, so most users sensitive to PWM should not notice any flickering. In comparison: 52 % of all tested devices do not use PWM to dim the display. If PWM was detected, an average of 7753 (minimum: 5 - maximum: 343500) Hz was measured. | |||
Display Response Times
| ↔ Response Time Black to White | ||
|---|---|---|
| 29 ms ... rise ↗ and fall ↘ combined | ↗ 17 ms rise | 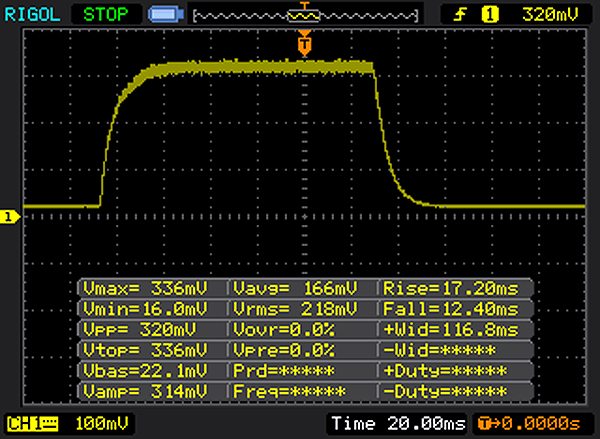 |
| ↘ 12 ms fall | ||
| The screen shows relatively slow response rates in our tests and may be too slow for gamers. In comparison, all tested devices range from 0.1 (minimum) to 240 (maximum) ms. » 77 % of all devices are better. This means that the measured response time is worse than the average of all tested devices (19.8 ms). | ||
| ↔ Response Time 50% Grey to 80% Grey | ||
| 38 ms ... rise ↗ and fall ↘ combined | ↗ 20 ms rise | 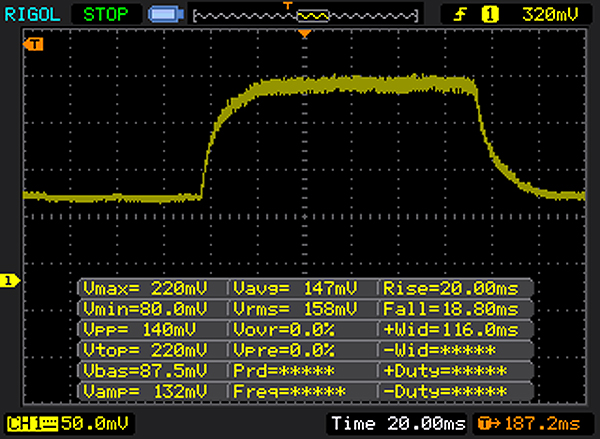 |
| ↘ 18 ms fall | ||
| The screen shows slow response rates in our tests and will be unsatisfactory for gamers. In comparison, all tested devices range from 0.165 (minimum) to 636 (maximum) ms. » 55 % of all devices are better. This means that the measured response time is worse than the average of all tested devices (31 ms). | ||
| Cinebench R10 | |
| Rendering Multiple CPUs 32Bit | |
| Acer TravelMate P259-MG-71UU | |
| Asus AsusPro P4540UQ-FY0056R | |
| Rendering Single 32Bit | |
| Asus AsusPro P4540UQ-FY0056R | |
| Acer TravelMate P259-MG-71UU | |
| Geekbench 3 | |
| 32 Bit Single-Core Score | |
| Acer TravelMate P259-MG-71UU | |
| Asus AsusPro P4540UQ-FY0056R | |
| 32 Bit Multi-Core Score | |
| Acer TravelMate P259-MG-71UU | |
| Asus AsusPro P4540UQ-FY0056R | |
| Geekbench 4.0 | |
| 64 Bit Single-Core Score | |
| Acer TravelMate P259-MG-71UU | |
| Asus AsusPro P4540UQ-FY0056R | |
| 64 Bit Multi-Core Score | |
| Acer TravelMate P259-MG-71UU | |
| Asus AsusPro P4540UQ-FY0056R | |
| JetStream 1.1 - 1.1 Total | |
| HP ProBook 450 G4 Y8B60EA | |
| Dell Vostro 15-5568 | |
| Asus AsusPro P4540UQ-FY0056R | |
| Lenovo ThinkPad E570-20H6S00000 | |
| Acer TravelMate P259-MG-71UU | |
| PCMark 8 Home Score Accelerated v2 | 3428 points | |
| PCMark 8 Creative Score Accelerated v2 | 4256 points | |
| PCMark 8 Work Score Accelerated v2 | 4478 points | |
Help | ||

| Asus AsusPro P4540UQ-FY0056R SK Hynix HFS256G39TND-N210A | HP ProBook 450 G4 Y8B60EA SanDisk SD8SNAT256G1002 | Lenovo ThinkPad E570-20H6S00000 Toshiba THNSF5256GPUK | Acer TravelMate P259-MG-71UU Liteonit CV3-8D256 | Dell Vostro 15-5568 SanDisk X400 256GB, SATA (SD8SB8U-256G) | |
|---|---|---|---|---|---|
| AS SSD | -15% | 71% | 5% | 10% | |
| Seq Read (MB/s) | 502 | 493.8 -2% | 1227 144% | 402.9 -20% | 502 0% |
| Seq Write (MB/s) | 190.8 | 315.9 66% | 636 233% | 333.5 75% | 465.2 144% |
| 4K Read (MB/s) | 27.19 | 17.96 -34% | 37.12 37% | 29.56 9% | 26.84 -1% |
| 4K Write (MB/s) | 63.5 | 73.4 16% | 73.1 15% | 62.9 -1% | 50.3 -21% |
| 4K-64 Read (MB/s) | 364.5 | 137.1 -62% | 654 79% | 328.5 -10% | 357.9 -2% |
| 4K-64 Write (MB/s) | 233.6 | 195.5 -16% | 232.5 0% | 163.6 -30% | 156.4 -33% |
| Access Time Read * (ms) | 0.084 | 0.141 -68% | 0.06 29% | 0.091 -8% | 0.098 -17% |
| Access Time Write * (ms) | 0.224 | 0.159 29% | 0.036 84% | 0.057 75% | 0.083 63% |
| Score Read (Points) | 442 | 204 -54% | 813 84% | 398 -10% | 435 -2% |
| Score Write (Points) | 316 | 300 -5% | 369 17% | 260 -18% | 253 -20% |
| Score Total (Points) | 977 | 607 -38% | 1578 62% | 869 -11% | 917 -6% |
* ... smaller is better
| 3DMark 11 Performance | 2800 points | |
| 3DMark Ice Storm Standard Score | 51531 points | |
| 3DMark Cloud Gate Standard Score | 7704 points | |
| 3DMark Fire Strike Score | 1916 points | |
| 3DMark Time Spy Score | 633 points | |
Help | ||
| 3DMark 11 - 1280x720 Performance GPU | |
| Lenovo ThinkPad E570-20H6S00000 | |
| Acer TravelMate P259-MG-71UU | |
| Asus AsusPro P4540UQ-FY0056R | |
| Lenovo ThinkPad E470-20H2S00400 | |
| Dell Vostro 15 5568 | |
| Asus Vivobook F556UQ-XO626D | |
| MSI CX62 7QL | |
| HP ProBook 450 G4 Y8B60EA | |
| Dell Vostro 15-5568 | |
| 3DMark - 1920x1080 Fire Strike Score | |
| Lenovo ThinkPad E570-20H6S00000 | |
| Acer TravelMate P259-MG-71UU | |
| Asus AsusPro P4540UQ-FY0056R | |
| Dell Vostro 15 5568 | |
| Lenovo ThinkPad E470-20H2S00400 | |
| MSI CX62 7QL | |
| HP ProBook 450 G4 Y8B60EA | |
| Dell Vostro 15-5568 | |
| low | med. | high | ultra | |
|---|---|---|---|---|
| BioShock Infinite (2013) | 111 | 63.3 | 55 | 20.2 |
| Dota 2 Reborn (2015) | 105.9 | 89.8 | 53.1 | 47.7 |
| Resident Evil 7 (2017) | 70 | 34.3 | 19.7 | 5.7 |
| For Honor (2017) | 50.7 | 18.2 | 17.4 | 12.9 |
| Ghost Recon Wildlands (2017) | 32.2 | 12.5 | 11.3 | 6 |
| Mass Effect Andromeda (2017) | 31.2 | 14.5 | 9.8 | 8.6 |
| BioShock Infinite - 1366x768 High Preset | |
| Lenovo ThinkPad E570-20H6S00000 | |
| Acer TravelMate P259-MG-71UU | |
| Asus AsusPro P4540UQ-FY0056R | |
| Dell Vostro 15 5568 | |
| MSI CX62 7QL | |
| Lenovo ThinkPad E470-20H2S00400 | |
| HP ProBook 450 G4 Y8B60EA | |
| Asus Vivobook F556UQ-XO626D | |
| Dell Vostro 15-5568 | |
Noise level
| Idle |
| 30.3 / 30.3 / 30.3 dB(A) |
| DVD |
| 36.5 / dB(A) |
| Load |
| 35.4 / 37.2 dB(A) |
 | ||
30 dB silent 40 dB(A) audible 50 dB(A) loud |
||
min: | ||
(+) The maximum temperature on the upper side is 38 °C / 100 F, compared to the average of 34.3 °C / 94 F, ranging from 21.2 to 62.5 °C for the class Office.
(+) The bottom heats up to a maximum of 39.1 °C / 102 F, compared to the average of 36.8 °C / 98 F
(+) In idle usage, the average temperature for the upper side is 22 °C / 72 F, compared to the device average of 29.5 °C / 85 F.
(+) The palmrests and touchpad are cooler than skin temperature with a maximum of 31.4 °C / 88.5 F and are therefore cool to the touch.
(-) The average temperature of the palmrest area of similar devices was 27.5 °C / 81.5 F (-3.9 °C / -7 F).
Asus AsusPro P4540UQ-FY0056R audio analysis
(±) | speaker loudness is average but good (78 dB)
Bass 100 - 315 Hz
(±) | reduced bass - on average 9.1% lower than median
(+) | bass is linear (5.3% delta to prev. frequency)
Mids 400 - 2000 Hz
(+) | balanced mids - only 1.9% away from median
(+) | mids are linear (3.2% delta to prev. frequency)
Highs 2 - 16 kHz
(±) | higher highs - on average 13.3% higher than median
(±) | linearity of highs is average (8.3% delta to prev. frequency)
Overall 100 - 16.000 Hz
(±) | linearity of overall sound is average (20.5% difference to median)
Compared to same class
» 46% of all tested devices in this class were better, 10% similar, 45% worse
» The best had a delta of 7%, average was 21%, worst was 53%
Compared to all devices tested
» 54% of all tested devices were better, 8% similar, 38% worse
» The best had a delta of 4%, average was 23%, worst was 134%
Apple MacBook 12 (Early 2016) 1.1 GHz audio analysis
(+) | speakers can play relatively loud (83.6 dB)
Bass 100 - 315 Hz
(±) | reduced bass - on average 11.3% lower than median
(±) | linearity of bass is average (14.2% delta to prev. frequency)
Mids 400 - 2000 Hz
(+) | balanced mids - only 2.4% away from median
(+) | mids are linear (5.5% delta to prev. frequency)
Highs 2 - 16 kHz
(+) | balanced highs - only 2% away from median
(+) | highs are linear (4.5% delta to prev. frequency)
Overall 100 - 16.000 Hz
(+) | overall sound is linear (10.2% difference to median)
Compared to same class
» 7% of all tested devices in this class were better, 2% similar, 91% worse
» The best had a delta of 5%, average was 18%, worst was 53%
Compared to all devices tested
» 5% of all tested devices were better, 1% similar, 94% worse
» The best had a delta of 4%, average was 23%, worst was 134%
| Off / Standby | |
| Idle | |
| Load |
|
Key:
min: | |
| Battery Runtime - WiFi Websurfing | |
| Asus AsusPro P4540UQ-FY0056R | |
| HP ProBook 450 G4 Y8B60EA | |
| Lenovo ThinkPad E570-20H6S00000 | |
| Dell Vostro 15-5568 | |
| Acer TravelMate P259-MG-71UU | |
Pros
Cons
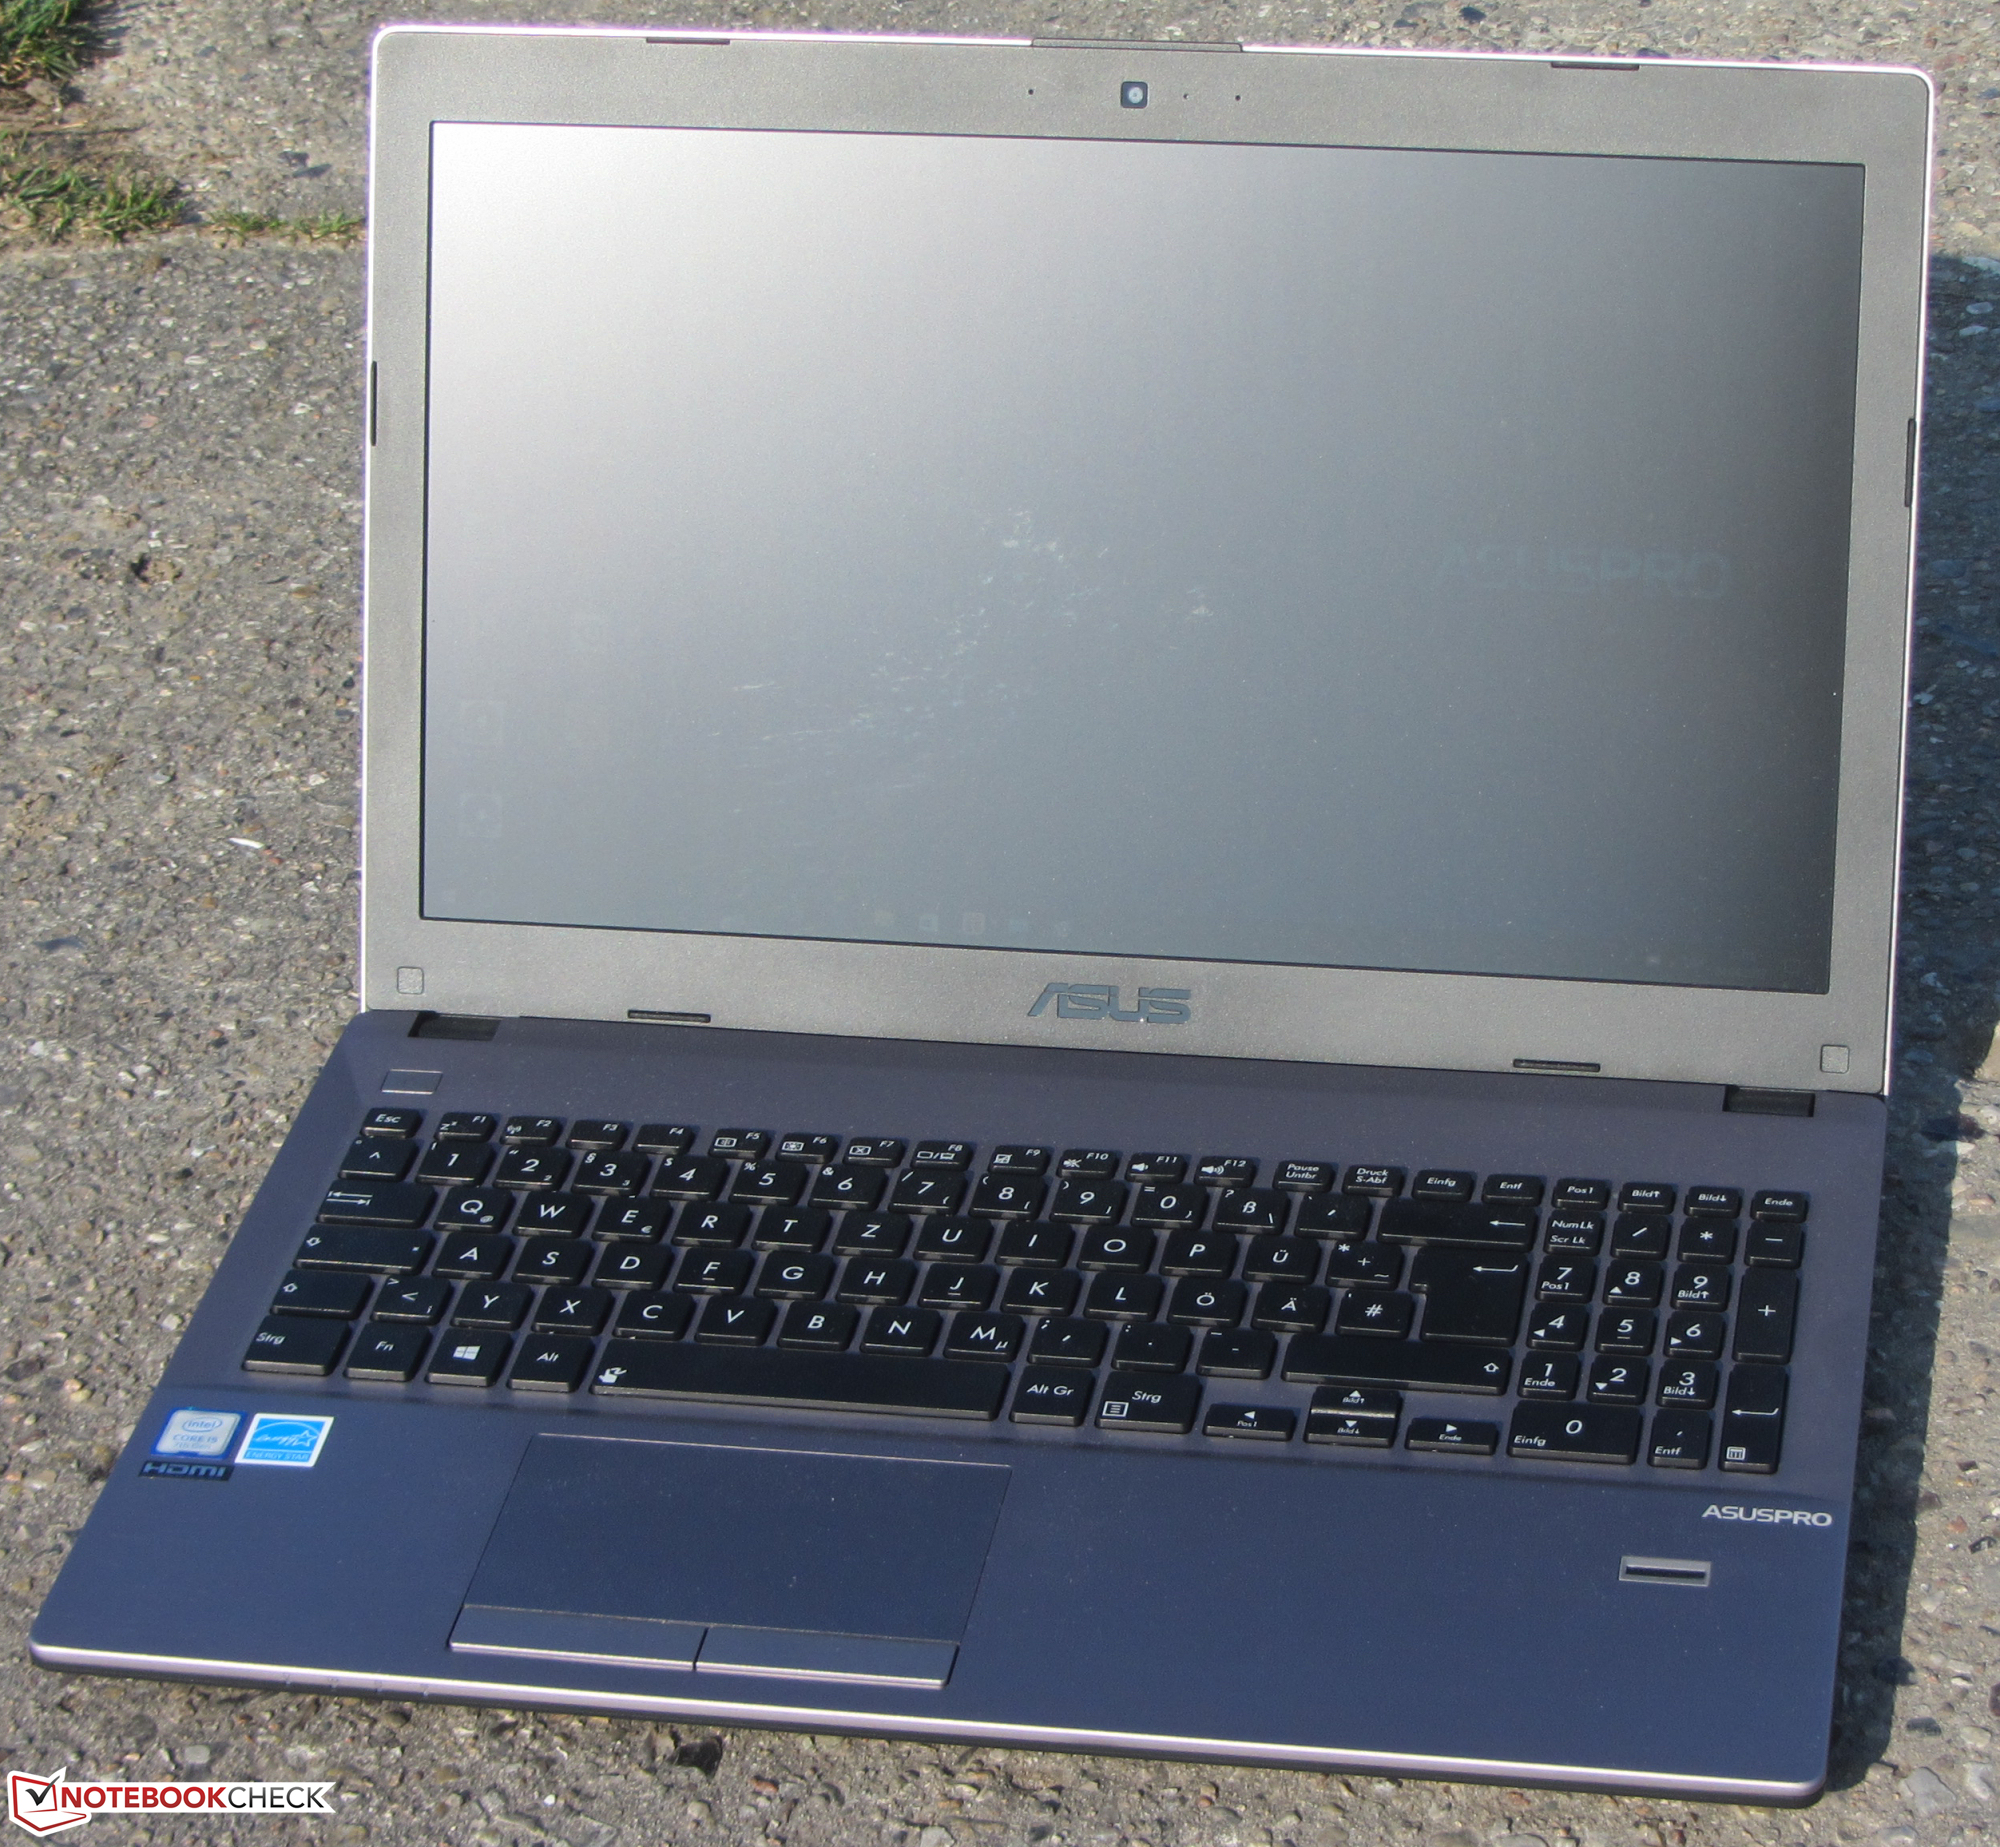
华硕ASUSPRO P4540UQ配备了Kaby-Lake酷睿i5处理器,完全可以满足大多数用户的需求。GeForce图形核显可以运行众多游戏。尽管设备体运行能力不俗,但它几乎不发烫,而且大多数情况下运行安静。
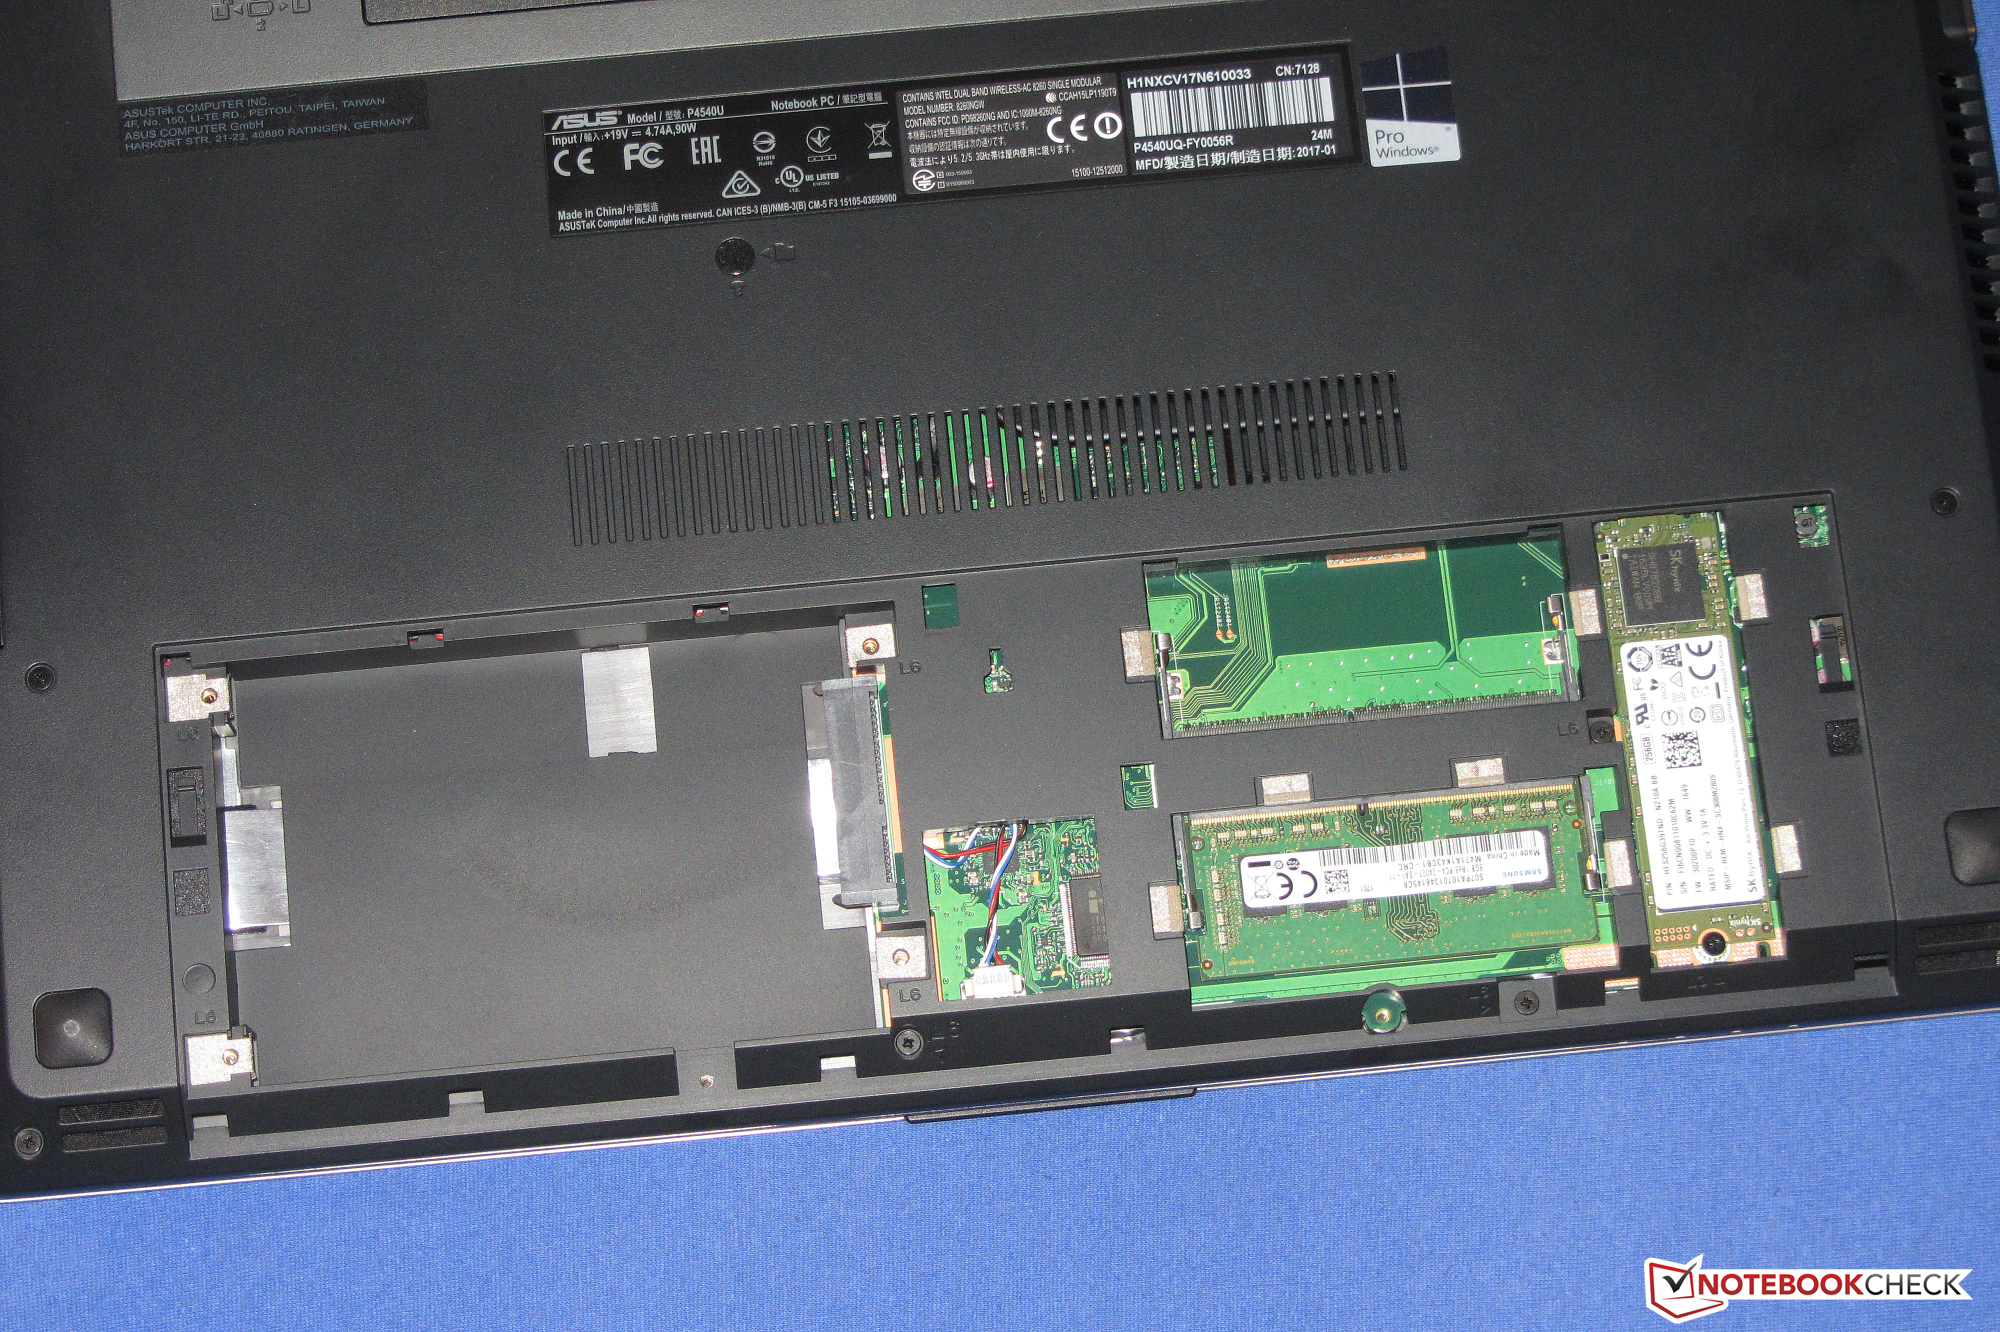
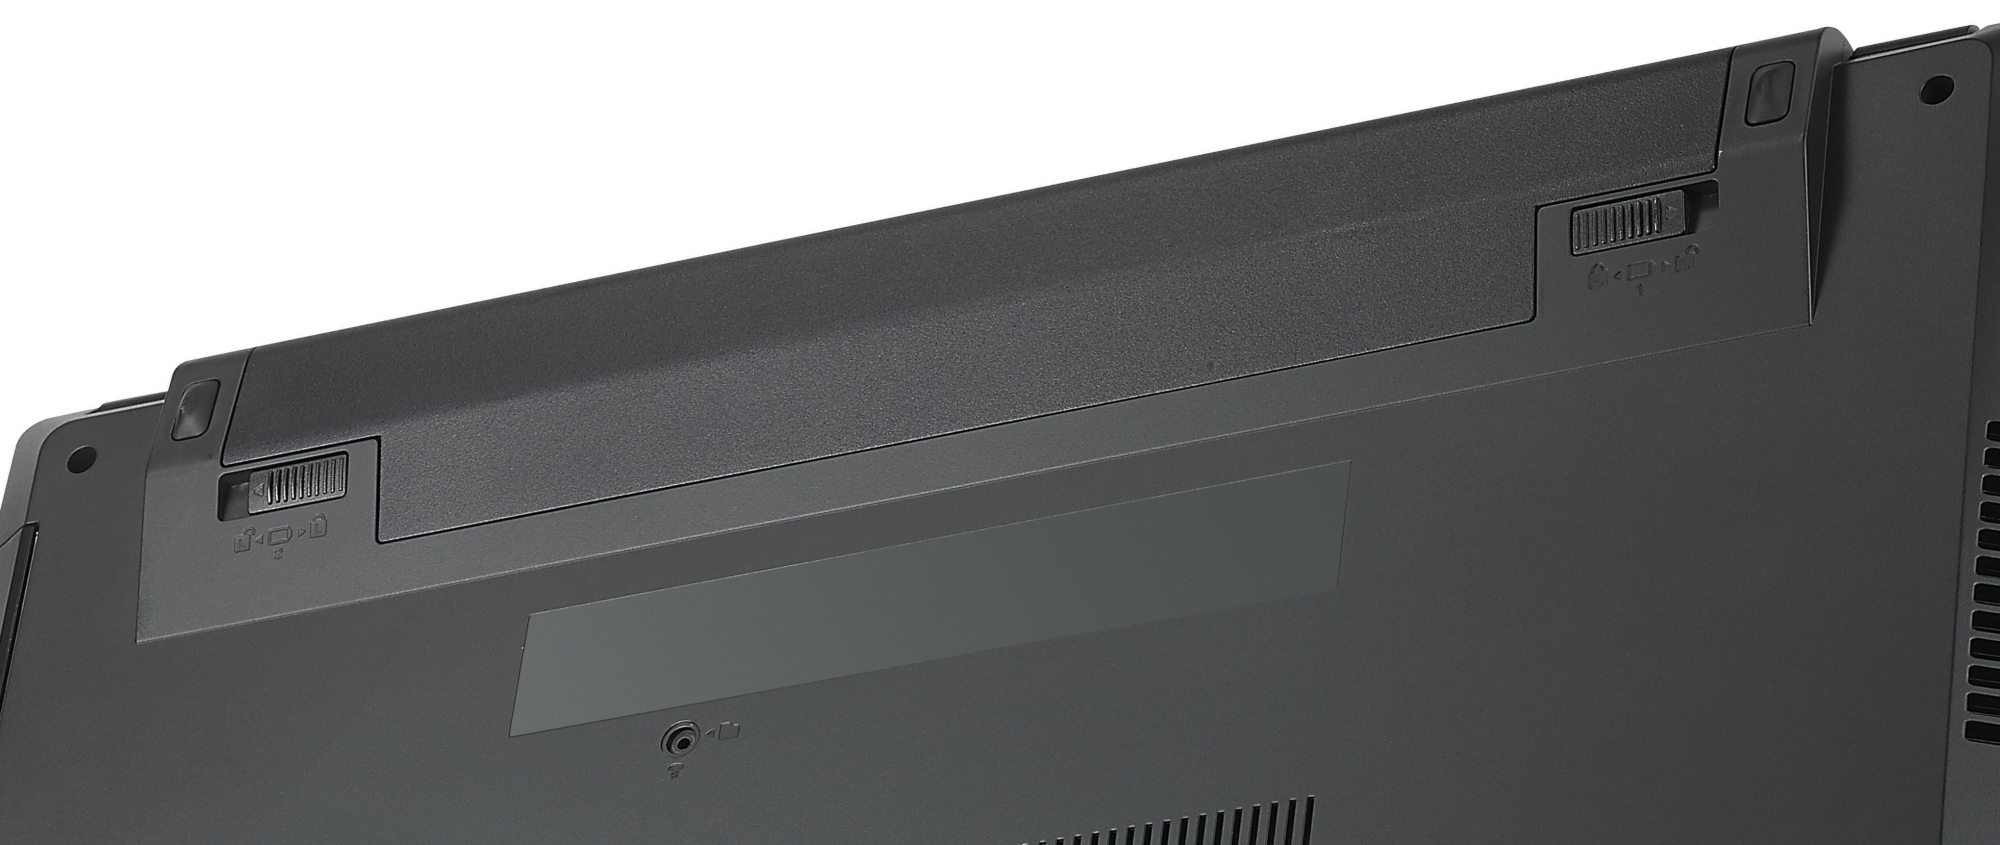
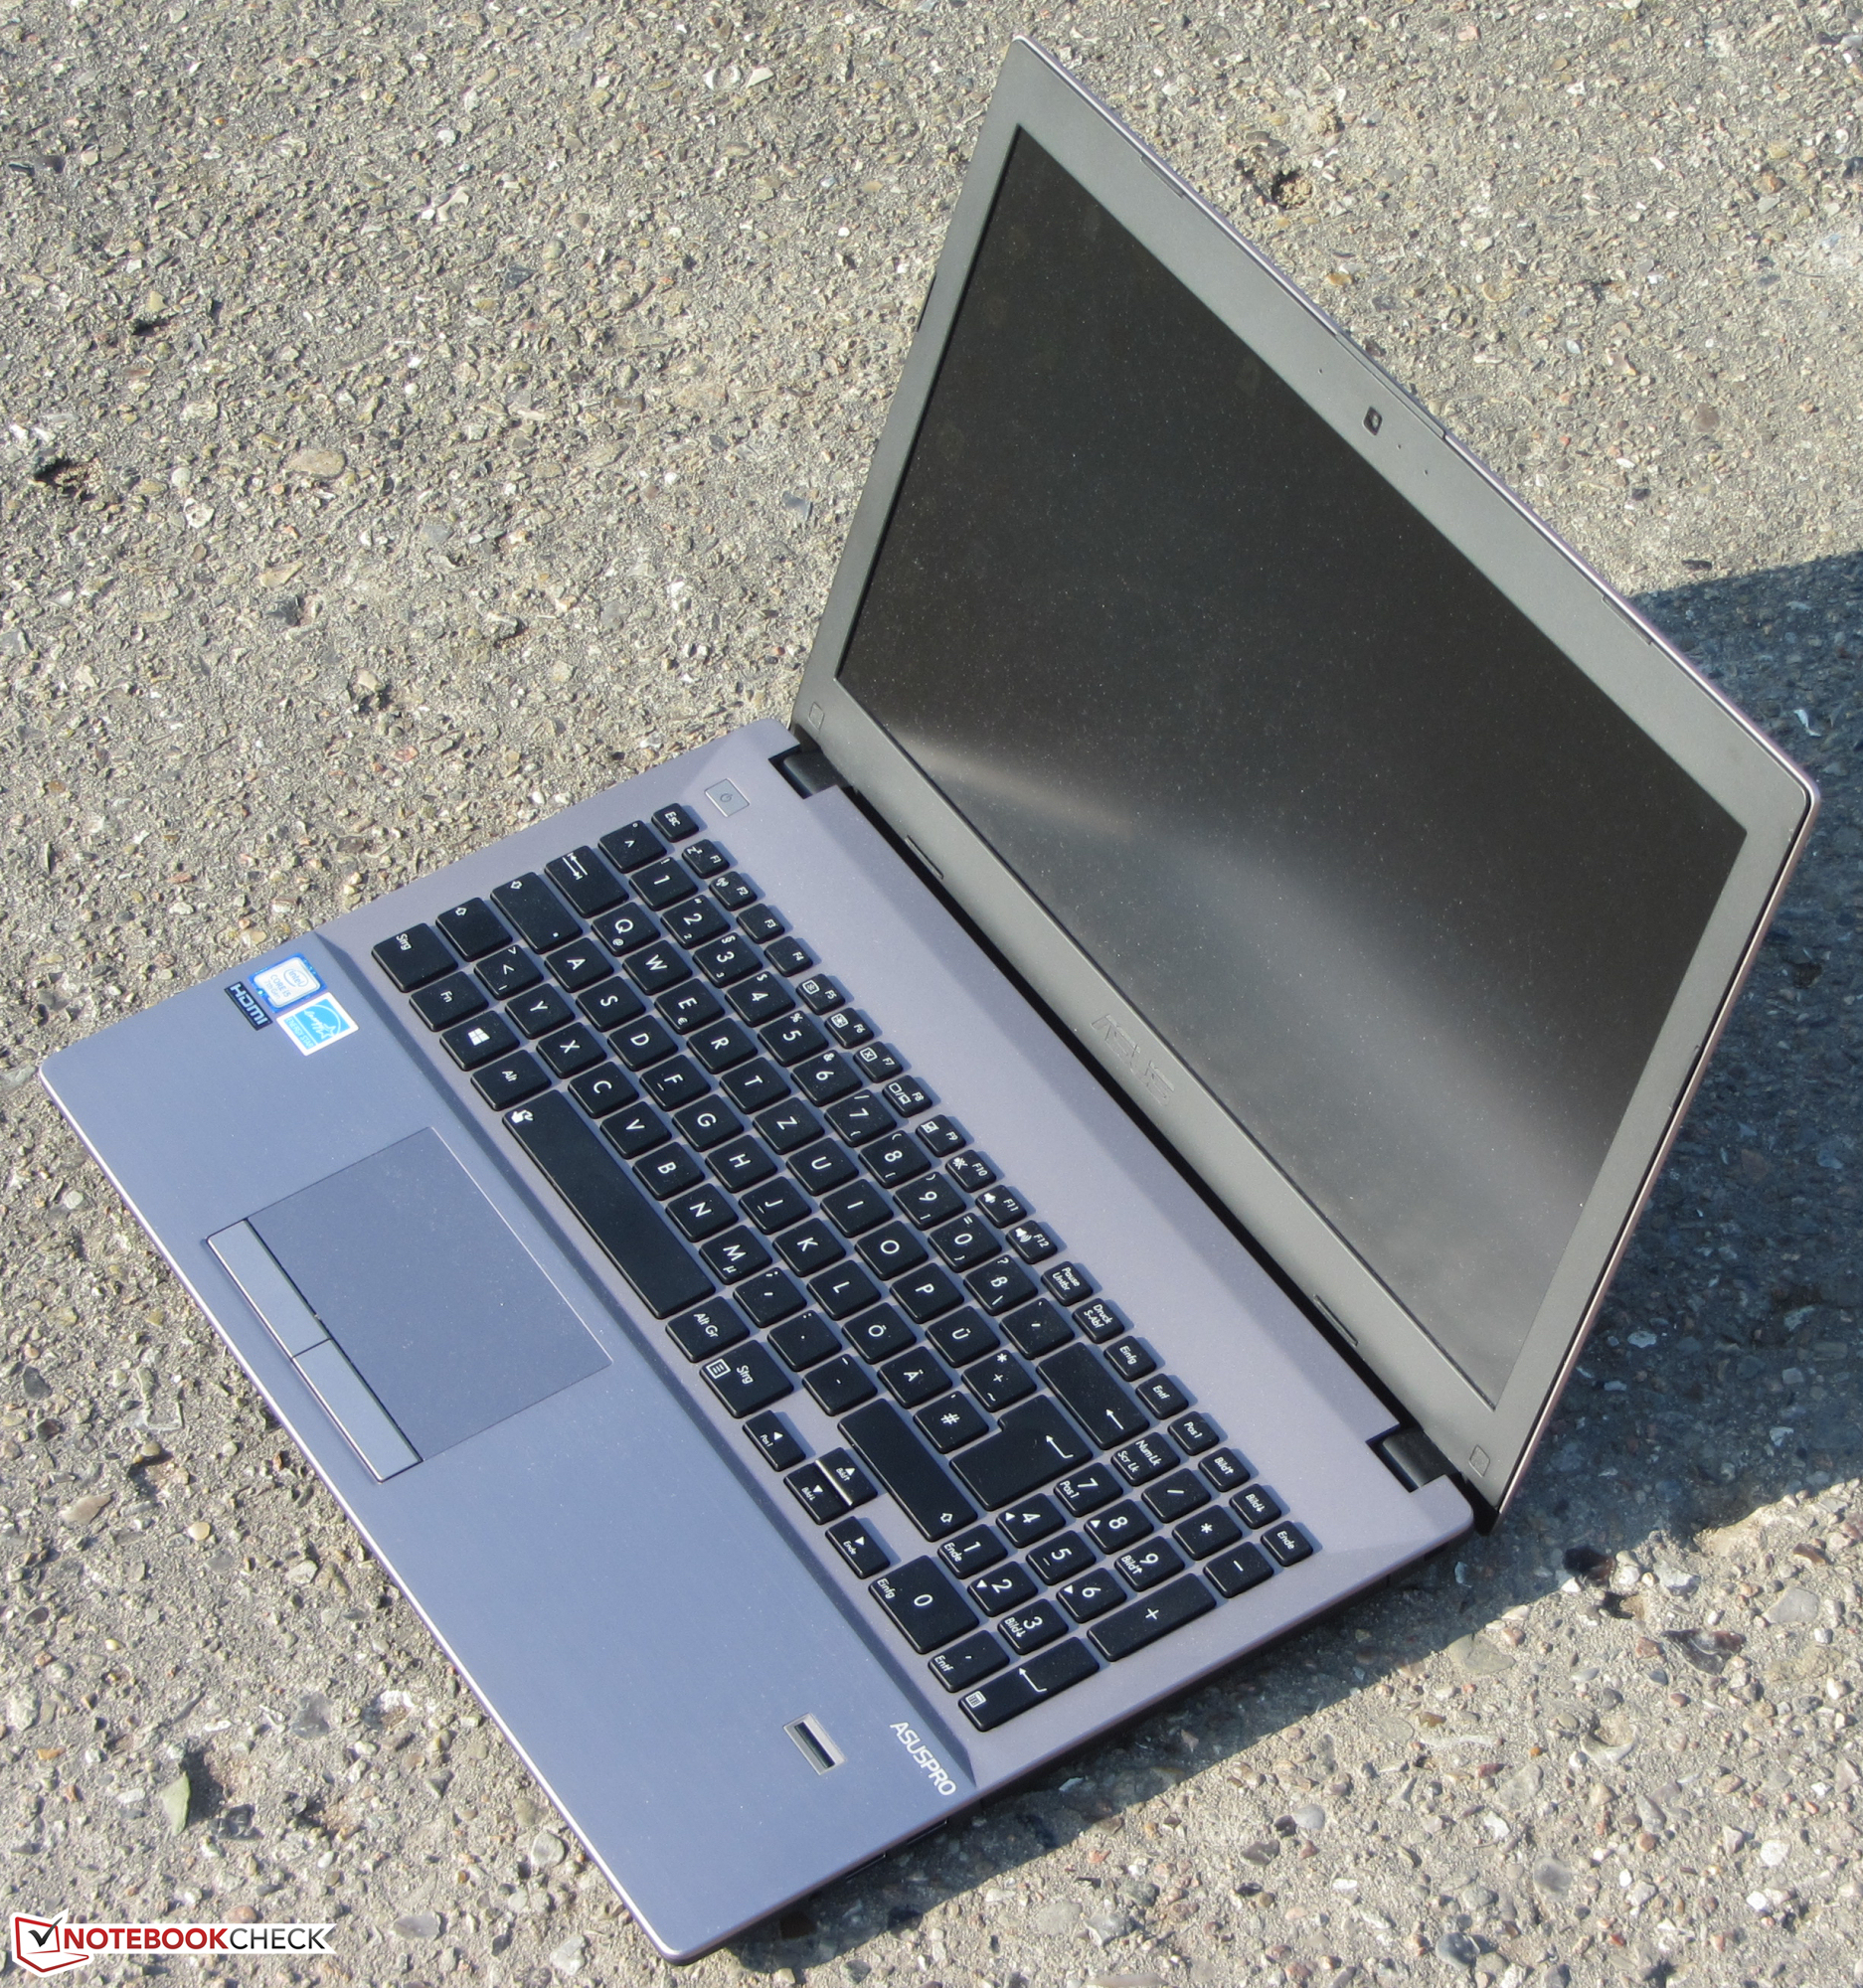
固态驱动器确保系统的快速运行。维护舱口的存在,使得固态硬盘的更换可以快速完成。用户还可以选择在计算机中插入一个额外的2.5英寸硬盘。当然,安装框架仍然是必须自行购买的。该机的哑光IPS屏幕具有稳定的视角,良好的对比度和亮度。优秀续航时候同样不容忽视。
华硕的ASUSPRO P4540UQ,确实可以媲美竞争对手。
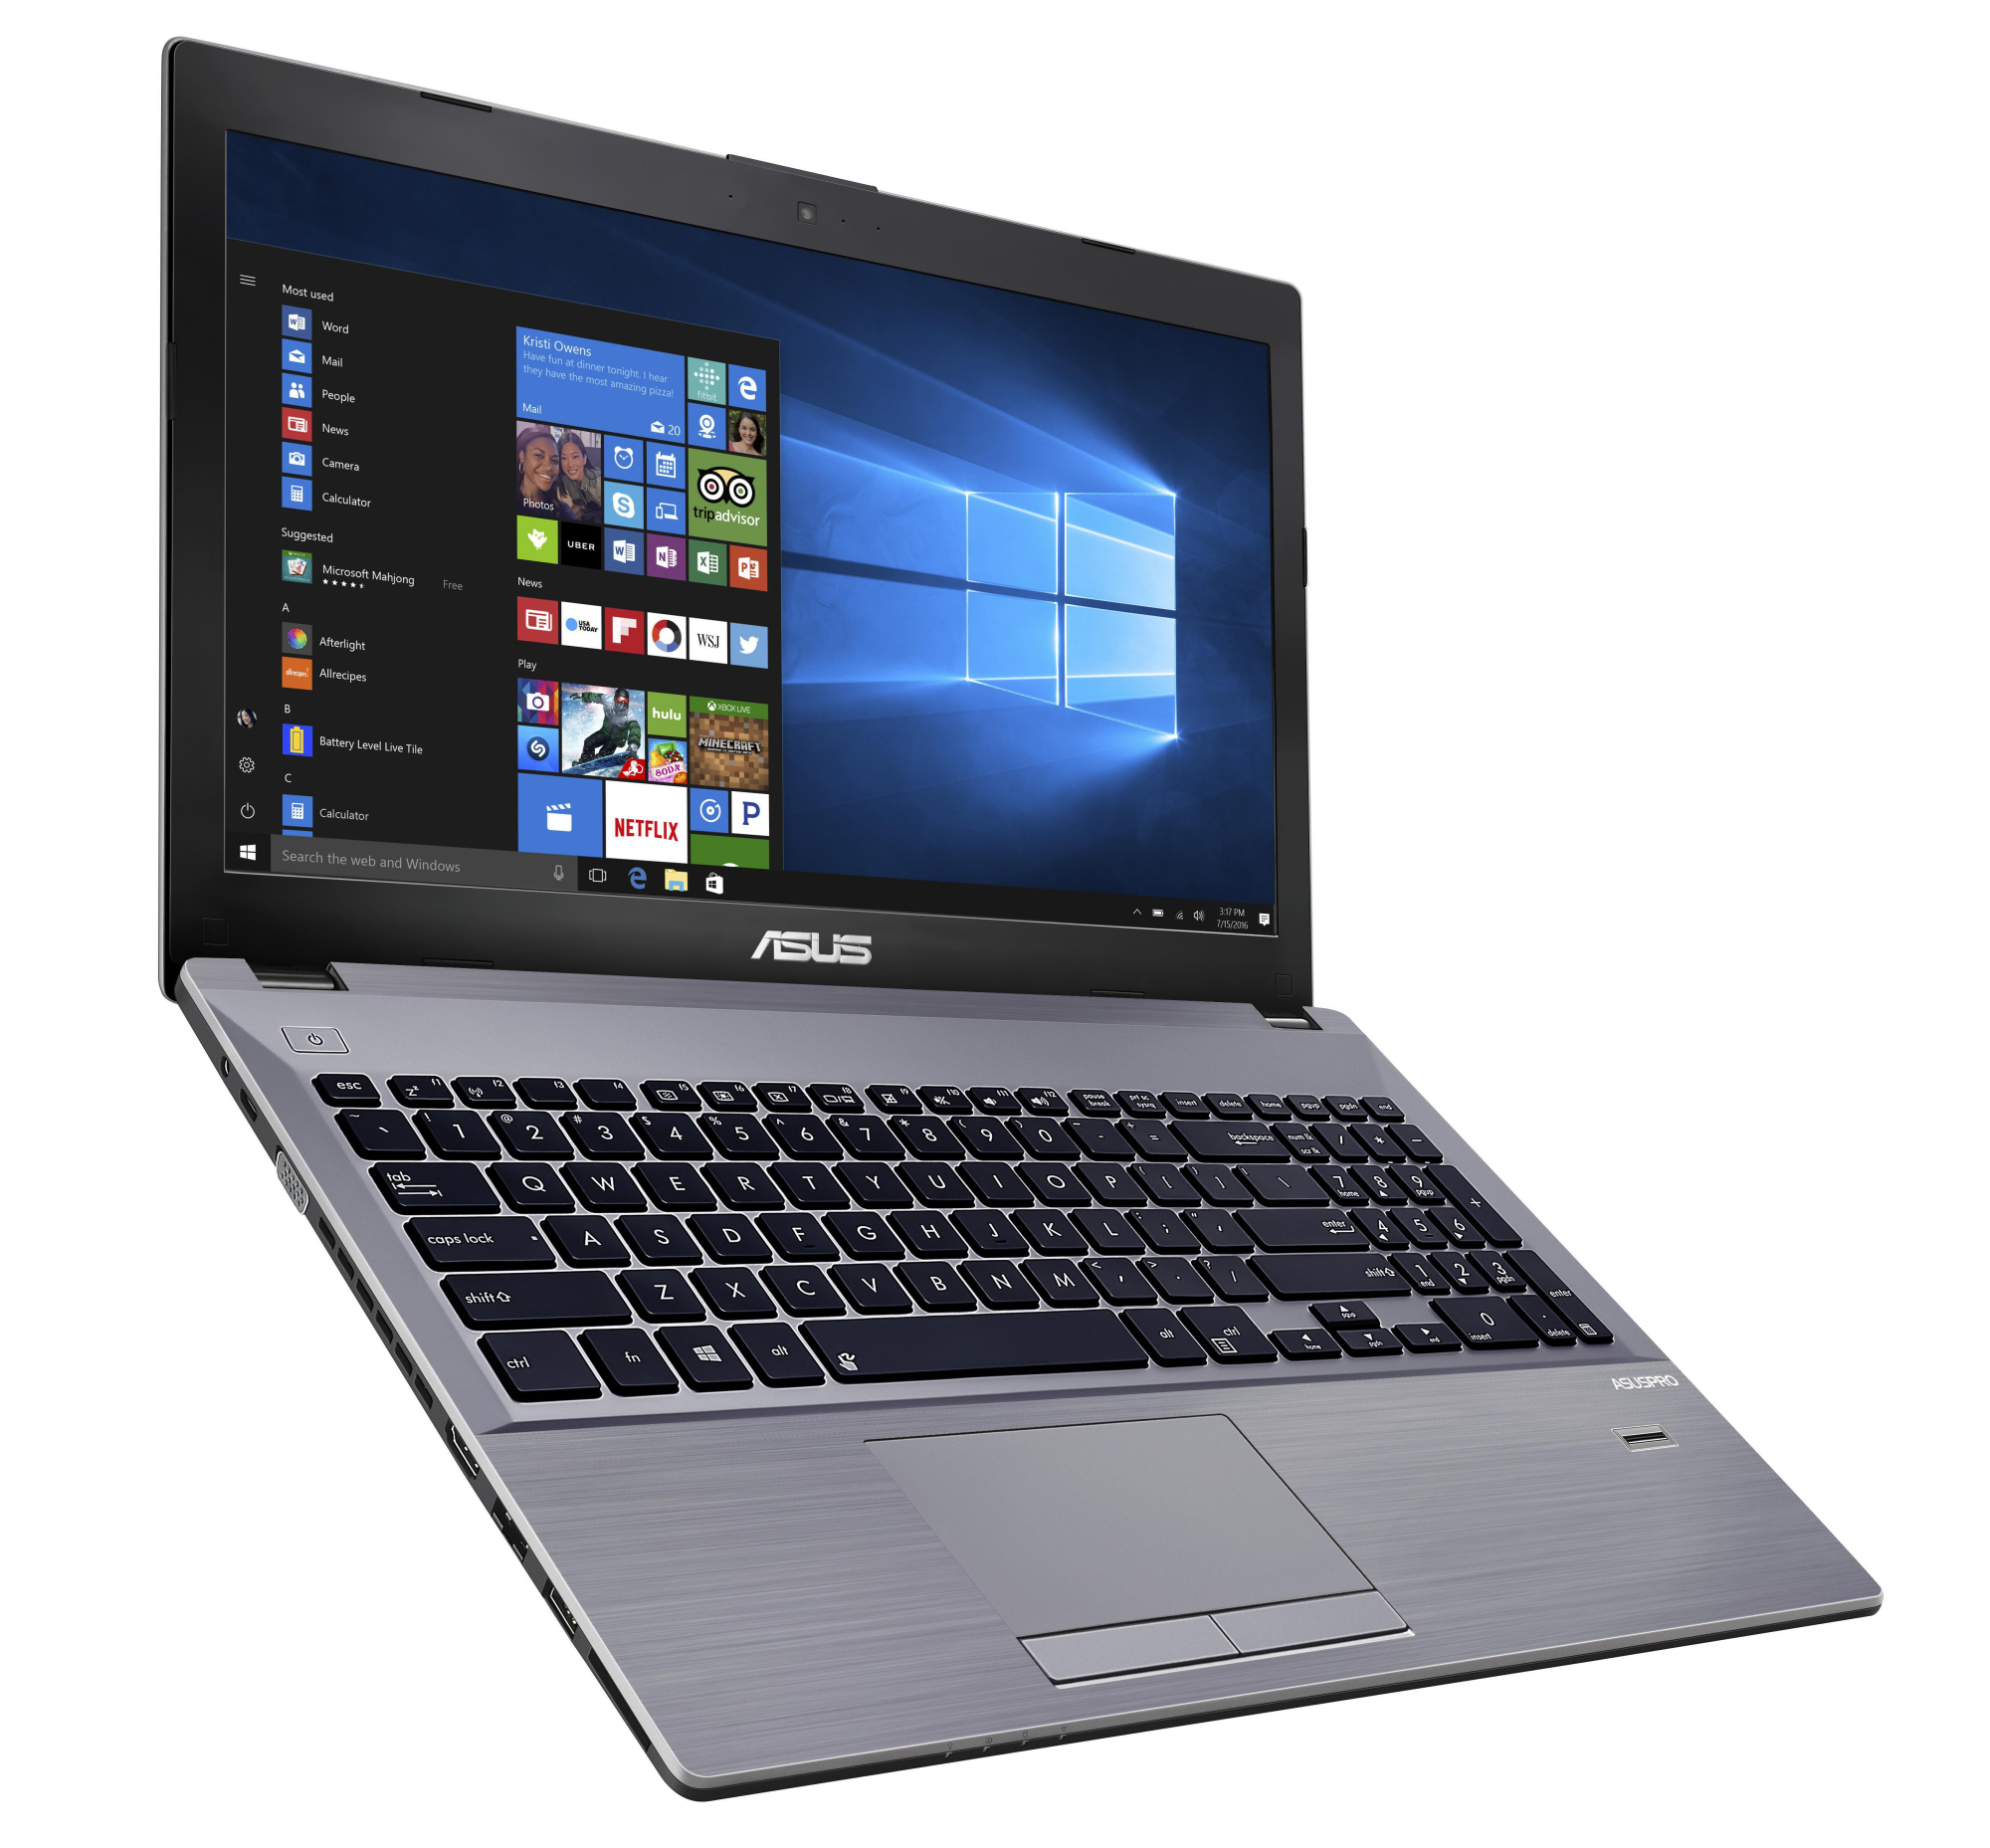
我们看到键盘还有改进的空间。并不是说改键盘不好,而是它不能比肩HP ProBook 450 G4 和联想 ThinkPad E570所搭载的键盘。另外,华硕的键盘缺少了背光。当然,这这方面,竞争对手也没强多少。
注:本文是基于完整评测的缩减版本,阅读完整的英文评测,请点击这里。
Asus AsusPro P4540UQ-FY0056R
- 04/06/2017 v6 (old)
Sascha Mölck