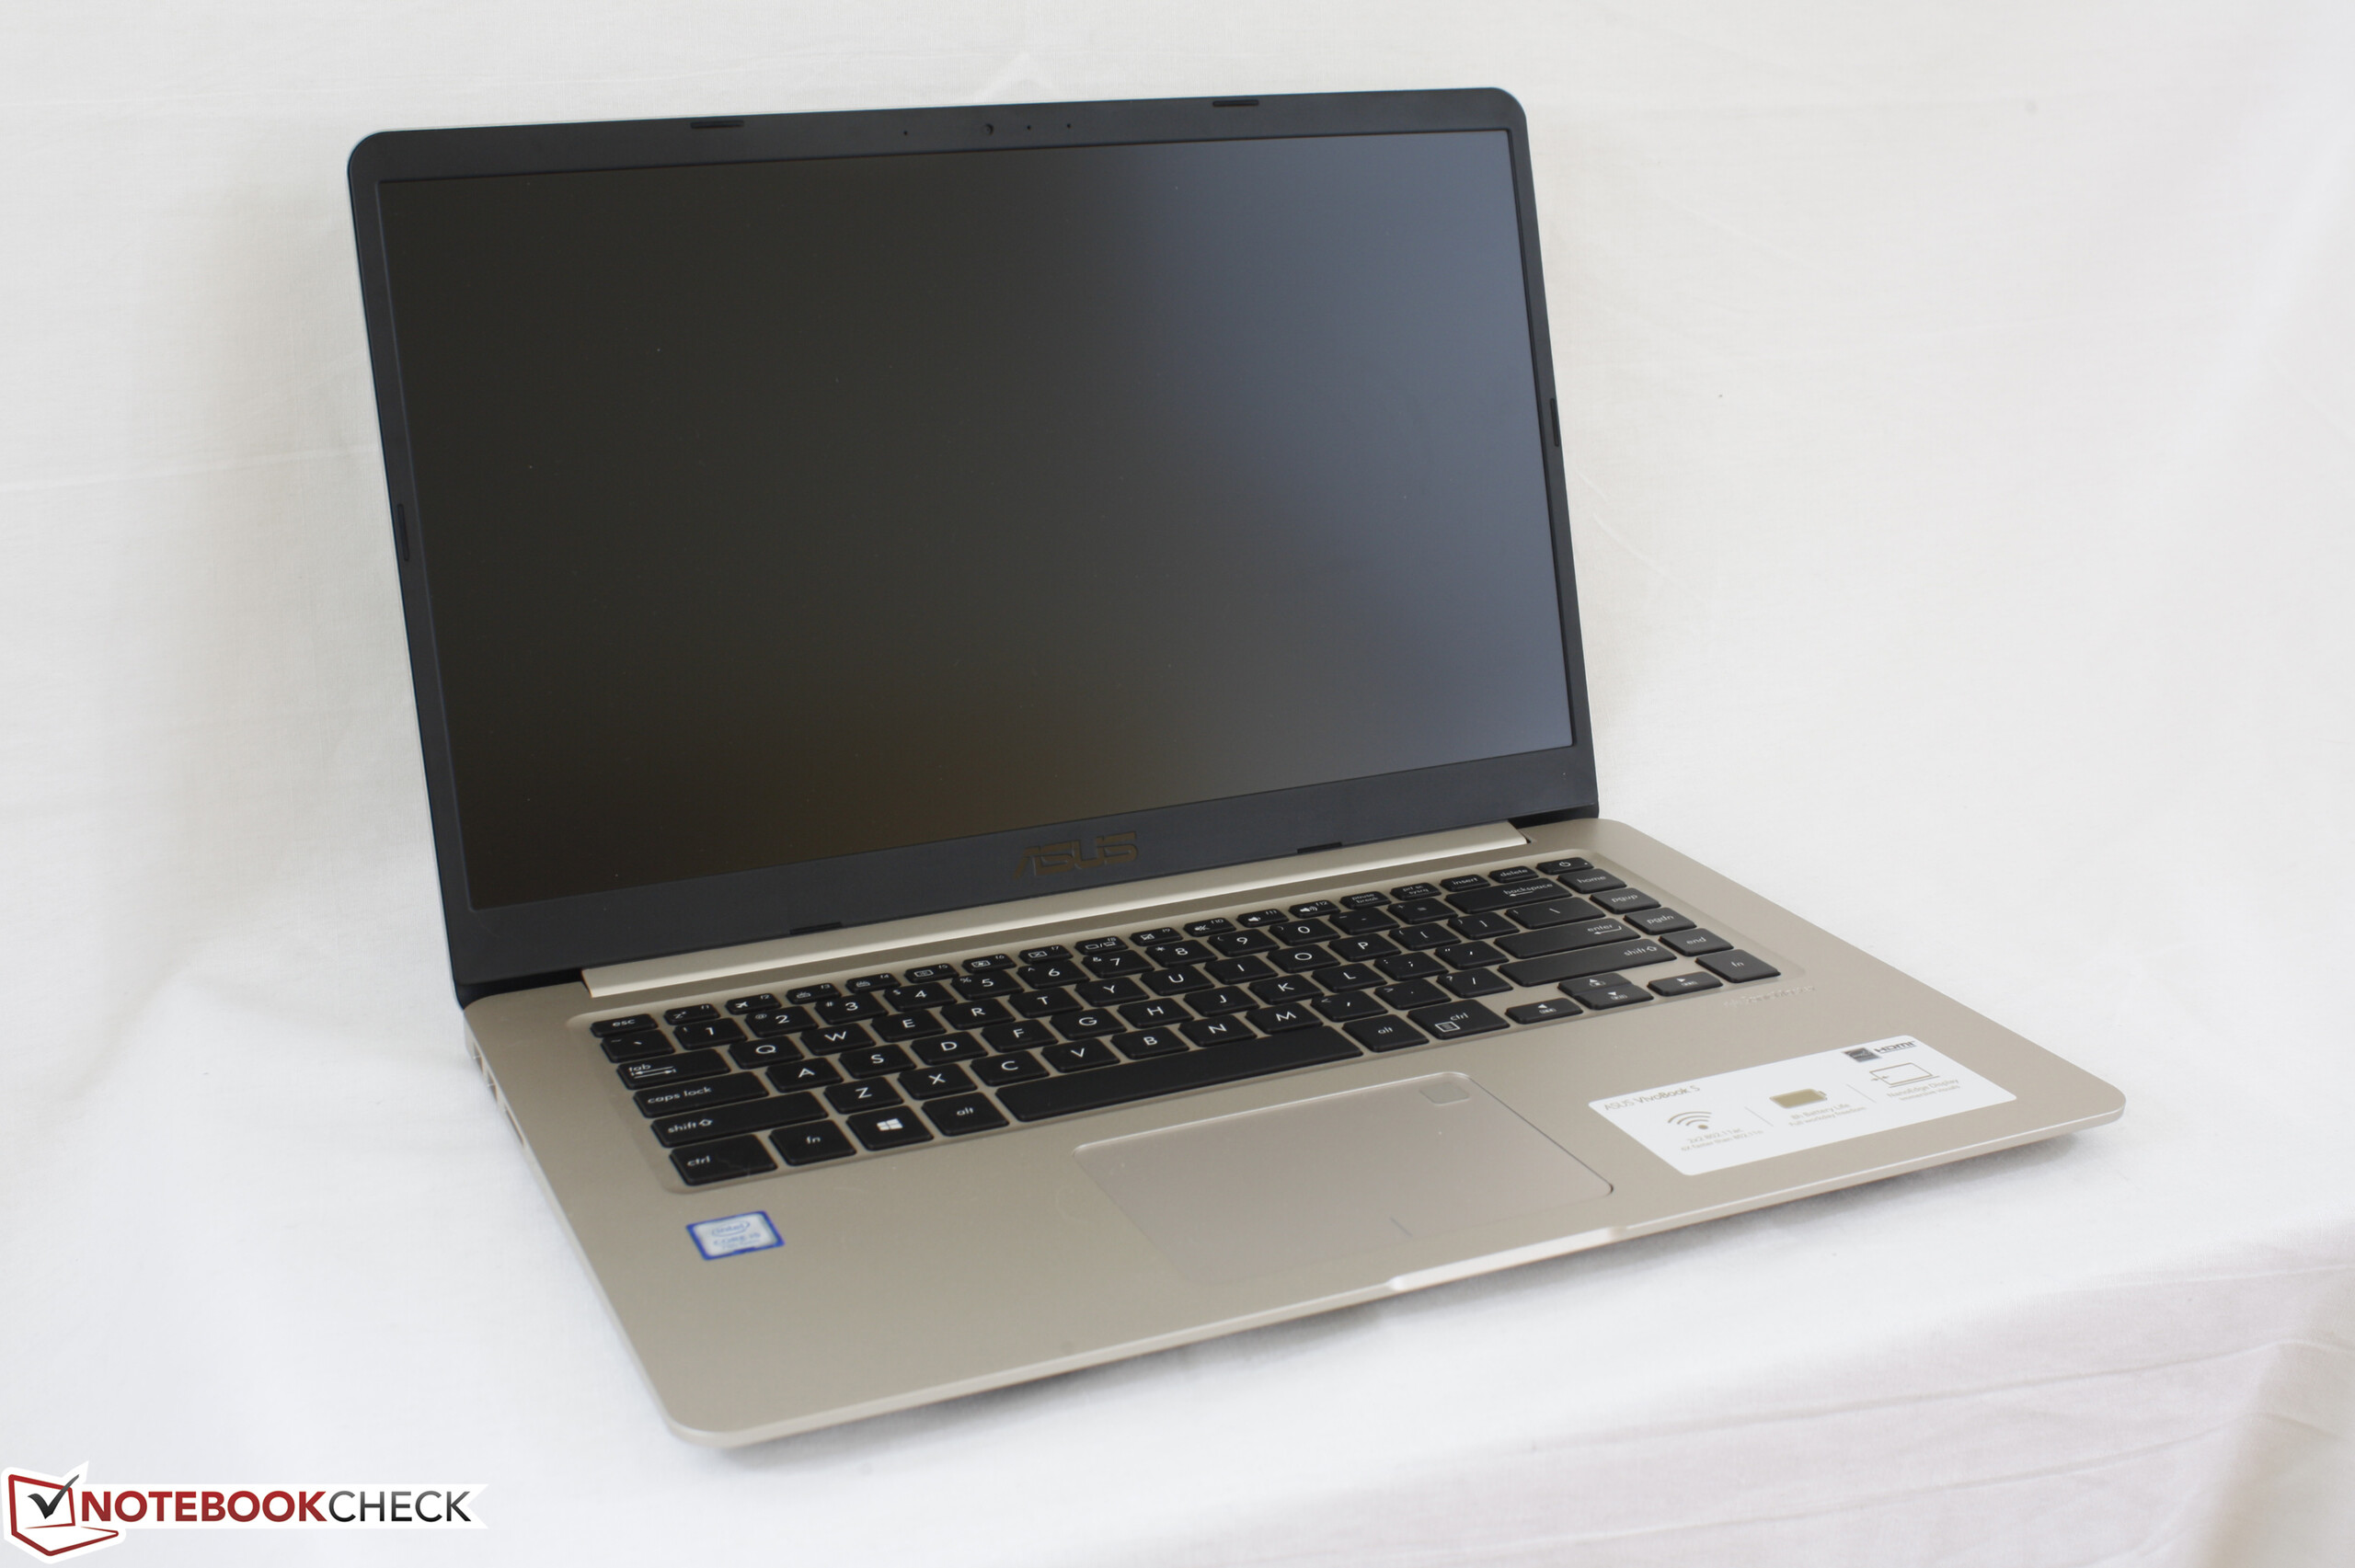
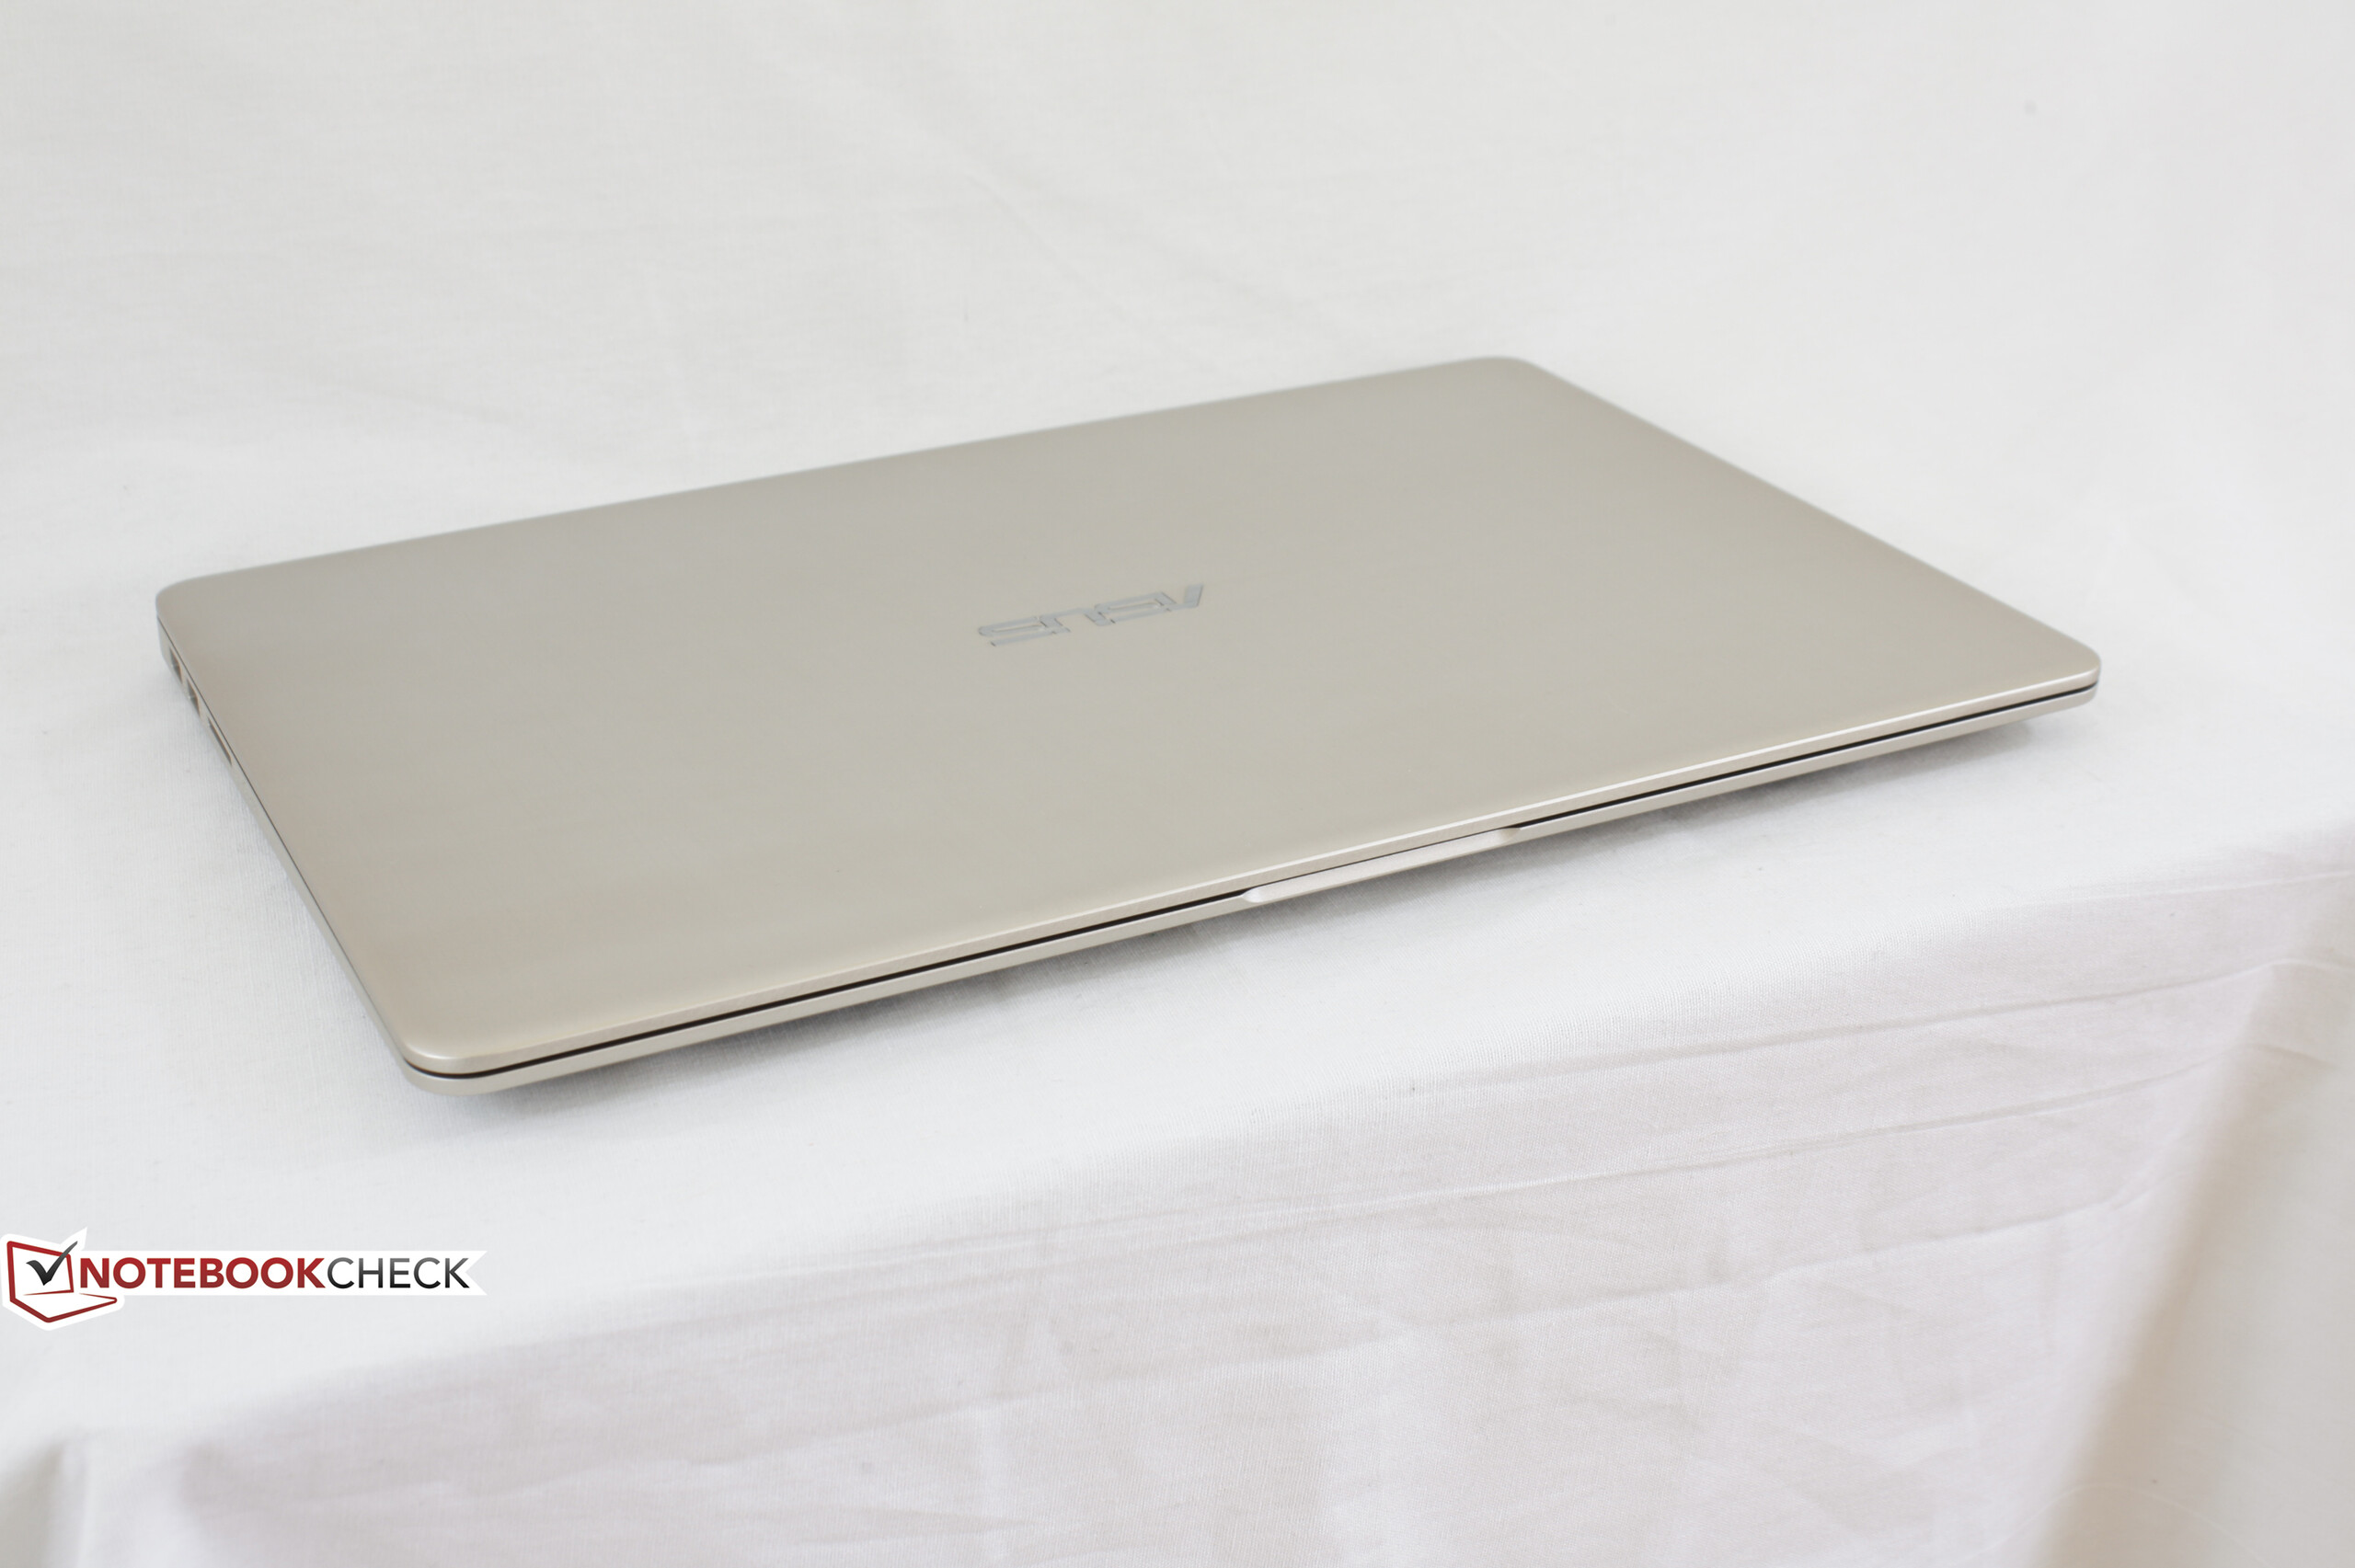
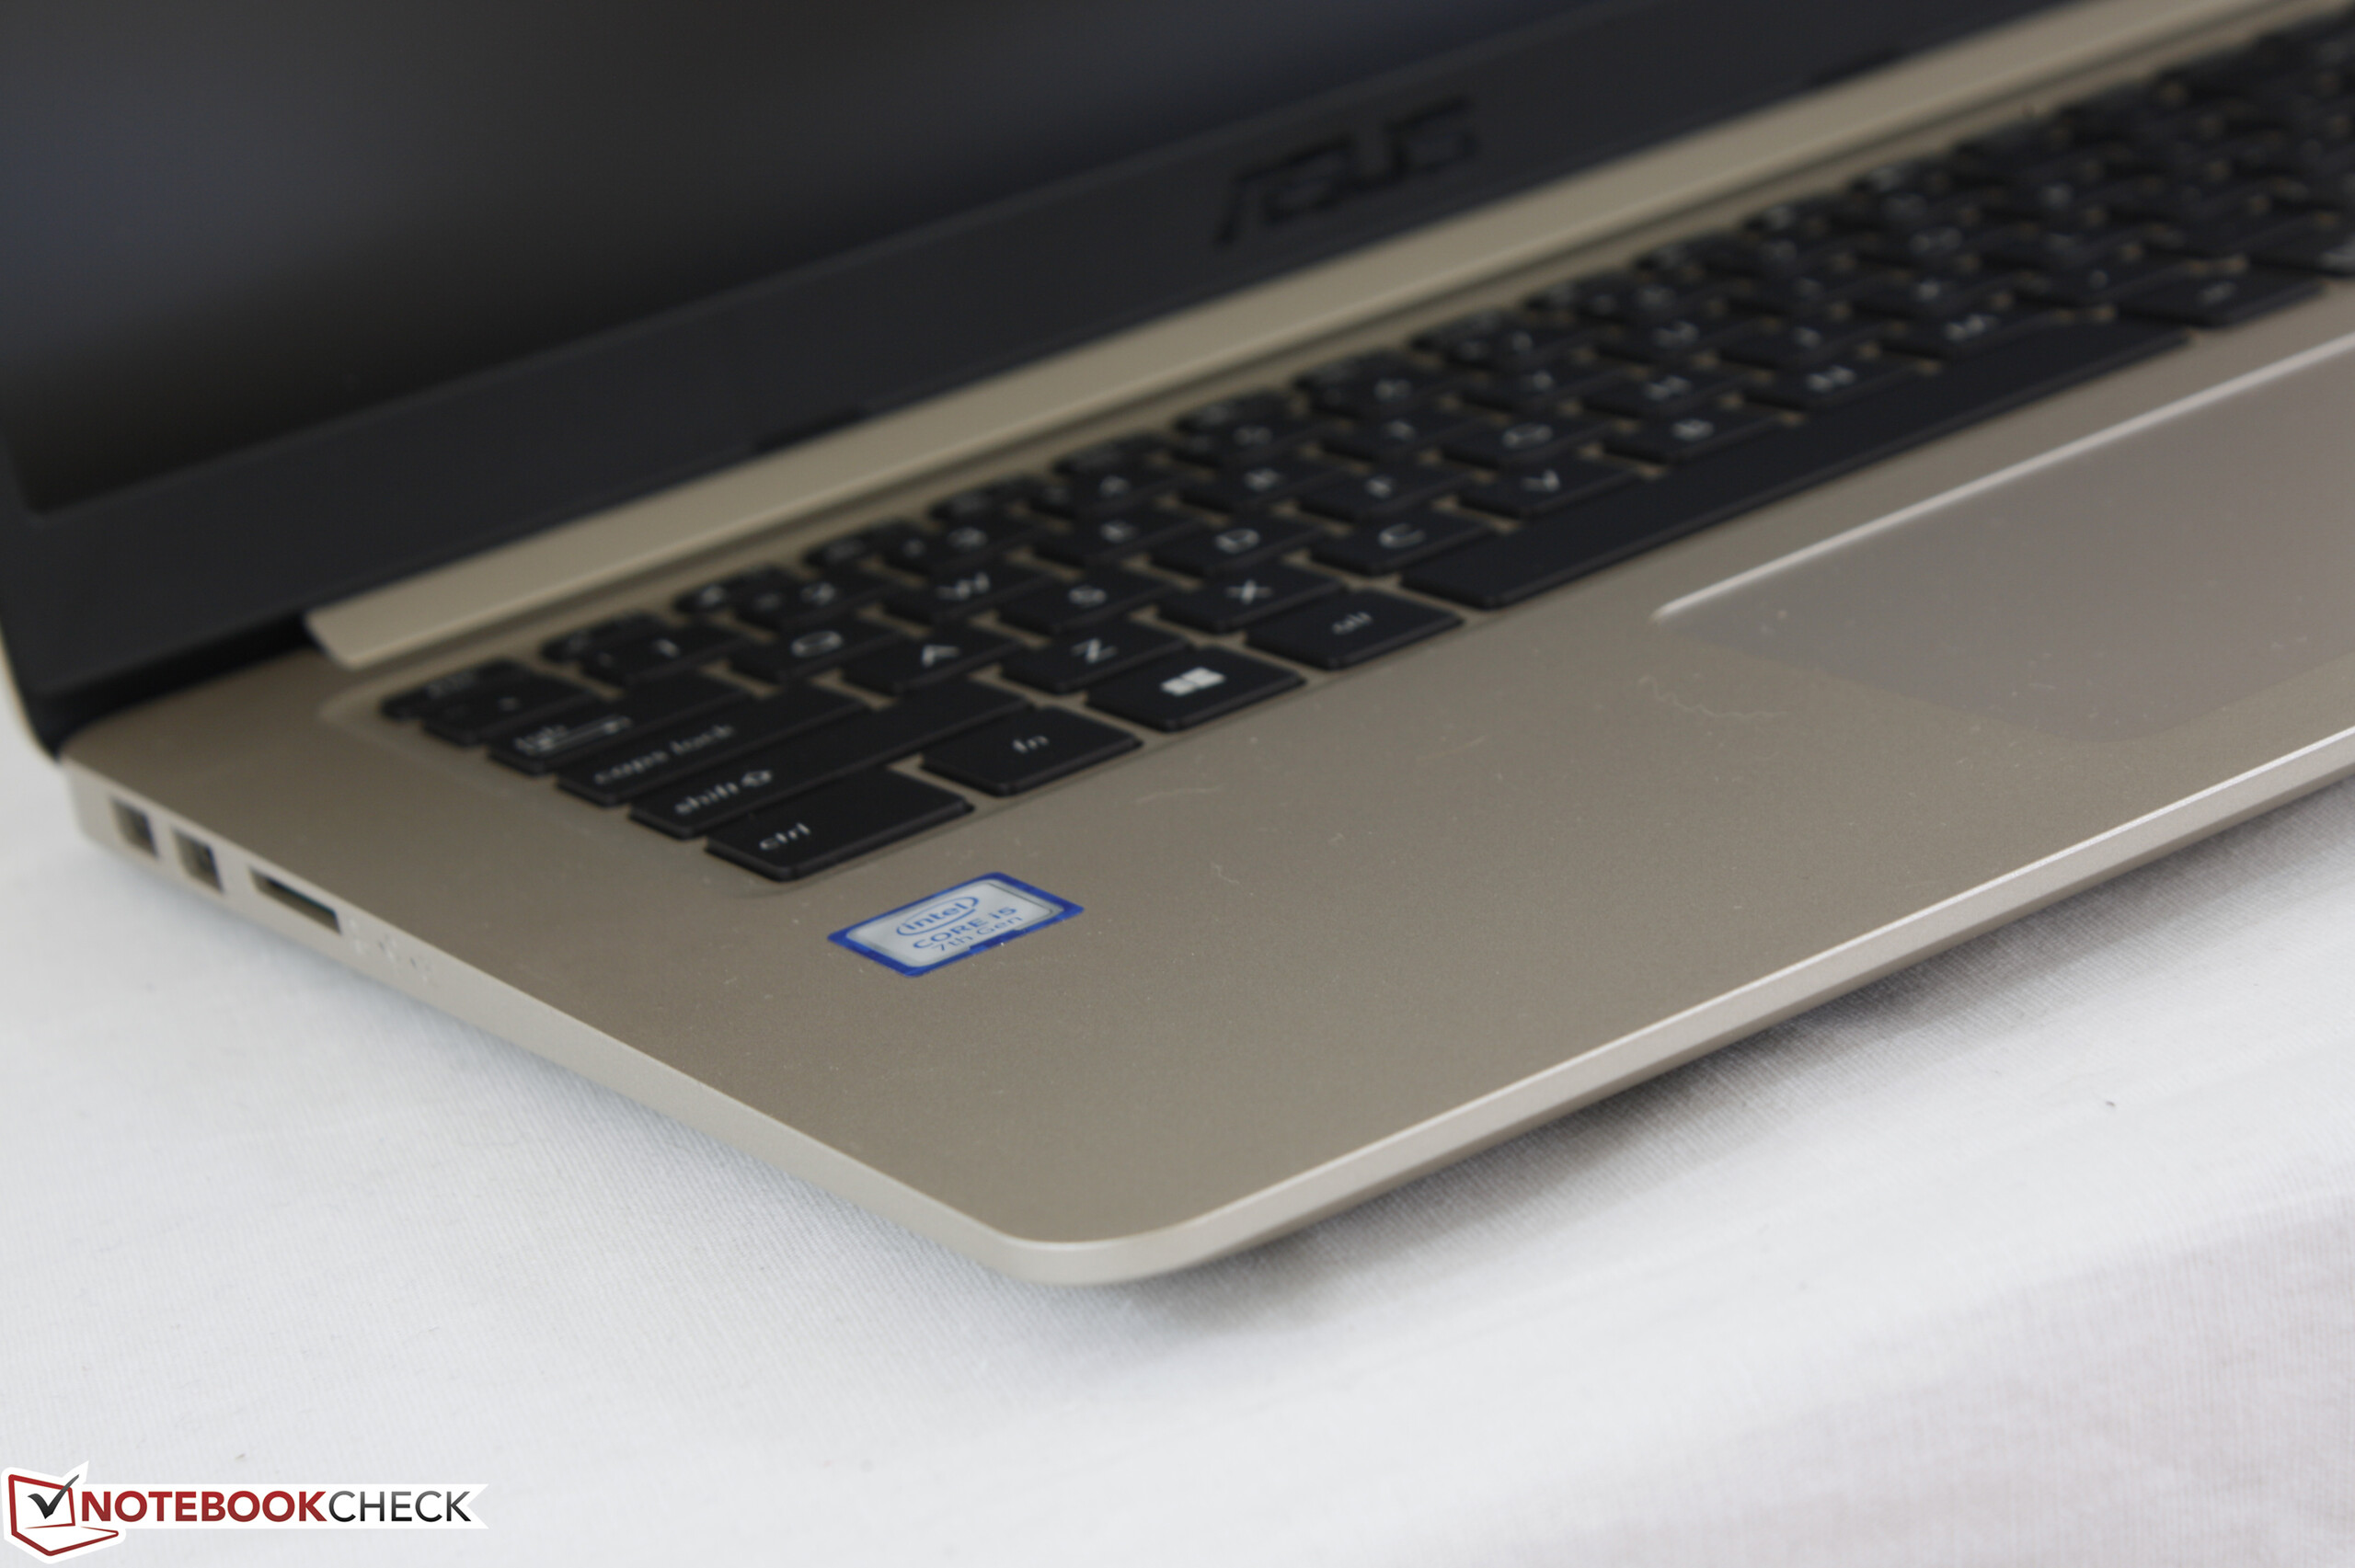
华硕 VivoBook S15 S510UQ (i5-7200U, 940MX) 笔记本电脑简短评测
| SD Card Reader | |
| average JPG Copy Test (av. of 3 runs) | |
| HP Pavilion 15 Power 1GK62AV (Toshiba Exceria Pro SDXC 64 GB UHS-II) | |
| Lenovo ThinkPad E570-20H6S00000 (Toshiba Exceria Pro SDXC 64 GB UHS-II) | |
| Asus Vivobook S15 S510UQ-BQ189T (Toshiba Exceria Pro SDXC 64 GB UHS-II) | |
| Acer Swift 3 SF315-51G-55Z9 (Toshiba Exceria Pro SDXC 64 GB UHS-II) | |
| maximum AS SSD Seq Read Test (1GB) | |
| HP Pavilion 15 Power 1GK62AV (Toshiba Exceria Pro SDXC 64 GB UHS-II) | |
| Lenovo ThinkPad E570-20H6S00000 (Toshiba Exceria Pro SDXC 64 GB UHS-II) | |
| Asus Vivobook S15 S510UQ-BQ189T (Toshiba Exceria Pro SDXC 64 GB UHS-II) | |
| Acer Swift 3 SF315-51G-55Z9 (Toshiba Exceria Pro SDXC 64 GB UHS-II) | |
| |||||||||||||||||||||||||
Brightness Distribution: 86 %
Center on Battery: 293 cd/m²
Contrast: 1172:1 (Black: 0.25 cd/m²)
ΔE ColorChecker Calman: 3.81 | ∀{0.5-29.43 Ø4.71}
ΔE Greyscale Calman: 2.66 | ∀{0.09-98 Ø4.96}
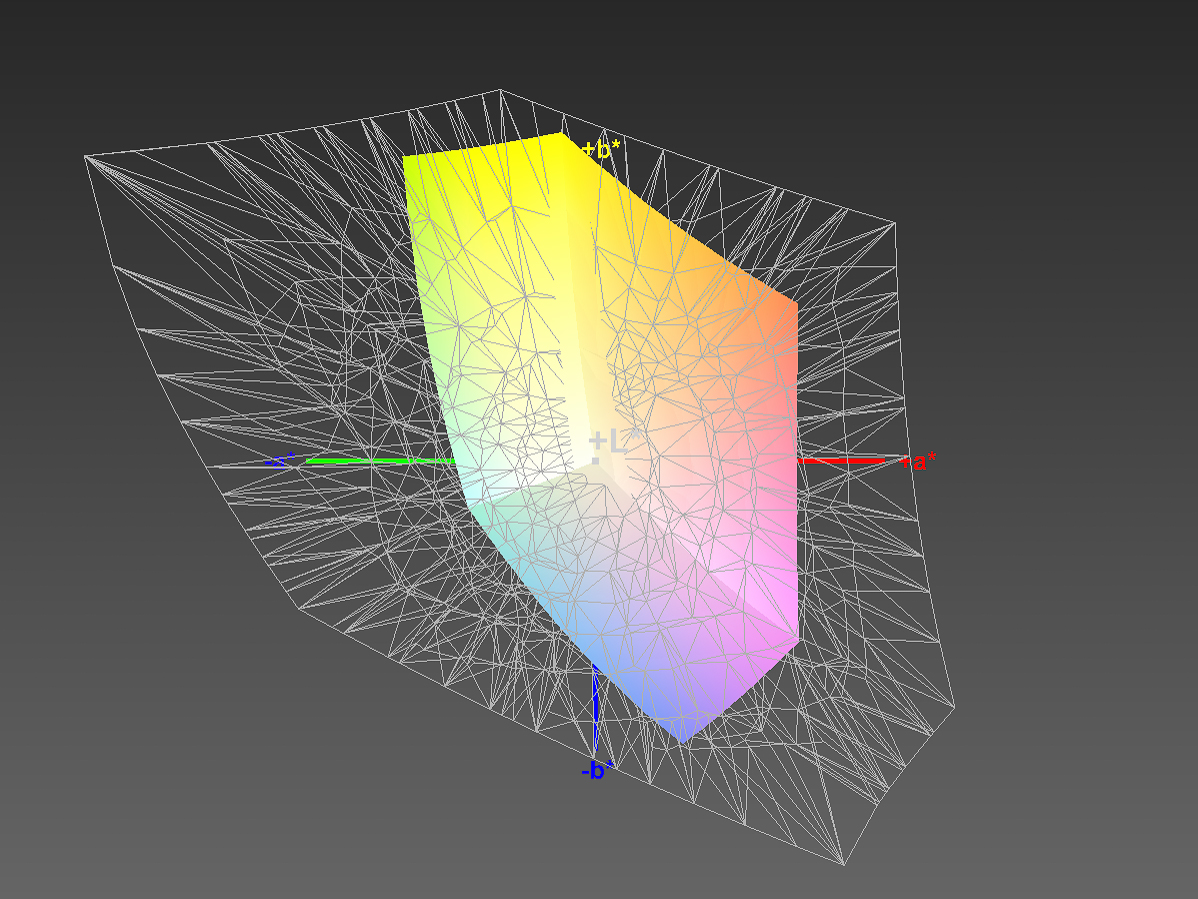
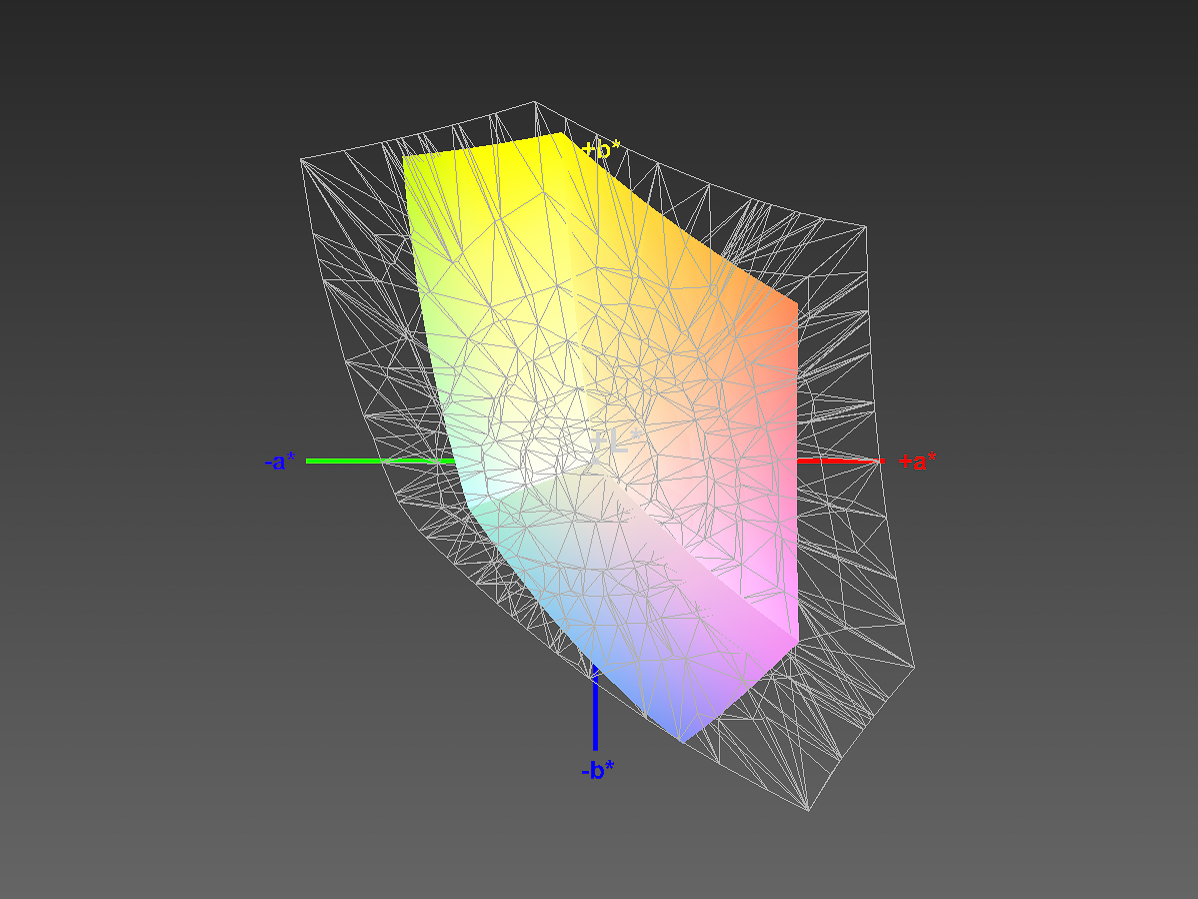
58% sRGB (Argyll 1.6.3 3D)
37% AdobeRGB 1998 (Argyll 1.6.3 3D)
40.23% AdobeRGB 1998 (Argyll 3D)
58.5% sRGB (Argyll 3D)
38.94% Display P3 (Argyll 3D)
Gamma: 2.54
CCT: 6541 K
| Asus Vivobook S15 S510UQ-BQ189T AU Optronics B156W02 / AUO B156HAN02.1, , 1920x1080, 15.6" | Acer Swift 3 SF315-51G-55Z9 BOE0700 / BOE CQ NV156FHM-N48, , 1920x1080, 15.6" | Lenovo ThinkPad E570-20H6S00000 AUO B156HAN04.4, , 1920x1080, 15.6" | HP Pavilion 15 Power 1GK62AV ID: AU Optronics AUO41ED, , 1920x1080, 15.6" | |
|---|---|---|---|---|
| Display | -0% | -1% | -0% | |
| Display P3 Coverage (%) | 38.94 | 39.02 0% | 38.65 -1% | 38.81 0% |
| sRGB Coverage (%) | 58.5 | 57.7 -1% | 58 -1% | 57.9 -1% |
| AdobeRGB 1998 Coverage (%) | 40.23 | 40.31 0% | 39.94 -1% | 40.03 0% |
| Response Times | -2% | 7% | 9% | |
| Response Time Grey 50% / Grey 80% * (ms) | 47 ? | 42 ? 11% | 44.8 ? 5% | 38.8 ? 17% |
| Response Time Black / White * (ms) | 28 ? | 32 ? -14% | 25.6 ? 9% | 28 ? -0% |
| PWM Frequency (Hz) | 1087 ? | |||
| Screen | -10% | -15% | -23% | |
| Brightness middle (cd/m²) | 293 | 248 -15% | 242 -17% | 256.6 -12% |
| Brightness (cd/m²) | 275 | 239 -13% | 243 -12% | 243 -12% |
| Brightness Distribution (%) | 86 | 69 -20% | 75 -13% | 81 -6% |
| Black Level * (cd/m²) | 0.25 | 0.18 28% | 0.24 4% | 0.19 24% |
| Contrast (:1) | 1172 | 1378 18% | 1008 -14% | 1351 15% |
| Colorchecker dE 2000 * | 3.81 | 4.85 -27% | 4.65 -22% | 5 -31% |
| Colorchecker dE 2000 max. * | 6.64 | 8.34 -26% | 9.64 -45% | 20.1 -203% |
| Greyscale dE 2000 * | 2.66 | 3.84 -44% | 3.39 -27% | 2.7 -2% |
| Gamma | 2.54 87% | 2.29 96% | 2.7 81% | 2.32 95% |
| CCT | 6541 99% | 6790 96% | 6246 104% | 6599 98% |
| Color Space (Percent of AdobeRGB 1998) (%) | 37 | 37 0% | 36.69 -1% | 36.7 -1% |
| Color Space (Percent of sRGB) (%) | 58 | 57 -2% | 57.66 -1% | 57.7 -1% |
| Total Average (Program / Settings) | -4% /
-7% | -3% /
-9% | -5% /
-14% |
* ... smaller is better
Display Response Times
| ↔ Response Time Black to White | ||
|---|---|---|
| 28 ms ... rise ↗ and fall ↘ combined | ↗ 16 ms rise | 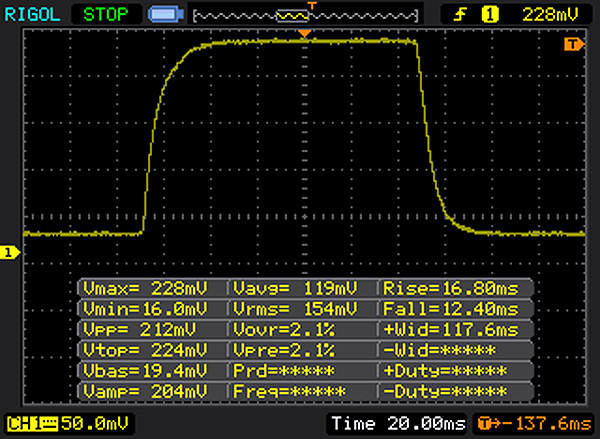 |
| ↘ 12 ms fall | ||
| The screen shows relatively slow response rates in our tests and may be too slow for gamers. In comparison, all tested devices range from 0.1 (minimum) to 240 (maximum) ms. » 71 % of all devices are better. This means that the measured response time is worse than the average of all tested devices (19.8 ms). | ||
| ↔ Response Time 50% Grey to 80% Grey | ||
| 47 ms ... rise ↗ and fall ↘ combined | ↗ 21 ms rise | 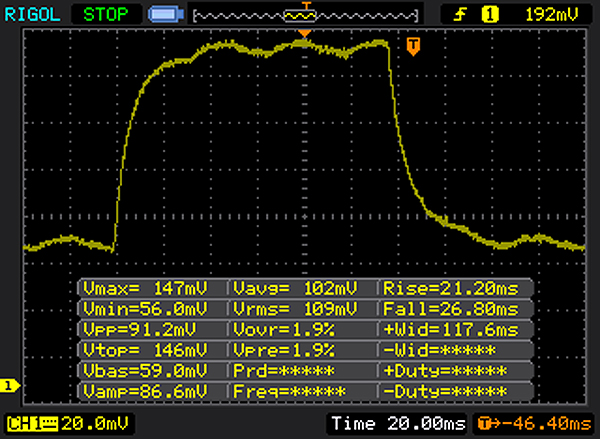 |
| ↘ 26 ms fall | ||
| The screen shows slow response rates in our tests and will be unsatisfactory for gamers. In comparison, all tested devices range from 0.165 (minimum) to 636 (maximum) ms. » 81 % of all devices are better. This means that the measured response time is worse than the average of all tested devices (31 ms). | ||
Screen Flickering / PWM (Pulse-Width Modulation)
| Screen flickering / PWM not detected | ||
In comparison: 52 % of all tested devices do not use PWM to dim the display. If PWM was detected, an average of 7754 (minimum: 5 - maximum: 343500) Hz was measured. | ||
| PCMark 8 | |
| Home Score Accelerated v2 | |
| HP Pavilion 15 Power 1GK62AV | |
| Acer Swift 3 SF315-51G-55Z9 | |
| Lenovo ThinkPad E570-20H6S00000 | |
| Asus Vivobook S15 S510UQ-BQ189T | |
| Work Score Accelerated v2 | |
| HP Pavilion 15 Power 1GK62AV | |
| Lenovo ThinkPad E570-20H6S00000 | |
| Acer Swift 3 SF315-51G-55Z9 | |
| Asus Vivobook S15 S510UQ-BQ189T | |
| PCMark 8 Home Score Accelerated v2 | 3468 points | |
| PCMark 8 Work Score Accelerated v2 | 4483 points | |
Help | ||
| Asus Vivobook S15 S510UQ-BQ189T Toshiba SG5 THNSNK128GVN8 | Acer Swift 3 SF315-51G-55Z9 Kingston RBUSNS8180DS3128GH | Lenovo ThinkPad E570-20H6S00000 Toshiba THNSF5256GPUK | HP Pavilion 15 Power 1GK62AV SK Hynix HFS256G39TND-N210A | |
|---|---|---|---|---|
| CrystalDiskMark 3.0 | 46% | 139% | 4% | |
| Read Seq (MB/s) | 437.6 | 462.2 6% | 1140 161% | 491.6 12% |
| Write Seq (MB/s) | 138.6 | 409.9 196% | 468.1 238% | 141.7 2% |
| Read 512 (MB/s) | 368.6 | 310.3 -16% | 759 106% | 345.6 -6% |
| Write 512 (MB/s) | 138.2 | 216.6 57% | 414 200% | 142.6 3% |
| Read 4k (MB/s) | 16.05 | 31.89 99% | 34.3 114% | 18.83 17% |
| Write 4k (MB/s) | 86.2 | 73.2 -15% | 123.4 43% | 76.3 -11% |
| Read 4k QD32 (MB/s) | 279.1 | 287.9 3% | 530 90% | 348.5 25% |
| Write 4k QD32 (MB/s) | 121.8 | 170.6 40% | 319.2 162% | 104.8 -14% |

| 3DMark 11 - 1280x720 Performance GPU | |
| HP Pavilion 15 Power 1GK62AV | |
| Acer Swift 3 SF315-51G-55Z9 | |
| Lenovo ThinkPad E570-20H6S00000 | |
| Asus Vivobook S15 S510UQ-BQ189T | |
| 3DMark | |
| 1280x720 Cloud Gate Standard Graphics | |
| HP Pavilion 15 Power 1GK62AV | |
| Lenovo ThinkPad E570-20H6S00000 | |
| Acer Swift 3 SF315-51G-55Z9 | |
| Asus Vivobook S15 S510UQ-BQ189T | |
| 1920x1080 Fire Strike Graphics | |
| HP Pavilion 15 Power 1GK62AV | |
| Acer Swift 3 SF315-51G-55Z9 | |
| Lenovo ThinkPad E570-20H6S00000 | |
| Asus Vivobook S15 S510UQ-BQ189T | |
| 3DMark 11 Performance | 2843 points | |
| 3DMark Cloud Gate Standard Score | 7748 points | |
| 3DMark Fire Strike Score | 1944 points | |
Help | ||
| low | med. | high | ultra | |
|---|---|---|---|---|
| The Witcher 3 (2015) | 41.4 | 25.4 | ||
| Rise of the Tomb Raider (2016) | 46.9 | 26.1 | ||
| Farming Simulator 17 (2016) | 43.8 | 29.8 |
Noise level
| Idle |
| 31.2 / 31.2 / 31.2 dB(A) |
| HDD |
| 31.6 dB(A) |
| Load |
| 43.3 / 43.3 dB(A) |
 | ||
30 dB silent 40 dB(A) audible 50 dB(A) loud |
||
min: | ||
(+) The maximum temperature on the upper side is 38.2 °C / 101 F, compared to the average of 36.8 °C / 98 F, ranging from 21 to 71 °C for the class Multimedia.
(-) The bottom heats up to a maximum of 49 °C / 120 F, compared to the average of 39.1 °C / 102 F
(+) In idle usage, the average temperature for the upper side is 21.9 °C / 71 F, compared to the device average of 31.3 °C / 88 F.
(+) The palmrests and touchpad are cooler than skin temperature with a maximum of 26 °C / 78.8 F and are therefore cool to the touch.
(+) The average temperature of the palmrest area of similar devices was 28.7 °C / 83.7 F (+2.7 °C / 4.9 F).
Asus Vivobook S15 S510UQ-BQ189T audio analysis
(±) | speaker loudness is average but good (73.4 dB)
Bass 100 - 315 Hz
(-) | nearly no bass - on average 19% lower than median
(±) | linearity of bass is average (10.7% delta to prev. frequency)
Mids 400 - 2000 Hz
(+) | balanced mids - only 2% away from median
(+) | mids are linear (4.3% delta to prev. frequency)
Highs 2 - 16 kHz
(+) | balanced highs - only 3.6% away from median
(+) | highs are linear (3.3% delta to prev. frequency)
Overall 100 - 16.000 Hz
(±) | linearity of overall sound is average (17.1% difference to median)
Compared to same class
» 47% of all tested devices in this class were better, 7% similar, 46% worse
» The best had a delta of 5%, average was 17%, worst was 45%
Compared to all devices tested
» 31% of all tested devices were better, 8% similar, 61% worse
» The best had a delta of 4%, average was 23%, worst was 134%
Acer Swift 3 SF315-51G-55Z9 audio analysis
(±) | speaker loudness is average but good (77.5 dB)
Bass 100 - 315 Hz
(-) | nearly no bass - on average 27.8% lower than median
(±) | linearity of bass is average (11.1% delta to prev. frequency)
Mids 400 - 2000 Hz
(+) | balanced mids - only 4.4% away from median
(+) | mids are linear (5.1% delta to prev. frequency)
Highs 2 - 16 kHz
(±) | higher highs - on average 6% higher than median
(±) | linearity of highs is average (7.2% delta to prev. frequency)
Overall 100 - 16.000 Hz
(±) | linearity of overall sound is average (20.8% difference to median)
Compared to same class
» 71% of all tested devices in this class were better, 7% similar, 22% worse
» The best had a delta of 5%, average was 17%, worst was 45%
Compared to all devices tested
» 56% of all tested devices were better, 8% similar, 36% worse
» The best had a delta of 4%, average was 23%, worst was 134%
Lenovo ThinkPad E570-20H6S00000 audio analysis
(±) | speaker loudness is average but good (80.7 dB)
Bass 100 - 315 Hz
(-) | nearly no bass - on average 16.8% lower than median
(-) | bass is not linear (16.4% delta to prev. frequency)
Mids 400 - 2000 Hz
(±) | higher mids - on average 5.1% higher than median
(±) | linearity of mids is average (9.5% delta to prev. frequency)
Highs 2 - 16 kHz
(+) | balanced highs - only 2.7% away from median
(+) | highs are linear (6.5% delta to prev. frequency)
Overall 100 - 16.000 Hz
(±) | linearity of overall sound is average (19.6% difference to median)
Compared to same class
» 64% of all tested devices in this class were better, 7% similar, 29% worse
» The best had a delta of 5%, average was 17%, worst was 45%
Compared to all devices tested
» 49% of all tested devices were better, 7% similar, 44% worse
» The best had a delta of 4%, average was 23%, worst was 134%
HP Pavilion 15 Power 1GK62AV audio analysis
(-) | not very loud speakers (68.5 dB)
Bass 100 - 315 Hz
(-) | nearly no bass - on average 17.7% lower than median
(±) | linearity of bass is average (13.4% delta to prev. frequency)
Mids 400 - 2000 Hz
(+) | balanced mids - only 4.2% away from median
(±) | linearity of mids is average (8.8% delta to prev. frequency)
Highs 2 - 16 kHz
(+) | balanced highs - only 3.5% away from median
(±) | linearity of highs is average (11.6% delta to prev. frequency)
Overall 100 - 16.000 Hz
(±) | linearity of overall sound is average (26.8% difference to median)
Compared to same class
» 92% of all tested devices in this class were better, 2% similar, 6% worse
» The best had a delta of 5%, average was 17%, worst was 45%
Compared to all devices tested
» 82% of all tested devices were better, 4% similar, 14% worse
» The best had a delta of 4%, average was 23%, worst was 134%
| Off / Standby | |
| Idle | |
| Load |
|
Key:
min: | |
| Asus Vivobook S15 S510UQ-BQ189T i5-7200U, GeForce 940MX, Toshiba SG5 THNSNK128GVN8, IPS, 1920x1080, 15.6" | Lenovo IdeaPad 320-15IKB 80XL01NEGE i5-7200U, GeForce 940MX, SK Hynix HFS256G3BTND, TN LED, 1920x1080, 15.6" | Acer Swift 3 SF315-51G-55Z9 i5-7200U, GeForce MX150, Kingston RBUSNS8180DS3128GH, IPS, 1920x1080, 15.6" | Lenovo ThinkPad E570-20H6S00000 i5-7200U, GeForce GTX 950M, Toshiba THNSF5256GPUK, IPS LED, 1920x1080, 15.6" | HP Pavilion 15 Power 1GK62AV i7-7700HQ, GeForce GTX 1050 Mobile, SK Hynix HFS256G39TND-N210A, IPS, 1920x1080, 15.6" | |
|---|---|---|---|---|---|
| Power Consumption | 21% | 1% | 6% | -84% | |
| Idle Minimum * (Watt) | 3.6 | 2.9 19% | 3.7 -3% | 2.8 22% | 9.4 -161% |
| Idle Average * (Watt) | 6.8 | 5.9 13% | 6.2 9% | 6.3 7% | 9.7 -43% |
| Idle Maximum * (Watt) | 9.5 | 7.3 23% | 8.4 12% | 6.9 27% | 16.8 -77% |
| Load Average * (Watt) | 51.6 | 39.5 23% | 50 3% | 51.6 -0% | 76.5 -48% |
| Load Maximum * (Watt) | 56 | 42 25% | 65.2 -16% | 69.7 -24% | 105.6 -89% |
| Witcher 3 ultra * (Watt) | 86.5 |
* ... smaller is better
| Asus Vivobook S15 S510UQ-BQ189T i5-7200U, GeForce 940MX, 42 Wh | Acer Swift 3 SF315-51G-55Z9 i5-7200U, GeForce MX150, 49 Wh | Lenovo ThinkPad E570-20H6S00000 i5-7200U, GeForce GTX 950M, 41 Wh | HP Pavilion 15 Power 1GK62AV i7-7700HQ, GeForce GTX 1050 Mobile, 70 Wh | |
|---|---|---|---|---|
| Battery runtime | 104% | 90% | 88% | |
| Reader / Idle (h) | 7.1 | 15.3 115% | 14.7 107% | 16.2 128% |
| WiFi v1.3 (h) | 4.3 | 8.5 98% | 7.7 79% | 8 86% |
| Load (h) | 1.2 | 2.4 100% | 2.2 83% | 1.8 50% |
Pros
Cons
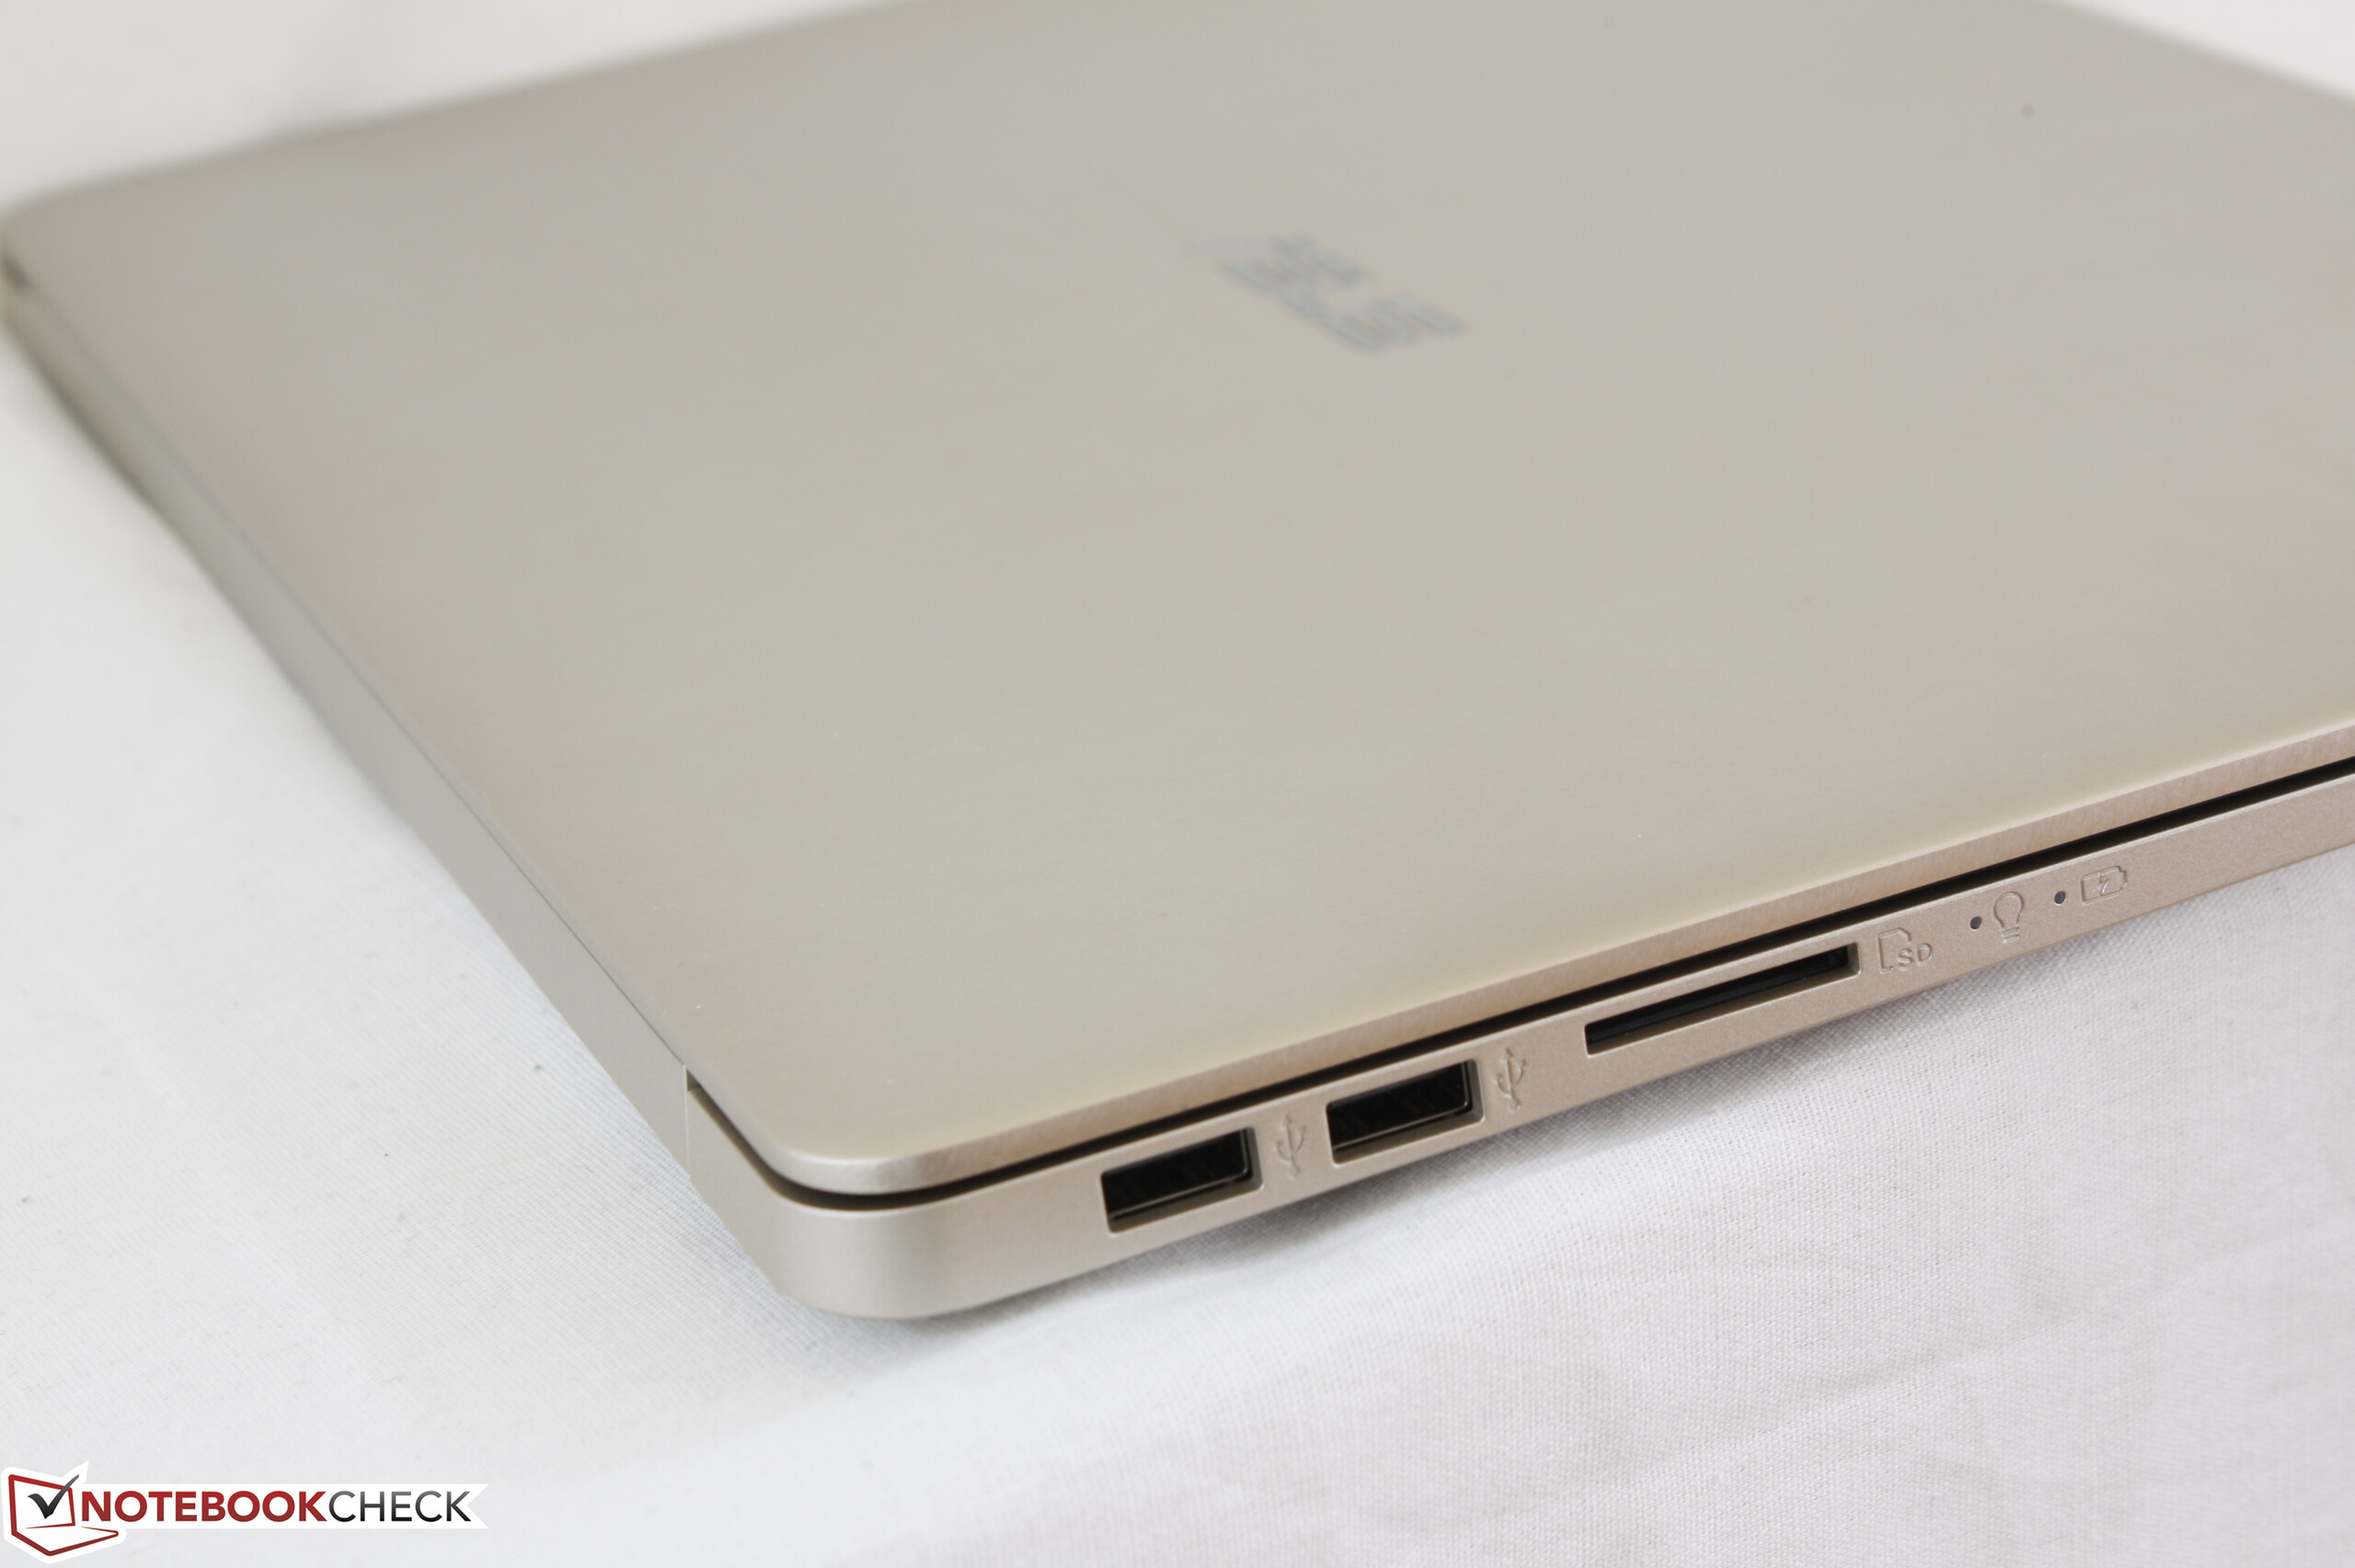
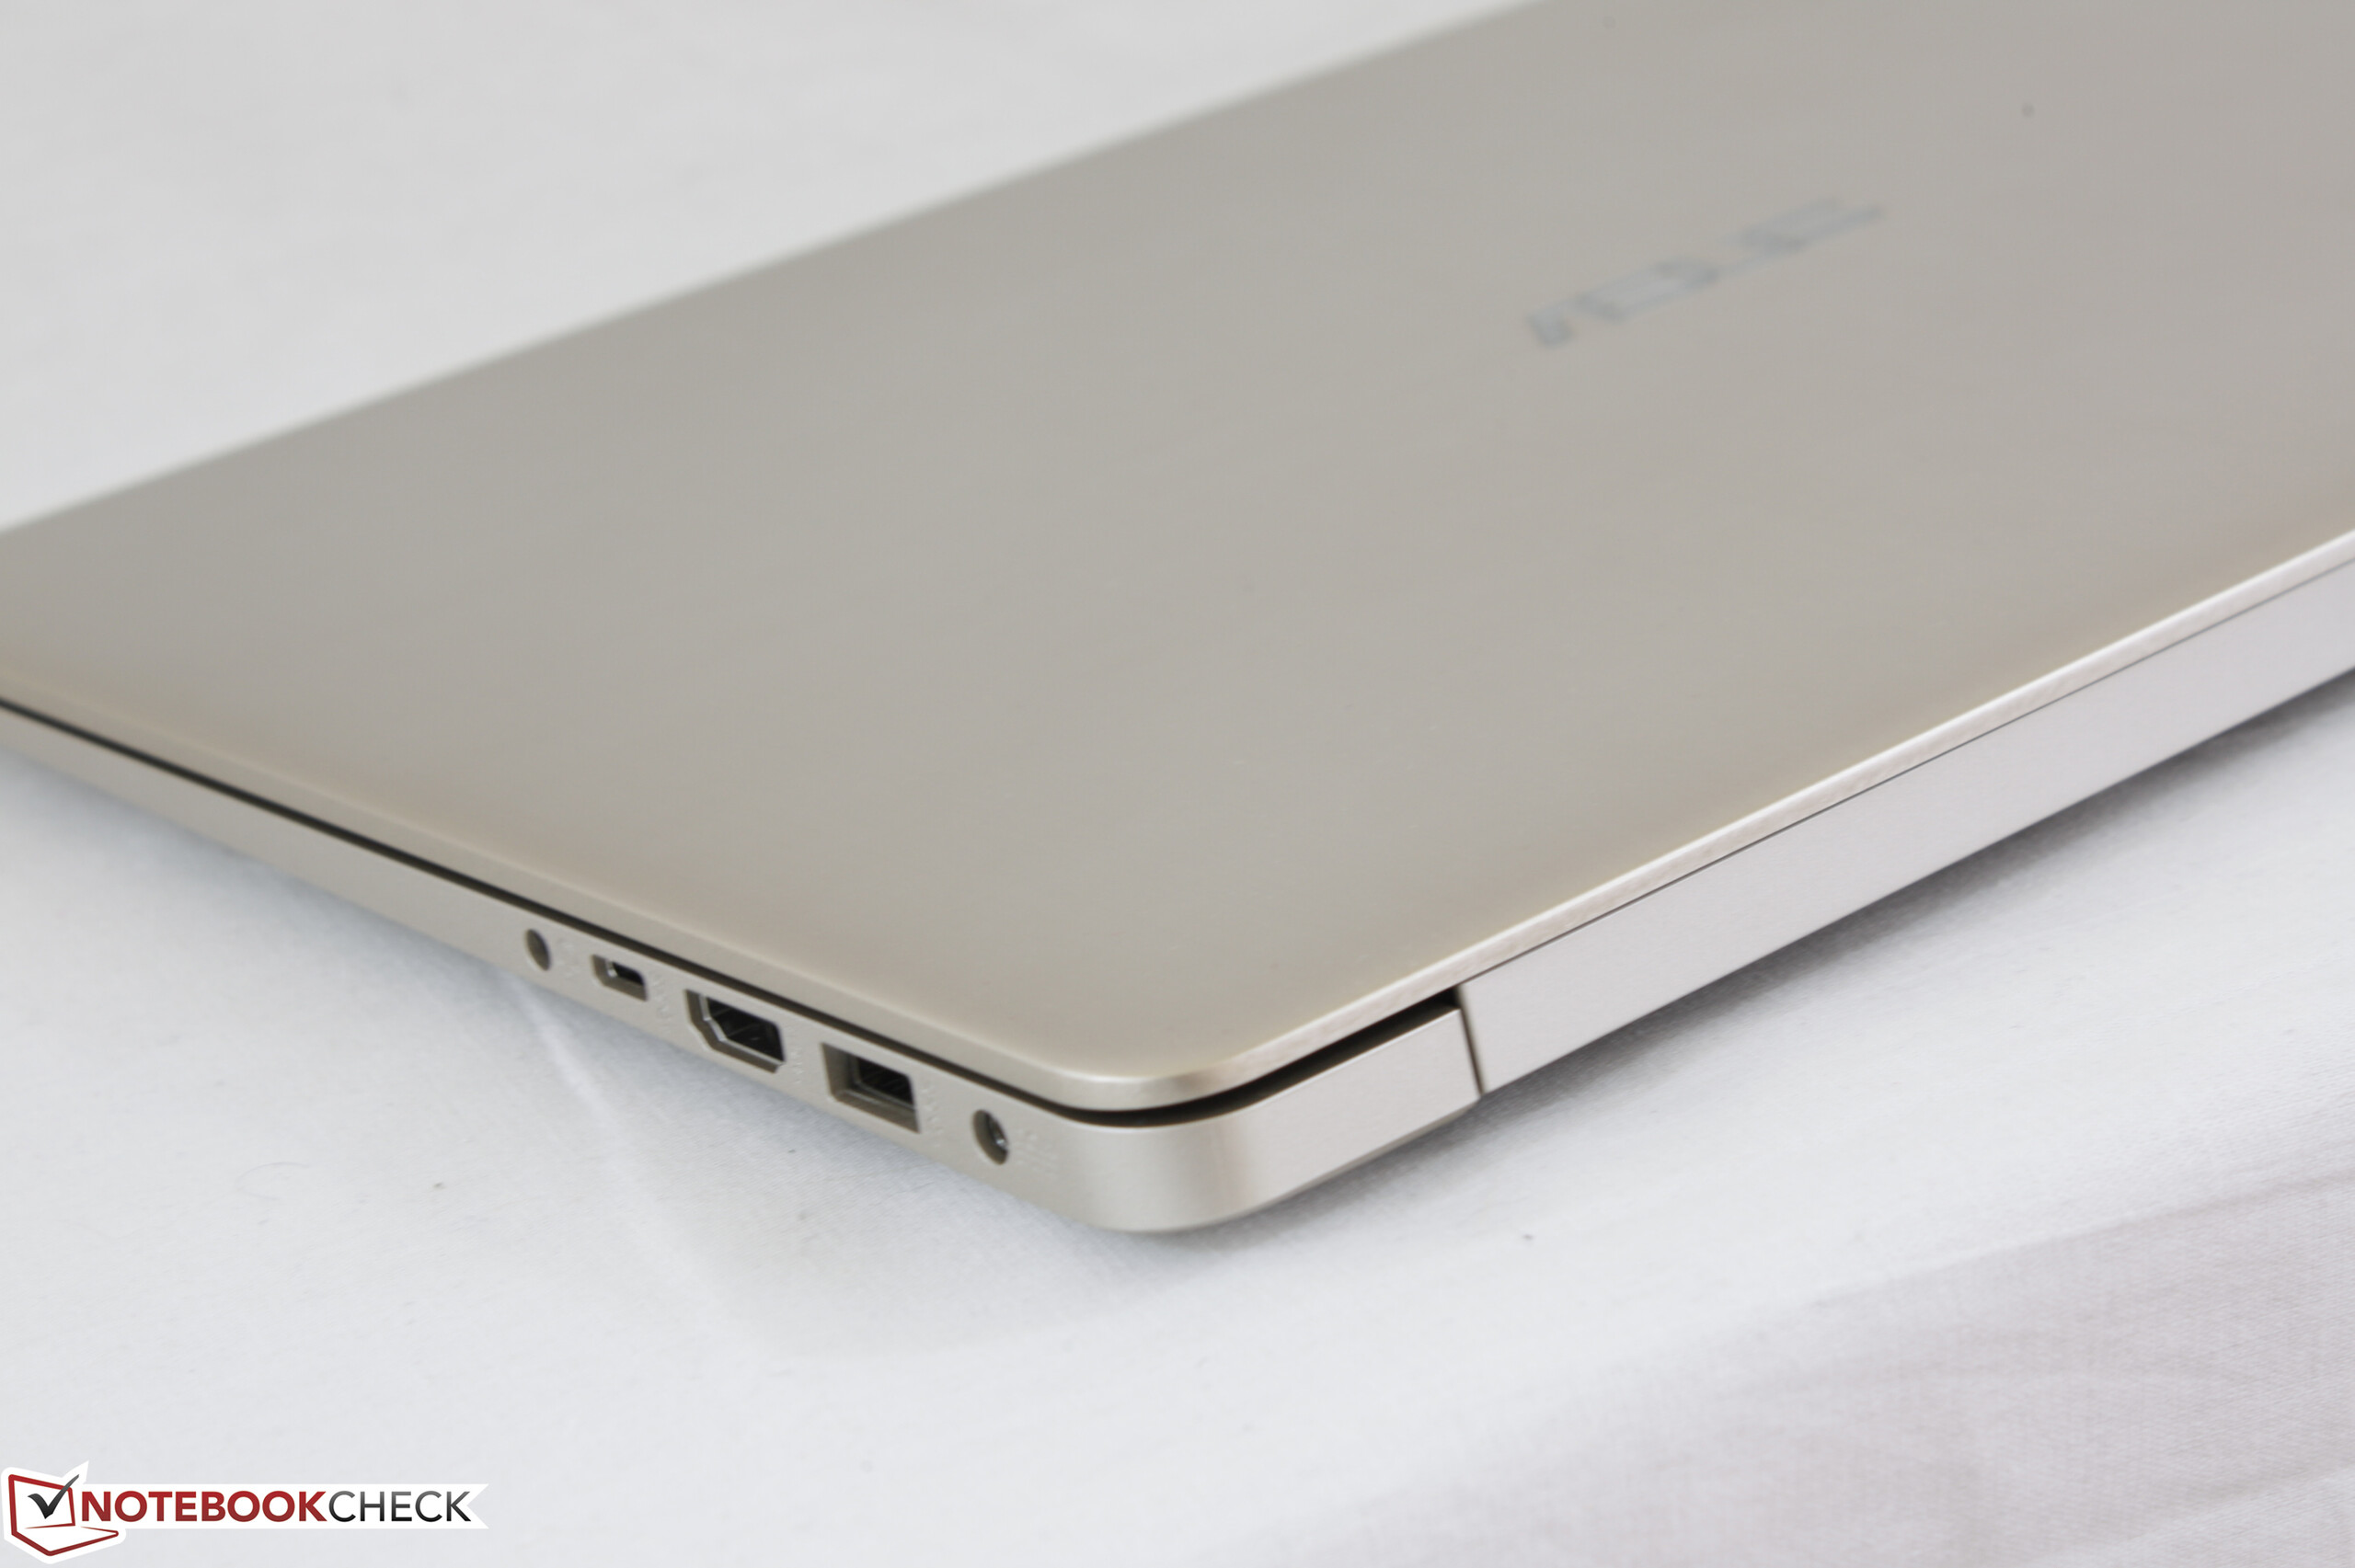
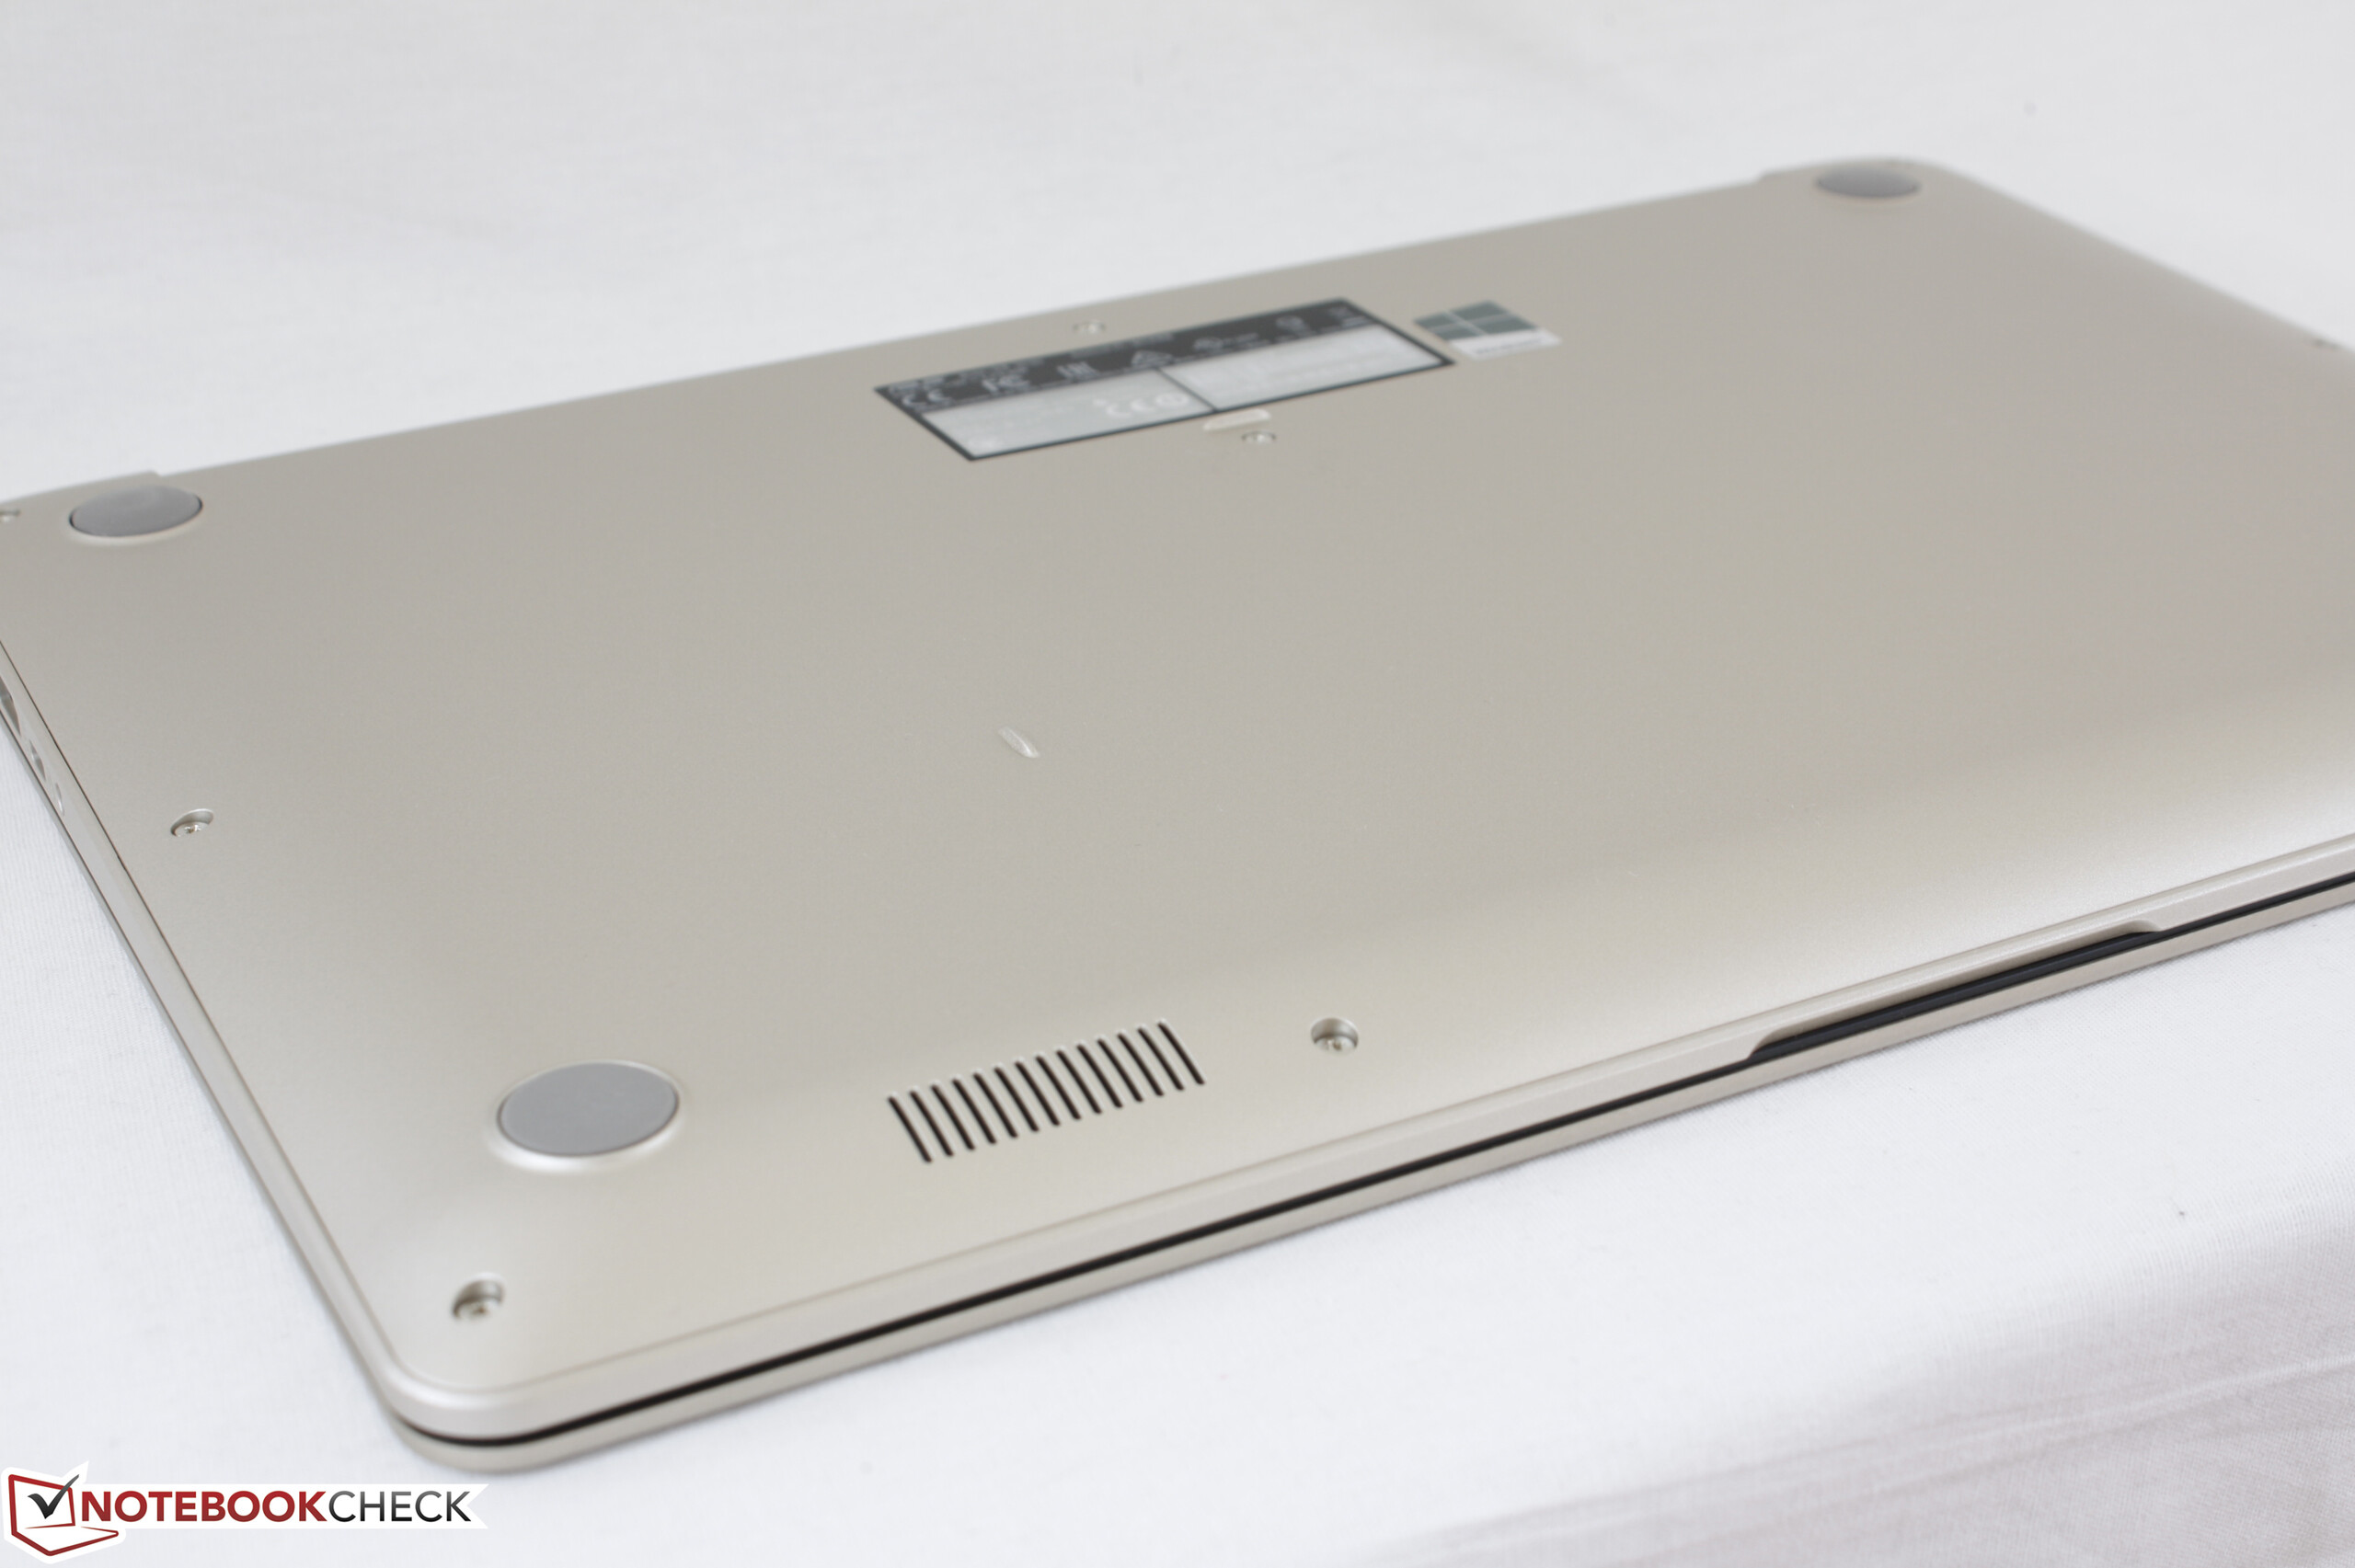
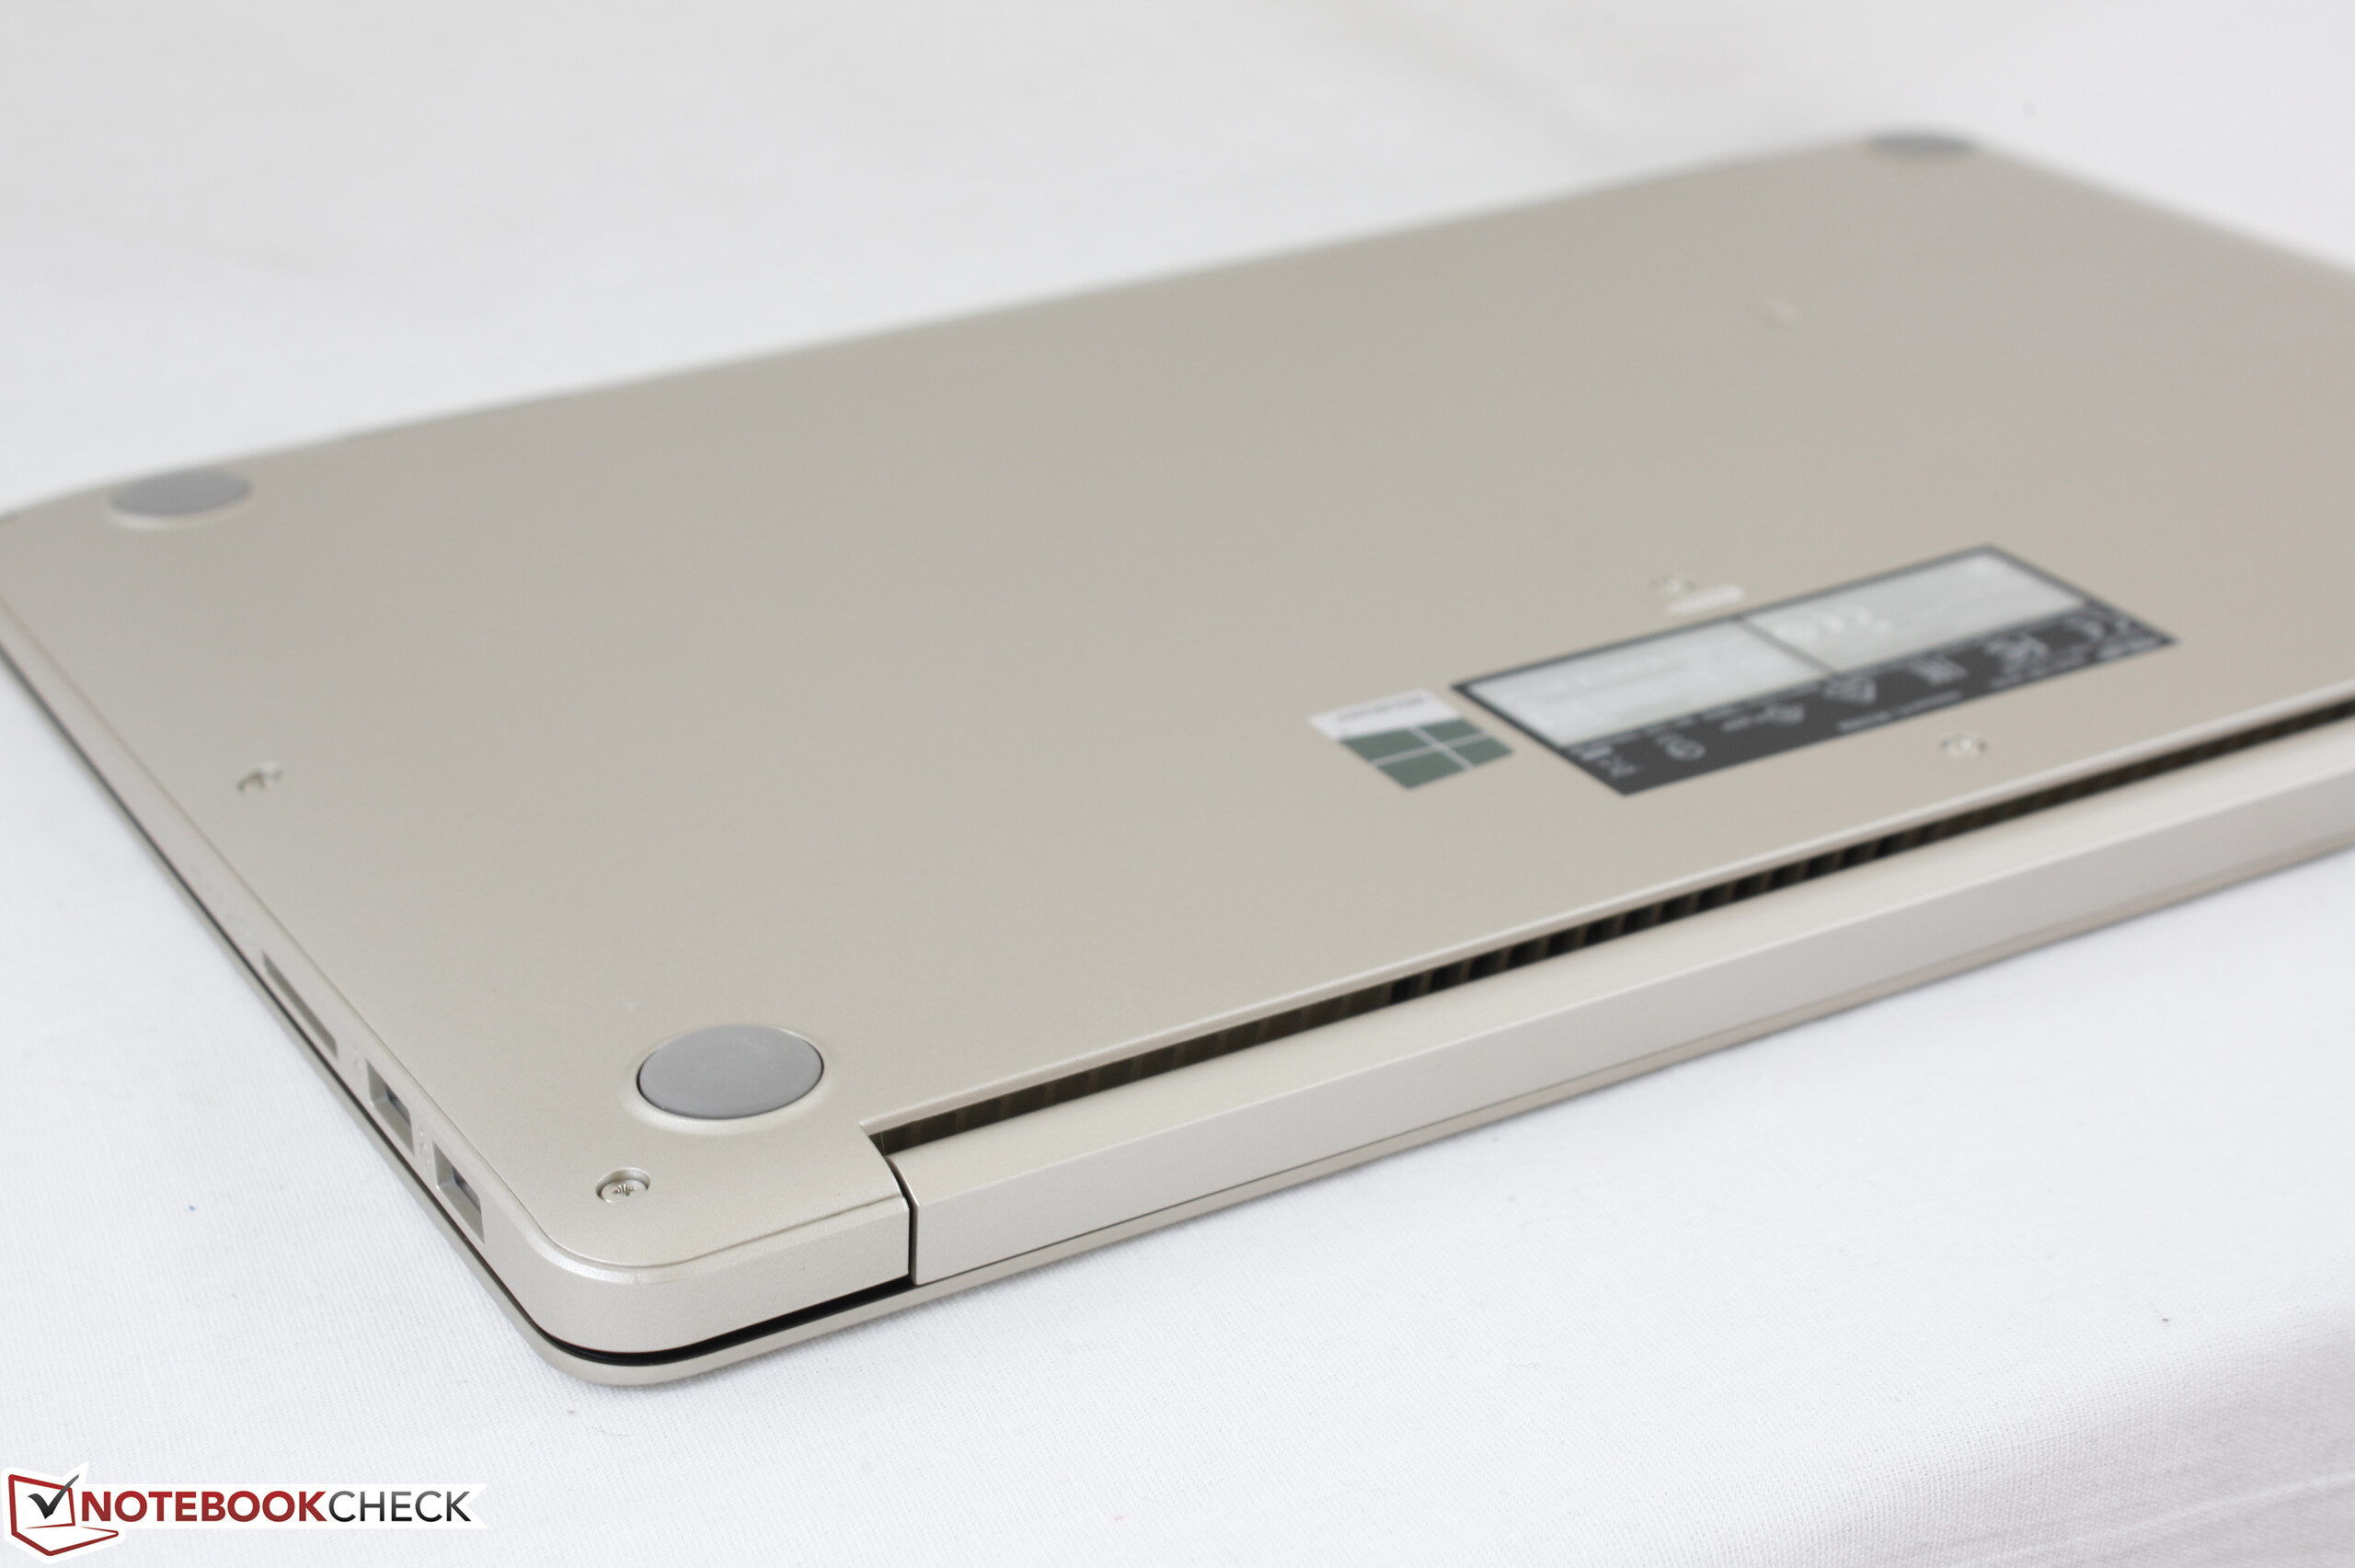
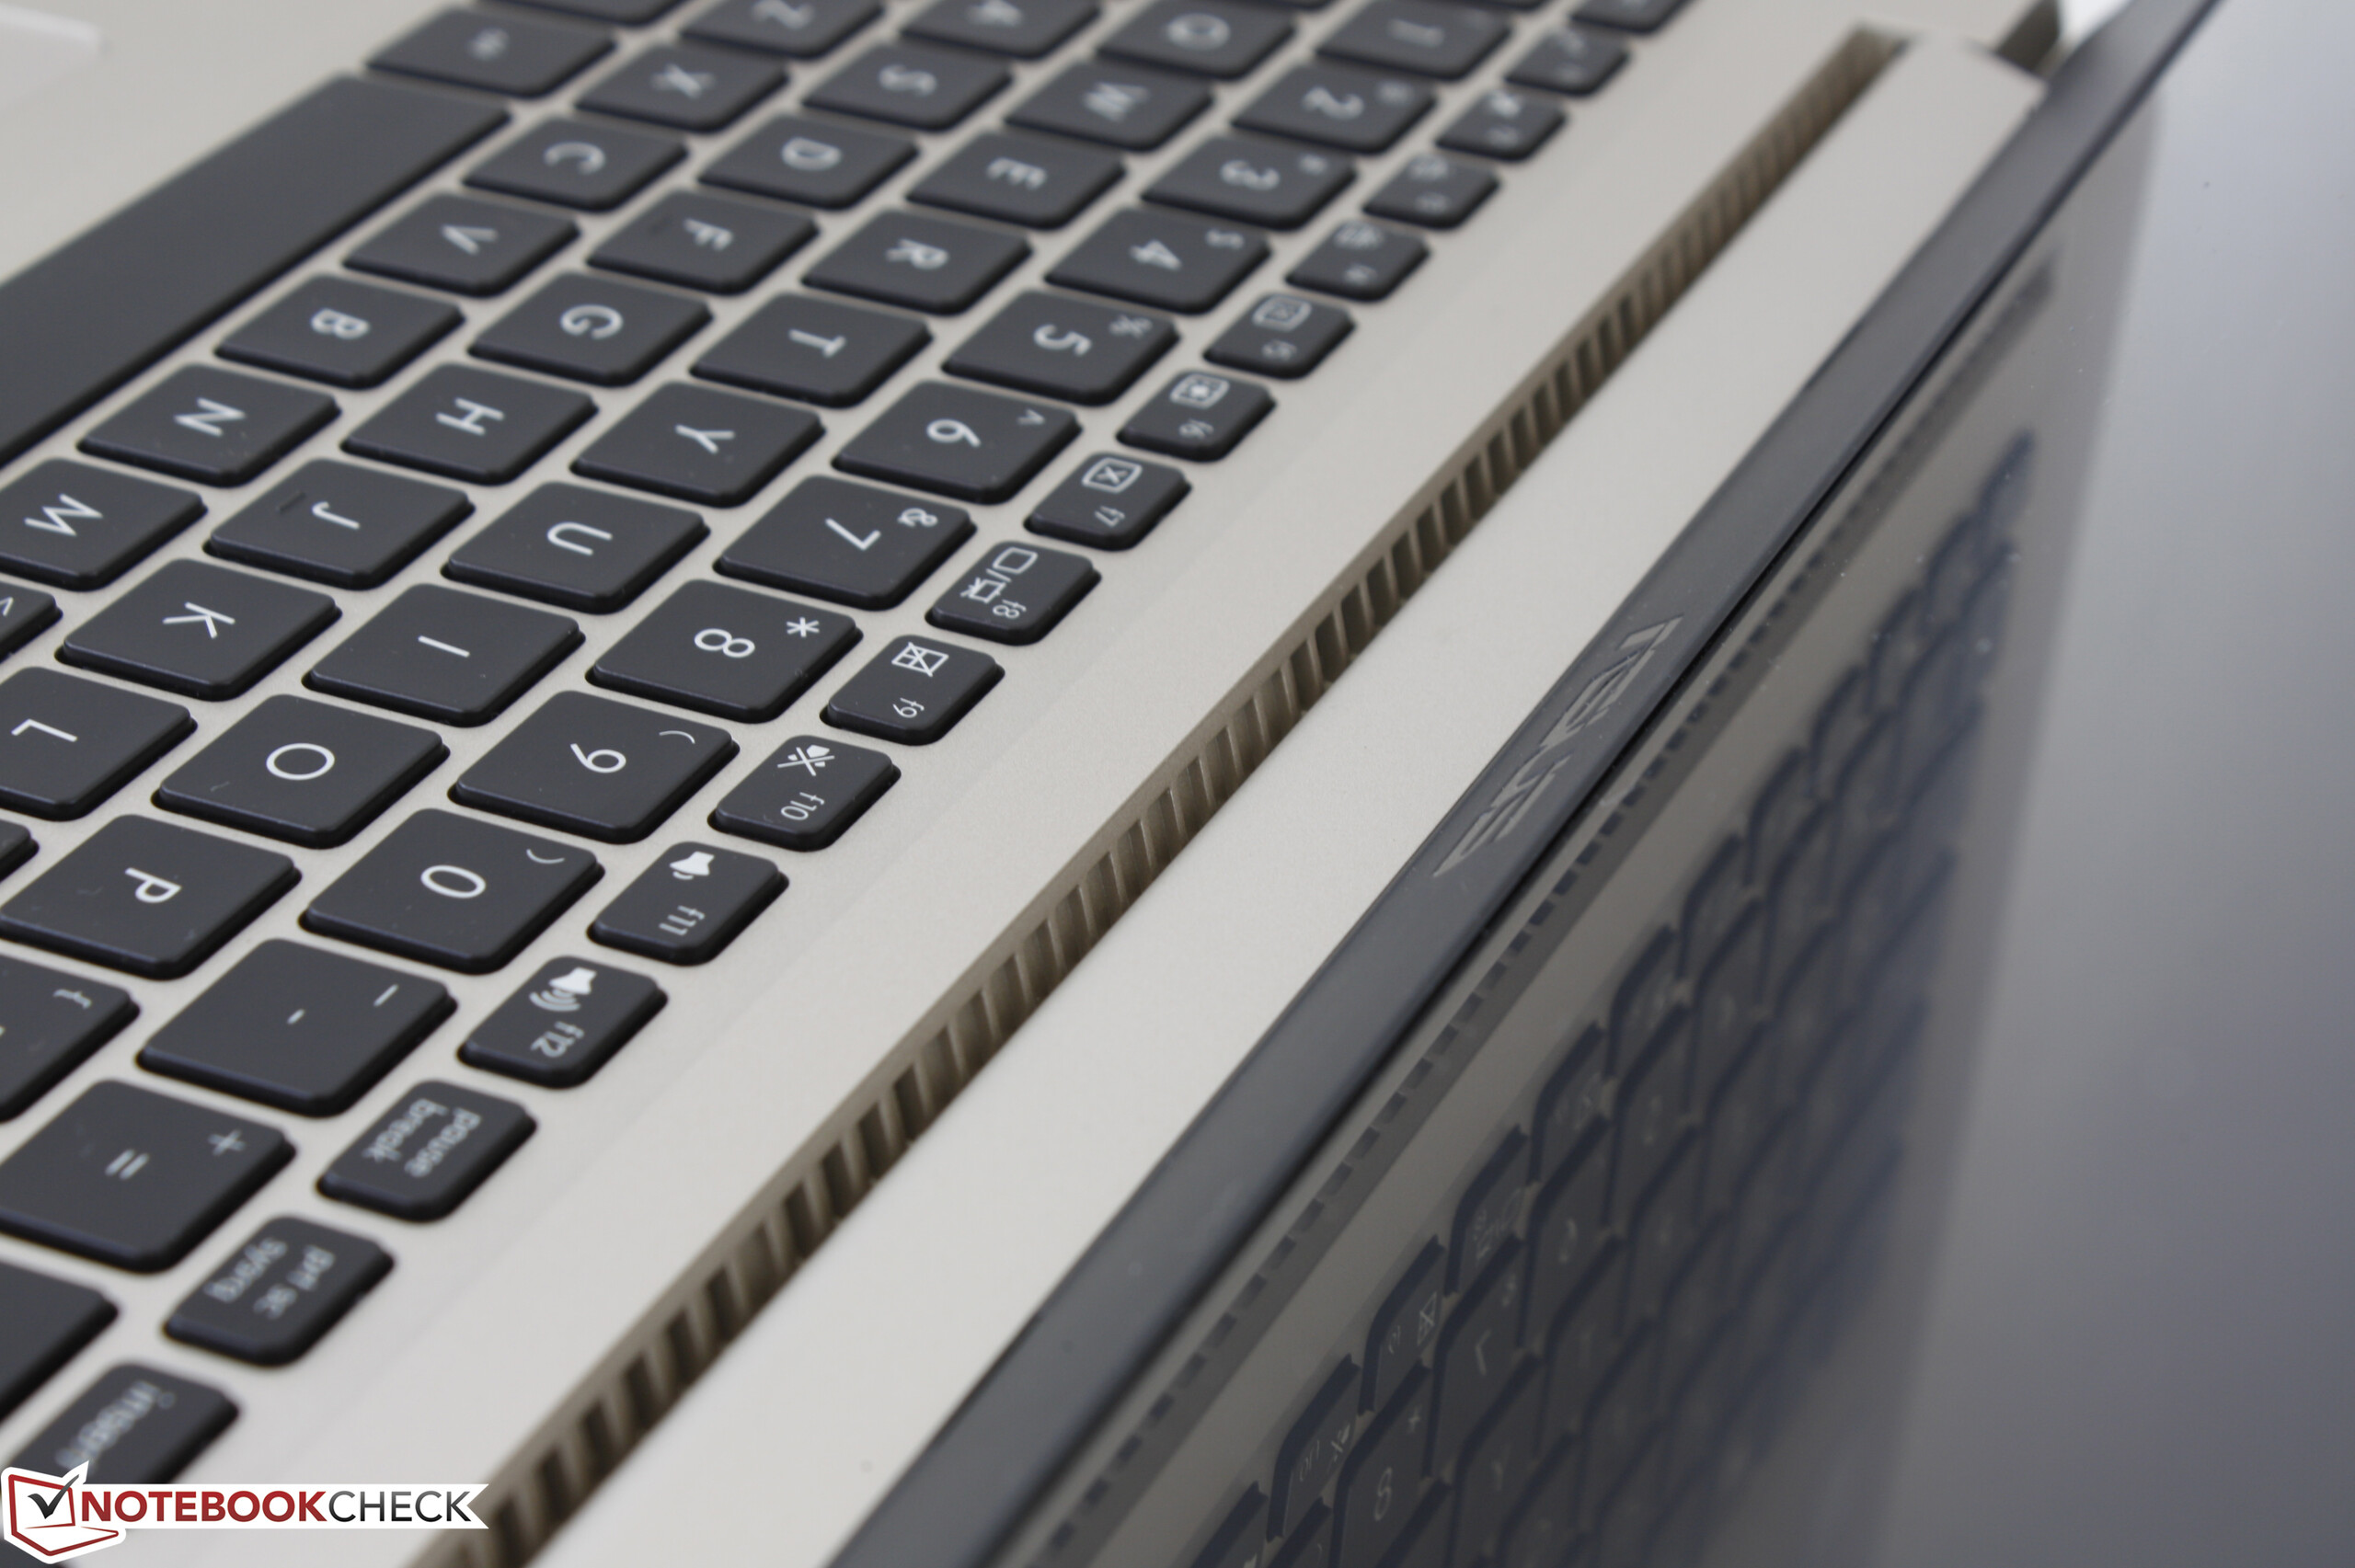
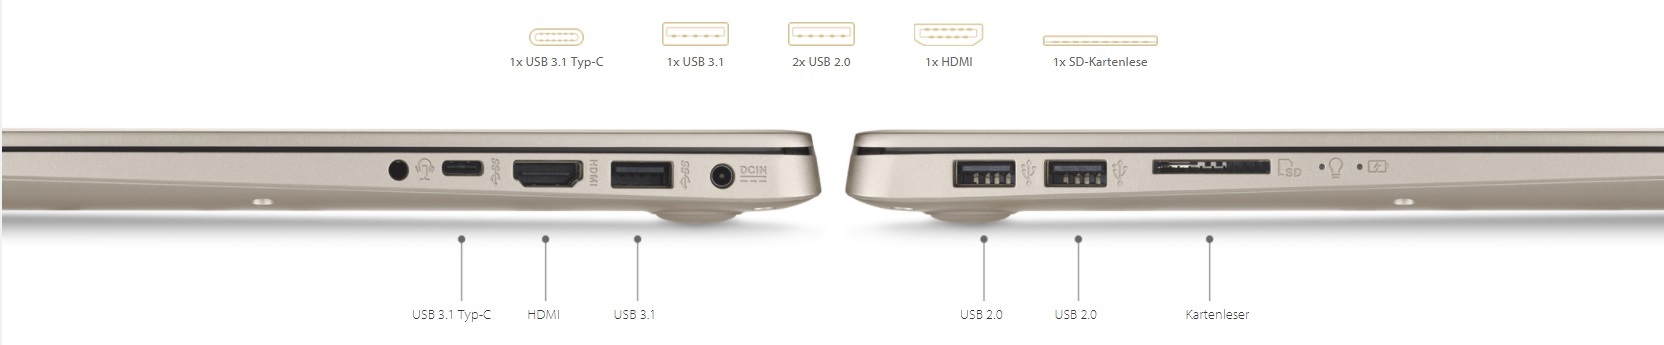
对不起,华硕,你这台外观时尚的VivoBook S15 S510UQ在某种程度上是失败的。 该机在市场上售价近1000欧元(约合1180美元),而且它的外壳稳定性不佳,而且键盘也只是可堪一用。如果电池续航时间只有4小时,那么拥有拥有安全芯片和指纹传感器,体积小巧,重量轻,这些优点有什么用? 在色彩覆盖率低的情况下,图像处理能力如何从良好的对比度和精准的色彩中受益?为什么华硕使用的显卡并没有太多的改进?为什么不配备更快的GeForce MX150? 台湾厂商在哪里找到的速度过时的固态硬盘? 2个 USB 2.0、如蜗牛般的读卡器,以及非常糟糕的摄像头怎么配得上价格?
在我们看来,华硕已经成为改系列笔记本策略下的牺牲品。这一系列的笔记本的价格,让人难以忍受。我们希望1000欧元的定价可以给我们带来更多的东西。如果有人在寻找紧凑型15英寸多媒体电脑,那么这里有一个更好的选择—— 宏碁 Swift 3 SF315 。这是一台我们刚刚评测过的笔电。
注:本文是基于完整评测的缩减版本,阅读完整的英文评测,请点击这里。
Asus Vivobook S15 S510UQ-BQ189T
- 10/17/2017 v6 (old)
Sven Kloevekorn