惠普 Spectre x360 15-bl002xx 变形本简短评测


| SD Card Reader | |
| average JPG Copy Test (av. of 3 runs) | |
| HP Spectre x360 15-bl002xx | |
| Lenovo Yoga 710-14IKB 80V4002HGE | |
| Dell XPS 15 2017 9560 (7300HQ, Full-HD) | |
| Dell Inspiron 15 5568 | |
| maximum AS SSD Seq Read Test (1GB) | |
| HP Spectre x360 15-bl002xx | |
| Dell XPS 15 2017 9560 (7300HQ, Full-HD) | |
| Lenovo Yoga 710-14IKB 80V4002HGE | |
| Dell Inspiron 15 5568 | |
| Networking | |
| iperf3 transmit AX12 | |
| HP Spectre x360 15-bl002xx | |
| iperf3 receive AX12 | |
| HP Spectre x360 15-bl002xx | |
| |||||||||||||||||||||||||
Brightness Distribution: 83 %
Center on Battery: 351.5 cd/m²
Contrast: 1465:1 (Black: 0.24 cd/m²)
ΔE ColorChecker Calman: 3.3 | ∀{0.5-29.43 Ø4.72}
ΔE Greyscale Calman: 1.9 | ∀{0.09-98 Ø4.97}
88.2% sRGB (Argyll 1.6.3 3D)
64.4% AdobeRGB 1998 (Argyll 1.6.3 3D)
64.4% AdobeRGB 1998 (Argyll 3D)
88.2% sRGB (Argyll 3D)
67.9% Display P3 (Argyll 3D)
Gamma: 2.09
CCT: 6784 K
| HP Spectre x360 15-bl002xx UHD UWVA eDP BrightView WLED-backlit , IPS, 15.6", 3840x2160 | HP Spectre x360 15-ap012dx IPS, 15.6", 3840x2160 | Dell XPS 15 2017 9560 (7300HQ, Full-HD) Sharp SHP1453 LQ156M1, LED IGZO IPS InfinityEdge, 15.6", 1920x1080 | Lenovo ThinkPad X1 Yoga-20FRS1VS00 Samsung ATNA40JU01-0, OLED, 14", 2560x1440 | Lenovo Yoga 710-14IKB 80V4002HGE AU Optronics B140HAN03.0, a-Si WLED TFT, IPS, 14", 1920x1080 | Dell Inspiron 15 5568 AU Optronics B156HW01 V0, IPS, 15.6", 1920x1080 | |
|---|---|---|---|---|---|---|
| Display | -3% | 8% | -3% | -39% | ||
| Display P3 Coverage (%) | 67.9 | 62.8 -8% | 68.9 1% | 62 -9% | 38.04 -44% | |
| sRGB Coverage (%) | 88.2 | 88.2 0% | 98.9 12% | 89.5 1% | 57.1 -35% | |
| AdobeRGB 1998 Coverage (%) | 64.4 | 63.9 -1% | 70.9 10% | 63.3 -2% | 39.3 -39% | |
| Response Times | 27% | -29% | 98% | -3% | 24% | |
| Response Time Grey 50% / Grey 80% * (ms) | 44 ? | 32.8 ? 25% | 54 ? -23% | 1 ? 98% | 53 ? -20% | 42 ? 5% |
| Response Time Black / White * (ms) | 38.8 ? | 28 ? 28% | 52.4 ? -35% | 1 ? 97% | 33 ? 15% | 22 ? 43% |
| PWM Frequency (Hz) | 1000 ? | 240 ? | 50 ? | |||
| Screen | -29% | -33% | -27% | -60% | -32% | |
| Brightness middle (cd/m²) | 351.5 | 298 -15% | 400 14% | 279 -21% | 340 -3% | 266 -24% |
| Brightness (cd/m²) | 336 | 295 -12% | 392 17% | 277 -18% | 302 -10% | 249 -26% |
| Brightness Distribution (%) | 83 | 88 6% | 89 7% | 91 10% | 77 -7% | 85 2% |
| Black Level * (cd/m²) | 0.24 | 0.57 -138% | 0.26 -8% | 0.31 -29% | 0.26 -8% | |
| Contrast (:1) | 1465 | 523 -64% | 1538 5% | 1097 -25% | 1023 -30% | |
| Colorchecker dE 2000 * | 3.3 | 4.43 -34% | 4.9 -48% | 5.15 -56% | 6.75 -105% | 4.98 -51% |
| Colorchecker dE 2000 max. * | 7.3 | 6.62 9% | 11 -51% | 8.28 -13% | 12.4 -70% | 11.82 -62% |
| Greyscale dE 2000 * | 1.9 | 2.45 -29% | 7.2 -279% | 5.44 -186% | 8.47 -346% | 2.68 -41% |
| Gamma | 2.09 105% | 2.45 90% | 2.11 104% | 2.28 96% | 2.22 99% | 2.27 97% |
| CCT | 6784 96% | 6326 103% | 6911 94% | 5686 114% | 6557 99% | 6583 99% |
| Color Space (Percent of AdobeRGB 1998) (%) | 64.4 | 57.2 -11% | 64.2 0% | 98 52% | 58 -10% | 36 -44% |
| Color Space (Percent of sRGB) (%) | 88.2 | 87.8 0% | 98.9 12% | 100 13% | 89 1% | 57 -35% |
| Total Average (Program / Settings) | -2% /
-16% | -18% /
-24% | 36% /
-2% | -22% /
-41% | -16% /
-26% |
* ... smaller is better
Display Response Times
| ↔ Response Time Black to White | ||
|---|---|---|
| 38.8 ms ... rise ↗ and fall ↘ combined | ↗ 6.4 ms rise | 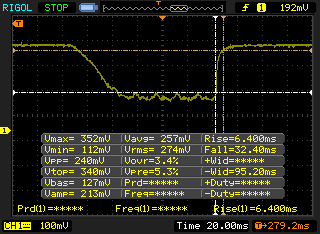 |
| ↘ 32.4 ms fall | ||
| The screen shows slow response rates in our tests and will be unsatisfactory for gamers. In comparison, all tested devices range from 0.1 (minimum) to 240 (maximum) ms. » 96 % of all devices are better. This means that the measured response time is worse than the average of all tested devices (19.8 ms). | ||
| ↔ Response Time 50% Grey to 80% Grey | ||
| 44 ms ... rise ↗ and fall ↘ combined | ↗ 20.4 ms rise | 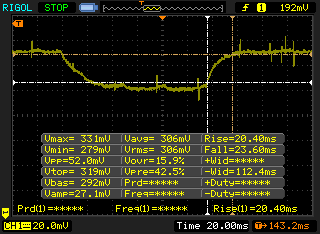 |
| ↘ 23.6 ms fall | ||
| The screen shows slow response rates in our tests and will be unsatisfactory for gamers. In comparison, all tested devices range from 0.165 (minimum) to 636 (maximum) ms. » 73 % of all devices are better. This means that the measured response time is worse than the average of all tested devices (31 ms). | ||
Screen Flickering / PWM (Pulse-Width Modulation)
| Screen flickering / PWM detected | 1000 Hz | ≤ 99 % brightness setting | 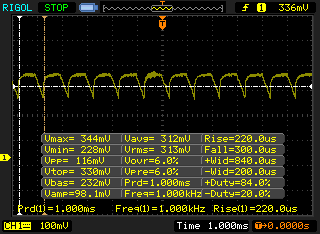 |
The display backlight flickers at 1000 Hz (worst case, e.g., utilizing PWM) Flickering detected at a brightness setting of 99 % and below. There should be no flickering or PWM above this brightness setting. The frequency of 1000 Hz is quite high, so most users sensitive to PWM should not notice any flickering. In comparison: 52 % of all tested devices do not use PWM to dim the display. If PWM was detected, an average of 7753 (minimum: 5 - maximum: 343500) Hz was measured. | |||
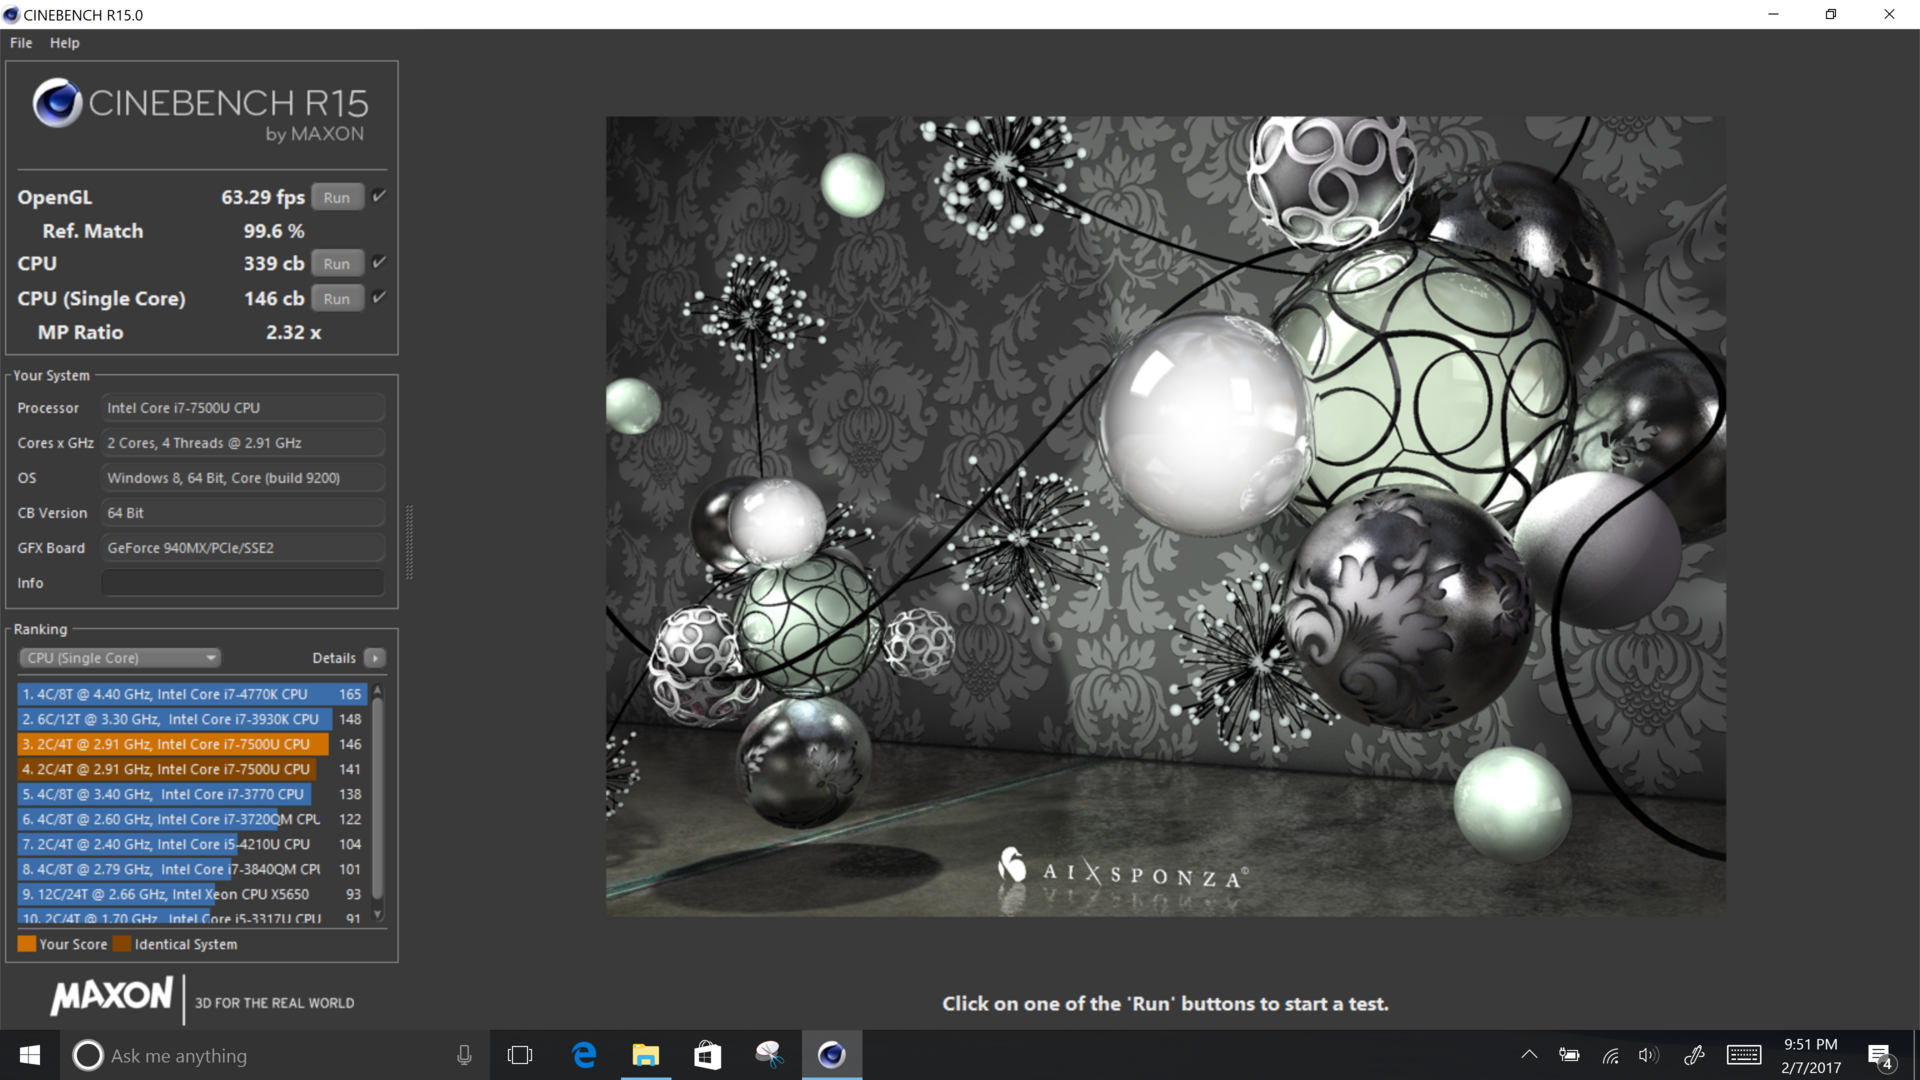
| Cinebench R15 | |
| CPU Single 64Bit | |
| Lenovo Yoga 910-13IKB-80VF004CGE | |
| Dell XPS 15 2017 9560 (7300HQ, Full-HD) | |
| HP Spectre x360 15-bl002xx | |
| Lenovo ThinkPad X1 Yoga-20FRS1VS00 | |
| Dell Inspiron 15 5568 | |
| HP Spectre x360 15-ap012dx | |
| CPU Multi 64Bit | |
| Dell XPS 15 2017 9560 (7300HQ, Full-HD) | |
| Lenovo Yoga 910-13IKB-80VF004CGE | |
| HP Spectre x360 15-bl002xx | |
| HP Spectre x360 15-ap012dx | |
| Dell Inspiron 15 5568 | |
| Lenovo ThinkPad X1 Yoga-20FRS1VS00 | |
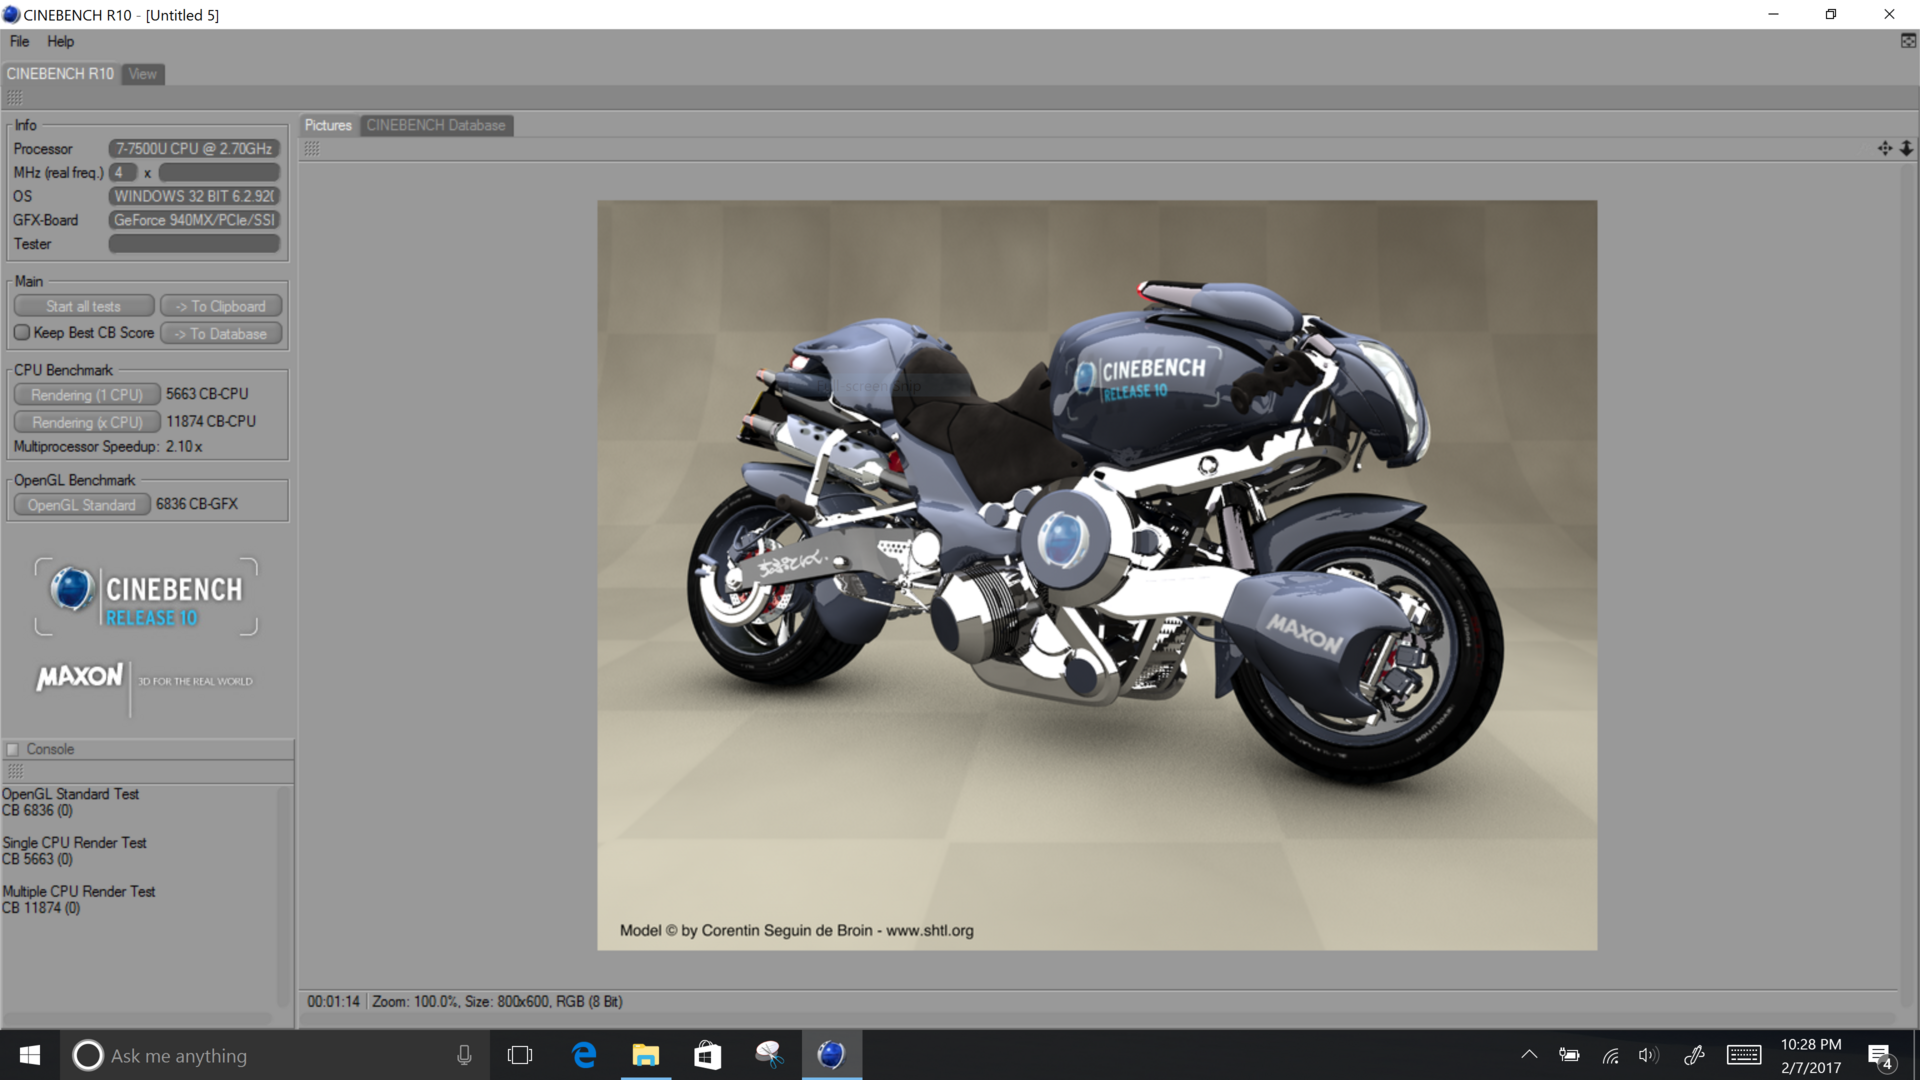
| Cinebench R10 | |
| Rendering Multiple CPUs 32Bit | |
| HP Spectre x360 15-bl002xx | |
| HP Spectre x360 15-ap012dx | |
| Rendering Single 32Bit | |
| HP Spectre x360 15-bl002xx | |
| HP Spectre x360 15-ap012dx | |
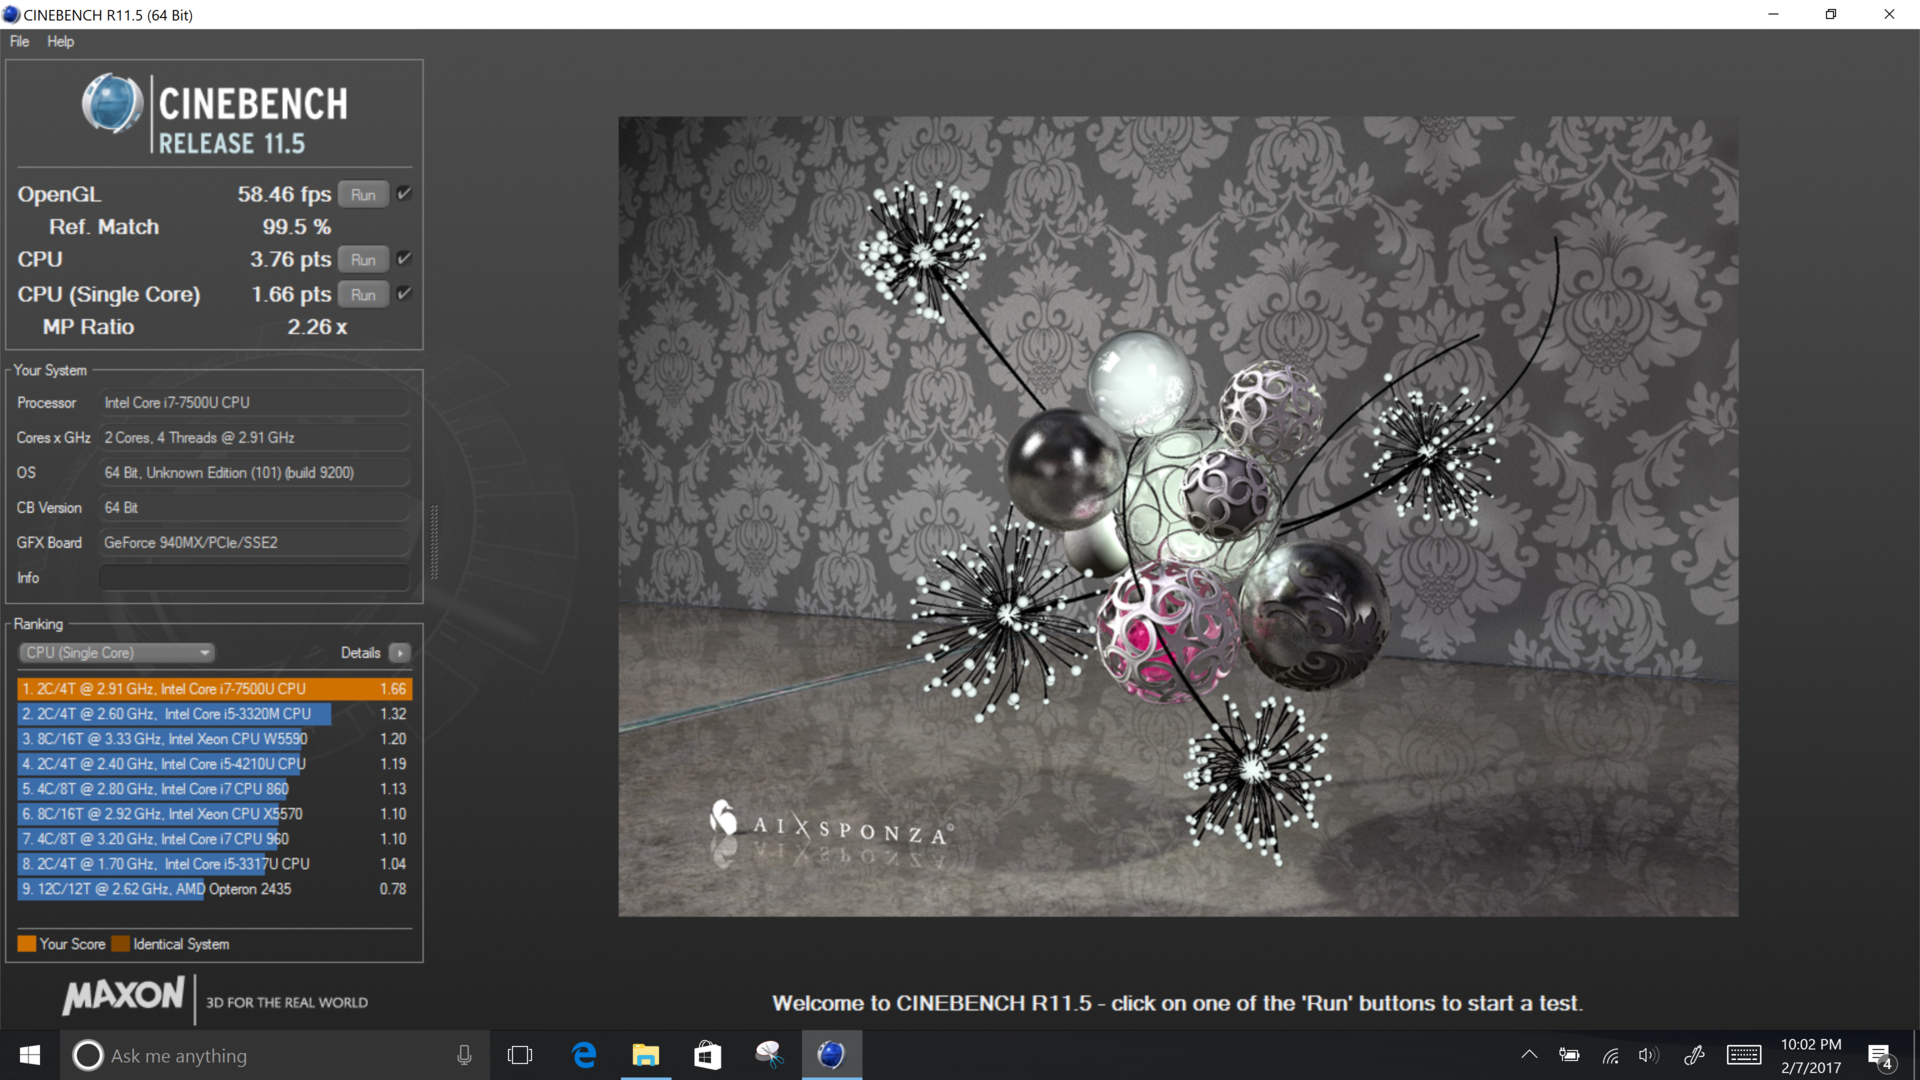
| Cinebench R11.5 | |
| CPU Single 64Bit | |
| HP Spectre x360 15-bl002xx | |
| Lenovo ThinkPad X1 Yoga-20FRS1VS00 | |
| HP Spectre x360 15-ap012dx | |
| CPU Multi 64Bit | |
| HP Spectre x360 15-bl002xx | |
| HP Spectre x360 15-ap012dx | |
| Lenovo ThinkPad X1 Yoga-20FRS1VS00 | |
| wPrime 2.10 - 1024m | |
| HP Spectre x360 15-ap012dx | |
| HP Spectre x360 15-bl002xx | |
* ... smaller is better
| PCMark 8 | |
| Home Score Accelerated v2 | |
| Dell XPS 15 2017 9560 (7300HQ, Full-HD) | |
| Dell Inspiron 15 5568 | |
| Lenovo Yoga 910-13IKB-80VF004CGE | |
| Lenovo ThinkPad X1 Yoga-20FRS1VS00 | |
| HP Spectre x360 15-bl002xx | |
| HP Spectre x360 15-ap012dx | |
| Work Score Accelerated v2 | |
| Dell XPS 15 2017 9560 (7300HQ, Full-HD) | |
| Dell Inspiron 15 5568 | |
| Lenovo ThinkPad X1 Yoga-20FRS1VS00 | |
| HP Spectre x360 15-bl002xx | |
| HP Spectre x360 15-ap012dx | |
| Creative Score Accelerated v2 | |
| HP Spectre x360 15-bl002xx | |
| HP Spectre x360 15-ap012dx | |
| PCMark 8 Home Score Accelerated v2 | 3249 points | |
| PCMark 8 Creative Score Accelerated v2 | 4542 points | |
| PCMark 8 Work Score Accelerated v2 | 4016 points | |
Help | ||
| HP Spectre x360 15-bl002xx Toshiba XG4 NVMe (THNSN5512GPUK) | Lenovo Yoga 910-13IKB-80VF004CGE Samsung PM951 NVMe MZVLV512 | HP Spectre x360 15-ap012dx Sandisk X300 SD7SN6S-256G-1006 | Dell XPS 15 2017 9560 (7300HQ, Full-HD) WDC WD10SPCX-75KHST0 + SanDisk Z400s M.2 2242 32 GB Cache | Lenovo ThinkPad X1 Yoga-20FRS1VS00 Samsung SSD PM961 1TB M.2 PCIe 3.0 x4 NVMe (MZSLW1T0) | Dell Inspiron 15 5568 Toshiba THNSNK256GCS8 | |
|---|---|---|---|---|---|---|
| CrystalDiskMark 3.0 | -1% | -50% | -90% | -4% | -55% | |
| Read Seq (MB/s) | 1266 | 1412 12% | 475.6 -62% | 123 -90% | 1510 19% | 458.6 -64% |
| Write Seq (MB/s) | 982 | 578 -41% | 425 -57% | 74.2 -92% | 1193 21% | 270 -73% |
| Read 512 (MB/s) | 834 | 701 -16% | 258.4 -69% | 101.7 -88% | 397.4 -52% | |
| Write 512 (MB/s) | 714 | 580 -19% | 318.9 -55% | 42.51 -94% | 242 -66% | |
| Read 4k (MB/s) | 40.72 | 43.5 7% | 35.48 -13% | 10.84 -73% | 37 -9% | 19.88 -51% |
| Write 4k (MB/s) | 139.4 | 159.7 15% | 93 -33% | 1.021 -99% | 126 -10% | 86.7 -38% |
| Read 4k QD32 (MB/s) | 527 | 570 8% | 281.2 -47% | 69.8 -87% | 404 -23% | 275.3 -48% |
| Write 4k QD32 (MB/s) | 395.2 | 488.7 24% | 138.7 -65% | 1.057 -100% | 319 -19% | 197.6 -50% |

| 3DMark 11 | |
| 1280x720 Performance GPU | |
| Dell XPS 15 2017 9560 (7300HQ, Full-HD) | |
| HP Spectre x360 15-bl002xx | |
| Lenovo Yoga 910-13IKB-80VF004CGE | |
| Dell Inspiron 15 5568 | |
| Lenovo ThinkPad X1 Yoga-20FRS1VS00 | |
| HP Spectre x360 15-ap012dx | |
| Lenovo Yoga 710-14IKB 80V4002HGE | |
| 1280x720 Performance Combined | |
| Dell XPS 15 2017 9560 (7300HQ, Full-HD) | |
| HP Spectre x360 15-bl002xx | |
| Lenovo Yoga 910-13IKB-80VF004CGE | |
| Dell Inspiron 15 5568 | |
| Lenovo ThinkPad X1 Yoga-20FRS1VS00 | |
| HP Spectre x360 15-ap012dx | |
| Lenovo Yoga 710-14IKB 80V4002HGE | |
| 3DMark | |
| 1280x720 Cloud Gate Standard Graphics | |
| Dell XPS 15 2017 9560 (7300HQ, Full-HD) | |
| HP Spectre x360 15-bl002xx | |
| Lenovo Yoga 910-13IKB-80VF004CGE | |
| Dell Inspiron 15 5568 | |
| Lenovo ThinkPad X1 Yoga-20FRS1VS00 | |
| Lenovo Yoga 710-14IKB 80V4002HGE | |
| HP Spectre x360 15-ap012dx | |
| 1920x1080 Fire Strike Graphics | |
| Dell XPS 15 2017 9560 (7300HQ, Full-HD) | |
| HP Spectre x360 15-bl002xx | |
| Lenovo Yoga 910-13IKB-80VF004CGE | |
| Lenovo ThinkPad X1 Yoga-20FRS1VS00 | |
| HP Spectre x360 15-ap012dx | |
| Lenovo Yoga 710-14IKB 80V4002HGE | |
| 1920x1080 Ice Storm Extreme Graphics | |
| Lenovo Yoga 710-14IKB 80V4002HGE | |
| HP Spectre x360 15-bl002xx | |
| HP Spectre x360 15-ap012dx | |
| 3DMark 11 Performance | 2772 points | |
| 3DMark Ice Storm Standard Score | 22543 points | |
| 3DMark Cloud Gate Standard Score | 7908 points | |
| 3DMark Fire Strike Score | 1926 points | |
| 3DMark Fire Strike Extreme Score | 969 points | |
Help | ||
| low | med. | high | ultra | |
|---|---|---|---|---|
| Anno 2070 (2011) | 190.1 | 83.2 | 50.5 | 27.1 |
| Sleeping Dogs (2012) | 122.4 | 93.6 | 45.5 | 11.9 |
| Hitman: Absolution (2012) | 77.2 | 56.6 | 27.5 | 10.8 |
| Tomb Raider (2013) | 184.4 | 92.7 | 52.1 | 26.5 |
| BioShock Infinite (2013) | 127.5 | 69.8 | 59 | 21.6 |
| Company of Heroes 2 (2013) | 28.4 | 24.2 | 14.6 | 8.7 |
| Middle-earth: Shadow of Mordor (2014) | 55.3 | 32.5 | 19.3 | 15.1 |
| Rise of the Tomb Raider (2016) | 38.5 | 18.4 | 15.3 | 13.8 |
Noise level
| Idle |
| 28.5 / 28.5 / 36.3 dB(A) |
| Load |
| 42.7 / 42.7 dB(A) |
 | ||
30 dB silent 40 dB(A) audible 50 dB(A) loud |
||
min: | ||
| HP Spectre x360 15-bl002xx GeForce 940MX, i7-7500U, Toshiba XG4 NVMe (THNSN5512GPUK) | Lenovo Yoga 910-13IKB-80VF004CGE HD Graphics 620, i7-7500U, Samsung PM951 NVMe MZVLV512 | HP Spectre x360 15-ap012dx HD Graphics 520, 6200U, Sandisk X300 SD7SN6S-256G-1006 | Dell XPS 15 2017 9560 (7300HQ, Full-HD) GeForce GTX 1050 Mobile, i5-7300HQ, WDC WD10SPCX-75KHST0 + SanDisk Z400s M.2 2242 32 GB Cache | Lenovo ThinkPad X1 Yoga-20FRS1VS00 HD Graphics 520, 6600U, Samsung SSD PM961 1TB M.2 PCIe 3.0 x4 NVMe (MZSLW1T0) | Dell Inspiron 15 5568 HD Graphics 520, 6500U, Toshiba THNSNK256GCS8 | Lenovo Yoga 710-14IKB 80V4002HGE HD Graphics 620, i5-7200U, Samsung MZYTY256HDHP | |
|---|---|---|---|---|---|---|---|
| Noise | 2% | 5% | -7% | 7% | -0% | 4% | |
| off / environment * (dB) | 28.5 | 31.7 -11% | 29.5 -4% | 30.3 -6% | 28.9 -1% | 31.2 -9% | 30.16 -6% |
| Idle Minimum * (dB) | 28.5 | 31.7 -11% | 29.5 -4% | 31.6 -11% | 28.9 -1% | 32.8 -15% | 30.16 -6% |
| Idle Average * (dB) | 28.5 | 31.7 -11% | 29.5 -4% | 31.6 -11% | 28.9 -1% | 32.8 -15% | 30.16 -6% |
| Idle Maximum * (dB) | 36.3 | 31.7 13% | 29.6 18% | 33.4 8% | 28.9 20% | 33.8 7% | 30.5 16% |
| Load Average * (dB) | 42.7 | 38.4 10% | 38.1 11% | 47.8 -12% | 35.3 17% | 36.3 15% | 37.2 13% |
| Load Maximum * (dB) | 42.7 | 34.7 19% | 38.2 11% | 47.8 -12% | 38.9 9% | 36.3 15% | 37 13% |
* ... smaller is better
(-) The maximum temperature on the upper side is 47 °C / 117 F, compared to the average of 36.8 °C / 98 F, ranging from 21 to 71 °C for the class Multimedia.
(-) The bottom heats up to a maximum of 50.2 °C / 122 F, compared to the average of 39.1 °C / 102 F
(+) In idle usage, the average temperature for the upper side is 28.6 °C / 83 F, compared to the device average of 31.3 °C / 88 F.
(+) The palmrests and touchpad are reaching skin temperature as a maximum (33.4 °C / 92.1 F) and are therefore not hot.
(-) The average temperature of the palmrest area of similar devices was 28.7 °C / 83.7 F (-4.7 °C / -8.4 F).
HP Spectre x360 15-bl002xx audio analysis
(±) | speaker loudness is average but good (72.9 dB)
Bass 100 - 315 Hz
(±) | reduced bass - on average 14.8% lower than median
(±) | linearity of bass is average (14% delta to prev. frequency)
Mids 400 - 2000 Hz
(+) | balanced mids - only 4.4% away from median
(±) | linearity of mids is average (10.1% delta to prev. frequency)
Highs 2 - 16 kHz
(+) | balanced highs - only 1.2% away from median
(+) | highs are linear (4.9% delta to prev. frequency)
Overall 100 - 16.000 Hz
(±) | linearity of overall sound is average (20.3% difference to median)
Compared to same class
» 68% of all tested devices in this class were better, 9% similar, 24% worse
» The best had a delta of 5%, average was 17%, worst was 45%
Compared to all devices tested
» 53% of all tested devices were better, 8% similar, 39% worse
» The best had a delta of 4%, average was 23%, worst was 134%
Apple MacBook 12 (Early 2016) 1.1 GHz audio analysis
(+) | speakers can play relatively loud (83.6 dB)
Bass 100 - 315 Hz
(±) | reduced bass - on average 11.3% lower than median
(±) | linearity of bass is average (14.2% delta to prev. frequency)
Mids 400 - 2000 Hz
(+) | balanced mids - only 2.4% away from median
(+) | mids are linear (5.5% delta to prev. frequency)
Highs 2 - 16 kHz
(+) | balanced highs - only 2% away from median
(+) | highs are linear (4.5% delta to prev. frequency)
Overall 100 - 16.000 Hz
(+) | overall sound is linear (10.2% difference to median)
Compared to same class
» 7% of all tested devices in this class were better, 2% similar, 91% worse
» The best had a delta of 5%, average was 18%, worst was 53%
Compared to all devices tested
» 5% of all tested devices were better, 1% similar, 94% worse
» The best had a delta of 4%, average was 23%, worst was 134%
| Off / Standby | |
| Idle | |
| Load |
|
Key:
min: | |
| HP Spectre x360 15-bl002xx i7-7500U, GeForce 940MX, Toshiba XG4 NVMe (THNSN5512GPUK), IPS, 3840x2160, 15.6" | Lenovo Yoga 910-13IKB-80VF004CGE i7-7500U, HD Graphics 620, Samsung PM951 NVMe MZVLV512, IPS, 3840x2160, 13.9" | HP Spectre x360 15-ap012dx 6200U, HD Graphics 520, Sandisk X300 SD7SN6S-256G-1006, IPS, 3840x2160, 15.6" | Dell XPS 15 2017 9560 (7300HQ, Full-HD) i5-7300HQ, GeForce GTX 1050 Mobile, WDC WD10SPCX-75KHST0 + SanDisk Z400s M.2 2242 32 GB Cache, LED IGZO IPS InfinityEdge, 1920x1080, 15.6" | Lenovo ThinkPad X1 Yoga-20FRS1VS00 6600U, HD Graphics 520, Samsung SSD PM961 1TB M.2 PCIe 3.0 x4 NVMe (MZSLW1T0), OLED, 2560x1440, 14" | Dell Inspiron 15 5568 6500U, HD Graphics 520, Toshiba THNSNK256GCS8, IPS, 1920x1080, 15.6" | |
|---|---|---|---|---|---|---|
| Power Consumption | 41% | 11% | -19% | 26% | 40% | |
| Idle Minimum * (Watt) | 8.14 | 4.3 47% | 6.5 20% | 6.6 19% | 4.7 42% | 4.34 47% |
| Idle Average * (Watt) | 10.91 | 6.3 42% | 13.3 -22% | 9 18% | 8.6 21% | 7.5 31% |
| Idle Maximum * (Watt) | 12.26 | 9 27% | 15.1 -23% | 10.7 13% | 12.2 -0% | 8.4 31% |
| Load Average * (Watt) | 45.67 | 32.7 28% | 30.8 33% | 77.5 -70% | 29.7 35% | 30.4 33% |
| Load Maximum * (Watt) | 74.94 | 28.8 62% | 38.5 49% | 130 -73% | 50.5 33% | 32.5 57% |
* ... smaller is better
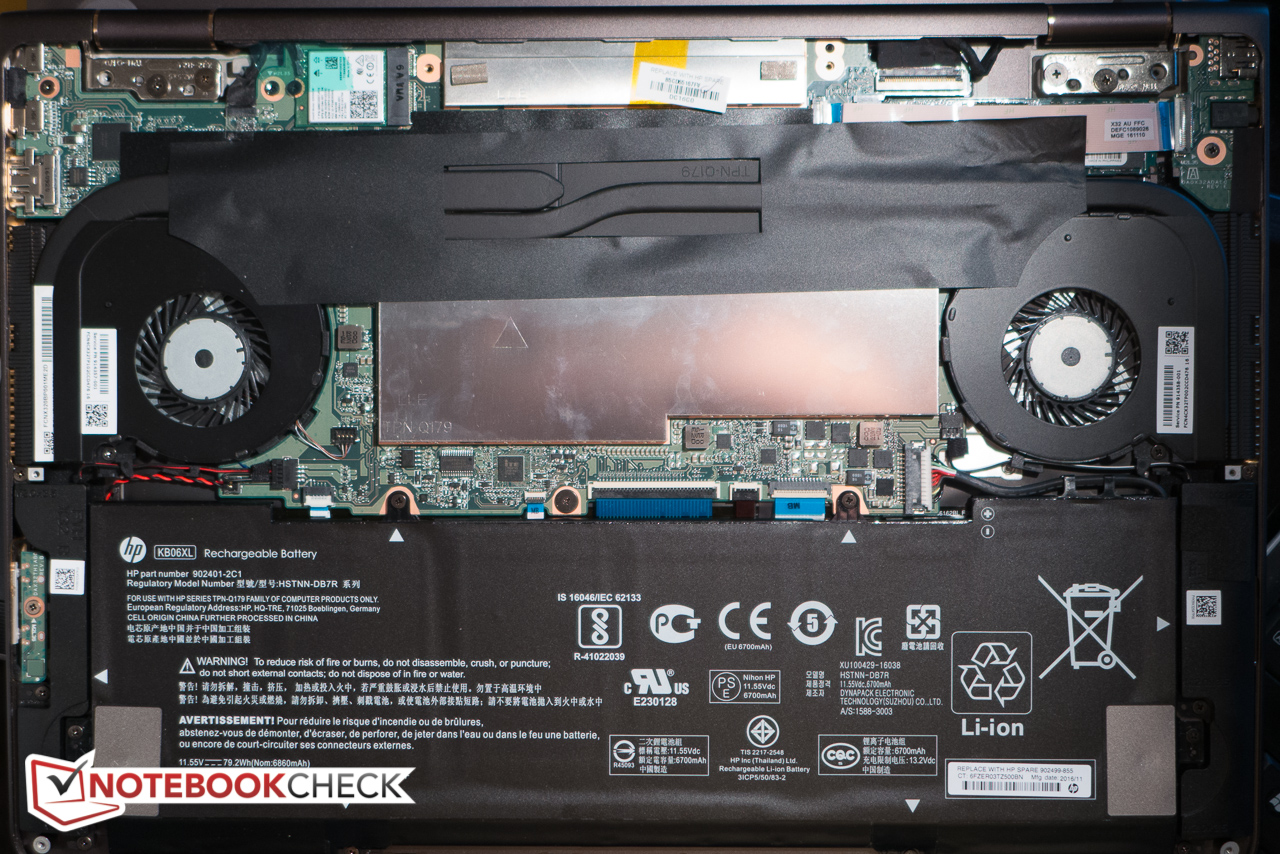
| HP Spectre x360 15-bl002xx i7-7500U, GeForce 940MX, 79.2 Wh | Lenovo Yoga 910-13IKB-80VF004CGE i7-7500U, HD Graphics 620, 78 Wh | HP Spectre x360 15-ap012dx 6200U, HD Graphics 520, 65 Wh | Dell XPS 15 2017 9560 (7300HQ, Full-HD) i5-7300HQ, GeForce GTX 1050 Mobile, 56 Wh | Lenovo ThinkPad X1 Yoga-20FRS1VS00 6600U, HD Graphics 520, 56 Wh | Dell Inspiron 15 5568 6500U, HD Graphics 520, 42 Wh | |
|---|---|---|---|---|---|---|
| Battery runtime | 20% | -20% | -39% | -19% | -43% | |
| Reader / Idle (h) | 14.4 | 17.8 24% | 11.8 -18% | 9.4 -35% | 13.7 -5% | 7.5 -48% |
| WiFi v1.3 (h) | 8.9 | 10.7 20% | 7.2 -19% | 5.6 -37% | 5.3 -40% | 5 -44% |
| Load (h) | 2.5 | 2.9 16% | 1.9 -24% | 1.4 -44% | 2.2 -12% | 1.6 -36% |
Pros
Cons
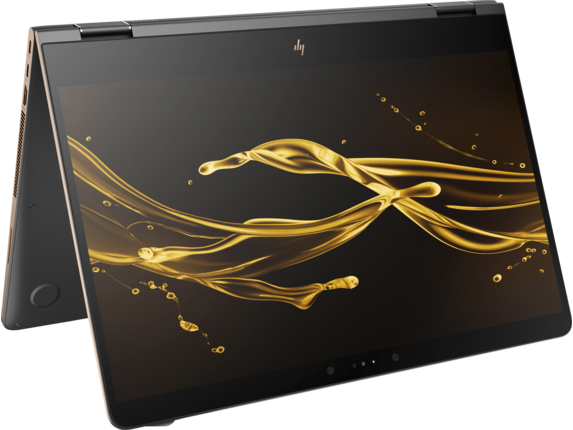
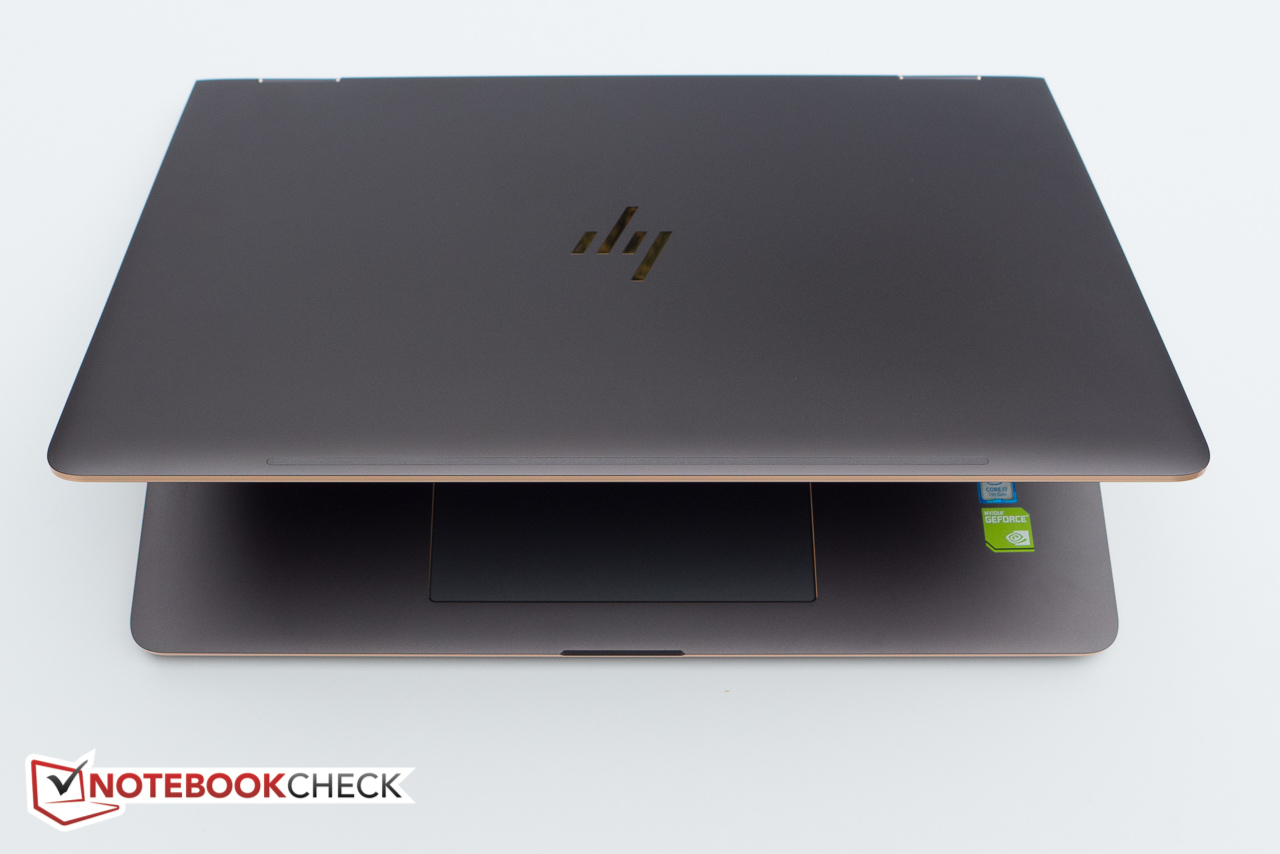
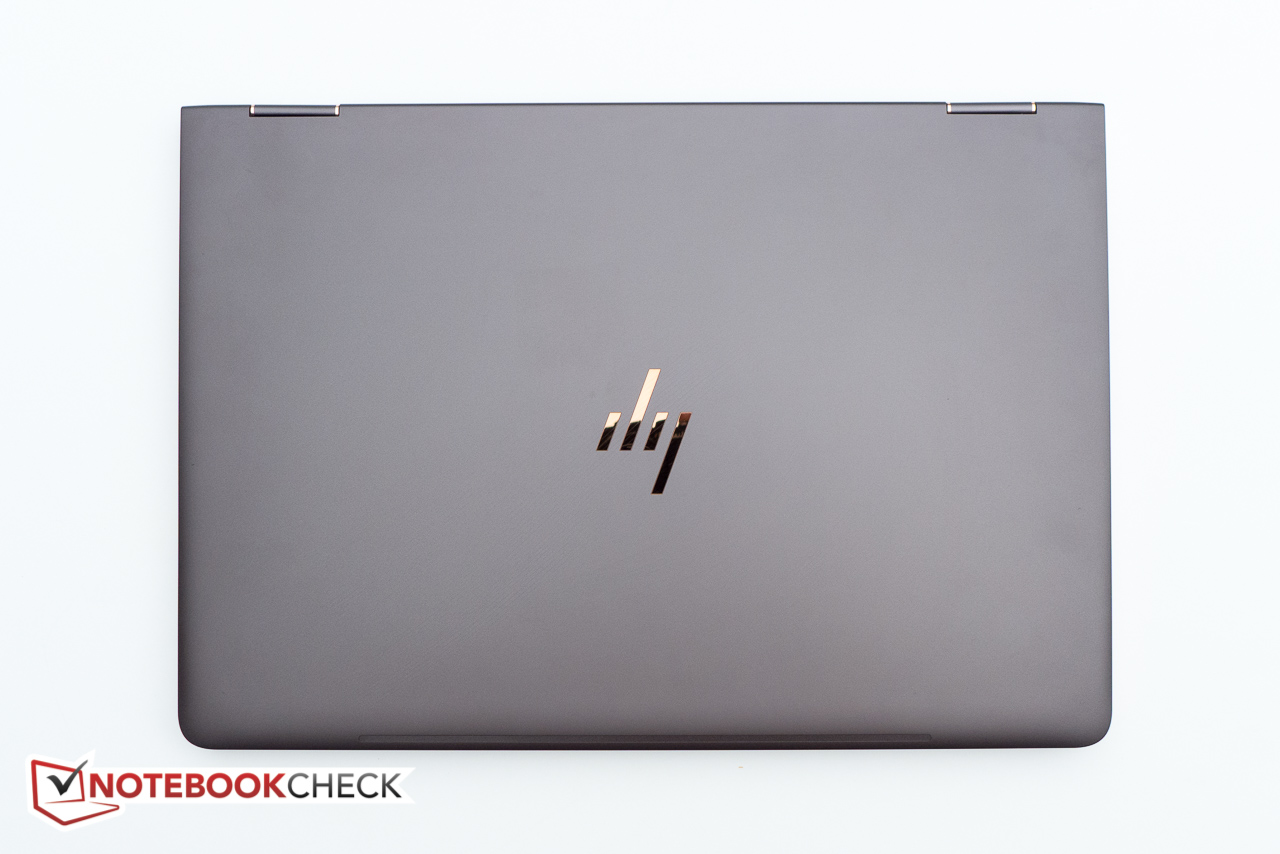
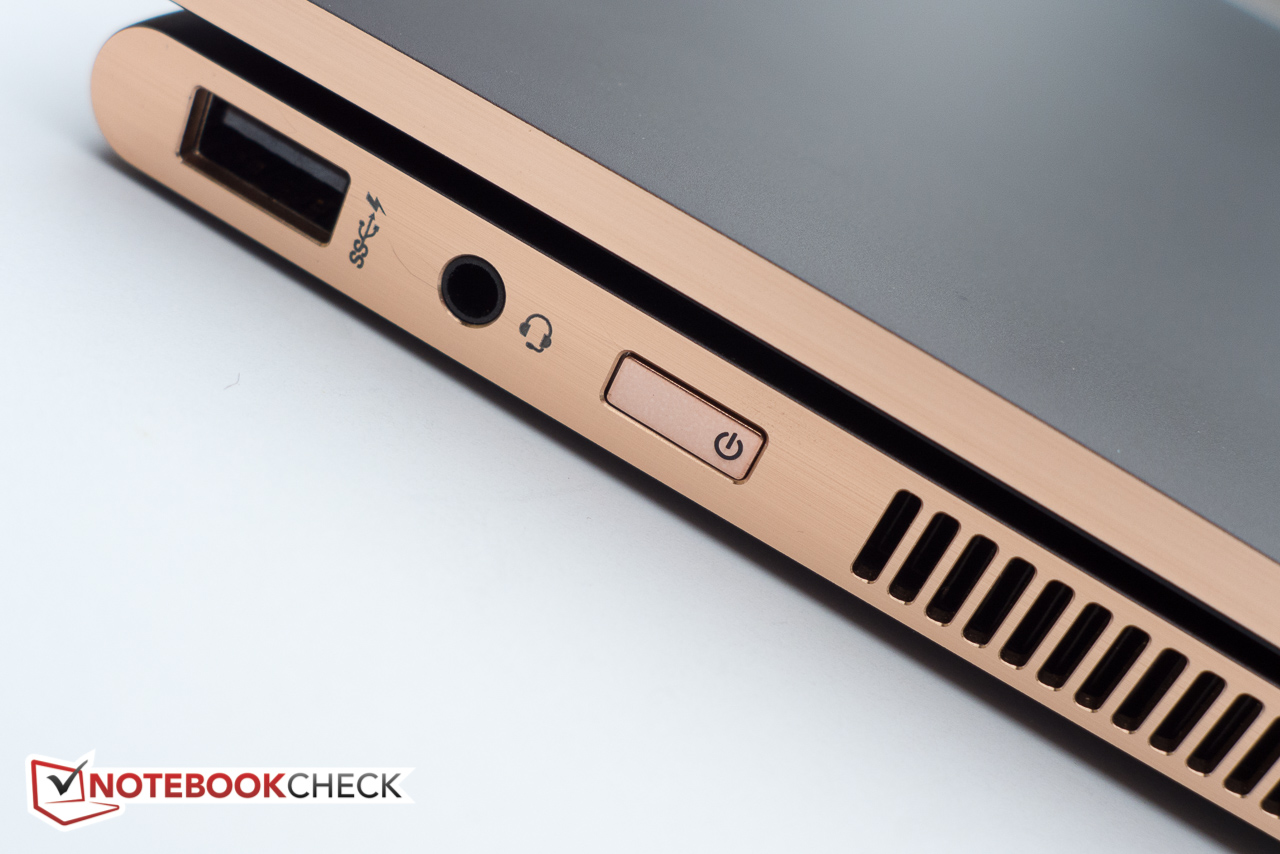
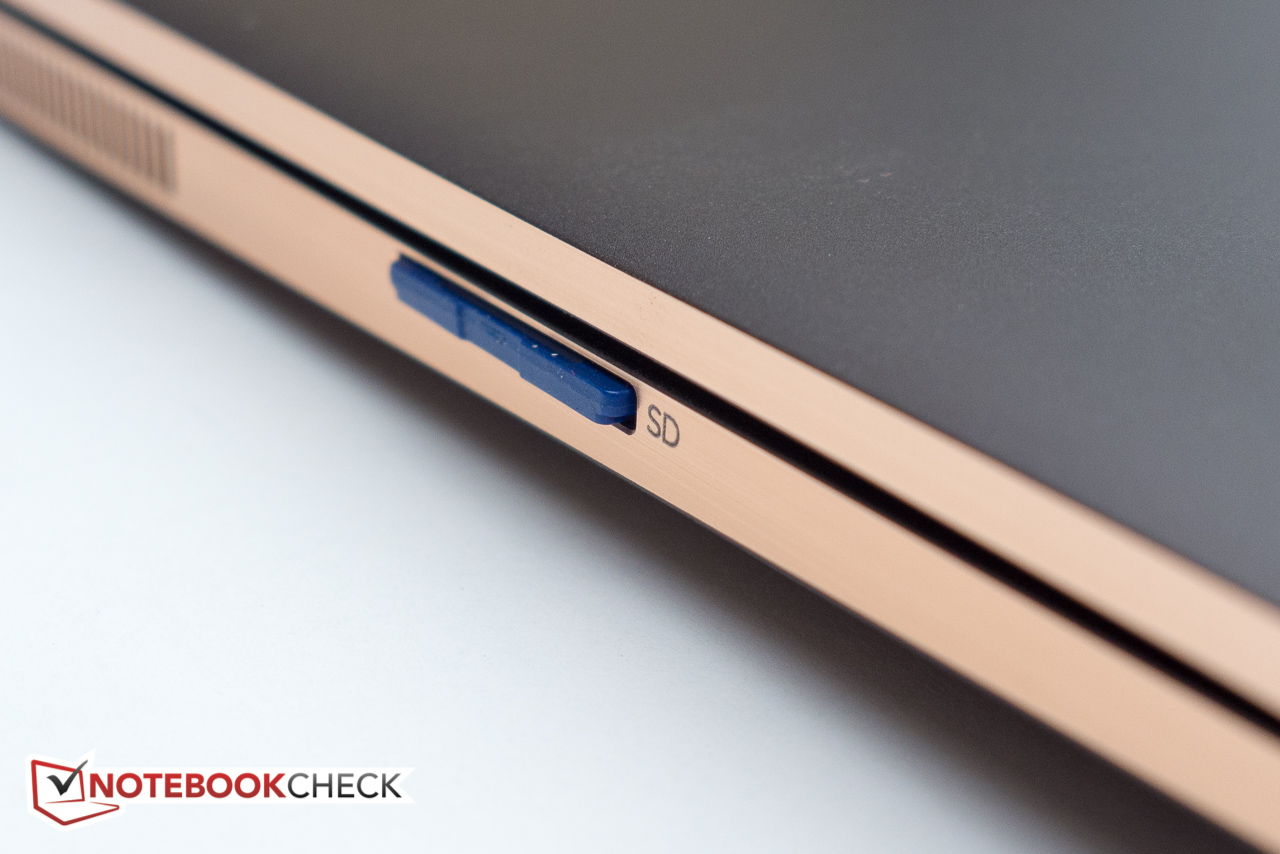
得到全新设计的15.6寸惠普Spectre x360采用了尺寸稍小的13寸机型的外观元素。它的CNC铝合金机身坚固美观、质感十足,不过它相比之前稍厚一些。更新后搭配Kaby Lake i7处理器和512GB M.2固态硬盘的这个机型性能得到了进一步提升,可以更好的适合未来长时间的使用。更大容量的电池可以满足更高功耗的需要,而整体的续航时间也比前代机型有所改进。它的4K屏幕采用标准RGB技术而不再是PenTile技术,显示效果明亮绚丽,它的输入设备也十分不错,同时主动式手写笔也让记笔记变得更加顺手。它的一个最大新颖特点是搭配了独立心啊卡,这可能会让除办公外还偶尔玩游戏的用户更感兴趣。
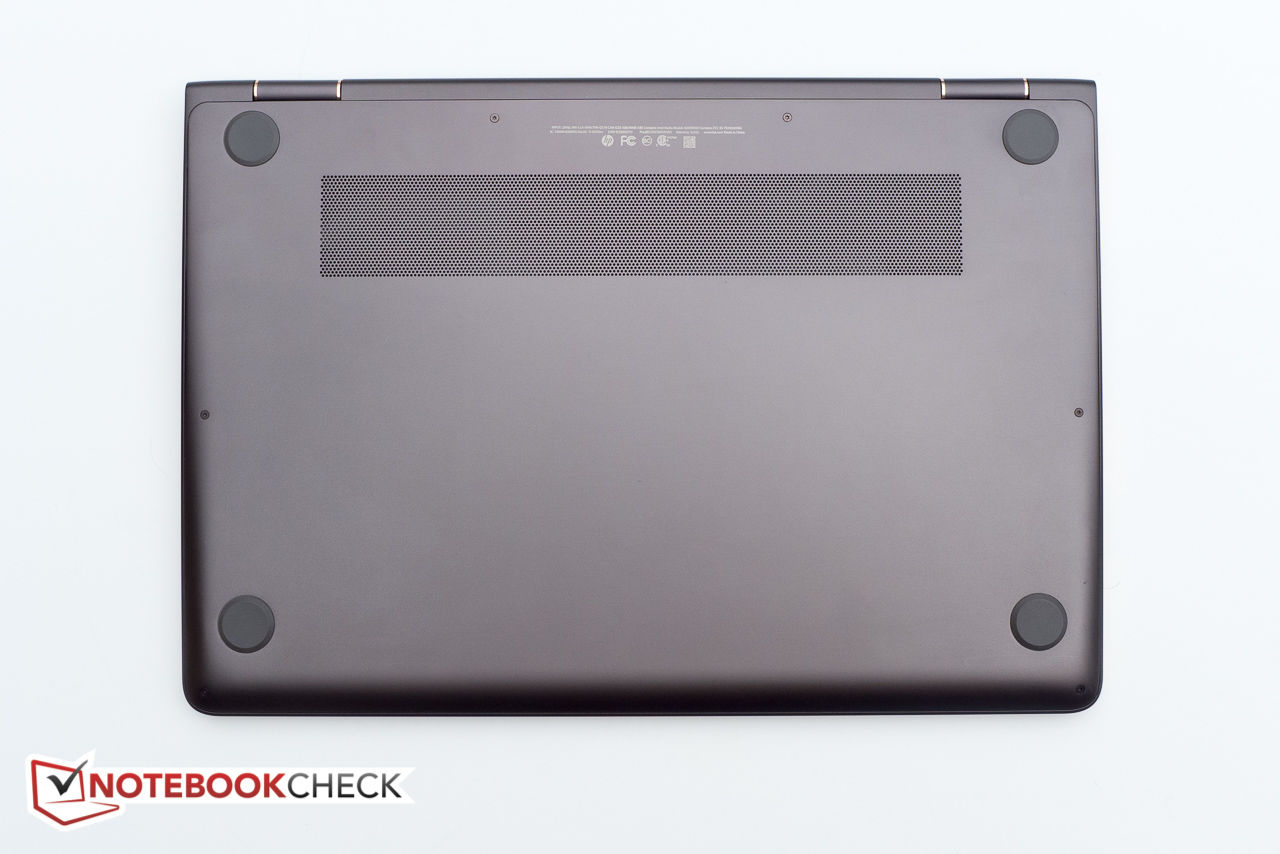
它有一个小问题让我们很难接受:玻璃的表面让屏幕上盖十分沉重,因此屏幕转轴有些难以让它保持稳定。在机身底部或屏幕边缘也没有保护性的橡胶垫脚,让这台变形本会很容易从光滑的表面滑落,同时铝合金的边缘也让它在帐篷模式下会很容易被划伤。4K屏幕仍然会遇到一些缩放比例的问题,且并不是所有用户都需要如此高的分辨率,如果惠普能够为它提供全高清或者WQHD分辨率作为选项会更合理。最后但同样关键的是,如果一台大尺寸变形本没有采用超薄设计的话,在平板模式下它的实用性将会十分有限。
惠普Spectre x360 15几乎没有弱点。它十分坚固,作为二合一设备性能优秀,如果用户在考虑大尺寸变形本的话,它是最值得考虑的设备之一。
注:本文是基于完整评测的缩减版本,阅读完整的英文评测,请点击这里。
HP Spectre x360 15-bl002xx
- 03/07/2017 v6 (old)
Bernhard Pechlaner
Price comparison
