华硕 Zenbook UX310UQ-GL011T 笔记本电脑简短评测
| SD Card Reader | |
| average JPG Copy Test (av. of 3 runs) | |
| Lenovo Yoga 710-14ISK | |
| HP Pavilion 14-al003ng | |
| Lenovo ThinkPad T460p-20FXS05500 | |
| Asus Zenbook UX310UQ-GL011T | |
| Asus Zenbook UX330UA-FC059T | |
| maximum AS SSD Seq Read Test (1GB) | |
| Lenovo Yoga 710-14ISK | |
| Lenovo ThinkPad T460p-20FXS05500 | |
| HP Pavilion 14-al003ng | |
| Asus Zenbook UX310UQ-GL011T | |
| Asus Zenbook UX330UA-FC059T | |
| Networking | |
| iperf Server (receive) TCP 1 m | |
| Asus Zenbook UX310UQ-GL011T (jseb) | |
| Asus Zenbook UX330UA-FC059T | |
| Asus Zenbook UX360UA-C4159T | |
| HP Spectre x2 12-a001ng | |
| iperf Client (transmit) TCP 1 m | |
| Asus Zenbook UX310UQ-GL011T (jseb) | |
| Asus Zenbook UX360UA-C4159T | |
| Asus Zenbook UX330UA-FC059T (jseb) | |
| HP Spectre x2 12-a001ng | |
| |||||||||||||||||||||||||
Brightness Distribution: 90 %
Center on Battery: 247 cd/m²
Contrast: 574:1 (Black: 0.43 cd/m²)
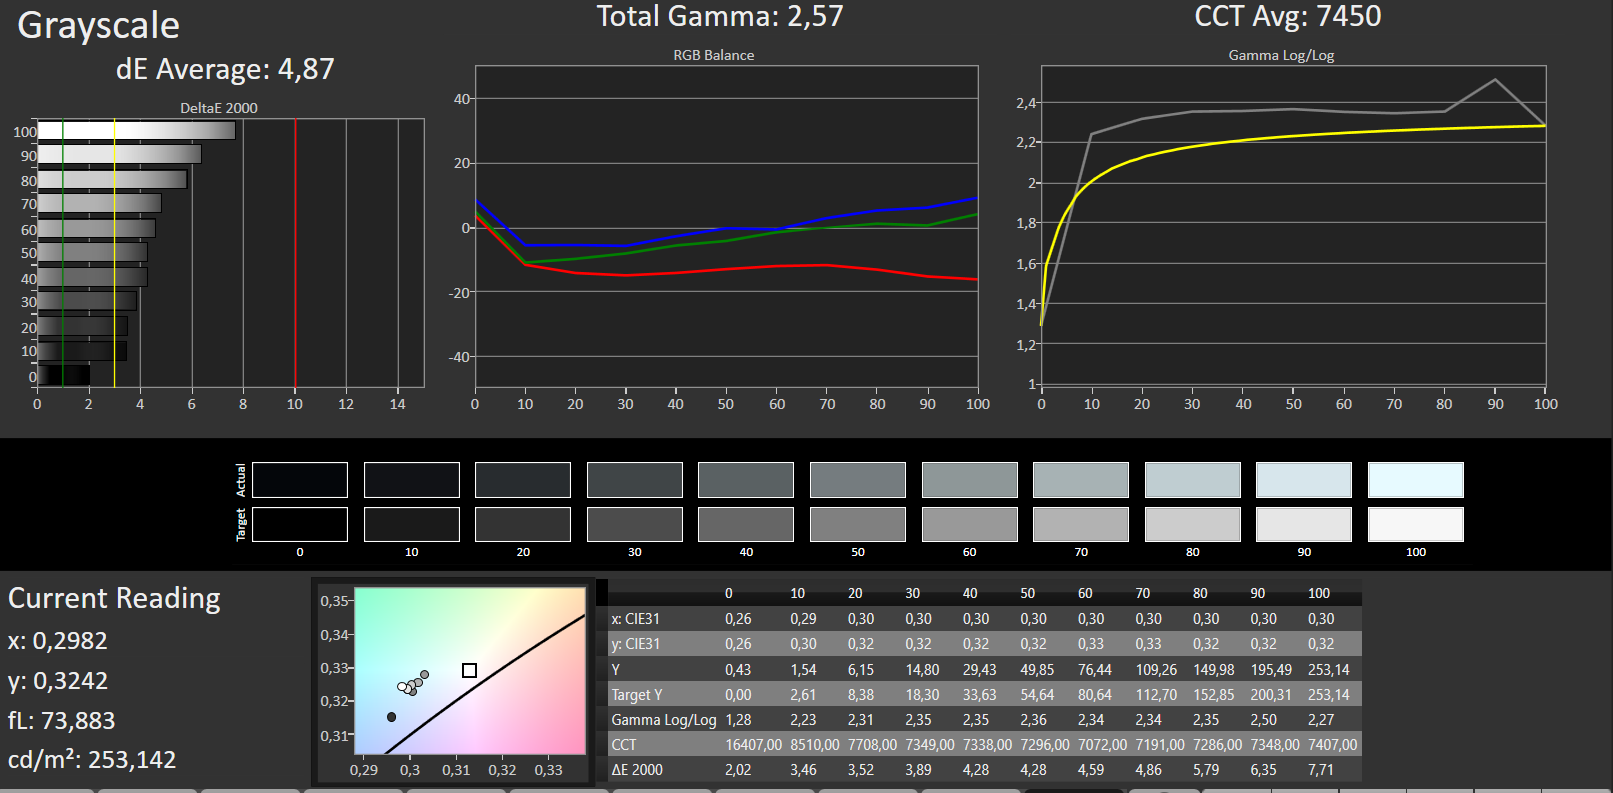
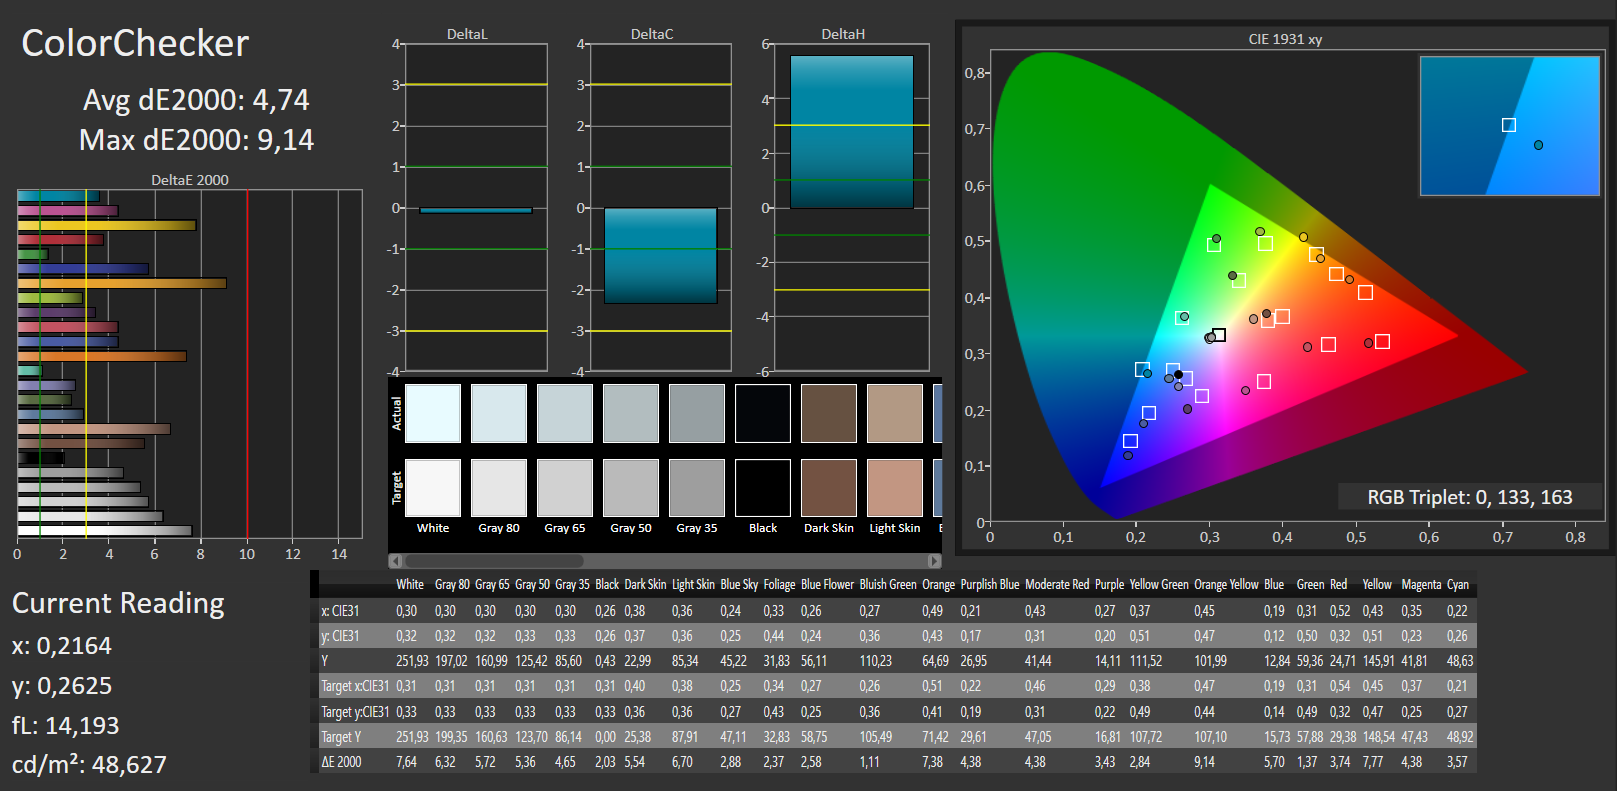
ΔE ColorChecker Calman: 4.74 | ∀{0.5-29.43 Ø4.72}
ΔE Greyscale Calman: 4.87 | ∀{0.09-98 Ø4.97}
88% sRGB (Argyll 1.6.3 3D)
57% AdobeRGB 1998 (Argyll 1.6.3 3D)
63% AdobeRGB 1998 (Argyll 3D)
88.3% sRGB (Argyll 3D)
61.9% Display P3 (Argyll 3D)
Gamma: 2.57
CCT: 7450 K
| Asus Zenbook UX310UQ-GL011T TN LED, 1920x1080, 13.3" | Lenovo Yoga 710-14ISK a-Si WLED TFT, IPS, 1920x1080, 14" | Xiaomi Mi Notebook Air 13.3 2016 IPS, 1920x1080, 13.3" | Lenovo ThinkPad T460p-20FXS05500 IPS-Panel, 2560x1440, 14" | HP Pavilion 14-al003ng LED IPS, 1920x1080, 14" | |
|---|---|---|---|---|---|
| Display | 8% | 9% | |||
| Display P3 Coverage (%) | 61.9 | 66 7% | 66.9 8% | ||
| sRGB Coverage (%) | 88.3 | 95.5 8% | 96.5 9% | ||
| AdobeRGB 1998 Coverage (%) | 63 | 67.8 8% | 68.8 9% | ||
| Response Times | -10% | -20% | -1% | 1% | |
| Response Time Grey 50% / Grey 80% * (ms) | 39 ? | 35 ? 10% | 49 ? -26% | 38.4 ? 2% | 36.4 ? 7% |
| Response Time Black / White * (ms) | 24 ? | 31 ? -29% | 27 ? -13% | 24.8 ? -3% | 25.2 ? -5% |
| PWM Frequency (Hz) | 50 ? | 50 ? | 50 ? | 220 | |
| Screen | 6% | 35% | 17% | -0% | |
| Brightness middle (cd/m²) | 247 | 325 32% | 347 40% | 290 17% | 220 -11% |
| Brightness (cd/m²) | 240 | 298 24% | 334 39% | 280 17% | 209 -13% |
| Brightness Distribution (%) | 90 | 88 -2% | 80 -11% | 93 3% | 88 -2% |
| Black Level * (cd/m²) | 0.43 | 0.35 19% | 0.27 37% | 0.31 28% | 0.28 35% |
| Contrast (:1) | 574 | 929 62% | 1285 124% | 935 63% | 786 37% |
| Colorchecker dE 2000 * | 4.74 | 6.2 -31% | 3.29 31% | 3.88 18% | 4.58 3% |
| Colorchecker dE 2000 max. * | 9.14 | 10.82 -18% | 4.69 49% | 8.19 10% | 11.47 -25% |
| Greyscale dE 2000 * | 4.87 | 6.32 -30% | 3.62 26% | 5.47 -12% | 2.34 52% |
| Gamma | 2.57 86% | 2.3 96% | 2.23 99% | 2.33 94% | 2.26 97% |
| CCT | 7450 87% | 6926 94% | 7307 89% | 6469 100% | 6661 98% |
| Color Space (Percent of AdobeRGB 1998) (%) | 57 | 58 2% | 62 9% | 63.3 11% | 34.6 -39% |
| Color Space (Percent of sRGB) (%) | 88 | 90 2% | 95 8% | 96.64 10% | 54.2 -38% |
| Total Average (Program / Settings) | -2% /
3% | 8% /
22% | 8% /
13% | 1% /
0% |
* ... smaller is better
Display Response Times
| ↔ Response Time Black to White | ||
|---|---|---|
| 24 ms ... rise ↗ and fall ↘ combined | ↗ 7 ms rise | 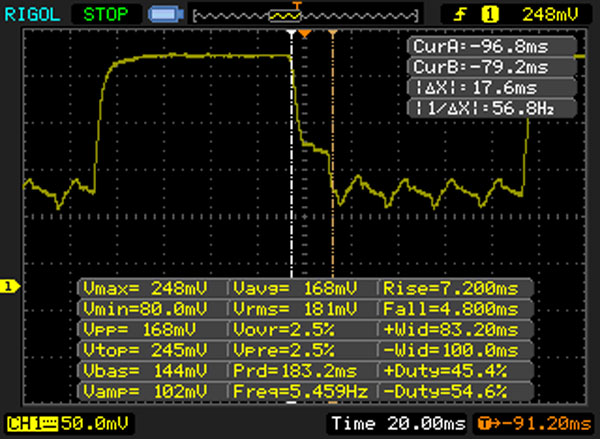 |
| ↘ 17 ms fall | ||
| The screen shows good response rates in our tests, but may be too slow for competitive gamers. In comparison, all tested devices range from 0.1 (minimum) to 240 (maximum) ms. » 54 % of all devices are better. This means that the measured response time is worse than the average of all tested devices (19.8 ms). | ||
| ↔ Response Time 50% Grey to 80% Grey | ||
| 39 ms ... rise ↗ and fall ↘ combined | ↗ 20 ms rise | 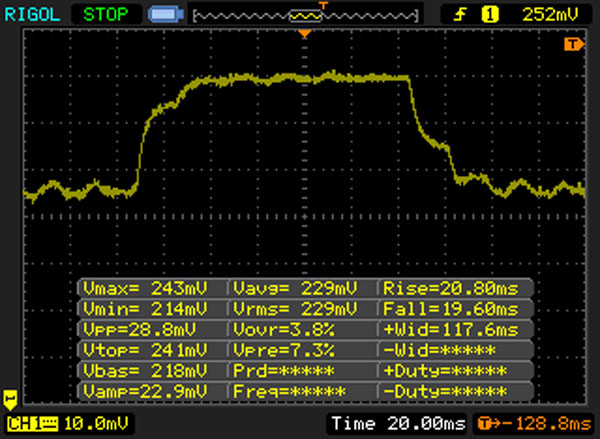 |
| ↘ 19 ms fall | ||
| The screen shows slow response rates in our tests and will be unsatisfactory for gamers. In comparison, all tested devices range from 0.165 (minimum) to 636 (maximum) ms. » 59 % of all devices are better. This means that the measured response time is worse than the average of all tested devices (31 ms). | ||
Screen Flickering / PWM (Pulse-Width Modulation)
| Screen flickering / PWM detected | 50 Hz | ≤ 30 % brightness setting | 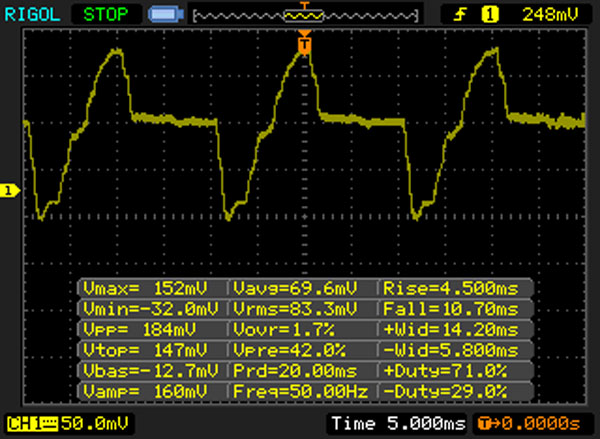 |
The display backlight flickers at 50 Hz (worst case, e.g., utilizing PWM) Flickering detected at a brightness setting of 30 % and below. There should be no flickering or PWM above this brightness setting. The frequency of 50 Hz is very low, so the flickering may cause eyestrain and headaches after extended use. In comparison: 52 % of all tested devices do not use PWM to dim the display. If PWM was detected, an average of 7781 (minimum: 5 - maximum: 343500) Hz was measured. | |||
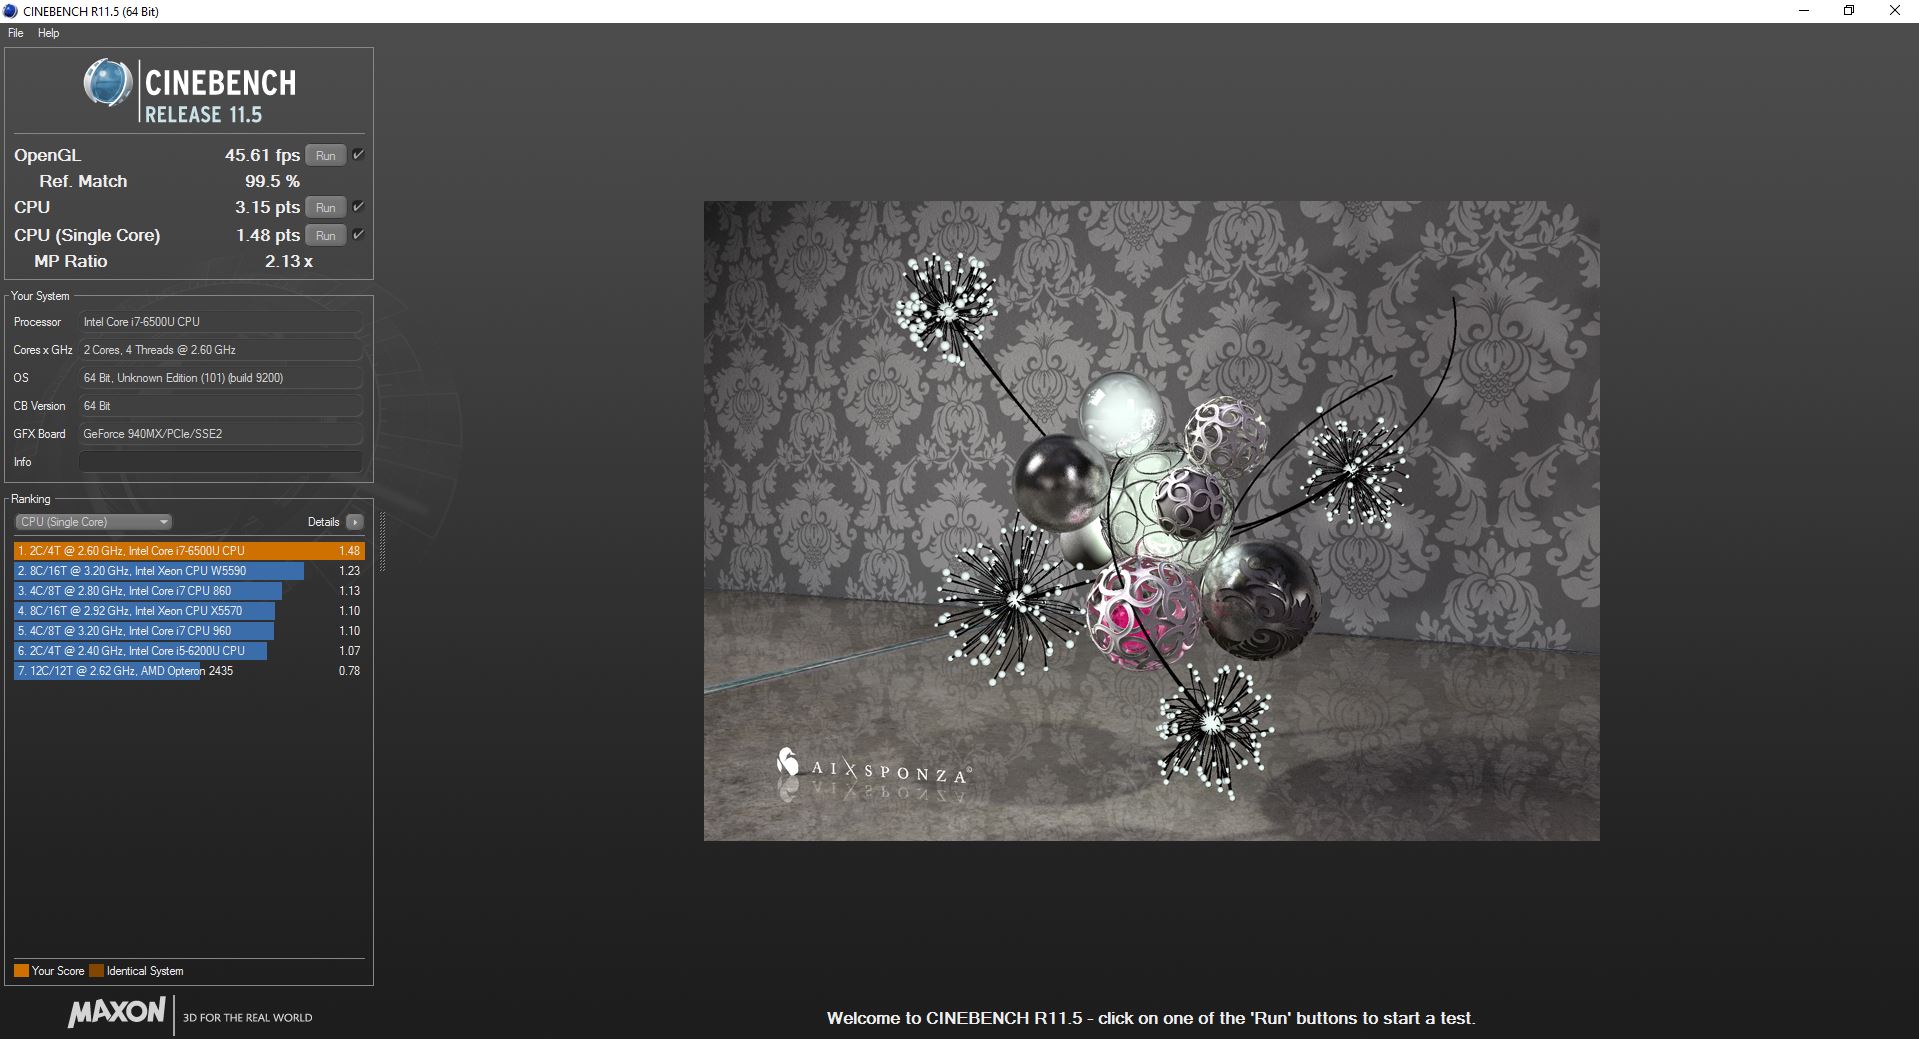
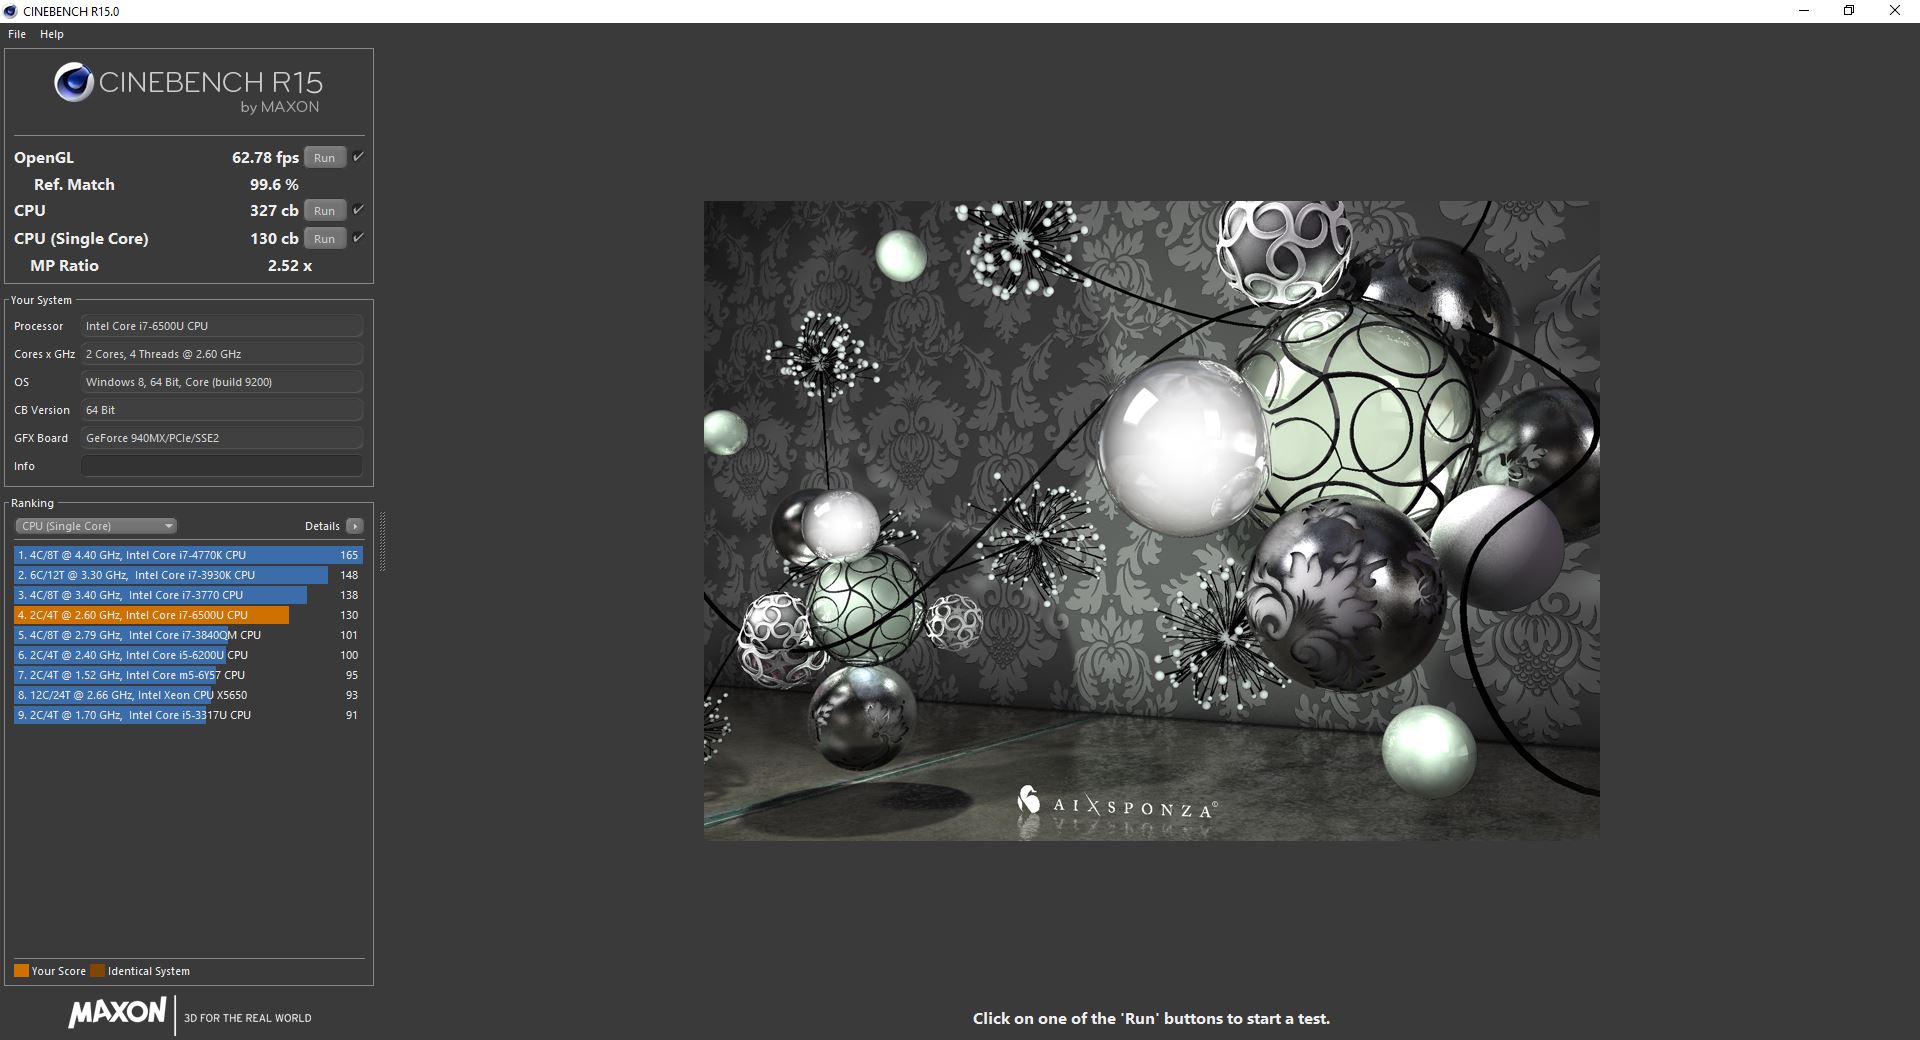
| Cinebench R15 | |
| CPU Single 64Bit | |
| Lenovo ThinkPad T460p-20FXS05500 | |
| Asus Zenbook UX310UQ-GL011T | |
| Xiaomi Mi Notebook Air 13.3 2016 | |
| HP Pavilion 14-al003ng | |
| Lenovo Yoga 710-14ISK | |
| CPU Multi 64Bit | |
| Lenovo ThinkPad T460p-20FXS05500 | |
| Asus Zenbook UX310UQ-GL011T | |
| Xiaomi Mi Notebook Air 13.3 2016 | |
| Lenovo Yoga 710-14ISK | |
| HP Pavilion 14-al003ng | |
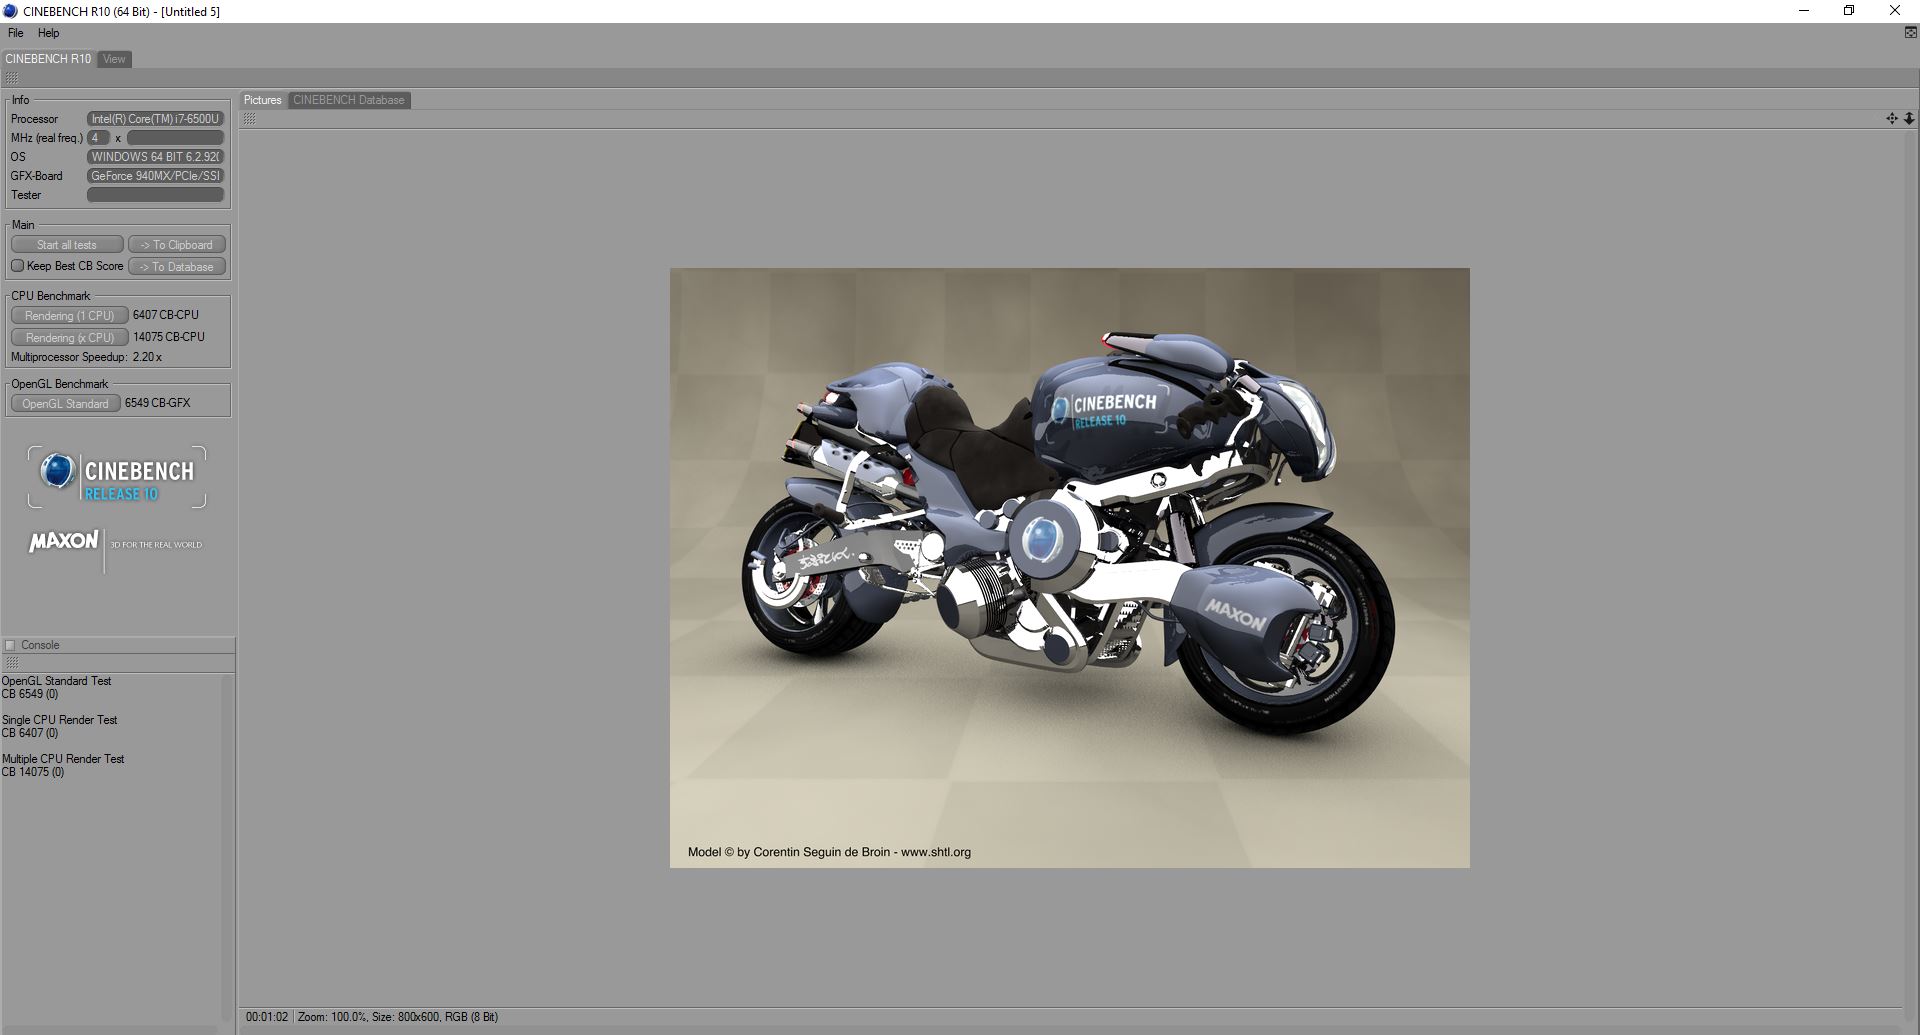
| Cinebench R10 | |
| Rendering Single CPUs 64Bit | |
| Asus Zenbook UX310UQ-GL011T | |
| Lenovo Yoga 710-14ISK | |
| Rendering Multiple CPUs 64Bit | |
| Asus Zenbook UX310UQ-GL011T | |
| Lenovo Yoga 710-14ISK | |
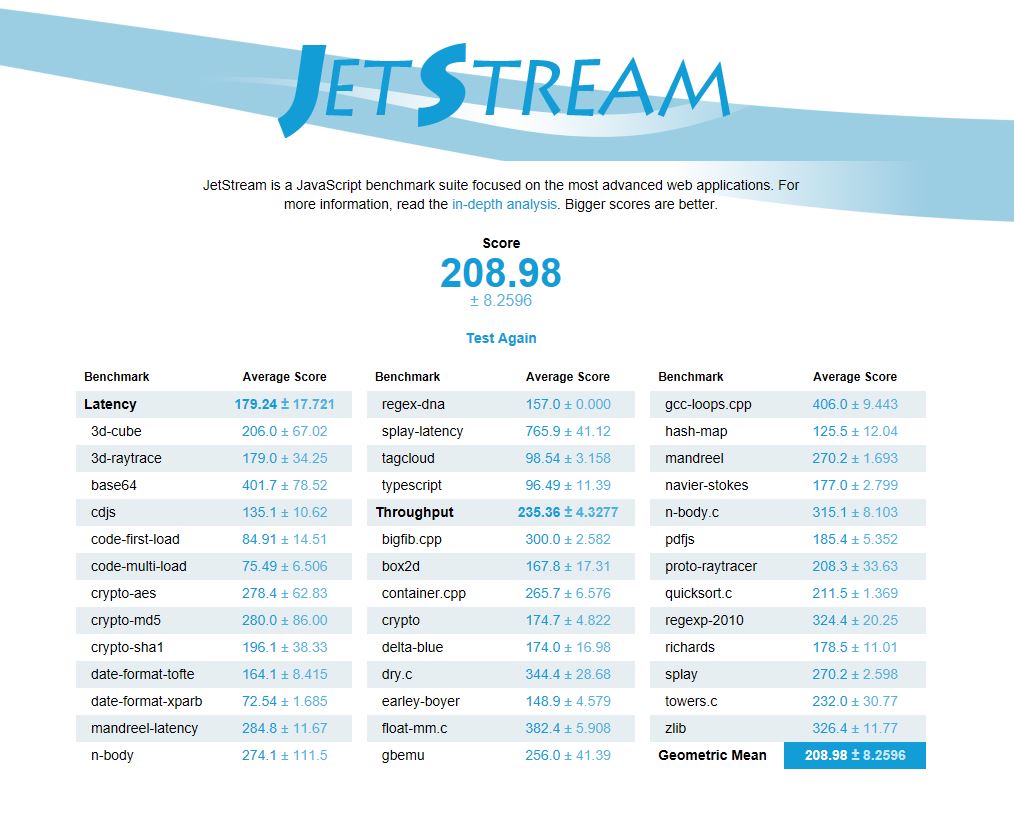
| JetStream 1.1 - 1.1 Total | |
| Lenovo ThinkPad T460p-20FXS05500 | |
| Asus Zenbook UX310UQ-GL011T | |
| HP Pavilion 14-al003ng | |
| Xiaomi Mi Notebook Air 13.3 2016 | |
| Lenovo Yoga 710-14ISK | |
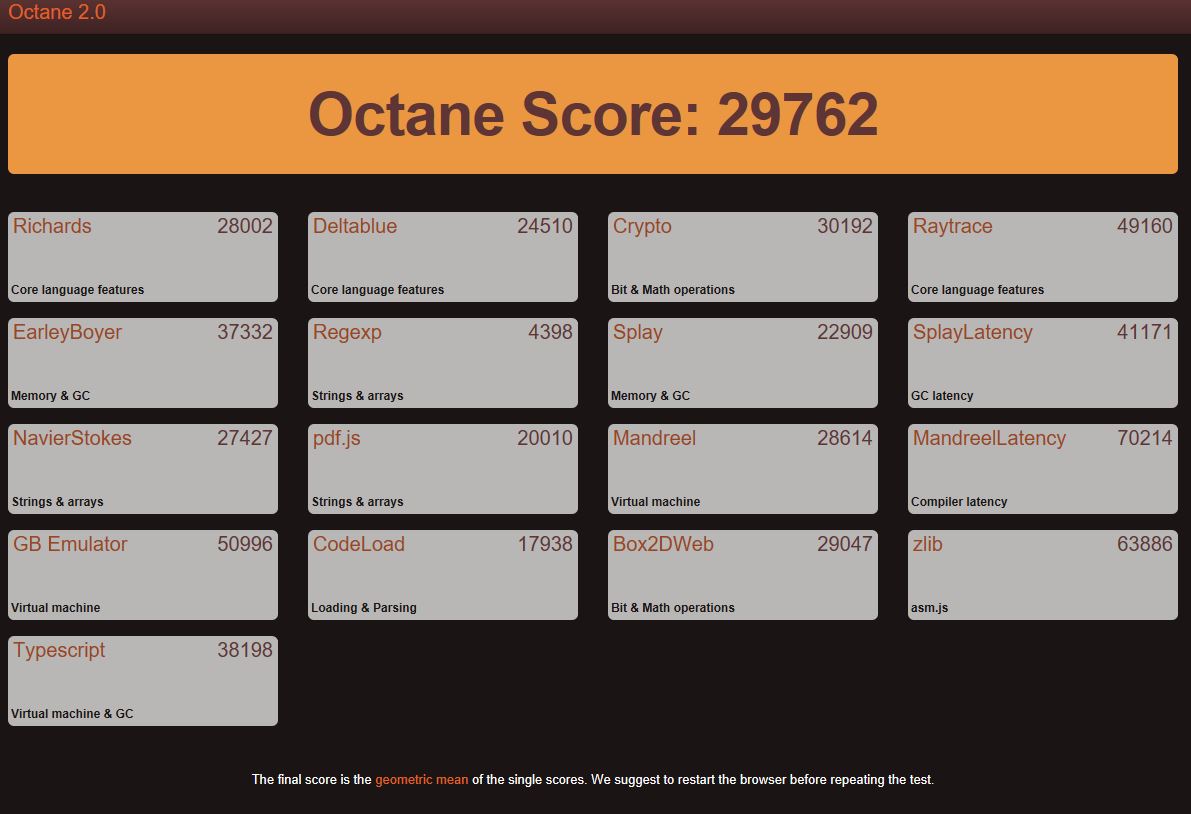
| Octane V2 - Total Score | |
| Lenovo ThinkPad T460p-20FXS05500 | |
| Asus Zenbook UX310UQ-GL011T | |
| Xiaomi Mi Notebook Air 13.3 2016 | |
| Lenovo Yoga 710-14ISK | |
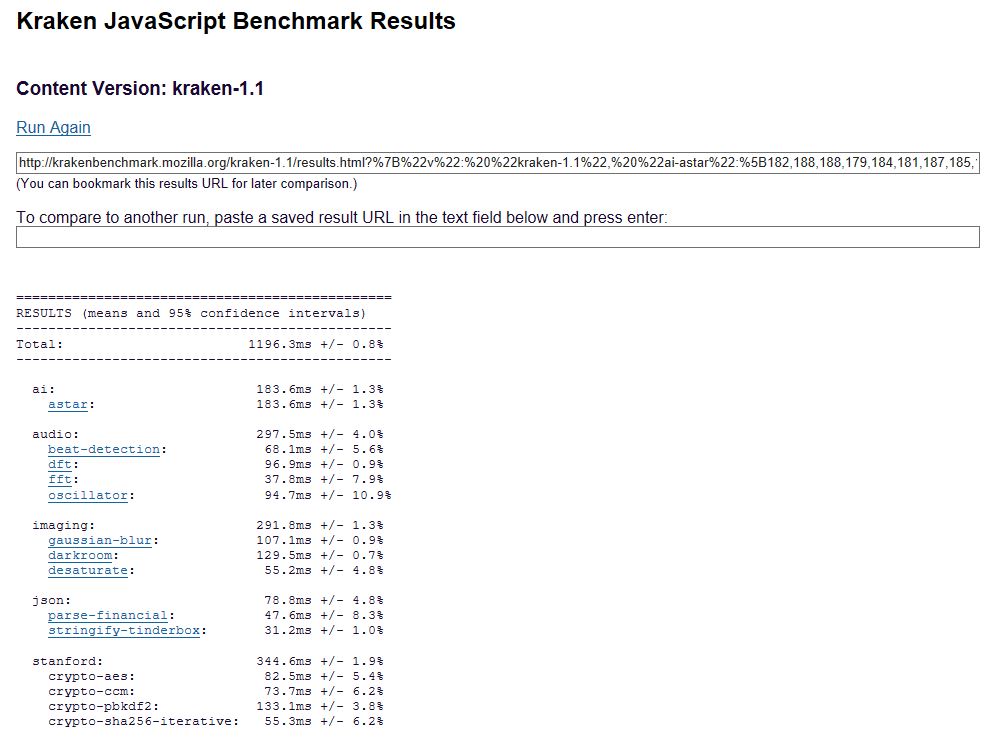
| Mozilla Kraken 1.1 - Total | |
| Xiaomi Mi Notebook Air 13.3 2016 | |
| Lenovo Yoga 710-14ISK | |
| Asus Zenbook UX310UQ-GL011T | |
| Lenovo ThinkPad T460p-20FXS05500 | |
* ... smaller is better
| PCMark 8 | |
| Home Score Accelerated v2 | |
| Asus Zenbook UX310UQ-GL011T | |
| Lenovo Yoga 710-14ISK | |
| Lenovo ThinkPad T460p-20FXS05500 | |
| HP Pavilion 14-al003ng | |
| Xiaomi Mi Notebook Air 13.3 2016 | |
| Work Score Accelerated v2 | |
| Asus Zenbook UX310UQ-GL011T | |
| Lenovo ThinkPad T460p-20FXS05500 | |
| Lenovo Yoga 710-14ISK | |
| Xiaomi Mi Notebook Air 13.3 2016 | |
| Creative Score Accelerated v2 | |
| Asus Zenbook UX310UQ-GL011T | |
| Lenovo ThinkPad T460p-20FXS05500 | |
| Lenovo Yoga 710-14ISK | |
| PCMark 7 | |
| Productivity | |
| Lenovo ThinkPad T460p-20FXS05500 | |
| Asus Zenbook UX310UQ-GL011T | |
| Lenovo Yoga 710-14ISK | |
| Score | |
| Lenovo ThinkPad T460p-20FXS05500 | |
| Asus Zenbook UX310UQ-GL011T | |
| Lenovo Yoga 710-14ISK | |
| PCMark Vantage Result | 13885 points | |
| PCMark 7 Score | 5305 points | |
| PCMark 8 Home Score Accelerated v2 | 3769 points | |
| PCMark 8 Creative Score Accelerated v2 | 4440 points | |
| PCMark 8 Work Score Accelerated v2 | 4603 points | |
Help | ||
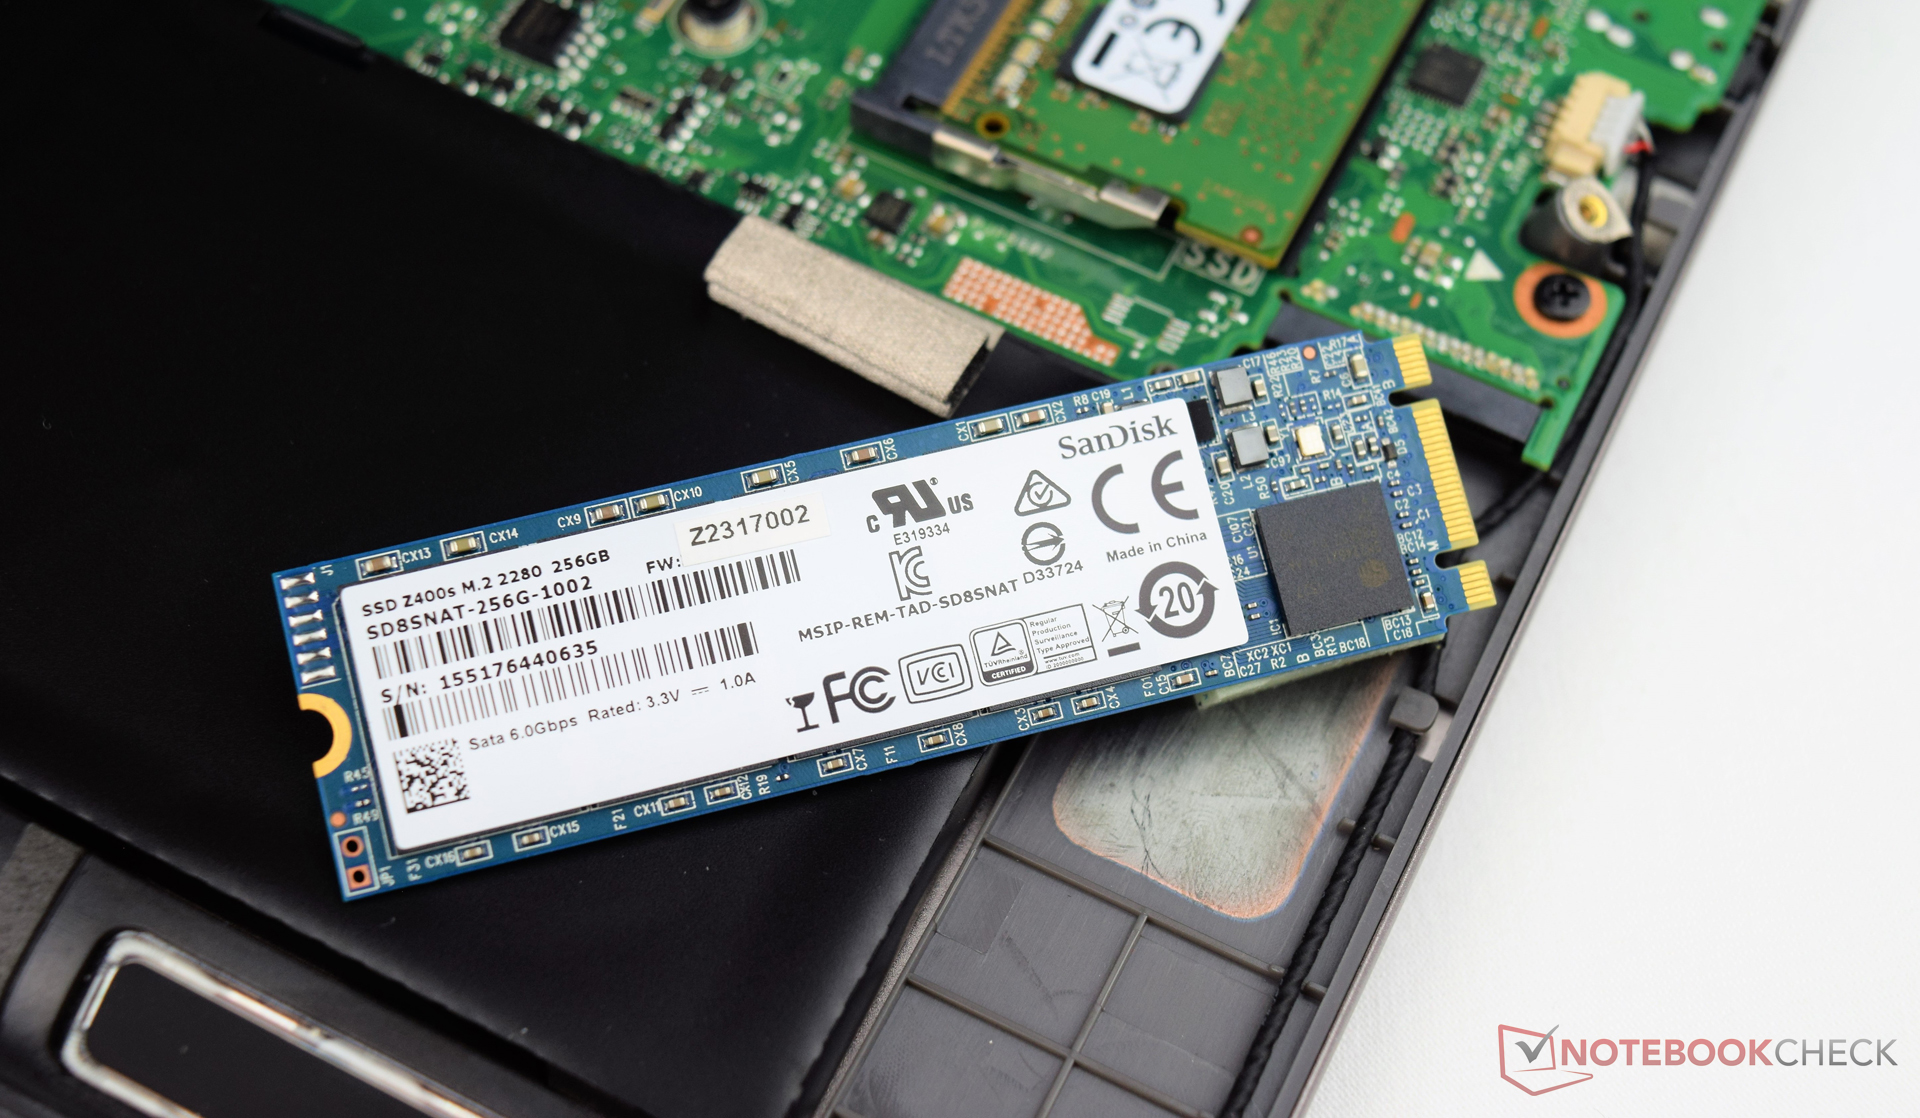
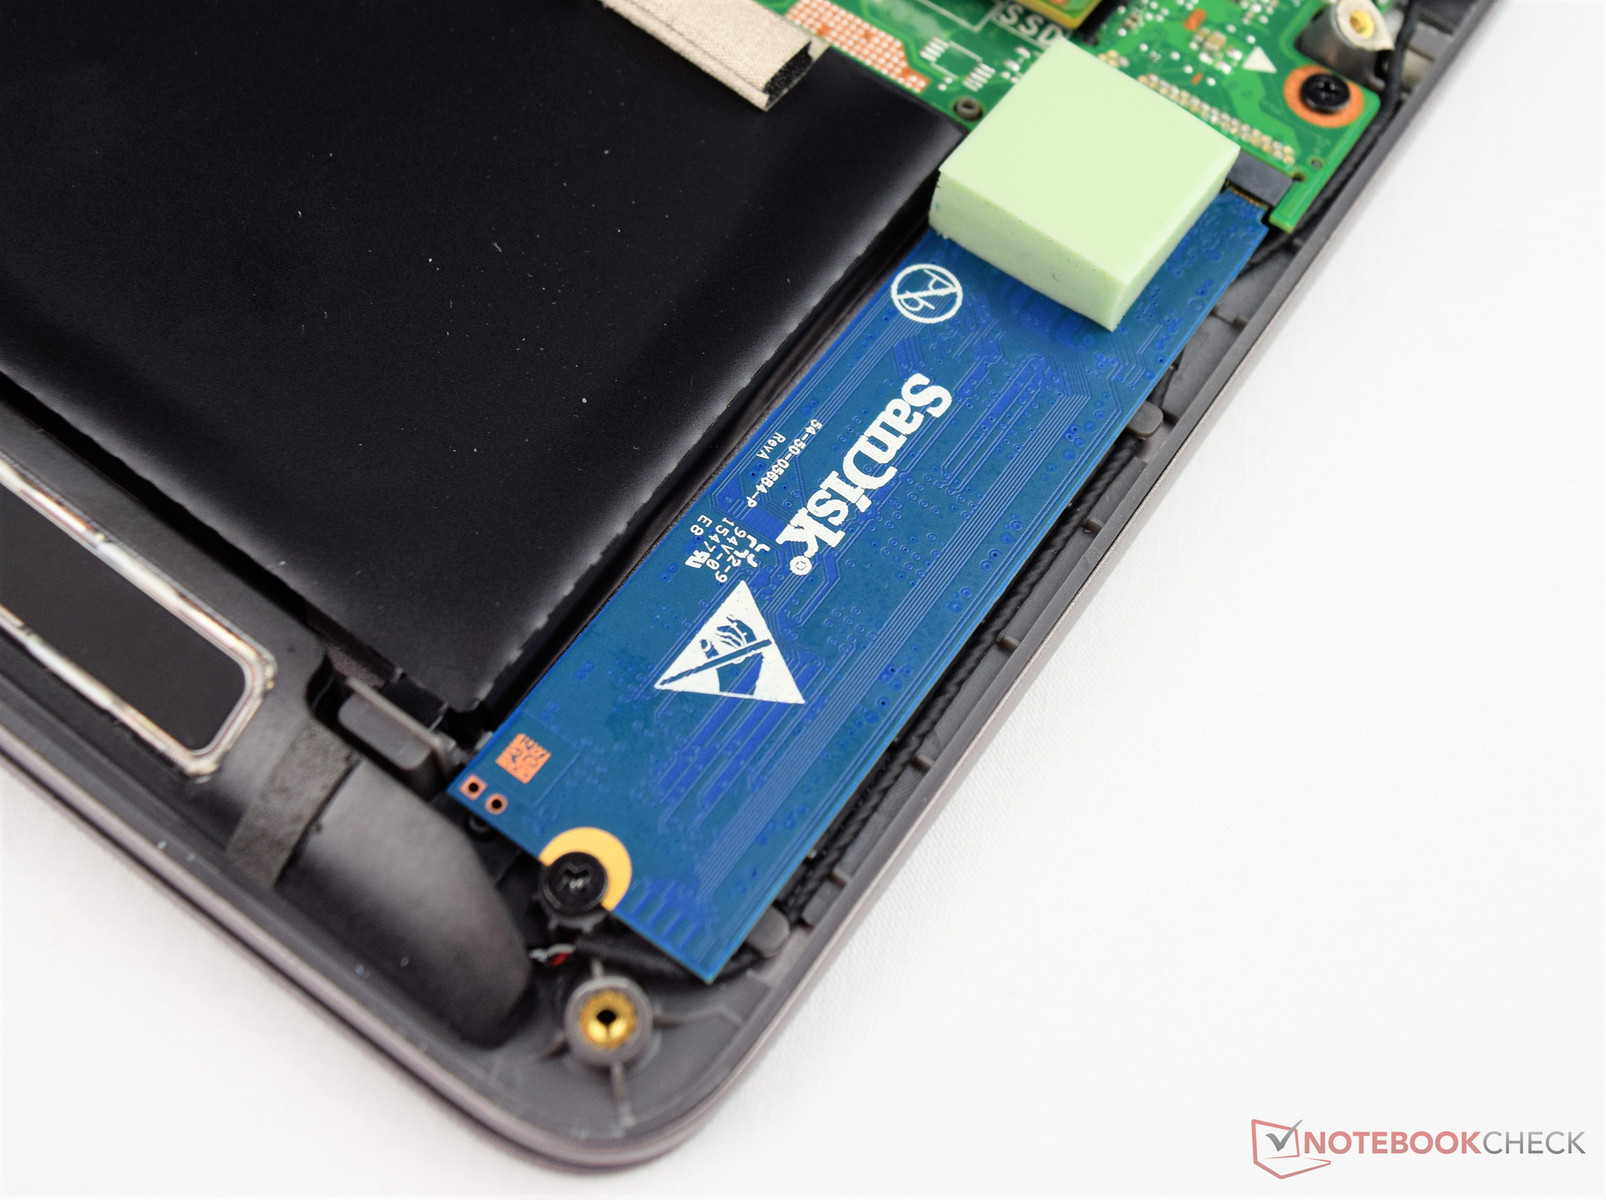
| Asus Zenbook UX310UQ-GL011T SanDisk SD8SNAT256G1002 | Lenovo Yoga 710-14ISK Samsung SSD PM871 MZNLN256HCHP | Xiaomi Mi Notebook Air 13.3 2016 Samsung PM951 NVMe MZVLV256 | Lenovo ThinkPad T460p-20FXS05500 Samsung SSD PM871 MZ7LN512HCHP | HP Pavilion 14-al003ng SanDisk Z400s 256 GB M.2 2280 | |
|---|---|---|---|---|---|
| CrystalDiskMark 3.0 | 42% | 109% | 48% | -6% | |
| Read Seq (MB/s) | 468.1 | 508 9% | 1209 158% | 502 7% | 469.3 0% |
| Write Seq (MB/s) | 319.2 | 302.7 -5% | 314 -2% | 442 38% | 309.1 -3% |
| Read 512 (MB/s) | 318.6 | 419.9 32% | 411.4 29% | ||
| Write 512 (MB/s) | 272.8 | 302.6 11% | 414.3 52% | ||
| Read 4k (MB/s) | 22.03 | 33.3 51% | 43.4 97% | 29.18 32% | 14 -36% |
| Write 4k (MB/s) | 72.1 | 85.8 19% | 153.4 113% | 86.5 20% | 73.9 2% |
| Read 4k QD32 (MB/s) | 147.4 | 395.8 169% | 487.6 231% | 358.1 143% | 149.5 1% |
| Write 4k QD32 (MB/s) | 200.2 | 294.3 47% | 312.2 56% | 319.8 60% | 204.6 2% |

| 3DMark | |
| 1280x720 Cloud Gate Standard Graphics | |
| Xiaomi Mi Notebook Air 13.3 2016 | |
| Lenovo ThinkPad T460p-20FXS05500 | |
| Lenovo Yoga 710-14ISK | |
| Asus Zenbook UX310UQ-GL011T | |
| 1920x1080 Fire Strike Graphics | |
| Xiaomi Mi Notebook Air 13.3 2016 | |
| Lenovo ThinkPad T460p-20FXS05500 | |
| Asus Zenbook UX310UQ-GL011T | |
| Lenovo Yoga 710-14ISK | |
| 1280x720 Ice Storm Standard Graphics | |
| Asus Zenbook UX310UQ-GL011T | |
| Lenovo Yoga 710-14ISK | |
| Lenovo ThinkPad T460p-20FXS05500 | |
| 3DMark 11 | |
| 1280x720 Performance GPU | |
| Lenovo ThinkPad T460p-20FXS05500 | |
| HP Pavilion 14-al003ng | |
| Xiaomi Mi Notebook Air 13.3 2016 | |
| Asus Zenbook UX310UQ-GL011T | |
| Lenovo Yoga 710-14ISK | |
| 1280x720 Performance | |
| Lenovo ThinkPad T460p-20FXS05500 | |
| Xiaomi Mi Notebook Air 13.3 2016 | |
| HP Pavilion 14-al003ng | |
| Asus Zenbook UX310UQ-GL011T | |
| Lenovo Yoga 710-14ISK | |
| 3DMark 06 - 1280x1024 Standard Score AA:0x AF:0x | |
| Lenovo ThinkPad T460p-20FXS05500 | |
| Lenovo Yoga 710-14ISK | |
| Asus Zenbook UX310UQ-GL011T | |
| 3DMark 2001SE Standard | 28793 points | |
| 3DMark 03 Standard | 28408 points | |
| 3DMark 05 Standard | 20654 points | |
| 3DMark 06 Standard Score | 10351 points | |
| 3DMark 11 Performance | 2424 points | |
| 3DMark Ice Storm Standard Score | 44072 points | |
| 3DMark Cloud Gate Standard Score | 6264 points | |
| 3DMark Fire Strike Score | 1394 points | |
| 3DMark Fire Strike Extreme Score | 716 points | |
| 3DMark Time Spy Score | 514 points | |
Help | ||
| low | med. | high | ultra | |
|---|---|---|---|---|
| BioShock Infinite (2013) | 85.9 | 48.7 | 39.4 | 13.3 |
| Battlefield 4 (2013) | 67.2 | 43.8 | 29.1 | 10.7 |
| The Witcher 3 (2015) | 24 | 16.3 | 8.7 | 5.3 |
Noise level
| Idle |
| 30.5 / 30.5 / 31.5 dB(A) |
| HDD |
| 30.9 dB(A) |
| Load |
| 36.2 / 40 dB(A) |
 | ||
30 dB silent 40 dB(A) audible 50 dB(A) loud |
||
min: | ||
| Asus Zenbook UX310UQ-GL011T Intel Core i7-6500U, GeForce 940MX | Lenovo Yoga 710-14ISK Intel Core i5-6200U, GeForce 940MX | Xiaomi Mi Notebook Air 13.3 2016 Intel Core i5-6200U, GeForce 940MX | Lenovo ThinkPad T460p-20FXS05500 Intel Core i7-6700HQ, GeForce 940MX | HP Pavilion 14-al003ng Intel Core i5-6200U, GeForce 940MX | |
|---|---|---|---|---|---|
| Noise | -7% | -3% | 5% | -0% | |
| off / environment * (dB) | 30.5 | 32.2 -6% | 31.15 -2% | 29.2 4% | 28.9 5% |
| Idle Minimum * (dB) | 30.5 | 32.5 -7% | 31.15 -2% | 29.2 4% | 29.2 4% |
| Idle Average * (dB) | 30.5 | 34.6 -13% | 31.15 -2% | 29.2 4% | 29.2 4% |
| Idle Maximum * (dB) | 31.5 | 34.6 -10% | 31.15 1% | 29.2 7% | 30.8 2% |
| Load Average * (dB) | 36.2 | 38.7 -7% | 38.2 -6% | 33.5 7% | 38 -5% |
| Load Maximum * (dB) | 40 | 39.9 -0% | 41.7 -4% | 38.8 3% | 44.3 -11% |
* ... smaller is better
| Asus Zenbook UX310UQ-GL011T GeForce 940MX, 6500U, SanDisk SD8SNAT256G1002 | Lenovo Yoga 710-14ISK GeForce 940MX, 6200U, Samsung SSD PM871 MZNLN256HCHP | Xiaomi Mi Notebook Air 13.3 2016 GeForce 940MX, 6200U, Samsung PM951 NVMe MZVLV256 | Lenovo ThinkPad T460p-20FXS05500 GeForce 940MX, 6700HQ, Samsung SSD PM871 MZ7LN512HCHP | HP Pavilion 14-al003ng GeForce 940MX, 6200U, SanDisk Z400s 256 GB M.2 2280 | |
|---|---|---|---|---|---|
| Heat | -13% | -12% | -32% | -21% | |
| Maximum Upper Side * (°C) | 38.5 | 43.4 -13% | 51 -32% | 51.6 -34% | 44.1 -15% |
| Maximum Bottom * (°C) | 40.4 | 43.2 -7% | 47 -16% | 55.2 -37% | 44.9 -11% |
| Idle Upper Side * (°C) | 24.8 | 28 -13% | 24.4 2% | 30.7 -24% | 32.4 -31% |
| Idle Bottom * (°C) | 23.8 | 28.2 -18% | 24.6 -3% | 31.5 -32% | 30.2 -27% |
* ... smaller is better
(+) The maximum temperature on the upper side is 38.5 °C / 101 F, compared to the average of 35.9 °C / 97 F, ranging from 21.4 to 59 °C for the class Subnotebook.
(±) The bottom heats up to a maximum of 40.4 °C / 105 F, compared to the average of 39.2 °C / 103 F
(+) In idle usage, the average temperature for the upper side is 23.6 °C / 74 F, compared to the device average of 30.8 °C / 87 F.
(+) The palmrests and touchpad are cooler than skin temperature with a maximum of 27.7 °C / 81.9 F and are therefore cool to the touch.
(±) The average temperature of the palmrest area of similar devices was 28.2 °C / 82.8 F (+0.5 °C / 0.9 F).
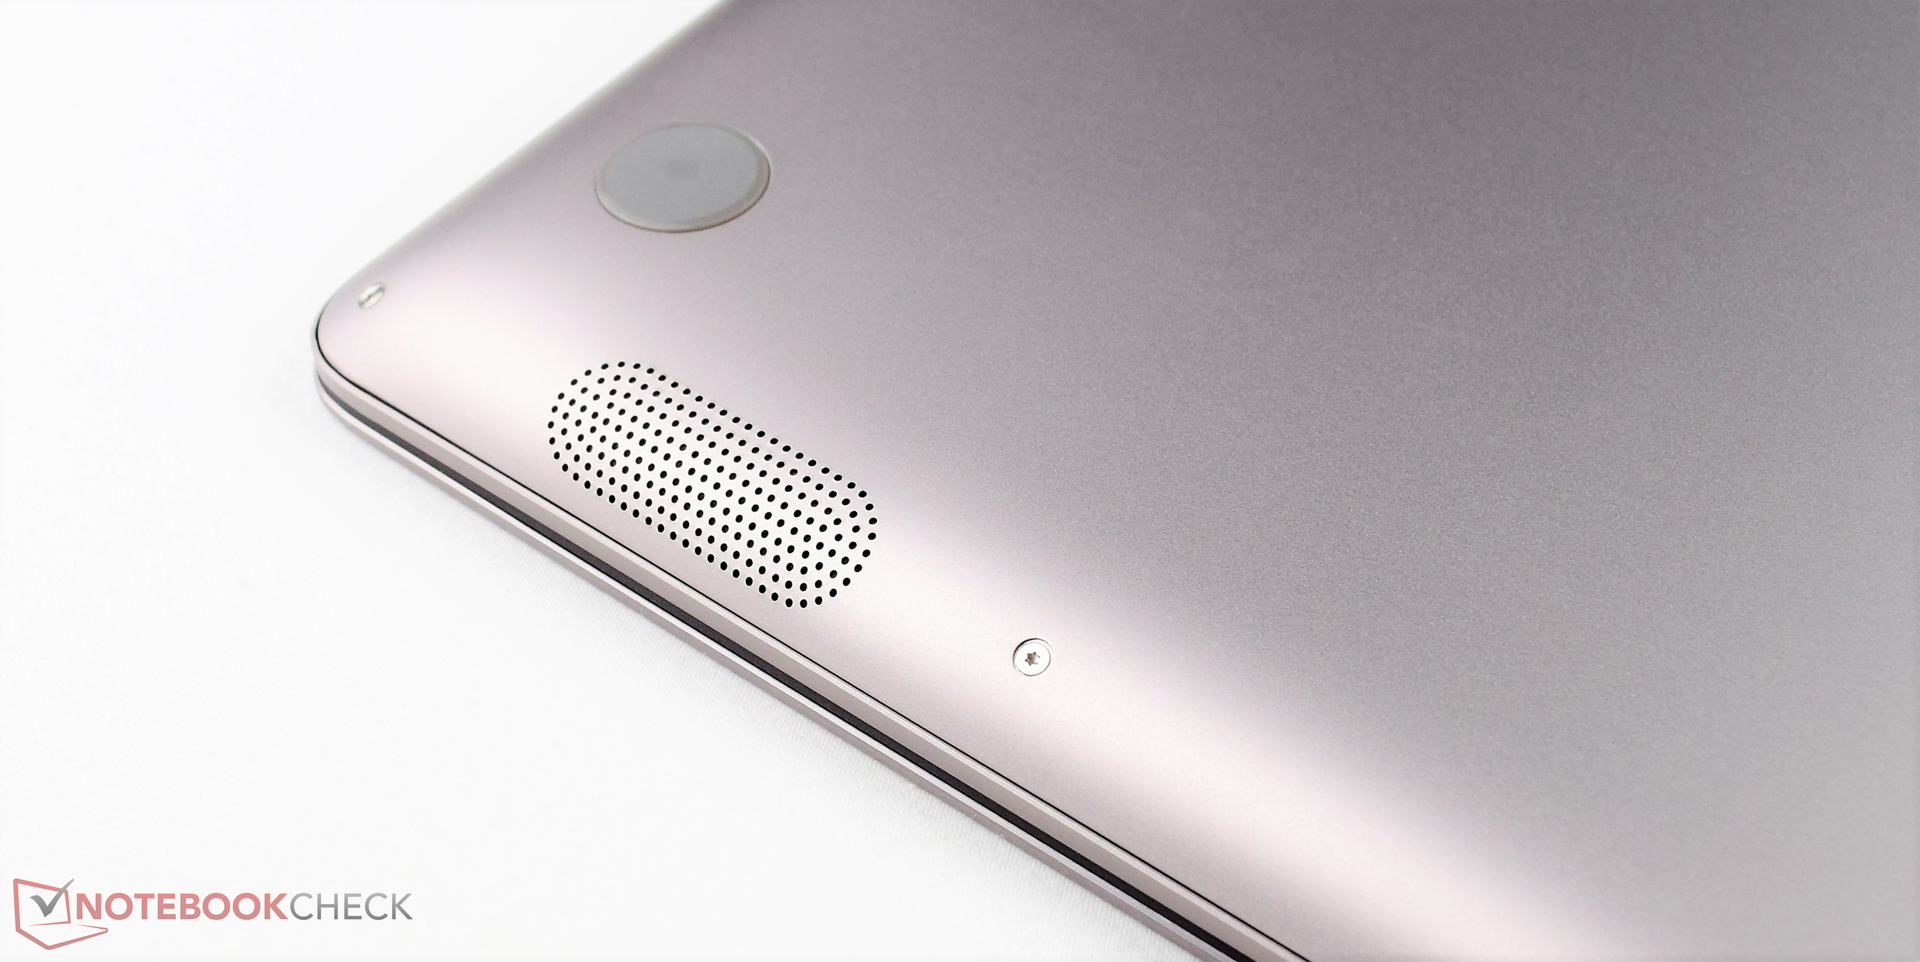
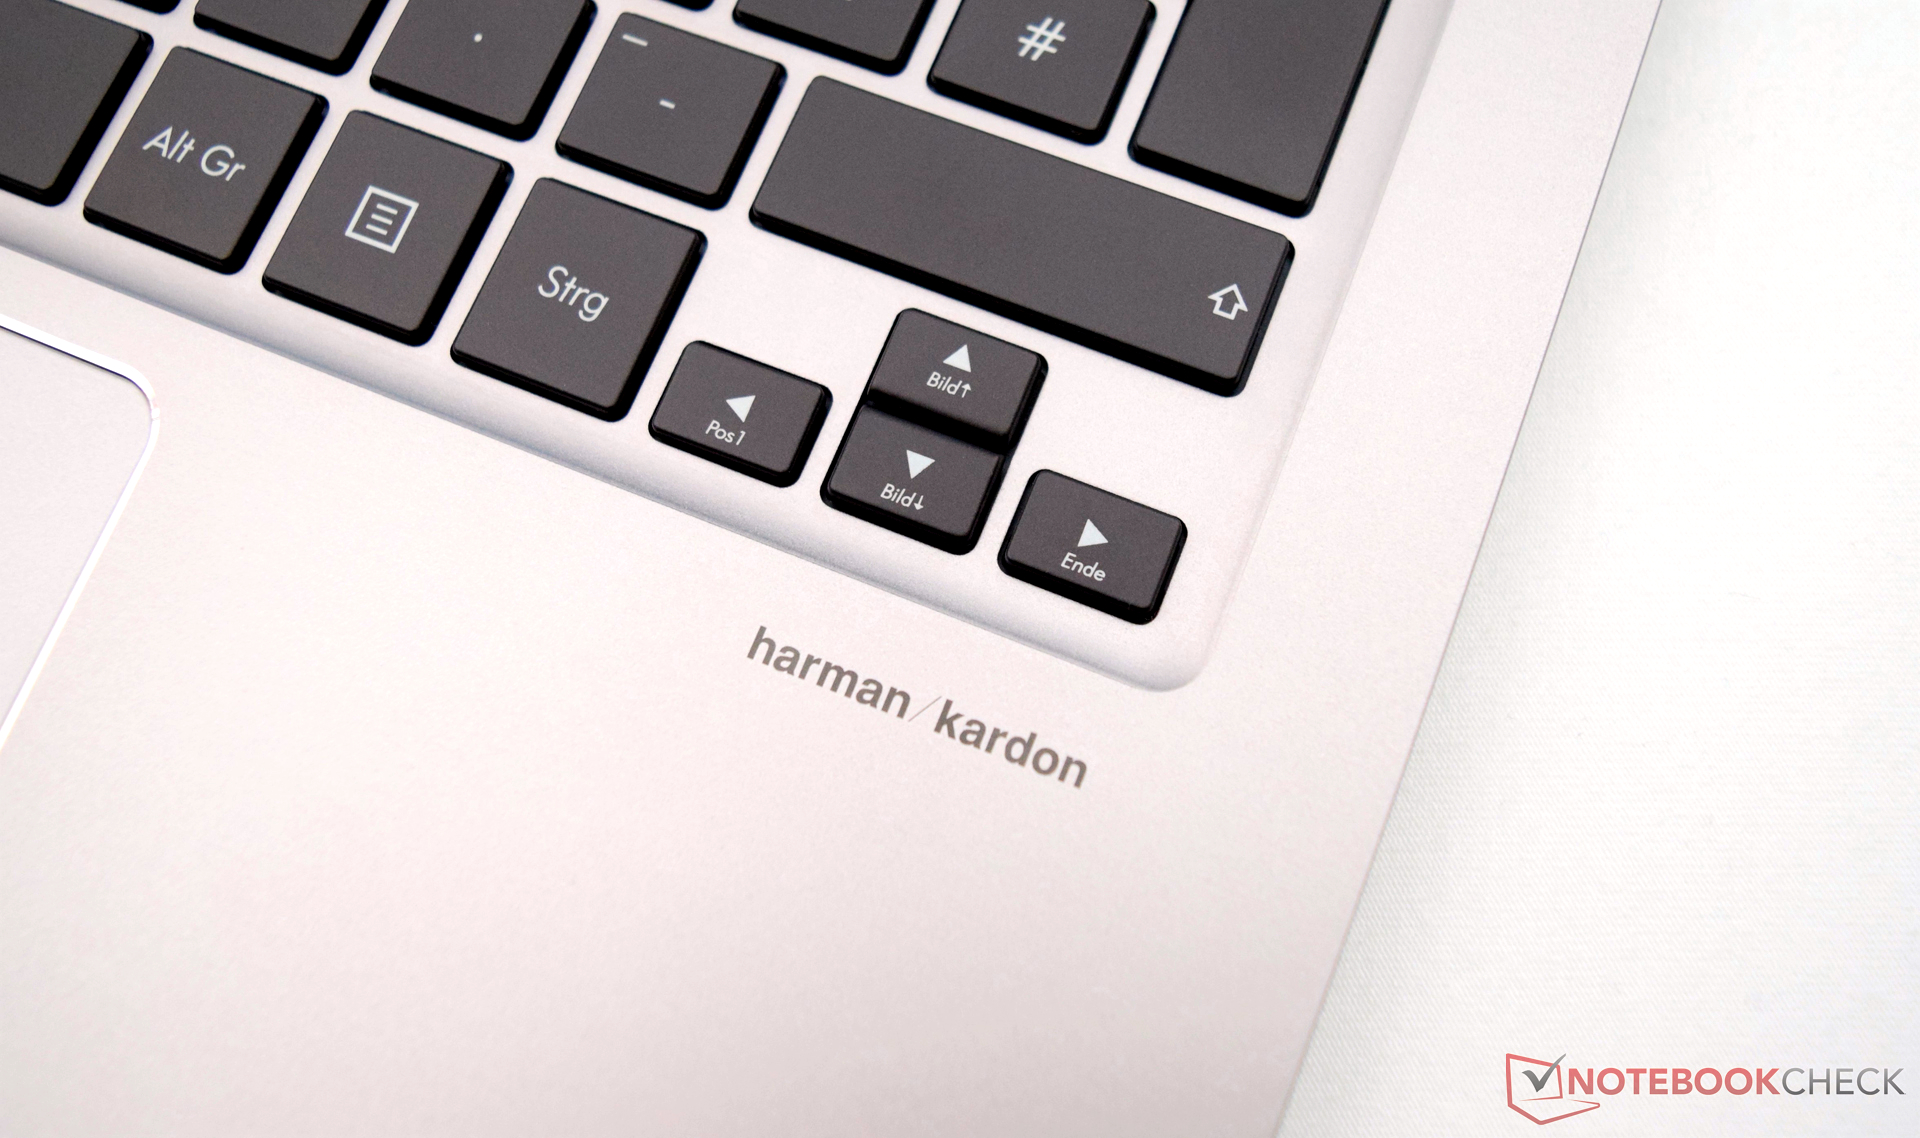
Asus Zenbook UX310UQ-GL011T audio analysis
(±) | speaker loudness is average but good (73 dB)
Bass 100 - 315 Hz
(-) | nearly no bass - on average 20.4% lower than median
(±) | linearity of bass is average (10.6% delta to prev. frequency)
Mids 400 - 2000 Hz
(+) | balanced mids - only 2.5% away from median
(+) | mids are linear (3.1% delta to prev. frequency)
Highs 2 - 16 kHz
(±) | higher highs - on average 6.3% higher than median
(+) | highs are linear (2.3% delta to prev. frequency)
Overall 100 - 16.000 Hz
(±) | linearity of overall sound is average (19.3% difference to median)
Compared to same class
» 59% of all tested devices in this class were better, 7% similar, 34% worse
» The best had a delta of 5%, average was 18%, worst was 53%
Compared to all devices tested
» 47% of all tested devices were better, 8% similar, 46% worse
» The best had a delta of 4%, average was 24%, worst was 134%
Apple MacBook 12 (Early 2016) 1.1 GHz audio analysis
(+) | speakers can play relatively loud (83.6 dB)
Bass 100 - 315 Hz
(±) | reduced bass - on average 11.3% lower than median
(±) | linearity of bass is average (14.2% delta to prev. frequency)
Mids 400 - 2000 Hz
(+) | balanced mids - only 2.4% away from median
(+) | mids are linear (5.5% delta to prev. frequency)
Highs 2 - 16 kHz
(+) | balanced highs - only 2% away from median
(+) | highs are linear (4.5% delta to prev. frequency)
Overall 100 - 16.000 Hz
(+) | overall sound is linear (10.2% difference to median)
Compared to same class
» 7% of all tested devices in this class were better, 2% similar, 91% worse
» The best had a delta of 5%, average was 18%, worst was 53%
Compared to all devices tested
» 5% of all tested devices were better, 1% similar, 94% worse
» The best had a delta of 4%, average was 24%, worst was 134%
| Off / Standby | |
| Idle | |
| Load |
|
Key:
min: | |
| Asus Zenbook UX310UQ-GL011T 6500U, GeForce 940MX, SanDisk SD8SNAT256G1002, TN LED, 1920x1080, 13.3" | Lenovo Yoga 710-14ISK 6200U, GeForce 940MX, Samsung SSD PM871 MZNLN256HCHP, a-Si WLED TFT, IPS, 1920x1080, 14" | Xiaomi Mi Notebook Air 13.3 2016 6200U, GeForce 940MX, Samsung PM951 NVMe MZVLV256, IPS, 1920x1080, 13.3" | Lenovo ThinkPad T460p-20FXS05500 6700HQ, GeForce 940MX, Samsung SSD PM871 MZ7LN512HCHP, IPS-Panel, 2560x1440, 14" | HP Pavilion 14-al003ng 6200U, GeForce 940MX, SanDisk Z400s 256 GB M.2 2280, LED IPS, 1920x1080, 14" | |
|---|---|---|---|---|---|
| Power Consumption | -31% | -6% | -51% | -8% | |
| Idle Minimum * (Watt) | 3 | 4.9 -63% | 4 -33% | 5 -67% | 4 -33% |
| Idle Average * (Watt) | 5.6 | 9.4 -68% | 6.6 -18% | 9.9 -77% | 6.4 -14% |
| Idle Maximum * (Watt) | 6.8 | 10.7 -57% | 7.4 -9% | 10.8 -59% | 7 -3% |
| Load Average * (Watt) | 48.7 | 46 6% | 41.7 14% | 52.4 -8% | 45.5 7% |
| Load Maximum * (Watt) | 63 | 47.2 25% | 52.4 17% | 89.8 -43% | 62.2 1% |
* ... smaller is better
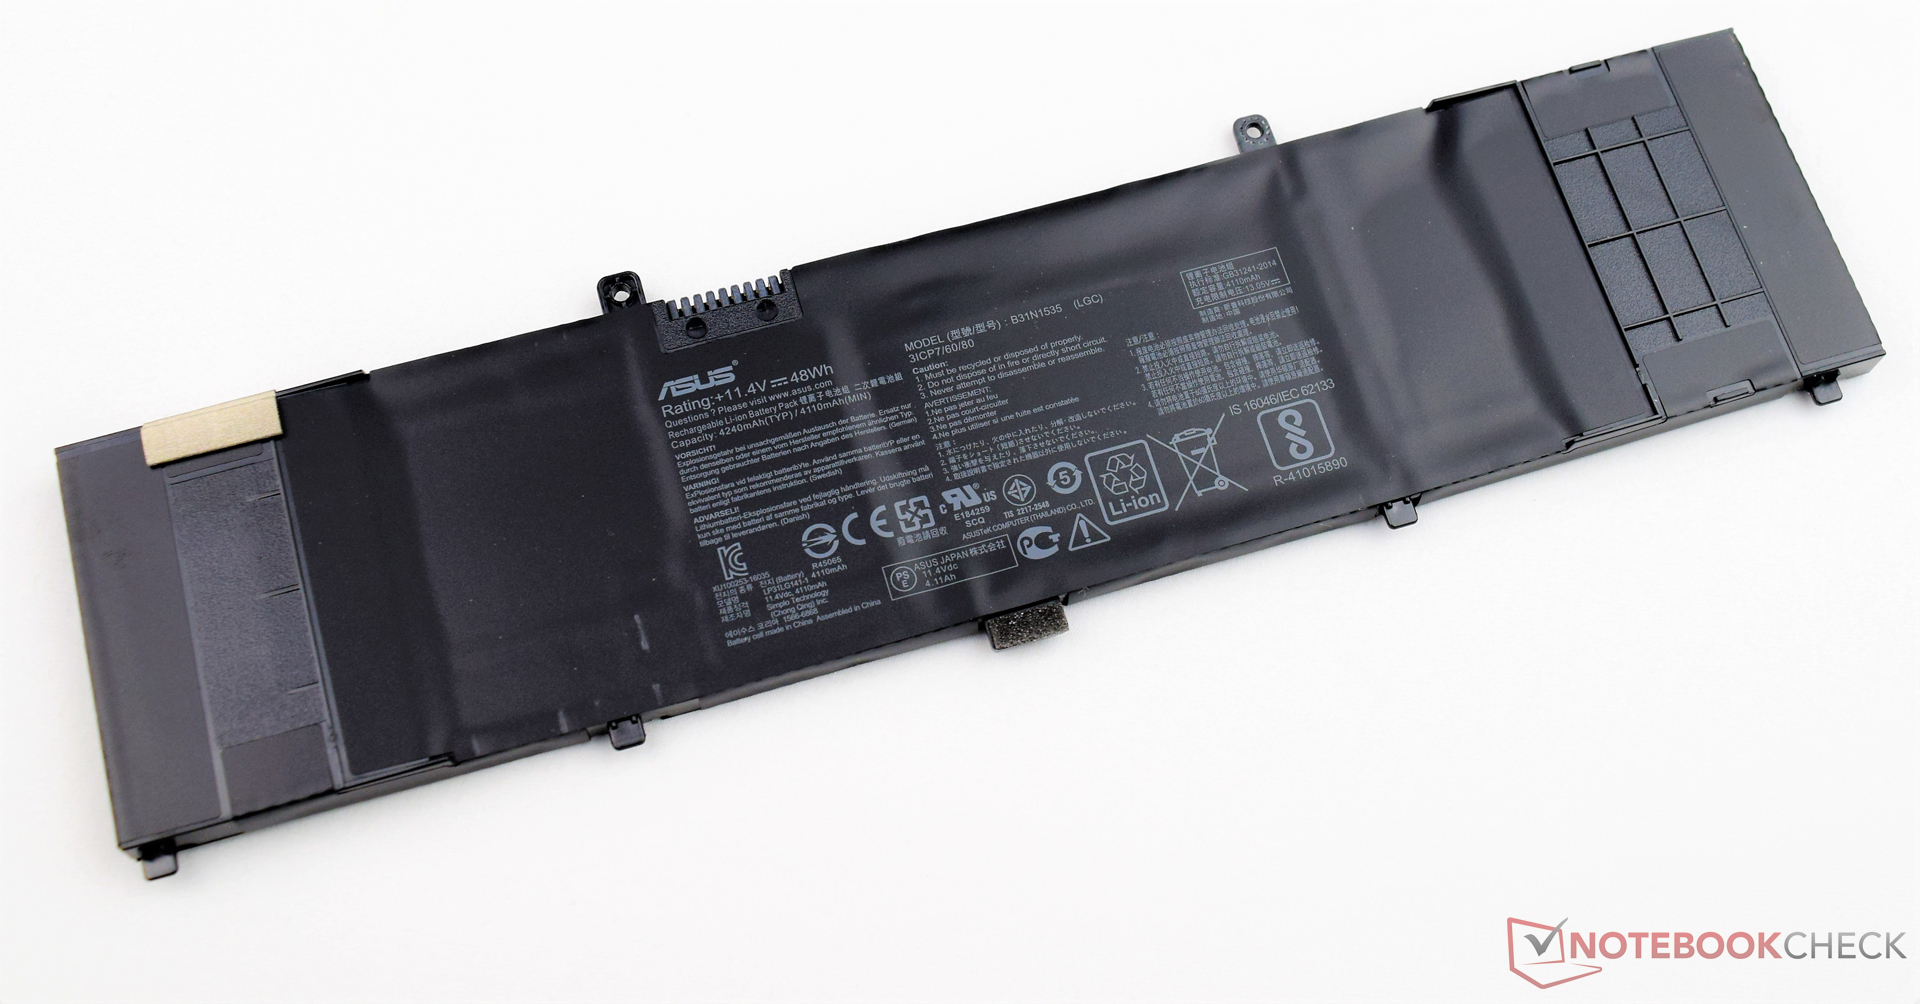
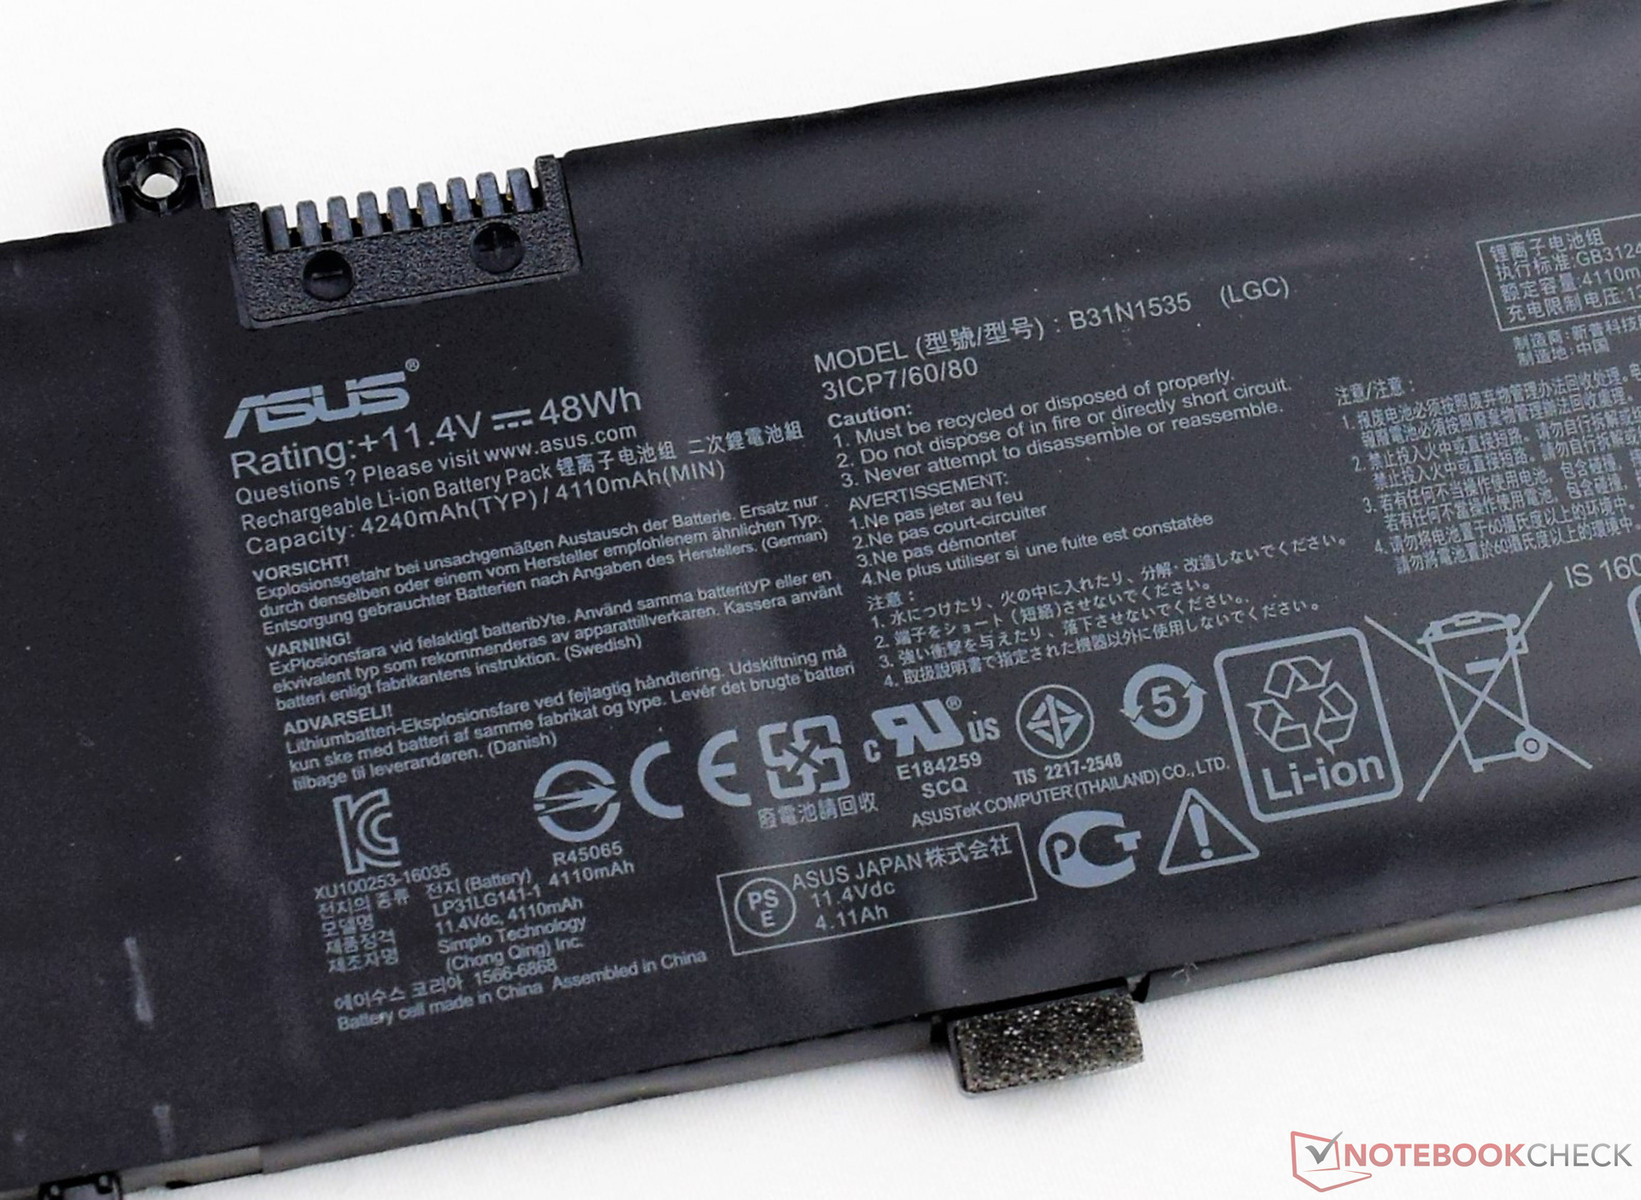

| Asus Zenbook UX310UQ-GL011T 6500U, GeForce 940MX, 48 Wh | Lenovo Yoga 710-14ISK 6200U, GeForce 940MX, 53 Wh | Xiaomi Mi Notebook Air 13.3 2016 6200U, GeForce 940MX, 40 Wh | Lenovo ThinkPad T460p-20FXS05500 6700HQ, GeForce 940MX, 48 Wh | HP Pavilion 14-al003ng 6200U, GeForce 940MX, 41 Wh | |
|---|---|---|---|---|---|
| Battery runtime | 12% | -14% | -30% | -32% | |
| Reader / Idle (h) | 14.6 | 16 10% | 12 -18% | 11 -25% | |
| H.264 (h) | 7 | 7.1 1% | 7.1 1% | 6 -14% | |
| WiFi v1.3 (h) | 8.1 | 7.2 -11% | 6.5 -20% | 5 -38% | 5.5 -32% |
| Load (h) | 1.7 | 2.5 47% | 1.4 -18% | 1 -41% |
Pros
Cons
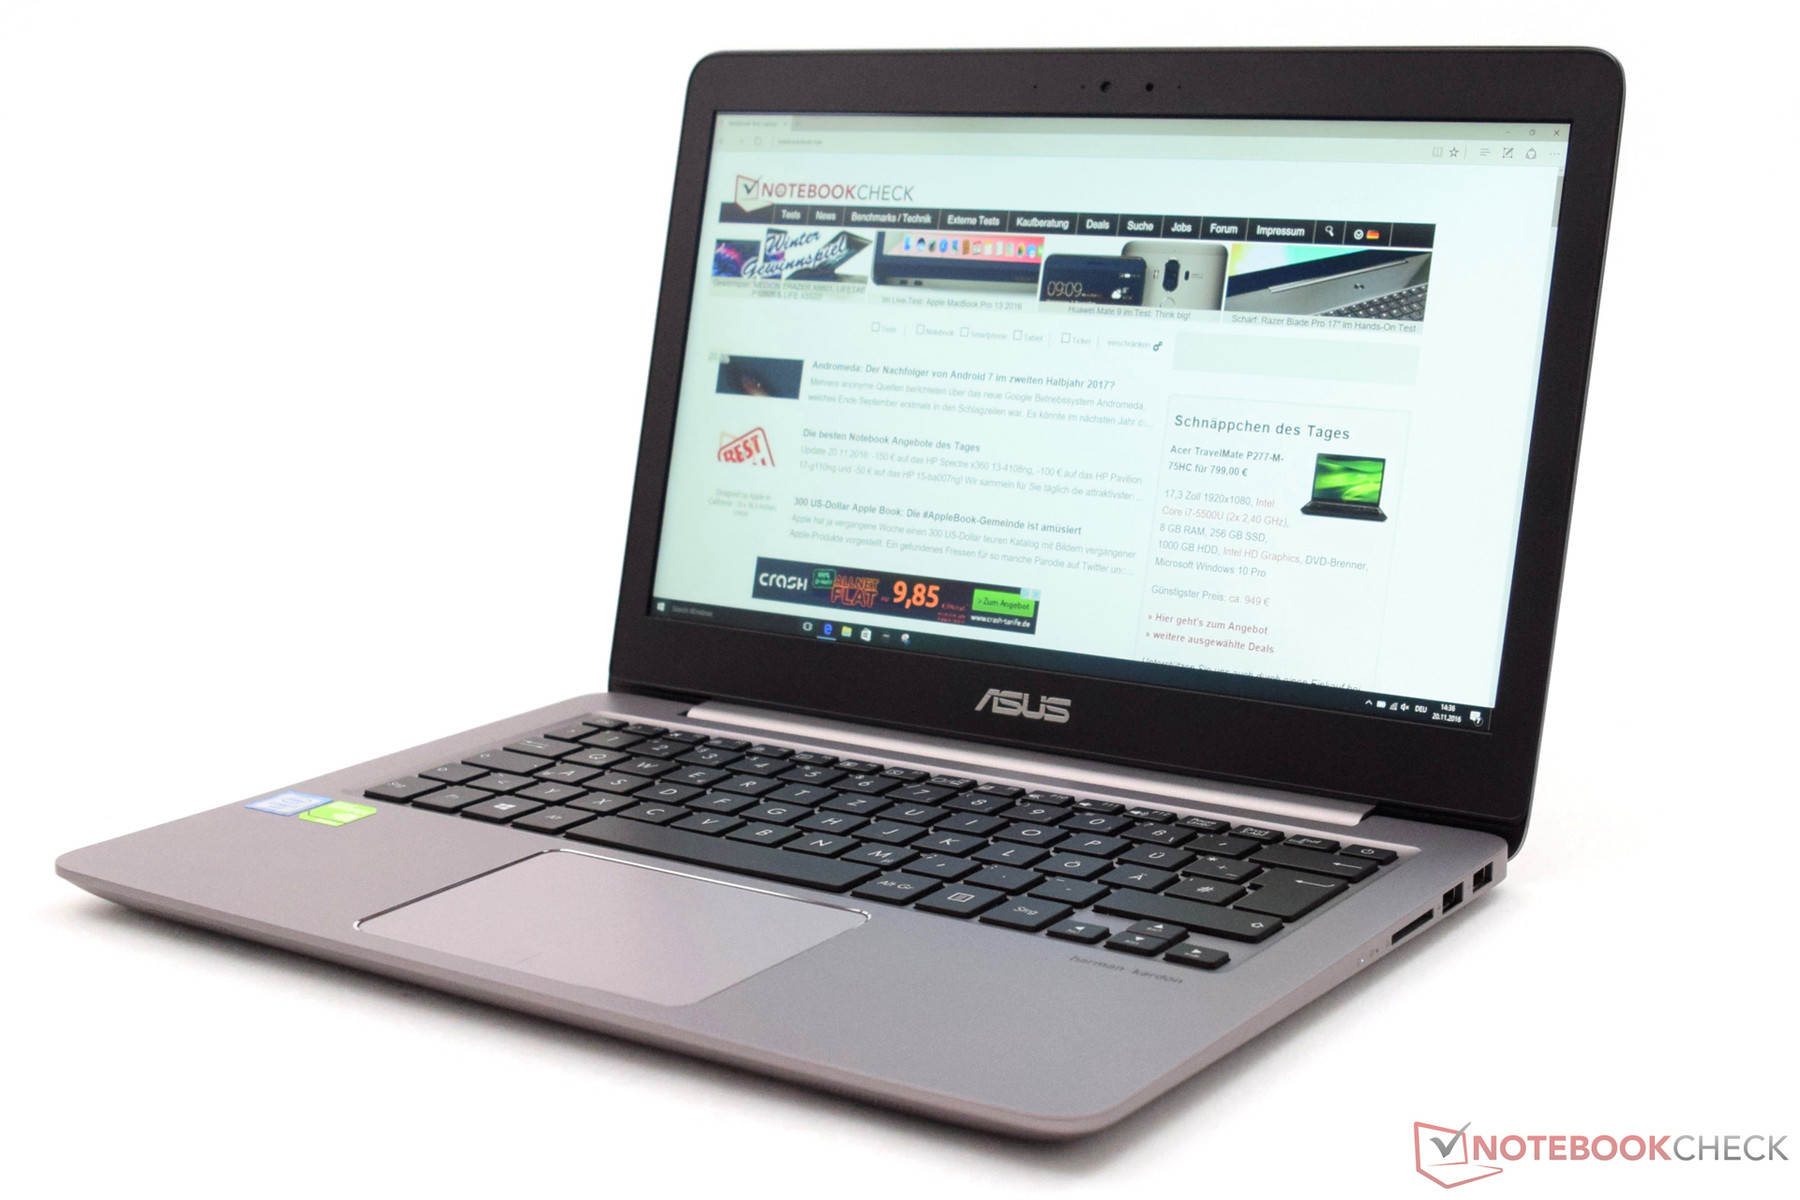
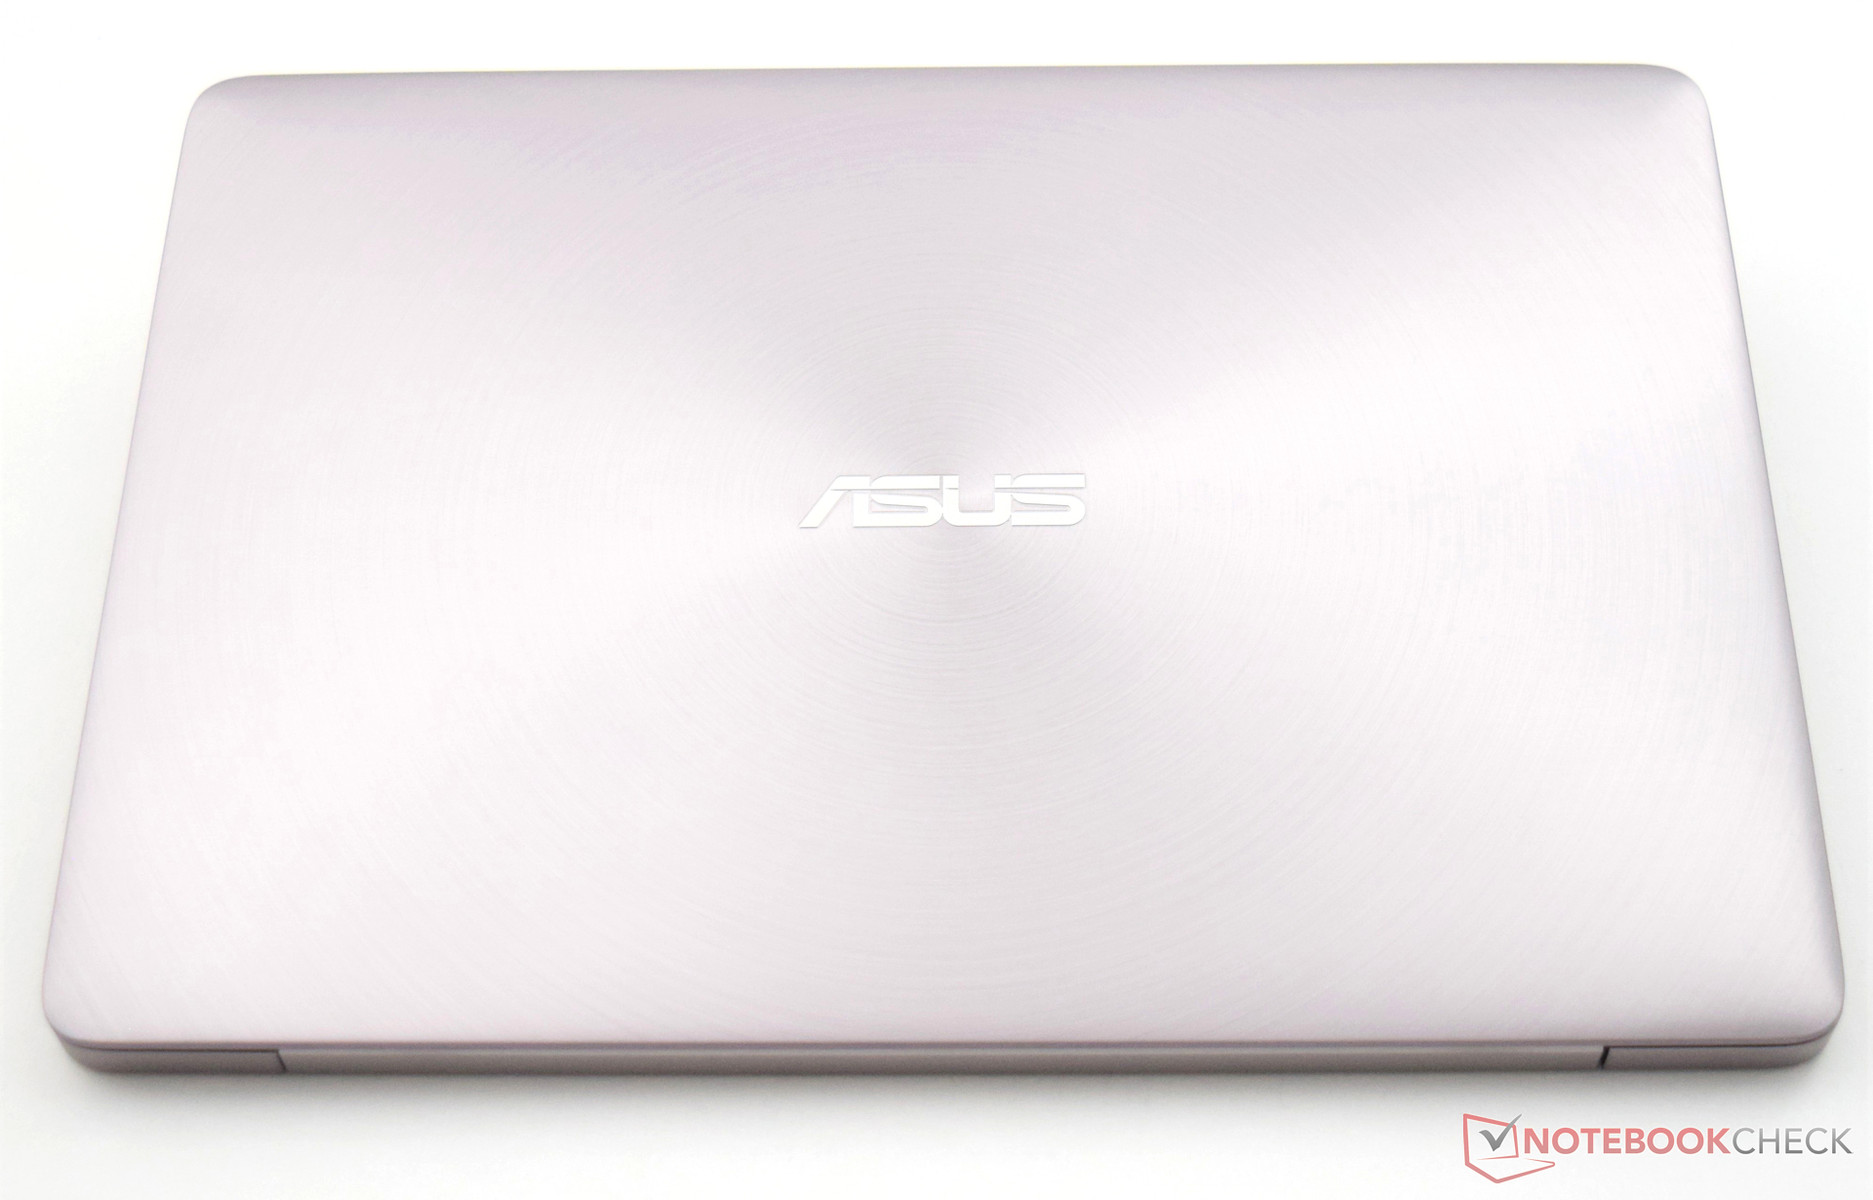
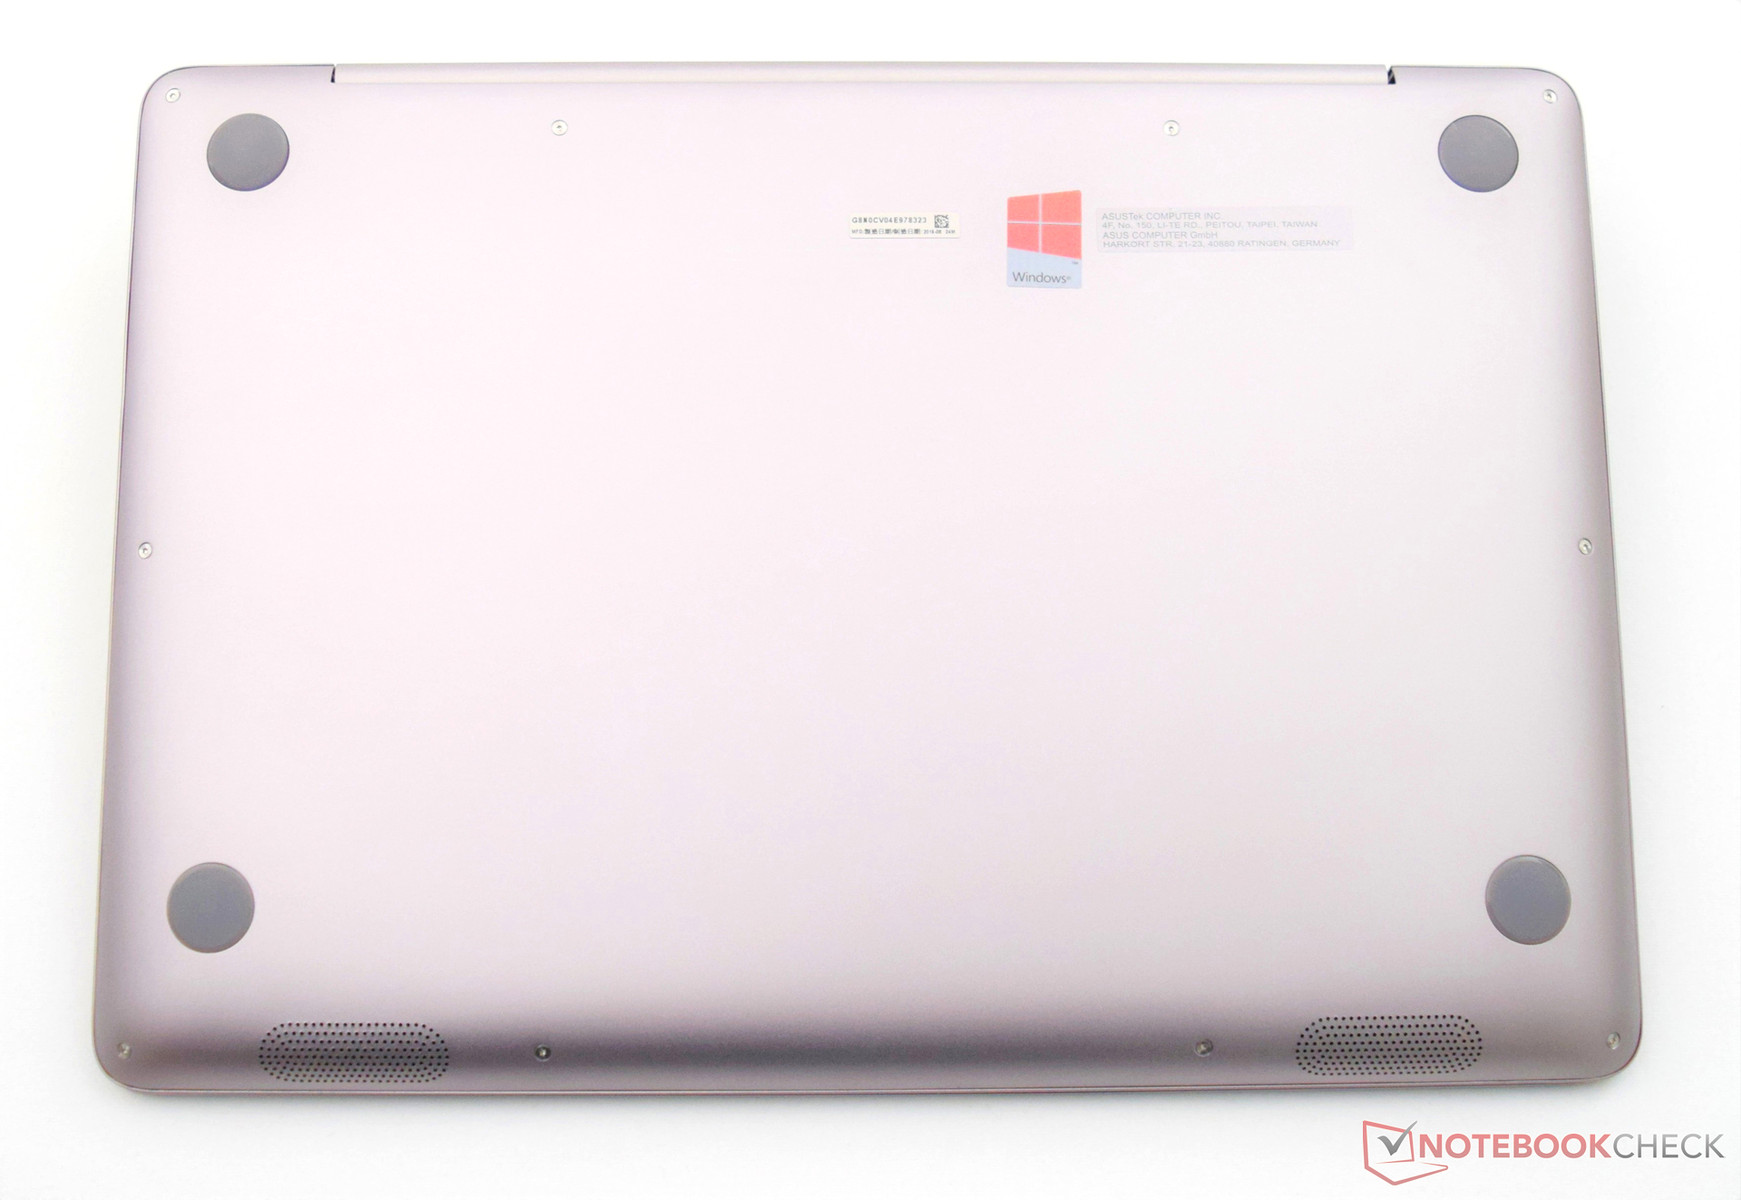
华硕的Zenbook系列向来以轻盈便携闻名,我们也完全认同这台华硕UX310UQ很好地延续了这个优势。Zenbook UX310UQ是华硕带来的一台续航能力很强的亚笔记本电脑,它采用了高端材质,机身品质优良。我们的测试机配置售价约1200欧元(约8752人民币),提供了优秀的系统性能和很长的电池续航。
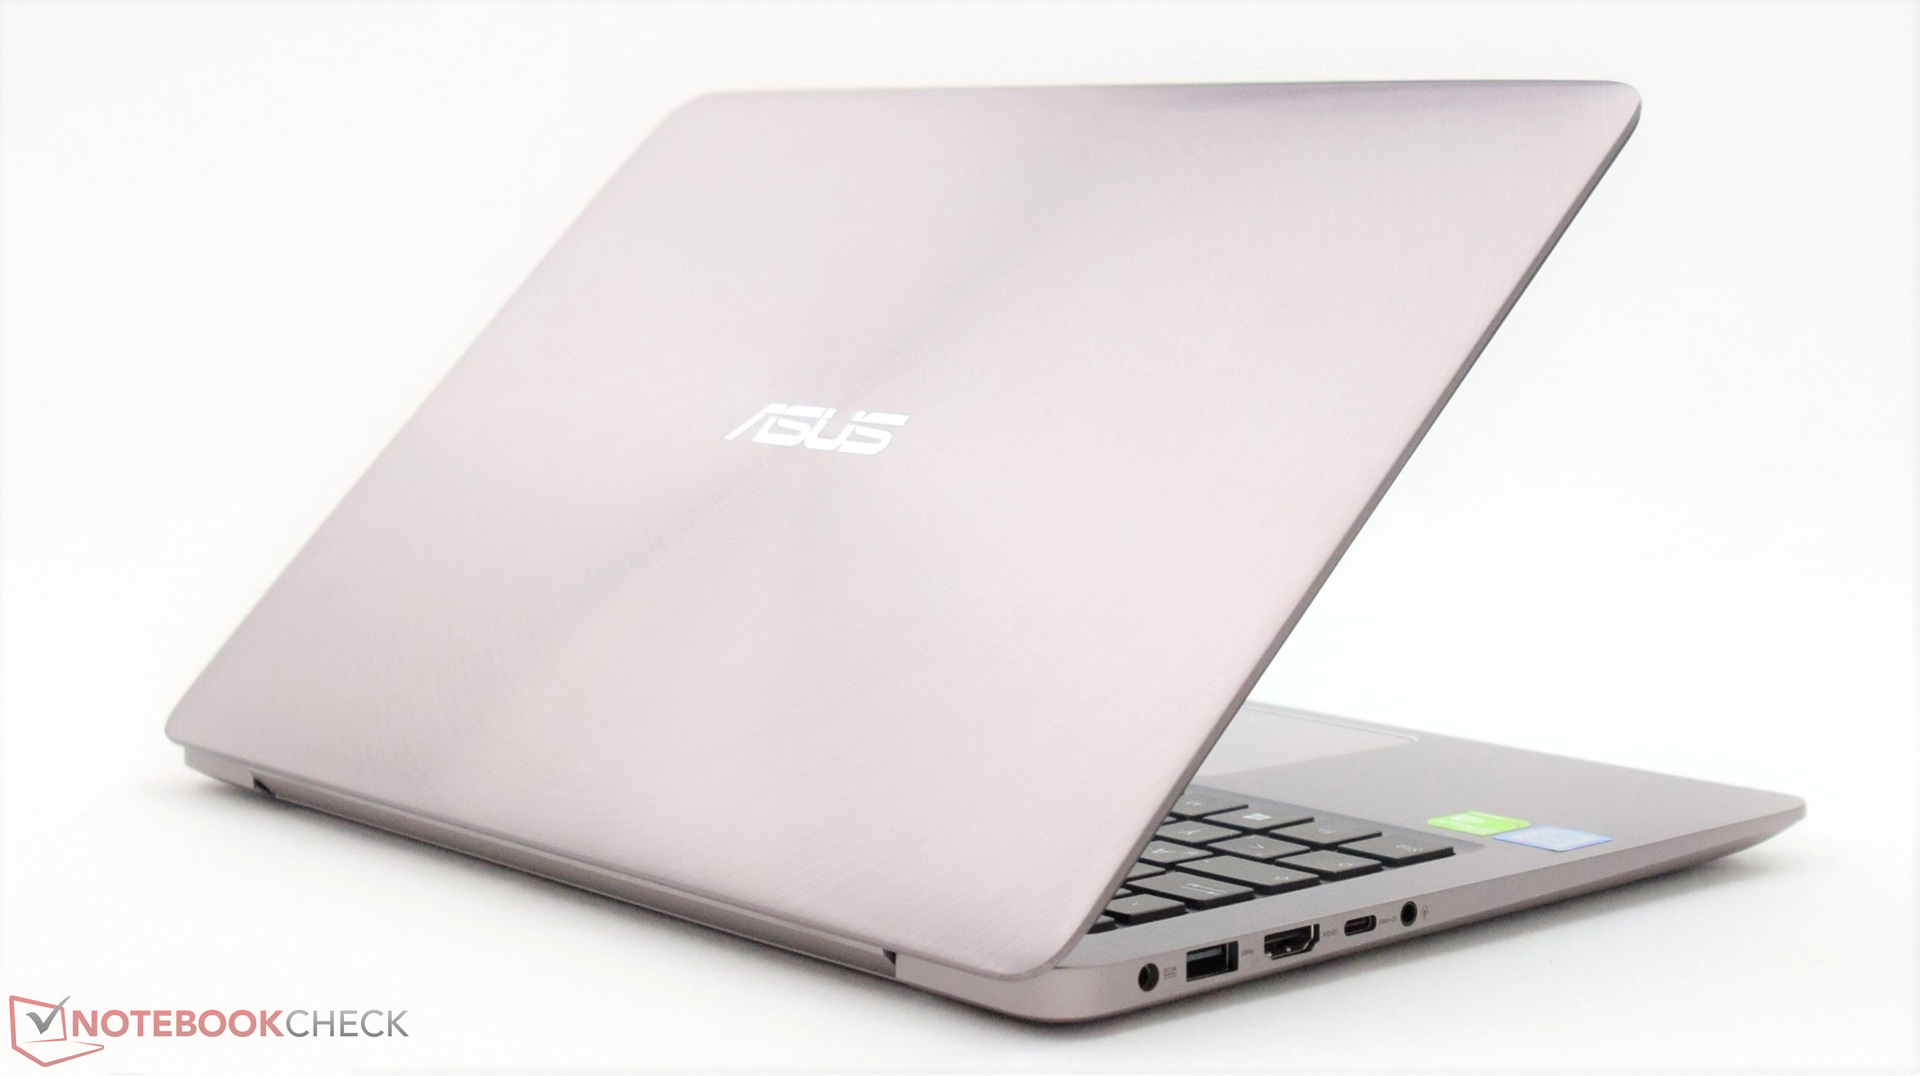
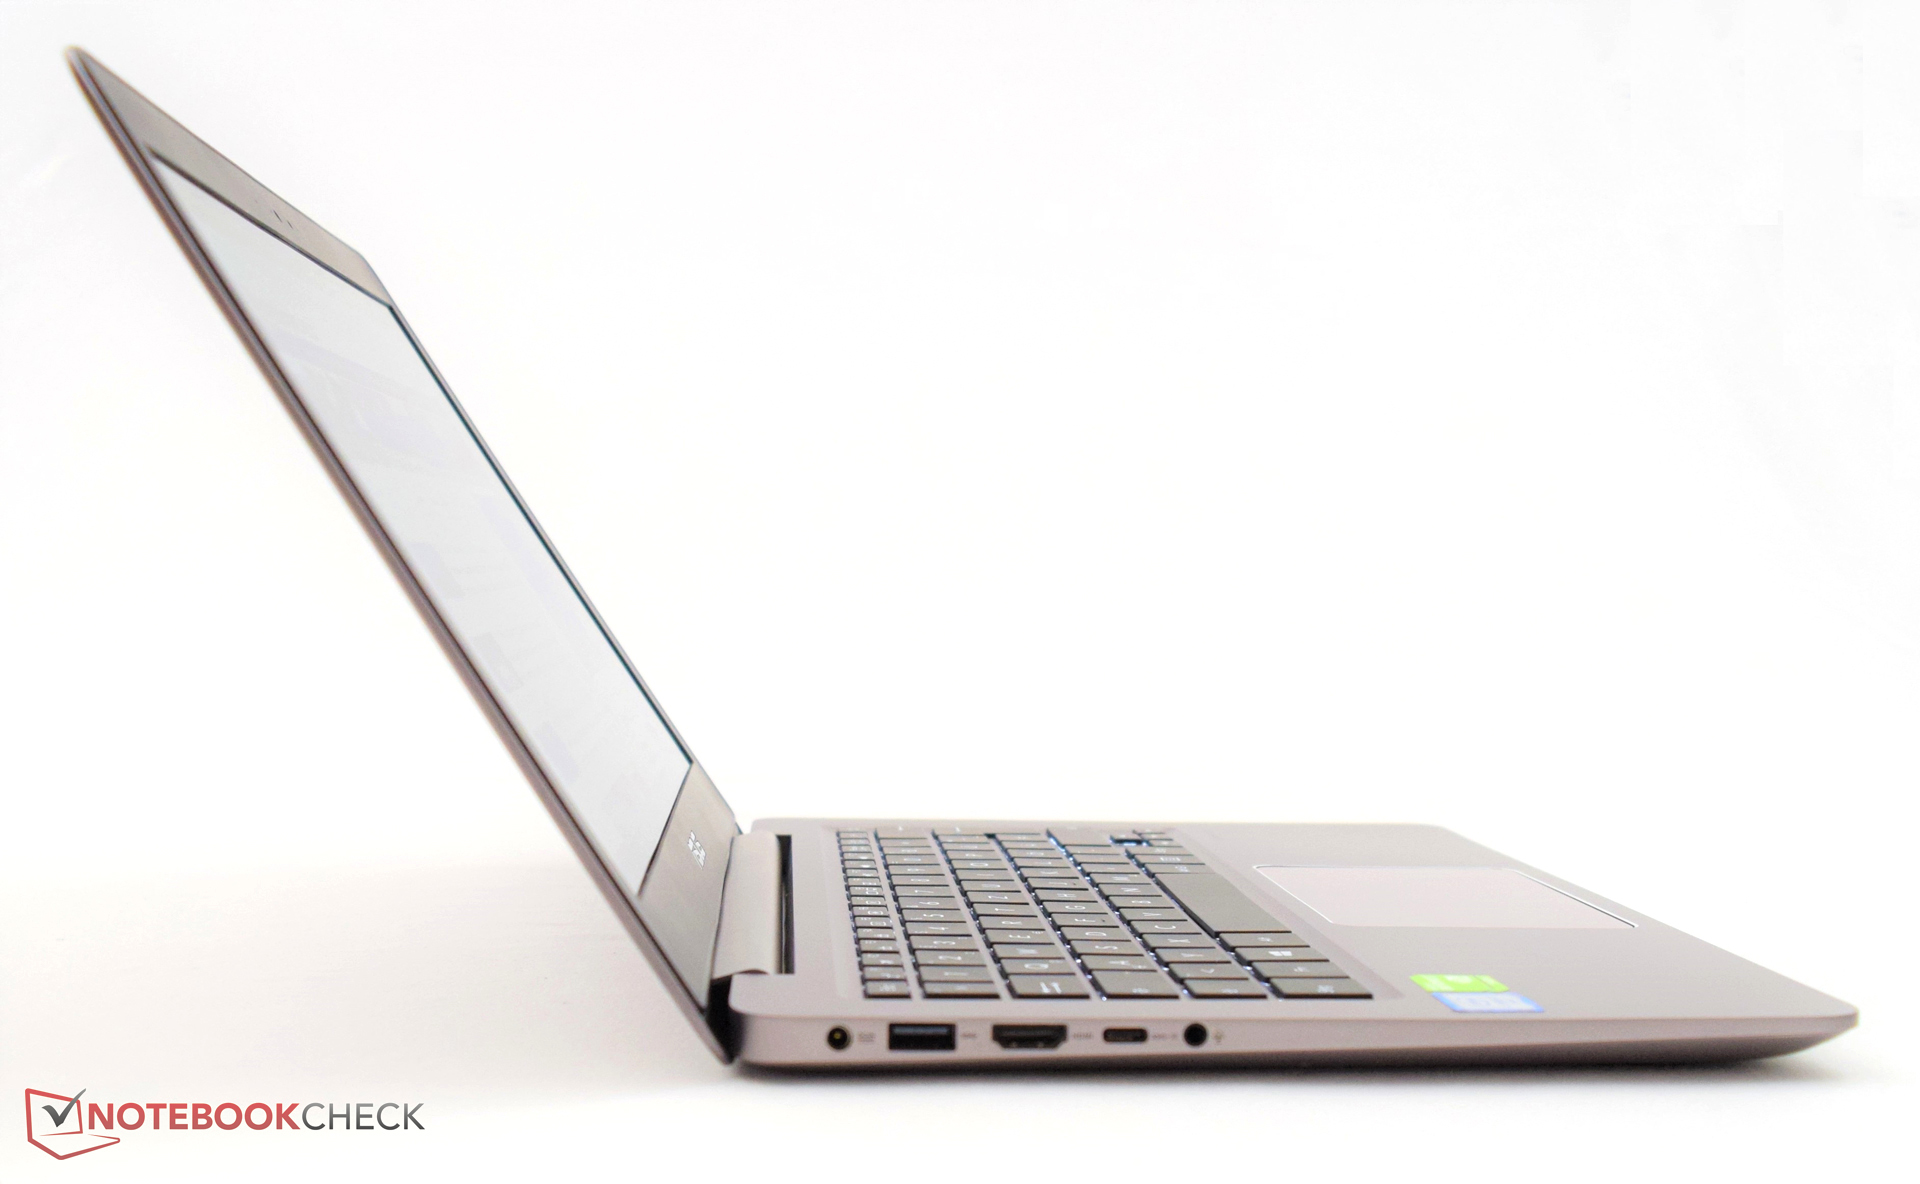
第一眼看上去华硕Zenbook UX310UQ显得十分高端。较轻的重量和长续航时间也让这台设备十分适合日常便携使用。这台雅致的设备需要用户拿出1200欧元(约8752人民币)的预算。
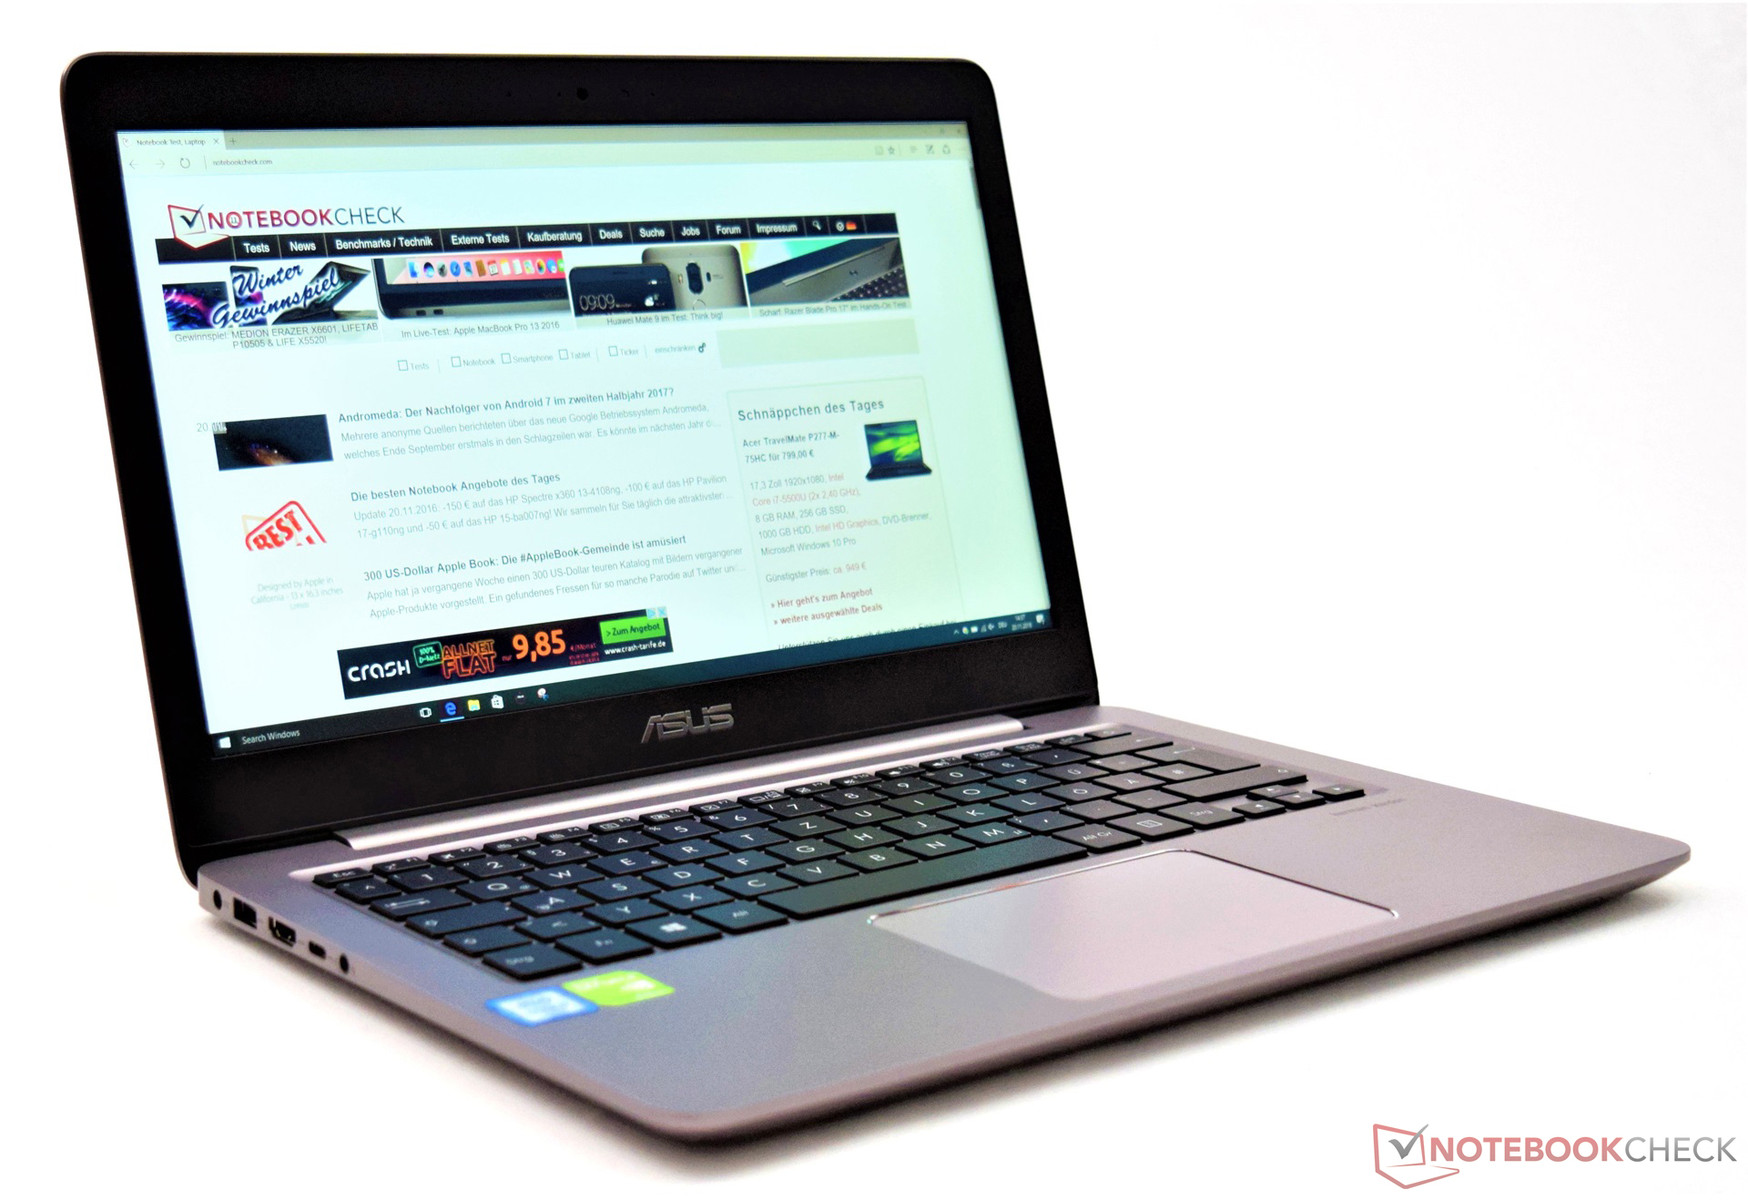
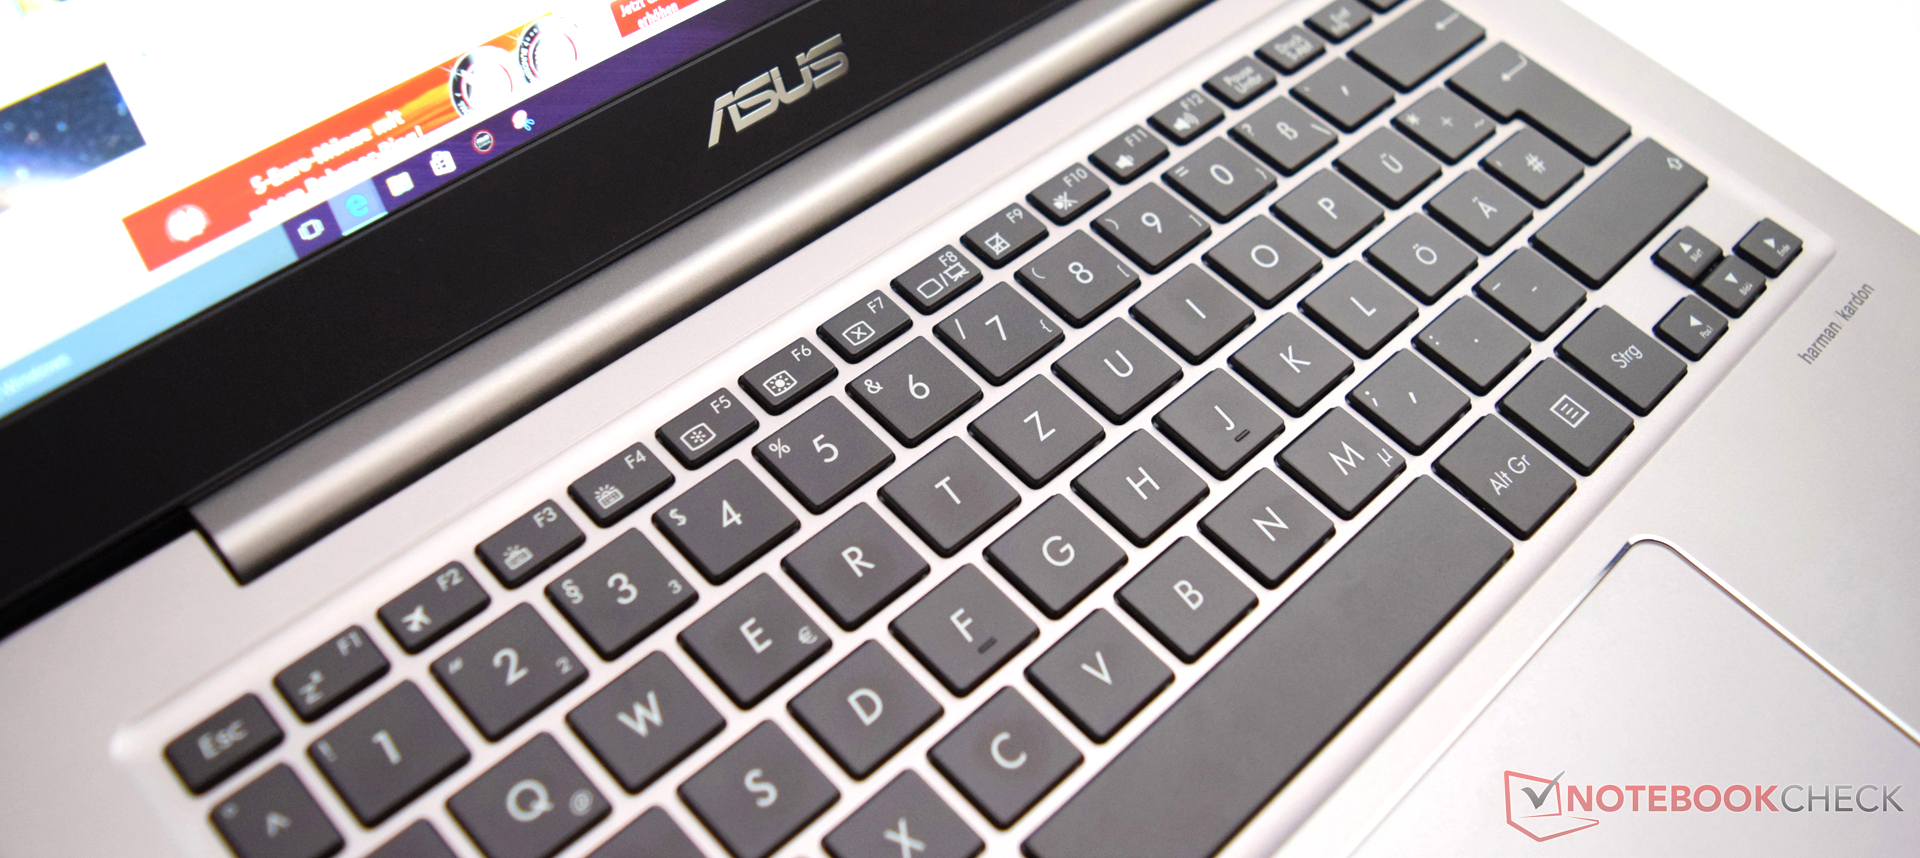
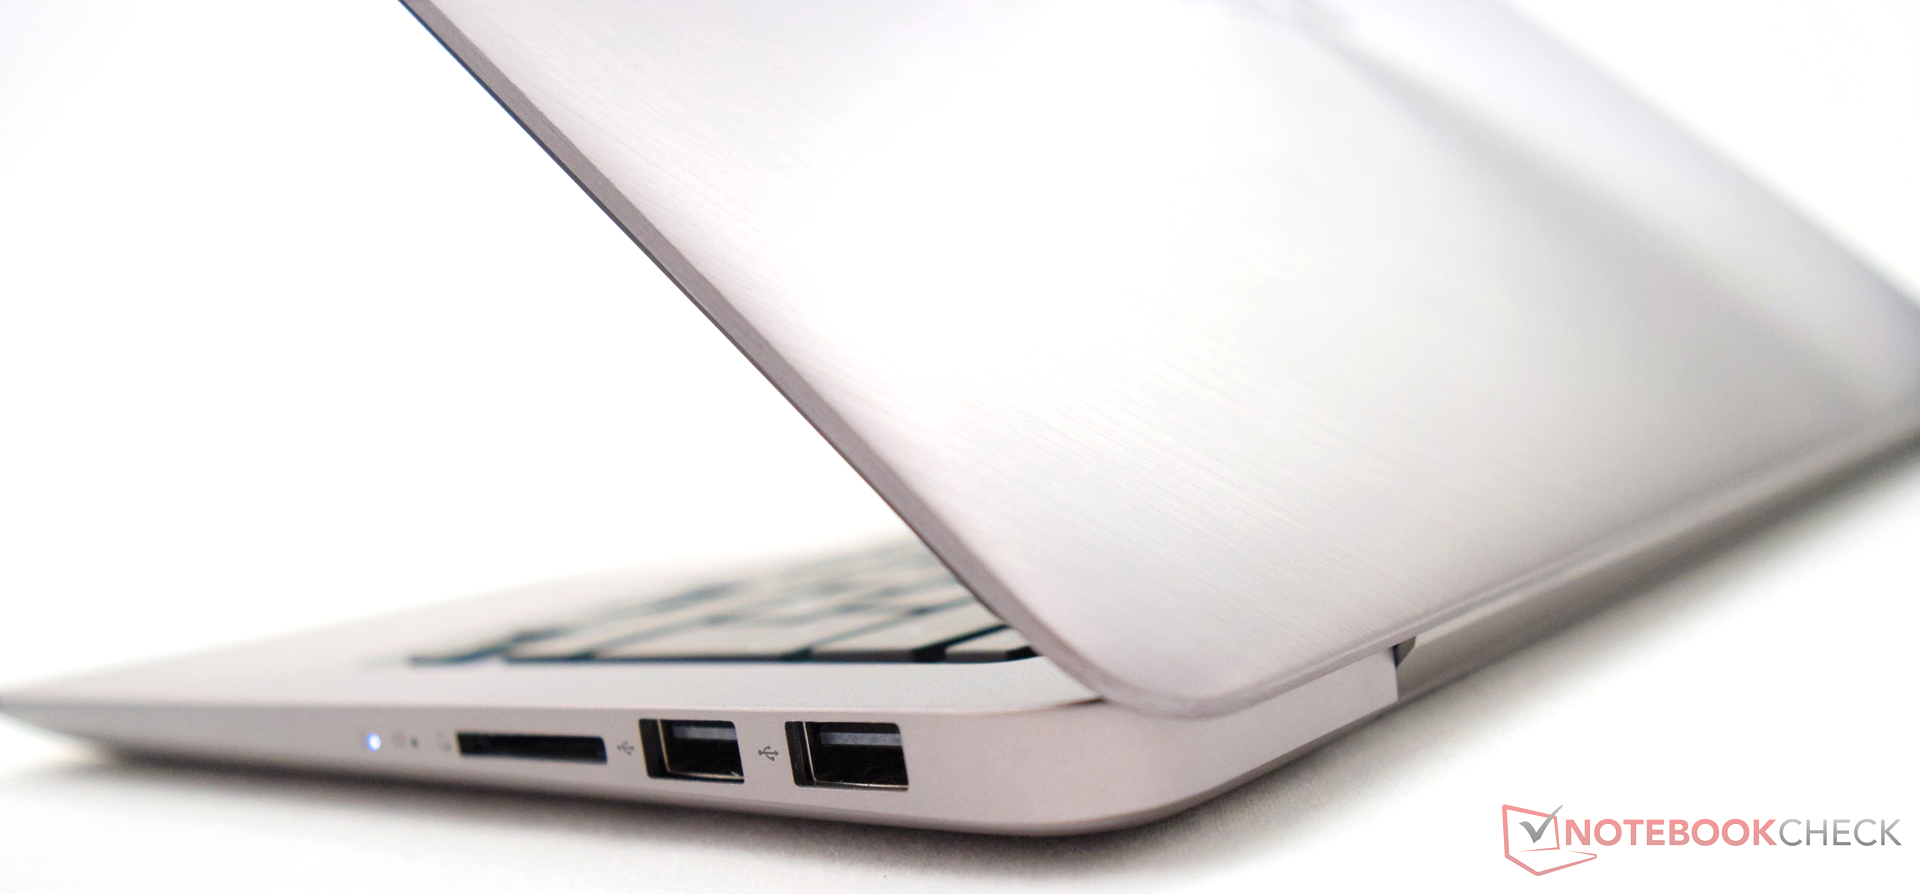
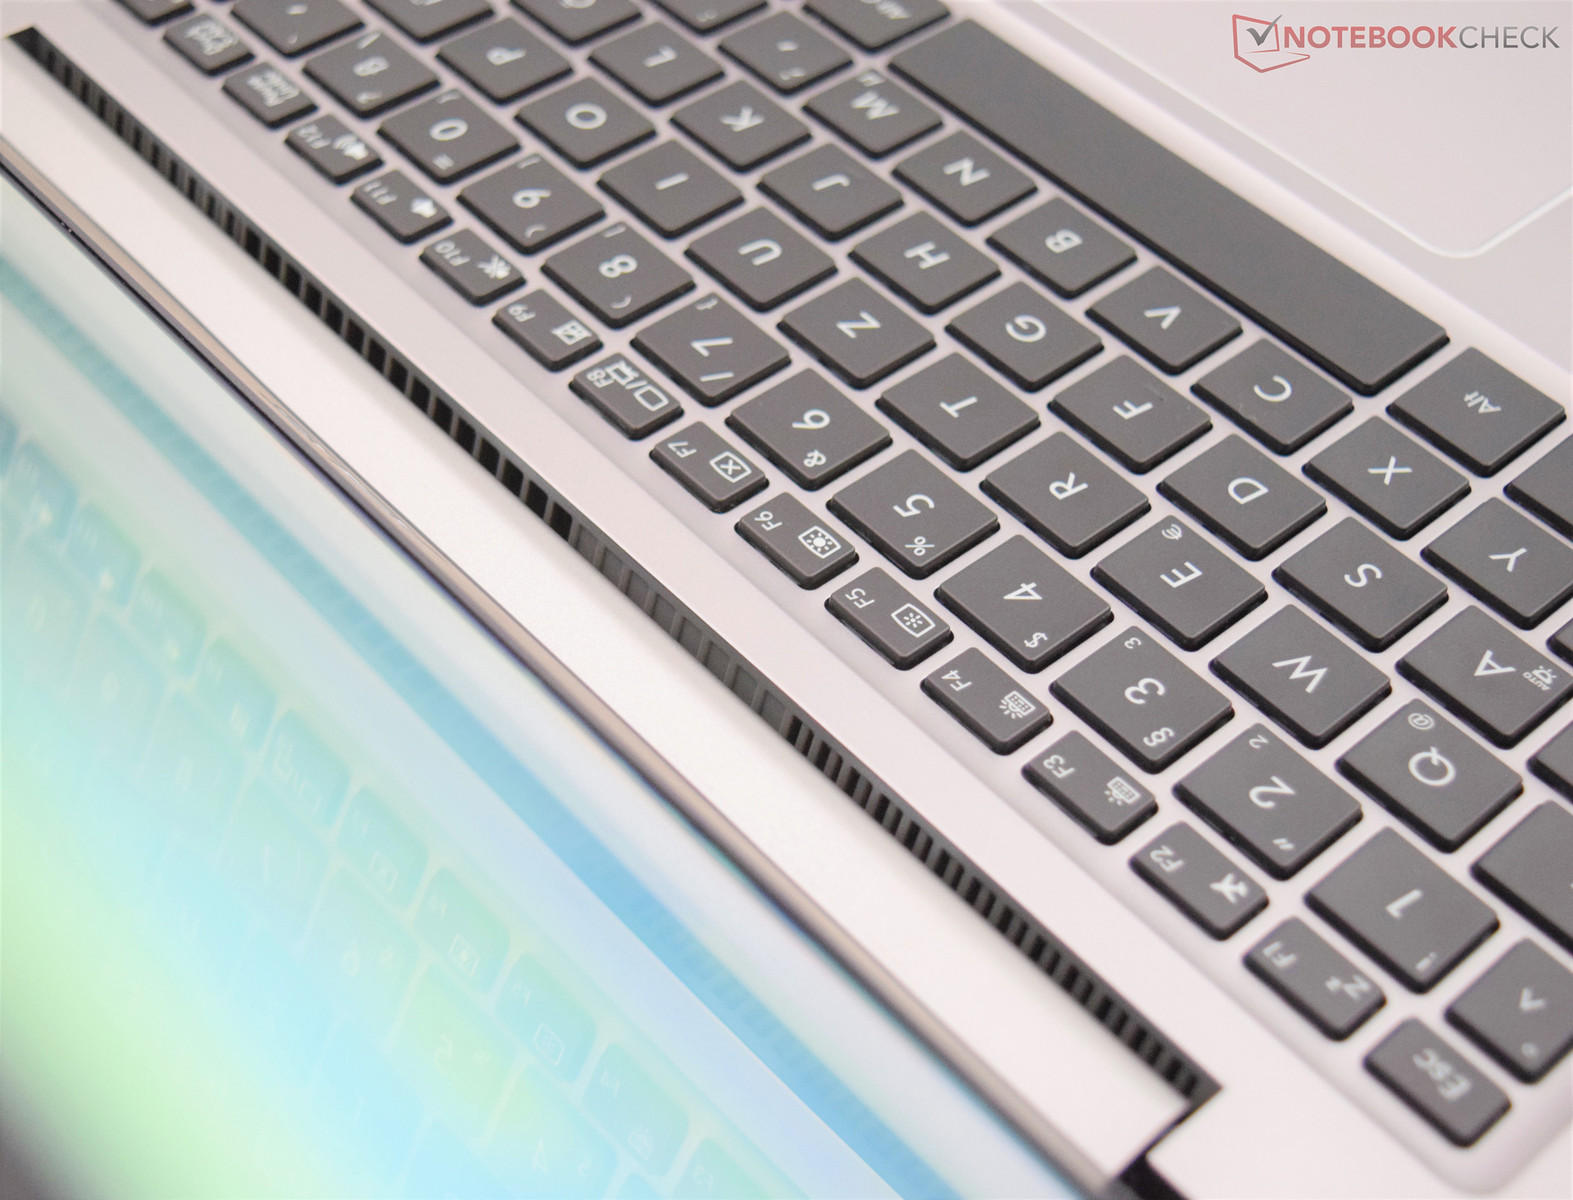
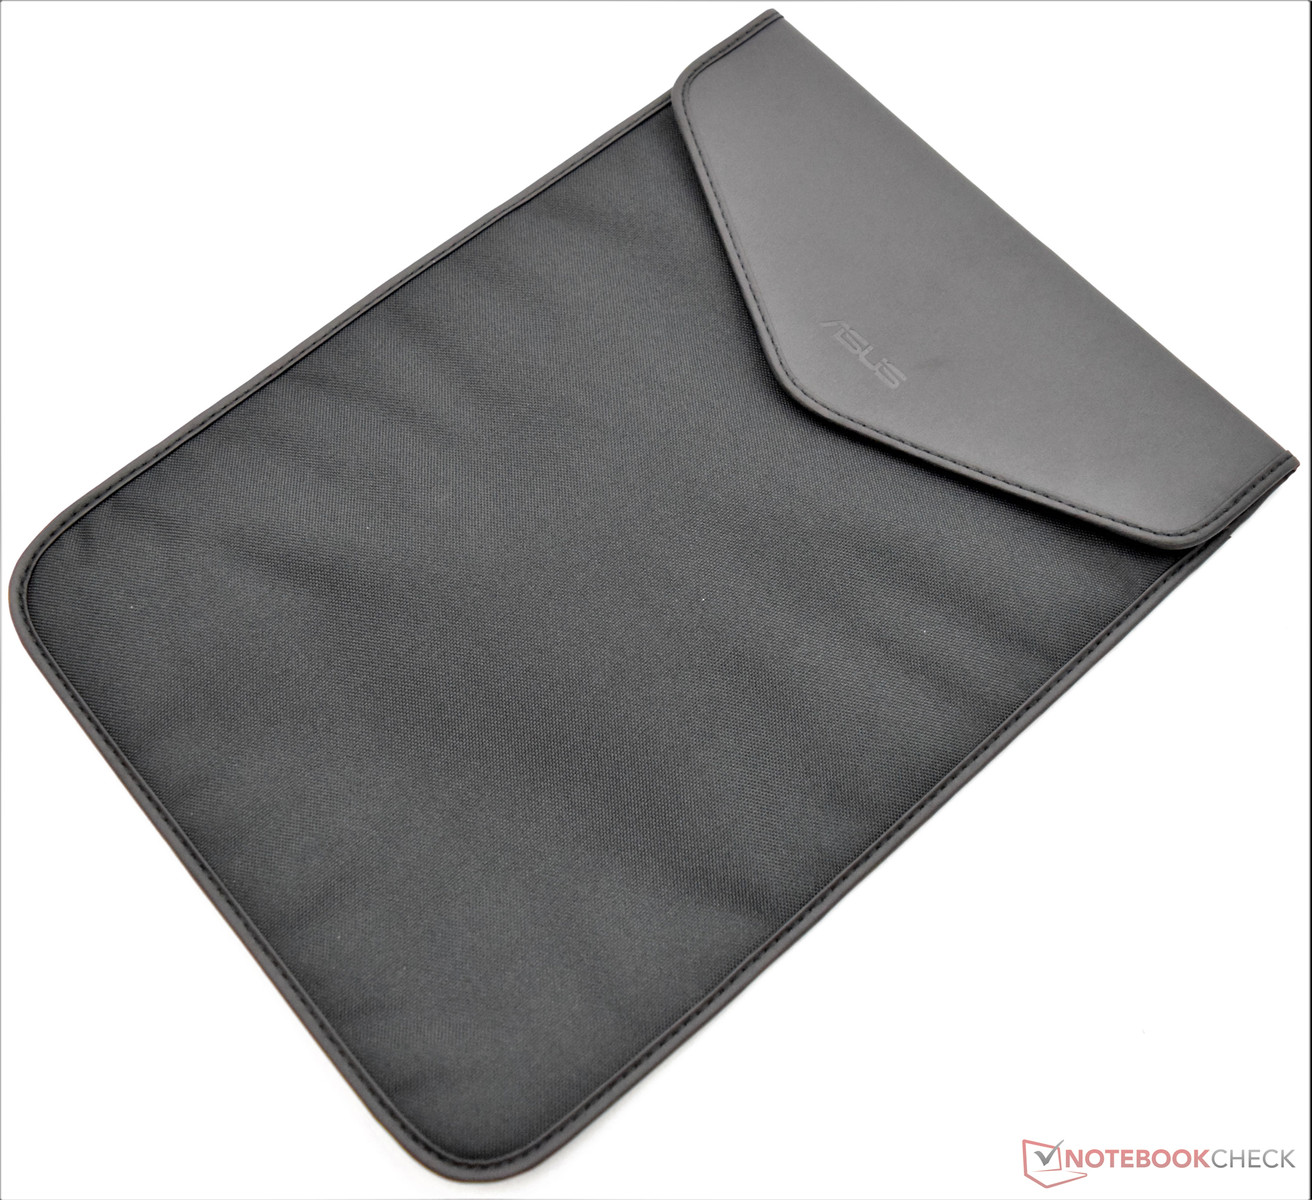
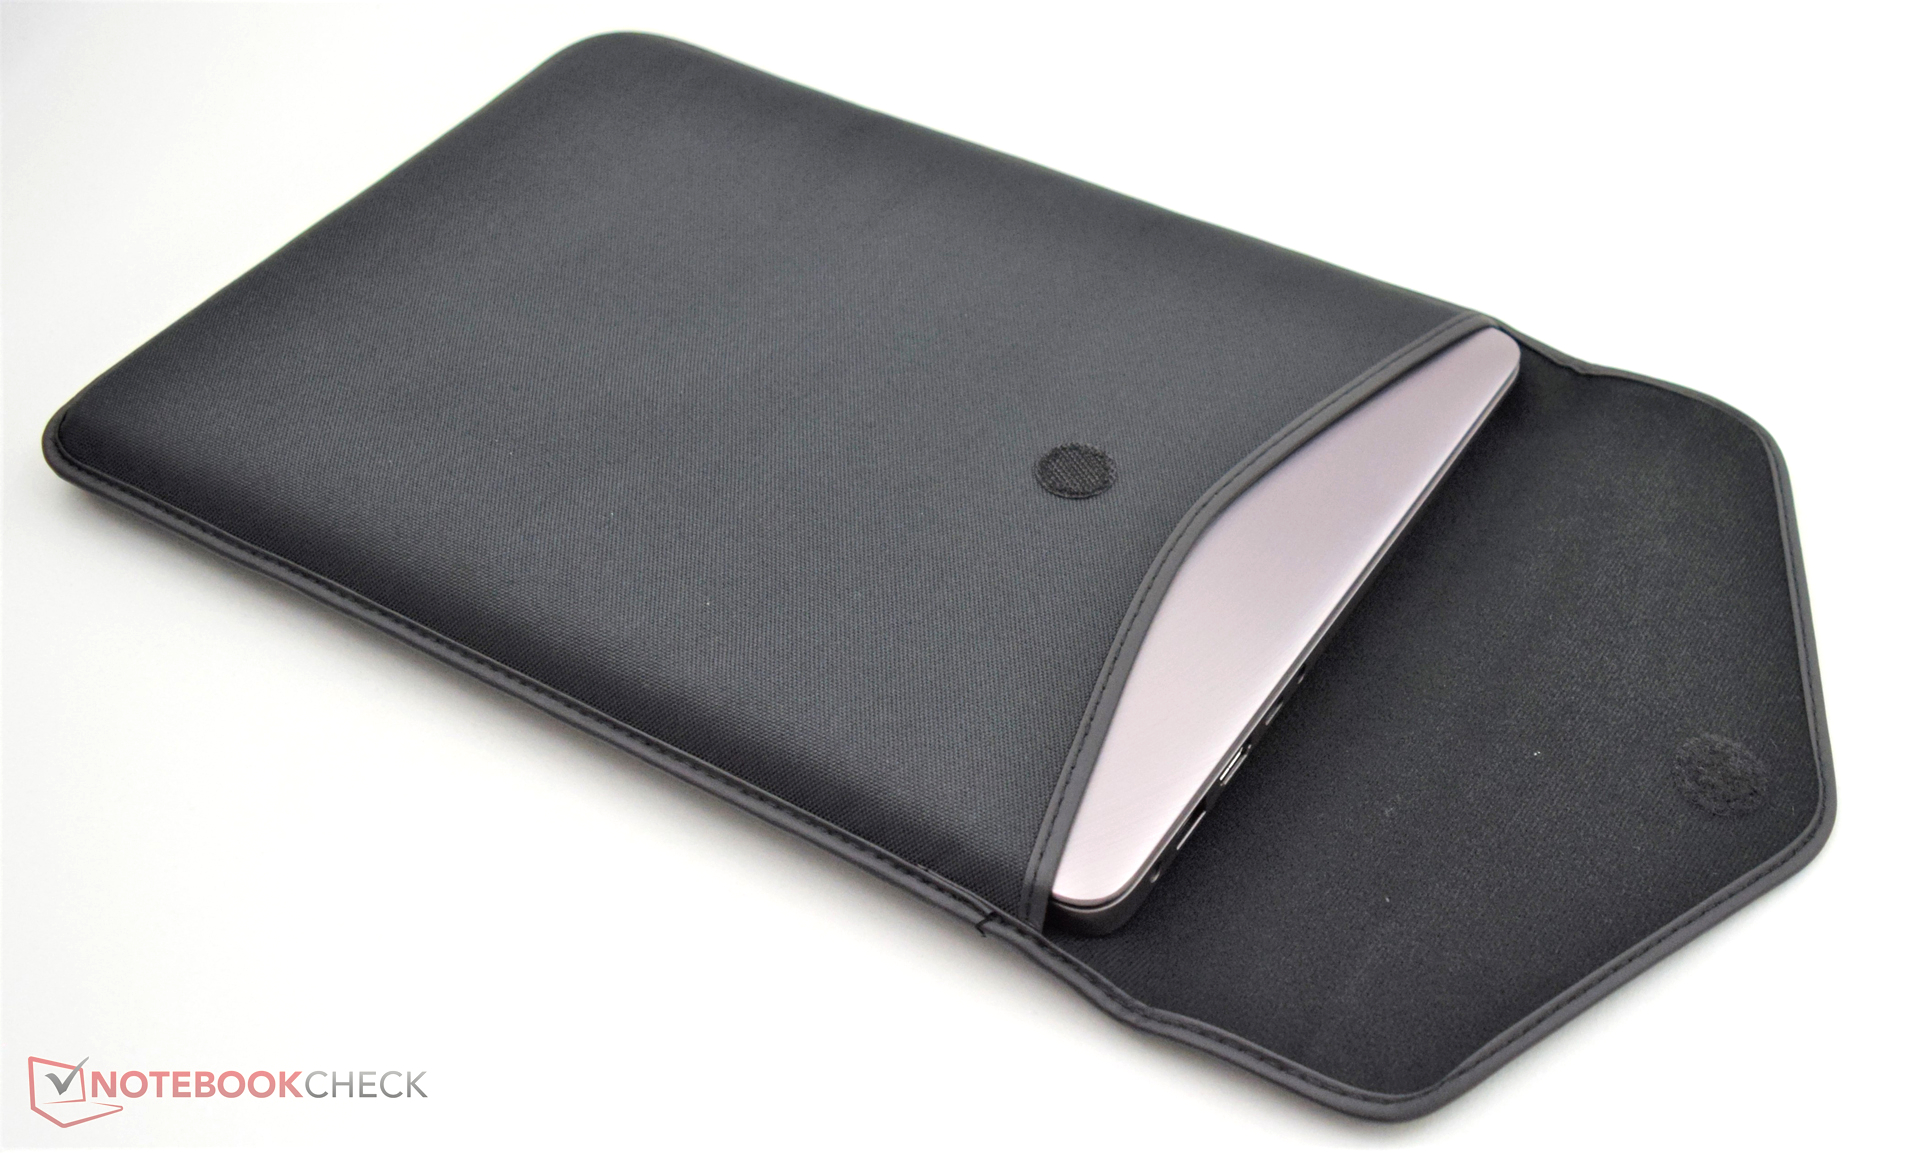
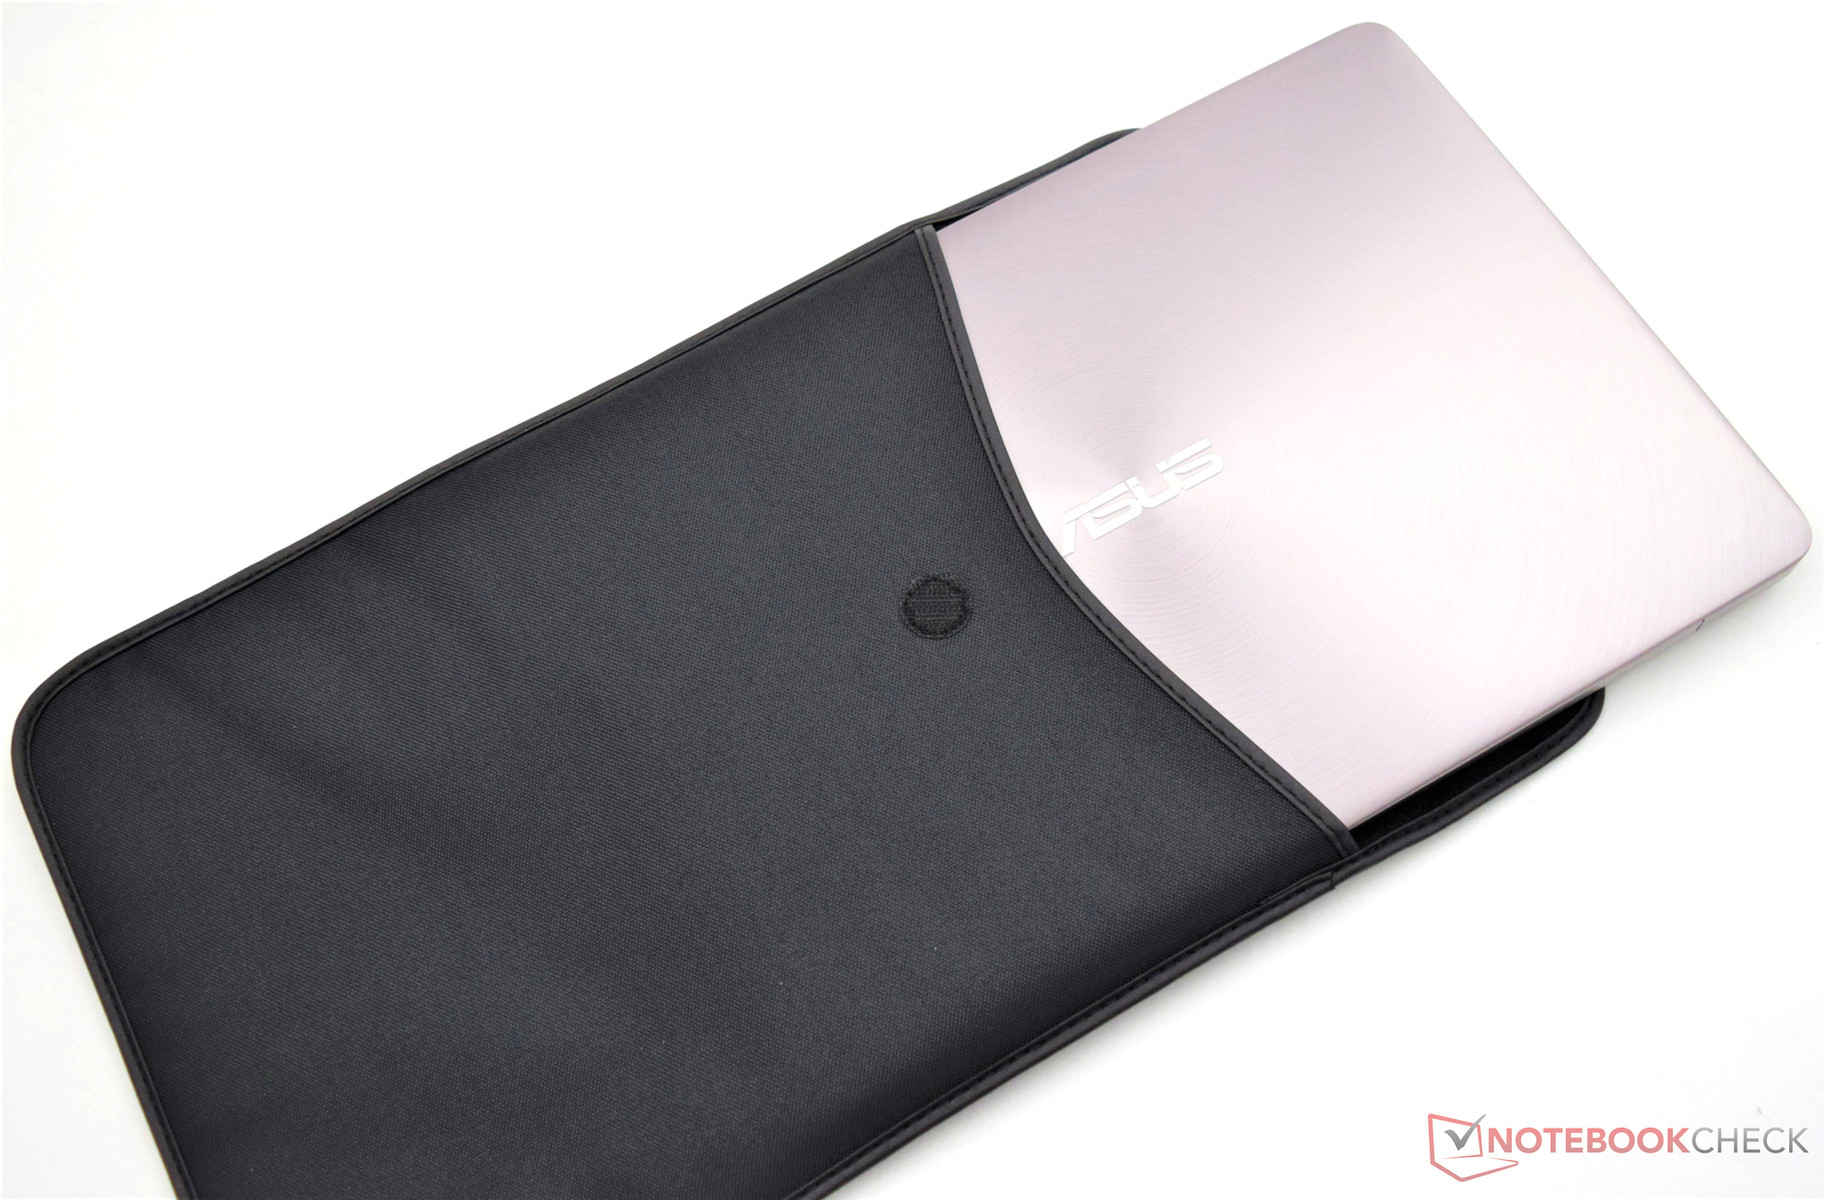
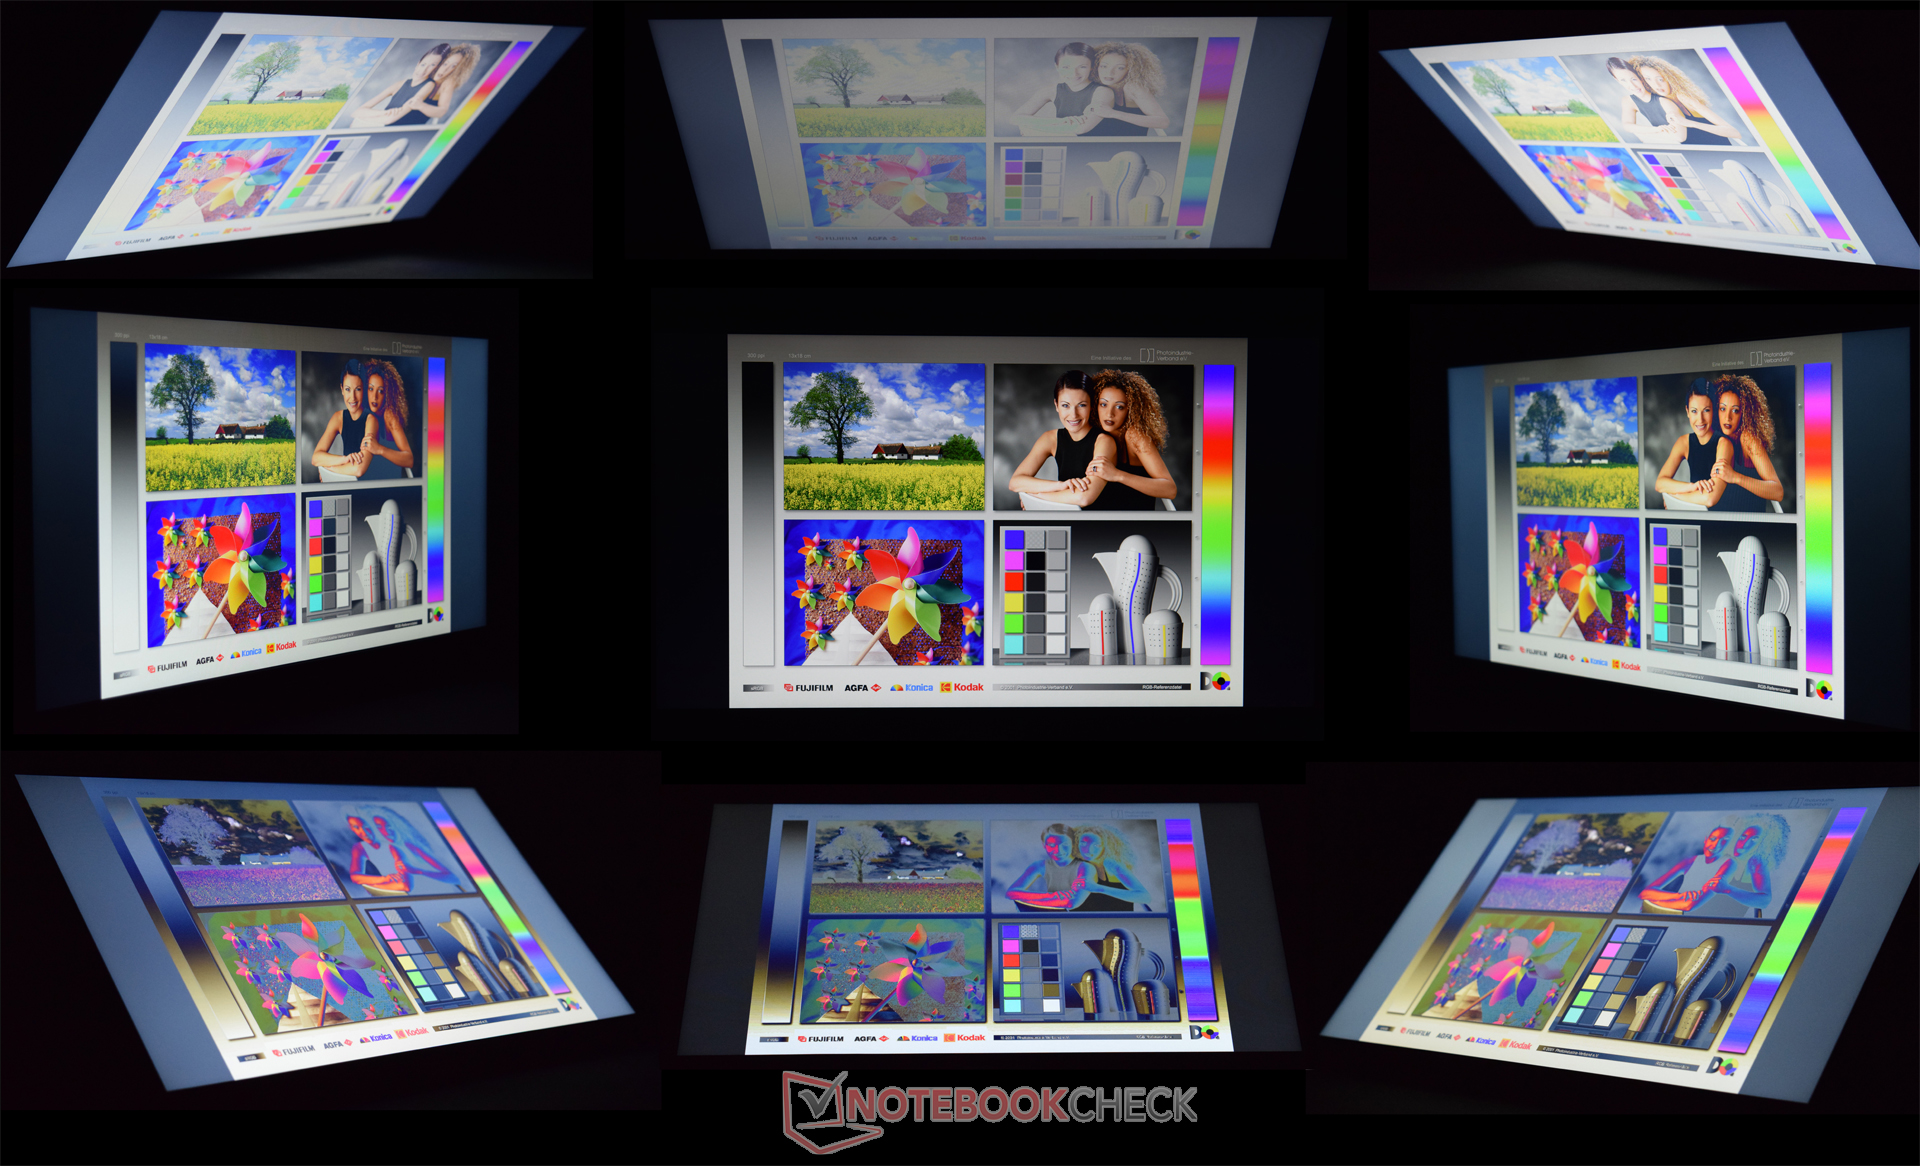
它的内置TN屏幕让我们十分失望。在这个价位的设备应该配备更好的屏幕。它的输入设备也不能完全让人满意。因此Zenbook UX310UQ可能不会让需要长时间编辑文档的用户一直高兴。随机附赠的保护套是个小优势。另外,华硕在连接性上考虑得十分周全。作为一台13寸的设备,它提供了可用于连接外设的丰富接口。
注:本文是基于完整评测的缩减版本,阅读完整的英文评测,请点击这里。
Asus Zenbook UX310UQ-GL011T
- 12/06/2016 v6 (old)
Sebastian Bade