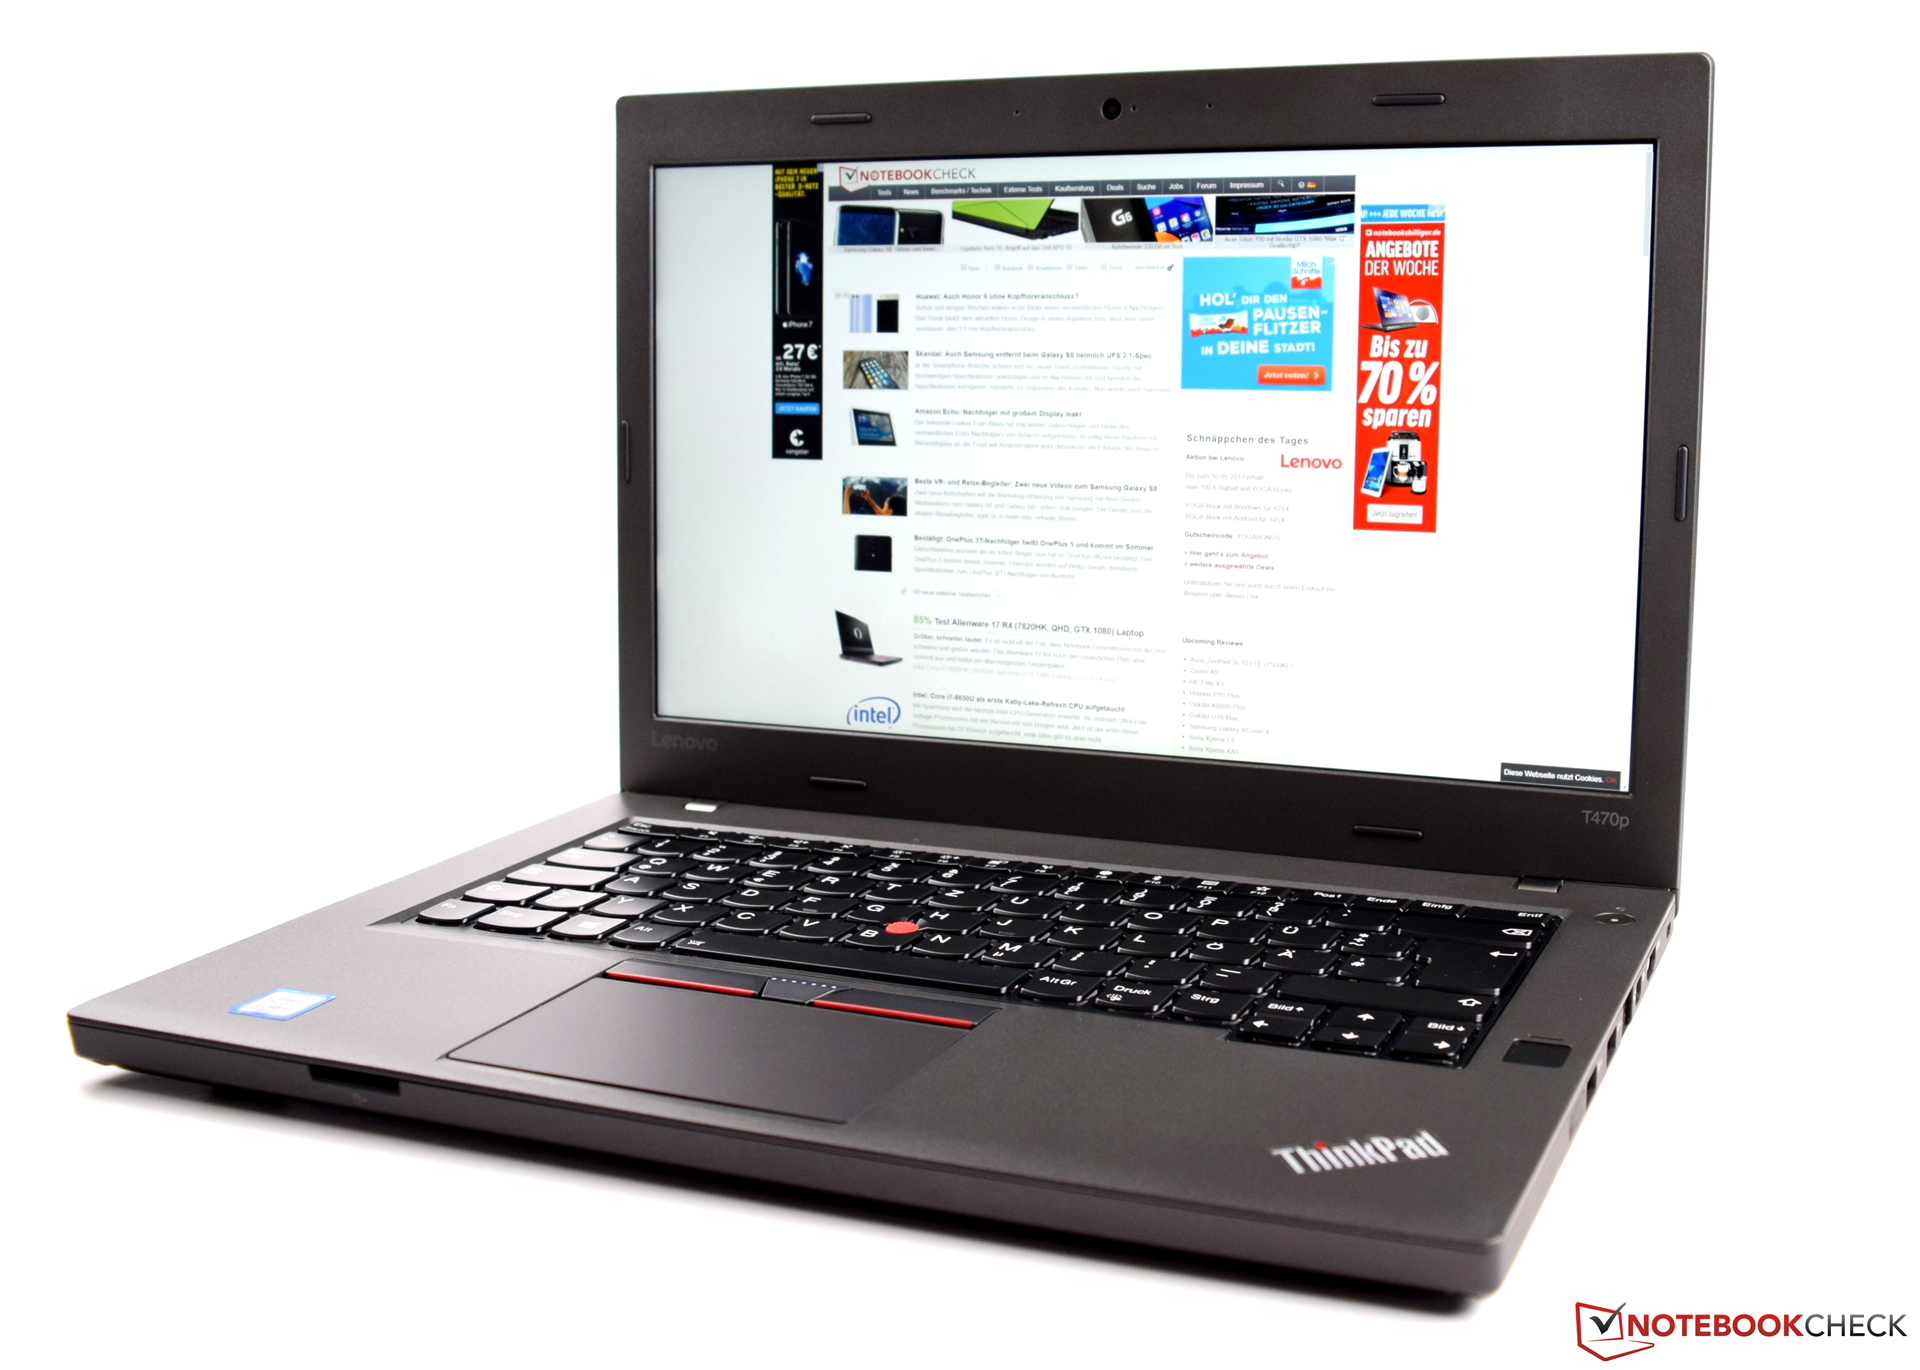
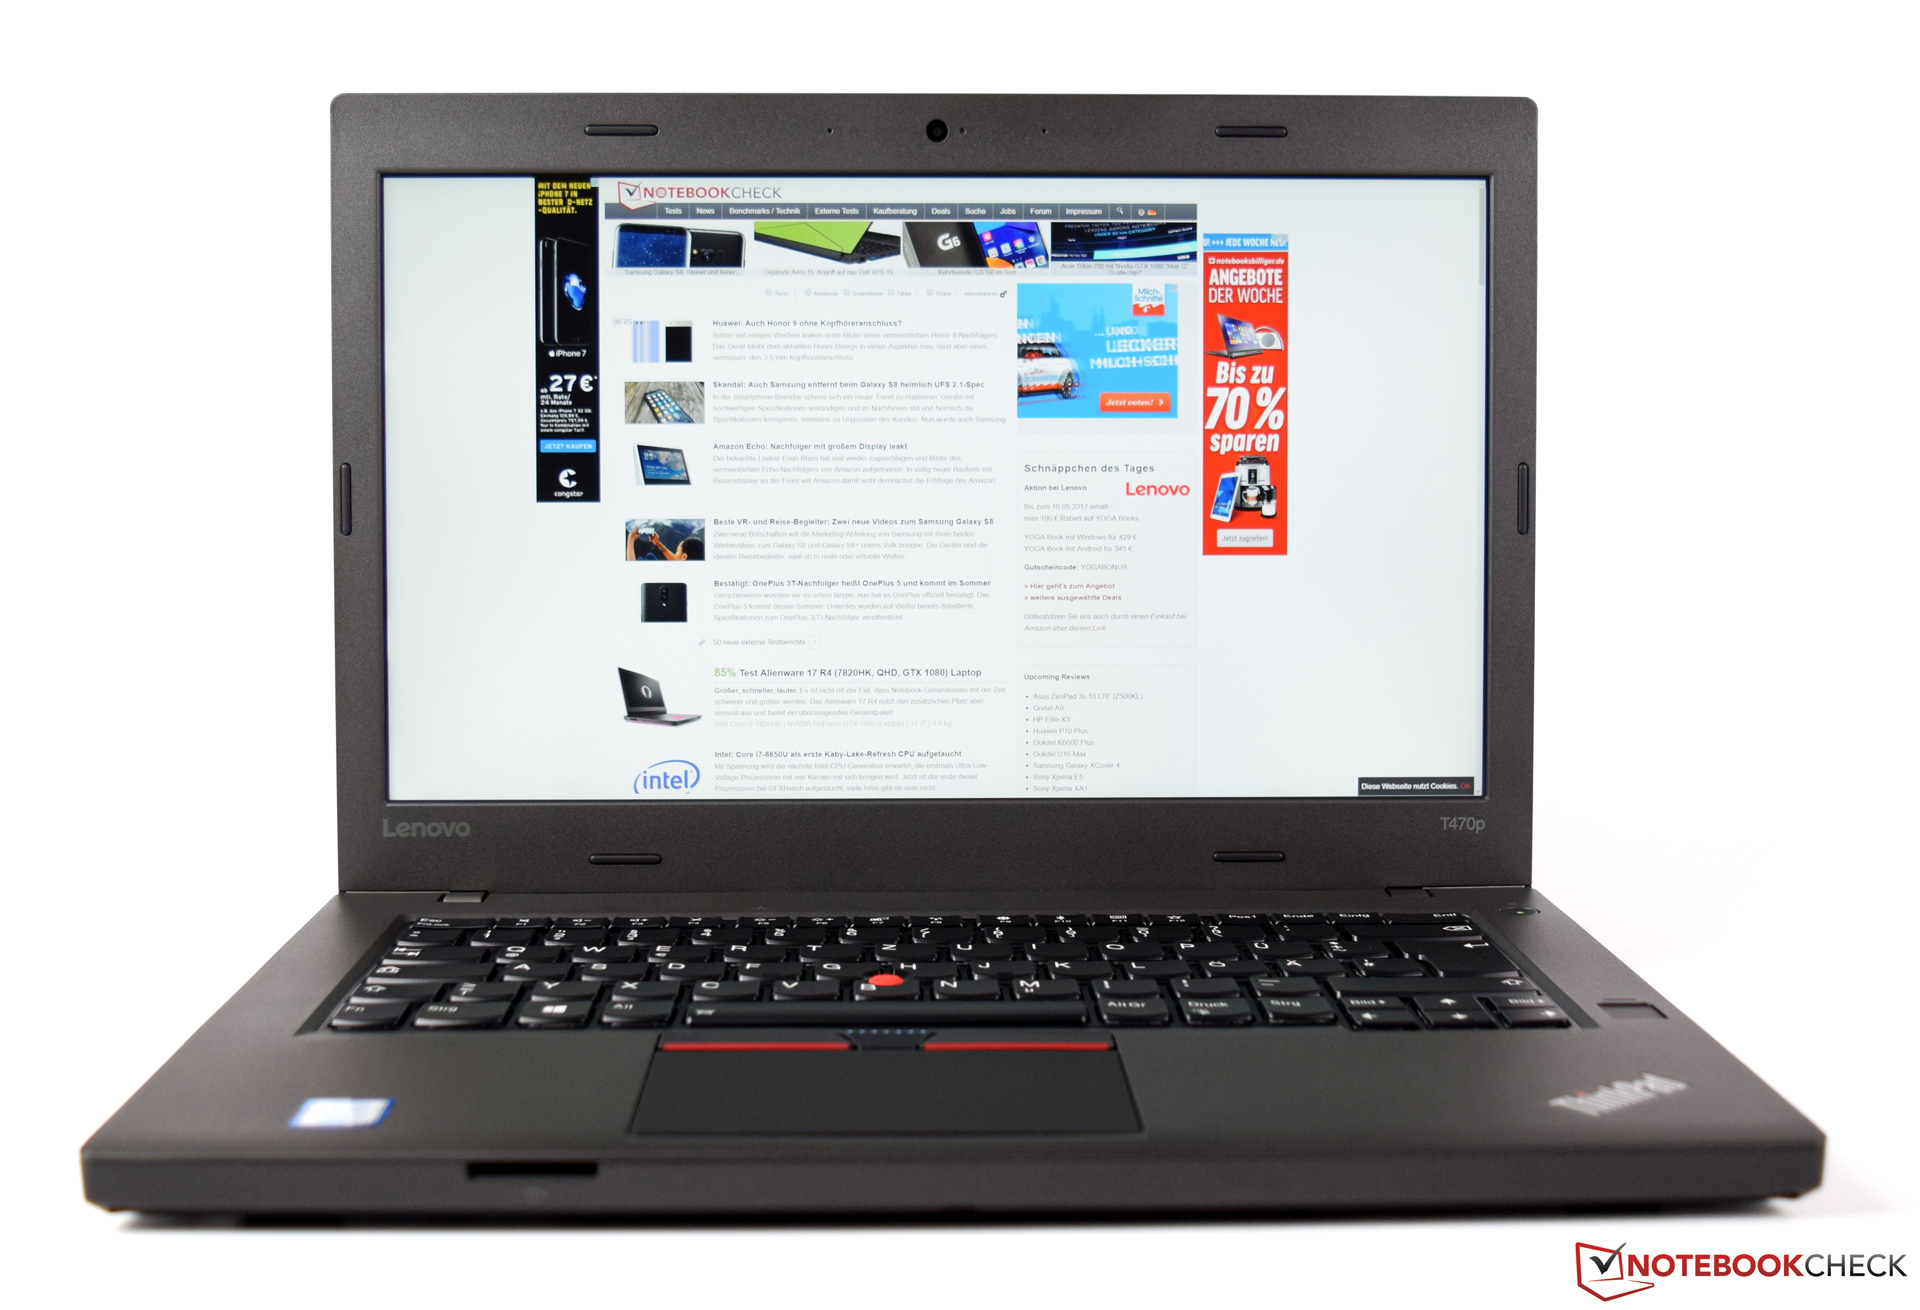
联想 ThinkPad T470p (酷睿 i7, GeForce 940MX) 笔记本电脑简短评测
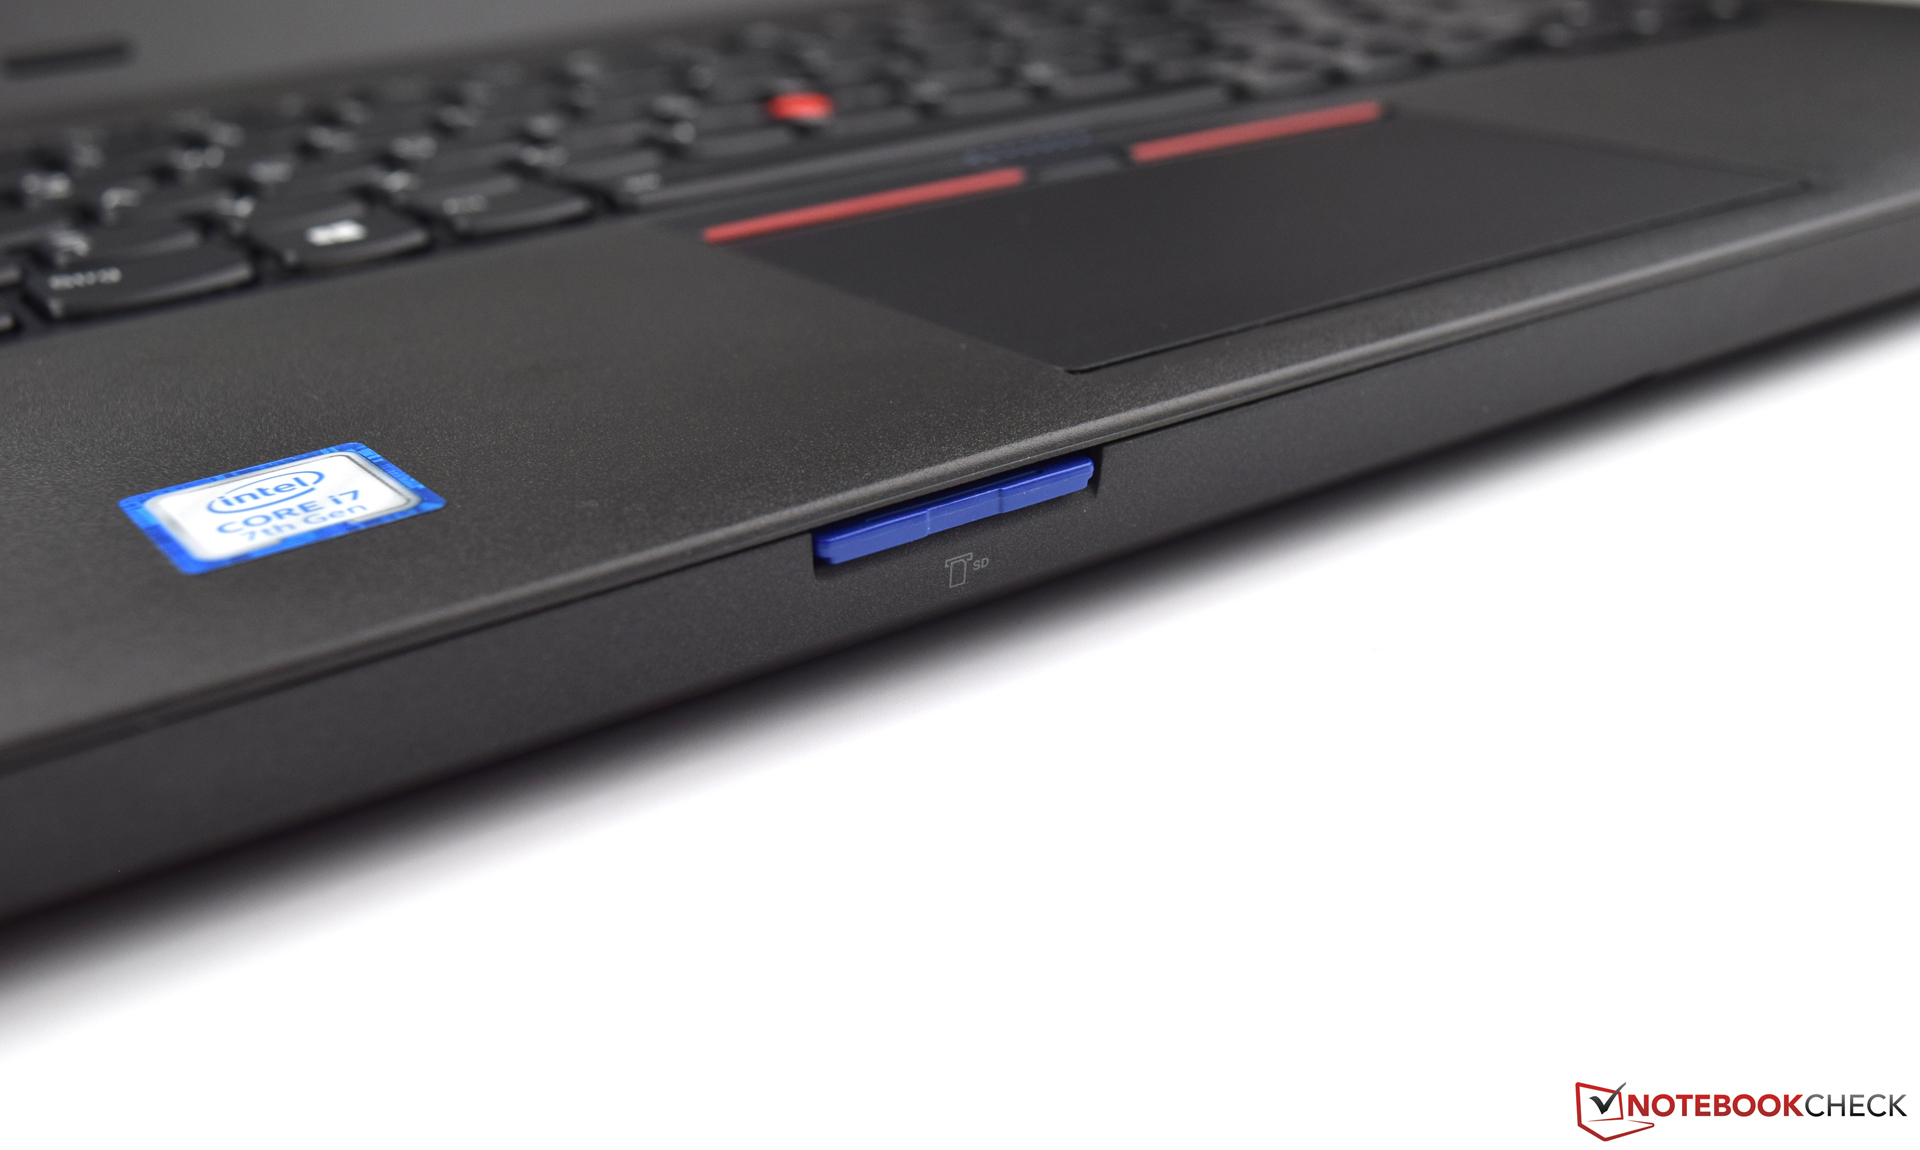
| SD Card Reader | |
| average JPG Copy Test (av. of 3 runs) | |
| Dell Latitude 14 E5470 | |
| Dell Latitude 5480 | |
| Lenovo ThinkPad T470-20HD002HGE | |
| HP EliteBook 840 G4-Z2V49ET ABD | |
| Lenovo ThinkPad T470p-20J7S00000 | |
| Lenovo ThinkPad T460p-20FXS05500 | |
| maximum AS SSD Seq Read Test (1GB) | |
| Dell Latitude 5480 | |
| Dell Latitude 14 E5470 | |
| Lenovo ThinkPad T470-20HD002HGE | |
| Lenovo ThinkPad T470p-20J7S00000 | |
| HP EliteBook 840 G4-Z2V49ET ABD | |
| Lenovo ThinkPad T460p-20FXS05500 | |
| Networking | |
| iperf3 transmit AX12 | |
| Lenovo ThinkPad T470-20HD002HGE | |
| HP EliteBook 840 G4-Z2V49ET ABD (jseb) | |
| Lenovo ThinkPad T470p-20J7S00000 | |
| Dell Latitude 5480 | |
| Dell Latitude 14 E5470 (jseb) | |
| iperf3 receive AX12 | |
| Lenovo ThinkPad T470-20HD002HGE | |
| Dell Latitude 5480 | |
| Dell Latitude 14 E5470 (jseb) | |
| HP EliteBook 840 G4-Z2V49ET ABD (jseb) | |
| Lenovo ThinkPad T470p-20J7S00000 | |
| |||||||||||||||||||||||||
Brightness Distribution: 87 %
Center on Battery: 267 cd/m²
Contrast: 1084:1 (Black: 0.25 cd/m²)
ΔE ColorChecker Calman: 6.68 | ∀{0.5-29.43 Ø4.71}
ΔE Greyscale Calman: 9.21 | ∀{0.09-98 Ø4.96}
94.72% sRGB (Argyll 1.6.3 3D)
61.49% AdobeRGB 1998 (Argyll 1.6.3 3D)
69.5% AdobeRGB 1998 (Argyll 3D)
94.9% sRGB (Argyll 3D)
69.3% Display P3 (Argyll 3D)
Gamma: 2.42
CCT: 6018 K
| Lenovo ThinkPad T470p-20J7S00000 IPS, 2560x1440, 14" | Lenovo ThinkPad T460p-20FXS05500 IPS-Panel, 2560x1440, 14" | Dell Latitude 14 E5470 AH-IPS, WLED, 1920x1080, 14" | Dell Latitude 5480 IPS, 1920x1080, 14" | HP EliteBook 840 G4-Z2V49ET ABD TN, 1920x1080, 14" | Lenovo ThinkPad T470-20HD002HGE IPS, 1920x1080, 14" | |
|---|---|---|---|---|---|---|
| Display | -1% | -9% | -39% | -17% | -38% | |
| Display P3 Coverage (%) | 69.3 | 66.9 -3% | 64.8 -6% | 40.62 -41% | 55.8 -19% | 41.6 -40% |
| sRGB Coverage (%) | 94.9 | 96.5 2% | 84.8 -11% | 61.2 -36% | 80.7 -15% | 61.9 -35% |
| AdobeRGB 1998 Coverage (%) | 69.5 | 68.8 -1% | 62 -11% | 41.96 -40% | 57.7 -17% | 43.06 -38% |
| Response Times | 17% | 15% | 20% | 20% | -3% | |
| Response Time Grey 50% / Grey 80% * (ms) | 52.8 ? | 38.4 ? 27% | 39 ? 26% | 32.8 ? 38% | 39 ? 26% | 41.6 ? 21% |
| Response Time Black / White * (ms) | 26.8 ? | 24.8 ? 7% | 26 ? 3% | 26.4 ? 1% | 23 ? 14% | 34 ? -27% |
| PWM Frequency (Hz) | 220 | |||||
| Screen | 11% | -2% | -4% | -35% | -4% | |
| Brightness middle (cd/m²) | 271 | 290 7% | 323 19% | 215.9 -20% | 346 28% | 306 13% |
| Brightness (cd/m²) | 266 | 280 5% | 316 19% | 205 -23% | 317 19% | 287 8% |
| Brightness Distribution (%) | 87 | 93 7% | 79 -9% | 90 3% | 86 -1% | 88 1% |
| Black Level * (cd/m²) | 0.25 | 0.31 -24% | 0.57 -128% | 0.22 12% | 0.86 -244% | 0.3 -20% |
| Contrast (:1) | 1084 | 935 -14% | 567 -48% | 981 -10% | 402 -63% | 1020 -6% |
| Colorchecker dE 2000 * | 6.68 | 3.88 42% | 3.68 45% | 5.1 24% | 8.64 -29% | 6.2 7% |
| Colorchecker dE 2000 max. * | 12.96 | 8.19 37% | 8.33 36% | 15.6 -20% | 13.58 -5% | 13.6 -5% |
| Greyscale dE 2000 * | 9.21 | 5.47 41% | 2.99 68% | 4 57% | 11.24 -22% | 5.8 37% |
| Gamma | 2.42 91% | 2.33 94% | 2.49 88% | 2.41 91% | 2.62 84% | 2.04 108% |
| CCT | 6018 108% | 6469 100% | 6572 99% | 6856 95% | 12530 52% | 6277 104% |
| Color Space (Percent of AdobeRGB 1998) (%) | 61.49 | 63.3 3% | 55 -11% | 41.96 -32% | 52 -15% | 39.62 -36% |
| Color Space (Percent of sRGB) (%) | 94.72 | 96.64 2% | 85 -10% | 61.15 -35% | 80 -16% | 61.44 -35% |
| Total Average (Program / Settings) | 9% /
9% | 1% /
-1% | -8% /
-8% | -11% /
-24% | -15% /
-10% |
* ... smaller is better
Display Response Times
| ↔ Response Time Black to White | ||
|---|---|---|
| 26.8 ms ... rise ↗ and fall ↘ combined | ↗ 6.4 ms rise | 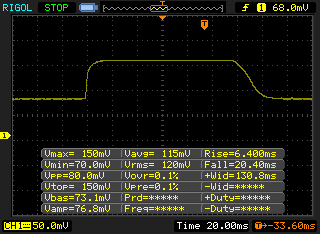 |
| ↘ 20.4 ms fall | ||
| The screen shows relatively slow response rates in our tests and may be too slow for gamers. In comparison, all tested devices range from 0.1 (minimum) to 240 (maximum) ms. » 67 % of all devices are better. This means that the measured response time is worse than the average of all tested devices (19.8 ms). | ||
| ↔ Response Time 50% Grey to 80% Grey | ||
| 52.8 ms ... rise ↗ and fall ↘ combined | ↗ 19.6 ms rise | 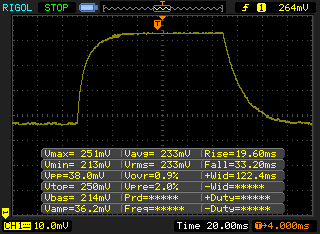 |
| ↘ 33.2 ms fall | ||
| The screen shows slow response rates in our tests and will be unsatisfactory for gamers. In comparison, all tested devices range from 0.165 (minimum) to 636 (maximum) ms. » 89 % of all devices are better. This means that the measured response time is worse than the average of all tested devices (31 ms). | ||
Screen Flickering / PWM (Pulse-Width Modulation)
| Screen flickering / PWM not detected | ||
In comparison: 52 % of all tested devices do not use PWM to dim the display. If PWM was detected, an average of 7754 (minimum: 5 - maximum: 343500) Hz was measured. | ||
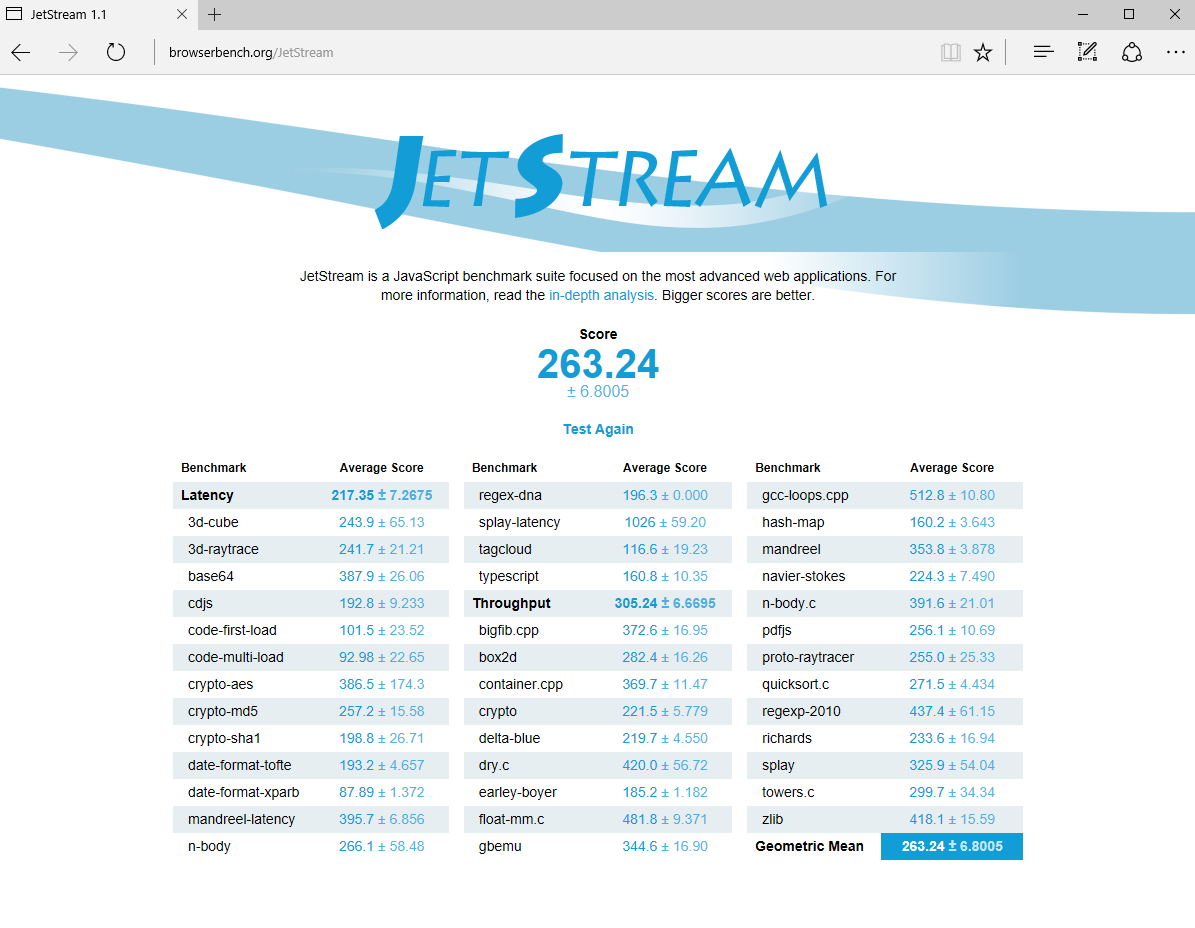
| JetStream 1.1 - 1.1 Total | |
| Lenovo ThinkPad T470p-20J7S00000 | |
| Lenovo ThinkPad T460p-20FXS05500 | |
| Dell Latitude 14 E5470 | |
| Lenovo ThinkPad T470-20HD002HGE | |
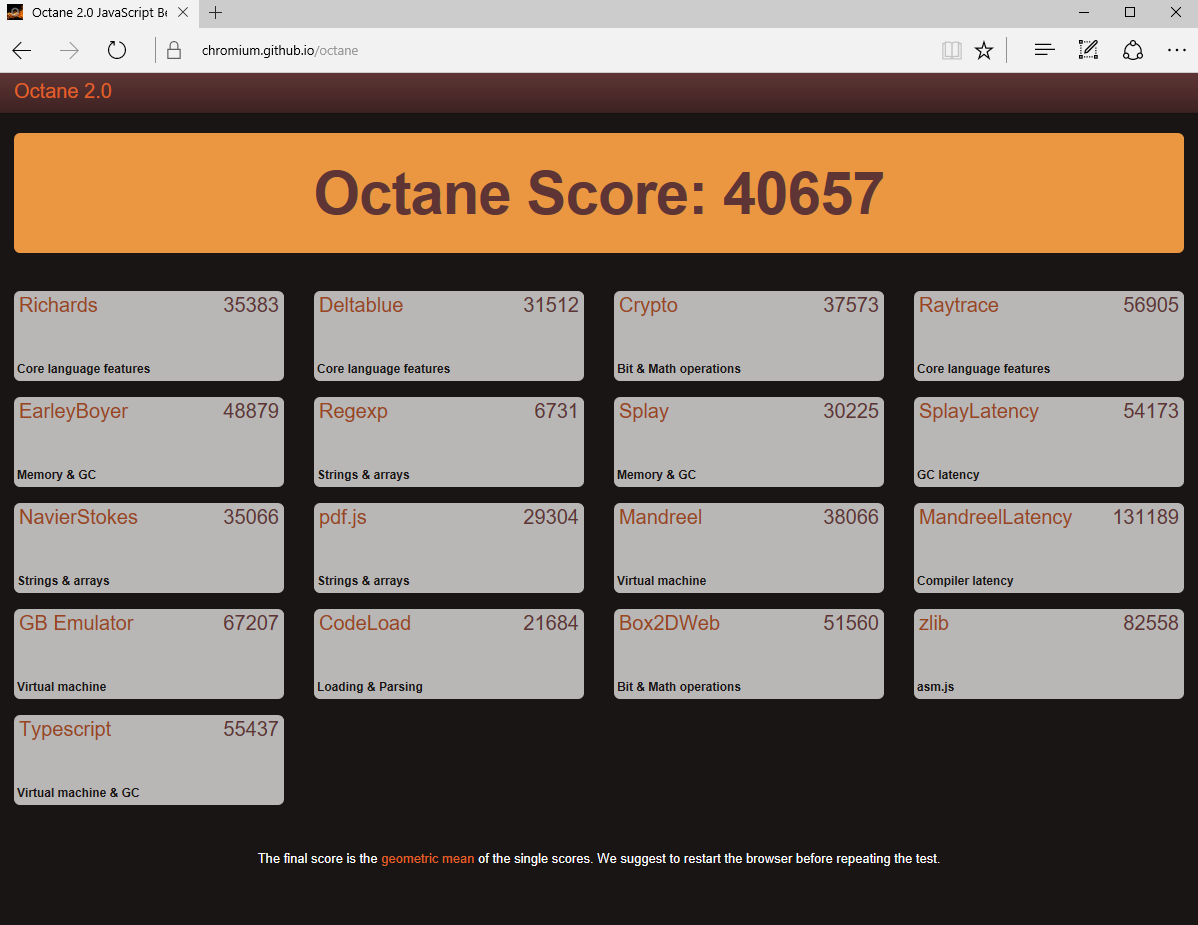
| Octane V2 - Total Score | |
| Lenovo ThinkPad T470p-20J7S00000 | |
| Lenovo ThinkPad T460p-20FXS05500 | |
| Dell Latitude 14 E5470 | |
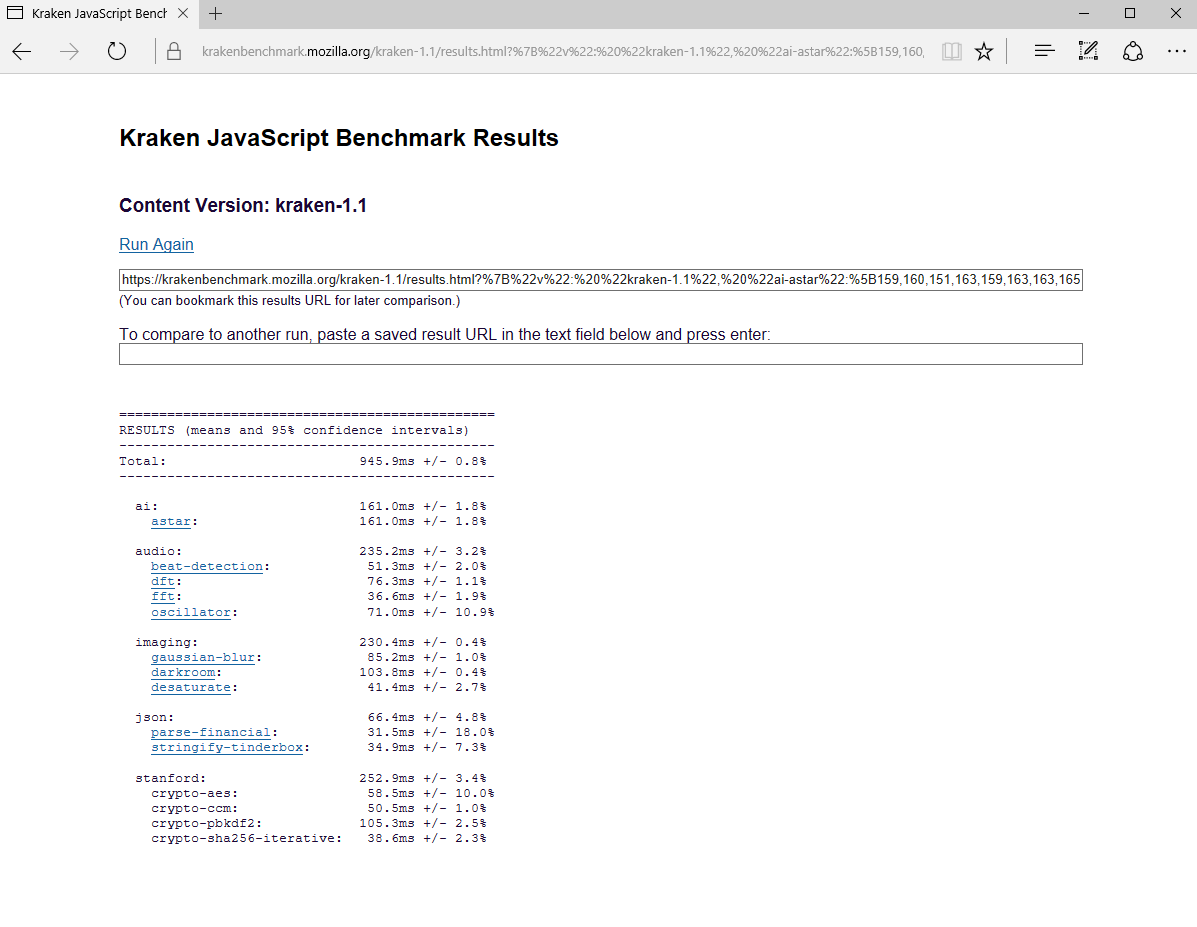
| Mozilla Kraken 1.1 - Total | |
| Lenovo ThinkPad T470-20HD002HGE | |
| Dell Latitude 14 E5470 | |
| Lenovo ThinkPad T460p-20FXS05500 | |
| Lenovo ThinkPad T470p-20J7S00000 | |
* ... smaller is better
| PCMark 7 Score | 5766 points | |
| PCMark 8 Home Score Accelerated v2 | 3650 points | |
| PCMark 8 Creative Score Accelerated v2 | 4883 points | |
| PCMark 8 Work Score Accelerated v2 | 4654 points | |
Help | ||
| Lenovo ThinkPad T470p-20J7S00000 Samsung PM961 NVMe MZVLW512HMJP | Lenovo ThinkPad T460p-20FXS05500 Samsung SSD PM871 MZ7LN512HCHP | Dell Latitude 14 E5470 Micron SSD 1100 (MTFDDAV256TBN) | Dell Latitude 5480 Toshiba SG5 256GB THNSNK256GVN8 | HP EliteBook 840 G4-Z2V49ET ABD Samsung PM961 MZVLW256HEHP | Lenovo ThinkPad T470-20HD002HGE Samsung PM961 NVMe MZVLW512HMJP | |
|---|---|---|---|---|---|---|
| CrystalDiskMark 3.0 | -49% | -60% | -55% | 8% | -6% | |
| Read Seq (MB/s) | 1088 | 502 -54% | 465.4 -57% | 469.4 -57% | 1819 67% | 1155 6% |
| Write Seq (MB/s) | 1023 | 442 -57% | 363.1 -65% | 264.8 -74% | 1263 23% | 1076 5% |
| Read 512 (MB/s) | 731 | 411.4 -44% | 338.4 -54% | 408.1 -44% | 922 26% | 811 11% |
| Write 512 (MB/s) | 798 | 414.3 -48% | 246.1 -69% | 265.5 -67% | 804 1% | 862 8% |
| Read 4k (MB/s) | 60.9 | 29.18 -52% | 25.83 -58% | 24.66 -60% | 61.4 1% | 55.5 -9% |
| Write 4k (MB/s) | 166.8 | 86.5 -48% | 80.3 -52% | 114.8 -31% | 157.1 -6% | 134.6 -19% |
| Read 4k QD32 (MB/s) | 652 | 358.1 -45% | 246.1 -62% | 380.3 -42% | 513 -21% | 496.2 -24% |
| Write 4k QD32 (MB/s) | 563 | 319.8 -43% | 197.7 -65% | 207.2 -63% | 410.2 -27% | 425.4 -24% |

| 3DMark 11 Performance | 3428 points | |
| 3DMark Ice Storm Standard Score | 36216 points | |
| 3DMark Cloud Gate Standard Score | 11802 points | |
| 3DMark Fire Strike Score | 2253 points | |
| 3DMark Fire Strike Extreme Score | 1089 points | |
| 3DMark Time Spy Score | 737 points | |
Help | ||
| low | med. | high | ultra | |
|---|---|---|---|---|
| BioShock Infinite (2013) | 129.4 | 79.3 | 68.3 | 25.5 |
| Battlefield 4 (2013) | 98.8 | 69.1 | 48.8 | 19.8 |
| The Witcher 3 (2015) | 49.2 | 28.4 | 14.6 | |
| Rise of the Tomb Raider (2016) | 51.8 | 30.6 | 17 |
Noise level
| Idle |
| 29 / 29 / 29 dB(A) |
| Load |
| 35.6 / 39.7 dB(A) |
 | ||
30 dB silent 40 dB(A) audible 50 dB(A) loud |
||
min: | ||
| Lenovo ThinkPad T470p-20J7S00000 i7-7700HQ, GeForce 940MX | Lenovo ThinkPad T460p-20FXS05500 6700HQ, GeForce 940MX | Dell Latitude 14 E5470 6440HQ, HD Graphics 530 | Dell Latitude 5480 i7-7600U, HD Graphics 620 | HP EliteBook 840 G4-Z2V49ET ABD i5-7200U, HD Graphics 620 | Lenovo ThinkPad T470-20HD002HGE i5-7200U, HD Graphics 620 | |
|---|---|---|---|---|---|---|
| Noise | 1% | 1% | -9% | -1% | 6% | |
| off / environment * (dB) | 29 | 29.2 -1% | 30.3 -4% | 31 -7% | 28 3% | |
| Idle Minimum * (dB) | 29 | 29.2 -1% | 30.3 -4% | 29.6 -2% | 31 -7% | 28 3% |
| Idle Average * (dB) | 29 | 29.2 -1% | 30.3 -4% | 29.6 -2% | 31 -7% | 28 3% |
| Idle Maximum * (dB) | 29 | 29.2 -1% | 30.3 -4% | 29.6 -2% | 31 -7% | 29.4 -1% |
| Load Average * (dB) | 35.6 | 33.5 6% | 31.6 11% | 42 -18% | 33.5 6% | 31.4 12% |
| Load Maximum * (dB) | 39.7 | 38.8 2% | 35 12% | 47.1 -19% | 33.7 15% | 34.6 13% |
* ... smaller is better
(-) The maximum temperature on the upper side is 50.2 °C / 122 F, compared to the average of 34.3 °C / 94 F, ranging from 21.2 to 62.5 °C for the class Office.
(-) The bottom heats up to a maximum of 51.3 °C / 124 F, compared to the average of 36.8 °C / 98 F
(+) In idle usage, the average temperature for the upper side is 25.4 °C / 78 F, compared to the device average of 29.5 °C / 85 F.
(±) The palmrests and touchpad can get very hot to the touch with a maximum of 38.5 °C / 101.3 F.
(-) The average temperature of the palmrest area of similar devices was 27.5 °C / 81.5 F (-11 °C / -19.8 F).
| Lenovo ThinkPad T470p-20J7S00000 i7-7700HQ, GeForce 940MX | Lenovo ThinkPad T460p-20FXS05500 6700HQ, GeForce 940MX | Dell Latitude 14 E5470 6440HQ, HD Graphics 530 | Dell Latitude 5480 i7-7600U, HD Graphics 620 | HP EliteBook 840 G4-Z2V49ET ABD i5-7200U, HD Graphics 620 | Lenovo ThinkPad T470-20HD002HGE i5-7200U, HD Graphics 620 | |
|---|---|---|---|---|---|---|
| Heat | -11% | -1% | 11% | 15% | 14% | |
| Maximum Upper Side * (°C) | 50.2 | 51.6 -3% | 43 14% | 36.4 27% | 37 26% | 37.2 26% |
| Maximum Bottom * (°C) | 51.3 | 55.2 -8% | 43 16% | 45 12% | 39.4 23% | 45.1 12% |
| Idle Upper Side * (°C) | 26.3 | 30.7 -17% | 31.2 -19% | 26.4 -0% | 25.9 2% | 24.4 7% |
| Idle Bottom * (°C) | 27.5 | 31.5 -15% | 31.3 -14% | 26.8 3% | 25.6 7% | 25 9% |
* ... smaller is better
Lenovo ThinkPad T470p-20J7S00000 audio analysis
(+) | speakers can play relatively loud (83.1 dB)
Bass 100 - 315 Hz
(-) | nearly no bass - on average 18.1% lower than median
(±) | linearity of bass is average (14.6% delta to prev. frequency)
Mids 400 - 2000 Hz
(+) | balanced mids - only 4.2% away from median
(+) | mids are linear (5.9% delta to prev. frequency)
Highs 2 - 16 kHz
(+) | balanced highs - only 3.3% away from median
(+) | highs are linear (6.5% delta to prev. frequency)
Overall 100 - 16.000 Hz
(±) | linearity of overall sound is average (19.6% difference to median)
Compared to same class
» 41% of all tested devices in this class were better, 8% similar, 51% worse
» The best had a delta of 7%, average was 21%, worst was 53%
Compared to all devices tested
» 49% of all tested devices were better, 7% similar, 44% worse
» The best had a delta of 4%, average was 23%, worst was 134%
Apple MacBook 12 (Early 2016) 1.1 GHz audio analysis
(+) | speakers can play relatively loud (83.6 dB)
Bass 100 - 315 Hz
(±) | reduced bass - on average 11.3% lower than median
(±) | linearity of bass is average (14.2% delta to prev. frequency)
Mids 400 - 2000 Hz
(+) | balanced mids - only 2.4% away from median
(+) | mids are linear (5.5% delta to prev. frequency)
Highs 2 - 16 kHz
(+) | balanced highs - only 2% away from median
(+) | highs are linear (4.5% delta to prev. frequency)
Overall 100 - 16.000 Hz
(+) | overall sound is linear (10.2% difference to median)
Compared to same class
» 7% of all tested devices in this class were better, 2% similar, 90% worse
» The best had a delta of 5%, average was 18%, worst was 53%
Compared to all devices tested
» 5% of all tested devices were better, 1% similar, 94% worse
» The best had a delta of 4%, average was 23%, worst was 134%
| Off / Standby | |
| Idle | |
| Load |
|
Key:
min: | |
| Lenovo ThinkPad T470p-20J7S00000 i7-7700HQ, GeForce 940MX, Samsung PM961 NVMe MZVLW512HMJP, IPS, 2560x1440, 14" | Lenovo ThinkPad T460p-20FXS05500 6700HQ, GeForce 940MX, Samsung SSD PM871 MZ7LN512HCHP, IPS-Panel, 2560x1440, 14" | Dell Latitude 14 E5470 6440HQ, HD Graphics 530, Micron SSD 1100 (MTFDDAV256TBN), AH-IPS, WLED, 1920x1080, 14" | Dell Latitude 5480 i7-7600U, HD Graphics 620, Toshiba SG5 256GB THNSNK256GVN8, IPS, 1920x1080, 14" | HP EliteBook 840 G4-Z2V49ET ABD i5-7200U, HD Graphics 620, Samsung PM961 MZVLW256HEHP, TN, 1920x1080, 14" | Lenovo ThinkPad T470-20HD002HGE i5-7200U, HD Graphics 620, Samsung PM961 NVMe MZVLW512HMJP, IPS, 1920x1080, 14" | |
|---|---|---|---|---|---|---|
| Power Consumption | -22% | 1% | 7% | 29% | 29% | |
| Idle Minimum * (Watt) | 3.8 | 5 -32% | 4.1 -8% | 6.64 -75% | 2.9 24% | 3.21 16% |
| Idle Average * (Watt) | 6.5 | 9.9 -52% | 8.1 -25% | 6.67 -3% | 5.6 14% | 6.15 5% |
| Idle Maximum * (Watt) | 7.2 | 10.8 -50% | 11.4 -58% | 7.78 -8% | 8.15 -13% | 6.82 5% |
| Load Average * (Watt) | 62.5 | 52.4 16% | 33.5 46% | 30.83 51% | 30.6 51% | 28.5 54% |
| Load Maximum * (Watt) | 99.6 | 89.8 10% | 49 51% | 31.7 68% | 31 69% | 34.5 65% |
* ... smaller is better
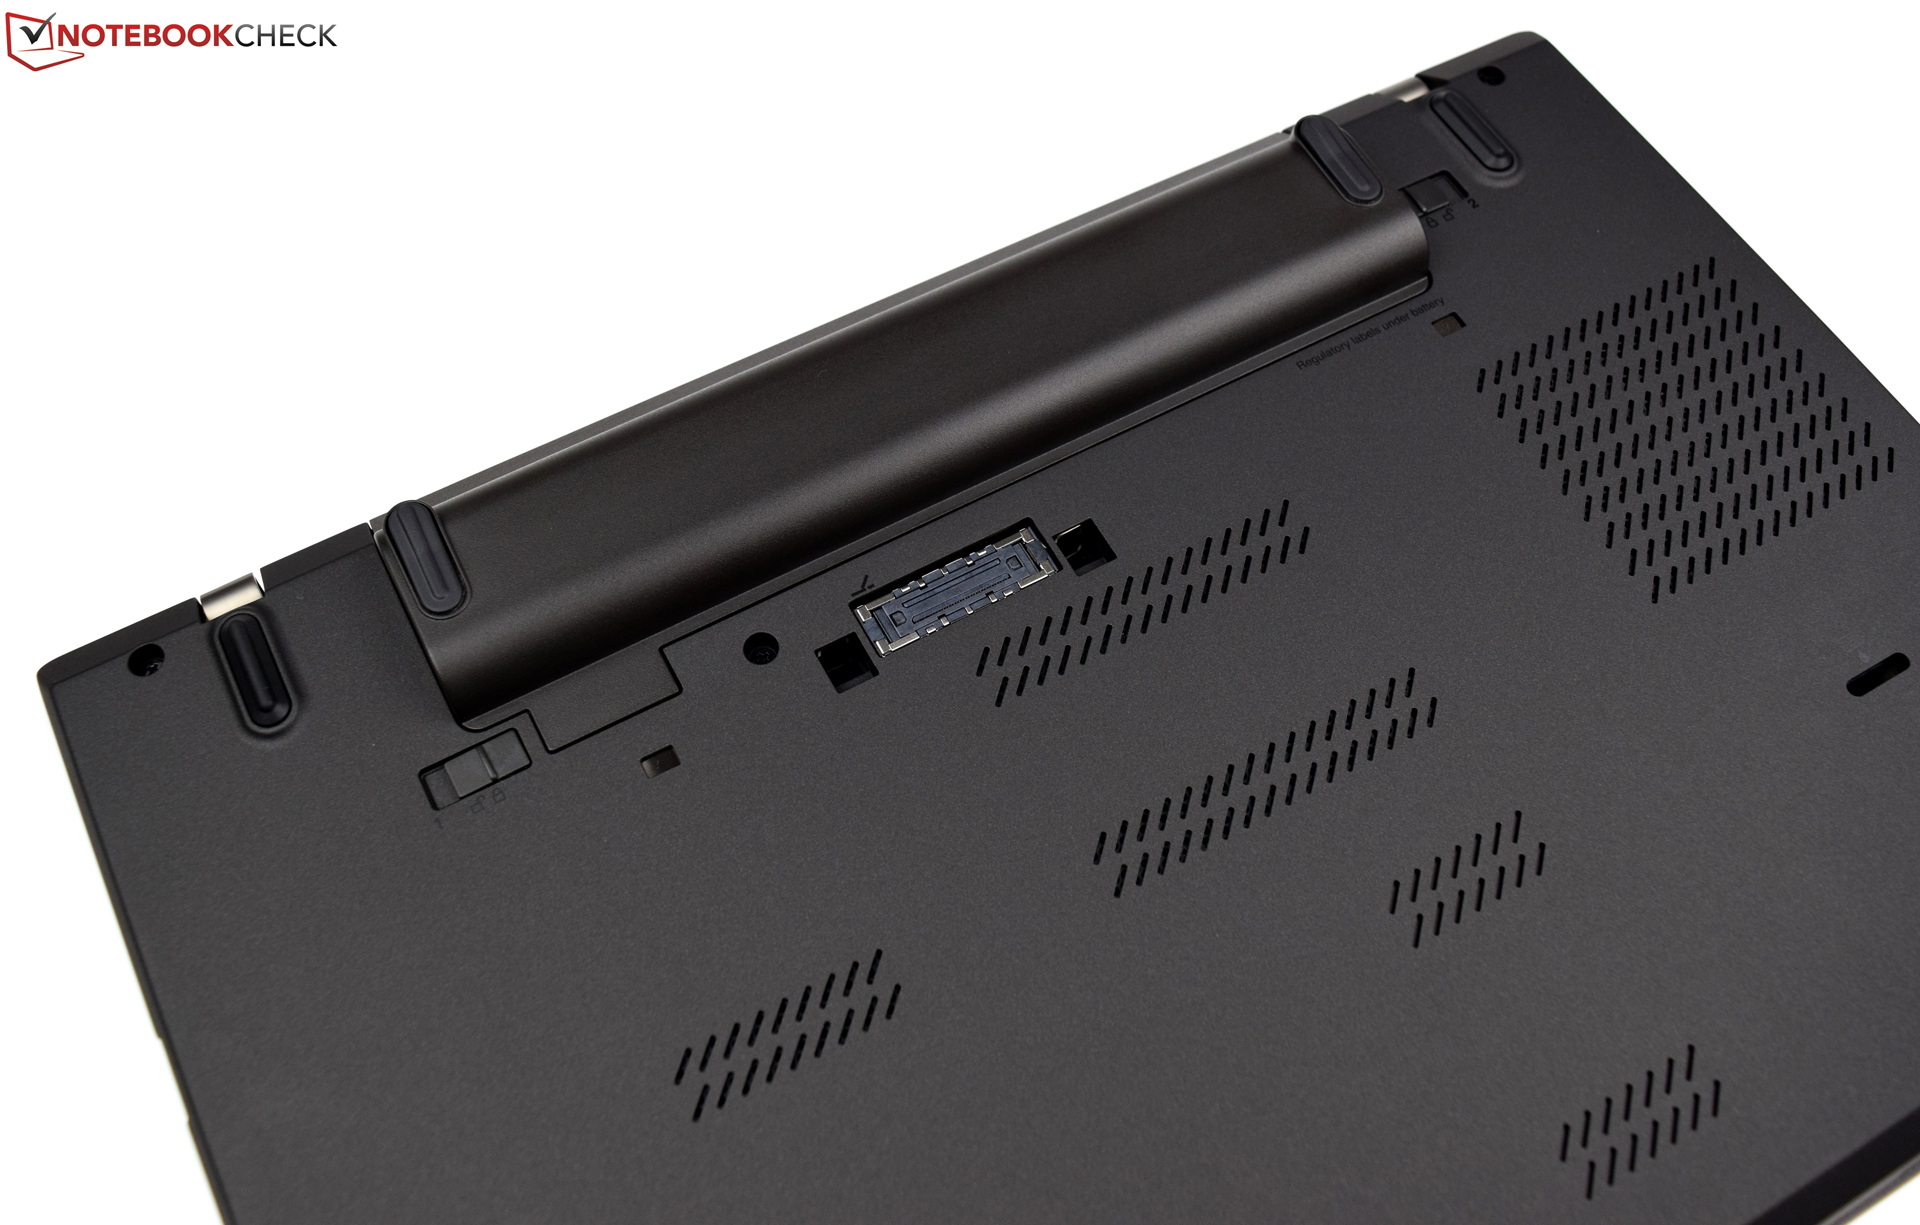
| Lenovo ThinkPad T470p-20J7S00000 i7-7700HQ, GeForce 940MX, 72 Wh | Lenovo ThinkPad T460p-20FXS05500 6700HQ, GeForce 940MX, 48 Wh | Dell Latitude 14 E5470 6440HQ, HD Graphics 530, 62 Wh | Dell Latitude 5480 i7-7600U, HD Graphics 620, 68 Wh | HP EliteBook 840 G4-Z2V49ET ABD i5-7200U, HD Graphics 620, 51 Wh | Lenovo ThinkPad T470-20HD002HGE i5-7200U, HD Graphics 620, 48 Wh | |
|---|---|---|---|---|---|---|
| Battery runtime | -35% | -13% | 63% | 39% | 13% | |
| Reader / Idle (h) | 17.7 | 11 -38% | 15.2 -14% | 24.1 36% | 19.3 9% | |
| H.264 (h) | 7.6 | 6 -21% | 6.9 -9% | 9.9 30% | 10.4 37% | |
| WiFi v1.3 (h) | 10 | 5 -50% | 7.2 -28% | 16.1 61% | 9.5 -5% | 7.3 -27% |
| Load (h) | 1.4 | 1 -29% | 1.4 0% | 2.7 93% | 3.1 121% | 1.8 29% |
Pros
Cons
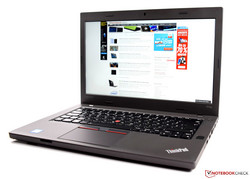
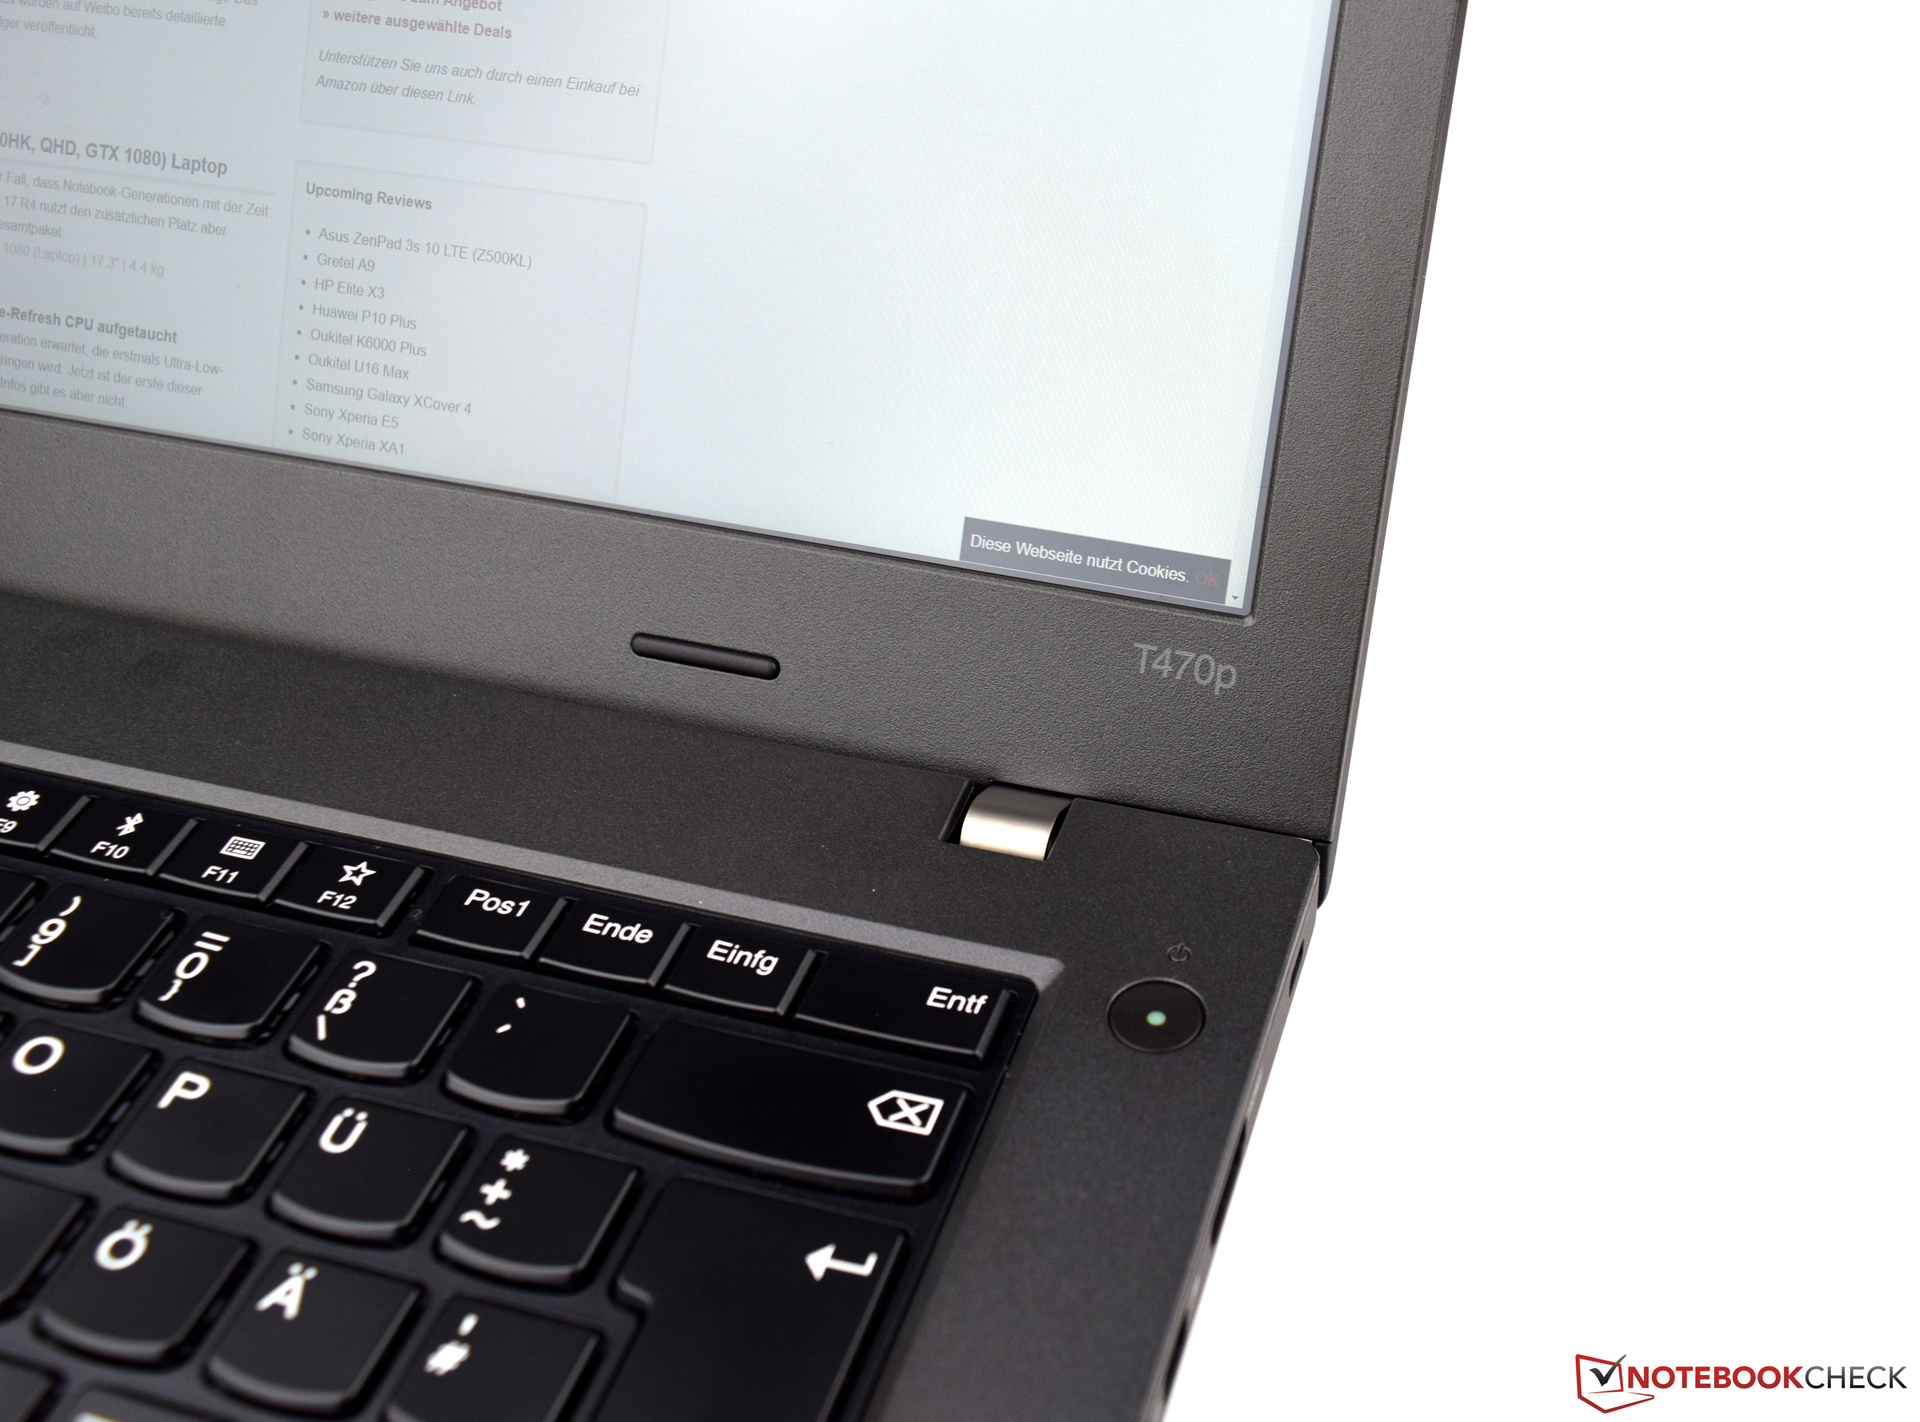
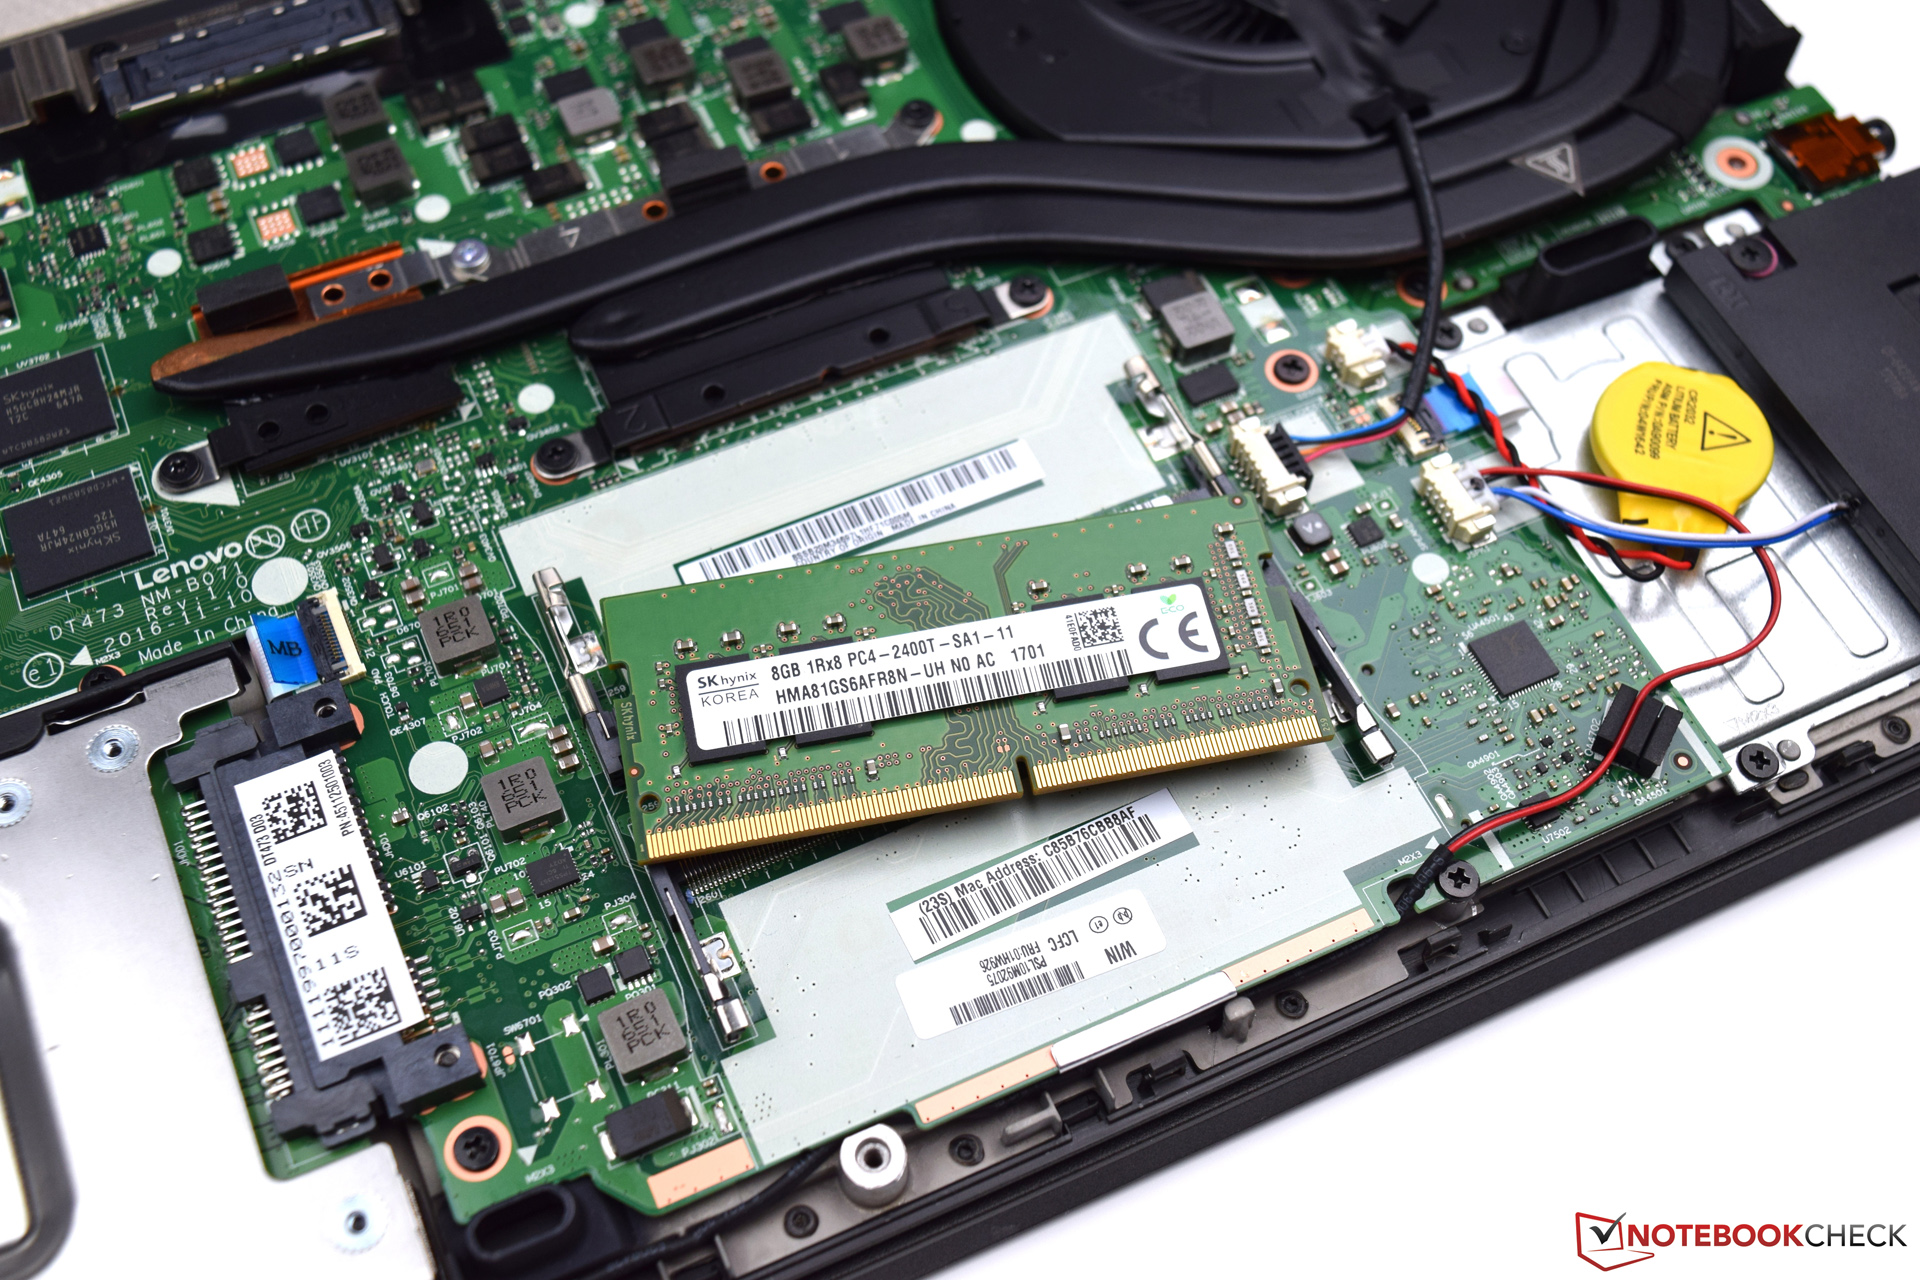
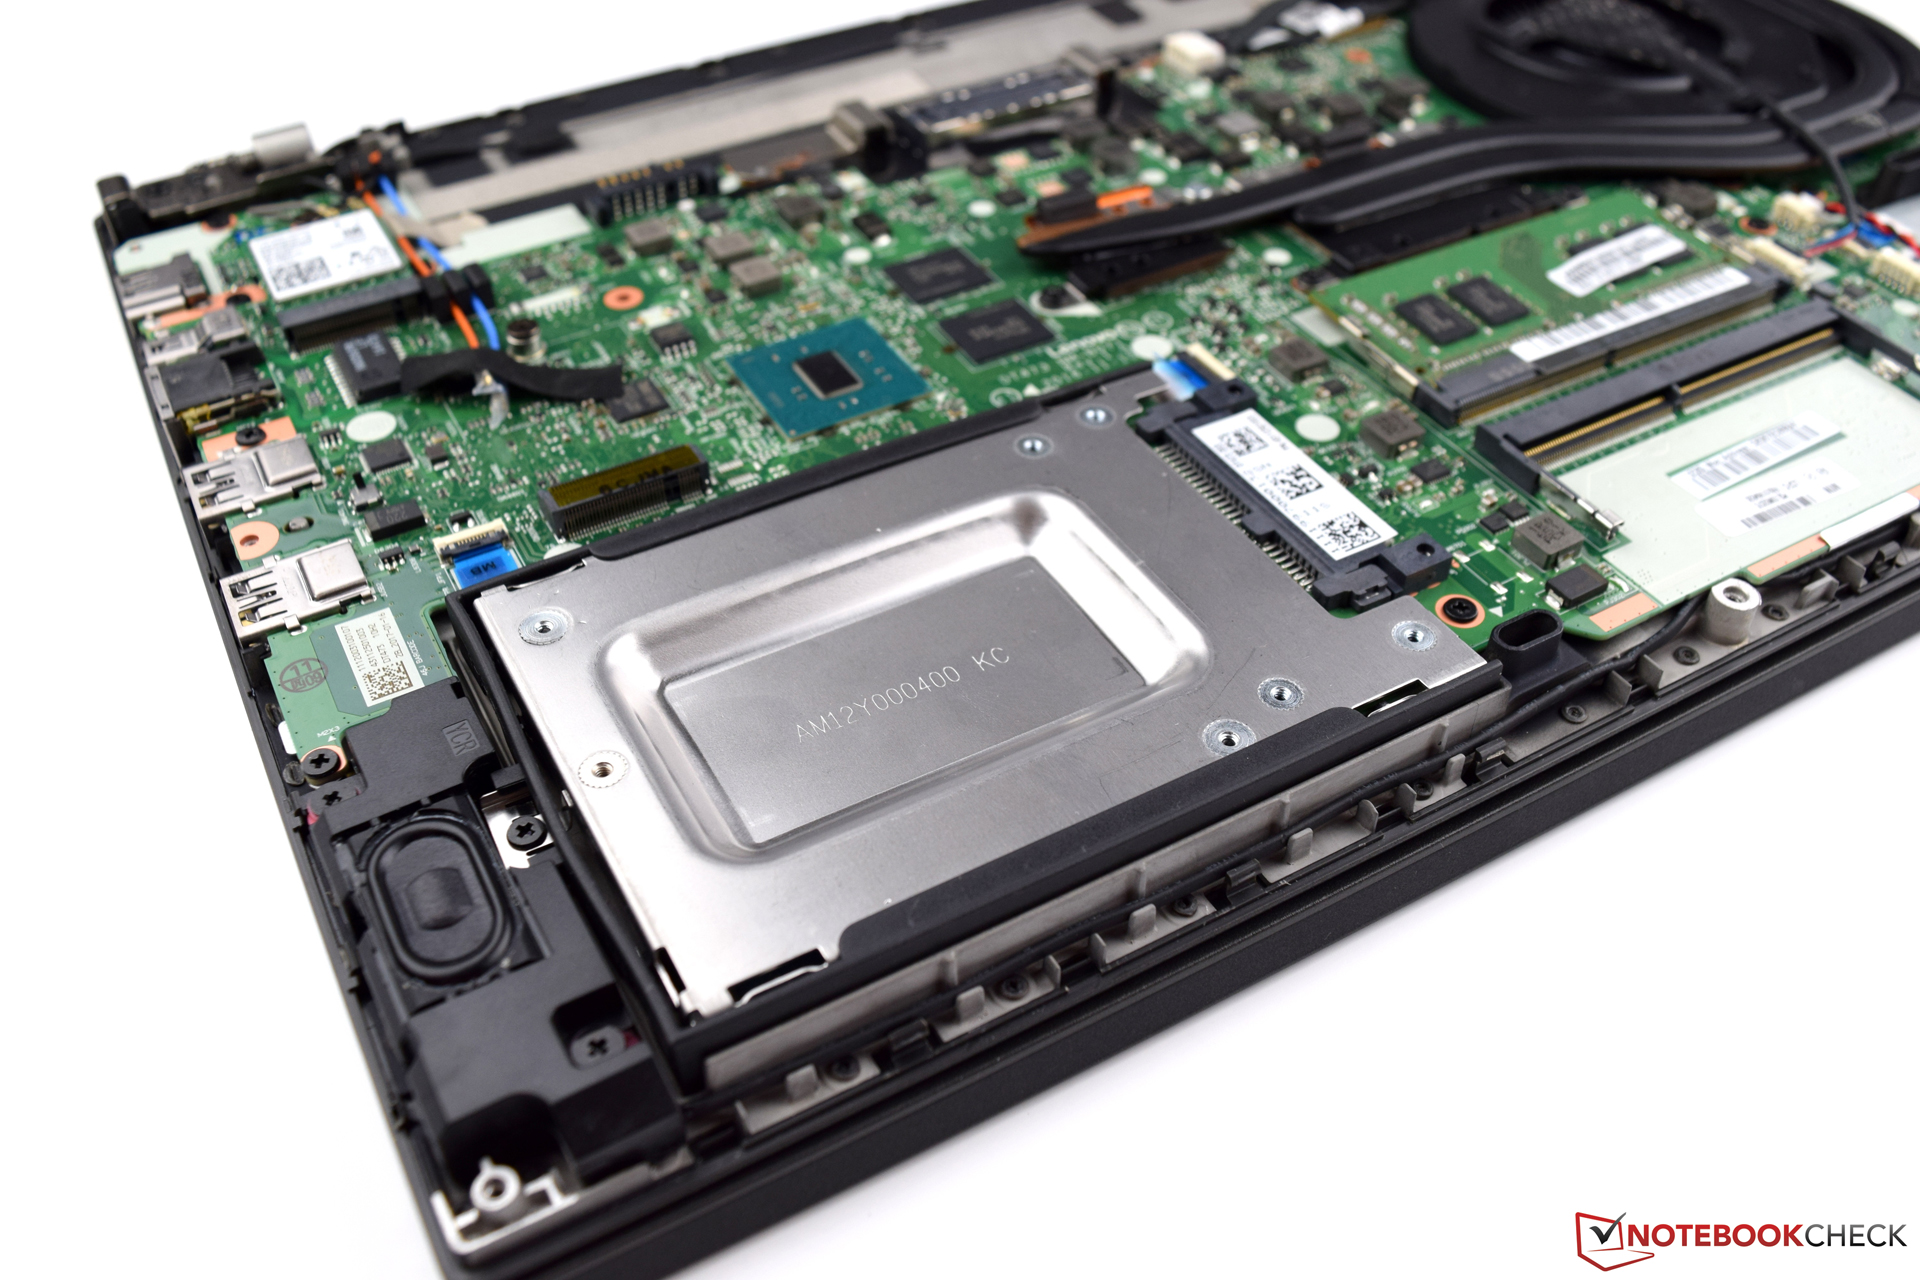
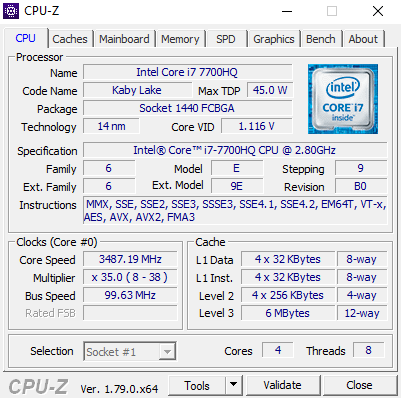
联想更新原有的机型,并为ThinkPad T470p配备了非常强大的Kaby Lake处理器,其性能远远超出了所设想的用途。而看似不够充足的内存(8 GB DDR4)可以在必要时扩展。我们喜欢所有的那些功能,它们把联想ThinkPad T470p变成商务本。尽管如此,制造商还为它提供了一个专用的显卡,使它能够以可行的帧速率将一些游戏呈现到屏幕上。存储解决方案提供了非常好的性能,并为系统的平稳运行做出了贡献。然而,必须注意到的是价格,这个设备的价格在2099欧元(约合2367美元)。在这个价格上,您获得的是14英寸高性能商务笔记本,且配备了非常好的输入设备。
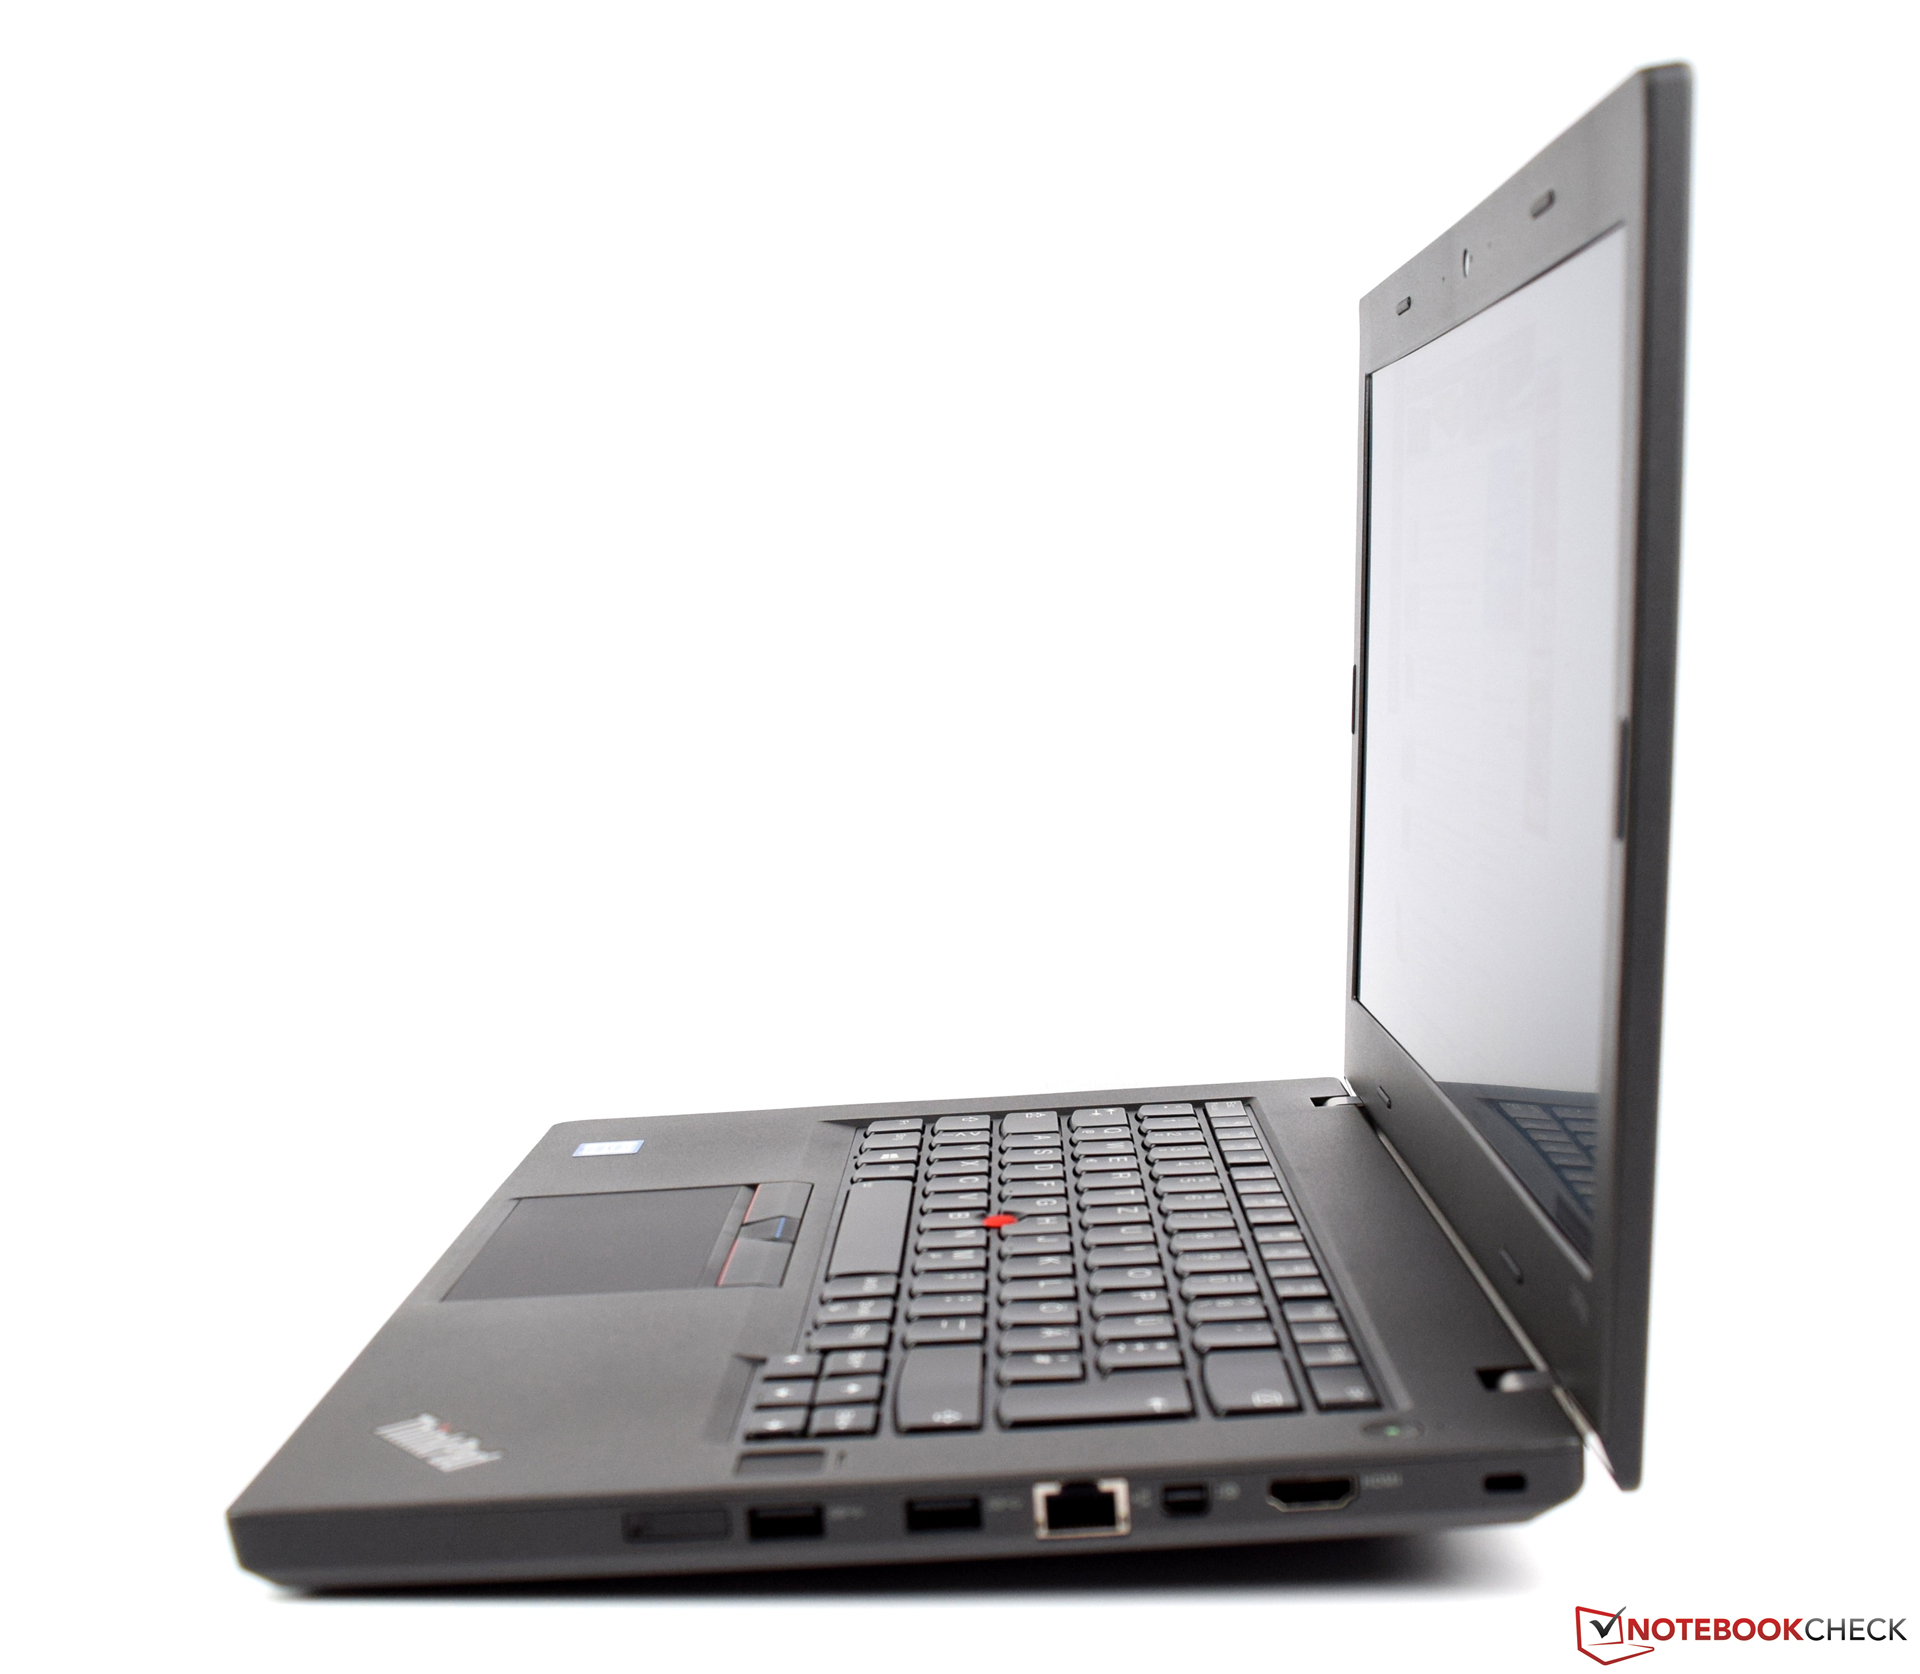
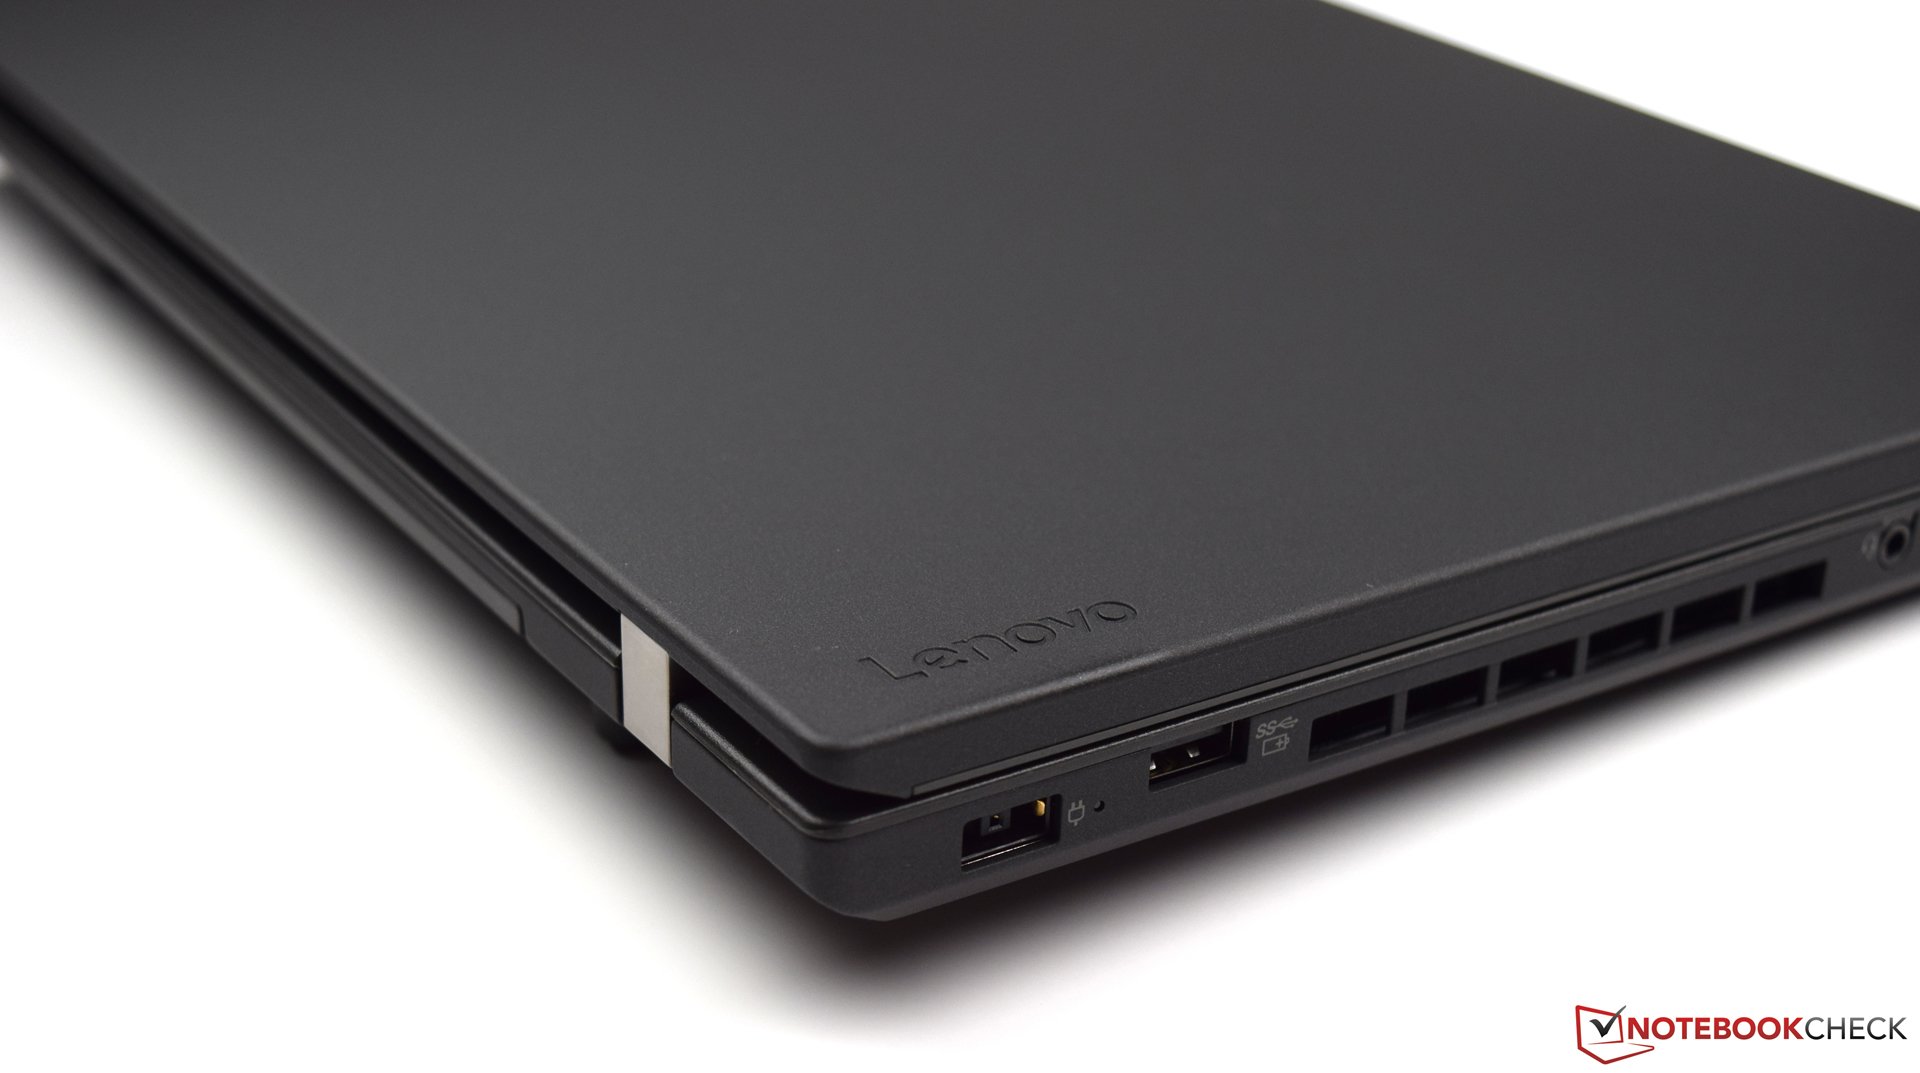
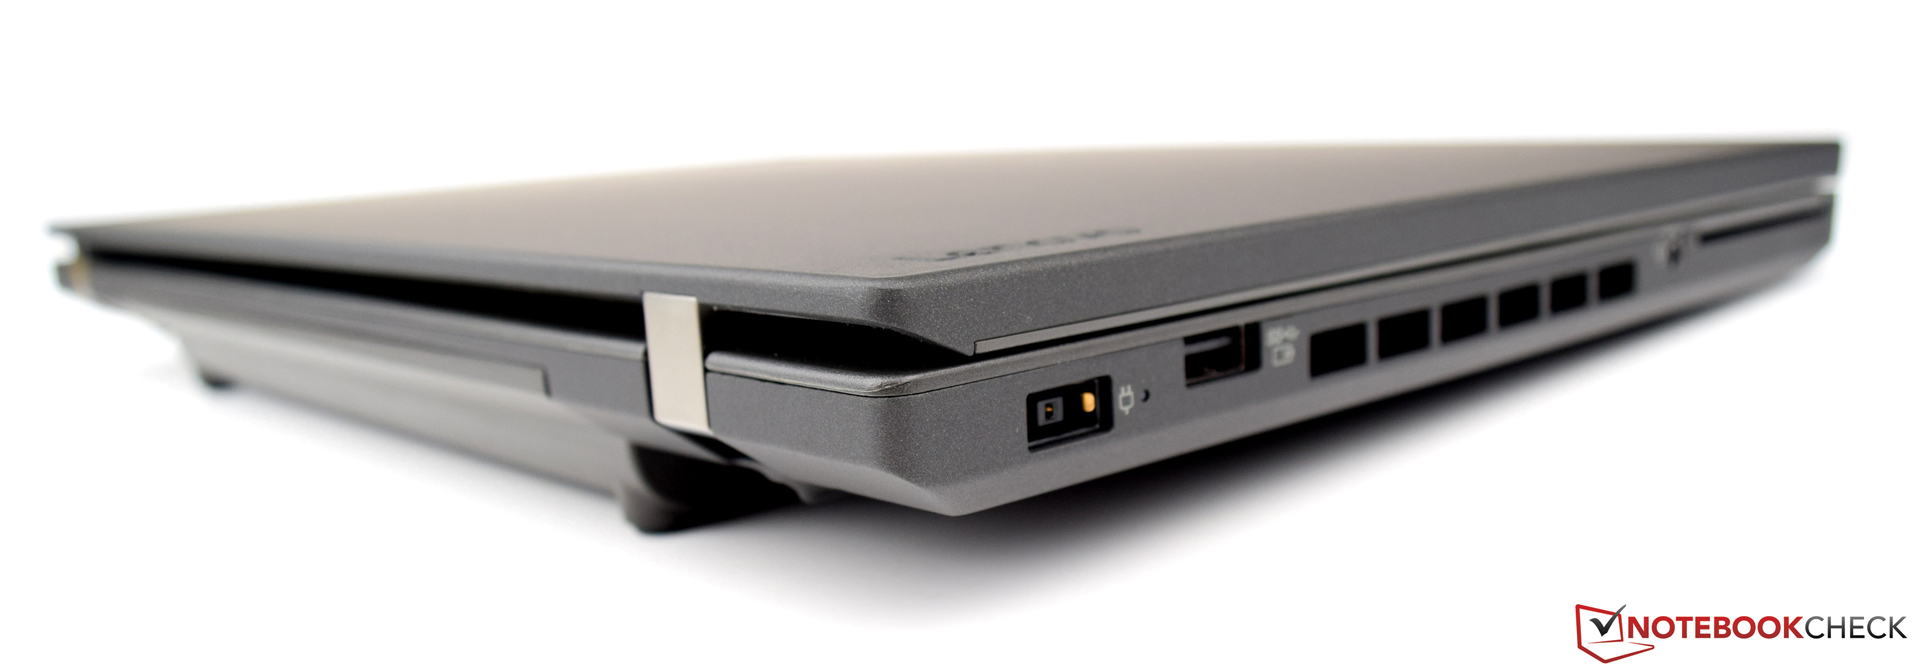
不过,联想ThinkPad T470p仍然有值得抱怨的地方:尽管显示屏提供了稳定的性能,但在亮度方面仍然落后于预期。我们不理解,为什么联想不提供一种可以被应用于未来几年的新型设备,同时具有时下的接口。对于这个价格,用户理应得到至少一个支持雷电的USB 3.1 Type-C端口。最后一点,后续的冷却性能也要提高。
作为14英寸的高性能四核设备,T470p在现在看来,具有非常独特的功能。
总的来说,联想ThinkPad T470p留下了不错的印象。卓越的系统性能和专用的显卡加强了设备能力,使其适用于多种使用场景。除了办公使用,联想ThinkPad T470p还可以很好地处理多媒体任务,甚至可以运行一些游戏,没有任何问题。
注:本文是基于完整评测的缩减版本,阅读完整的英文评测,请点击这里。
Lenovo ThinkPad T470p-20J7S00000
- 05/14/2017 v6 (old)
Sebastian Bade