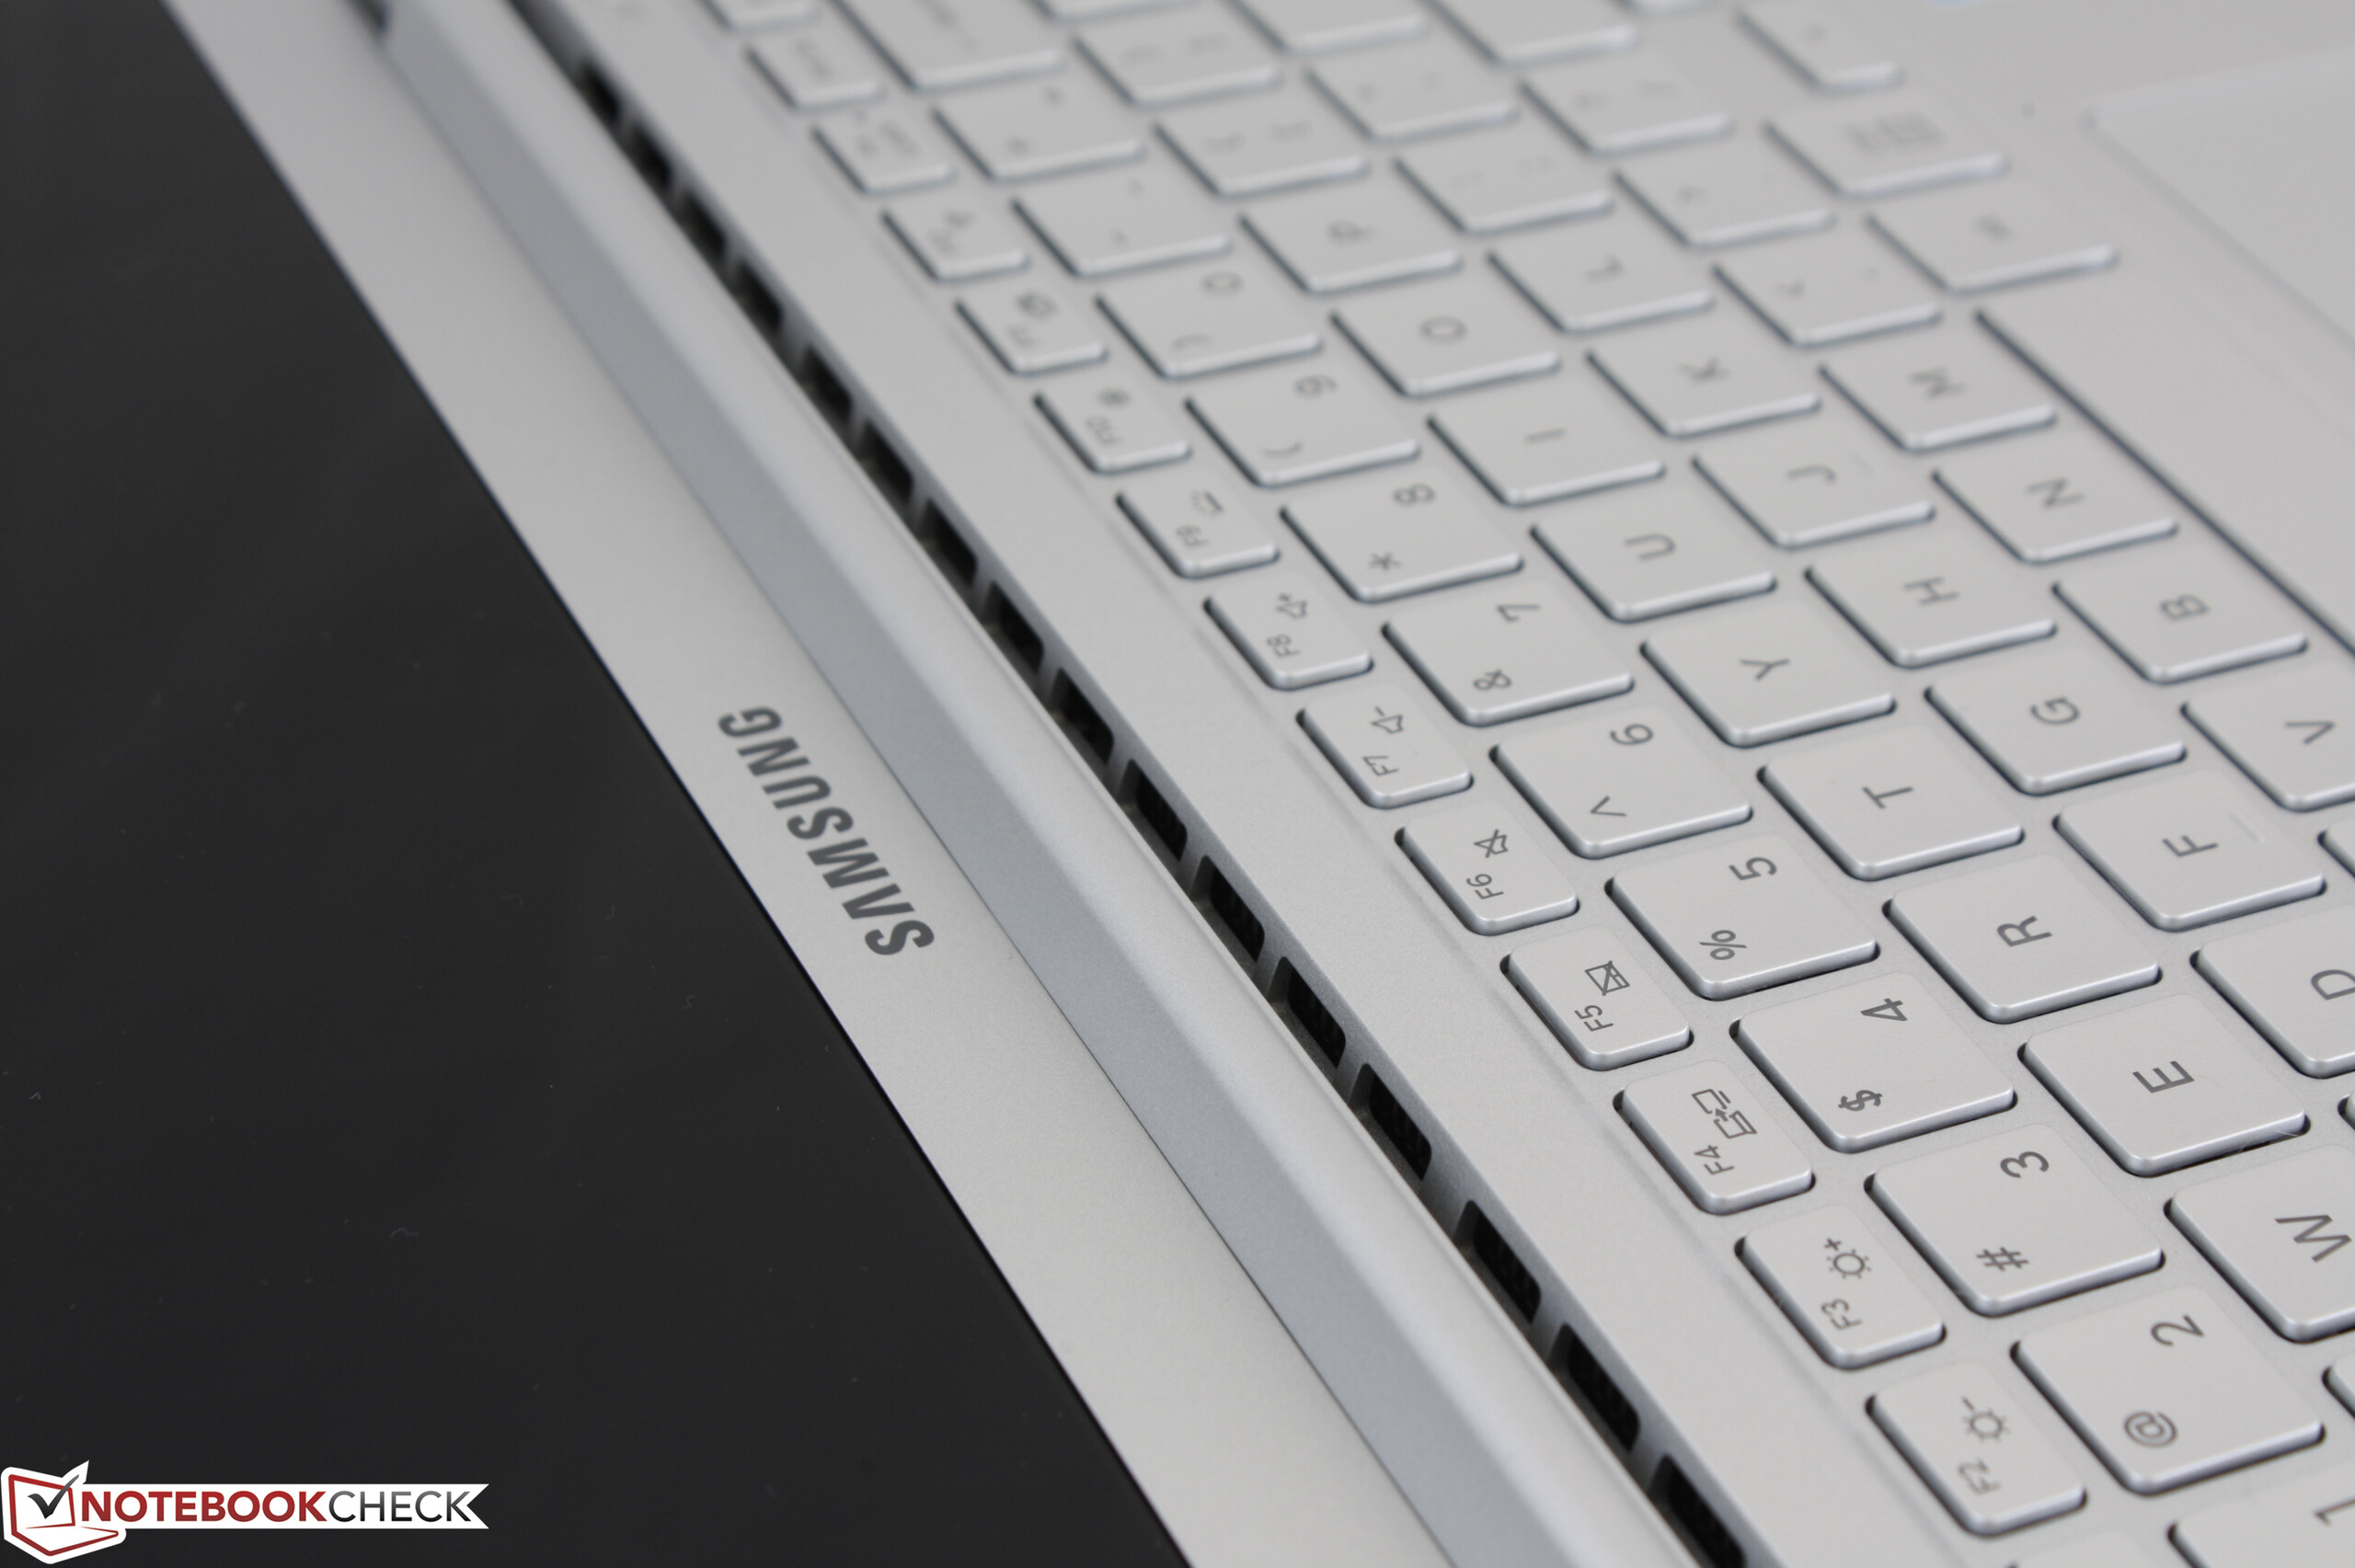
三星 Notebook 9 NP900X5N (7500U, FHD, GeForce 940MX) 笔记本电脑简短评测


| SD Card Reader | |
| average JPG Copy Test (av. of 3 runs) | |
| Dell XPS 15 9560 (i7-7700HQ, UHD) | |
| Samsung Notebook 9 NP900X5N-X01US | |
| Dell Latitude 12 5285 2-in-1 | |
| maximum AS SSD Seq Read Test (1GB) | |
| Dell XPS 15 9560 (i7-7700HQ, UHD) | |
| Dell Latitude 12 5285 2-in-1 | |
| Samsung Notebook 9 NP900X5N-X01US | |
| Networking | |
| iperf3 transmit AX12 | |
| Dell XPS 15 9560 (i7-7700HQ, UHD) | |
| Samsung Notebook 9 NP900X5N-X01US | |
| Dell XPS 13 9365-4537 2-in-1 | |
| iperf3 receive AX12 | |
| Samsung Notebook 9 NP900X5N-X01US | |
| Dell XPS 15 9560 (i7-7700HQ, UHD) | |
| Dell XPS 13 9365-4537 2-in-1 | |
| |||||||||||||||||||||||||
Brightness Distribution: 88 %
Center on Battery: 565.6 cd/m²
Contrast: 1154:1 (Black: 0.49 cd/m²)
ΔE ColorChecker Calman: 2 | ∀{0.5-29.43 Ø4.71}
ΔE Greyscale Calman: 2.5 | ∀{0.09-98 Ø4.96}
97.5% sRGB (Argyll 1.6.3 3D)
61.2% AdobeRGB 1998 (Argyll 1.6.3 3D)
67.2% AdobeRGB 1998 (Argyll 3D)
97.7% sRGB (Argyll 3D)
65.2% Display P3 (Argyll 3D)
Gamma: 2.21
CCT: 6896 K
| Samsung Notebook 9 NP900X5N-X01US ID: BOE06E8, Name: BOE HF NV150FHB-N31, IPS, 15", 1920x1080 | Dell XPS 15 2017 9560 (7300HQ, Full-HD) Sharp SHP1453 LQ156M1, LED IGZO IPS InfinityEdge, 15.6", 1920x1080 | Apple MacBook Pro 15 2016 (2.9 GHz, 460) Apple APPA030, IPS, 15.4", 2880x1800 | HP Spectre x360 15-bl002xx UHD UWVA eDP BrightView WLED-backlit , IPS, 15.6", 3840x2160 | Lenovo ThinkPad T570-20HAS01E00 BOE NV156QUM-N44, IPS, 15.6", 3840x2160 | |
|---|---|---|---|---|---|
| Display | 4% | 28% | -3% | -0% | |
| Display P3 Coverage (%) | 65.2 | 68.9 6% | 99 52% | 67.9 4% | 70 7% |
| sRGB Coverage (%) | 97.7 | 98.9 1% | 100 2% | 88.2 -10% | 91.1 -7% |
| AdobeRGB 1998 Coverage (%) | 67.2 | 70.9 6% | 87.3 30% | 64.4 -4% | 66.7 -1% |
| Response Times | -47% | -43% | -14% | 26% | |
| Response Time Grey 50% / Grey 80% * (ms) | 40.8 ? | 54 ? -32% | 46 ? -13% | 44 ? -8% | 41.6 ? -2% |
| Response Time Black / White * (ms) | 32.4 ? | 52.4 ? -62% | 56 ? -73% | 38.8 ? -20% | 15.2 ? 53% |
| PWM Frequency (Hz) | 208.3 ? | 119000 ? | 1000 ? | 926 ? | |
| Screen | -42% | -3% | -9% | -35% | |
| Brightness middle (cd/m²) | 565.6 | 400 -29% | 420 -26% | 351.5 -38% | 339 -40% |
| Brightness (cd/m²) | 524 | 392 -25% | 401 -23% | 336 -36% | 314 -40% |
| Brightness Distribution (%) | 88 | 89 1% | 90 2% | 83 -6% | 89 1% |
| Black Level * (cd/m²) | 0.49 | 0.26 47% | 0.3 39% | 0.24 51% | 0.36 27% |
| Contrast (:1) | 1154 | 1538 33% | 1400 21% | 1465 27% | 942 -18% |
| Colorchecker dE 2000 * | 2 | 4.9 -145% | 3.33 -67% | 3.3 -65% | 4.2 -110% |
| Colorchecker dE 2000 max. * | 5 | 11 -120% | 5.11 -2% | 7.3 -46% | 7.8 -56% |
| Greyscale dE 2000 * | 2.5 | 7.2 -188% | 2.73 -9% | 1.9 24% | 5.1 -104% |
| Gamma | 2.21 100% | 2.11 104% | 2.48 89% | 2.09 105% | 2.16 102% |
| CCT | 6896 94% | 6911 94% | 6457 101% | 6784 96% | 6569 99% |
| Color Space (Percent of AdobeRGB 1998) (%) | 61.2 | 64.2 5% | 78.09 28% | 64.4 5% | 59.4 -3% |
| Color Space (Percent of sRGB) (%) | 97.5 | 98.9 1% | 99.97 3% | 88.2 -10% | 91 -7% |
| Total Average (Program / Settings) | -28% /
-33% | -6% /
-2% | -9% /
-9% | -3% /
-20% |
* ... smaller is better
Display Response Times
| ↔ Response Time Black to White | ||
|---|---|---|
| 32.4 ms ... rise ↗ and fall ↘ combined | ↗ 17.6 ms rise | 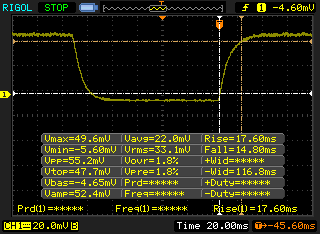 |
| ↘ 14.8 ms fall | ||
| The screen shows slow response rates in our tests and will be unsatisfactory for gamers. In comparison, all tested devices range from 0.1 (minimum) to 240 (maximum) ms. » 88 % of all devices are better. This means that the measured response time is worse than the average of all tested devices (19.8 ms). | ||
| ↔ Response Time 50% Grey to 80% Grey | ||
| 40.8 ms ... rise ↗ and fall ↘ combined | ↗ 20.4 ms rise | 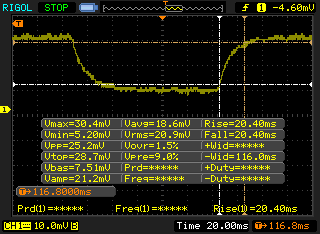 |
| ↘ 20.4 ms fall | ||
| The screen shows slow response rates in our tests and will be unsatisfactory for gamers. In comparison, all tested devices range from 0.165 (minimum) to 636 (maximum) ms. » 64 % of all devices are better. This means that the measured response time is worse than the average of all tested devices (31 ms). | ||
Screen Flickering / PWM (Pulse-Width Modulation)
| Screen flickering / PWM detected | 208.3 Hz | ≤ 99 % brightness setting | 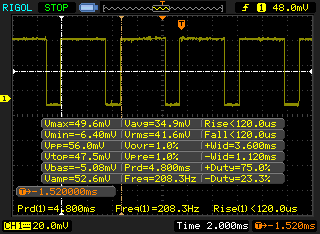 |
The display backlight flickers at 208.3 Hz (worst case, e.g., utilizing PWM) Flickering detected at a brightness setting of 99 % and below. There should be no flickering or PWM above this brightness setting. The frequency of 208.3 Hz is relatively low, so sensitive users will likely notice flickering and experience eyestrain at the stated brightness setting and below. In comparison: 52 % of all tested devices do not use PWM to dim the display. If PWM was detected, an average of 7754 (minimum: 5 - maximum: 343500) Hz was measured. | |||
| Cinebench R11.5 | |
| CPU Single 64Bit | |
| Lenovo ThinkPad 13-20J2S00G00 | |
| Samsung Notebook 9 NP900X5N-X01US | |
| Dell Latitude 5280 | |
| Lenovo U31-70 80M5003EGE | |
| Toshiba Portege Z30t-A-10X | |
| Acer TravelMate P449-M-7407 | |
| Lenovo Thinkpad 13-20J1001BUS | |
| CPU Multi 64Bit | |
| Lenovo ThinkPad 13-20J2S00G00 | |
| Samsung Notebook 9 NP900X5N-X01US | |
| Dell Latitude 5280 | |
| Acer TravelMate P449-M-7407 | |
| Lenovo U31-70 80M5003EGE | |
| Lenovo Thinkpad 13-20J1001BUS | |
| Toshiba Portege Z30t-A-10X | |
| Cinebench R10 | |
| Rendering Multiple CPUs 32Bit | |
| Apple MacBook Pro 15 2016 (2.7 GHz, 455) | |
| Samsung Notebook 9 NP900X5N-X01US | |
| Dell Latitude 5280 | |
| Lenovo ThinkPad 13-20J2S00G00 | |
| Lenovo U31-70 80M5003EGE | |
| Acer TravelMate P449-M-7407 | |
| Lenovo Thinkpad 13-20J1001BUS | |
| Toshiba Portege Z30t-A-10X | |
| Rendering Single 32Bit | |
| Samsung Notebook 9 NP900X5N-X01US | |
| Apple MacBook Pro 15 2016 (2.7 GHz, 455) | |
| Dell Latitude 5280 | |
| Lenovo ThinkPad 13-20J2S00G00 | |
| Acer TravelMate P449-M-7407 | |
| Lenovo U31-70 80M5003EGE | |
| Toshiba Portege Z30t-A-10X | |
| Lenovo Thinkpad 13-20J1001BUS | |
| wPrime 2.10 - 1024m | |
| Lenovo Thinkpad 13-20J1001BUS | |
| Acer TravelMate P449-M-7407 | |
| Dell Latitude 5280 | |
| Samsung Notebook 9 NP900X5N-X01US | |
| Apple MacBook Pro 15 2016 (2.7 GHz, 455) | |
* ... smaller is better
| PCMark 8 | |
| Home Score Accelerated v2 | |
| Apple MacBook Pro 15 2016 (2.9 GHz, 460) | |
| Samsung Notebook 9 NP900X5N-X01US | |
| Dell XPS 15 9560 (i7-7700HQ, UHD) | |
| Work Score Accelerated v2 | |
| Samsung Notebook 9 NP900X5N-X01US | |
| Apple MacBook Pro 15 2016 (2.9 GHz, 460) | |
| Dell XPS 15 9560 (i7-7700HQ, UHD) | |
| Creative Score Accelerated v2 | |
| Dell XPS 15 9560 (i7-7700HQ, UHD) | |
| Apple MacBook Pro 15 2016 (2.9 GHz, 460) | |
| Samsung Notebook 9 NP900X5N-X01US | |
| PCMark 8 Home Score Accelerated v2 | 3852 points | |
| PCMark 8 Creative Score Accelerated v2 | 4769 points | |
| PCMark 8 Work Score Accelerated v2 | 4928 points | |
Help | ||
| Samsung Notebook 9 NP900X5N-X01US Samsung PM961 MZVLW256HEHP | Dell XPS 15 9560 (i7-7700HQ, UHD) Lite-On CX2-8B512-Q11 | Apple MacBook Pro 15 2016 (2.9 GHz, 460) Apple SSD SM1024L | HP Spectre x360 15-bl002xx Toshiba XG4 NVMe (THNSN5512GPUK) | Lenovo ThinkPad T570-20HAS01E00 Samsung PM961 NVMe MZVLW512HMJP | |
|---|---|---|---|---|---|
| CrystalDiskMark 3.0 | 8% | -3% | -6% | 5% | |
| Read Seq (MB/s) | 1447 | 1684 16% | 1458 1% | 1266 -13% | 1210 -16% |
| Write Seq (MB/s) | 1281 | 1106 -14% | 1440 12% | 982 -23% | 1134 -11% |
| Read 512 (MB/s) | 651 | 977 50% | 914 40% | 834 28% | 789 21% |
| Write 512 (MB/s) | 765 | 1119 46% | 1058 38% | 714 -7% | 903 18% |
| Read 4k (MB/s) | 58.3 | 45.14 -23% | 9.786 -83% | 40.72 -30% | 58.4 0% |
| Write 4k (MB/s) | 131.9 | 134.1 2% | 10.9 -92% | 139.4 6% | 144.1 9% |
| Read 4k QD32 (MB/s) | 545 | 509 -7% | 679 25% | 527 -3% | 559 3% |
| Write 4k QD32 (MB/s) | 419.3 | 398.1 -5% | 562 34% | 395.2 -6% | 474.4 13% |

| 3DMark 11 | |
| 1280x720 Performance GPU | |
| Intel Skull Canyon NUC6i7KYK | |
| Apple MacBook Pro 13 2016 (2.9 GHz) | |
| Asus AsusPro P4540UQ-FY0056R | |
| HP Spectre x360 15-bl002xx | |
| Samsung Notebook 9 NP900X5N-X01US | |
| HP 15-ba077ng | |
| Dell Latitude 5280 | |
| Apple MacBook 12 (Early 2016) 1.2 GHz | |
| Toshiba Satellite Pro R50-C-16V | |
| 1280x720 Performance Combined | |
| Intel Skull Canyon NUC6i7KYK | |
| HP Spectre x360 15-bl002xx | |
| Apple MacBook Pro 13 2016 (2.9 GHz) | |
| Asus AsusPro P4540UQ-FY0056R | |
| Samsung Notebook 9 NP900X5N-X01US | |
| HP 15-ba077ng | |
| Apple MacBook 12 (Early 2016) 1.2 GHz | |
| Dell Latitude 5280 | |
| Toshiba Satellite Pro R50-C-16V | |
| 3DMark | |
| 1280x720 Cloud Gate Standard Graphics | |
| Intel Skull Canyon NUC6i7KYK | |
| Apple MacBook Pro 13 2016 (2.9 GHz) | |
| HP Spectre x360 15-bl002xx | |
| Asus AsusPro P4540UQ-FY0056R | |
| Samsung Notebook 9 NP900X5N-X01US | |
| HP 15-ba077ng | |
| Apple MacBook 12 (Early 2016) 1.2 GHz | |
| Dell Latitude 5280 | |
| 1920x1080 Fire Strike Graphics | |
| HP Spectre x360 15-bl002xx | |
| Asus AsusPro P4540UQ-FY0056R | |
| Intel Skull Canyon NUC6i7KYK | |
| Apple MacBook Pro 13 2016 (2.9 GHz) | |
| Samsung Notebook 9 NP900X5N-X01US | |
| HP 15-ba077ng | |
| Apple MacBook 12 (Early 2016) 1.2 GHz | |
| Dell Latitude 5280 | |
| 1920x1080 Ice Storm Extreme Graphics | |
| Intel Skull Canyon NUC6i7KYK | |
| Samsung Notebook 9 NP900X5N-X01US | |
| HP 15-ba077ng | |
| Dell Latitude 5280 | |
| HP Spectre x360 15-bl002xx | |
| 3DMark 11 Performance | 2372 points | |
| 3DMark Ice Storm Standard Score | 49982 points | |
| 3DMark Cloud Gate Standard Score | 6800 points | |
| 3DMark Fire Strike Score | 1408 points | |
| 3DMark Fire Strike Extreme Score | 722 points | |
Help | ||
| BioShock Infinite - 1366x768 High Preset | |
| Lenovo ThinkPad T570-20HAS01E00 | |
| Intel Skull Canyon NUC6i7KYK | |
| Apple MacBook Pro 13 2016 (2.9 GHz) | |
| Samsung Notebook 9 NP900X5N-X01US | |
| Dell Latitude 5280 | |
| Toshiba Satellite Pro R50-C-16V | |
| low | med. | high | ultra | |
|---|---|---|---|---|
| BioShock Infinite (2013) | 89.8 | 48.7 | 39.3 | 13.5 |
| The Witcher 3 (2015) | 31 | |||
| Dota 2 Reborn (2015) | 95 | 64 | 24 | |
| Rise of the Tomb Raider (2016) | 37.4 | 20.5 | 10.9 | |
| Overwatch (2016) | 65.2 | 44.8 |
Noise level
| Idle |
| 28.3 / 28.3 / 28.3 dB(A) |
| Load |
| 38.3 / 38.3 dB(A) |
 | ||
30 dB silent 40 dB(A) audible 50 dB(A) loud |
||
min: | ||
| Samsung Notebook 9 NP900X5N-X01US GeForce 940MX, i7-7500U, Samsung PM961 MZVLW256HEHP | Dell XPS 15 9560 (i7-7700HQ, UHD) GeForce GTX 1050 Mobile, i7-7700HQ, Lite-On CX2-8B512-Q11 | Apple MacBook Pro 15 2016 (2.9 GHz, 460) Radeon Pro 460, 6920HQ, Apple SSD SM1024L | HP Spectre x360 15-bl002xx GeForce 940MX, i7-7500U, Toshiba XG4 NVMe (THNSN5512GPUK) | Lenovo ThinkPad T570-20HAS01E00 GeForce 940MX, i7-7500U, Samsung PM961 NVMe MZVLW512HMJP | |
|---|---|---|---|---|---|
| Noise | -11% | -6% | -9% | -4% | |
| off / environment * (dB) | 28.3 | 28.4 -0% | 29 -2% | 28.5 -1% | 29.3 -4% |
| Idle Minimum * (dB) | 28.3 | 29 -2% | 30.3 -7% | 28.5 -1% | 29.3 -4% |
| Idle Average * (dB) | 28.3 | 29 -2% | 30.3 -7% | 28.5 -1% | 29.3 -4% |
| Idle Maximum * (dB) | 28.3 | 32.2 -14% | 30.3 -7% | 36.3 -28% | 31.1 -10% |
| Load Average * (dB) | 38.3 | 47.1 -23% | 35.1 8% | 42.7 -11% | 35.2 8% |
| Load Maximum * (dB) | 38.3 | 47.1 -23% | 46 -20% | 42.7 -11% | 41.3 -8% |
| Witcher 3 ultra * (dB) | 52 |
* ... smaller is better
(±) The maximum temperature on the upper side is 40.4 °C / 105 F, compared to the average of 36.8 °C / 98 F, ranging from 21 to 71 °C for the class Multimedia.
(±) The bottom heats up to a maximum of 42.4 °C / 108 F, compared to the average of 39.1 °C / 102 F
(+) In idle usage, the average temperature for the upper side is 22 °C / 72 F, compared to the device average of 31.3 °C / 88 F.
(+) The palmrests and touchpad are cooler than skin temperature with a maximum of 31.6 °C / 88.9 F and are therefore cool to the touch.
(-) The average temperature of the palmrest area of similar devices was 28.7 °C / 83.7 F (-2.9 °C / -5.2 F).
Samsung Notebook 9 NP900X5N-X01US audio analysis
(-) | not very loud speakers (58.2 dB)
Bass 100 - 315 Hz
(-) | nearly no bass - on average 16% lower than median
(±) | linearity of bass is average (13.2% delta to prev. frequency)
Mids 400 - 2000 Hz
(+) | balanced mids - only 3.8% away from median
(+) | mids are linear (6.8% delta to prev. frequency)
Highs 2 - 16 kHz
(+) | balanced highs - only 4.4% away from median
(±) | linearity of highs is average (13.7% delta to prev. frequency)
Overall 100 - 16.000 Hz
(±) | linearity of overall sound is average (29.8% difference to median)
Compared to same class
» 95% of all tested devices in this class were better, 2% similar, 3% worse
» The best had a delta of 5%, average was 17%, worst was 45%
Compared to all devices tested
» 88% of all tested devices were better, 3% similar, 9% worse
» The best had a delta of 4%, average was 23%, worst was 134%
Apple MacBook 12 (Early 2016) 1.1 GHz audio analysis
(+) | speakers can play relatively loud (83.6 dB)
Bass 100 - 315 Hz
(±) | reduced bass - on average 11.3% lower than median
(±) | linearity of bass is average (14.2% delta to prev. frequency)
Mids 400 - 2000 Hz
(+) | balanced mids - only 2.4% away from median
(+) | mids are linear (5.5% delta to prev. frequency)
Highs 2 - 16 kHz
(+) | balanced highs - only 2% away from median
(+) | highs are linear (4.5% delta to prev. frequency)
Overall 100 - 16.000 Hz
(+) | overall sound is linear (10.2% difference to median)
Compared to same class
» 7% of all tested devices in this class were better, 2% similar, 90% worse
» The best had a delta of 5%, average was 18%, worst was 53%
Compared to all devices tested
» 5% of all tested devices were better, 1% similar, 94% worse
» The best had a delta of 4%, average was 23%, worst was 134%
| Off / Standby | |
| Idle | |
| Load |
|
Key:
min: | |
| Samsung Notebook 9 NP900X5N-X01US i7-7500U, GeForce 940MX, Samsung PM961 MZVLW256HEHP, IPS, 1920x1080, 15" | Dell XPS 15 9560 (i7-7700HQ, UHD) i7-7700HQ, GeForce GTX 1050 Mobile, Lite-On CX2-8B512-Q11, IGZO IPS, 3840x2160, 15.6" | Apple MacBook Pro 15 2016 (2.9 GHz, 460) 6920HQ, Radeon Pro 460, Apple SSD SM1024L, IPS, 2880x1800, 15.4" | HP Spectre x360 15-bl002xx i7-7500U, GeForce 940MX, Toshiba XG4 NVMe (THNSN5512GPUK), IPS, 3840x2160, 15.6" | Asus VivoBook S15 S510UA i5-7200U, HD Graphics 620, Toshiba HG6 THNSNJ128G8NY, IPS, 1920x1080, 15.6" | |
|---|---|---|---|---|---|
| Power Consumption | -91% | -12% | -18% | 28% | |
| Idle Minimum * (Watt) | 5 | 11.9 -138% | 3 40% | 8.14 -63% | 4.6 8% |
| Idle Average * (Watt) | 11.6 | 17.1 -47% | 9.9 15% | 10.91 6% | 7.6 34% |
| Idle Maximum * (Watt) | 12.2 | 17.3 -42% | 12.5 -2% | 12.26 -0% | 7.7 37% |
| Load Average * (Watt) | 47.8 | 94.7 -98% | 70.6 -48% | 45.67 4% | 35.1 27% |
| Witcher 3 ultra * (Watt) | 51.9 | 104.8 -102% | |||
| Load Maximum * (Watt) | 55.7 | 122 -119% | 90.8 -63% | 74.94 -35% | 36.2 35% |
* ... smaller is better
| Samsung Notebook 9 NP900X5N-X01US i7-7500U, GeForce 940MX, 66 Wh | Dell XPS 15 9560 (i7-7700HQ, UHD) i7-7700HQ, GeForce GTX 1050 Mobile, 97 Wh | Apple MacBook Pro 15 2016 (2.9 GHz, 460) 6920HQ, Radeon Pro 460, 76 Wh | HP Spectre x360 15-bl002xx i7-7500U, GeForce 940MX, 79.2 Wh | Asus VivoBook S15 S510UA i5-7200U, HD Graphics 620, 42 Wh | Apple MacBook 13" T7200, Graphics Media Accelerator (GMA) 950, Wh | |
|---|---|---|---|---|---|---|
| Battery runtime | -30% | -26% | -9% | -52% | -36% | |
| Reader / Idle (h) | 27.4 | 13.9 -49% | 14.4 -47% | 10.2 -63% | 6.5 -76% | |
| WiFi v1.3 (h) | 10.1 | 7.2 -29% | 10.3 2% | 8.9 -12% | 4.3 -57% | |
| Load (h) | 1.9 | 1.7 -11% | 0.9 -53% | 2.5 32% | 1.2 -37% | 2 5% |
Pros
Cons
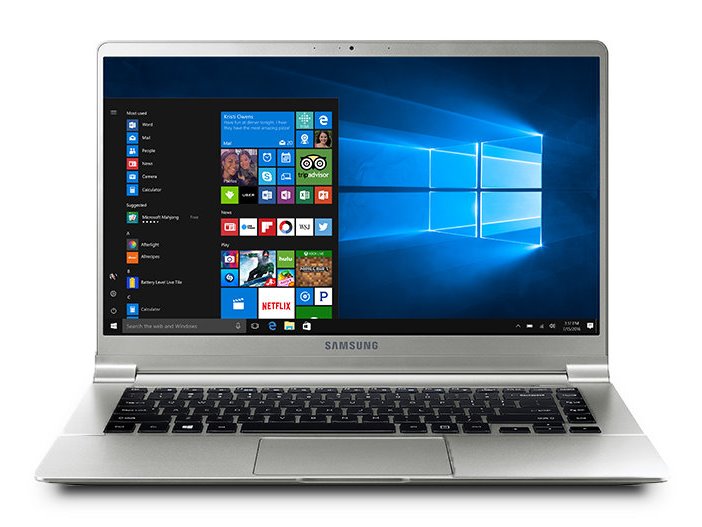
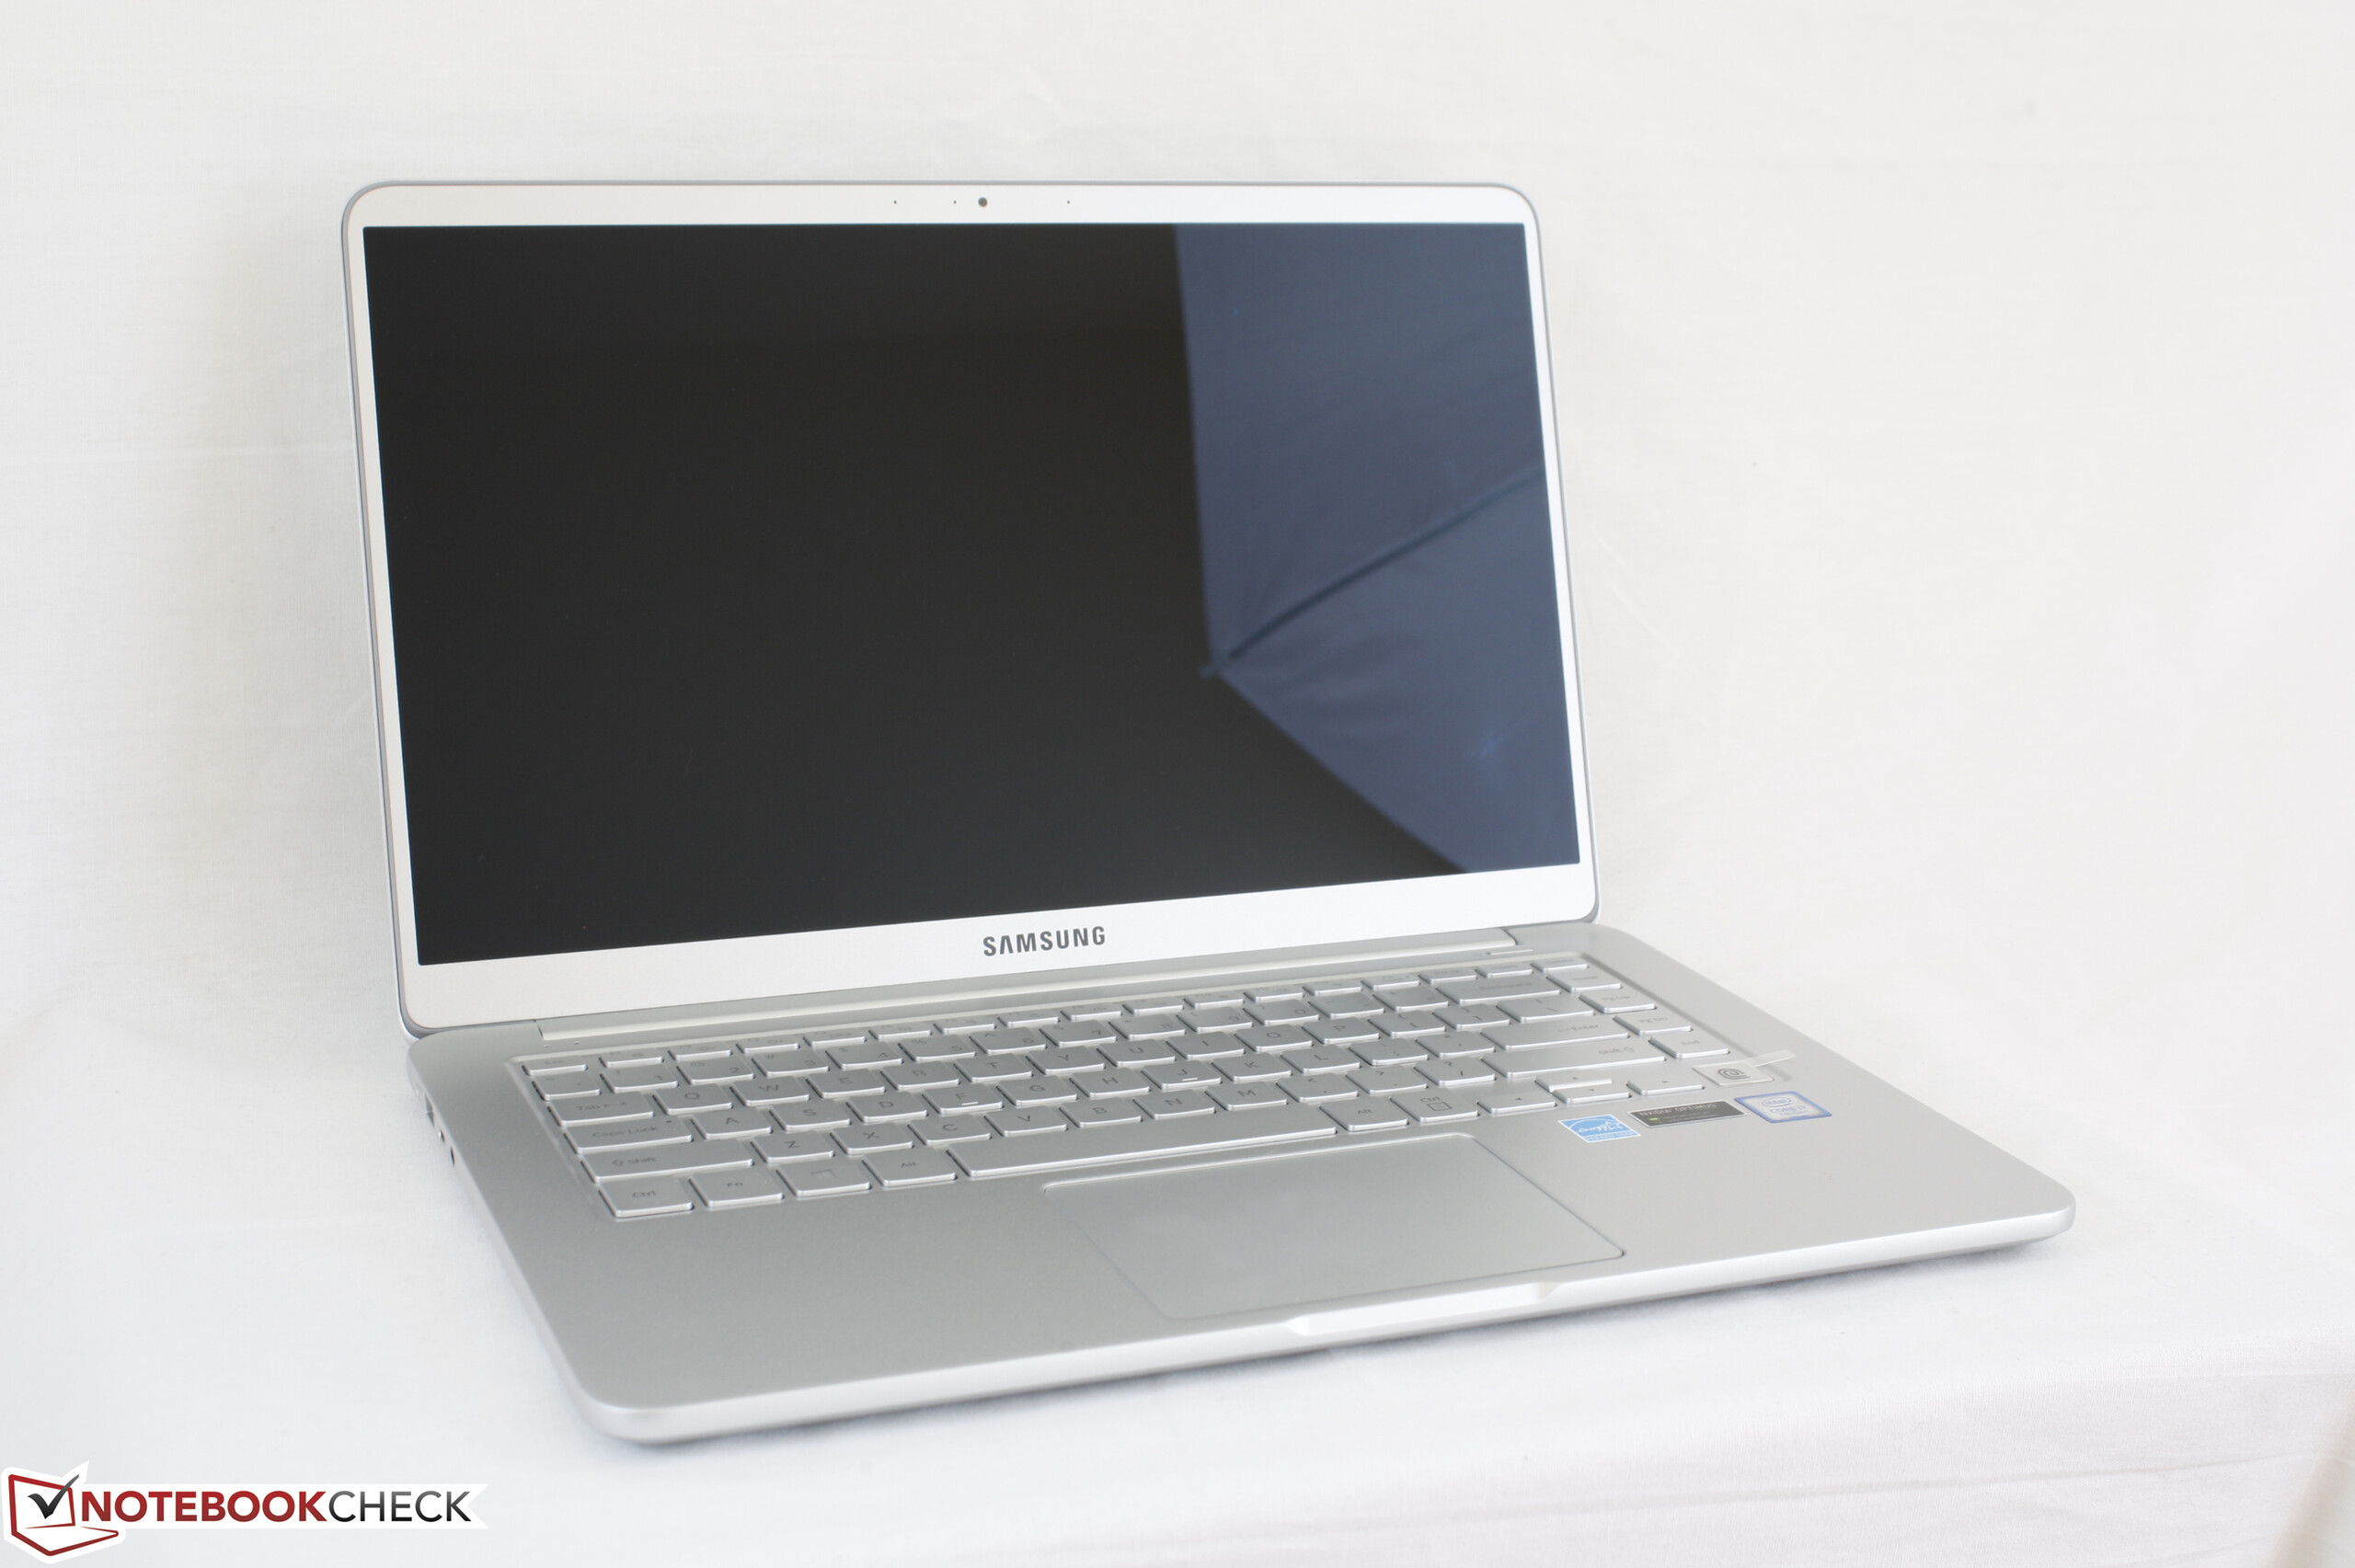
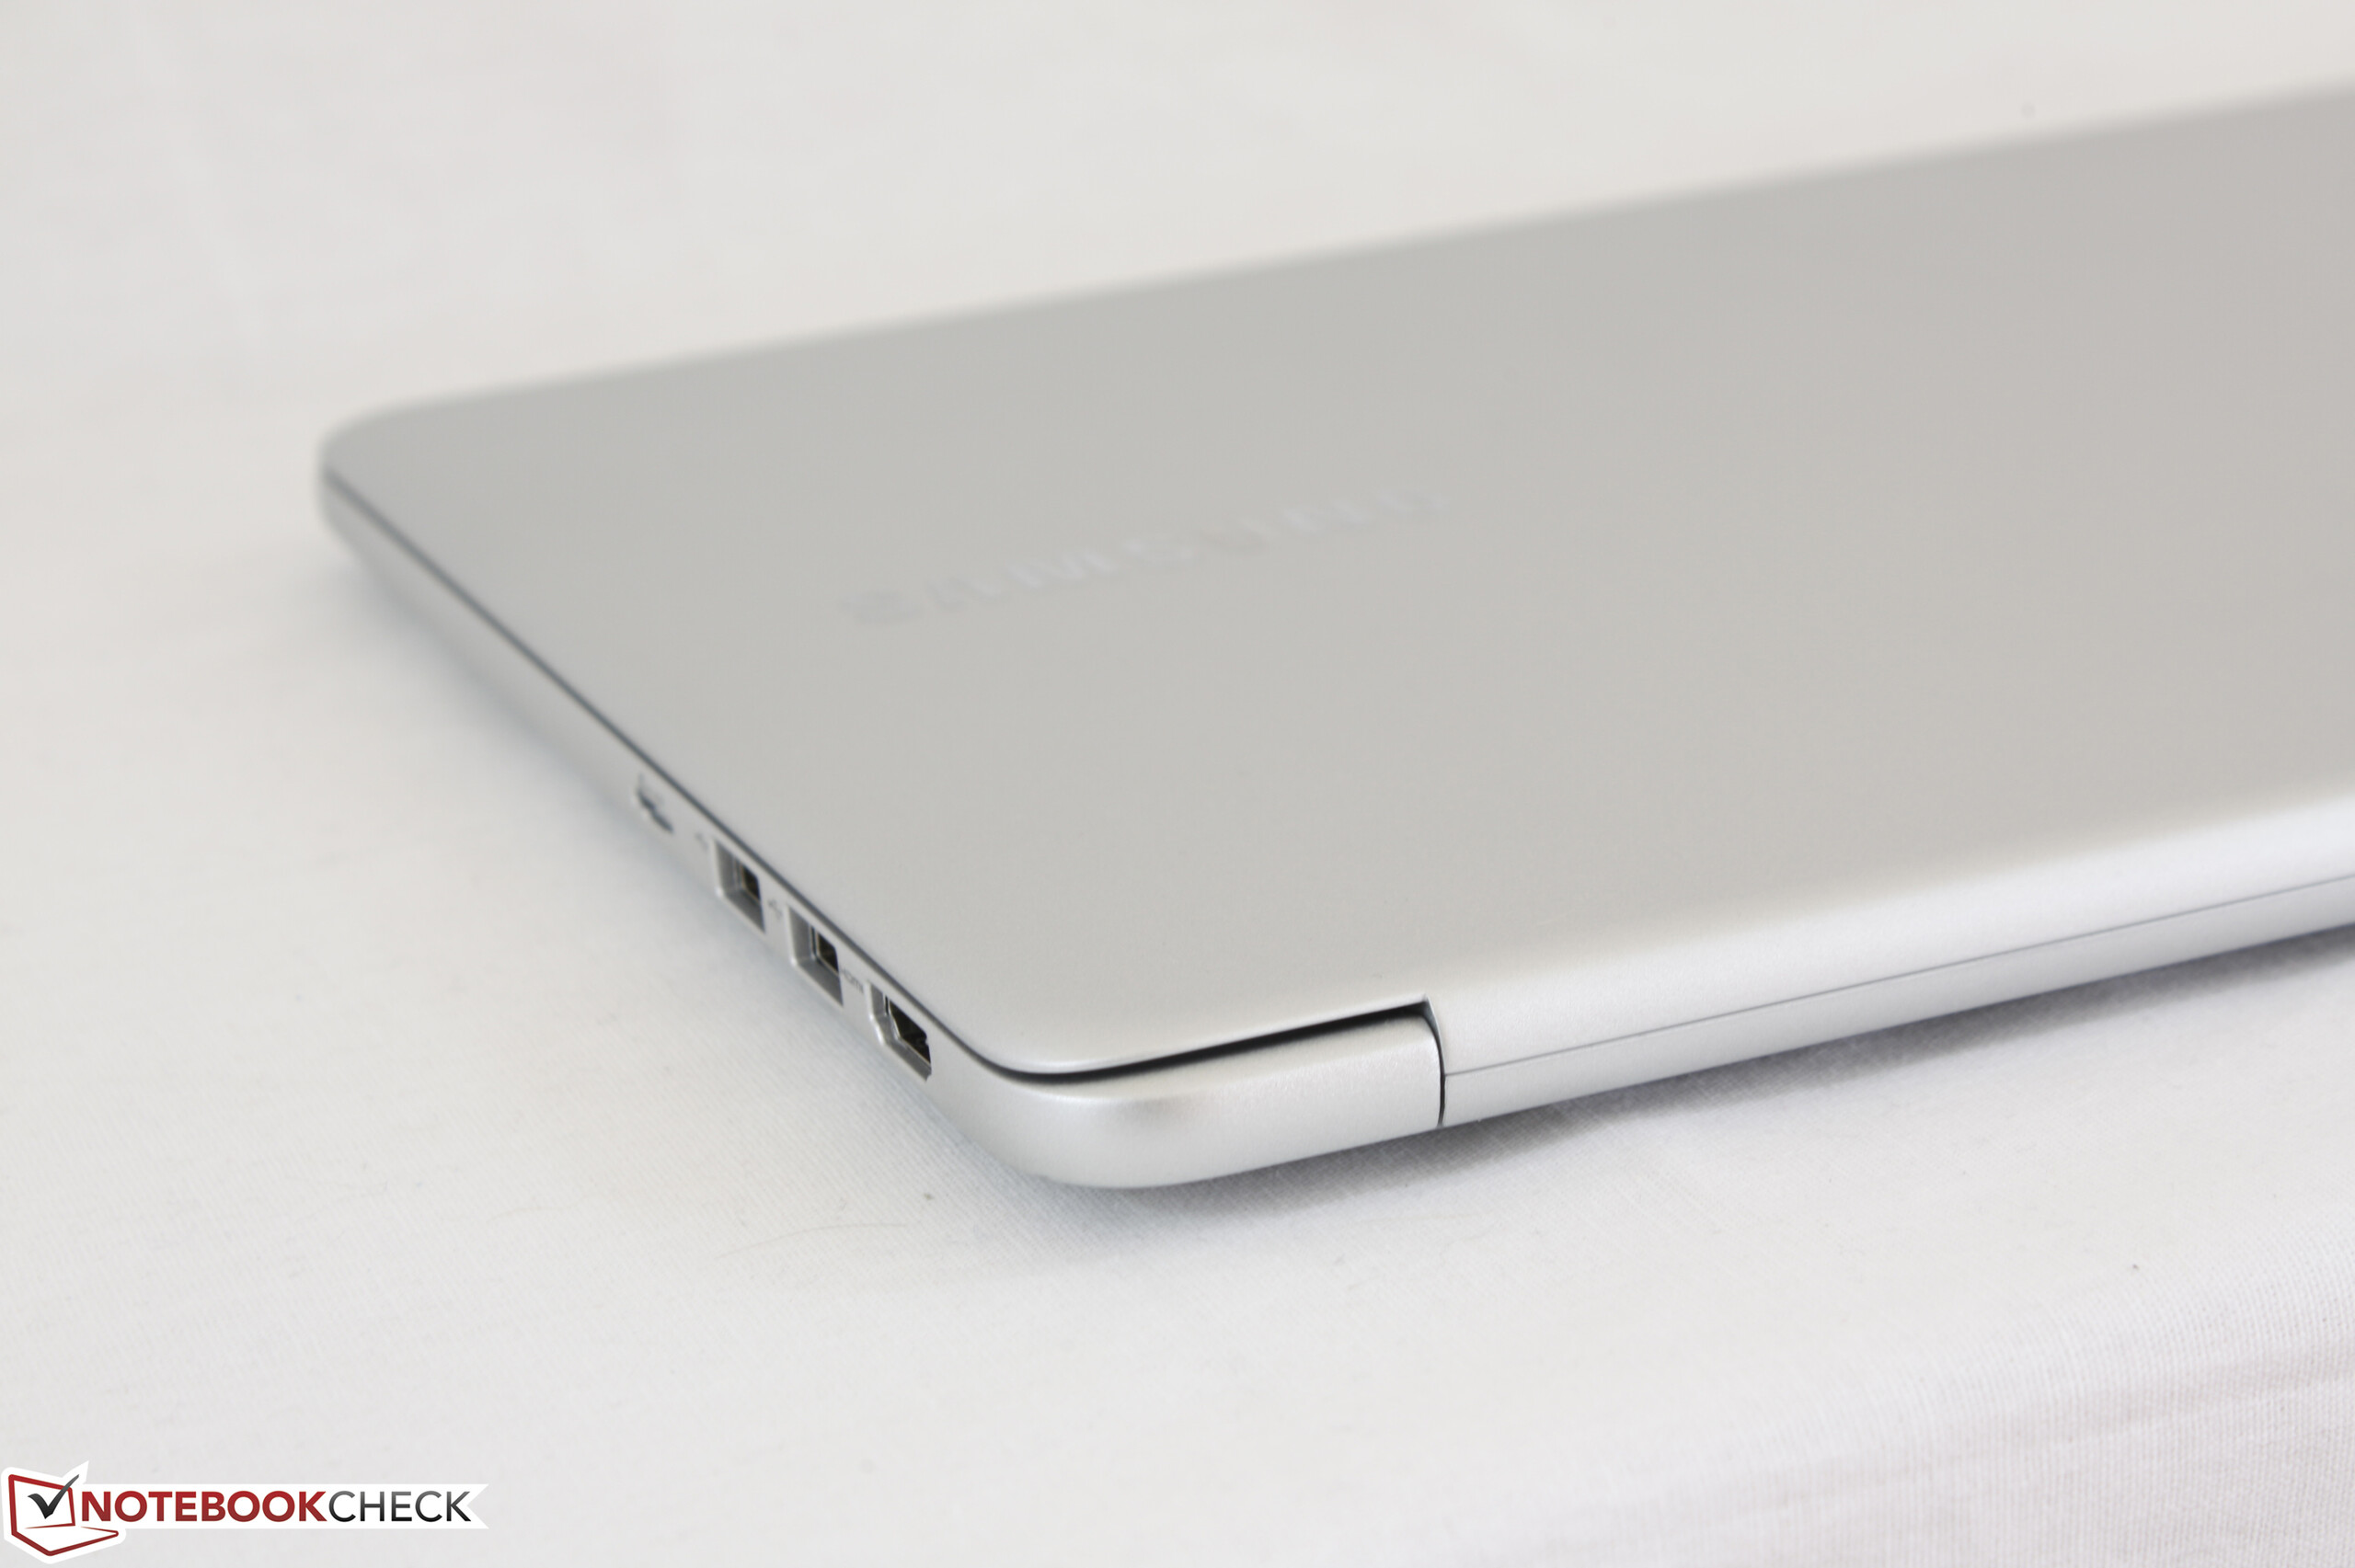
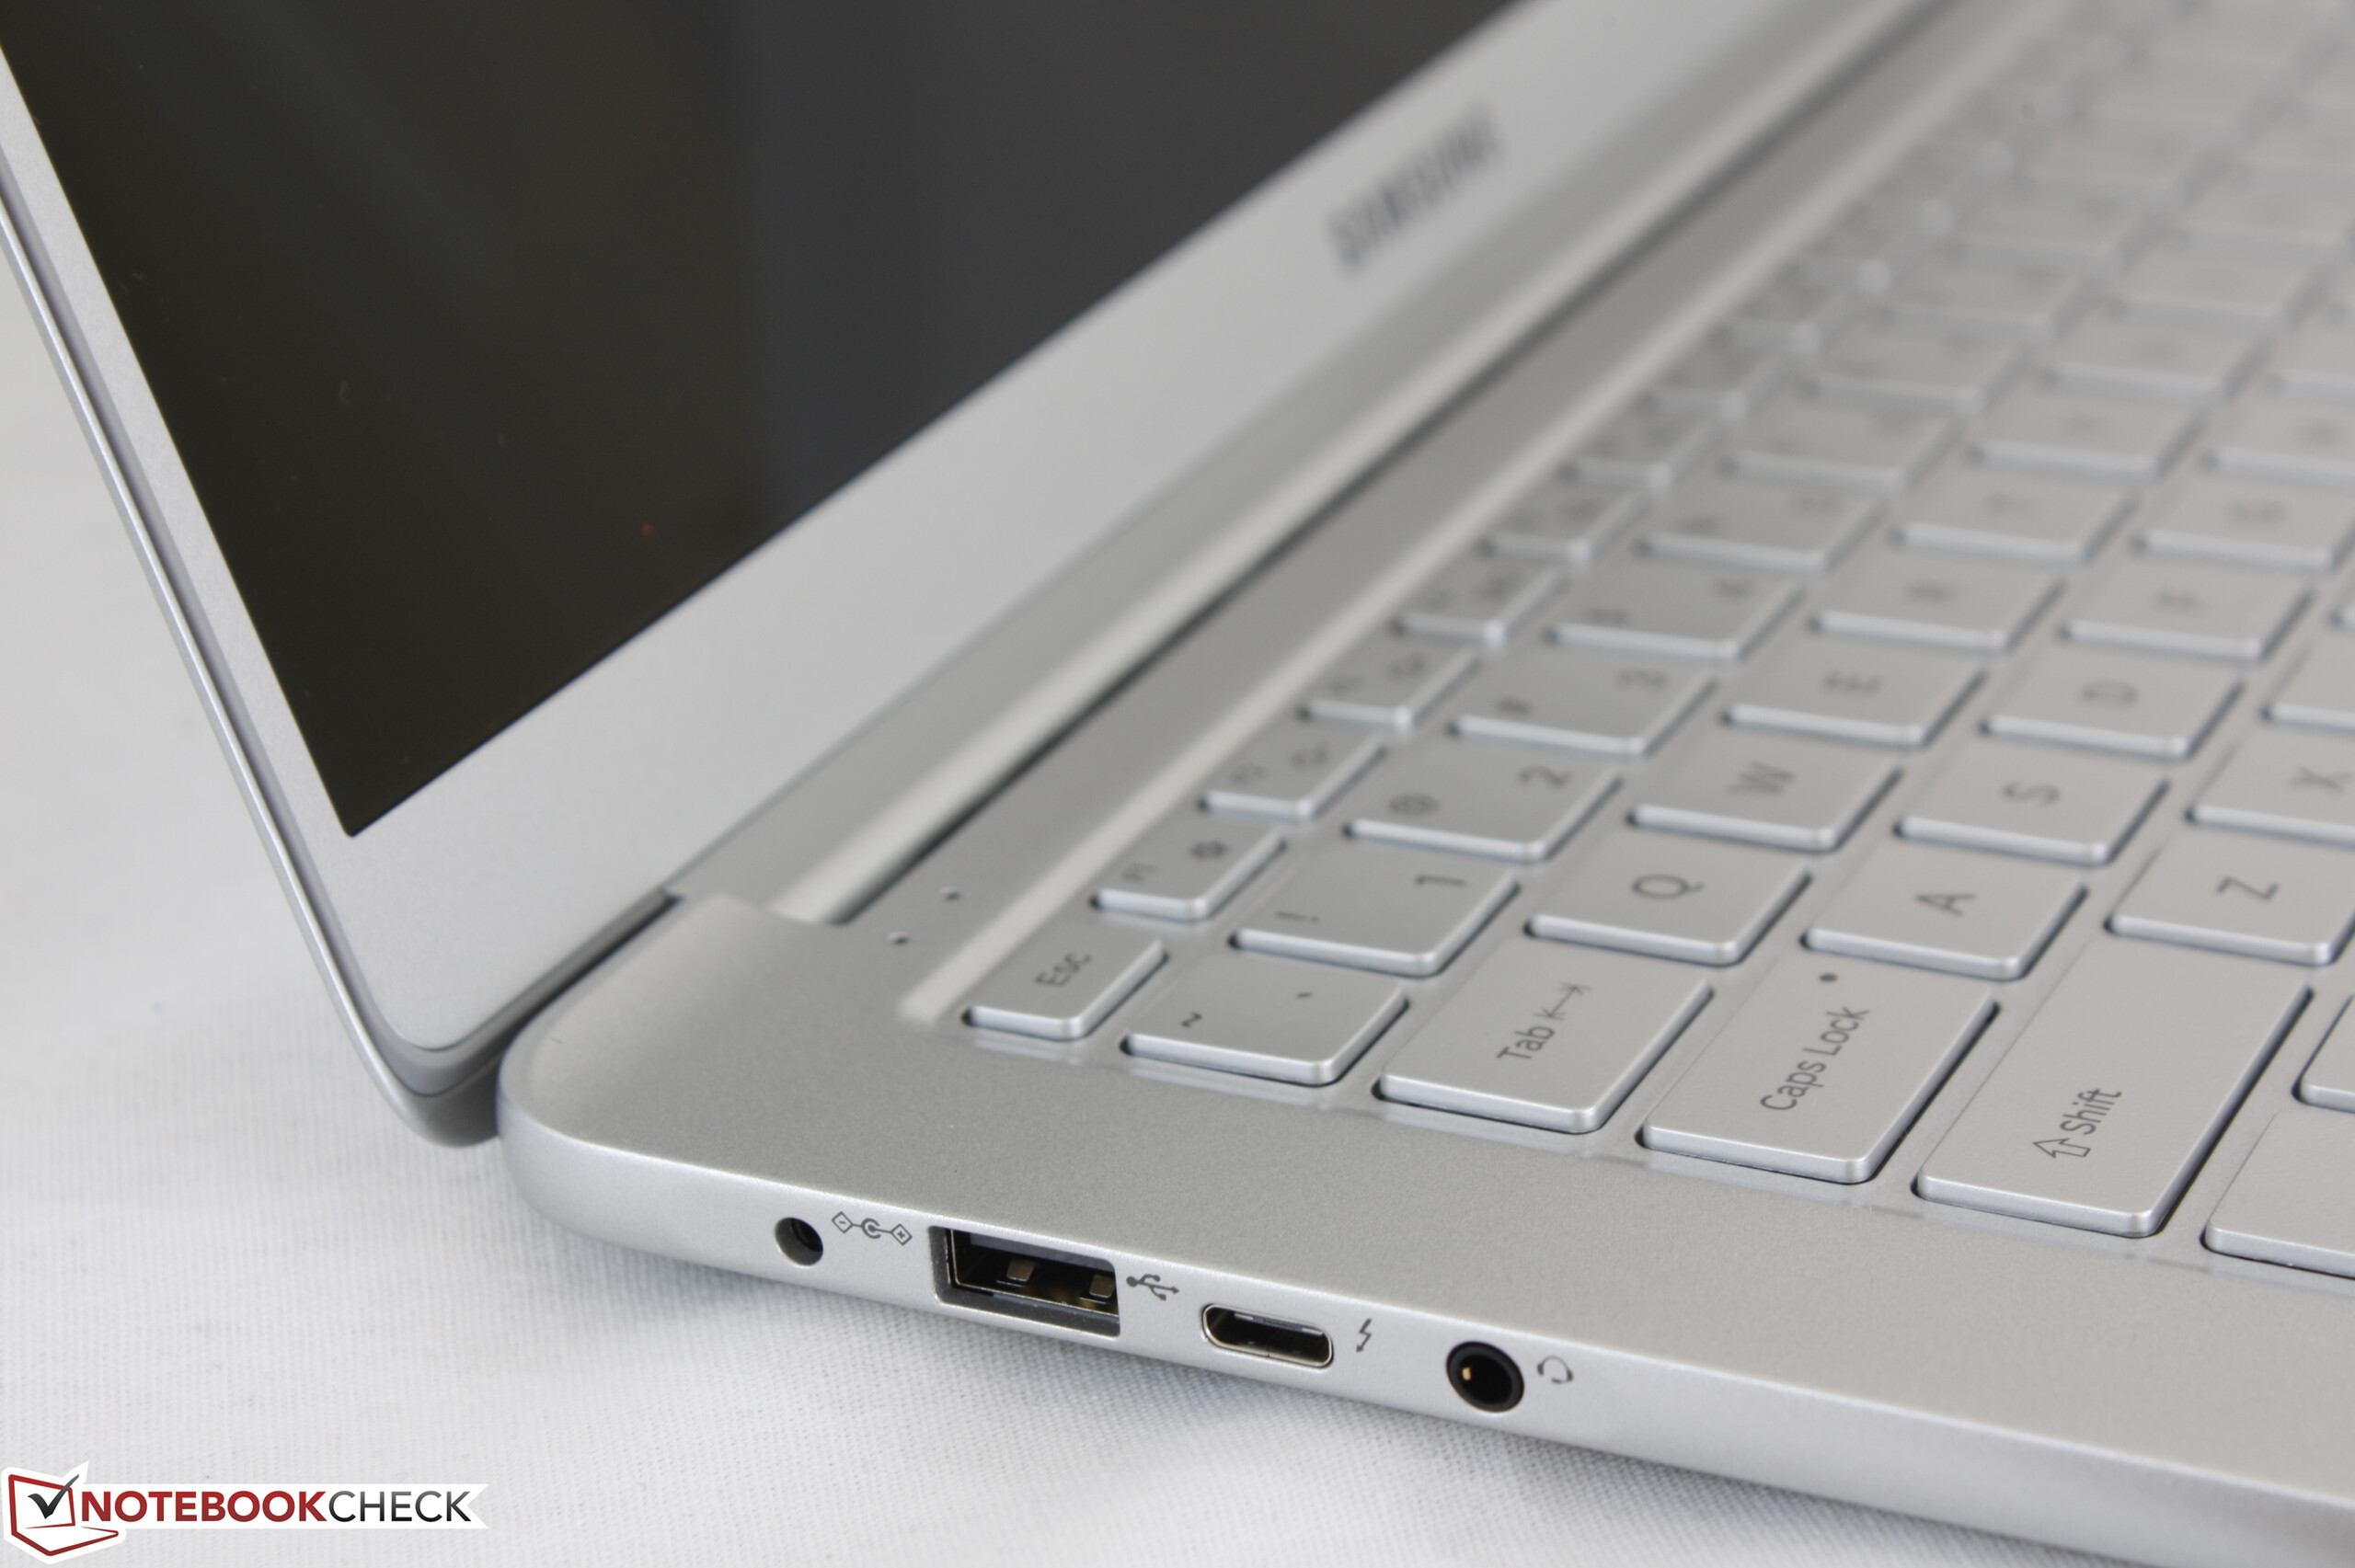
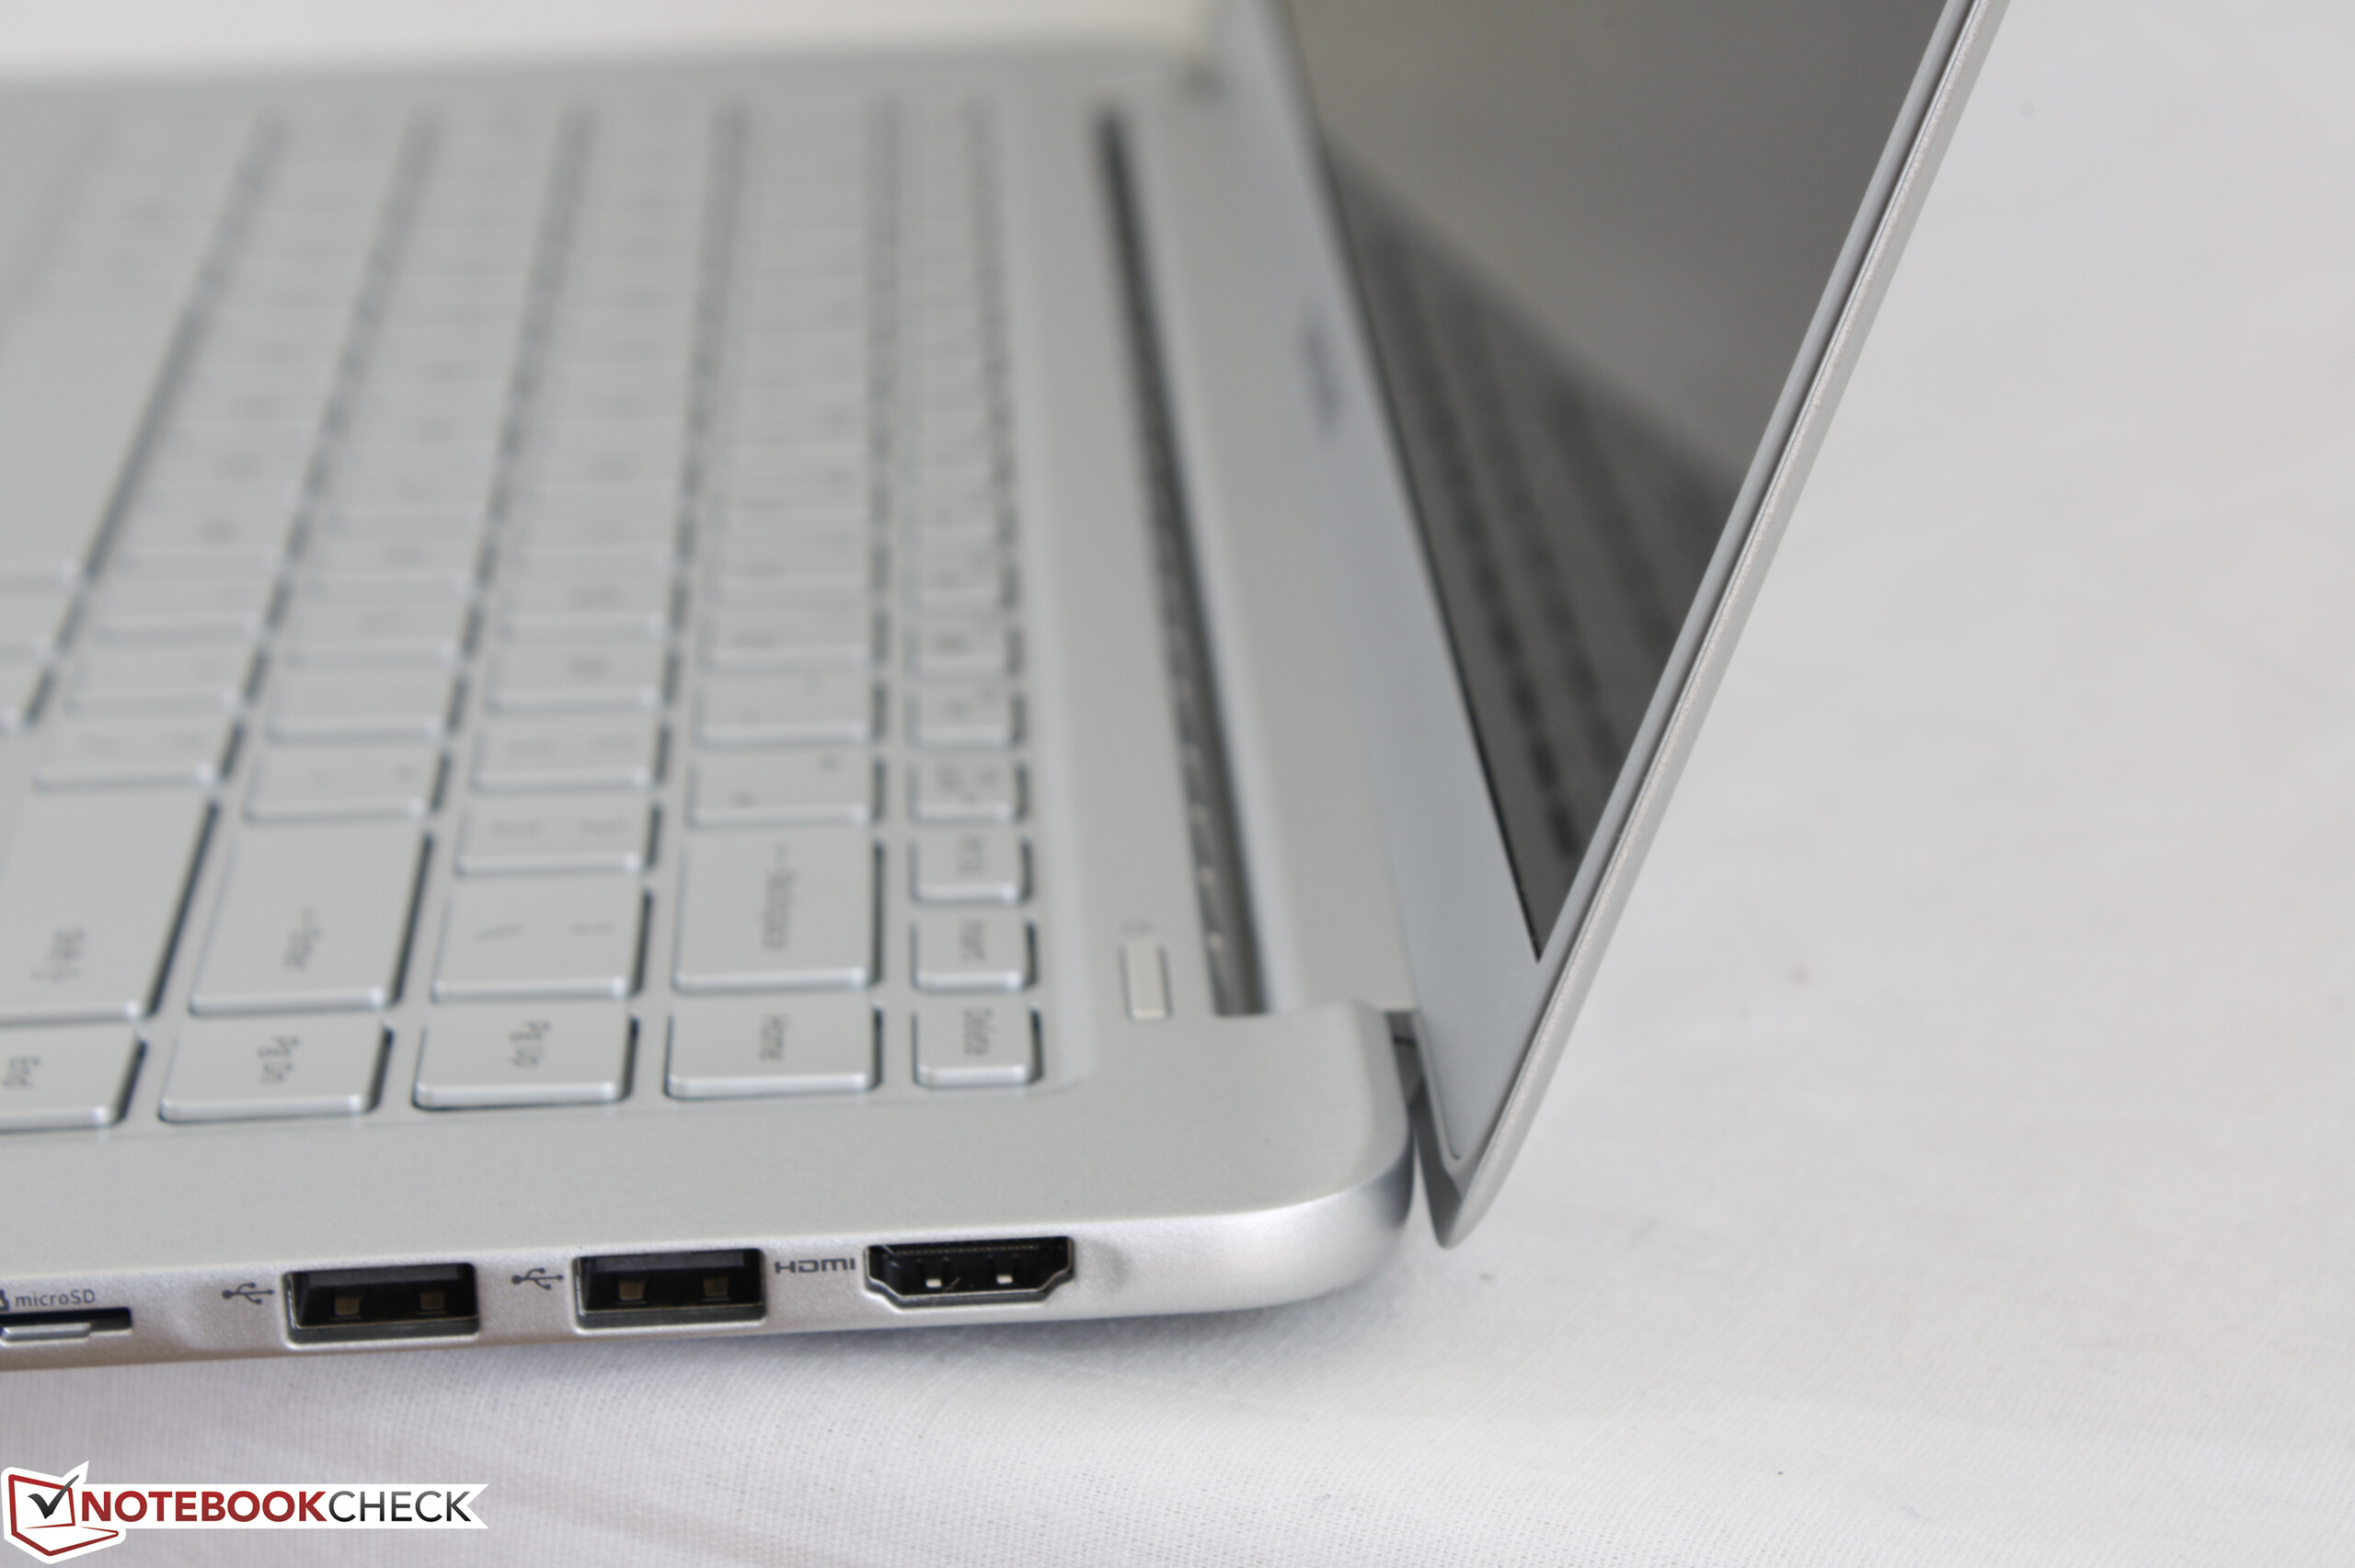
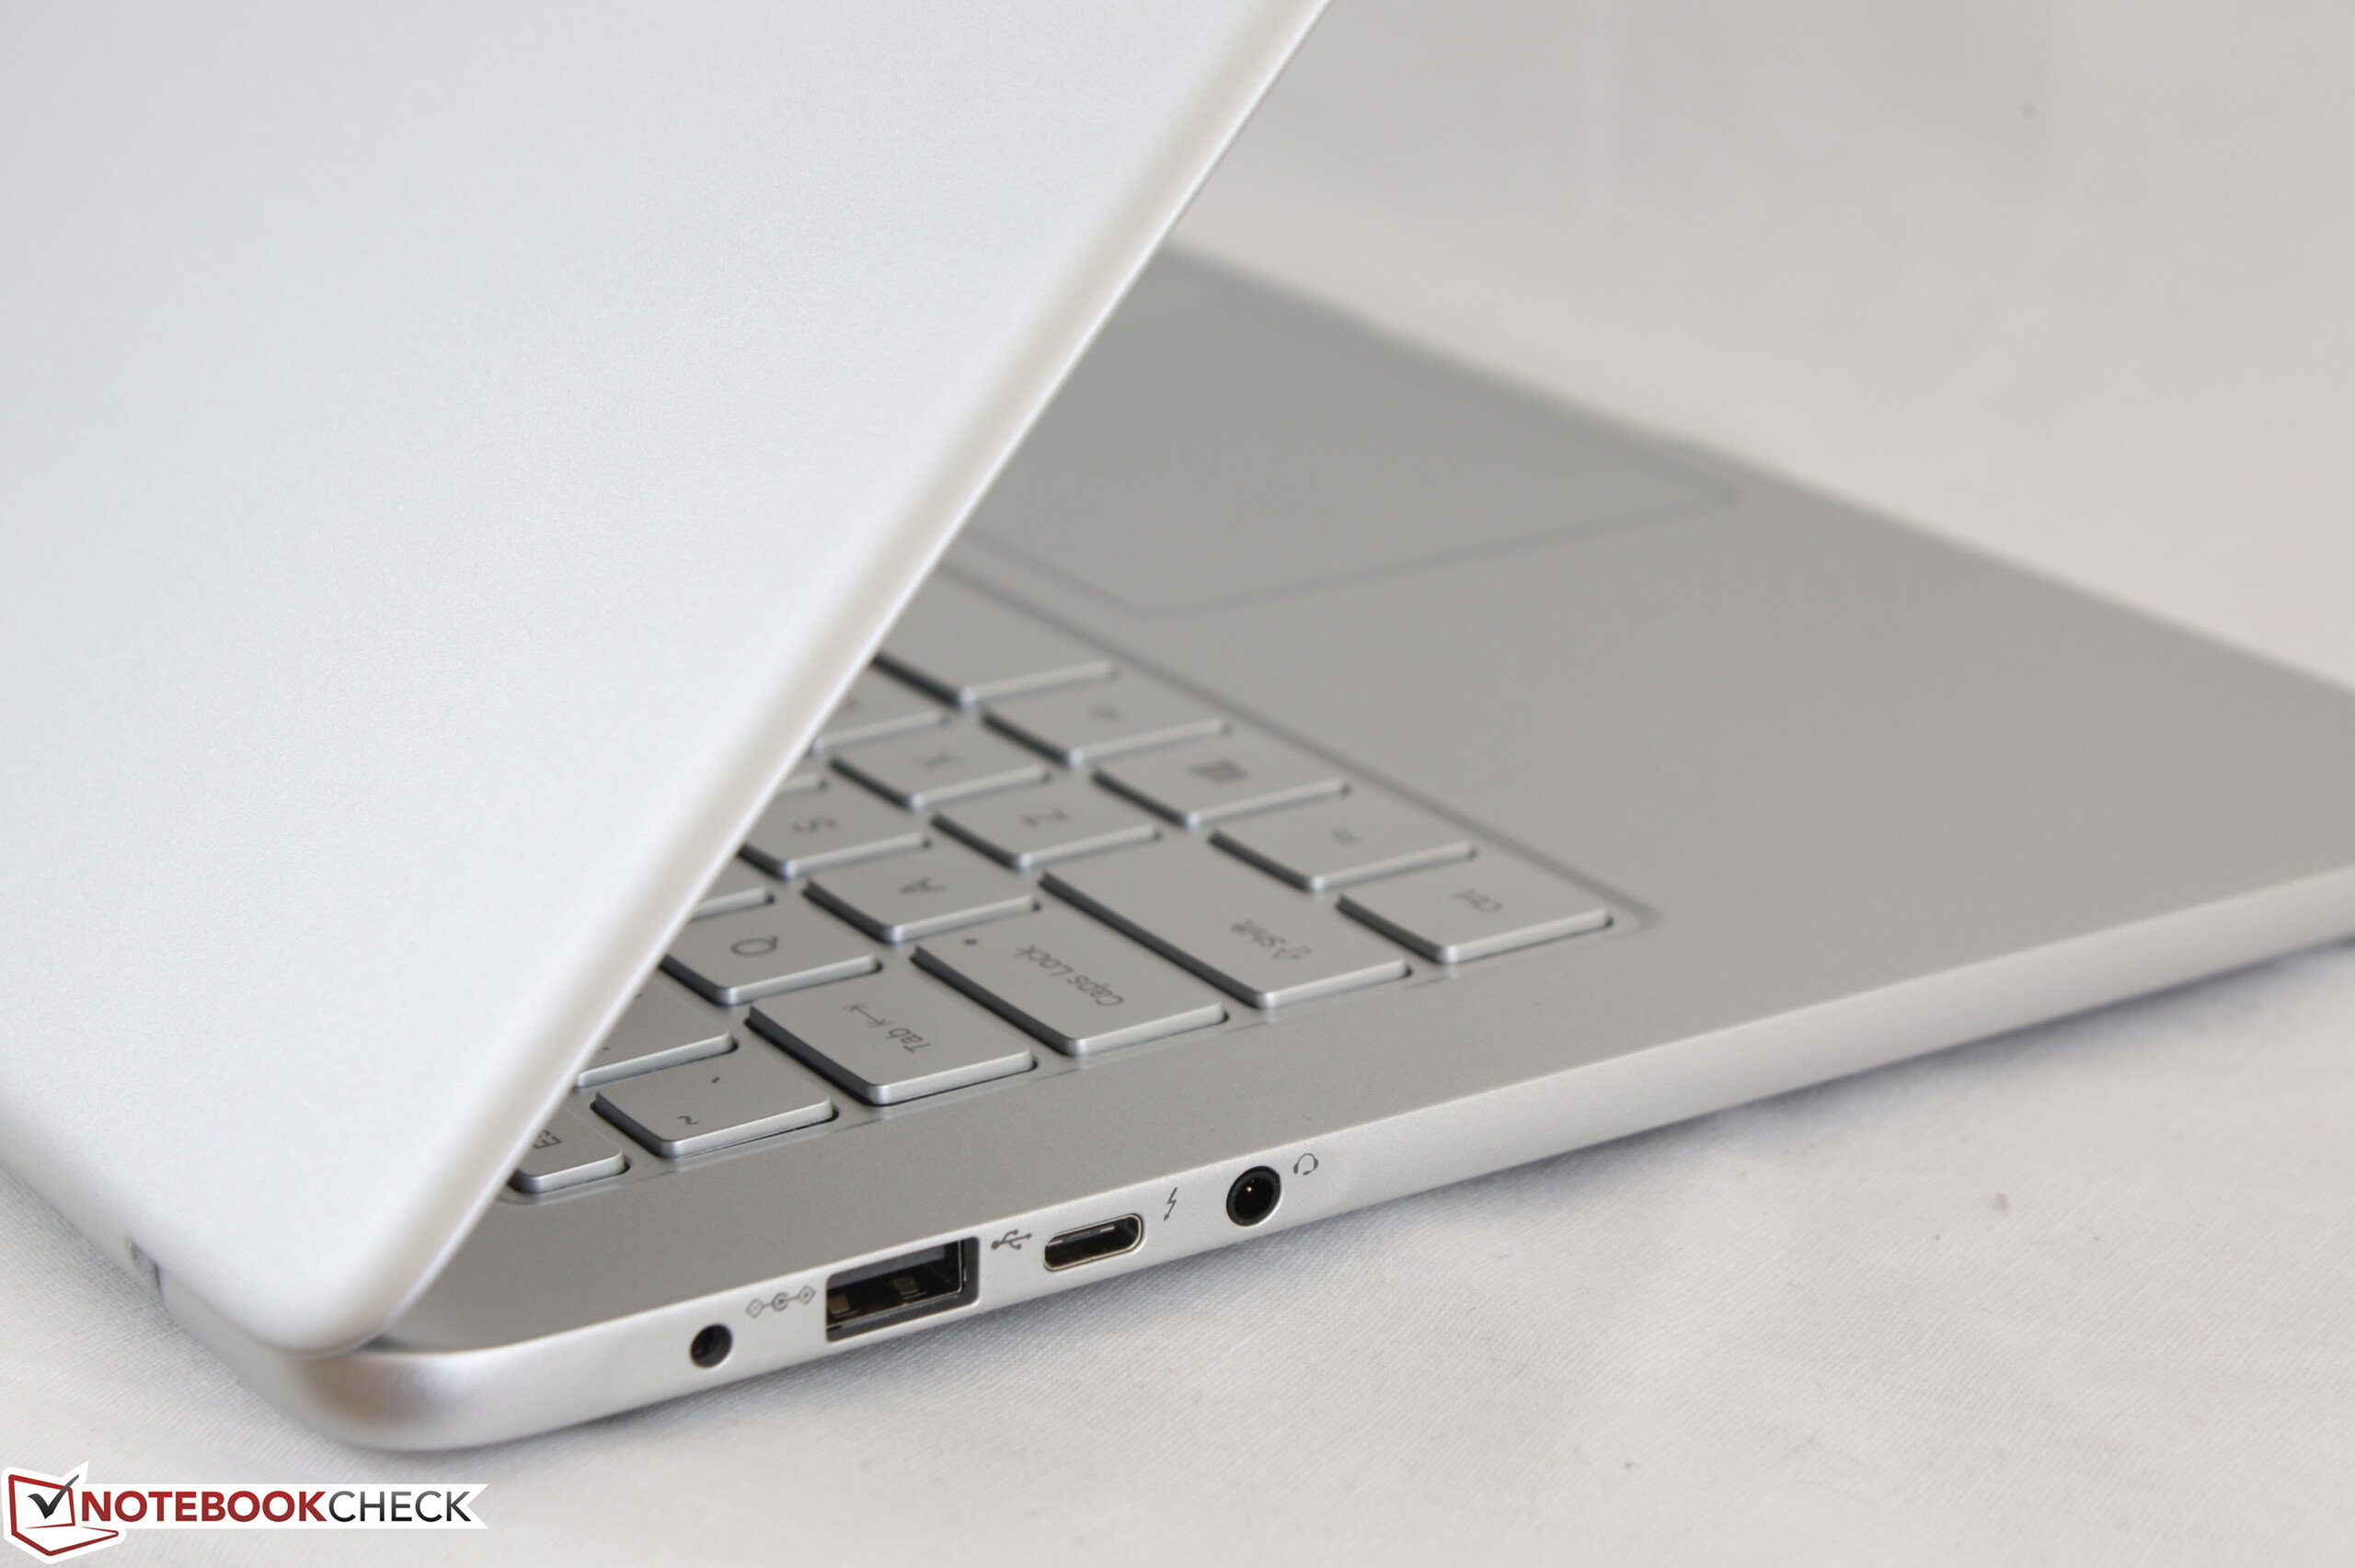
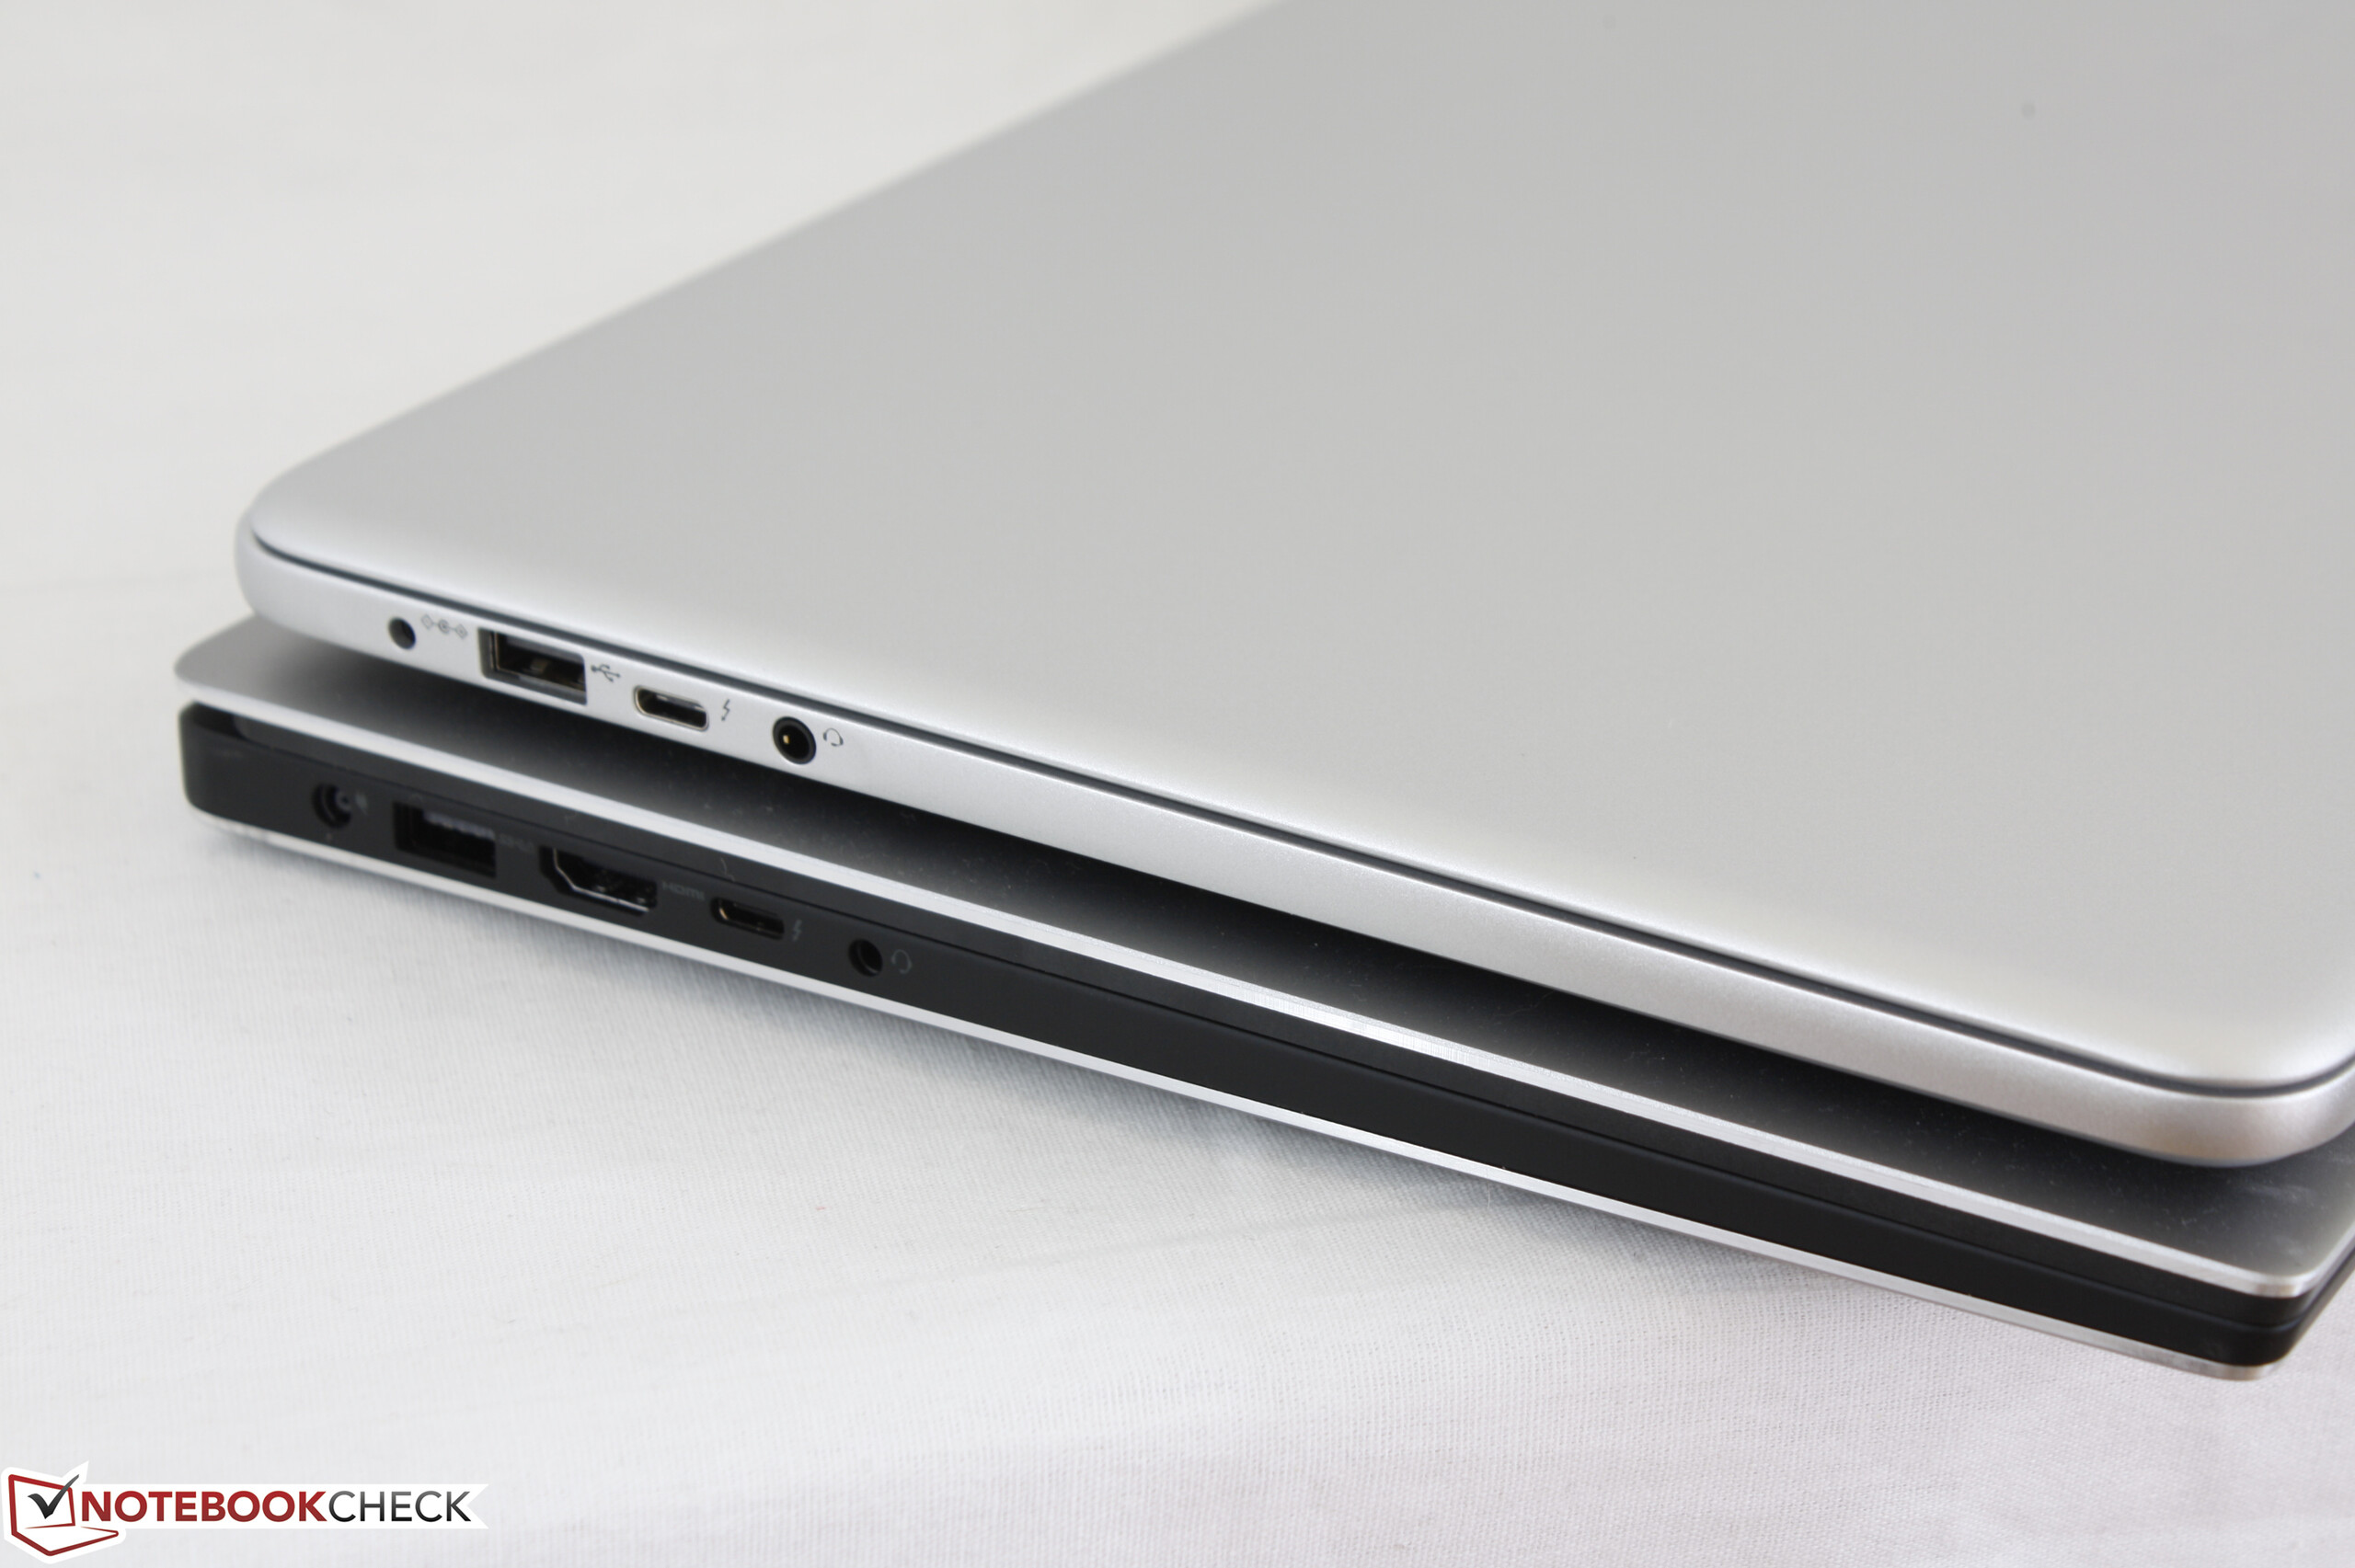
Notebook 9 NP900X5N 在很多方面表现得很出色,但也在一些关键部分失去了一些分数。我们赞扬厂商能够在极度轻盈的机身当中提供可选独立显卡的同时搭载一块如此高亮度的1080P屏幕。如果亮度,便携度,寿命,Thundebolt 接口,以及GeForce显卡是优先被考虑的因素的话,那么 Notebook 9 是一个很简单的选择,特别是对于那些不在乎触摸屏或是认为14寸屏幕过小无法满足生产力需求的用户来说。
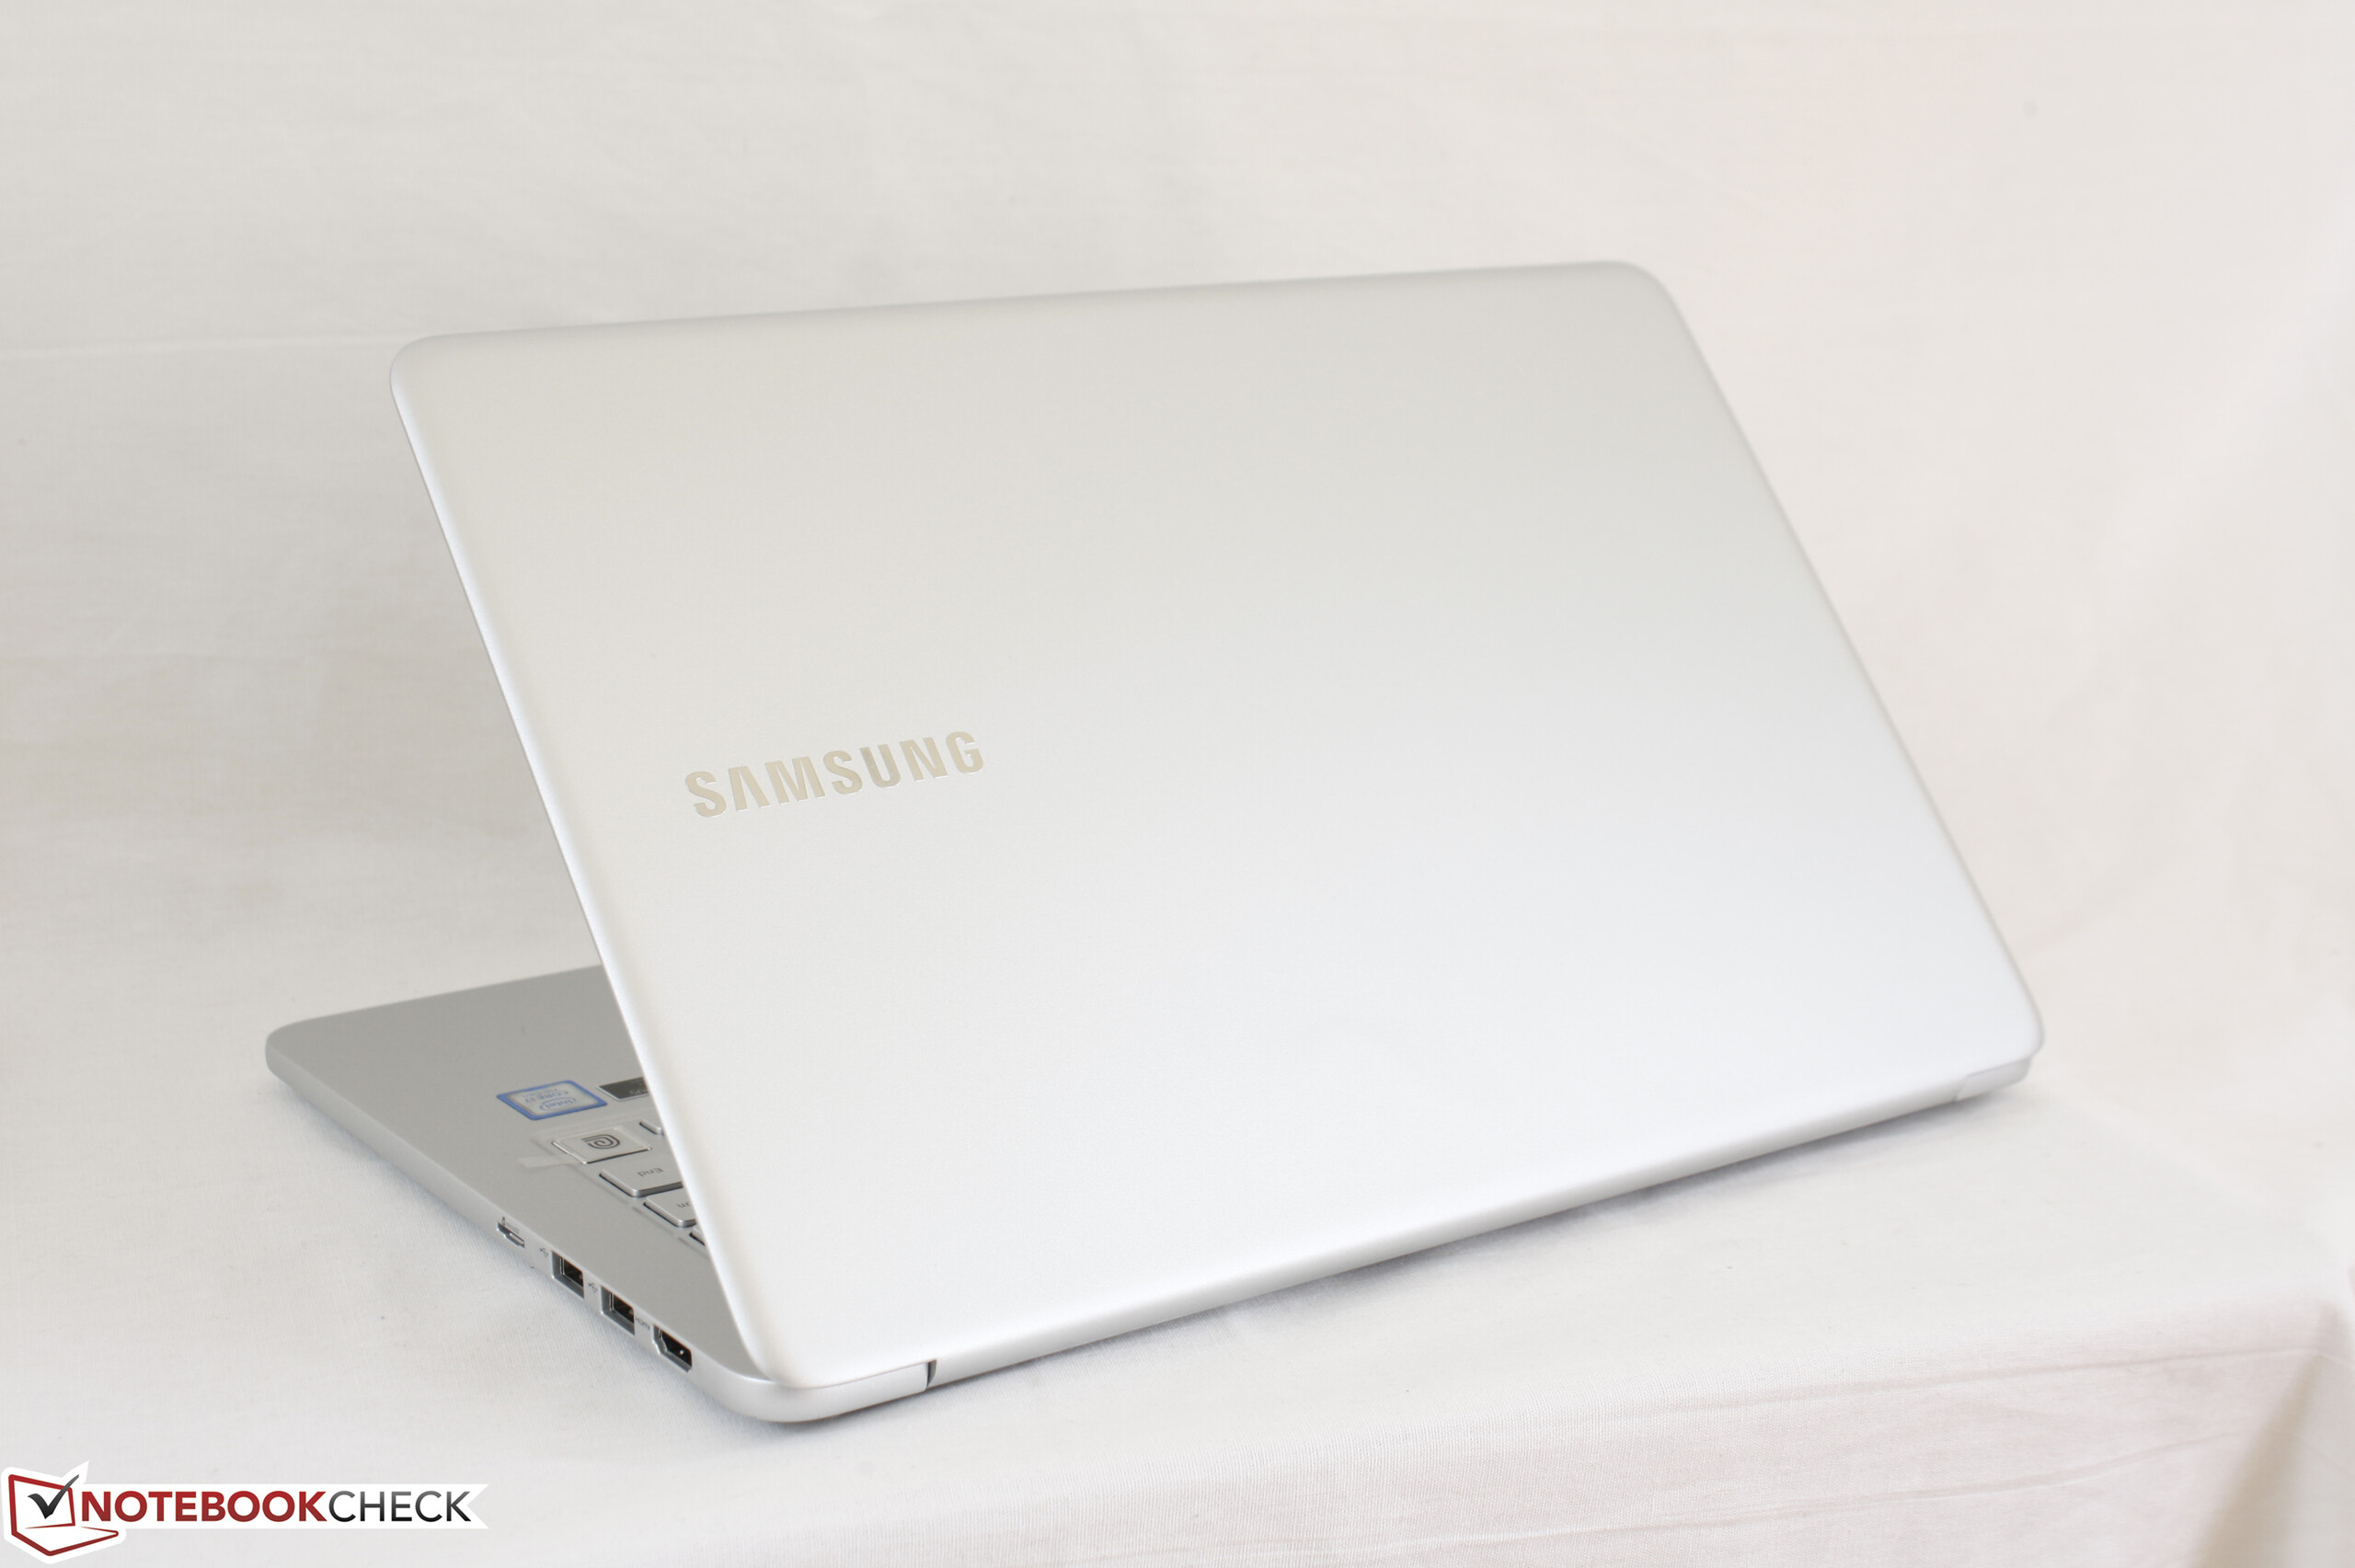
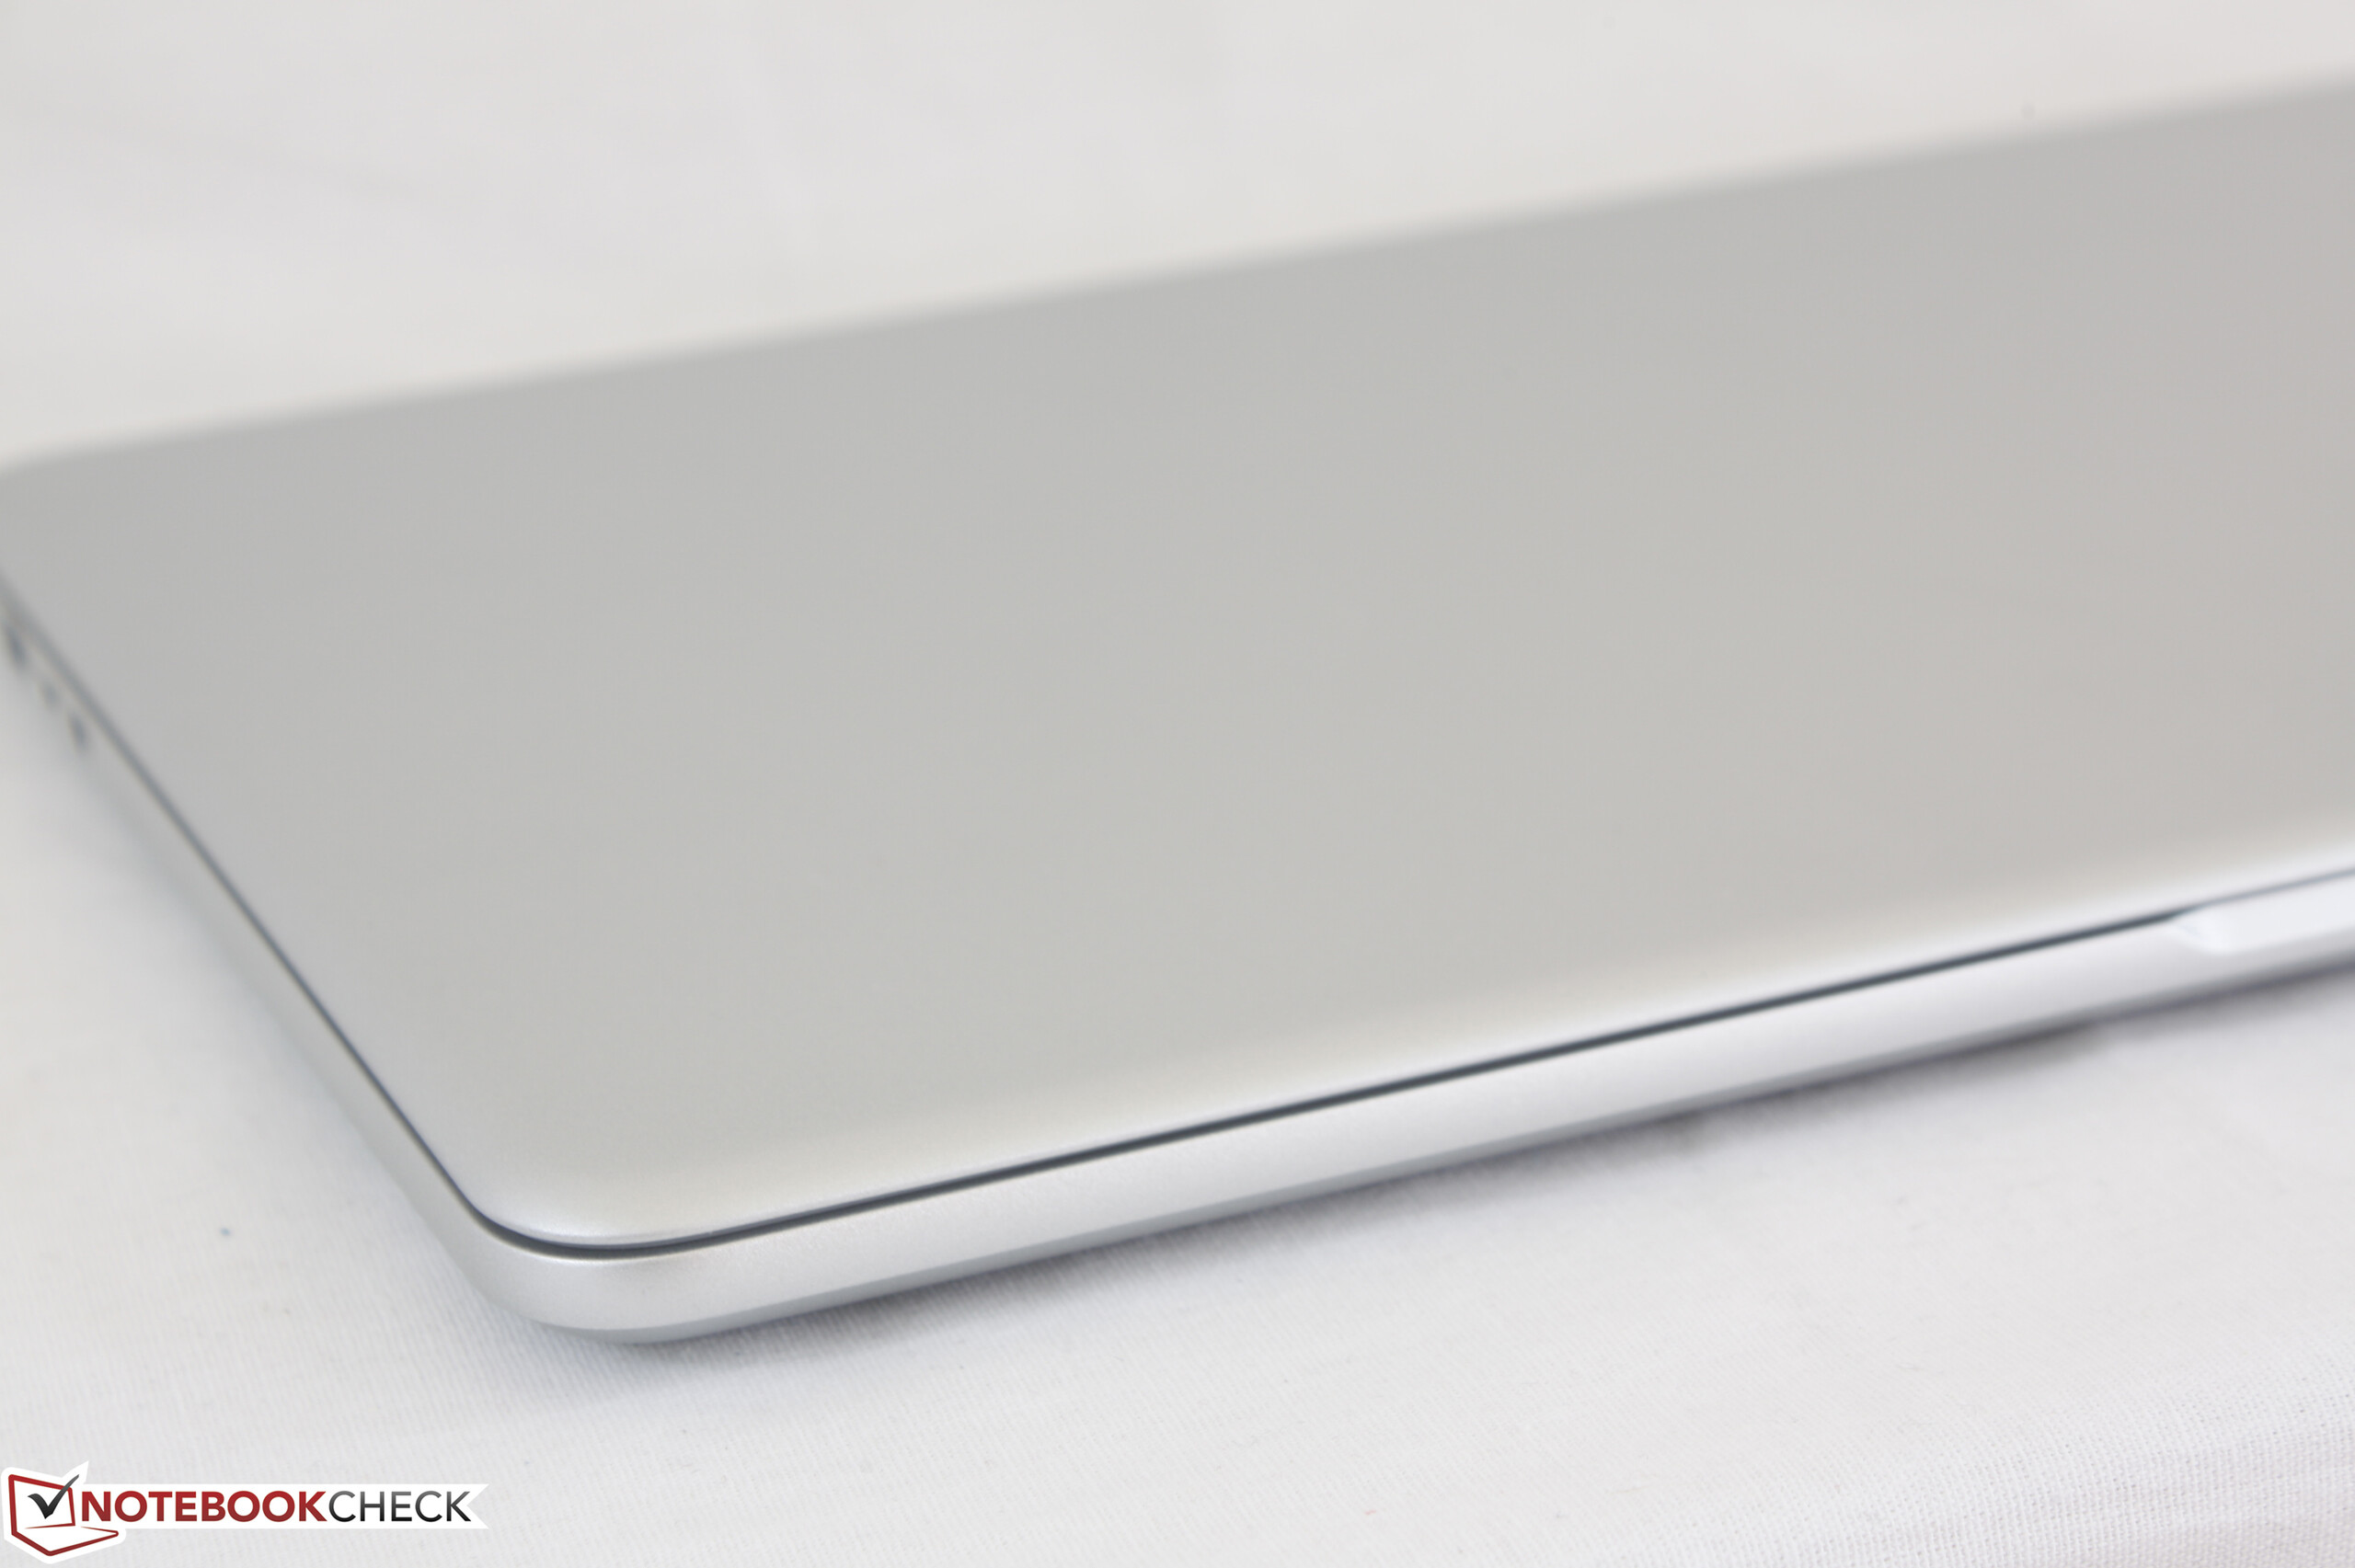
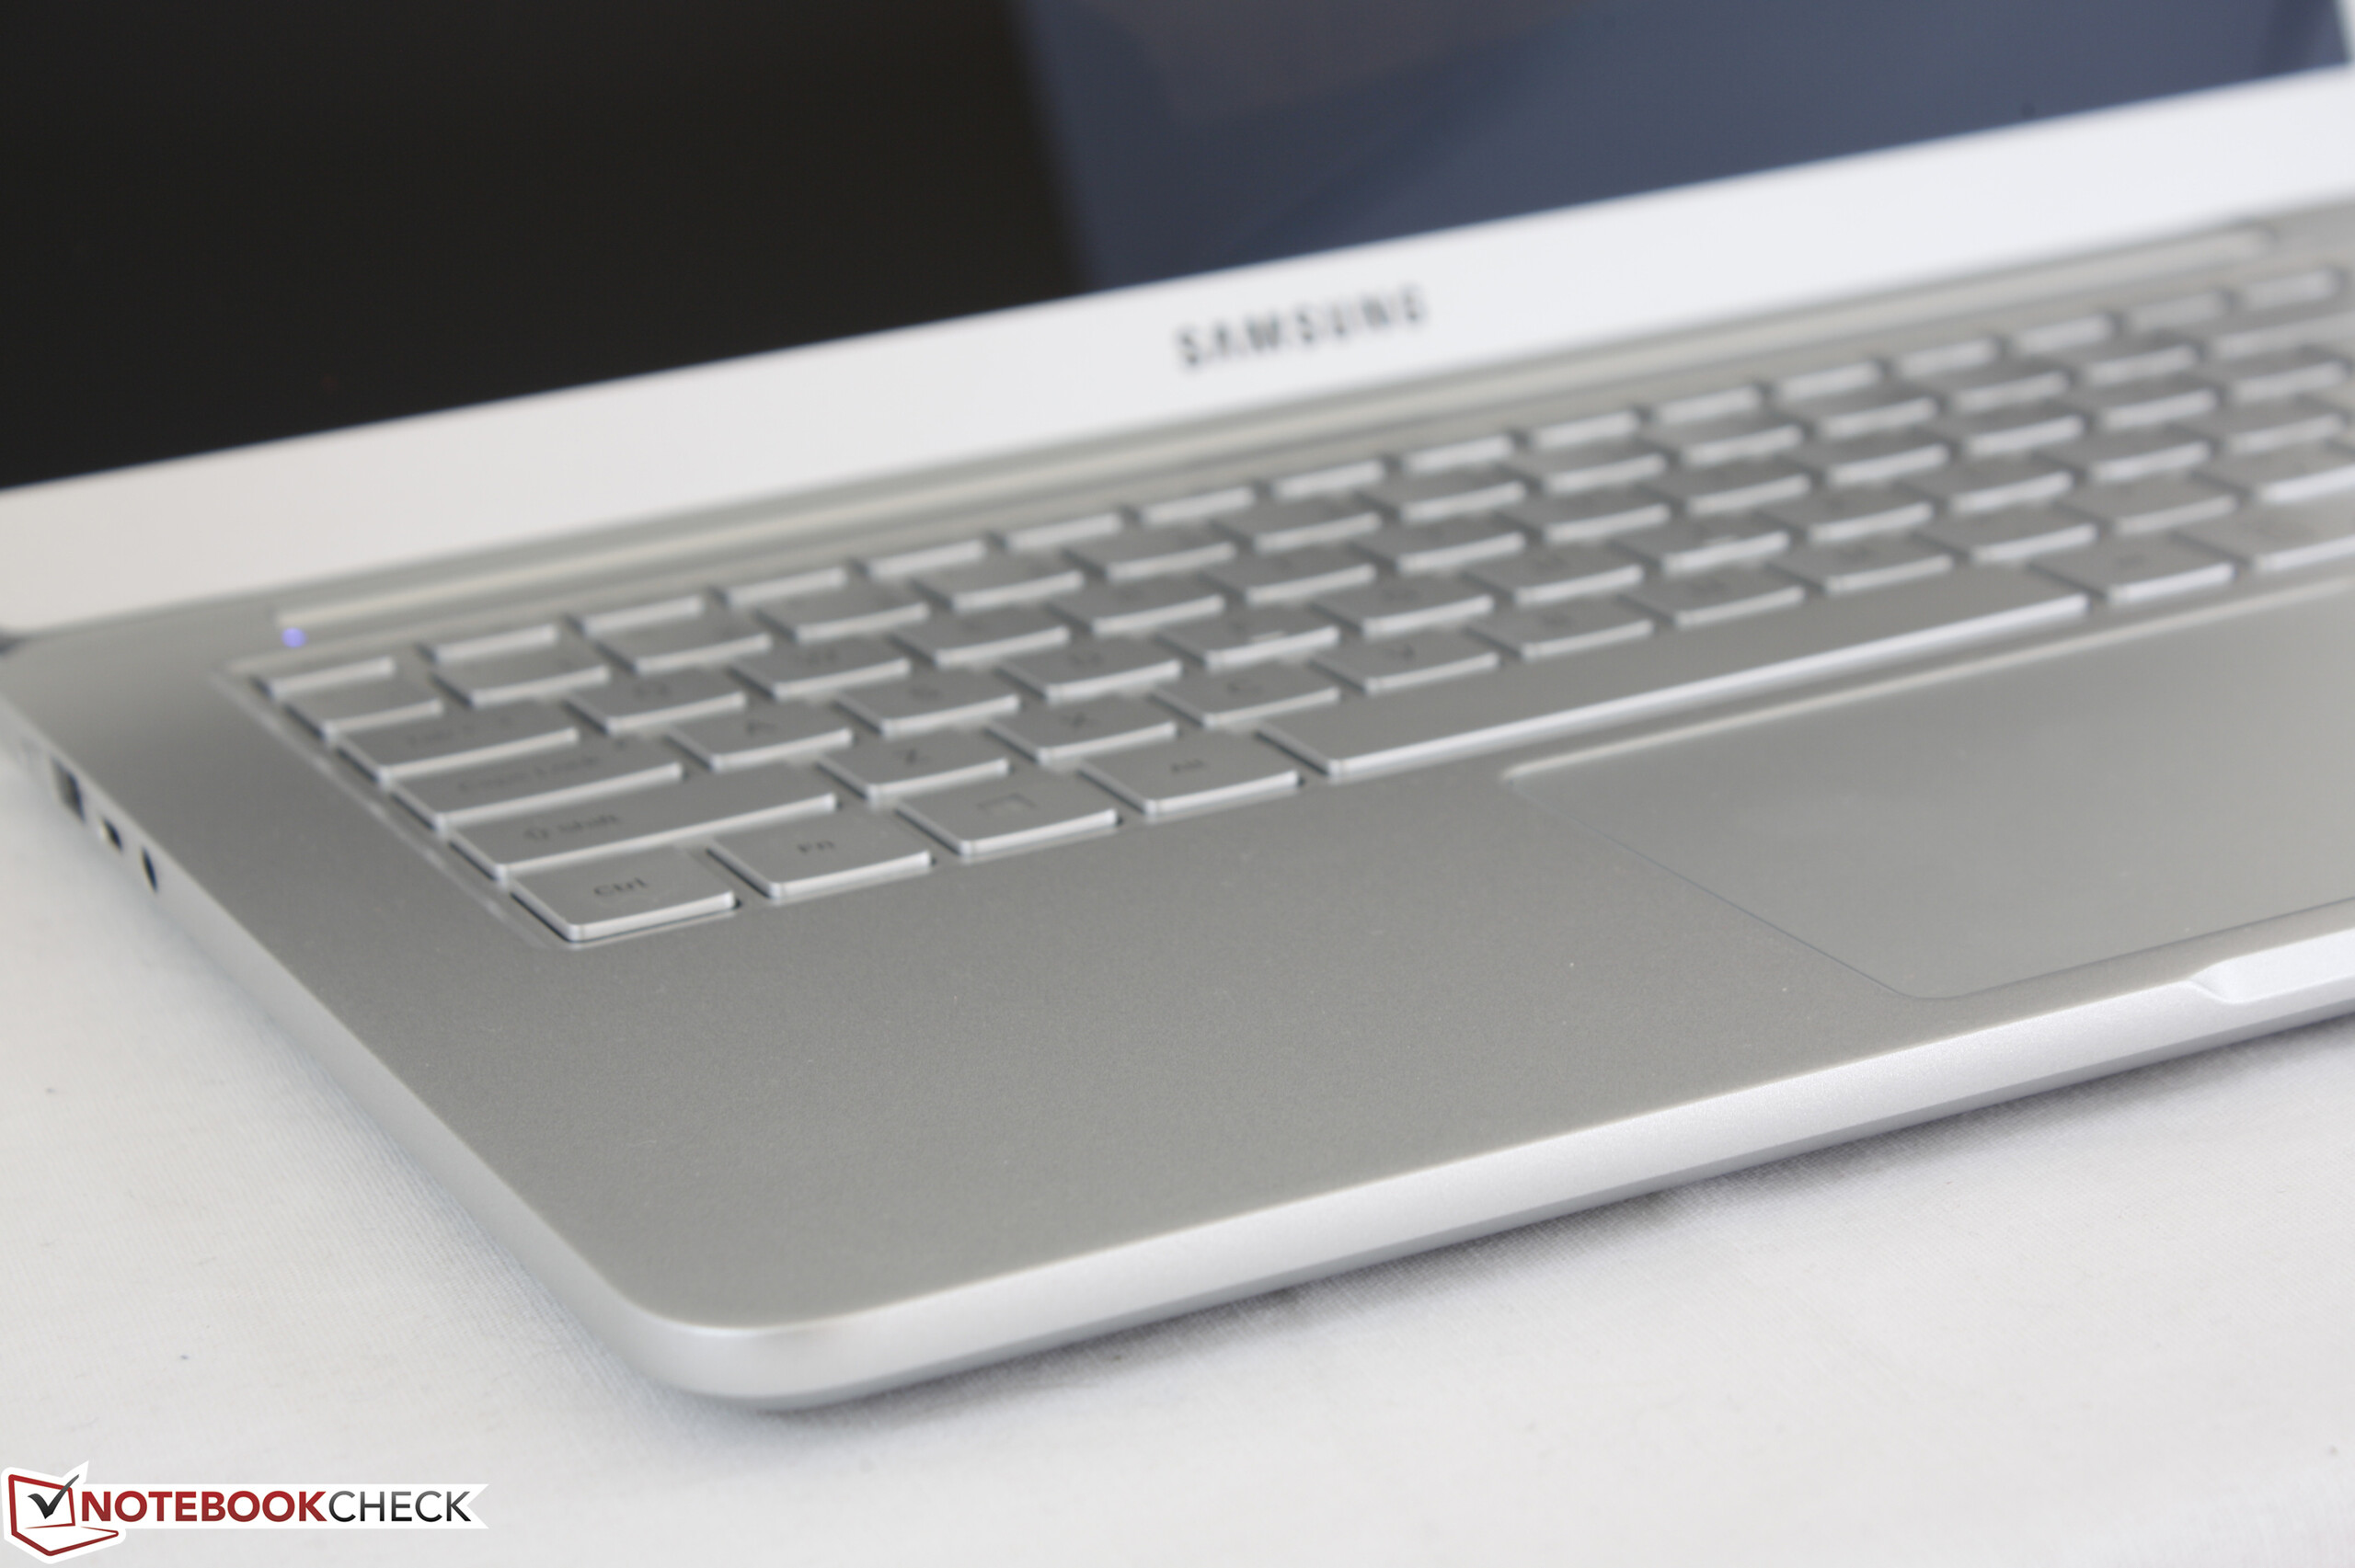
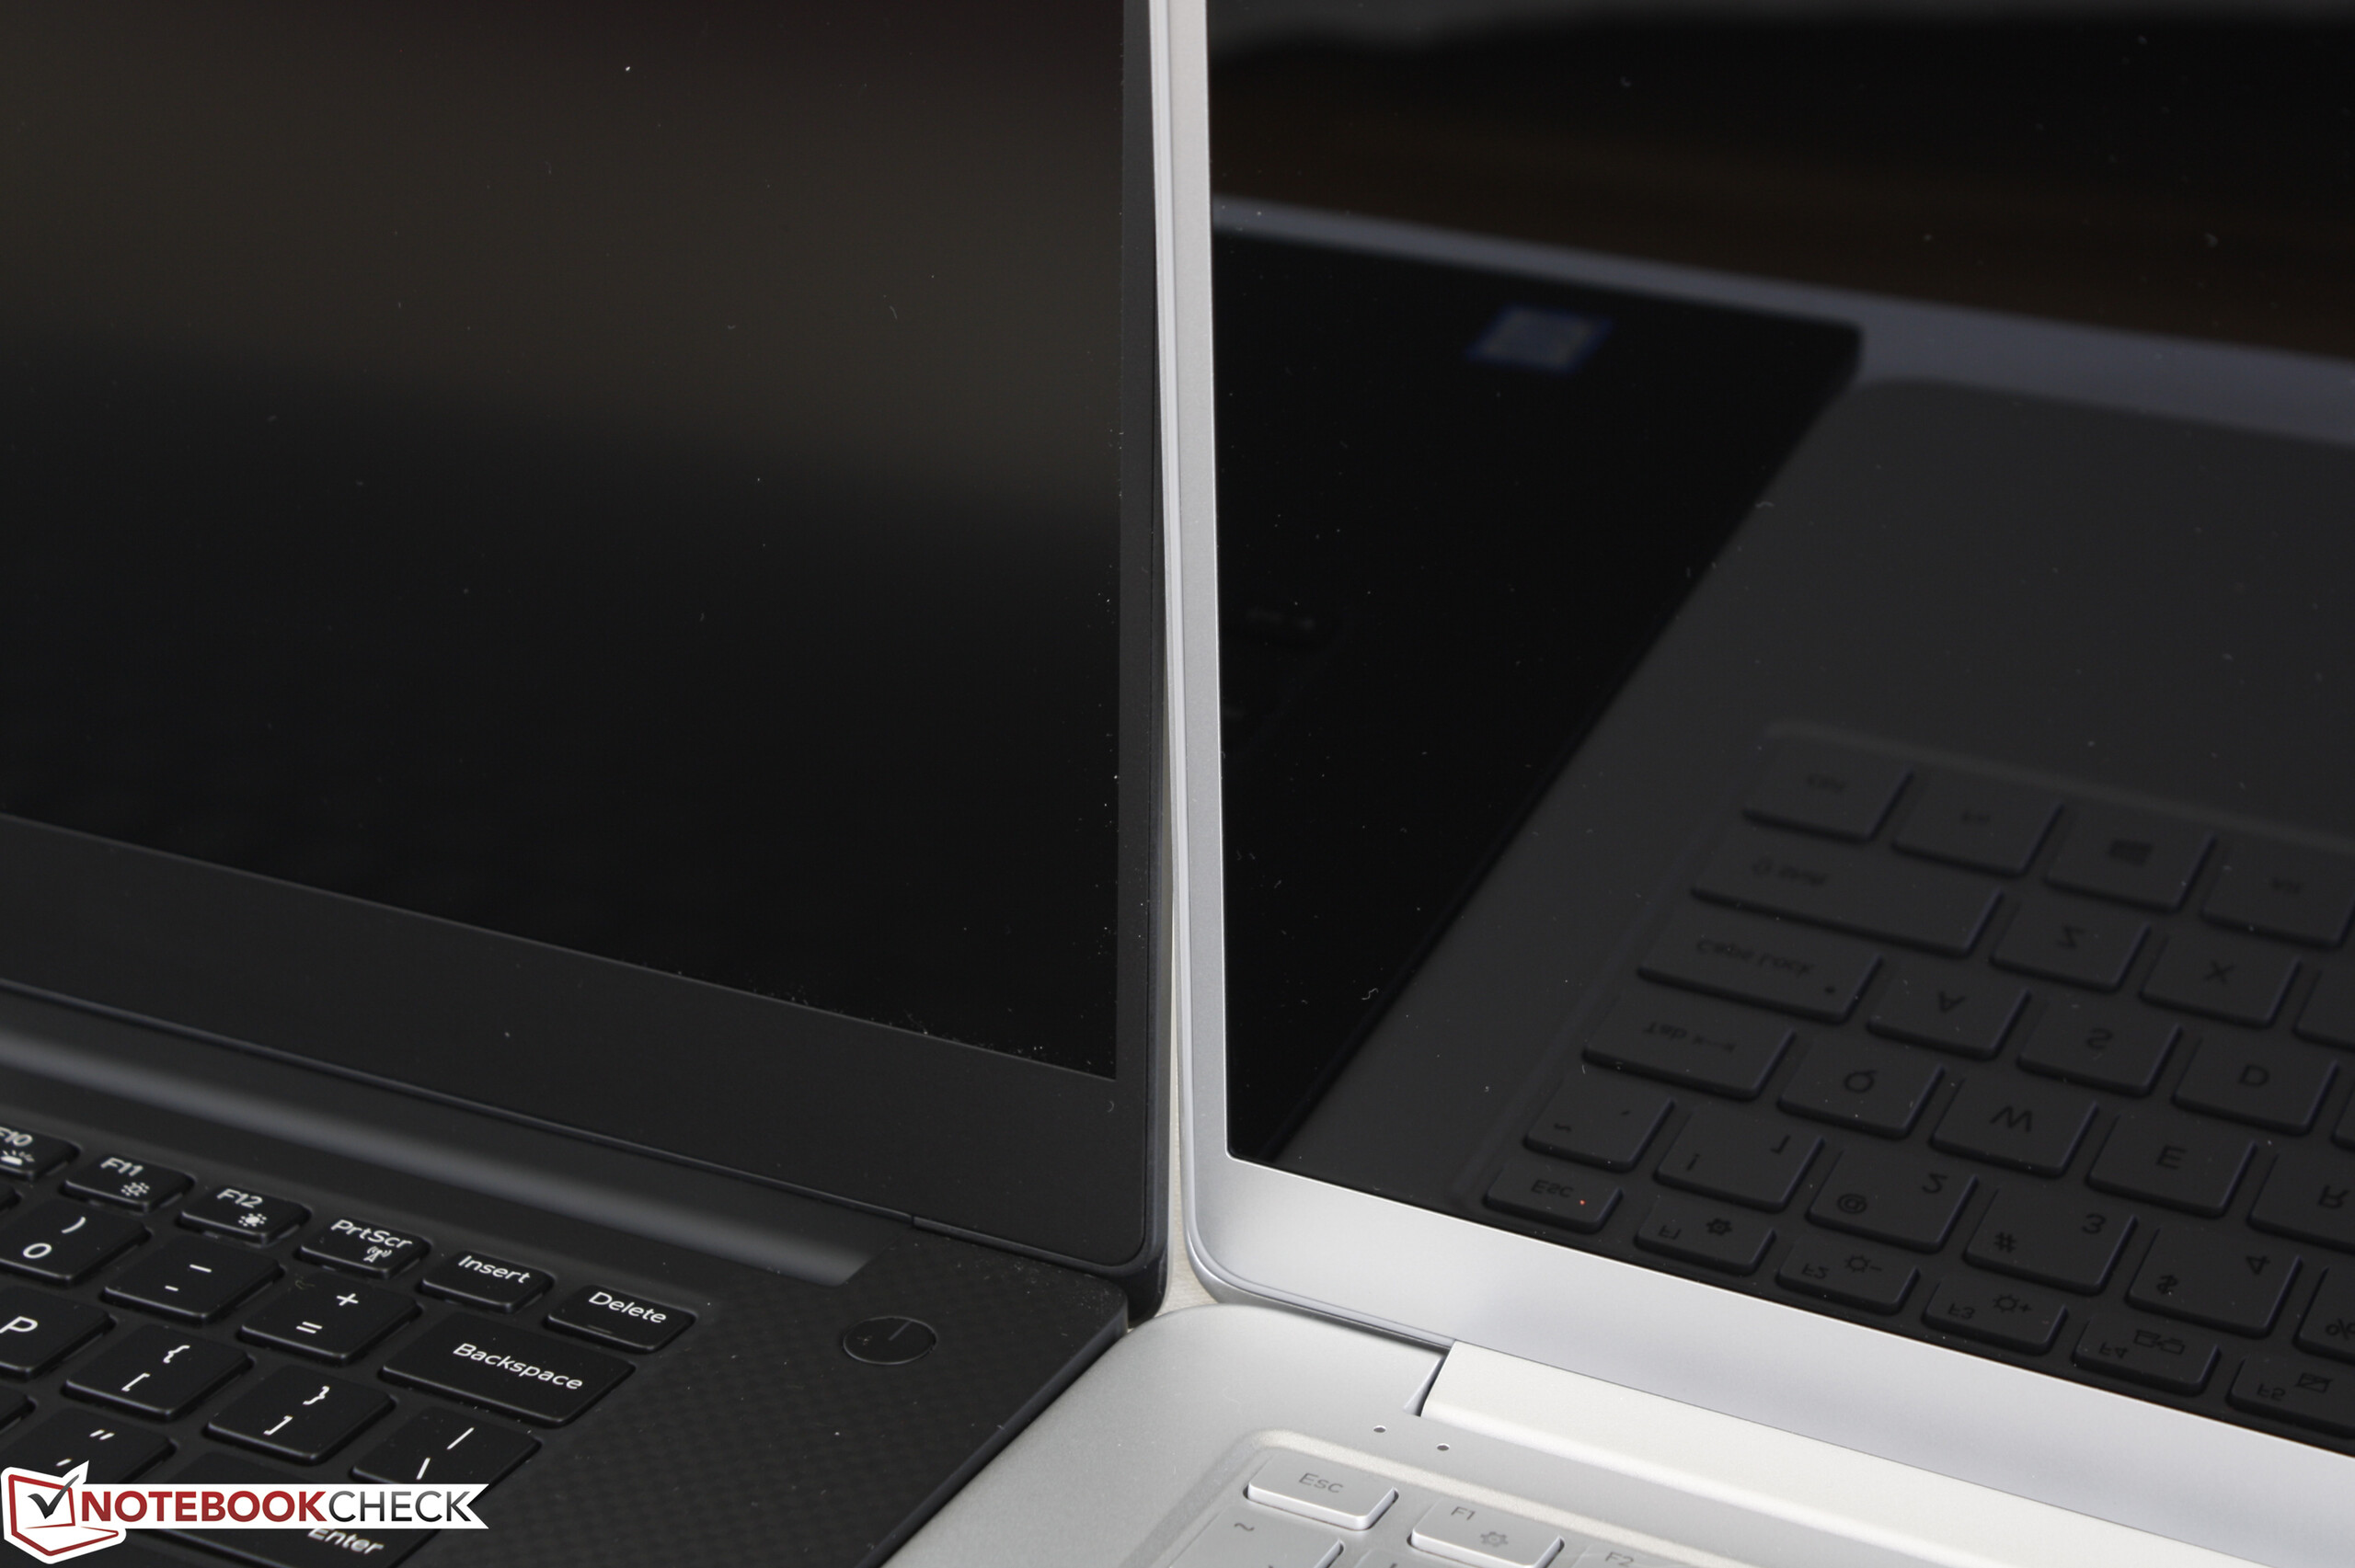
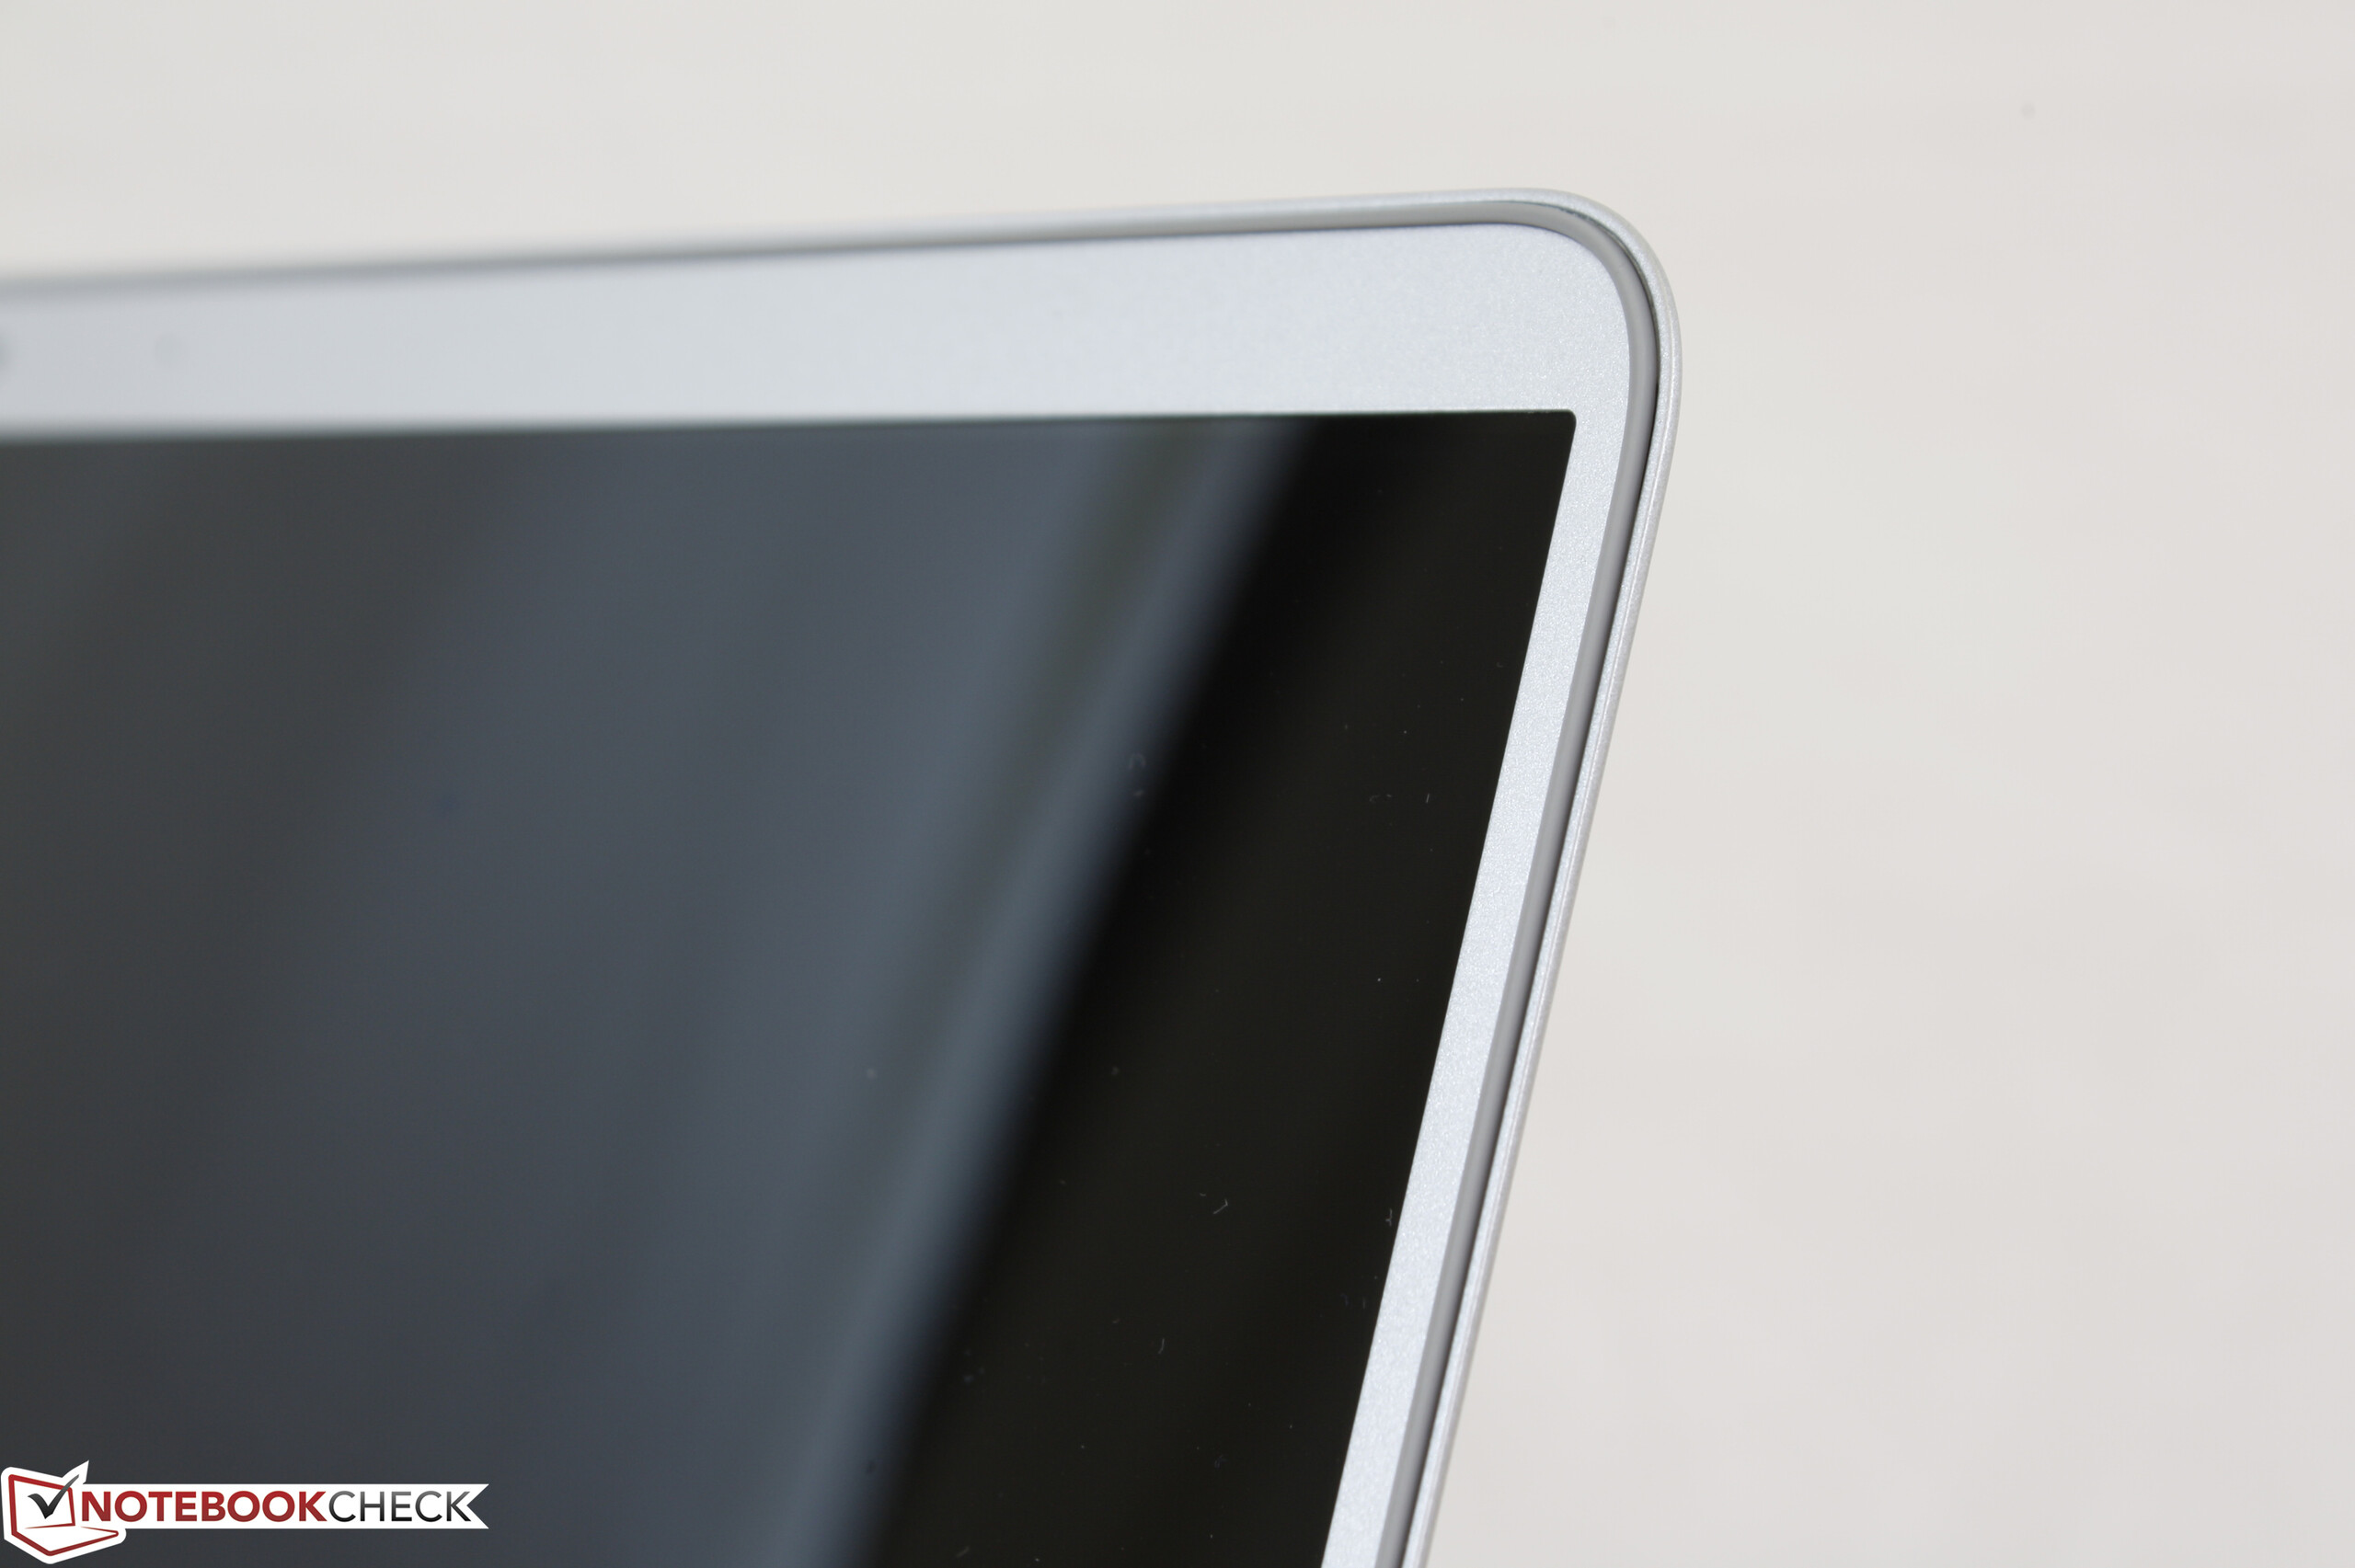
三星在机身强度方面做得远远谈不上完美,只能说是平均水平,特别是在屏幕配置方面奇怪的选择。的确窄边框很讨人喜欢,但它比其他竞品来说都太过柔软了。很奇怪的是镜面屏幕是标配但却没有常见的大猩猩玻璃保护或者是触摸屏的选项。在几乎所有亮度上都可以发现的PWM可能是另一个让部分用户考虑是否购买的因素。
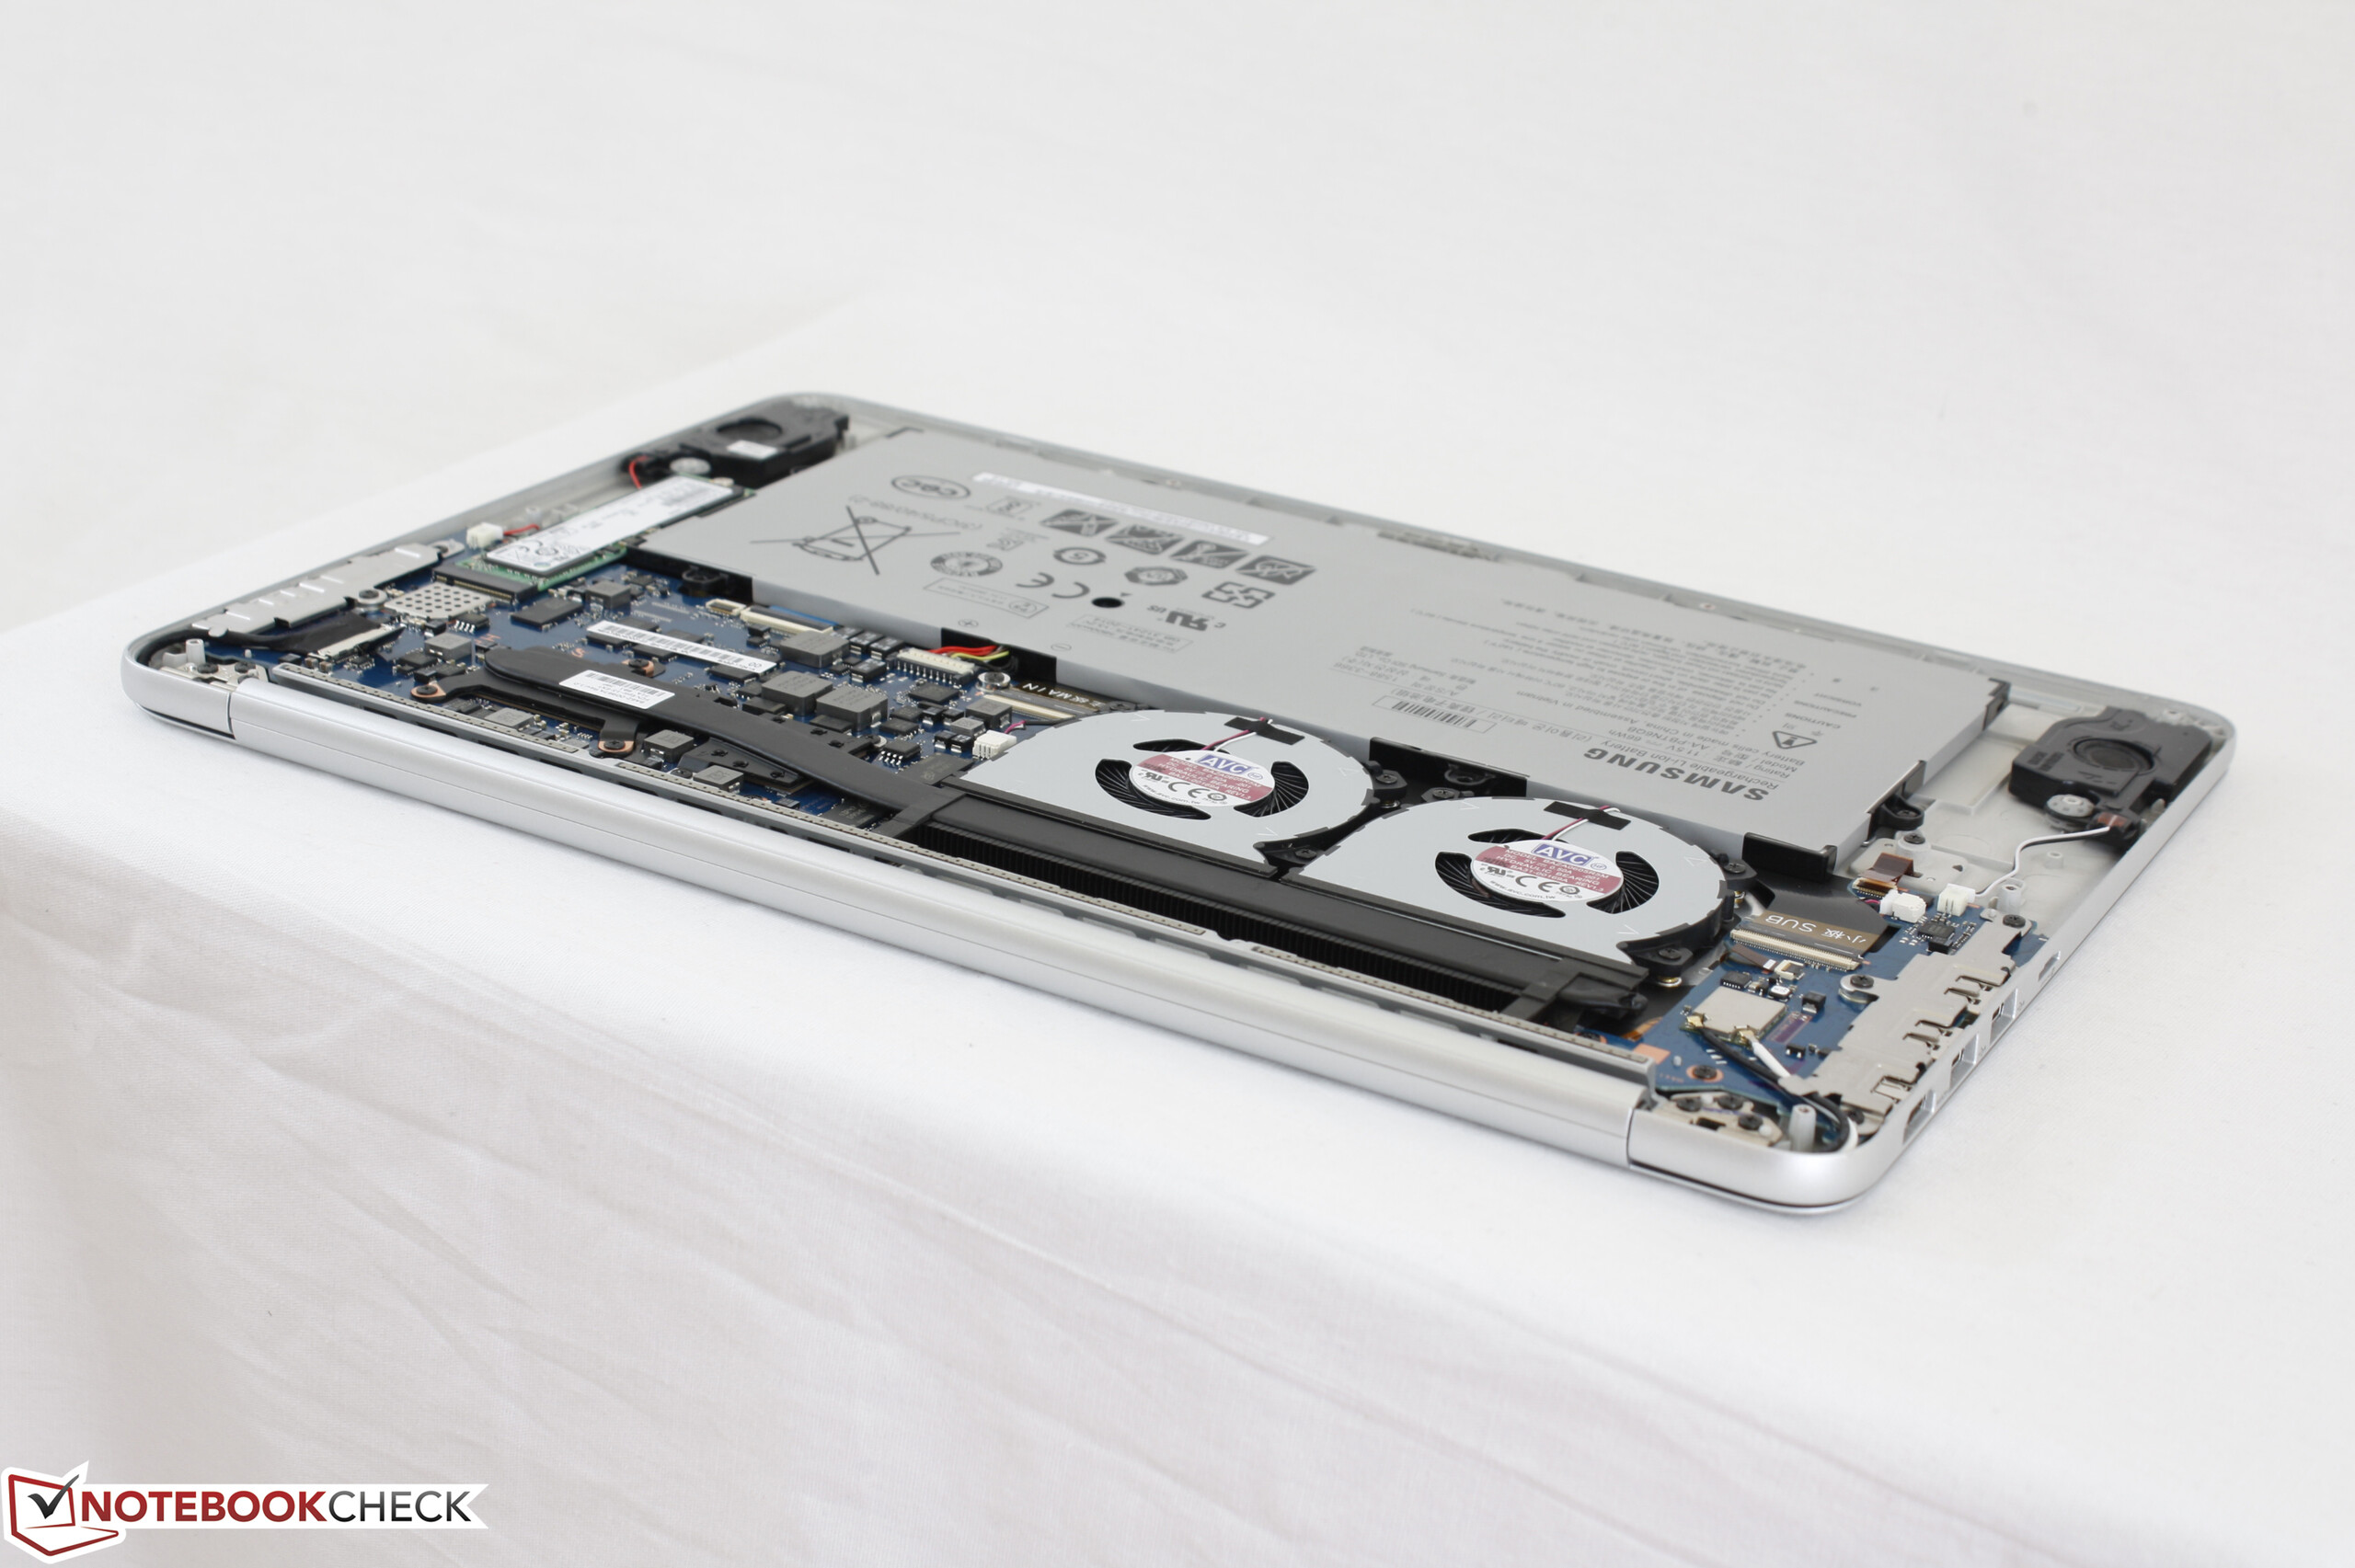
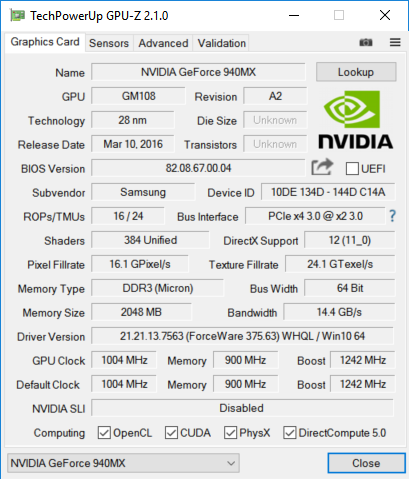
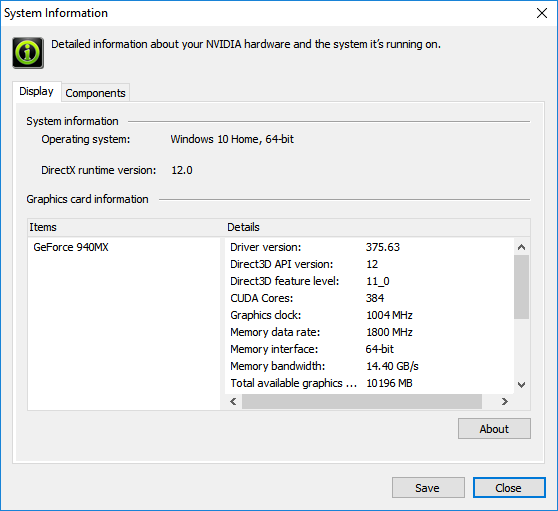
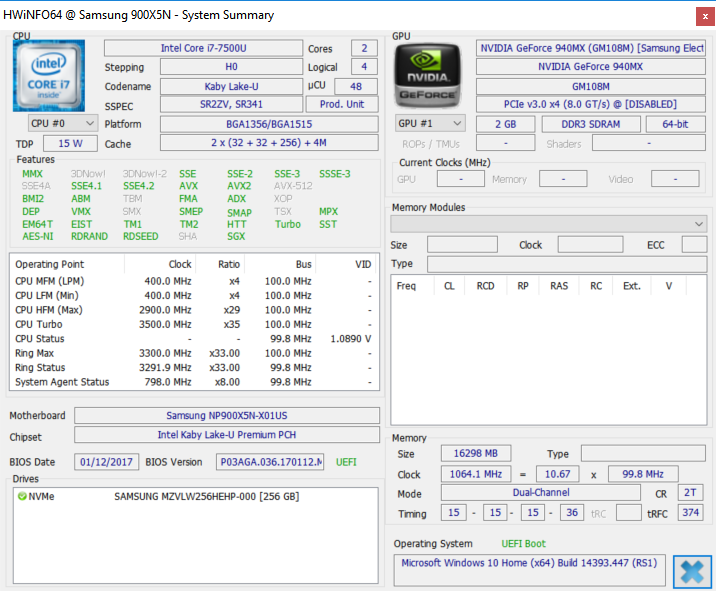
再者,我们对于 GeForce 940MX 显卡仅配备 DDR3显存而不是更好的GDDR5显存感到失望,毕竟940MX已经是即将被淘汰的型号了。英伟达很快就会发布用于轻薄笨的 GeForce MX150 ,它将使得 940MX 系列被彻底淘汰。
最后,测试机的配置型号要价高达1400美元。如果用户能够避免损坏脆弱的转轴,那么它的优点依旧是能够超过其缺点的。
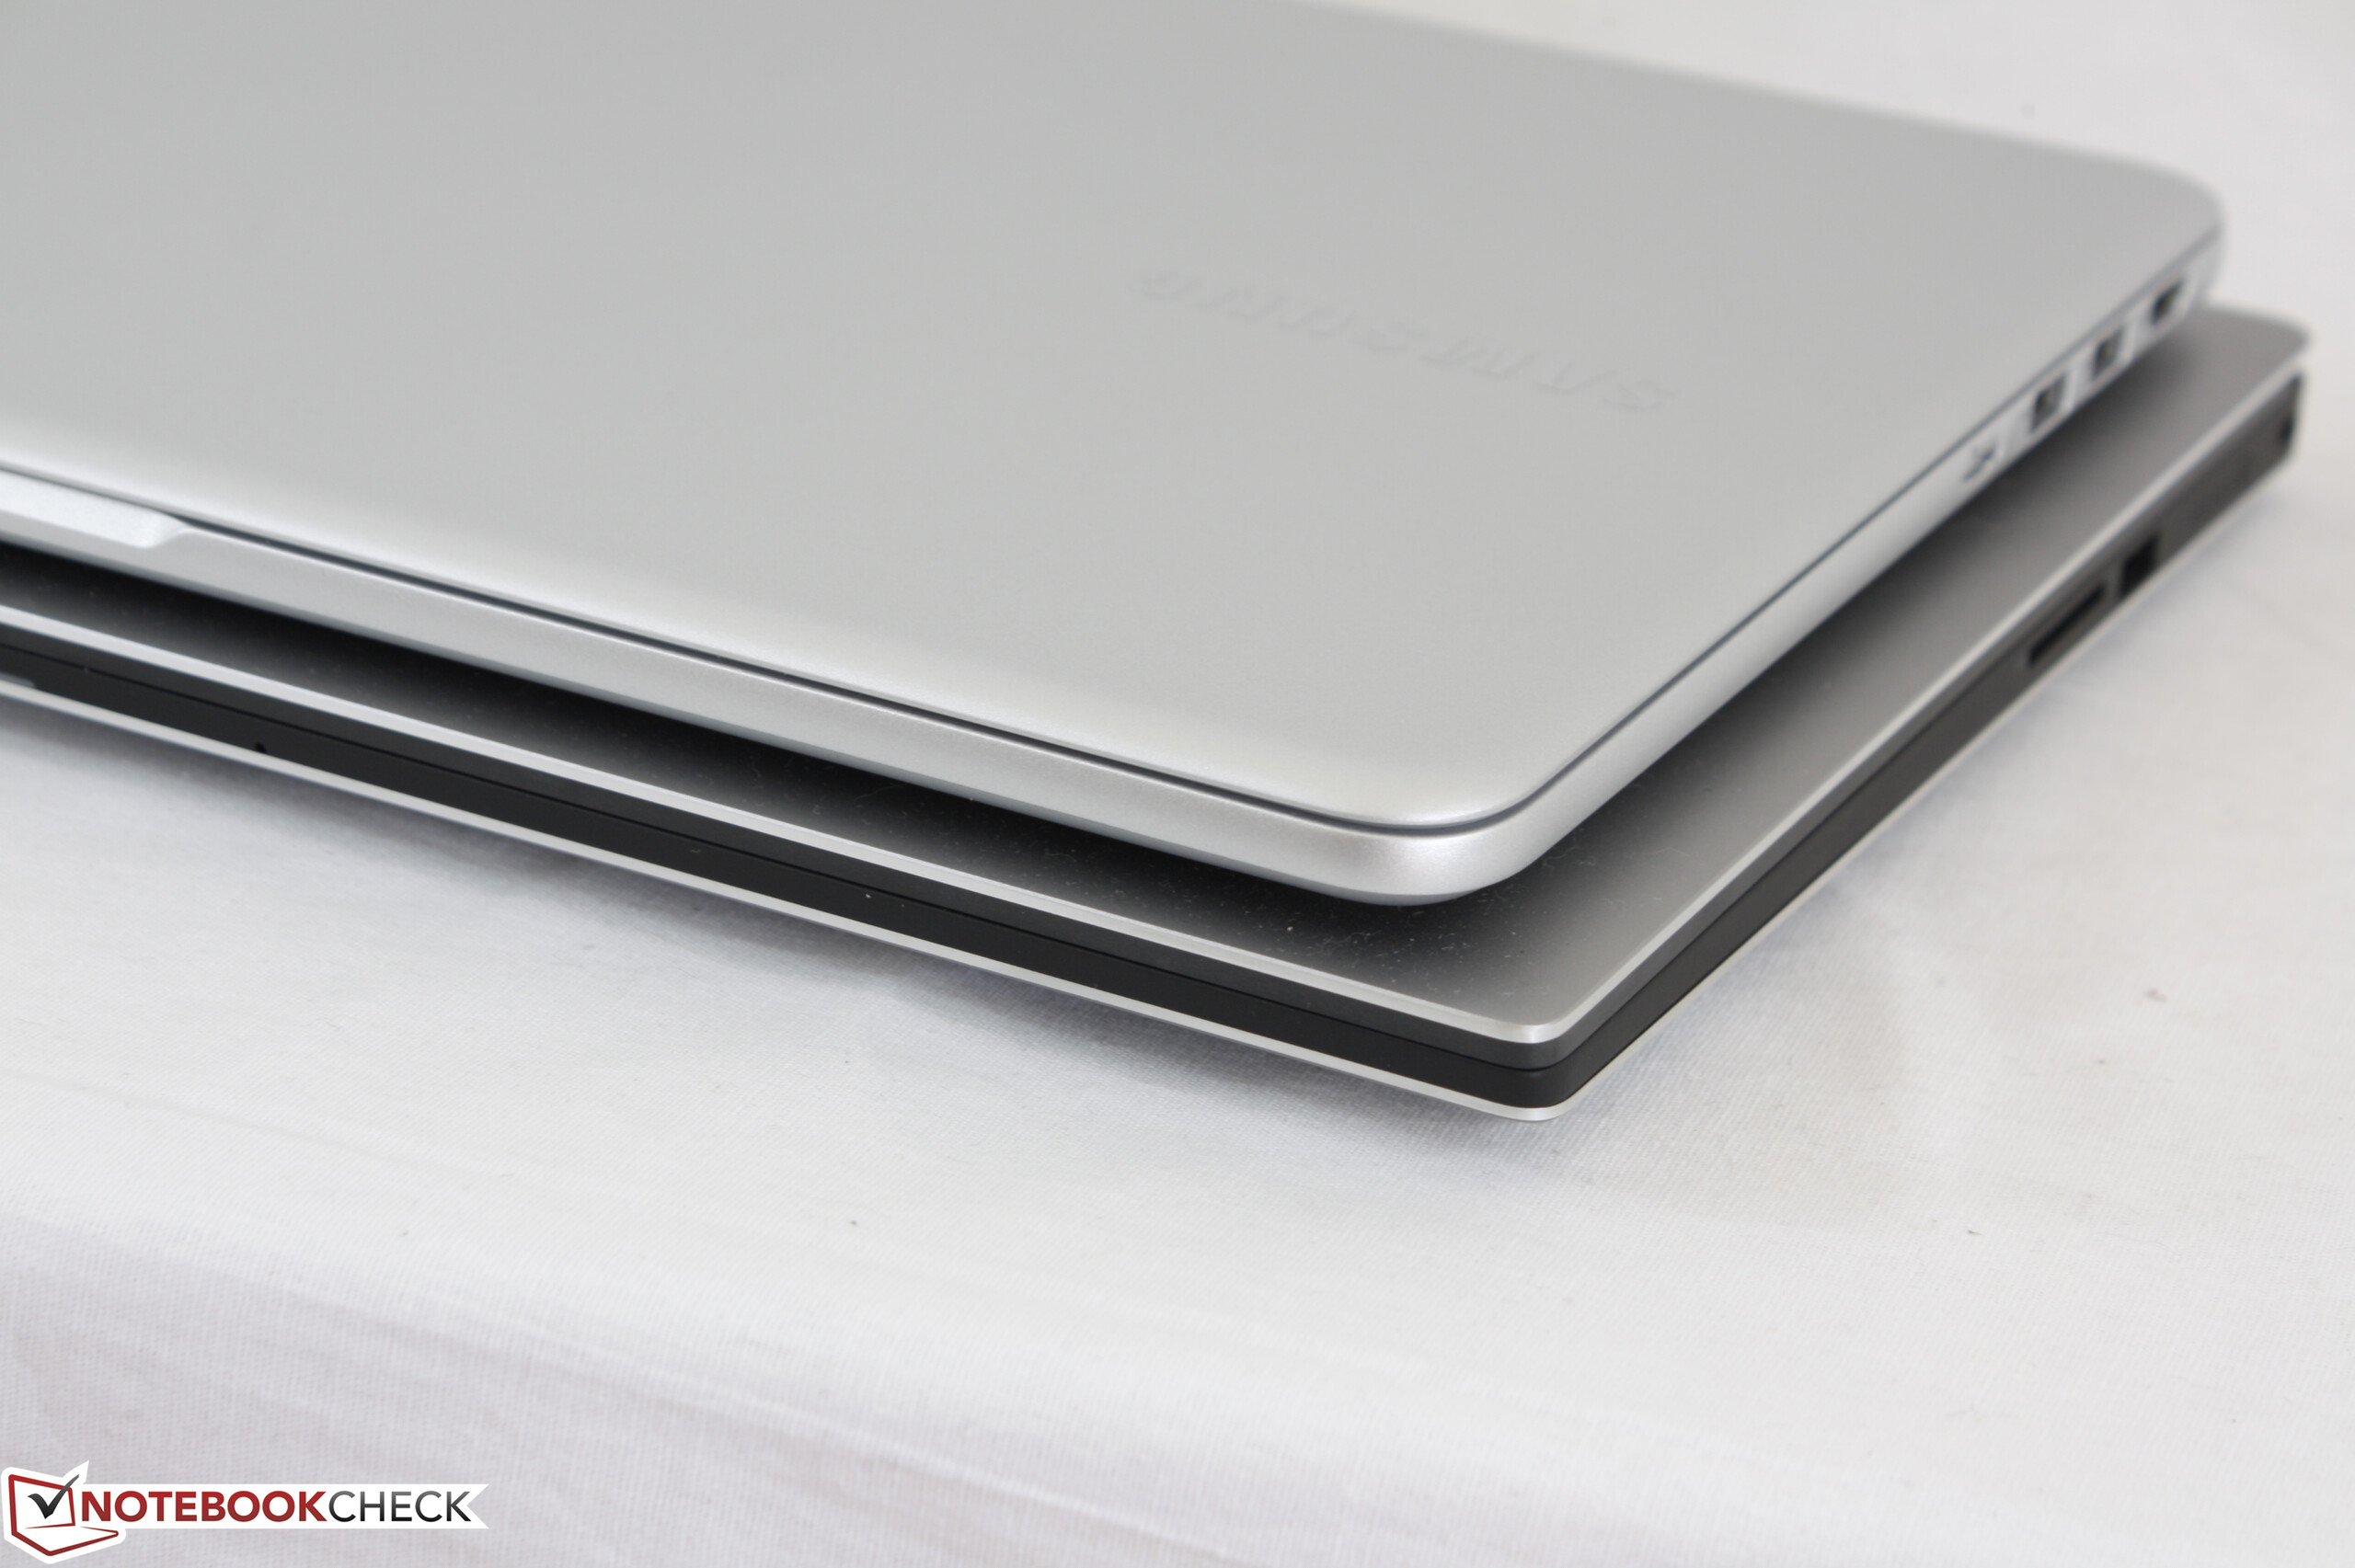
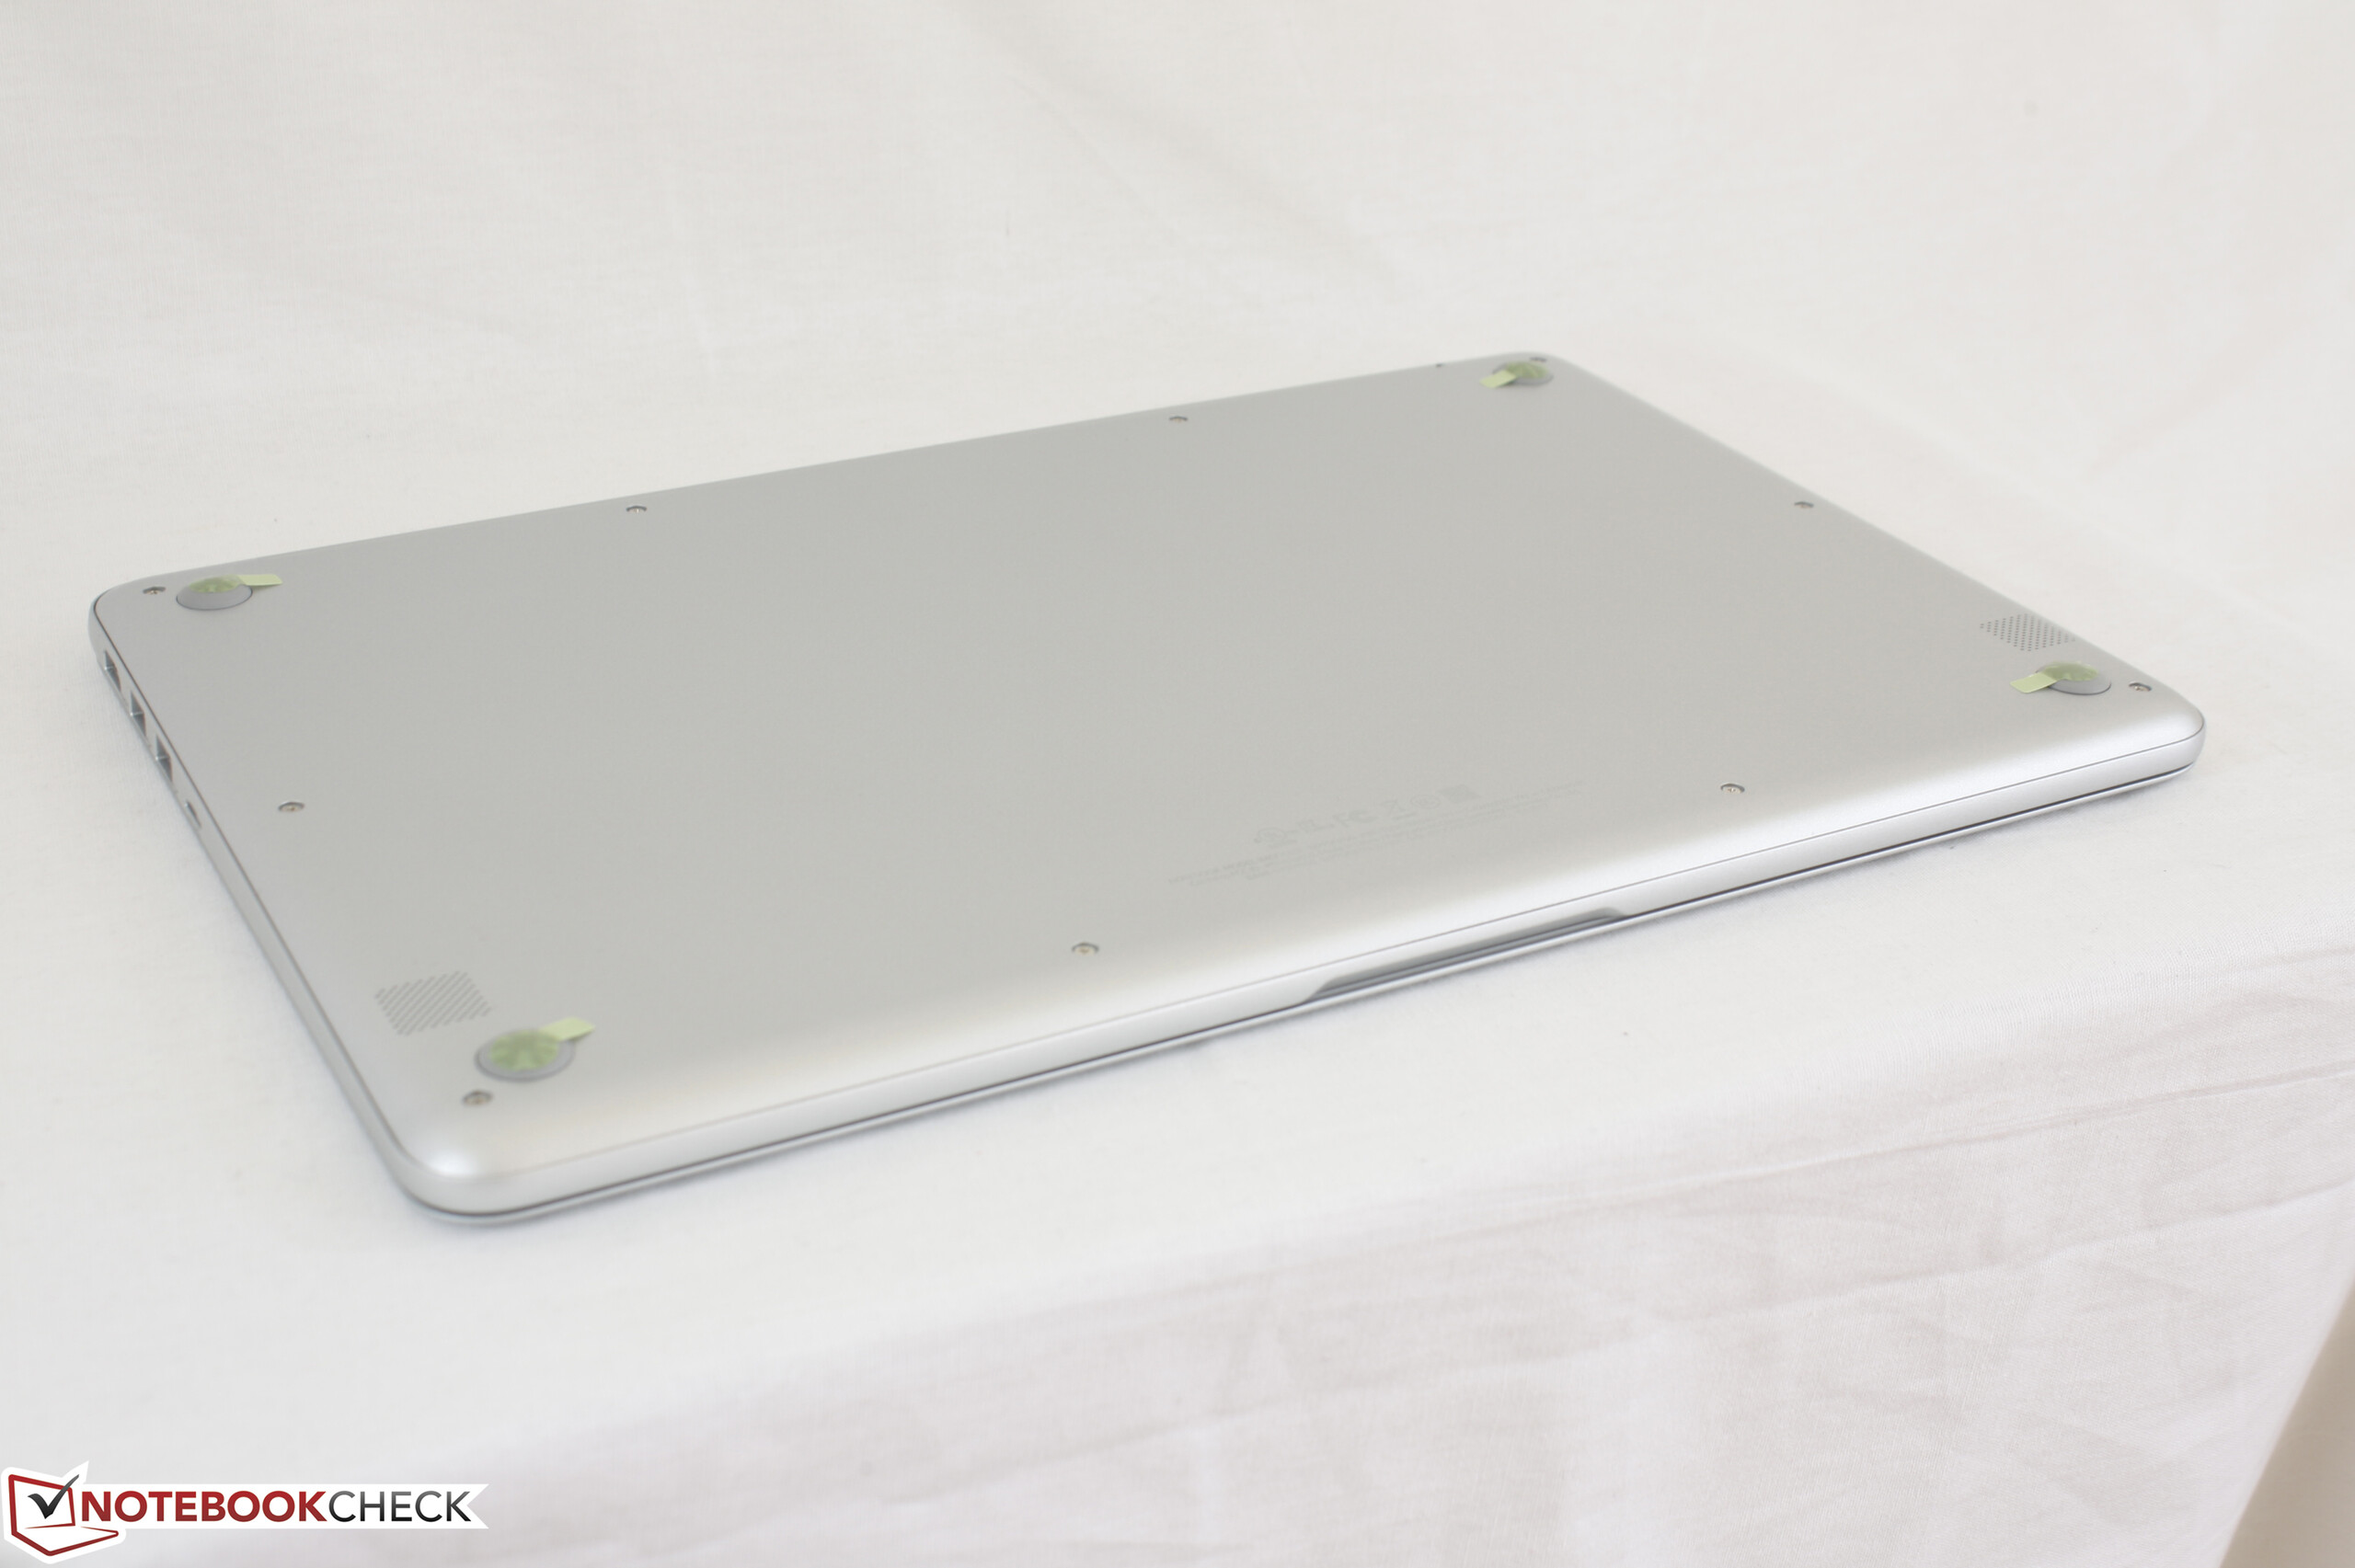
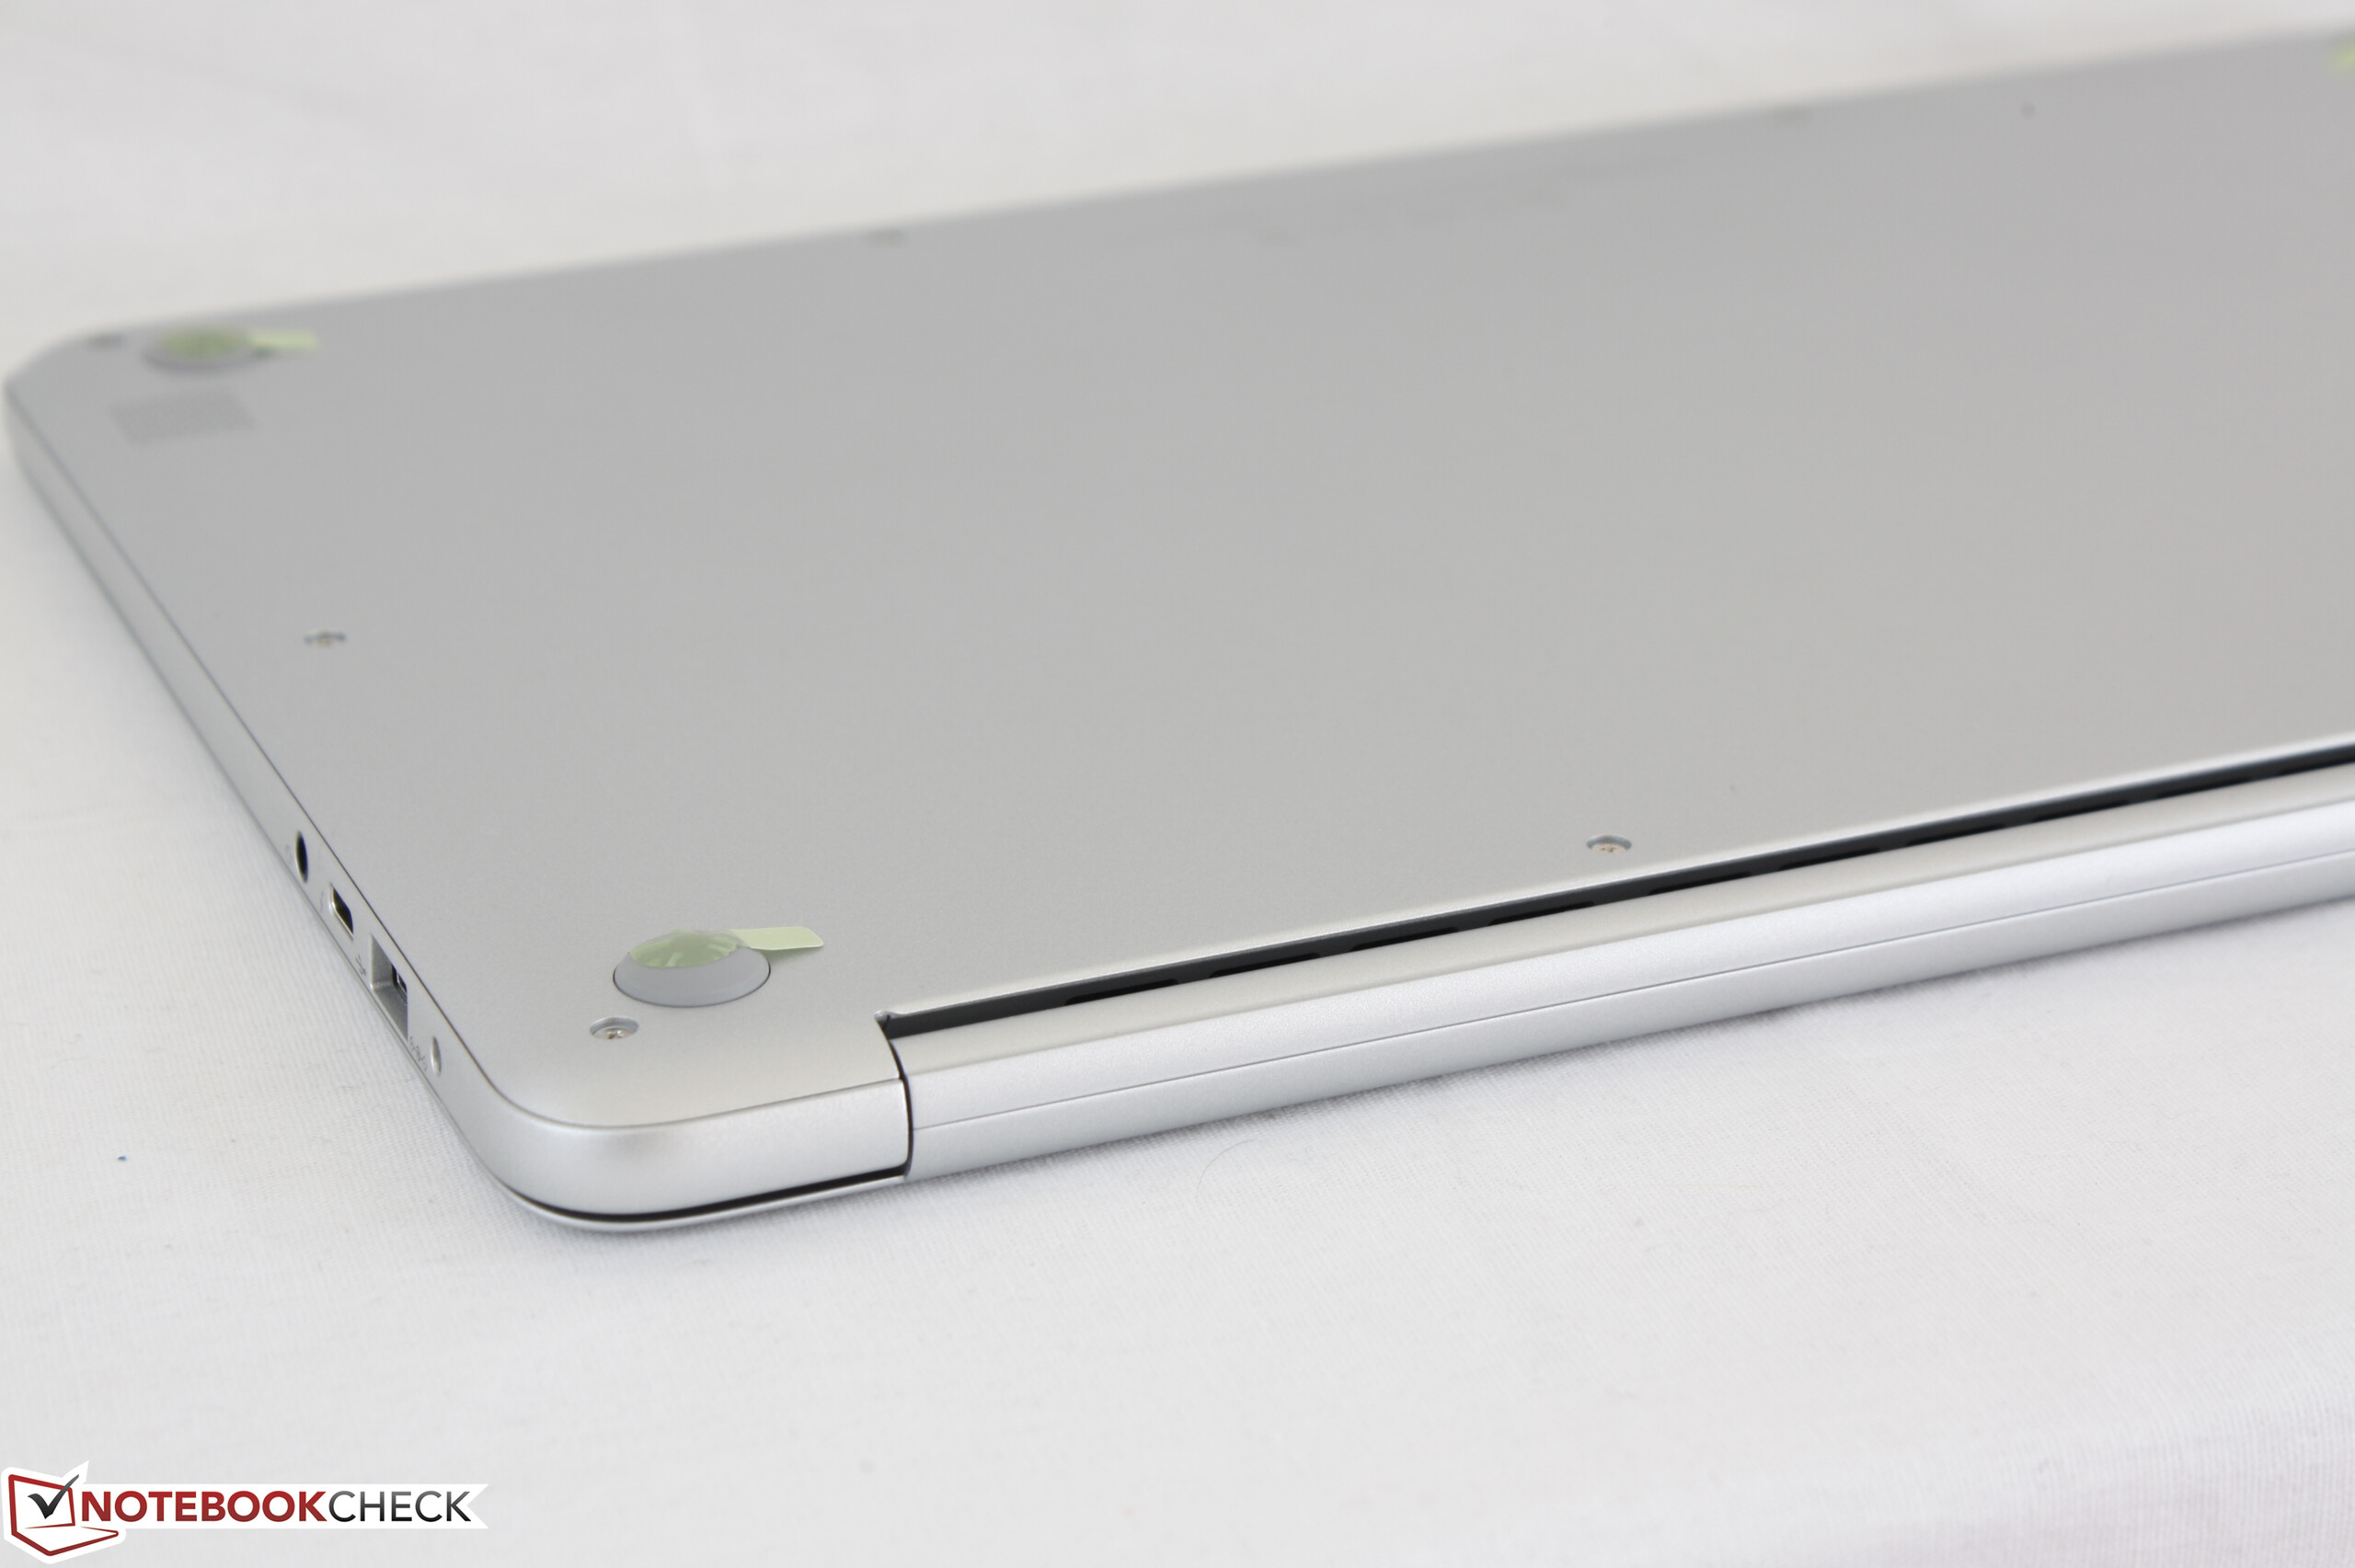
新款 Notebook 9 由于其的15英寸屏幕而出众,其所占面积在14英寸及15.6英寸笔记本之间。它的便携性令人惊讶,而且使用起来十分舒适,特别是对于那些长期出行的用户来说,但外壳能够通过加强而得到改善。
注:本文是基于完整评测的缩减版本,阅读完整的英文评测,请点击这里。
Samsung Notebook 9 NP900X5N-X01US
- 06/15/2017 v6 (old)
Allen Ngo
Price comparison
