Notebookcheck Logo

Intel HD Graphics 4000

Intel HD Graphics 4000

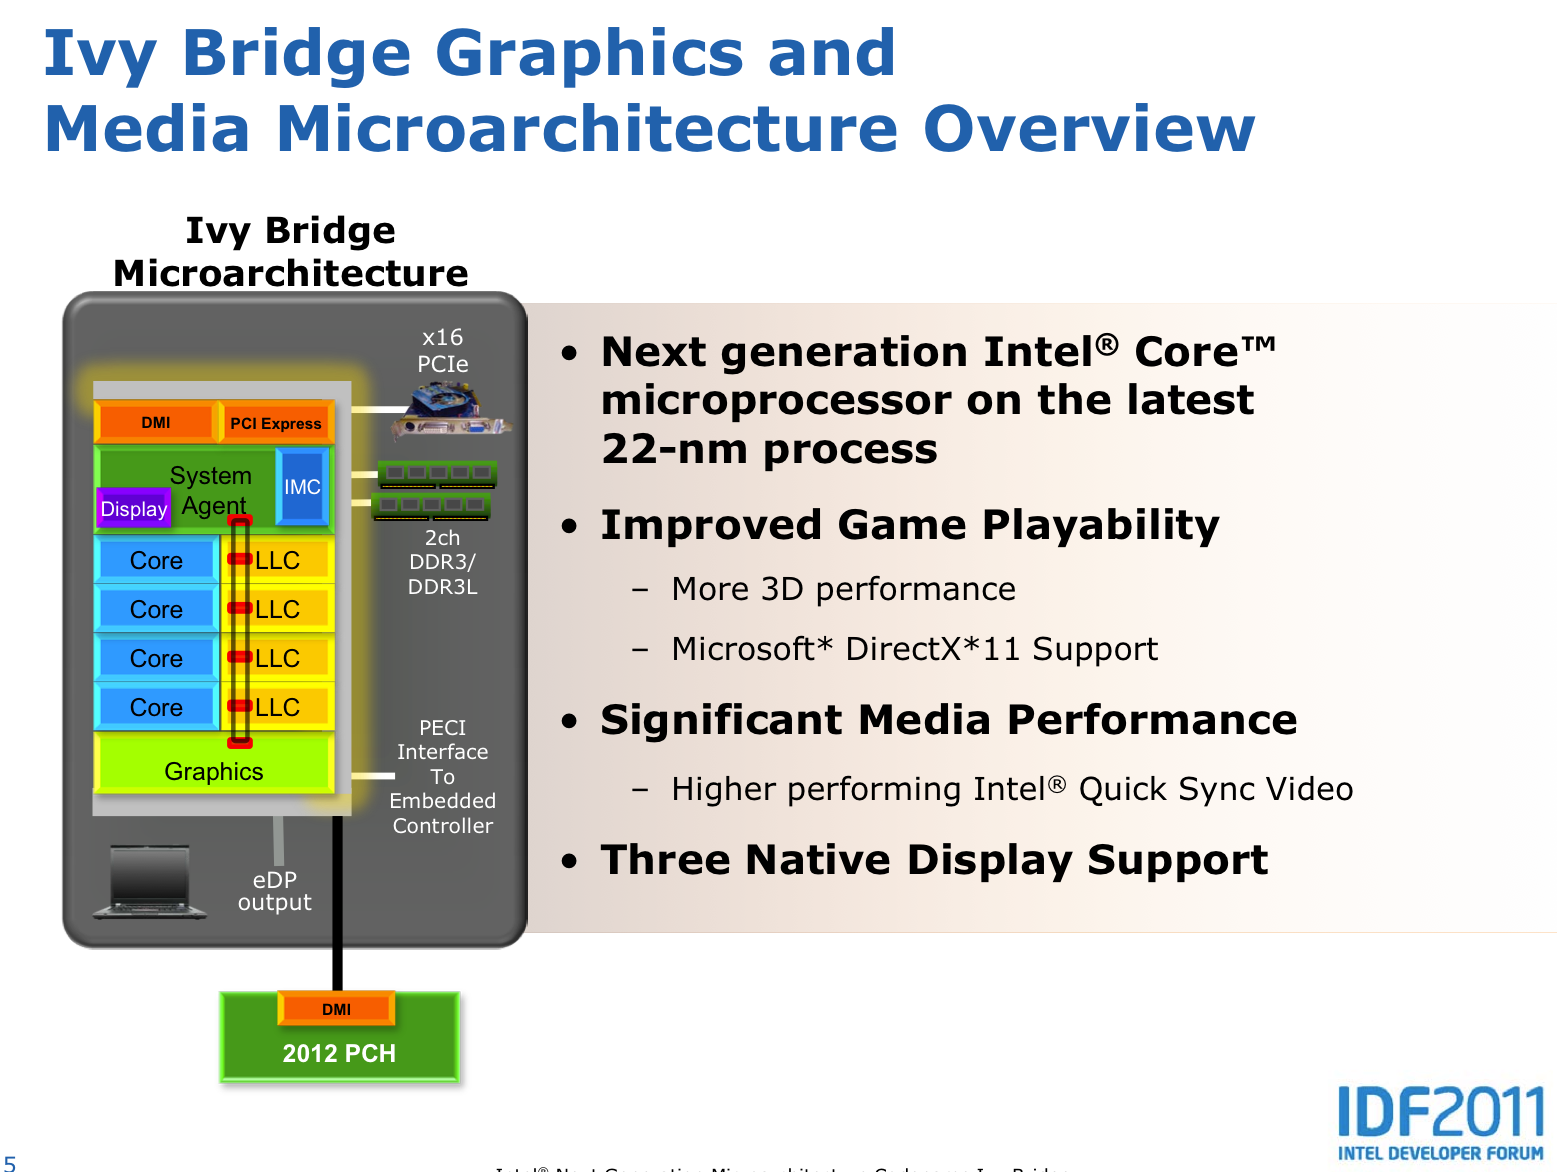
英特尔HD Graphics 4000(GT2)处理器的图形卡,包括在2012年(第三代的核心,例如酷睿i7-3770)的Ivy Bridge处理器。 Turbo Boost技术,可以自动超频使用的基准时钟。根据不同的处理器型号,基地和涡轮增压的时钟速率可以有很大的不同,导致在不同的图形性能相比高端四核心部件的ULV部分。的Sandy Bridge处理器中的英特尔HD Graphics 3000,HD 4000显卡完全重新设计,并提供改善的DirectX 11的着色器,硬件Tessellation(曲面细分),一个专门的3级缓存(前最后的CPU的一级缓存LLC)和DirectCompute支持。 IPC(每时钟周期指令),因此,即使以最快的速度与Sandy Bridge和整体高达60%以上的性能(3DMark Vantage中)应该是可能的2倍。第一基准位置的HD 4000图形(在一个快速的四核台式机CPU),一个专用的NVIDIA GeForce GT 330M,因此AMD处理器显卡Radeon HD 6620G以上的水平。在我们广泛的测试与游戏的HD 4000图形是能够击败HD 6620G在一个快速的酷睿i7-3820QM约15%。在较低的酷睿i7-3610QM和双核酷睿i5的6620G水平相近。因此,随意降低质量设置中高端游戏玩家不会介意,可能是高清显卡4000的表现感到高兴。请注意,高清显卡4000的CP​​U型号的不同,使用不同的时钟速度。 ULV的CPU(核心IX-3xx7M)的,例如功能较低的时钟速度,并不能维持Turbo频率为35 - 55瓦特型号。因此,ULV版本是,平均慢约30%。集成视频解码器称为多格式编解码器引擎(MFX)也得到了改善和4K应该允许甚至simultaneus的视频解码。 DXVAChecker列表MPEG2,VC1,WMV9,H264支持的编解码器。 QuickSync快速转码的视频进行了优化,以更高的性能和更好的图像质量。另一项新功能是支持多达3个独立的显示器(取决于如何使用HD 4000的笔记本电脑 - 也许只有一个DisplayPort / EDP)为AMD提供了与他们的Eyefinity技术支持(最多6个显示器)。由于3D三栅极的22nm生产工艺,应该是比较低的功耗(每瓦特性能)的发展重点。全包(包括处理器和内存控制器)之间的TDP 18瓦(ULV​​)移动四核45瓦()的消费类笔记本的CPU。

HD Graphics Series

HD Graphics P530 24 @ 0.35 - 1.05 GHz64/128 Bit
HD Graphics 5600 24 @ 0.3 - 1.05 GHz64/128 Bit
HD Graphics 6000 48 @ 0.3 - 1 GHz64/128 Bit
HD Graphics 4600 20 @ 0.2 - 1.35 GHz64/128 Bit
HD Graphics 5500 24 @ 0.3 - 0.95 GHz64/128 Bit
HD Graphics 5000 40 @ 0.2 - 1.1 GHz64/128 Bit
HD Graphics 4400 20 @ 0.2 - 1.1 GHz64/128 Bit
HD Graphics 5300 24 @ 0.1 - 0.9 GHz64/128 Bit
HD Graphics 4000 16 @ 0.35 - 1.35 GHz64/128 Bit
HD Graphics (Broadwell) 12 @ 0.1 - 0.85 GHz64/128 Bit
HD Graphics 4200 20 @ 0.2 - 0.85 GHz64/128 Bit
HD Graphics (Skylake) 12 @ 0.3 - 0.8 GHz64/128 Bit
HD Graphics 405 (Braswell) 16 @ 0.32 - 0.7 GHz64/128 Bit
HD Graphics (Braswell) 16 @ 0.32 - 0.7 GHz64/128 Bit
HD Graphics 400 (Braswell) 12 @ 0.32 - 0.64 GHz64/128 Bit
HD Graphics (Haswell) 10 @ 0.2 - 1 GHz64/128 Bit
HD Graphics (Cherry Trail) 16 @ 0.2 - 0.6 GHz64/128 Bit
HD Graphics 3000 12 @ 0.35 - 1.35 GHz64/128 Bit
HD Graphics 2500 6 @ 0.65 - 1.15 GHz64/128 Bit
HD Graphics (Ivy Bridge) 6 @ 0.35 - 1.1 GHz64/128 Bit
HD Graphics 2000 6 @ 0.85 - 1.35 GHz64/128 Bit
HD Graphics (Sandy Bridge) 6 @ 0.35 - 1.1 GHz64/128 Bit
HD Graphics (Bay Trail) 4 @ 0.31 - 0.9 GHz32/64/128 Bit
CodenameIvy Bridge
ArchitectureGen. 7 Ivy Bridge
Pipelines16 - unified
Core Speed350 - 1350 (Boost) MHz
Memory Bus Width64/128 Bit
Shared Memoryyes
APIDirectX 11, Shader 5.0, OpenGL 3.1
technology22 nm
FeaturesQuickSync
Date of Announcement23.03.2011
CPU in HD Graphics 4000GPU Base SpeedGPU Boost / Turbo
Intel Core i7-3770K4 x 3500 MHz, 77 W650 MHz1150 MHz
Intel Core i7-3940XM4 x 3000 MHz, 55 W650 MHz1350 MHz
Intel Core i7-3920XM4 x 2900 MHz, 55 W650 MHz1300 MHz
min. - max.350 - 650 MHz850 - 1350 MHz

Benchmarks

Performance Rating - 3DMark 11 + Fire Strike + Time Spy
0.2 pt (1%)
AMD Radeon HD 8180
0.06605 -70%
...
0.1911 -13%
Intel HD Graphics 4200
0.1966 -10%
Intel UHD Graphics 600
0.1972 -10%
AMD Radeon R4 (Kaveri)
0.1975 -10%
0.2 -9%
Intel UHD Graphics 605
0.2068 -5%
Intel HD Graphics (Broadwell)
0.2109 -4%
AMD Radeon HD 8450G
0.2116 -3%
AMD Radeon HD 8610G
0.2164 -1%
Intel HD Graphics 4000
0.2187
0.2264 4%
AMD Radeon R2 (Stoney Ridge)
0.233 7%
0.2332 7%
AMD Radeon HD 8450G + Radeon HD 8570M Dual Graphics
0.2346 7%
Intel UHD Graphics (Elkhart Lake 16 EU)
0.2382 9%
0.2455 12%
0.2592 19%
Intel HD Graphics 4400
0.2592 19%
0.2592 19%
...
21.1 9548%
max:
33.3 15126%
0%
100%
3DMark - 3DMark Ice Storm Unlimited Graphics
min: 43759     avg: 44324     median: 44323.5 (5%)     max: 44888 Points
3DMark - 3DMark Ice Storm Extreme Graphics
min: 20514     avg: 24179     median: 24426 (3%)     max: 28772 Points
3DMark - 3DMark Cloud Gate Score
min: 1469     avg: 3380     median: 3282.5 (4%)     max: 5946 Points
3DMark - 3DMark Cloud Gate Graphics
min: 1619     avg: 3850     median: 3768.5 (1%)     max: 5761 Points
3DMark - 3DMark Fire Strike Standard Score
min: 168     avg: 446.5     median: 444 (1%)     max: 647 Points
3DMark - 3DMark Fire Strike Standard Graphics
min: 191     avg: 486.1     median: 480 (1%)     max: 705 Points
3DMark - 3DMark Ice Storm Graphics
min: 11232     avg: 31858     median: 31598 (4%)     max: 48923 Points
3DMark 11 - 3DM11 Performance Score
min: 248     avg: 603     median: 603 (1%)     max: 802 Points
3DMark 11 - 3DM11 Performance GPU
min: 216     avg: 522     median: 523 (0%)     max: 684 Points
171.8 -67%
...
469.1 -10%
471.7 -10%
478.6 -8%
Intel HD Graphics (Haswell)
479.6 -8%
492 -6%
AMD Radeon HD 8280
496 -5%
499.8 -4%
513 -2%
519 -1%
Intel HD Graphics 4000
522
531 2%
AMD Radeon HD 8330
532 2%
Intel UHD Graphics 600
558 7%
576 10%
582 11%
584 12%
585 12%
597 14%
599 15%
...
59943 11383%
max:
106023 20211%
0%
100%
3DMark Vantage
3DM Vant. Perf. total +
3DMark Vantage - 3DM Vant. Perf. total
min: 830     avg: 2985     median: 2959 (1%)     max: 4433 Points
3DM Vant. Perf. GPU no PhysX +
3DMark Vantage - 3DM Vant. Perf. GPU no PhysX
min: 659     avg: 2441     median: 2415 (1%)     max: 3488 Points
ATI Radeon HD 3200
62 -97%
...
AMD Radeon HD 8350G
2212 -9%
2216 -9%
NVIDIA GeForce 8800M GTS
2220 -9%
2222 -9%
AMD Radeon R4 (Stoney Ridge)
2243 -8%
2259 -7%
2322 -5%
2362 -3%
NVIDIA Quadro FX 2700M
2392 -2%
Intel HD Graphics 4000
2441
NVIDIA GeForce 9700M GTS
2453 0%
2478 2%
2527 4%
ATI Mobility Radeon HD 4670
2552 5%
2593 6%
2624 7%
2674 10%
2711 11%
2731 12%
...
132443 5326%
max:
170928 6902%
0%
100%
3DMark 2001SE - 3DMark 2001 - Standard
min: 8967     avg: 14343     median: 15220 (16%)     max: 16933 Points
3DMark 03 - 3DMark 03 - Standard
min: 7402     avg: 11805     median: 12768 (7%)     max: 19294 Points
3DMark 05 - 3DMark 05 - Standard
min: 5239     avg: 8296     median: 8393 (9%)     max: 11948 Points
Intel Graphics Media Accelerator (GMA) 500
133.4 -98%
...
7600 -8%
7605 -8%
7732 -7%
7781 -6%
NVIDIA Quadro FX 570M
7790 -6%
7795 -6%
8031 -3%
ATI Mobility Radeon HD 3670
8176 -1%
8276 0%
Intel HD Graphics 4000
8296
8358 1%
NVIDIA GeForce 9650M GT
8387 1%
NVIDIA GeForce Go 7900 GTX
8436 2%
NVIDIA Quadro FX 2500M
8450 2%
8495 2%
ATI Mobility FireGL V5700
8577 3%
8649 4%
Intel HD Graphics 4400
8674 5%
8696 5%
...
61850 646%
max:
87172 951%
0%
100%
3DMark 06 3DMark 06 - Score Unknown Settings +
3DMark 06
4276 points (6%)
3DMark 06 - Standard 1280x1024 +
3DMark 06
min: 1605     avg: 4588     median: 4412.5 (6%)     max: 7159 Points
Unigine Heaven 3.0 - Unigine Heaven 3.0 DX 11
min: 6.9     avg: 7.6     median: 7.4 (2%)     max: 8.9 fps
Unigine Heaven 3.0 - Unigine Heaven 3.0 OpenGL
min: 7.7     avg: 8.1     median: 8.1 (4%)     max: 8.4 fps
Unigine Heaven 2.1 - Heaven 2.1 high
min: 6     avg: 9.6     median: 9.4 (2%)     max: 13 fps
SPECviewperf 11
specvp11 snx-01 +
SPECviewperf 11 - specvp11 snx-01
min: 0.69     avg: 1.1     median: 1.2 (1%)     max: 1.47 fps
specvp11 tcvis-02 +
SPECviewperf 11 - specvp11 tcvis-02
min: 1.43     avg: 1.9     median: 2.1 (1%)     max: 2.27 fps
specvp11 sw-02 +
SPECviewperf 11 - specvp11 sw-02
min: 3.98     avg: 6.9     median: 7.5 (6%)     max: 8.45 fps
specvp11 proe-05 +
SPECviewperf 11 - specvp11 proe-05
min: 0.62     avg: 1.1     median: 1.2 (1%)     max: 1.47 fps
specvp11 maya-03 +
SPECviewperf 11 - specvp11 maya-03
min: 7.12     avg: 10.2     median: 9.7 (7%)     max: 13.09 fps
specvp11 lightwave-01 +
SPECviewperf 11 - specvp11 lightwave-01
min: 5.67     avg: 10.2     median: 11.1 (12%)     max: 12.55 fps
specvp11 ensight-04 +
SPECviewperf 11 - specvp11 ensight-04
min: 1.06     avg: 1.6     median: 1.7 (1%)     max: 2.24 fps
specvp11 catia-03 +
Windows 7 Experience Index - Win7 Gaming graphics
min: 5.9     avg: 6.4     median: 6.4 (81%)     max: 6.6 Points
Windows 7 Experience Index - Win7 Graphics
min: 4.7     avg: 5.6     median: 5.1 (65%)     max: 6.6 Points
Cinebench R10 Cinebench R10 Shading (32bit) +
Cinebench R10 - Cinebench R10 Shading (32bit)
min: 2447     avg: 5020     median: 5157 (4%)     max: 8562 points
Cinebench R11.5 Cinebench R11.5 OpenGL 64 Bit +
Cinebench R11.5 - Cinebench R11.5 OpenGL 64 Bit
min: 5.58     avg: 14.4     median: 13.6 (5%)     max: 22.54 fps
Cinebench R15
Cinebench R15 OpenGL 64 Bit +
Cinebench R15 - Cinebench R15 OpenGL 64 Bit
min: 8.47     avg: 11.9     median: 11.9 (1%)     max: 15.35 fps
Cinebench R15 OpenGL Ref. Match 64 Bit +
Cinebench R15 - Cinebench R15 OpenGL Ref. Match 64 Bit
min: 32.2     avg: 50.9     median: 32.2 (32%)     max: 97.8 %
GFXBench (DX / GLBenchmark) 2.7
GFXBench T-Rex HD Offscreen C24Z16 +
GFXBench (DX / GLBenchmark) 2.7 - GFXBench T-Rex HD Offscreen C24Z16
min: 31     avg: 40.1     median: 39 (0%)     max: 49 fps
LuxMark v2.0 64Bit - LuxMark v2.0 Room GPU
min: 31     avg: 46.9     median: 34 (0%)     max: 163 Samples/s
LuxMark v2.0 64Bit - LuxMark v2.0 Sala GPU
min: 50     avg: 79.4     median: 66 (0%)     max: 251 Samples/s
ComputeMark v2.1 - ComputeMark v2.1 Result
min: 31     avg: 514     median: 537 (1%)     max: 630 points
- Range of benchmark values for this graphics card
- Average benchmark values for this graphics card
* Smaller numbers mean a higher performance

Game Benchmarks

The following benchmarks stem from our benchmarks of review laptops. The performance depends on the used graphics memory, clock rate, processor, system settings, drivers, and operating systems. So the results don't have to be representative for all laptops with this GPU. For detailed information on the benchmark results, click on the fps number.

low 1280x720
68  fps    + Compare
ultra 1920x1080
13.3  fps    + Compare
» With all tested laptops playable in detail settings low.
low 1280x720
43  fps    + Compare
med. 1366x768
25.1  fps    + Compare
» With all tested laptops playable in detail settings low.
low 1280x720
0 (!)  fps    + Compare
Overwatch

Overwatch

2016
low 1280x720
25.6  fps    + Compare
» The benchmarks indicate that the game is not playable in the tested settings.
low 1024x768
10  fps    + Compare
» The benchmarks indicate that the game is not playable in the tested settings.
FIFA 16

FIFA 16

2015
low 1280x720
60  fps    + Compare
high 1366x768
26  fps    + Compare
ultra 1920x1080
16  fps    + Compare
» With all tested laptops playable in detail settings low.
low 1366x768
56.7  fps    + Compare
med. 1366x768
36  fps    + Compare
high 1920x1080
17.1  fps    + Compare
ultra 1920x1080
12.4  fps    + Compare
» With all tested laptops playable in detail settings med..
low 1024x768
41  fps    + Compare
med. 1366x768
25.2  fps    + Compare
high 1920x1080
9.6  fps    + Compare
» With all tested laptops playable in detail settings low.
Mad Max

Mad Max

2015
med. 1366x768
14.6  fps    + Compare
» The benchmarks indicate that the game is not playable in the tested settings.
low 1280x720
96  fps    + Compare
med. 1366x768
40.2  fps    + Compare
high 1920x1080
16.9  fps    + Compare
» With all tested laptops playable in detail settings med..
low 1024x768
53.7 91 (!) ~ 72 fps    + Compare
med. 1366x768
16.4 21 ~ 19 fps    + Compare
high 1920x1080
12.5 12.6 ~ 13 fps    + Compare
ultra 1920x1080
12.5  fps    + Compare
» With all tested laptops playable in detail settings low.
GTA V

GTA V

2015
low 1024x768
26.8  fps    + Compare
» The benchmarks indicate that the game is not playable in the tested settings.
low 1024x768
21.2  fps    + Compare
» The benchmarks indicate that the game is not playable in the tested settings.
Evolve

Evolve

2015
low 1024x768
12.2  fps    + Compare
» The benchmarks indicate that the game is not playable in the tested settings.
The Crew

The Crew

2014
low 1280x720
15  fps    + Compare
» The benchmarks indicate that the game is not playable in the tested settings.
low 1024x768
18.5  fps    + Compare
med. 1366x768
11.7  fps    + Compare
» The benchmarks indicate that the game is not playable in the tested settings.
Far Cry 4

Far Cry 4

2014
low 1024x768
13.2  fps    + Compare
» The benchmarks indicate that the game is not playable in the tested settings.
low 1024x768
3 (!)  fps    + Compare
» The benchmarks indicate that the game is not playable in the tested settings.
low 1024x768
0 (!)  fps    + Compare
low 1024x768
18.2  fps    + Compare
med. 1366x768
8.1  fps    + Compare
» The benchmarks indicate that the game is not playable in the tested settings.
F1 2014

F1 2014

2014
low 1024x768
38 55 ~ 47 fps    + Compare
med. 1366x768
23 33 ~ 28 fps    + Compare
high 1920x1080
16 18 ~ 17 fps    + Compare
ultra 1920x1080
12 12.5 ~ 12 fps    + Compare
» With all tested laptops playable in detail settings low.
low 1024x768
8.8  fps    + Compare
» The benchmarks indicate that the game is not playable in the tested settings.
low 1024x768
11.4  fps    + Compare
» The benchmarks indicate that the game is not playable in the tested settings.
low 1024x768
28.6  fps    + Compare
med. 1366x768
18.2  fps    + Compare
» The benchmarks indicate that the game is not playable in the tested settings.
low 1280x720
13  fps    + Compare
» The benchmarks indicate that the game is not playable in the tested settings.
Fifa 15

Fifa 15

2014
low 1280x720
32.4  fps    + Compare
high 1366x768
24.6  fps    + Compare
ultra 1920x1080
15.7  fps    + Compare
» The benchmarks indicate that the game is not playable in the tested settings.
low 1024x768
36.4  fps    + Compare
med. 1366x768
17.6  fps    + Compare
high 1920x1080
7.2  fps    + Compare
» With all tested laptops playable in detail settings low.
low 1024x768
83  fps    + Compare
med. 1366x768
25  fps    + Compare
high 1920x1080
14  fps    + Compare
» With all tested laptops playable in detail settings low.
low 1024x768
12.7  fps    + Compare
» The benchmarks indicate that the game is not playable in the tested settings.
low 1280x720
31  fps    + Compare
med. 1280x720
21.9  fps    + Compare
high 1920x1080
9.1  fps    + Compare
» The benchmarks indicate that the game is not playable in the tested settings.
low 1024x768
40  fps    + Compare
med. 1366x768
23.1  fps    + Compare
high 1366x768
13.9  fps    + Compare
ultra 1920x1080
7.2  fps    + Compare
» With all tested laptops playable in detail settings low.
Titanfall

Titanfall

2014
low 1024x768
20.4  fps    + Compare
med. 1366x768
10.9  fps    + Compare
high 1366x768
6.7  fps    + Compare
ultra 1920x1080
4.9  fps    + Compare
» The benchmarks indicate that the game is not playable in the tested settings.
Thief

Thief

2014
low 1024x768
19  fps    + Compare
med. 1366x768
10.9  fps    + Compare
high 1366x768
8.8  fps    + Compare
ultra 1920x1080
4.3  fps    + Compare
» The benchmarks indicate that the game is not playable in the tested settings.
low 1024x768
23.6  fps    + Compare
med. 1366x768
17.4  fps    + Compare
high 1366x768
7.4  fps    + Compare
ultra 1920x1080
3.6  fps    + Compare
» The benchmarks indicate that the game is not playable in the tested settings.
low 1024x768
37.7 46 ~ 42 fps    + Compare
med. 1366x768
14.6 18.1 ~ 16 fps    + Compare
high 1366x768
6.6 7.4 ~ 7 fps    + Compare
ultra 1920x1080
4.4 4.7 ~ 5 fps    + Compare
» With all tested laptops playable in detail settings low.
low 1024x768
12.6  fps    + Compare
» The benchmarks indicate that the game is not playable in the tested settings.
low 1024x768
40.6  fps    + Compare
med. 1366x768
24.3  fps    + Compare
high 1366x768
7.2  fps    + Compare
ultra 1920x1080
4  fps    + Compare
» With all tested laptops playable in detail settings low.
low 1024x768
32.2  fps    + Compare
med. 1366x768
19.7  fps    + Compare
high 1366x768
12.2  fps    + Compare
ultra 1920x1080
4.7  fps    + Compare
» The benchmarks indicate that the game is not playable in the tested settings.
low 1024x768
52  fps    + Compare
med. 1366x768
30  fps    + Compare
high 1366x768
12  fps    + Compare
ultra 1920x1080
6  fps    + Compare
» With all tested laptops playable in detail settings low.
F1 2013

F1 2013

2013
low 1024x768
34 34 48 76 85 ~ 55 fps    + Compare
med. 1366x768
28 28 33 46 ~ 34 fps    + Compare
high 1366x768
24 25 26 33 ~ 27 fps    + Compare
ultra 1920x1080
12 12 12 ~ 12 fps    + Compare
» With most tested laptops playable in detail settings low.
Fifa 14

Fifa 14

2013
low 1024x768
87.1 182 207.4 ~ 159 fps    + Compare
med. 1366x768
56.7 97 112.1 ~ 89 fps    + Compare
high 1366x768
33.7 48 84 85.4 ~ 63 fps    + Compare
ultra 1920x1080
18 26 44.7 49.6 ~ 35 fps    + Compare
» With most tested laptops playable in detail settings high.
low 1024x768
20 25.6 29.9 42 ~ 29 fps    + Compare
med. 1366x768
14 19.4 21.6 30.9 ~ 21 fps    + Compare
» The benchmarks indicate that the game is not playable in the tested settings.
low 1280x720
28.6 30.8 ~ 30 fps    + Compare
med. 1366x768
20.6 21.8 ~ 21 fps    + Compare
high 1366x768
9.4 9.6 ~ 10 fps    + Compare
ultra 1920x1080
5.5 5.5 ~ 6 fps    + Compare
» The benchmarks indicate that the game is not playable in the tested settings.
low 1024x768
38.2  fps    + Compare
med. 1366x768
16.4  fps    + Compare
high 1366x768
8.9  fps    + Compare
ultra 1920x1080
5.9  fps    + Compare
» With all tested laptops playable in detail settings low.
low 1024x768
40.7  fps    + Compare
» With all tested laptops playable in detail settings low.
Dota 2

Dota 2

2013
low 1024x768
32.8 97.3 ~ 65 fps    + Compare
med. 1366x768
21.1 53.9 ~ 38 fps    + Compare
ultra 1920x1080
10.3 19.4 ~ 15 fps    + Compare
» With most tested laptops playable in detail settings med..
low 1024x768
4 5 14.9 15 ~ 10 fps    + Compare
med. 1366x768
5 11.5 11.7 ~ 9 fps    + Compare
high 1366x768
6.2 6.3 ~ 6 fps    + Compare
ultra 1920x1080
2.9 2.9 ~ 3 fps    + Compare
» The benchmarks indicate that the game is not playable in the tested settings.
GRID 2

GRID 2

2013
low 1024x768
72.6  fps    + Compare
med. 1366x768
37.8  fps    + Compare
high 1366x768
20.2  fps    + Compare
» With all tested laptops playable in detail settings med..
low 1024x768
16.6 26.4 ~ 22 fps    + Compare
med. 1366x768
11.4 17.6 ~ 15 fps    + Compare
high 1366x768
6.3 10.1 ~ 8 fps    + Compare
ultra 1920x1080
3.3 5.1 ~ 4 fps    + Compare
» The benchmarks indicate that the game is not playable in the tested settings.
low 1280x720
15.9 17 20.2 20.6 21 23.1 26.8 27.7 32.5 32.6 33 36.5 39.3 ~ 27 fps    + Compare
med. 1366x768
10 10.4 10.7 11 11.6 12.2 12.6 12.7 13.6 17 17.4 18.2 18.6 18.9 ~ 14 fps    + Compare
high 1366x768
9 9.1 9.5 9.7 10.2 10.2 11.4 14 14.4 15.3 15.4 16.4 ~ 12 fps    + Compare
ultra 1920x1080
3 3.4 3.6 5 6.5 ~ 4 fps    + Compare
» The benchmarks indicate that the game is not playable in the tested settings.
low 1024x768
70 88.9 95 106.1 110 111 129 178 ~ 111 fps    + Compare
med. 1366x768
20.8 25 25.1 28 28.2 31 38 40.9 ~ 30 fps    + Compare
high 1366x768
11.4 14 15 15.4 15.5 19 21 22 ~ 17 fps    + Compare
ultra 1920x1080
7.6  fps    + Compare
» With all tested laptops playable in detail settings low.
SimCity

SimCity

2013
low 1024x768
21 28.9 37 ~ 29 fps    + Compare
med. 1366x768
11 15 15.2 ~ 14 fps    + Compare
high 1366x768
8 11 11.1 ~ 10 fps    + Compare
ultra 1920x1080
5.4  fps    + Compare
» The benchmarks indicate that the game is not playable in the tested settings.
low 1024x768
14 27.4 29 30 31.1 31.2 33.2 33.2 33.8 34.8 34.9 35.2 35.8 35.8 37.1 40.1 48.8 52.4 ~ 34 fps    + Compare
med. 1366x768
7 13.2 13.7 15 15.8 16 16.2 16.9 17 17.9 17.9 18.3 18.3 20.2 21.1 22.2 24.4 ~ 17 fps    + Compare
high 1366x768
7.7 9 9.5 9.6 10 10.4 10.8 10.9 11.3 13.1 15.3 ~ 11 fps    + Compare
ultra 1920x1080
6.4 7.1 7.7 ~ 7 fps    + Compare
» The benchmarks indicate that the game is not playable in the tested settings.
Crysis 3

Crysis 3

2013
low 1024x768
19 22 24.8 ~ 22 fps    + Compare
med. 1366x768
9 13.4 ~ 11 fps    + Compare
high 1366x768
7 8.3 ~ 8 fps    + Compare
ultra 1920x1080
3.2  fps    + Compare
» The benchmarks indicate that the game is not playable in the tested settings.
low 1024x768
37.3 42.7 69.4 79.7 80.4 86 ~ 66 fps    + Compare
med. 1366x768
17.4 19.4 30.2 32.8 34.3 34.5 ~ 28 fps    + Compare
high 1366x768
14.2 14.9 23.7 26 27.2 27.4 ~ 22 fps    + Compare
ultra 1920x1080
13.6 14.6 15.1 15.2 ~ 15 fps    + Compare
» With all tested laptops playable in detail settings low.
Far Cry 3

Far Cry 3

2012
low 1024x768
31.7 32.1 ~ 32 fps    + Compare
med. 1366x768
20.1 22.6 ~ 21 fps    + Compare
high 1366x768
7.8  fps    + Compare
» The benchmarks indicate that the game is not playable in the tested settings.
med. 1366x768
17.2 17.5 ~ 17 fps    + Compare
high 1366x768
15.5  fps    + Compare
ultra 1920x1080
3.7  fps    + Compare
» The benchmarks indicate that the game is not playable in the tested settings.
low 1024x768
10.8 11 17 18 21.5 21.6 23.9 ~ 18 fps    + Compare
med. 1366x768
8 8.6 14 14 17 17.8 18.6 ~ 14 fps    + Compare
high 1366x768
3 5 5.6 6 6.1 6.2 ~ 5 fps    + Compare
ultra 1920x1080
2.8 3 3 3.1 ~ 3 fps    + Compare
» The benchmarks indicate that the game is not playable in the tested settings.
low 1024x768
29.6 31 31.8 36.1 ~ 32 fps    + Compare
med. 1366x768
19 19.7 22.1 25.2 ~ 22 fps    + Compare
high 1366x768
5.5 6 7.2 8.7 ~ 7 fps    + Compare
ultra 1920x1080
6.6  fps    + Compare
» The benchmarks indicate that the game is not playable in the tested settings.
low 1024x768
17 27.7 32.5 ~ 26 fps    + Compare
med. 1366x768
10 11 19.9 ~ 14 fps    + Compare
high 1366x768
5 12.6 ~ 9 fps    + Compare
ultra 1920x1080
7.7  fps    + Compare
» The benchmarks indicate that the game is not playable in the tested settings.
low 1024x768
9 14 19 30.6 ~ 18 fps    + Compare
med. 1366x768
7.4 12 13 19.8 ~ 13 fps    + Compare
high 1366x768
9.6 16 ~ 13 fps    + Compare
ultra 1920x1080
5.1  fps    + Compare
» The benchmarks indicate that the game is not playable in the tested settings.
low 1024x768
9.5 20.5 32.1 35.2 35.8 40.1 ~ 29 fps    + Compare
med. 1366x768
19.5 20.5 26.5 32.7 36 ~ 27 fps    + Compare
high 1366x768
18 20.2 29.2 32 ~ 25 fps    + Compare
ultra 1920x1080
16.4 17.7 ~ 17 fps    + Compare
» The benchmarks indicate that the game is not playable in the tested settings.
low 1024x768
38.9 41 55 64.3 ~ 50 fps    + Compare
med. 1366x768
19 21.7 22.2 26.2 ~ 22 fps    + Compare
high 1366x768
15.3 18.9 21.6 ~ 19 fps    + Compare
ultra 1920x1080
8.4  fps    + Compare
» With all tested laptops playable in detail settings low.
Fifa 13

Fifa 13

2012
low 1024x768
32 44 59.1 67.2 73 73.8 75.5 77.2 78 82 83.2 83.6 84 90 96 98.1 100.4 101 101.2 105.8 106 108.1 119 130 130 135.7 148.6 165 172 ~ 97 fps    + Compare
med. 1366x768
26 29 34 37.5 45.5 48 48.5 50.1 51.2 53.3 54 55 55.3 57 58 58.3 59.6 63.9 64 65 67.2 69 71 72 72 89.6 97 105 110.3 ~ 61 fps    + Compare
high 1366x768
18.2 20 22 23.9 26.5 28.4 29 30 30 31 31.6 32 33 33.9 34 34.8 35.4 38 38 38.4 39.1 42 42.6 48 48.2 51.9 52 55 56 57 ~ 37 fps    + Compare
ultra 1920x1080
9.3 15 15 18 20.2 22 25 26 27 27.3 29 29.1 ~ 22 fps    + Compare
» With most tested laptops playable in detail settings high.
F1 2012

F1 2012

2012
low 1024x768
27 28 28 31 31 32 32 32 32 33 33 34 36 40 55 ~ 34 fps    + Compare
med. 1366x768
18 23 23 24 25 26 27 27 28 29 29 33 34 ~ 27 fps    + Compare
high 1366x768
14 15 17 18 18 21 21 22 22 23 24 25 29 ~ 21 fps    + Compare
ultra 1920x1080
12 12 12 ~ 12 fps    + Compare
» The benchmarks indicate that the game is not playable in the tested settings.
low 1024x768
27.2 32.7 41 ~ 34 fps    + Compare
med. 1366x768
21.7 23.2 26.2 ~ 24 fps    + Compare
high 1366x768
15.7 15.8 19.3 ~ 17 fps    + Compare
ultra 1920x1080
10.3  fps    + Compare
» The benchmarks indicate that the game is not playable in the tested settings.
Torchlight 2

Torchlight 2

2012
low 1024x768
58.7 64.7 ~ 62 fps    + Compare
med. 1366x768
34 36.7 ~ 35 fps    + Compare
ultra 1920x1080
18.8 22.7 ~ 21 fps    + Compare
» With all tested laptops playable in detail settings low.
low 1024x768
17.9 21.6 25 32 34 35 35 44 44 45 45.3 49.4 ~ 36 fps    + Compare
high 1366x768
5.8 7.3 11 12 13 14 14.8 15 15.1 15.8 ~ 12 fps    + Compare
ultra 1920x1080
5 5 5.3 11 12 ~ 8 fps    + Compare
» With most tested laptops playable in detail settings low.
low 1024x768
55.3 62 77.7 78.6 105.5 144.7 ~ 87 fps    + Compare
med. 1366x768
35.5 37.3 43.9 49.7 63.2 64 ~ 49 fps    + Compare
high 1366x768
20.3 21.3 25.2 28.2 33.5 39 ~ 28 fps    + Compare
ultra 1920x1080
13.1 20.9 26 ~ 20 fps    + Compare
» With all tested laptops playable in detail settings med..
med. 1366x768
21 27.2 ~ 24 fps    + Compare
ultra 1920x1080
12 15.3 ~ 14 fps    + Compare
» The benchmarks indicate that the game is not playable in the tested settings.
low 1024x768
12.8 21 21.4 24.8 24.8 31.6 ~ 23 fps    + Compare
med. 1366x768
9.2 14 14.9 15 17.2 22.3 ~ 15 fps    + Compare
high 1366x768
5 7 7.5 7.6 7.9 9.2 ~ 7 fps    + Compare
ultra 1920x1080
5  fps    + Compare
» The benchmarks indicate that the game is not playable in the tested settings.
low 1024x768
23.5  fps    + Compare
med. 1366x768
17.8  fps    + Compare
high 1366x768
11.6  fps    + Compare
» The benchmarks indicate that the game is not playable in the tested settings.
low 1024x768
14.1 15.5 ~ 15 fps    + Compare
med. 1366x768
8.3  fps    + Compare
» The benchmarks indicate that the game is not playable in the tested settings.
low 1024x768
22.3  fps    + Compare
» The benchmarks indicate that the game is not playable in the tested settings.
low 1024x768
33 39.6 51 54.3 54.5 60 ~ 49 fps    + Compare
med. 1366x768
20.3 21 24.5 31.1 31.6 33 ~ 27 fps    + Compare
high 1366x768
12.8 16 17.2 19 21 ~ 17 fps    + Compare
ultra 1920x1080
5.7 6 6 7 7 ~ 6 fps    + Compare
» With most tested laptops playable in detail settings low.
low 1024x768
14.2 23 28.4 34 35 36 37 37.5 38 39 39.6 39.8 42.4 42.5 43 43 43.2 44 44 45 45.9 46 46.7 47 48 49 50 50 50 50.3 50.6 51 52.3 53 53.1 53.1 53.9 56 58 60 62 65.5 74 80 ~ 47 fps    + Compare
med. 1366x768
14 17.2 19 21 21 21.8 22 22 22.5 22.5 22.8 23 23.3 24.4 24.6 24.6 25 25 25 25 26 26 26 26.4 26.4 26.5 28 29 29 29 29 29.4 29.6 30 30.4 30.6 31 32 32 32.2 36 36 ~ 26 fps    + Compare
high 1366x768
10 11 13.9 14 14 14.6 16 17 17 18 18 18.4 18.6 19 20 20 20 20 20.3 21 21 21 21.4 21.6 22 23.1 23.9 24 24 24 24.5 24.8 25 25.4 26 26 26 26.7 27.3 28 29 ~ 21 fps    + Compare
ultra 1920x1080
10.8 11 11.2 11.6 13 13 13.2 14 14.4 15 16 16 16 17 ~ 14 fps    + Compare
» With most tested laptops playable in detail settings low.
low 1024x768
16 21 25 25.3 33 ~ 24 fps    + Compare
med. 1366x768
10 13 16.8 17 ~ 14 fps    + Compare
high 1366x768
8 10 12.8 13 ~ 11 fps    + Compare
ultra 1920x1080
5.9 6 ~ 6 fps    + Compare
» The benchmarks indicate that the game is not playable in the tested settings.
low 1280x720
15.9 18 20 21.1 21.2 25.4 27.4 27.7 42.4 42.5 48.3 ~ 28 fps    + Compare + 📈 Graph
high 1366x768
11 11 11.7 15.3 16.2 19 19.9 20.1 30.7 30.9 33.9 ~ 20 fps    + Compare + 📈 Graph
ultra 1920x1080
8.3 12.3 18.1 18.2 18.8 ~ 15 fps    + Compare + 📈 Graph
» The benchmarks indicate that the game is not playable in the tested settings.
Alan Wake

Alan Wake

2012
low 1024x768
10 11.5 13.6 14.4 16.2 ~ 13 fps    + Compare + 📈 Graph
med. 1366x768
8 10.3 10.6 11.8 ~ 10 fps    + Compare + 📈 Graph
ultra 1920x1080
4.8 4.8 5.3 ~ 5 fps    + Compare + 📈 Graph
» The benchmarks indicate that the game is not playable in the tested settings.
Anno 2070

Anno 2070

2011
low 1024x768
18.4 19 19.5 20 26.5 27 28.9 29 30.9 31.2 31.9 32.4 32.6 33 33 33 33.1 33.5 33.7 33.7 34 34.2 34.5 35 35.7 36 36.7 37.2 37.3 37.4 37.4 37.4 38.1 38.5 38.5 38.6 38.6 38.8 38.8 39 39 39 39 41.5 42 42 42.2 42.4 42.8 43 43.1 43.2 43.4 44 44.1 44.7 45 45.5 46 46.7 47 47.7 48 50.2 51.7 51.9 52.4 53.5 54.8 55 55.4 58.2 60 ~ 39 fps    + Compare + 📈 Graph
med. 1366x768
8.5 8.6 9 10.5 13.2 14.4 15 15.7 15.9 15.9 16.4 16.4 16.6 16.7 17 17.3 17.3 17.4 17.5 17.7 17.9 18 18.1 18.1 18.4 18.4 18.5 18.8 18.8 18.8 19 19.1 19.3 19.3 19.4 19.5 19.7 19.7 19.7 19.8 19.9 20 20 20 20 20.1 20.2 20.3 21 21 21.1 21.2 21.7 21.9 22 22 22 22.7 22.7 22.8 23.1 23.8 24.2 24.4 24.9 25.5 25.9 26 26 26.2 26.3 27.9 30 ~ 20 fps    + Compare + 📈 Graph
high 1366x768
6 6.6 8 9.9 10 10 10.1 10.1 10.1 10.3 10.8 11 11.3 11.4 11.7 11.8 11.8 12 12 12.1 12.2 12.4 12.4 12.4 12.5 12.6 12.6 12.7 12.8 12.9 12.9 12.9 13 13 13 13 13 13 13.2 13.2 13.5 13.6 13.9 14 14 14 14.3 14.4 14.5 14.8 15.5 15.8 16 16.3 16.3 17.8 19 30 ~ 13 fps    + Compare + 📈 Graph
ultra 1920x1080
3.2 5.4 5.5 5.8 6.2 6.4 6.4 6.6 7 7.2 7.7 7.8 7.9 8 8.1 8.7 15 20 ~ 8 fps    + Compare + 📈 Graph
» With most tested laptops playable in detail settings low.
low 1280x720
13.6 17 23 24.2 24.5 25 25.4 25.5 26.1 26.8 26.9 27 27.2 27.6 29 29.1 30 30 34.3 35.2 35.9 36 37.9 39.5 ~ 28 fps    + Compare + 📈 Graph
med. 1366x768
6.2 11.8 12 12 12 12.5 13 13 13.1 13.3 13.3 13.4 14 15.2 15.4 16 16.9 17.4 17.7 17.7 17.8 19.5 26 ~ 15 fps    + Compare + 📈 Graph
high 1366x768
6.9 7 7 7.5 7.7 7.7 7.8 7.9 9.7 10 10 10.2 10.3 10.3 11.2 14 ~ 9 fps    + Compare + 📈 Graph
ultra 1920x1080
5.4 5.5 6.1 ~ 6 fps    + Compare + 📈 Graph
» The benchmarks indicate that the game is not playable in the tested settings.
low 1024x768
23 69.7 78.8 84.5 ~ 64 fps    + Compare + 📈 Graph
med. 1366x768
14 37.2 42.8 47 ~ 35 fps    + Compare + 📈 Graph
high 1366x768
12 17.5 18 19.9 ~ 17 fps    + Compare + 📈 Graph
ultra 1920x1080
12.3 12.7 14.2 ~ 13 fps    + Compare + 📈 Graph
» With most tested laptops playable in detail settings low.
low 1024x768
4.5 9.8 10.7 11.7 11.8 12.1 12.2 14.1 14.4 14.8 14.9 15.1 15.4 15.7 22.9 23.1 24.5 24.8 26.9 ~ 16 fps    + Compare + 📈 Graph
med. 1366x768
6.4 9 9.1 9.3 9.7 11 12.2 12.2 12.3 17.3 17.5 18.2 18.5 20.4 ~ 13 fps    + Compare + 📈 Graph
high 1366x768
7.5 8 9.7 9.8 10.2 13.8 13.9 14.1 15.3 ~ 11 fps    + Compare + 📈 Graph
ultra 1920x1080
3.2 5.1 5.4 5.8 ~ 5 fps    + Compare + 📈 Graph
» The benchmarks indicate that the game is not playable in the tested settings.
low 1024x768
61  fps    + Compare
med. 1366x768
45  fps    + Compare
high 1366x768
13  fps    + Compare
ultra 1920x1080
8  fps    + Compare
» With all tested laptops playable in detail settings med..
Fifa 12

Fifa 12

2011
low 800x600
37 58.9 62 79 105.9 108 115.2 127 136.2 143 189.4 192.1 ~ 113 fps    + Compare + 📈 Graph
med. 1024x768
21 38.2 39.8 49 57.9 60.3 62.1 63.6 65.8 68 76 85.4 99.2 106.4 ~ 64 fps    + Compare + 📈 Graph
high 1360x768
18.4 19.1 22 23.7 26 29.9 30.8 31 33.9 37.9 38.3 44.1 47.8 50.8 ~ 32 fps    + Compare + 📈 Graph
ultra 1920x1080
18.3 24.5 25 26.5 28.3 ~ 25 fps    + Compare + 📈 Graph
» With most tested laptops playable in detail settings med..
F1 2011

F1 2011

2011
low 800x600
32 33 48 61 70 70 78 ~ 56 fps    + Compare
med. 1024x768
22 24 26 34 38 40 42 ~ 32 fps    + Compare
high 1366x768
12 15 16 16 17 18 ~ 16 fps    + Compare
ultra 1920x1080
12 12 12 ~ 12 fps    + Compare
» With most tested laptops playable in detail settings low.
low 1024x768
28 32.5 37 37.5 38 38.5 41.8 45.8 52.7 54.3 60.2 65.5 66.8 74.5 ~ 48 fps    + Compare + 📈 Graph
high 1366x768
16.7 16.7 17.6 19 21.3 21.3 22.9 23 28 30.2 30.8 31.1 31.8 32.9 33 ~ 25 fps    + Compare + 📈 Graph
ultra 1920x1080
11.1 12.6 13 13.3 ~ 13 fps    + Compare + 📈 Graph
» With most tested laptops playable in detail settings low.
Dirt 3

Dirt 3

2011
low 800x600
51.6 60.1 68.6 77.5 ~ 64 fps    + Compare
med. 1024x768
27.4 36.7 38.2 45 ~ 37 fps    + Compare
high 1360x768
17.6 22.3 22.4 25.1 ~ 22 fps    + Compare
ultra 1920x1080
12.8 12.8 12.8 ~ 13 fps    + Compare
» With most tested laptops playable in detail settings med..
low 1024x768
21  fps    + Compare
med. 1366x768
13  fps    + Compare
» The benchmarks indicate that the game is not playable in the tested settings.
Crysis 2

Crysis 2

2011
low 800x600
29.1 40.6 43.7 49.5 ~ 41 fps    + Compare + 📈 Graph
med. 1024x768
19.5 27.2 27.7 31.1 ~ 26 fps    + Compare + 📈 Graph
high 1366x768
11.2 19.2 19.2 21.3 ~ 18 fps    + Compare + 📈 Graph
ultra 1920x1080
4.7 7 7.2 7.7 ~ 7 fps    + Compare + 📈 Graph
» With most tested laptops playable in detail settings low.
Total War: Shogun 2

Total War: Shogun 2

2011
low 1024x768
47.1 74.2 113 ~ 78 fps    + Compare
» With all tested laptops playable in detail settings low.
Additional Benchmarks
CPU 1280x1024
7.5
low 800x600
44.8 51.5 53 54.5 ~ 51 fps    + Compare + 📈 Graph
med. 1024x768
30.6 34.1 36 36.5 ~ 34 fps    + Compare + 📈 Graph
high 1360x768
19.5 20.5 22 22.5 ~ 21 fps    + Compare + 📈 Graph
ultra 1920x1080
15.7 16.2 16.9 ~ 16 fps    + Compare + 📈 Graph
» With all tested laptops playable in detail settings low.
Mafia 2

Mafia 2

2010
low 800x600
21.3 26.6 29.1 35.6 38.8 40.5 ~ 32 fps    + Compare
med. 1024x768
19.8 22.1 22.4 27.1 30.8 32.1 ~ 26 fps    + Compare
high 1360x768
17.5 18.7 18.7 20.6 23.4 26.2 ~ 21 fps    + Compare
ultra 1920x1080
12.8 14.6 16.3 ~ 15 fps    + Compare
» The benchmarks indicate that the game is not playable in the tested settings.
low 1024x768
62 63.8 64.1 65.6 78 79 82 85.7 89 93.6 96.2 105 108 117 125 126 126 142.4 143 143.3 145 151 152.4 153.1 160.9 186 ~ 113 fps    + Compare + 📈 Graph
med. 1360x768
10.6 12.6 17.5 18 18 20 21 21 22.6 23.2 24.7 26 26 27 28 28 28.2 29 30 30.8 31.2 32 32.4 33.3 33.4 34.3 ~ 25 fps    + Compare + 📈 Graph
high 1360x768
6.9 8.9 8.9 10 11 11 11 12 12.9 13.1 13.1 16 17 17 18 18 18.9 19.2 20 20.1 20.3 20.4 20.9 21.2 22 22.4 ~ 16 fps    + Compare + 📈 Graph
ultra 1920x1080
5 9 10.8 10.9 10.9 12 12 ~ 10 fps    + Compare + 📈 Graph
» With all tested laptops playable in detail settings low.
Just Cause 2

Just Cause 2

2010
ultra 1920x1080
11.2  fps    + Compare
» The benchmarks indicate that the game is not playable in the tested settings.
low 800x600
19 19 22.4 25.3 30 38.1 41.2 44.3 51 ~ 32 fps    + Compare + 📈 Graph
med. 1360x768
9 12.7 14 15 20.1 21.5 23.7 25 ~ 18 fps    + Compare + 📈 Graph
high 1600x900
5.3 12.1 12.5 13.6 ~ 11 fps    + Compare + 📈 Graph
ultra 1920x1080
4.1 4.3 4.6 4.7 ~ 4 fps    + Compare + 📈 Graph
» The benchmarks indicate that the game is not playable in the tested settings.
low 1024x768
78.8  fps    + Compare
med. 1366x768
34.2  fps    + Compare
high 1366x768
19.4  fps    + Compare
ultra 1920x1080
8.2  fps    + Compare
» With all tested laptops playable in detail settings low.
Risen

Risen

2009
low 800x600
20.5 27.3 28.6 29.3 29.6 38.8 39.5 42.4 58.6 ~ 35 fps    + Compare
med. 1024x768
9.4 14.9 16.6 16.8 18.1 19.6 22.5 26.1 26.5 ~ 19 fps    + Compare
high 1366x768
6.1 11 13.1 13.3 13.7 14 14.5 ~ 12 fps    + Compare
ultra 1920x1080
8.6 10 ~ 9 fps    + Compare
» The benchmarks indicate that the game is not playable in the tested settings.
Resident Evil 5

Resident Evil 5

2009
low 800x600
93.6  fps    + Compare
high 1360x768
39.1  fps    + Compare
ultra 1920x1080
16.4  fps    + Compare
» With all tested laptops playable in detail settings high.
Colin McRae: DIRT 2

Colin McRae: DIRT 2

2009
low 800x600
20.3 44.7 ~ 33 fps    + Compare
med. 1024x768
18.6 34.1 ~ 26 fps    + Compare
high 1360x768
12.8  fps    + Compare
» The benchmarks indicate that the game is not playable in the tested settings.
Sims 3

Sims 3

2009
med. 1024x768
33  fps    + Compare
high 1280x1024
21  fps    + Compare
» The benchmarks indicate that the game is not playable in the tested settings.
Trackmania Nations Forever

Trackmania Nations Forever

2008
low 640x480
127 131 135 163 177 ~ 147 fps    + Compare
high 1024x768
26.4 30.5 37.2 45.7 47 ~ 37 fps    + Compare
ultra 1920x1080
18 22.1 ~ 20 fps    + Compare
» With most tested laptops playable in detail settings high.
Call of Duty 4 - Modern Warfare

Call of Duty 4 - Modern Warfare

2007
low 800x600
100.6  fps    + Compare
med. 1024x768
43.3  fps    + Compare
» With all tested laptops playable in detail settings med..
World in Conflict - Benchmark

World in Conflict - Benchmark

2007
low 800x600
49 84 ~ 67 fps    + Compare
med. 1024x768
20 35 ~ 28 fps    + Compare
high 1024x768
12 14 ~ 13 fps    + Compare
» With all tested laptops playable in detail settings low.
Call of Juarez Benchmark

Call of Juarez Benchmark

2006
high 1024x768
15.4  fps    + Compare
» The benchmarks indicate that the game is not playable in the tested settings.
World of Warcraft

World of Warcraft

2005
low 800x600
79 81 98 99 112 117 123 ~ 101 fps    + Compare
med. 1024x768
58 62 62 63 65 65 76 83 ~ 67 fps    + Compare
high 1280x1024
12 15 16 17 20 20 21 ~ 17 fps    + Compare
ultra 1920x1080
8  fps    + Compare
» With all tested laptops playable in detail settings med..
lowmed.highultraQHD4K
Team Fortress 26813.3
Farming Simulator 174325.1
Mirror's Edge Catalyst
Overwatch25.6
Rise of the Tomb Raider10
FIFA 16602616
World of Warships56.73617.112.4
Metal Gear Solid V4125.29.6
Mad Max14.6
Dota 2 Reborn9640.216.9
Dirt Rally72191312.5
GTA V26.8
Battlefield Hardline21.2
Evolve12.2
The Crew15
Dragon Age: Inquisition18.511.7
Far Cry 413.2
Assassin's Creed Unity3
Call of Duty: Advanced Warfare0
Civilization: Beyond Earth18.28.1
F1 201447281712
The Evil Within8.8
Ryse: Son of Rome11.4
Alien: Isolation28.618.2
Middle-earth: Shadow of Mordor13
Fifa 1532.424.615.7
Risen 3: Titan Lords36.417.67.2
GRID: Autosport832514
Watch Dogs12.7
Wolfenstein: The New Order3121.99.1
The Elder Scrolls Online4023.113.97.2
Titanfall20.410.96.74.9
Thief1910.98.84.3
Assassin´s Creed IV: Black Flag23.617.47.43.6
X-Plane 10.25421675
Need for Speed: Rivals12.6
Call of Duty: Ghosts40.624.37.24
Battlefield 432.219.712.24.7
Batman: Arkham Origins5230126
F1 201355342712
Fifa 14159896335
Total War: Rome II2921
Saints Row IV3021106
The Bureau: XCOM Declassified38.216.48.95.9
Splinter Cell: Blacklist40.7
Dota 2653815
Company of Heroes 210963
GRID 272.637.820.2
Metro: Last Light221584
BioShock Infinite2714124
StarCraft II: Heart of the Swarm11130177.6
SimCity2914105.4
Tomb Raider3417117
Crysis 3221183.2
Dead Space 366282215
Far Cry 332217.8
Assassin´s Creed III1715.53.7
Hitman: Absolution181453
Call of Duty: Black Ops 2322276.6
Need for Speed: Most Wanted261497.7
Medal of Honor: Warfighter1813135.1
Dishonored29272517
World of Tanks v85022198.4
Fifa 1397613722
F1 201234272112
Borderlands 234241710.3
Torchlight 2623521
Guild Wars 236128
Counter-Strike: GO87492820
Darksiders II2414
Sleeping Dogs231575
The Secret World23.517.811.6
Ghost Recon: Future Soldier158.3
Max Payne 322.3
Dirt Showdown4927176
Diablo III47262114
Risen 2: Dark Waters2414116
Mass Effect 3282015
Alan Wake13105
Anno 20703920138
The Elder Scrolls V: Skyrim281596
CoD: Modern Warfare 364351713
Battlefield 31613115
Batman: Arkham City6145138
Fifa 12113643225
F1 201156321612
Deus Ex Human Revolution482513
Dirt 364372213
The Witcher 2: Assassins of Kings2113
Crysis 24126187
Total War: Shogun 278
Call of Duty: Black Ops51342116
Mafia 232262115
StarCraft 2113251610
Just Cause 211.2
Metro 20333218114
Dawn of War II - Chaos Rising78.834.1819.48.15
Risen3519129
Resident Evil 593.639.116.4
Colin McRae: DIRT 2332612.8
Sims 33321
Trackmania Nations Forever1473720
Call of Duty 4 - Modern Warfare100.643.3
World in Conflict - Benchmark672813
Call of Juarez Benchmark15.4
World of Warcraft10167178
< 30 fps
< 60 fps
< 120 fps
≥ 120 fps
39
34
23
2
57
17
4
68
4
1
66
1


For more games that might be playable and a list of all games and graphics cards visit our Gaming List

v1.26
log 11. 19:46:25

#0 no ids found in url (should be separated by "_") +0s ... 0s

#1 not redirecting to Ajax server +0s ... 0s

#2 did not recreate cache, as it is less than 5 days old! Created at Wed, 10 Apr 2024 05:36:42 +0200 +0.001s ... 0.001s

#3 no comparison url found in template nbc.compare_page_1 needed +0.065s ... 0.066s

#4 no comparison url found in template nbc.compare_page_1 needed +0s ... 0.066s

#5 no comparison url found in template nbc.compare_page_1 needed +0s ... 0.067s

#6 no comparison url found in template nbc.compare_page_1 needed +0s ... 0.067s

#7 no comparison url found in template nbc.compare_page_1 needed +0s ... 0.067s

#8 no comparison url found in template nbc.compare_page_1 needed +0s ... 0.067s

#9 no comparison url found in template nbc.compare_page_1 needed +0s ... 0.067s

#10 no comparison url found in template nbc.compare_page_1 needed +0s ... 0.067s

#11 no comparison url found in template nbc.compare_page_1 needed +0s ... 0.067s

#12 no comparison url found in template nbc.compare_page_1 needed +0s ... 0.067s

#13 no comparison url found in template nbc.compare_page_1 needed +0s ... 0.067s

#14 no comparison url found in template nbc.compare_page_1 needed +0s ... 0.068s

#15 no comparison url found in template nbc.compare_page_1 needed +0s ... 0.068s

#16 no comparison url found in template nbc.compare_page_1 needed +0s ... 0.068s

#17 no comparison url found in template nbc.compare_page_1 needed +0s ... 0.068s

#18 no comparison url found in template nbc.compare_page_1 needed +0s ... 0.068s

#19 no comparison url found in template nbc.compare_page_1 needed +0s ... 0.068s

#20 no comparison url found in template nbc.compare_page_1 needed +0s ... 0.069s

#21 no comparison url found in template nbc.compare_page_1 needed +0s ... 0.069s

#22 no comparison url found in template nbc.compare_page_1 needed +0s ... 0.069s

#23 no comparison url found in template nbc.compare_page_1 needed +0s ... 0.07s

#24 no comparison url found in template nbc.compare_page_1 needed +0s ... 0.07s

#25 composed specs +0s ... 0.07s

#26 did output specs +0s ... 0.07s

#27 start showIntegratedCPUs +0s ... 0.07s

#28 getting avg benchmarks for device 2822 +0.04s ... 0.11s

#29 got single benchmarks 2822 +0.514s ... 0.624s

#30 got avg benchmarks for devices +0s ... 0.624s

#31 No cached benchmark found, getting uncached values +0.547s ... 1.17s

#32 min, max, avg, median took s +0.145s ... 1.315s

#33 before gaming benchmark output +0s ... 1.315s

#34 Got 1645 rows for game benchmarks. +0.162s ... 1.477s

#35 composed SQL query for gamebenchmarks +0s ... 1.477s

#36 got data and put it in $dataArray +0.077s ... 1.555s

#37 benchmarks composed for output. +2.845s ... 4.4s

#38 no comparison url found in template nbc.compare_page_1 needed +0.008s ... 4.407s

#39 return log +0s ... 4.407s

Notebook reviews with Intel HD Graphics 4000 graphics card


联想 IdeaPad Yoga 11S 超级本测评

完美的平衡? 联想的IdeaPad Yoga11S是结合瑜伽和瑜伽13,起重两个元素平衡电池的寿命,性能和多功能性。这是值得的努力吗?...
Intel Core i5-3339Y | Intel HD Graphics 4000 | 11.60" | 1.4 kg
 

联想ThinkPad螺旋3G换股测评

无限的流动性. 数位板的一个会议上,工作区的一个笔记本电脑 - 联想的ThinkPad螺旋应该是这两种设备的优点结合起来。聪明的ultrabook的混合忽略传统智慧有关敞篷车,留下了深刻的印象,由于其流动性和办公的优势。...
Intel Core i5-3317U | Intel HD Graphics 4000 | 11.60" | 1.7 kg
 

微星S30-i3U465的超薄笔记本电脑测评

超薄,时尚和别致, 微星希望你做出自己的小型笔记本电脑您的日常伴侣。包完全以白色为主,它甚至应该适合追逐时尚的“大都会名媛”。我们的测试暴露出的设备是否运行良好,对他们来说是合适的。我们可以揭示这一点:S30是非常迅速的。...
Intel Core i3-3217U | Intel HD Graphics 4000 | 13.30" | 1.4 kg
 

惠普ProBook4340s H4R47EA笔记本测评

紧凑型的贸易伙伴 一切一点点。 ,惠普已建成的ProBook灯,根据这个口号:固体铝表面,几个连接功能的输入设备,中产阶级的性能,全面的安全功能和平均显示面板。这是足以说服在商业世界?...
Intel Core i3-3120M | Intel HD Graphics 4000 | 13.30" | 2 kg
 

东芝Satellite U920t-100超级本测评

超混合. 东芝提出了不少有趣的超极本到世界各地。我们最新的测试模型是一种融合了平板电脑和Ultrabook。它采用了12.5英寸的触摸屏和省电的英特尔酷睿i5-3317U处理器,集成Intel HD Graphics4000 IGP。混合模型看起来不错,但在硬件方面提供什么?...
Intel Core i5-3317U | Intel HD Graphics 4000 | 12.50" | 1.5 kg

Sony Vaio SV-T1511M1E/S: Intel Core i5-3337U, 15.60", 2.2 kg
  Review » 索尼Vaio SV-T1511M1E/ S超级本测评

Sony Vaio SV-E14A3M2ES: Intel Core i3-3120M, 14.00", 2.3 kg
  Review » 索尼的Vaio的SV-E14A3M2ES笔记本测评

Toshiba Satellite P845T-S4310: Intel Core i5-3317U, 14.00", 2.2 kg
  Review » 东芝Satellite P845T-S4310笔记本测评

  Review » 东芝Satellite P845T-S4310笔记本测评

Sony SV-T14124CXS: Intel Core i3-3227U, 14.00", 2 kg
  Review » 索尼的Vaio的SV-T14124CXS笔记本测评

Samsung Ativ Smart PC Pro XE700T1C A02: Intel Core i5-3317U, 11.60", 1.6 kg
  Review » 三星ATIV智能PC Pro的XE700T1C A02换股测评

Toshiba Satellite P845T-S4310: Intel Core i5-3317U, 14.00", 2.2 kg
  Review » 东芝Satellite P845T-S4310笔记本测评

Sony Vaio Tap 20 SVJ2021V1E: Intel Core i5-3317U, 20.00", 5.1 kg
  Review » 索尼的Vaio点击20 SVJ2021V1E的平板测评

Samsung 400B5C-H02DE: Intel Core i5-3210M, 15.60", 2.5 kg
  Review » 评论三星系列4400B5C的H02DE的笔记本

Acer Aspire M5-481PT-6644: Intel Core i5-3337U, 14.00", 2 kg
  Review » 回顾宏碁Aspire M5-481PT-6644笔记本

Microsoft Surface Pro: Intel Core i5-3317U, 10.60", 0.9 kg
  Review » 回顾微软Surface Pro的平板电脑

Asus VivoBook S300CA: Intel Core i3-3217U, 13.30", 1.8 kg
  Review » 回顾华硕VivoBook S300CA亚笔记本

Google Chromebook Pixel: Intel Core i5-3427U, 12.90", 1.5 kg
  Review » 回顾谷歌Chromebook的像素笔记本

Acer W700-53334G12as: Intel Core i5-3337U, 11.60", 1 kg
  Review » 回顾宏碁Iconia W700-53334G12as平板

Toshiba Satellite U940-101: Intel Core i5-3317U, 14.00", 1.7 kg
  Review » 东芝 Satellite U940-101 超级本测评

MSI CR41-i587: Intel Core i5-3210M, 14.00", 2.4 kg
  Review » 微星 CR41-i587 笔记本测评

Fujitsu Lifebook T902: Intel Core i5-3320M, 13.30", 2 kg
  Review » 富士通 LifeBook T902 Convertible 测评

Asus Zenbook Prime UX31A: Intel Core i5-3317U, 13.30", 1.4 kg
  Review » 华硕 Zenbook Prime UX31A 超级本测评

Acer Aspire S7-191-73514G25ass: Intel Core i7-3517U, 11.60", 1.1 kg
  Review » 宏基 Aspire S7-191 超级本测评

Fujitsu LifeBook UH572: Intel Core i5-3317U, 13.30", 1.6 kg
  Review » 富士通LifeBook UH572 超级本测评

Apple MacBook Air 11 inch 2012-06 MD223D/A: Intel Core i5-3317U, 11.60", 1.1 kg
  Review » 苹果 MacBook Air 11 Mid 2012 小型笔记本测评

Dell Latitude E5530: Intel Core i5-3360M, 15.60", 2.9 kg
  Review » 戴尔 Latitude E5530 笔记本测评

Lenovo ThinkPad X1 Carbon: Intel Core i7-3667U, 14.00", 1.3 kg
  Review » 联想 ThinkPad X1 Carbon 超级本测评

Fujitsu Lifebook E782: Intel Core i5-3360M, 15.60", 2.5 kg
  Review » 富士通 Lifebook E782 笔记本

Lenovo IdeaPad U510 MBM62GE: Intel Core i3-3217U, 15.60", 2.2 kg
  Review » 联想 IdeaPad U510 超级本测评

Fujitsu LifeBook AH552/SL: Intel Core i5-3210M, 15.60", 2.2 kg
  Review » 富士通 LifeBook AH552/SL 笔记本

Samsung 540U3C-A01DE: Intel Core i5-3317U, 13.30", 1.6 kg
  Review » 三星540U3C 超级本测评

Fujitsu LifeBook U772: Intel Core i5-3427U, 14.00", 1.4 kg
  Review » 富士通 LifeBook U772 超级本测评

Dell XPS 13: Intel Core i7-3517U, 13.30", 1.4 kg
  Review » 戴尔 XPS 13 Ultrabook (Late 2012) 测评

Sony Vaio SV-Z1311Z9EX: Intel Core i7-3612QM, 13.10", 1.2 kg
  Review » 索尼 Vaio SV-Z1311Z9EX 笔记本测评

Dell Latitude E6430: Intel Core i5-3320M, 14.00", 2.1 kg
  Review » 戴尔Latitude E6430 笔记本测评

Dell Latitude E5430: Intel Core i5-3360M, 14.00", 2.5 kg
  Review » 戴尔 Latitude E5430 笔记本

HP Envy Spectre XT 13-2000eg: Intel Core i5-3317U, 13.30", 1.4 kg
  Review » 惠普 Envy Spectre XT 13-2000eg 超级本测评

Dell Latitude E6430: Intel Core i5-3320M, 14.00", 2.1 kg
  Review » 戴尔 Latitude E6430 笔记本测评

  Review » 戴尔 Latitude E6430 笔记本测评

  Review » 戴尔 Latitude E6430 笔记本测评

HP Elitebook 2570p-B6Q10EA: Intel Core i7-3520M, 12.50", 1.6 kg
  Review » 惠普 Elitebook 2570p-B6Q10EA 笔记本测评

Acer TravelMate P453-M-53214G50Makk: Intel Core i5-3210M, 15.60", 2.6 kg
  Review » 宏基 TravelMate P453-M-53214G50Makk 笔记本测评

Acer Aspire V5-171-53314G50ass: Intel Core i5-3317U, 11.60", 1.3 kg
  Review » 宏基 Aspire V5-171-53314G50ass 小型笔记本电脑测评

HP Envy TouchSmart 4-1102sg: Intel Core i5-3317U, 14.00", 2.1 kg
  Review » 惠普Envy TouchSmart 4-1102sg 超级本测评

Acer Aspire S5-391-73514G25akk: Intel Core i7-3517U, 13.30", 1.2 kg
  Review » 宏基Aspire S5-391-73514G25akk 超级本测评

Asus VivoBook S200E-CT182H: Intel Core i3-3217U, 11.60", 1.4 kg
  Review » 华硕 VivoBook S200E 小型笔记本测评

HP ProBook 4340s-C5C86EA: Intel Core i3-3110M, 13.30", 2 kg
  External Review » HP ProBook 4340s-C5C86EA

HP Pavilion g7-2373sd: Intel Core i5-3210M, 17.30", 3 kg
  External Review » HP Pavilion g7-2373sd

Panasonic Toughpad FZ-G1-AAAFECE: Intel Core i5-3437U, 10.10", 1.1 kg
  External Review » Panasonic Toughpad FZ-G1-AAAFECE

Toshiba Satellite C75-A-156: Intel Core i3-3110M, 17.30", 2.7 kg
  External Review » Toshiba Satellite C75-A-156

Lenovo ThinkPad Helix: Intel Core i5-3427U, 11.60", 2.5 kg
  External Review » Lenovo ThinkPad Helix

Toshiba WT310: Intel Core i5-3339Y, 11.60", 0.8 kg
  External Review » Toshiba WT310

Fujitsu Lifebook E782: Intel Core i5-3360M, 15.60", 2.5 kg
  External Review » Fujitsu Lifebook E782

Fujitsu Lifebook E743-0M55A1DE: Intel Core i5-3230M, 14.00", 1.8 kg
  External Review » Fujitsu Lifebook E743-0M55A1DE

Toshiba Satellite C50-B-122: Intel Core i3-3217U, 15.60", 2.2 kg
  External Review » Toshiba Satellite C50-B-122

Google Chromebook Pixel: Intel Core i5-3427U, 12.90", 1.5 kg
  External Review » Google Chromebook Pixel

HP Envy 4-1120SW: Intel Core i5-3317U, 14.00", 1.8 kg
  External Review » HP Envy 4-1120SW

Asus ASUSPRO ESSENTIAL PU550CA: Intel Core i3-3217U, 15.60", 2.5 kg
  External Review » Asus ASUSPRO ESSENTIAL PU550CA

Asus UX32LA-R3065H: Intel Core i7-4500U, 13.30", 1.5 kg
  External Review » Asus UX32LA-R3065H

HP Elitebook Revolve 810 G1: Intel Core i5-3437U, 11.60", 1.4 kg
  External Review » HP Elitebook Revolve 810 G1

Please share our article, every link counts!

» Comparison of GPUs
Detailed list of all laptop GPUs sorted by class and performance.

» Benchmark List
Sort and restrict laptop GPUs based on performance in synthetic benchmarks.

» Notebook Gaming List
Playable games for each graphics card and their average FPS results.

Class 1

GeForce RTX 2080 Super Mobile

Class 2

M1 Max 32-Core GPU *
GeForce RTX 2070 Super Mobile
M1 Max 24-Core GPU *
Quadro RTX 5000 Max-Q
Radeon RX 5700M *
GeForce GTX 1080 Mobile
Quadro RTX 4000 (Laptop)
M1 Pro 16-Core GPU *
Radeon PRO W6600M *
GeForce RTX 2070 Super Max-Q
Quadro RTX 4000 Max-Q *
M1 Pro 14-Core GPU *
Quadro P5200
Quadro RTX 3000 Max-Q *
Quadro P4200
Quadro P5000 Max-Q *
GeForce GTX 980 (Laptop)
Quadro P4000
Quadro P4000 Max-Q
Quadro P3200
Radeon RX 580X (Laptop) *
Radeon RX 580 (Laptop)
Radeon Pro 5300M
Radeon RX 5300M
Quadro P3000 Max-Q *
Quadro T2000 Max-Q *
Radeon Pro WX 7100 *
Radeon RX 570X (Laptop) *
Radeon RX 570 (Laptop) *
Radeon RX 470 (Laptop) *
Quadro T1000 Max-Q *

Class 3

Vega M GH
Quadro M5000M
GeForce GTX 1050 Ti Mobile
Radeon 680M
Quadro P2000
Quadro P2000 Max-Q
Quadro M4000M
T500 Laptop GPU *
Radeon R9 M395X
GeForce GTX 1050 Ti Max-Q *
Radeon Pro Vega 16
WX Vega M GL
Radeon R9 M485X
Quadro M3000M
FirePro W7170M
Radeon R9 M395
GeForce GTX 1050 Max-Q *
Radeon 660M
Radeon Pro WX 4150 *
Radeon RX 560X (Laptop)
Radeon RX 560 (Laptop)
Radeon RX 460 (Laptop)
Quadro P1000
Radeon R9 M390
Xe MAX
Radeon Pro 560X
Radeon Pro 560
Radeon Pro 460
Radeon Pro WX 4130 *
GeForce GTX 960M
Quadro P620 *
Radeon RX 550X (Laptop)
Radeon Pro WX 3200 *
Radeon Pro 555X
Radeon Pro 555
Radeon Pro 455
Quadro P600
Quadro M2000M
Radeon RX 540X *
Radeon Pro WX 2100 *
Radeon Pro WX 3100 *
GeForce GTX 950M
Radeon Pro 450
Radeon 630
Radeon 540X *
Radeon R9 M385X
Quadro P520
Quadro M1000M
GeForce 945M
Quadro P500 *
Iris Plus Graphics G7 (Ice Lake 64 EU) *
Vega 10 *
Iris Pro Graphics 580
FirePro W5170M *
Radeon R9 M370X
Vega 9
FirePro W5130M
UHD Graphics Xe G4 48EUs *
UHD Graphics 32EUs
UHD Graphics Xe 32EUs (Tiger Lake-H) *
UHD Graphics 750
Vega 7
Radeon R7 M465
Iris Pro Graphics 6200
Vega 8
GeForce 940M
Iris Plus Graphics G4 (Ice Lake 48 EU)
Quadro M600M
FirePro W4190M
Radeon R9 M375
Radeon R7 M445
Iris Plus Graphics 650
Iris Graphics 550
Radeon 625
Vega 6 *
Iris Plus Graphics 640
Iris Graphics 540
UHD Graphics 24EUs (Alder Lake-N) *
Radeon R7 M360
GeForce 920M
Radeon 620
Radeon R7 M340
Radeon 610
Radeon 610M *
Vega 6 *
UHD Graphics G1 (Ice Lake 32 EU)
UHD Graphics Xe 16EUs (Tiger Lake-H) *
HD Graphics 530
Radeon R5 (Bristol Ridge)
Adreno 690 *
Adreno 685 *
Adreno 680 *
Radeon R5 M330
GeForce 910M
HD Graphics 520

Class 4

UHD Graphics 730
Radeon R5 M320 *
Radeon R5 M315 *
Radeon R5 M420 *
Vega 2 *
UHD Graphics 617
UHD Graphics 615
HD Graphics 515
UHD Graphics 610
HD Graphics 510
UHD Graphics 605
Radeon R4 (Stoney Ridge)
Radeon R2 (Stoney Ridge)
HD Graphics (Broadwell)
UHD Graphics 600
HD Graphics (Braswell)

Class 5

* Approximate position of the graphics adapter