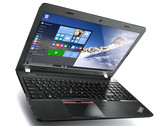
Notebookcheck Logo

AMD Radeon R7 M370

AMD Radeon R7 M370

AMD Radeon R7 M370是一款为中低端市场设计的中低端显卡,在2015年年中发布。它基于28纳米的GCN(Graphics Core Next)架构Mars芯片。因此,尽管频率较低但性能接近于较老的Radeon R9 M260X。

性能

由于相对较高的显存带宽,Radeon R7 M370的性能接近于Nvidia GeForce 830M。2015年的最新大型游戏应可以在中低设置和分辨率下流畅运行。较老的游戏应该可以更高的设置。

它的384个着色器可以通过OpenCL 1.2勇于通用计算(作为6个运算单元)。相比较老的TeraScale 2芯片,GCN架构的Mars芯片在这个方面提供了更好的性能。

特性

R7 M370的特性包括直接硬件视频解码MPEG-4 AVC/H.264,VC-1,MPEG-2和Flash。它也支持Multi-View Codec(MVC)和MPEG-4 part 2(DivX, xVid)的高清视频解码。

R7系列还支持在集成显卡和独立显卡之间的自动切换。 名叫Enduro的这项技术将取代AMD的Dynamic Switchable Graphics技术,类似于Nvidia的Optimus技术。 此外,如果Enduro处于禁用模式下,M370可以直接支持Eyefinity技术,提供对多显示器的支持。

其他功能包括用于降低屏幕关闭时功耗的ZeroCore技术,用于关闭未使用显卡区域的Power Gating技术。 PowerTune可以允许显卡在热设计功率范围内自动超频以及降频。例如,在运行FurMark和OCCT时,芯片可能会降频,而在一些游戏如Lost Planet,Crysis或Resident Evil 5中可能会超频。

集成的HD音频处理器能够通过HDMI和DisplayPort(例如,蓝光视频)传输高清音频(TrueHD技术或DTS Master音频)。 另外,它允许协同离散数字多点音频(DDMA)平行输出音频信号到多个设备。

功耗

它的功耗应该接近于较老的Radeon HD 8670M同时略高于Maxwell架构的Nvidia GeForce 830M。因此,R7 M370应该适合于13寸或更大尺寸的笔记本电脑。

Radeon R7 M300 Series

Radeon R7 M380 640 @ 0.92 GHz128 Bit @ 2000 MHz
Radeon R7 M370 384 @ 0.88 GHz128 Bit @ 3600 MHz
Radeon R7 M360 384 @ 1.13 GHz64 Bit @ 2000 MHz
Radeon R7 M340 320 @ 1.02 GHz64 Bit @ 2000 MHz
ArchitectureGCN
Pipelines384 - unified
Core Speed875 MHz
Memory Speed3600 MHz
Memory Bus Width128 Bit
Memory TypeGDDR5
Max. Amount of Memory2048 MB
Shared Memoryno
APIDirectX 12, Shader 5.0, OpenGL 4.4
Transistor Count1 Billion
technology28 nm
FeaturesMantle, PCIe 3.0, Zero Core, PowerTune
Notebook Sizemedium sized
Date of Announcement06.05.2015

Benchmarks

Performance Rating - 3DMark 11 + Fire Strike + Time Spy
0.8 pt (2%)
AMD Radeon HD 8180
0.06605 -92%
...
NVIDIA Quadro K620M
0.738 -8%
NVIDIA GeForce 940M
0.739 -8%
Intel Iris Graphics 550
0.75 -6%
AMD Radeon 610M
0.753 -6%
0.78 -3%
0.781 -3%
AMD Radeon HD 8790M
0.787 -2%
AMD FirePro W4190M
0.795 -1%
0.798 0%
AMD Radeon R7 M370
0.802
AMD FirePro W4170M
0.804 0%
AMD Radeon HD 8850M
0.84 5%
0.859 7%
AMD Radeon R8 M365DX
0.866 8%
Intel Iris Pro Graphics 580
0.867 8%
AMD Radeon R7 M275DX
0.88 10%
0.888 11%
0.903 13%
0.909 13%
...
21.1 2531%
max:
33.3 4052%
0%
100%
3DMark - 3DMark Ice Storm Unlimited Graphics
118746 Points (13%)
3DMark - 3DMark Ice Storm Extreme Graphics
28896 Points (4%)
3DMark - 3DMark Cloud Gate Score
min: 7083     avg: 7881     median: 7169 (8%)     max: 9391 Points
3DMark - 3DMark Cloud Gate Graphics
min: 10288     avg: 11149     median: 10364 (3%)     max: 12795 Points
3DMark - 3DMark Fire Strike Standard Score
min: 1609     avg: 1659     median: 1654 (3%)     max: 1714 Points
3DMark - 3DMark Fire Strike Standard Graphics
min: 1693     avg: 1751     median: 1760 (2%)     max: 1801 Points
3DMark - 3DMark Ice Storm Graphics
min: 34077     avg: 44852     median: 34092 (4%)     max: 66387 Points
3DMark 11 - 3DM11 Performance Score
min: 2689     avg: 2802     median: 2690 (4%)     max: 3027 Points
3DMark 11 - 3DM11 Performance GPU
min: 2522     avg: 2595     median: 2524 (2%)     max: 2739 Points
171.8 -93%
...
2427 -6%
NVIDIA Quadro K620M
2434 -6%
Intel Iris Graphics 550
2435 -6%
2452 -6%
2467 -5%
AMD Radeon R7 M340
2492 -4%
NVIDIA GeForce GT 750M
2549 -2%
NVIDIA Maxwell GPU Surface Book
2577 -1%
2582 -1%
AMD Radeon R7 M370
2595
2615 1%
2658 2%
AMD Radeon R6 M340DX
2681 3%
2693 4%
2702 4%
2707 4%
2709 4%
2729 5%
Intel Iris Plus Graphics 650
2762 6%
...
59943 2210%
max:
106023 3986%
0%
100%
3DMark Vantage
3DM Vant. Perf. total +
3DMark Vantage - 3DM Vant. Perf. total
8513 Points (2%)
3DM Vant. Perf. GPU no PhysX +
3DMark Vantage - 3DM Vant. Perf. GPU no PhysX
7782 Points (4%)
ATI Radeon HD 3200
62 -99%
...
AMD Radeon RX Vega 6 (Ryzen 2000/3000)
7387 -5%
Intel UHD Graphics G1 (Ice Lake 32 EU)
7444 -4%
AMD Radeon HD 8650G + HD 8670M Dual Graphics
7535 -3%
NVIDIA GeForce 9800M GT SLI
7591 -2%
Intel Iris Plus Graphics G4 (Ice Lake 48 EU)
7610 -2%
7614 -2%
NVIDIA GeForce GT 745M
7631 -2%
7645 -2%
7691 -1%
AMD Radeon R7 M370
7782
7906 2%
7990 3%
7999 3%
AMD Radeon R9 M375
8042 3%
8081 4%
Intel Iris Graphics 540
8220 6%
AMD Radeon HD 8790M
8407 8%
NVIDIA GeForce 9800M GTX SLI
8492 9%
AMD Radeon HD 8850M
8538 10%
...
132443 1602%
max:
170928 2096%
0%
100%
3DMark 06 3DMark 06 - Standard 1280x1024 +
3DMark 06
12983 Points (17%)
SPECviewperf 11
specvp11 snx-01 +
SPECviewperf 11 - specvp11 snx-01
min: 7.8     avg: 8.3     median: 8.3 (5%)     max: 8.7 fps
specvp11 tcvis-02 +
SPECviewperf 11 - specvp11 tcvis-02
min: 2.95     avg: 5.1     median: 5.1 (3%)     max: 7.34 fps
specvp11 sw-02 +
SPECviewperf 11 - specvp11 sw-02
min: 12.08     avg: 18.9     median: 18.9 (14%)     max: 25.7 fps
specvp11 proe-05 +
SPECviewperf 11 - specvp11 proe-05
min: 3.21     avg: 3.8     median: 3.8 (5%)     max: 4.48 fps
specvp11 maya-03 +
SPECviewperf 11 - specvp11 maya-03
min: 6.67     avg: 10     median: 10 (8%)     max: 13.33 fps
specvp11 lightwave-01 +
SPECviewperf 11 - specvp11 lightwave-01
min: 14.55     avg: 20.6     median: 20.6 (22%)     max: 26.7 fps
specvp11 ensight-04 +
SPECviewperf 11 - specvp11 ensight-04
min: 22.24     avg: 24.8     median: 24.8 (12%)     max: 27.29 fps
specvp11 catia-03 +
SPECviewperf 11 - specvp11 catia-03
min: 5.66     avg: 7.7     median: 7.7 (4%)     max: 9.66 fps
Cinebench R10 Cinebench R10 Shading (32bit) +
Cinebench R10 - Cinebench R10 Shading (32bit)
min: 7921     avg: 9538     median: 9537.5 (7%)     max: 11154 points
Cinebench R11.5 Cinebench R11.5 OpenGL 64 Bit +
Cinebench R11.5 - Cinebench R11.5 OpenGL 64 Bit
min: 52.9     avg: 53.1     median: 53.1 (18%)     max: 53.3 fps
Cinebench R15
Cinebench R15 OpenGL 64 Bit +
Cinebench R15 - Cinebench R15 OpenGL 64 Bit
min: 51.3     avg: 52     median: 52.1 (3%)     max: 52.6 fps
Cinebench R15 OpenGL Ref. Match 64 Bit +
Cinebench R15 - Cinebench R15 OpenGL Ref. Match 64 Bit
98 % (98%)
GFXBench 3.0 - GFXBench 3.0 Manhattan Offscreen
35.3 fps (2%)
GFXBench (DX / GLBenchmark) 2.7
GFXBench T-Rex HD Offscreen C24Z16 +
GFXBench (DX / GLBenchmark) 2.7 - GFXBench T-Rex HD Offscreen C24Z16
80.7 fps (1%)
LuxMark v2.0 64Bit - LuxMark v2.0 Room GPU
269 Samples/s (1%)
LuxMark v2.0 64Bit - LuxMark v2.0 Sala GPU
475 Samples/s (1%)
ComputeMark v2.1 - ComputeMark v2.1 Result
507 points (1%)
- Range of benchmark values for this graphics card
- Average benchmark values for this graphics card
* Smaller numbers mean a higher performance

Game Benchmarks

The following benchmarks stem from our benchmarks of review laptops. The performance depends on the used graphics memory, clock rate, processor, system settings, drivers, and operating systems. So the results don't have to be representative for all laptops with this GPU. For detailed information on the benchmark results, click on the fps number.

low 1024x768
52.1  fps    + Compare
med. 1366x768
32.8  fps    + Compare
high 1920x1080
16  fps    + Compare
ultra 1920x1080
13.5  fps    + Compare
» With all tested laptops playable in detail settings low.
low 1024x768
19.3  fps    + Compare
med. 1366x768
15.8  fps    + Compare
high 1920x1080
8.9  fps    + Compare
» The benchmarks indicate that the game is not playable in the tested settings.
Fallout 4

Fallout 4

2015
low 1280x720
34  fps    + Compare
med. 1366x768
21.1  fps    + Compare
high 1920x1080
11.5  fps    + Compare
ultra 1920x1080
8.4  fps    + Compare
» The benchmarks indicate that the game is not playable in the tested settings.
low 1024x768
44.2  fps    + Compare
med. 1366x768
28  fps    + Compare
high 1920x1080
11.4  fps    + Compare
ultra 1920x1080
6.5  fps    + Compare
» With all tested laptops playable in detail settings low.
Anno 2205

Anno 2205

2015
low 1024x768
35.4  fps    + Compare
med. 1366x768
19.8  fps    + Compare
high 1920x1080
8.7  fps    + Compare
ultra 1920x1080
4.1  fps    + Compare
» With all tested laptops playable in detail settings low.
FIFA 16

FIFA 16

2015
high 1366x768
27.9  fps    + Compare
ultra 1920x1080
15.6  fps    + Compare
» The benchmarks indicate that the game is not playable in the tested settings.
low 1366x768
51  fps    + Compare
med. 1366x768
35.6  fps    + Compare
high 1920x1080
17.7  fps    + Compare
ultra 1920x1080
13.3  fps    + Compare
» With all tested laptops playable in detail settings med..
low 1024x768
57.1  fps    + Compare
med. 1366x768
43.3  fps    + Compare
high 1920x1080
20.2  fps    + Compare
ultra 1920x1080
12.7  fps    + Compare
» With all tested laptops playable in detail settings med..
Mad Max

Mad Max

2015
med. 1366x768
38.4  fps    + Compare
high 1920x1080
17.1  fps    + Compare
ultra 1920x1080
13.8  fps    + Compare
» With all tested laptops playable in detail settings med..
low 1280x720
29 31 35 ~ 32 fps    + Compare
med. 1366x768
23 25 30 ~ 26 fps    + Compare
high 1920x1080
10 11 13 ~ 11 fps    + Compare
» The benchmarks indicate that the game is not playable in the tested settings.
low 1024x768
27.6  fps    + Compare
med. 1366x768
18  fps    + Compare
high 1920x1080
9.5  fps    + Compare
ultra 1920x1080
5.7  fps    + Compare
» The benchmarks indicate that the game is not playable in the tested settings.
low 1024x768
116.8  fps    + Compare
med. 1366x768
47.6  fps    + Compare
high 1920x1080
25.6  fps    + Compare
ultra 1920x1080
13.4  fps    + Compare
» With all tested laptops playable in detail settings med..
low 1024x768
72.4  fps    + Compare
med. 1366x768
52.5  fps    + Compare
high 1920x1080
19.4  fps    + Compare
ultra 1920x1080
12.8  fps    + Compare
» With all tested laptops playable in detail settings med..
low 1024x768
58.6  fps    + Compare
med. 1366x768
34.9  fps    + Compare
high 1920x1080
11.7  fps    + Compare
ultra 1920x1080
7.6  fps    + Compare
» With all tested laptops playable in detail settings low.
low 1280x720
37.4  fps    + Compare
med. 1344x756
27.8  fps    + Compare
high 1920x1080
15.7  fps    + Compare
ultra 1920x1080
11.7  fps    + Compare
» With all tested laptops playable in detail settings low.
Sims 4

Sims 4

2014
low 1024x768
172.7  fps    + Compare
med. 1366x768
58.6  fps    + Compare
high 1920x1080
35  fps    + Compare
ultra 1920x1080
25  fps    + Compare
» With all tested laptops playable in detail settings med..
Thief

Thief

2014
low 1024x768
24.1 30.3 ~ 27 fps    + Compare
med. 1366x768
18.2 21 ~ 20 fps    + Compare
high 1366x768
17 18 ~ 18 fps    + Compare
ultra 1920x1080
9.8 11.4 ~ 11 fps    + Compare
» The benchmarks indicate that the game is not playable in the tested settings.
low 1024x768
68  fps    + Compare
med. 1366x768
46.7  fps    + Compare
high 1366x768
33.2  fps    + Compare
ultra 1920x1080
12.8  fps    + Compare
» With all tested laptops playable in detail settings med..
low 1024x768
80.1 83.8 ~ 82 fps    + Compare
med. 1366x768
60.1 65.9 ~ 63 fps    + Compare
high 1366x768
49.5 58.1 ~ 54 fps    + Compare
ultra 1920x1080
7.9 9 ~ 8 fps    + Compare
» With all tested laptops playable in detail settings high.
low 1024x768
51.9  fps    + Compare
med. 1366x768
38.2  fps    + Compare
high 1366x768
21.8  fps    + Compare
ultra 1920x1080
10.1  fps    + Compare
» With all tested laptops playable in detail settings med..
low 1280x720
86.7 88.2 120.6 ~ 99 fps    + Compare
med. 1366x768
48.4 50.2 59.3 ~ 53 fps    + Compare
high 1366x768
44 46.7 52.2 ~ 48 fps    + Compare
ultra 1920x1080
16.1 17 18.6 ~ 17 fps    + Compare
» With all tested laptops playable in detail settings high.
low 1024x768
105.5  fps    + Compare
med. 1366x768
55.4  fps    + Compare
high 1366x768
42.7  fps    + Compare
ultra 1920x1080
18.6  fps    + Compare
» With all tested laptops playable in detail settings high.
Crysis 3

Crysis 3

2013
low 1024x768
54.1  fps    + Compare
med. 1366x768
32.6  fps    + Compare
high 1366x768
20.2  fps    + Compare
ultra 1920x1080
7.4  fps    + Compare
» With all tested laptops playable in detail settings low.
Mafia 2

Mafia 2

2010
low 800x600
82.9 87.6 ~ 85 fps    + Compare
med. 1024x768
64.8 65.9 ~ 65 fps    + Compare
high 1360x768
53.1 53.7 ~ 53 fps    + Compare
ultra 1920x1080
31.6 32.3 ~ 32 fps    + Compare
» With all tested laptops playable in detail settings high.
lowmed.highultraQHD4K
Star Wars Battlefront52.132.81613.5
Assassin's Creed Syndicate19.315.88.9
Fallout 43421.111.58.4
Call of Duty: Black Ops 344.22811.46.5
Anno 220535.419.88.74.1
FIFA 1627.915.6
World of Warships5135.617.713.3
Metal Gear Solid V57.143.320.212.7
Mad Max38.417.113.8
Batman: Arkham Knight322611
The Witcher 327.6189.55.7
Dirt Rally116.847.625.613.4
Battlefield Hardline72.452.519.412.8
Dragon Age: Inquisition58.634.911.77.6
Middle-earth: Shadow of Mordor37.427.815.711.7
Sims 4172.758.63525
Thief27201811
Battlefield 46846.733.212.8
Total War: Rome II8263548
Metro: Last Light51.938.221.810.1
BioShock Infinite99534817
Tomb Raider105.555.442.718.6
Crysis 354.132.620.27.4
Mafia 285655332
< 30 fps
< 60 fps
< 120 fps
≥ 120 fps
3
11
7
1
8
13
2
18
6

21
1


For more games that might be playable and a list of all games and graphics cards visit our Gaming List

v1.26
log 17. 10:38:55

#0 no ids found in url (should be separated by "_") +0s ... 0s

#1 not redirecting to Ajax server +0s ... 0s

#2 did not recreate cache, as it is less than 5 days old! Created at Thu, 16 May 2024 05:40:59 +0200 +0.001s ... 0.001s

#3 no comparison url found in template nbc.compare_page_1 needed +0.054s ... 0.055s

#4 no comparison url found in template nbc.compare_page_1 needed +0s ... 0.055s

#5 no comparison url found in template nbc.compare_page_1 needed +0s ... 0.055s

#6 composed specs +0s ... 0.055s

#7 did output specs +0s ... 0.055s

#8 start showIntegratedCPUs +0s ... 0.055s

#9 getting avg benchmarks for device 6390 +0.062s ... 0.117s

#10 got single benchmarks 6390 +0.016s ... 0.133s

#11 got avg benchmarks for devices +0s ... 0.133s

#12 min, max, avg, median took s +0.723s ... 0.856s

#13 before gaming benchmark output +0s ... 0.856s

#14 Got 117 rows for game benchmarks. +0.019s ... 0.875s

#15 composed SQL query for gamebenchmarks +0s ... 0.875s

#16 got data and put it in $dataArray +0.02s ... 0.895s

#17 benchmarks composed for output. +0.91s ... 1.806s

#18 no comparison url found in template nbc.compare_page_1 needed +0.003s ... 1.809s

#19 return log +0s ... 1.809s

Please share our article, every link counts!

» Comparison of GPUs
Detailed list of all laptop GPUs sorted by class and performance.

» Benchmark List
Sort and restrict laptop GPUs based on performance in synthetic benchmarks.

» Notebook Gaming List
Playable games for each graphics card and their average FPS results.

Class 1

GeForce RTX 2080 Super Mobile

Class 2

M1 Max 32-Core GPU *
GeForce RTX 2070 Super Mobile
M1 Max 24-Core GPU *
Quadro RTX 5000 Max-Q
Radeon RX 5700M *
GeForce GTX 1080 Mobile
Quadro RTX 4000 (Laptop)
M1 Pro 16-Core GPU *
Radeon PRO W6600M *
GeForce RTX 2070 Super Max-Q
Quadro RTX 4000 Max-Q *
M1 Pro 14-Core GPU *
Quadro P5200
Quadro RTX 3000 Max-Q *
Quadro P4200
Quadro P5000 Max-Q *
GeForce GTX 980 (Laptop)
Quadro P4000
Quadro P4000 Max-Q
Quadro P3200
Radeon RX 580X (Laptop) *
Radeon RX 580 (Laptop)
Radeon Pro 5300M
Radeon RX 5300M
Quadro P3000 Max-Q *
Quadro T2000 Max-Q *
Radeon Pro WX 7100 *
Radeon RX 570X (Laptop) *
Radeon RX 570 (Laptop) *
Radeon RX 470 (Laptop) *
Quadro T1000 Max-Q *

Class 3

Vega M GH
Quadro M5000M
GeForce GTX 1050 Ti Mobile
Radeon 680M
Quadro P2000
Quadro P2000 Max-Q
Quadro M4000M
T500 Laptop GPU *
Radeon R9 M395X
GeForce GTX 1050 Ti Max-Q *
Radeon Pro Vega 16
WX Vega M GL
Radeon R9 M485X
Quadro M3000M
FirePro W7170M
Radeon R9 M395
GeForce GTX 1050 Max-Q *
Radeon 660M
Radeon Pro WX 4150 *
Radeon RX 560X (Laptop)
Radeon RX 560 (Laptop)
Radeon RX 460 (Laptop)
Quadro P1000
Radeon R9 M390
Xe MAX
Radeon Pro 560X
Radeon Pro 560
Radeon Pro 460
Radeon Pro WX 4130 *
GeForce GTX 960M
Quadro P620 *
Radeon RX 550X (Laptop)
Radeon Pro WX 3200 *
Radeon Pro 555X
Radeon Pro 555
Radeon Pro 455
Quadro P600
Quadro M2000M
Radeon RX 540X *
Radeon Pro WX 2100 *
Radeon Pro WX 3100 *
GeForce GTX 950M
Radeon Pro 450
Radeon 630
Radeon 540X *
Radeon R9 M385X
Quadro P520
Quadro M1000M
GeForce 945M
Quadro P500 *
Iris Plus Graphics G7 (Ice Lake 64 EU) *
Vega 10 *
Iris Pro Graphics 580
FirePro W5170M *
Radeon R9 M370X
Vega 9
FirePro W5130M
UHD Graphics Xe G4 48EUs *
UHD Graphics 32EUs
UHD Graphics Xe 32EUs (Tiger Lake-H) *
UHD Graphics 750
Vega 7
Radeon R7 M465
Iris Pro Graphics 6200
Vega 8
GeForce 940M
Iris Plus Graphics G4 (Ice Lake 48 EU)
Quadro M600M
FirePro W4190M
Radeon R9 M375
Radeon R7 M445
Iris Plus Graphics 650
Iris Graphics 550
Radeon 625
Vega 6 *
Iris Plus Graphics 640
Iris Graphics 540
UHD Graphics 24EUs (Alder Lake-N) *
Radeon R7 M360
GeForce 920M
Radeon 620
Radeon R7 M340
Radeon 610
Radeon 610M *
Vega 6 *
UHD Graphics G1 (Ice Lake 32 EU)
UHD Graphics Xe 16EUs (Tiger Lake-H) *
HD Graphics 530
Radeon R5 (Bristol Ridge)
Adreno 690 *
Adreno 685 *
Adreno 680 *
Radeon R5 M330
GeForce 910M
HD Graphics 520

Class 4

UHD Graphics 730
Radeon R5 M320 *
Radeon R5 M315 *
Radeon R5 M420 *
Vega 2 *
UHD Graphics 617
UHD Graphics 615
HD Graphics 515
UHD Graphics 610
HD Graphics 510
UHD Graphics 605
Radeon R4 (Stoney Ridge)
Radeon R2 (Stoney Ridge)
HD Graphics (Broadwell)
UHD Graphics 600
HD Graphics (Braswell)

Class 5

* Approximate position of the graphics adapter