华为MateBook 16 AMD评测--多媒体笔记本电脑以其Ryzen 7 CPU给人留下深刻印象
新的MateBook 16是华为高品质多媒体笔记本电脑阵容的最新成员,其风格为华为MateBook X Pro或新的 MateBook 14s。它最近在欧洲推出,起价为1100欧元(约1300美元),这使它高于旧的MateBook D16新的MateBook 16针对的是那些正在寻找一个具有大显示屏的强大设备,但不需要专用GPU进行游戏的客户。
我们已经审查了更强大的配置,配备了新的 AMD Ryzen 7 5800H包括Radeon RX Vega 8 iGPU,16GB内存,512GB PCIe SSD和高分辨率16英寸3:2 IPS显示屏,售价1200欧元。竞争对手包括 MateBook D 16上面提到的。Acer Swift 3 16,以及联想IdeaPad 5 Pro 16,以及申科视界15和戴尔XPS 15 9510.
potential competitors in comparison
Rating | Date | Model | Weight | Height | Size | Resolution | Price |
|---|---|---|---|---|---|---|---|
| 86.5 % v7 (old) | 10 / 2021 | Huawei MateBook 16 R7 5800H R7 5800H, Vega 8 | 2 kg | 17.8 mm | 16.00" | 2520x1680 | |
| 86.4 % v7 (old) | 10 / 2021 | Acer Swift 3 SF316-51 i7-11370H, Iris Xe G7 96EUs | 1.7 kg | 15.9 mm | 16.10" | 1920x1080 | |
| 86 % v7 (old) | 04 / 2021 | Huawei MateBook D 16-53011VFJ R5 4600H, Vega 6 | 1.7 kg | 18.4 mm | 16.10" | 1920x1080 | |
| 86.1 % v7 (old) | 09 / 2021 | Lenovo IdeaPad 5 Pro 16ACH R7 5800H, GeForce GTX 1650 Mobile | 2 kg | 17.5 mm | 16.00" | 2560x1600 | |
| 87.7 % v7 (old) | 01 / 2021 | Schenker Vision 15 i7-1165G7, Iris Xe G7 96EUs | 1.7 kg | 15 mm | 15.60" | 1920x1080 | |
| 84.2 % v7 (old) | 10 / 2021 | Dell XPS 15 9510 i5 11400H FHD i5-11400H, UHD Graphics Xe 16EUs | 1.8 kg | 18 mm | 15.60" | 1920x1200 |
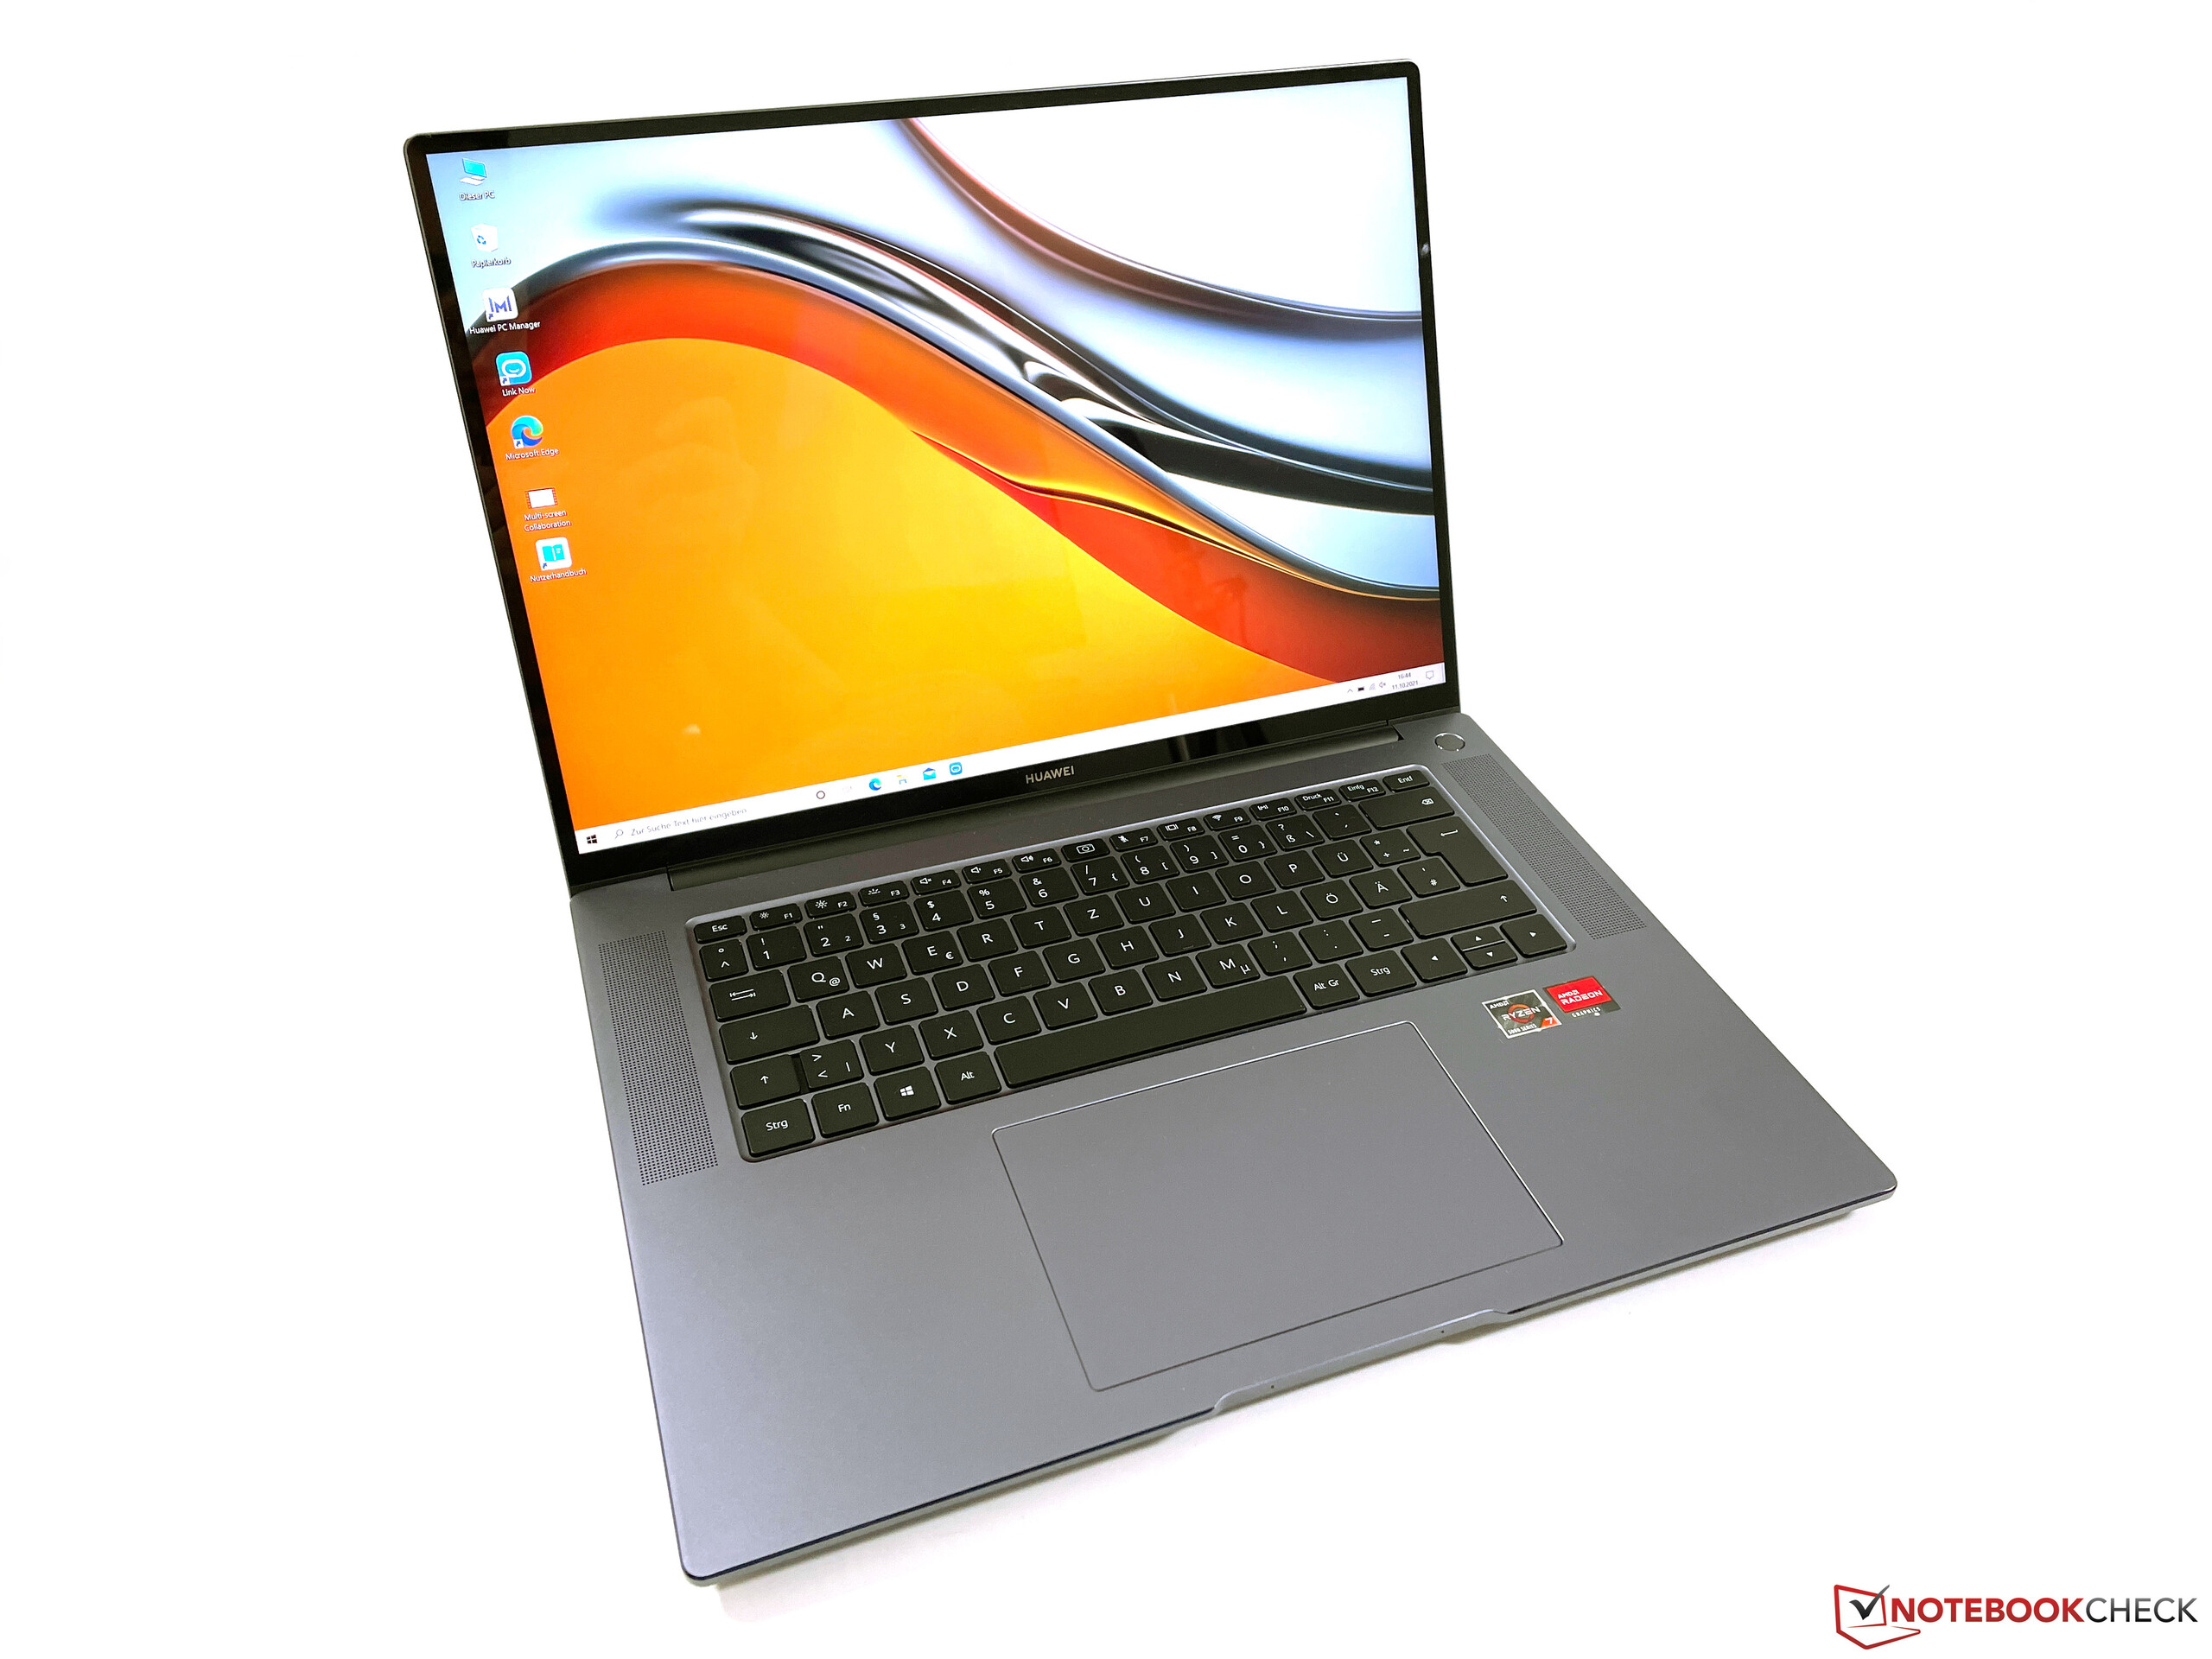
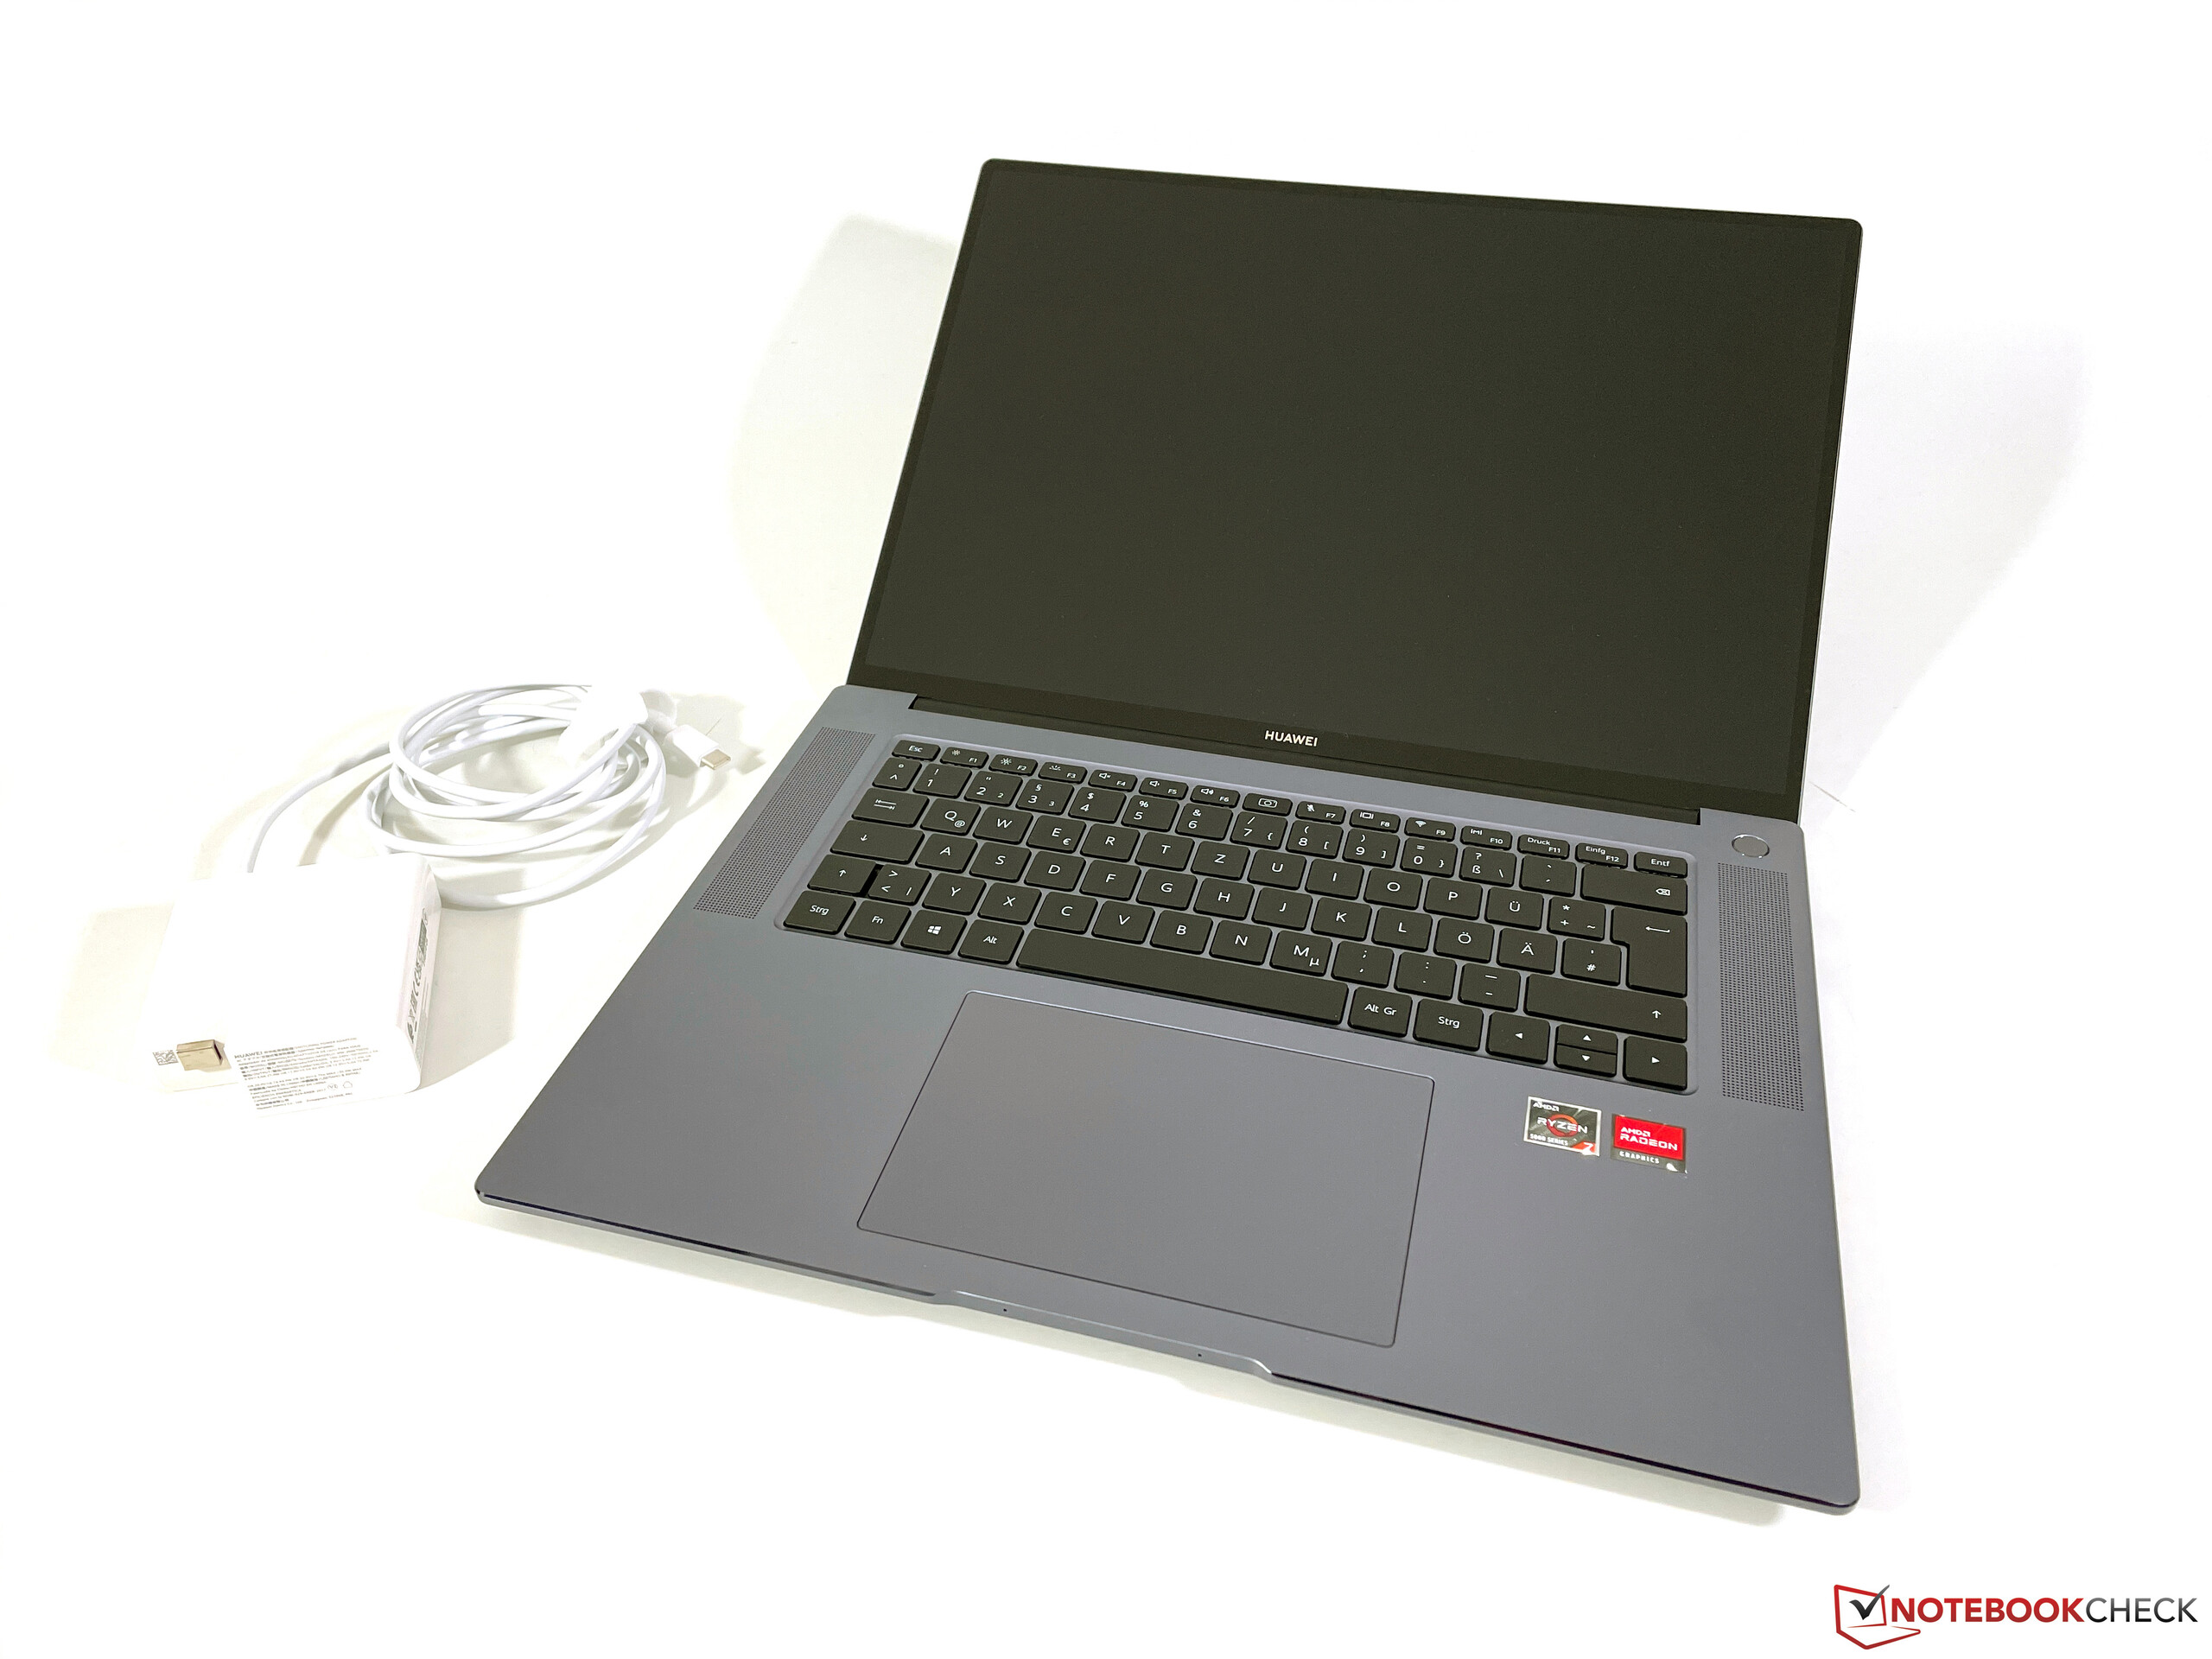
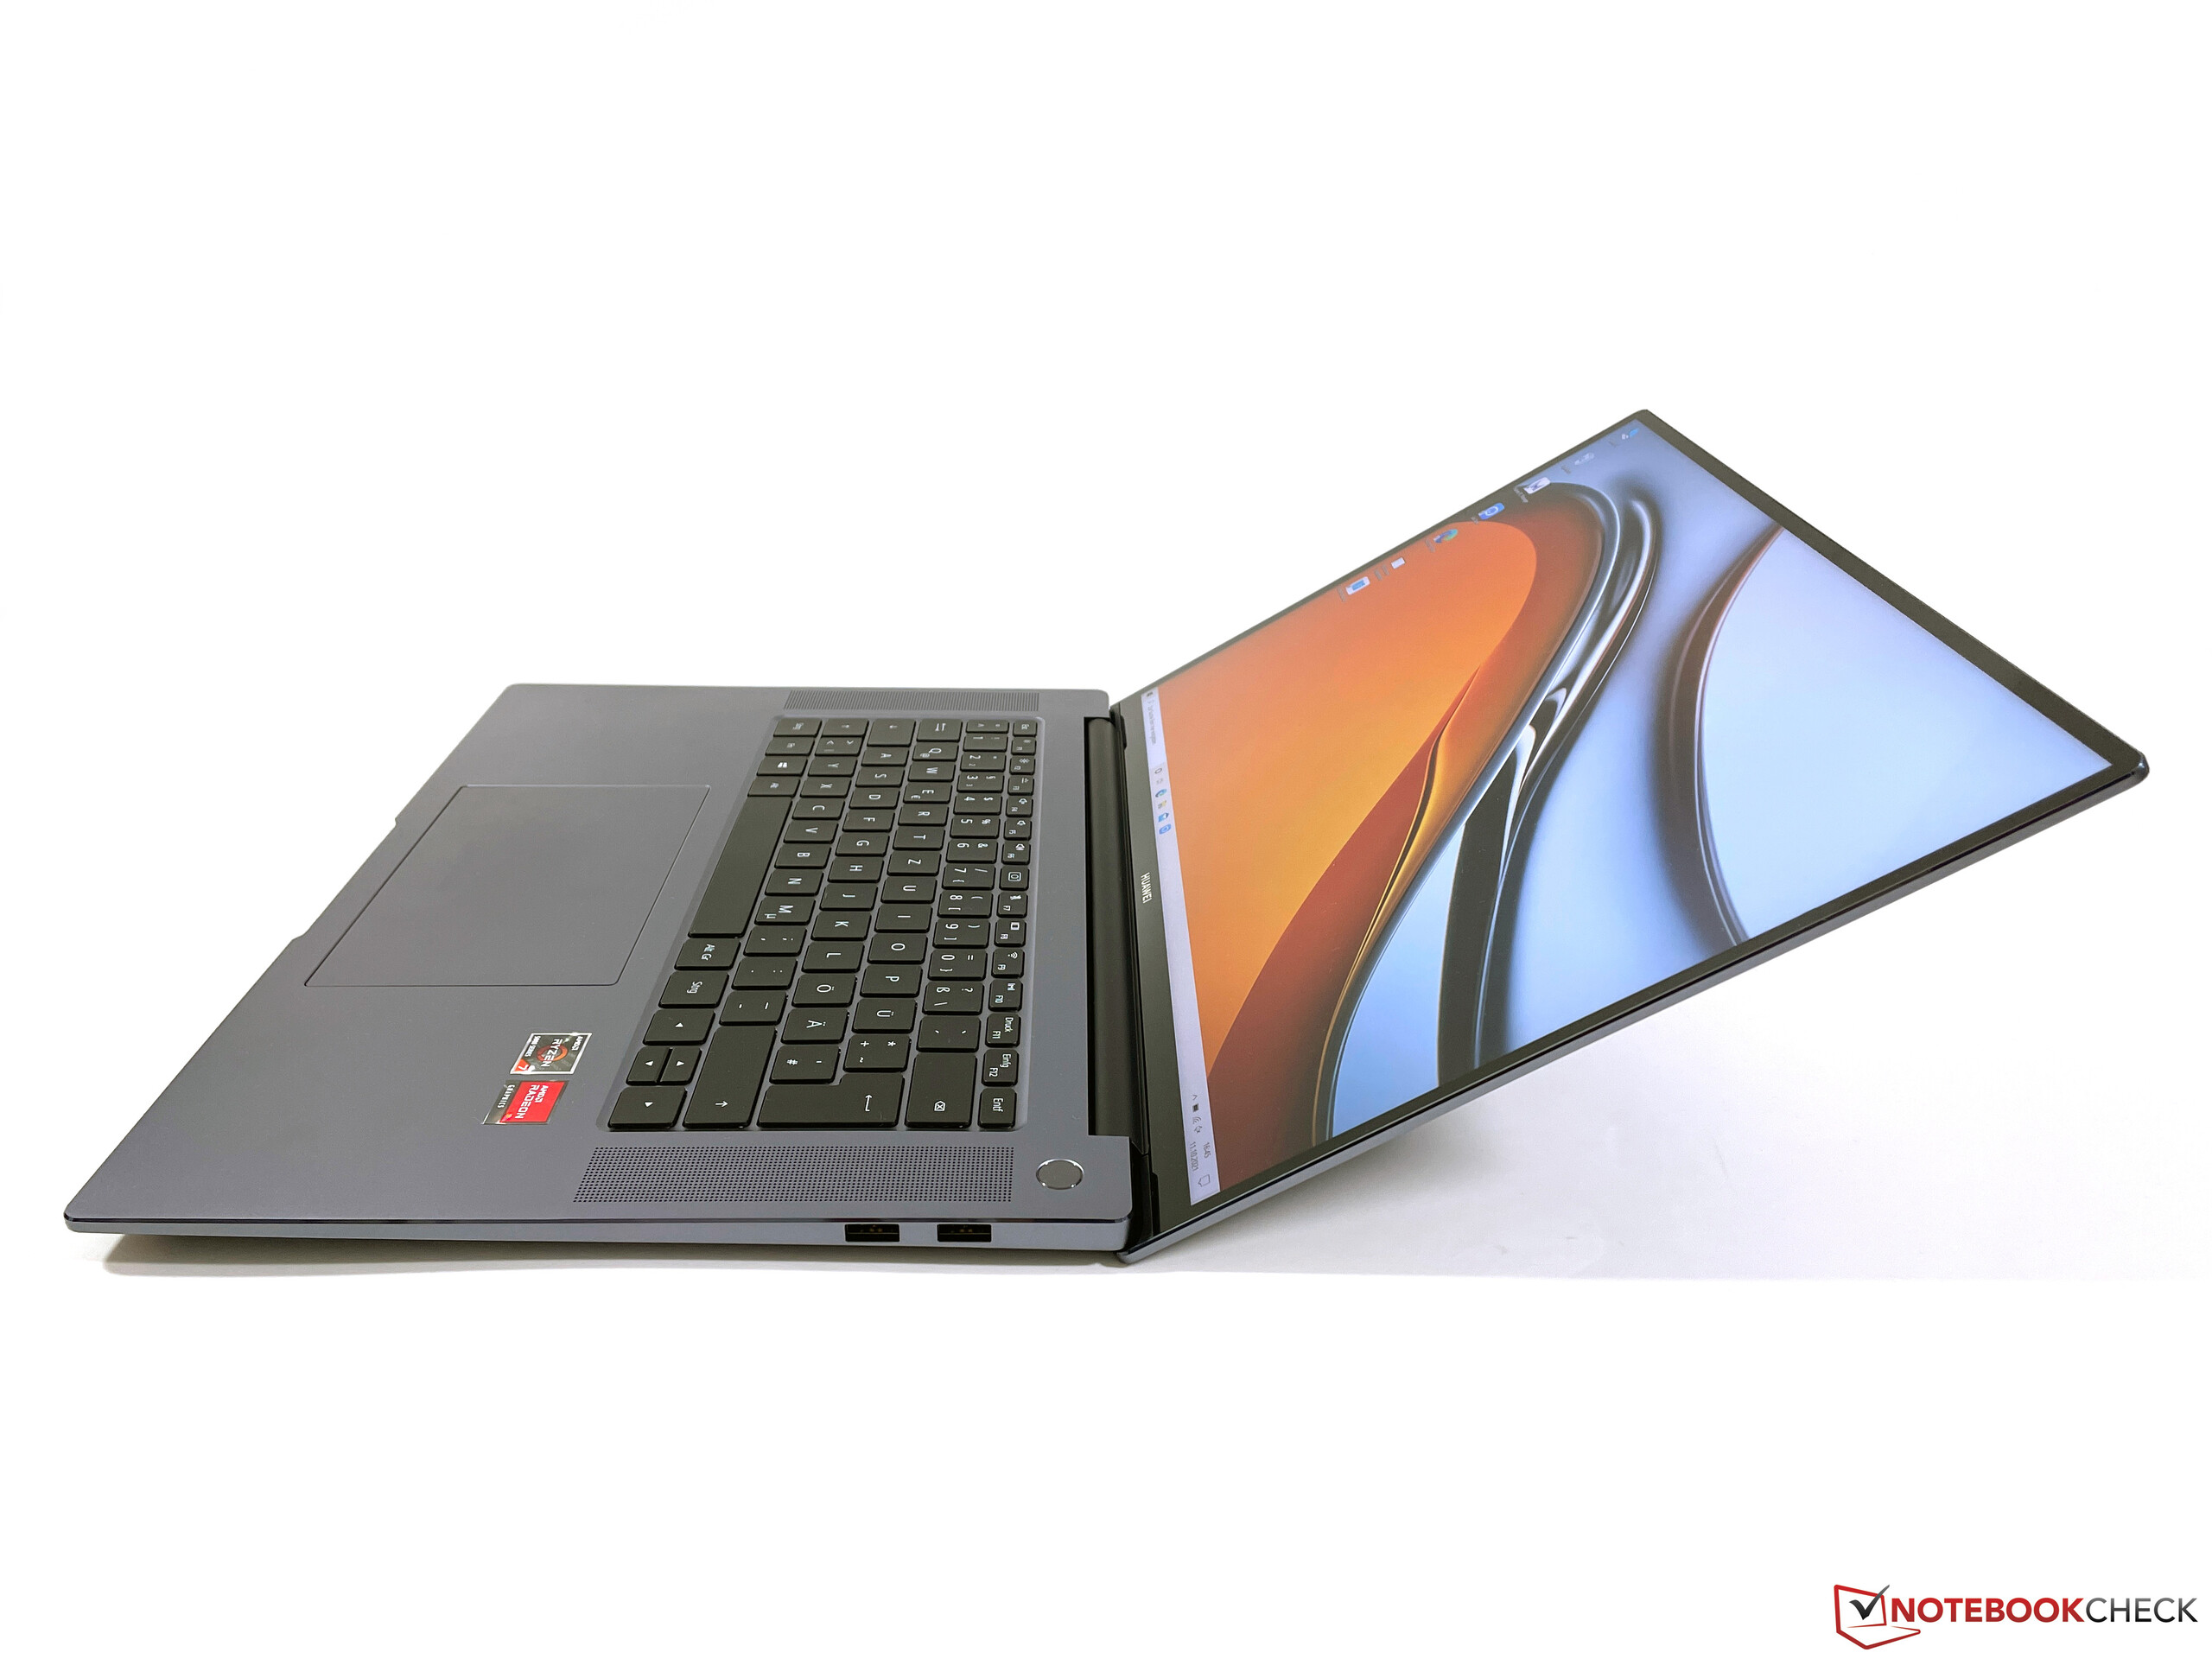
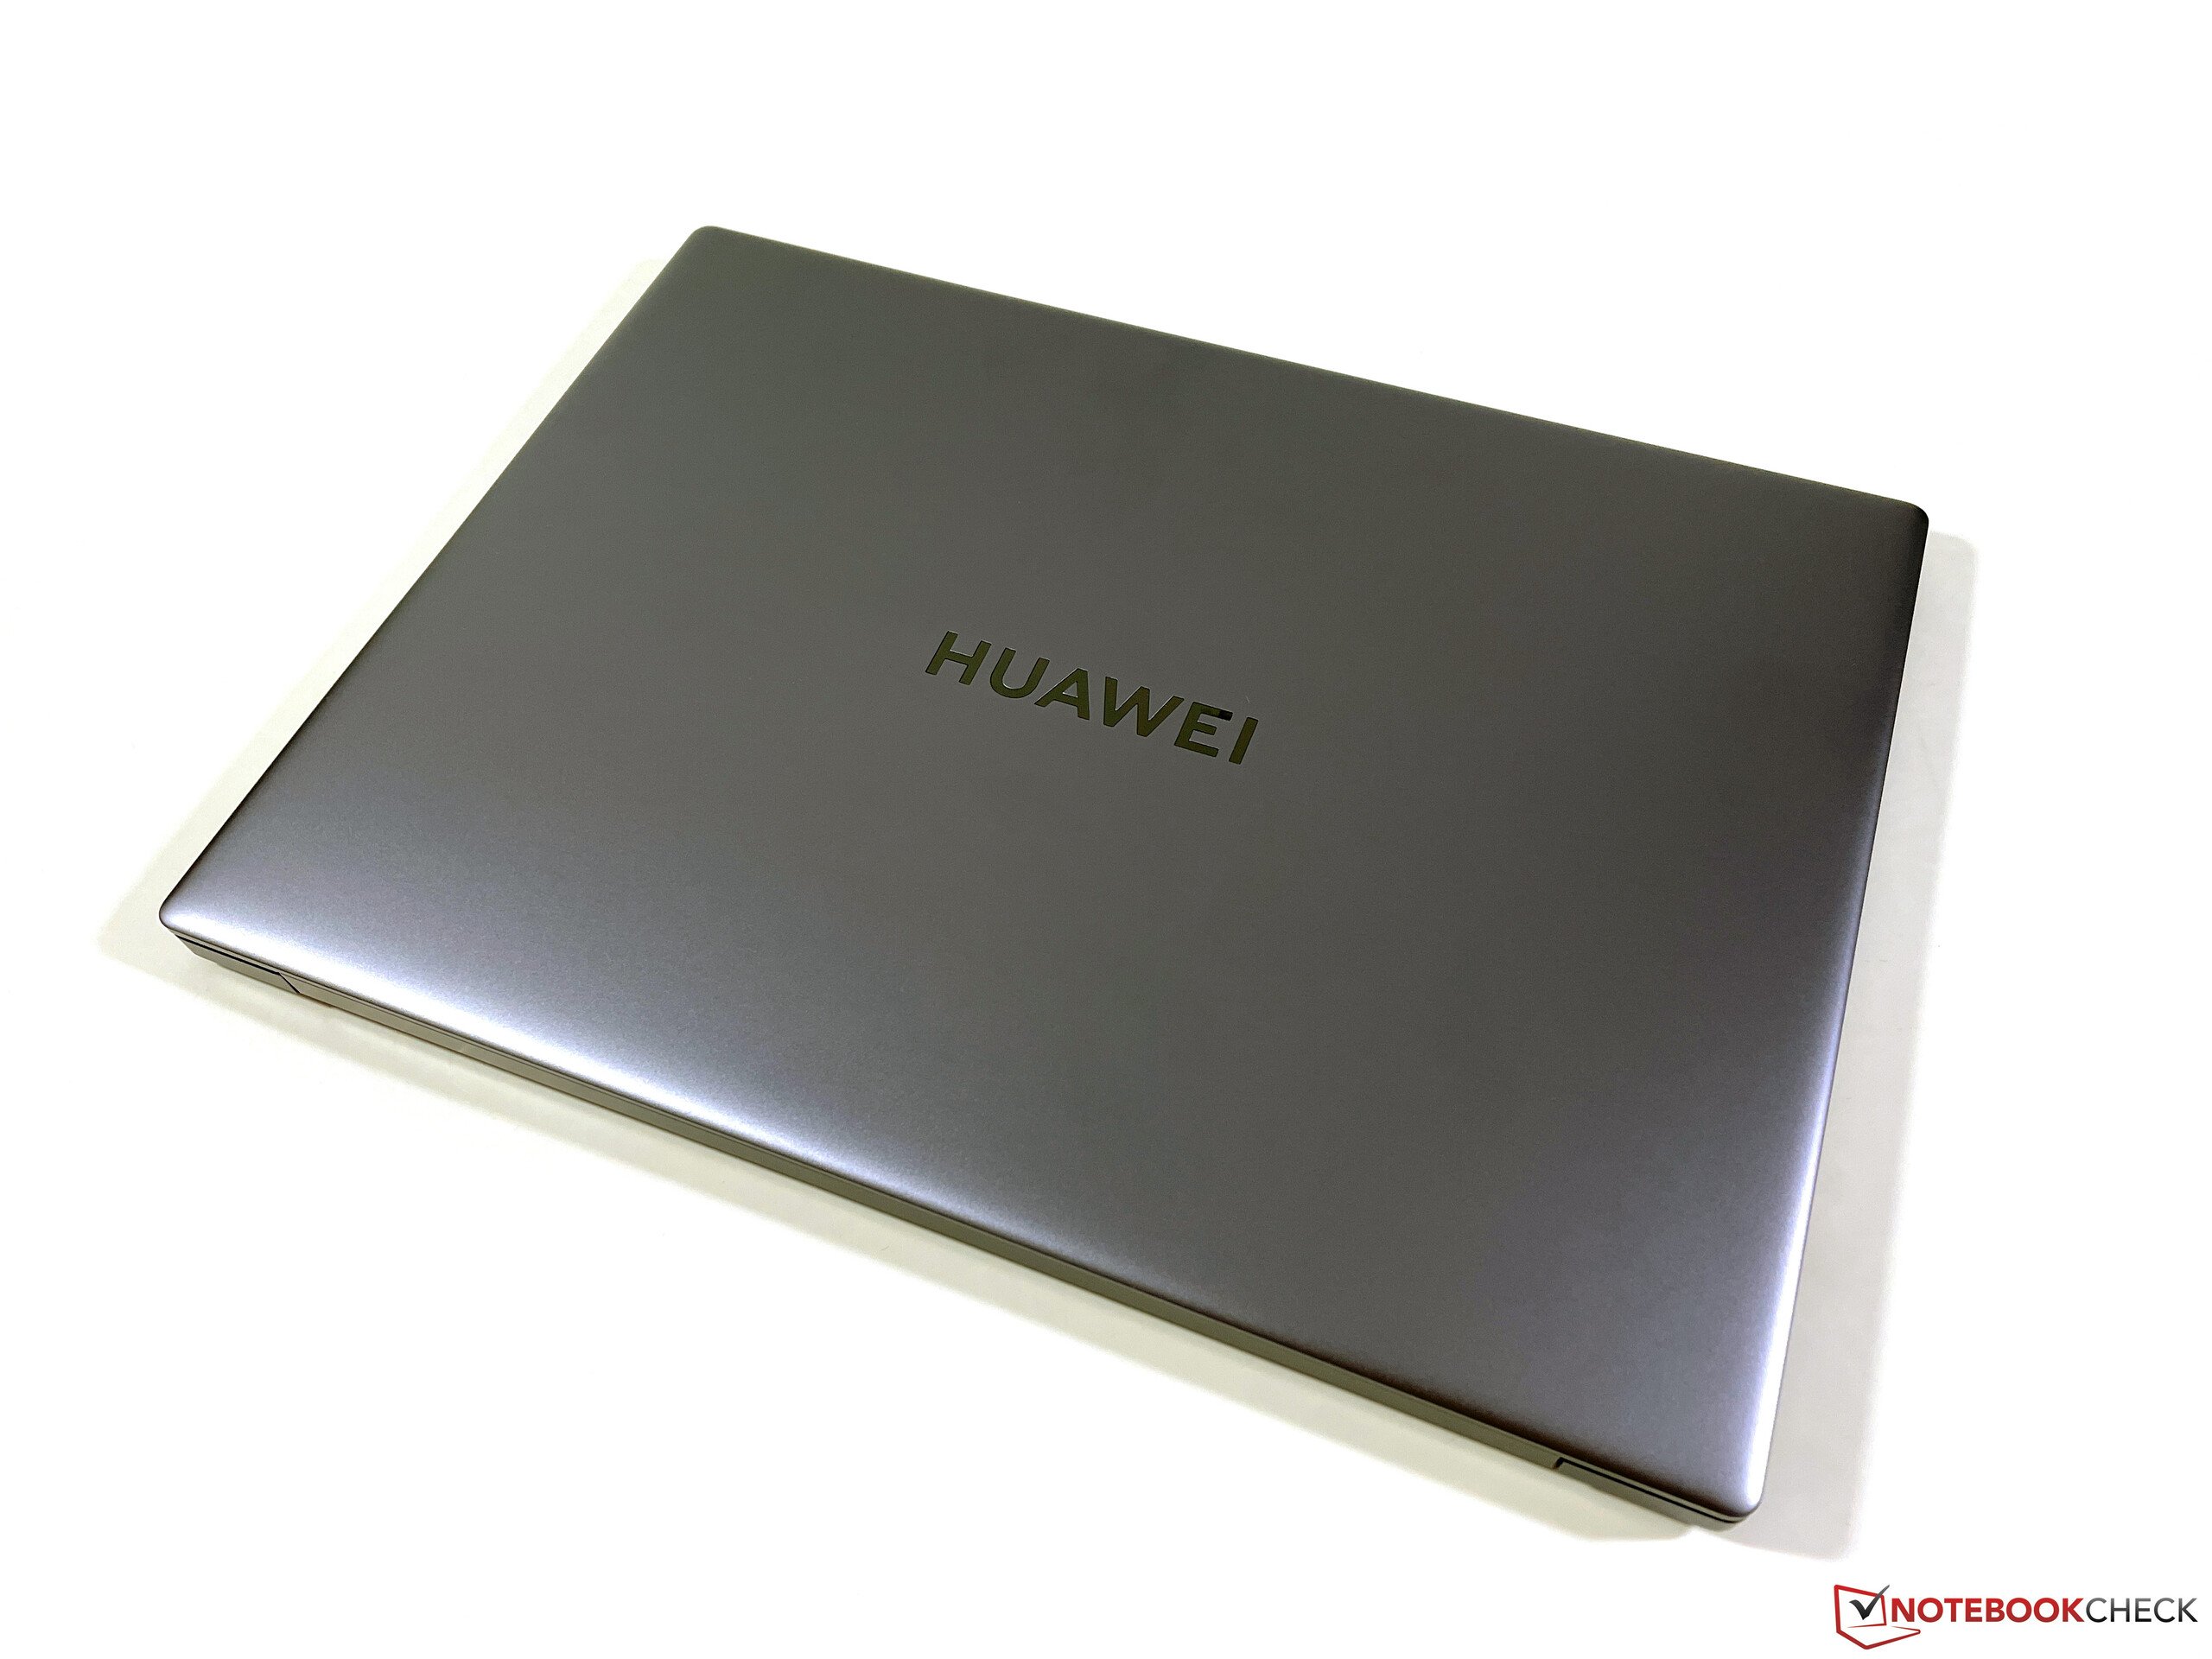
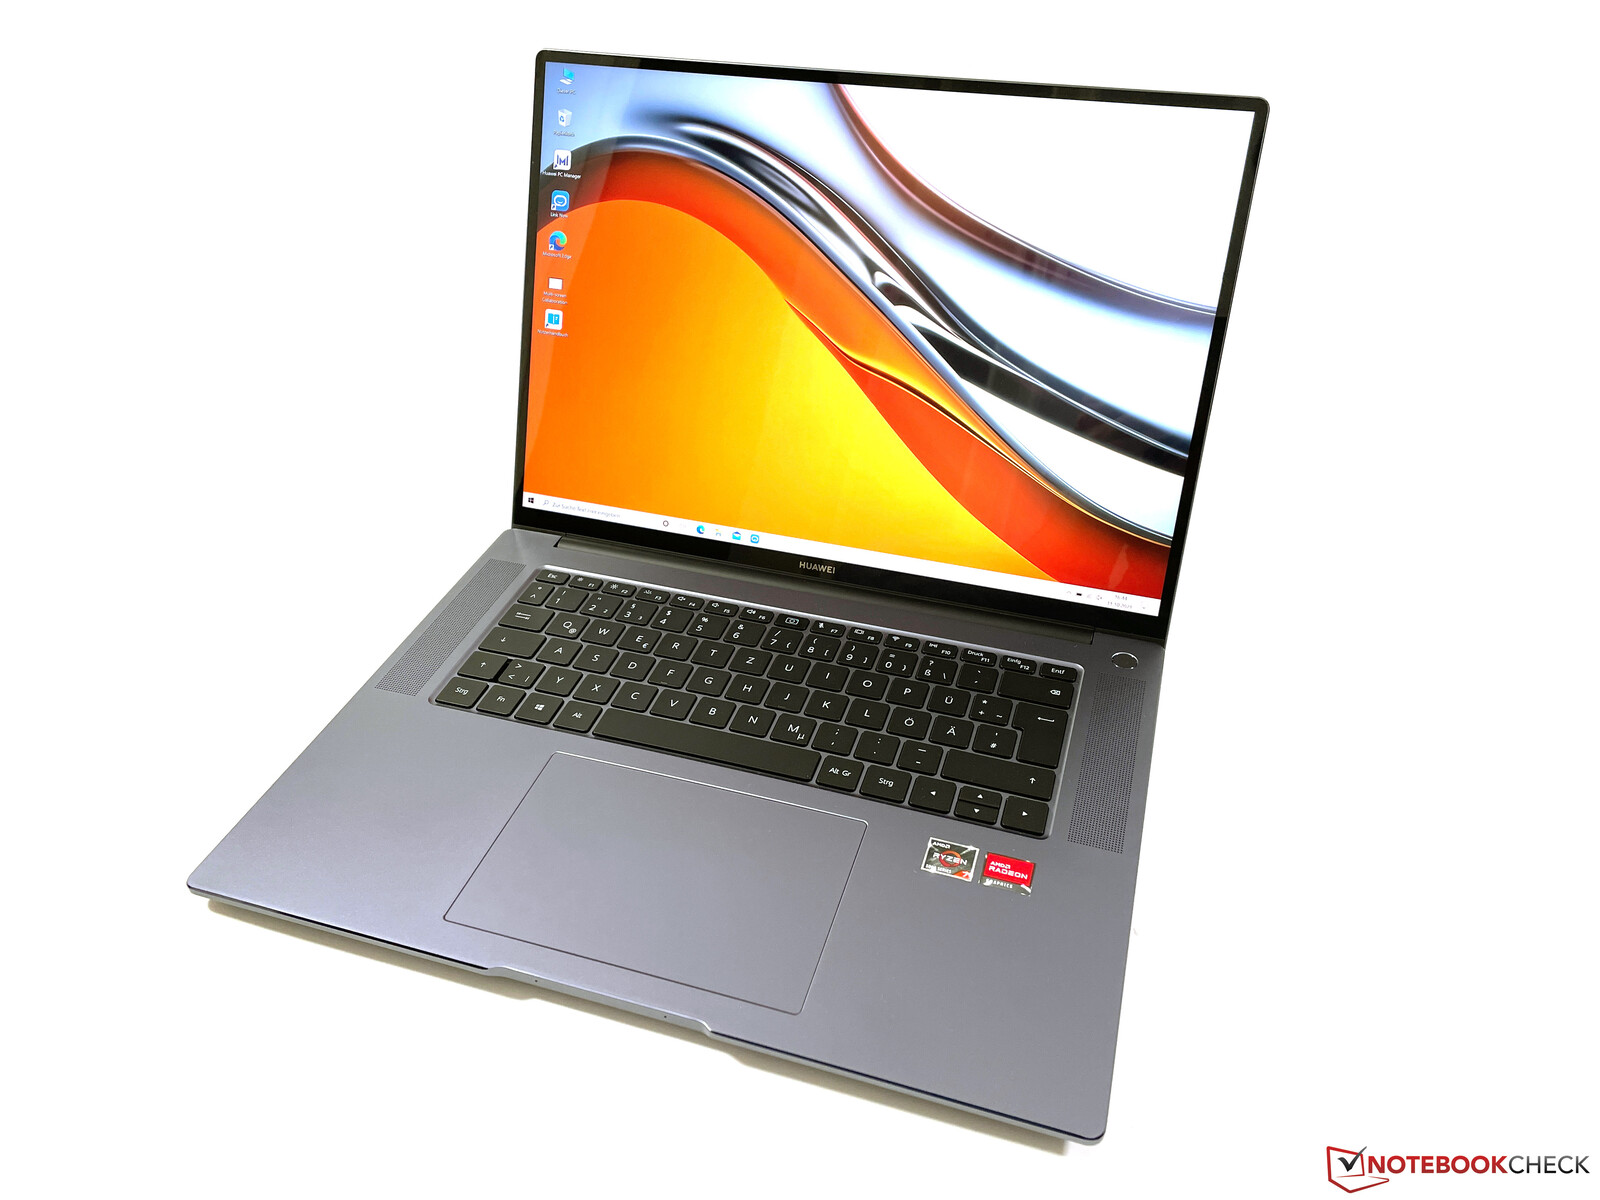
外壳 - MateBook 16采用了有吸引力的铝制外壳
MateBook 16的新铝制外壳相当于MateBook X Pro或新的MateBook 14s就质量而言,它给人的印象比老款的MateBook D16.该设备有一种非常高质量的感觉,做工似乎也很完美。它的设计与其他MateBooks类似,包括一个打开显示盖的小空洞和底座顶部的抛光边缘。该设备的唯一颜色是太空灰。如果光线以某种方式落在表面上,这种颜色,与Apple's Space Gray不同,实际上看起来略带紫色。不是每个人都会欣赏这种颜色的选择,所以我们希望至少有一种其他颜色的选择。显示屏上方和侧面的边框只有5.2毫米宽,这导致屏幕与身体的比例几乎达到90%。
底座和显示屏盖都非常牢固和结实。底座只有在键盘上方的中间位置才会有压力。这不应该以任何方式影响日常使用。铰链调整得很好,但由于3:2的屏幕比例,不能完全弥补显示器相当大和深的事实。笔记本电脑相当容易用一只手打开,但在调整打开角度(最大145度)时,显示屏会轻微晃动。
尽管有16英寸的大面板,MateBook是我们这组对比设备中最窄的设备。其3:2的屏幕比例也使其成为最深的。所有的对比设备在厚度上都非常相似。MateBook是我们的对比表中最重的设备之一,正好2公斤,这并没有使它成为最便携的解决方案。交流适配器又重了400克。
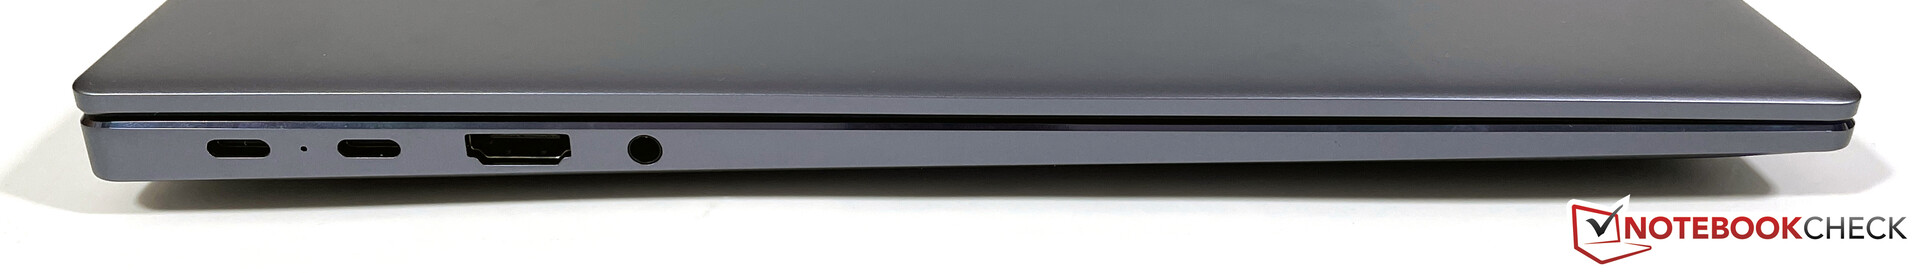
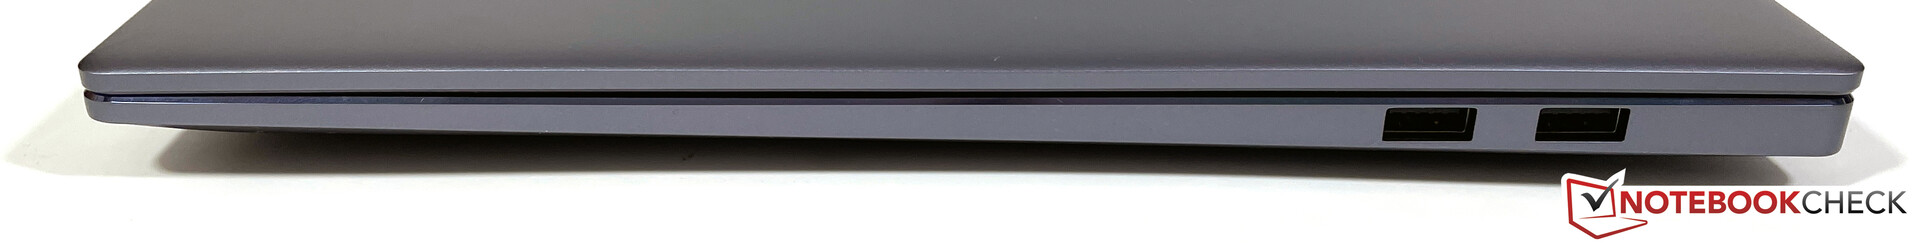
连接性 - 华为选择了USB-C和USB-A
华为已经决定为其MateBook 16配备USB C端口(可用于充电)和USB A端口。这非常有用,因为用户不需要求助于适配器。HDMI端口支持2.0标准,这意味着该设备可以连接到高达60赫兹的4K显示器。
沟通
华为选择为MateBook 16配备著名的英特尔Wi-Fi模块AX200,支持目前的Wi-Fi 6标准(802.11ax),频率为160赫兹,以及蓝牙5.1。我们用Netgear Nighthawk RAX120路由器进行的标准化Wi-Fi测试结果是非常好的传输速率,我们可以根据我们在使用该设备时的经验确认这一点。我们在速度或信号方面没有遇到任何限制。该设备与AVM Fritz!Box 7590(Wi-Fi 5,802.11ac)的表现一样好。
网络摄像头
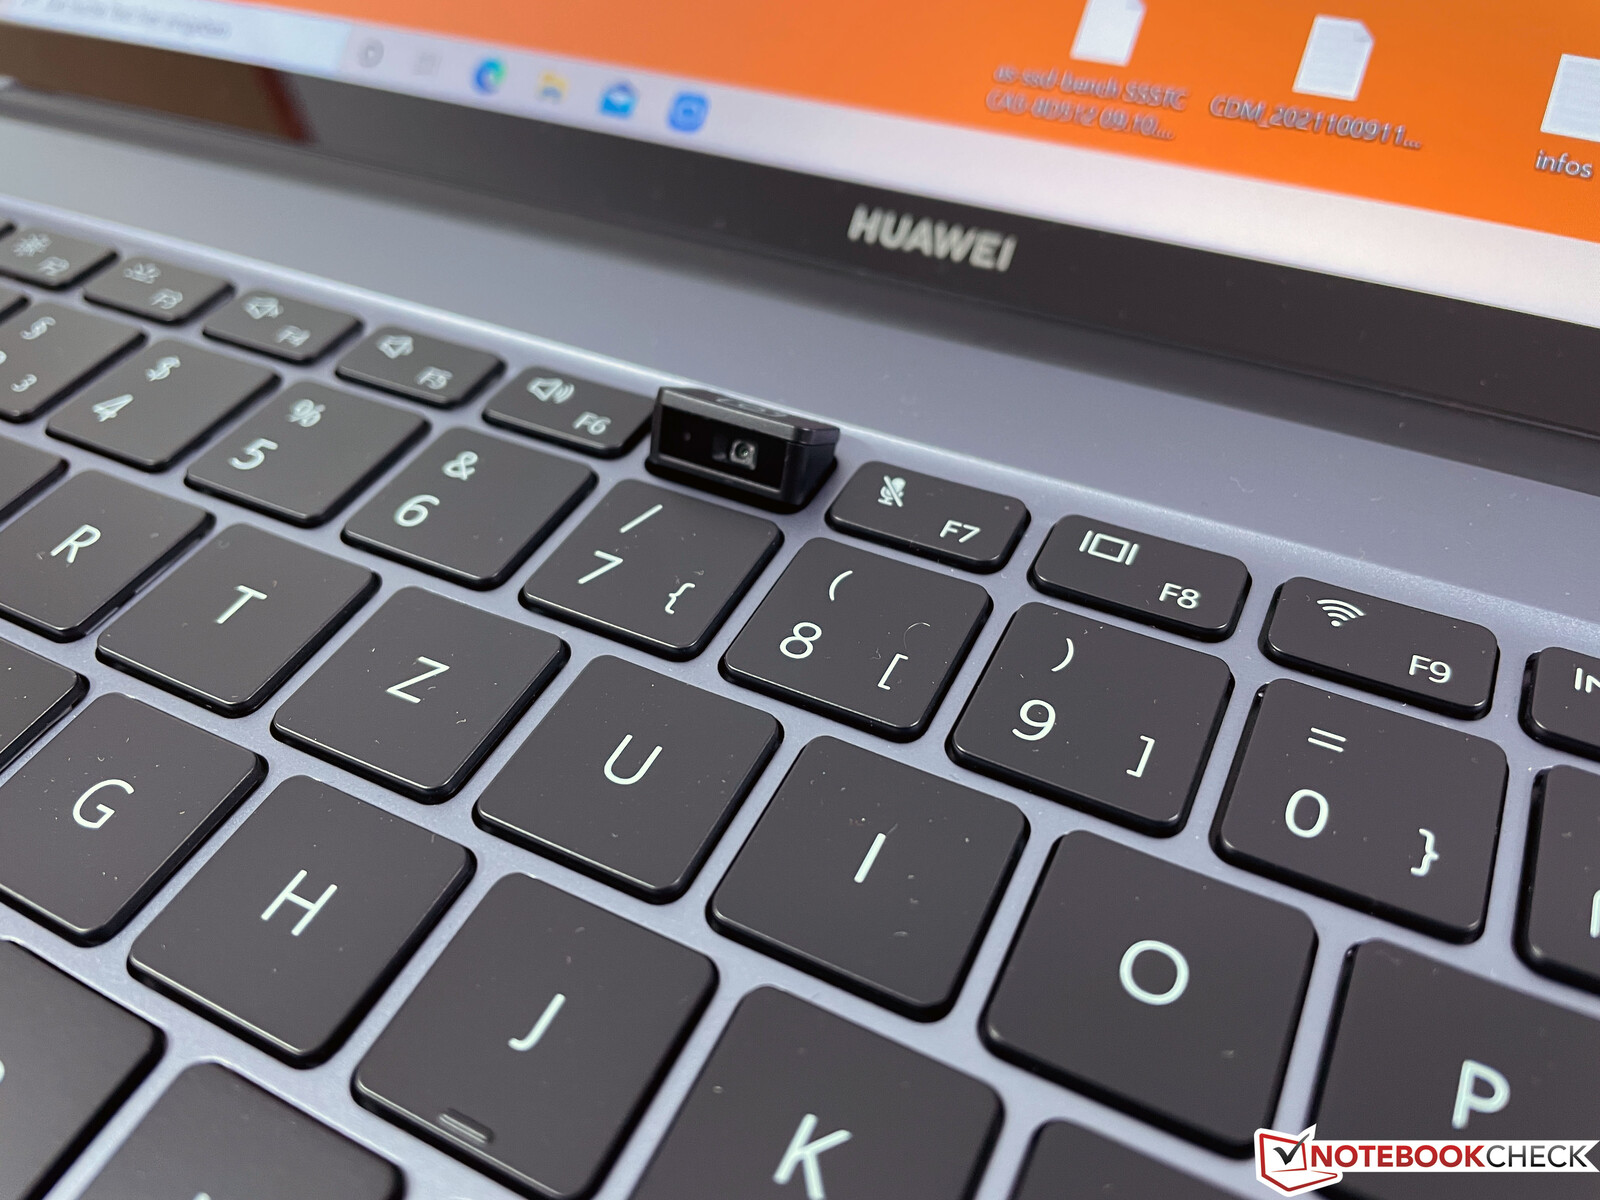
虽然华为为新的MateBook 14s将网络摄像头重新定位到屏幕的顶部,但这并不意味着华为的网络摄像头就会消失。 MateBook 14s但制造商将MateBook 16的网络摄像头保持在键盘顶排的通常位置。这在安全方面是很好的,但导致了一个相当扭曲的视角。即使在光线良好的情况下,720p传感器的质量也相当微薄。


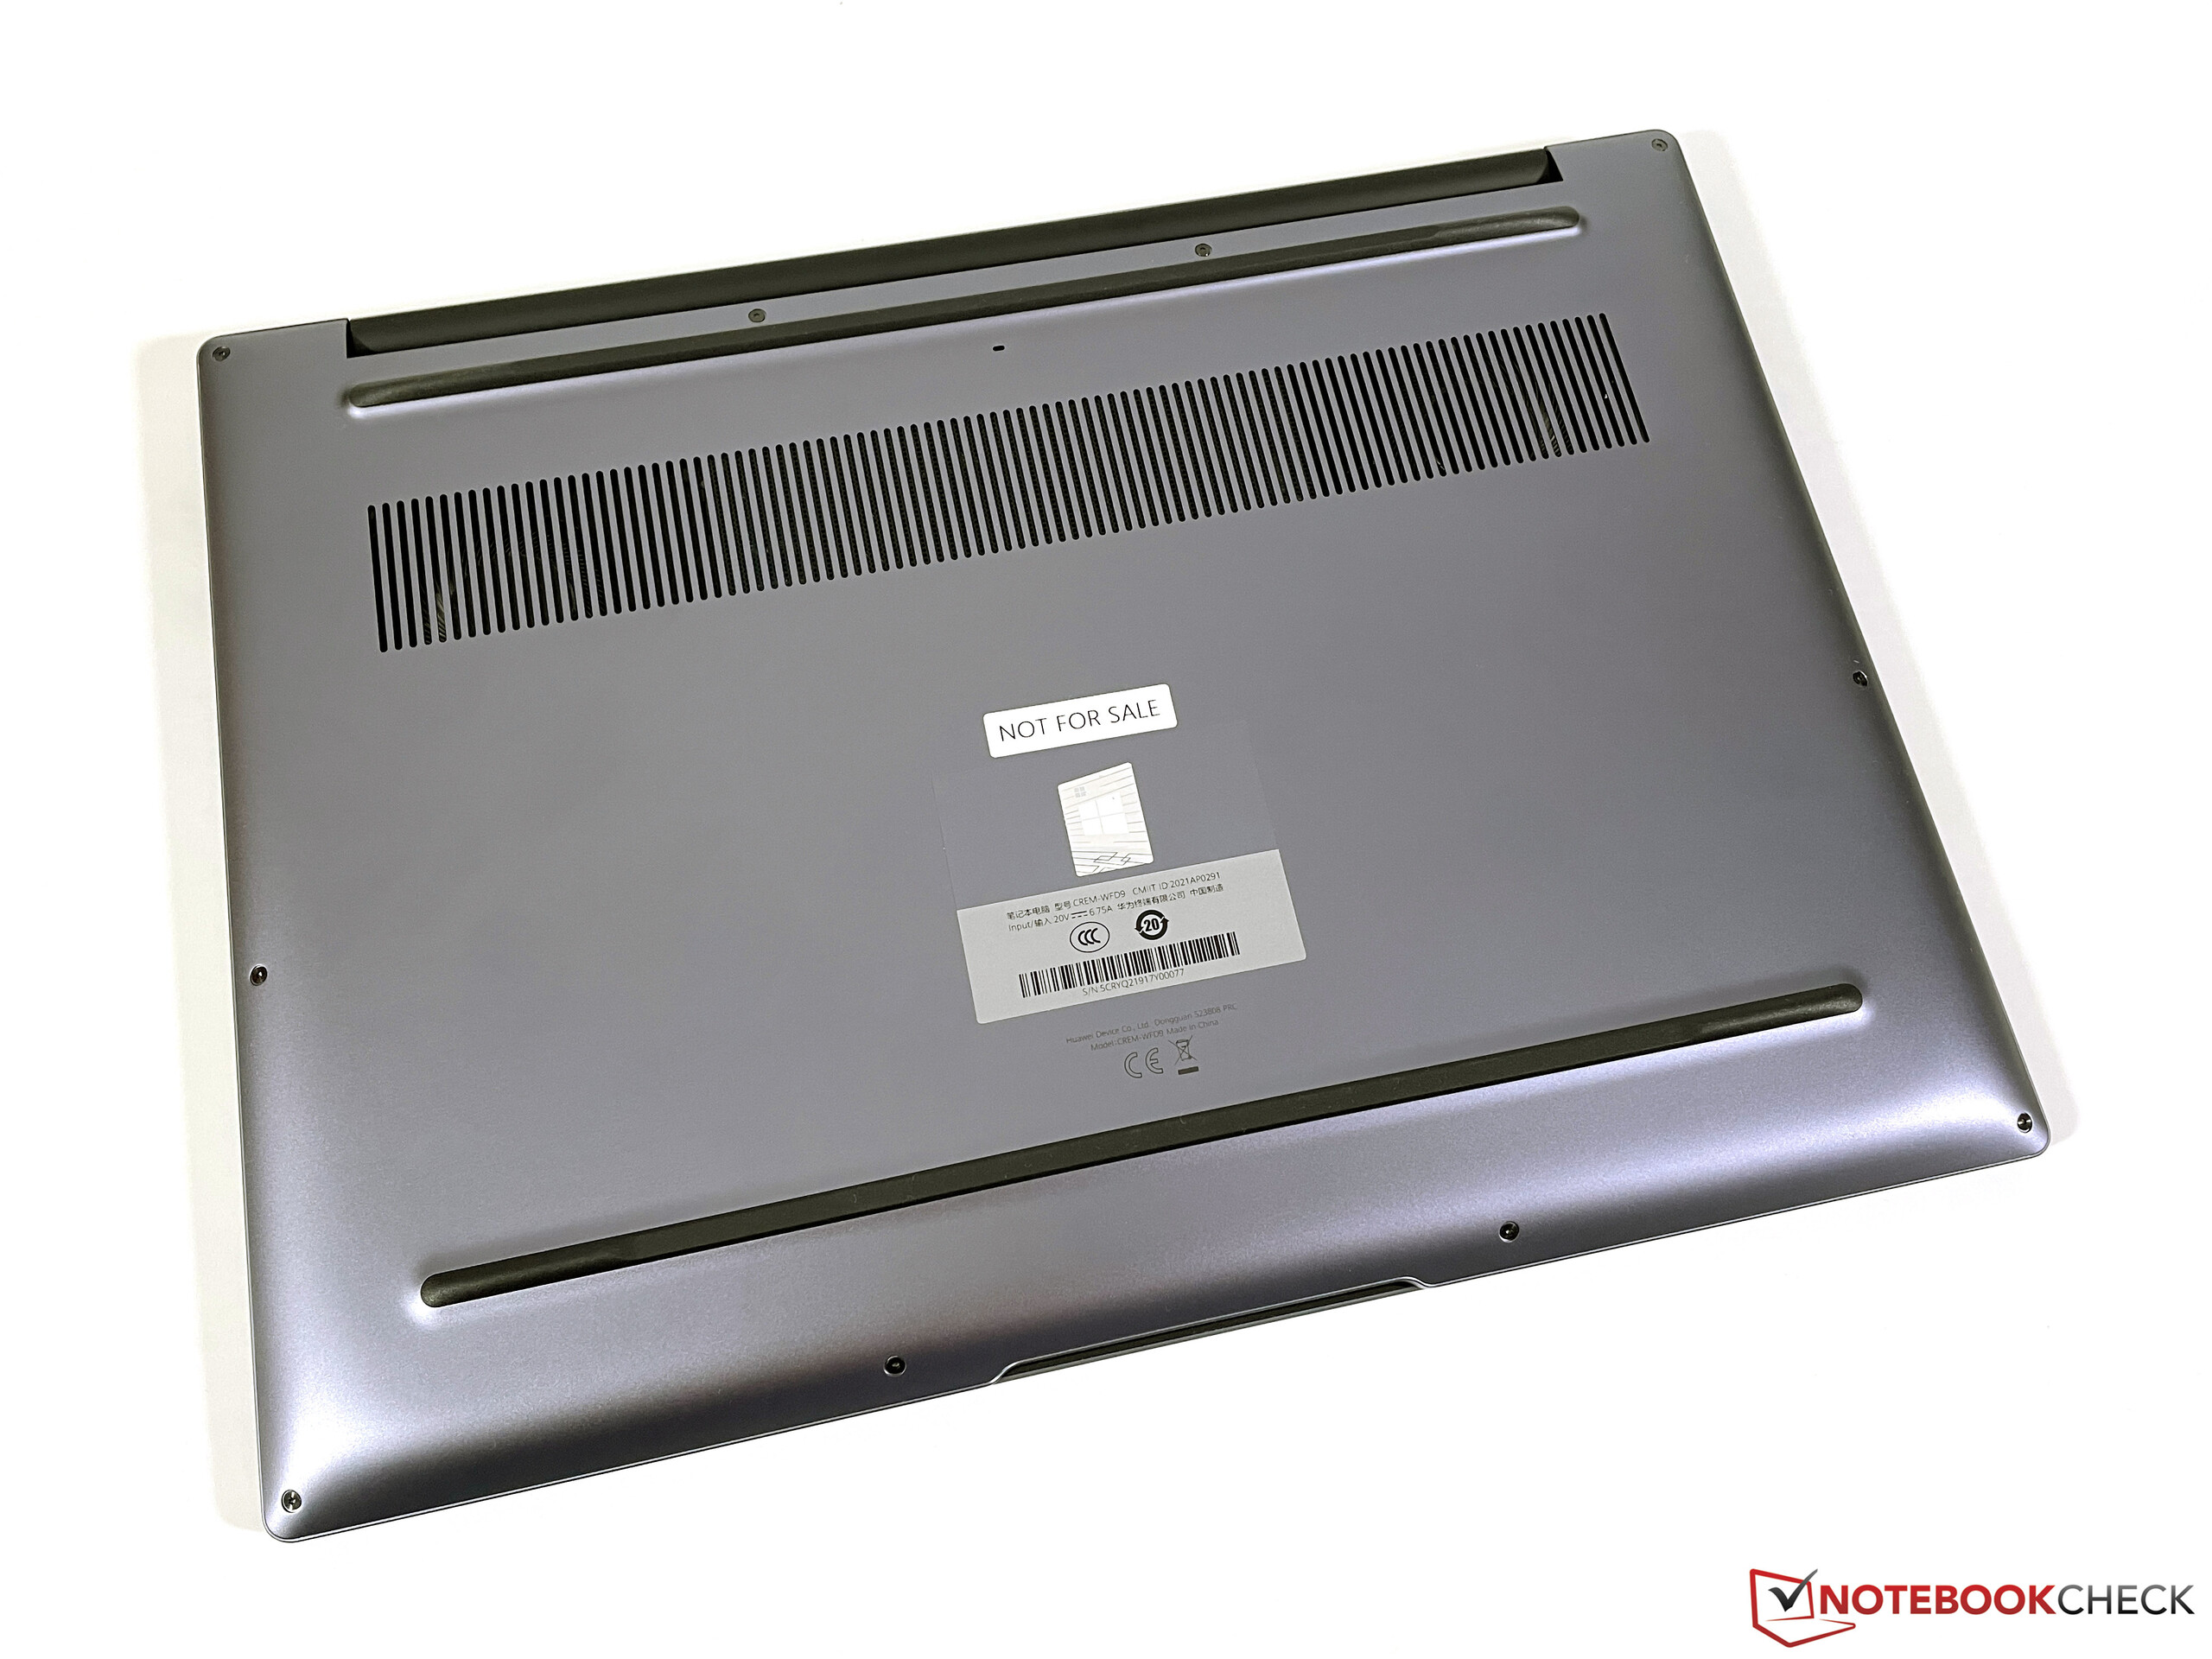
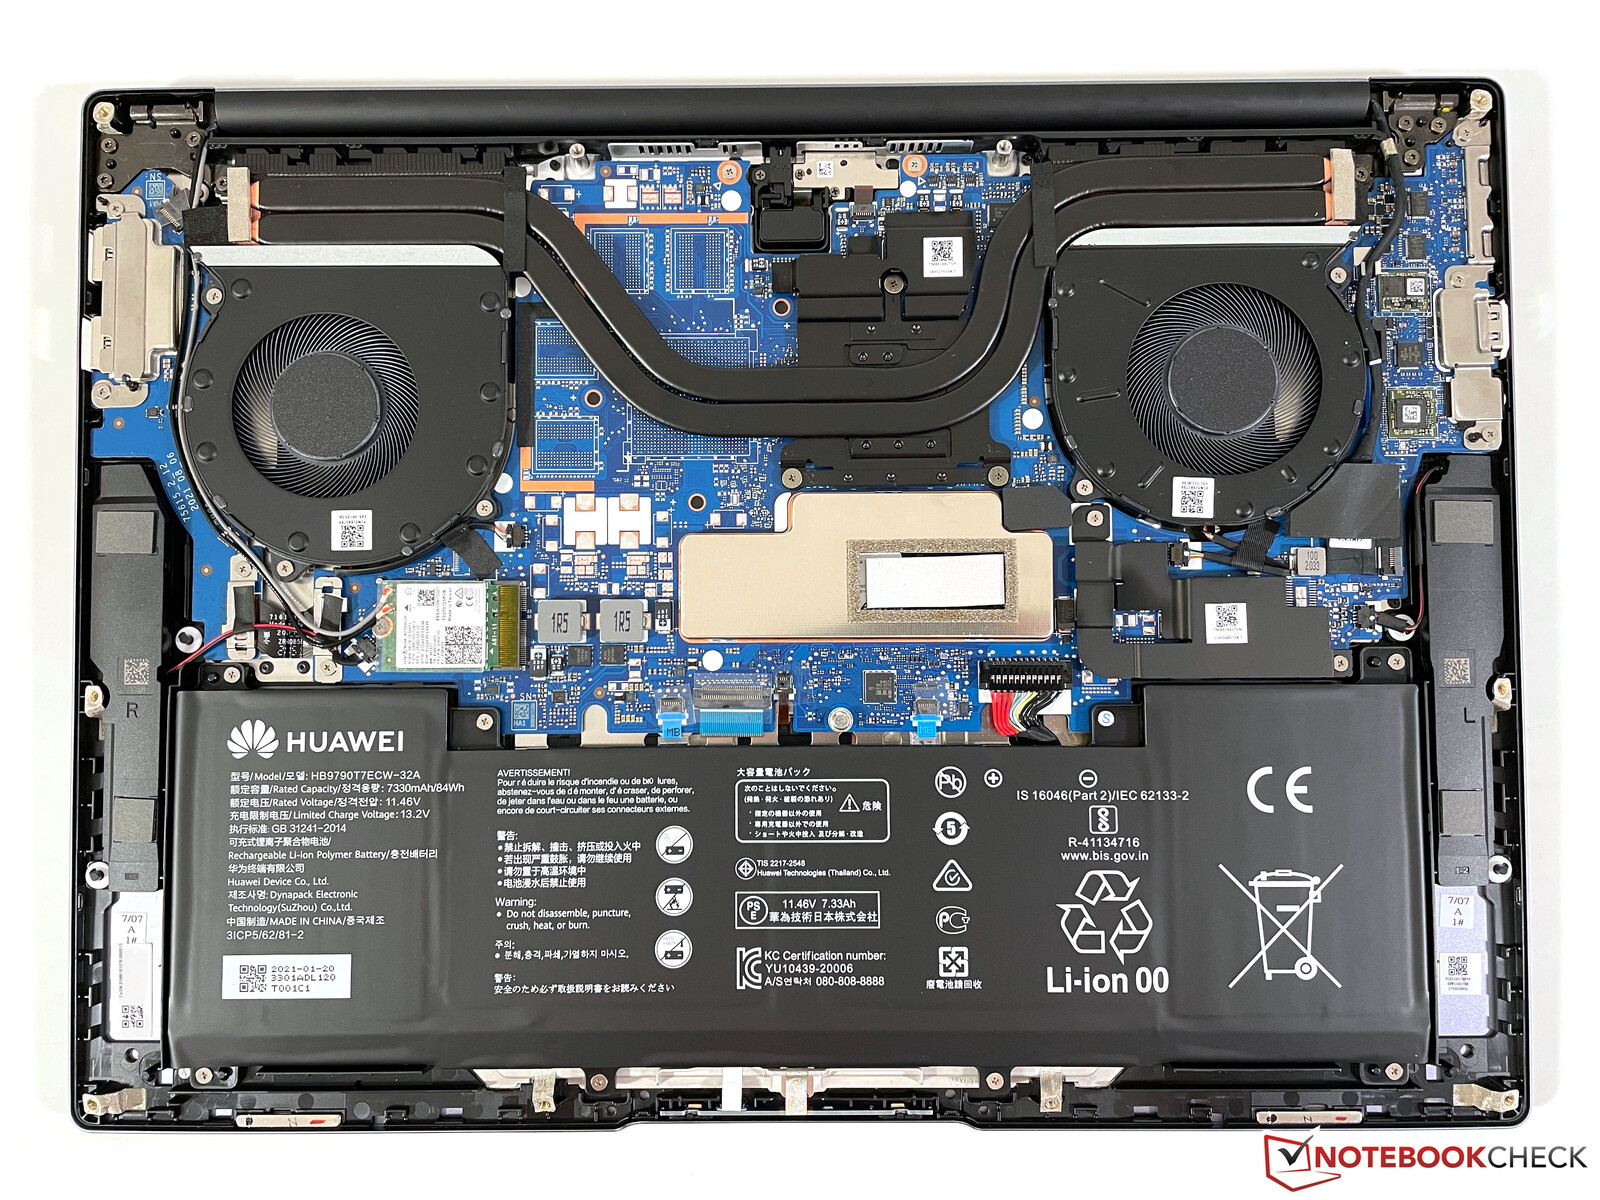
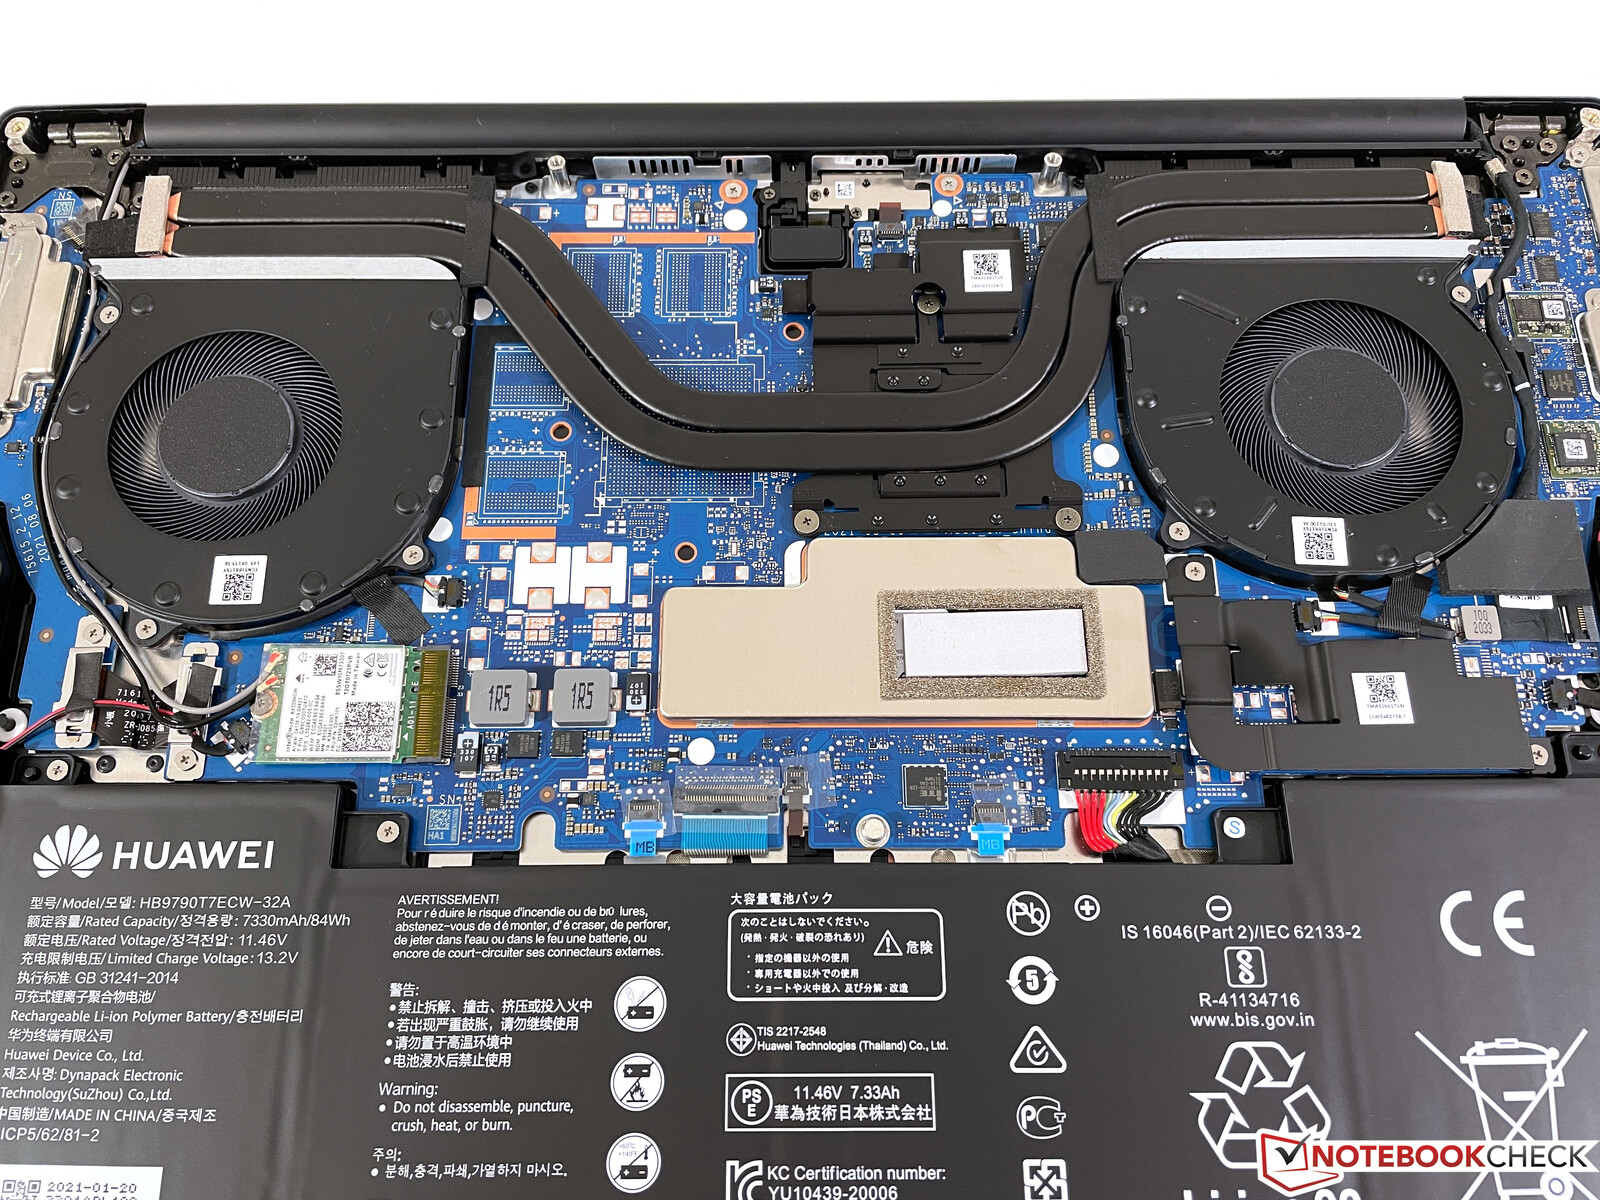
维护
基本单元的底部只用几颗Torx T6螺丝固定,很容易拆卸。内部没有什么可做的--只有Wi-Fi模块和M.2 2280固态硬盘(在另一块金属板下面,可以很容易地取下)可以被替换。内存模块是焊接的,不能升级。
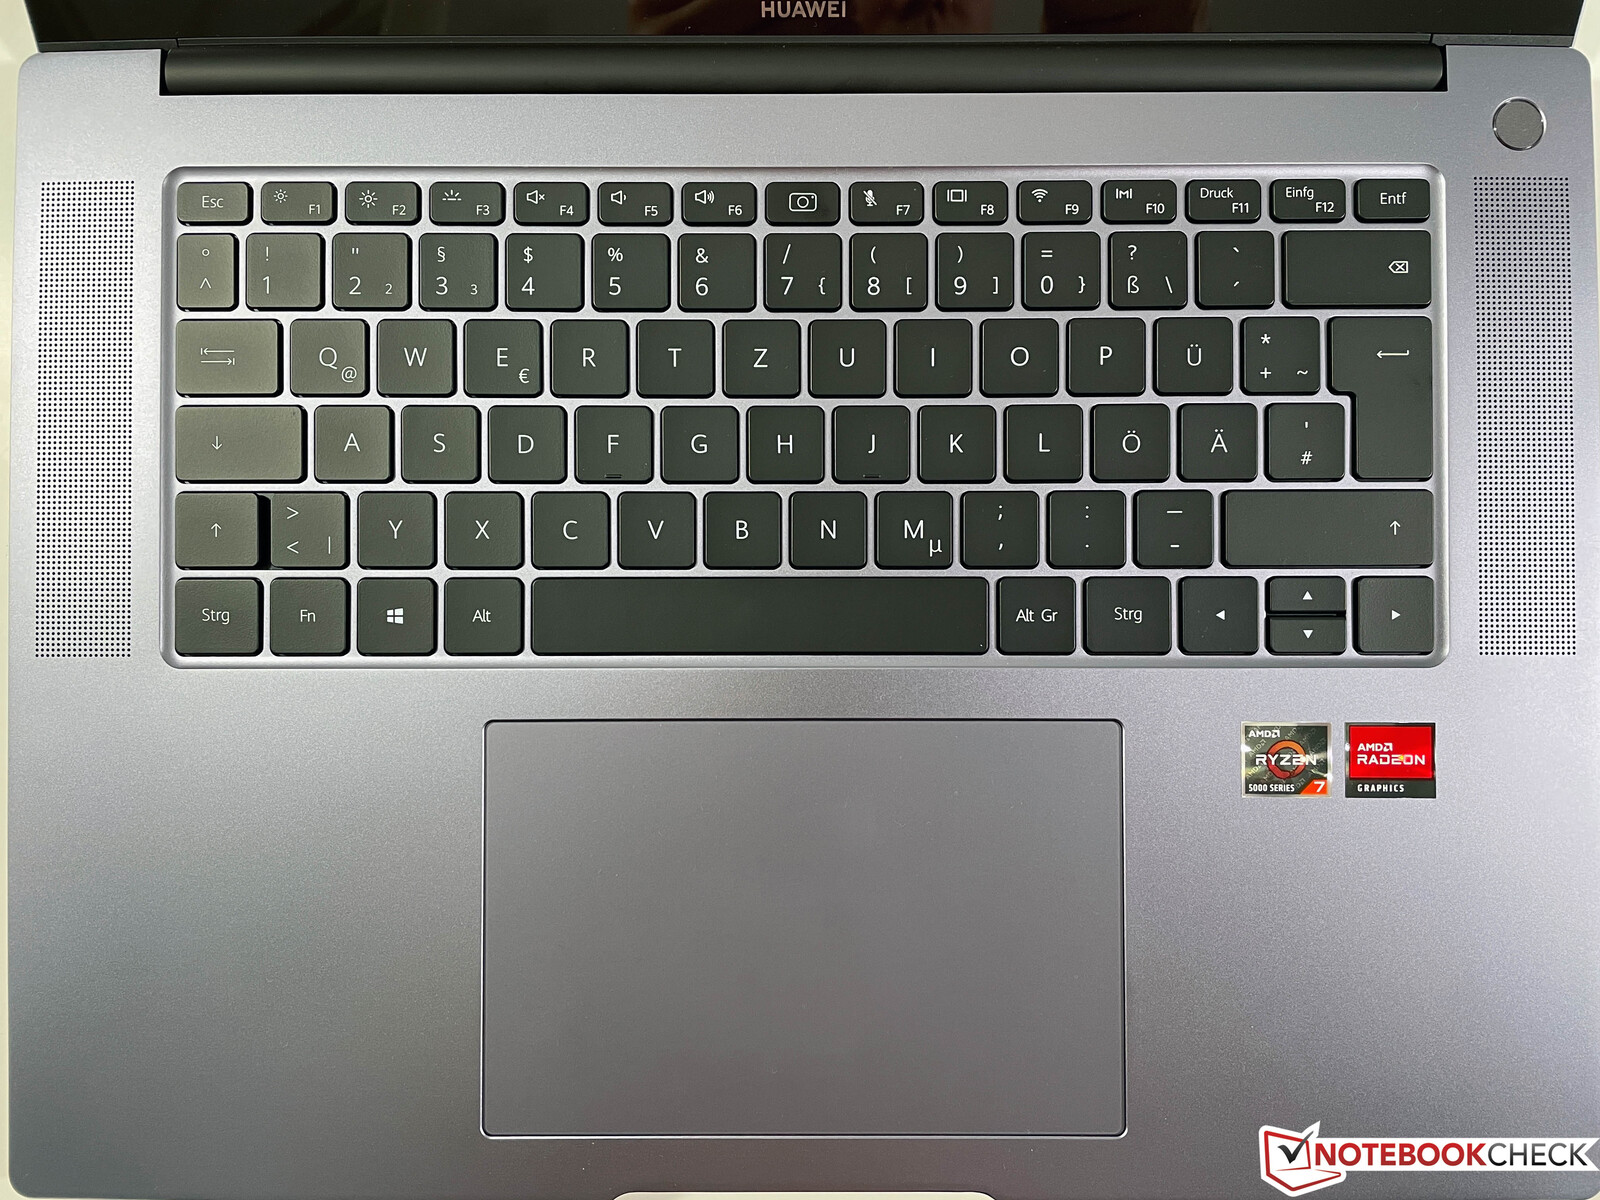
输入设备 - 背光和一个指纹扫描仪
键盘
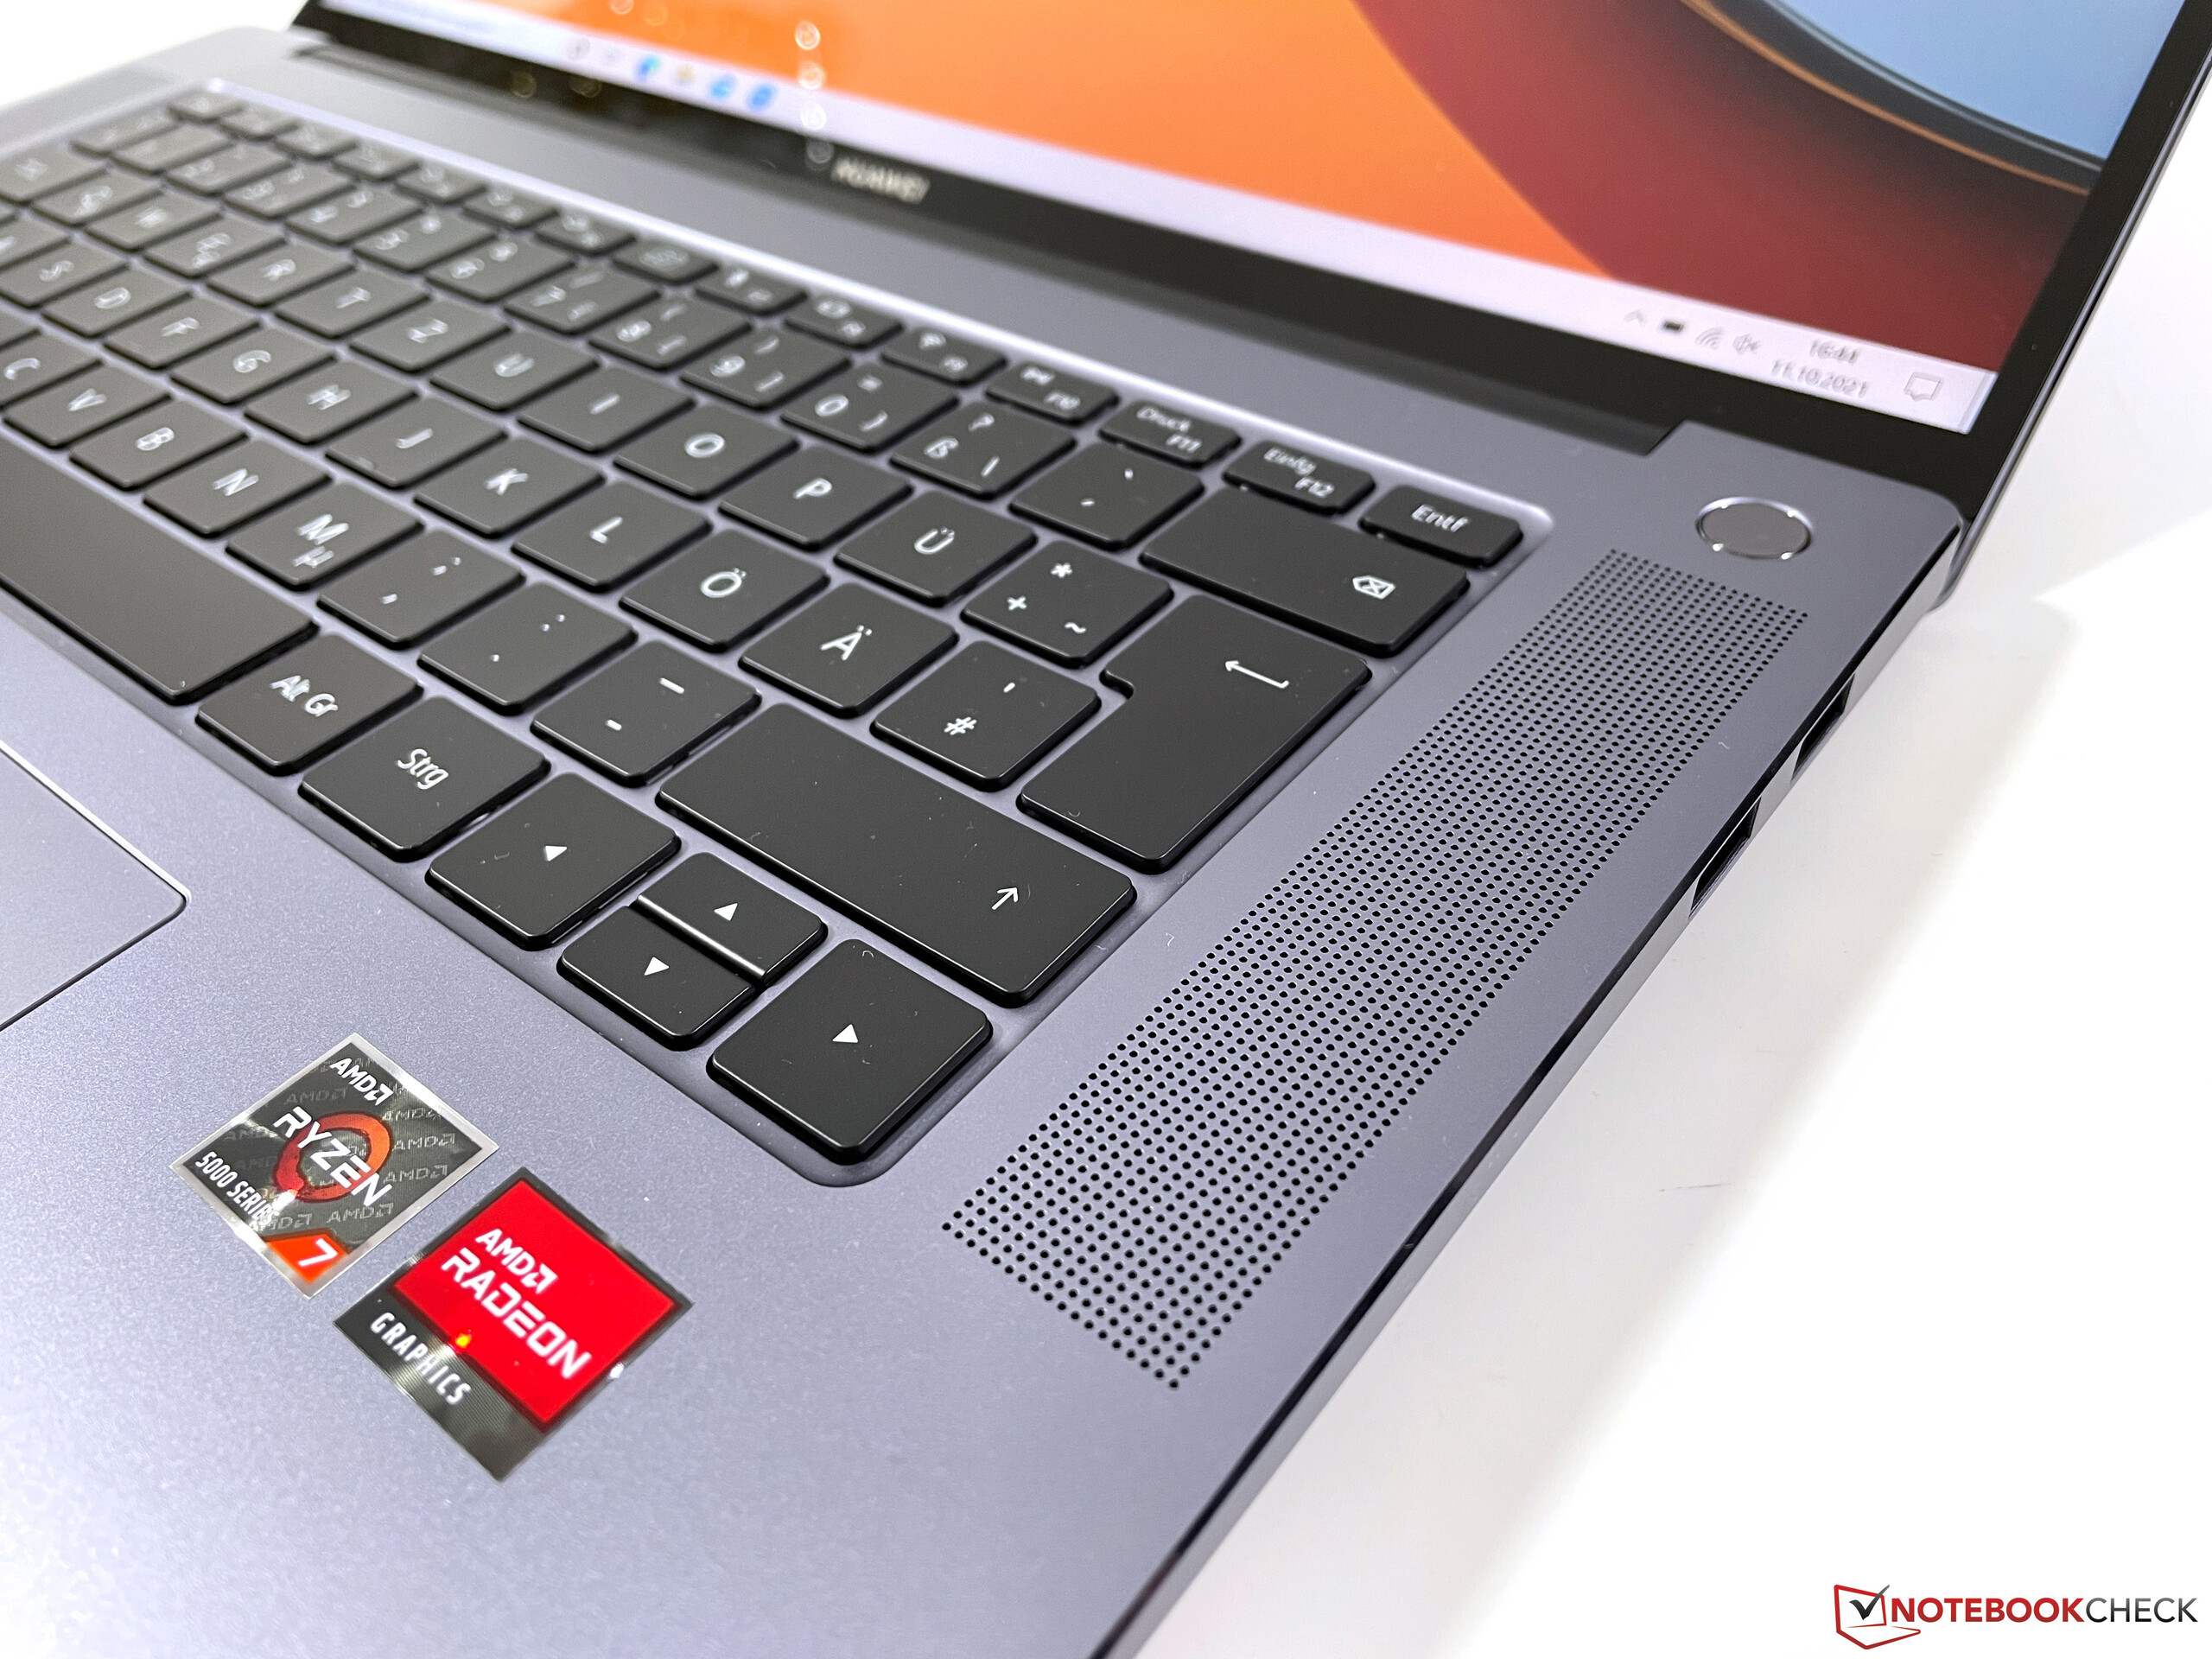
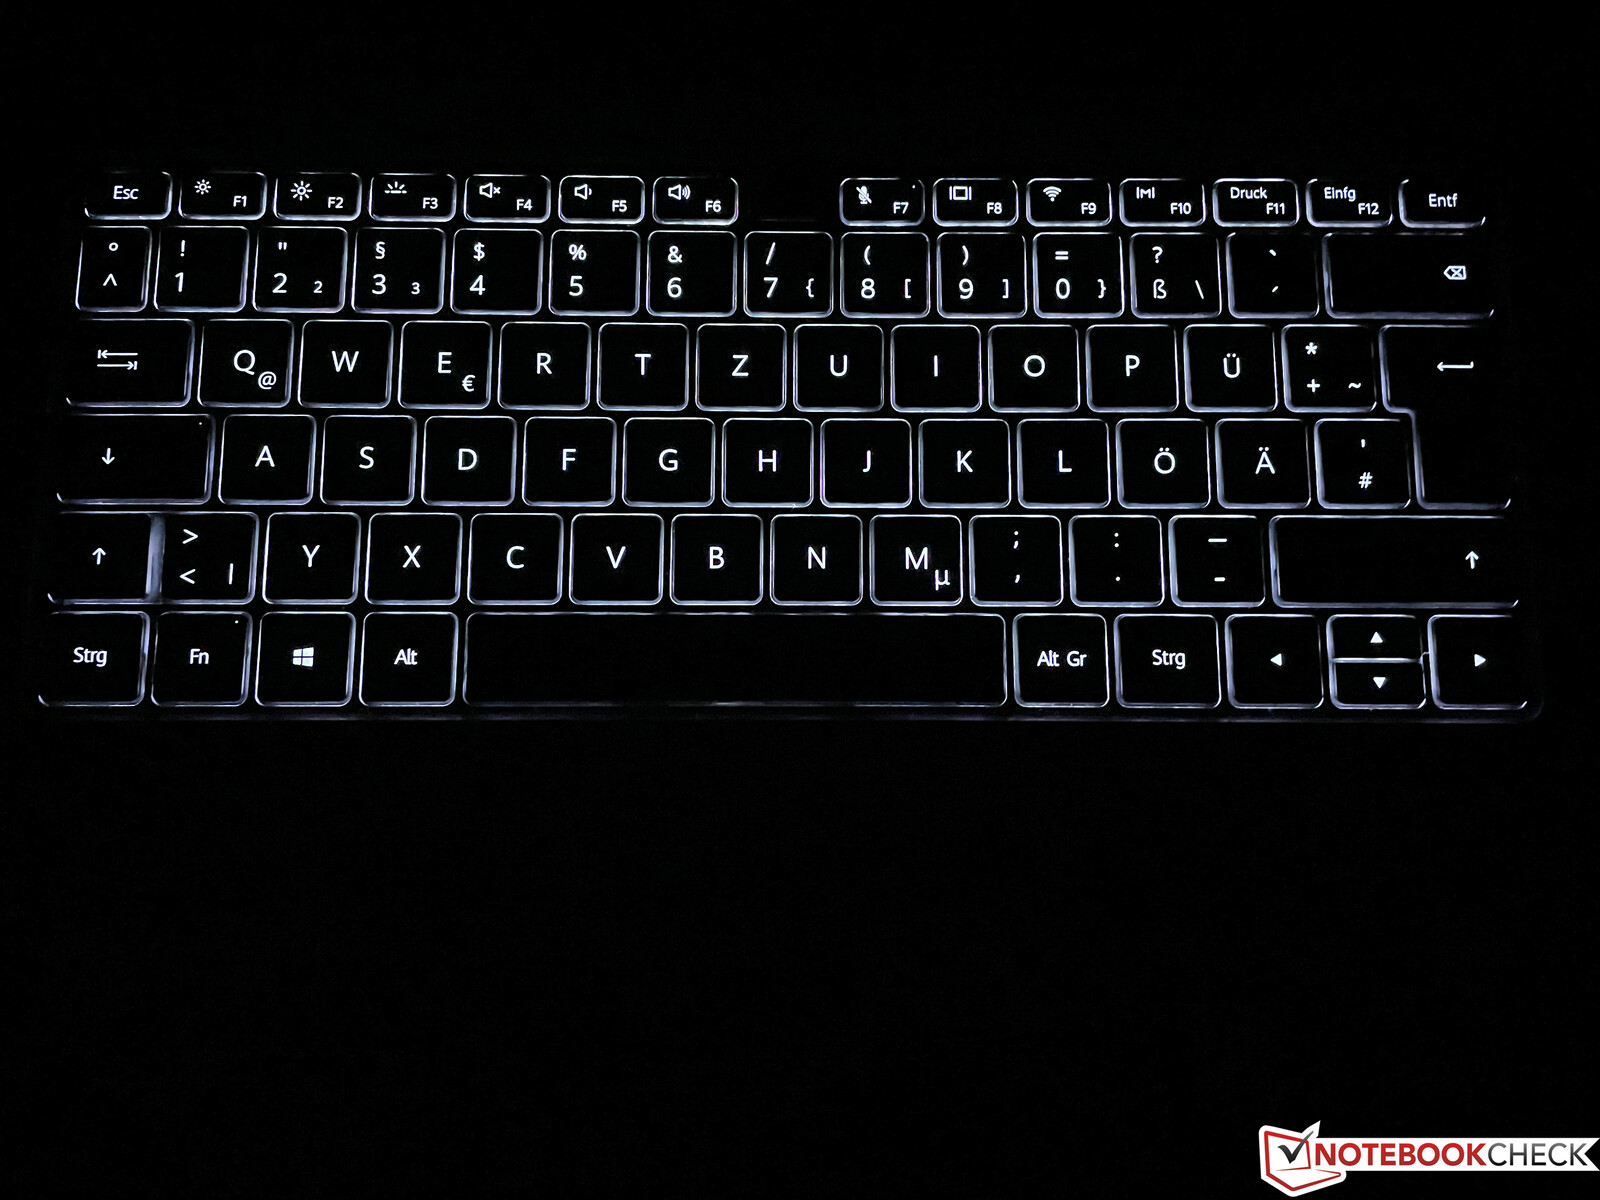
华为为MateBook 16配备了著名的黑色chiclet键盘,没有专门的数字键盘。幸运的是,键盘两侧的可用空间并没有被浪费,因为制造商将其用于扬声器。打字体验一般,压力点均匀而明显。键盘非常安静,尽管有些键的响声比其他键大。键盘的底座可能并不完全平整。外面肯定有更好的键盘,特别是在看专业笔记本电脑时,但MateBook 16仍然完全可以接受,即使你花很多时间打字。
键盘配备了白色两层背景照明,用于在黑暗环境中工作。用户可以通过预装的PC管理器(可按F10键进入)将背光设置为在非活动期间自动关闭。电源按钮位于键盘外侧,有一个集成的指纹扫描仪,在我们的测试中工作可靠而迅速。
触摸板
ClickPad非常大,为14 x 9.1厘米,为最多四个手指的手势提供了足够的空间。手指很容易在垫子上滑行。与许多设备的情况一样,集成键发出的噪音有点太大,这稍微影响了整体的高质量印象。我们建议简单地使用点按来避免这个问题。
显示器 - 2.5K IPS,屏幕比例为3:2
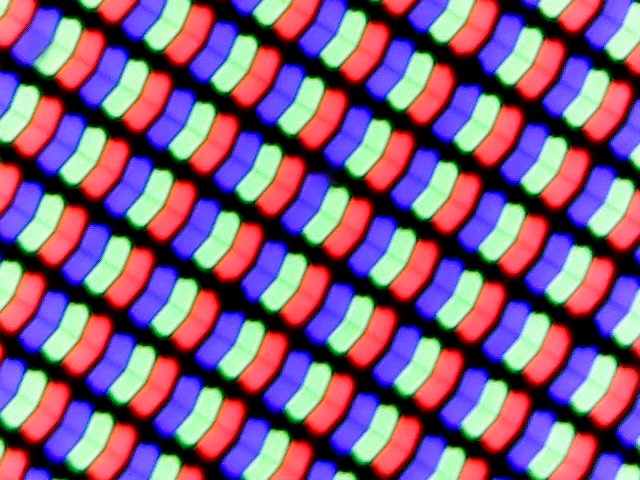
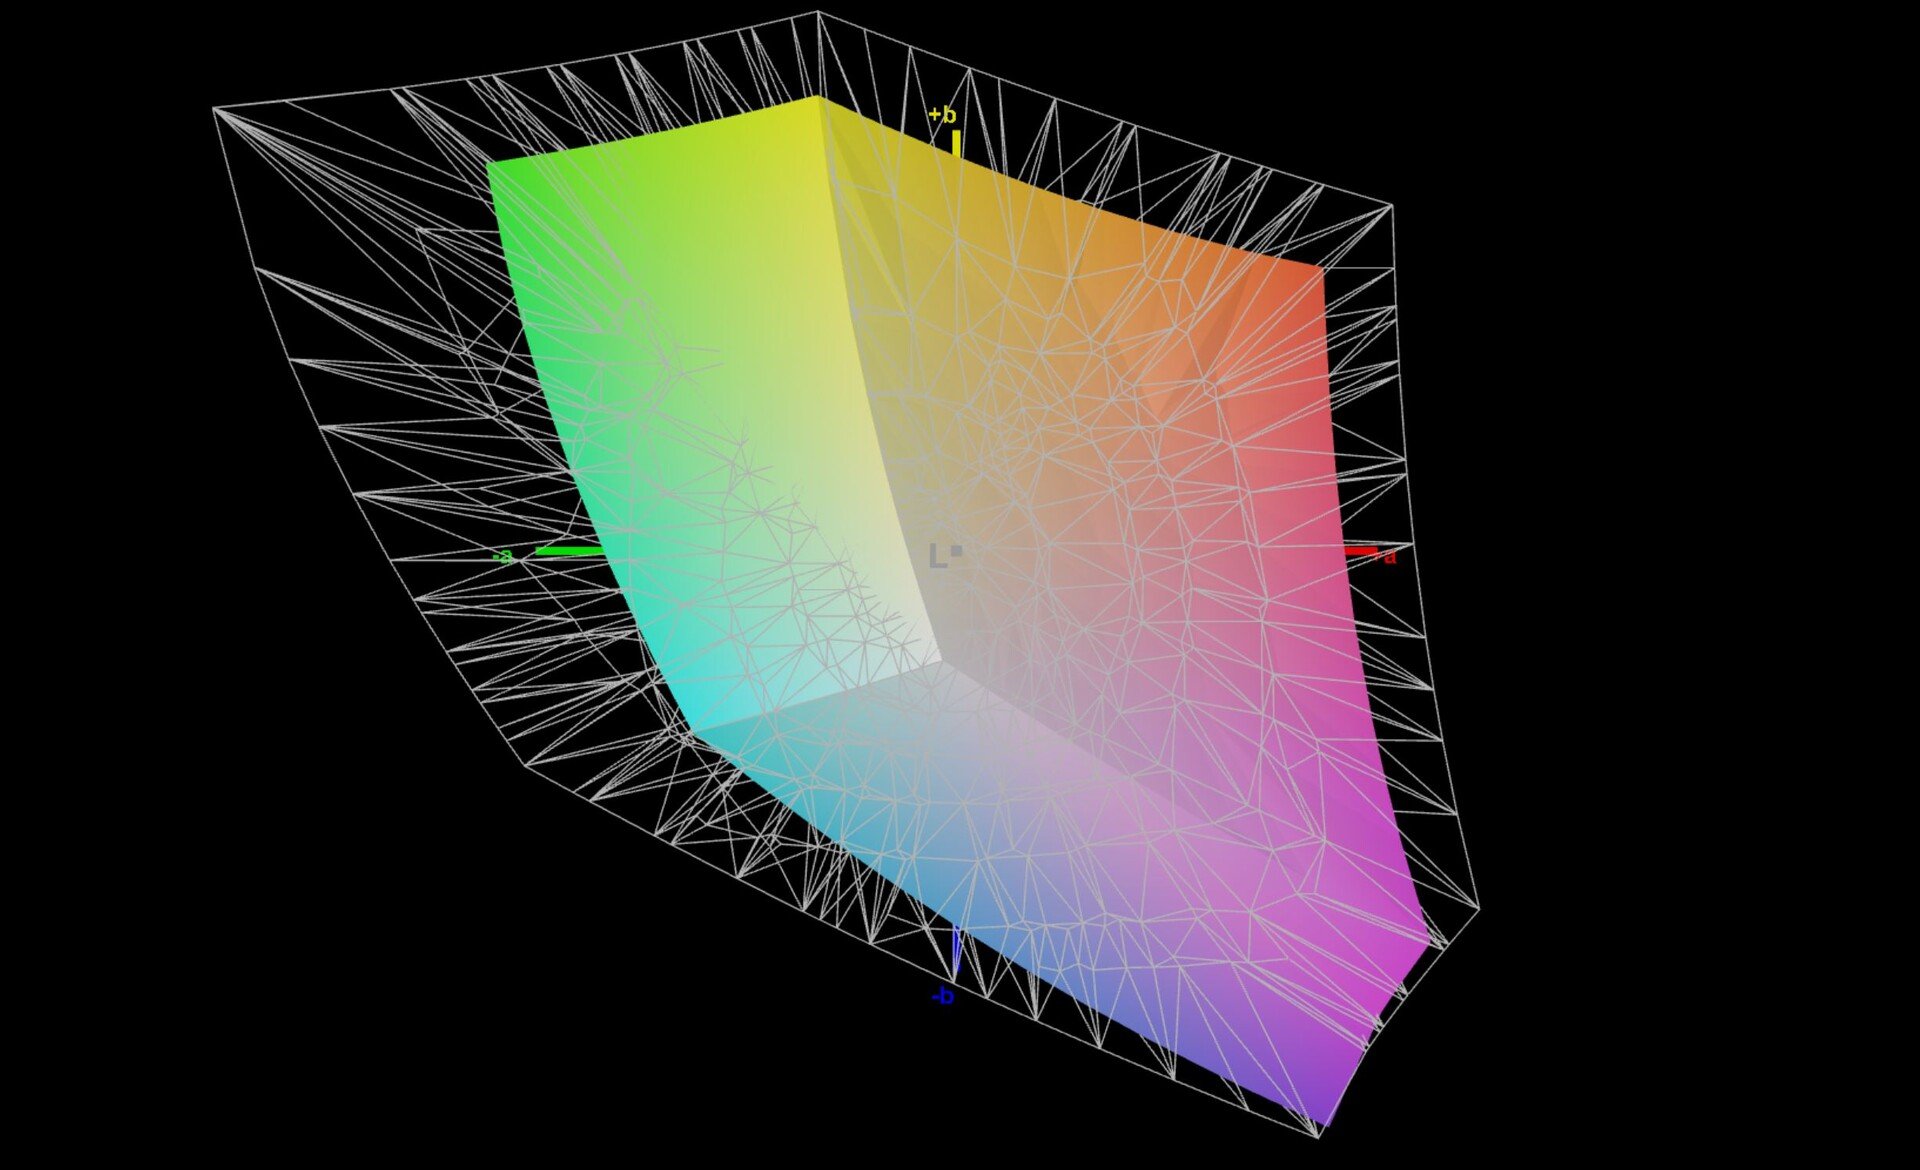
与其他华为机型类似,新的MateBook 16配备了一个屏幕比例为3:2的面板。16英寸面板有2520 x 1680像素,因此像素密度为189 DPI。从主观上看,反射式显示屏给人留下了很好的印象。屏幕内容显示得非常清楚,色彩也很强烈。京东方IPS面板的可视角度稳定性非常好。
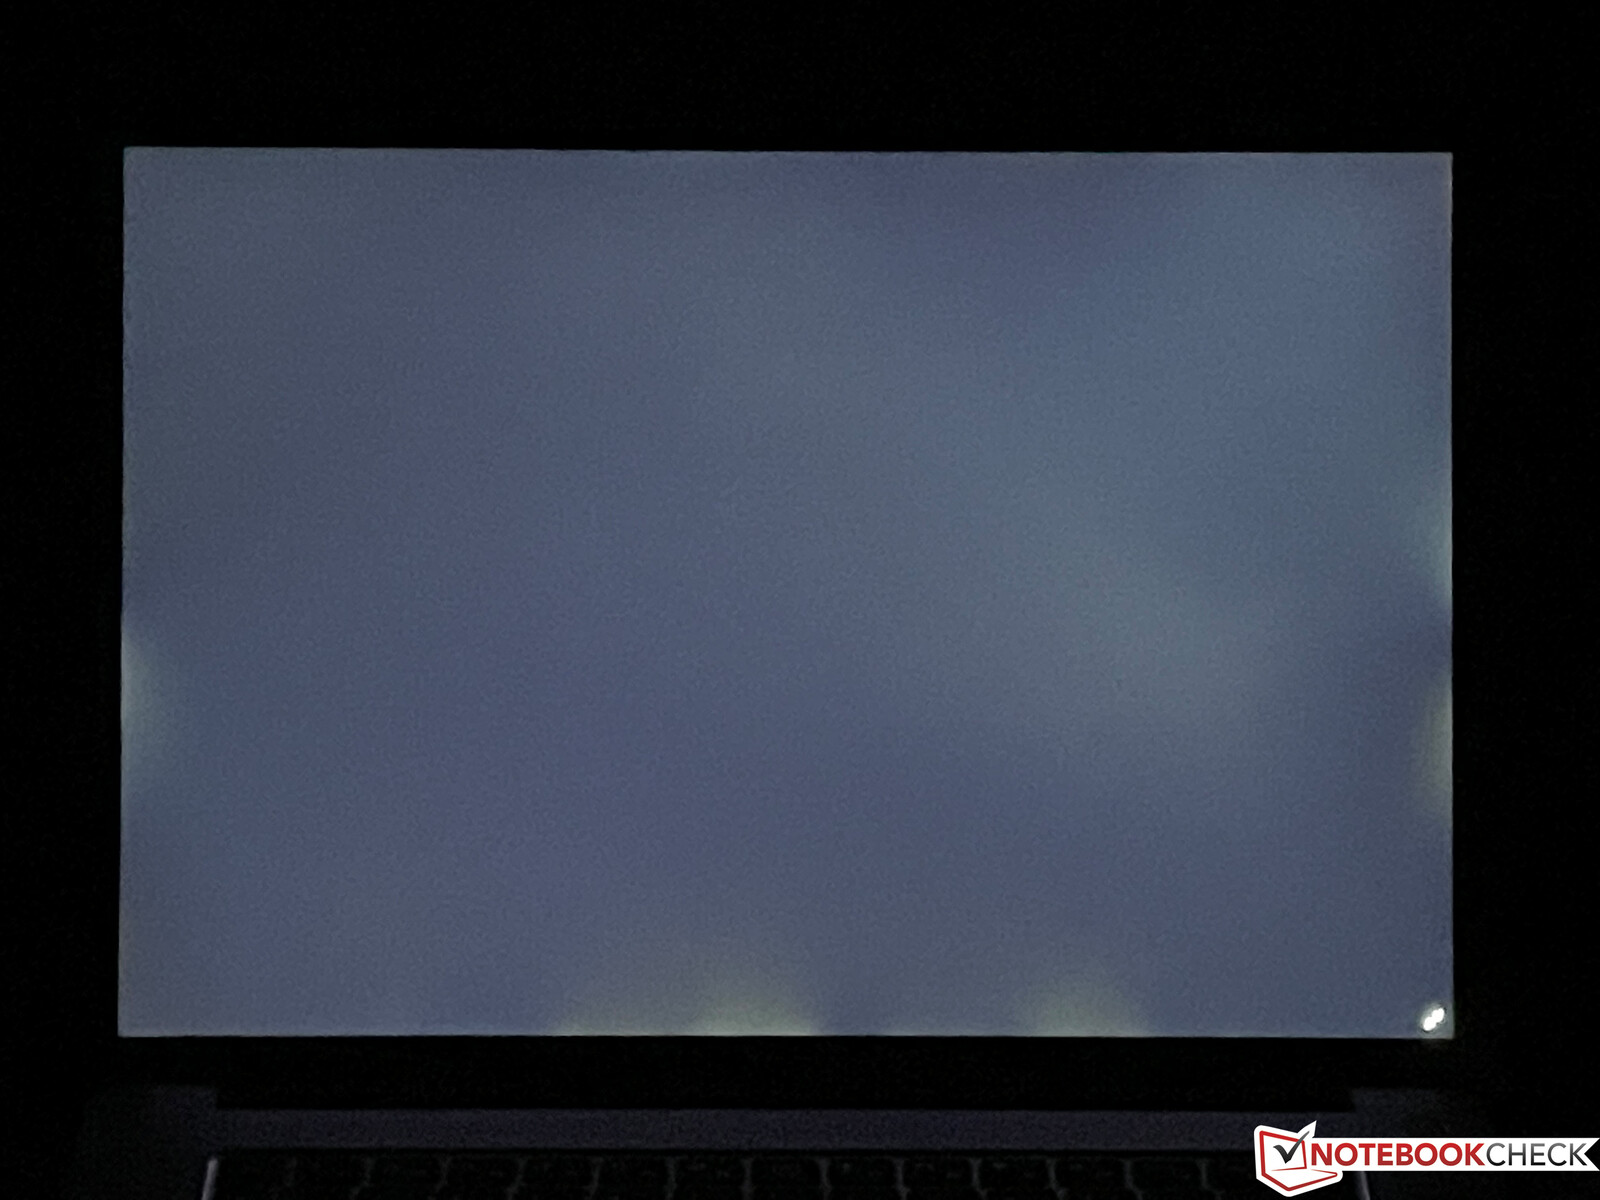
根据技术数据表,华为MateBook 16的亮度为300尼特。我们的面板实际上以平均350尼特居首。黑值很低,这相当于1700:1的非常好的对比度。在最大亮度下,沿边缘有一些背光渗出。这在日常使用中不是一个问题,只有在显示比例为16:9的视频时沿底部可见。我们没有发现任何PWM闪烁。
| |||||||||||||||||||||||||
Brightness Distribution: 93 %
Center on Battery: 354 cd/m²
Contrast: 1700:1 (Black: 0.21 cd/m²)
ΔE ColorChecker Calman: 1.6 | ∀{0.5-29.43 Ø4.71}
calibrated: 0.6
ΔE Greyscale Calman: 2.4 | ∀{0.09-98 Ø4.96}
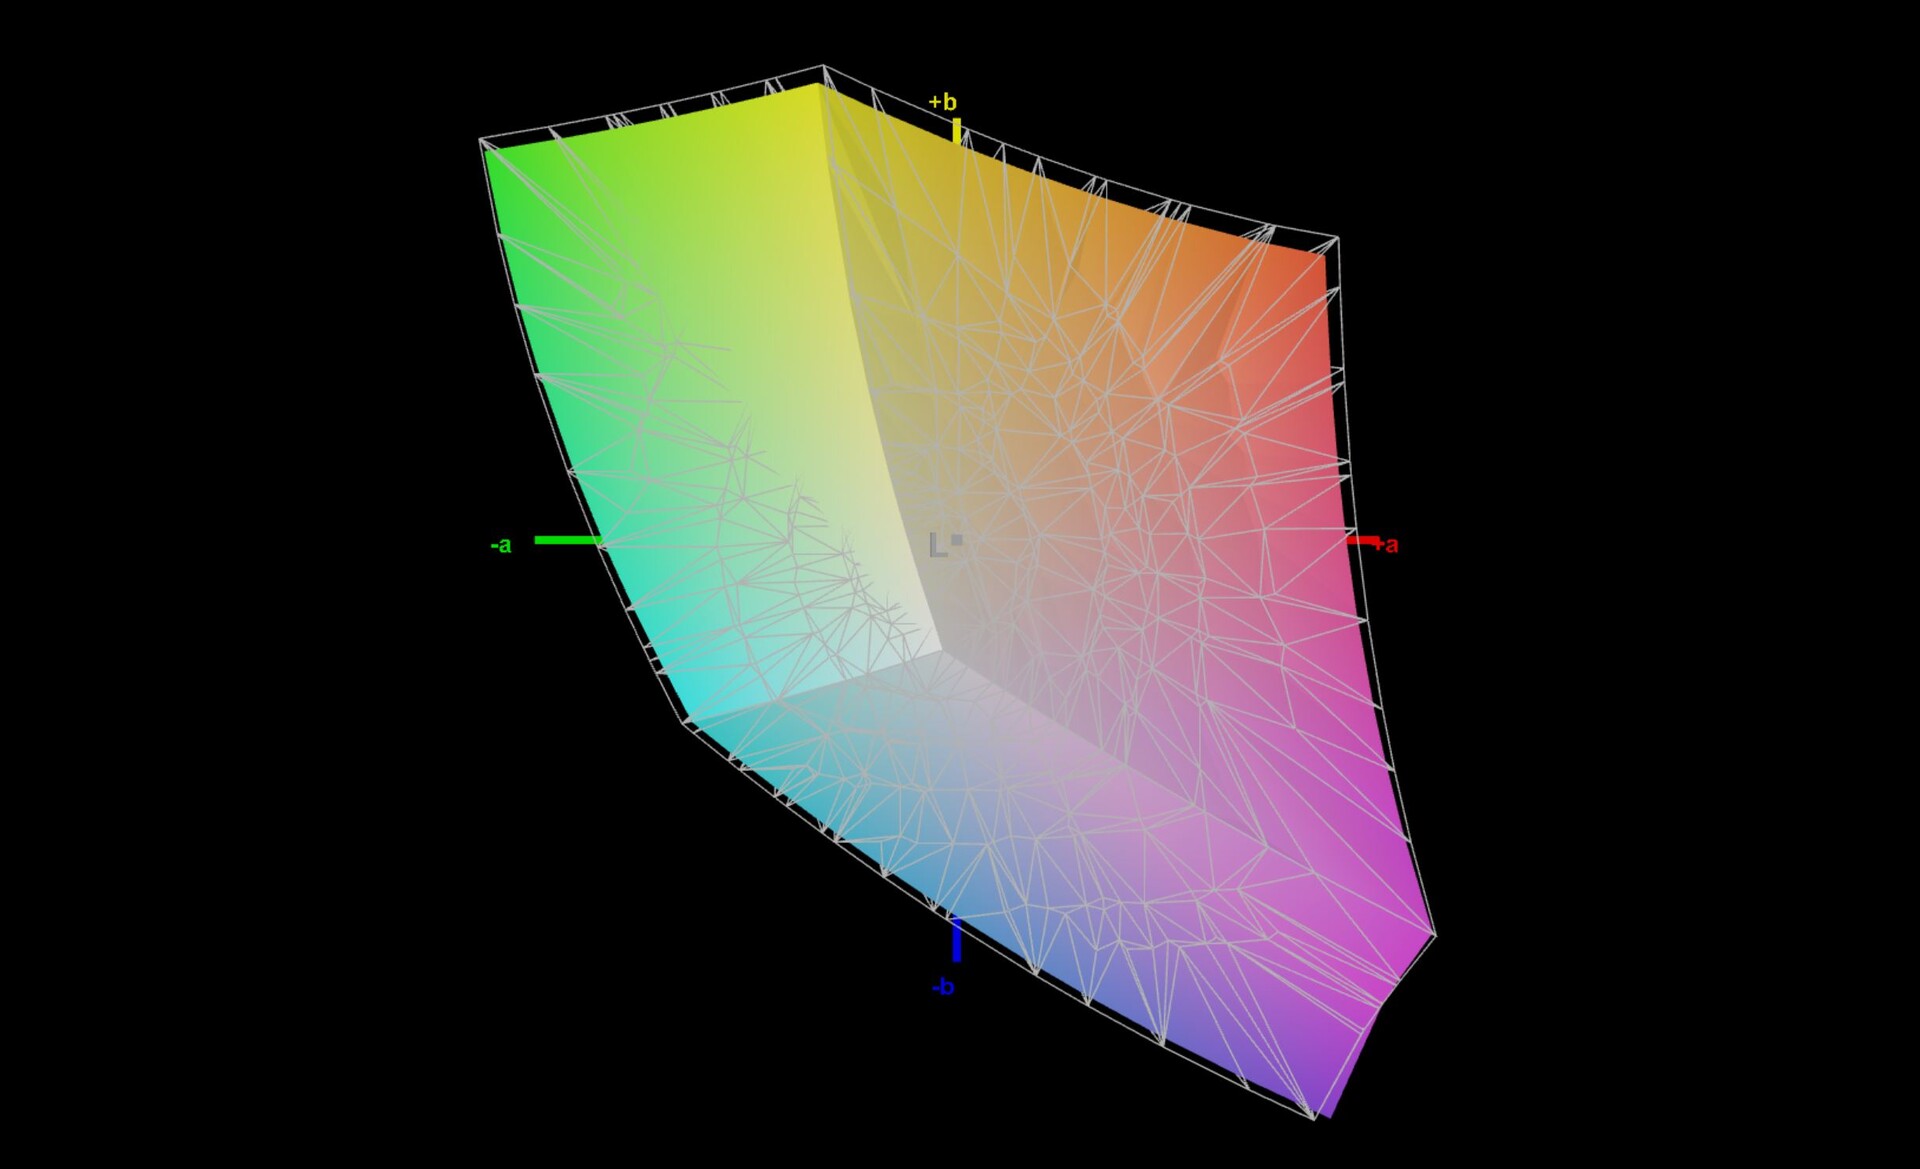
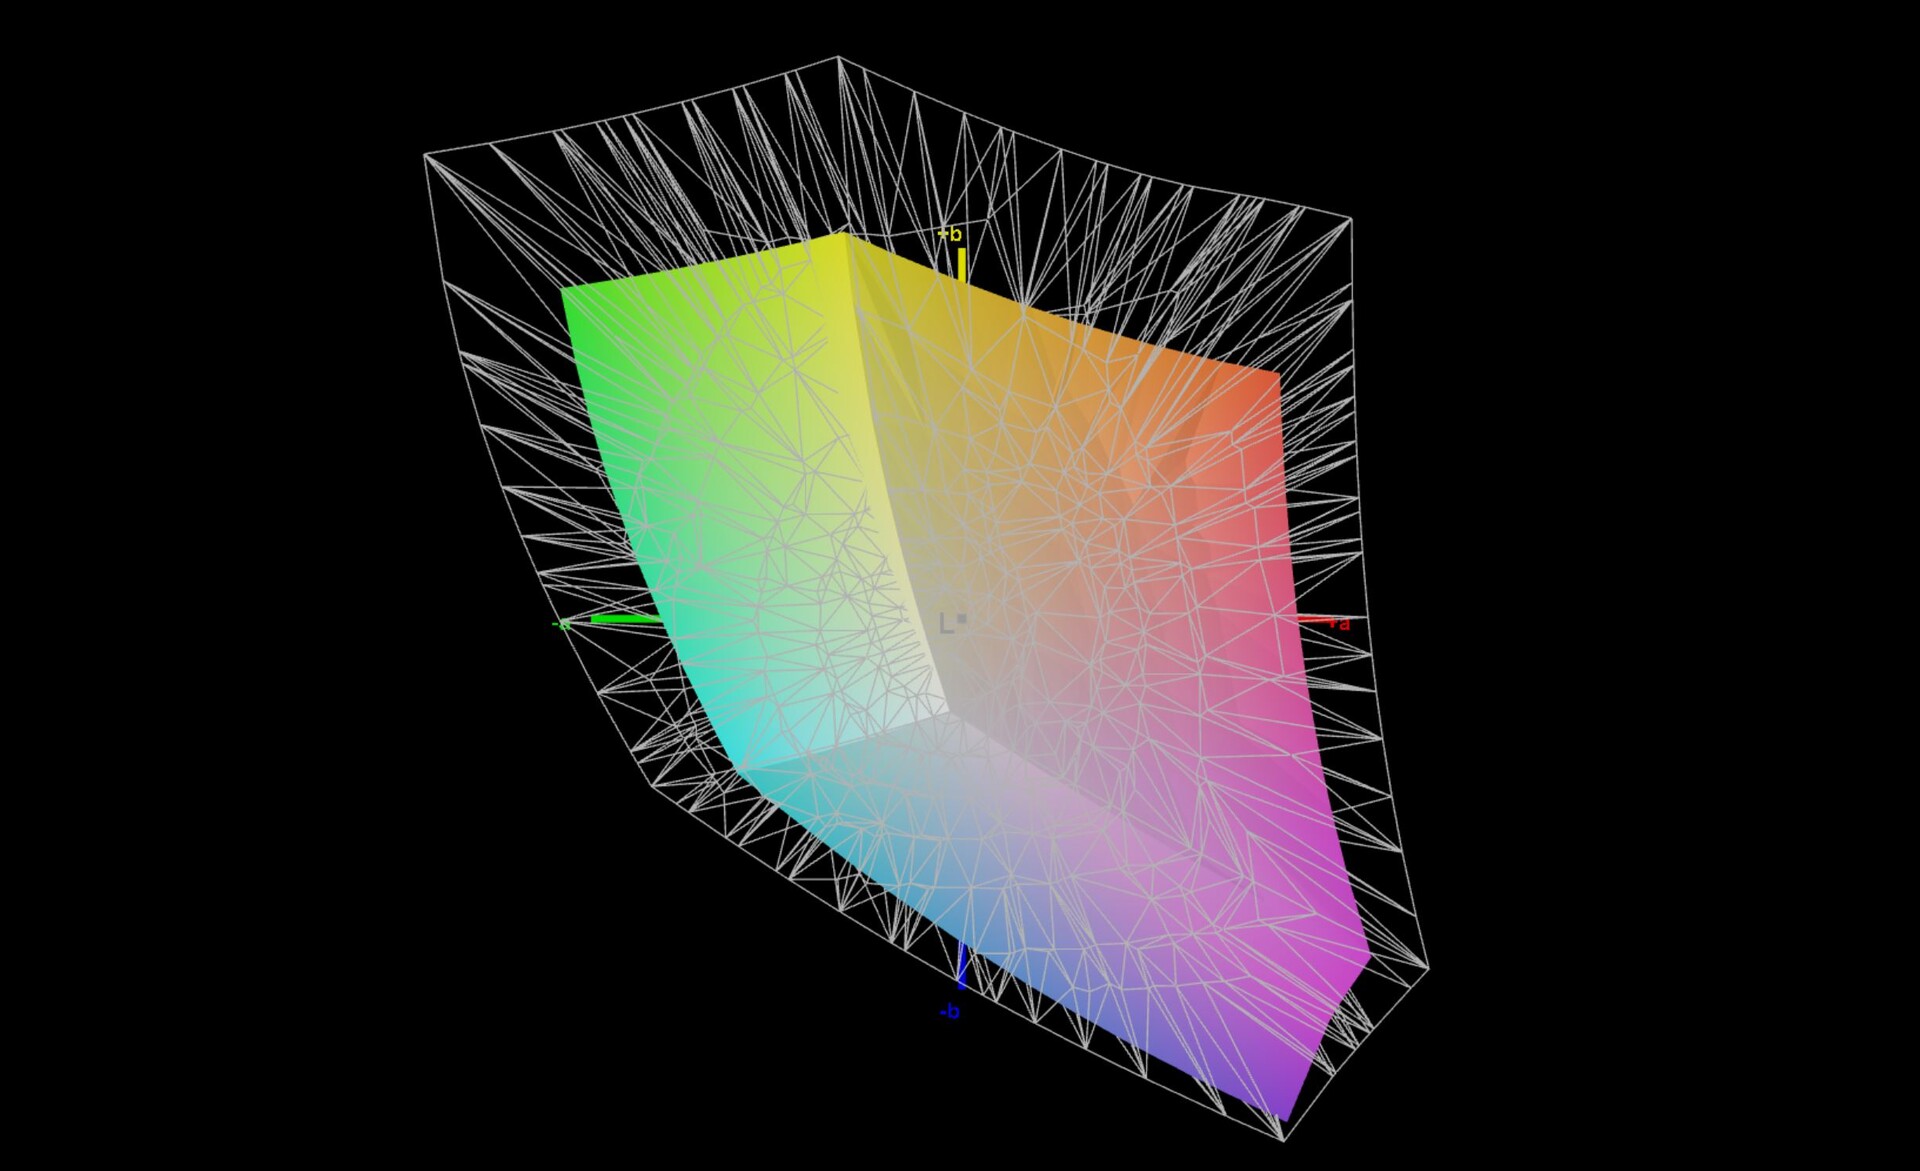
65.1% AdobeRGB 1998 (Argyll 3D)
94.9% sRGB (Argyll 3D)
63.1% Display P3 (Argyll 3D)
Gamma: 2.14
CCT: 6728 K
| Huawei MateBook 16 R7 5800H BOE TV160DKT-NH0, , 2520x1680, 16" | Acer Swift 3 SF316-51 Chi Mei CMN160B, IPS, 1920x1080, 16.1" | Huawei MateBook D 16-53011VFJ N161HCA-EA3, IPS, 1920x1080, 16.1" | Lenovo IdeaPad 5 Pro 16ACH IPS LED, 2560x1600, 16" | Schenker Vision 15 BOE08F5, IPS, 1920x1080, 15.6" | Dell XPS 15 9510 i5 11400H FHD Sharp LQ156N1, IPS, 1920x1200, 15.6" | |
|---|---|---|---|---|---|---|
| Display | 5% | 5% | 10% | 6% | 18% | |
| Display P3 Coverage (%) | 63.1 | 66.6 6% | 66.8 6% | 71 13% | 69.3 10% | 80.9 28% |
| sRGB Coverage (%) | 94.9 | 99.5 5% | 99 4% | 99 4% | 94 -1% | 100 5% |
| AdobeRGB 1998 Coverage (%) | 65.1 | 68.5 5% | 69 6% | 73.3 13% | 70.8 9% | 79.1 22% |
| Response Times | 23% | 28% | 64% | -47% | -49% | |
| Response Time Grey 50% / Grey 80% * (ms) | 41.2 ? | 32 ? 22% | 25 ? 39% | 16.4 ? 60% | 60 ? -46% | 62.4 ? -51% |
| Response Time Black / White * (ms) | 26.4 ? | 20 ? 24% | 22 ? 17% | 8.8 ? 67% | 39 ? -48% | 38.8 ? -47% |
| PWM Frequency (Hz) | 2500 ? | 2500 ? | 24940 ? | |||
| Screen | -0% | -0% | -32% | -55% | -43% | |
| Brightness middle (cd/m²) | 357 | 304 -15% | 352 -1% | 395 11% | 478 34% | 632 77% |
| Brightness (cd/m²) | 349 | 284 -19% | 330 -5% | 375 7% | 462 32% | 606 74% |
| Brightness Distribution (%) | 93 | 88 -5% | 89 -4% | 90 -3% | 94 1% | 91 -2% |
| Black Level * (cd/m²) | 0.21 | 0.165 21% | 0.28 -33% | 0.32 -52% | 0.27 -29% | 0.29 -38% |
| Contrast (:1) | 1700 | 1842 8% | 1257 -26% | 1234 -27% | 1770 4% | 2179 28% |
| Colorchecker dE 2000 * | 1.6 | 1.44 10% | 1.35 16% | 2.6 -63% | 3.2 -100% | 3.5 -119% |
| Colorchecker dE 2000 max. * | 3.9 | 3.62 7% | 2.58 34% | 5.4 -38% | 8.4 -115% | 6.4 -64% |
| Colorchecker dE 2000 calibrated * | 0.6 | 1.1 -83% | 2 -233% | 2 -233% | ||
| Greyscale dE 2000 * | 2.4 | 2.6 -8% | 2.02 16% | 3.4 -42% | 4.5 -88% | 5 -108% |
| Gamma | 2.14 103% | 2.41 91% | 2.49 88% | 2.12 104% | 2.16 102% | 2.26 97% |
| CCT | 6728 97% | 6527 100% | 6445 101% | 6140 106% | 6788 96% | 7033 92% |
| Color Space (Percent of AdobeRGB 1998) (%) | 68.5 | 63 | 63.1 | |||
| Color Space (Percent of sRGB) (%) | 99.5 | 99 | 93.6 | |||
| Total Average (Program / Settings) | 9% /
5% | 11% /
5% | 14% /
-10% | -32% /
-41% | -25% /
-31% |
* ... smaller is better
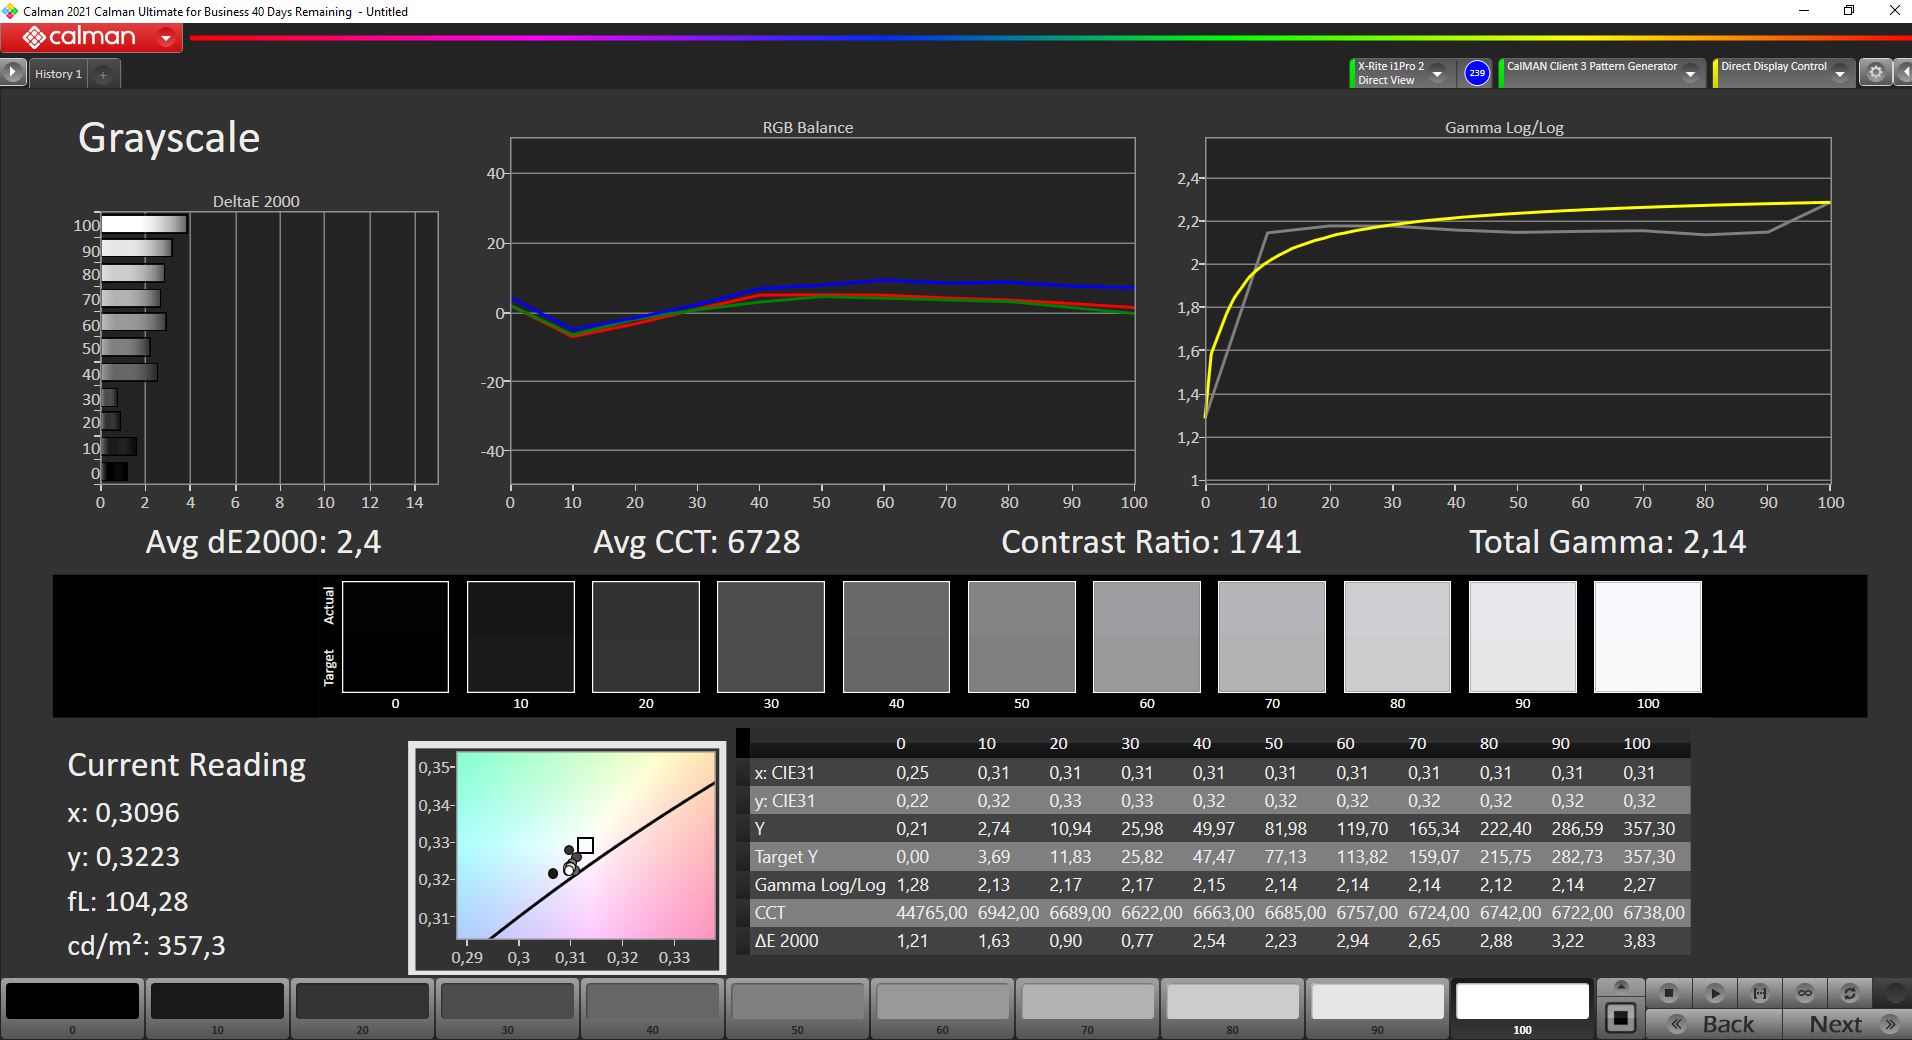
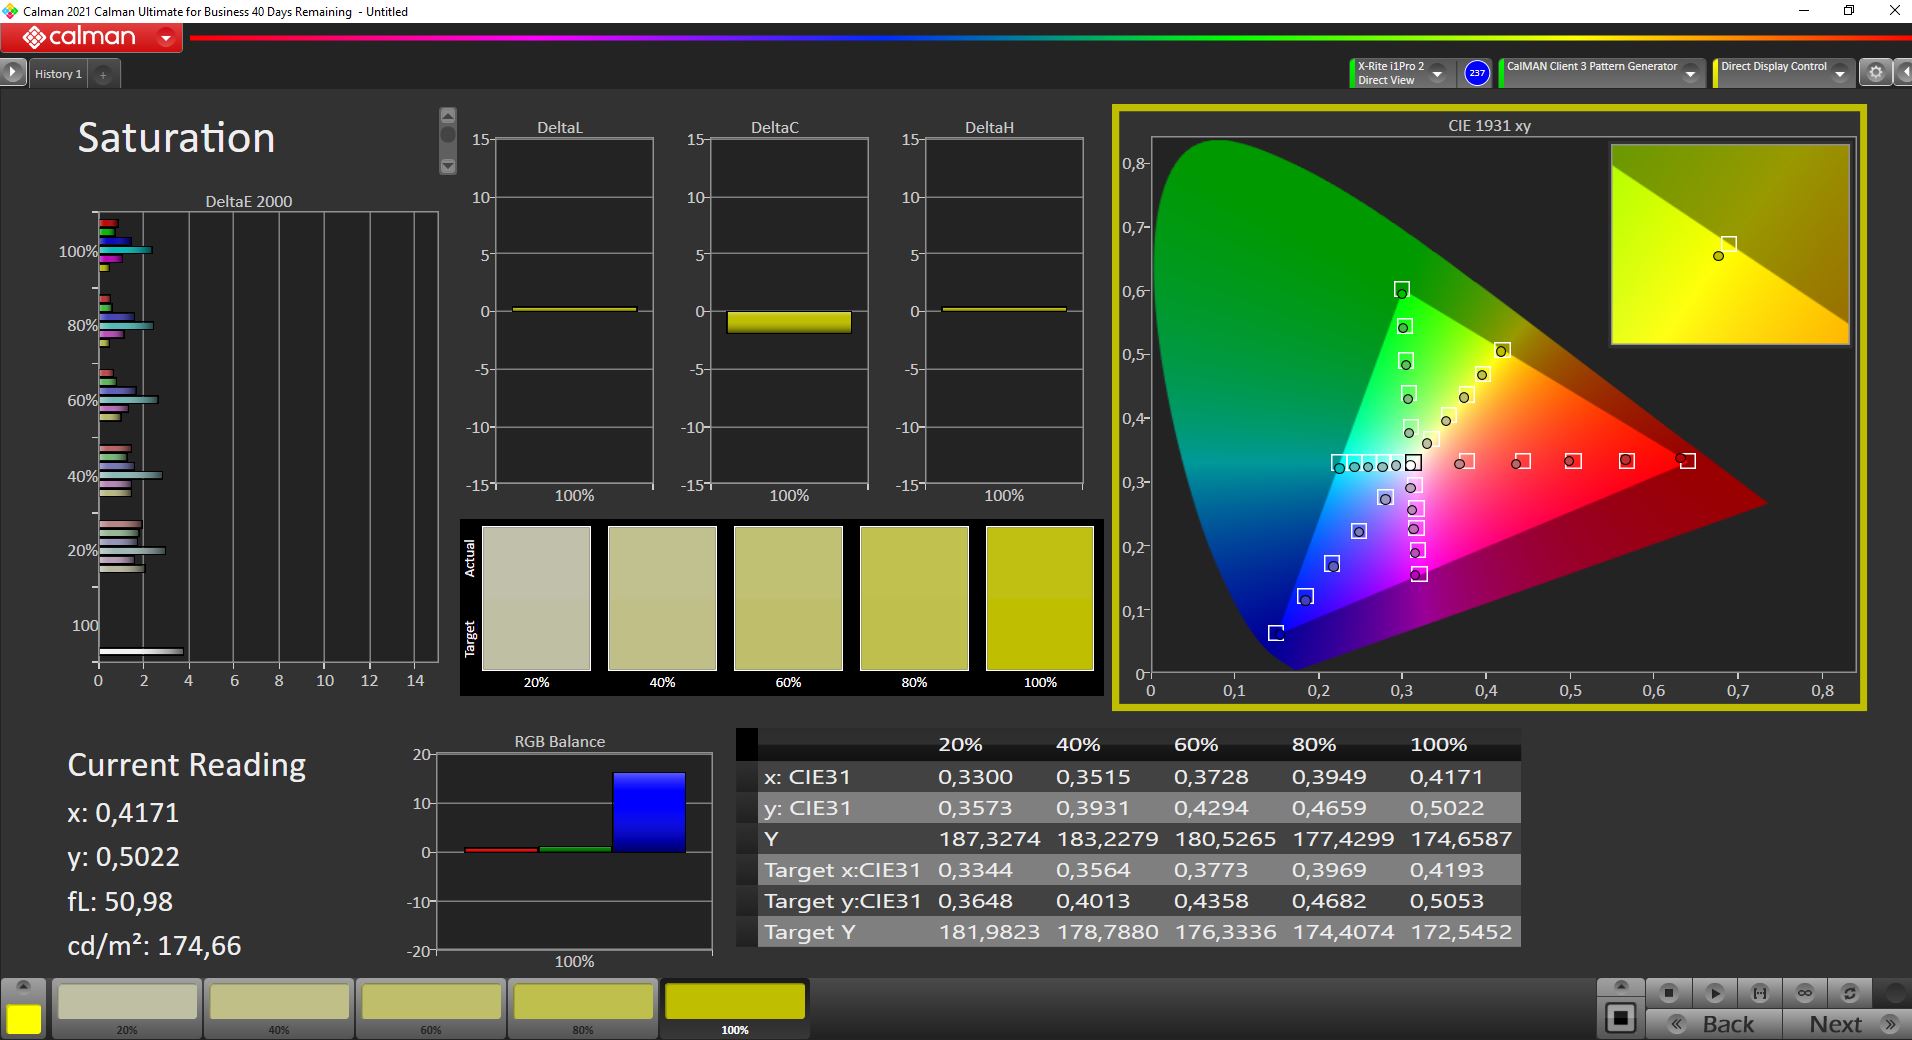
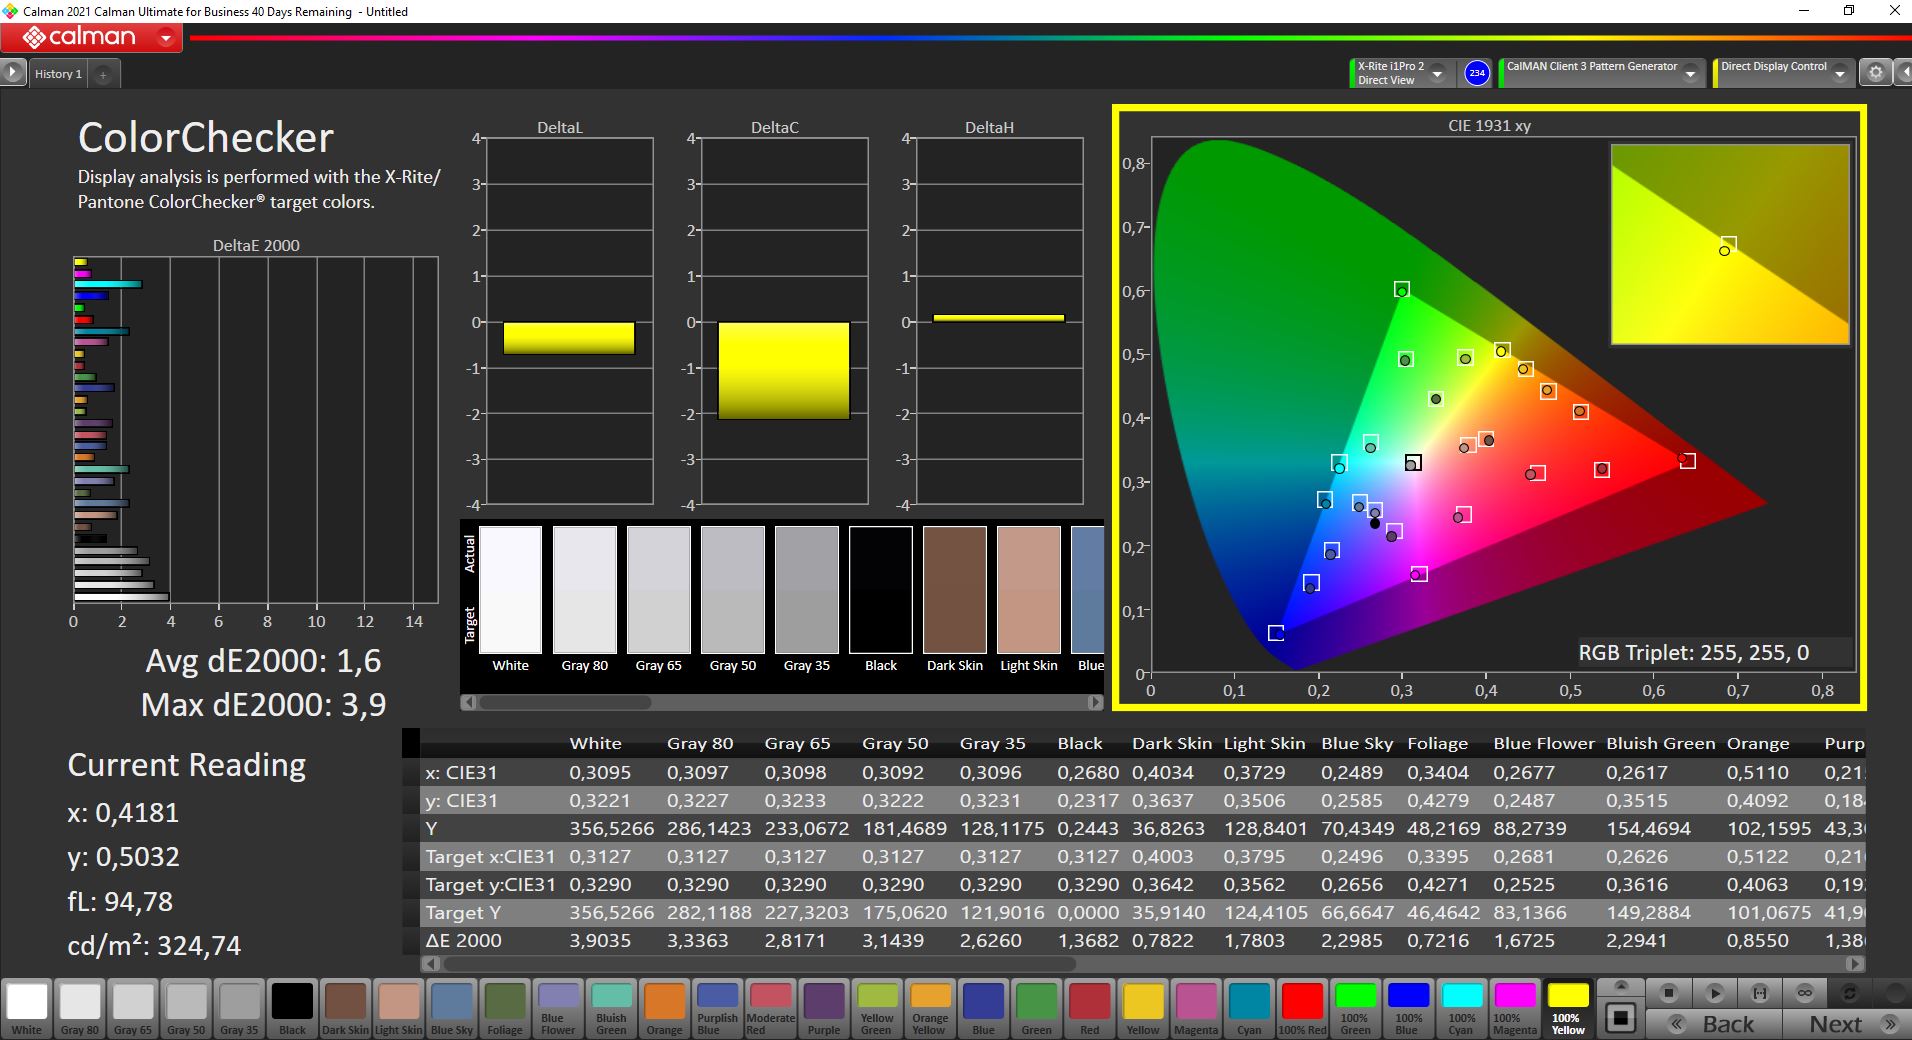
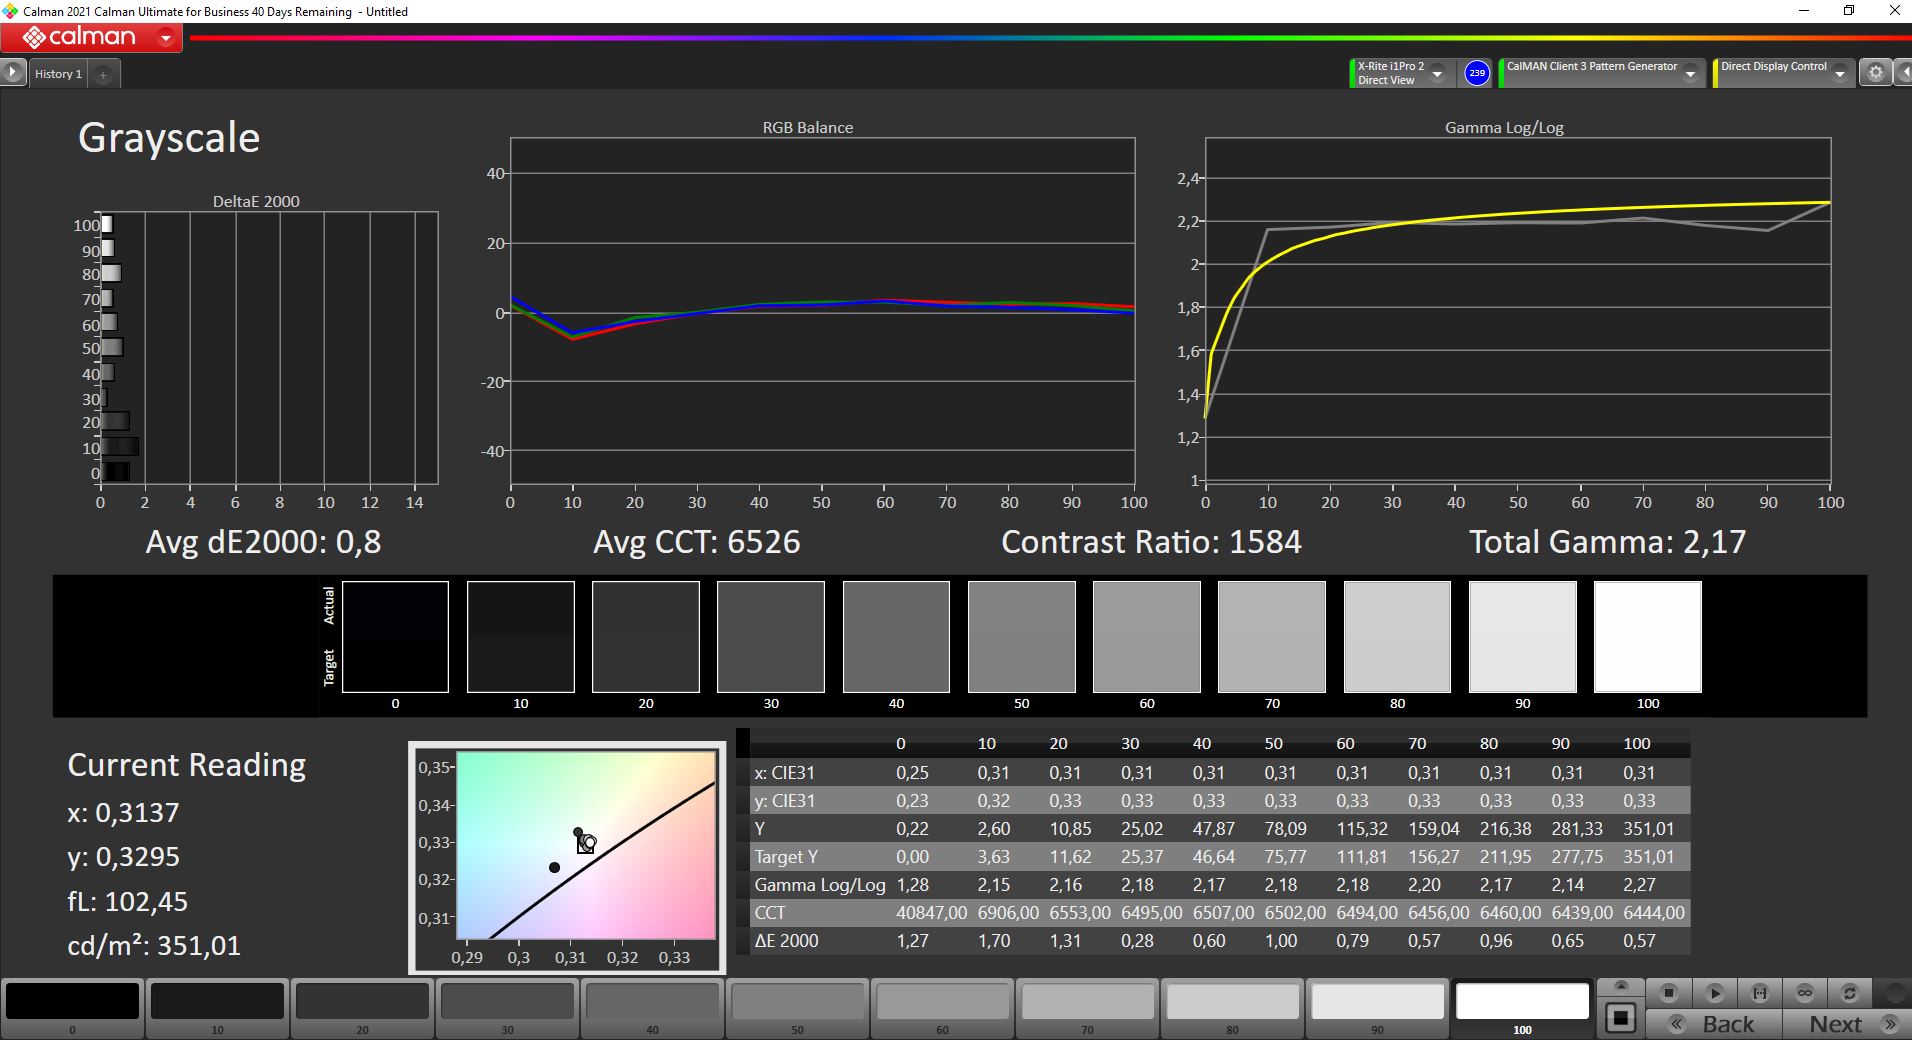
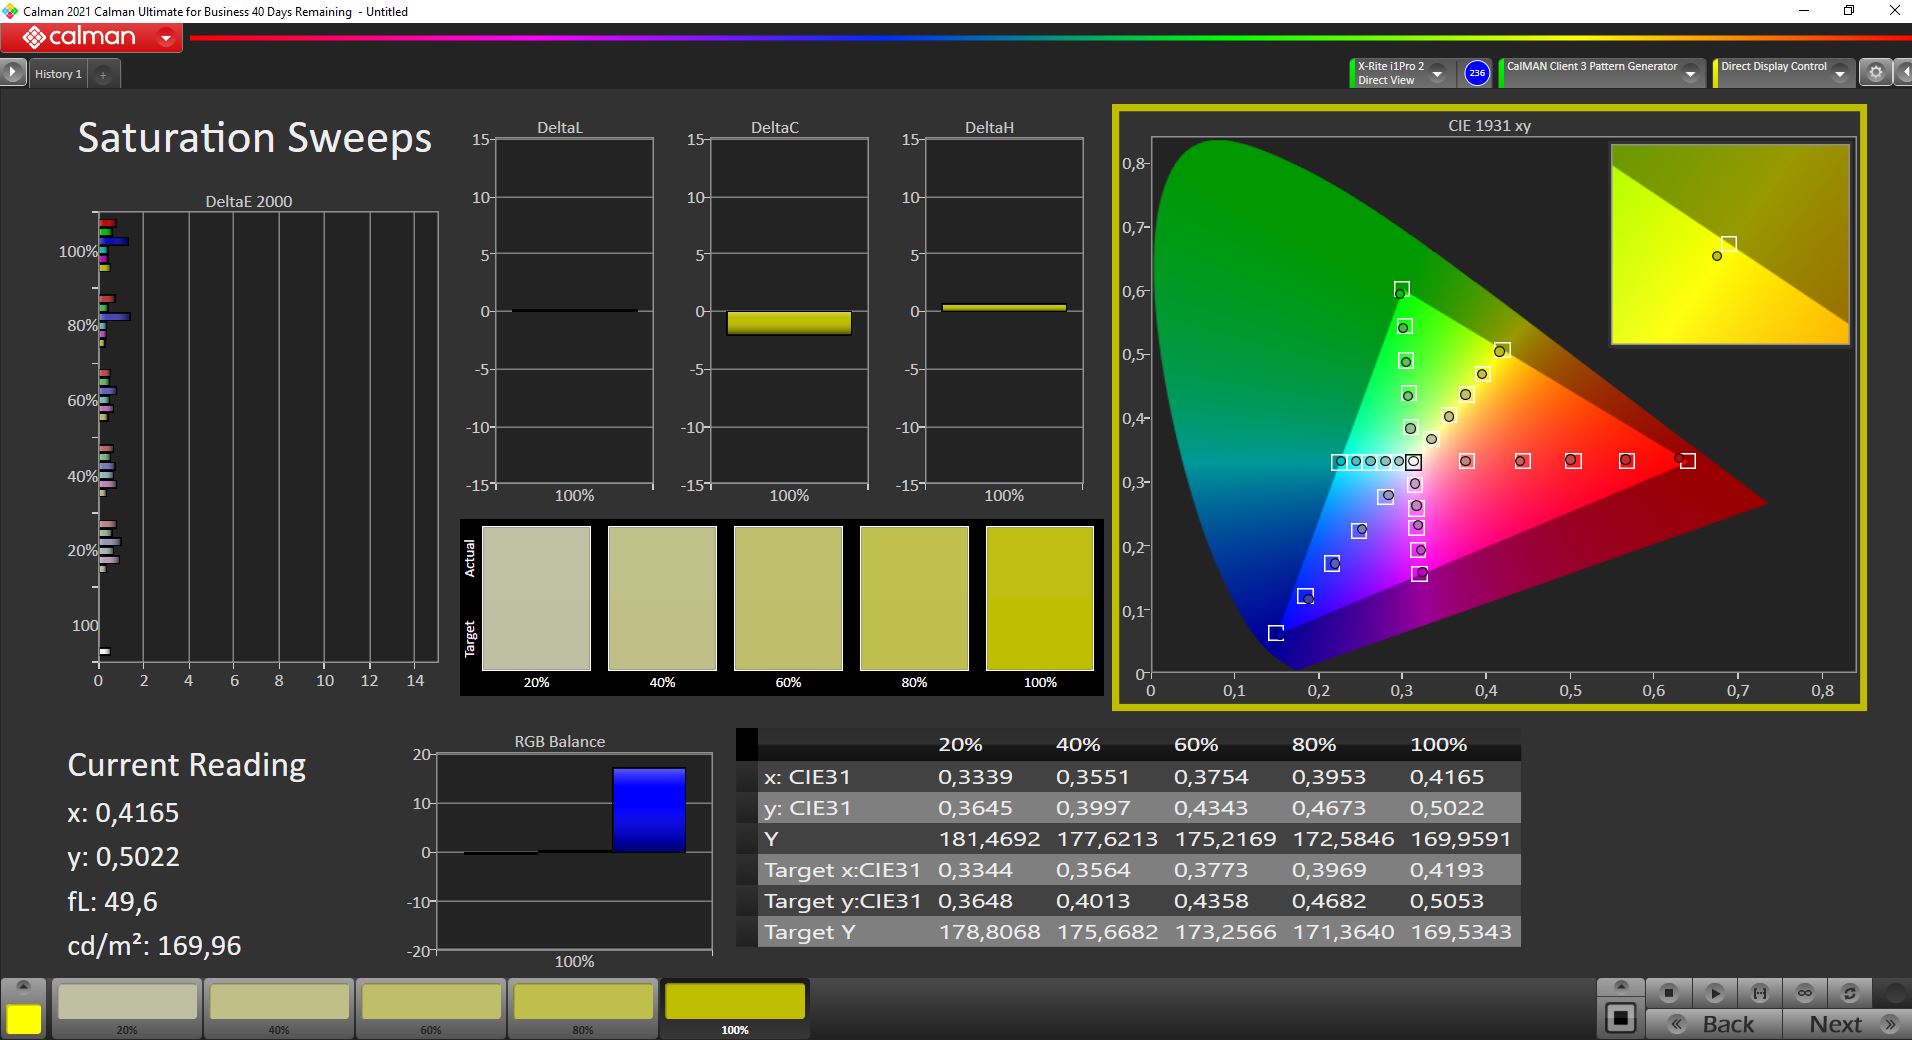
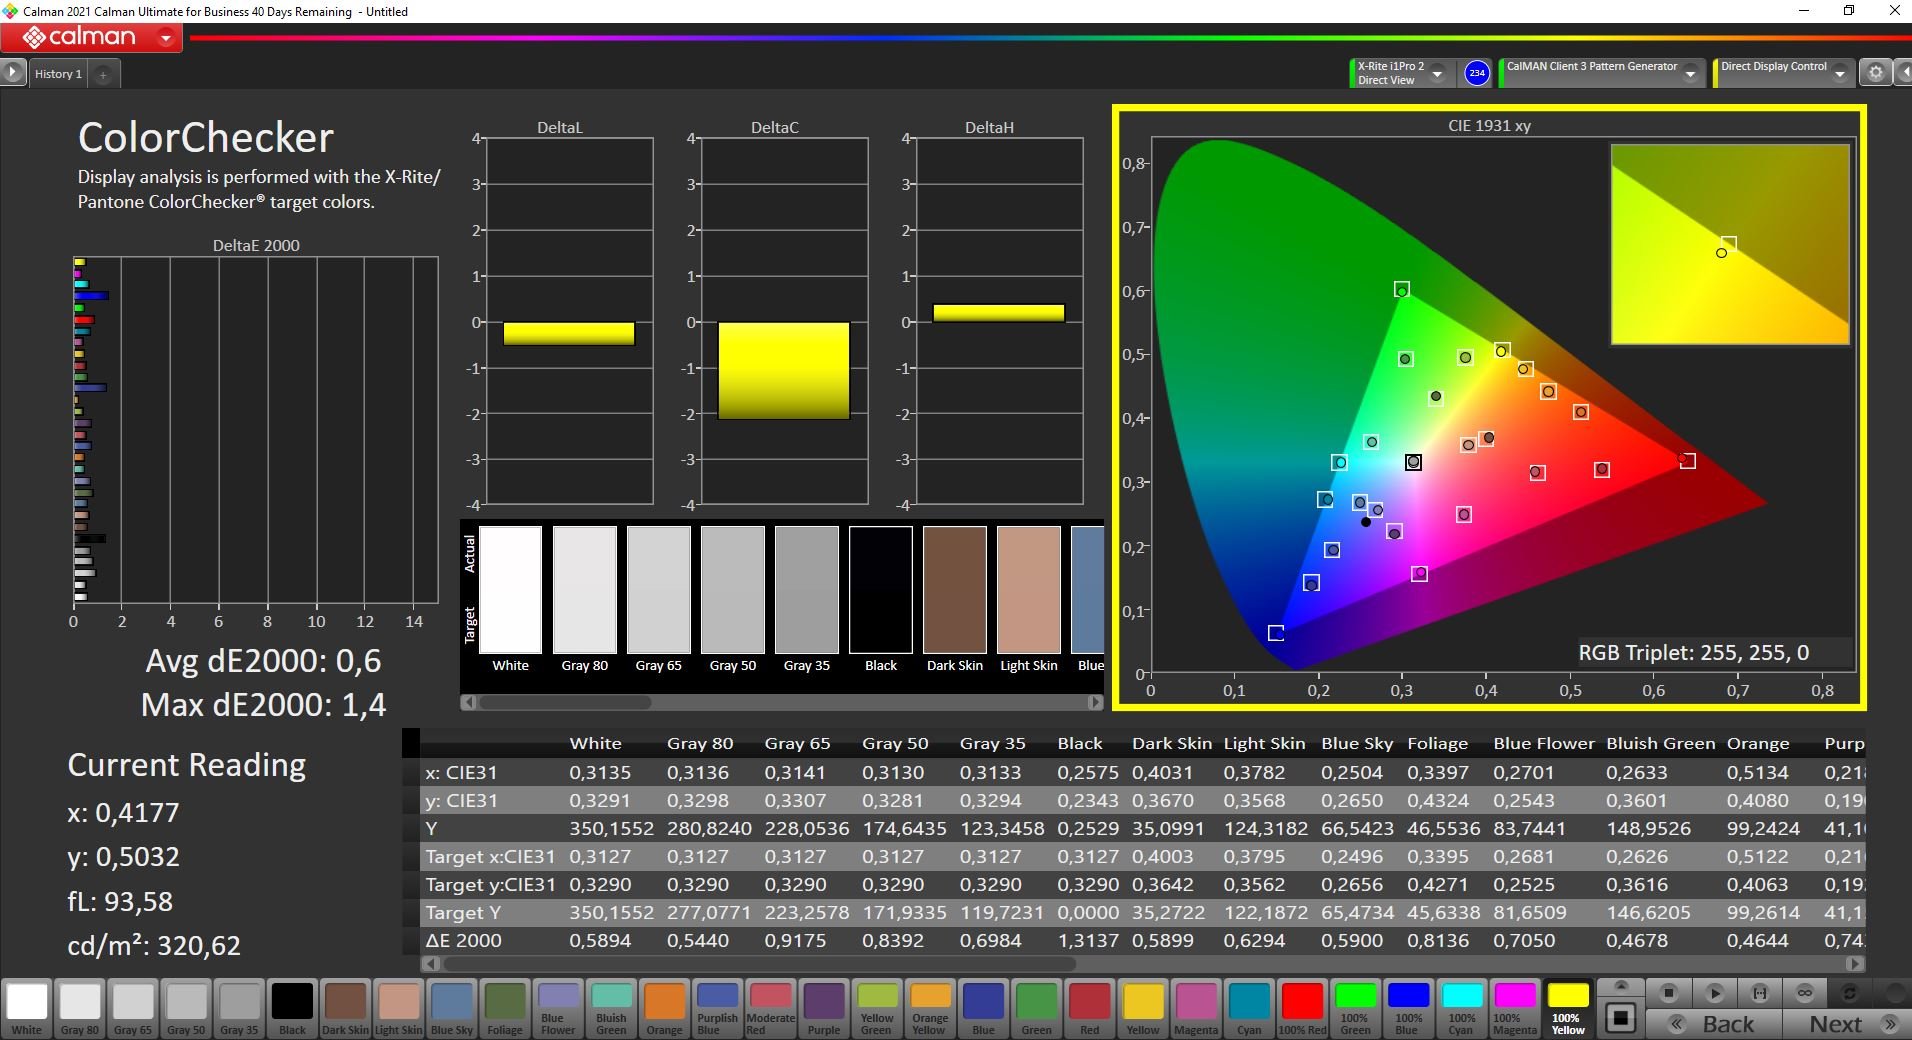
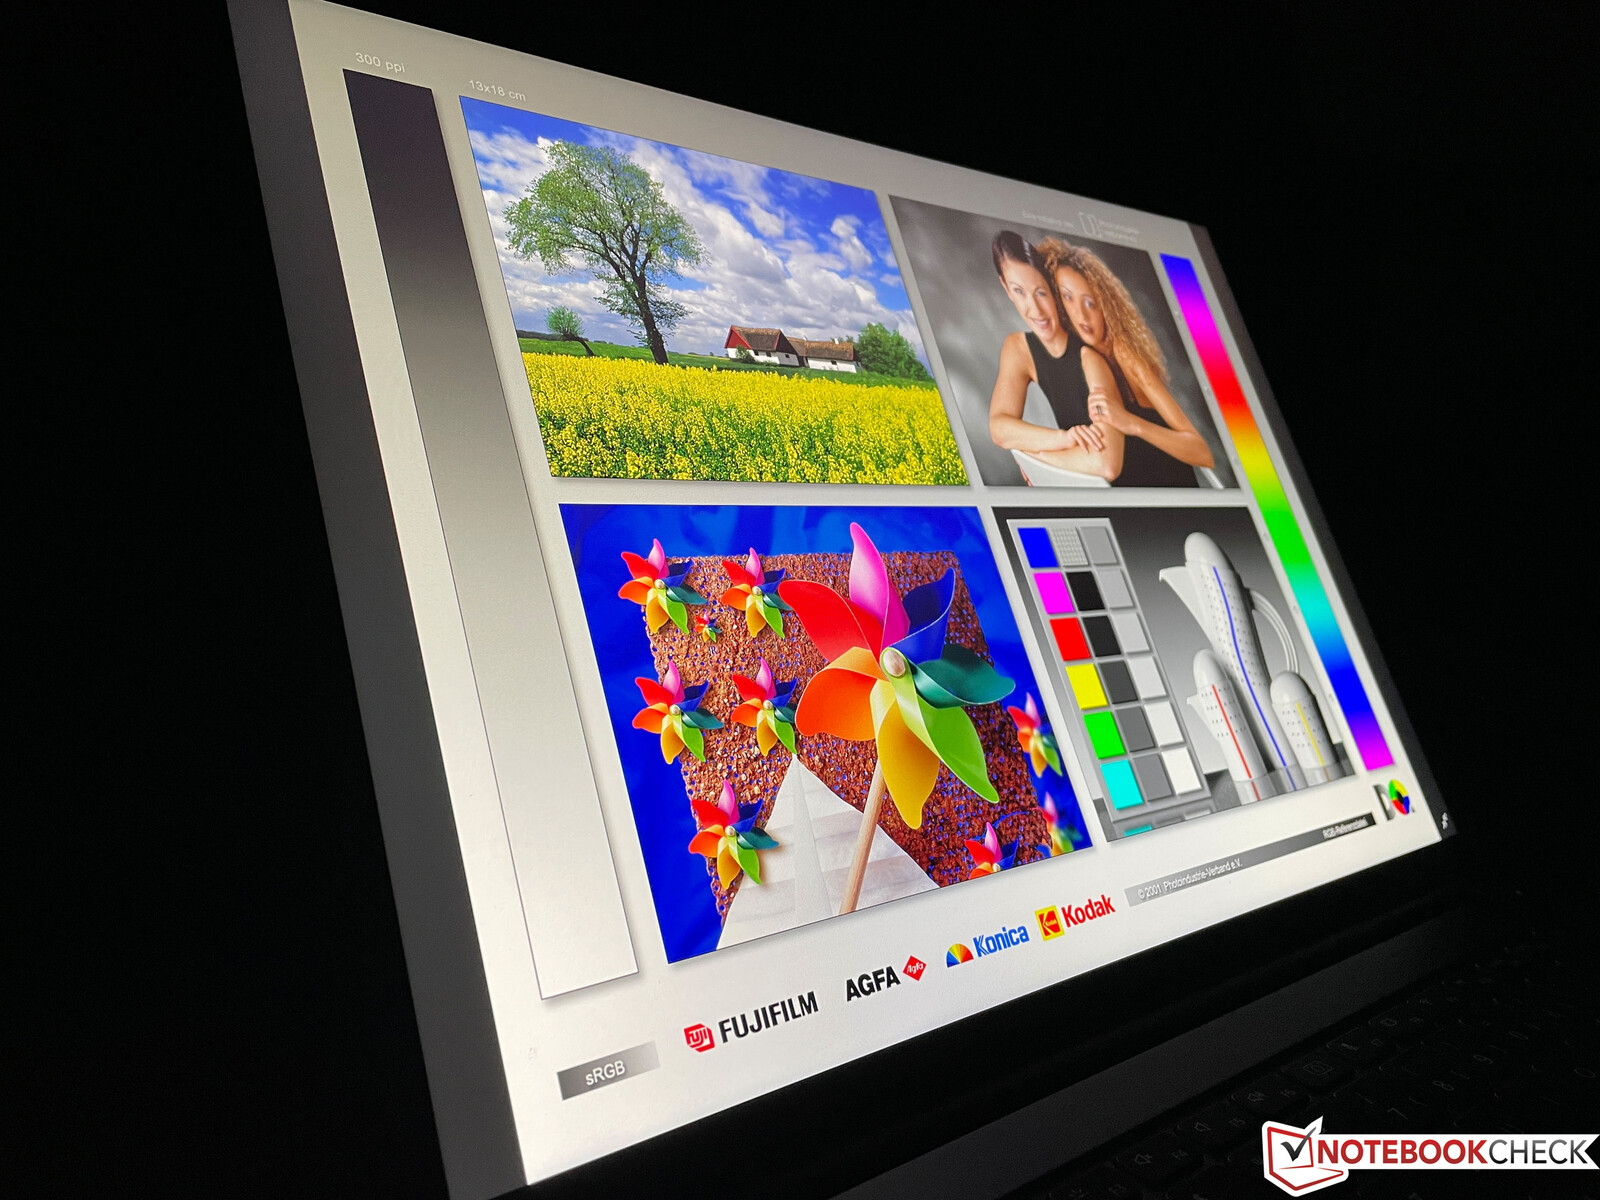
我们的分析(CalMAN Professional,X-Rite i1 Pro 2)表明,该面板在出厂前已经经过了良好的校准。灰阶有轻微的蓝色偏移,但这对眼睛来说并不明显。颜色都在理想范围内,不需要额外的校准。我们自己的校准只对显示器进行了最小的改进(链接可在上面的信息框中找到)。颜色几乎完全覆盖了较小的sRGB色彩空间,这使得该面板适合编辑图像和视频。
Display Response Times
| ↔ Response Time Black to White | ||
|---|---|---|
| 26.4 ms ... rise ↗ and fall ↘ combined | ↗ 14 ms rise | 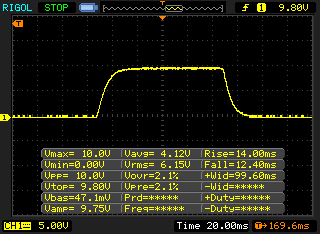 |
| ↘ 12.4 ms fall | ||
| The screen shows relatively slow response rates in our tests and may be too slow for gamers. In comparison, all tested devices range from 0.1 (minimum) to 240 (maximum) ms. » 66 % of all devices are better. This means that the measured response time is worse than the average of all tested devices (19.8 ms). | ||
| ↔ Response Time 50% Grey to 80% Grey | ||
| 41.2 ms ... rise ↗ and fall ↘ combined | ↗ 19.2 ms rise | 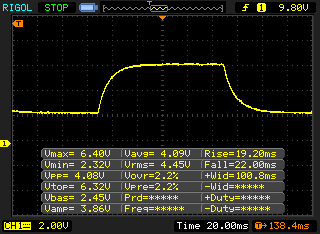 |
| ↘ 22 ms fall | ||
| The screen shows slow response rates in our tests and will be unsatisfactory for gamers. In comparison, all tested devices range from 0.165 (minimum) to 636 (maximum) ms. » 66 % of all devices are better. This means that the measured response time is worse than the average of all tested devices (31 ms). | ||
Screen Flickering / PWM (Pulse-Width Modulation)
| Screen flickering / PWM not detected | 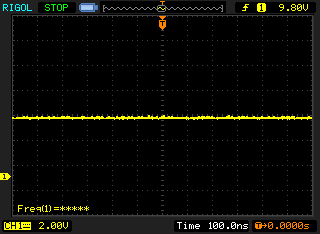 | ||
In comparison: 52 % of all tested devices do not use PWM to dim the display. If PWM was detected, an average of 7754 (minimum: 5 - maximum: 343500) Hz was measured. | |||
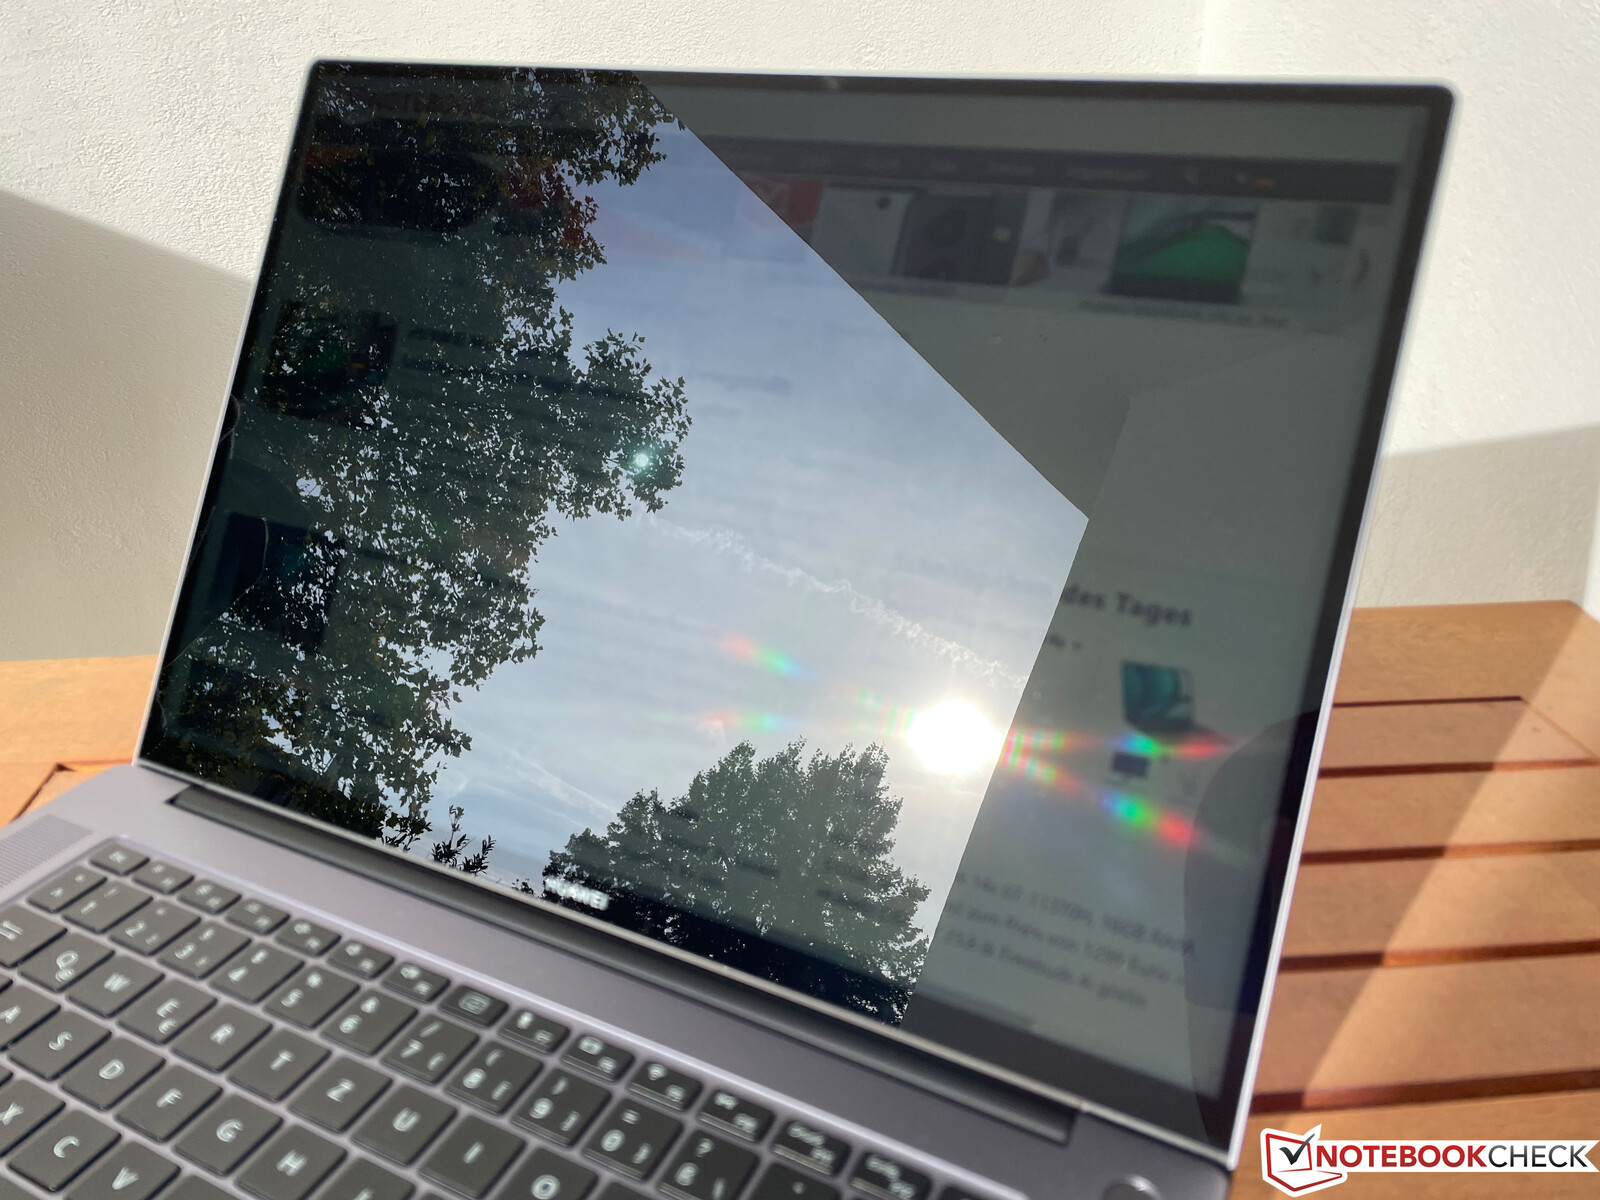
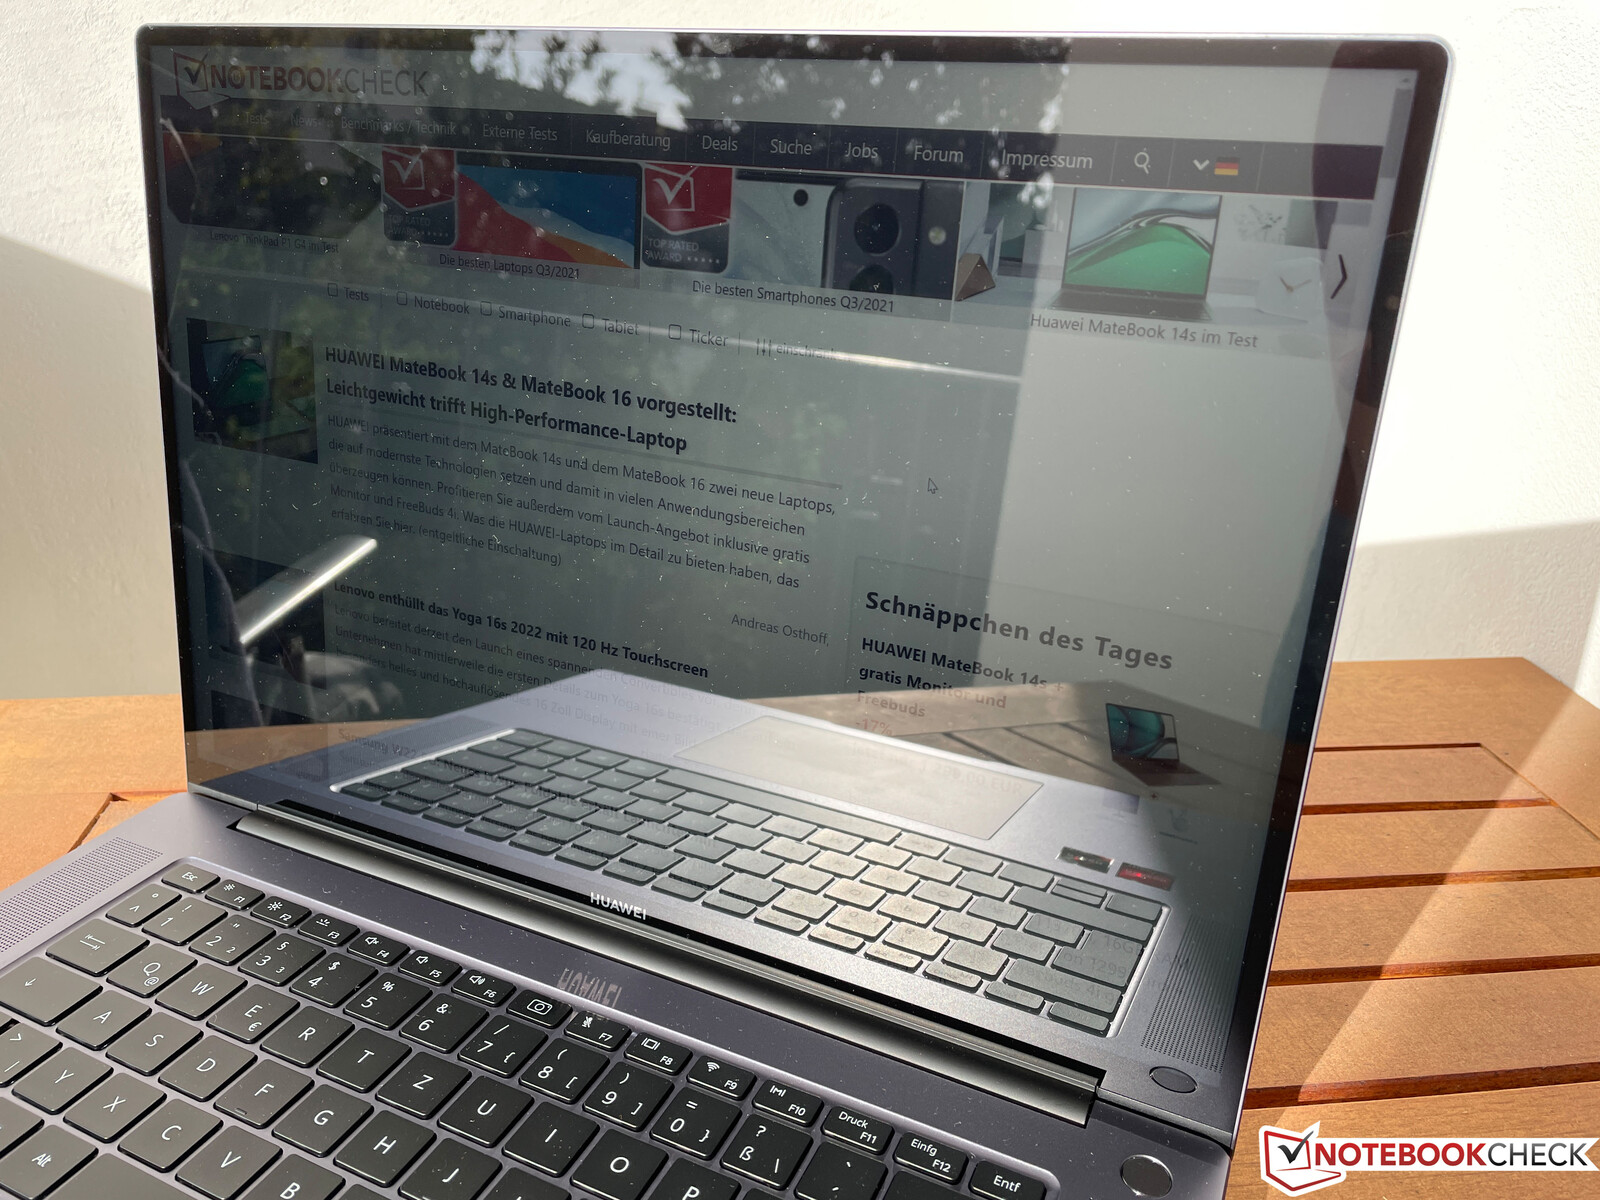
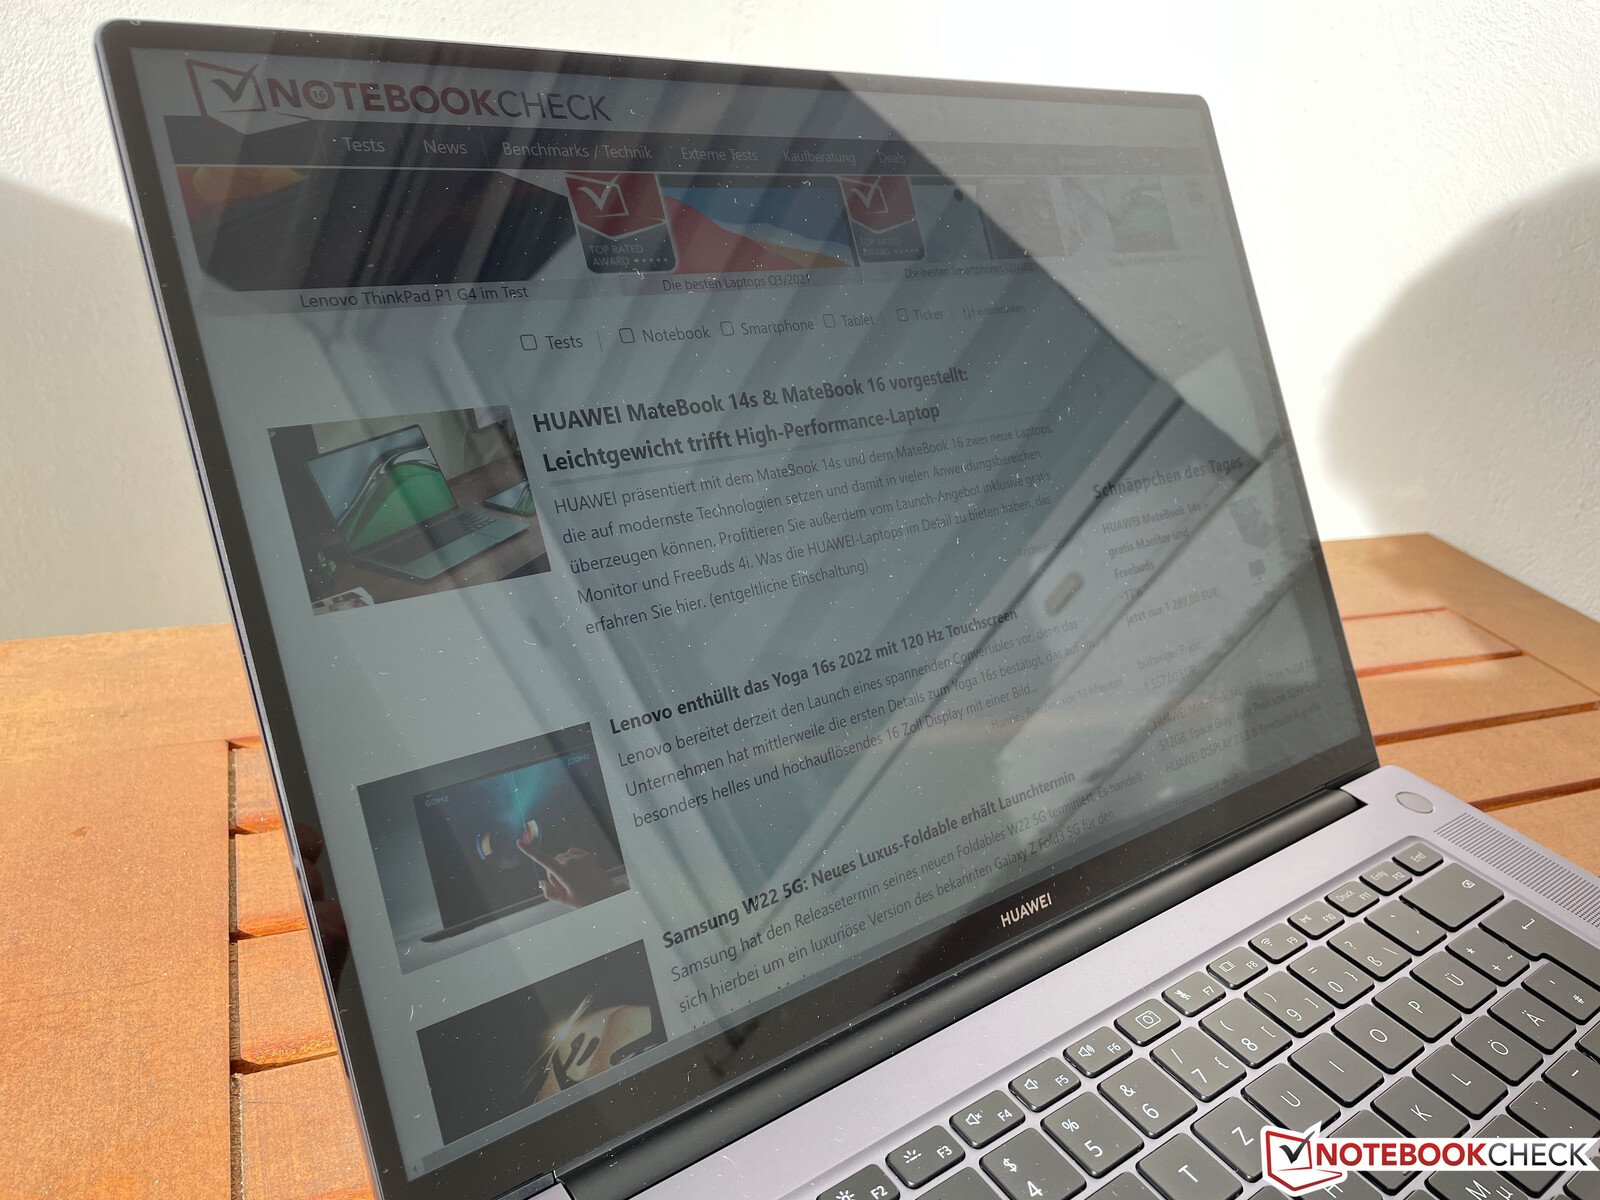
该显示器唯一真正的弱点是其极度反光的表面,下面的图片就说明了这一点。在阳光明媚的日子里,几乎不可能在户外使用该设备,在室内工作时,反射甚至会成为一个小问题。
性能 - Zen 3和良好的散热
MateBook 16可配备AMD Ryzen 5 5600H(6个Zen-3核心)或 Ryzen 7 5800H(8个Zen-3核心),但需支付100欧元的附加费。这两种配置的其余功能相同,都是16GB内存和512GB PCI-SSD。
组合键Fn+P允许用户在平衡和性能模式之间切换,但我们没有测量到CPU或iGPU性能的差异。
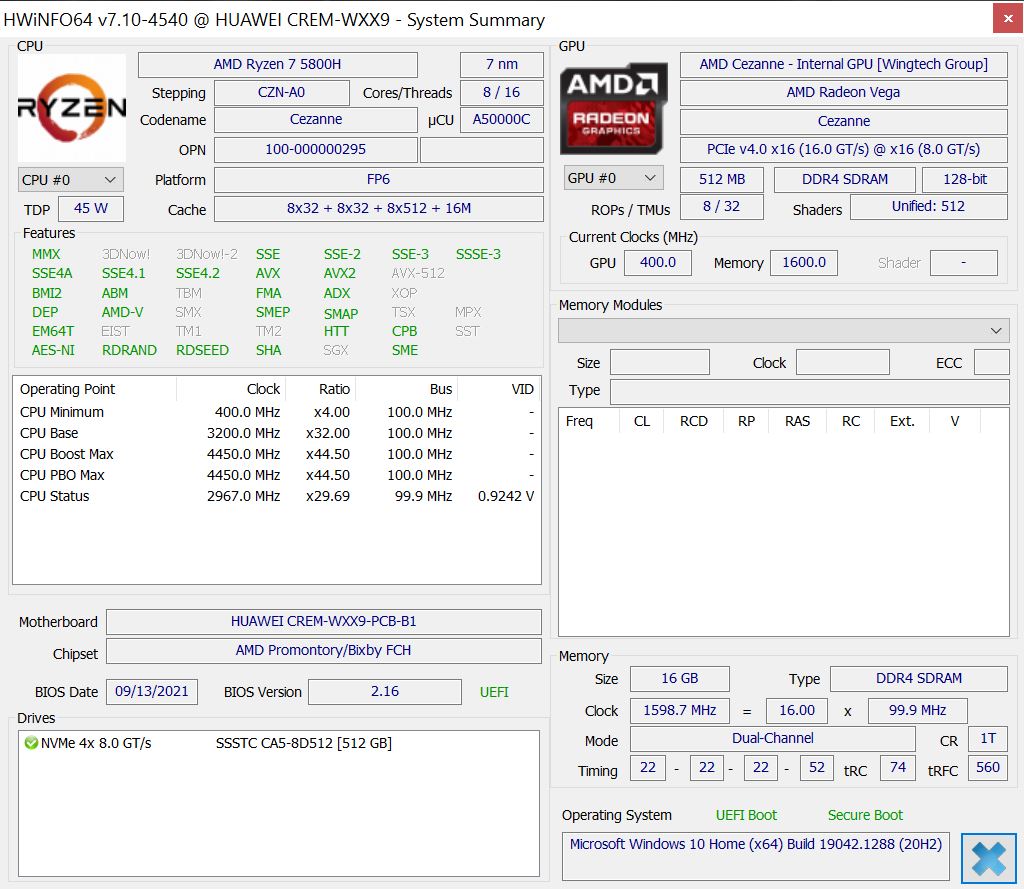
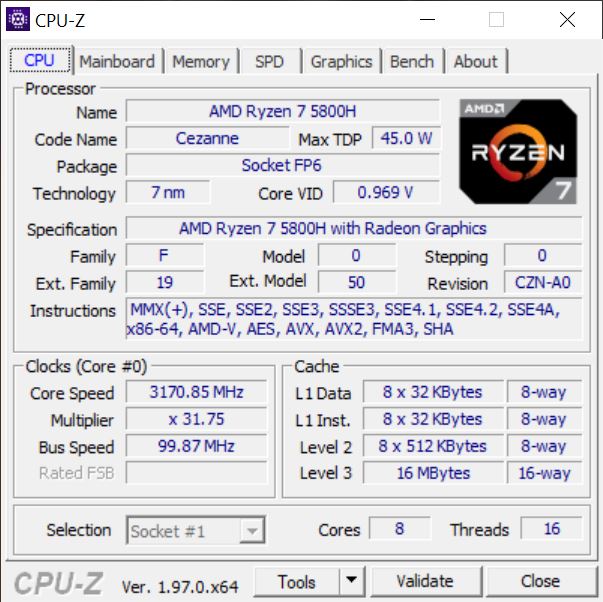
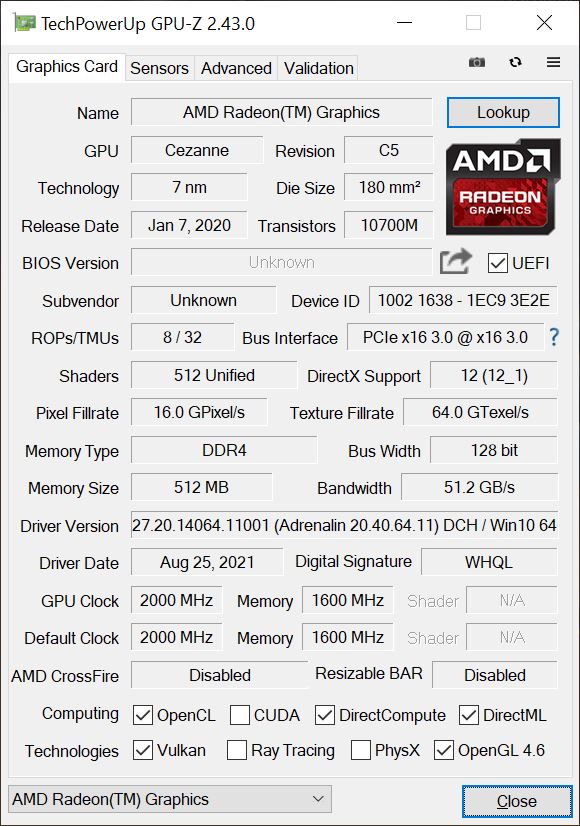
处理器 - Ryzen 7 5800H,连续负载54瓦
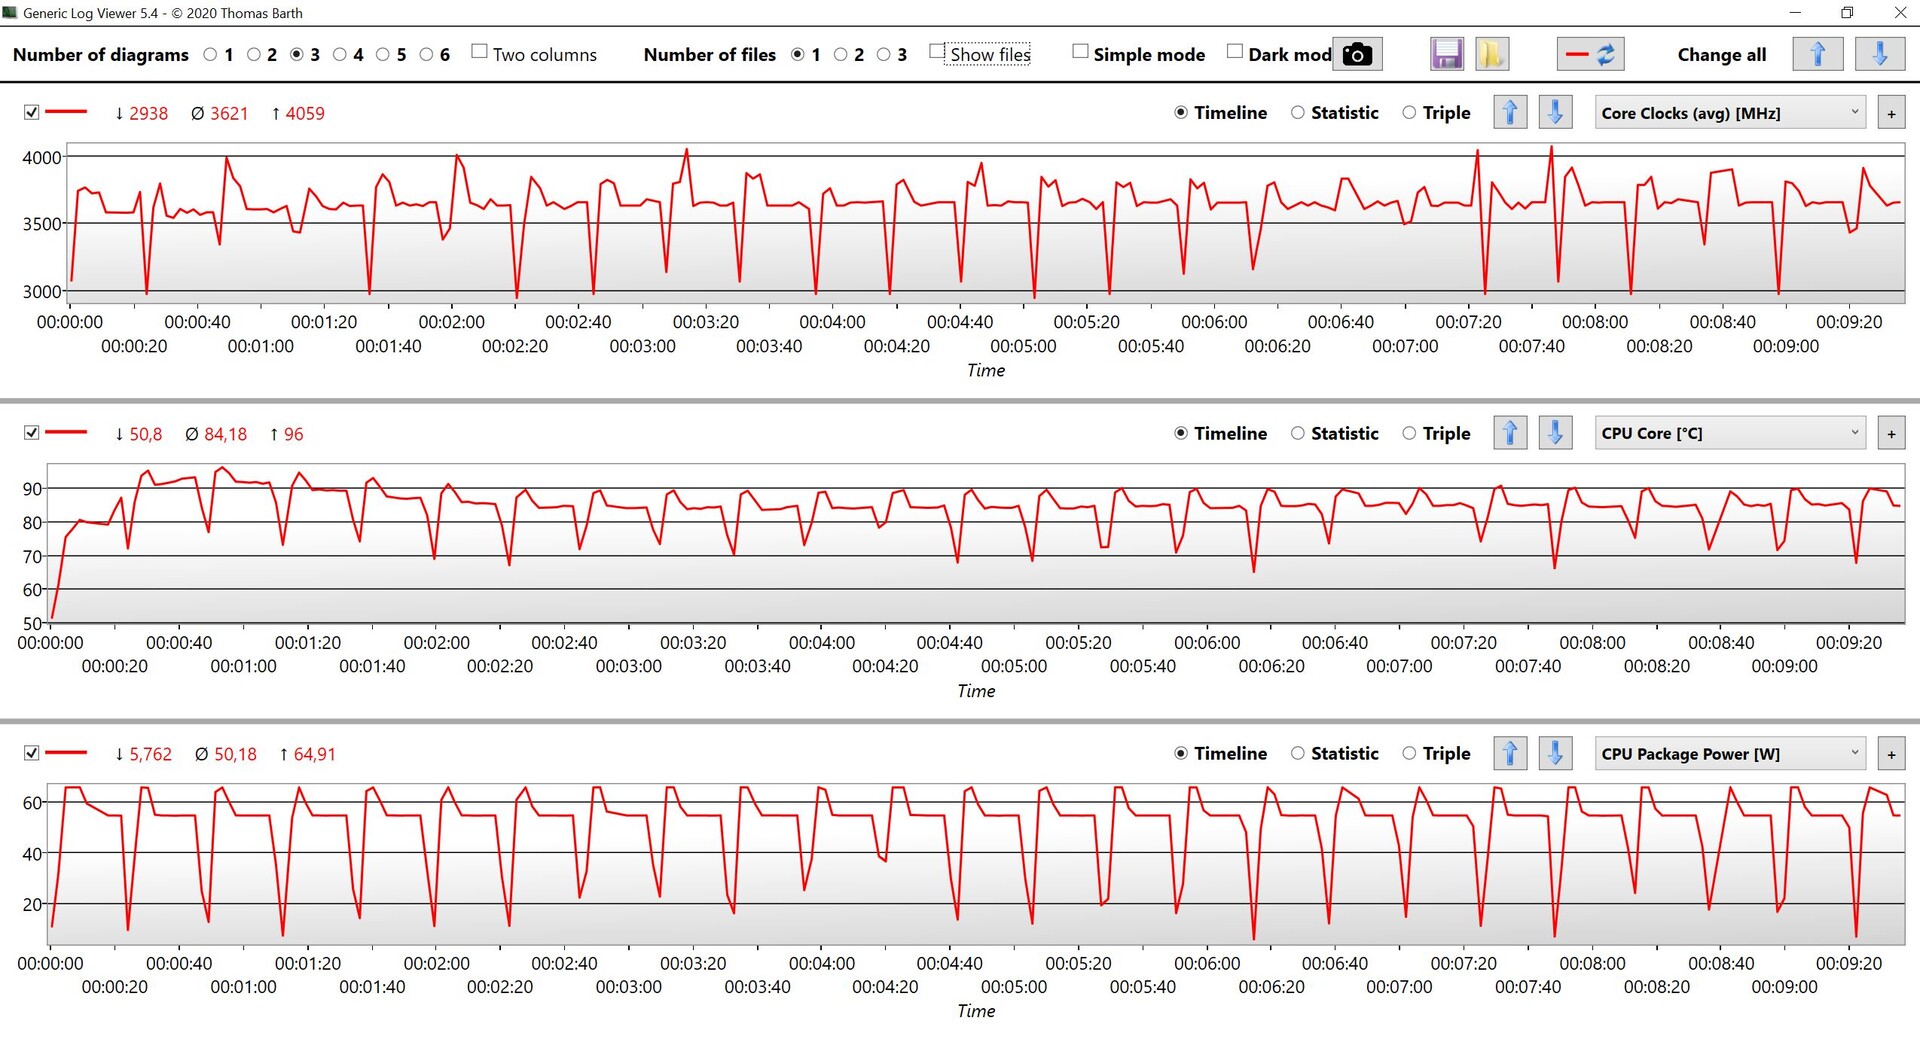
淘宝网AMD Ryzen 7 5800H有8个快速的Zen-3核心(16个线程),最高达到4.4GHz。该芯片采用7纳米工艺生产,这对效率有积极影响。Ryzen 7 5800H目前是最快的45瓦移动处理器之一,正如下面令人印象深刻的基准测试所示。该处理器的功耗峰值为65瓦,然后立即稳定在54瓦左右,这导致性能非常稳定。
该IdeaPad Pro装备了相同的处理器,提供了相当的性能,而其他型号,装备了英特尔芯片,在多核或单核测试中没有机会与AMD处理器抗衡。公平地说,这些设备都没有配备最快的处理器。但是,当看到一些(明显更昂贵的)移动工作站时,结果仍然相似,如戴尔Precision 5560或ThinkPad P1 G4(高端版本),配备了英特尔酷睿i7-11850H.有的实现了酷睿i7-11800H提供更多的性能(例如在一些游戏笔记本电脑中),但只与非常高的功耗水平相结合(在Alienware x17的情况下,约100瓦)。Alienware x17).所有这些都说明了当前AMD芯片效率的显著提高,以及MateBook 16甚至可以跟上价格更高的机型的事实。
在电池上运行时,处理器在几秒钟内消耗54瓦特,然后被限制在35瓦特。这只导致在多核心测试中损失约10%(CBR15 Multi中的1793分)。有关CPU基准测试的更多信息,请访问我们的 技术页面。
Cinebench R15 Multi loop
Cinebench R23: Multi Core | Single Core
Cinebench R20: CPU (Multi Core) | CPU (Single Core)
Cinebench R15: CPU Multi 64Bit | CPU Single 64Bit
Blender: v2.79 BMW27 CPU
7-Zip 18.03: 7z b 4 | 7z b 4 -mmt1
Geekbench 5.5: Multi-Core | Single-Core
HWBOT x265 Benchmark v2.2: 4k Preset
LibreOffice : 20 Documents To PDF
R Benchmark 2.5: Overall mean
| CPU Performance rating | |
| Average of class Multimedia | |
| Lenovo IdeaPad 5 Pro 16ACH | |
| Huawei MateBook 16 R7 5800H | |
| Average AMD Ryzen 7 5800H | |
| Acer Swift 3 SF316-51 | |
| Dell XPS 15 9510 i5 11400H FHD | |
| Huawei MateBook D 16-53011VFJ | |
| Schenker Vision 15 | |
| Cinebench R23 / Multi Core | |
| Average of class Multimedia (4861 - 33362, n=74, last 2 years) | |
| Average AMD Ryzen 7 5800H (8812 - 13214, n=29) | |
| Lenovo IdeaPad 5 Pro 16ACH | |
| Huawei MateBook 16 R7 5800H | |
| Huawei MateBook D 16-53011VFJ | |
| Dell XPS 15 9510 i5 11400H FHD | |
| Acer Swift 3 SF316-51 | |
| Schenker Vision 15 | |
| Cinebench R23 / Single Core | |
| Average of class Multimedia (1128 - 2459, n=66, last 2 years) | |
| Acer Swift 3 SF316-51 | |
| Average AMD Ryzen 7 5800H (1294 - 1441, n=29) | |
| Lenovo IdeaPad 5 Pro 16ACH | |
| Dell XPS 15 9510 i5 11400H FHD | |
| Huawei MateBook 16 R7 5800H | |
| Schenker Vision 15 | |
| Huawei MateBook D 16-53011VFJ | |
| Cinebench R20 / CPU (Multi Core) | |
| Average of class Multimedia (1887 - 12912, n=57, last 2 years) | |
| Lenovo IdeaPad 5 Pro 16ACH | |
| Average AMD Ryzen 7 5800H (3430 - 5020, n=31) | |
| Huawei MateBook 16 R7 5800H | |
| Huawei MateBook D 16-53011VFJ | |
| Dell XPS 15 9510 i5 11400H FHD | |
| Acer Swift 3 SF316-51 | |
| Schenker Vision 15 | |
| Cinebench R20 / CPU (Single Core) | |
| Average of class Multimedia (425 - 853, n=57, last 2 years) | |
| Acer Swift 3 SF316-51 | |
| Dell XPS 15 9510 i5 11400H FHD | |
| Average AMD Ryzen 7 5800H (502 - 560, n=30) | |
| Lenovo IdeaPad 5 Pro 16ACH | |
| Schenker Vision 15 | |
| Huawei MateBook 16 R7 5800H | |
| Huawei MateBook D 16-53011VFJ | |
| Cinebench R15 / CPU Multi 64Bit | |
| Average of class Multimedia (856 - 5224, n=61, last 2 years) | |
| Huawei MateBook 16 R7 5800H | |
| Lenovo IdeaPad 5 Pro 16ACH | |
| Average AMD Ryzen 7 5800H (1487 - 2119, n=28) | |
| Huawei MateBook D 16-53011VFJ | |
| Dell XPS 15 9510 i5 11400H FHD | |
| Dell XPS 15 9510 i5 11400H FHD | |
| Schenker Vision 15 | |
| Acer Swift 3 SF316-51 | |
| Cinebench R15 / CPU Single 64Bit | |
| Average of class Multimedia (184.8 - 326, n=59, last 2 years) | |
| Acer Swift 3 SF316-51 | |
| Huawei MateBook 16 R7 5800H | |
| Schenker Vision 15 | |
| Average AMD Ryzen 7 5800H (209 - 234, n=29) | |
| Lenovo IdeaPad 5 Pro 16ACH | |
| Dell XPS 15 9510 i5 11400H FHD | |
| Huawei MateBook D 16-53011VFJ | |
| Blender / v2.79 BMW27 CPU | |
| Schenker Vision 15 | |
| Acer Swift 3 SF316-51 | |
| Dell XPS 15 9510 i5 11400H FHD | |
| Huawei MateBook D 16-53011VFJ | |
| Lenovo IdeaPad 5 Pro 16ACH | |
| Average AMD Ryzen 7 5800H (237 - 340, n=29) | |
| Huawei MateBook 16 R7 5800H | |
| Average of class Multimedia (100 - 557, n=58, last 2 years) | |
| 7-Zip 18.03 / 7z b 4 | |
| Average of class Multimedia (26062 - 130368, n=55, last 2 years) | |
| Average AMD Ryzen 7 5800H (45773 - 59986, n=28) | |
| Huawei MateBook 16 R7 5800H | |
| Lenovo IdeaPad 5 Pro 16ACH | |
| Huawei MateBook D 16-53011VFJ | |
| Dell XPS 15 9510 i5 11400H FHD | |
| Acer Swift 3 SF316-51 | |
| Schenker Vision 15 | |
| 7-Zip 18.03 / 7z b 4 -mmt1 | |
| Average of class Multimedia (3666 - 7545, n=56, last 2 years) | |
| Huawei MateBook 16 R7 5800H | |
| Average AMD Ryzen 7 5800H (5038 - 5632, n=29) | |
| Acer Swift 3 SF316-51 | |
| Lenovo IdeaPad 5 Pro 16ACH | |
| Schenker Vision 15 | |
| Dell XPS 15 9510 i5 11400H FHD | |
| Huawei MateBook D 16-53011VFJ | |
| Geekbench 5.5 / Multi-Core | |
| Average of class Multimedia (4652 - 20422, n=56, last 2 years) | |
| Average AMD Ryzen 7 5800H (6551 - 9062, n=28) | |
| Huawei MateBook 16 R7 5800H | |
| Lenovo IdeaPad 5 Pro 16ACH | |
| Acer Swift 3 SF316-51 | |
| Huawei MateBook D 16-53011VFJ | |
| Dell XPS 15 9510 i5 11400H FHD | |
| Schenker Vision 15 | |
| Geekbench 5.5 / Single-Core | |
| Average of class Multimedia (805 - 2974, n=56, last 2 years) | |
| Acer Swift 3 SF316-51 | |
| Schenker Vision 15 | |
| Dell XPS 15 9510 i5 11400H FHD | |
| Huawei MateBook 16 R7 5800H | |
| Average AMD Ryzen 7 5800H (1336 - 1505, n=28) | |
| Lenovo IdeaPad 5 Pro 16ACH | |
| Huawei MateBook D 16-53011VFJ | |
| HWBOT x265 Benchmark v2.2 / 4k Preset | |
| Average of class Multimedia (5.26 - 36.1, n=56, last 2 years) | |
| Average AMD Ryzen 7 5800H (11.6 - 16.1, n=29) | |
| Huawei MateBook 16 R7 5800H | |
| Lenovo IdeaPad 5 Pro 16ACH | |
| Huawei MateBook D 16-53011VFJ | |
| Dell XPS 15 9510 i5 11400H FHD | |
| Acer Swift 3 SF316-51 | |
| Schenker Vision 15 | |
| LibreOffice / 20 Documents To PDF | |
| Average AMD Ryzen 7 5800H (47.4 - 113, n=29) | |
| Huawei MateBook D 16-53011VFJ | |
| Average of class Multimedia (23.9 - 146.7, n=57, last 2 years) | |
| Huawei MateBook 16 R7 5800H | |
| Lenovo IdeaPad 5 Pro 16ACH | |
| Dell XPS 15 9510 i5 11400H FHD | |
| Schenker Vision 15 | |
| Acer Swift 3 SF316-51 | |
| R Benchmark 2.5 / Overall mean | |
| Huawei MateBook D 16-53011VFJ | |
| Dell XPS 15 9510 i5 11400H FHD | |
| Schenker Vision 15 | |
| Acer Swift 3 SF316-51 | |
| Lenovo IdeaPad 5 Pro 16ACH | |
| Average AMD Ryzen 7 5800H (0.511 - 0.559, n=28) | |
| Huawei MateBook 16 R7 5800H | |
| Average of class Multimedia (0.3604 - 0.947, n=56, last 2 years) | |
* ... smaller is better
AIDA64: FP32 Ray-Trace | FPU Julia | CPU SHA3 | CPU Queen | FPU SinJulia | FPU Mandel | CPU AES | CPU ZLib | FP64 Ray-Trace | CPU PhotoWorxx
| Performance rating | |
| Average of class Multimedia | |
| Huawei MateBook 16 R7 5800H | |
| Average AMD Ryzen 7 5800H | |
| Lenovo IdeaPad 5 Pro 16ACH | |
| Huawei MateBook D 16-53011VFJ | |
| Schenker Vision 15 | |
| Dell XPS 15 9510 i5 11400H FHD -9! | |
| AIDA64 / FP32 Ray-Trace | |
| Average of class Multimedia (2214 - 50388, n=53, last 2 years) | |
| Huawei MateBook 16 R7 5800H | |
| Average AMD Ryzen 7 5800H (10349 - 15169, n=29) | |
| Lenovo IdeaPad 5 Pro 16ACH | |
| Huawei MateBook D 16-53011VFJ | |
| Schenker Vision 15 | |
| AIDA64 / FPU Julia | |
| Huawei MateBook 16 R7 5800H | |
| Lenovo IdeaPad 5 Pro 16ACH | |
| Average AMD Ryzen 7 5800H (63663 - 95954, n=29) | |
| Average of class Multimedia (12867 - 201874, n=54, last 2 years) | |
| Huawei MateBook D 16-53011VFJ | |
| Schenker Vision 15 | |
| AIDA64 / CPU SHA3 | |
| Average of class Multimedia (626 - 8623, n=54, last 2 years) | |
| Huawei MateBook 16 R7 5800H | |
| Lenovo IdeaPad 5 Pro 16ACH | |
| Average AMD Ryzen 7 5800H (2096 - 3287, n=29) | |
| Schenker Vision 15 | |
| Huawei MateBook D 16-53011VFJ | |
| AIDA64 / CPU Queen | |
| Average AMD Ryzen 7 5800H (91846 - 99215, n=29) | |
| Huawei MateBook 16 R7 5800H | |
| Lenovo IdeaPad 5 Pro 16ACH | |
| Average of class Multimedia (13483 - 181505, n=41, last 2 years) | |
| Huawei MateBook D 16-53011VFJ | |
| Schenker Vision 15 | |
| AIDA64 / FPU SinJulia | |
| Huawei MateBook 16 R7 5800H | |
| Average AMD Ryzen 7 5800H (9962 - 11871, n=29) | |
| Lenovo IdeaPad 5 Pro 16ACH | |
| Huawei MateBook D 16-53011VFJ | |
| Average of class Multimedia (886 - 28794, n=54, last 2 years) | |
| Schenker Vision 15 | |
| AIDA64 / FPU Mandel | |
| Huawei MateBook 16 R7 5800H | |
| Lenovo IdeaPad 5 Pro 16ACH | |
| Average AMD Ryzen 7 5800H (36083 - 52732, n=29) | |
| Average of class Multimedia (6395 - 105740, n=53, last 2 years) | |
| Huawei MateBook D 16-53011VFJ | |
| Schenker Vision 15 | |
| AIDA64 / CPU AES | |
| Huawei MateBook 16 R7 5800H | |
| Lenovo IdeaPad 5 Pro 16ACH | |
| Average AMD Ryzen 7 5800H (50226 - 127832, n=29) | |
| Schenker Vision 15 | |
| Average of class Multimedia (8171 - 126790, n=54, last 2 years) | |
| Huawei MateBook D 16-53011VFJ | |
| AIDA64 / CPU ZLib | |
| Average of class Multimedia (143.8 - 2022, n=54, last 2 years) | |
| Lenovo IdeaPad 5 Pro 16ACH | |
| Huawei MateBook 16 R7 5800H | |
| Average AMD Ryzen 7 5800H (591 - 828, n=29) | |
| Huawei MateBook D 16-53011VFJ | |
| Schenker Vision 15 | |
| Dell XPS 15 9510 i5 11400H FHD | |
| AIDA64 / FP64 Ray-Trace | |
| Average of class Multimedia (1014 - 26875, n=54, last 2 years) | |
| Huawei MateBook 16 R7 5800H | |
| Lenovo IdeaPad 5 Pro 16ACH | |
| Average AMD Ryzen 7 5800H (5457 - 7884, n=29) | |
| Huawei MateBook D 16-53011VFJ | |
| Schenker Vision 15 | |
| AIDA64 / CPU PhotoWorxx | |
| Average of class Multimedia (8187 - 88154, n=54, last 2 years) | |
| Schenker Vision 15 | |
| Huawei MateBook D 16-53011VFJ | |
| Average AMD Ryzen 7 5800H (14445 - 25421, n=29) | |
| Lenovo IdeaPad 5 Pro 16ACH | |
| Huawei MateBook 16 R7 5800H | |
系统管理
尽管缺乏专用的GPU,MateBook 16在合成的PCMark 10中取得了优异的成绩,并轻松达到了我们比较表的前列。我们的主观印象同样良好。我们发现MateBook 16在日常使用中是一个特别快和反应灵敏的伙伴。
MateBook 16支持升级到Windows 11,这使华为笔记本面向未来。华为共享使用户能够在各种华为设备(如平板电脑和智能手机)之间轻松共享文件,甚至可以将平板电脑作为第二屏幕(镜像或扩展显示)。在我们的测试中,这个功能非常好,用一台MatePad Pro(2020年),我们没有遇到任何问题或延迟。
| PCMark 10 / Score | |
| Average of class Multimedia (4325 - 10386, n=52, last 2 years) | |
| Huawei MateBook 16 R7 5800H | |
| Average AMD Ryzen 7 5800H, AMD Radeon RX Vega 8 (Ryzen 4000/5000) (5989 - 6365, n=5) | |
| Lenovo IdeaPad 5 Pro 16ACH | |
| Acer Swift 3 SF316-51 | |
| Schenker Vision 15 | |
| Huawei MateBook D 16-53011VFJ | |
| Dell XPS 15 9510 i5 11400H FHD | |
| PCMark 10 / Essentials | |
| Huawei MateBook 16 R7 5800H | |
| Schenker Vision 15 | |
| Average of class Multimedia (8025 - 11664, n=51, last 2 years) | |
| Average AMD Ryzen 7 5800H, AMD Radeon RX Vega 8 (Ryzen 4000/5000) (10112 - 10690, n=5) | |
| Acer Swift 3 SF316-51 | |
| Lenovo IdeaPad 5 Pro 16ACH | |
| Dell XPS 15 9510 i5 11400H FHD | |
| Huawei MateBook D 16-53011VFJ | |
| PCMark 10 / Productivity | |
| Average of class Multimedia (7323 - 18233, n=51, last 2 years) | |
| Huawei MateBook 16 R7 5800H | |
| Average AMD Ryzen 7 5800H, AMD Radeon RX Vega 8 (Ryzen 4000/5000) (9198 - 9729, n=5) | |
| Lenovo IdeaPad 5 Pro 16ACH | |
| Huawei MateBook D 16-53011VFJ | |
| Acer Swift 3 SF316-51 | |
| Schenker Vision 15 | |
| Dell XPS 15 9510 i5 11400H FHD | |
| PCMark 10 / Digital Content Creation | |
| Average of class Multimedia (3651 - 16240, n=51, last 2 years) | |
| Huawei MateBook 16 R7 5800H | |
| Lenovo IdeaPad 5 Pro 16ACH | |
| Average AMD Ryzen 7 5800H, AMD Radeon RX Vega 8 (Ryzen 4000/5000) (6236 - 6730, n=5) | |
| Acer Swift 3 SF316-51 | |
| Huawei MateBook D 16-53011VFJ | |
| Schenker Vision 15 | |
| Dell XPS 15 9510 i5 11400H FHD | |
| PCMark 10 Score | 6365 points | |
Help | ||
| AIDA64 / Memory Copy | |
| Average of class Multimedia (11299 - 132135, n=54, last 2 years) | |
| Schenker Vision 15 | |
| Average AMD Ryzen 7 5800H (34964 - 44180, n=29) | |
| Lenovo IdeaPad 5 Pro 16ACH | |
| Huawei MateBook 16 R7 5800H | |
| Huawei MateBook D 16-53011VFJ | |
| AIDA64 / Memory Read | |
| Average of class Multimedia (11624 - 174586, n=54, last 2 years) | |
| Schenker Vision 15 | |
| Average AMD Ryzen 7 5800H (39548 - 47260, n=29) | |
| Lenovo IdeaPad 5 Pro 16ACH | |
| Huawei MateBook 16 R7 5800H | |
| Huawei MateBook D 16-53011VFJ | |
| AIDA64 / Memory Write | |
| Average of class Multimedia (11755 - 134998, n=54, last 2 years) | |
| Schenker Vision 15 | |
| Average AMD Ryzen 7 5800H (28456 - 47022, n=29) | |
| Huawei MateBook D 16-53011VFJ | |
| Huawei MateBook 16 R7 5800H | |
| Lenovo IdeaPad 5 Pro 16ACH | |
| AIDA64 / Memory Latency | |
| Average of class Multimedia (7 - 535, n=53, last 2 years) | |
| Schenker Vision 15 | |
| Average AMD Ryzen 7 5800H (76.3 - 105.1, n=29) | |
| Huawei MateBook D 16-53011VFJ | |
| Huawei MateBook 16 R7 5800H | |
| Lenovo IdeaPad 5 Pro 16ACH | |
| Dell XPS 15 9510 i5 11400H FHD | |
* ... smaller is better
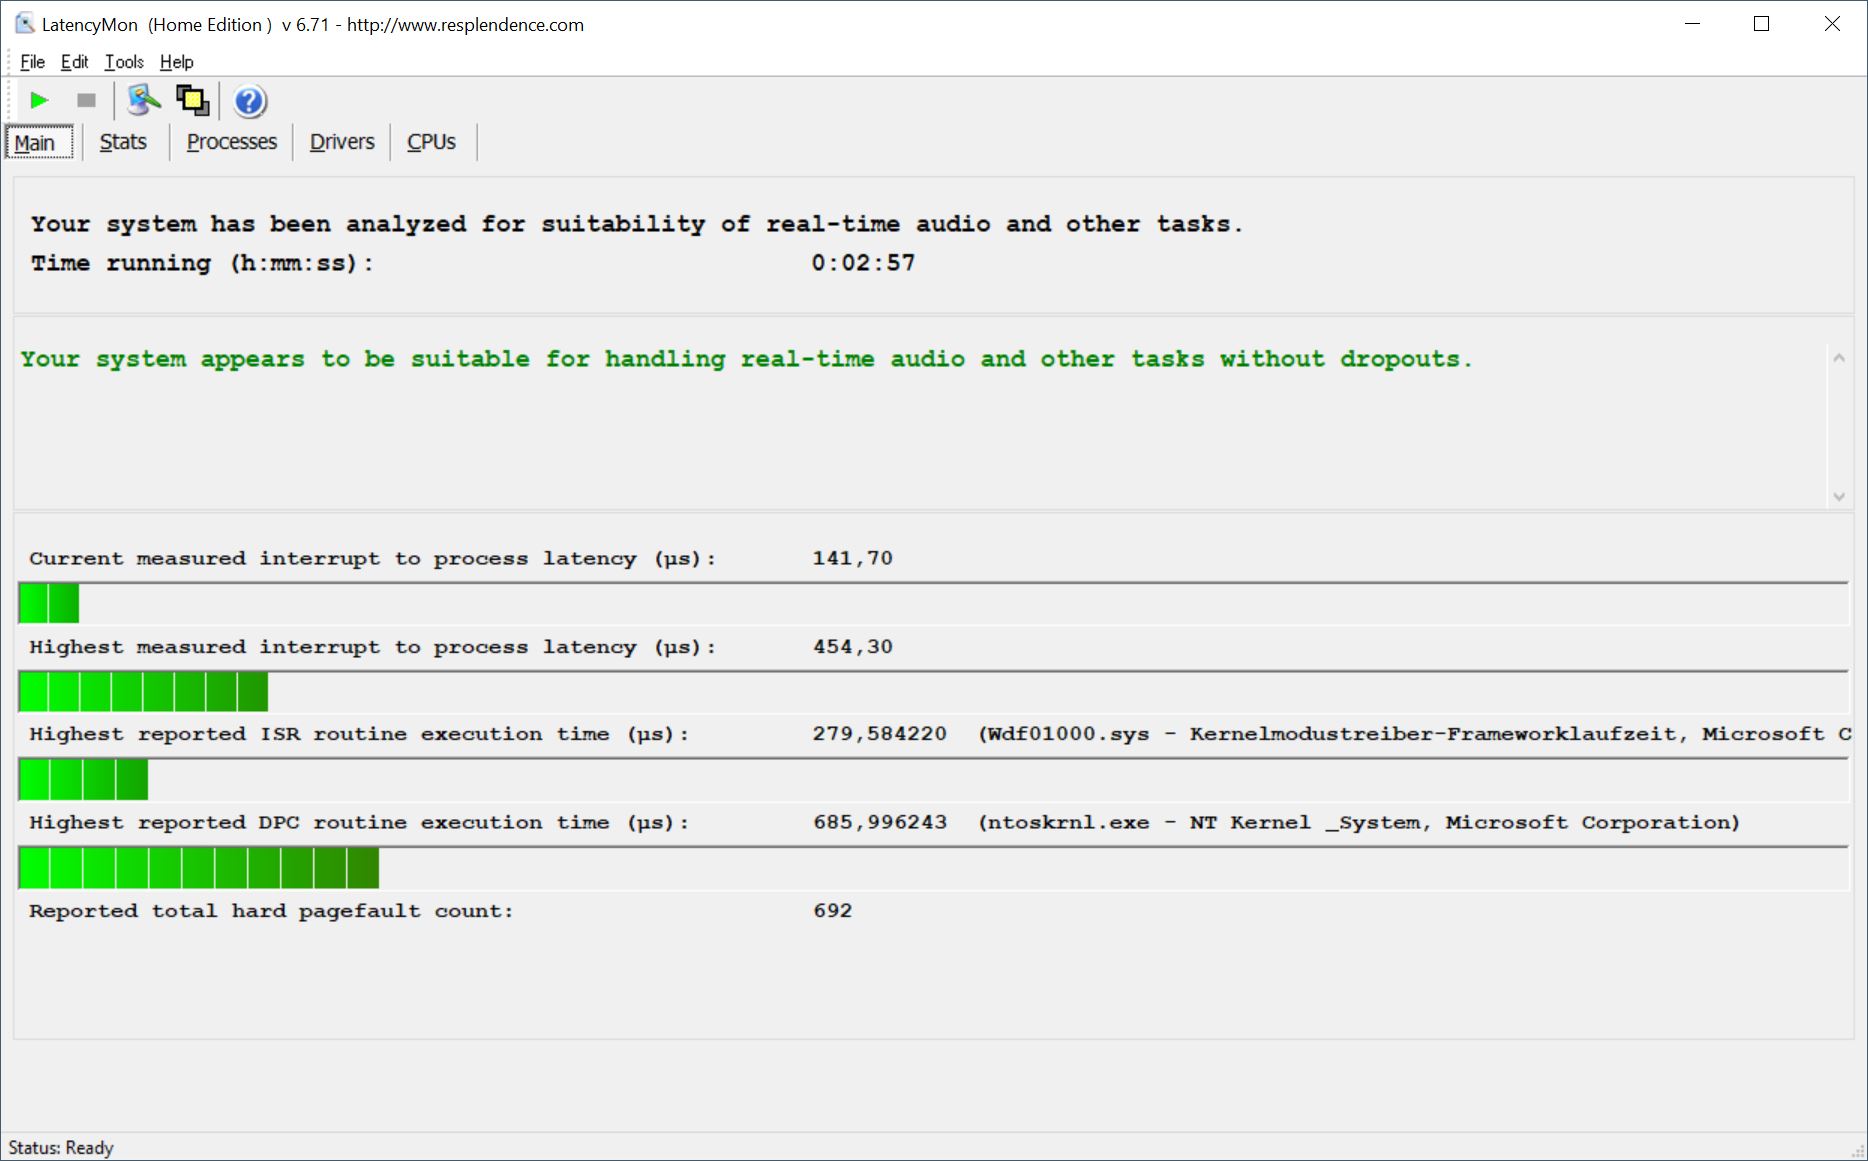
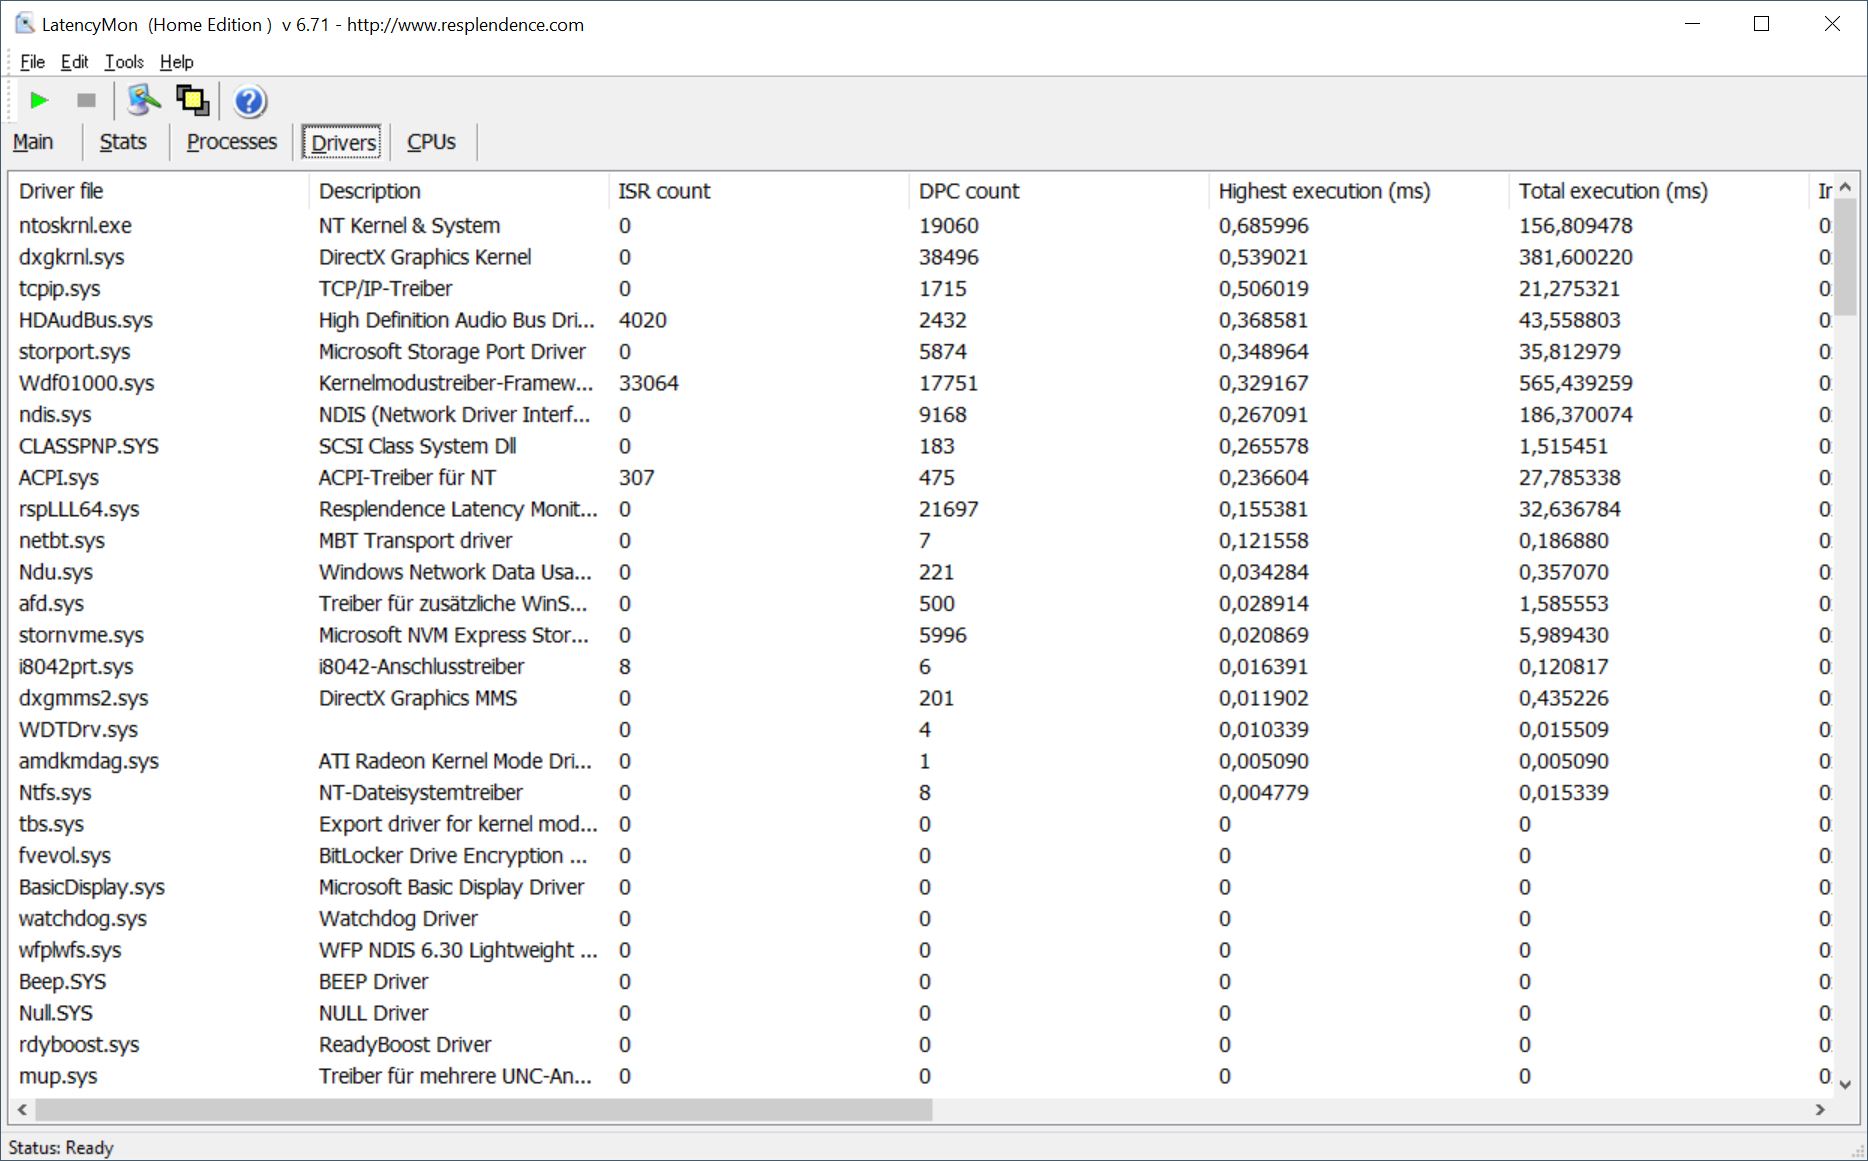
DPC延迟
我们的标准化延迟测试(打开几个浏览器标签浏览网页,在YouTube上播放4K视频,CPU负载)并没有表明我们的测试装置有任何问题,这使得它适合于使用实时音频的应用程序。
| DPC Latencies / LatencyMon - interrupt to process latency (max), Web, Youtube, Prime95 | |
| Schenker Vision 15 | |
| Dell XPS 15 9510 i5 11400H FHD | |
| Huawei MateBook D 16-53011VFJ | |
| Lenovo IdeaPad 5 Pro 16ACH | |
| Huawei MateBook 16 R7 5800H | |
| Acer Swift 3 SF316-51 | |
* ... smaller is better
存储设备
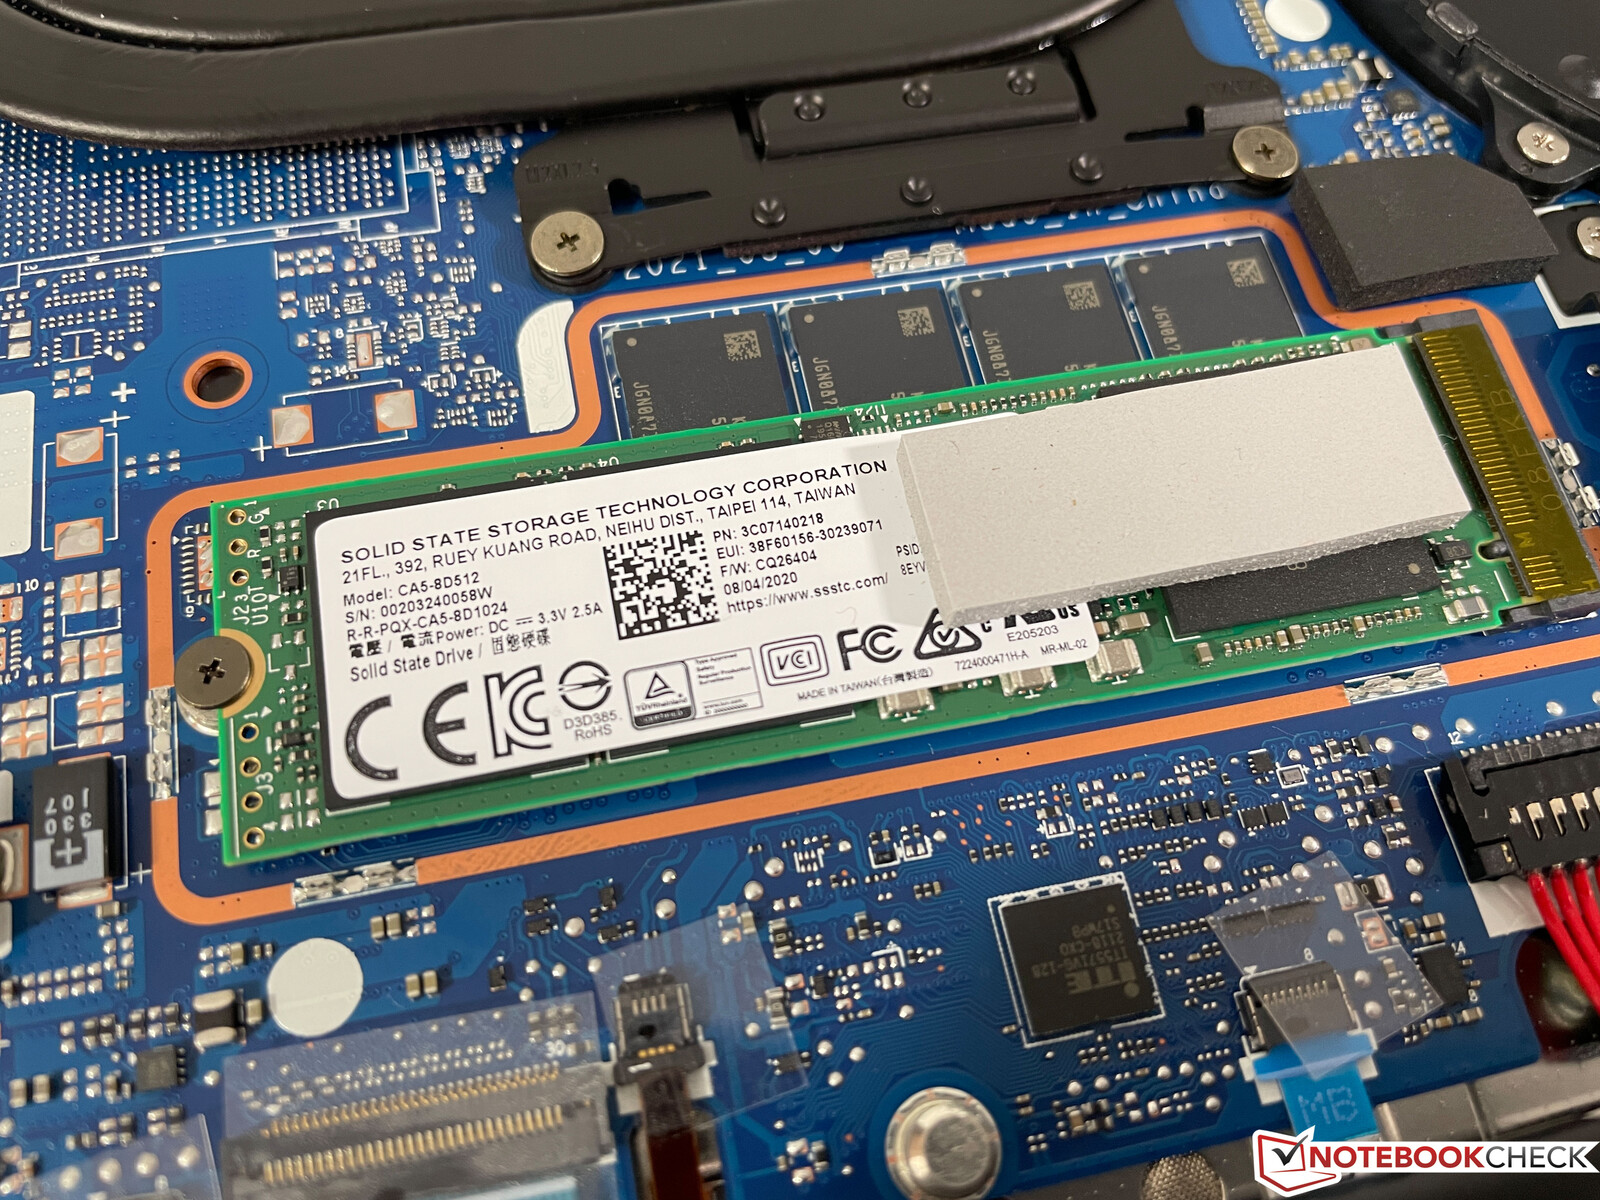
来自Lite-On的单个512-GB M.2 2280 SSD通过PCIe 3.0 x4连接。传输速率非常好,并且达到了PCIe 3.0接口的极限,所以只有在你需要更多存储空间的时候,升级存储设备才有意义。与其他华为笔记本电脑一样,固态硬盘已经在出厂前进行了分区,这相当没有必要,实际上会导致问题。系统驱动器在初始启动后只有71GB可用,因此,如果一些用户不小心下载和安装文件和程序,可能很快就会达到极限。剩余的337GB可用在数据(D)分区。了解更多关于SSD基准的信息 这里.
* ... smaller is better

Disk Throttling: DiskSpd Read Loop, Queue Depth 8
图形
该处理器的Radeon RX Vega 8负责显示图形。它的原始性能比英特尔目前最快的型号低约20%-30%(取决于基准测试)。 Iris Xe Graphics G796个EUs,比Ryzen 4000中的旧版Vega 8快约30%。 Ryzen 4000一代中的Vega 8.目前Vega 8的最大优势是其显著改进的视频解码器变得更加高效,现在可以击败英特尔Iris Xe(在播放4K视频时,大约8%对32%的GPU负载)。
MateBook 16轻松通过了苛刻的3DMarkTime Spy 压力测试(99.6%),在电池运行时,图形性能仍然稳定。了解更多关于GPU基准测试 这里.
| 3DMark 11 Performance | 6278 points | |
| 3DMark Ice Storm Standard Score | 164152 points | |
| 3DMark Cloud Gate Standard Score | 25813 points | |
| 3DMark Fire Strike Score | 3441 points | |
| 3DMark Time Spy Score | 1357 points | |
Help | ||
游戏性能
Witcher 3 FPS diagram
| low | med. | high | ultra | |
|---|---|---|---|---|
| GTA V (2015) | 112 | 103 | 26.3 | 10.5 |
| The Witcher 3 (2015) | 72 | 22 | 14.6 | |
| Dota 2 Reborn (2015) | 124 | 95.5 | 53.7 | 50.8 |
| Final Fantasy XV Benchmark (2018) | 37.2 | 18.1 | 12.1 | |
| X-Plane 11.11 (2018) | 53.2 | 41.7 | 36.8 | |
| Far Cry 5 (2018) | 22 | 21 | 20 | |
| Strange Brigade (2018) | 85 | 33 | 29 | 25 |
| F1 2020 (2020) | 94 | 44 | 33 | 24 |
| F1 2021 (2021) | 96.7 | 40.3 | 30.9 | 21.4 |
| FIFA 22 (2021) | 166 | 106 | 89 | 78 |
排放--MateBook在日常使用中仍然非常安静
系统噪音
尽管该设备的性能很高,但冷却系统似乎工作得很好,因为在浏览网页或播放高分辨率视频时,大部分时间它几乎保持沉默。第一个风扇阶段(大约27 dB(A))在安静的环境中只能听到一点声音。即使在游戏时,风扇也保持平静;我们在Witcher 3 ,测得最大的32 dB(A)。在CPU上负载较重的游戏确实会导致风扇轻微转动,但不会大到使人难以使用内部扬声器。
只有当CPU处于持续的满负荷状态时,风扇才会变得非常响亮,不过即使如此,也要在一分钟后才开始听到它们。几分钟后,风扇的最大音量达到约42 dB(A)。幸运的是,风扇噪音的频率并不是特别高。我们没有注意到任何其他电子噪音,如线圈啸叫。
| Huawei MateBook 16 R7 5800H Vega 8, R7 5800H, Lite-On CA5-8D512 | Acer Swift 3 SF316-51 Iris Xe G7 96EUs, i7-11370H, Micron 2210 MTFDHBA512QFD | Huawei MateBook D 16-53011VFJ Vega 6, R5 4600H, Samsung SSD PM981a MZVLB512HBJQ | Lenovo IdeaPad 5 Pro 16ACH GeForce GTX 1650 Mobile, R7 5800H, Micron 2300 512GB MTFDHBA512TDV | Schenker Vision 15 Iris Xe G7 96EUs, i7-1165G7, Samsung SSD 980 Pro 1TB MZ-V8P1T0BW | Dell XPS 15 9510 i5 11400H FHD UHD Graphics Xe 16EUs, i5-11400H, Micron 2300 512GB MTFDHBA512TDV | |
|---|---|---|---|---|---|---|
| Noise | -2% | -1% | -13% | -18% | 6% | |
| off / environment * (dB) | 24.8 | 26 -5% | 25.5 -3% | 24.04 3% | 29.8 -20% | 24.4 2% |
| Idle Minimum * (dB) | 24.8 | 26 -5% | 25.5 -3% | 24.04 3% | 29.8 -20% | 24.4 2% |
| Idle Average * (dB) | 24.8 | 26 -5% | 25.5 -3% | 24.04 3% | 29.8 -20% | 24.4 2% |
| Idle Maximum * (dB) | 26.7 | 27.7 -4% | 25.5 4% | 24.04 10% | 31.1 -16% | 24.4 9% |
| Load Average * (dB) | 32 | 32.7 -2% | 33 -3% | 41.3 -29% | 40.5 -27% | 26.1 18% |
| Witcher 3 ultra * (dB) | 32 | 49.21 -54% | 40.5 -27% | 33.2 -4% | ||
| Load Maximum * (dB) | 42.4 | 39 8% | 42.1 1% | 52.93 -25% | 40.5 4% | 37.7 11% |
* ... smaller is better
Noise level
| Idle |
| 24.8 / 24.8 / 26.7 dB(A) |
| Load |
| 32 / 42.4 dB(A) |
 | ||
30 dB silent 40 dB(A) audible 50 dB(A) loud |
||
min: | ||
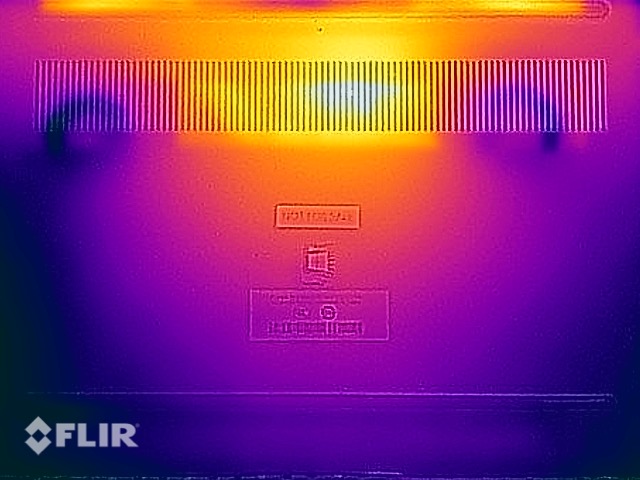
温度
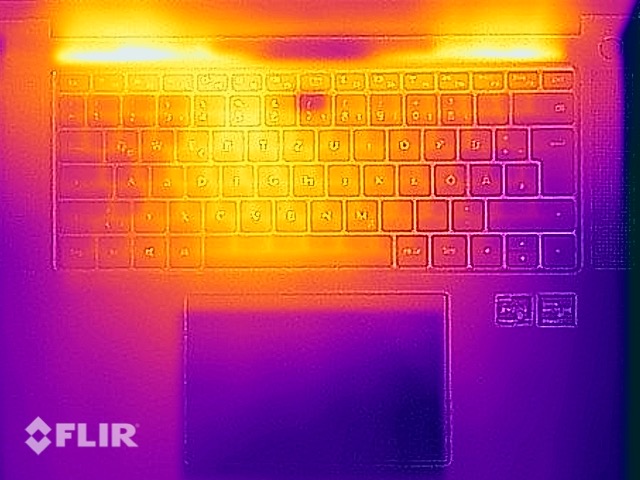
MateBook 16的外壳在日常工作/低负荷时几乎不发热。当设备处于负载状态时,热量的发展主要被控制在底座底部的后部中心区域,我们在那里测得的热点为50℃。即使在这种情况下,该设备仍然可以在膝上使用,因为设备的这一区域通常不直接接触你的身体。在基本单元的顶部,用户在压力测试中会感觉到键盘轻微发热,但这不会真正导致任何限制。
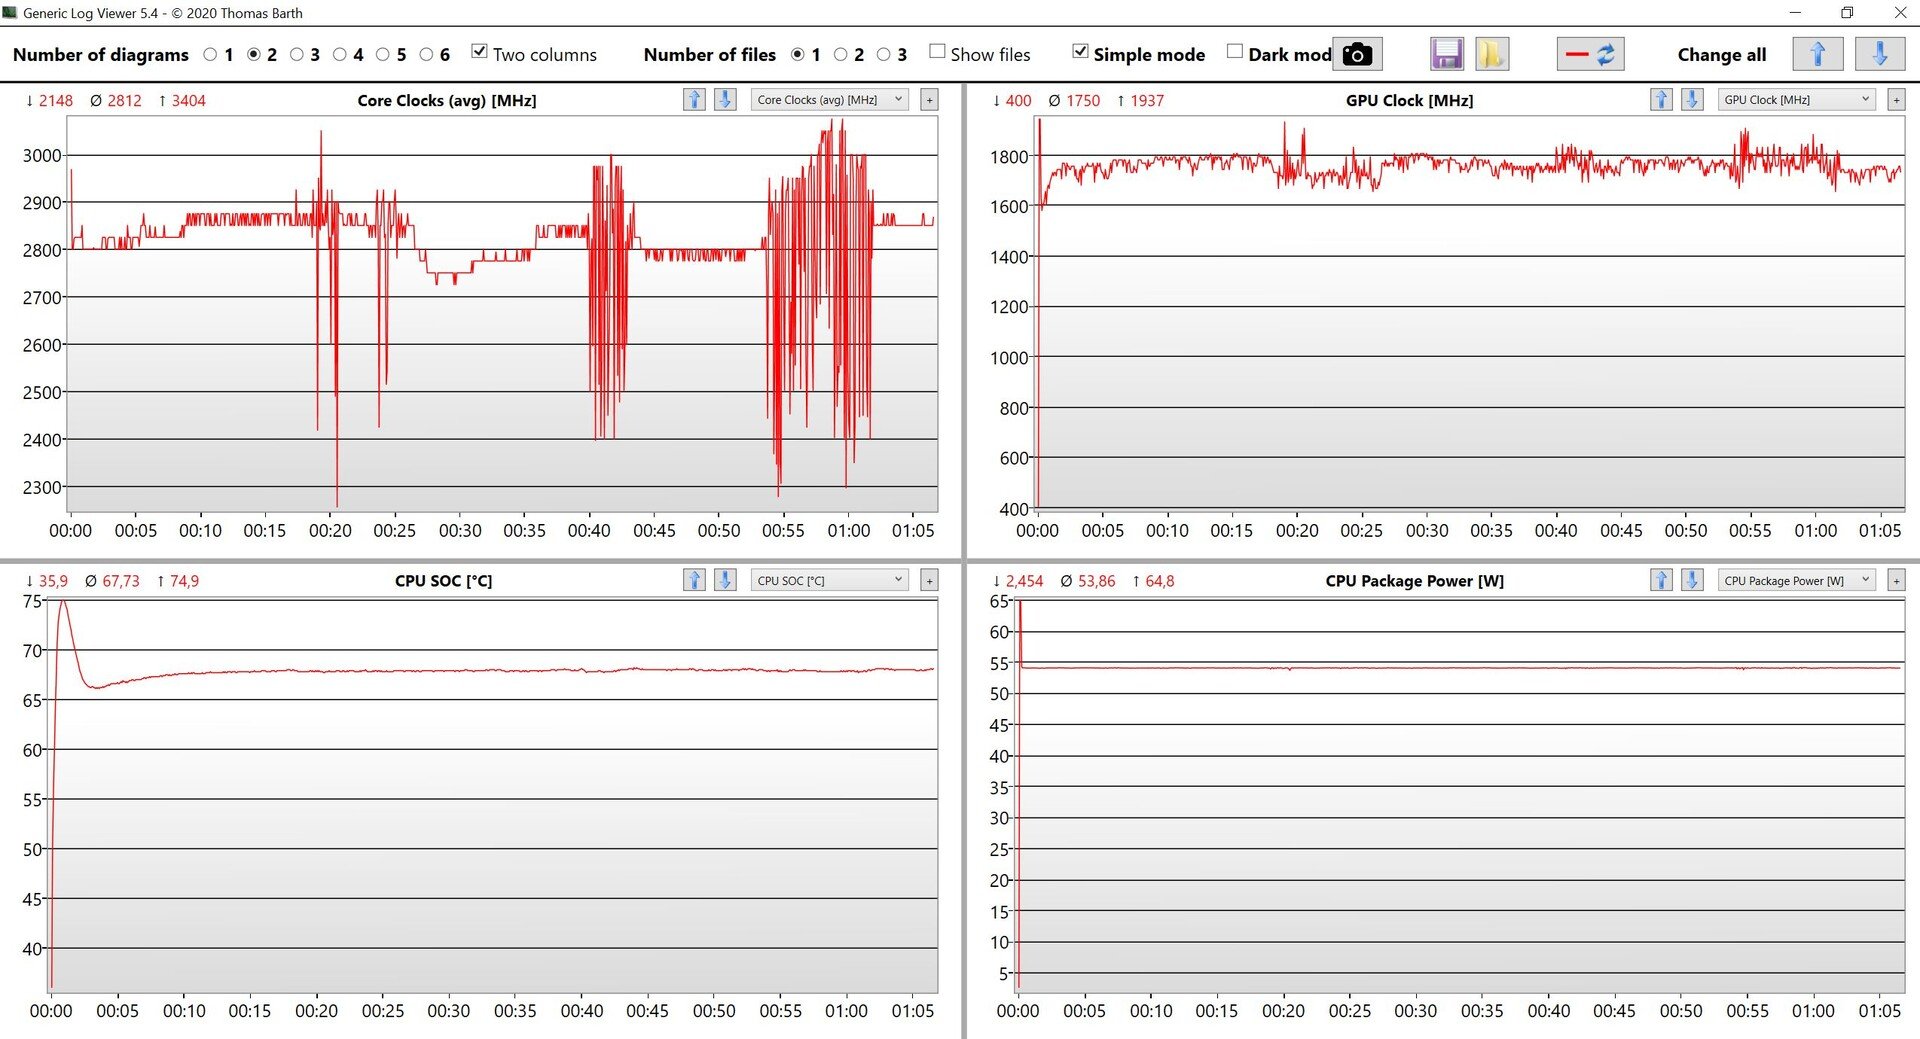
MateBook 16的性能非常稳定,在压力测试期间,CPU的总消耗量为54瓦,给人留下深刻印象。处理器的平均时钟频率为8 x 2.8 GHz,iGPU的时钟频率为1,750 MHz。
(±) The maximum temperature on the upper side is 40.2 °C / 104 F, compared to the average of 36.8 °C / 98 F, ranging from 21 to 71 °C for the class Multimedia.
(-) The bottom heats up to a maximum of 49.7 °C / 121 F, compared to the average of 39.1 °C / 102 F
(+) In idle usage, the average temperature for the upper side is 25.6 °C / 78 F, compared to the device average of 31.3 °C / 88 F.
(+) Playing The Witcher 3, the average temperature for the upper side is 30.3 °C / 87 F, compared to the device average of 31.3 °C / 88 F.
(+) The palmrests and touchpad are cooler than skin temperature with a maximum of 28 °C / 82.4 F and are therefore cool to the touch.
(±) The average temperature of the palmrest area of similar devices was 28.7 °C / 83.7 F (+0.7 °C / 1.3 F).
演讲者
键盘旁边的两个立体声扬声器产生的声音出乎意料地响亮和饱满。当然,缺少低音,但视频和音乐在该设备上听起来都相当不错。虽然竞争者戴尔XPS 15有稍好的扬声器,但在某些情况下,这些扬声器也有过载的趋势。
Huawei MateBook 16 R7 5800H audio analysis
(+) | speakers can play relatively loud (86 dB)
Bass 100 - 315 Hz
(±) | reduced bass - on average 6.5% lower than median
(±) | linearity of bass is average (7.3% delta to prev. frequency)
Mids 400 - 2000 Hz
(±) | higher mids - on average 7.2% higher than median
(+) | mids are linear (4.5% delta to prev. frequency)
Highs 2 - 16 kHz
(+) | balanced highs - only 4.6% away from median
(+) | highs are linear (5.2% delta to prev. frequency)
Overall 100 - 16.000 Hz
(+) | overall sound is linear (12.1% difference to median)
Compared to same class
» 22% of all tested devices in this class were better, 3% similar, 76% worse
» The best had a delta of 5%, average was 17%, worst was 45%
Compared to all devices tested
» 10% of all tested devices were better, 2% similar, 88% worse
» The best had a delta of 4%, average was 23%, worst was 134%
Dell XPS 15 9510 i5 11400H FHD audio analysis
(+) | speakers can play relatively loud (88.8 dB)
Bass 100 - 315 Hz
(±) | reduced bass - on average 5.6% lower than median
(+) | bass is linear (4.3% delta to prev. frequency)
Mids 400 - 2000 Hz
(+) | balanced mids - only 3.9% away from median
(+) | mids are linear (4.1% delta to prev. frequency)
Highs 2 - 16 kHz
(+) | balanced highs - only 2.4% away from median
(+) | highs are linear (4.9% delta to prev. frequency)
Overall 100 - 16.000 Hz
(+) | overall sound is linear (8.4% difference to median)
Compared to same class
» 9% of all tested devices in this class were better, 2% similar, 89% worse
» The best had a delta of 5%, average was 17%, worst was 45%
Compared to all devices tested
» 2% of all tested devices were better, 1% similar, 97% worse
» The best had a delta of 4%, average was 23%, worst was 134%
耗电量 - 电池寿命长
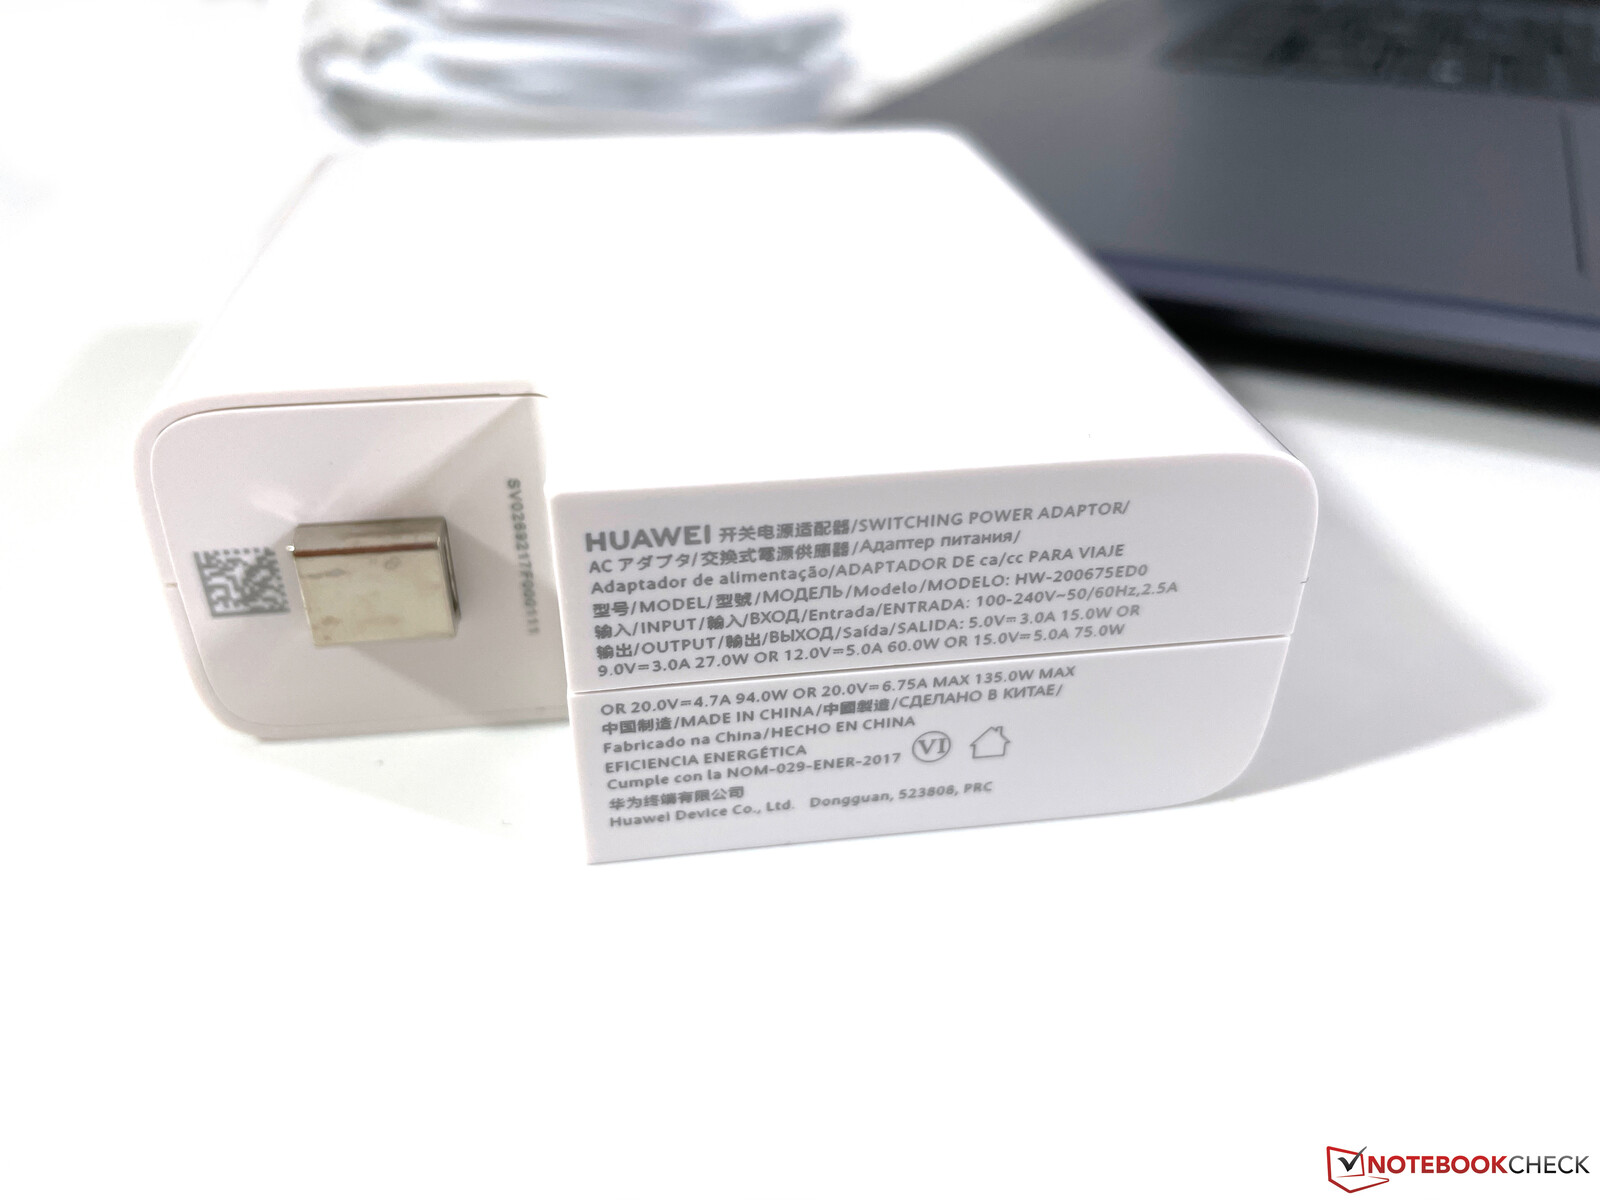
一般来说,高分辨率显示屏会消耗相当多的电力,MateBook 16在负载时是所有带iGPU的对比设备中功耗最高的。负载下的最大功耗为100瓦,然后降至90瓦。附带的135瓦交流适配器是足够的,可以在重载下继续为设备充电。
| Off / Standby | |
| Idle | |
| Load |
|
Key:
min: | |
| Huawei MateBook 16 R7 5800H R7 5800H, Vega 8, Lite-On CA5-8D512, , 2520x1680, 16" | Acer Swift 3 SF316-51 i7-11370H, Iris Xe G7 96EUs, Micron 2210 MTFDHBA512QFD, IPS, 1920x1080, 16.1" | Huawei MateBook D 16-53011VFJ R5 4600H, Vega 6, Samsung SSD PM981a MZVLB512HBJQ, IPS, 1920x1080, 16.1" | Lenovo IdeaPad 5 Pro 16ACH R7 5800H, GeForce GTX 1650 Mobile, Micron 2300 512GB MTFDHBA512TDV, IPS LED, 2560x1600, 16" | Schenker Vision 15 i7-1165G7, Iris Xe G7 96EUs, Samsung SSD 980 Pro 1TB MZ-V8P1T0BW, IPS, 1920x1080, 15.6" | Dell XPS 15 9510 i5 11400H FHD i5-11400H, UHD Graphics Xe 16EUs, Micron 2300 512GB MTFDHBA512TDV, IPS, 1920x1200, 15.6" | Average AMD Radeon RX Vega 8 (Ryzen 4000/5000) | Average of class Multimedia | |
|---|---|---|---|---|---|---|---|---|
| Power Consumption | 29% | 20% | -24% | 29% | 22% | 18% | -11% | |
| Idle Minimum * (Watt) | 4.6 | 4.8 -4% | 5.2 -13% | 5.7 -24% | 3.5 24% | 5.3 -15% | 5.3 ? -15% | 5.66 ? -23% |
| Idle Average * (Watt) | 10.5 | 7.4 30% | 8.2 22% | 9.3 11% | 6.3 40% | 9 14% | 7.85 ? 25% | 10.2 ? 3% |
| Idle Maximum * (Watt) | 11.2 | 9 20% | 9.4 16% | 11 2% | 6.8 39% | 9.7 13% | 9.31 ? 17% | 12.5 ? -12% |
| Load Average * (Watt) | 59.1 | 34.9 41% | 40 32% | 83.4 -41% | 43.2 27% | 30.3 49% | 44.2 ? 25% | 65.2 ? -10% |
| Witcher 3 ultra * (Watt) | 58.6 | 34.9 40% | 40.5 31% | 94.4 -61% | 52 11% | 30.6 48% | ||
| Load Maximum * (Watt) | 98.3 | 51.4 48% | 67 32% | 128.7 -31% | 67.7 31% | 76.2 22% | 58.9 ? 40% | 113.5 ? -15% |
* ... smaller is better
Power Consumption Witcher 3 / Stress test
电池寿命
84瓦时的电池提供了非常好的电池寿命。我们在视频测试中达到13小时,在Wi-Fi测试中达到11小时,两者的亮度都是150尼特(约为最大亮度的46%)。在最大亮度下,Wi-Fi电池寿命仍然不错,达到8.5小时。电池在负载下1.5小时内耗尽。
尽管有宣传的超级充电技术,但我们没能让快速充电功能发挥作用(在电脑管理器中也没有设置)。大约65分钟后,电池达到50%的容量。在我们的测试中,在设备打开的情况下,为电池完全充电大约需要150分钟。
| Huawei MateBook 16 R7 5800H R7 5800H, Vega 8, 84 Wh | Acer Swift 3 SF316-51 i7-11370H, Iris Xe G7 96EUs, 56 Wh | Huawei MateBook D 16-53011VFJ R5 4600H, Vega 6, 56 Wh | Lenovo IdeaPad 5 Pro 16ACH R7 5800H, GeForce GTX 1650 Mobile, 75 Wh | Schenker Vision 15 i7-1165G7, Iris Xe G7 96EUs, 73 Wh | Dell XPS 15 9510 i5 11400H FHD i5-11400H, UHD Graphics Xe 16EUs, 56 Wh | Average of class Multimedia | |
|---|---|---|---|---|---|---|---|
| Battery runtime | -3% | -24% | 5% | 28% | -42% | 24% | |
| H.264 (h) | 10.9 | 10.3 -6% | 8.5 -22% | 10.4 -5% | 18.7 72% | 17.1 ? 57% | |
| WiFi v1.3 (h) | 12.8 | 9.8 -23% | 9 -30% | 12.6 -2% | 15.2 19% | 7.4 -42% | 12.2 ? -5% |
| Load (h) | 1.4 | 1.7 21% | 1.1 -21% | 1.7 21% | 1.3 -7% | 1.664 ? 19% | |
| Reader / Idle (h) | 20.1 | 11.8 | 24.9 ? | ||||
| Witcher 3 ultra (h) | 2.2 | 1 |
Pros
Cons
结论 - MateBook 16没有明显的弱点
新的MateBook 16在我们的测试中给人留下了非常好的印象--特别是考虑到其价格。在质量方面,该设备可以轻松跟上价格明显更高的戴尔XPS 15 ,而且还在众多被塑料包裹的竞争对手中脱颖而出。虽然MateBook 16不是最轻或最薄的笔记本,但这对其刚性和热特性以及风扇噪音有积极影响。更薄并不总是更好。
华为决定为其MateBook配备强大的Ryzen 5000处理器,功率为45W,可以经受住连续的负载而不影响其性能。尽管英特尔目前的Tiger Lake 处理器(如i7-11800H)也能提供这个级别的性能,但它们需要更多的功率来实现。因此,MateBook 16提供的CPU性能超过了当前大多数工作站,后者几乎仍然全部基于英特尔CPU。AMD还优化了CPU的功耗,该设备的电池寿命非常好。
MateBook 16没有配备专用的GPU,因此希望在设备上玩新游戏的用户必须到其他地方寻找。除此之外,iGPU非常适用于日常应用和显示高分辨率视频,良好的扬声器进一步支持了这一点。新的3:2显示屏在大多数方面都做得很好,但它的反射率很高,有时可能会导致阅读屏幕的困难。
MateBook 16是一款不错的多媒体笔记本,没有任何严重的弱点。它的高CPU性能胜过大多数移动工作站,显示屏也很好。更不用说出色的性价比了。
当然,有几个方面仍然可以改进,比如网络摄像头的位置和质量,改用插入式内存模块和集成USB 4,尽管至少后一点应该随着下一代AMD CPU的推出而得到解决。稍微有限的连接性(没有SD卡读卡器)也对我们的评级产生了一点影响。尽管如此,我们绝对可以推荐MateBook 16,尤其是因为它的价格合理。我们的审查表明带iGPU的XPS 15如果它最终配备了AMD的CPU,会是什么样子。对更多游戏性能感兴趣的用户应该看一下IdeaPad 5 Pro,它将快速的Ryzen 7处理器与GeForce GTX 1650.该斯肯克视觉15另一方面,它更便于携带,并提供略多的图形性能。
价格和可用性
在撰写本报告时,MateBook 16只在亚洲和欧洲上市,但预计在不久的将来会在英国和美国上市。
Huawei MateBook 16 R7 5800H
- 10/21/2021 v7 (old)
Andreas Osthoff
Price comparison

