Ninkear A15 Plus 笔记本电脑评测:出人意料的出色和实惠

中国笔记本电脑制造商的数量难以计数。Ninkear 就是其中之一,主要提供价廉物美的笔记本电脑。所提供的笔记本电脑通常没有最新的硬件,但正如我们的测试所显示的,即使是一台 AMD Ryzen 7 5700U也足以满足 2024 年的日常使用需求。
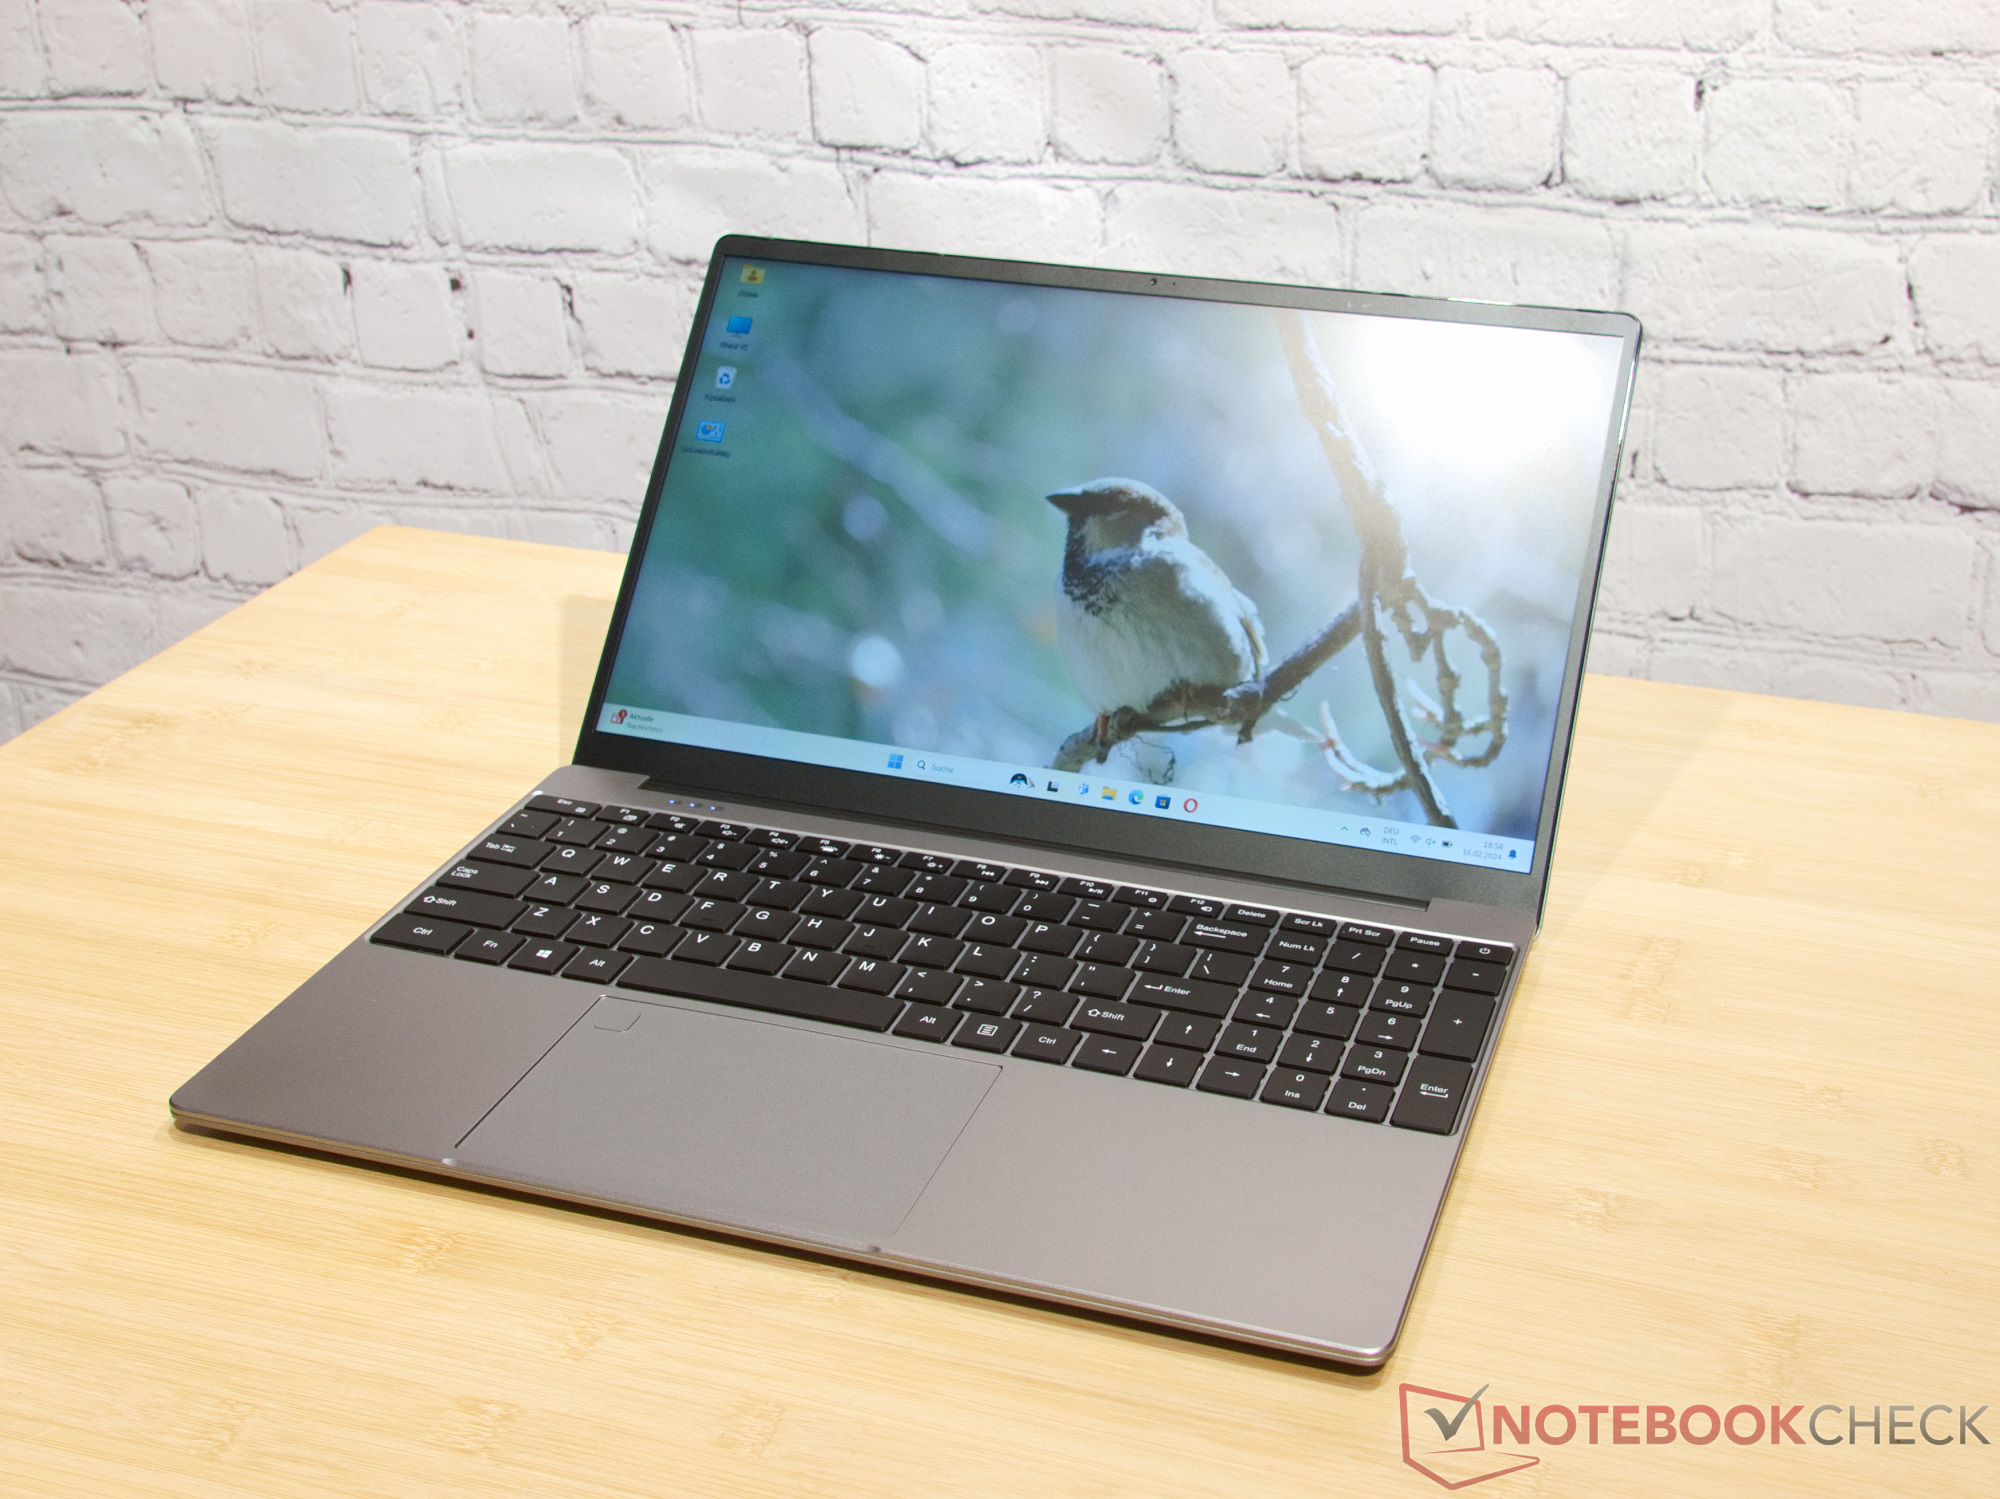
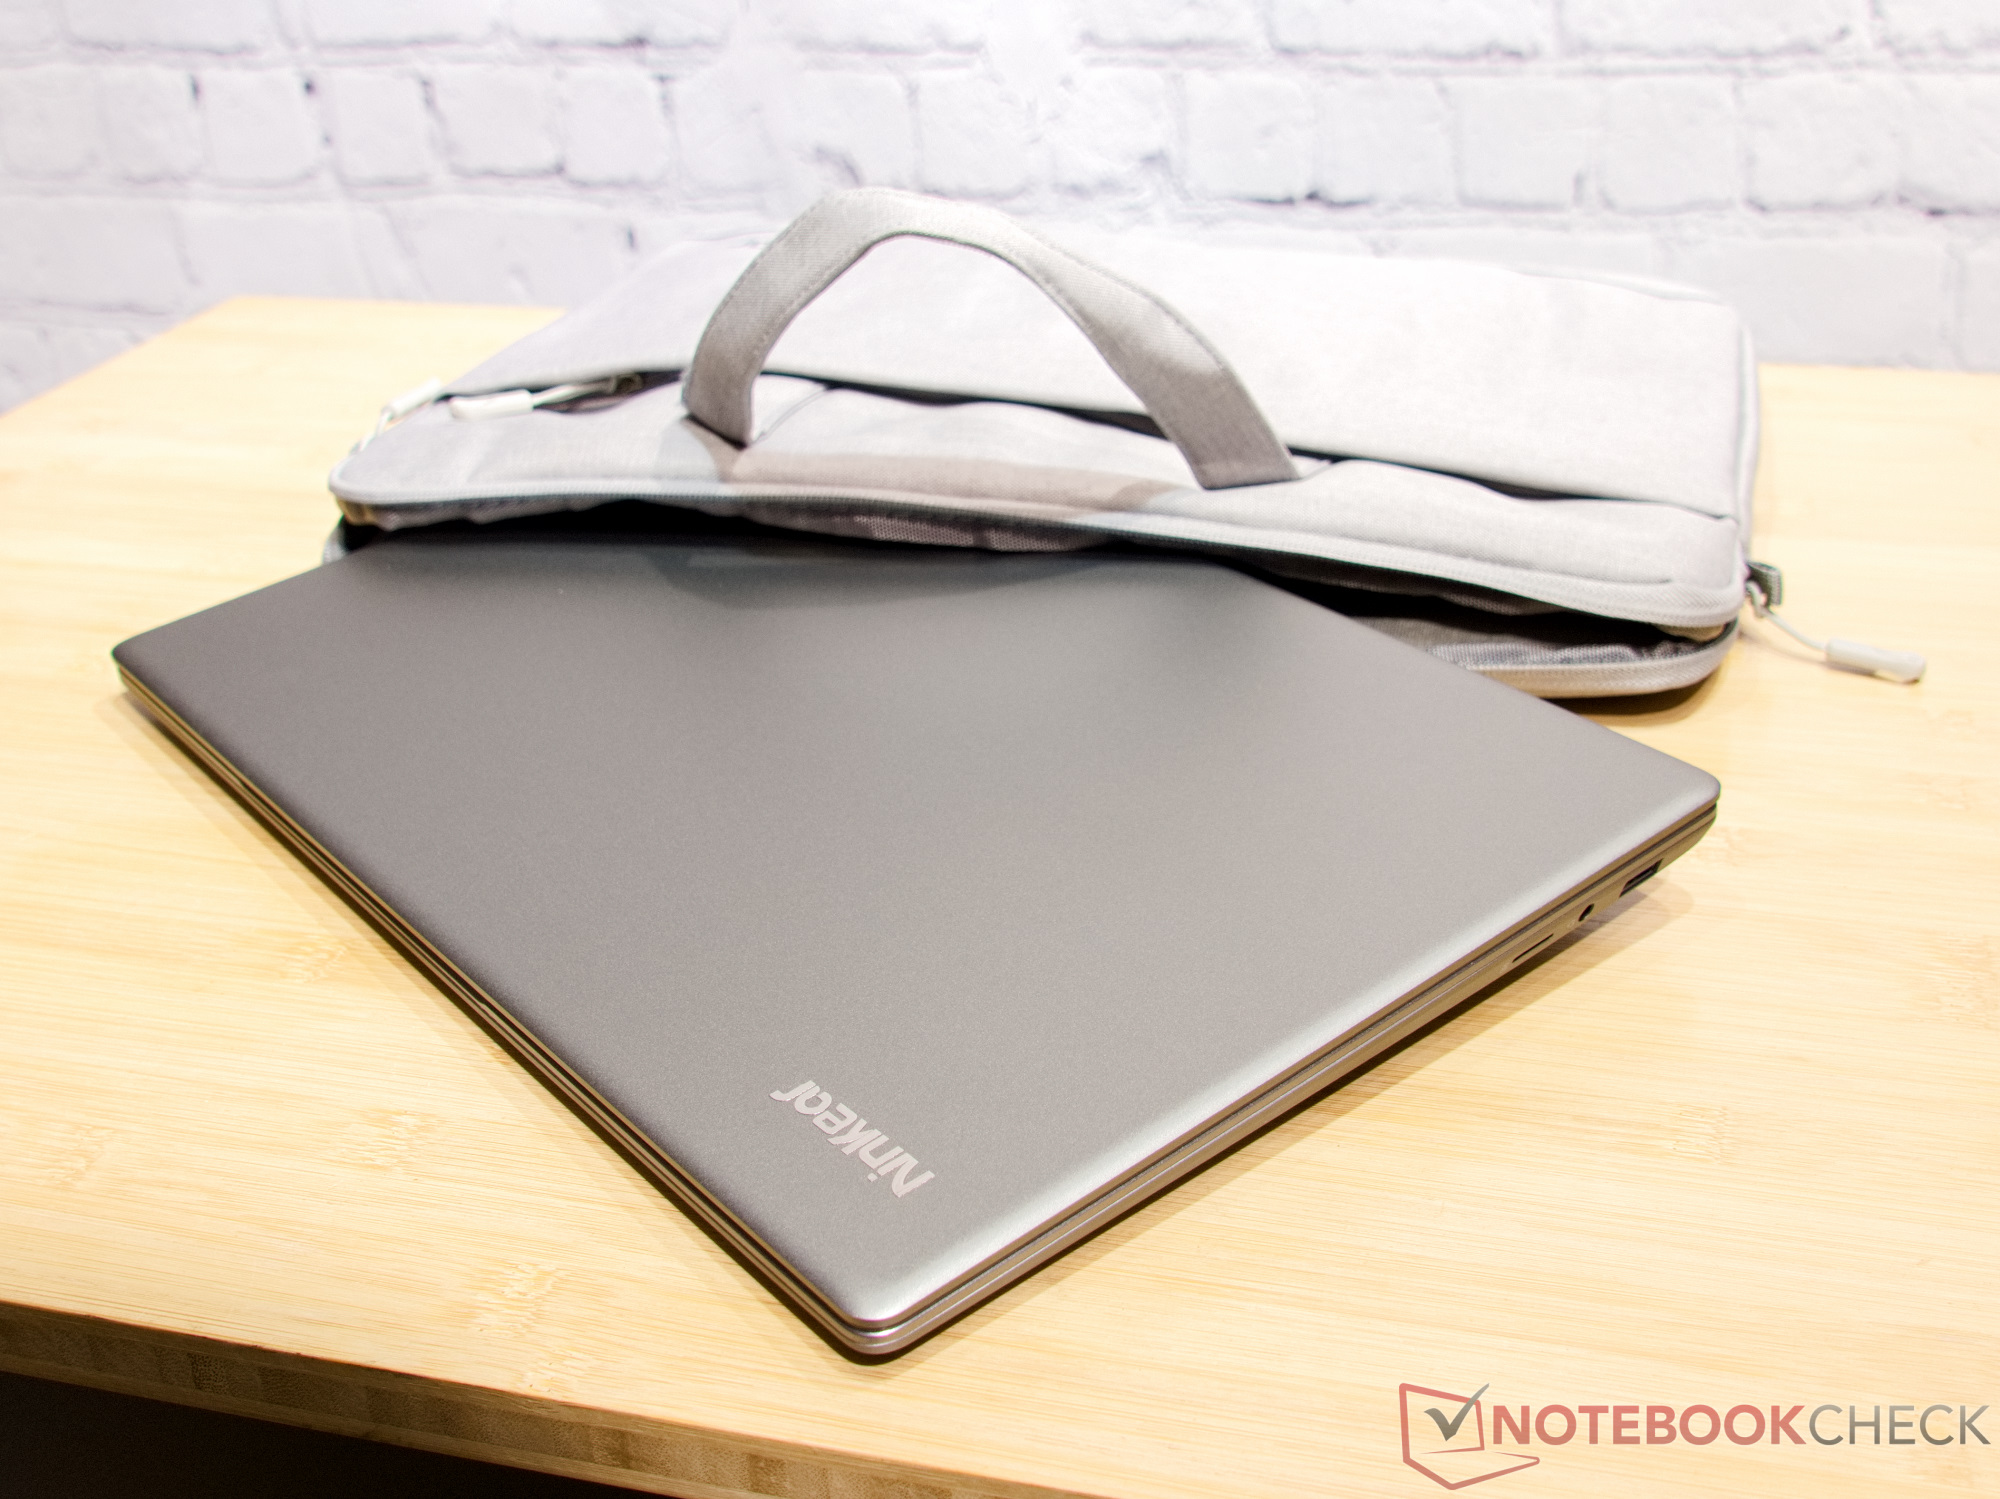
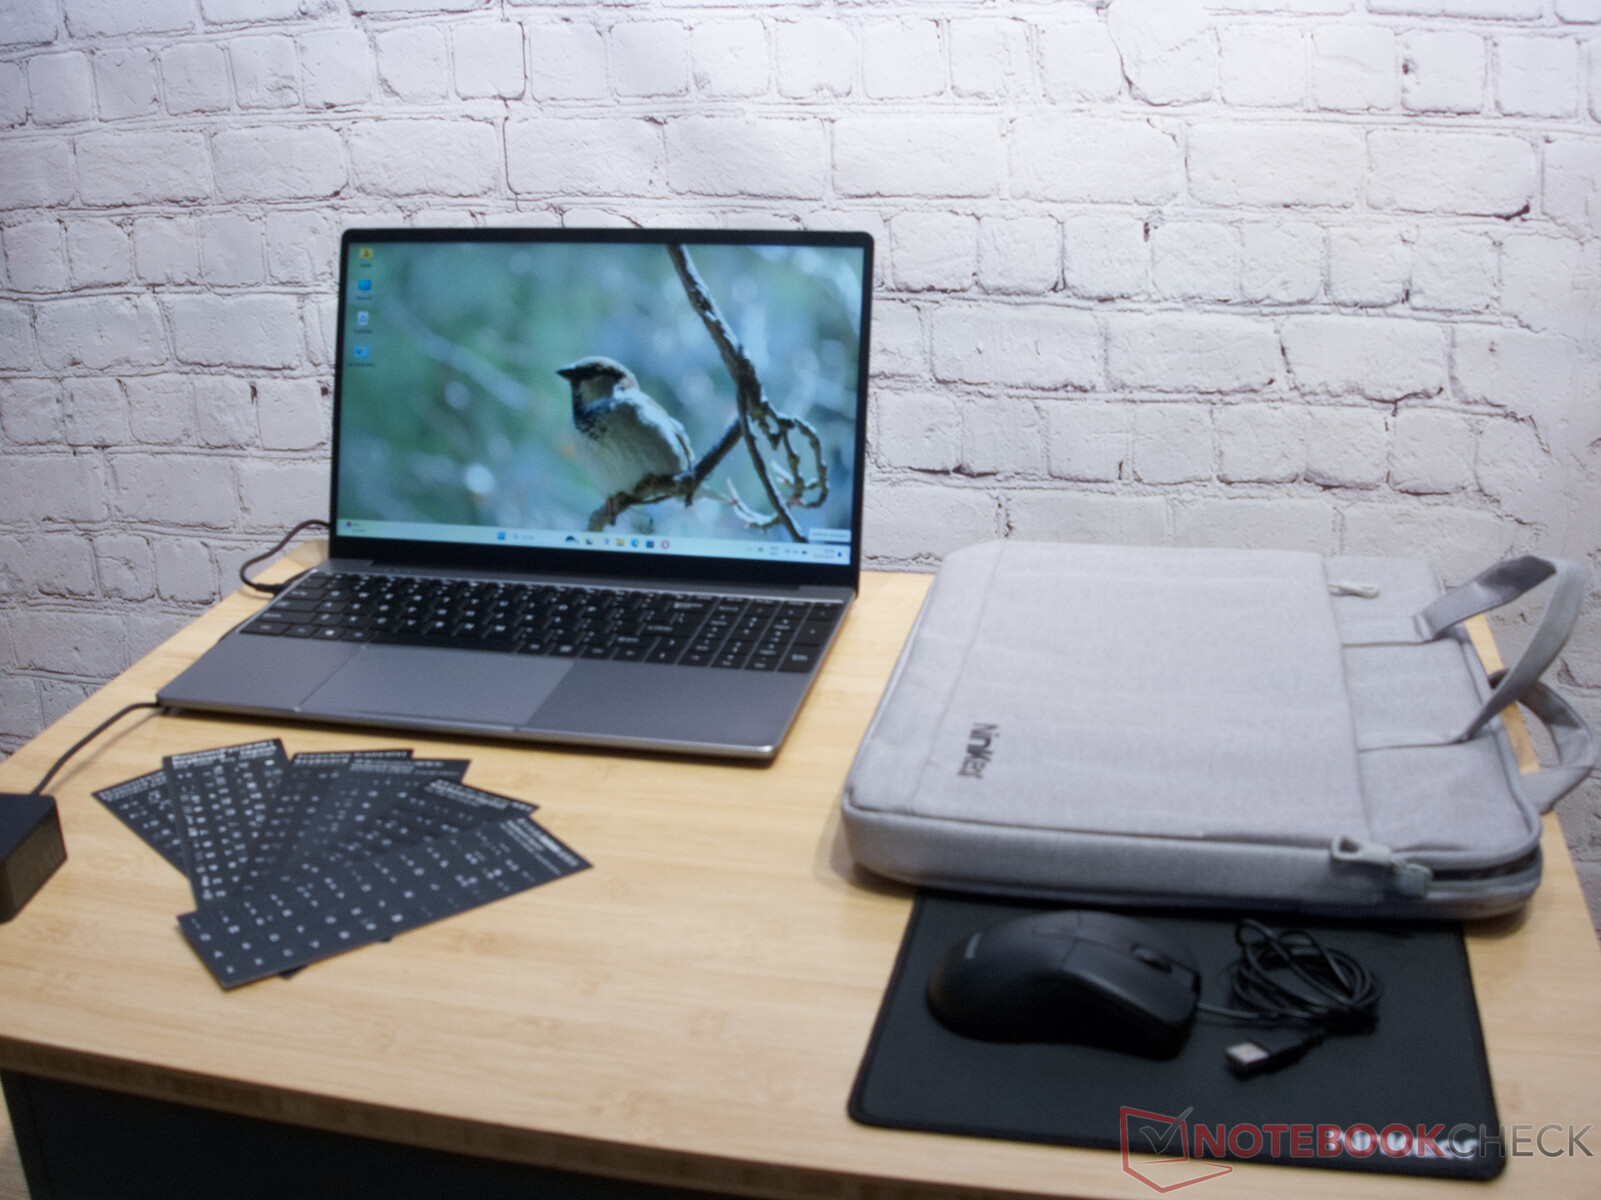
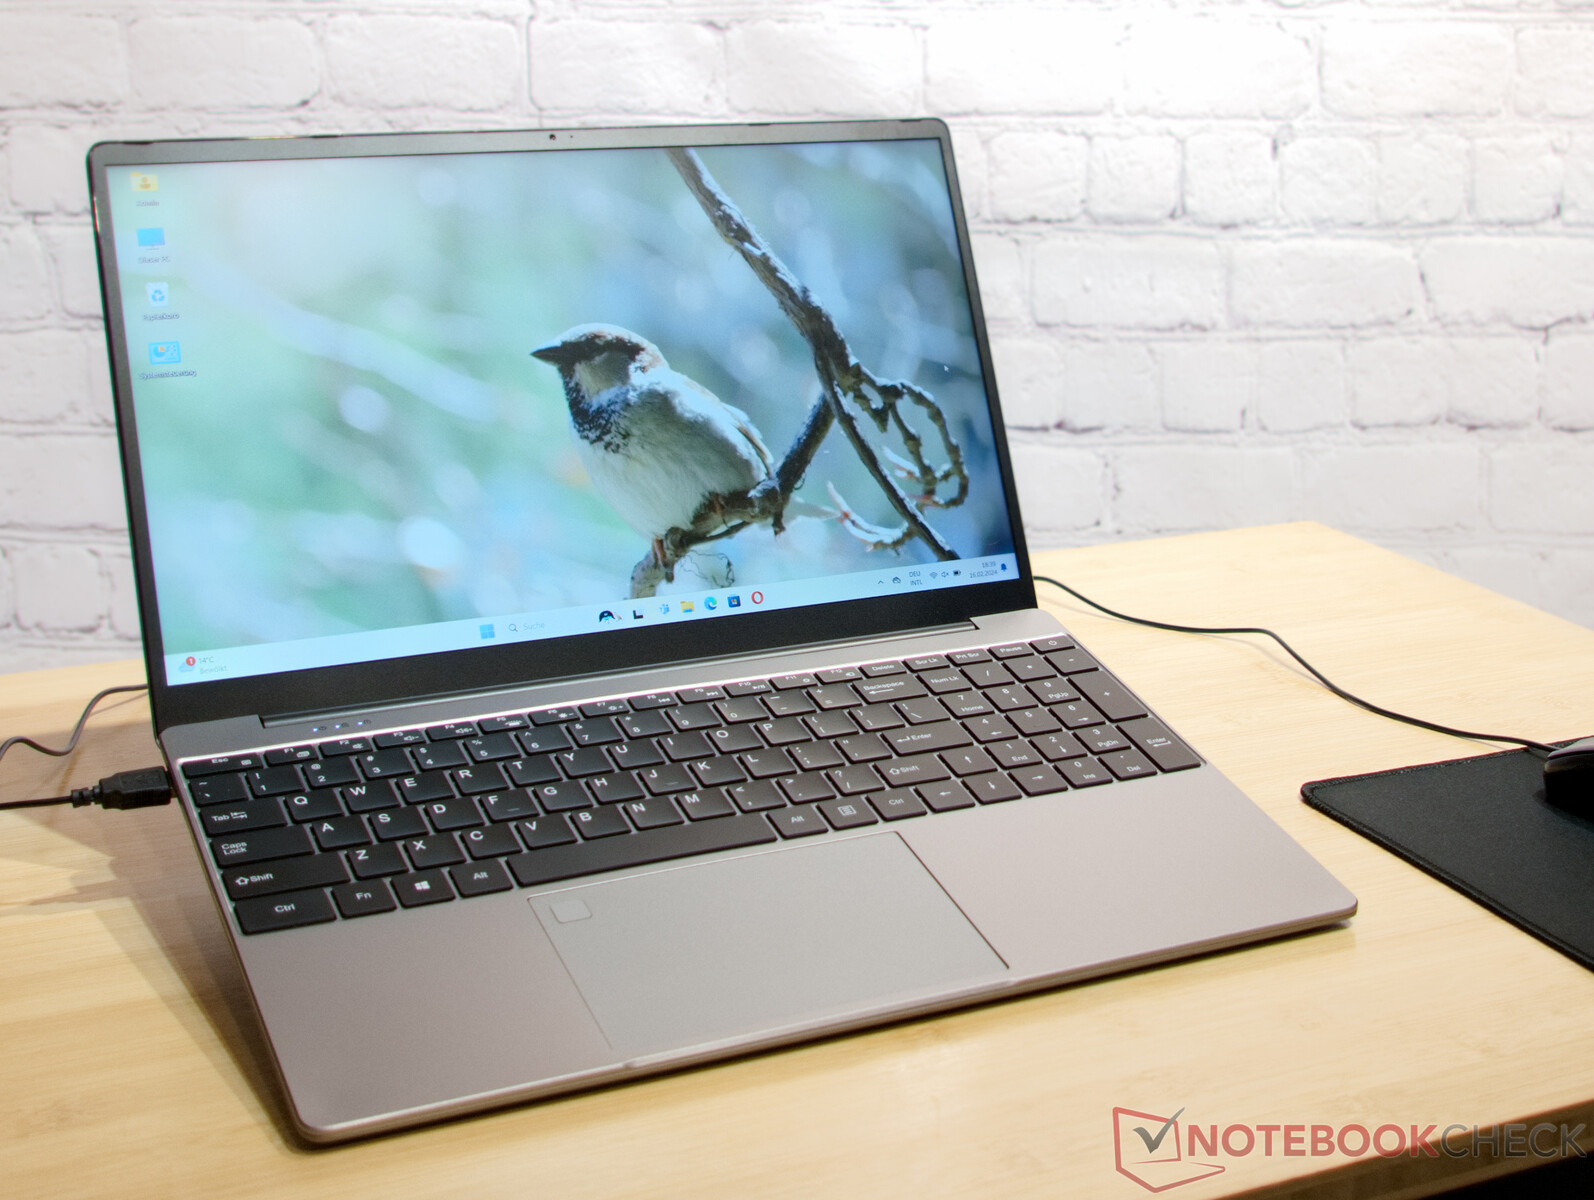
Ninkear A15 Plus 配备 16GB 或 32GB 内存、15.6 英寸 IPS 面板、QWERTY 键盘和大量配件。这款来自中国的经济型笔记本电脑在包装盒中还附带了笔记本电脑包、鼠标和鼠标垫。
可能的竞争对手比较
我们从两组不同的笔记本电脑中挑选了几款作为竞争对手,它们是 华硕 P1511CEA和 惠普 250 G9和惠普 250 G9,它们的价格也在 500 欧元左右,以及 申克威盛 15 Pro和 Eurocom C315 Blitz价格要贵得多,但功能与我们的测试设备类似。
潜在的竞争对手比较
Rating | Date | Model | Weight | Height | Size | Resolution | Price |
|---|---|---|---|---|---|---|---|
| 83.6 % v7 (old) | 03 / 2024 | Ninkear A15 Plus (16+512) R7 5700U, Vega 8 | 1.8 kg | 18.2 mm | 15.60" | 1920x1080 | |
| 85.7 % v7 (old) | 09 / 2022 | Lenovo IdeaPad 5 Pro 16ARH7 R5 6600HS, Radeon 660M | 1.9 kg | 18.4 mm | 16.00" | 2560x1600 | |
| 83.4 % v7 (old) | 11 / 2023 | Eurocom C315 Blitz i7-1360P, Iris Xe G7 96EUs | 1.7 kg | 19.9 mm | 15.60" | 3840x2160 | |
| 87.1 % v7 (old) | 06 / 2023 | Schenker VIA 15 Pro M22 R7 5700U, Vega 8 | 1.4 kg | 16.8 mm | 15.60" | 2560x1440 | |
| 75.2 % v7 (old) | 12 / 2023 | HP 250 G9 7N029ES i3-1215U, UHD Graphics 64EUs | 1.7 kg | 19.9 mm | 15.60" | 1920x1080 | |
| 77.5 % v7 (old) | 01 / 2023 | Asus P1511CEA-BQ753R i3-1115G4, UHD Graphics Xe G4 48EUs | 1.8 kg | 19.9 mm | 15.60" | 1920x1080 |
箱体和设备铝制盖子和底座
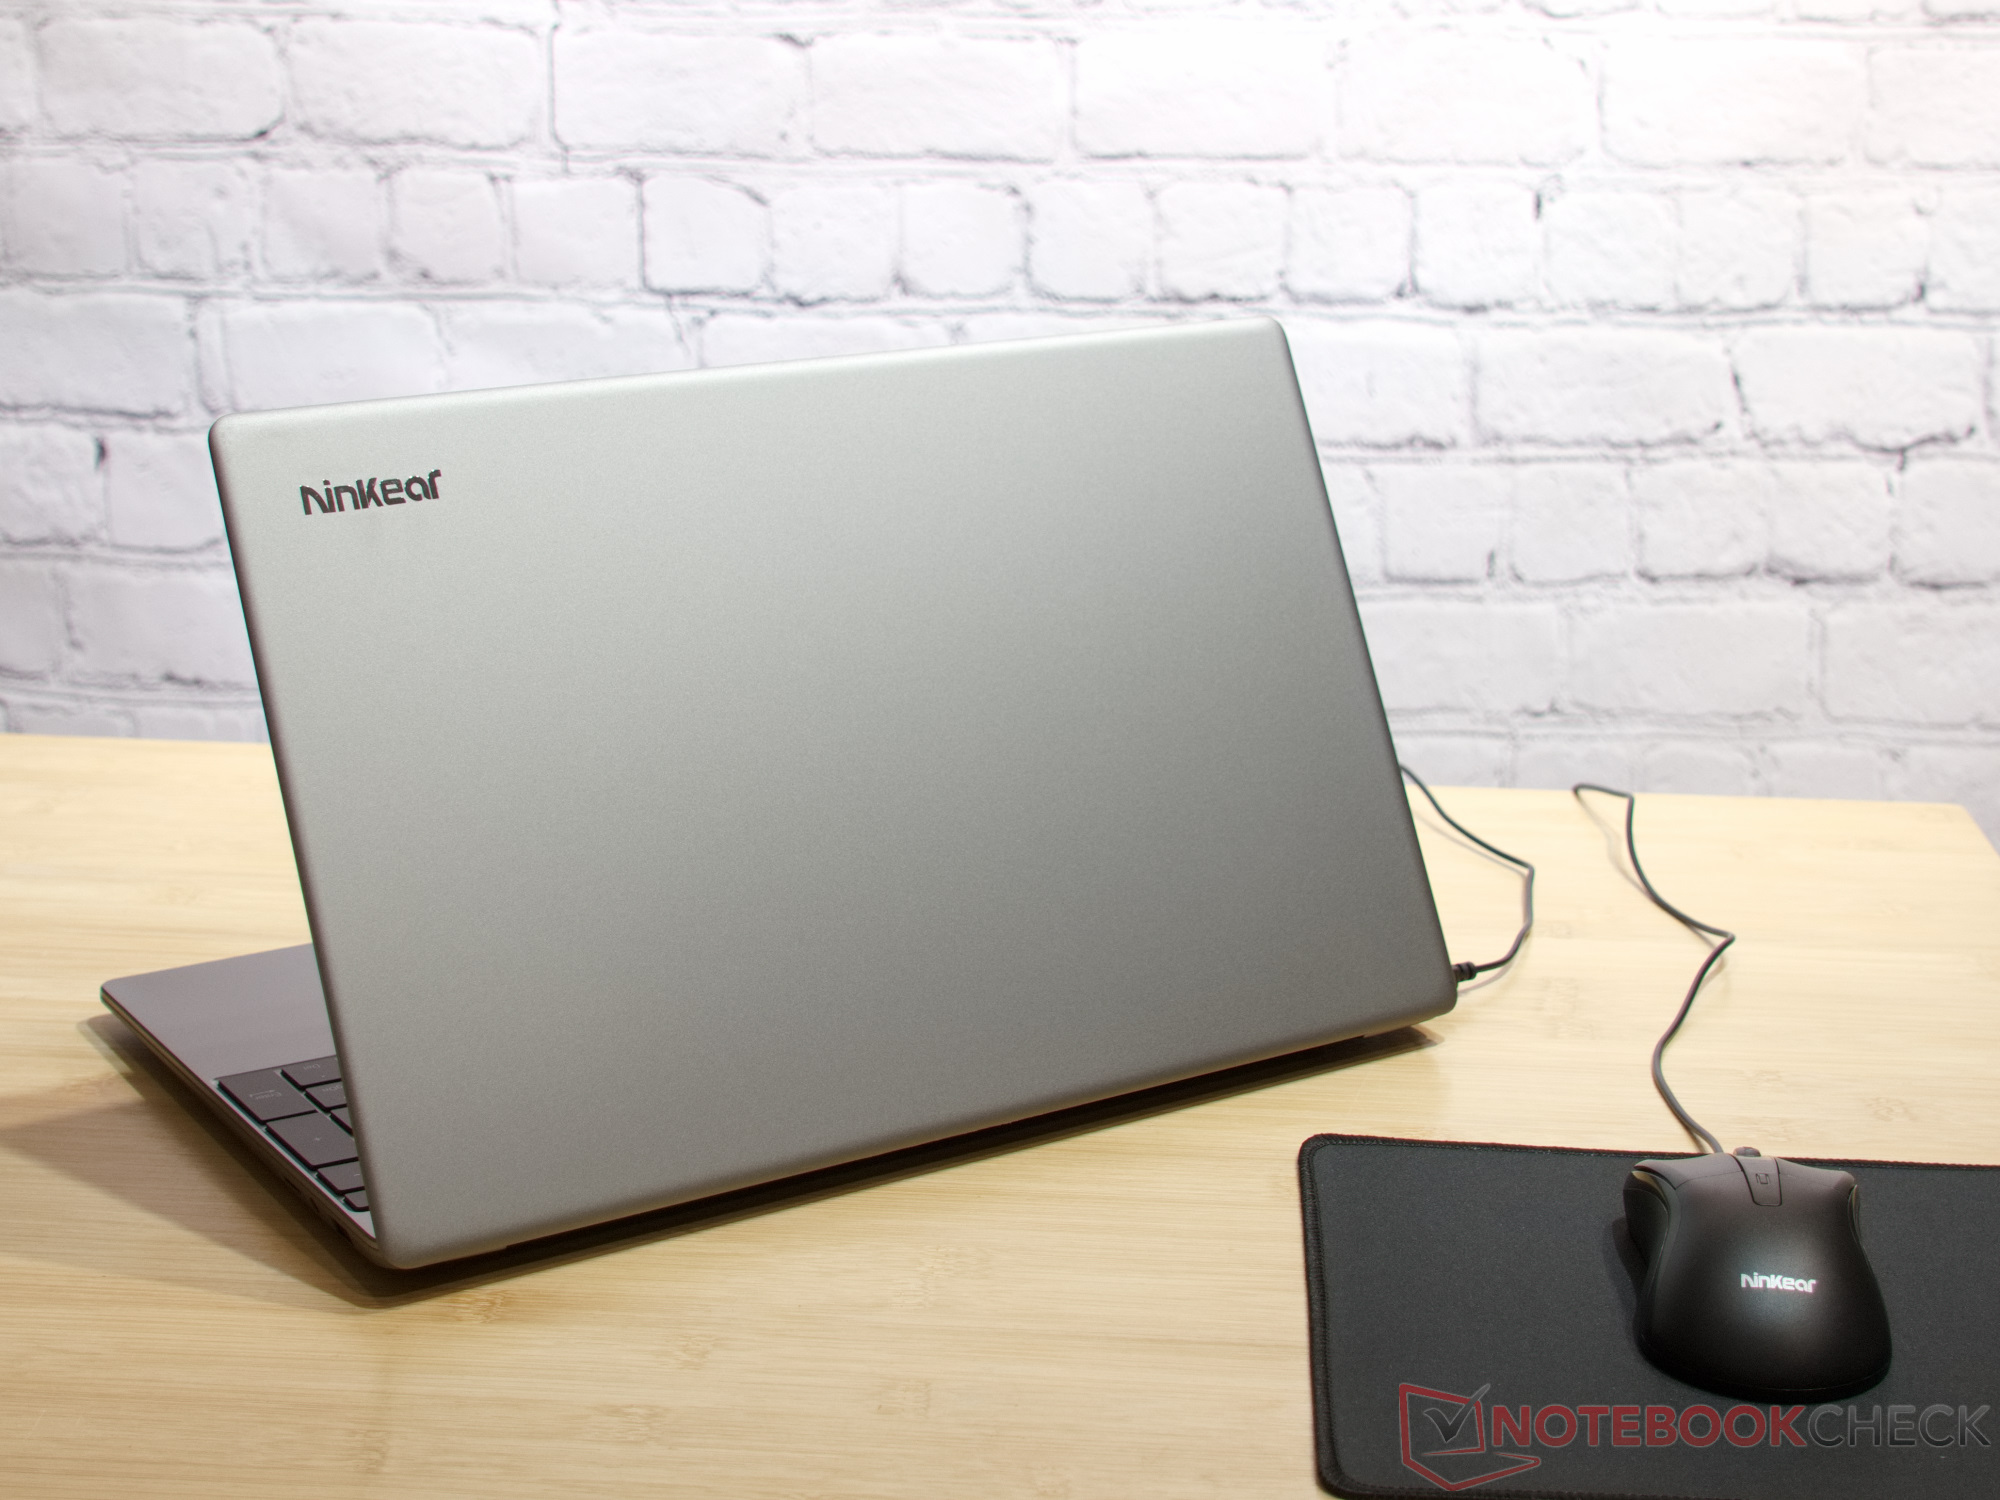
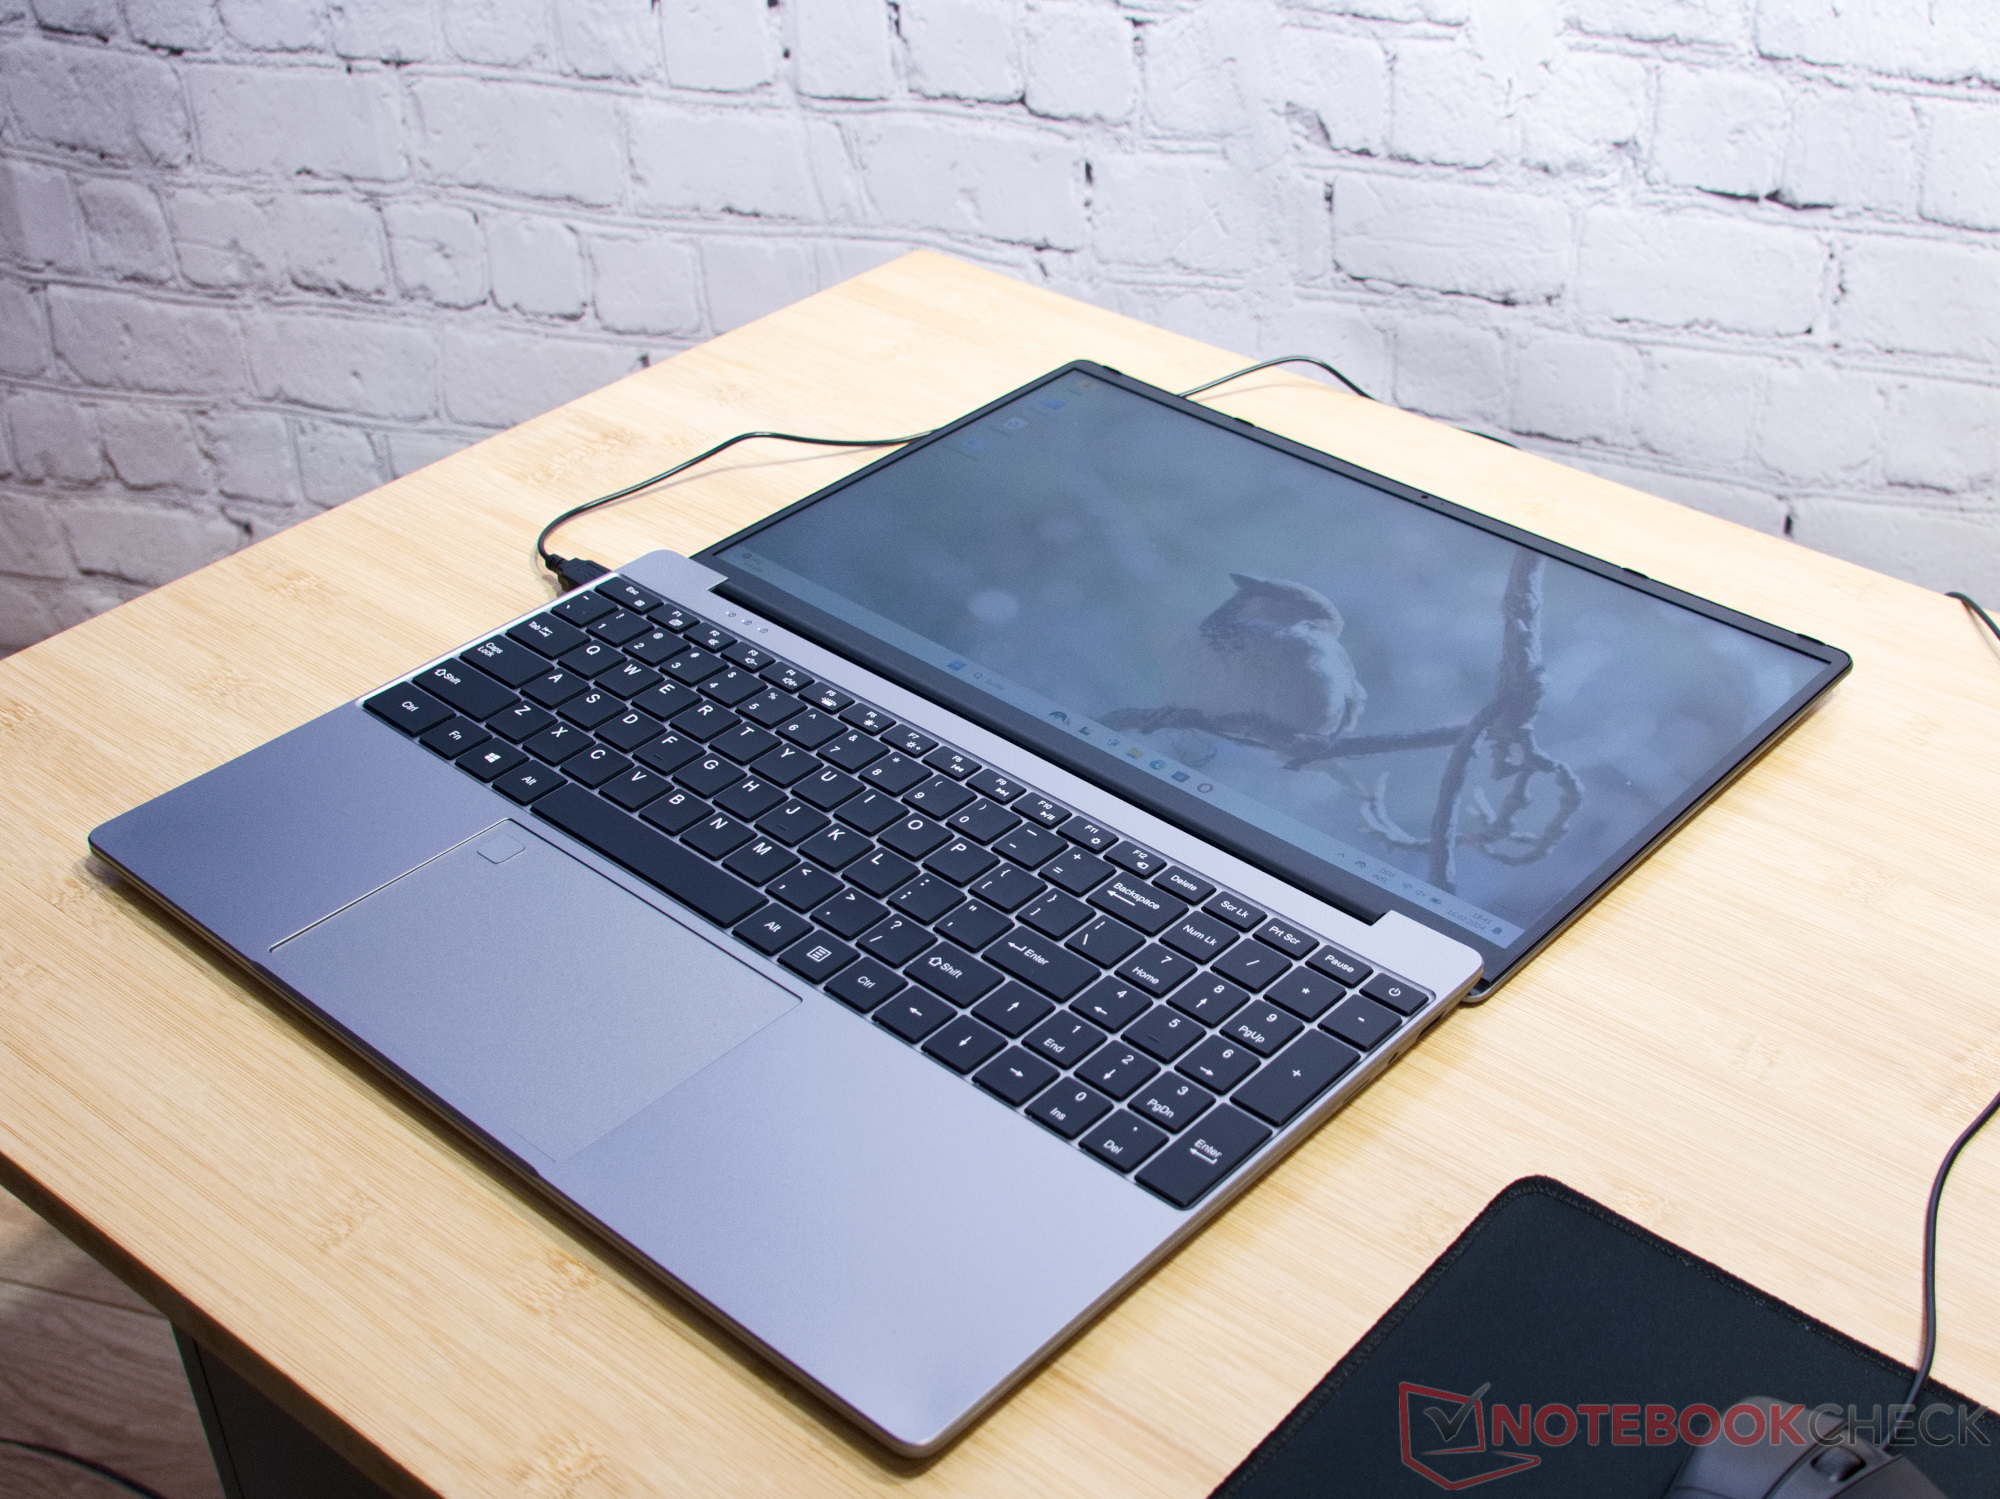
乍一看,Ninkear A15 Plus 的外壳质量非常高。笔记本的盖子和底座由铝合金制成,而键盘盖则由喷漆塑料制成。不过,制造商对颜色的搭配非常精确,光看外表根本无法分辨材质的不同。掌托和法定 B 盖由塑料制成也有一些好处。
其表面不会像铝制材料那样迅速发热,即使在发热的情况下,触感也更加舒适。缺点是耐用性较差。即使是最好的油漆也会随着时间的推移而脱落。
总的来说,外壳的质量还可以。屏幕可以顺畅地打开到 180°,铰链不会有晃动的感觉。键盘的按压力度很小,笔记本电脑在其他方面也有很好的稳定性。制造商知道如何用刻意选择的阴影缝隙来掩盖外壳缝隙有时不太完美的事实。
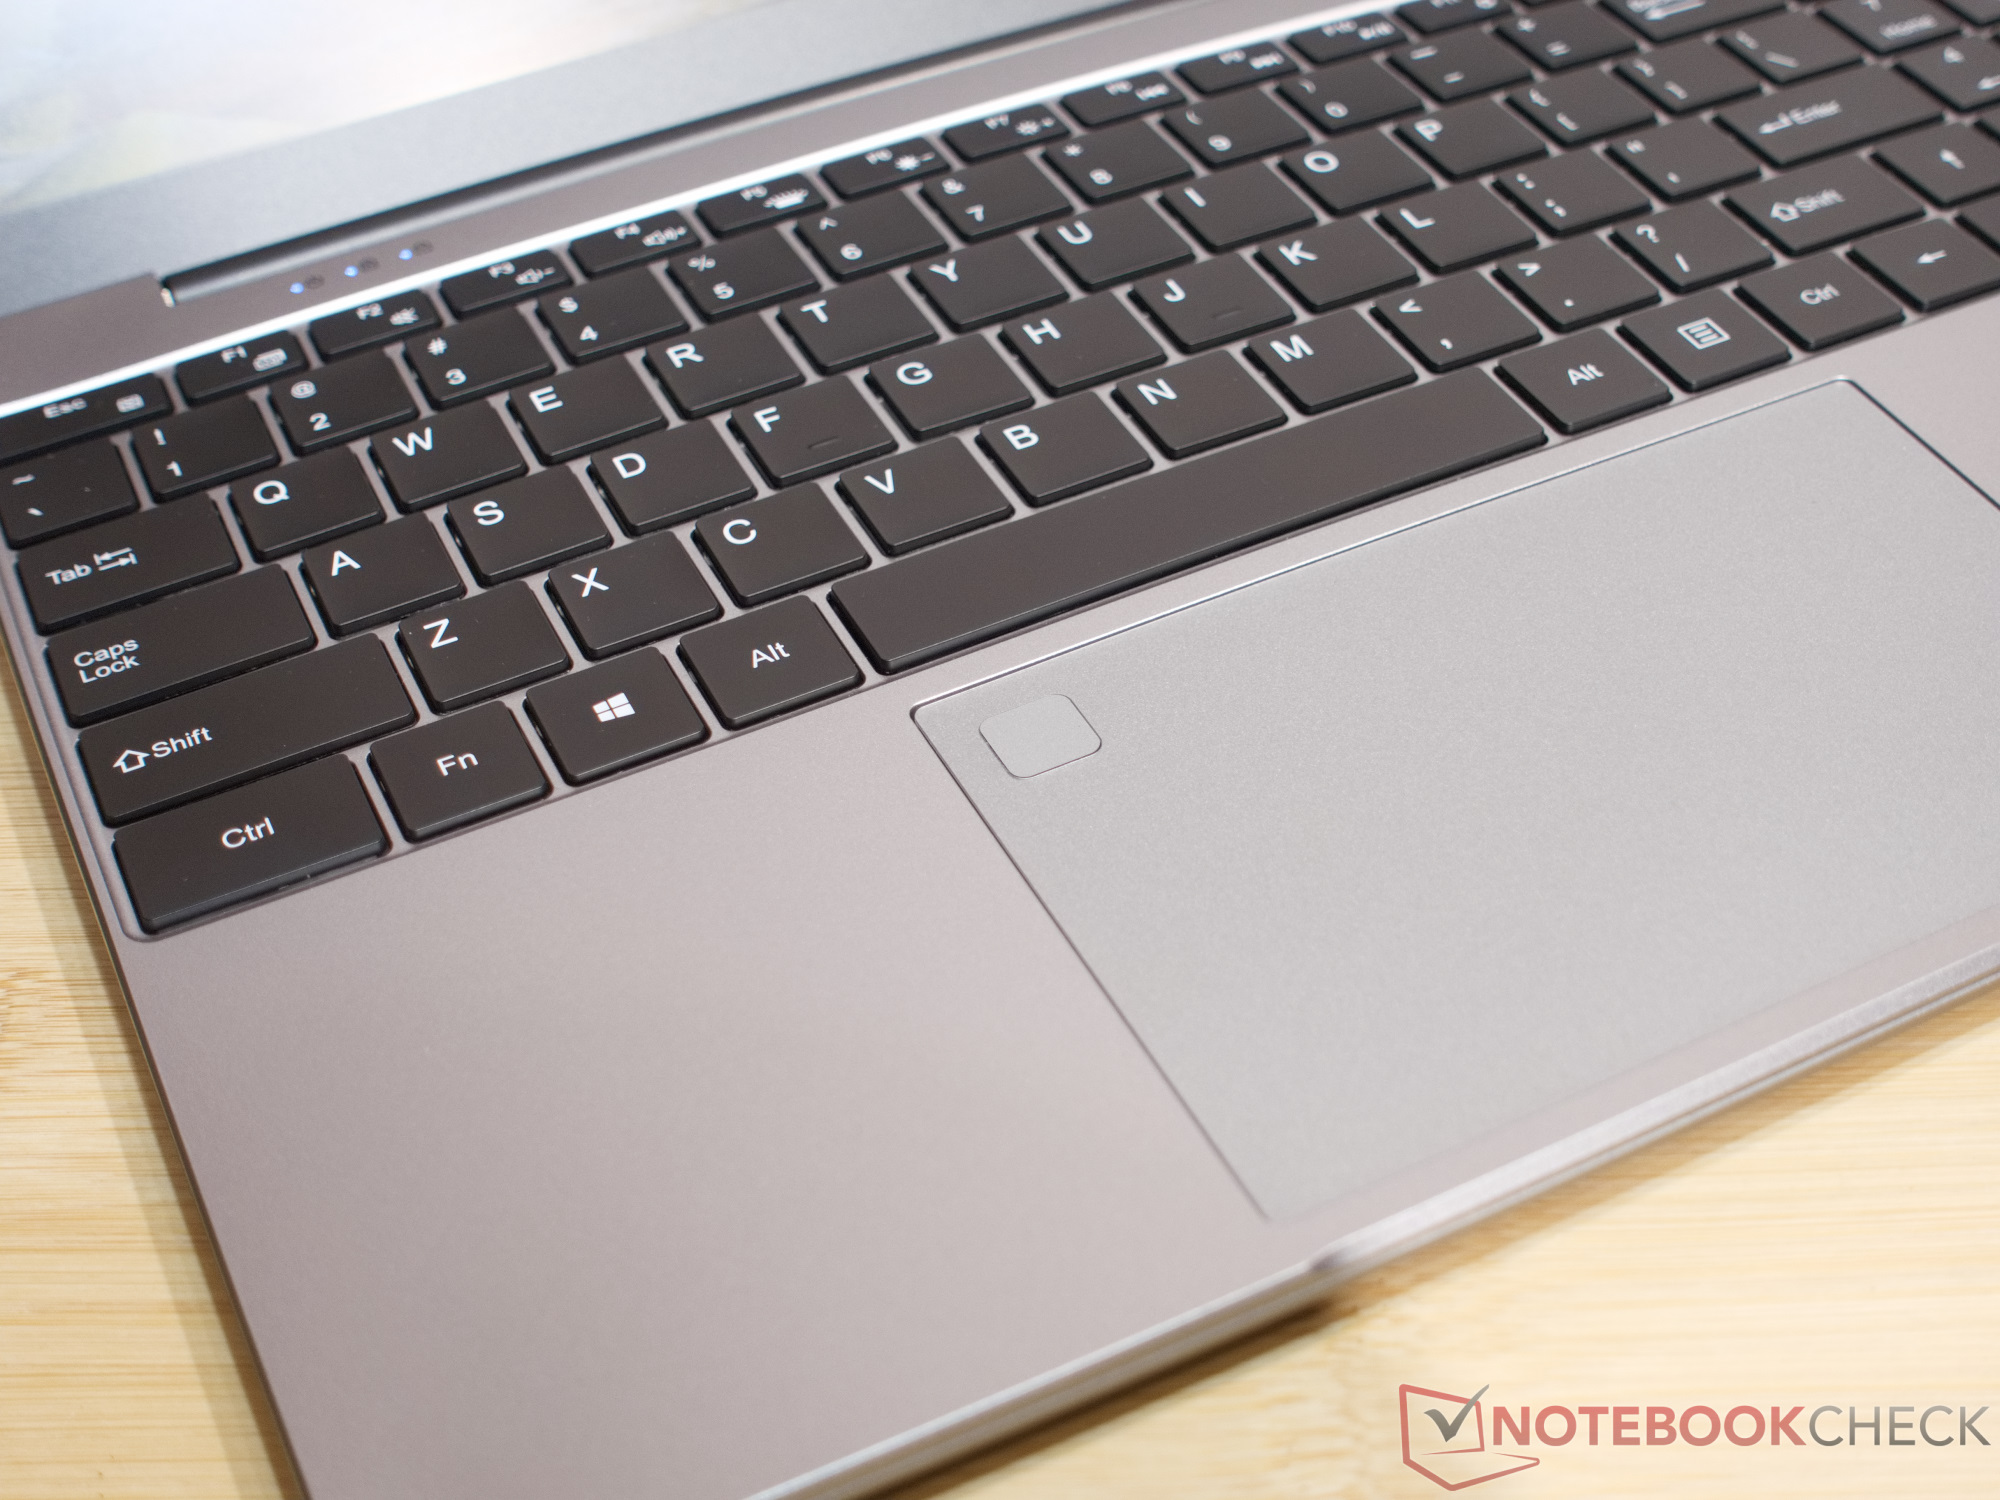
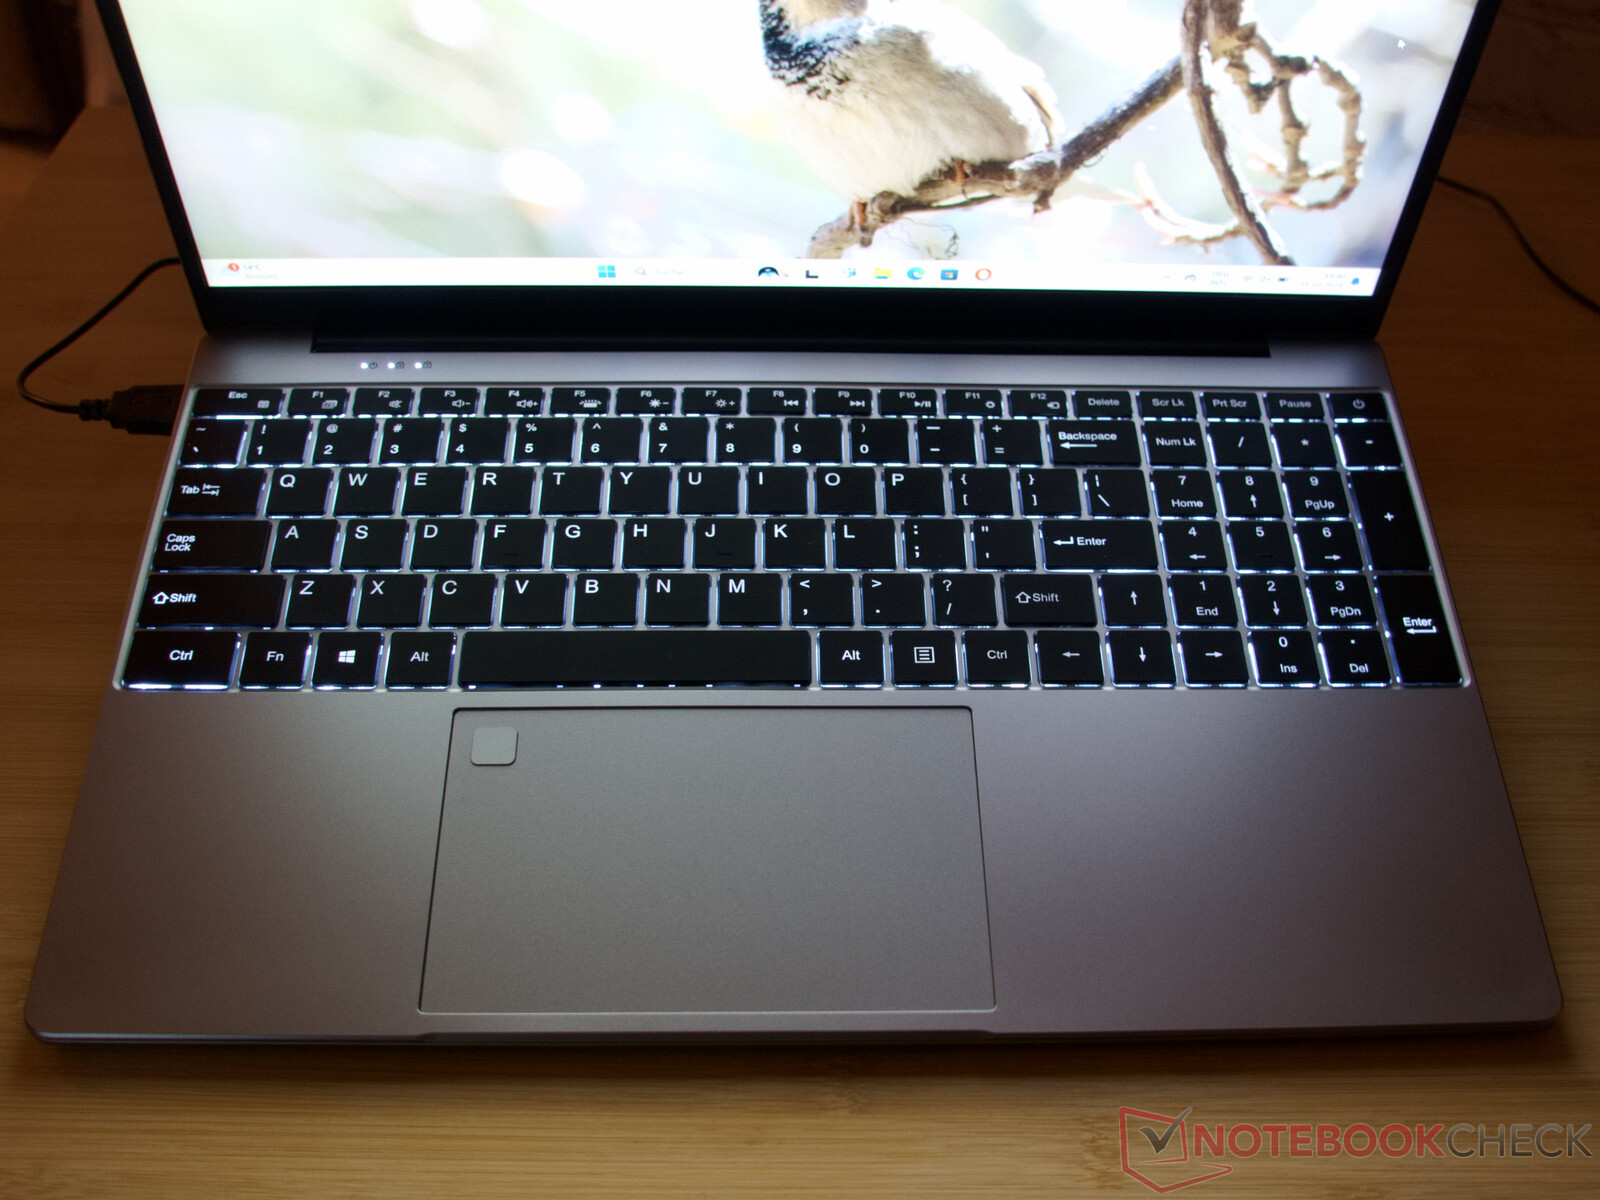
打开笔记本电脑后,大屏幕和大键盘立即映入眼帘。Ninkear 充分利用了机箱内的空间,配备了带有 NUM 块和全尺寸按键的键盘。
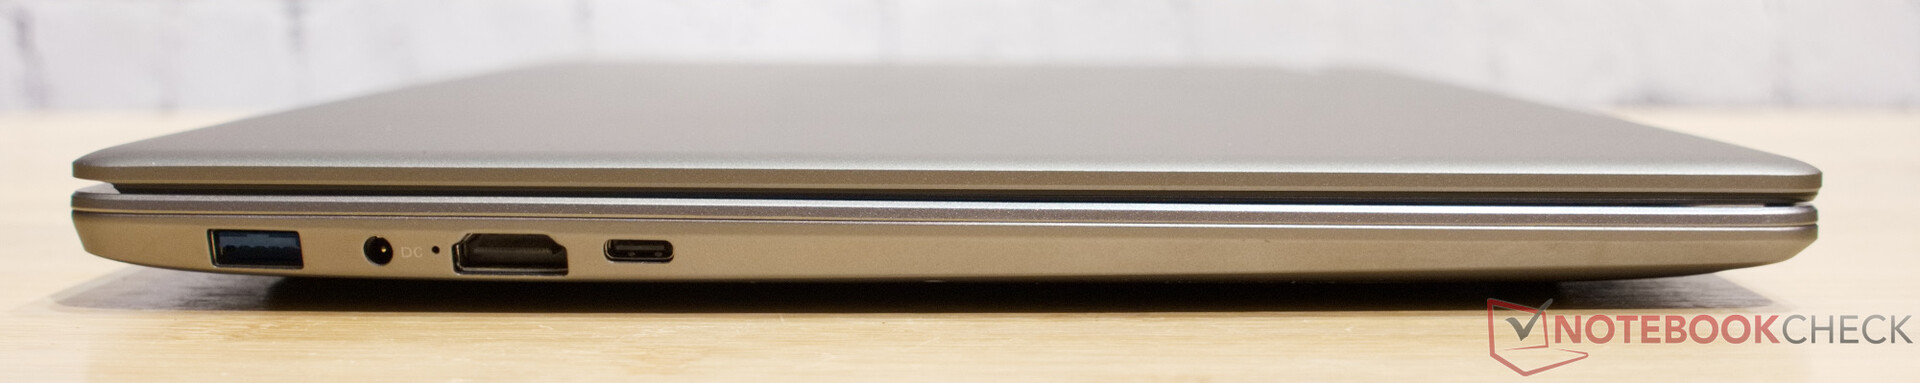
笔记本电脑的连接功能足够。与德语快速指南相反,左侧的 USB Type-C 端口提供了包括 DisplayPort 和 Power Delivery 在内的所有设施。
我们不清楚为什么制造商没有提及 Power Delivery 功能。Power Delivery 功能非常有用,因为它允许在扩展坞上操作 Ninkear A15 Plus,笔记本电脑的圆形插头电源装置也可以留在家里。
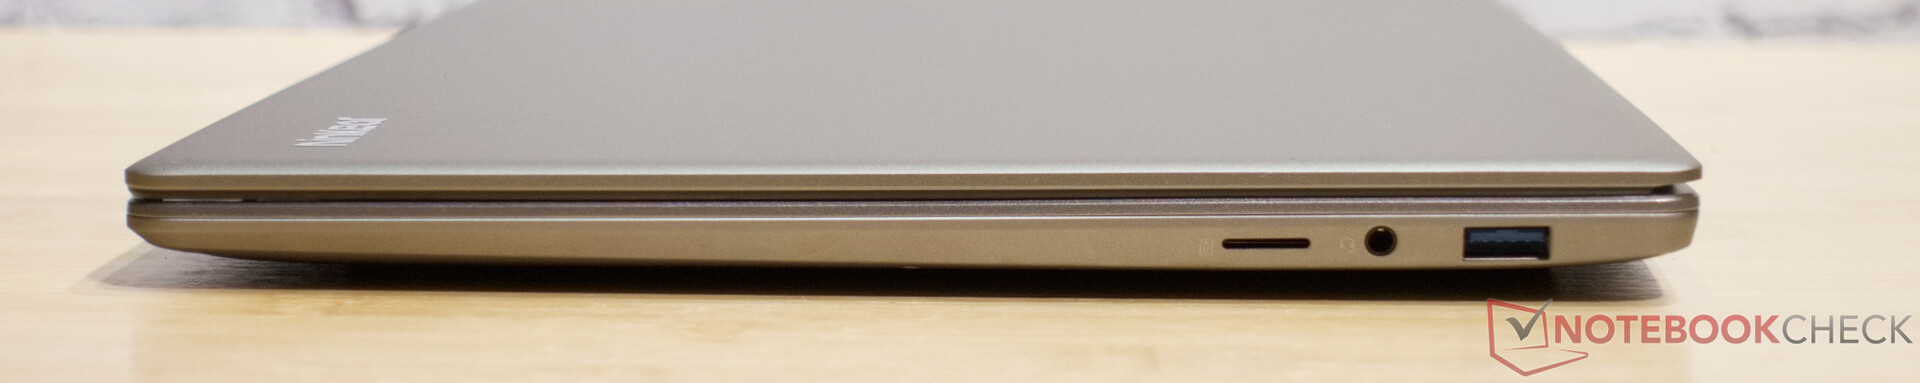
遗憾的是,我们发现 microSD 读卡器和 Wi-Fi 存在一些问题。与处理器一样,Ninkear A15 Plus 的 Wi-Fi 芯片也是相当老旧的芯片。它不支持 Wi-Fi 6 或 6E。因此,传输速度也相应较差。
Wi-Fi 的吞吐量足以满足上网冲浪的需要,但如果要在网络中传输大文件,则需要耐心等待。 速度较慢的 microSD 读卡器也是如此。这个读卡器还存在一个问题,那就是有可能将存储卡从插槽推入机壳。在最糟糕的情况下,您必须拧开笔记本电脑才能取出存储卡!
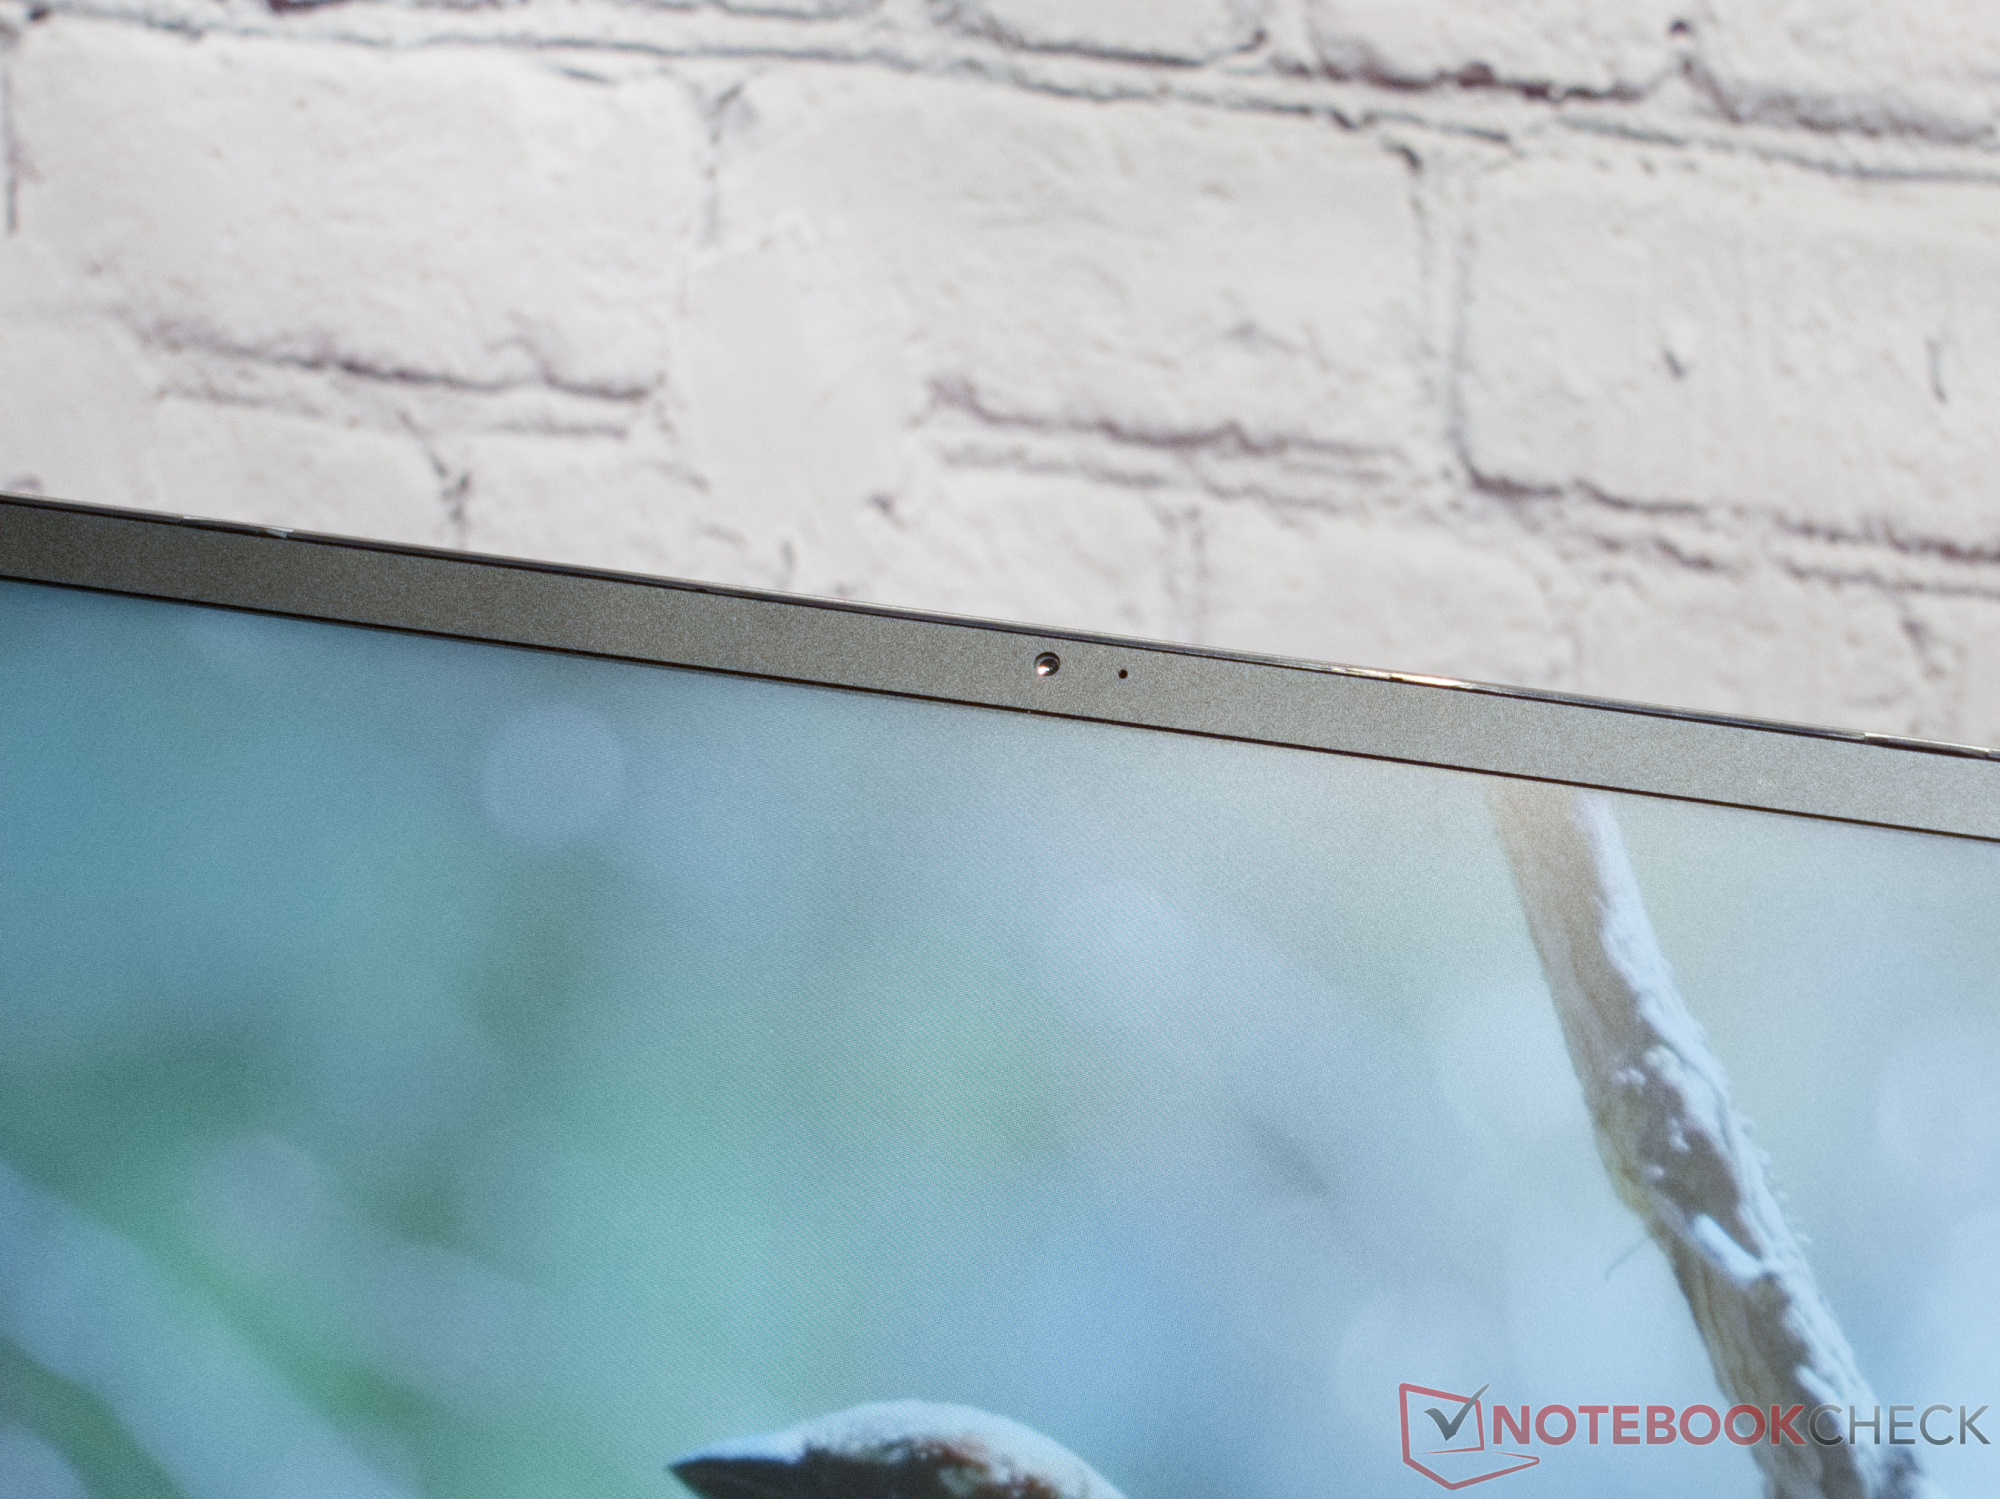
720p 网络摄像头和单声道麦克风可以使用,但质量不是最好。它们可用于在家中进行快速视频通话,但如果您经常参加视频会议,最好还是使用外置网络摄像头。
总的来说,读卡器、网络摄像头和无线局域网模块的性能基本够用。500 欧元价位的设备也没有太大差别。
| SD Card Reader | |
| average JPG Copy Test (av. of 3 runs) | |
| Lenovo IdeaPad 5 Pro 16ARH7 (AV PRO microSD 128 GB V60) | |
| Eurocom C315 Blitz (Angelbird AV Pro V60) | |
| Average of class Office (19.8 - 198.5, n=22, last 2 years) | |
| Ninkear A15 Plus (16+512) | |
| HP 250 G9 7N029ES (Angelbird AV Pro V60) | |
| Schenker VIA 15 Pro M22 (Angelbird AV Pro V60) | |
| maximum AS SSD Seq Read Test (1GB) | |
| Eurocom C315 Blitz (Angelbird AV Pro V60) | |
| Average of class Office (27.4 - 249, n=21, last 2 years) | |
| Ninkear A15 Plus (16+512) | |
| HP 250 G9 7N029ES (Angelbird AV Pro V60) | |
| Schenker VIA 15 Pro M22 (Angelbird AV Pro V60) | |

 Vega 8, R7 5700U, GOFATOO P110E-512GB")
 Vega 8, R7 5700U, GOFATOO P110E-512GB")
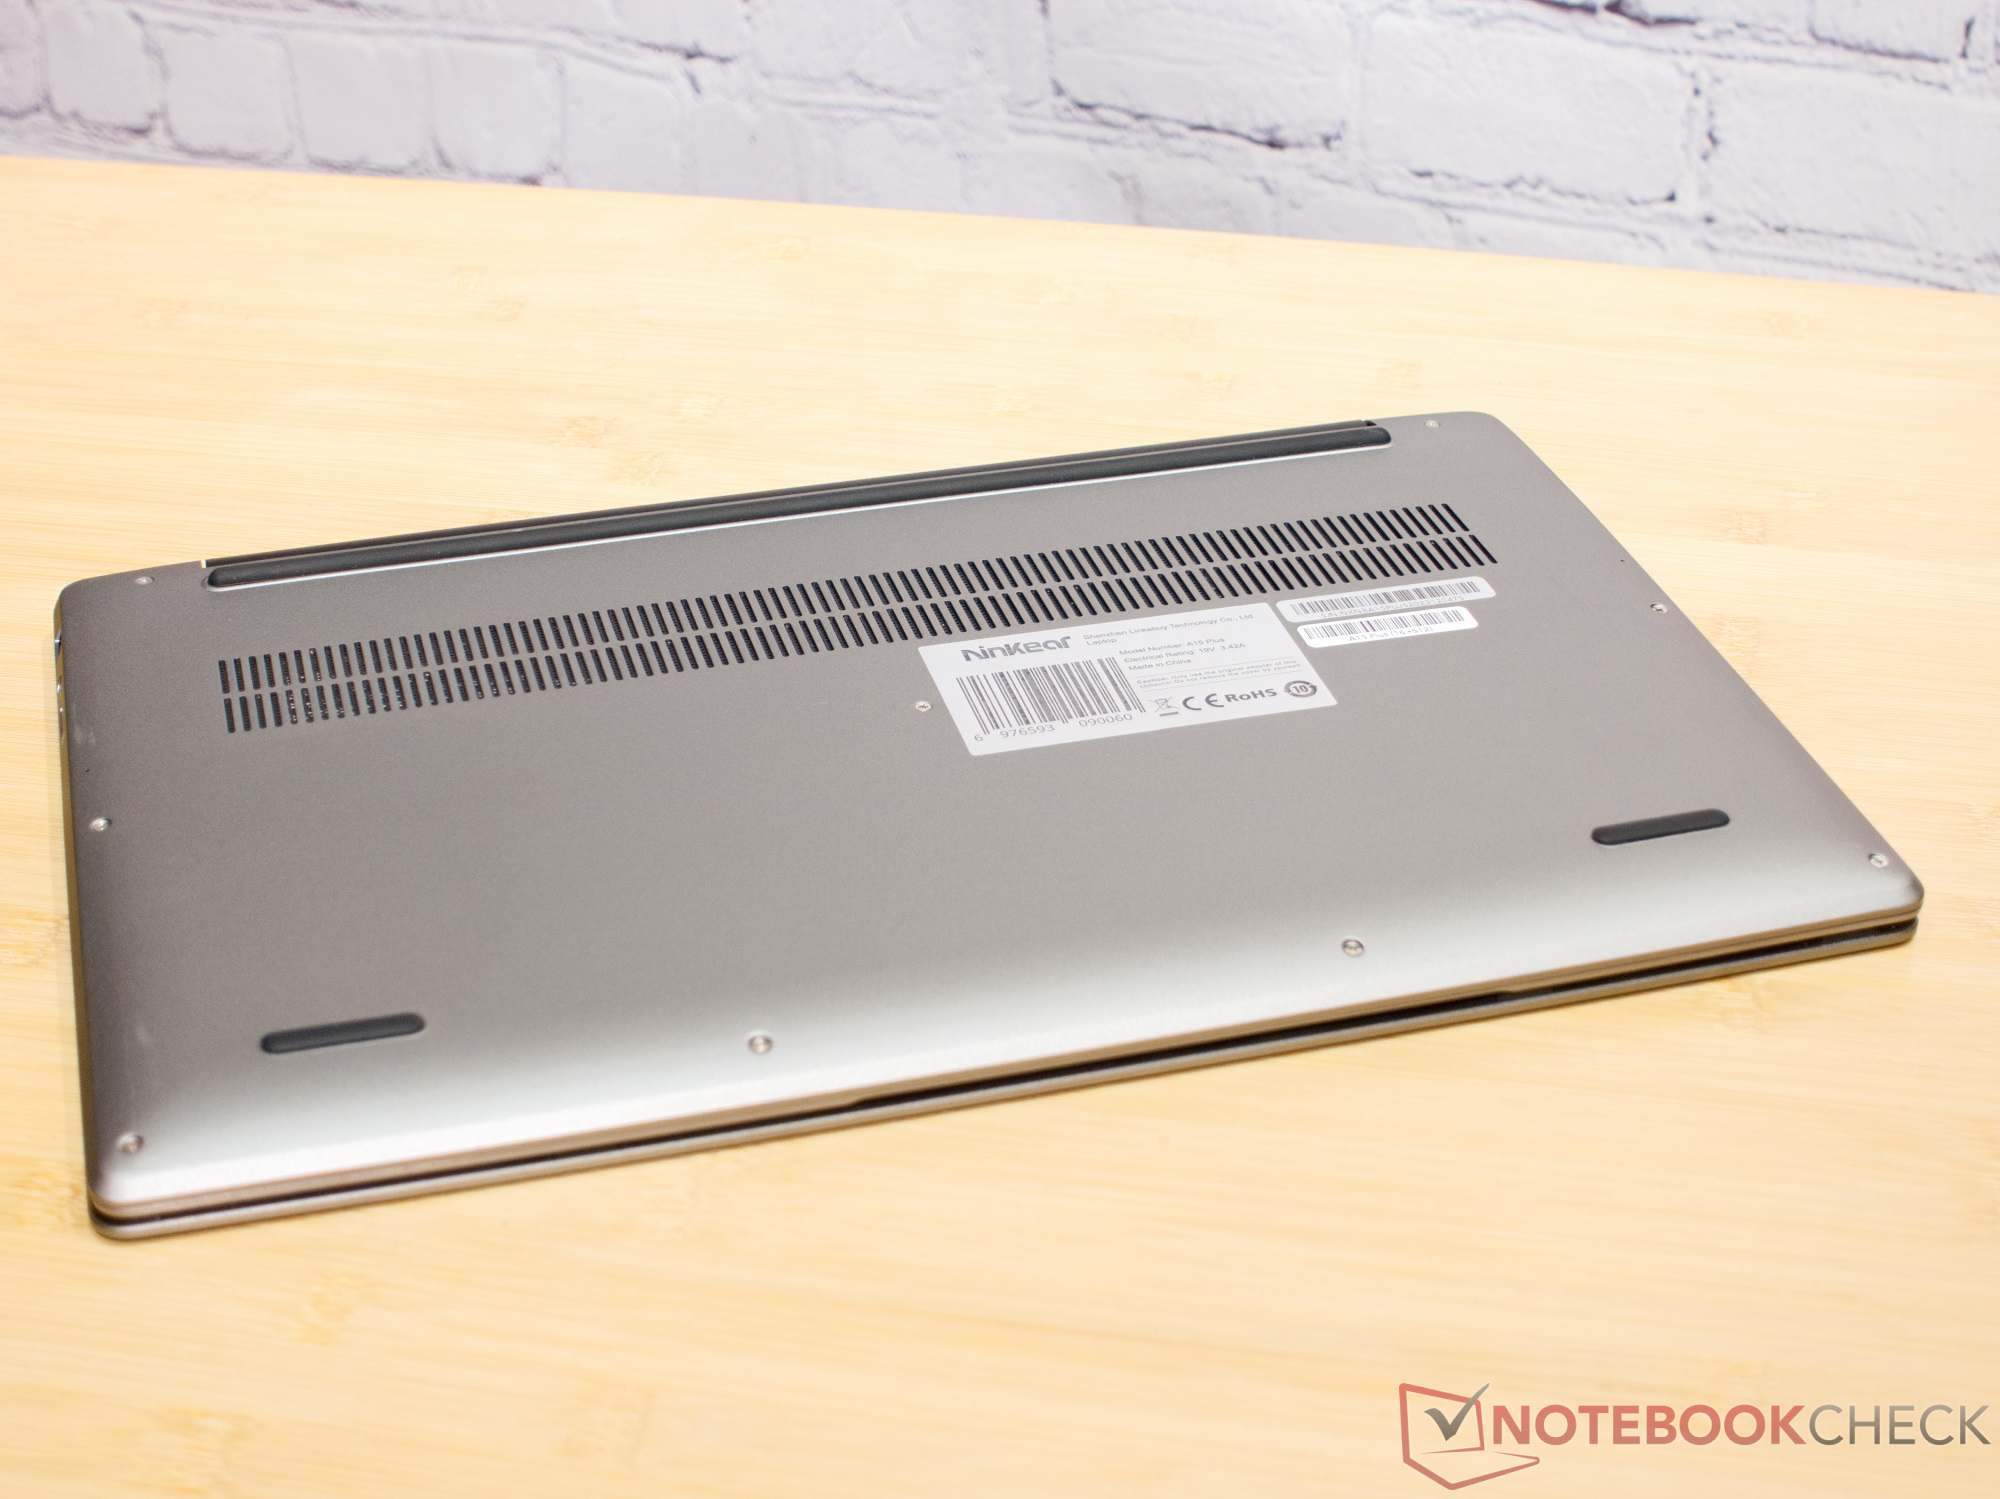
维护、保修和交付范围
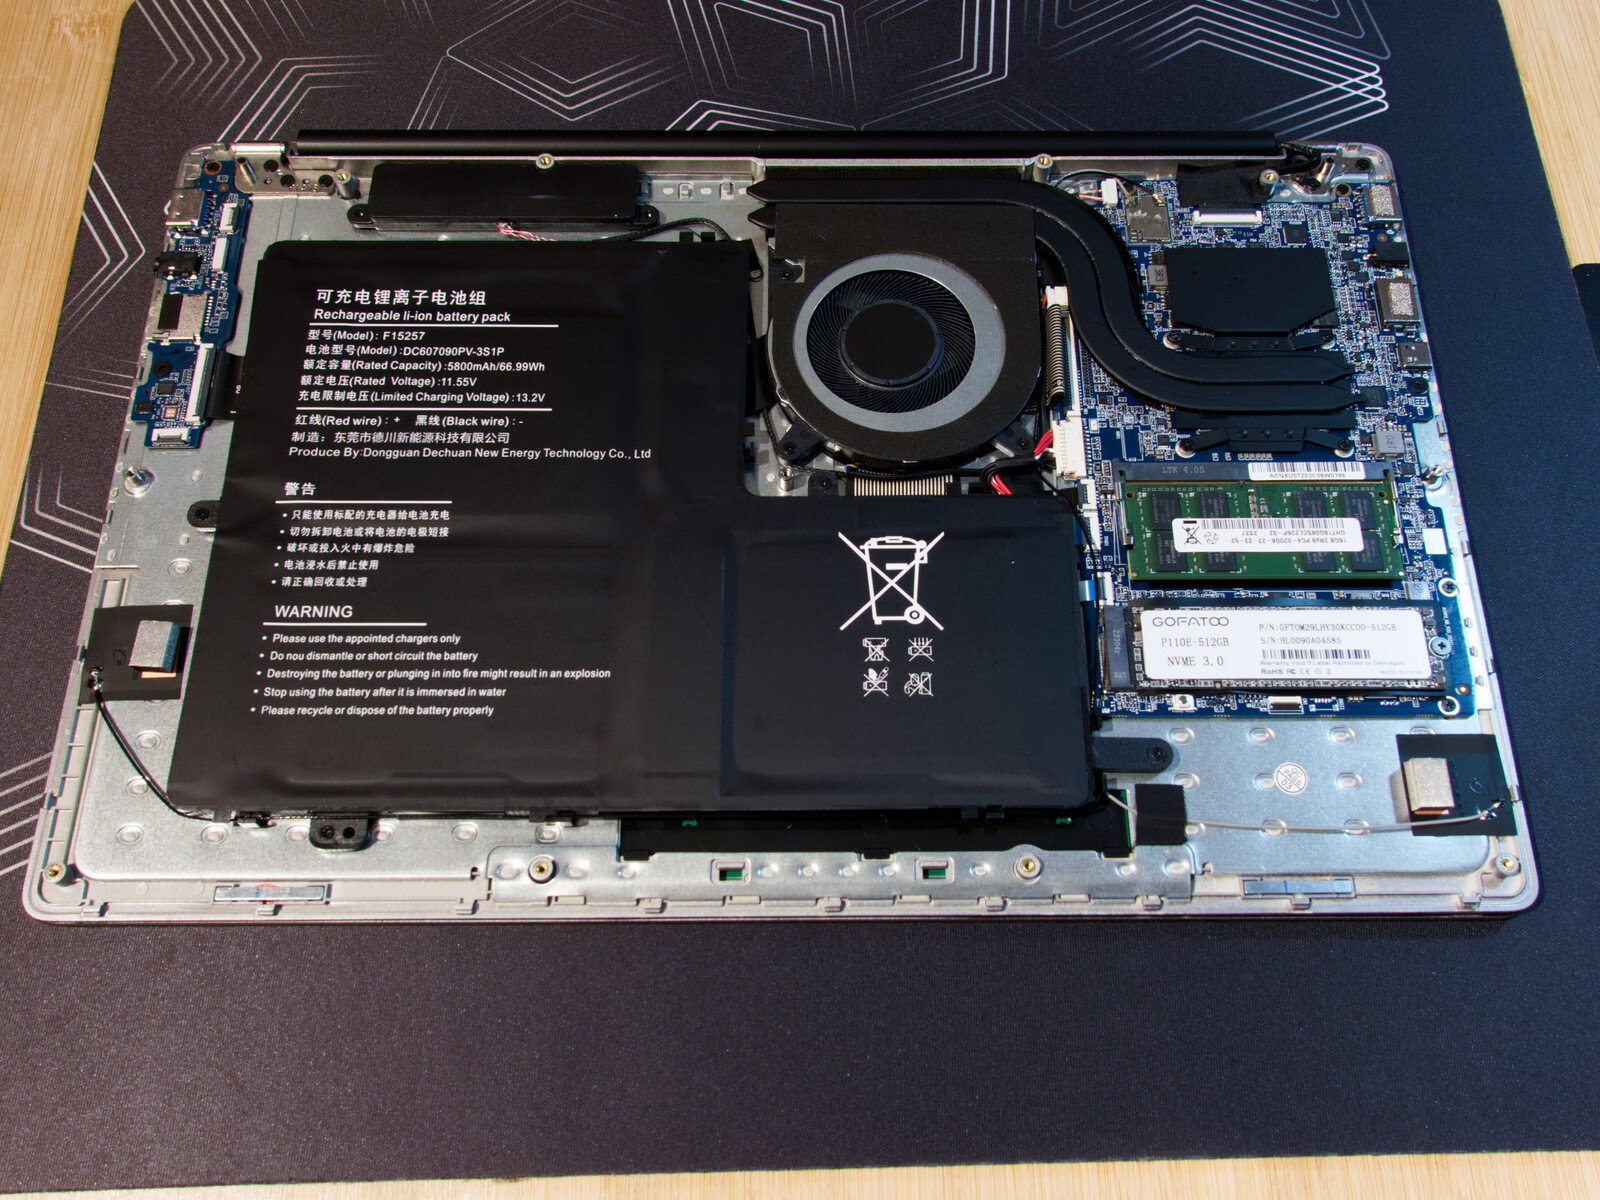
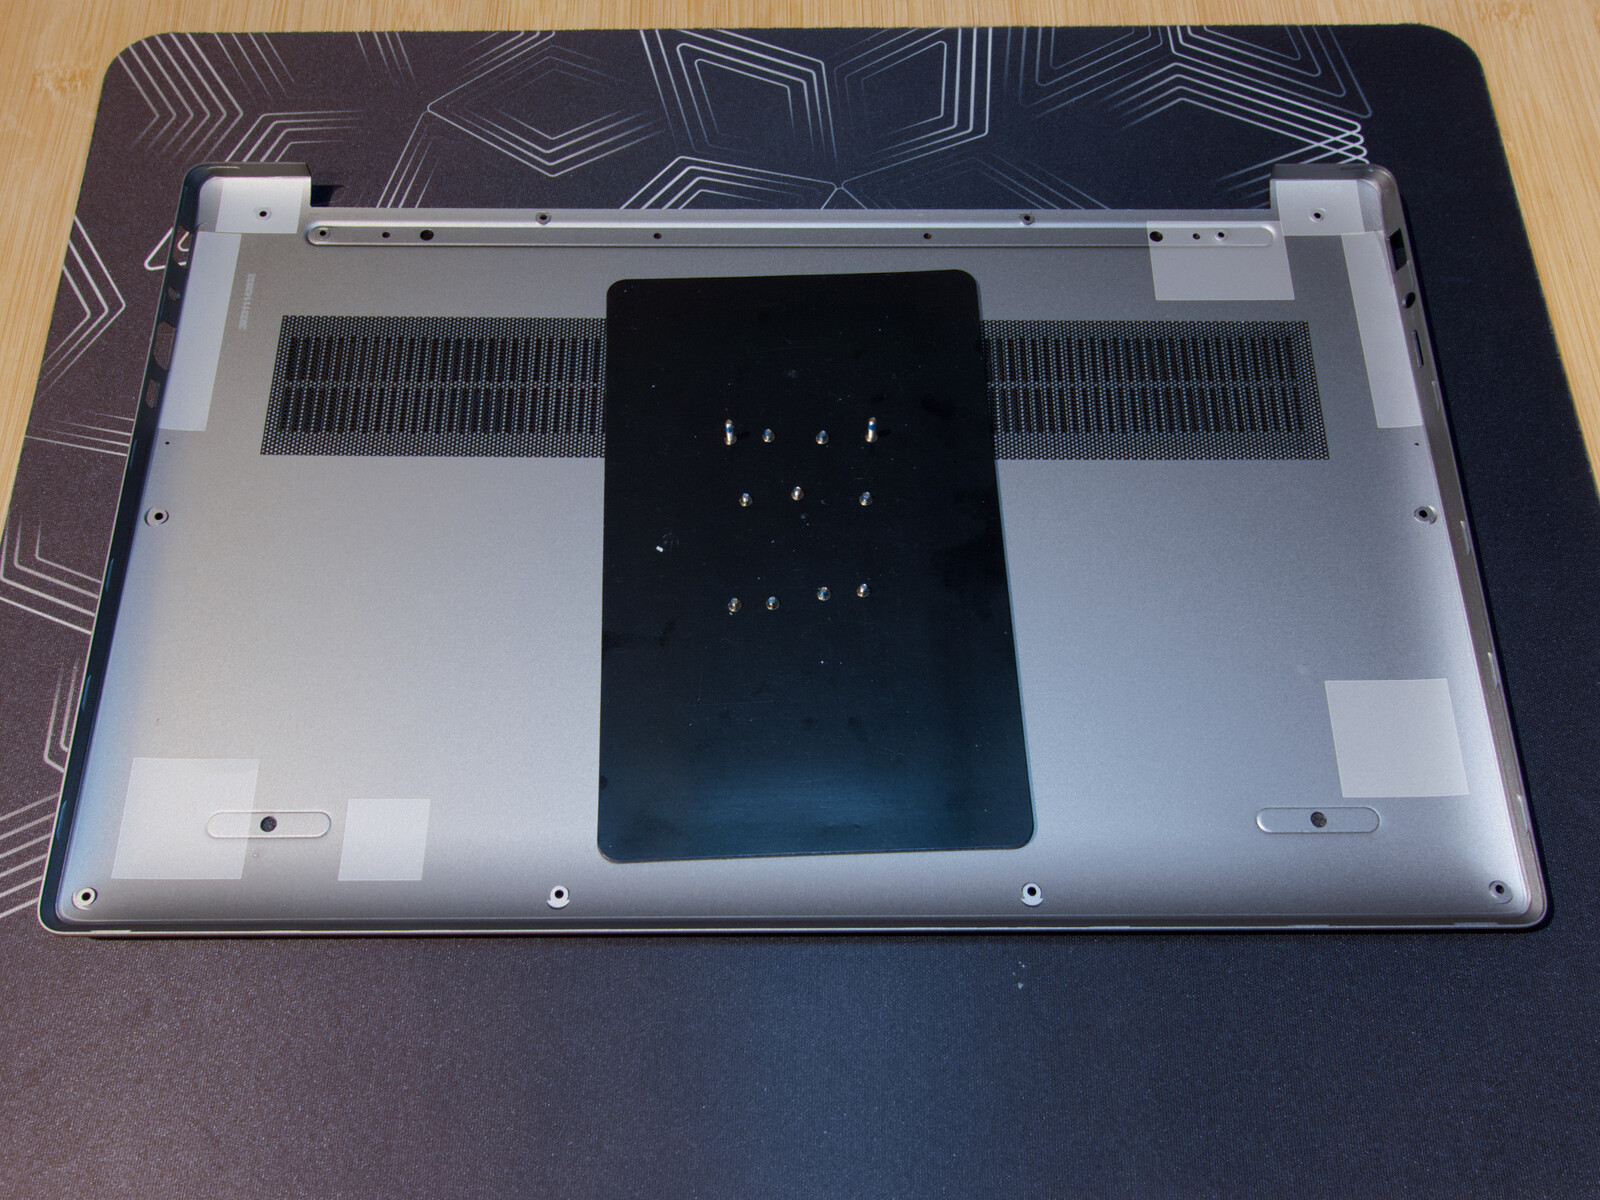
11 颗十字螺丝固定着铝制底座,可以轻松取下。在底座下方,我们可以看到已插入的内存和一个 M.2 NVMe 固态硬盘。遗憾的是,速度较慢的 WLAN 模块是焊接的。根据零售商的不同,这款笔记本电脑提供 12 个月或两年的保修服务。
我们的 Ninkear A15 Plus 附带了一个笔记本电脑包、一个 USB 鼠标和一个鼠标垫。另外还附带了不同键盘布局的贴纸。
输入设备:键盘好,触摸板差
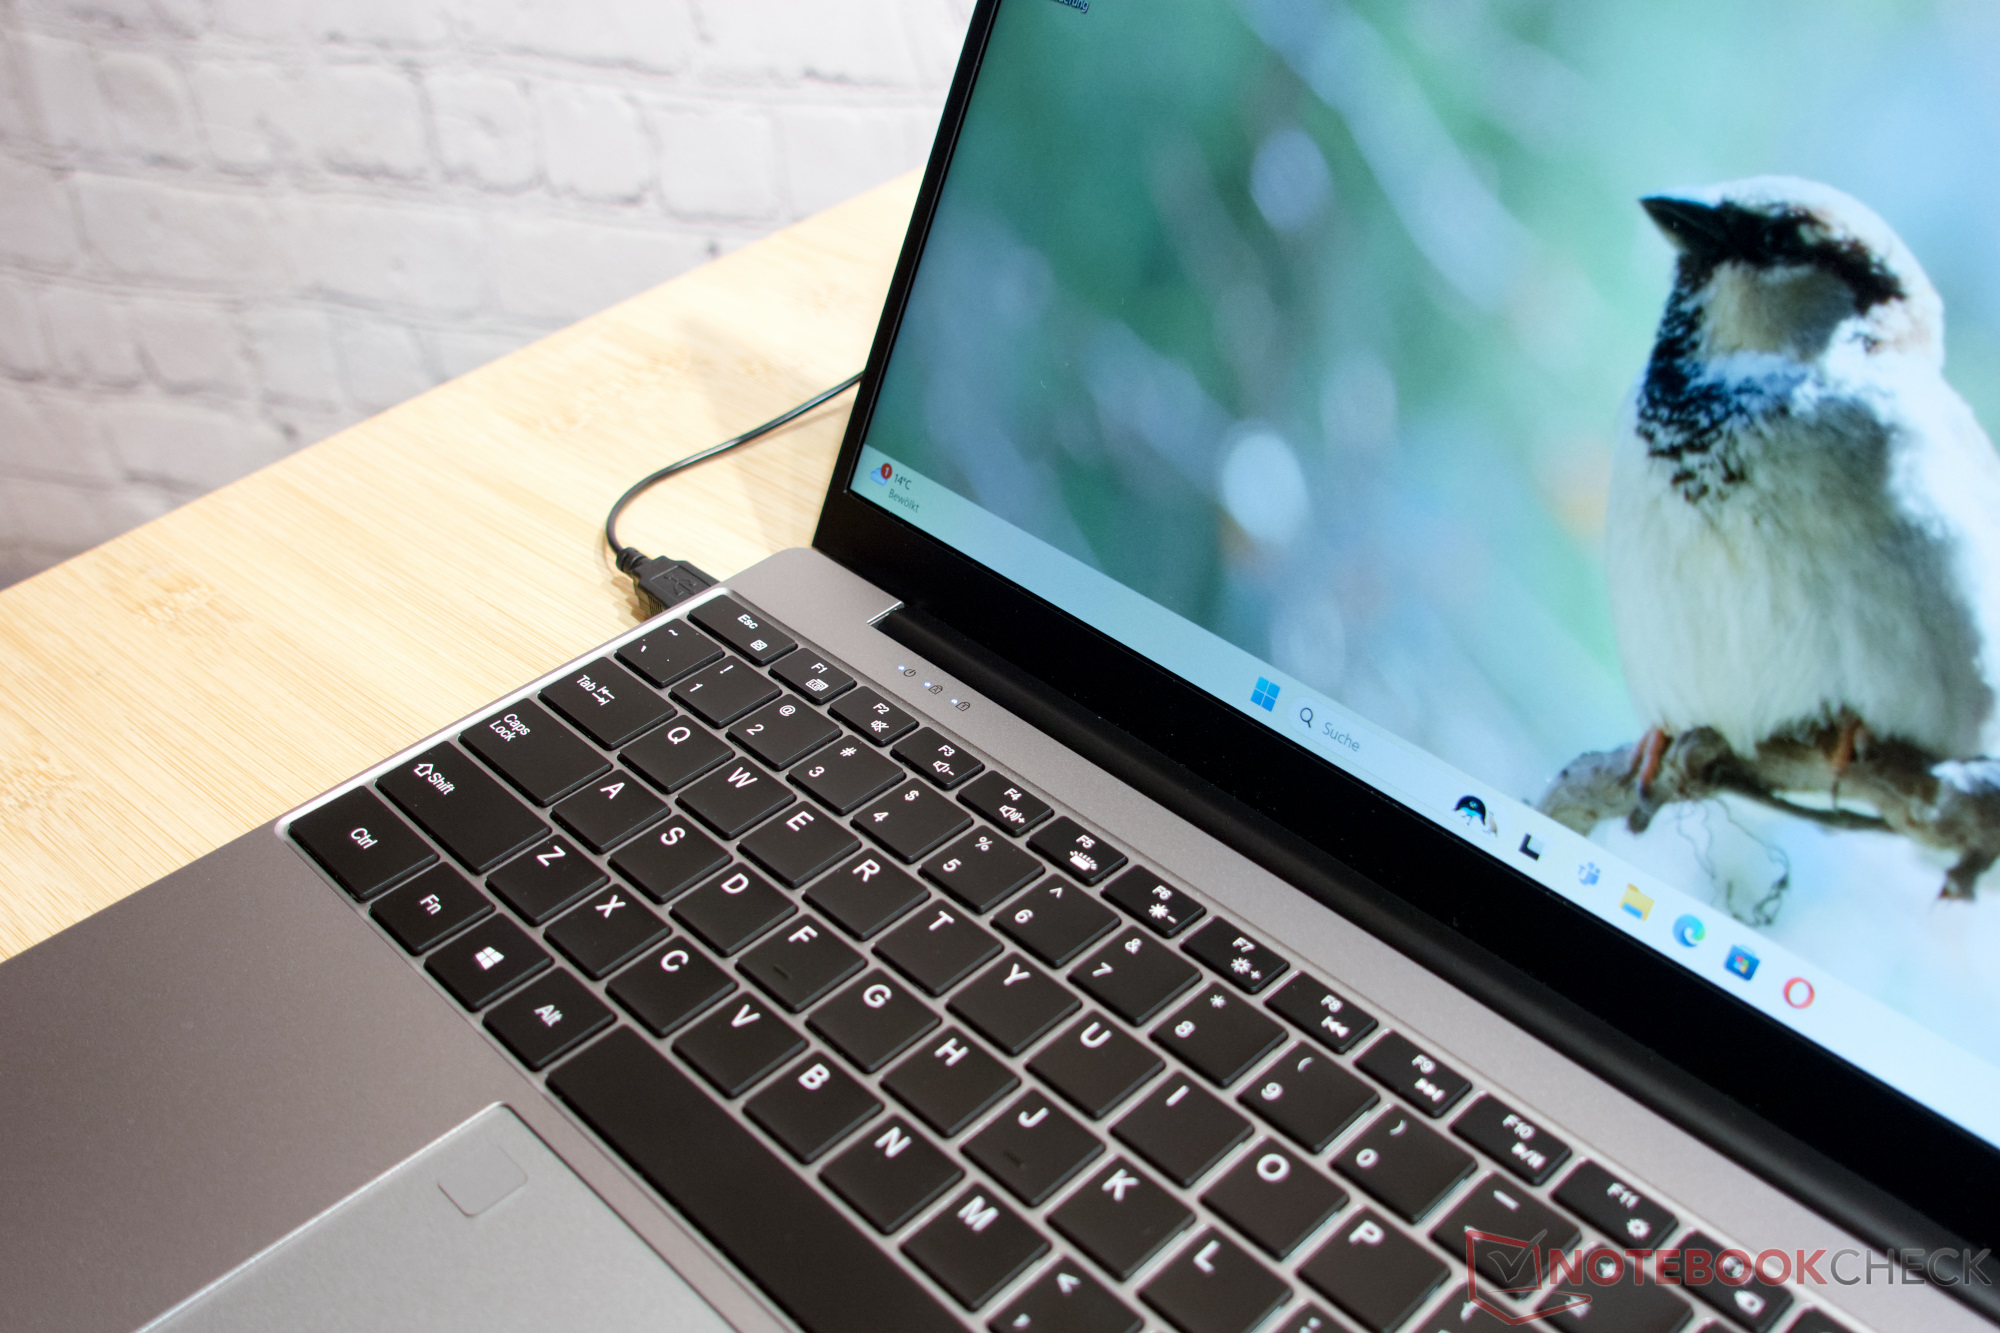
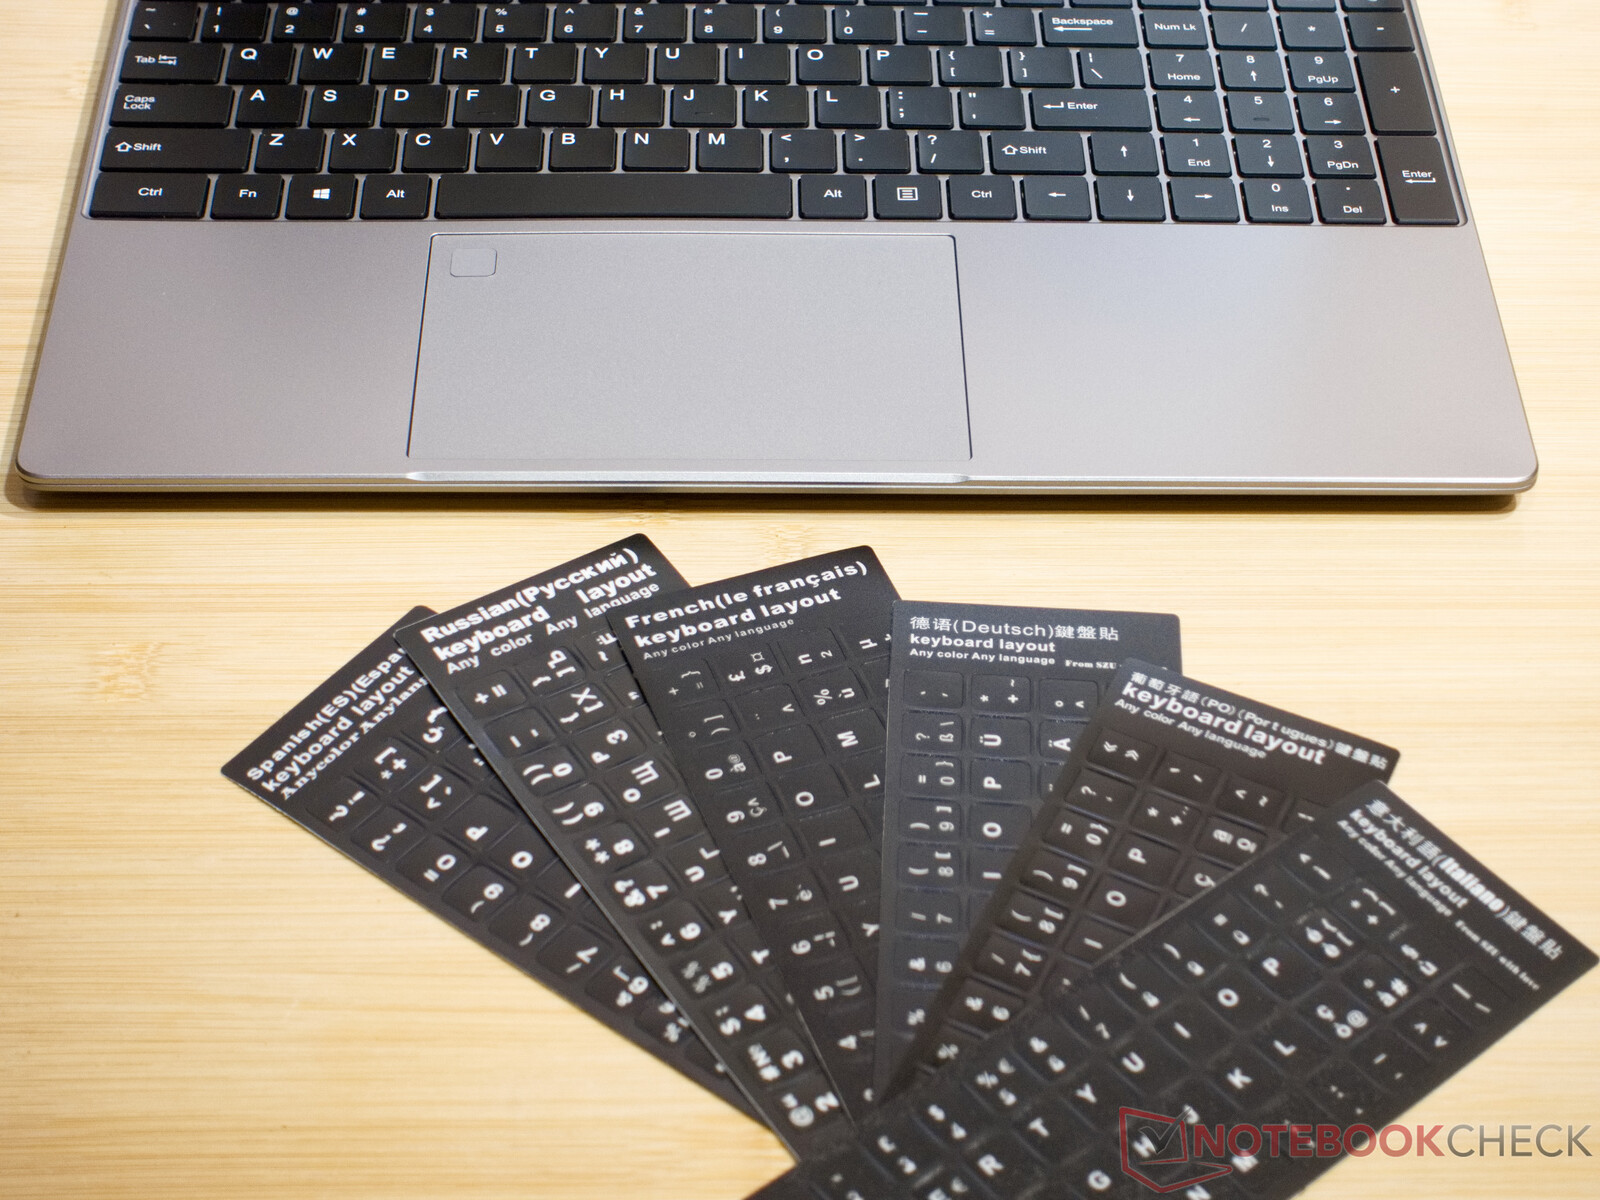
Ninkear A15 Plus 的发光键盘非常出色。它配备了全尺寸按键,包括数字键盘。1.4 毫米的键程恰到好处,手感清脆。遗憾的是,这款笔记本电脑只有美式布局,即 ANSI 格式的 QWERTY 键盘。
这意味着要切换到 ISO 格式的 QWERTY 键盘并不容易。虽然制造商提供了各种语言的键盘贴纸,但德语键盘布局比笔记本电脑多一个键。这使得用户更容易习惯美国国际键盘布局。.
虽然大触摸板提供多点触控输入功能,但在我们的测试中,它在按键时也会出现问题。鼠标指针可能会跳动。幸运的是,制造商还提供了一个鼠标作为替代。此外,我们在评测发布前不久发现,经过几次更新后,这个问题就消失了。大型触摸板现在可以完美运行。
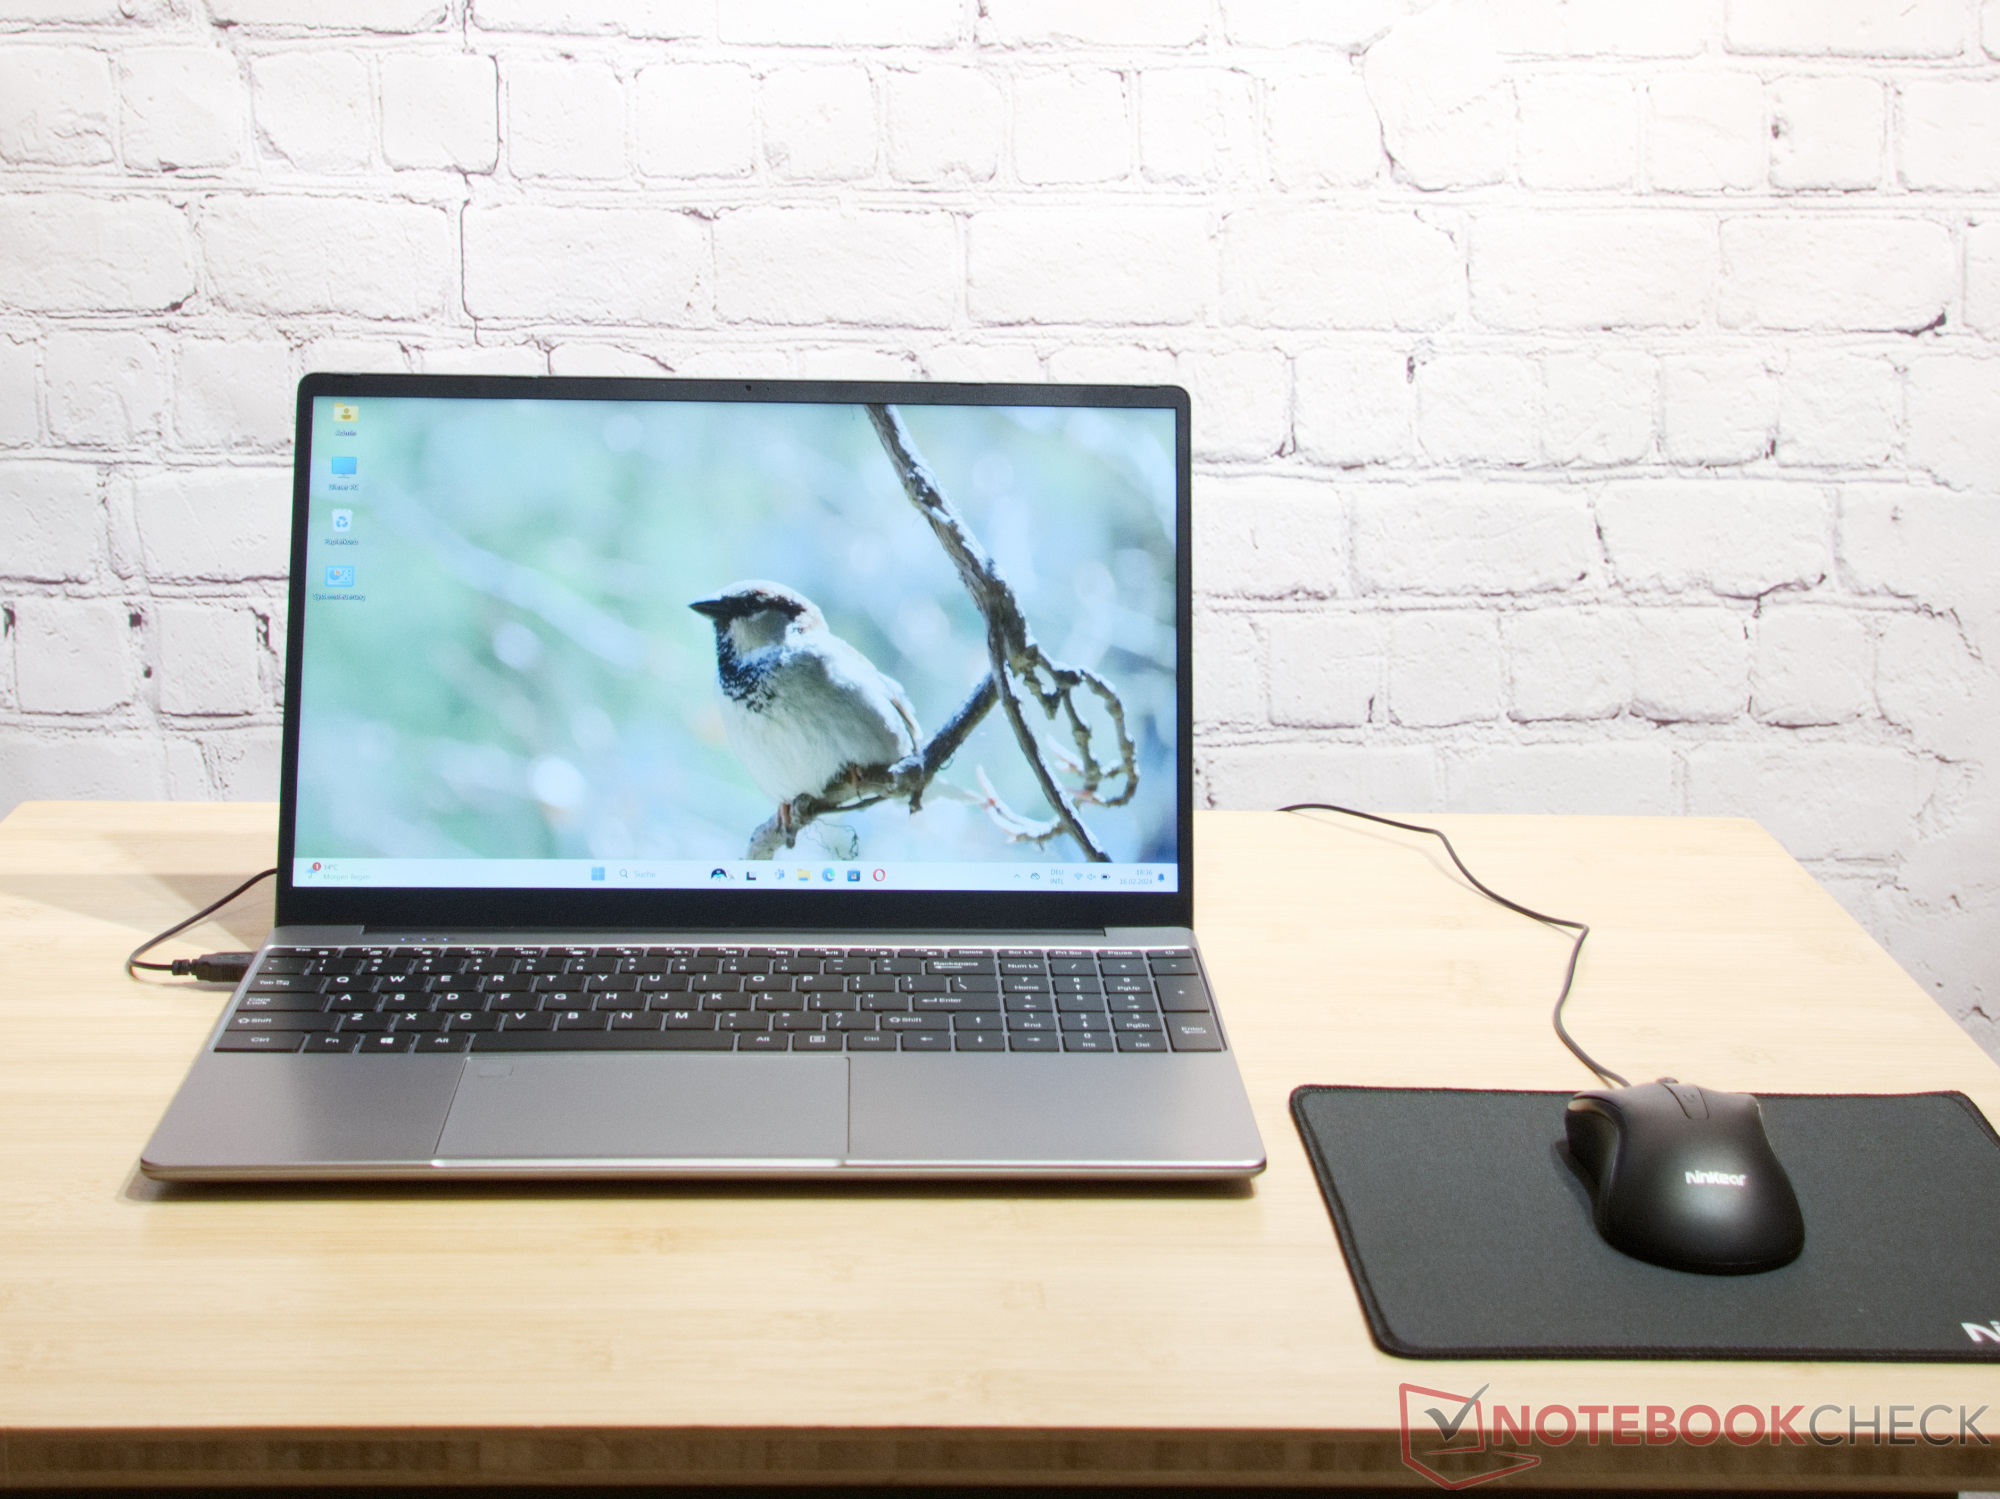
显示屏全高清 IPS

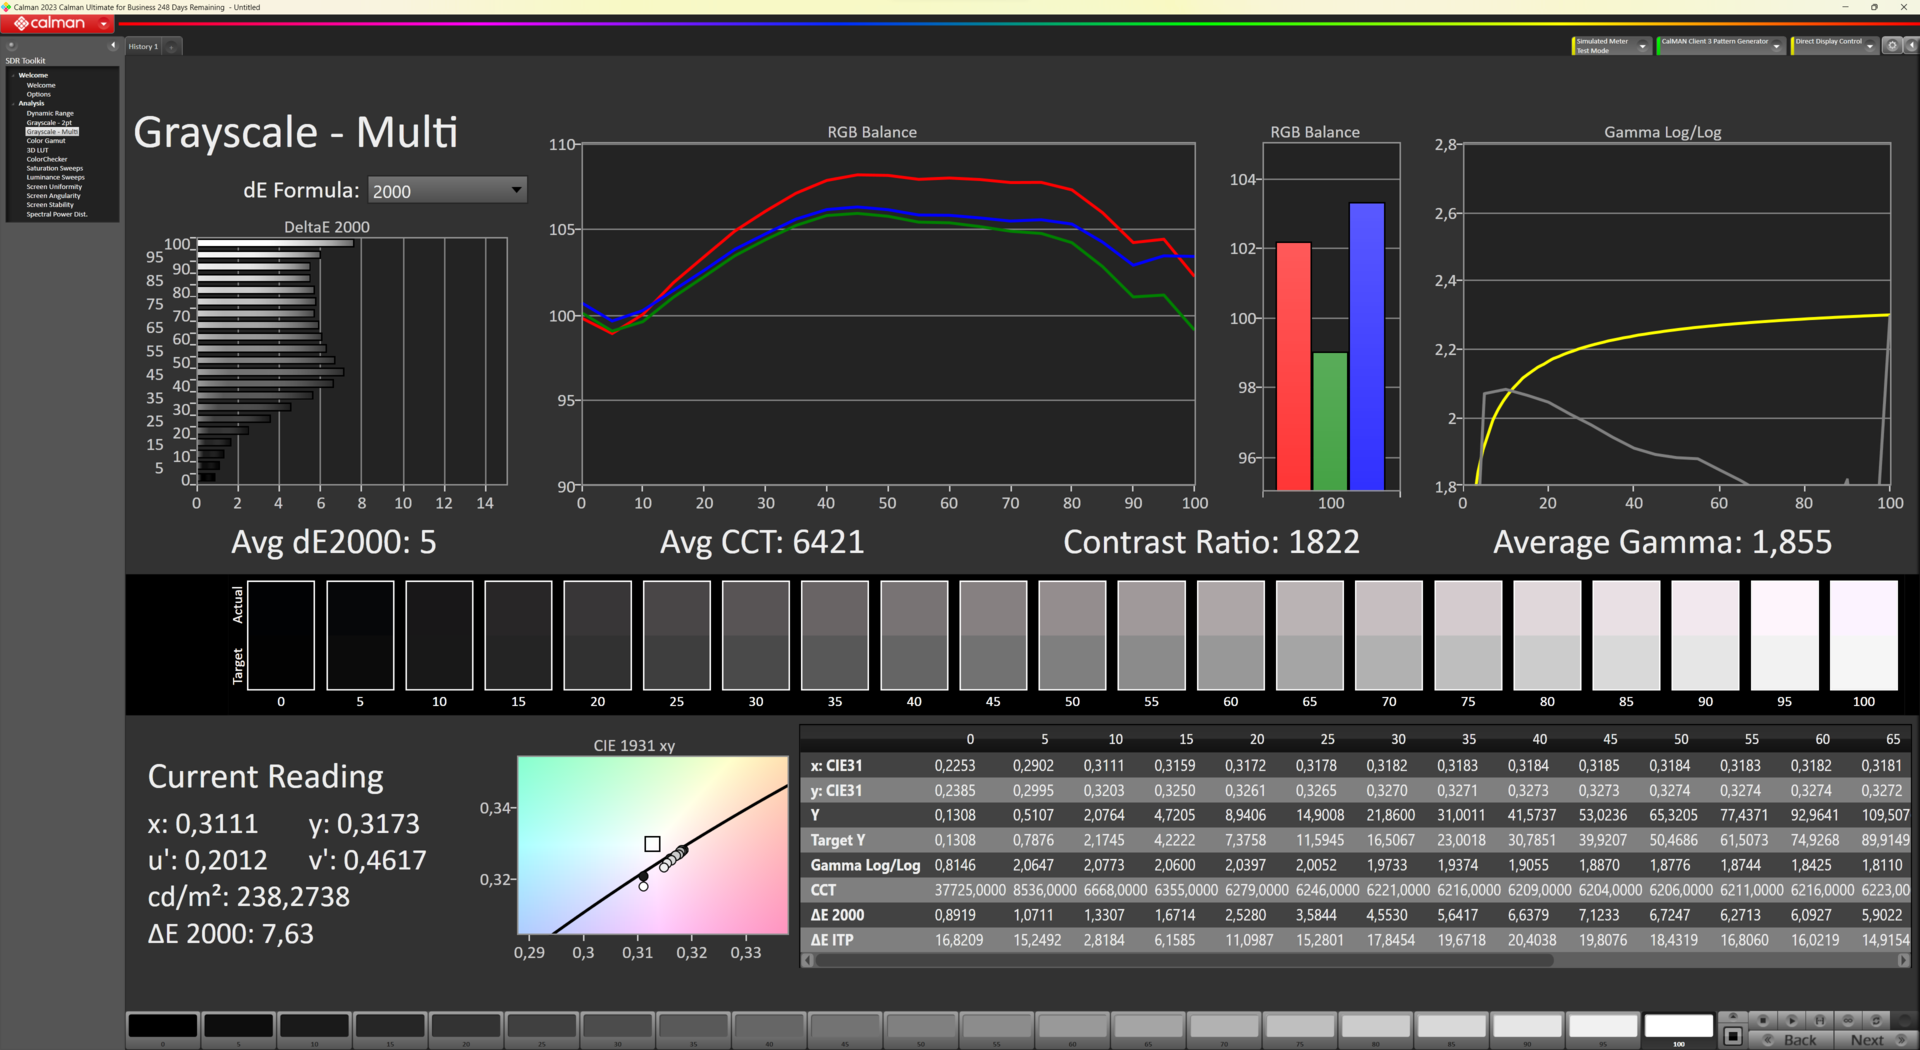
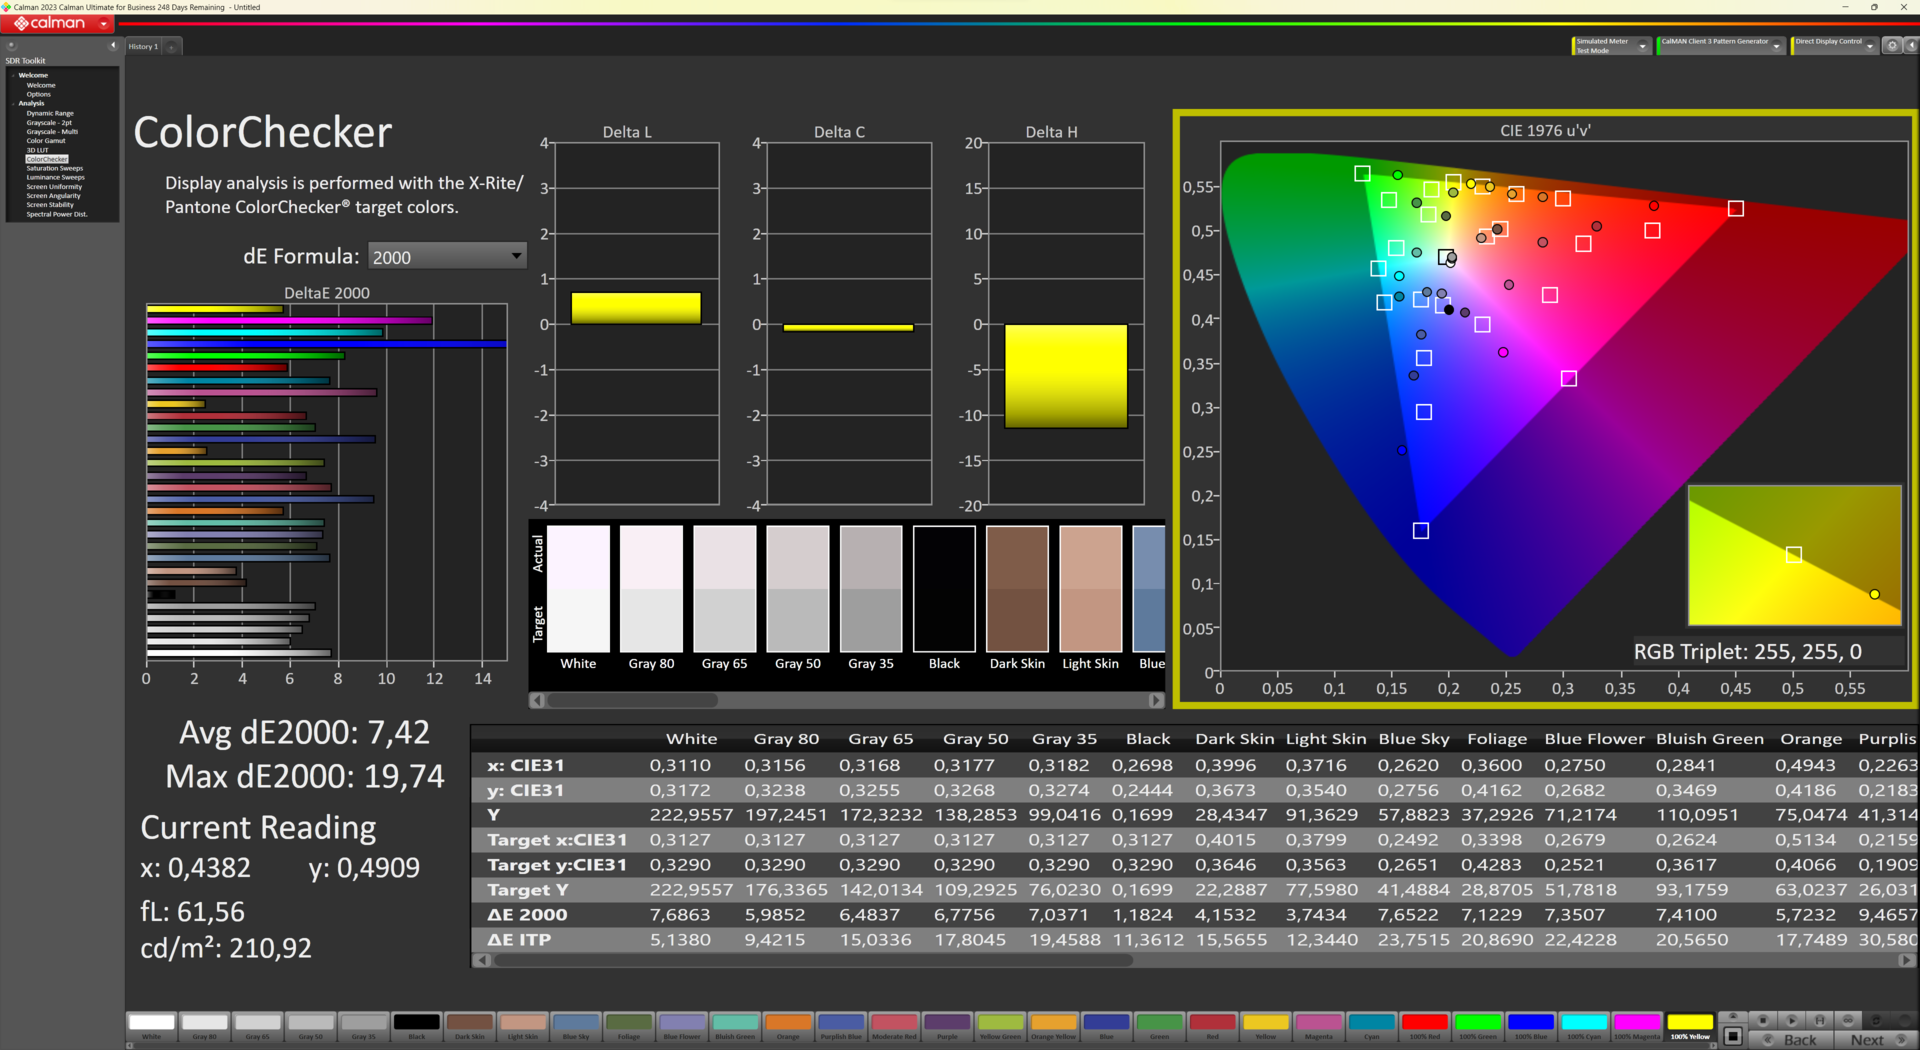
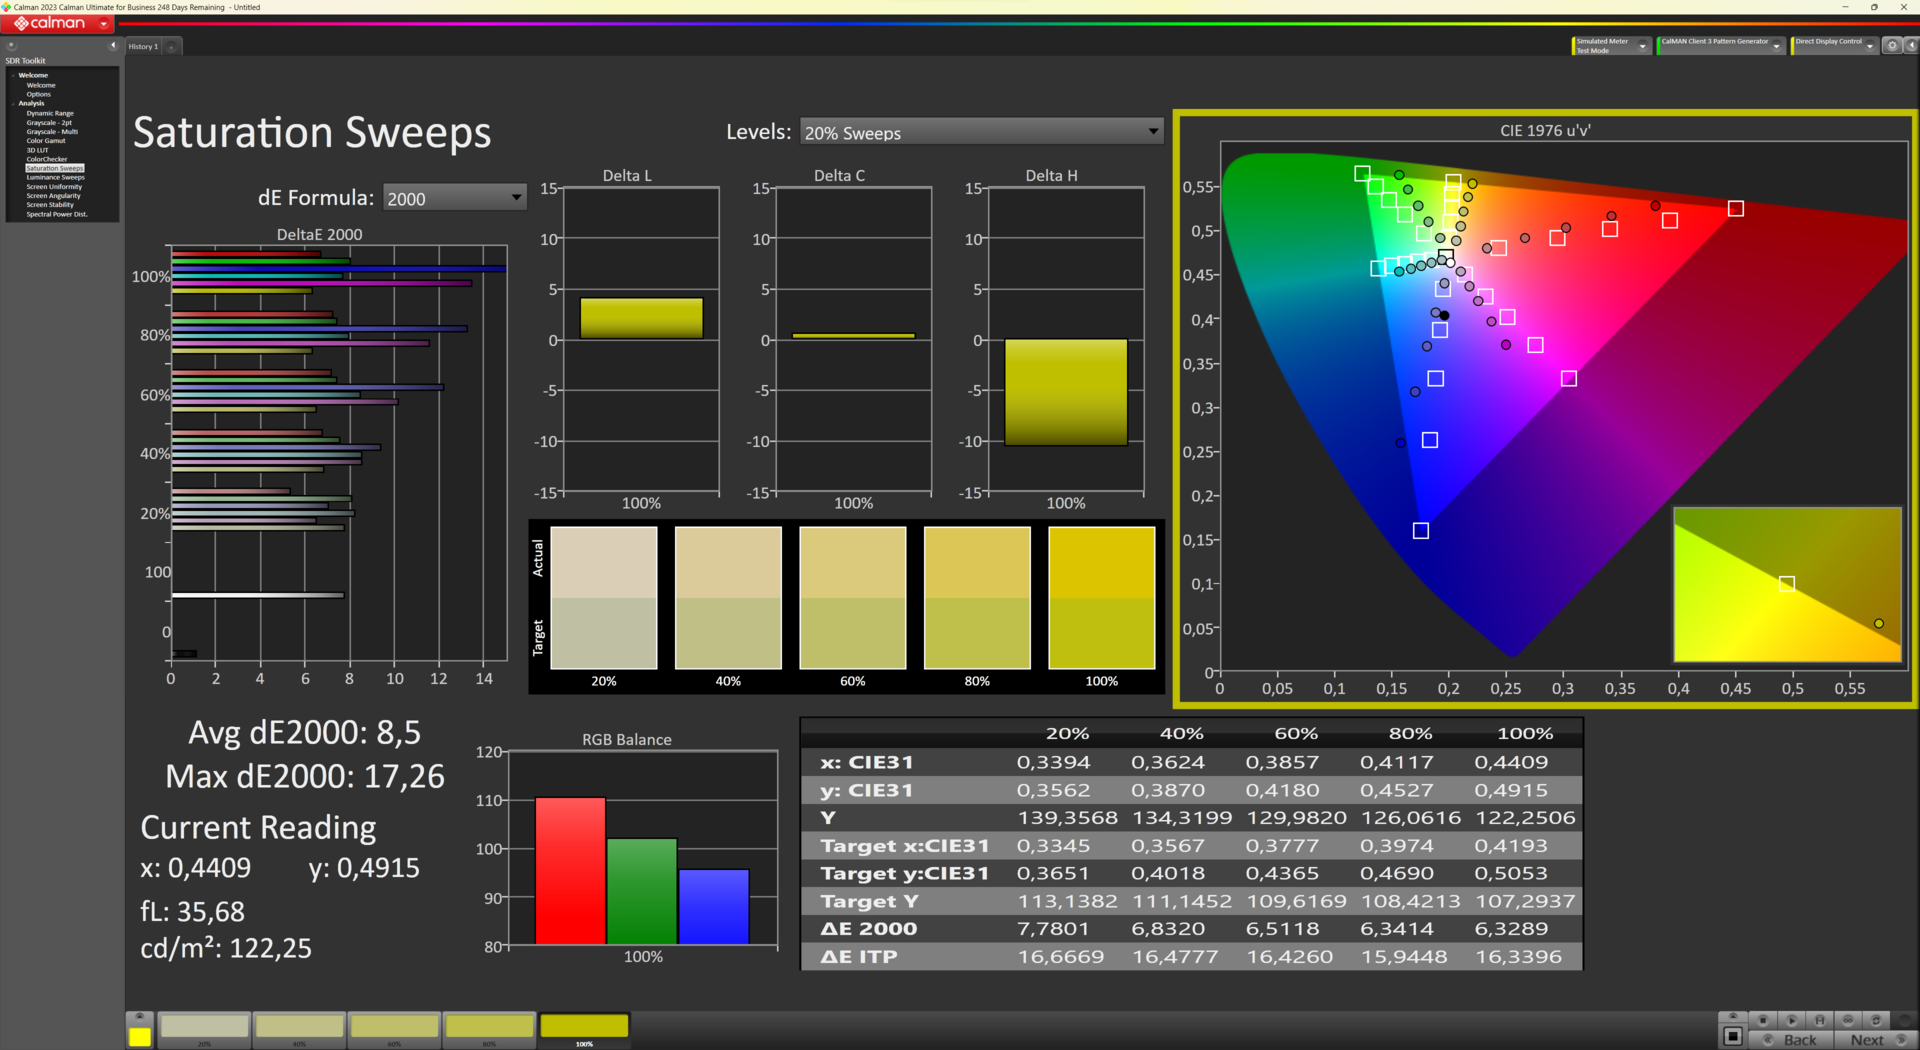
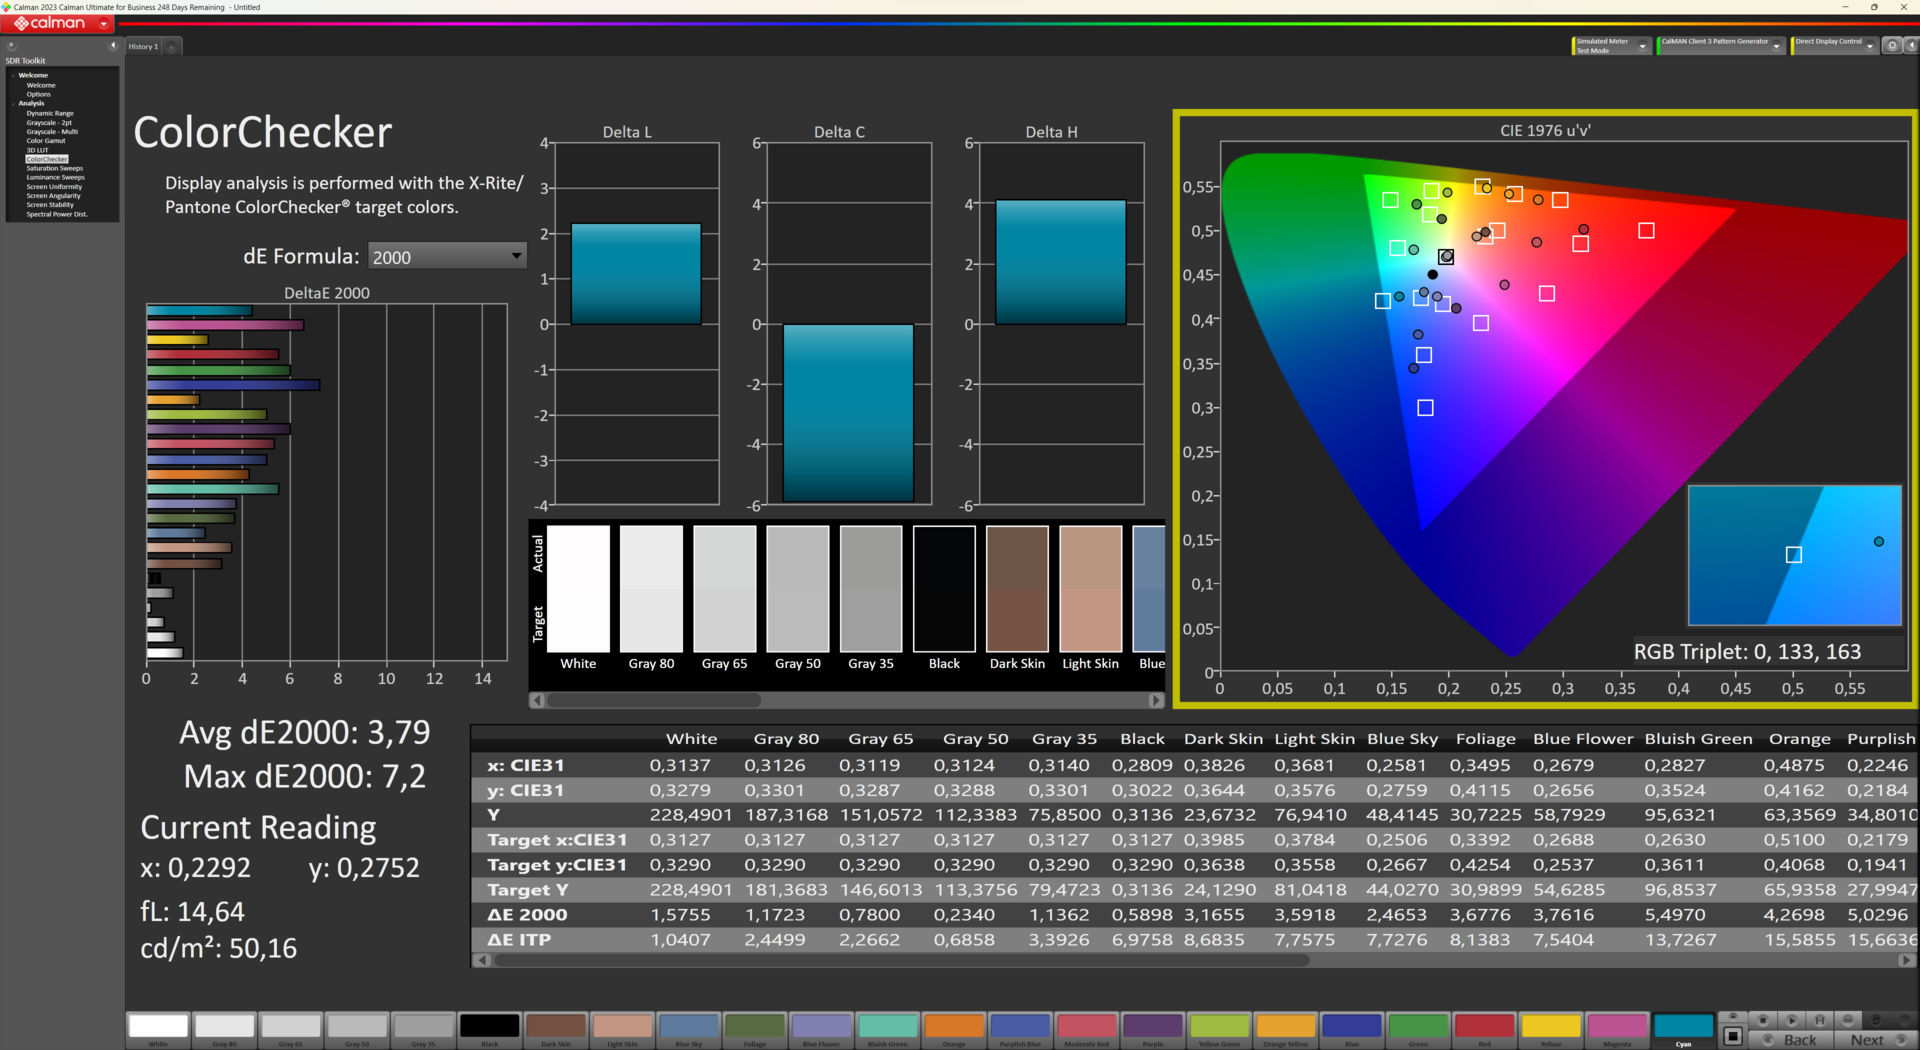
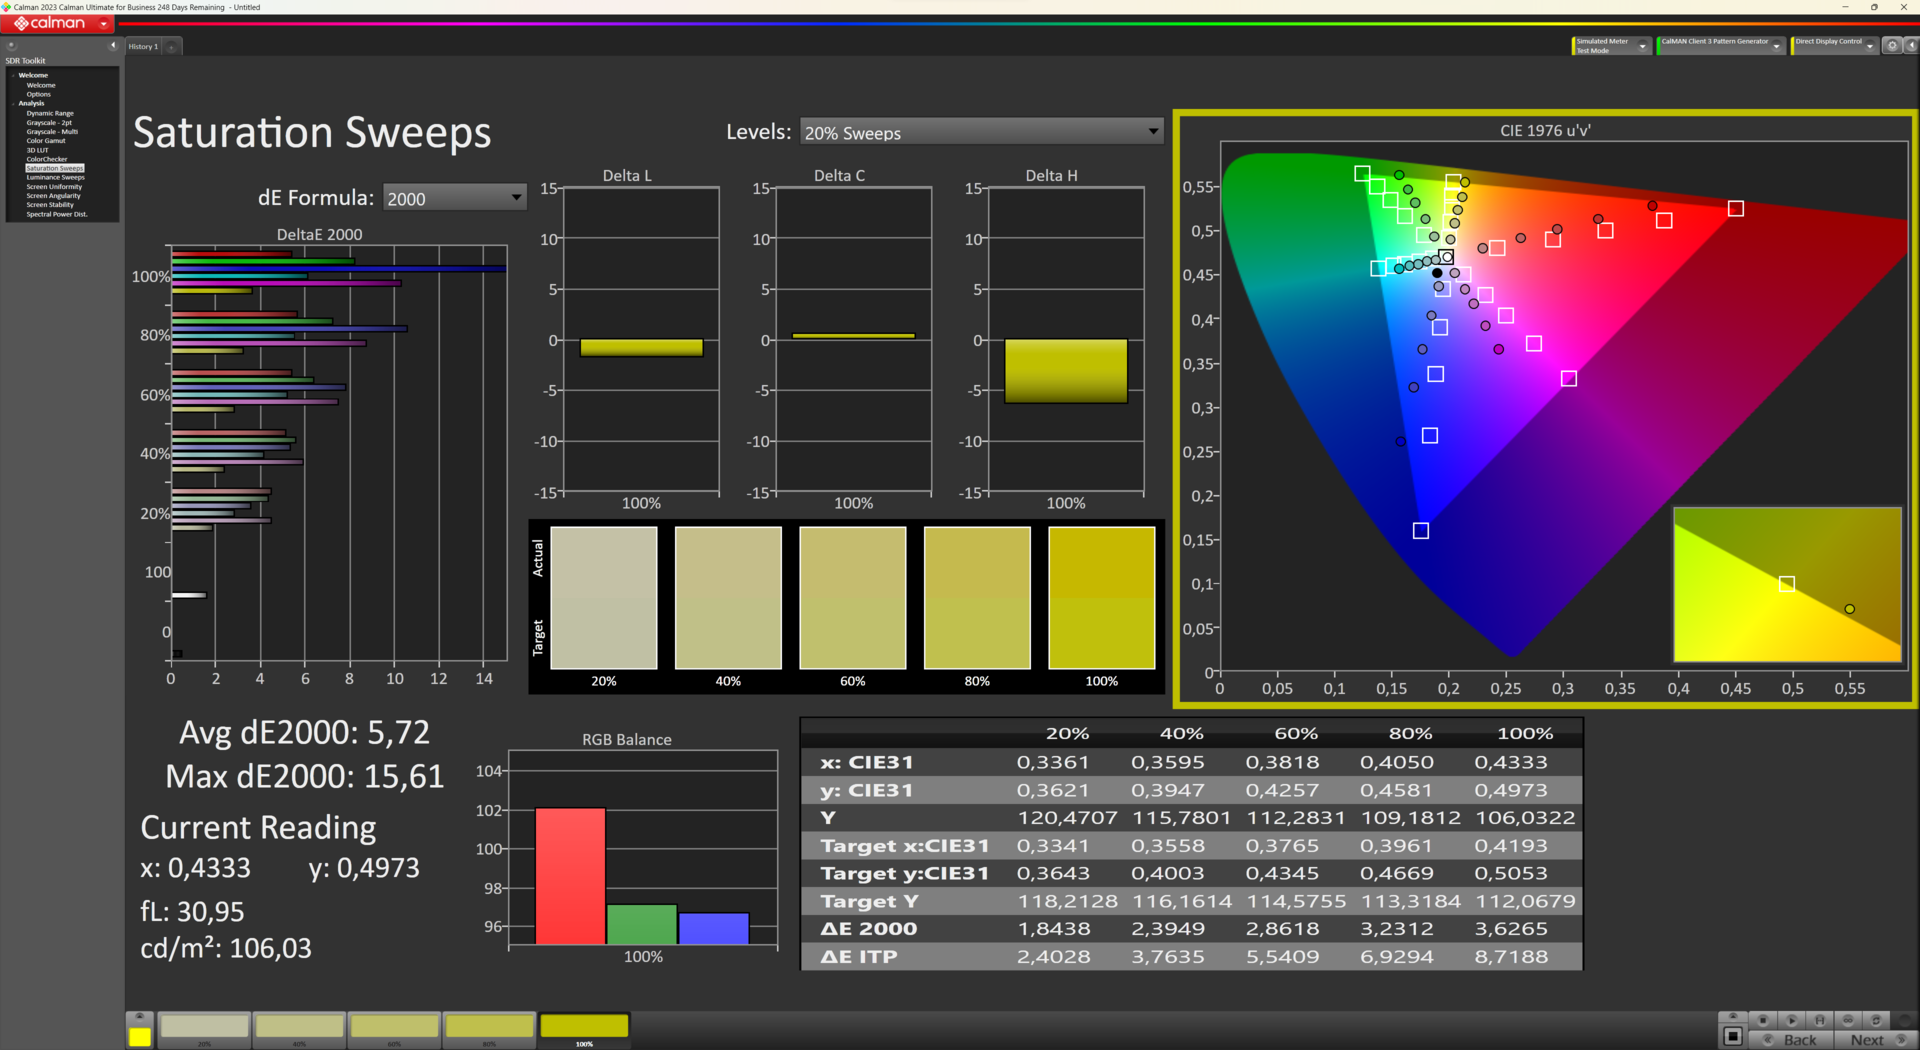
遗憾的是,Ninkear A15 Plus 的显示屏采用 60 Hz 的全高清分辨率,除了基本的办公用途外,并不适合其他用途。低蓝光显示屏的色彩准确度不高,亮度也有待提高。亮度无法超过 250 cd/m²。
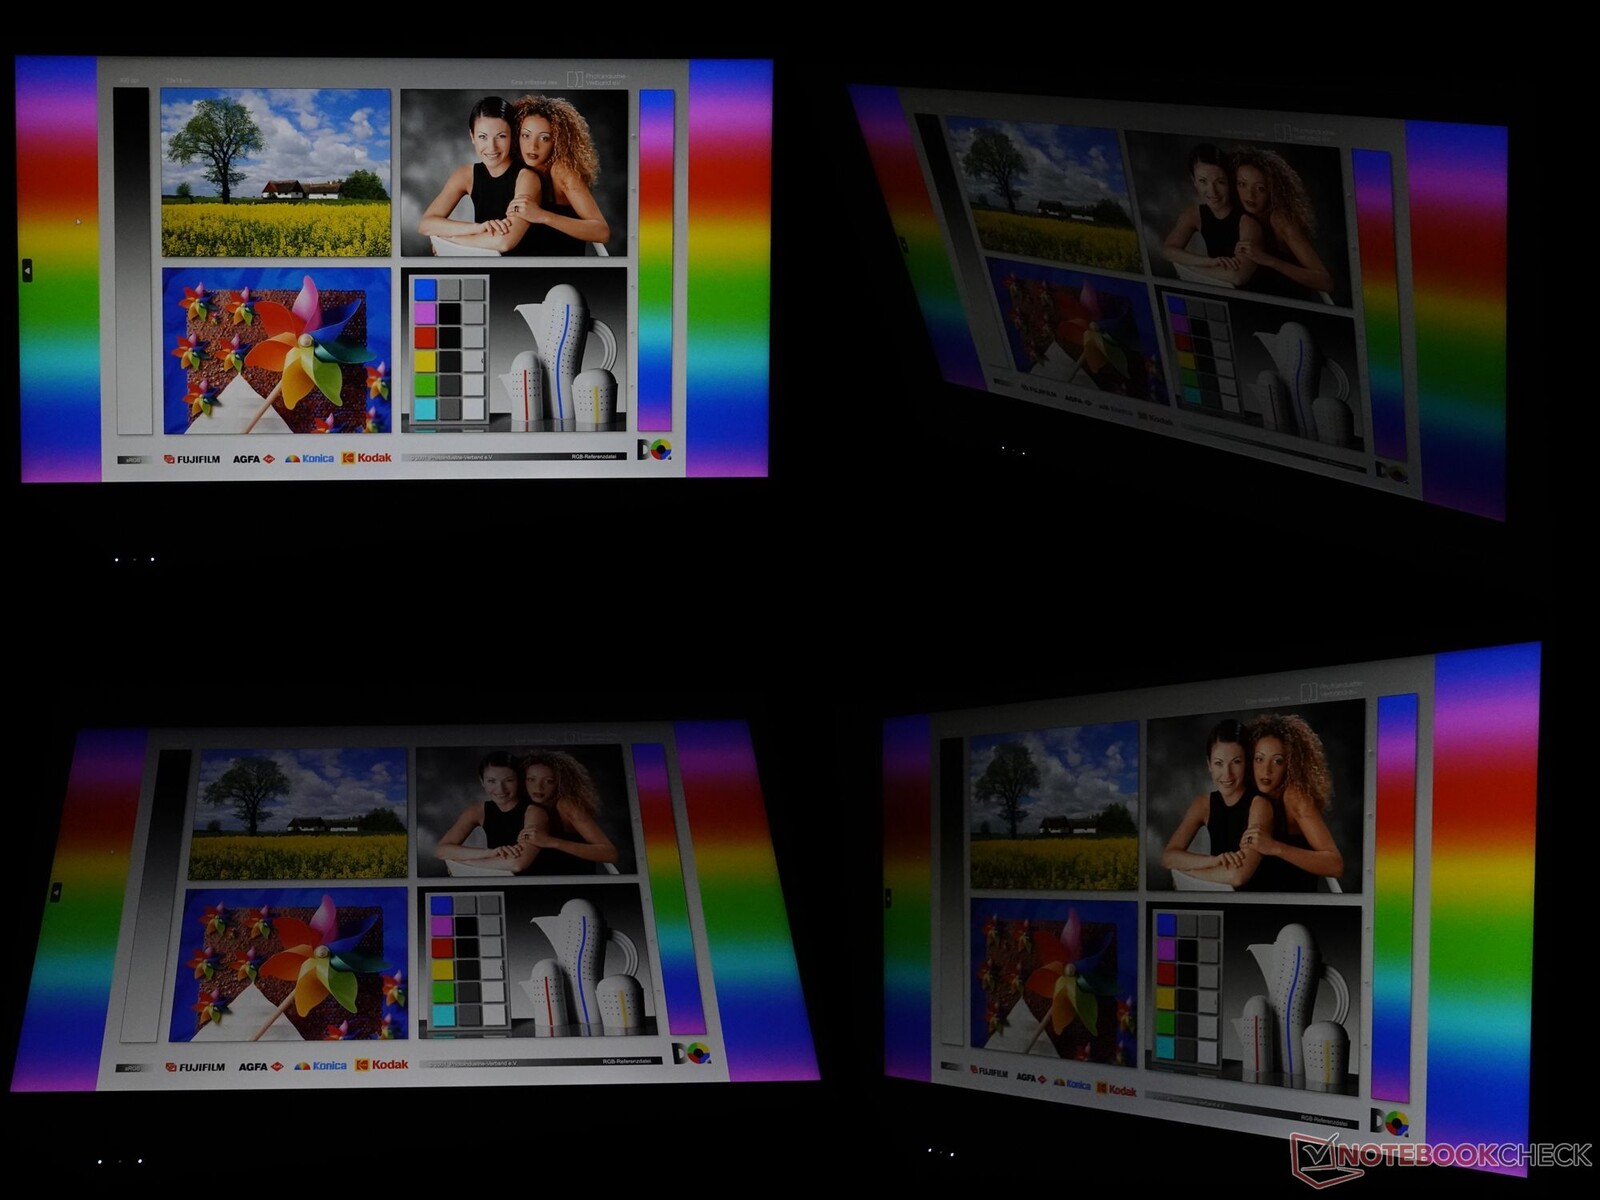
不过,屏幕不会闪烁,响应时间尚可,可视角度稳定的 IPS 面板的光照也相对均匀。主观而言,笔记本屏幕的图像质量不错。不过,该设备无疑不适合作为平面设计师的专业设备使用。
| |||||||||||||||||||||||||
Brightness Distribution: 89 %
Center on Battery: 250 cd/m²
Contrast: 1601:1 (Black: 0.1587 cd/m²)
ΔE ColorChecker Calman: 7.42 | ∀{0.5-29.43 Ø4.71}
calibrated: 5.72
ΔE Greyscale Calman: 5 | ∀{0.09-98 Ø4.96}
40.34% AdobeRGB 1998 (Argyll 3D)
58.06% sRGB (Argyll 3D)
39.04% Display P3 (Argyll 3D)
Gamma: 1.855
CCT: 6421 K
| Ninkear A15 Plus (16+512) HKC023D, IPS, 1920x1080, 15.6" | Lenovo IdeaPad 5 Pro 16ARH7 AUO B160QAN02.H, IPS, 2560x1600, 16" | Eurocom C315 Blitz BOE HF NE156QUM-N64, IPS, 3840x2160, 15.6" | Schenker VIA 15 Pro M22 NE156QHM-NY2, IPS, 2560x1440, 15.6" | HP 250 G9 7N029ES CMN1538, IPS, 1920x1080, 15.6" | Asus P1511CEA-BQ753R Chi Mei N156HCA-EAB, IPS, 1920x1080, 15.6" | |
|---|---|---|---|---|---|---|
| Display | 67% | 71% | 70% | 11% | 10% | |
| Display P3 Coverage (%) | 39.04 | 65 66% | 67.7 73% | 67.5 73% | 43.3 11% | 42.8 10% |
| sRGB Coverage (%) | 58.06 | 98 69% | 96.5 66% | 97.1 67% | 64.8 12% | 64.1 10% |
| AdobeRGB 1998 Coverage (%) | 40.34 | 67.2 67% | 69.8 73% | 68.5 70% | 44.7 11% | 44.3 10% |
| Response Times | 47% | -134% | 38% | -41% | -48% | |
| Response Time Grey 50% / Grey 80% * (ms) | 25 ? | 14.1 ? 44% | 54.4 ? -118% | 13.8 ? 45% | 31.9 ? -28% | 33 ? -32% |
| Response Time Black / White * (ms) | 14 ? | 7.1 ? 49% | 34.8 ? -149% | 9.8 ? 30% | 21.6 ? -54% | 23 ? -64% |
| PWM Frequency (Hz) | ||||||
| Screen | 30% | 12% | 12% | 14% | -22% | |
| Brightness middle (cd/m²) | 254 | 415 63% | 262.5 3% | 354 39% | 281 11% | 269 6% |
| Brightness (cd/m²) | 244 | 409 68% | 260 7% | 331 36% | 257 5% | 250 2% |
| Brightness Distribution (%) | 89 | 91 2% | 85 -4% | 80 -10% | 82 -8% | 85 -4% |
| Black Level * (cd/m²) | 0.1587 | 0.32 -102% | 0.25 -58% | 0.41 -158% | 0.16 -1% | 0.67 -322% |
| Contrast (:1) | 1601 | 1297 -19% | 1050 -34% | 863 -46% | 1756 10% | 401 -75% |
| Colorchecker dE 2000 * | 7.42 | 1.92 74% | 3.34 55% | 2.4 68% | 4.7 37% | 3.81 49% |
| Colorchecker dE 2000 max. * | 19.74 | 5.71 71% | 7.72 61% | 6.4 68% | 18 9% | 7.34 63% |
| Colorchecker dE 2000 calibrated * | 5.72 | 0.58 90% | 0.91 84% | 1.4 76% | 3.7 35% | 3.91 32% |
| Greyscale dE 2000 * | 5 | 3.7 26% | 5.3 -6% | 3.2 36% | 3.6 28% | 2.46 51% |
| Gamma | 1.855 119% | 2.272 97% | 2.25 98% | 2.08 106% | 2.2 100% | 6451 0% |
| CCT | 6421 101% | 7132 91% | 7387 88% | 6786 96% | 7267 89% | 6451 101% |
| Total Average (Program / Settings) | 48% /
41% | -17% /
4% | 40% /
28% | -5% /
6% | -20% /
-19% |
* ... smaller is better
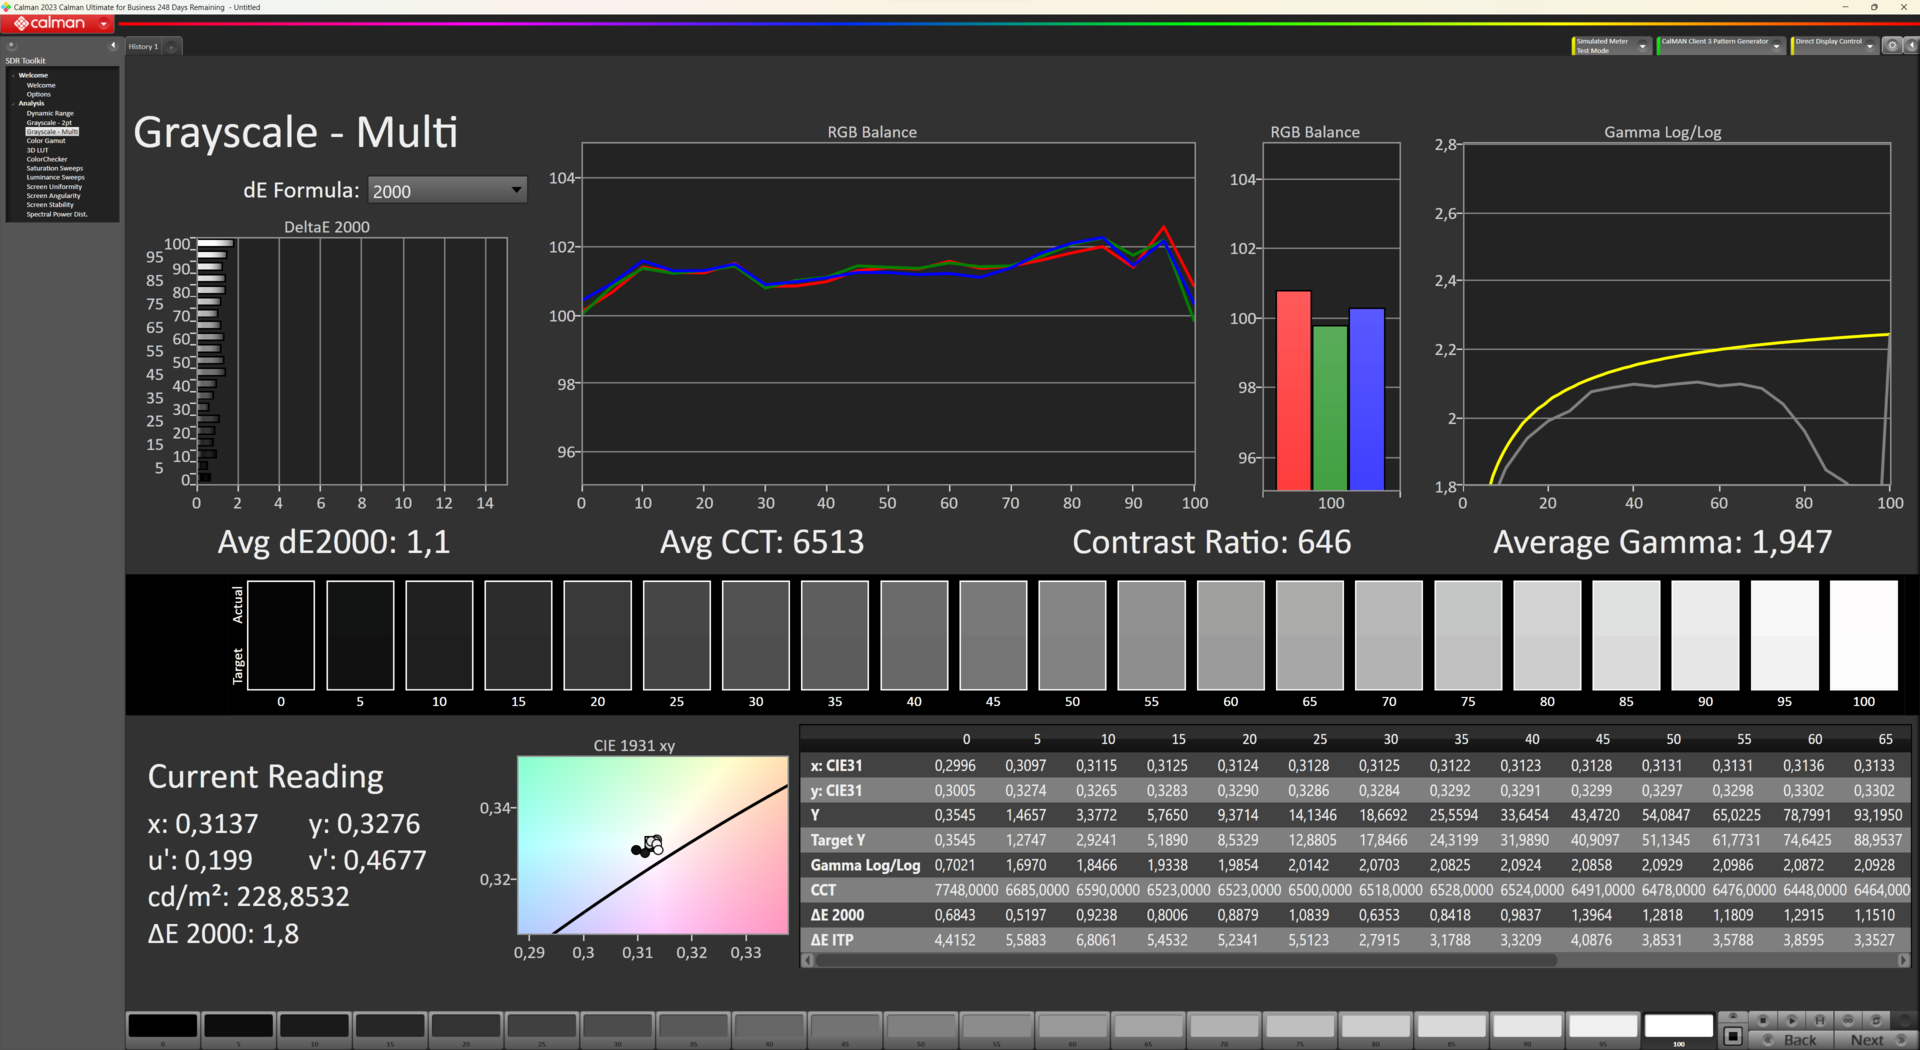
Ninkear A15 Plus 的显示屏蓝光发射率较低,但开箱后会有轻微的红色色调。使用肖像显示器公司的 X-Rite i1Pro 3 分光光度计和 Calman Ultimate 色彩校准软件进行校准后,ColorChecker DeltaE 2000 的平均值有所改善。
Display Response Times
| ↔ Response Time Black to White | ||
|---|---|---|
| 14 ms ... rise ↗ and fall ↘ combined | ↗ 6.5 ms rise |  |
| ↘ 7.5 ms fall | ||
| The screen shows good response rates in our tests, but may be too slow for competitive gamers. In comparison, all tested devices range from 0.1 (minimum) to 240 (maximum) ms. » 34 % of all devices are better. This means that the measured response time is better than the average of all tested devices (19.8 ms). | ||
| ↔ Response Time 50% Grey to 80% Grey | ||
| 25 ms ... rise ↗ and fall ↘ combined | ↗ 15.5 ms rise |  |
| ↘ 9.5 ms fall | ||
| The screen shows relatively slow response rates in our tests and may be too slow for gamers. In comparison, all tested devices range from 0.165 (minimum) to 636 (maximum) ms. » 35 % of all devices are better. This means that the measured response time is better than the average of all tested devices (31 ms). | ||
Screen Flickering / PWM (Pulse-Width Modulation)
| Screen flickering / PWM not detected |  | ||
In comparison: 52 % of all tested devices do not use PWM to dim the display. If PWM was detected, an average of 7754 (minimum: 5 - maximum: 343500) Hz was measured. | |||
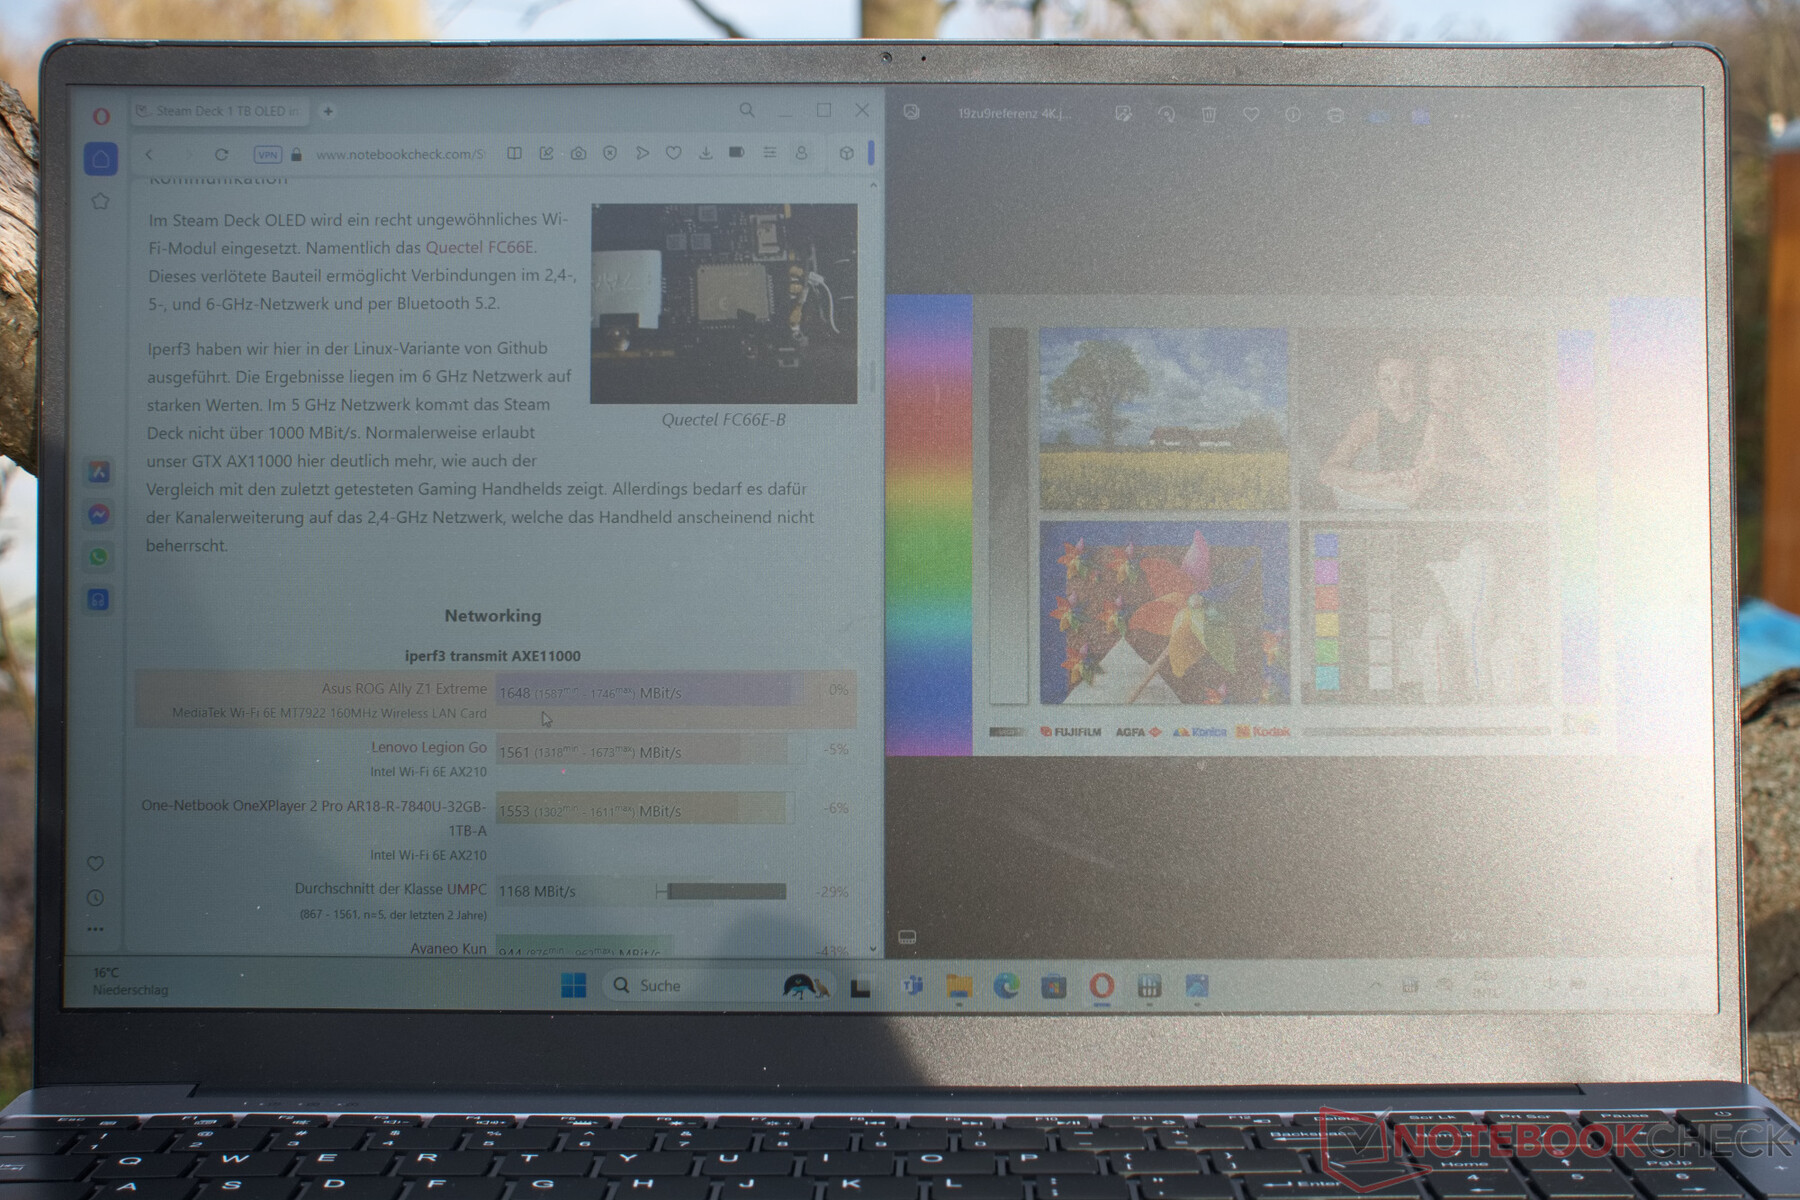
得益于亚光显示屏表面和良好的对比度,这款笔记本电脑在一定程度上可以在户外使用。
性能尽管 Ryzen 7 性能不足,但仍适合日常使用
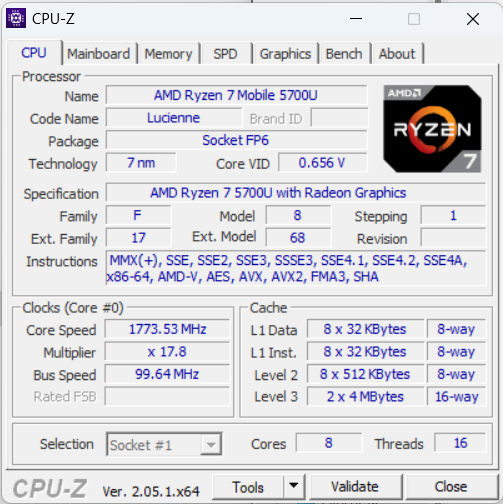
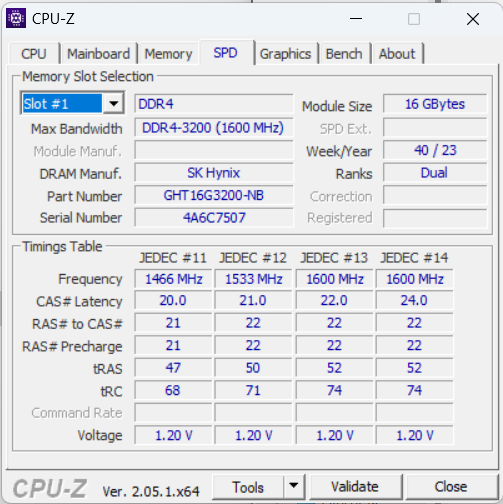
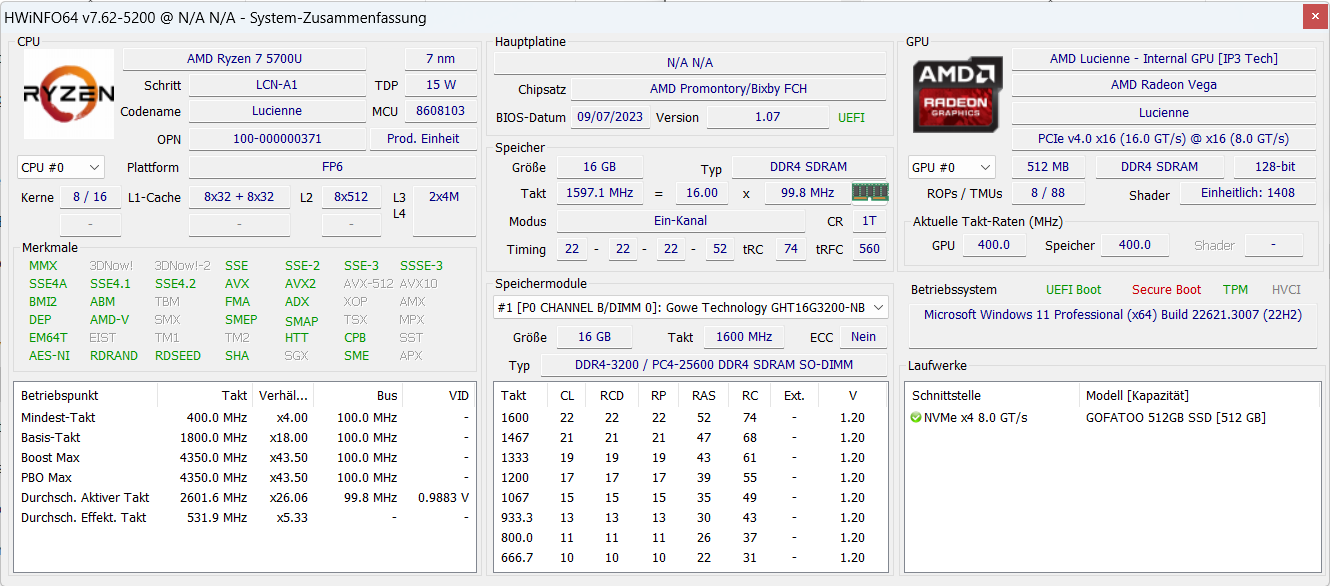
......(英文 AMD Ryzen 7 5700U是一款传统的芯片,但拥有 8 个 Zen 2 内核和 16 个线程,仍能提供令人印象深刻的性能。我们的测试设备还配备了 16 GB 内存。
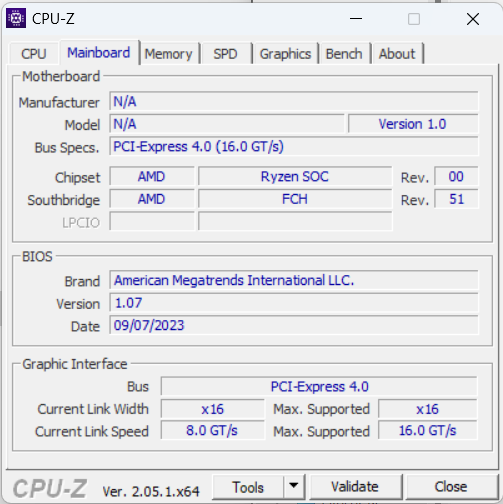
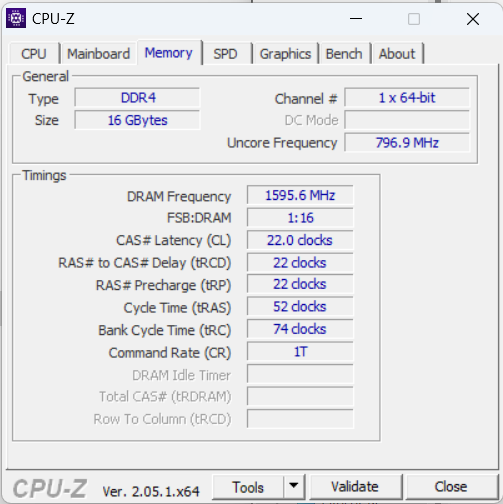
Ninkear A15 Plus 也有 32 GB DDR 4 内存的配置。这是插入式的。不过,测试设备只有一个 SO-DIMM 空间。因此,这是一个单通道配置。
测试条件
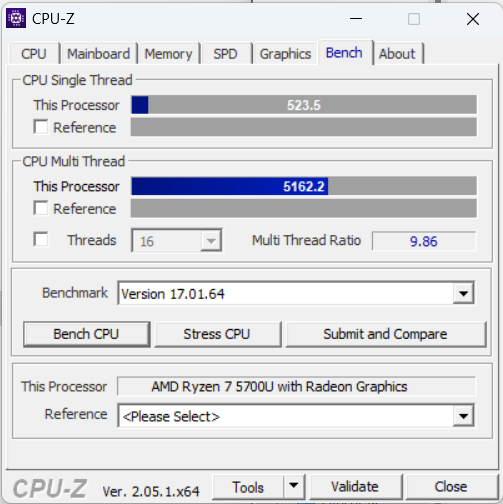
Ninkear 没有安装任何性能控制软件,因此只能通过 Windows 提供的级别进行性能控制。我们在 "最佳性能 "模式下对笔记本电脑进行了测试。Ryzen 7 5700U 的提升功率为 30 W,持续功率为 15 W。相比之下,这两个数值都相对较低。但由于 TDP 较低,笔记本电脑通常可以安静或非常安静地工作。
处理器
500 欧元价位的笔记本电脑通常配备英特尔酷睿 i3 或 Ryzen 3 处理器。有些甚至只配备英特尔 N 系列处理器。处理器 Ryzen 7 5700U因此,Ninkear A15 Plus 中的 Ryzen 7 5700U 虽然 TDP 相对较低,但性能却明显更强。
另一方面,这款笔记本电脑依然非常安静,处理器性能足以满足日常冲浪、流媒体和办公需求。AMD 处理器的多核性能仍然非常实用,也能与像 英特尔酷睿 i7-1360P等处理器相抗衡,尽管它严重落后于新的 英特尔酷睿至尊 7 155H.
Cinebench R15 Multi Loop test
Cinebench R23: Multi Core | Single Core
Cinebench R20: CPU (Multi Core) | CPU (Single Core)
Cinebench R15: CPU Multi 64Bit | CPU Single 64Bit
Blender: v2.79 BMW27 CPU
7-Zip 18.03: 7z b 4 | 7z b 4 -mmt1
Geekbench 6.7: Multi-Core | Single-Core
Geekbench 5.5: Multi-Core | Single-Core
HWBOT x265 Benchmark v2.2: 4k Preset
LibreOffice : 20 Documents To PDF
R Benchmark 2.5: Overall mean
| CPU Performance rating | |
| Asus ZenBook 14 UX3405MA | |
| Average of class Office | |
| Lenovo IdeaPad 5 Pro 16ARH7 -2! | |
| Eurocom C315 Blitz | |
| Schenker VIA 15 Pro M22 -2! | |
| Ninkear A15 Plus (16+512) | |
| Average AMD Ryzen 7 5700U | |
| HP 250 G9 7N029ES | |
| Asus P1511CEA-BQ753R -2! | |
| Cinebench R23 / Multi Core | |
| Asus ZenBook 14 UX3405MA | |
| Average of class Office (1673 - 22808, n=76, last 2 years) | |
| Schenker VIA 15 Pro M22 | |
| Lenovo IdeaPad 5 Pro 16ARH7 | |
| Ninkear A15 Plus (16+512) | |
| Average AMD Ryzen 7 5700U (4861 - 10139, n=20) | |
| Eurocom C315 Blitz | |
| HP 250 G9 7N029ES | |
| Asus P1511CEA-BQ753R | |
| Cinebench R23 / Single Core | |
| Asus ZenBook 14 UX3405MA | |
| Average of class Office (708 - 2130, n=76, last 2 years) | |
| Eurocom C315 Blitz | |
| Lenovo IdeaPad 5 Pro 16ARH7 | |
| HP 250 G9 7N029ES | |
| Asus P1511CEA-BQ753R | |
| Ninkear A15 Plus (16+512) | |
| Schenker VIA 15 Pro M22 | |
| Average AMD Ryzen 7 5700U (1177 - 1268, n=20) | |
| Cinebench R20 / CPU (Multi Core) | |
| Asus ZenBook 14 UX3405MA | |
| Average of class Office (648 - 8840, n=75, last 2 years) | |
| Lenovo IdeaPad 5 Pro 16ARH7 | |
| Schenker VIA 15 Pro M22 | |
| Ninkear A15 Plus (16+512) | |
| Average AMD Ryzen 7 5700U (1887 - 3877, n=21) | |
| Eurocom C315 Blitz | |
| HP 250 G9 7N029ES | |
| Asus P1511CEA-BQ753R | |
| Cinebench R20 / CPU (Single Core) | |
| Asus ZenBook 14 UX3405MA | |
| Average of class Office (345 - 816, n=75, last 2 years) | |
| Eurocom C315 Blitz | |
| Lenovo IdeaPad 5 Pro 16ARH7 | |
| HP 250 G9 7N029ES | |
| Asus P1511CEA-BQ753R | |
| Ninkear A15 Plus (16+512) | |
| Schenker VIA 15 Pro M22 | |
| Average AMD Ryzen 7 5700U (471 - 495, n=21) | |
| Cinebench R15 / CPU Multi 64Bit | |
| Asus ZenBook 14 UX3405MA | |
| Average of class Office (250 - 3380, n=77, last 2 years) | |
| Schenker VIA 15 Pro M22 | |
| Lenovo IdeaPad 5 Pro 16ARH7 | |
| Ninkear A15 Plus (16+512) | |
| Average AMD Ryzen 7 5700U (856 - 1691, n=20) | |
| Eurocom C315 Blitz | |
| HP 250 G9 7N029ES | |
| Asus P1511CEA-BQ753R | |
| Cinebench R15 / CPU Single 64Bit | |
| Asus ZenBook 14 UX3405MA | |
| Average of class Office (99.5 - 316, n=77, last 2 years) | |
| Lenovo IdeaPad 5 Pro 16ARH7 | |
| Eurocom C315 Blitz | |
| HP 250 G9 7N029ES | |
| Ninkear A15 Plus (16+512) | |
| Schenker VIA 15 Pro M22 | |
| Asus P1511CEA-BQ753R | |
| Average AMD Ryzen 7 5700U (181 - 190, n=19) | |
| Blender / v2.79 BMW27 CPU | |
| Asus P1511CEA-BQ753R | |
| HP 250 G9 7N029ES | |
| Eurocom C315 Blitz | |
| Ninkear A15 Plus (16+512) | |
| Average AMD Ryzen 7 5700U (292 - 557, n=20) | |
| Average of class Office (158 - 1940, n=76, last 2 years) | |
| Lenovo IdeaPad 5 Pro 16ARH7 | |
| Schenker VIA 15 Pro M22 | |
| Asus ZenBook 14 UX3405MA | |
| 7-Zip 18.03 / 7z b 4 | |
| Asus ZenBook 14 UX3405MA | |
| Schenker VIA 15 Pro M22 | |
| Lenovo IdeaPad 5 Pro 16ARH7 | |
| Average of class Office (7098 - 76886, n=77, last 2 years) | |
| Average AMD Ryzen 7 5700U (29095 - 47501, n=20) | |
| Ninkear A15 Plus (16+512) | |
| Eurocom C315 Blitz | |
| HP 250 G9 7N029ES | |
| Asus P1511CEA-BQ753R | |
| 7-Zip 18.03 / 7z b 4 -mmt1 | |
| Eurocom C315 Blitz | |
| Asus ZenBook 14 UX3405MA | |
| Average of class Office (3387 - 6469, n=77, last 2 years) | |
| Lenovo IdeaPad 5 Pro 16ARH7 | |
| HP 250 G9 7N029ES | |
| Ninkear A15 Plus (16+512) | |
| Schenker VIA 15 Pro M22 | |
| Average AMD Ryzen 7 5700U (4402 - 4620, n=20) | |
| Asus P1511CEA-BQ753R | |
| Geekbench 6.7 / Multi-Core | |
| Asus ZenBook 14 UX3405MA | |
| Eurocom C315 Blitz | |
| Average of class Office (757 - 17846, n=82, last 2 years) | |
| Ninkear A15 Plus (16+512) | |
| Ninkear A15 Plus (16+512) | |
| Average AMD Ryzen 7 5700U (4983 - 6260, n=5) | |
| HP 250 G9 7N029ES | |
| Geekbench 6.7 / Single-Core | |
| Eurocom C315 Blitz | |
| Asus ZenBook 14 UX3405MA | |
| Average of class Office (462 - 2988, n=83, last 2 years) | |
| HP 250 G9 7N029ES | |
| Ninkear A15 Plus (16+512) | |
| Ninkear A15 Plus (16+512) | |
| Average AMD Ryzen 7 5700U (1550 - 1625, n=5) | |
| Geekbench 5.5 / Multi-Core | |
| Asus ZenBook 14 UX3405MA | |
| Average of class Office (1483 - 16999, n=73, last 2 years) | |
| Schenker VIA 15 Pro M22 | |
| Eurocom C315 Blitz | |
| Lenovo IdeaPad 5 Pro 16ARH7 | |
| Average AMD Ryzen 7 5700U (4254 - 7635, n=19) | |
| Ninkear A15 Plus (16+512) | |
| HP 250 G9 7N029ES | |
| Asus P1511CEA-BQ753R | |
| Geekbench 5.5 / Single-Core | |
| Eurocom C315 Blitz | |
| Average of class Office (811 - 2175, n=73, last 2 years) | |
| Asus ZenBook 14 UX3405MA | |
| HP 250 G9 7N029ES | |
| Lenovo IdeaPad 5 Pro 16ARH7 | |
| Asus P1511CEA-BQ753R | |
| Schenker VIA 15 Pro M22 | |
| Ninkear A15 Plus (16+512) | |
| Average AMD Ryzen 7 5700U (1105 - 1205, n=19) | |
| HWBOT x265 Benchmark v2.2 / 4k Preset | |
| Asus ZenBook 14 UX3405MA | |
| Average of class Office (2.21 - 26, n=76, last 2 years) | |
| Schenker VIA 15 Pro M22 | |
| Lenovo IdeaPad 5 Pro 16ARH7 | |
| Average AMD Ryzen 7 5700U (6.08 - 12.1, n=20) | |
| Ninkear A15 Plus (16+512) | |
| Eurocom C315 Blitz | |
| HP 250 G9 7N029ES | |
| Asus P1511CEA-BQ753R | |
| LibreOffice / 20 Documents To PDF | |
| Ninkear A15 Plus (16+512) | |
| Lenovo IdeaPad 5 Pro 16ARH7 | |
| Schenker VIA 15 Pro M22 | |
| Average AMD Ryzen 7 5700U (52.4 - 75.5, n=20) | |
| Asus P1511CEA-BQ753R | |
| Average of class Office (39.9 - 102.3, n=76, last 2 years) | |
| HP 250 G9 7N029ES | |
| Asus ZenBook 14 UX3405MA | |
| Eurocom C315 Blitz | |
| R Benchmark 2.5 / Overall mean | |
| Asus P1511CEA-BQ753R | |
| Ninkear A15 Plus (16+512) | |
| Average AMD Ryzen 7 5700U (0.567 - 0.641, n=20) | |
| Schenker VIA 15 Pro M22 | |
| HP 250 G9 7N029ES | |
| Lenovo IdeaPad 5 Pro 16ARH7 | |
| Average of class Office (0.393 - 0.888, n=76, last 2 years) | |
| Asus ZenBook 14 UX3405MA | |
| Eurocom C315 Blitz | |
* ... smaller is better
AIDA64: FP32 Ray-Trace | FPU Julia | CPU SHA3 | CPU Queen | FPU SinJulia | FPU Mandel | CPU AES | CPU ZLib | FP64 Ray-Trace | CPU PhotoWorxx
| Performance rating | |
| Schenker VIA 15 Pro M22 | |
| Average of class Office | |
| Lenovo IdeaPad 5 Pro 16ARH7 | |
| Ninkear A15 Plus (16+512) | |
| Average AMD Ryzen 7 5700U | |
| Eurocom C315 Blitz | |
| HP 250 G9 7N029ES | |
| Asus P1511CEA-BQ753R | |
| AIDA64 / FP32 Ray-Trace | |
| Average of class Office (2083 - 31245, n=83, last 2 years) | |
| Schenker VIA 15 Pro M22 | |
| Lenovo IdeaPad 5 Pro 16ARH7 | |
| Ninkear A15 Plus (16+512) | |
| Average AMD Ryzen 7 5700U (5679 - 12346, n=20) | |
| Eurocom C315 Blitz | |
| HP 250 G9 7N029ES | |
| Asus P1511CEA-BQ753R | |
| AIDA64 / FPU Julia | |
| Lenovo IdeaPad 5 Pro 16ARH7 | |
| Schenker VIA 15 Pro M22 | |
| Average of class Office (8191 - 125394, n=83, last 2 years) | |
| Average AMD Ryzen 7 5700U (39042 - 69580, n=20) | |
| Ninkear A15 Plus (16+512) | |
| Eurocom C315 Blitz | |
| HP 250 G9 7N029ES | |
| Asus P1511CEA-BQ753R | |
| AIDA64 / CPU SHA3 | |
| Average of class Office (433 - 5755, n=83, last 2 years) | |
| Lenovo IdeaPad 5 Pro 16ARH7 | |
| Schenker VIA 15 Pro M22 | |
| Ninkear A15 Plus (16+512) | |
| Average AMD Ryzen 7 5700U (1103 - 2231, n=20) | |
| Eurocom C315 Blitz | |
| Asus P1511CEA-BQ753R | |
| HP 250 G9 7N029ES | |
| AIDA64 / CPU Queen | |
| Ninkear A15 Plus (16+512) | |
| Schenker VIA 15 Pro M22 | |
| Average AMD Ryzen 7 5700U (57016 - 99178, n=20) | |
| Eurocom C315 Blitz | |
| Lenovo IdeaPad 5 Pro 16ARH7 | |
| Average of class Office (22784 - 115197, n=67, last 2 years) | |
| HP 250 G9 7N029ES | |
| Asus P1511CEA-BQ753R | |
| AIDA64 / FPU SinJulia | |
| Schenker VIA 15 Pro M22 | |
| Ninkear A15 Plus (16+512) | |
| Average AMD Ryzen 7 5700U (6837 - 14169, n=20) | |
| Lenovo IdeaPad 5 Pro 16ARH7 | |
| Average of class Office (1378 - 18321, n=83, last 2 years) | |
| Eurocom C315 Blitz | |
| HP 250 G9 7N029ES | |
| Asus P1511CEA-BQ753R | |
| AIDA64 / FPU Mandel | |
| Lenovo IdeaPad 5 Pro 16ARH7 | |
| Schenker VIA 15 Pro M22 | |
| Average of class Office (4601 - 66922, n=83, last 2 years) | |
| Average AMD Ryzen 7 5700U (20179 - 36523, n=20) | |
| Ninkear A15 Plus (16+512) | |
| Eurocom C315 Blitz | |
| HP 250 G9 7N029ES | |
| Asus P1511CEA-BQ753R | |
| AIDA64 / CPU AES | |
| Ninkear A15 Plus (16+512) | |
| Average AMD Ryzen 7 5700U (26066 - 64646, n=20) | |
| Average of class Office (4854 - 155900, n=83, last 2 years) | |
| Schenker VIA 15 Pro M22 | |
| Lenovo IdeaPad 5 Pro 16ARH7 | |
| Asus P1511CEA-BQ753R | |
| Eurocom C315 Blitz | |
| HP 250 G9 7N029ES | |
| AIDA64 / CPU ZLib | |
| Schenker VIA 15 Pro M22 | |
| Average of class Office (114.6 - 1366, n=83, last 2 years) | |
| Average AMD Ryzen 7 5700U (440 - 776, n=20) | |
| Lenovo IdeaPad 5 Pro 16ARH7 | |
| Ninkear A15 Plus (16+512) | |
| Eurocom C315 Blitz | |
| HP 250 G9 7N029ES | |
| Asus P1511CEA-BQ753R | |
| AIDA64 / FP64 Ray-Trace | |
| Average of class Office (1109 - 17834, n=83, last 2 years) | |
| Schenker VIA 15 Pro M22 | |
| Lenovo IdeaPad 5 Pro 16ARH7 | |
| Ninkear A15 Plus (16+512) | |
| Average AMD Ryzen 7 5700U (2985 - 6784, n=20) | |
| Eurocom C315 Blitz | |
| HP 250 G9 7N029ES | |
| Asus P1511CEA-BQ753R | |
| AIDA64 / CPU PhotoWorxx | |
| Average of class Office (11090 - 65229, n=83, last 2 years) | |
| Eurocom C315 Blitz | |
| Lenovo IdeaPad 5 Pro 16ARH7 | |
| Schenker VIA 15 Pro M22 | |
| Asus P1511CEA-BQ753R | |
| Average AMD Ryzen 7 5700U (6903 - 25066, n=20) | |
| HP 250 G9 7N029ES | |
| Ninkear A15 Plus (16+512) | |
系统性能
在日常使用中,Ninkear A15 Plus 的系统性能令人感觉足够。冲浪、流媒体和 Office 都能流畅运行。
在 PCMark、CrossMark 和 WebXPRT 4 的基准测试中,我们的测试设备仅略逊于搭载酷睿 i7 或 Ryzen 7 的竞争对手。
CrossMark: Overall | Productivity | Creativity | Responsiveness
WebXPRT 4: Overall
| PCMark 10 / Score | |
| Average of class Office (2601 - 9298, n=68, last 2 years) | |
| Asus ZenBook 14 UX3405MA | |
| Lenovo IdeaPad 5 Pro 16ARH7 | |
| Eurocom C315 Blitz | |
| Average AMD Ryzen 7 5700U, AMD Radeon RX Vega 8 (Ryzen 4000/5000) (4325 - 5518, n=15) | |
| Schenker VIA 15 Pro M22 | |
| Ninkear A15 Plus (16+512) | |
| HP 250 G9 7N029ES | |
| Asus P1511CEA-BQ753R | |
| PCMark 10 / Essentials | |
| Asus ZenBook 14 UX3405MA | |
| Eurocom C315 Blitz | |
| Lenovo IdeaPad 5 Pro 16ARH7 | |
| Average of class Office (3245 - 11594, n=68, last 2 years) | |
| HP 250 G9 7N029ES | |
| Average AMD Ryzen 7 5700U, AMD Radeon RX Vega 8 (Ryzen 4000/5000) (8025 - 10091, n=15) | |
| Schenker VIA 15 Pro M22 | |
| Ninkear A15 Plus (16+512) | |
| Asus P1511CEA-BQ753R | |
| PCMark 10 / Productivity | |
| Average of class Office (5336 - 17243, n=68, last 2 years) | |
| Asus ZenBook 14 UX3405MA | |
| Lenovo IdeaPad 5 Pro 16ARH7 | |
| Average AMD Ryzen 7 5700U, AMD Radeon RX Vega 8 (Ryzen 4000/5000) (7001 - 8457, n=15) | |
| Ninkear A15 Plus (16+512) | |
| Schenker VIA 15 Pro M22 | |
| Eurocom C315 Blitz | |
| Asus P1511CEA-BQ753R | |
| HP 250 G9 7N029ES | |
| PCMark 10 / Digital Content Creation | |
| Average of class Office (2049 - 13541, n=68, last 2 years) | |
| Asus ZenBook 14 UX3405MA | |
| Lenovo IdeaPad 5 Pro 16ARH7 | |
| Schenker VIA 15 Pro M22 | |
| Eurocom C315 Blitz | |
| Average AMD Ryzen 7 5700U, AMD Radeon RX Vega 8 (Ryzen 4000/5000) (3738 - 5964, n=15) | |
| Ninkear A15 Plus (16+512) | |
| HP 250 G9 7N029ES | |
| Asus P1511CEA-BQ753R | |
| CrossMark / Overall | |
| Eurocom C315 Blitz | |
| Asus ZenBook 14 UX3405MA | |
| Average of class Office (381 - 2010, n=75, last 2 years) | |
| HP 250 G9 7N029ES | |
| Schenker VIA 15 Pro M22 | |
| Ninkear A15 Plus (16+512) | |
| Asus P1511CEA-BQ753R | |
| Average AMD Ryzen 7 5700U, AMD Radeon RX Vega 8 (Ryzen 4000/5000) (866 - 1183, n=8) | |
| CrossMark / Productivity | |
| Eurocom C315 Blitz | |
| Asus ZenBook 14 UX3405MA | |
| Average of class Office (464 - 1880, n=75, last 2 years) | |
| HP 250 G9 7N029ES | |
| Asus P1511CEA-BQ753R | |
| Schenker VIA 15 Pro M22 | |
| Ninkear A15 Plus (16+512) | |
| Average AMD Ryzen 7 5700U, AMD Radeon RX Vega 8 (Ryzen 4000/5000) (931 - 1191, n=8) | |
| CrossMark / Creativity | |
| Eurocom C315 Blitz | |
| Asus ZenBook 14 UX3405MA | |
| Average of class Office (319 - 2361, n=75, last 2 years) | |
| Schenker VIA 15 Pro M22 | |
| HP 250 G9 7N029ES | |
| Ninkear A15 Plus (16+512) | |
| Average AMD Ryzen 7 5700U, AMD Radeon RX Vega 8 (Ryzen 4000/5000) (907 - 1197, n=8) | |
| Asus P1511CEA-BQ753R | |
| CrossMark / Responsiveness | |
| Eurocom C315 Blitz | |
| Average of class Office (360 - 1820, n=75, last 2 years) | |
| Asus ZenBook 14 UX3405MA | |
| Asus P1511CEA-BQ753R | |
| Schenker VIA 15 Pro M22 | |
| HP 250 G9 7N029ES | |
| Ninkear A15 Plus (16+512) | |
| Average AMD Ryzen 7 5700U, AMD Radeon RX Vega 8 (Ryzen 4000/5000) (605 - 1159, n=8) | |
| WebXPRT 4 / Overall | |
| HP 250 G9 7N029ES | |
| Asus ZenBook 14 UX3405MA | |
| Average of class Office (104.2 - 313, n=77, last 2 years) | |
| Ninkear A15 Plus (16+512) | |
| Average AMD Ryzen 7 5700U, AMD Radeon RX Vega 8 (Ryzen 4000/5000) (158.5 - 225, n=5) | |
| Schenker VIA 15 Pro M22 | |
| Asus P1511CEA-BQ753R | |
| PCMark 10 Score | 4953 points | |
Help | ||
| AIDA64 / Memory Copy | |
| Eurocom C315 Blitz | |
| Average of class Office (20075 - 110930, n=80, last 2 years) | |
| Lenovo IdeaPad 5 Pro 16ARH7 | |
| Schenker VIA 15 Pro M22 | |
| Asus P1511CEA-BQ753R | |
| Average AMD Ryzen 7 5700U (15867 - 39326, n=20) | |
| HP 250 G9 7N029ES | |
| Ninkear A15 Plus (16+512) | |
| AIDA64 / Memory Read | |
| Average of class Office (10084 - 128030, n=81, last 2 years) | |
| Eurocom C315 Blitz | |
| Schenker VIA 15 Pro M22 | |
| Lenovo IdeaPad 5 Pro 16ARH7 | |
| Average AMD Ryzen 7 5700U (17632 - 47190, n=20) | |
| Asus P1511CEA-BQ753R | |
| Ninkear A15 Plus (16+512) | |
| HP 250 G9 7N029ES | |
| AIDA64 / Memory Write | |
| Lenovo IdeaPad 5 Pro 16ARH7 | |
| Eurocom C315 Blitz | |
| Average of class Office (20073 - 119858, n=81, last 2 years) | |
| Schenker VIA 15 Pro M22 | |
| Asus P1511CEA-BQ753R | |
| Average AMD Ryzen 7 5700U (11554 - 47048, n=20) | |
| Ninkear A15 Plus (16+512) | |
| HP 250 G9 7N029ES | |
| AIDA64 / Memory Latency | |
| Lenovo IdeaPad 5 Pro 16ARH7 | |
| Average of class Office (7.6 - 162.9, n=76, last 2 years) | |
| Schenker VIA 15 Pro M22 | |
| Average AMD Ryzen 7 5700U (84.9 - 113, n=20) | |
| Ninkear A15 Plus (16+512) | |
| Asus P1511CEA-BQ753R | |
| Eurocom C315 Blitz | |
| HP 250 G9 7N029ES | |
* ... smaller is better
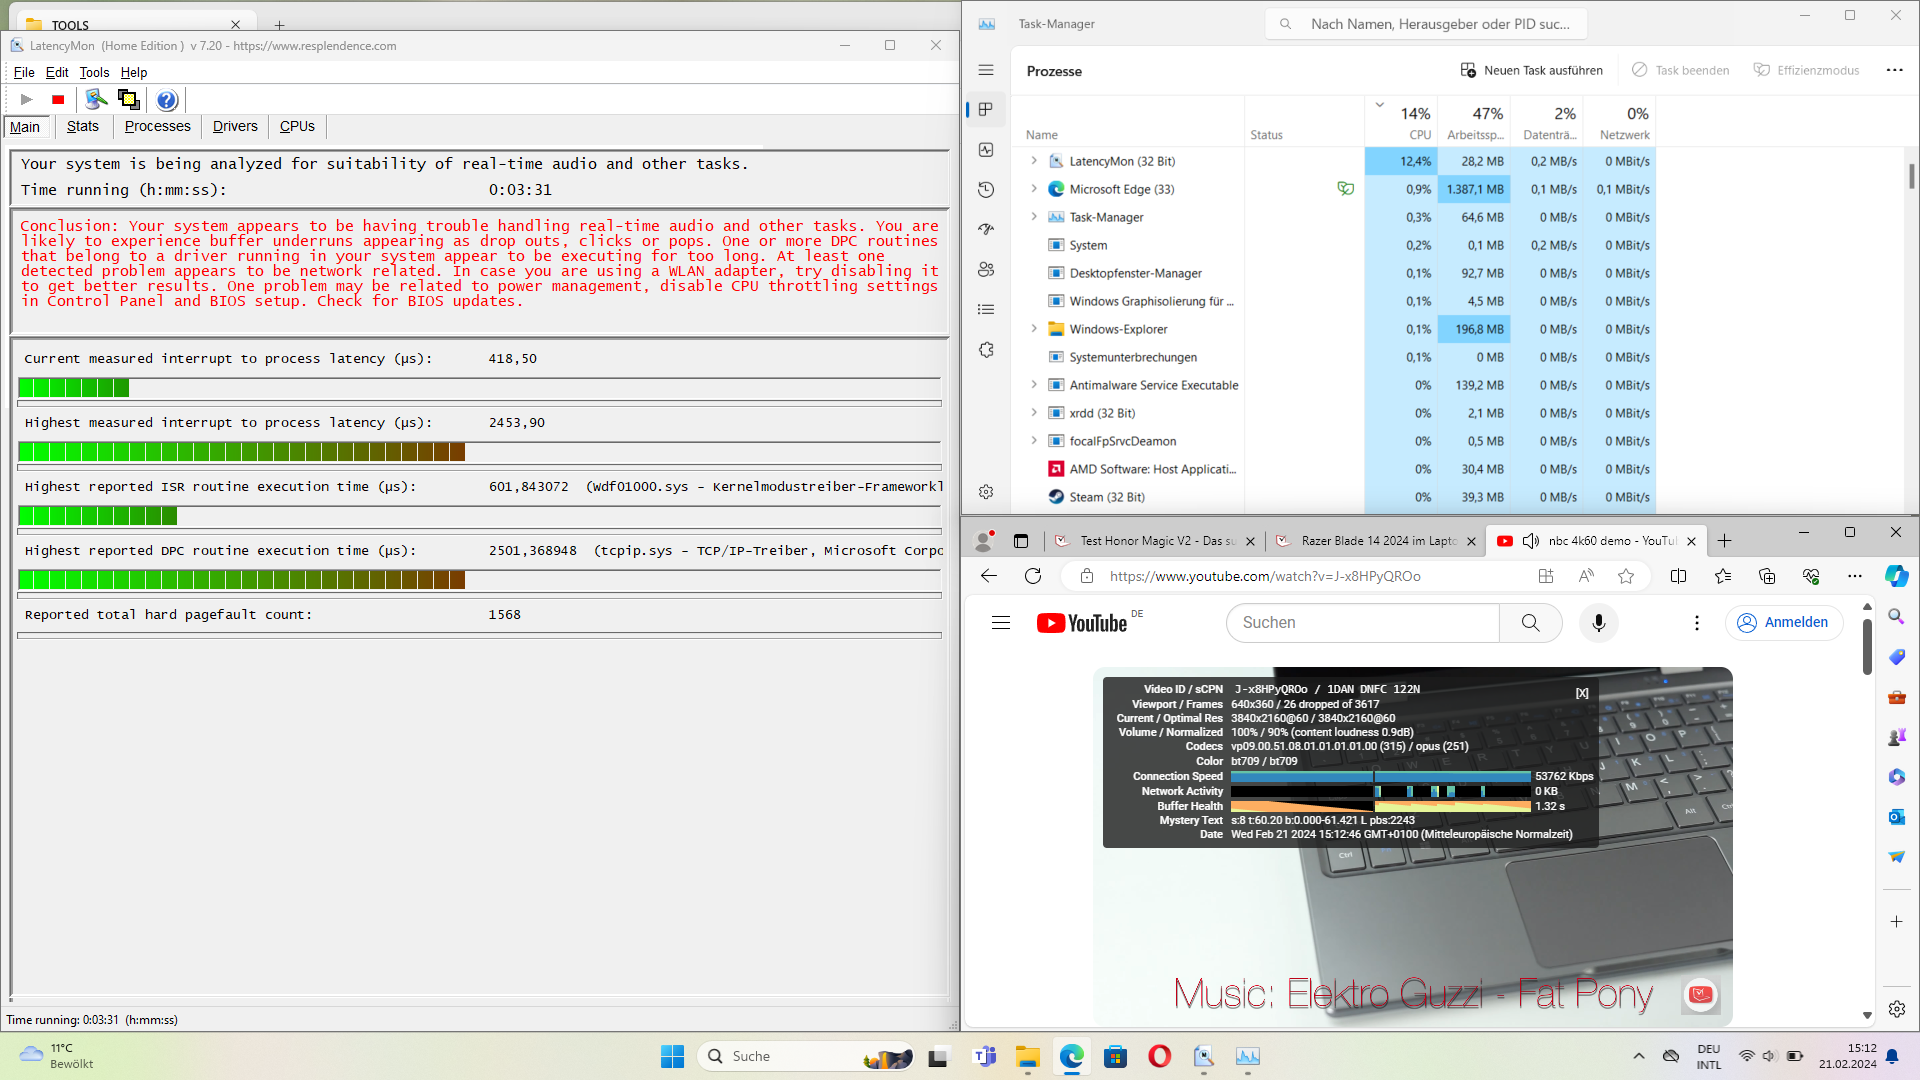
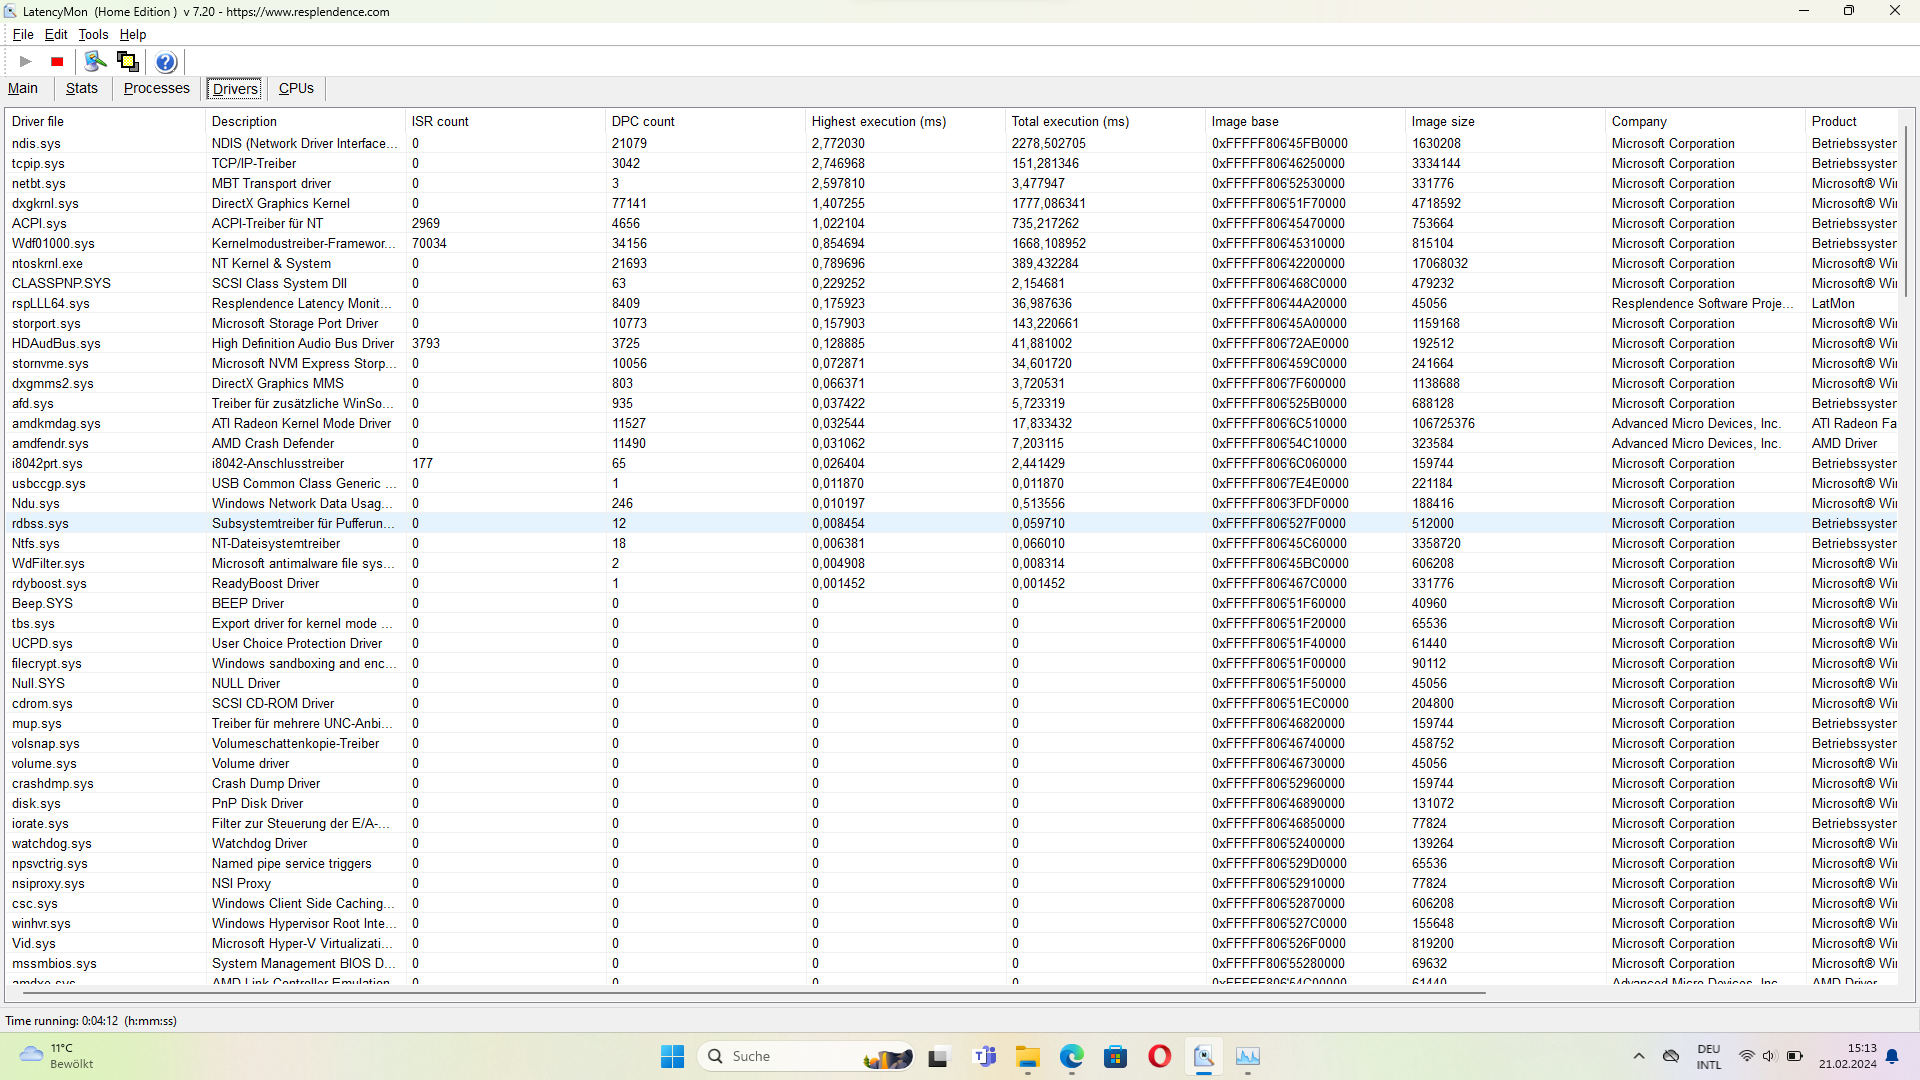
DPC 延迟
在测试时可用的驱动程序配置下,DPC 延迟高达 2,453 µs。因此,LatencyMon 判断该笔记本电脑不适合实时应用。
| DPC Latencies / LatencyMon - interrupt to process latency (max), Web, Youtube, Prime95 | |
| Ninkear A15 Plus (16+512) | |
| Schenker VIA 15 Pro M22 | |
| HP 250 G9 7N029ES | |
| Asus P1511CEA-BQ753R | |
| Eurocom C315 Blitz | |
| Lenovo IdeaPad 5 Pro 16ARH7 | |
* ... smaller is better
存储设备
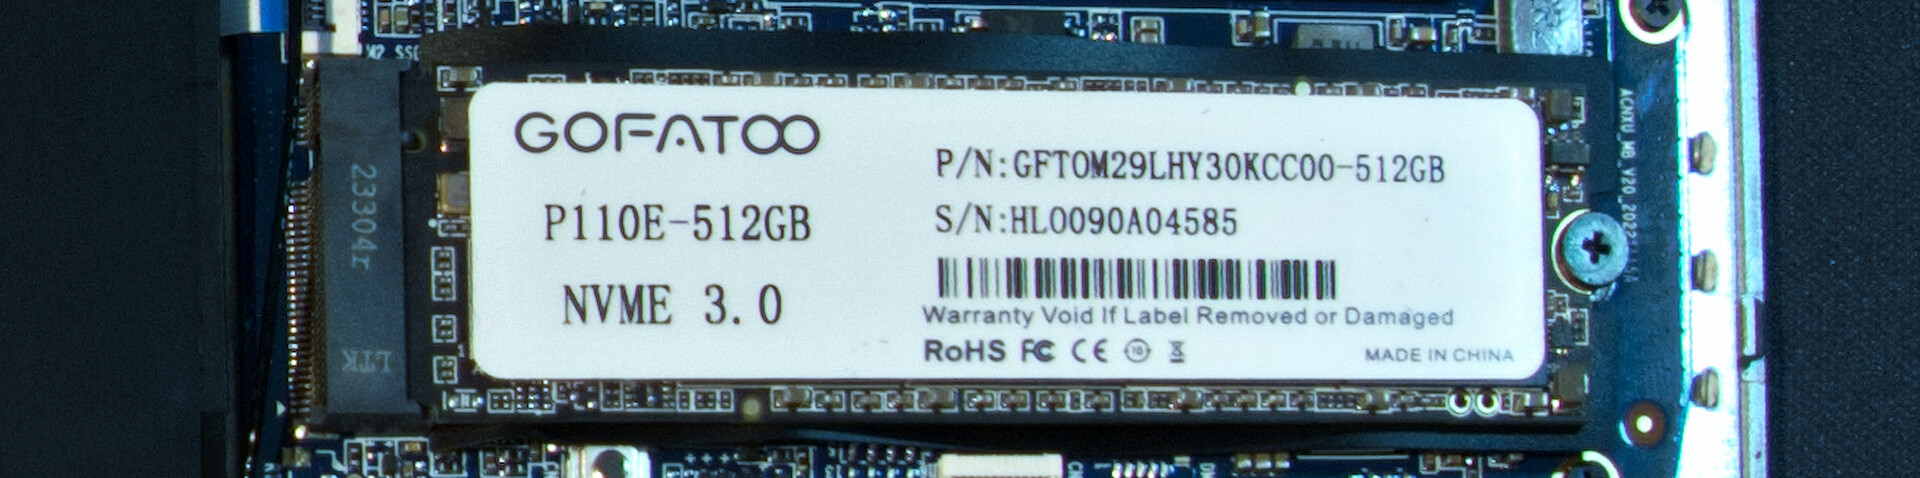
测试设备中安装的 Gofatoo NVMe 固态硬盘通过 PCI Gen 3.0 接口连接。它的数据传输速度与之相当,但对于办公笔记本电脑来说已经绰绰有余。
在读取速度方面,该固态硬盘与三星固态硬盘 970 EVO Plus 大致相当,后者可在申克 Via 15 Pro 等产品中找到。

* ... smaller is better
Disk throttling: DiskSpd Read Loop, Queue Depth 8
图形卡
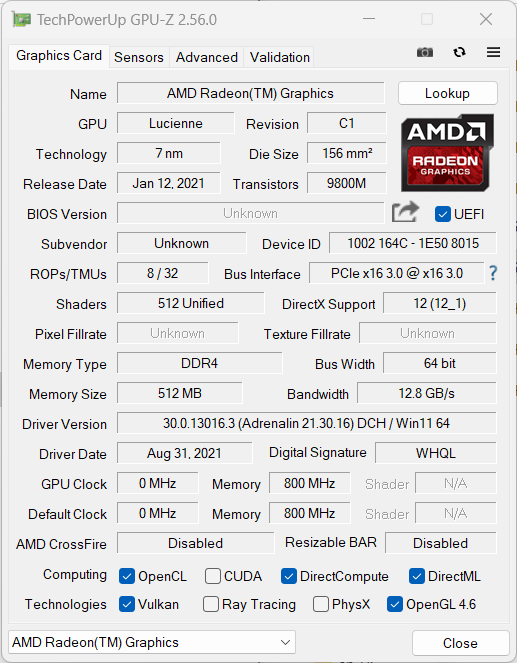
超薄的 Ninkear A15 Plus 没有 dGPU,因此 AMD Ryzen 7 5700U 的 iGPU 必须处理所有图形任务。遗憾的是,Vega 8 在单通道内存和低 TDP 的情况下只能做到这么多。因此,原本可用的 iGPU 性能也相应下降。
相比之下,搭载 i3 处理器的 Ninkear A15 要比竞争对手强大得多,但我们的测试设备却远远达不到 RX Vega 8.申克威盛 15 Pro 在所有图形性能基准测试中的表现都要好得多。
测试游戏的性能也相应较弱。在这款笔记本电脑上可以玩一些游戏,但目前的 AAA 级游戏更容易让人产生挫败感。
| 3DMark 11 Performance | 4600 points | |
| 3DMark Cloud Gate Standard Score | 16817 points | |
| 3DMark Fire Strike Score | 2378 points | |
| 3DMark Time Spy Score | 1009 points | |
Help | ||
| Performance rating - Percent | |
| Average of class Office | |
| Lenovo IdeaPad 5 Pro 16ARH7 | |
| Schenker VIA 15 Pro M22 | |
| Eurocom C315 Blitz | |
| Ninkear A15 Plus (16+512) | |
| The Witcher 3 - 1920x1080 Ultra Graphics & Postprocessing (HBAO+) | |
| Average of class Office (14.8 - 28.1, n=3, last 2 years) | |
| Lenovo IdeaPad 5 Pro 16ARH7 | |
| Schenker VIA 15 Pro M22 | |
| Eurocom C315 Blitz | |
| Ninkear A15 Plus (16+512) | |
| GTA V - 1920x1080 Highest AA:4xMSAA + FX AF:16x | |
| Average of class Office (5.77 - 45.3, n=69, last 2 years) | |
| Lenovo IdeaPad 5 Pro 16ARH7 | |
| Schenker VIA 15 Pro M22 | |
| Eurocom C315 Blitz | |
| Ninkear A15 Plus (16+512) | |
| Final Fantasy XV Benchmark - 1920x1080 High Quality | |
| Average of class Office (8.09 - 79.5, n=71, last 2 years) | |
| Lenovo IdeaPad 5 Pro 16ARH7 | |
| Eurocom C315 Blitz | |
| Schenker VIA 15 Pro M22 | |
| Ninkear A15 Plus (16+512) | |
| Strange Brigade - 1920x1080 ultra AA:ultra AF:16 | |
| Average of class Office (12.9 - 142.1, n=53, last 2 years) | |
| Lenovo IdeaPad 5 Pro 16ARH7 | |
| Schenker VIA 15 Pro M22 | |
| Eurocom C315 Blitz | |
| Ninkear A15 Plus (16+512) | |
| Dota 2 Reborn - 1920x1080 ultra (3/3) best looking | |
| Average of class Office (14.6 - 135, n=77, last 2 years) | |
| Lenovo IdeaPad 5 Pro 16ARH7 | |
| Schenker VIA 15 Pro M22 | |
| Eurocom C315 Blitz | |
| Ninkear A15 Plus (16+512) | |
| X-Plane 11.11 - 1920x1080 high (fps_test=3) | |
| Lenovo IdeaPad 5 Pro 16ARH7 | |
| Average of class Office (12 - 82.4, n=69, last 2 years) | |
| Eurocom C315 Blitz | |
| Schenker VIA 15 Pro M22 | |
| Ninkear A15 Plus (16+512) | |
| low | med. | high | ultra | QHD | |
|---|---|---|---|---|---|
| GTA V (2015) | 65.3 | 58.3 | 16.9 | 7.71 | |
| The Witcher 3 (2015) | 10.3 | ||||
| Dota 2 Reborn (2015) | 89.9 | 68 | 36.5 | 35.5 | |
| Final Fantasy XV Benchmark (2018) | 13 | 8.72 | 6.33 | ||
| X-Plane 11.11 (2018) | 36.5 | 28.6 | 26.3 | ||
| Far Cry 5 (2018) | 28 | 14 | 13 | 12 | |
| Strange Brigade (2018) | 48.3 | 19.4 | 16.4 | 14.3 | |
| F1 23 (2023) | 23.4 | 20.9 | 15.8 | 11.5 | |
| Cyberpunk 2077 (2023) | 11 | 5.71 |
排放与能源 - 节能、安静
噪音排放
由于处理器的功耗较低,Ninkear 的风扇也无需散热。这款笔记本电脑的最大噪音为 35 dB(A),明显低于同类产品。
Noise level
| Idle |
| 24.78 / 27.6 / 26.5 dB(A) |
| Load |
| 34.38 / 34.58 dB(A) |
 | ||
30 dB silent 40 dB(A) audible 50 dB(A) loud |
||
min: | ||
| Ninkear A15 Plus (16+512) Vega 8, R7 5700U, GOFATOO P110E-512GB | Lenovo IdeaPad 5 Pro 16ARH7 Radeon 660M, R5 6600HS, Samsung PM9A1 MZVL2512HCJQ | Eurocom C315 Blitz Iris Xe G7 96EUs, i7-1360P, Samsung 990 Pro 1 TB | Schenker VIA 15 Pro M22 Vega 8, R7 5700U, Samsung SSD 970 EVO Plus 1TB | HP 250 G9 7N029ES UHD Graphics 64EUs, i3-1215U, SK hynix HFS512GEJ9X125N | Asus P1511CEA-BQ753R UHD Graphics Xe G4 48EUs, i3-1115G4, Kingston OM8PDP3256B | |
|---|---|---|---|---|---|---|
| Noise | -5% | -11% | -1% | -9% | -14% | |
| off / environment * (dB) | 24.78 | 25 -1% | 22.5 9% | 24 3% | 24.3 2% | 26 -5% |
| Idle Minimum * (dB) | 24.78 | 25 -1% | 25.1 -1% | 24 3% | 24.3 2% | 26 -5% |
| Idle Average * (dB) | 27.6 | 26 6% | 25.1 9% | 24 13% | 24.3 12% | 29.5 -7% |
| Idle Maximum * (dB) | 26.5 | 28 -6% | 34.9 -32% | 27.5 -4% | 28.2 -6% | 29.5 -11% |
| Load Average * (dB) | 34.38 | 44 -28% | 42.1 -22% | 33.7 2% | 45.2 -31% | 43.1 -25% |
| Load Maximum * (dB) | 34.58 | 35 -1% | 44.2 -28% | 42.4 -23% | 45.2 -31% | 46 -33% |
| Witcher 3 ultra * (dB) | 35 | 44.5 | 33.7 | 45.2 |
* ... smaller is better
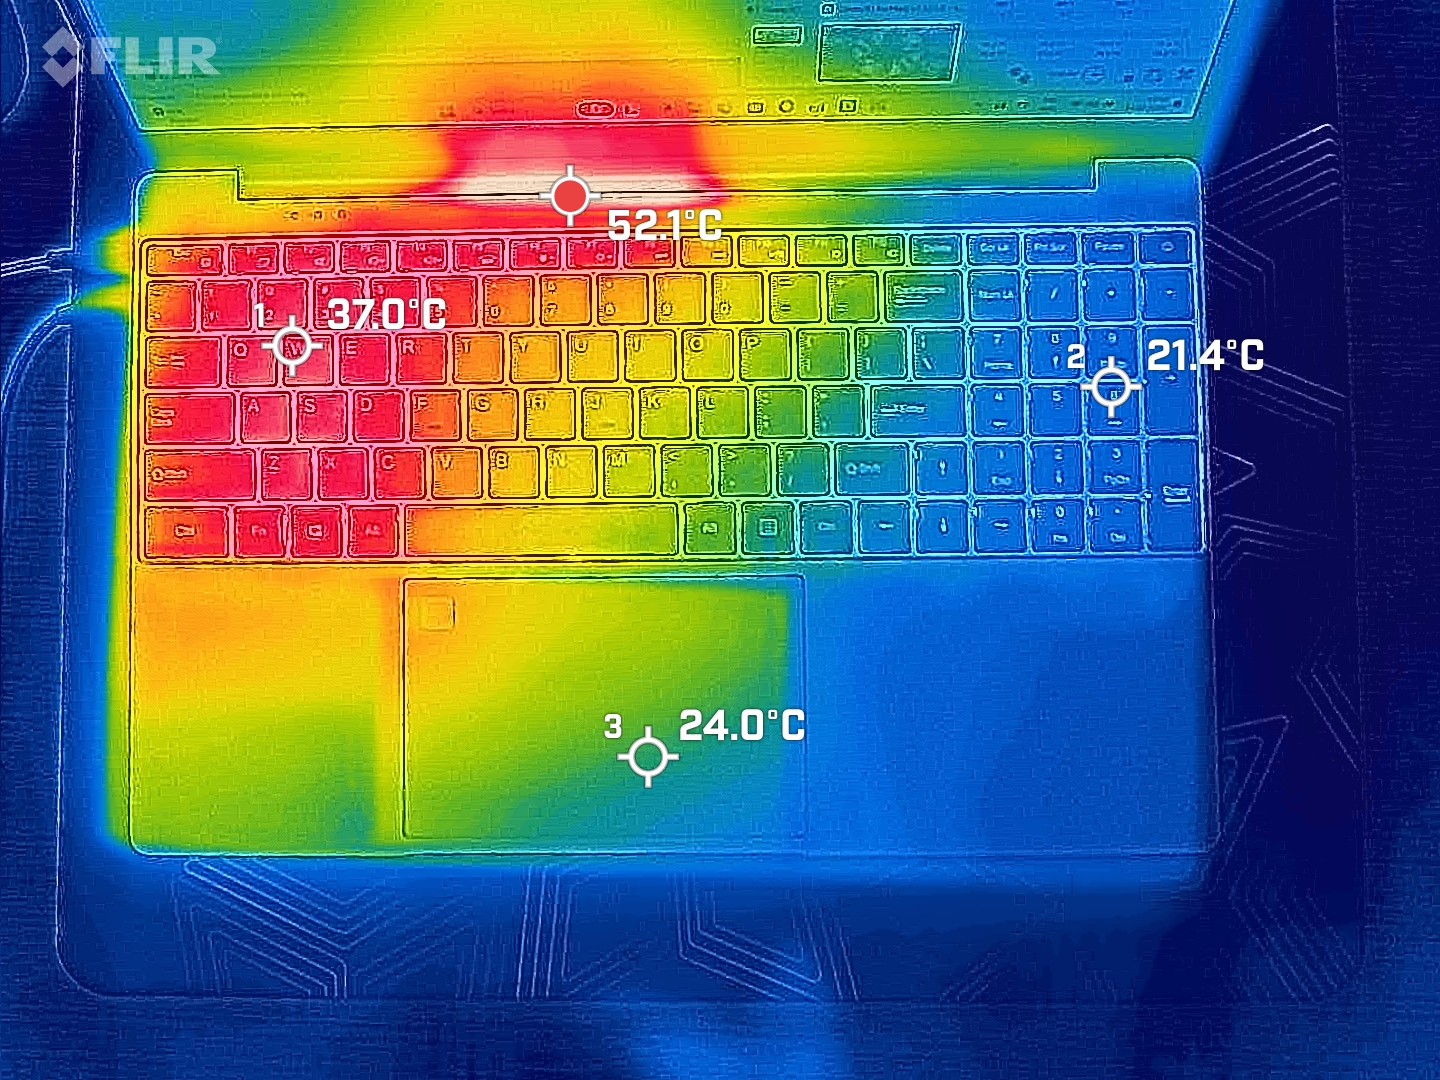
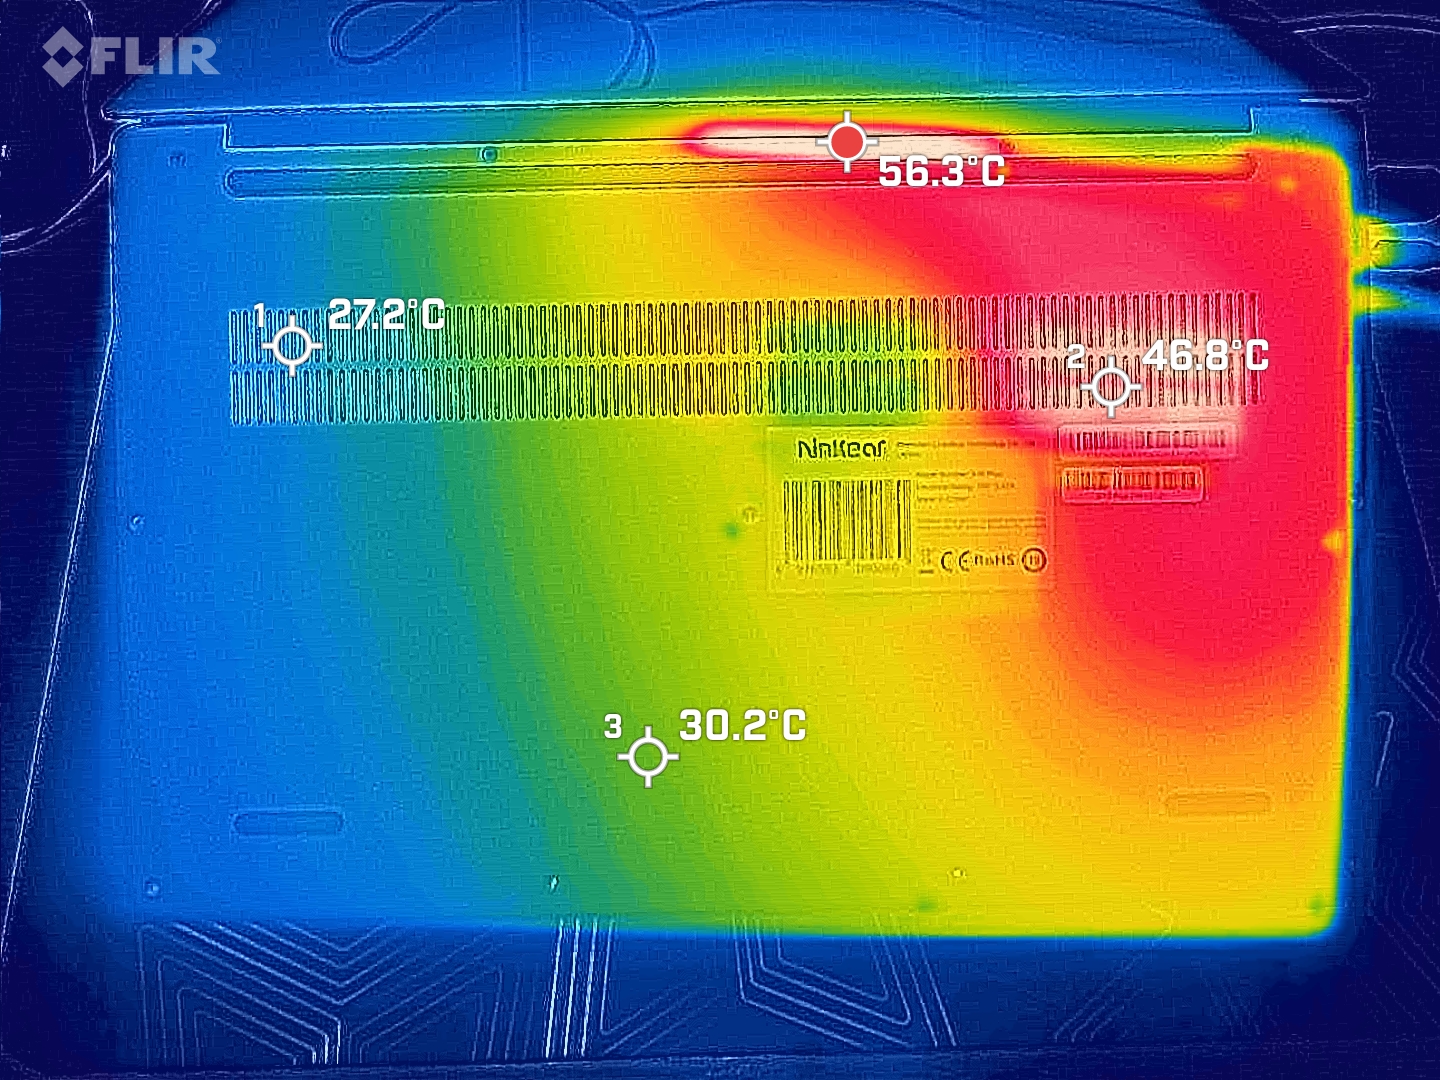
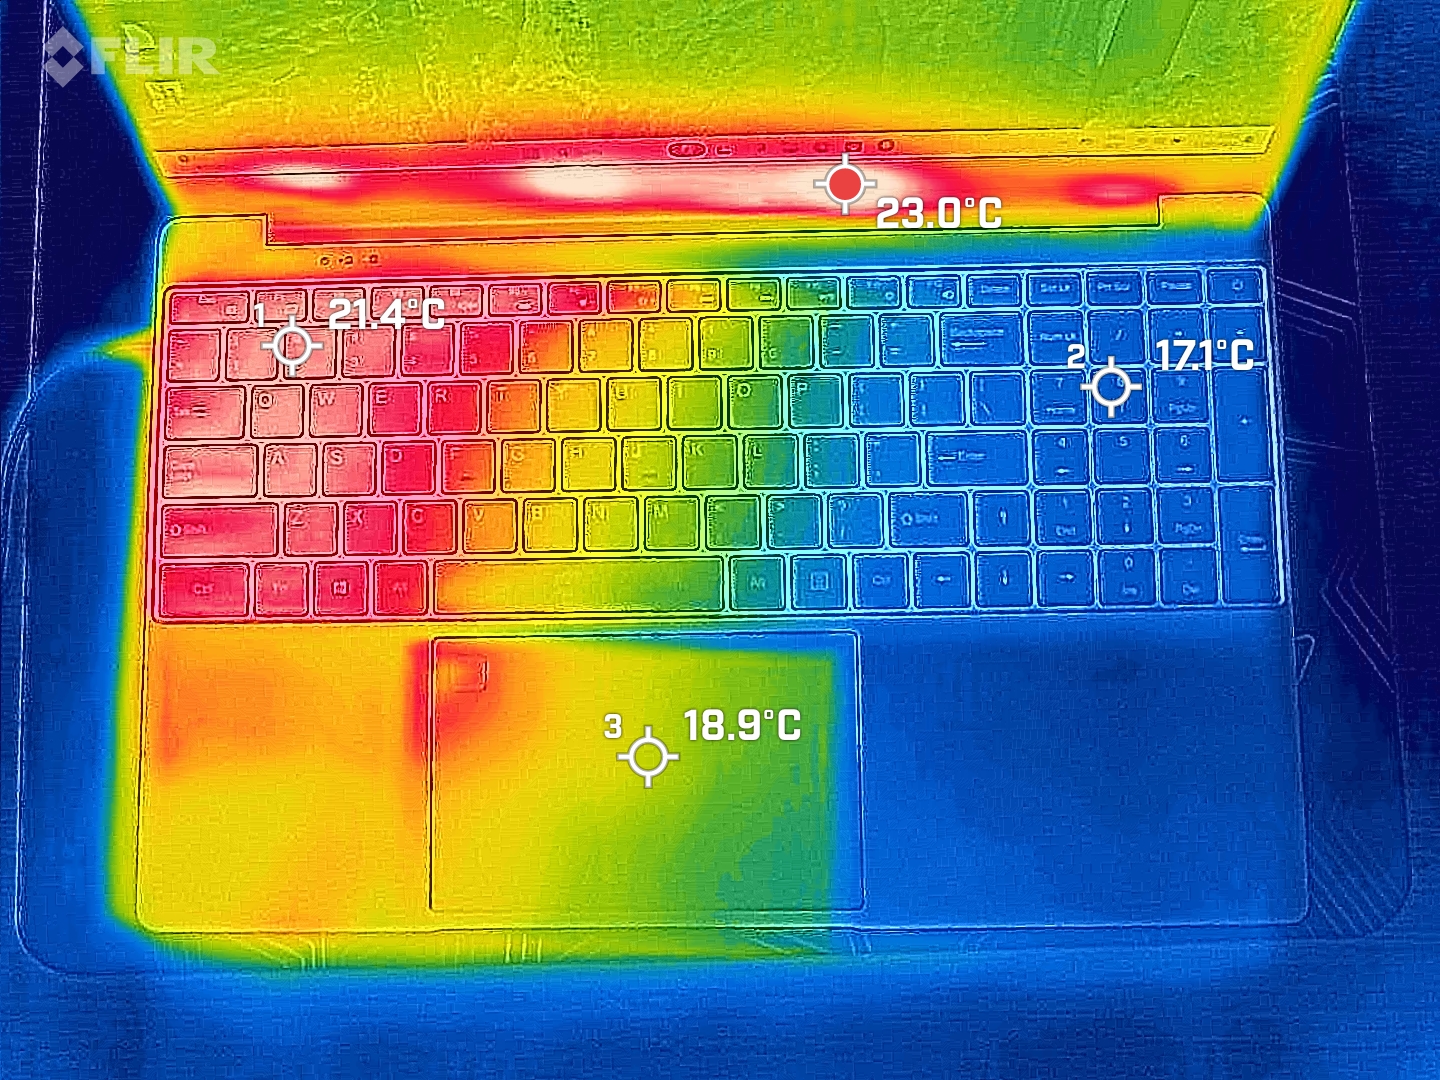
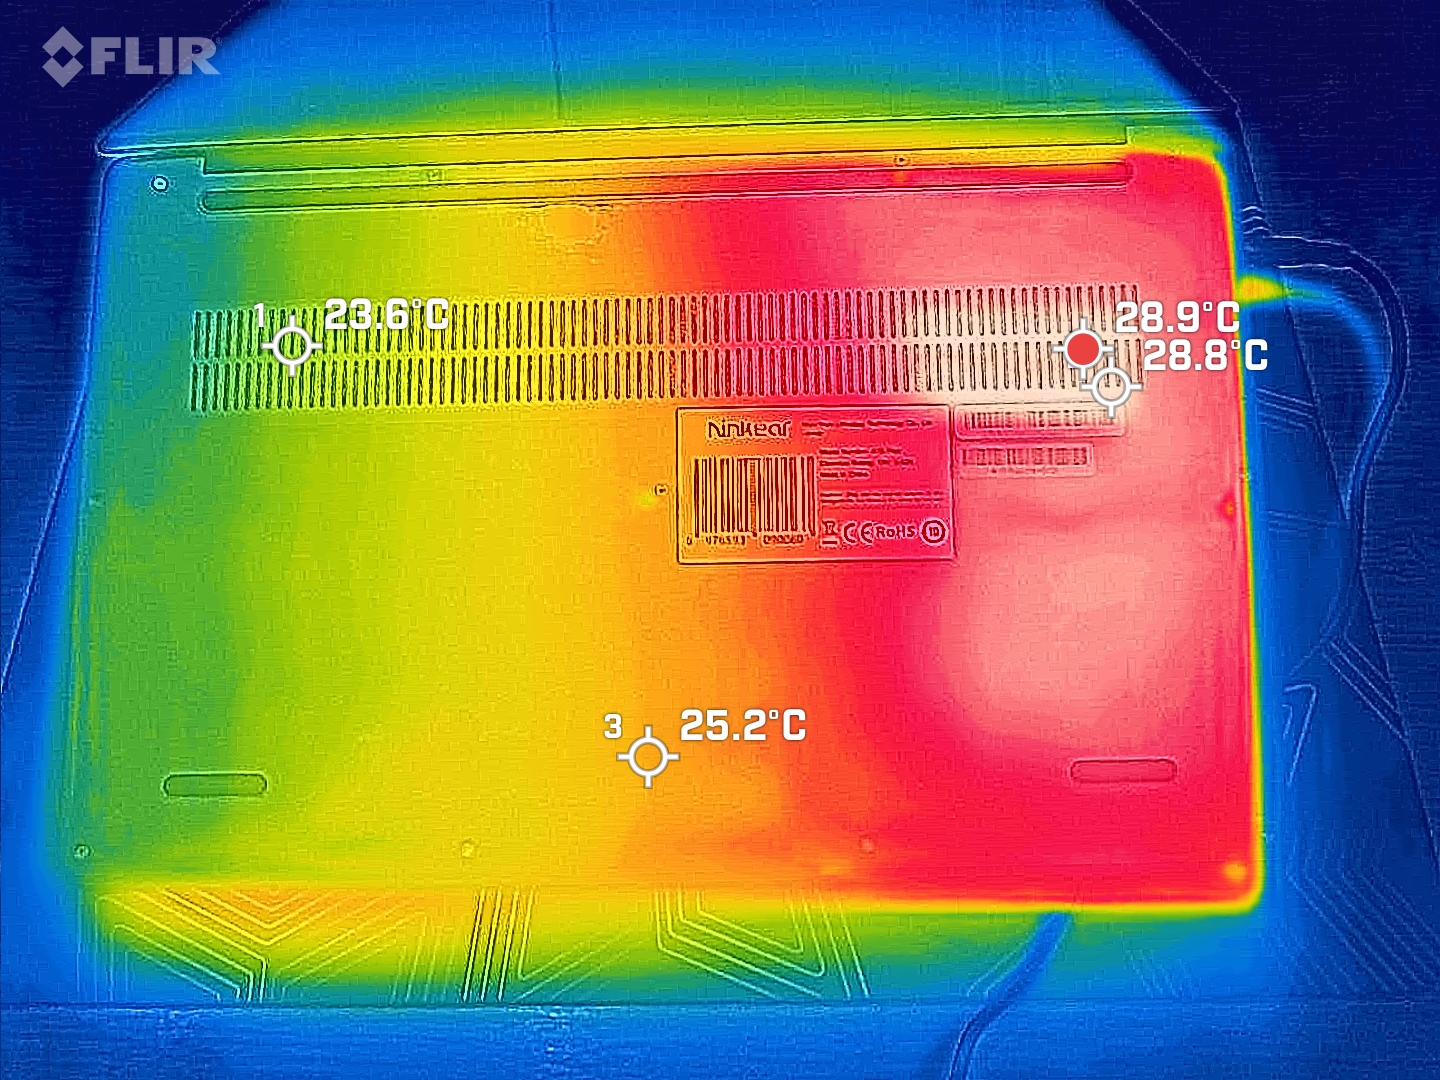
温度
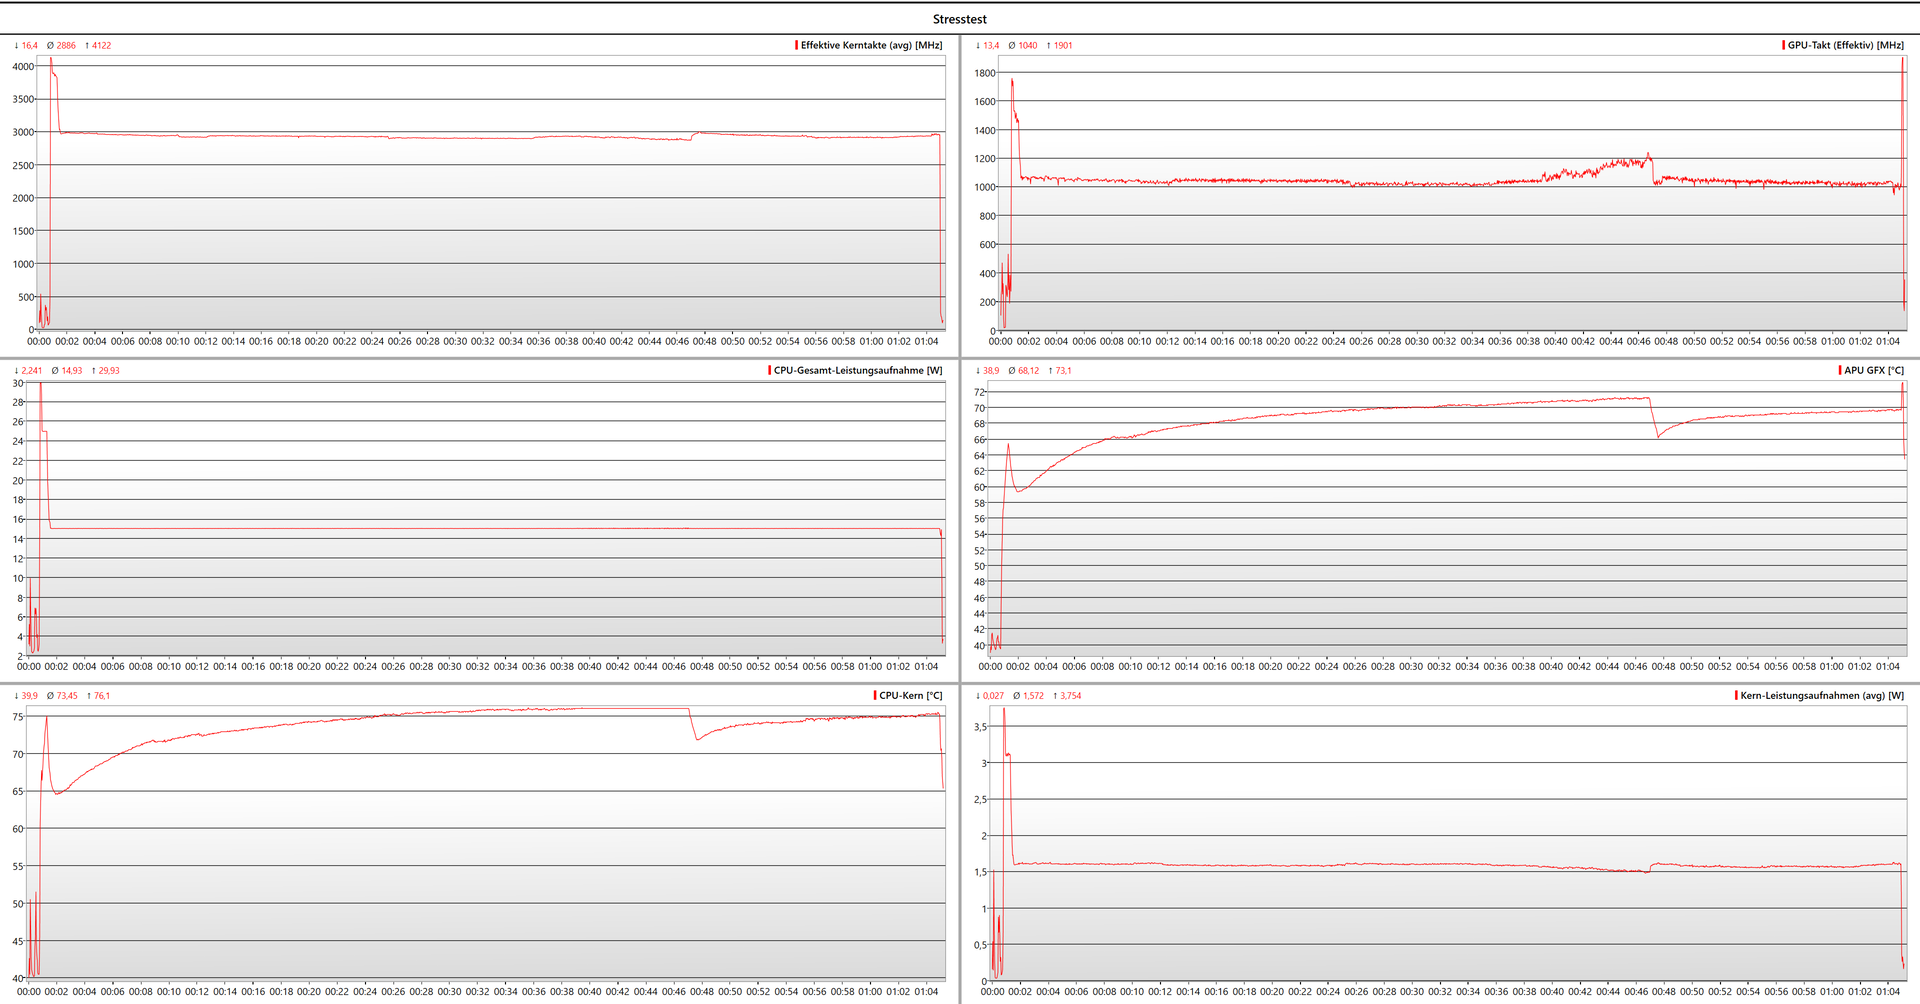
在正常运行和压力测试中,我们测试设备的表面温度也保持在一定范围内。设备发热超过体温;只有在散热器出风口附近的某些位置,笔记本电脑的表面温度才达到 50 °C。
我们的测试设备以前面讨论过的性能经受住了压力测试。您不应该期望 Ninkear A15 Plus 的 Ryzen 7 5700U 能提供超过 15 W 的连续功率。
(+) The maximum temperature on the upper side is 37 °C / 99 F, compared to the average of 34.3 °C / 94 F, ranging from 21.2 to 62.5 °C for the class Office.
(+) The bottom heats up to a maximum of 33 °C / 91 F, compared to the average of 36.8 °C / 98 F
(+) In idle usage, the average temperature for the upper side is 22.3 °C / 72 F, compared to the device average of 29.5 °C / 85 F.
(+) The palmrests and touchpad are cooler than skin temperature with a maximum of 27 °C / 80.6 F and are therefore cool to the touch.
(±) The average temperature of the palmrest area of similar devices was 27.5 °C / 81.5 F (+0.5 °C / 0.9 F).
| Ninkear A15 Plus (16+512) AMD Ryzen 7 5700U, AMD Radeon RX Vega 8 (Ryzen 4000/5000) | Lenovo IdeaPad 5 Pro 16ARH7 AMD Ryzen 5 6600HS, AMD Radeon 660M | Eurocom C315 Blitz Intel Core i7-1360P, Intel Iris Xe Graphics G7 96EUs | Schenker VIA 15 Pro M22 AMD Ryzen 7 5700U, AMD Radeon RX Vega 8 (Ryzen 4000/5000) | HP 250 G9 7N029ES Intel Core i3-1215U, Intel UHD Graphics 64EUs (Alder Lake 12th Gen) | Asus P1511CEA-BQ753R Intel Core i3-1115G4, Intel UHD Graphics Xe G4 48EUs | |
|---|---|---|---|---|---|---|
| Heat | -21% | -2% | -16% | -9% | -11% | |
| Maximum Upper Side * (°C) | 37 | 46 -24% | 35.6 4% | 41.2 -11% | 35.1 5% | 40.3 -9% |
| Maximum Bottom * (°C) | 33 | 48 -45% | 37.8 -15% | 43.5 -32% | 44.8 -36% | 39.2 -19% |
| Idle Upper Side * (°C) | 23.5 | 28 -19% | 24.2 -3% | 28.4 -21% | 25.7 -9% | 27.3 -16% |
| Idle Bottom * (°C) | 28.1 | 27 4% | 26 7% | 28.1 -0% | 26.5 6% | 28.5 -1% |
* ... smaller is better
扬声器
现在我们来看看 Ninkear A15 Plus 最薄弱的方面--扬声器。在我们的测试设备中,大电池上方的立体声扬声器模块既不特别响亮,也称不上铿锵有力。
不过,即使是昂贵得多的 申克 Via 15 Pro的声音也没有好到哪里去。只有价格低廉的 惠普 250 G9才能在办公设备中占有一席之地,并发出相当不错的声音。
Ninkear A15 Plus (16+512) audio analysis
(±) | speaker loudness is average but good (72 dB)
Bass 100 - 315 Hz
(-) | nearly no bass - on average 20% lower than median
(±) | linearity of bass is average (8.1% delta to prev. frequency)
Mids 400 - 2000 Hz
(±) | higher mids - on average 8% higher than median
(±) | linearity of mids is average (11.9% delta to prev. frequency)
Highs 2 - 16 kHz
(±) | higher highs - on average 7.2% higher than median
(±) | linearity of highs is average (8.2% delta to prev. frequency)
Overall 100 - 16.000 Hz
(-) | overall sound is not linear (30.8% difference to median)
Compared to same class
» 92% of all tested devices in this class were better, 3% similar, 5% worse
» The best had a delta of 7%, average was 21%, worst was 53%
Compared to all devices tested
» 89% of all tested devices were better, 3% similar, 8% worse
» The best had a delta of 4%, average was 23%, worst was 134%
Schenker VIA 15 Pro M22 audio analysis
(±) | speaker loudness is average but good (74.8 dB)
Bass 100 - 315 Hz
(-) | nearly no bass - on average 22.2% lower than median
(±) | linearity of bass is average (12% delta to prev. frequency)
Mids 400 - 2000 Hz
(±) | higher mids - on average 5.1% higher than median
(±) | linearity of mids is average (10.2% delta to prev. frequency)
Highs 2 - 16 kHz
(+) | balanced highs - only 4.3% away from median
(+) | highs are linear (6.6% delta to prev. frequency)
Overall 100 - 16.000 Hz
(±) | linearity of overall sound is average (22.8% difference to median)
Compared to same class
» 63% of all tested devices in this class were better, 8% similar, 29% worse
» The best had a delta of 7%, average was 21%, worst was 53%
Compared to all devices tested
» 68% of all tested devices were better, 5% similar, 27% worse
» The best had a delta of 4%, average was 23%, worst was 134%
HP 250 G9 7N029ES audio analysis
(±) | speaker loudness is average but good (81.6 dB)
Bass 100 - 315 Hz
(-) | nearly no bass - on average 21.3% lower than median
(±) | linearity of bass is average (10.2% delta to prev. frequency)
Mids 400 - 2000 Hz
(+) | balanced mids - only 4.3% away from median
(+) | mids are linear (5.9% delta to prev. frequency)
Highs 2 - 16 kHz
(+) | balanced highs - only 1.5% away from median
(+) | highs are linear (4% delta to prev. frequency)
Overall 100 - 16.000 Hz
(±) | linearity of overall sound is average (16% difference to median)
Compared to same class
» 19% of all tested devices in this class were better, 6% similar, 76% worse
» The best had a delta of 7%, average was 21%, worst was 53%
Compared to all devices tested
» 25% of all tested devices were better, 5% similar, 69% worse
» The best had a delta of 4%, average was 23%, worst was 134%
能源消耗
Ninkear 为 A15 Plus 提供 65 W 的电源。这完全够用,因为即使在短时间的升压阶段,笔记本电脑也几乎不会消耗电压转换器的功率。
| Off / Standby | |
| Idle | |
| Load |
|
Key:
min: | |
Power consumption: Integrated display
Power consumption: External monitor
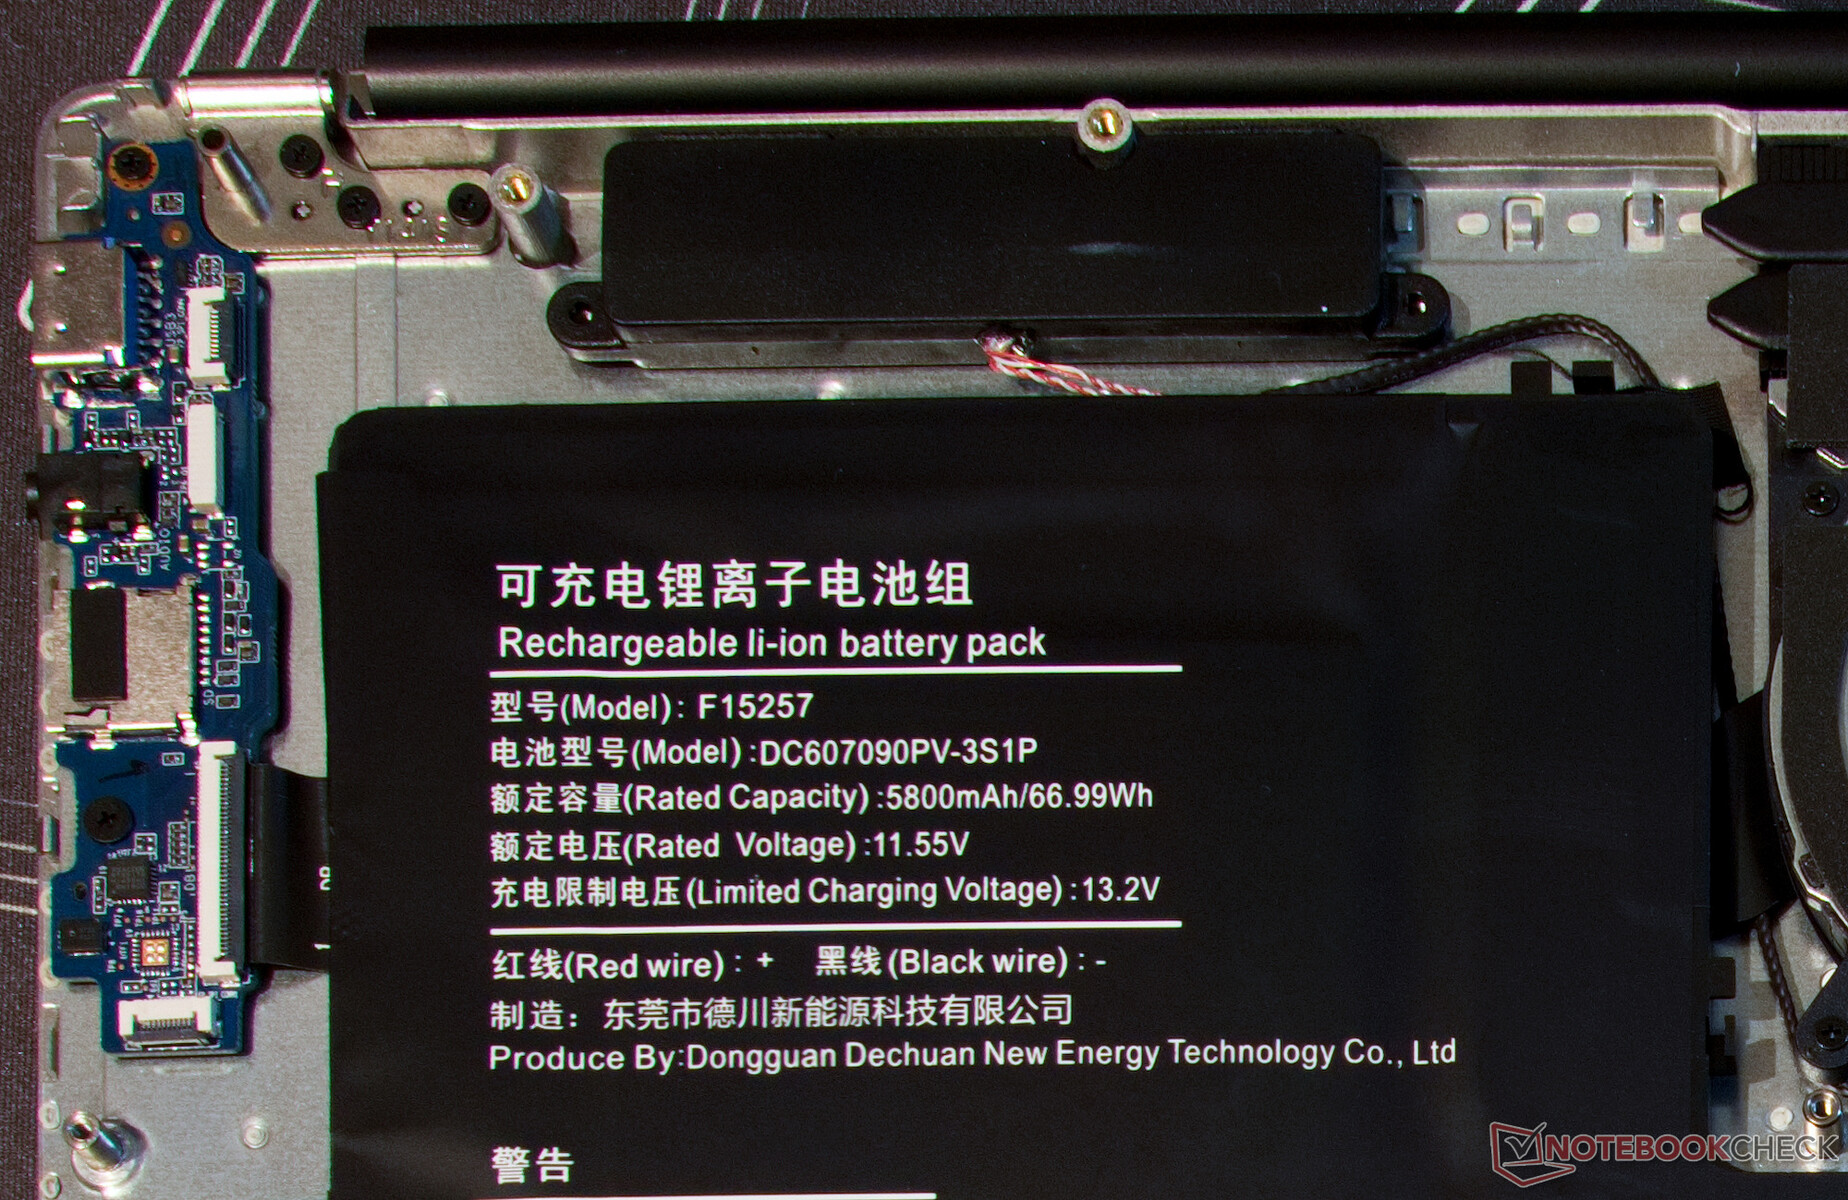
电池寿命
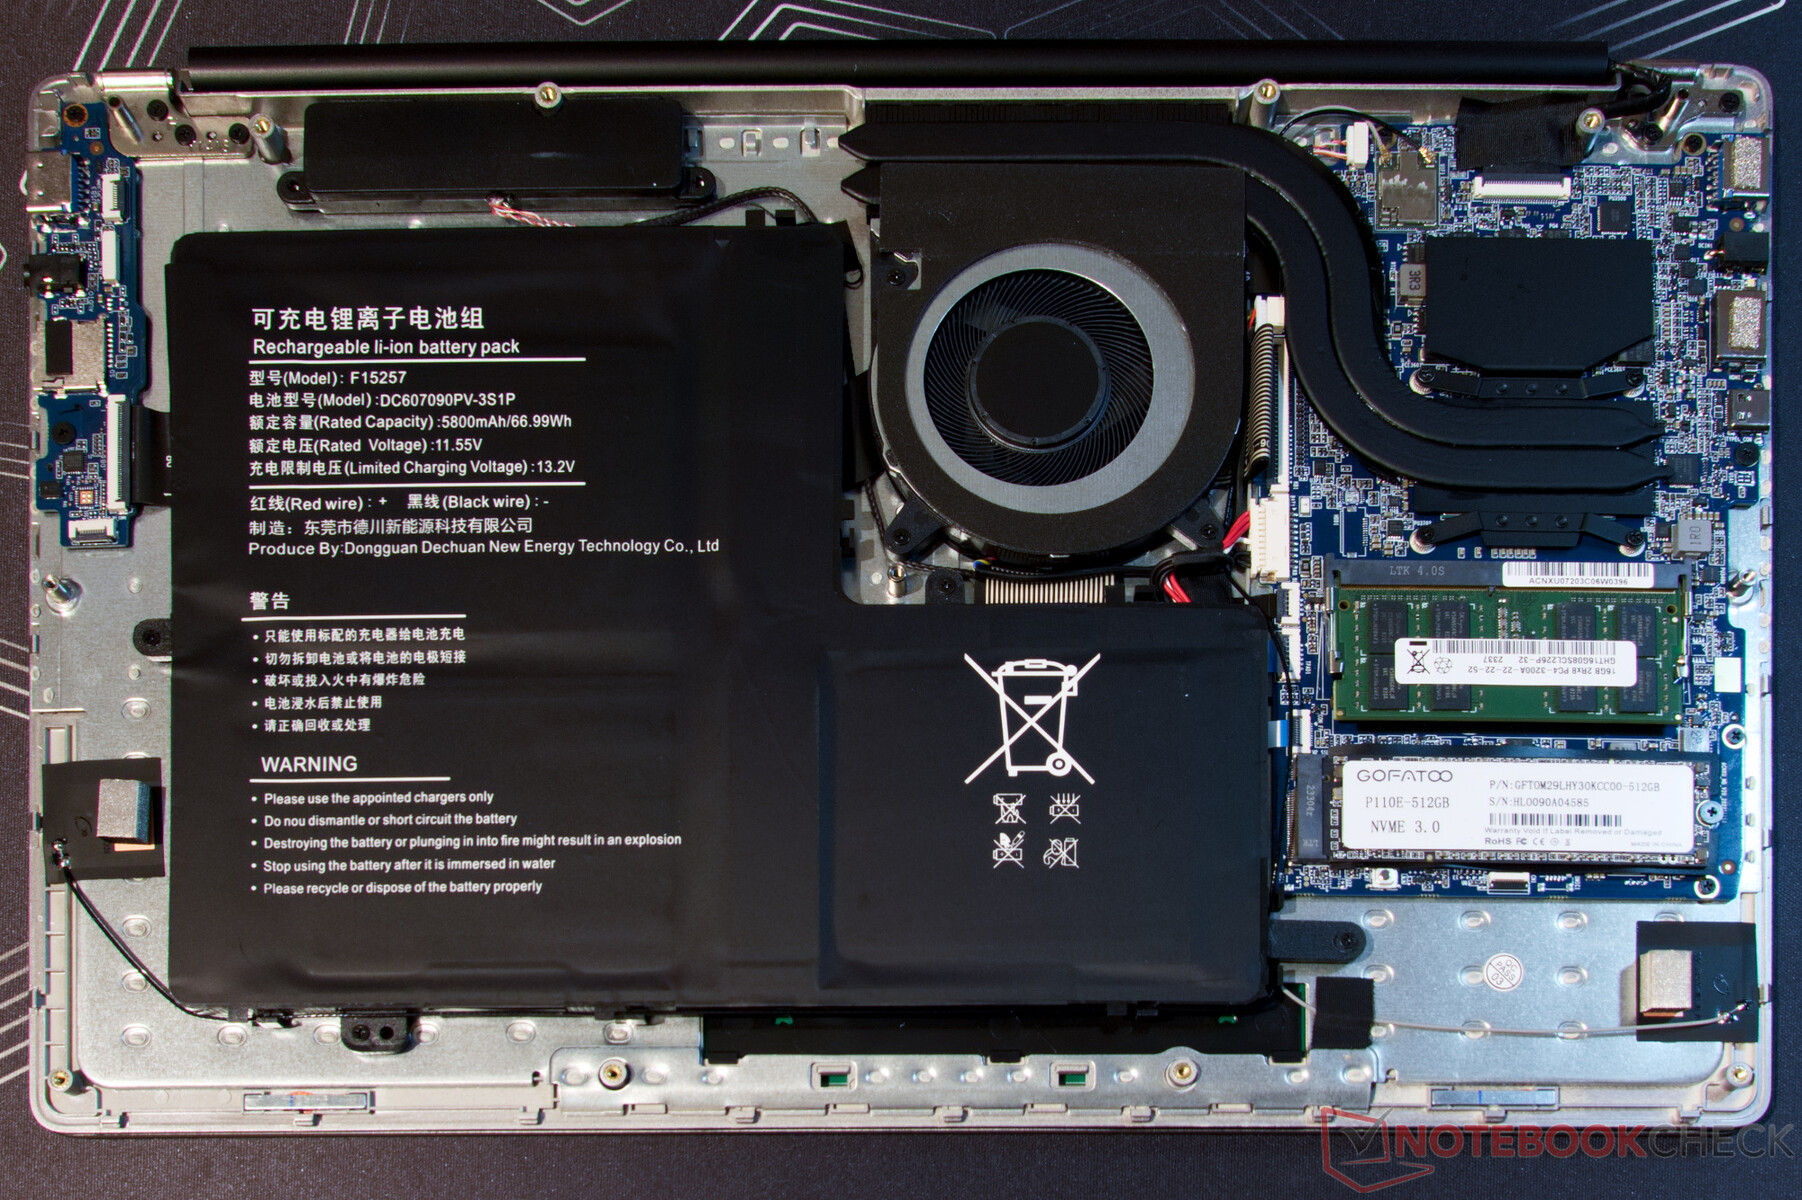
测试设备三分之一以上的空间都被电池占据,电池容量接近 67 Whr。再加上经济型处理器和我们测试设备普遍较低的能耗要求,这使得电池续航时间很长。
在冲浪时,Ninkear A15 Plus 在不使用电源的情况下可持续使用 10 多个小时。这使得这款办公笔记本电脑几乎可以与申克 Via 15 Pro 相提并论,后者是本次对比中电池续航时间最长的笔记本电脑。
| Ninkear A15 Plus (16+512) R7 5700U, Vega 8, 64.9 Wh | Lenovo IdeaPad 5 Pro 16ARH7 R5 6600HS, Radeon 660M, 75 Wh | Eurocom C315 Blitz i7-1360P, Iris Xe G7 96EUs, 73 Wh | Schenker VIA 15 Pro M22 R7 5700U, Vega 8, 91 Wh | HP 250 G9 7N029ES i3-1215U, UHD Graphics 64EUs, 41 Wh | Asus P1511CEA-BQ753R i3-1115G4, UHD Graphics Xe G4 48EUs, 37 Wh | Average of class Office | |
|---|---|---|---|---|---|---|---|
| Battery runtime | |||||||
| WiFi v1.3 (h) | 10.6 | 9.8 -8% | 8 -25% | 11 4% | 6 -43% | 5.2 -51% | 13.2 ? 25% |
Pros
Cons
结论绝对不是中国废料

Ninkear A15 Plus 的功率足以满足日常使用需求,噪音低,键盘坚固,轻金属外壳也很吸引人,但售价仅为 500 至 550 欧元。这个价格相对较低。相比之下 申克 Via 15 Pro M22在许多方面都比我们的测试设备配置更好,但最终价格却是它的两倍。
为了实现低价,Ninkear 在某些方面积极利用了节省成本的机会。在正常使用中,单通道内存和相对较慢的 WLAN 模块可能是最不引人注意的。而弱小的扬声器和不太明亮的屏幕则可能会让人更加厌烦。
不过,惠普或华硕等知名制造商生产的廉价笔记本电脑在这方面的配置通常也不会好到哪里去,而且处理器也明显较弱。尽管如此,大容量电池和 Windows 11 Pro 许可证在这个价位的笔记本电脑中也是不多见的。
测试证明,Ninkear A15 Plus 是一款非常适合家庭办公的笔记本电脑。良好的性能与吸引人的设计相得益彰。不过,扬声器、无线局域网和屏幕亮度等方面不得不做出妥协。
事实上,事实证明 Ninkear A15 Plus 是我们对比设备的有力竞争者。这款办公笔记本的外壳非常吸引人,而且整体上非常实用。对于 惠普 250 G9或 华硕 P1511CEA如果中国笔记本电脑制造商继续进军欧洲市场,竞争就会更加激烈。
Ninkear A15 Plus 证明了它不是中国垃圾。这款产品给了我们很大的惊喜,在如此低的价位上,我们对它的期望要低得多。Ninkear 的唯一缺点可能就是担保或保修。对于来自远东的设备和经销商来说,这两点有时都很难做到。
价格和供应情况
遗憾的是,我们的 16+512 配置的 Ninkear A15 Plus 目前几乎到处缺货。这款笔记本电脑配备 32 GB 内存和 1 TB NVMe 固态硬盘,目前在 Tomtop 的售价为€617(从德国仓库发货)。.这意味着在欧盟地区没有关税或类似费用。
Ninkear A15 Plus (16+512)
- 02/22/2024 v7 (old)
Marc Herter
Transparency
The selection of devices to be reviewed is made by our editorial team. The test sample was given to the author by the manufacturer free of charge for the purposes of review. There was no third-party influence on this review, nor did the manufacturer receive a copy of this review before publication. There was no obligation to publish this review. As an independent media company, Notebookcheck is not subjected to the authority of manufacturers, retailers or publishers.
This is how Notebookcheck is testing
Every year, Notebookcheck independently reviews hundreds of laptops and smartphones using standardized procedures to ensure that all results are comparable. We have continuously developed our test methods for around 20 years and set industry standards in the process. In our test labs, high-quality measuring equipment is utilized by experienced technicians and editors. These tests involve a multi-stage validation process. Our complex rating system is based on hundreds of well-founded measurements and benchmarks, which maintains objectivity. Further information on our test methods can be found here.
Price comparison
