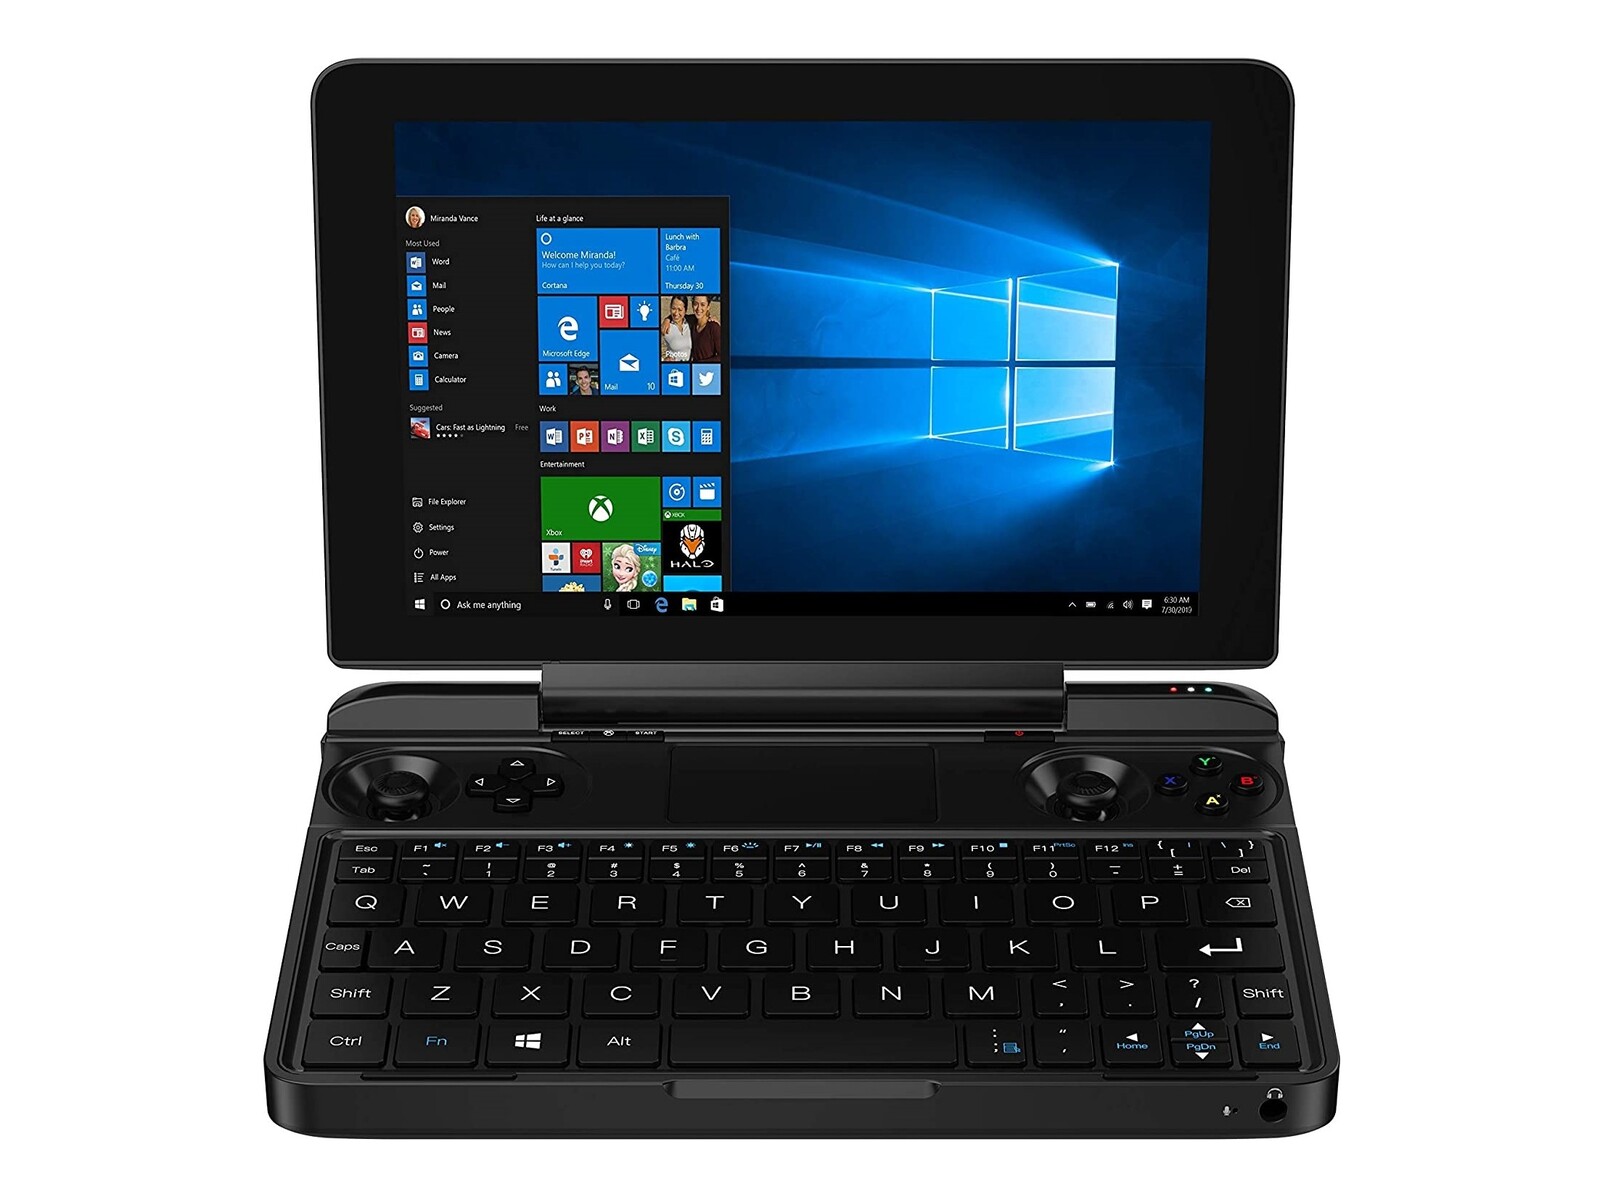
GPD Win Max 2021手持式游戏笔记本电脑评测。Ryzen 7比Core i7更慢

GPD Win Max去年年底推出了10代英特尔Ice Lake 选项。对于2021年,制造商已经刷新了该模型,采用了更新更快的第11代Tiger Lake CPU,甚至为AMD粉丝提供了Zen 2选项。我们这里的测试单元配备了Ryzen 7 4800U和集成的Radeon RX Vega 8 GPU。虽然AMD后来转向移动的Zen 3 CPU,如 Ryzen 7 5800U但较早的Ryzen 7 4800U仍然是目前最快的U系列CPU之一。
请看Indiegogo的官方网页。了解更多关于Win Max和它的功能。1000美元的价格标签与许多传统超极本处于同一水平,因为Win Max本质上是一台具有现代超极本性能和端口的UMPC。
更多GPD评论。
potential competitors in comparison
Rating | Date | Model | Weight | Height | Size | Resolution | Price |
|---|---|---|---|---|---|---|---|
| 79.3 % v7 (old) | 08 / 2021 | GPD Win Max 2021 R7 4800U, Vega 8 | 850 g | 26 mm | 8.00" | 1280x800 | |
v (old) | GPD Win 3 i5-1135G7, Iris Xe G7 80EUs | 553 g | 27 mm | 5.50" | 1280x720 | ||
| 84.4 % v7 (old) | 08 / 2021 | HP Pavilion Aero 13 be0097nr R7 5800U, Vega 8 | 953 g | 17 mm | 13.30" | 1920x1200 | |
| 84.7 % v7 (old) | 08 / 2021 | Lenovo Yoga 6 13 82ND0009US R5 5500U, Vega 7 | 1.3 kg | 18.2 mm | 13.30" | 1920x1080 | |
| 86.3 % v7 (old) | Asus ZenBook Flip 13 UX363EA-HP069T i7-1165G7, Iris Xe G7 96EUs | 1.2 kg | 13 mm | 13.30" | 1920x1080 | ||
| 88.9 % v7 (old) | 06 / 2021 | Asus ZenBook 13 UX325EA i7-1165G7, Iris Xe G7 96EUs | 1.2 kg | 13.9 mm | 13.30" | 1920x1080 |
案例
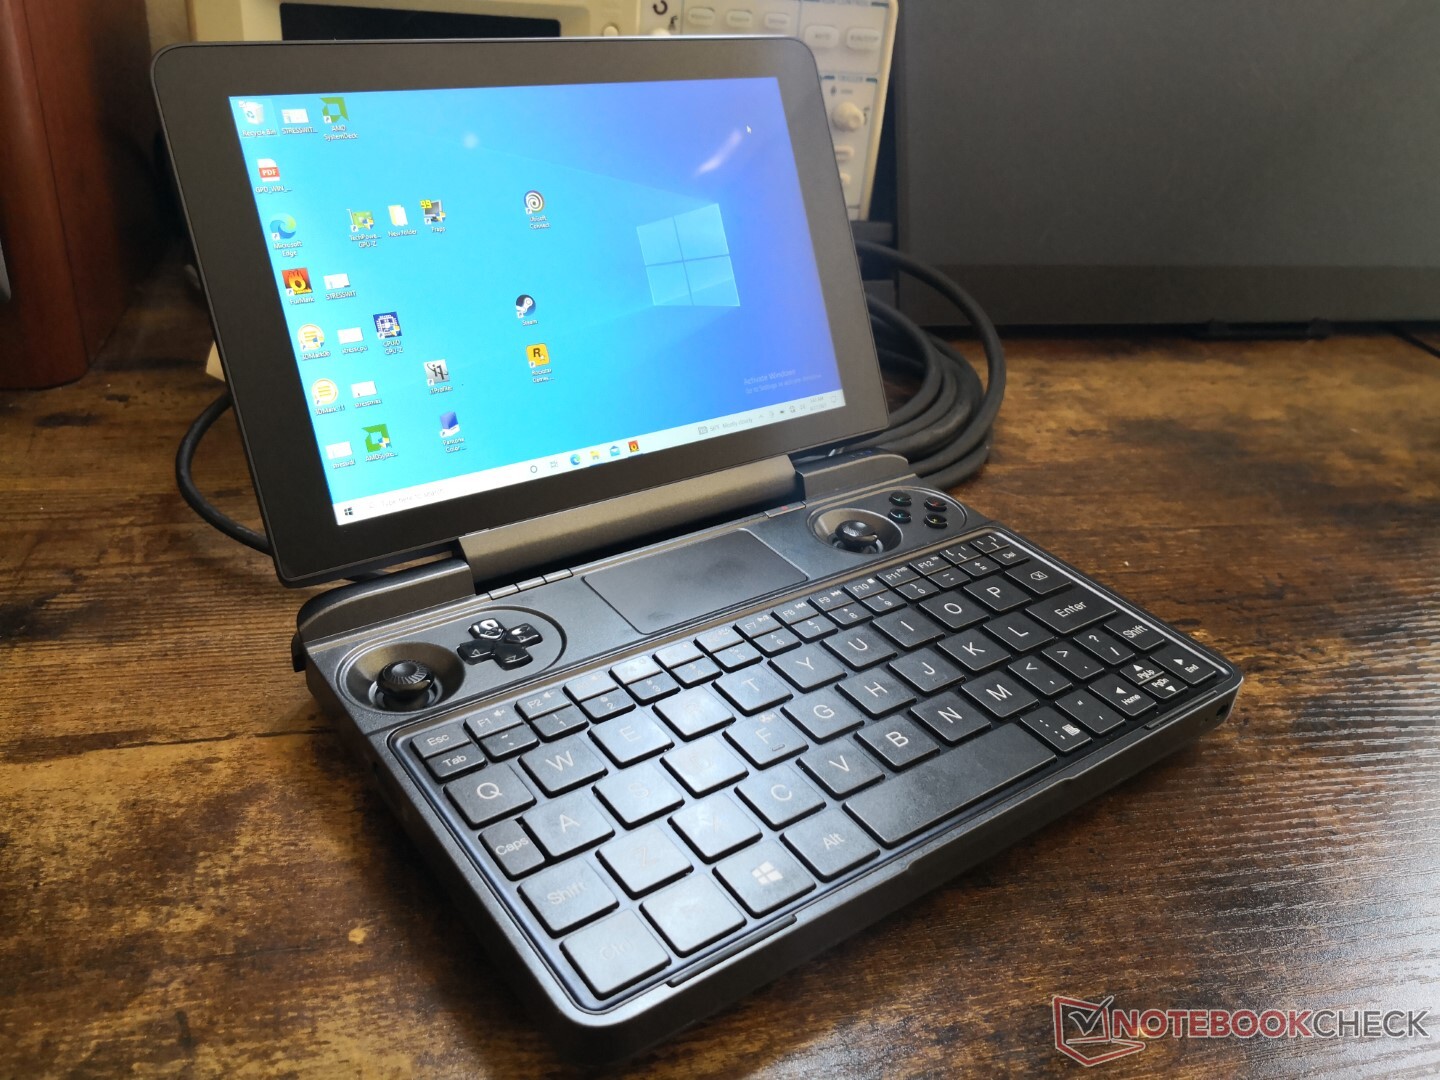
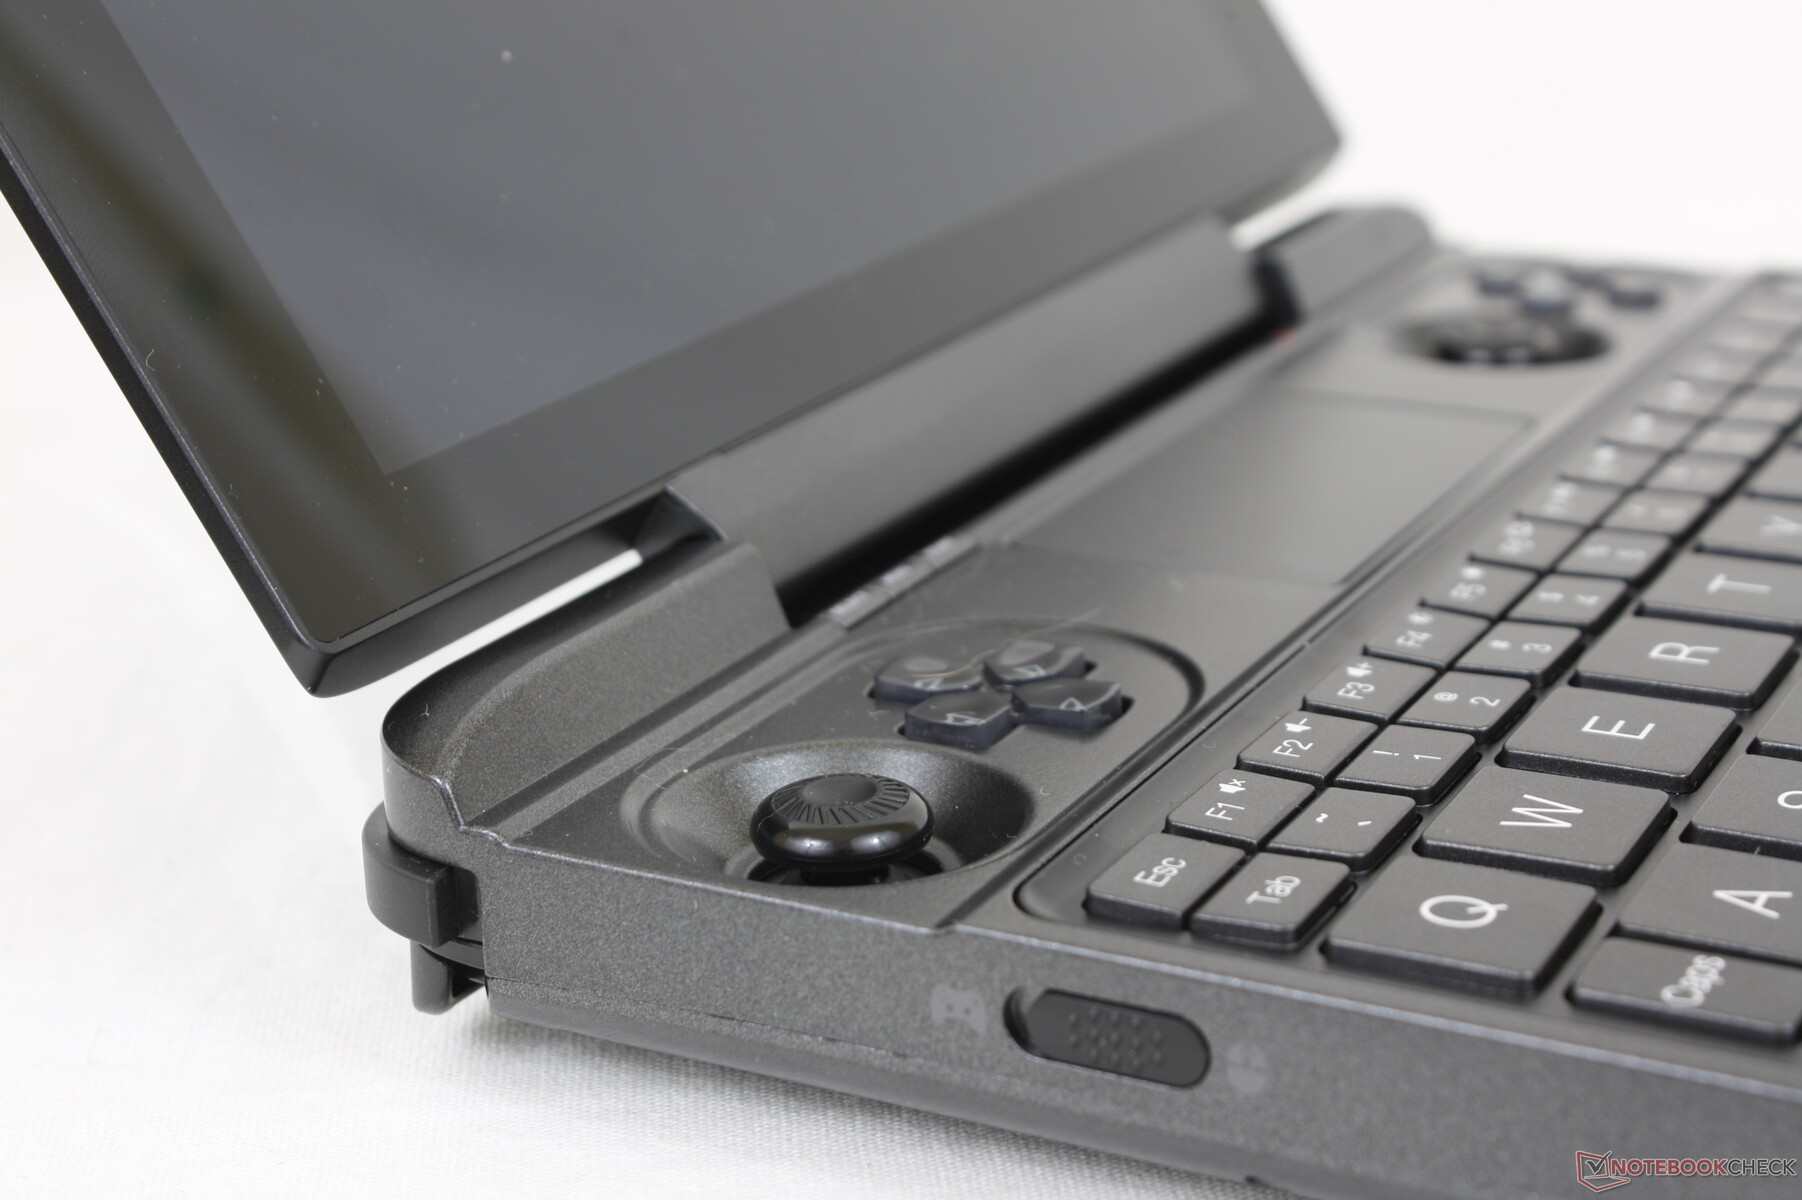
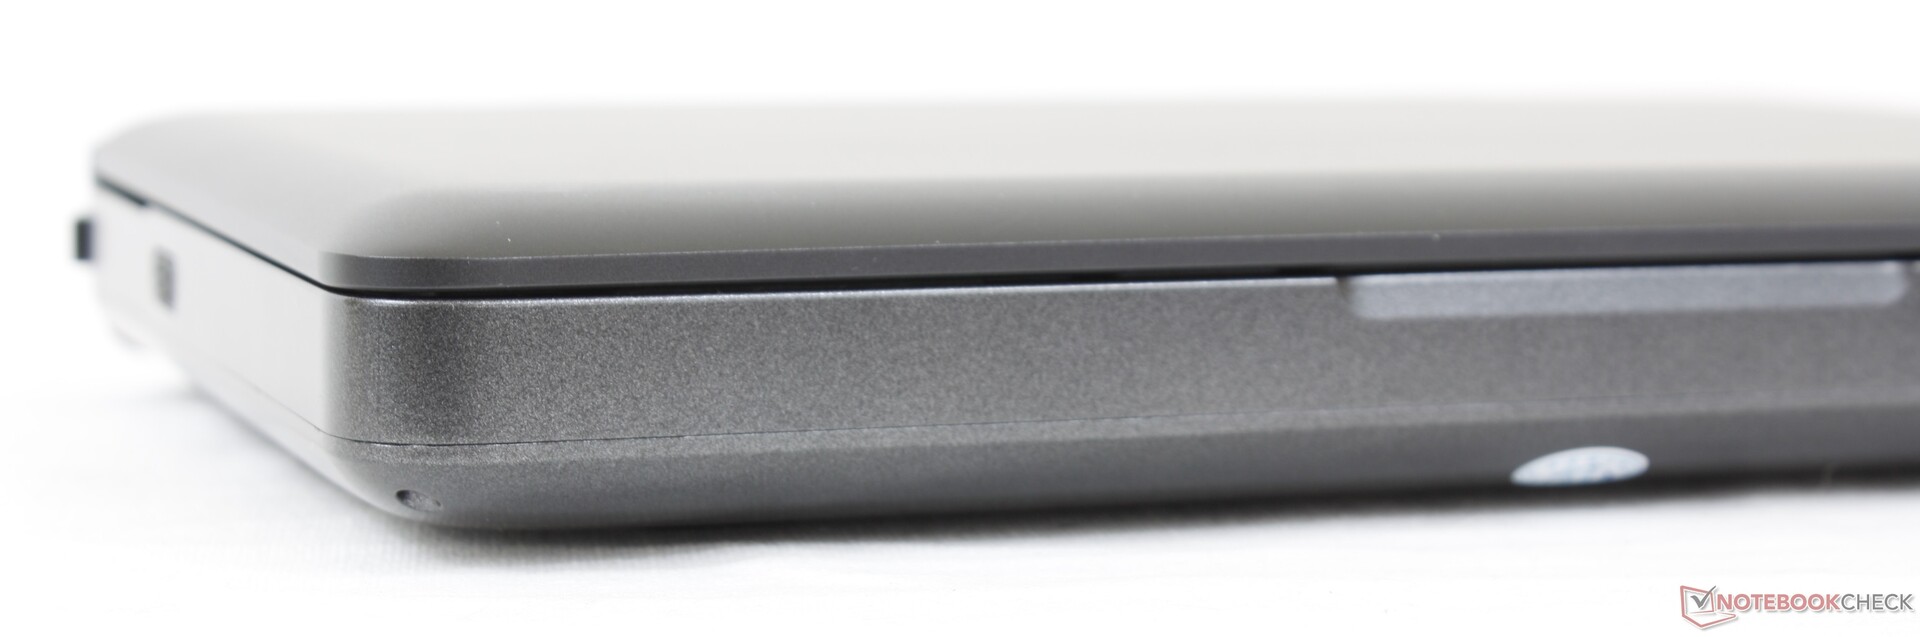
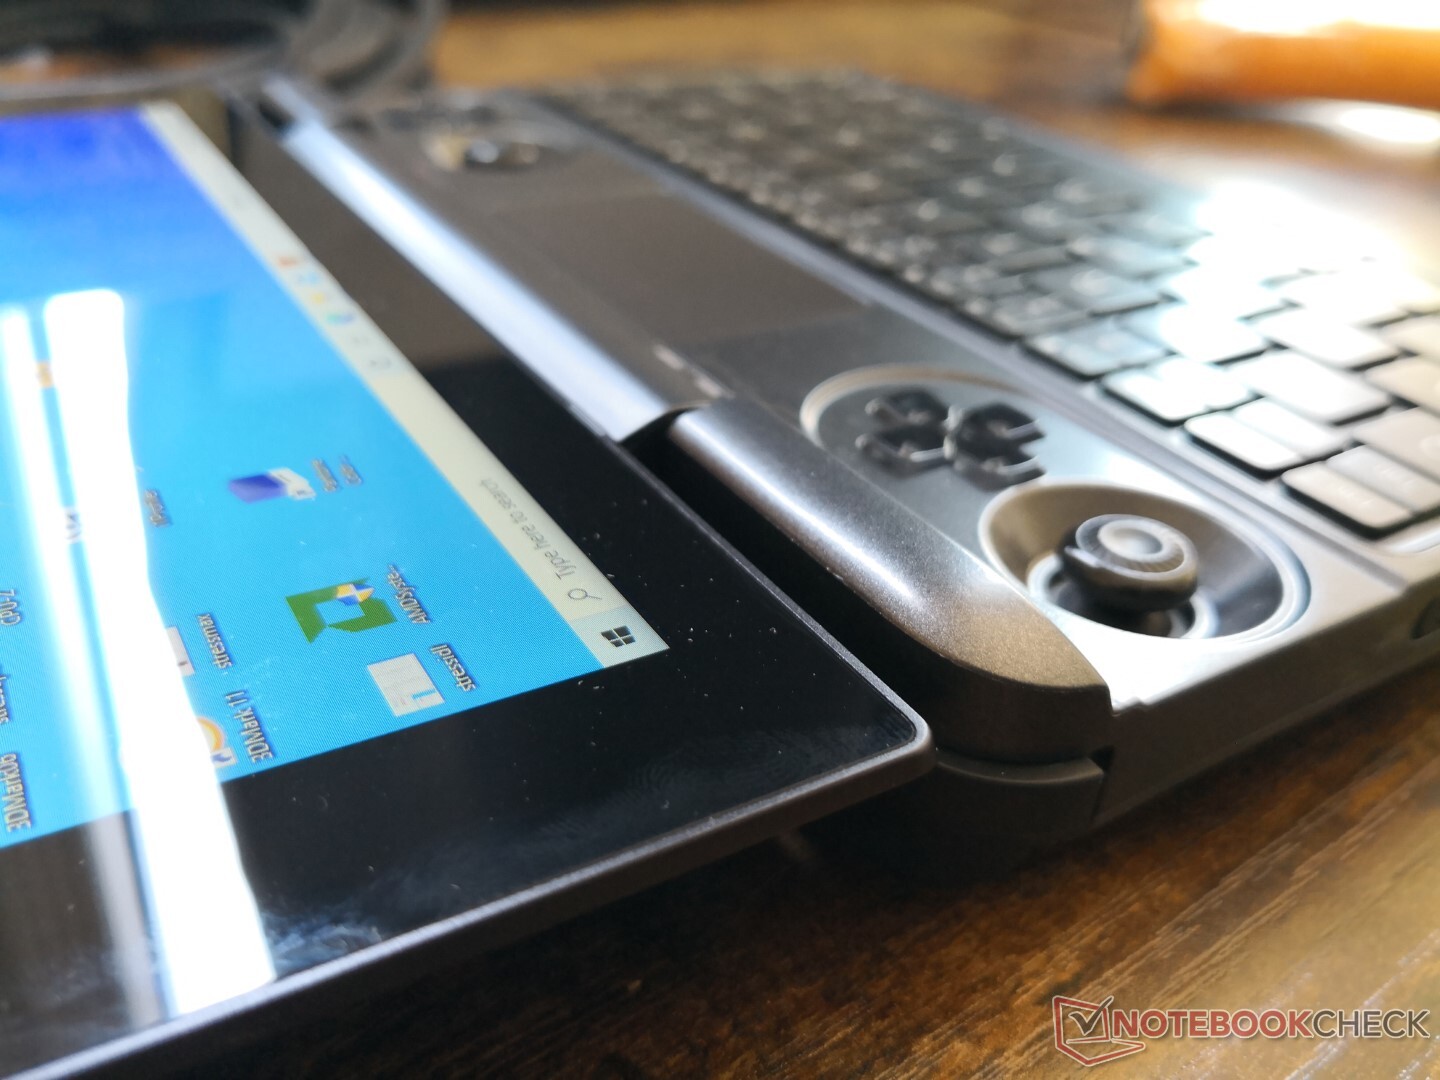
从外观上看,该机箱结构紧凑,灰色金属表面光滑,视觉设计出色。然而,拿在手上,即使是简单的动作,如打开盖子或抓紧底座的两侧,系统也很容易发出吱吱声。由于所有的吱吱作响,该机箱并不带有强烈的豪华感。对于超过一千美元的产品,制造商当然可以在这方面做得更好。
连接性
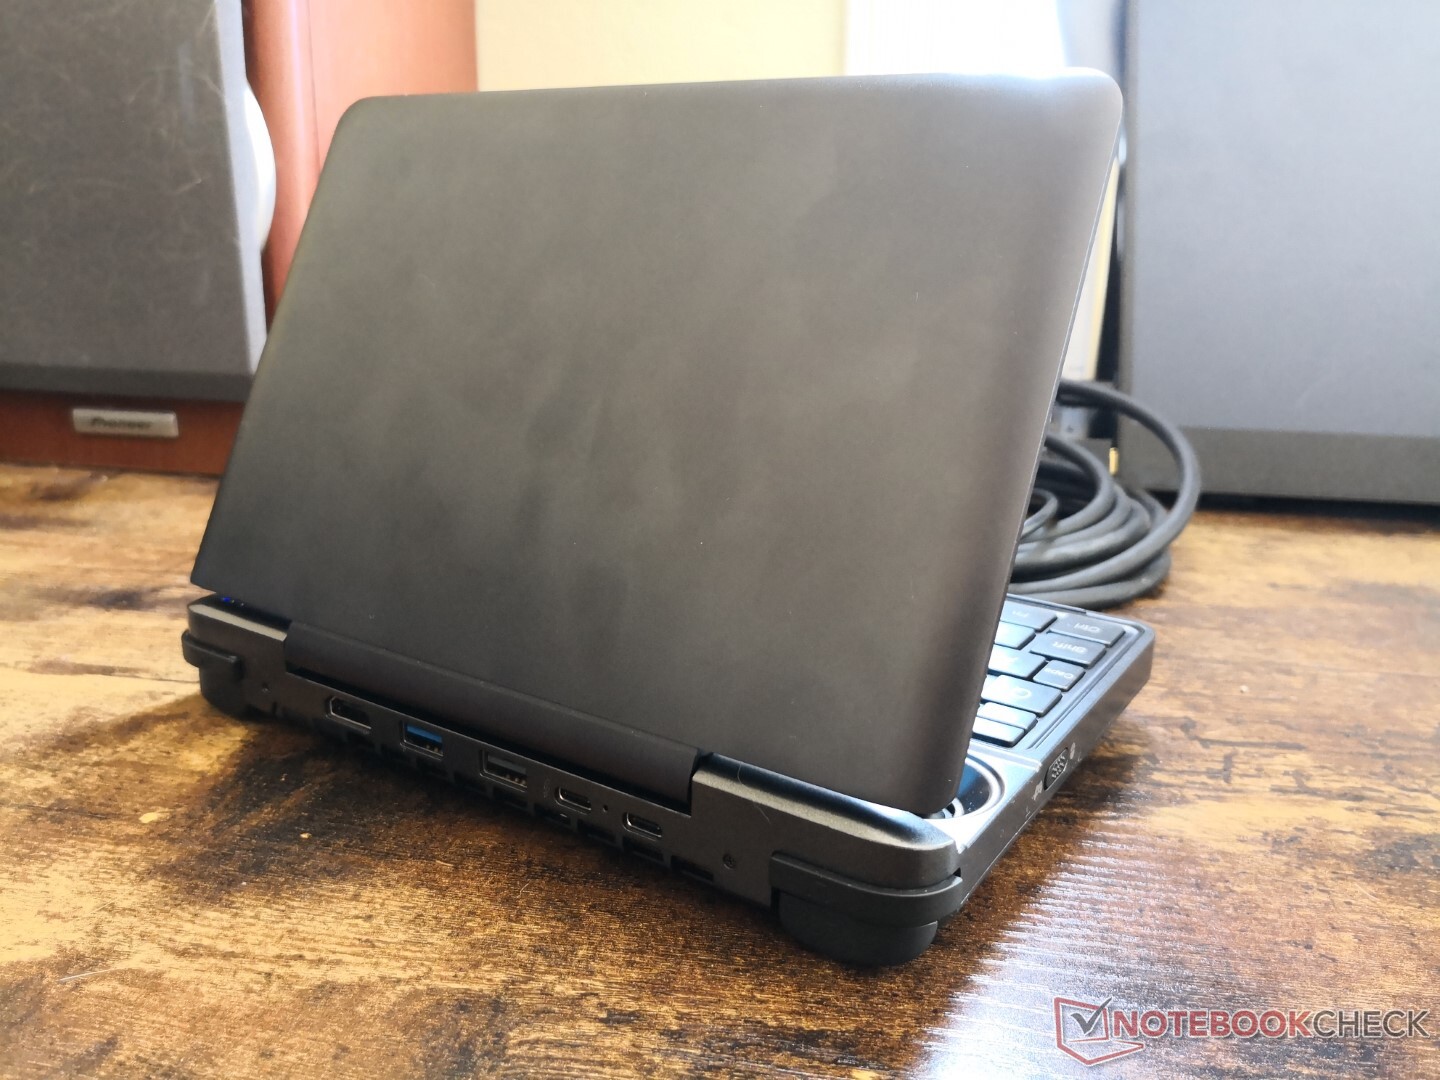
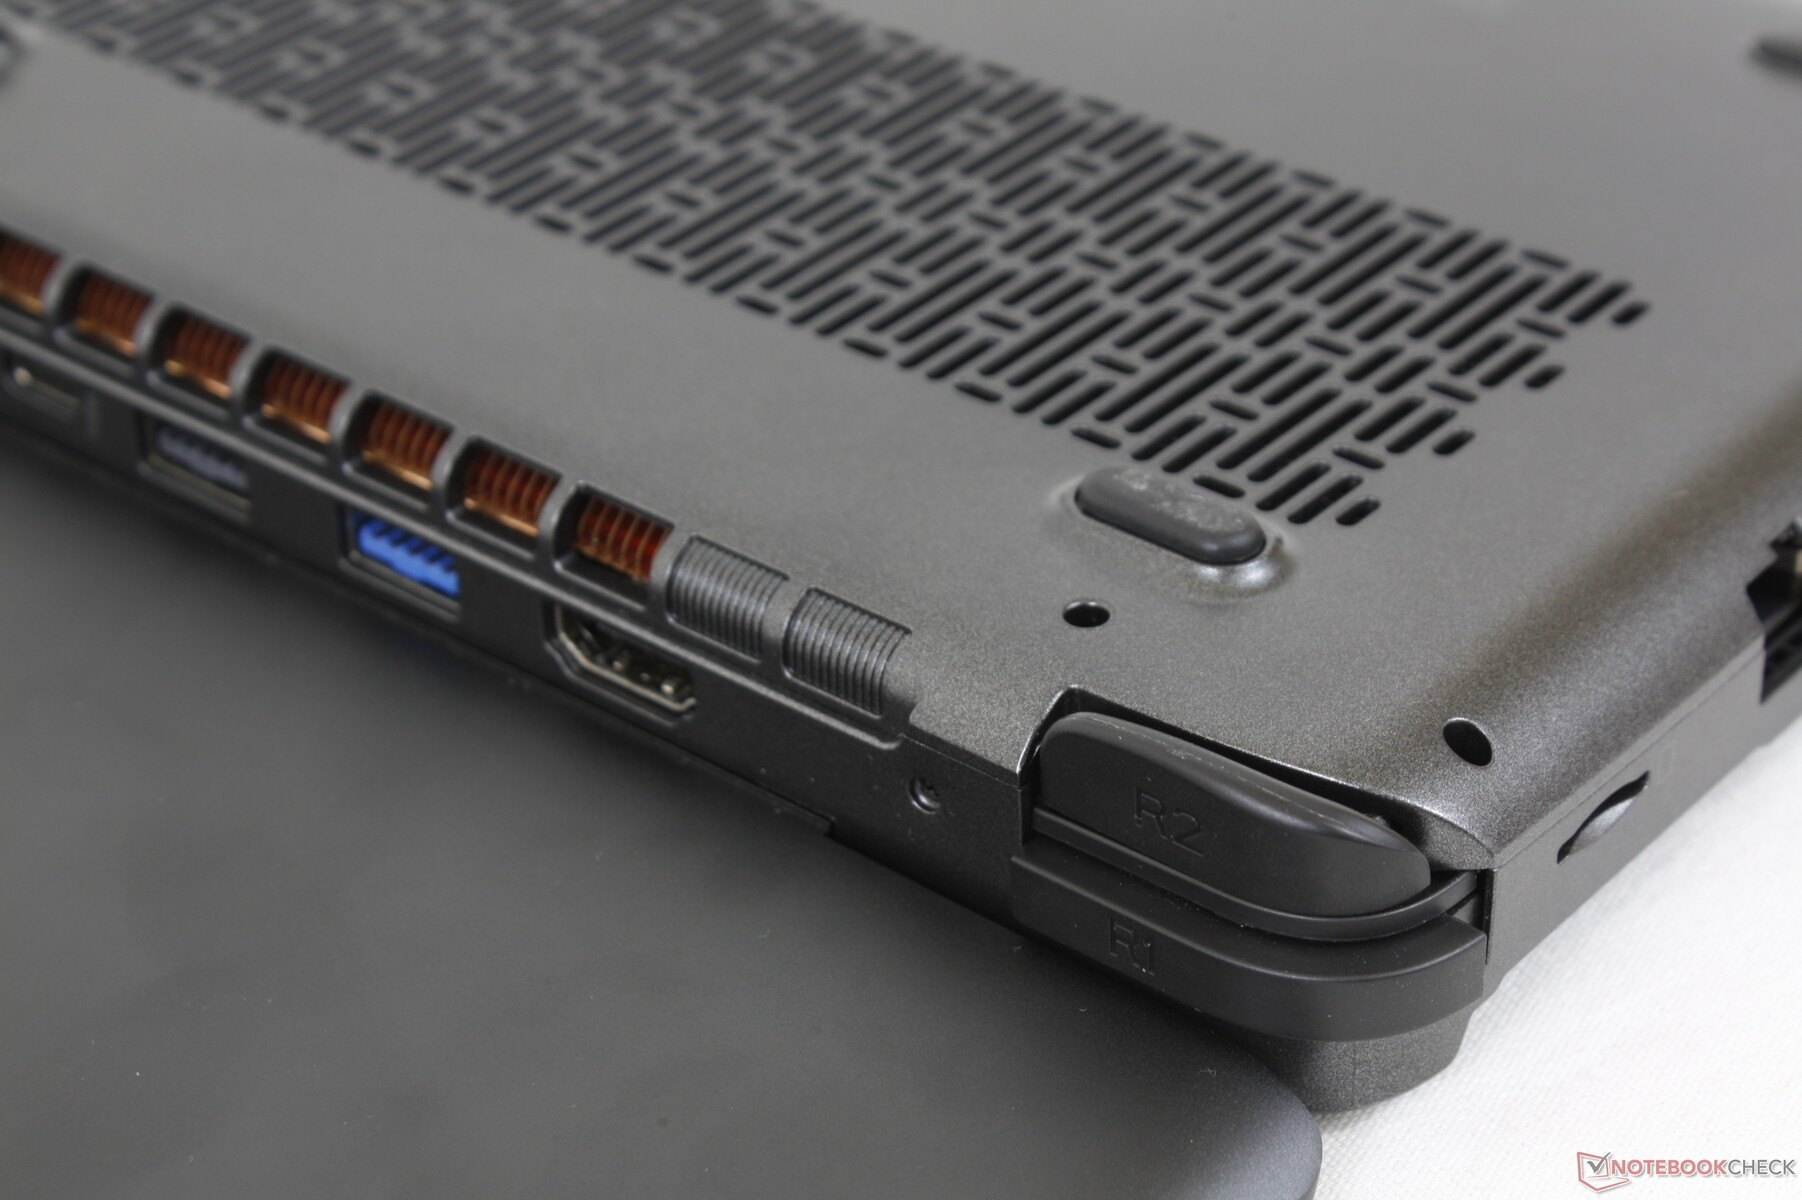
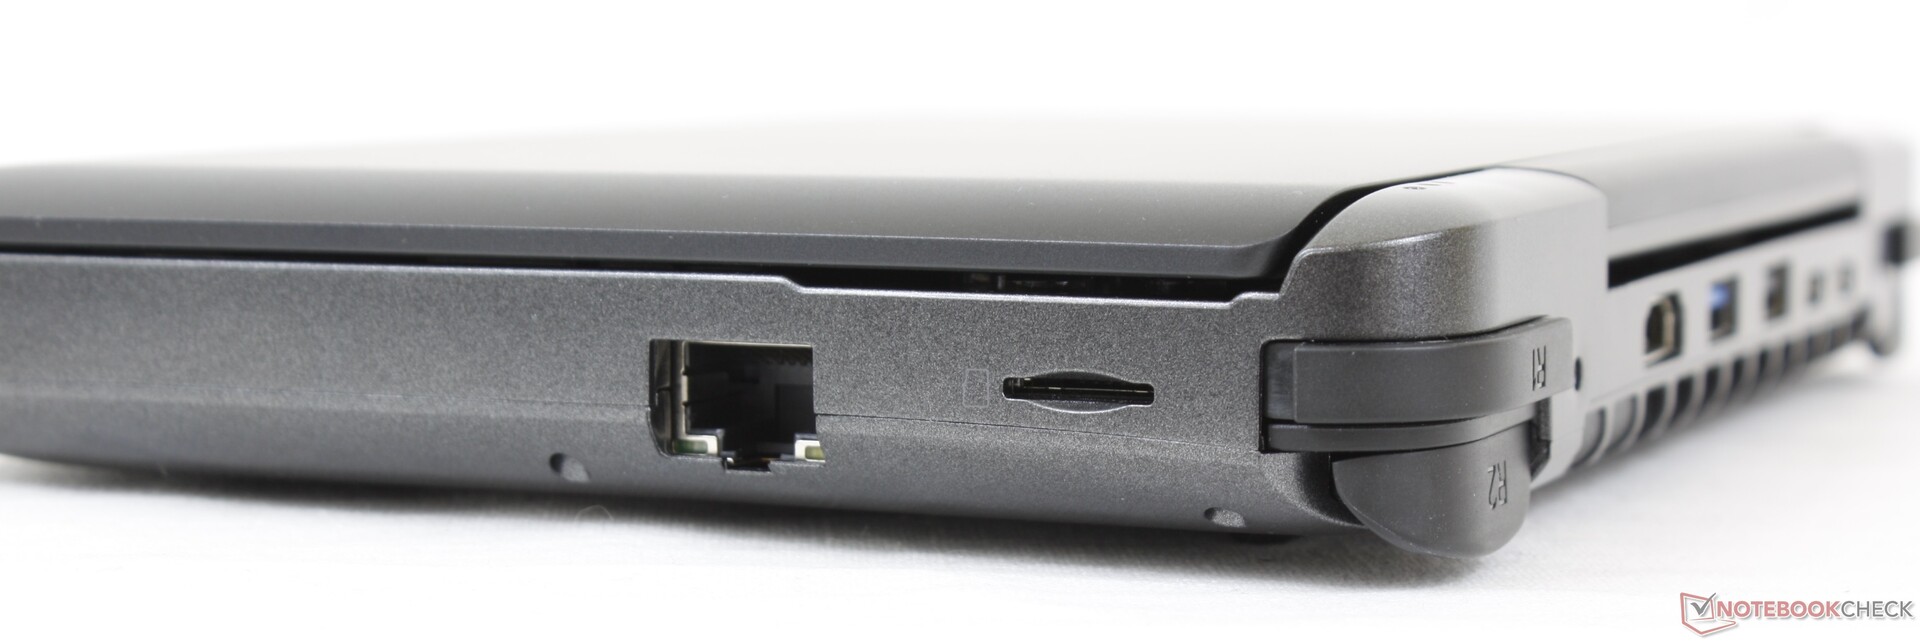
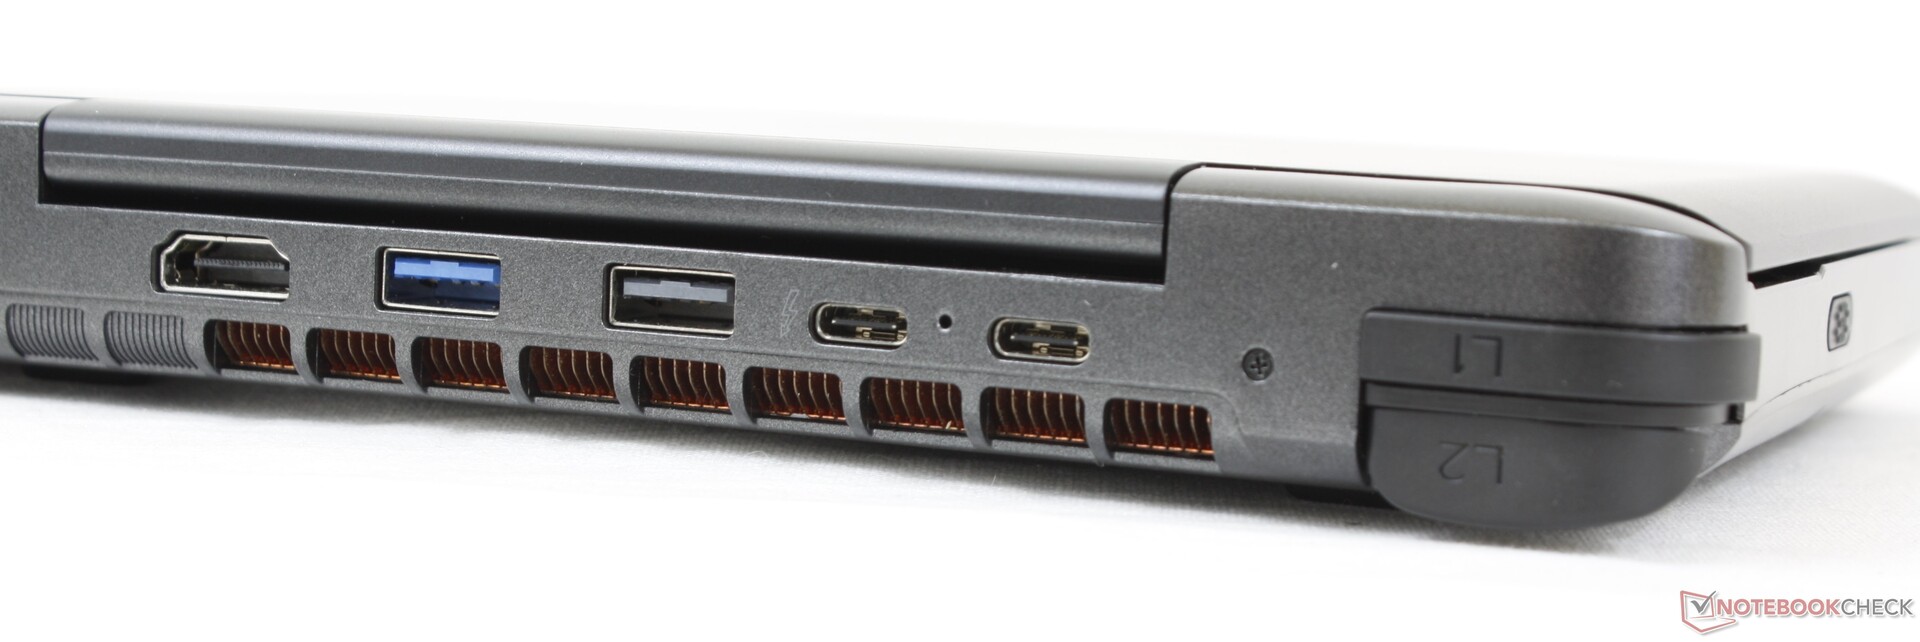
对于这样一个小设计来说,端口选项是丰富的。不幸的是,我们的AMD设备不支持DisplayPort-over-USB-C,这意味着用户必须使用HDMI端口来连接外部显示器。
选择英特尔版本的Win Max将授予两个USB-C端口的Thunderbolt 4兼容性。
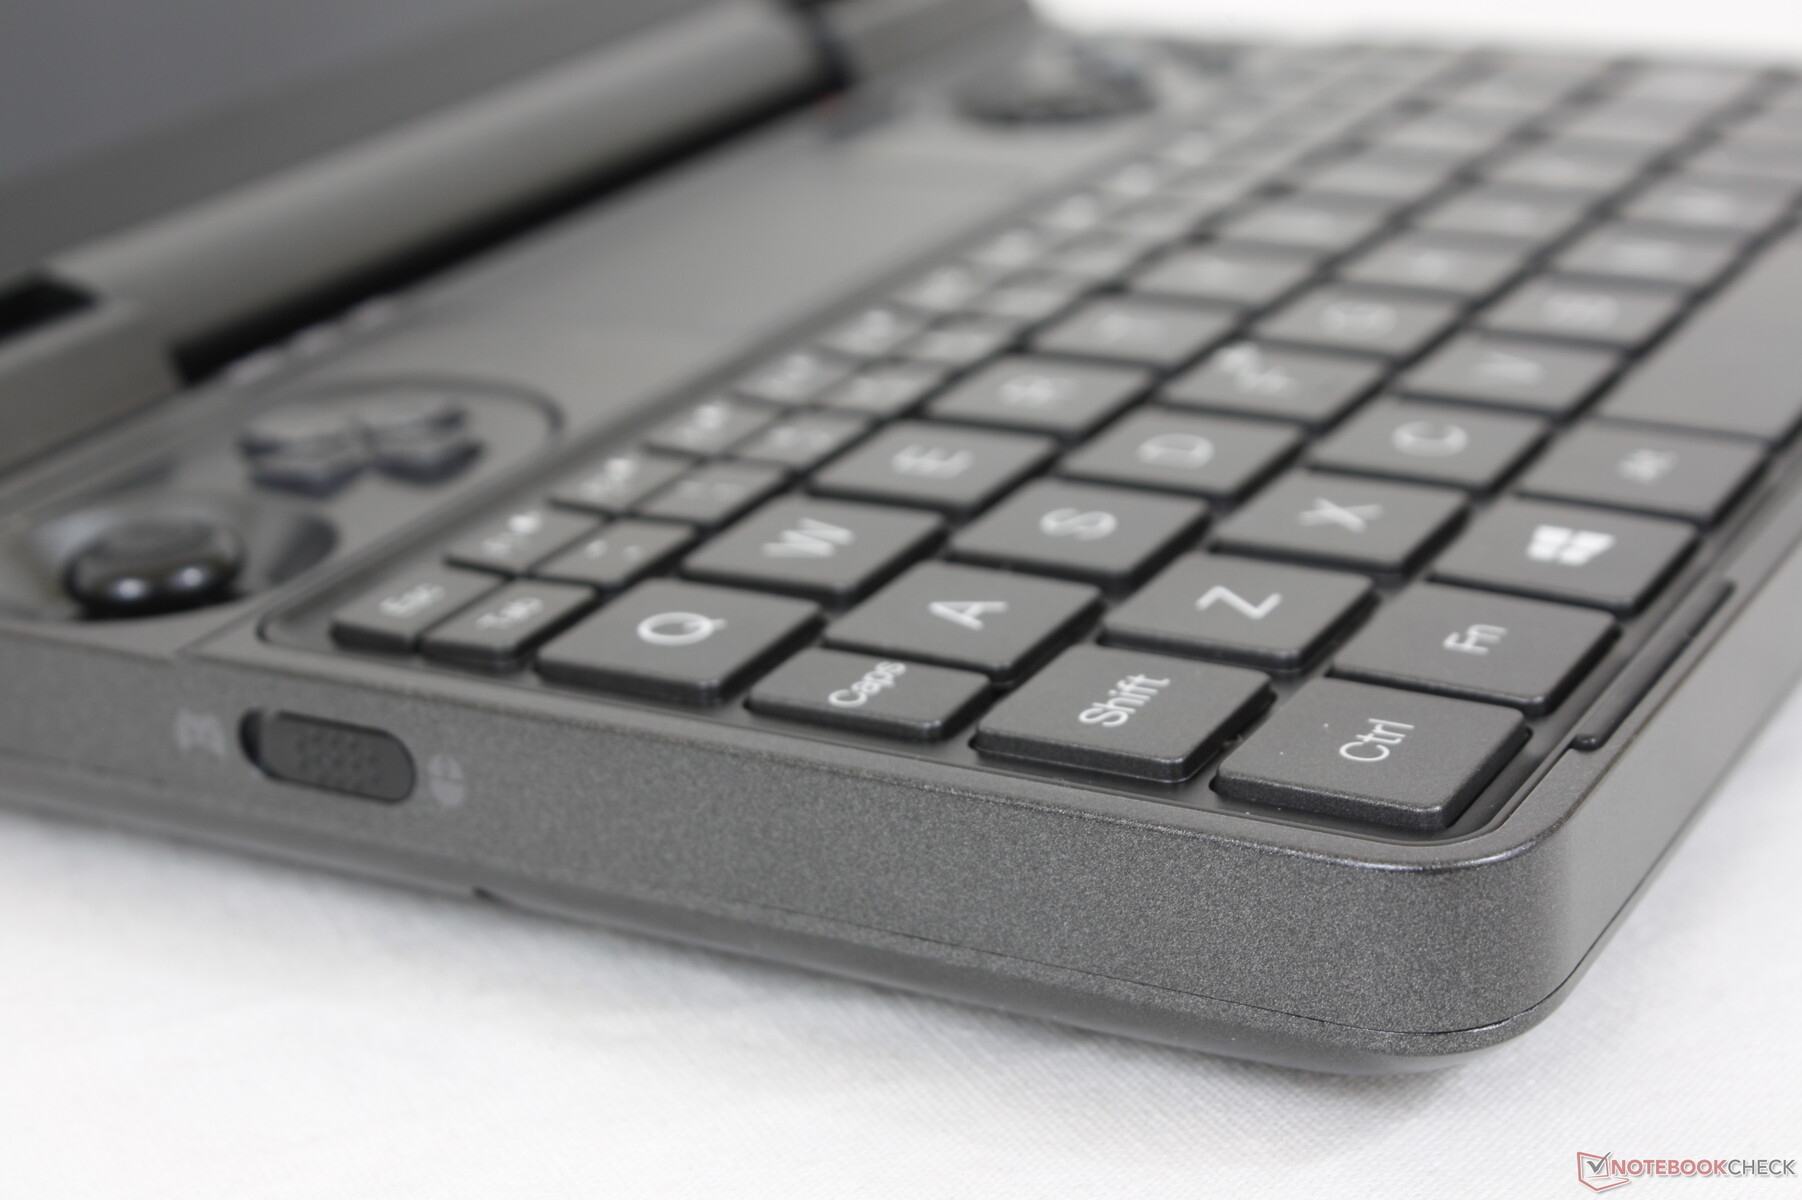
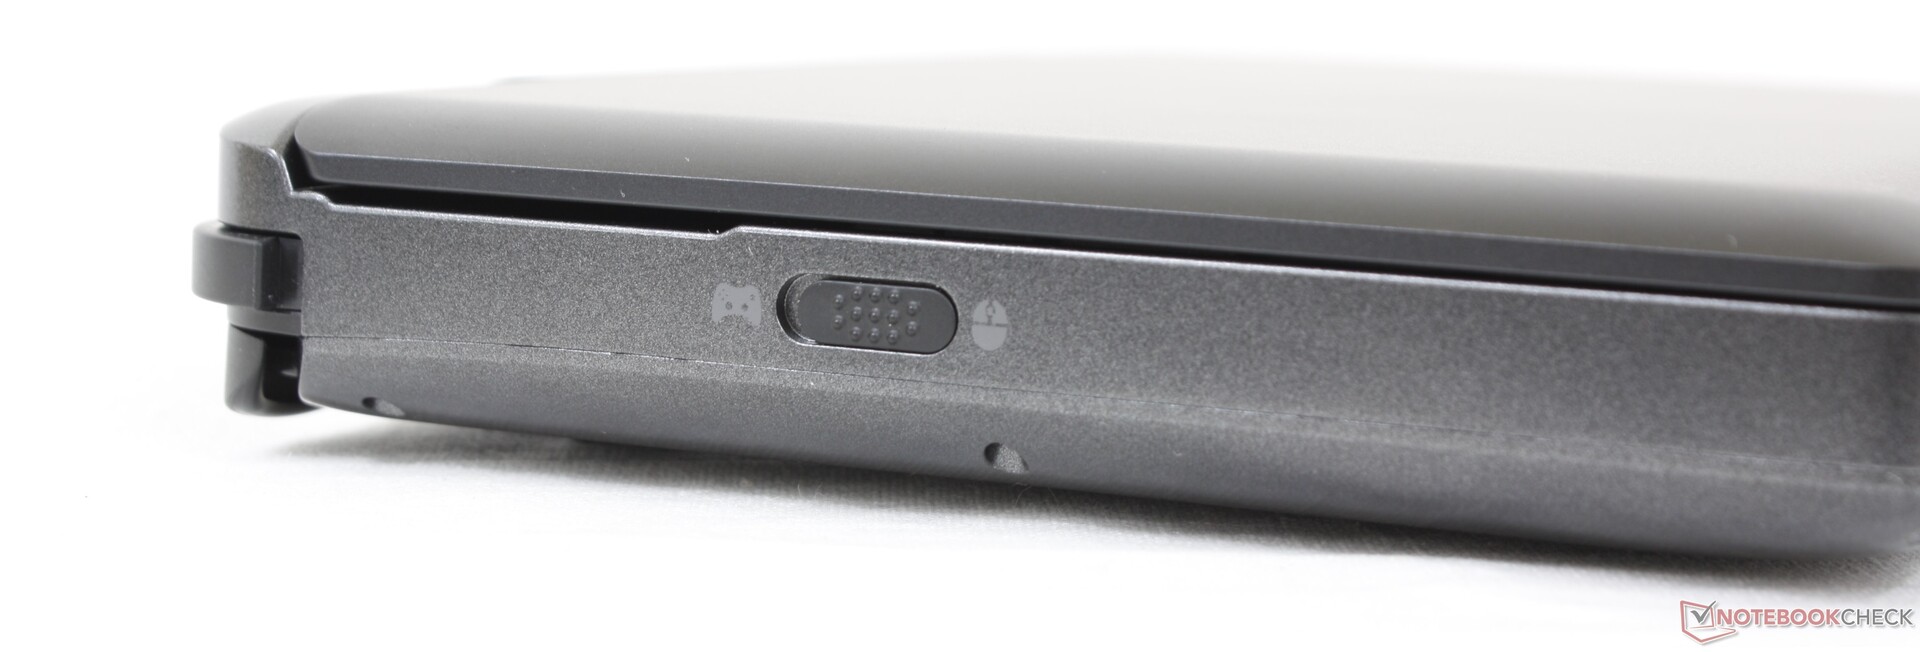
沿着左侧边缘的开关可以切换控制器的输入,详情如下 这里详述在Win 3上。
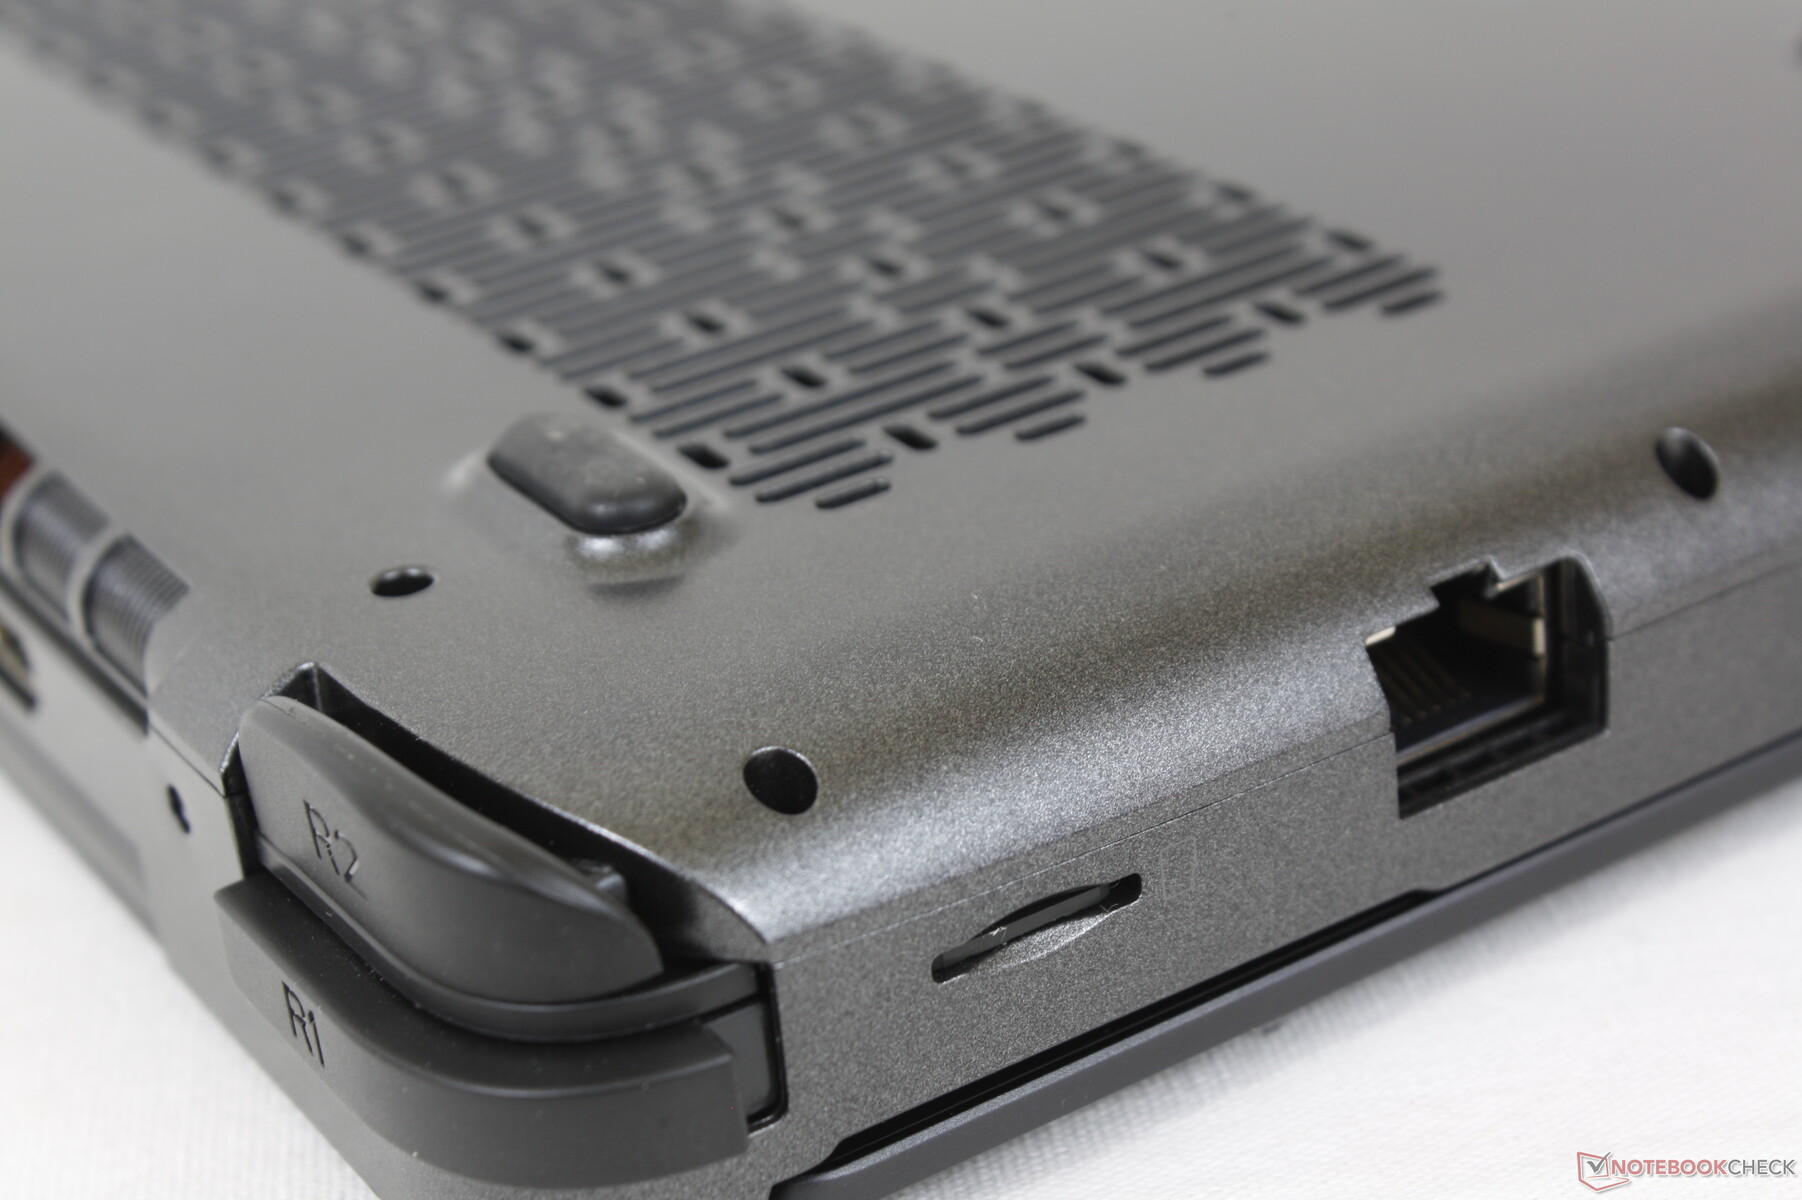
SD卡阅读器
虽然该系统集成了一个MicroSD读卡器,但它在我们的预生产设备上根本无法工作。我们尝试插入UHS-I和UHS-II卡,但都无法识别。我们建议用户在购买时立即测试一下MicroSD卡插槽。
沟通
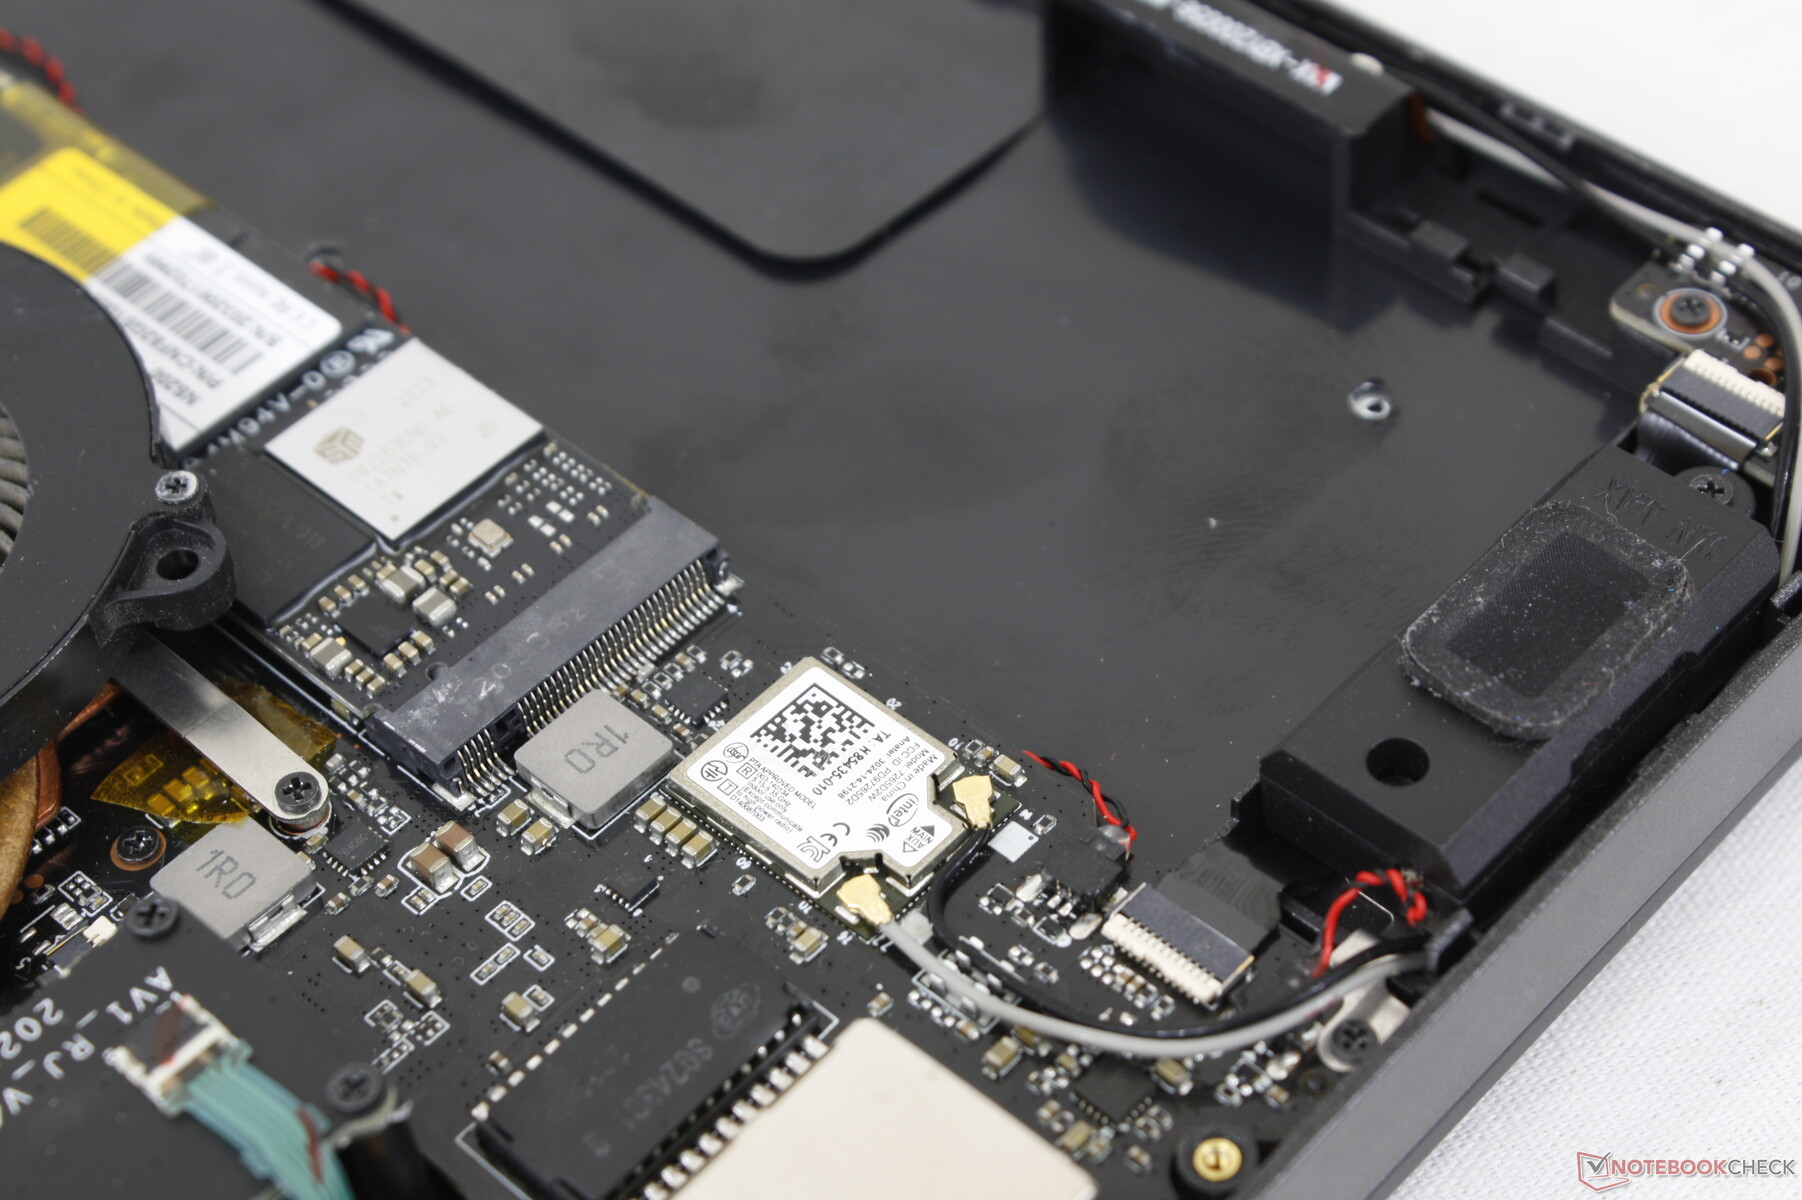
令人失望的是,Win Max配备的是英特尔7265,而不是更新更快的英特尔AX200/201。这意味着该系统不支持Wi-Fi 6的速度,在将Win Max与Win 3等由英特尔驱动的设备进行比较时就可以看出这一点。
| Networking | |
| iperf3 transmit AX12 | |
| Asus ZenBook Flip 13 UX363EA-HP069T | |
| GPD Win 3 | |
| Asus ZenBook 13 UX325EA | |
| Lenovo Yoga 6 13 82ND0009US | |
| HP Pavilion Aero 13 be0097nr | |
| GPD Win Max 2021 | |
| iperf3 receive AX12 | |
| Asus ZenBook 13 UX325EA | |
| GPD Win 3 | |
| Asus ZenBook Flip 13 UX363EA-HP069T | |
| HP Pavilion Aero 13 be0097nr | |
| Lenovo Yoga 6 13 82ND0009US | |
| GPD Win Max 2021 | |
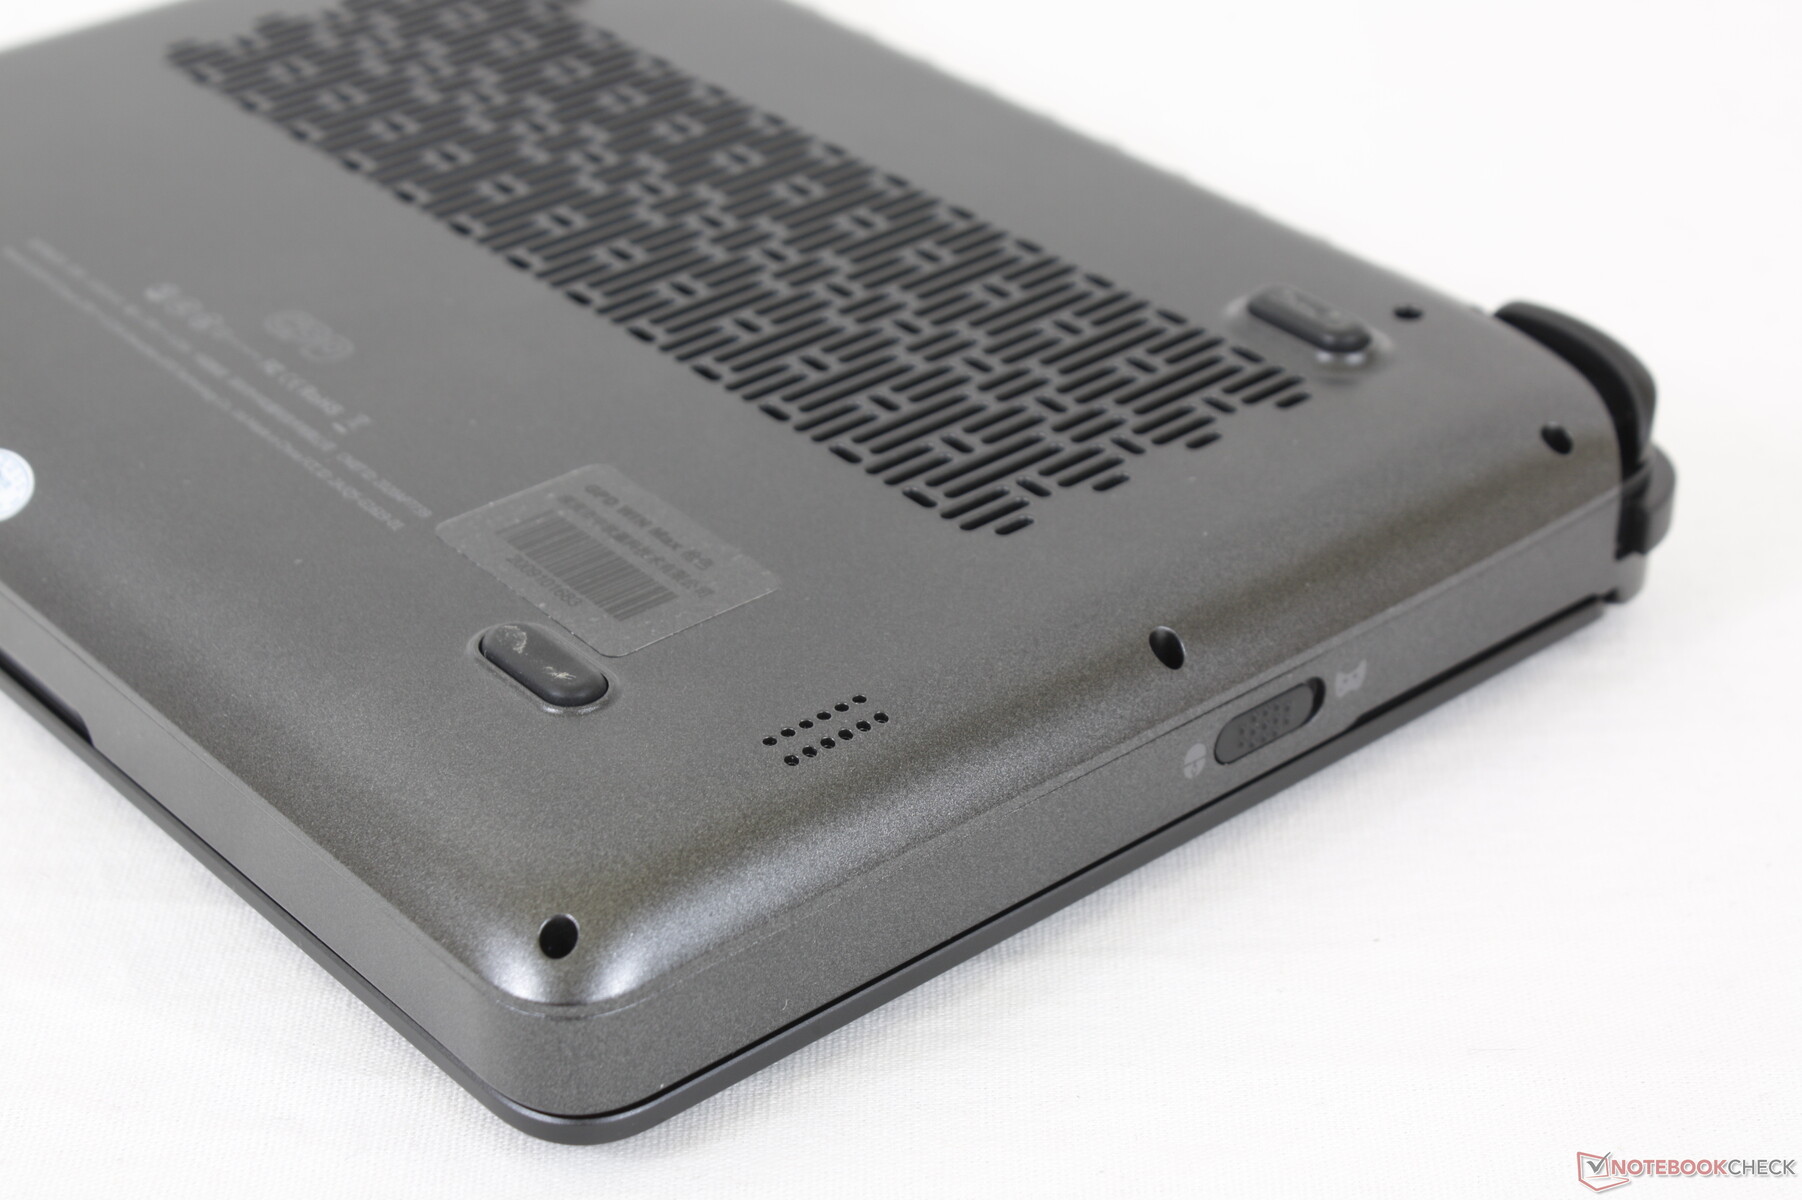
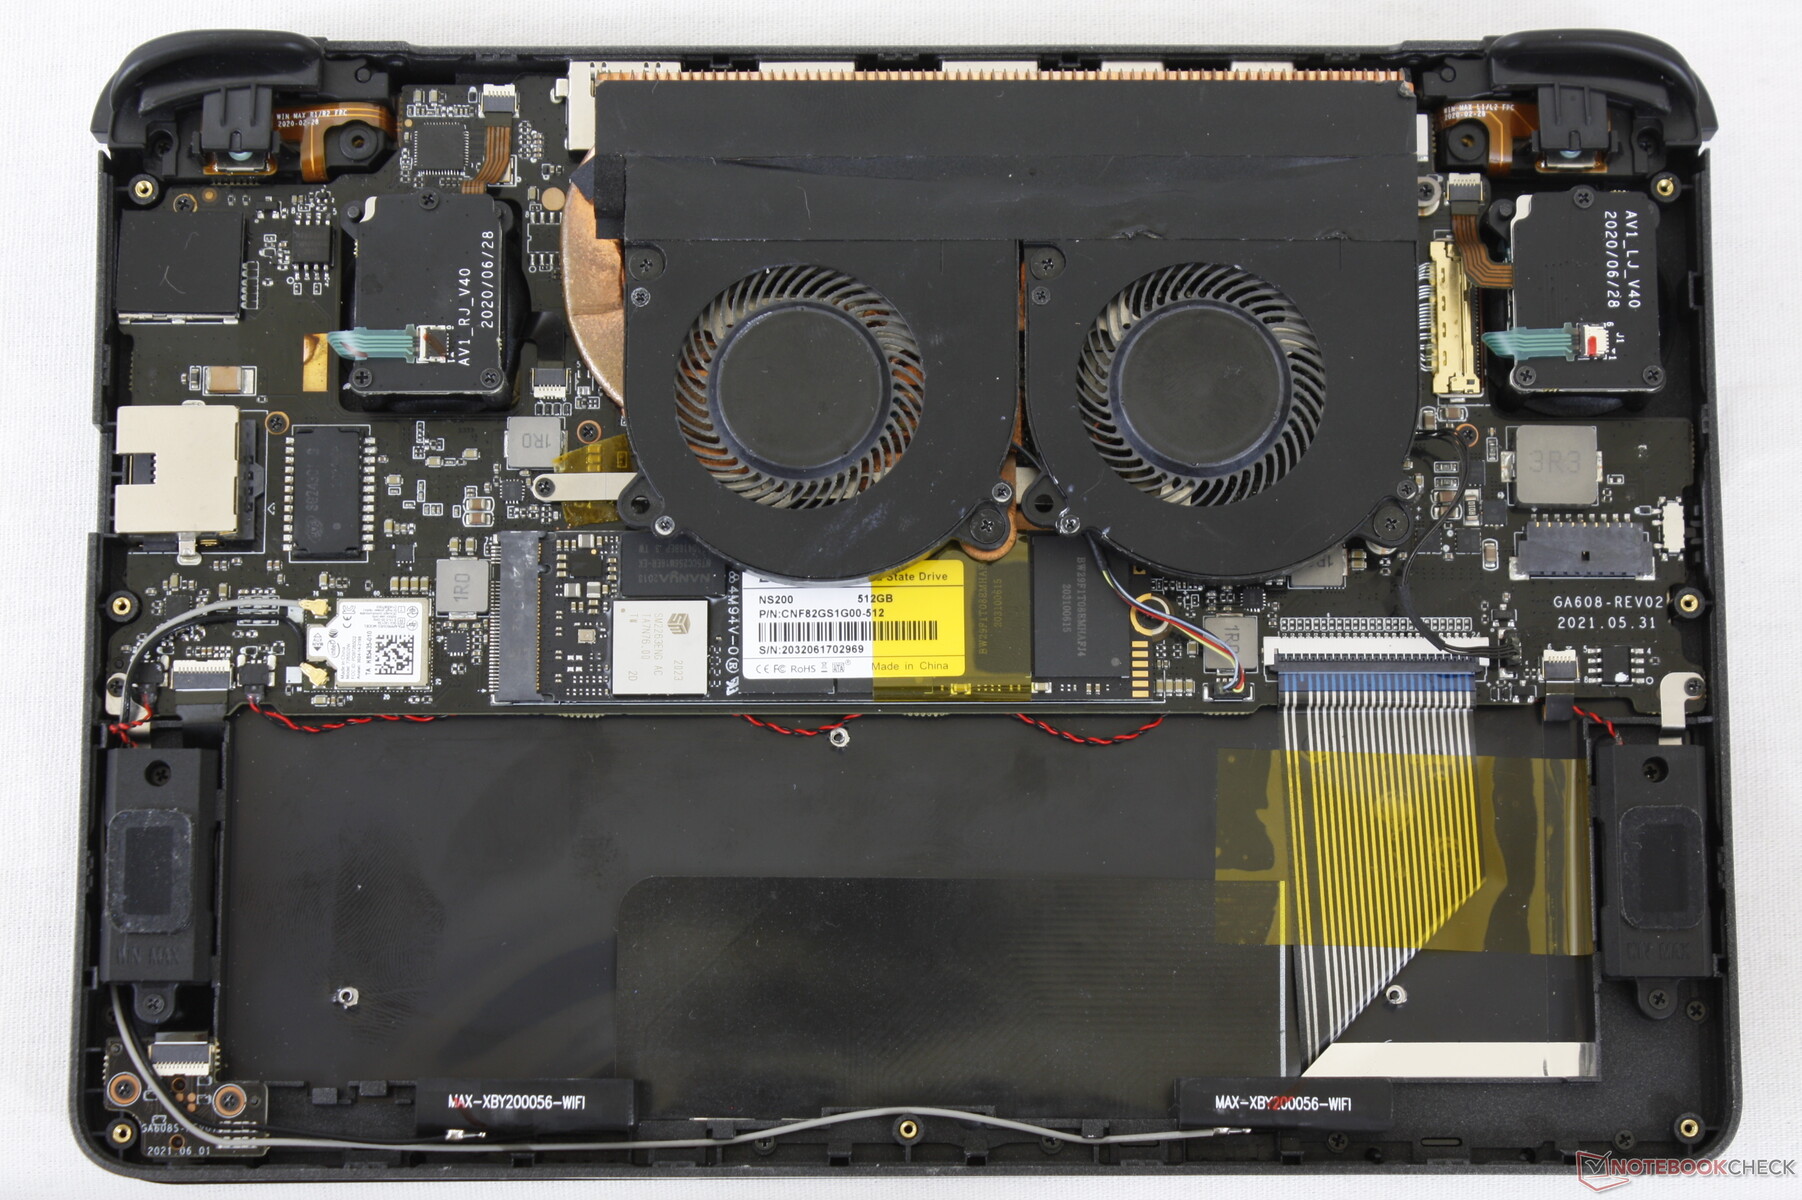
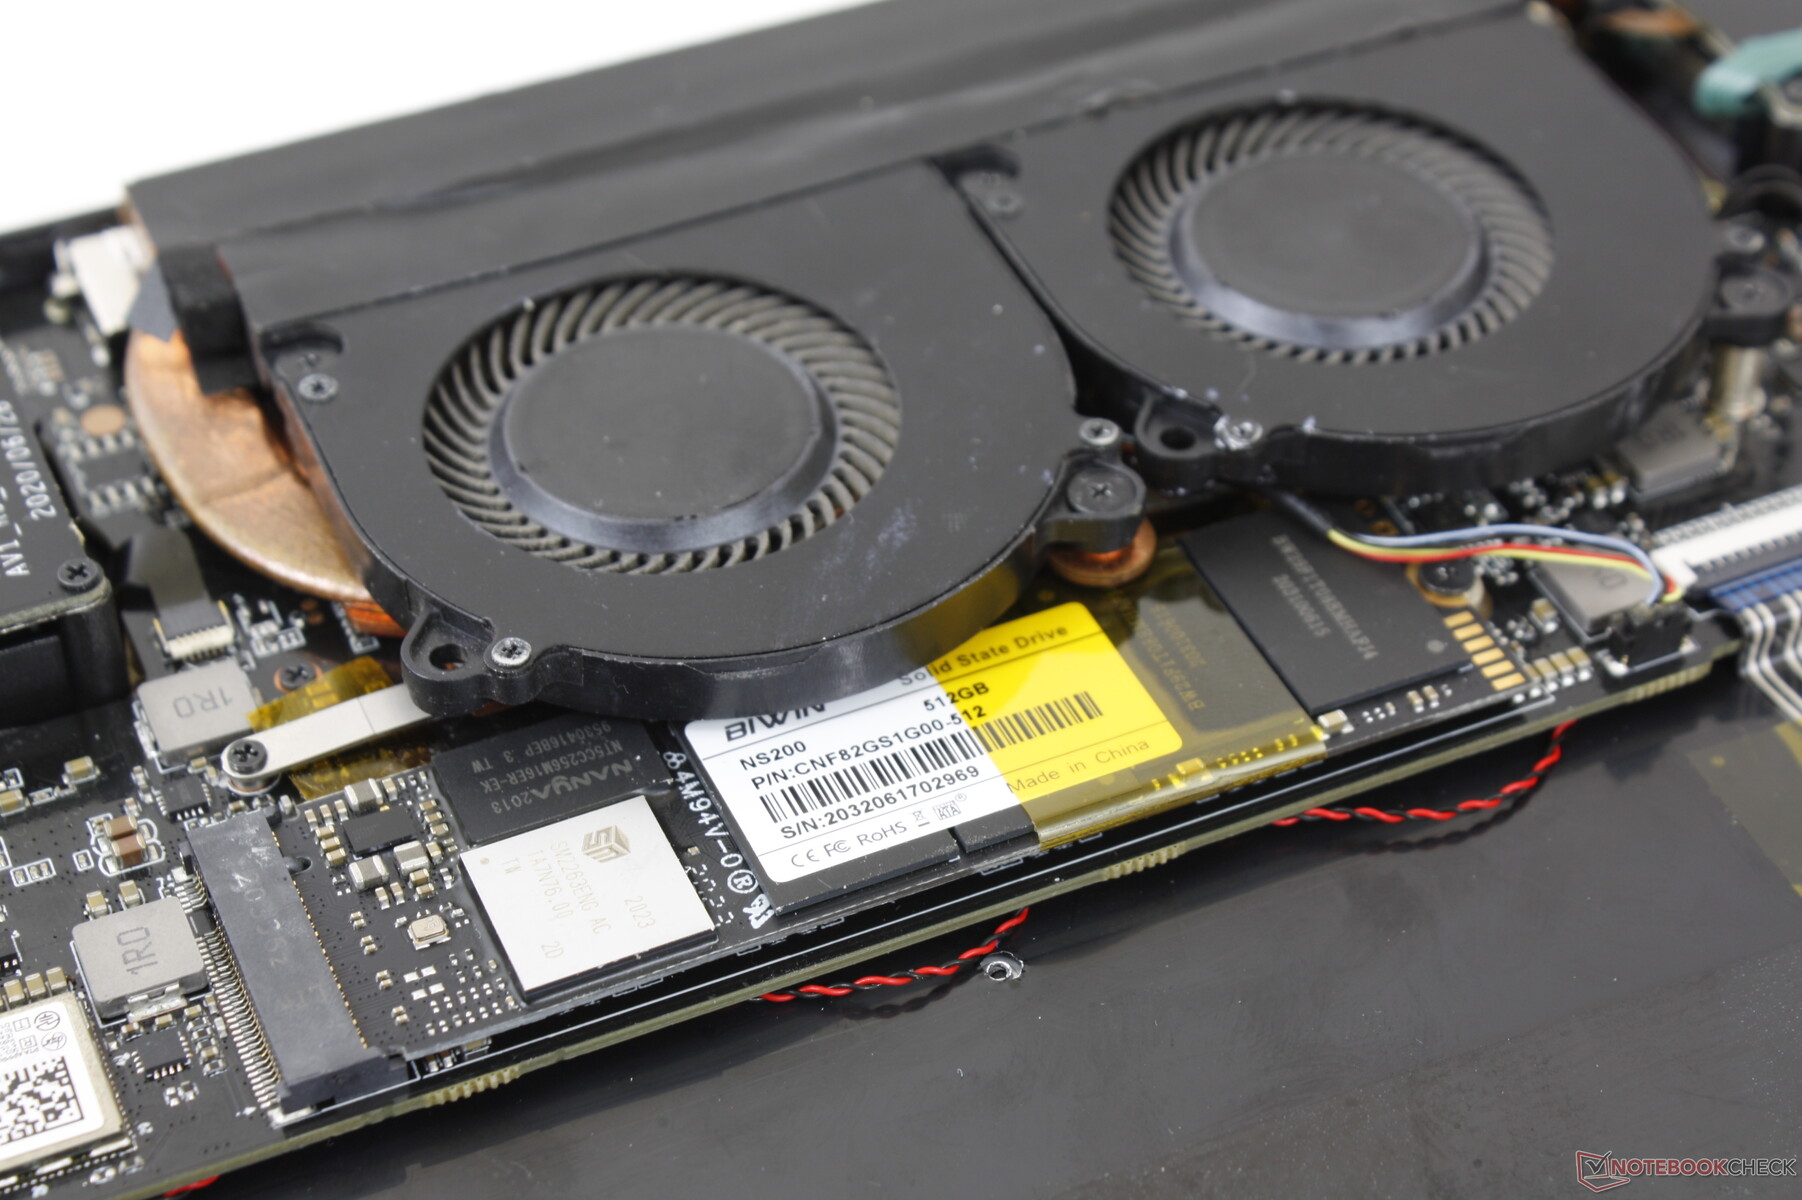
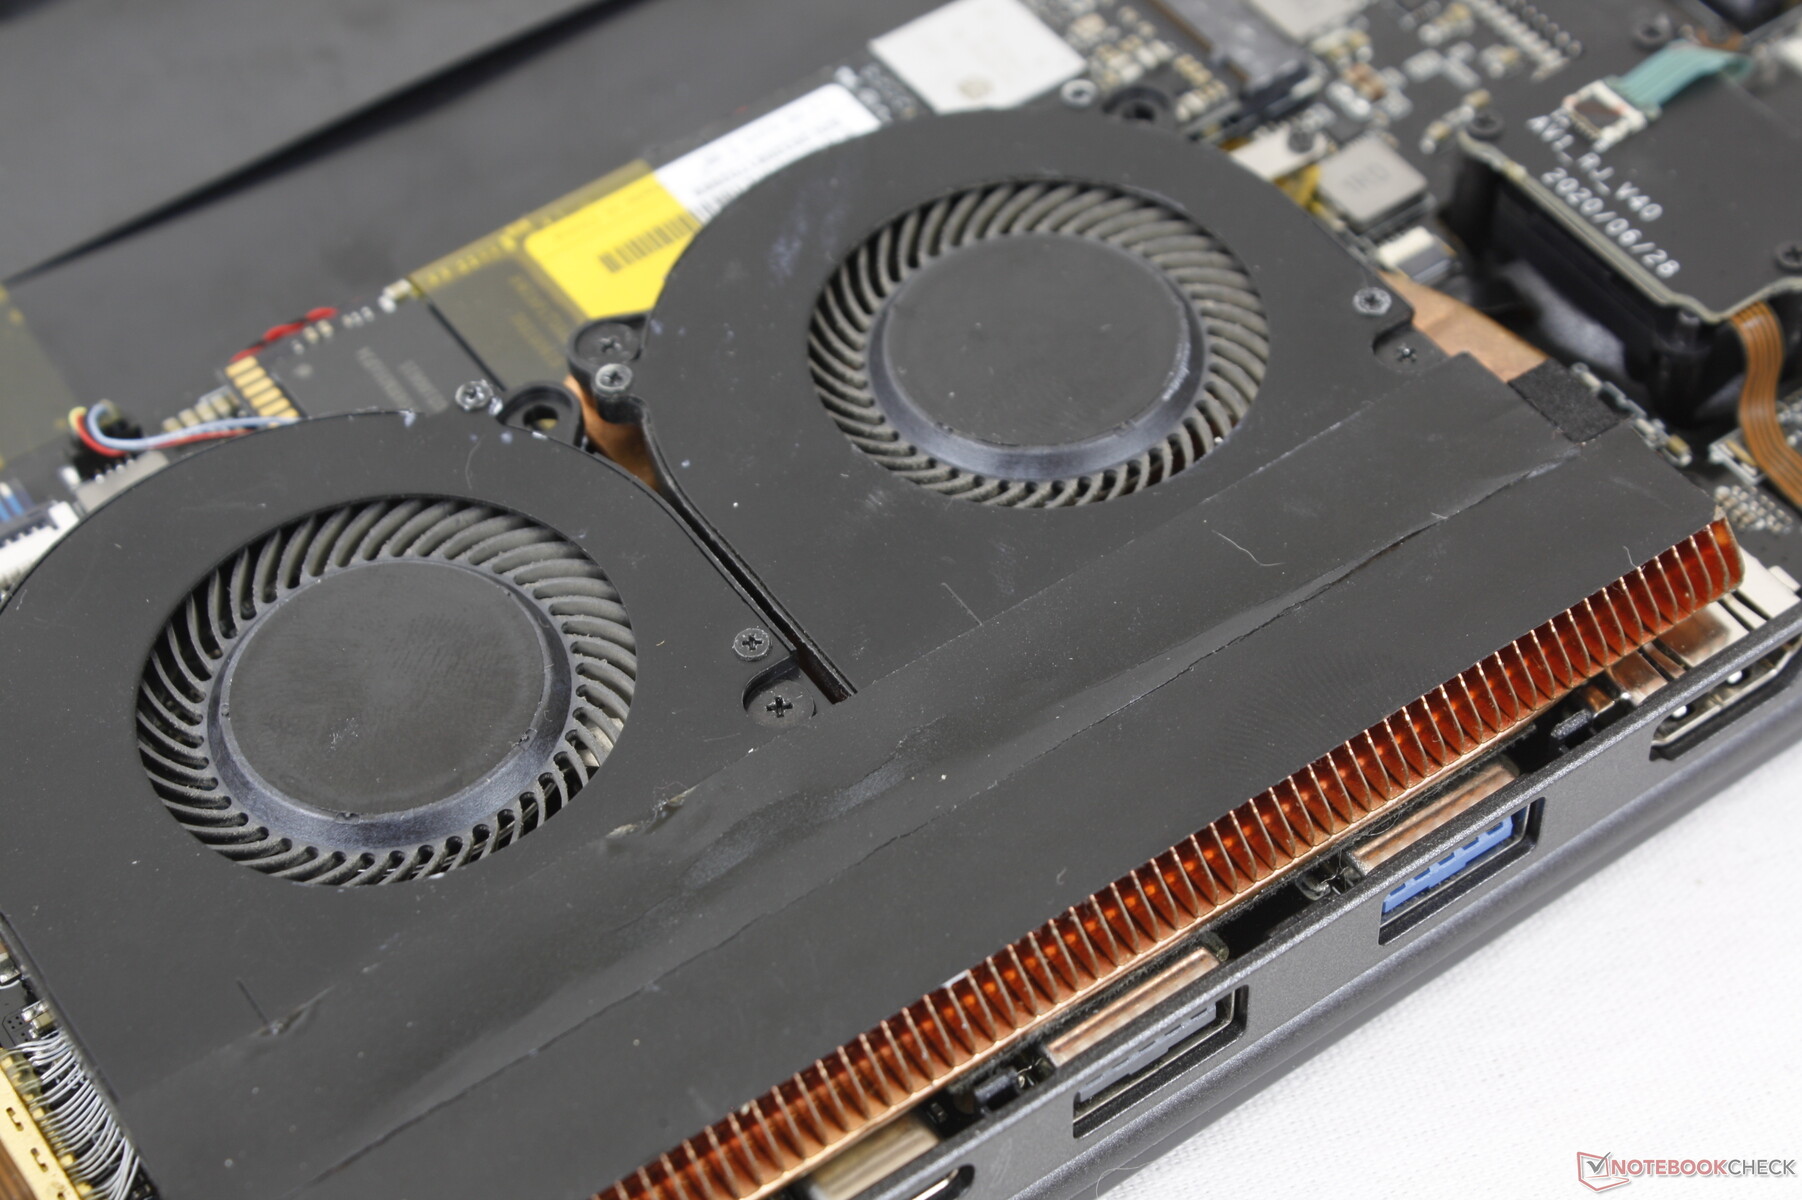
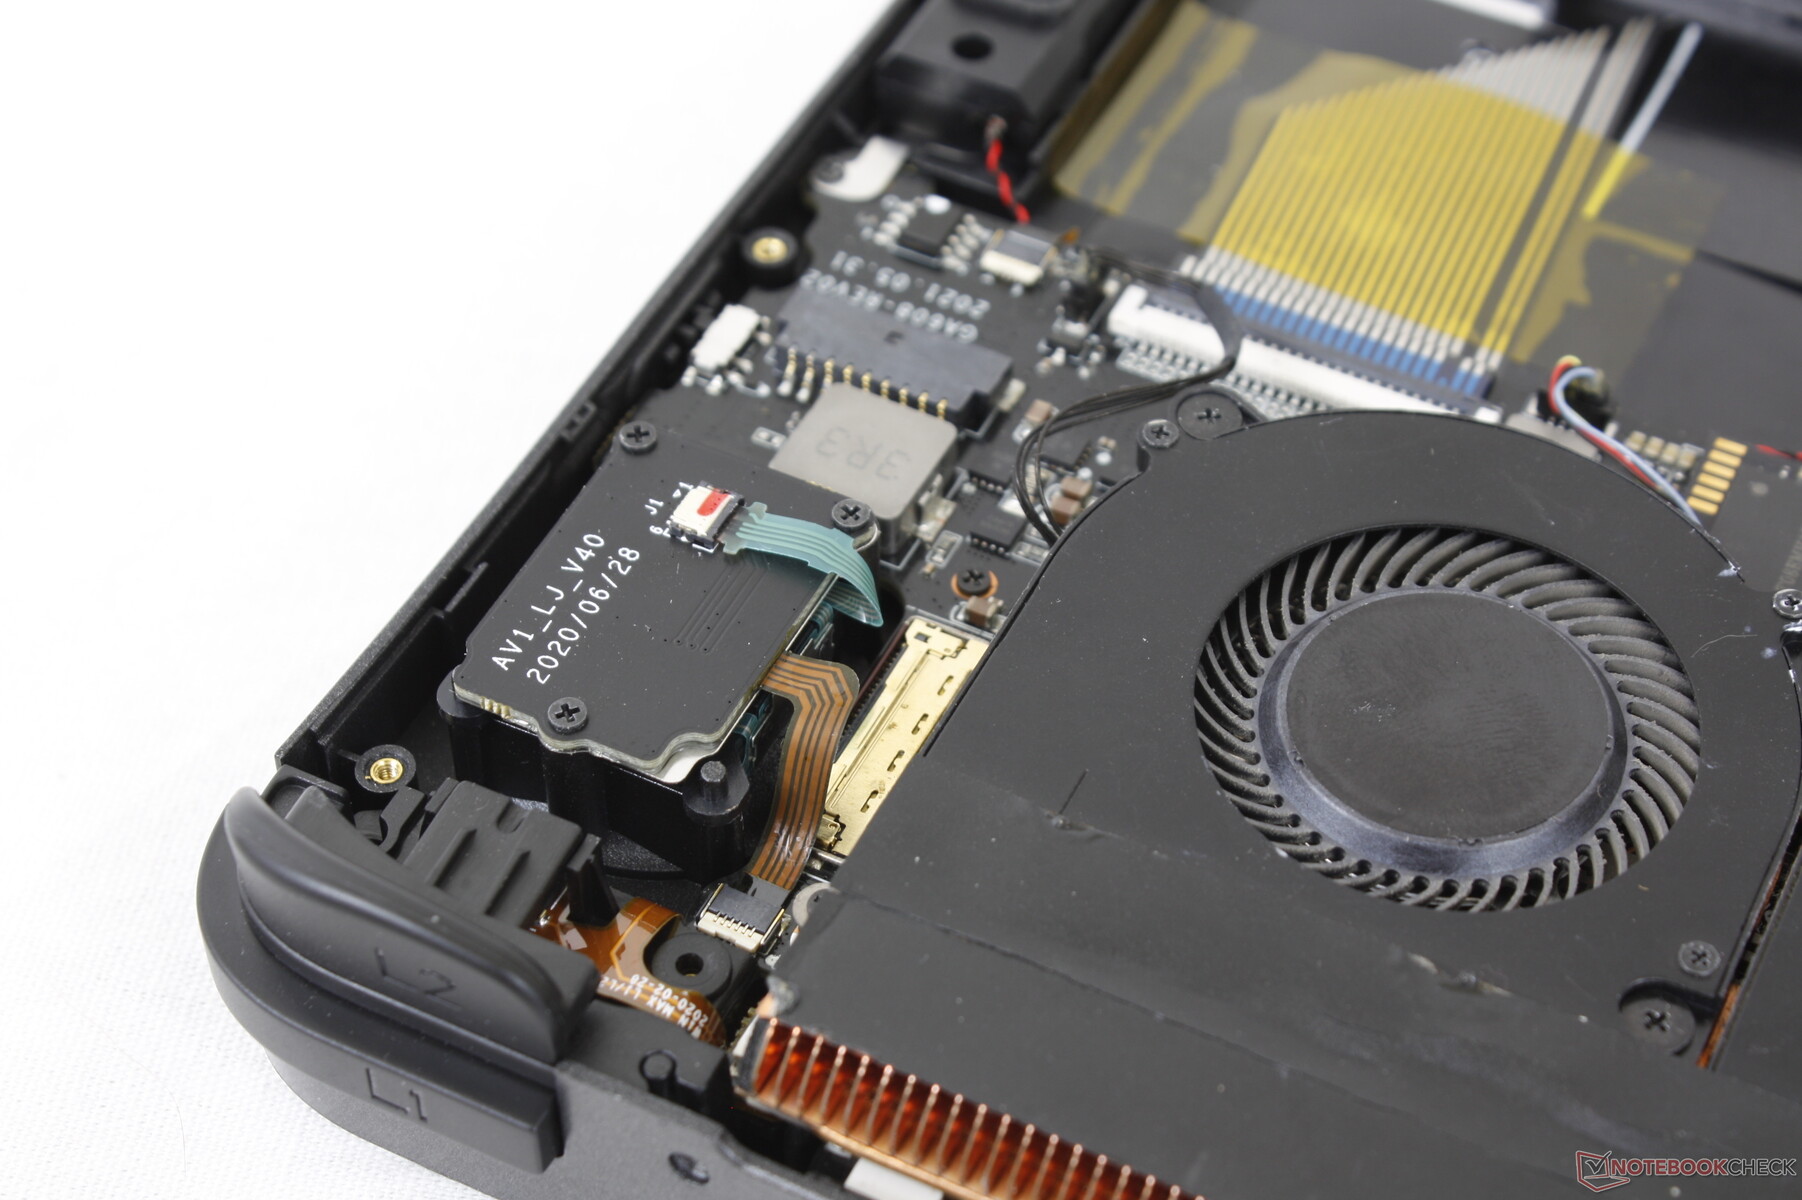
维护
底部面板需要一把超小的飞利浦螺丝刀来拆卸。内存和WLAN都是焊接的,这意味着用户只能在需要时升级SSD或更换电池。
配件和保修
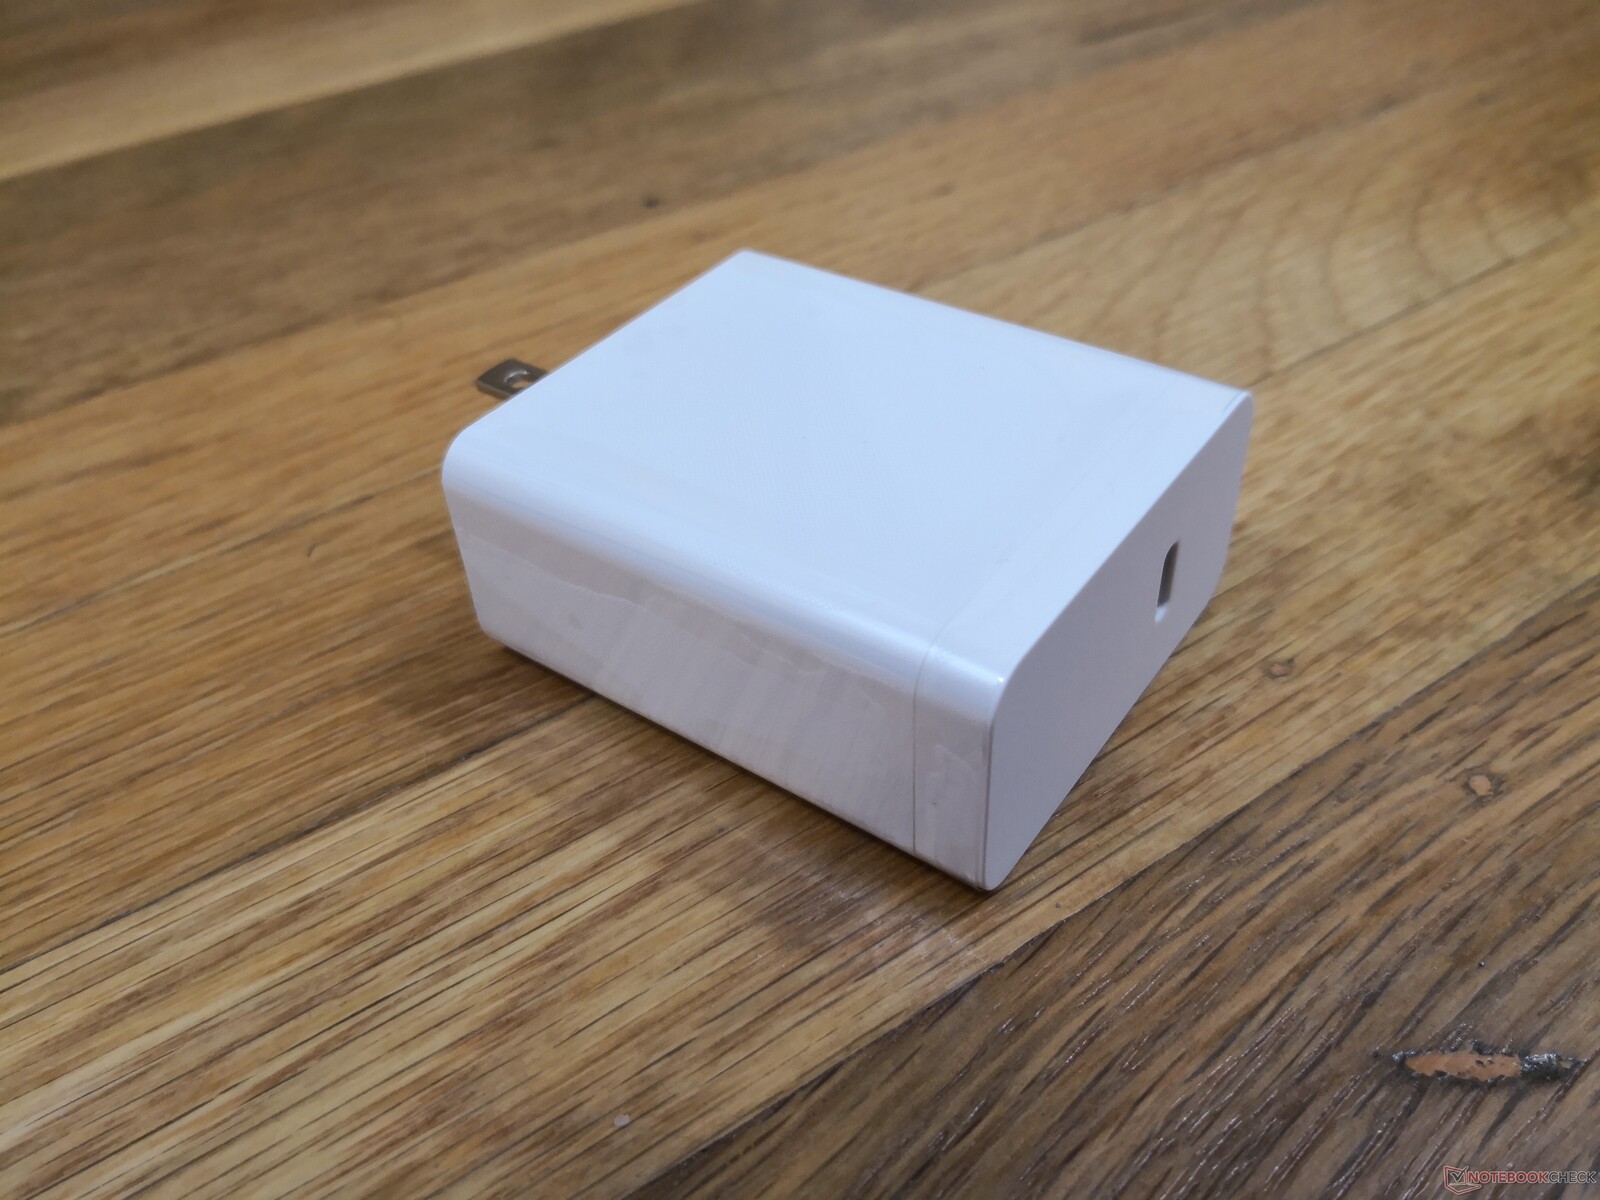
除了USB-C交流适配器之外,盒子里没有任何额外的东西。标准的一年有限制造商保修适用。对于海外买家来说,申请保修可能需要漫长的等待。
输入设备
键盘
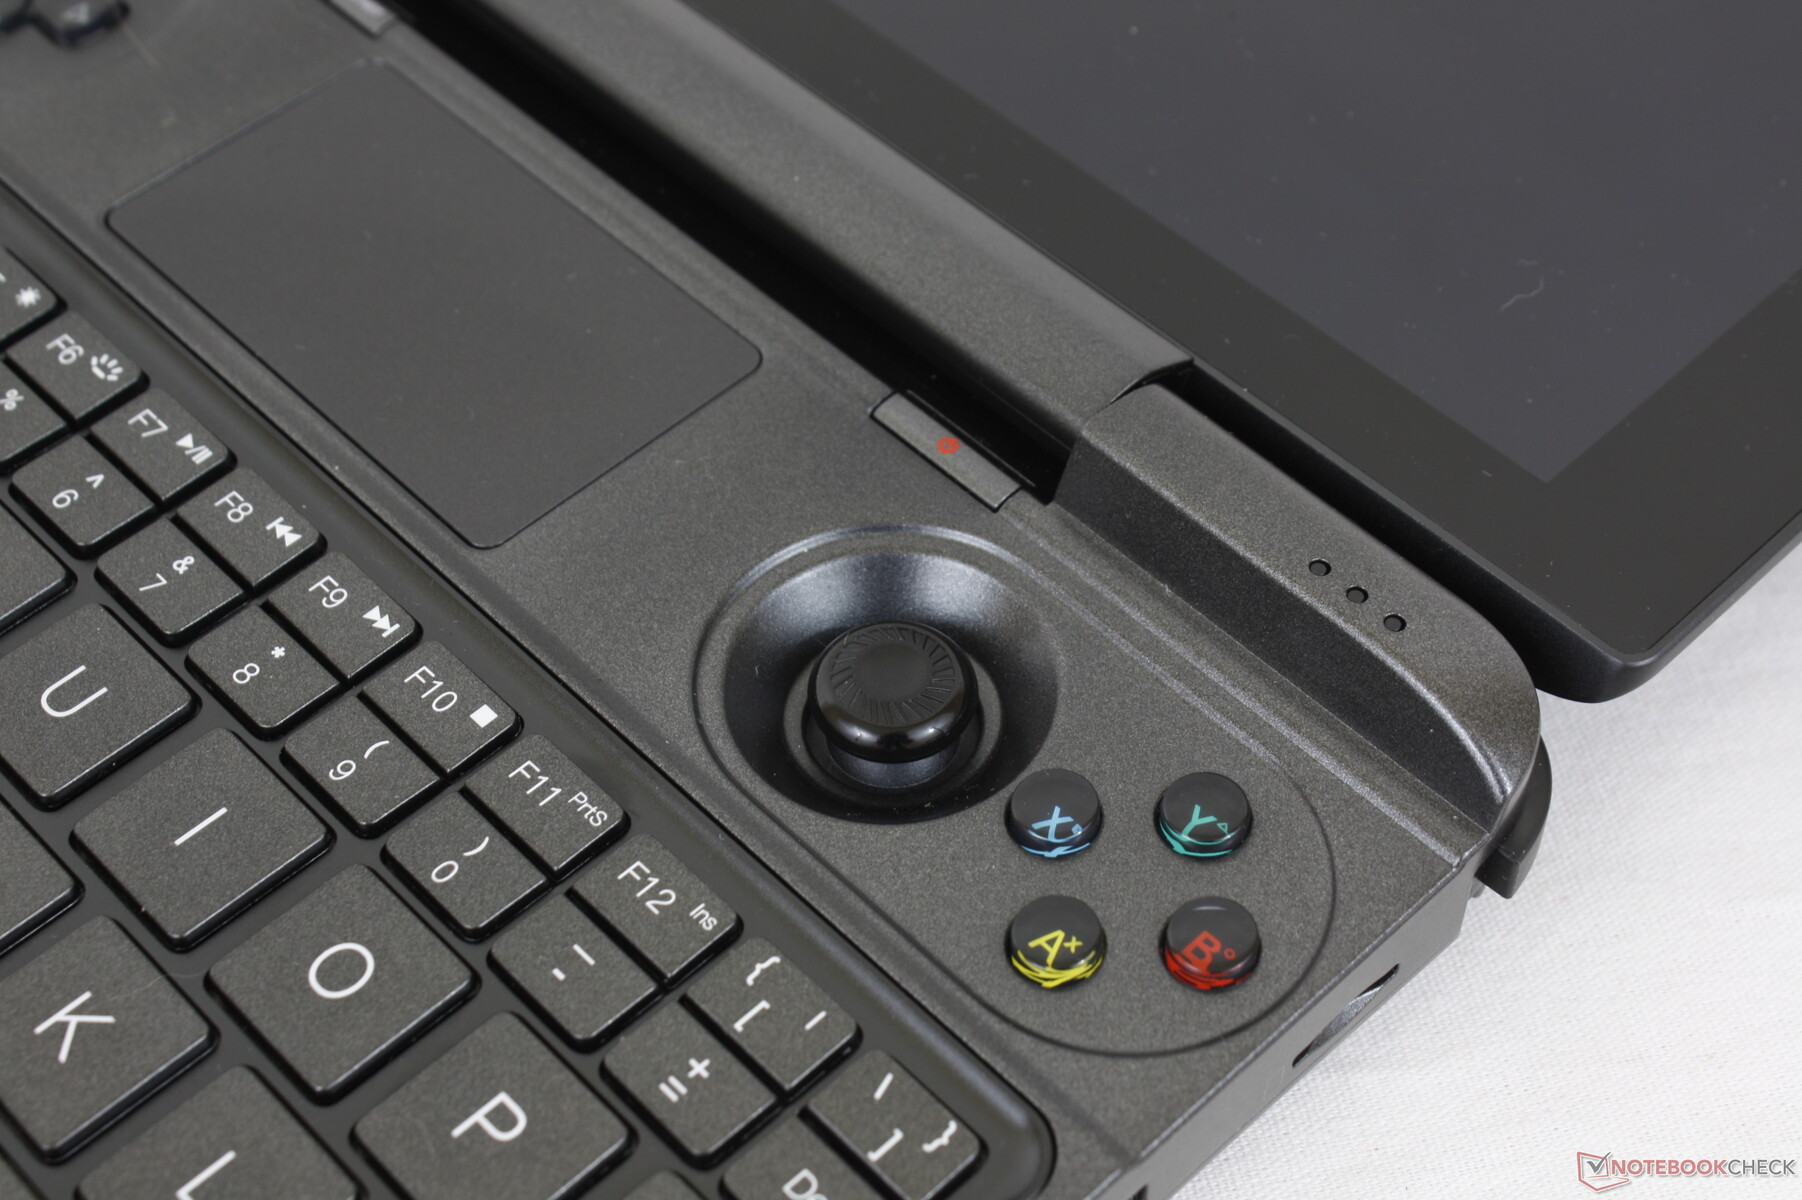
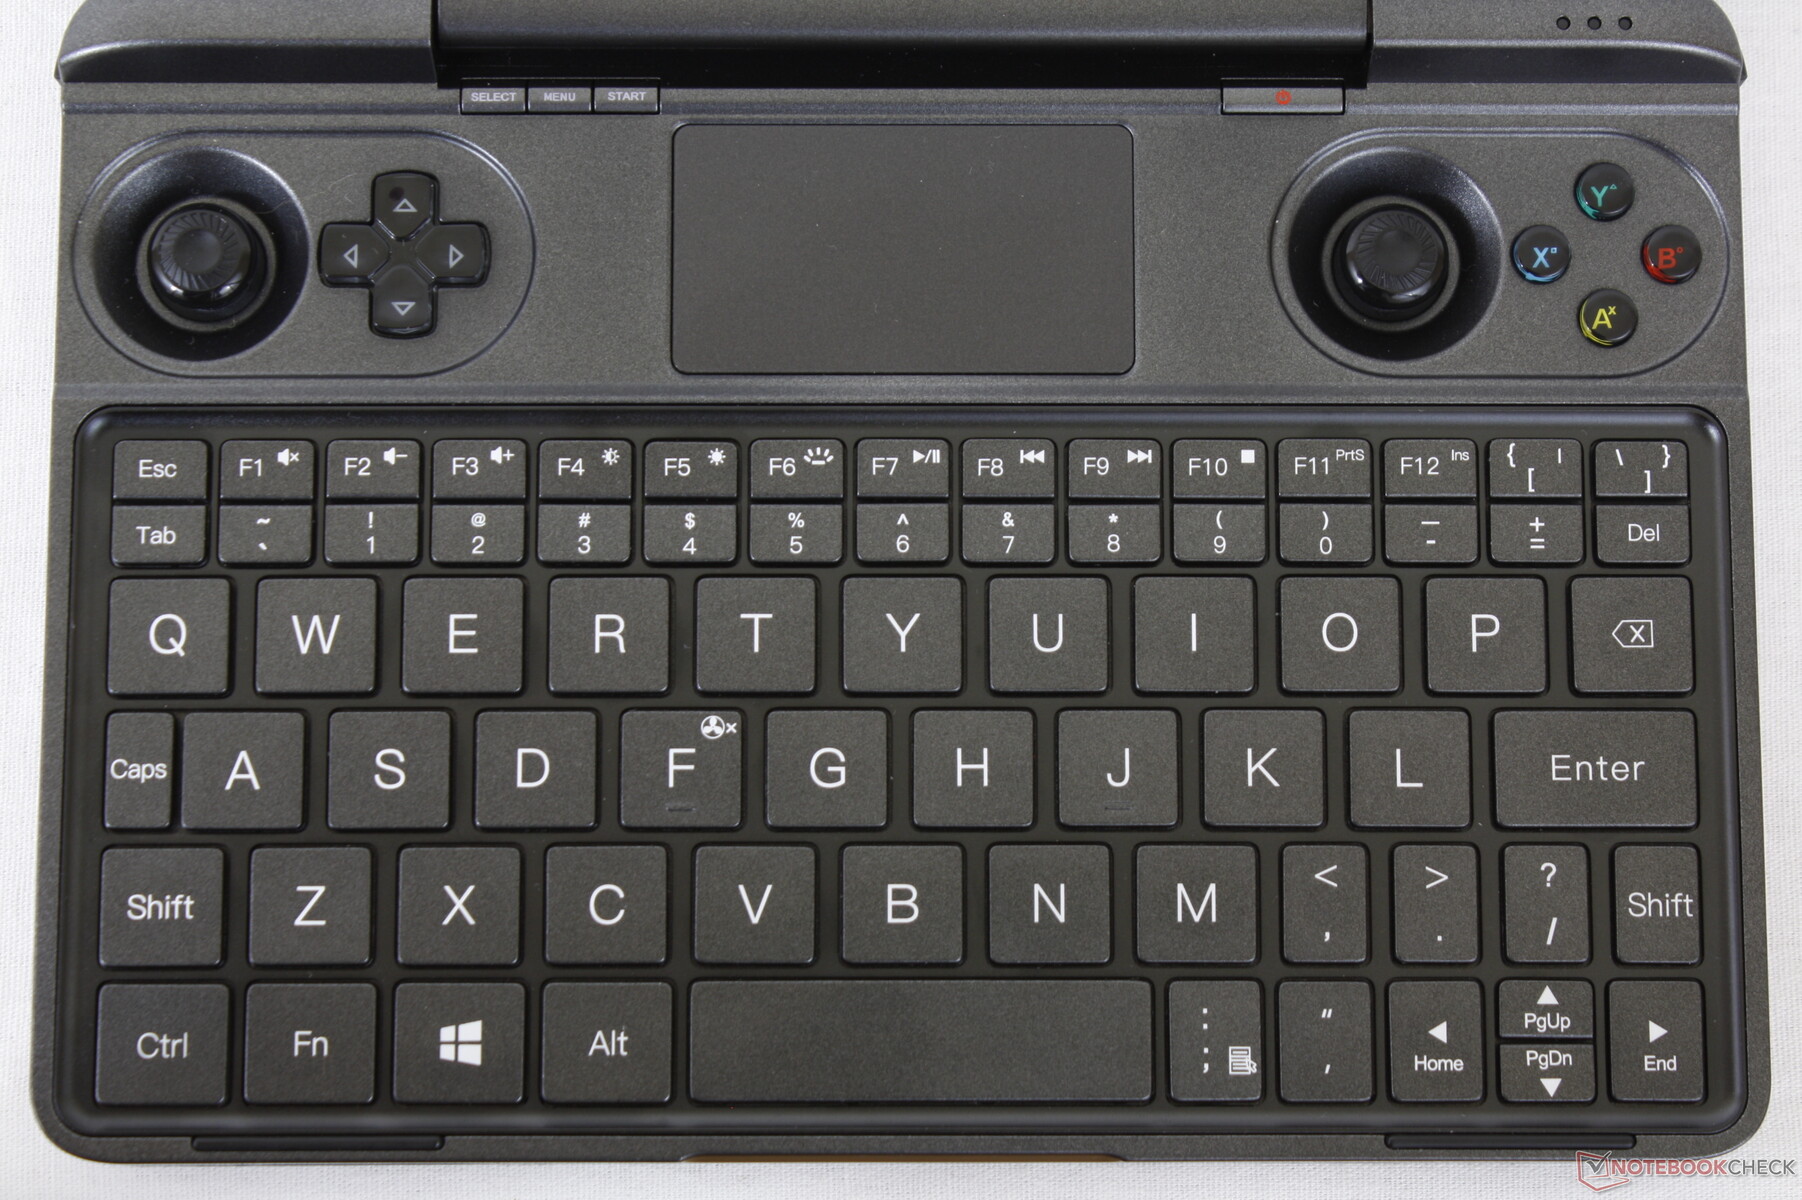
我们不能指责背光键盘的拥挤,因为对于其8英寸的外形因素来说,这是可以预期的。如果你打算经常在Win Max上打字,肯定需要一些时间来适应这种奇怪的布局和小键。
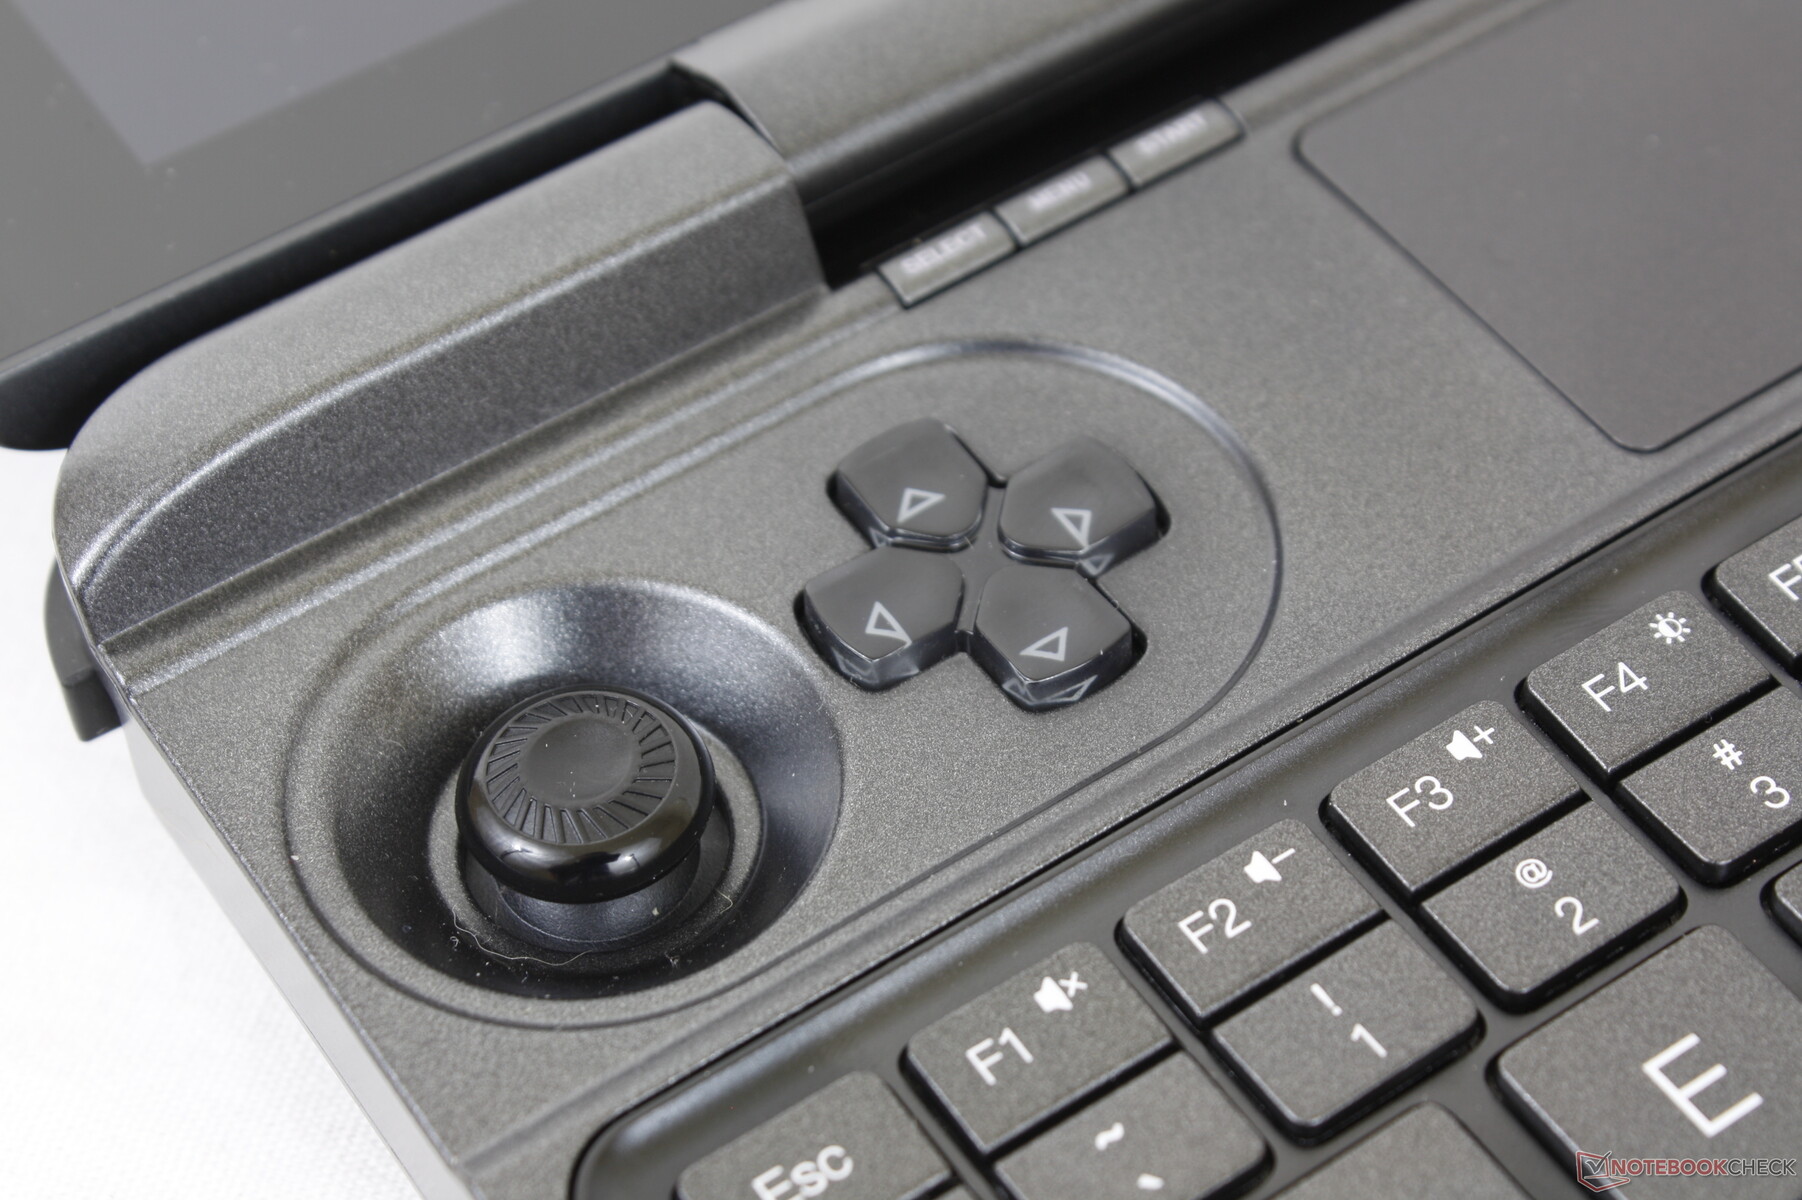
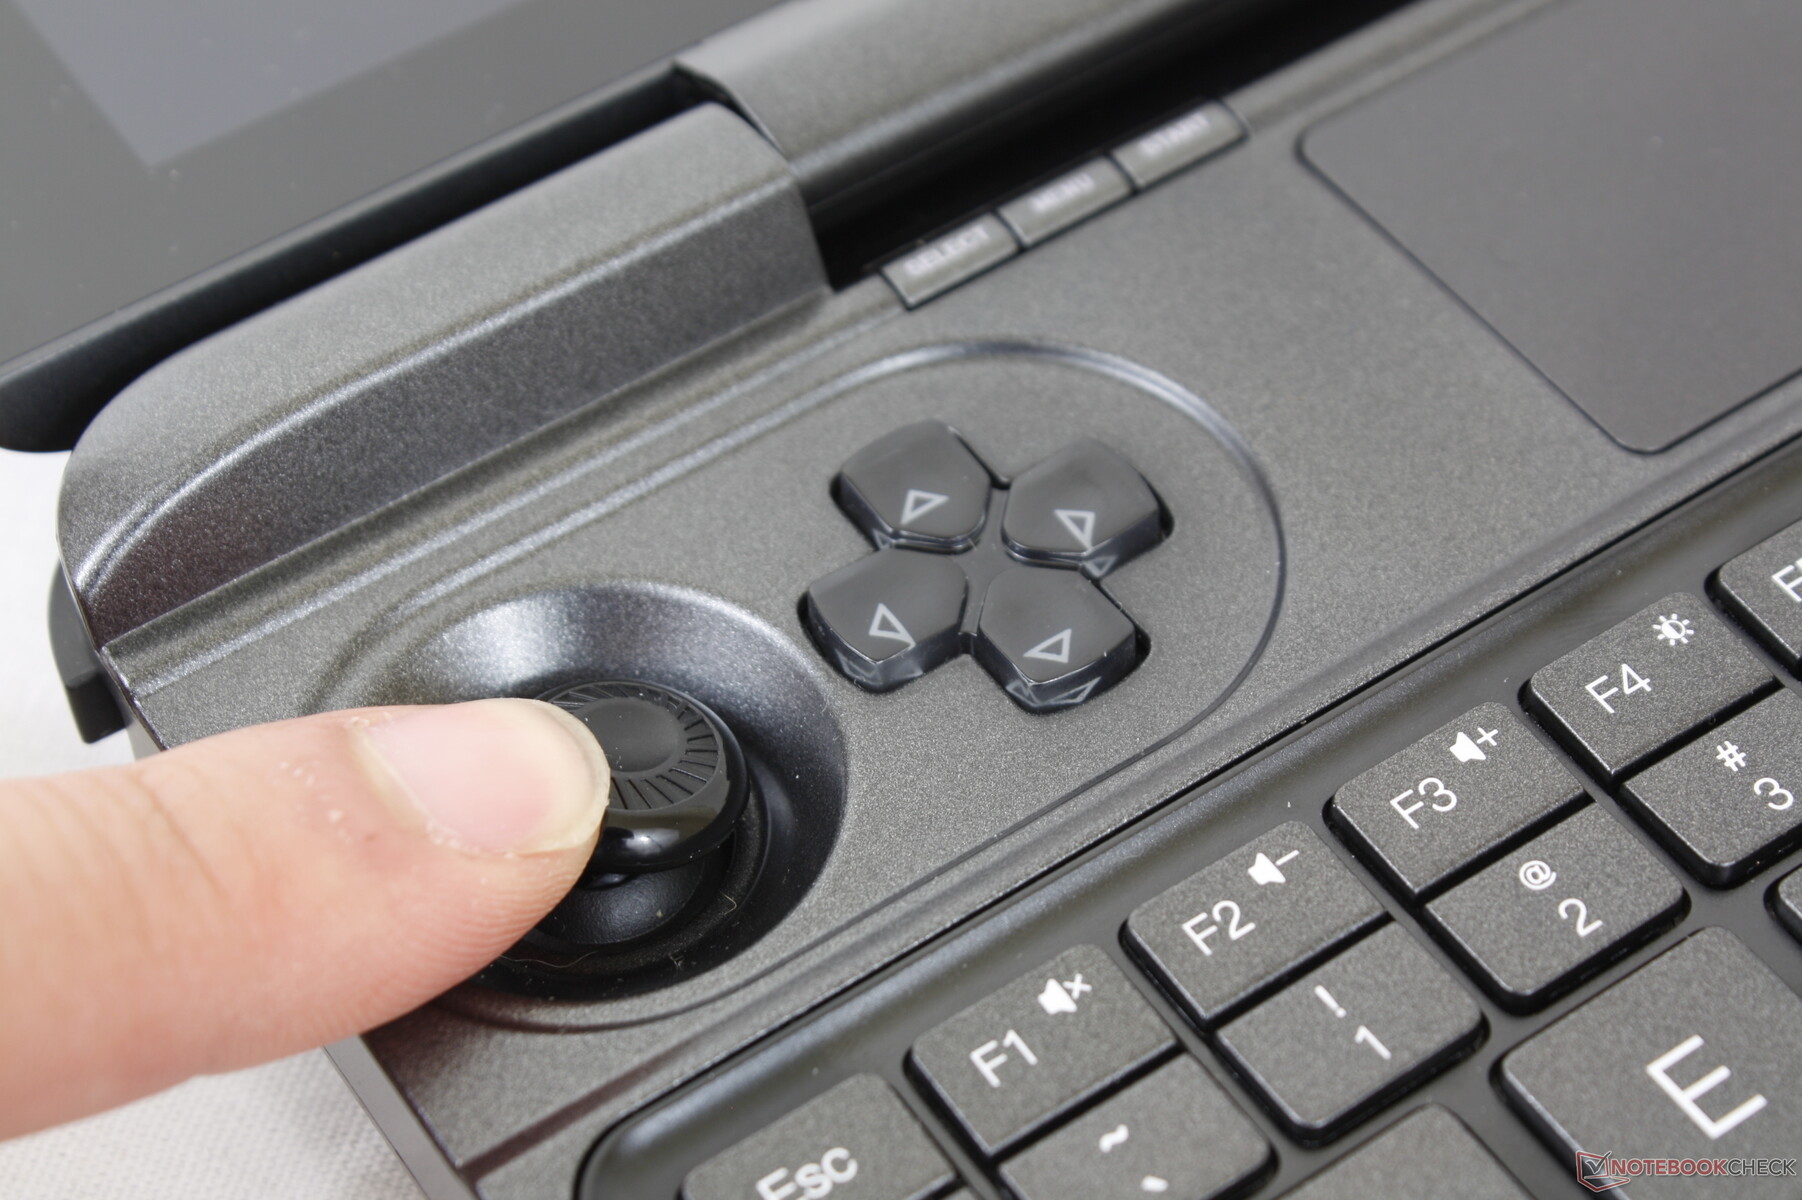
控制器的按钮使用起来不是很舒服。特别是肩部按钮的行程和反馈,分别太窄和太软。此外,操纵杆的运动范围非常窄,甚至比任天堂的Joy Cons还要小。因此,精确的动作在这里很难完成,特别是对于拇指较大的用户。
涡轮风扇模式可以用Fn+F键来切换。然而,屏幕上没有显示涡轮模式是否激活的指示灯,这意味着有时很难知道在任何特定时刻的风扇模式。
触摸板
支持Precision 的小型点击板(5.8 x 3.3厘米)具有出色的牵引力,在较慢的速度下有一点粘性。不幸的是,光标在缓慢滑行时可能会出现跳动和反应迟钝,这可能会使精确点击变得非常困难。

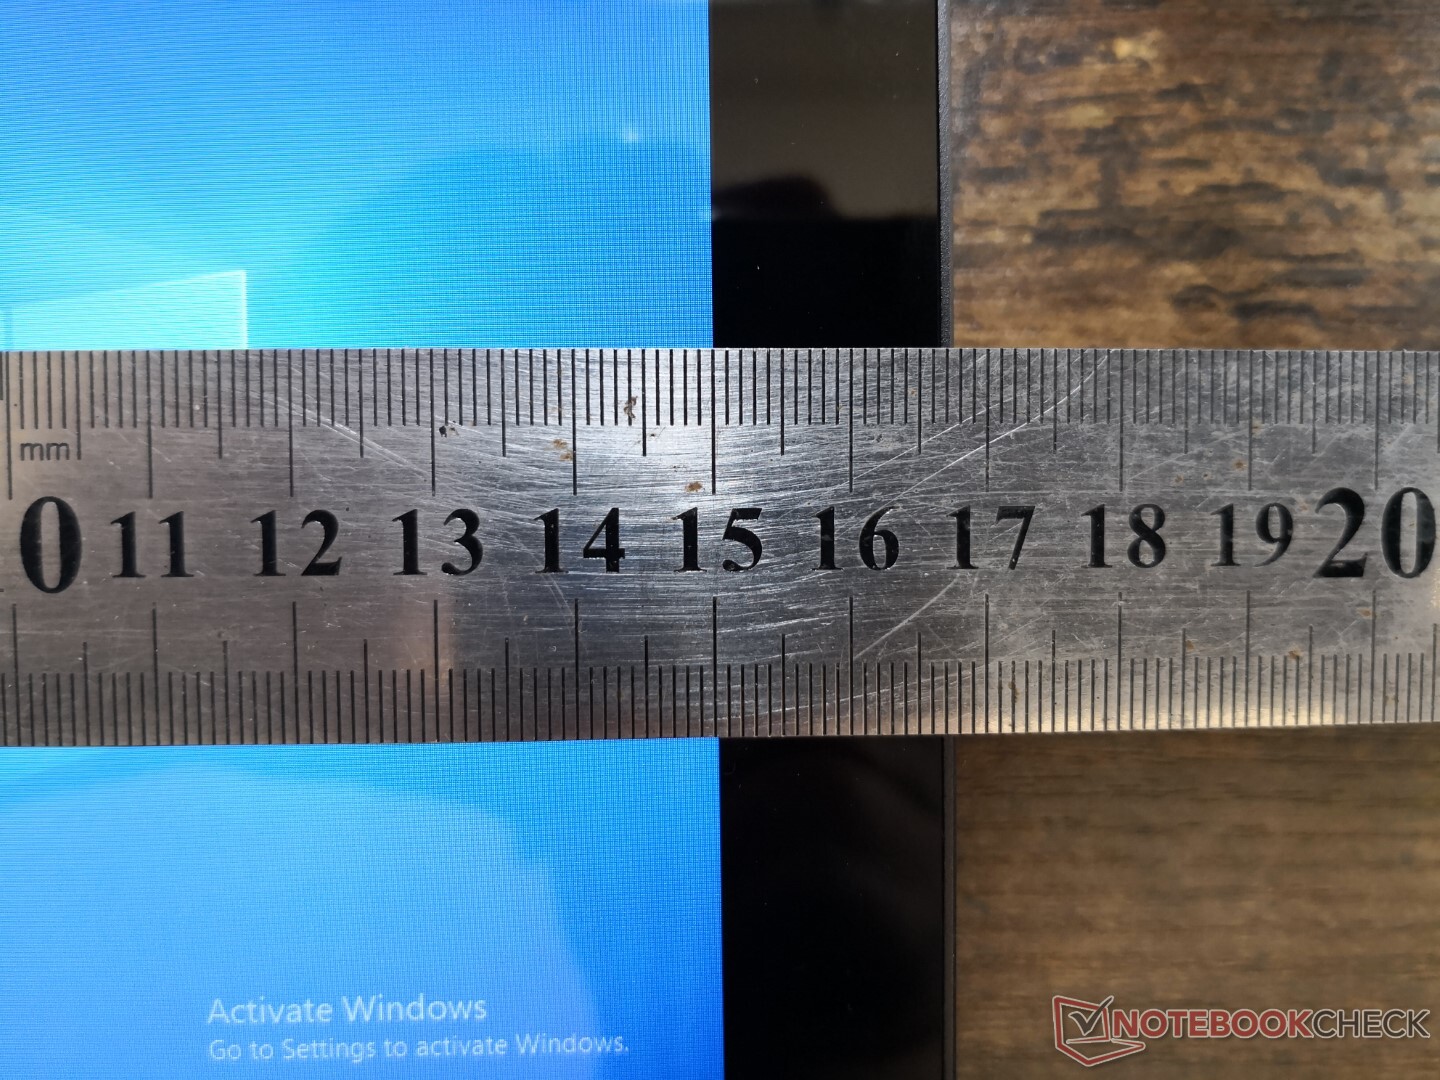
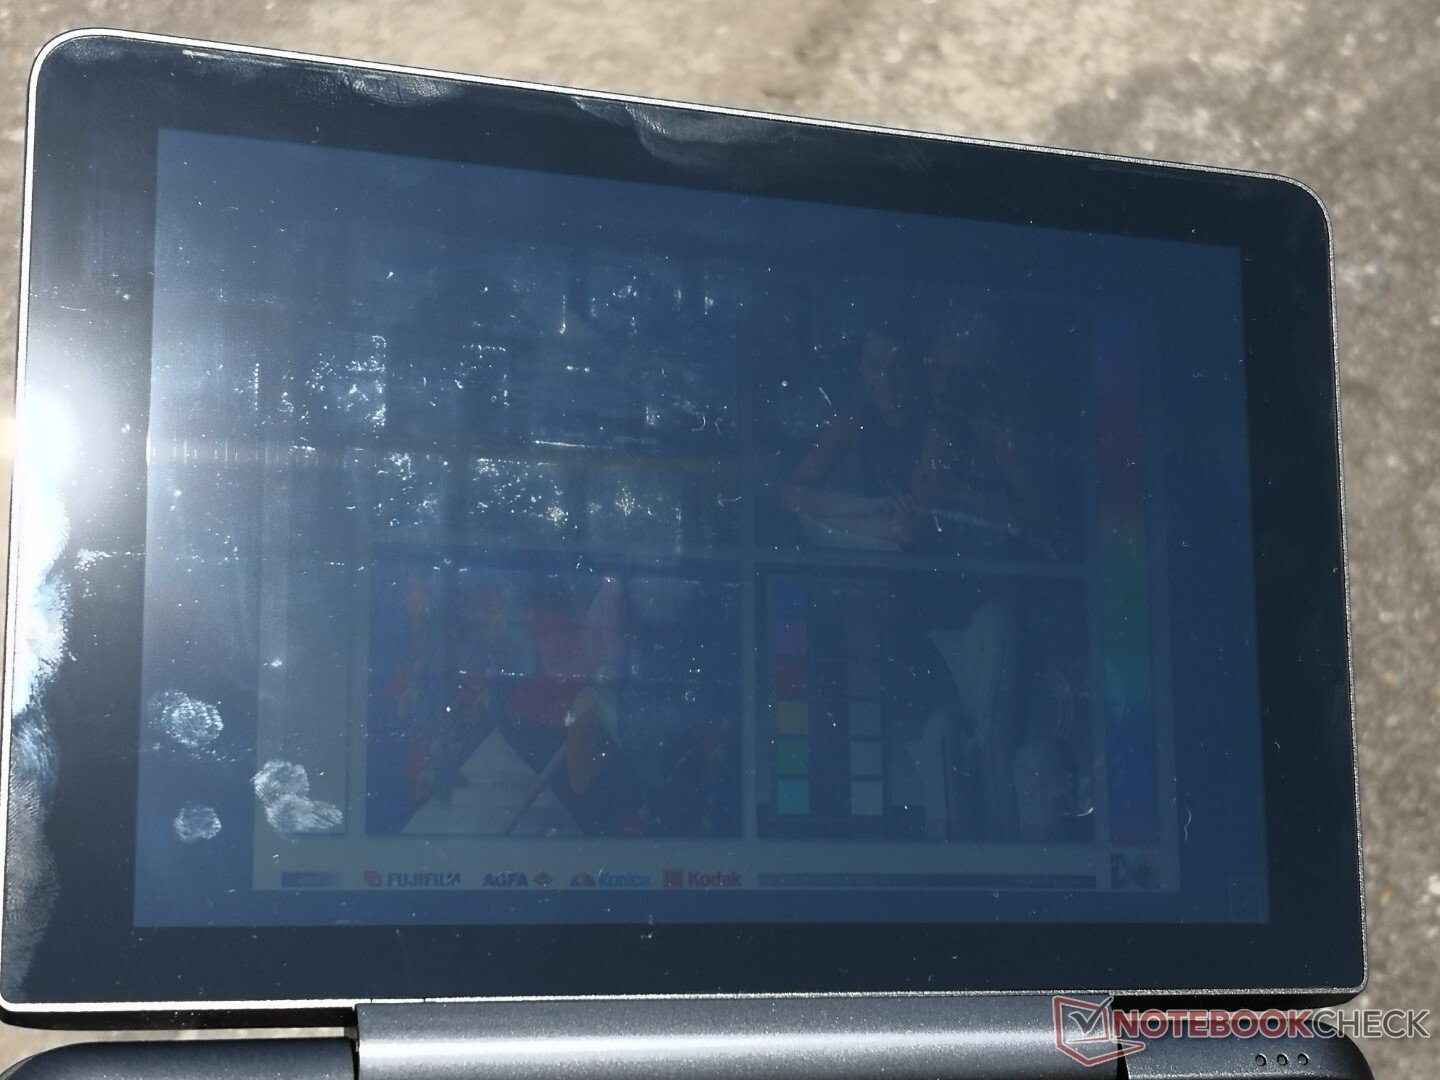
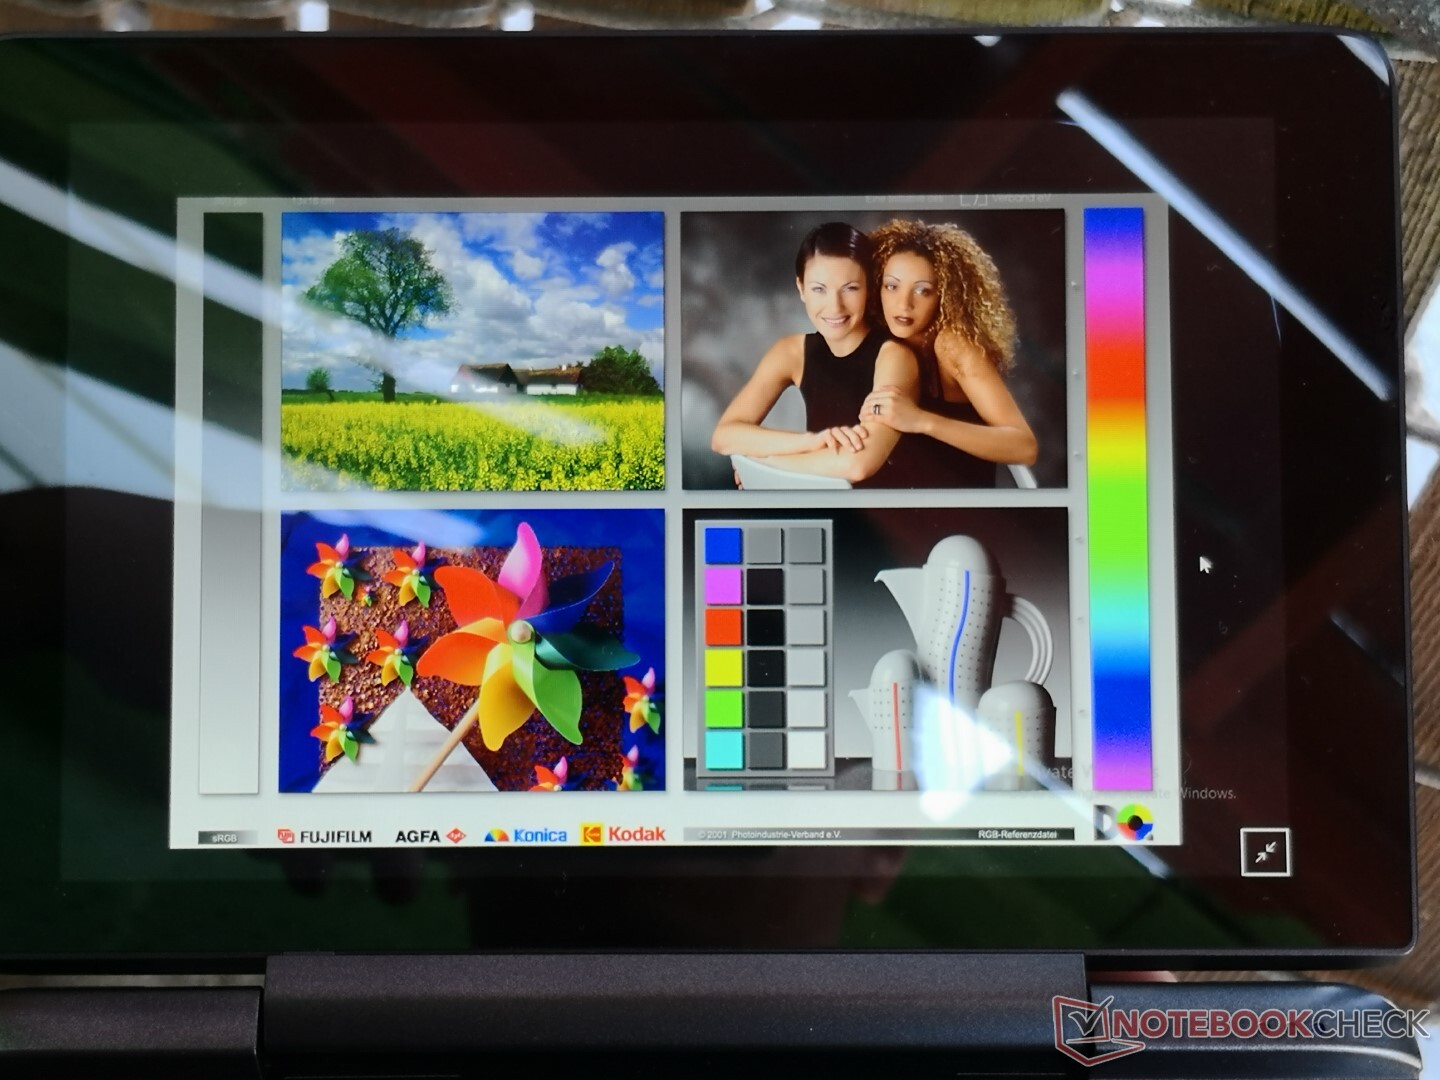
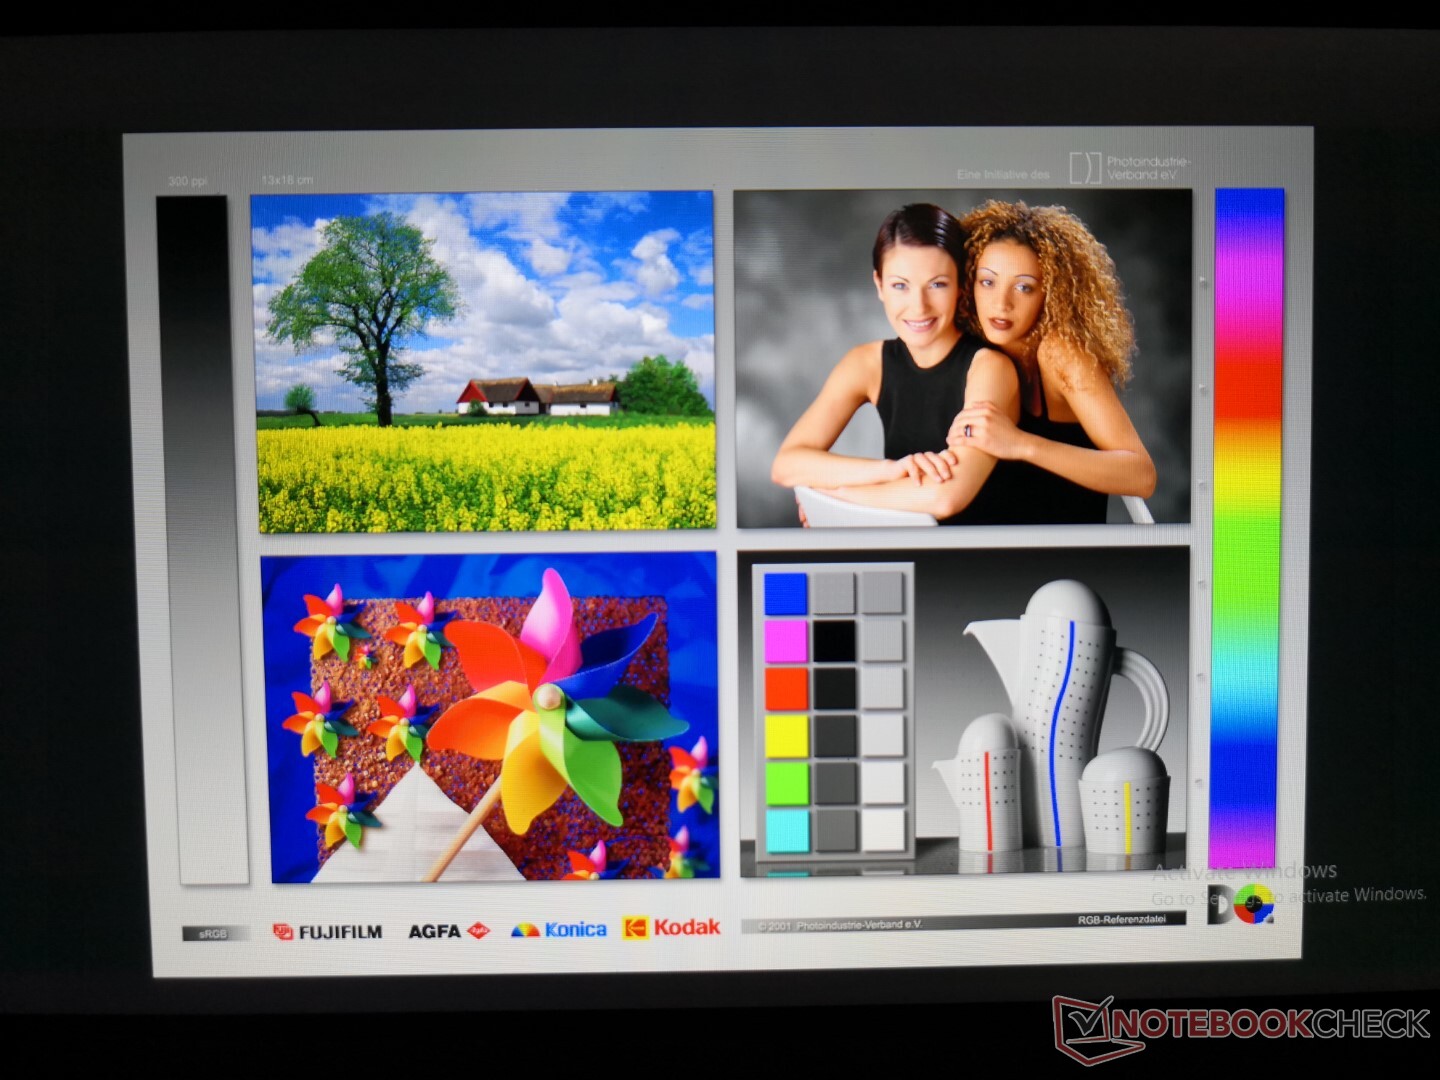
显示
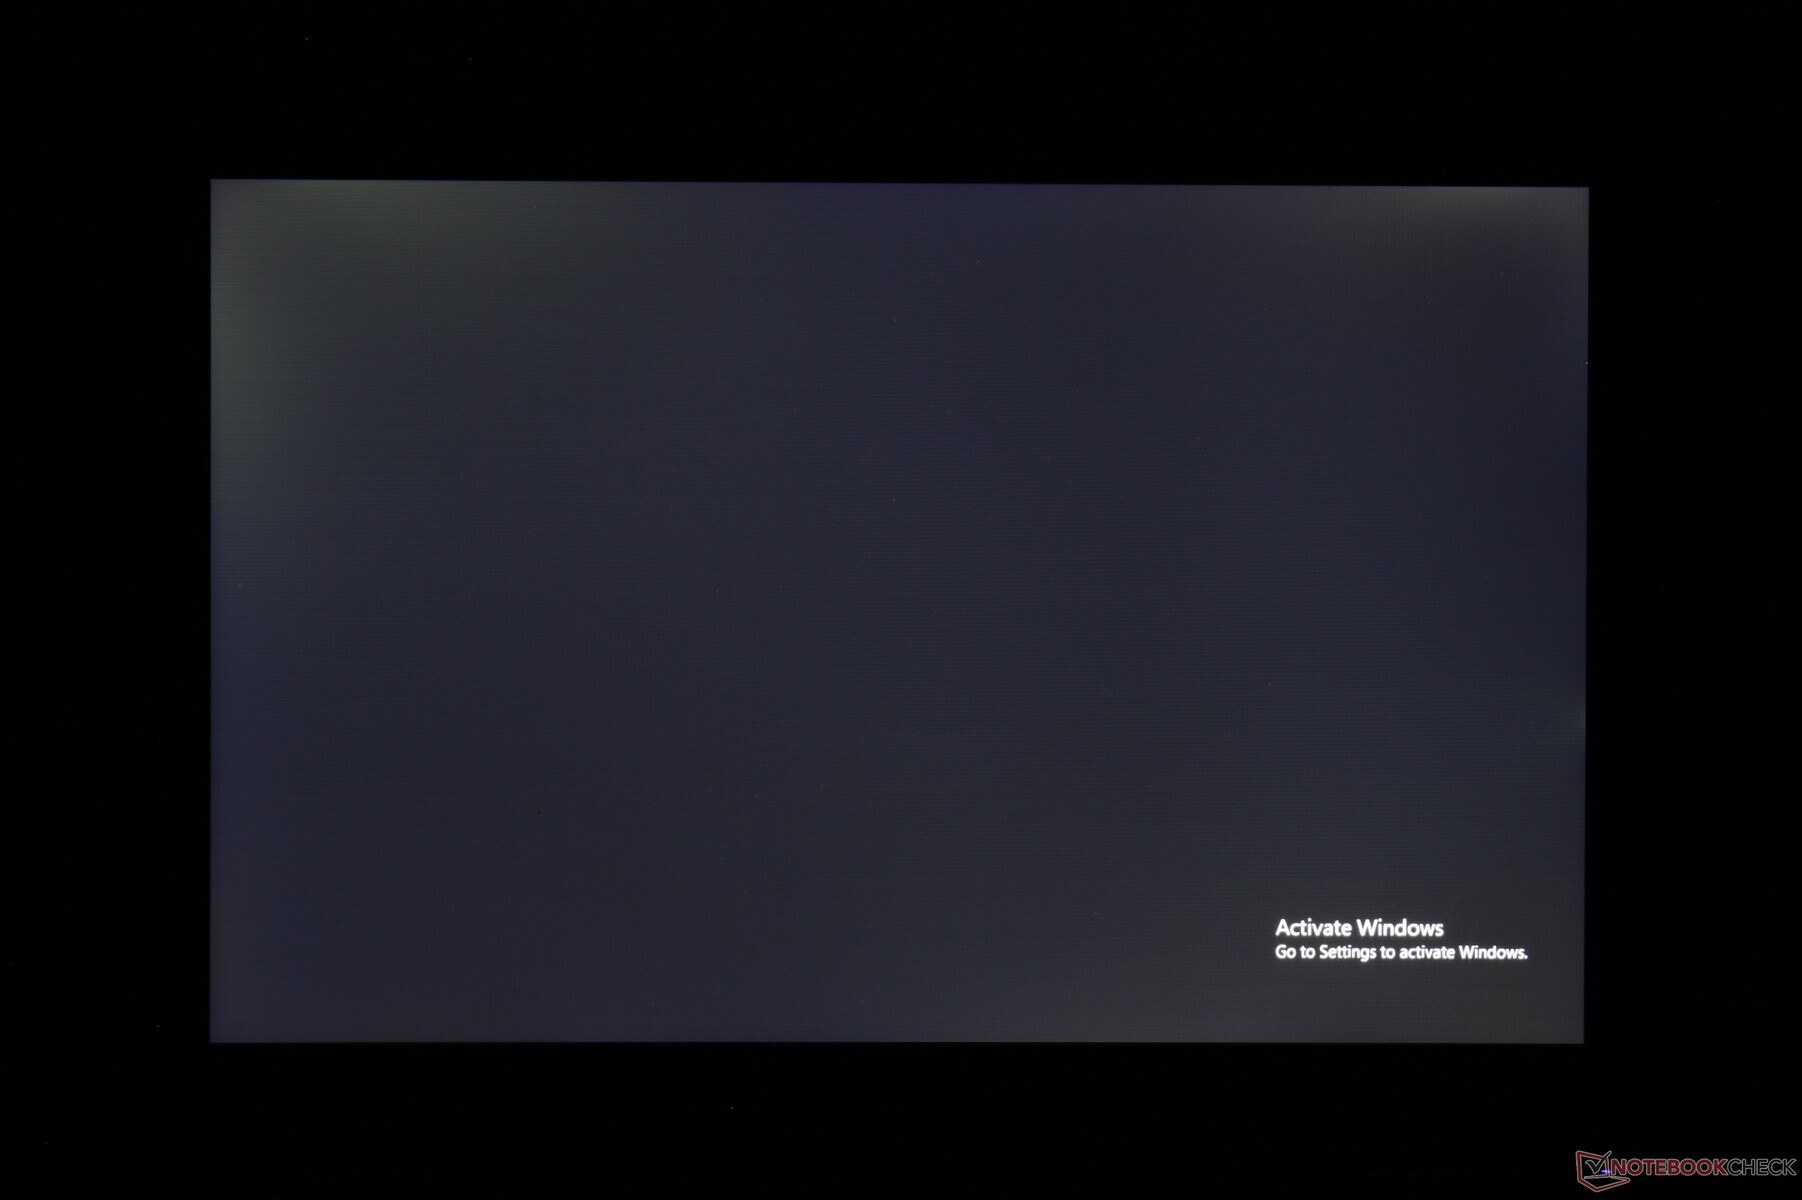
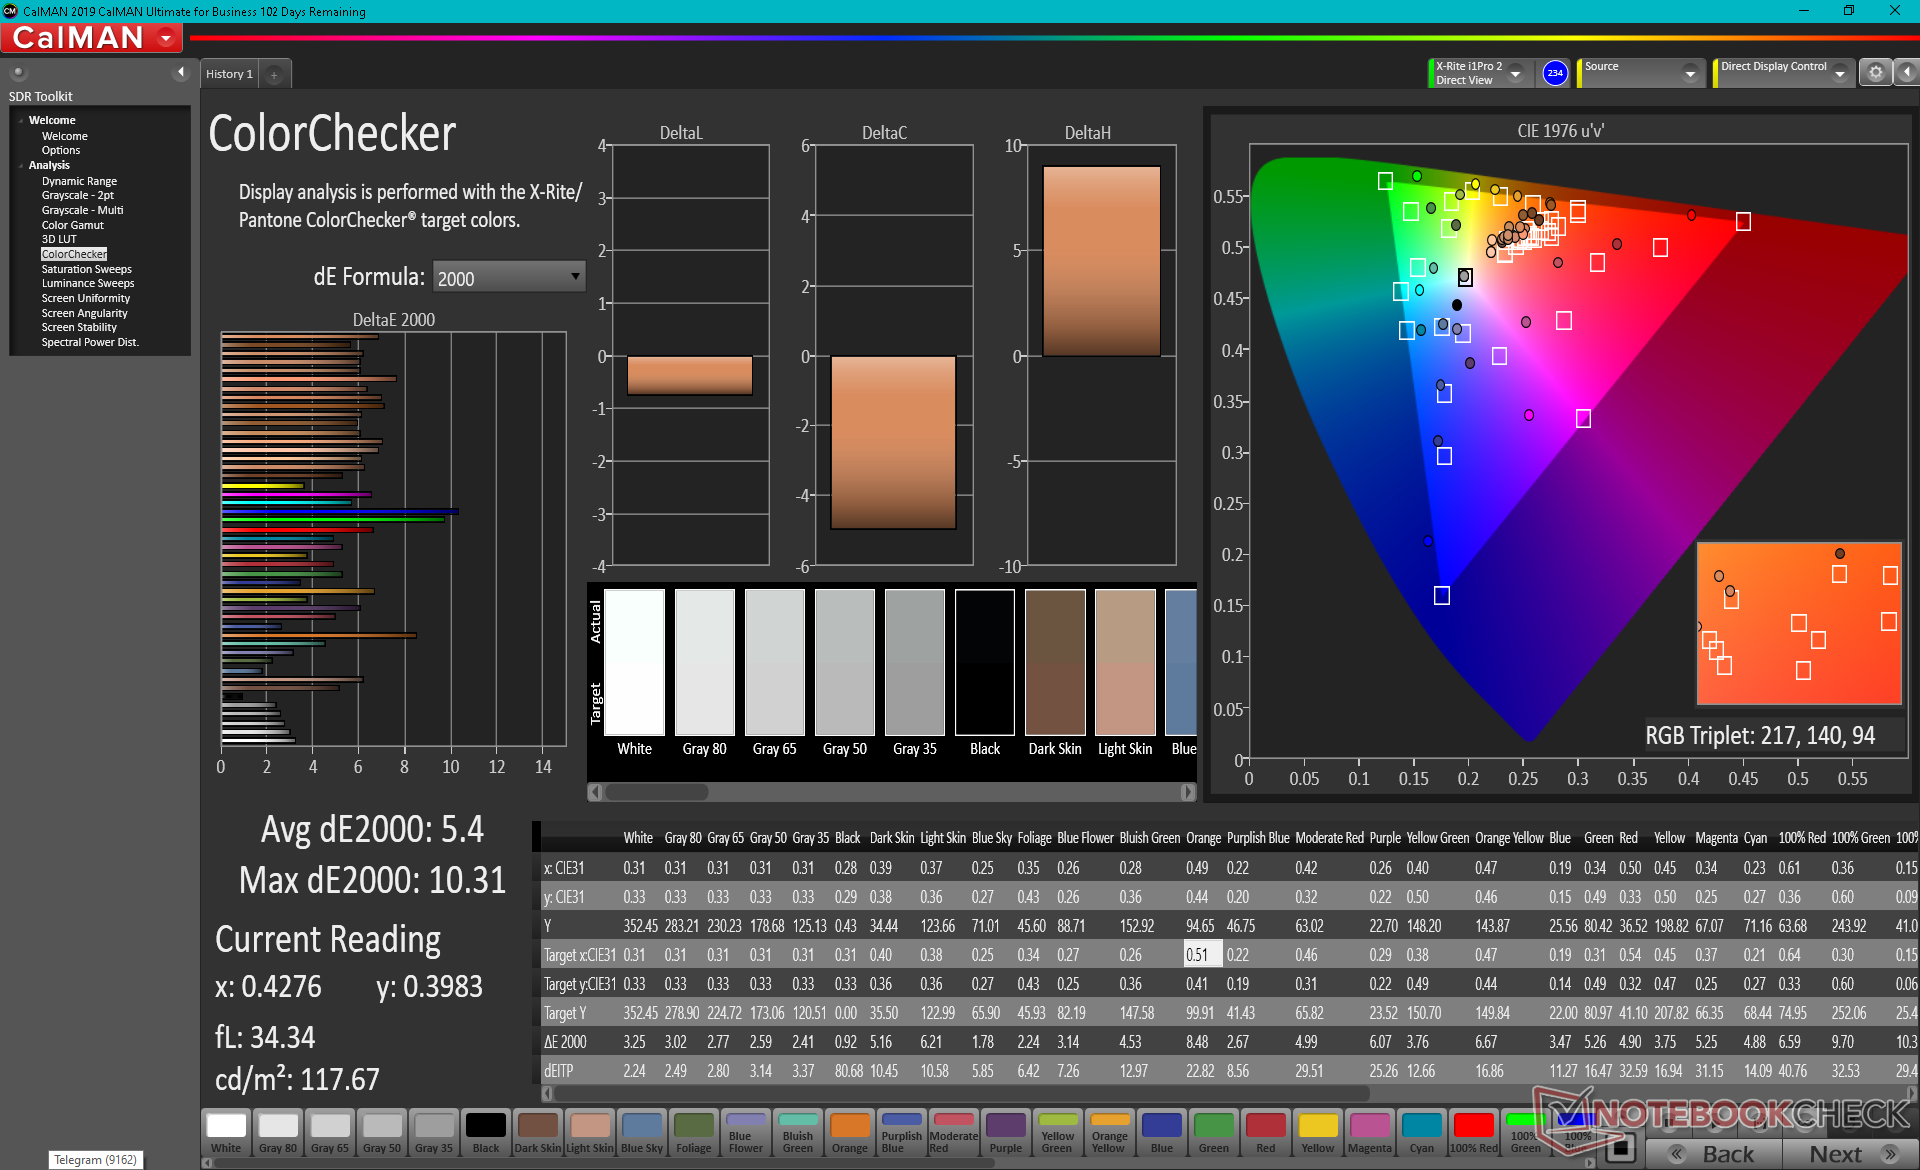
8英寸的触摸屏显然比Win 3的5.5英寸触摸屏要大,但这就是优势所在。从响应时间、亮度和色彩来看,其他一切都比Win 3的显示屏慢得多、暗得多、浅得多。这绝不是一个差劲的显示屏,但从我们在Win 3上的体验来看,它比我们所知道的制造商的能力要低一个档次。改用OLED实际上可以解决我们对这个特殊的IPS面板的重影、颜色和对比度的担忧。

| |||||||||||||||||||||||||
Brightness Distribution: 92 %
Center on Battery: 374.6 cd/m²
Contrast: 832:1 (Black: 0.45 cd/m²)
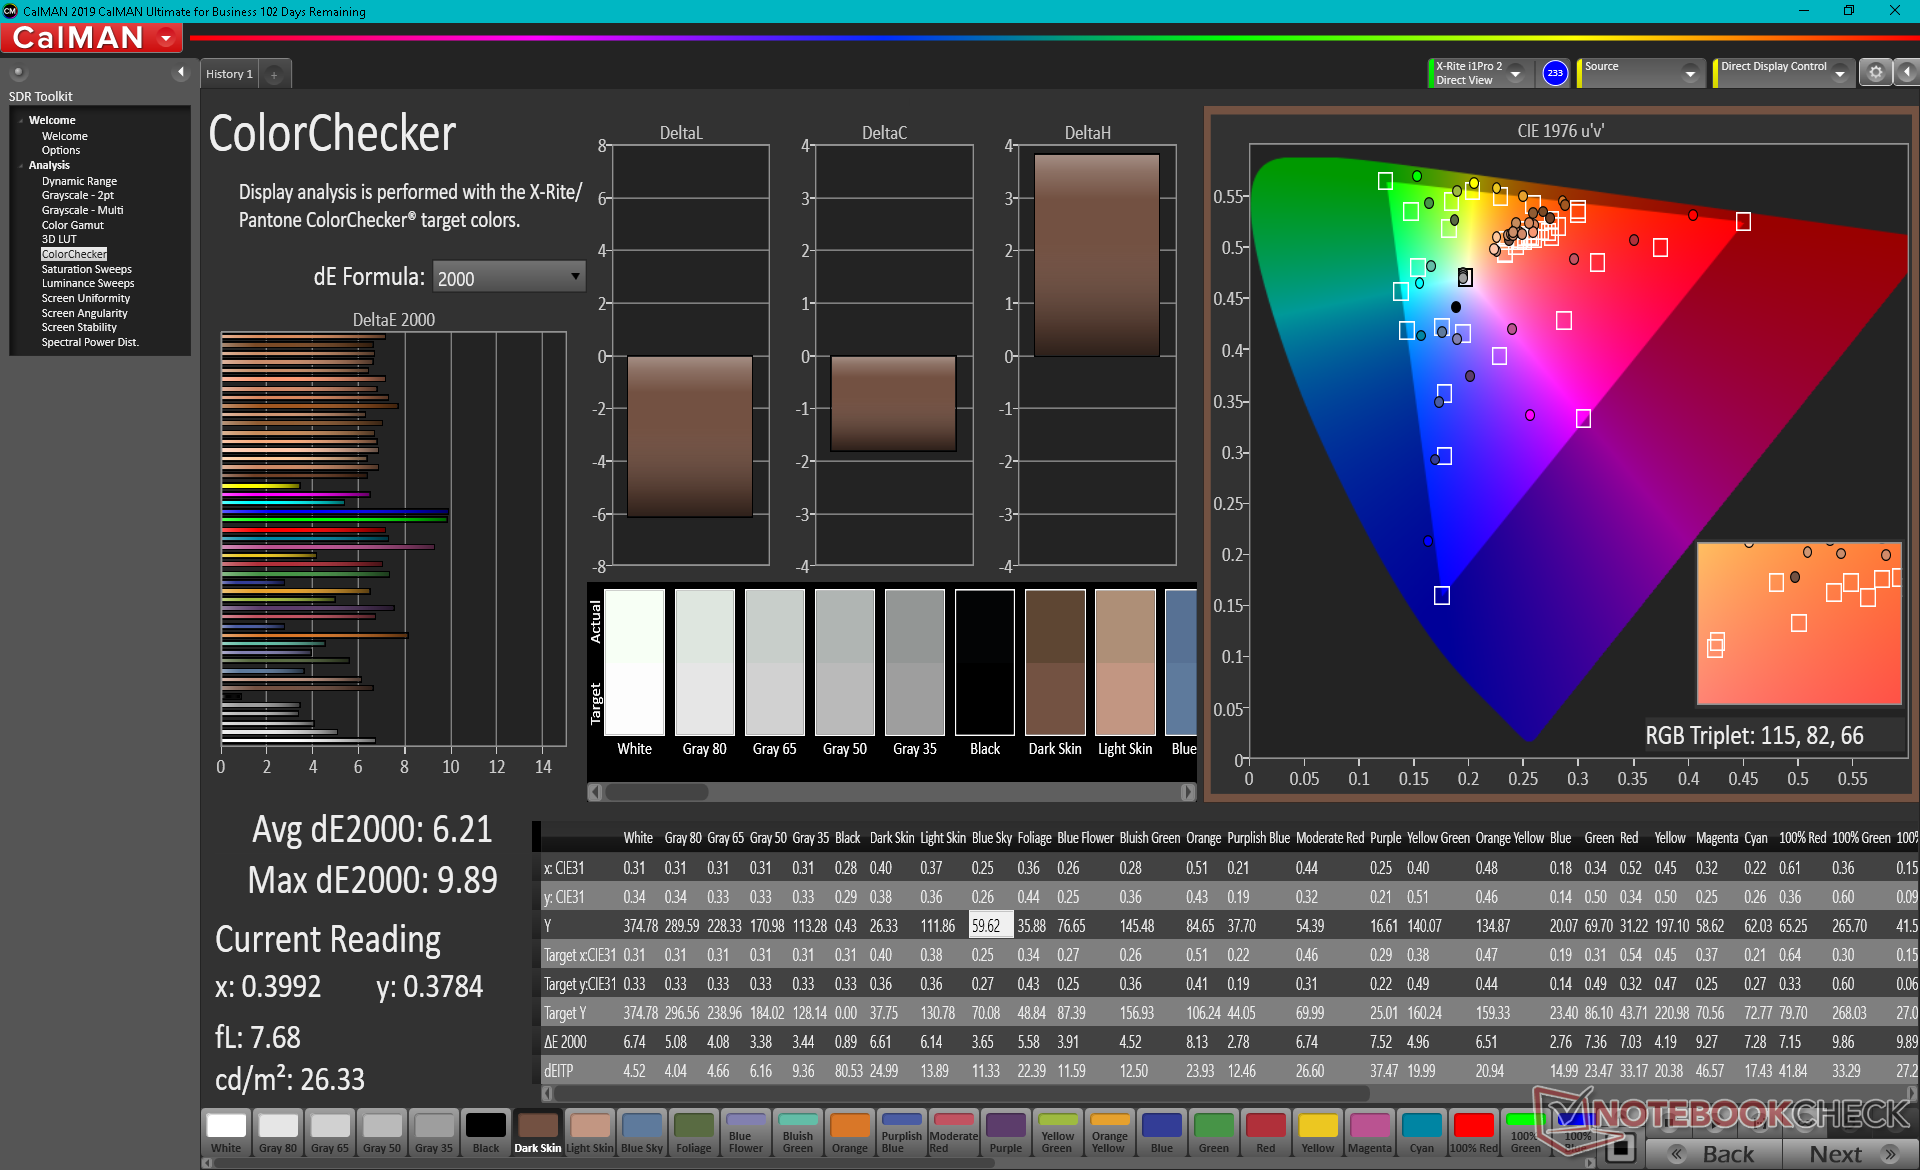
ΔE ColorChecker Calman: 6.21 | ∀{0.5-29.43 Ø4.71}
calibrated: 5.4
ΔE Greyscale Calman: 4.5 | ∀{0.09-98 Ø4.96}
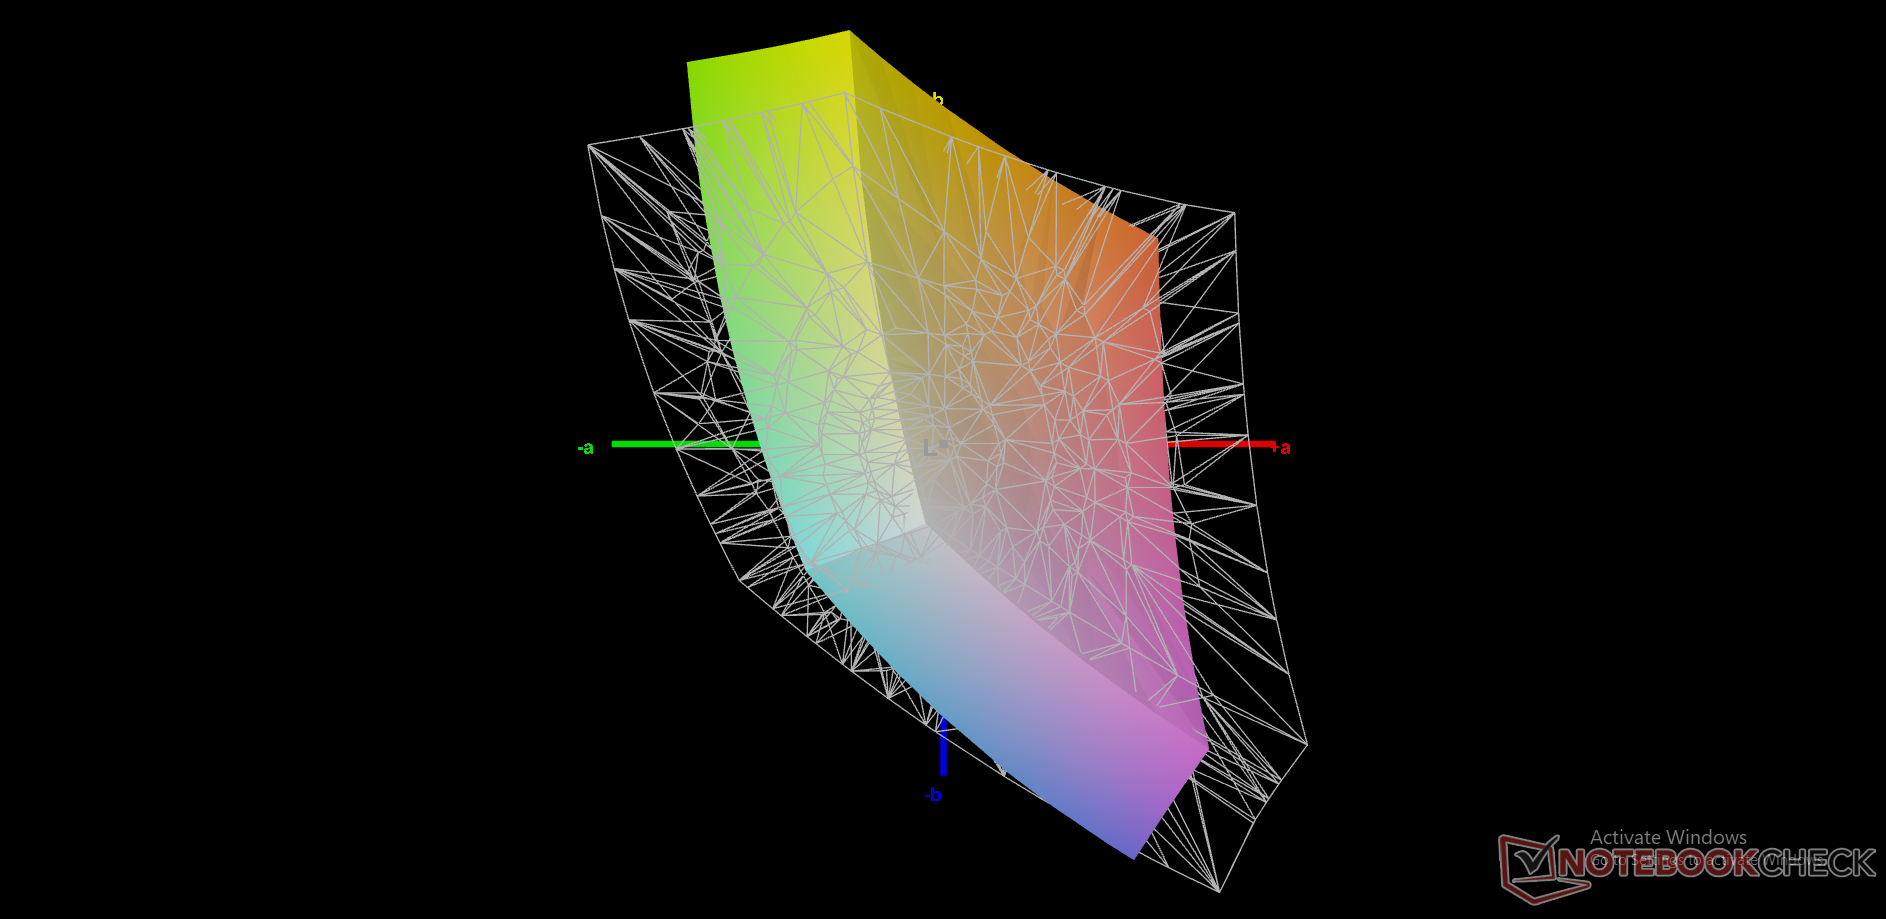
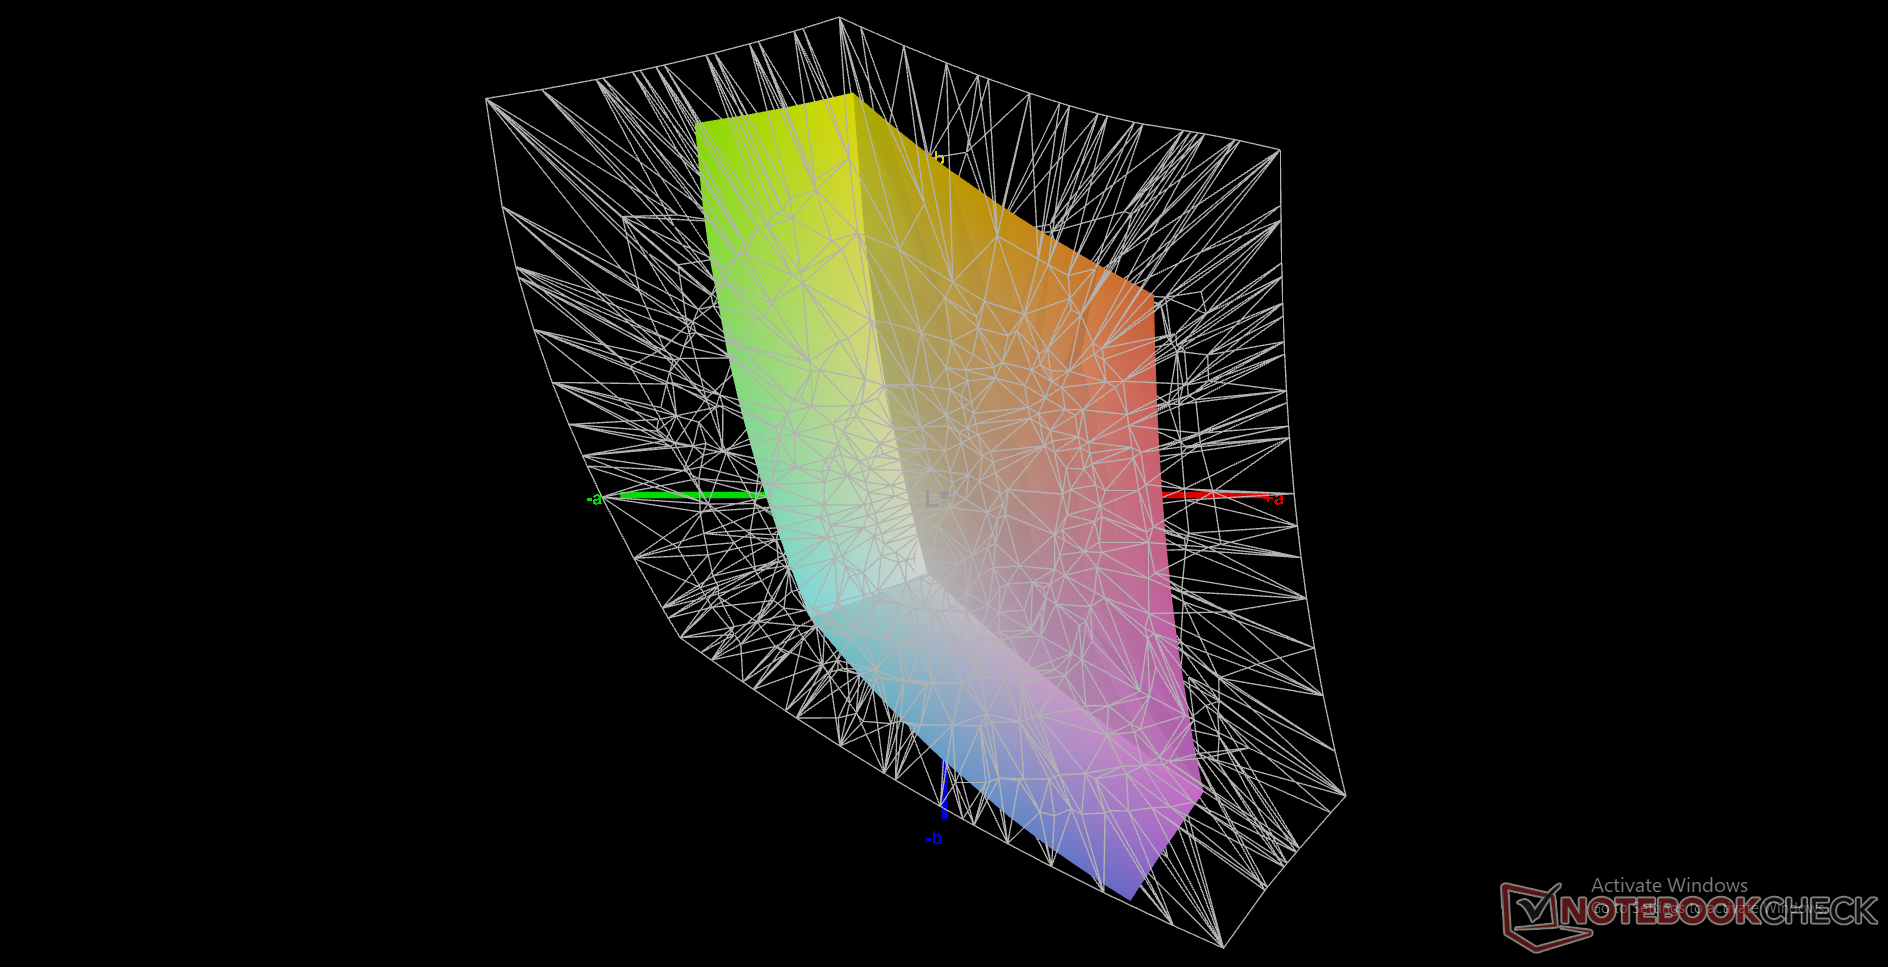
47.6% AdobeRGB 1998 (Argyll 3D)
65.2% sRGB (Argyll 3D)
47.2% Display P3 (Argyll 3D)
Gamma: 2.49
CCT: 6726 K
| GPD Win Max 2021 LT7911D, IPS, 8", 1280x800 | GPD Win 3 IPS, 5.5", 1280x720 | HP Pavilion Aero 13 be0097nr AU Optronics AUO6496, IPS, 13.3", 1920x1200 | Lenovo Yoga 6 13 82ND0009US AU Optronics B133HAN05.F, IPS, 13.3", 1920x1080 | Asus ZenBook Flip 13 UX363EA-HP069T Samsung, SDC414A, OLED, 13.3", 1920x1080 | Asus ZenBook 13 UX325EA Samsung SDC4155 (ATNA33XC09-0), OLED, 13.3", 1920x1080 | |
|---|---|---|---|---|---|---|
| Display | 31% | 55% | 50% | 90% | ||
| Display P3 Coverage (%) | 47.2 | 59.5 26% | 73.4 56% | 69.7 48% | 99.9 112% | |
| sRGB Coverage (%) | 65.2 | 89.6 37% | 99.8 53% | 99.2 52% | 100 53% | |
| AdobeRGB 1998 Coverage (%) | 47.6 | 61.4 29% | 74.8 57% | 71.4 50% | 97.5 105% | |
| Response Times | 31% | 21% | 21% | 96% | 96% | |
| Response Time Grey 50% / Grey 80% * (ms) | 56.8 ? | 40 ? 30% | 42.4 ? 25% | 46.8 ? 18% | 2 ? 96% | 2 ? 96% |
| Response Time Black / White * (ms) | 37.6 ? | 25.6 ? 32% | 31.6 ? 16% | 28.8 ? 23% | 2 ? 95% | 2 ? 95% |
| PWM Frequency (Hz) | 201.6 ? | 60 | 60 ? | |||
| Screen | -11% | 37% | 22% | 8% | 33% | |
| Brightness middle (cd/m²) | 374.6 | 468.8 25% | 473.9 27% | 291.5 -22% | 353 -6% | 390 4% |
| Brightness (cd/m²) | 361 | 460 27% | 458 27% | 294 -19% | 359 -1% | 368 2% |
| Brightness Distribution (%) | 92 | 93 1% | 91 -1% | 93 1% | 95 3% | 66 -28% |
| Black Level * (cd/m²) | 0.45 | 0.45 -0% | 0.36 20% | 0.19 58% | 0.1 78% | |
| Contrast (:1) | 832 | 1042 25% | 1316 58% | 1534 84% | 3530 324% | |
| Colorchecker dE 2000 * | 6.21 | 9 -45% | 2.99 52% | 3.83 38% | 3.98 36% | 2.03 67% |
| Colorchecker dE 2000 max. * | 9.89 | 15.5 -57% | 4.35 56% | 8.43 15% | 53.07 -437% | 3.14 68% |
| Colorchecker dE 2000 calibrated * | 5.4 | 1.91 65% | 1.1 80% | 1.07 80% | 3.1 43% | |
| Greyscale dE 2000 * | 4.5 | 10.9 -142% | 4 11% | 6.2 -38% | 1.41 69% | 1.28 72% |
| Gamma | 2.49 88% | 2.13 103% | 2.35 94% | 2.2 100% | 2.39 92% | 2.4 92% |
| CCT | 6726 97% | 10972 59% | 6269 104% | 6469 100% | 6346 102% | 6359 102% |
| Color Space (Percent of AdobeRGB 1998) (%) | 56.6 | 87 | ||||
| Color Space (Percent of sRGB) (%) | 89.2 | 100 | ||||
| Total Average (Program / Settings) | 17% /
4% | 38% /
38% | 31% /
28% | 52% /
26% | 73% /
57% |
* ... smaller is better
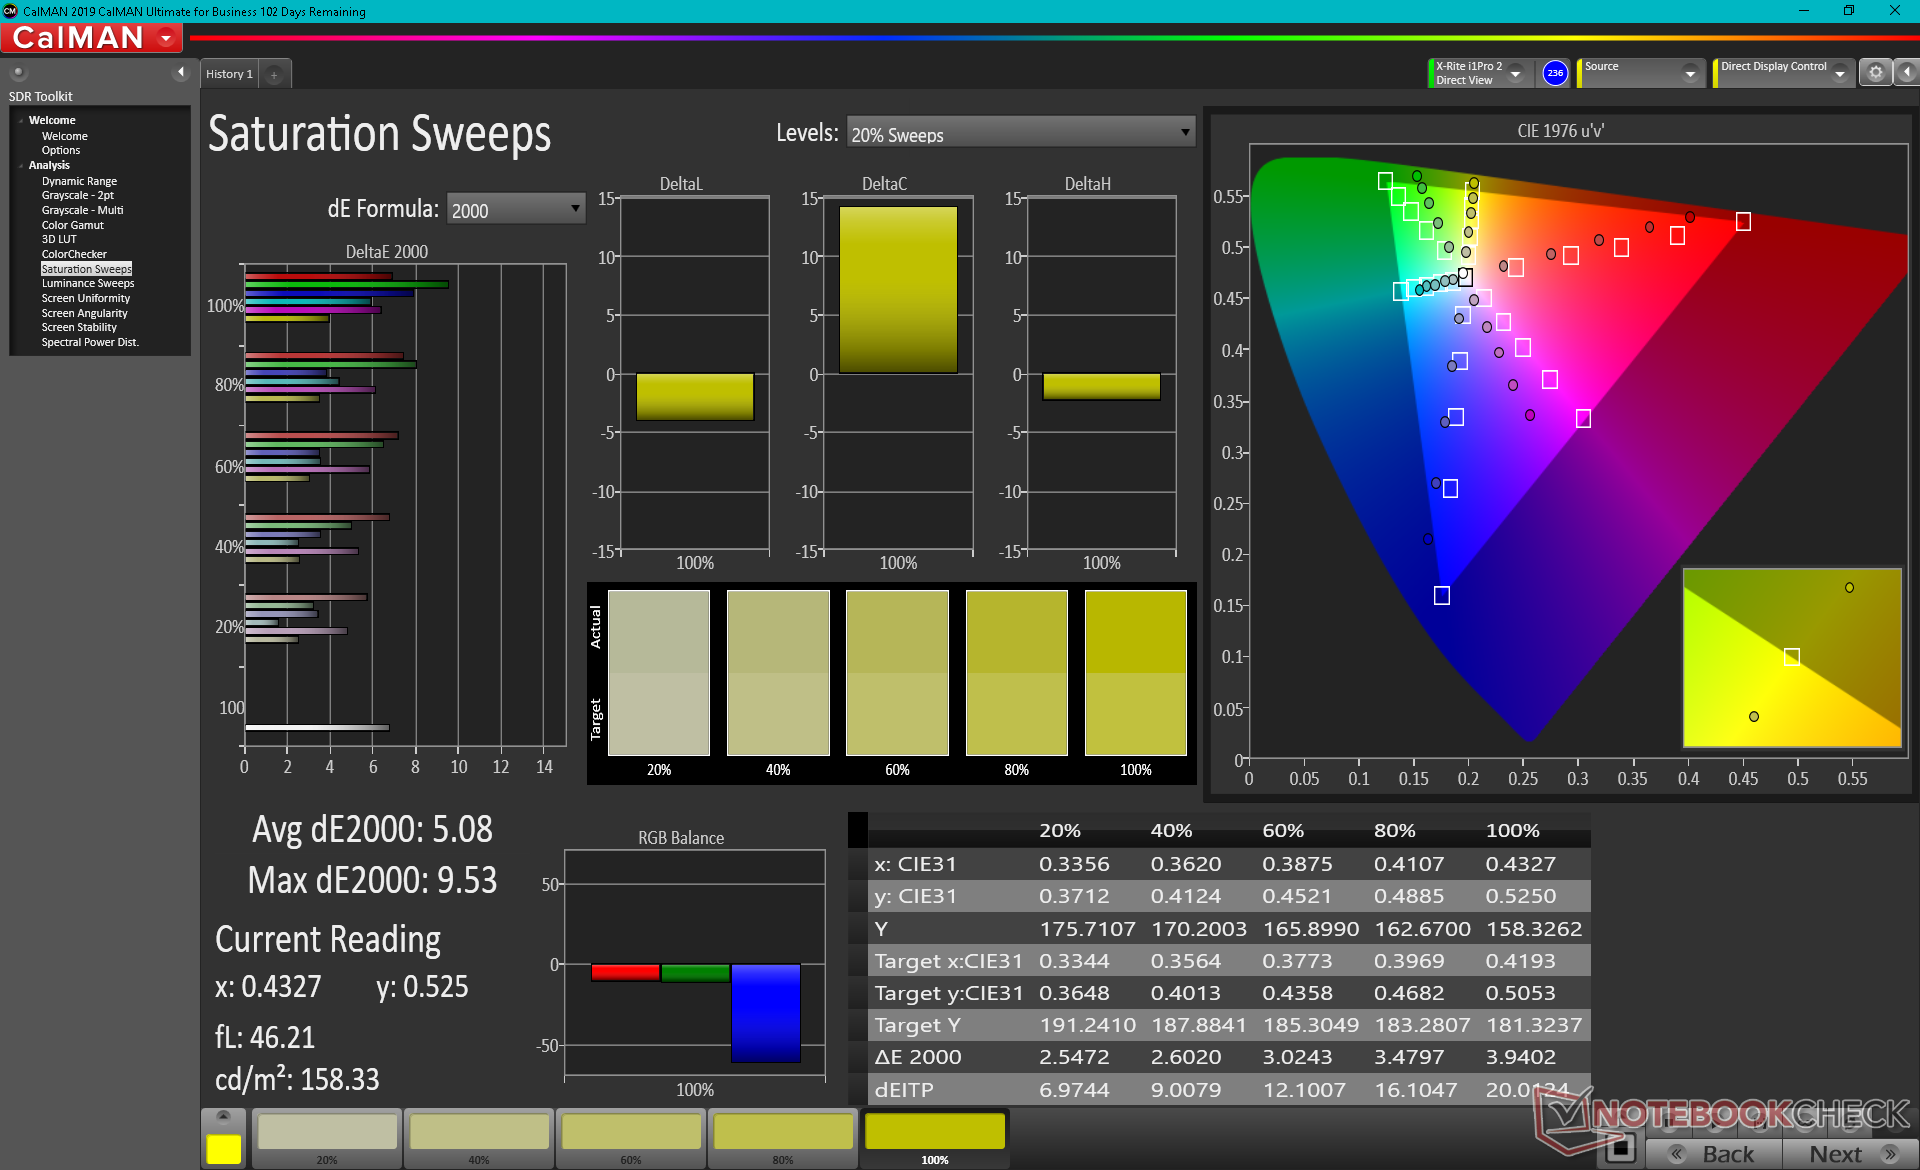
因此,虽然Win Max的显示屏比Win 3大,但后者的颜色更深、更准确。
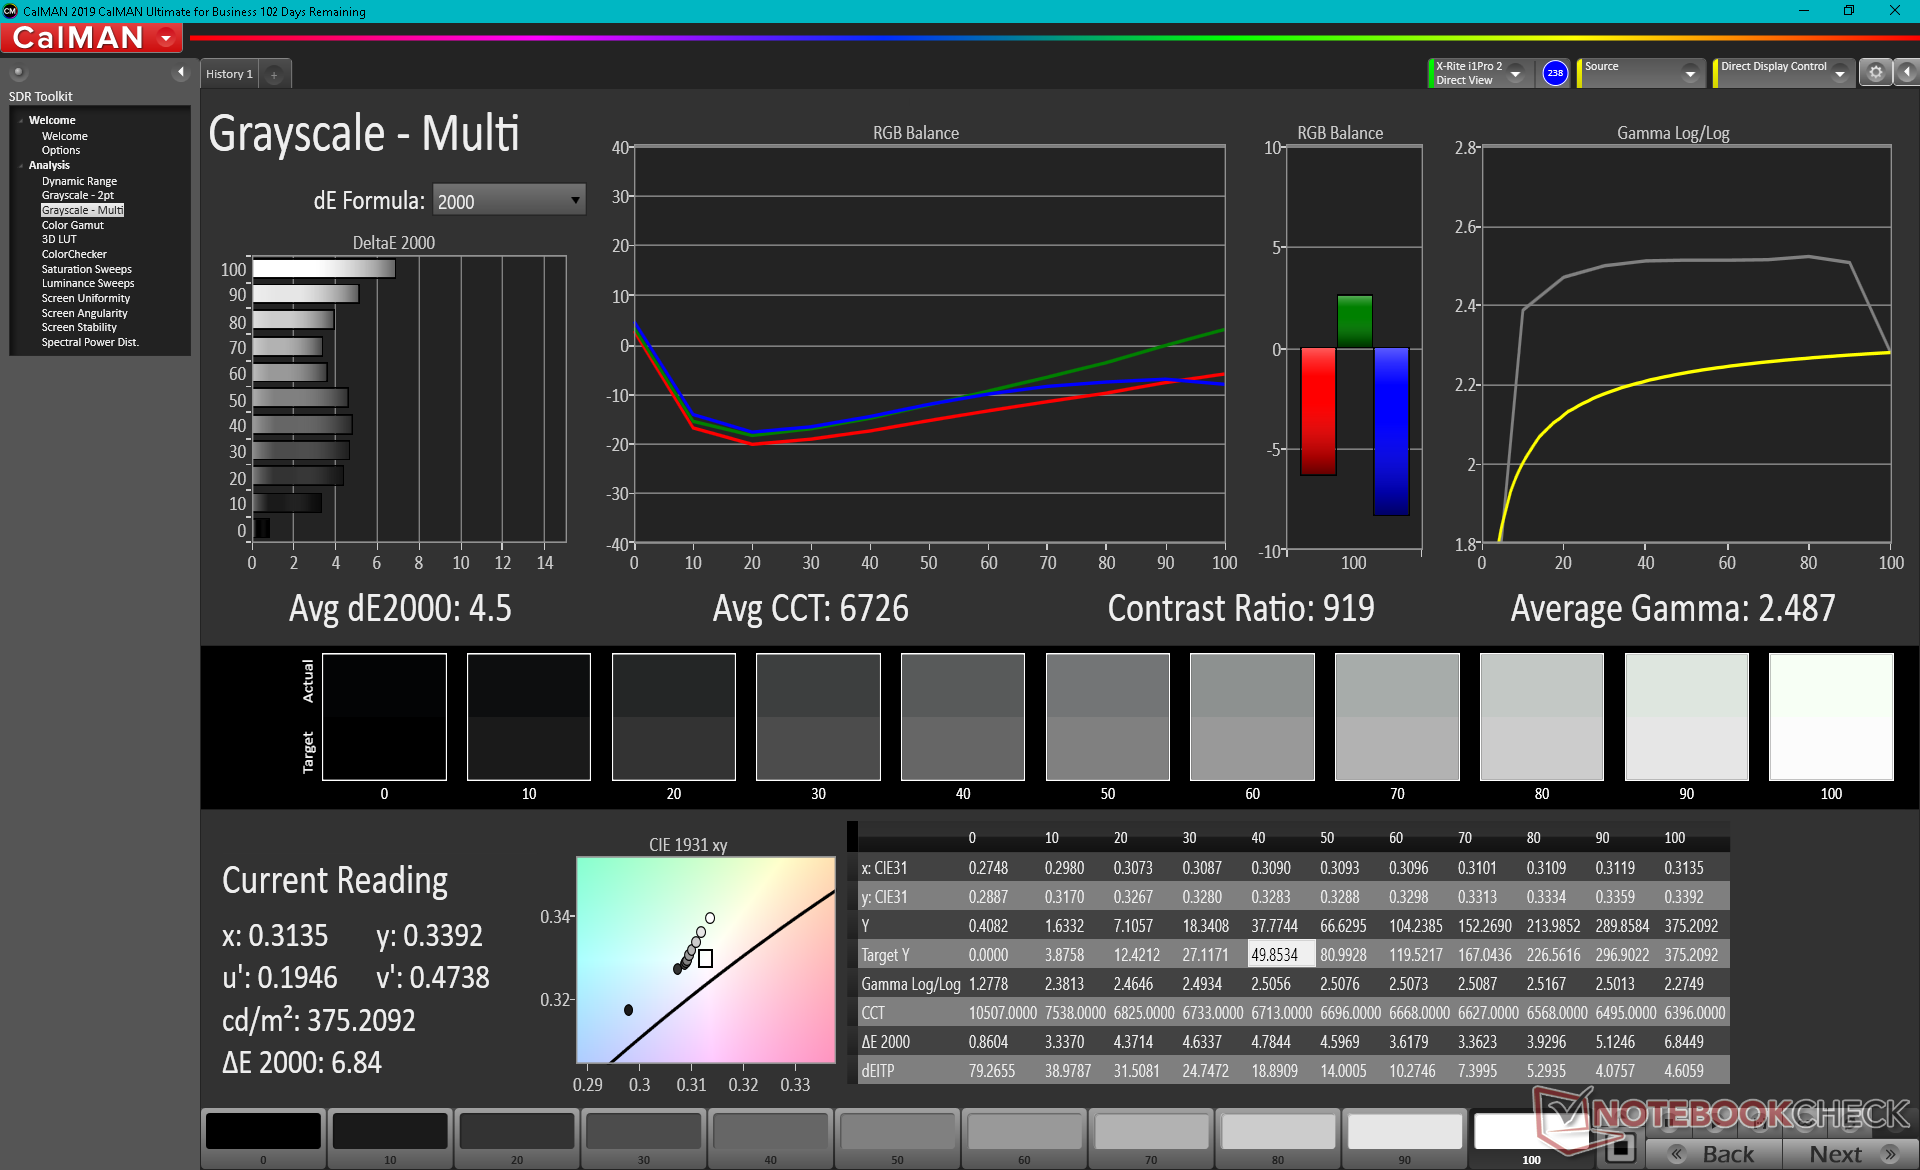
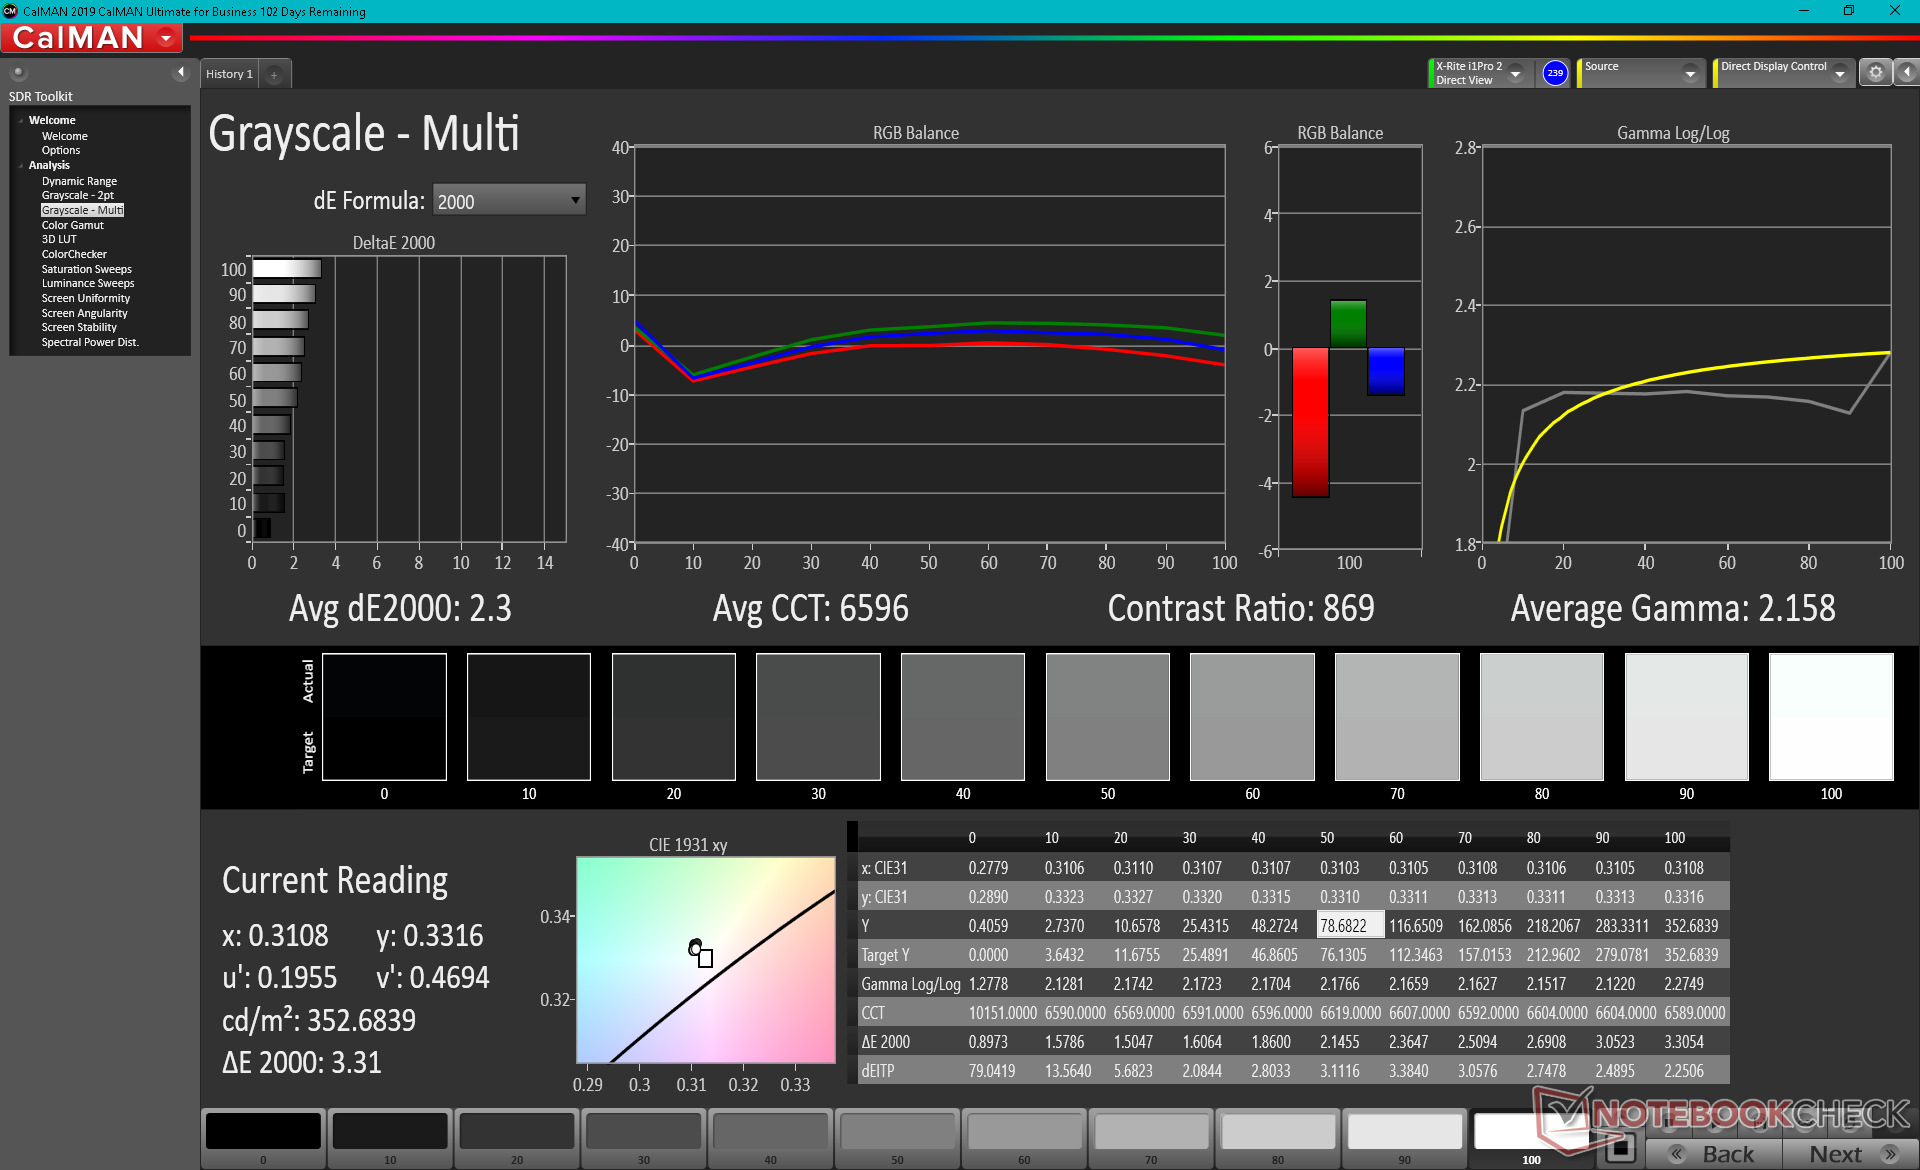
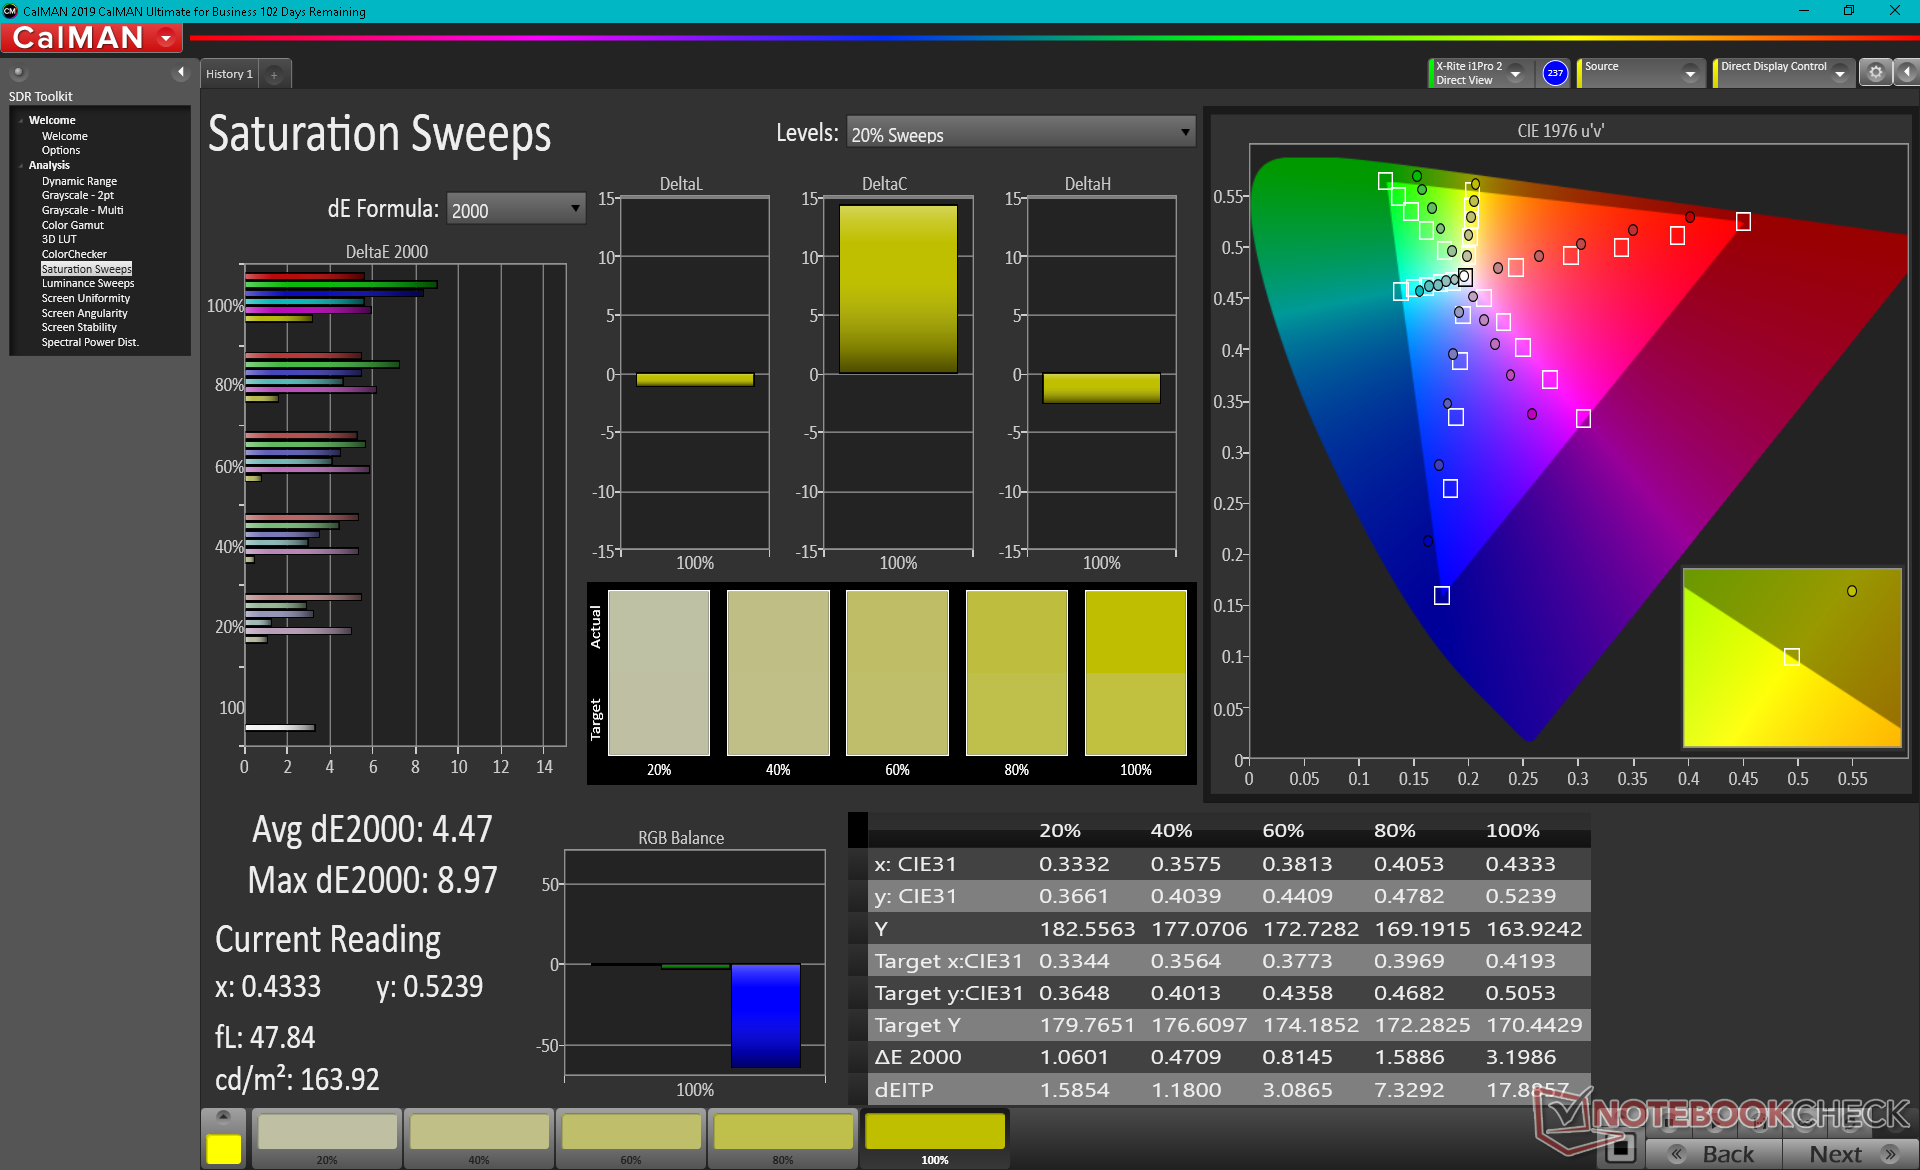
X-Rite色度计的测量结果显示,色温略微偏冷。一旦正确校准,平均灰度和ColorChecker DeltaE值将分别从4.5提高到2.3和6.2提高到5.4。由于面板的色彩空间有限,颜色在较高的饱和度下仍然变得越来越不准确。
Display Response Times
| ↔ Response Time Black to White | ||
|---|---|---|
| 37.6 ms ... rise ↗ and fall ↘ combined | ↗ 22 ms rise | 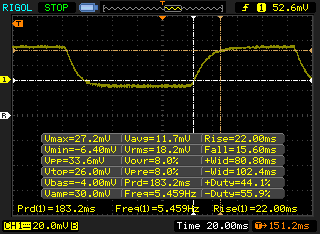 |
| ↘ 15.6 ms fall | ||
| The screen shows slow response rates in our tests and will be unsatisfactory for gamers. In comparison, all tested devices range from 0.1 (minimum) to 240 (maximum) ms. » 95 % of all devices are better. This means that the measured response time is worse than the average of all tested devices (19.8 ms). | ||
| ↔ Response Time 50% Grey to 80% Grey | ||
| 56.8 ms ... rise ↗ and fall ↘ combined | ↗ 28.4 ms rise | 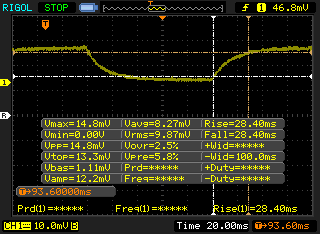 |
| ↘ 28.4 ms fall | ||
| The screen shows slow response rates in our tests and will be unsatisfactory for gamers. In comparison, all tested devices range from 0.165 (minimum) to 636 (maximum) ms. » 94 % of all devices are better. This means that the measured response time is worse than the average of all tested devices (31 ms). | ||
Screen Flickering / PWM (Pulse-Width Modulation)
| Screen flickering / PWM detected | 201.6 Hz | ≤ 99 % brightness setting | 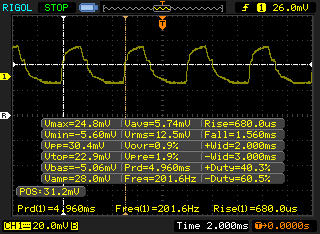 |
The display backlight flickers at 201.6 Hz (worst case, e.g., utilizing PWM) Flickering detected at a brightness setting of 99 % and below. There should be no flickering or PWM above this brightness setting. The frequency of 201.6 Hz is relatively low, so sensitive users will likely notice flickering and experience eyestrain at the stated brightness setting and below. In comparison: 52 % of all tested devices do not use PWM to dim the display. If PWM was detected, an average of 7757 (minimum: 5 - maximum: 343500) Hz was measured. | |||
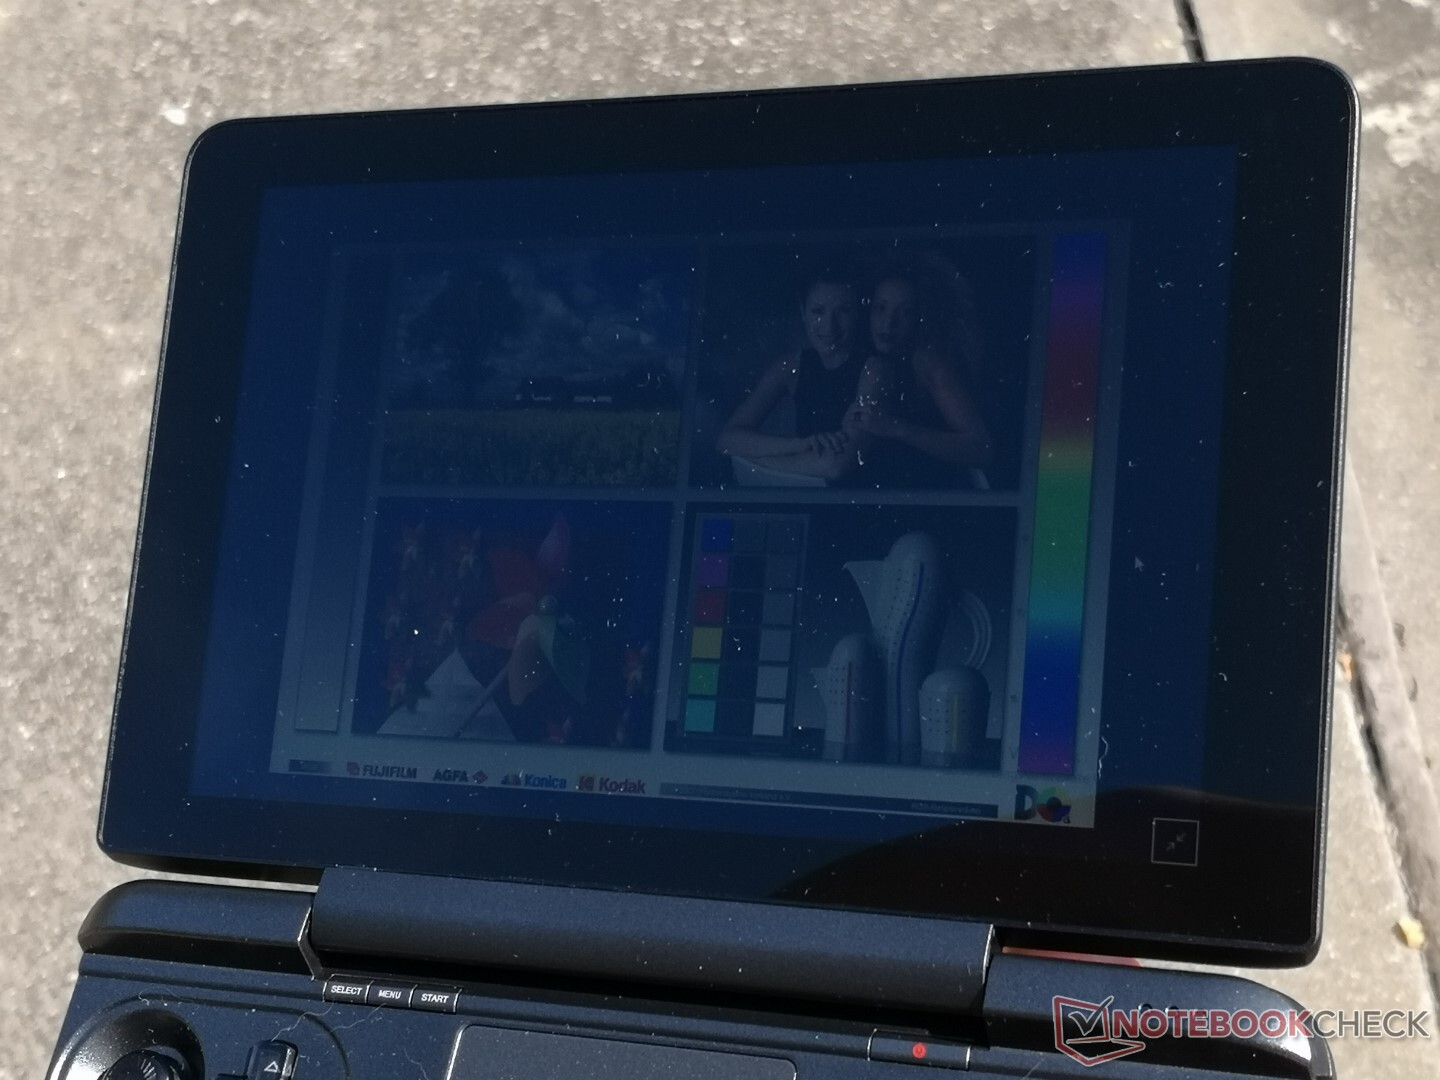
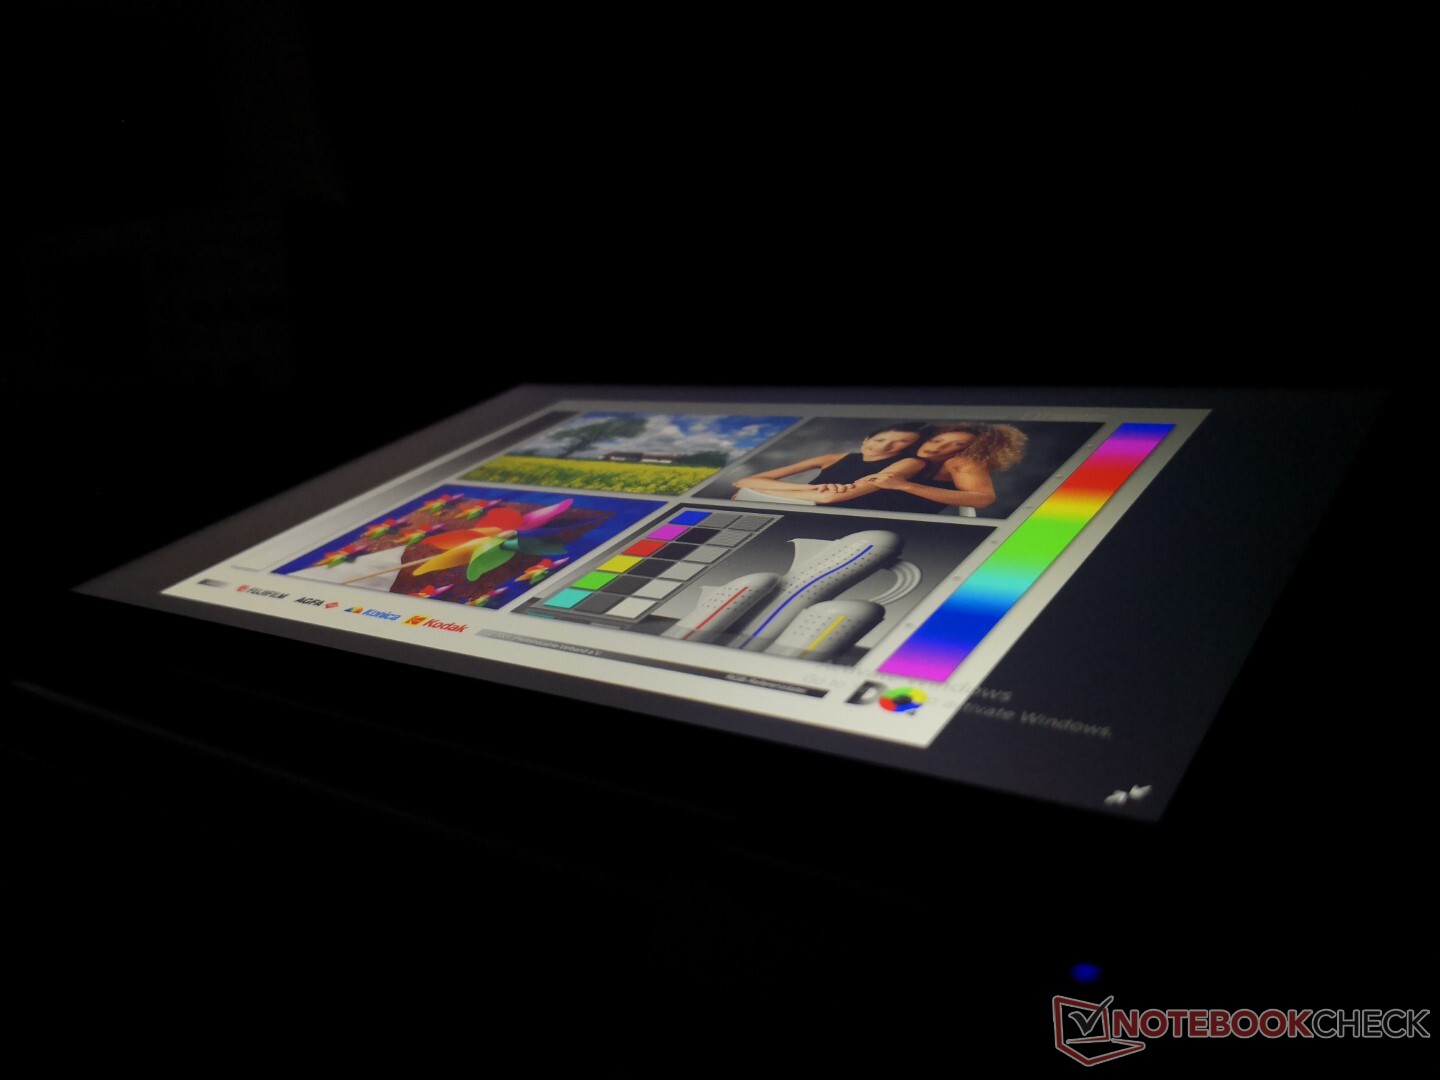
户外能见度只有在阴凉处才会好,因为那里的眩光更容易控制。我们建议禁用AMD Vari-Bright,否则在电池供电的情况下,最大亮度将自动从374尼特降至300尼特。
业绩

处理器
AMD Ryzen 7 4800U是为大型超极本设计的,所以在较小的8英寸外形尺寸上看到它是不常见的。原始多线程性能非常好,基本上与Ryzen 7 4700U齐头并进。 Ryzen 7 4700U甚至是 Ryzen 7 5800U.另一方面,单线程性能比竞争者的Core i7-1165G7慢15%至20%。 酷睿i7-1165G7.
Cinebench R15 Multi Loop
Cinebench R23: Multi Core | Single Core
Cinebench R15: CPU Multi 64Bit | CPU Single 64Bit
Blender: v2.79 BMW27 CPU
7-Zip 18.03: 7z b 4 -mmt1 | 7z b 4
Geekbench 5.5: Single-Core | Multi-Core
HWBOT x265 Benchmark v2.2: 4k Preset
LibreOffice : 20 Documents To PDF
R Benchmark 2.5: Overall mean
| Cinebench R20 / CPU (Multi Core) | |
| Average AMD Ryzen 7 4800U (2943 - 3306, n=4) | |
| Lenovo Yoga Slim 7 14ARE05 82A20008GE | |
| HP Pavilion Aero 13 be0097nr | |
| GPD Win Max 2021 | |
| Lenovo Yoga 6 13 82ND0009US | |
| Honor MagicBook 15 4500U | |
| Framework Laptop 13.5 | |
| GPD Win 3 | |
| Infinix INBook X1 Pro | |
| Cinebench R20 / CPU (Single Core) | |
| Framework Laptop 13.5 | |
| HP Pavilion Aero 13 be0097nr | |
| GPD Win 3 | |
| GPD Win Max 2021 | |
| Average AMD Ryzen 7 4800U (474 - 488, n=4) | |
| Lenovo Yoga Slim 7 14ARE05 82A20008GE | |
| Infinix INBook X1 Pro | |
| Lenovo Yoga 6 13 82ND0009US | |
| Honor MagicBook 15 4500U | |
| Cinebench R23 / Multi Core | |
| Average AMD Ryzen 7 4800U (7558 - 9762, n=3) | |
| HP Pavilion Aero 13 be0097nr | |
| Lenovo Yoga Slim 7 14ARE05 82A20008GE | |
| GPD Win Max 2021 | |
| Lenovo Yoga 6 13 82ND0009US | |
| Framework Laptop 13.5 | |
| GPD Win 3 | |
| Infinix INBook X1 Pro | |
| Cinebench R23 / Single Core | |
| Framework Laptop 13.5 | |
| HP Pavilion Aero 13 be0097nr | |
| GPD Win 3 | |
| Average AMD Ryzen 7 4800U (1231 - 1240, n=3) | |
| GPD Win Max 2021 | |
| Lenovo Yoga Slim 7 14ARE05 82A20008GE | |
| Infinix INBook X1 Pro | |
| Lenovo Yoga 6 13 82ND0009US | |
| Cinebench R15 / CPU Multi 64Bit | |
| Average AMD Ryzen 7 4800U (1281 - 1639, n=3) | |
| HP Pavilion Aero 13 be0097nr | |
| GPD Win Max 2021 | |
| Lenovo Yoga Slim 7 14ARE05 82A20008GE | |
| Lenovo Yoga 6 13 82ND0009US | |
| Honor MagicBook 15 4500U | |
| Framework Laptop 13.5 | |
| GPD Win 3 | |
| Infinix INBook X1 Pro | |
| Cinebench R15 / CPU Single 64Bit | |
| HP Pavilion Aero 13 be0097nr | |
| Framework Laptop 13.5 | |
| GPD Win 3 | |
| Average AMD Ryzen 7 4800U (182 - 187, n=3) | |
| GPD Win Max 2021 | |
| Infinix INBook X1 Pro | |
| Lenovo Yoga Slim 7 14ARE05 82A20008GE | |
| Lenovo Yoga 6 13 82ND0009US | |
| Honor MagicBook 15 4500U | |
| Blender / v2.79 BMW27 CPU | |
| Infinix INBook X1 Pro | |
| GPD Win 3 | |
| Honor MagicBook 15 4500U | |
| Framework Laptop 13.5 | |
| Lenovo Yoga Slim 7 14ARE05 82A20008GE | |
| Lenovo Yoga 6 13 82ND0009US | |
| GPD Win Max 2021 | |
| Average AMD Ryzen 7 4800U (322 - 374, n=3) | |
| HP Pavilion Aero 13 be0097nr | |
| 7-Zip 18.03 / 7z b 4 -mmt1 | |
| Framework Laptop 13.5 | |
| HP Pavilion Aero 13 be0097nr | |
| GPD Win 3 | |
| Average AMD Ryzen 7 4800U (4420 - 4603, n=3) | |
| GPD Win Max 2021 | |
| Infinix INBook X1 Pro | |
| Lenovo Yoga Slim 7 14ARE05 82A20008GE | |
| Lenovo Yoga 6 13 82ND0009US | |
| Honor MagicBook 15 4500U | |
| 7-Zip 18.03 / 7z b 4 | |
| HP Pavilion Aero 13 be0097nr | |
| Average AMD Ryzen 7 4800U (38654 - 44804, n=3) | |
| GPD Win Max 2021 | |
| Lenovo Yoga Slim 7 14ARE05 82A20008GE | |
| Lenovo Yoga 6 13 82ND0009US | |
| Honor MagicBook 15 4500U | |
| Framework Laptop 13.5 | |
| GPD Win 3 | |
| Infinix INBook X1 Pro | |
| Geekbench 5.5 / Single-Core | |
| GPD Win 3 | |
| Honor MagicBook 15 4500U | |
| Average AMD Ryzen 7 4800U (1150 - 1192, n=4) | |
| Lenovo Yoga Slim 7 14ARE05 82A20008GE | |
| Geekbench 5.5 / Multi-Core | |
| Average AMD Ryzen 7 4800U (5798 - 6950, n=4) | |
| Lenovo Yoga Slim 7 14ARE05 82A20008GE | |
| Honor MagicBook 15 4500U | |
| GPD Win 3 | |
| HWBOT x265 Benchmark v2.2 / 4k Preset | |
| HP Pavilion Aero 13 be0097nr | |
| Average AMD Ryzen 7 4800U (9.48 - 10.8, n=3) | |
| GPD Win Max 2021 | |
| Lenovo Yoga Slim 7 14ARE05 82A20008GE | |
| Lenovo Yoga 6 13 82ND0009US | |
| Honor MagicBook 15 4500U | |
| Framework Laptop 13.5 | |
| GPD Win 3 | |
| Infinix INBook X1 Pro | |
| LibreOffice / 20 Documents To PDF | |
| Lenovo Yoga Slim 7 14ARE05 82A20008GE | |
| Lenovo Yoga 6 13 82ND0009US | |
| Honor MagicBook 15 4500U | |
| GPD Win Max 2021 | |
| Average AMD Ryzen 7 4800U (57.8 - 62.6, n=3) | |
| Infinix INBook X1 Pro | |
| HP Pavilion Aero 13 be0097nr | |
| GPD Win 3 | |
| Framework Laptop 13.5 | |
| R Benchmark 2.5 / Overall mean | |
| Infinix INBook X1 Pro | |
| GPD Win 3 | |
| Lenovo Yoga 6 13 82ND0009US | |
| Honor MagicBook 15 4500U | |
| Lenovo Yoga Slim 7 14ARE05 82A20008GE | |
| GPD Win Max 2021 | |
| Average AMD Ryzen 7 4800U (0.576 - 0.613, n=3) | |
| Framework Laptop 13.5 | |
| HP Pavilion Aero 13 be0097nr | |
* ... smaller is better
系统性能
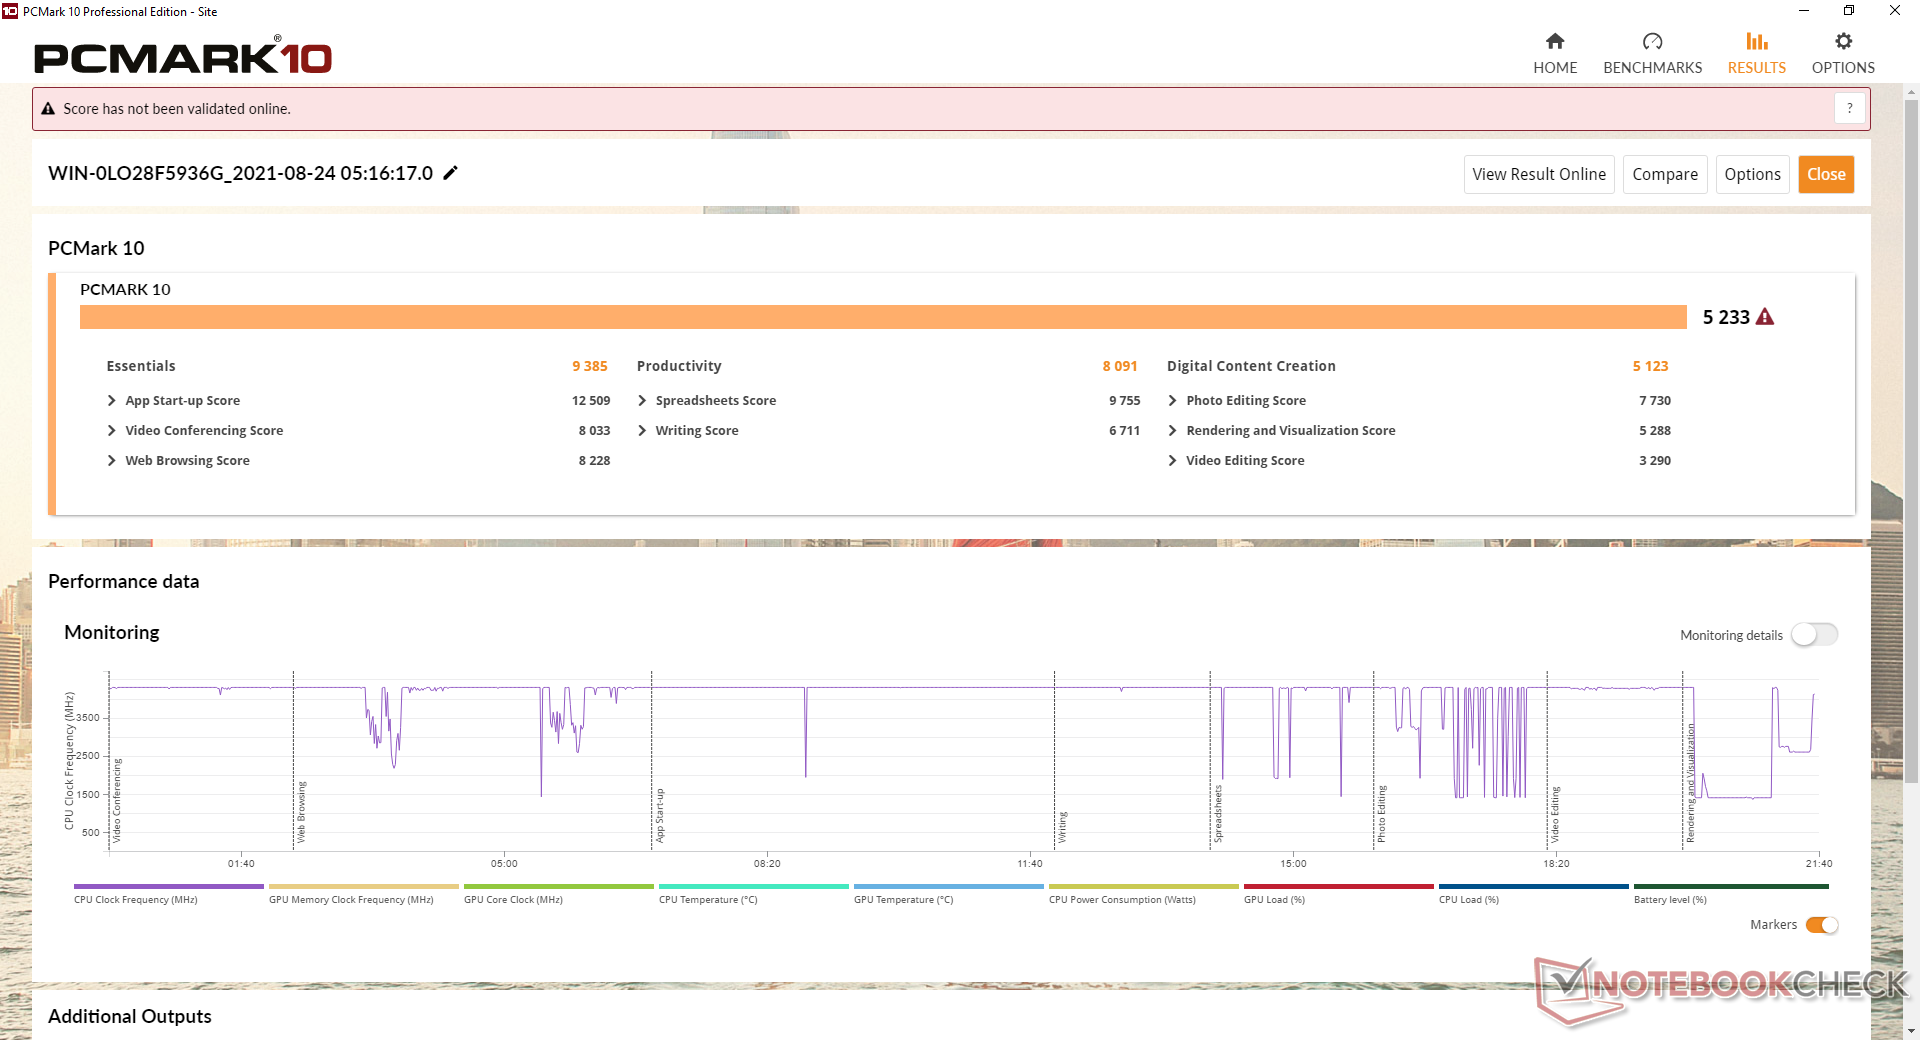
PCMark 10的结果比我们的GPD Win 3略高,主要是由于与Core i5-1135G7相比,Ryzen 7 4800U上的额外核心。
| PCMark 10 / Score | |
| HP Pavilion Aero 13 be0097nr | |
| Average AMD Ryzen 7 4800U, AMD Radeon RX Vega 8 (Ryzen 4000/5000) (5233 - 5383, n=3) | |
| GPD Win Max 2021 | |
| Lenovo Yoga 6 13 82ND0009US | |
| Asus ZenBook 13 UX325EA | |
| Asus ZenBook Flip 13 UX363EA-HP069T | |
| GPD Win 3 | |
| PCMark 10 / Essentials | |
| Asus ZenBook Flip 13 UX363EA-HP069T | |
| HP Pavilion Aero 13 be0097nr | |
| Asus ZenBook 13 UX325EA | |
| Lenovo Yoga 6 13 82ND0009US | |
| GPD Win 3 | |
| Average AMD Ryzen 7 4800U, AMD Radeon RX Vega 8 (Ryzen 4000/5000) (9188 - 9637, n=3) | |
| GPD Win Max 2021 | |
| PCMark 10 / Productivity | |
| HP Pavilion Aero 13 be0097nr | |
| GPD Win Max 2021 | |
| Average AMD Ryzen 7 4800U, AMD Radeon RX Vega 8 (Ryzen 4000/5000) (7631 - 8091, n=3) | |
| Lenovo Yoga 6 13 82ND0009US | |
| Asus ZenBook Flip 13 UX363EA-HP069T | |
| Asus ZenBook 13 UX325EA | |
| GPD Win 3 | |
| PCMark 10 / Digital Content Creation | |
| HP Pavilion Aero 13 be0097nr | |
| Average AMD Ryzen 7 4800U, AMD Radeon RX Vega 8 (Ryzen 4000/5000) (5123 - 5758, n=3) | |
| Lenovo Yoga 6 13 82ND0009US | |
| GPD Win Max 2021 | |
| Asus ZenBook 13 UX325EA | |
| GPD Win 3 | |
| Asus ZenBook Flip 13 UX363EA-HP069T | |
| PCMark 10 Score | 5233 points | |
Help | ||
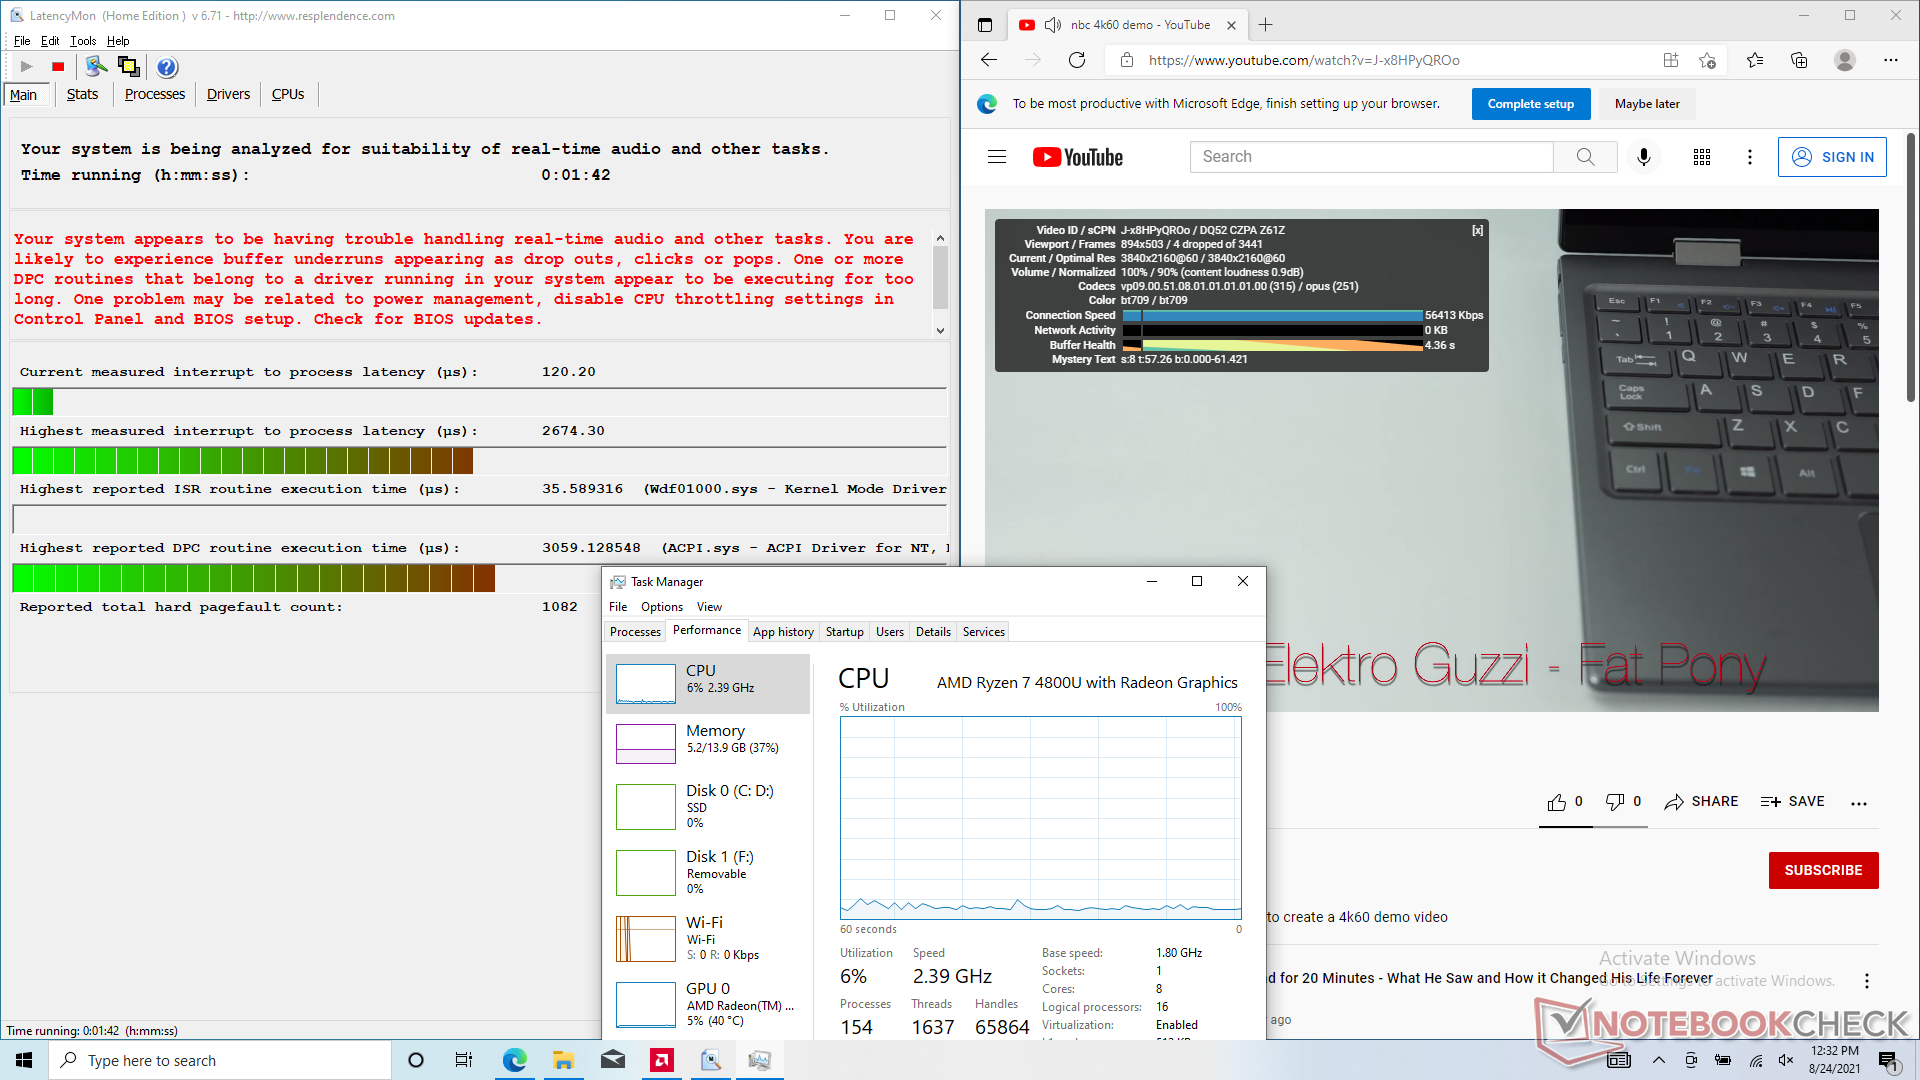
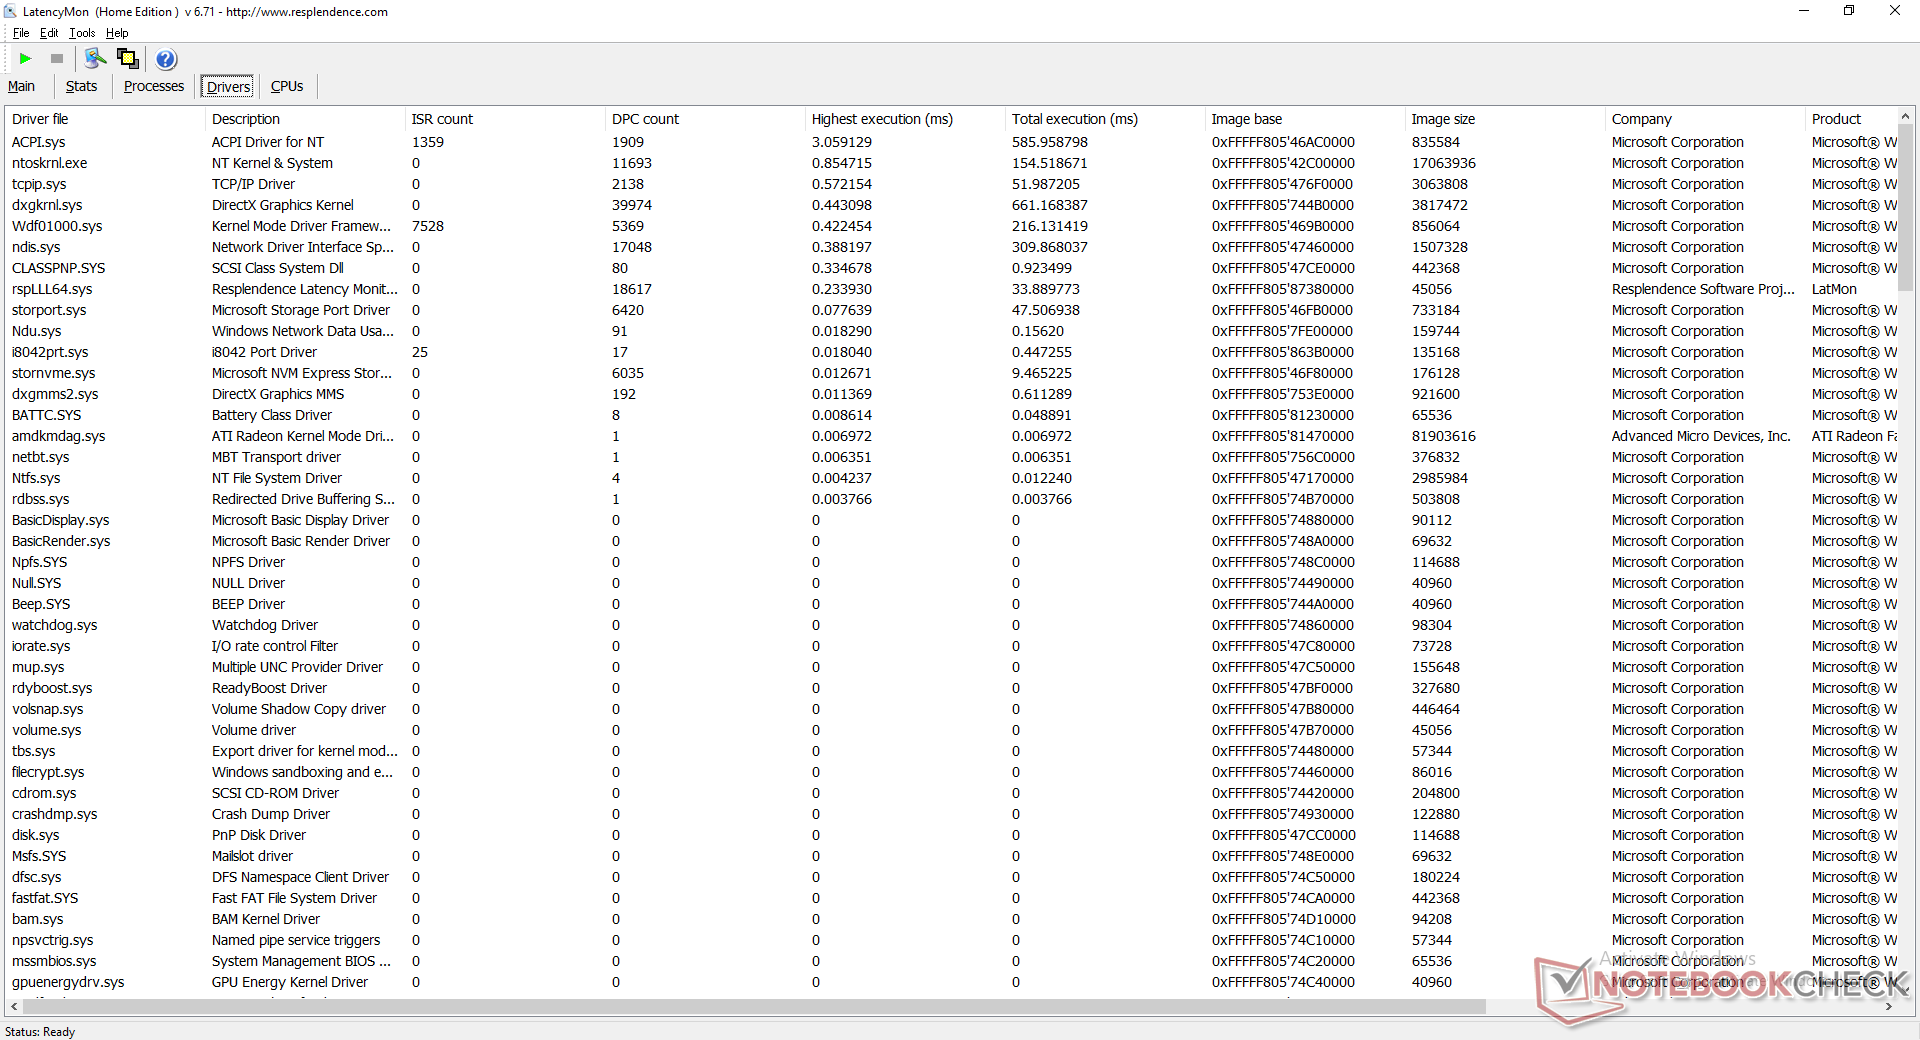
DPC延时
LatencyMon显示在我们的主页上打开多个浏览器标签时存在DPC延迟问题。在我们长达1分钟的视频测试中,4K 60 FPS的视频播放很流畅,只有4个丢帧。
| DPC Latencies / LatencyMon - interrupt to process latency (max), Web, Youtube, Prime95 | |
| Asus ZenBook Flip 13 UX363EA-HP069T | |
| GPD Win Max 2021 | |
| Lenovo Yoga 6 13 82ND0009US | |
| Asus ZenBook 13 UX325EA | |
| HP Pavilion Aero 13 be0097nr | |
| GPD Win 3 | |
* ... smaller is better
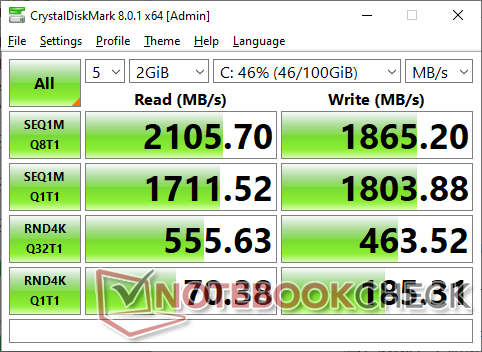
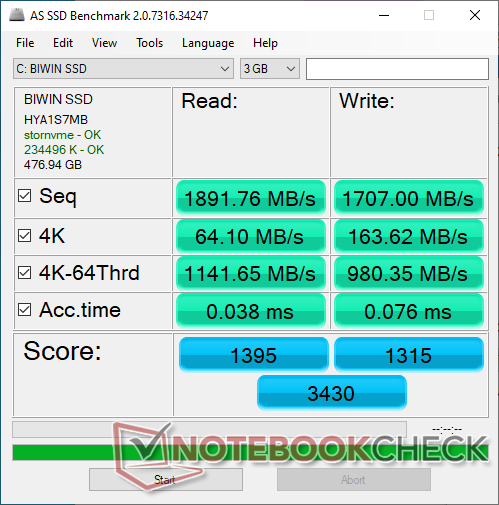
存储设备
Win Max配备了一个BIWIN NS200 PCIe 3固态硬盘,与我们在Win 3上发现的一样。性能比英特尔固态硬盘660p更快,特别是在连续写入率方面,但价格较高的 三星PM981a仍然处于领先地位。
| GPD Win Max 2021 BIWIN NS200 512GB CNF82GS1G00-512 | GPD Win 3 BIWIN NS200 1TB CNF82GS1G02-1TB | HP Pavilion Aero 13 be0097nr Intel SSD 660p SSDPEKNW512G8 | Lenovo Yoga 6 13 82ND0009US WDC PC SN530 SDBPMPZ-265G | Asus ZenBook Flip 13 UX363EA-HP069T WDC PC SN730 SDBPNTY-1T00 | |
|---|---|---|---|---|---|
| AS SSD | 4% | -44% | -69% | 15% | |
| Seq Read (MB/s) | 1892 | 1585 -16% | 1616 -15% | 1860 -2% | 2767 46% |
| Seq Write (MB/s) | 1707 | 1776 4% | 761 -55% | 500 -71% | 1368 -20% |
| 4K Read (MB/s) | 64.1 | 61.6 -4% | 46.87 -27% | 36.26 -43% | 46.86 -27% |
| 4K Write (MB/s) | 163.6 | 208.9 28% | 126.6 -23% | 118.6 -28% | 140.1 -14% |
| 4K-64 Read (MB/s) | 1142 | 1142 0% | 324.6 -72% | 419 -63% | 954 -16% |
| 4K-64 Write (MB/s) | 980 | 1103 13% | 815 -17% | 219 -78% | 1361 39% |
| Access Time Read * (ms) | 0.038 | 0.03 21% | 0.074 -95% | 0.102 -168% | 0.051 -34% |
| Access Time Write * (ms) | 0.076 | 0.074 3% | 0.135 -78% | 0.17 -124% | 0.022 71% |
| Score Read (Points) | 1395 | 1362 -2% | 533 -62% | 641 -54% | 1277 -8% |
| Score Write (Points) | 1315 | 1489 13% | 1018 -23% | 388 -70% | 1638 25% |
| Score Total (Points) | 3430 | 3573 4% | 1798 -48% | 1300 -62% | 3507 2% |
| Copy ISO MB/s (MB/s) | 1520 | 1741 15% | 906 -40% | 880 -42% | 2767 82% |
| Copy Program MB/s (MB/s) | 654 | 543 -17% | 614 -6% | 185.3 -72% | 1072 64% |
| Copy Game MB/s (MB/s) | 1325 | 1318 -1% | 539 -59% | 212.7 -84% | 1319 0% |
| CrystalDiskMark 5.2 / 6 | 10% | -25% | -32% | 6% | |
| Write 4K (MB/s) | 183.6 | 223 21% | 128.3 -30% | 89.2 -51% | 143 -22% |
| Read 4K (MB/s) | 70.1 | 66.5 -5% | 50.9 -27% | 33.09 -53% | 50.2 -28% |
| Write Seq (MB/s) | 1815 | 1857 2% | 971 -47% | 988 -46% | 1963 8% |
| Read Seq (MB/s) | 1721 | 1737 1% | 1540 -11% | 1322 -23% | 1990 16% |
| Write 4K Q32T1 (MB/s) | 458.6 | 611 33% | 538 17% | 332.6 -27% | 375 -18% |
| Read 4K Q32T1 (MB/s) | 552 | 688 25% | 344.4 -38% | 389.3 -29% | 363.7 -34% |
| Write Seq Q32T1 (MB/s) | 1865 | 1948 4% | 980 -47% | 984 -47% | 3086 65% |
| Read Seq Q32T1 (MB/s) | 2106 | 1995 -5% | 1829 -13% | 2461 17% | 3382 61% |
| Write 4K Q8T8 (MB/s) | 405.6 | ||||
| Read 4K Q8T8 (MB/s) | 930 | ||||
| Total Average (Program / Settings) | 7% /
6% | -35% /
-37% | -51% /
-55% | 11% /
12% |
* ... smaller is better

Disk Throttling: DiskSpd Read Loop, Queue Depth 8
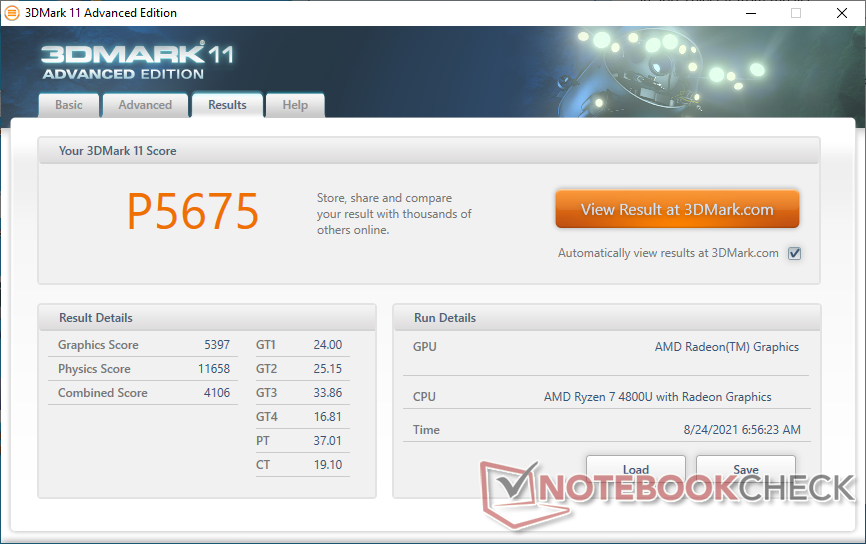
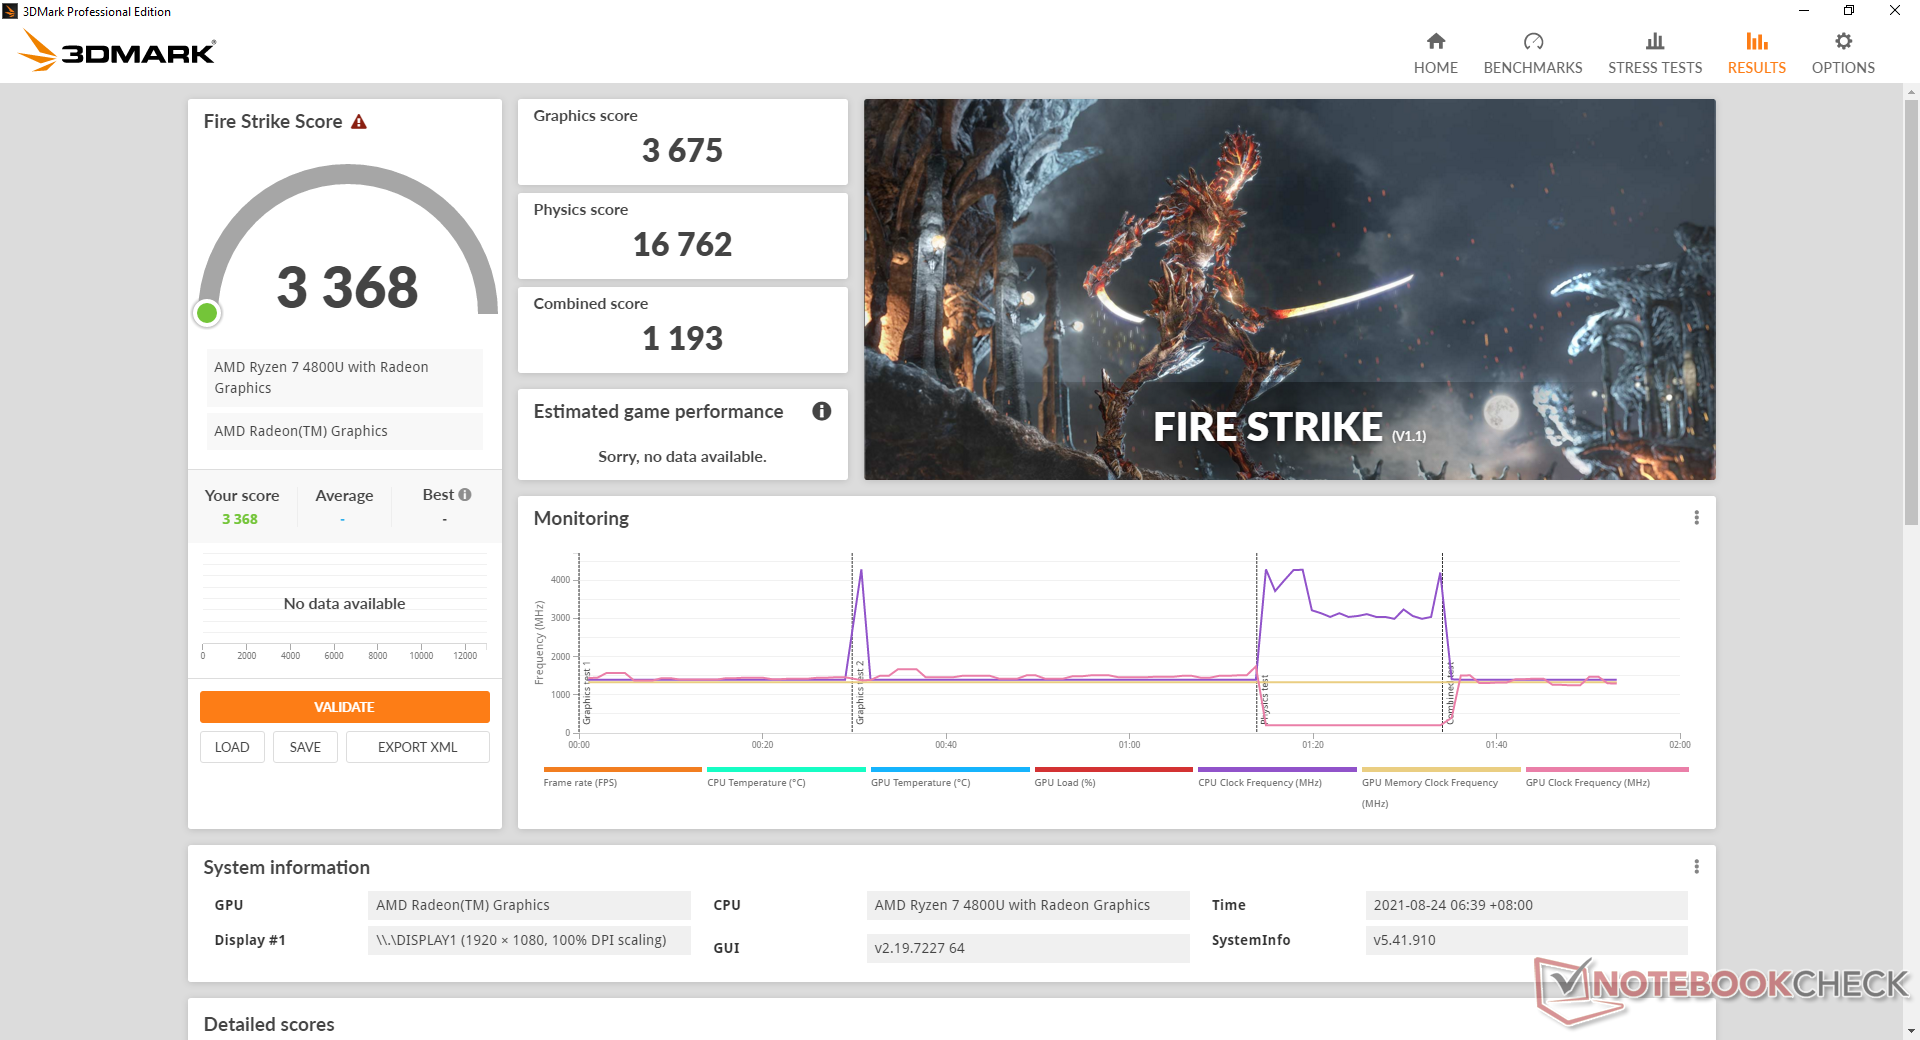
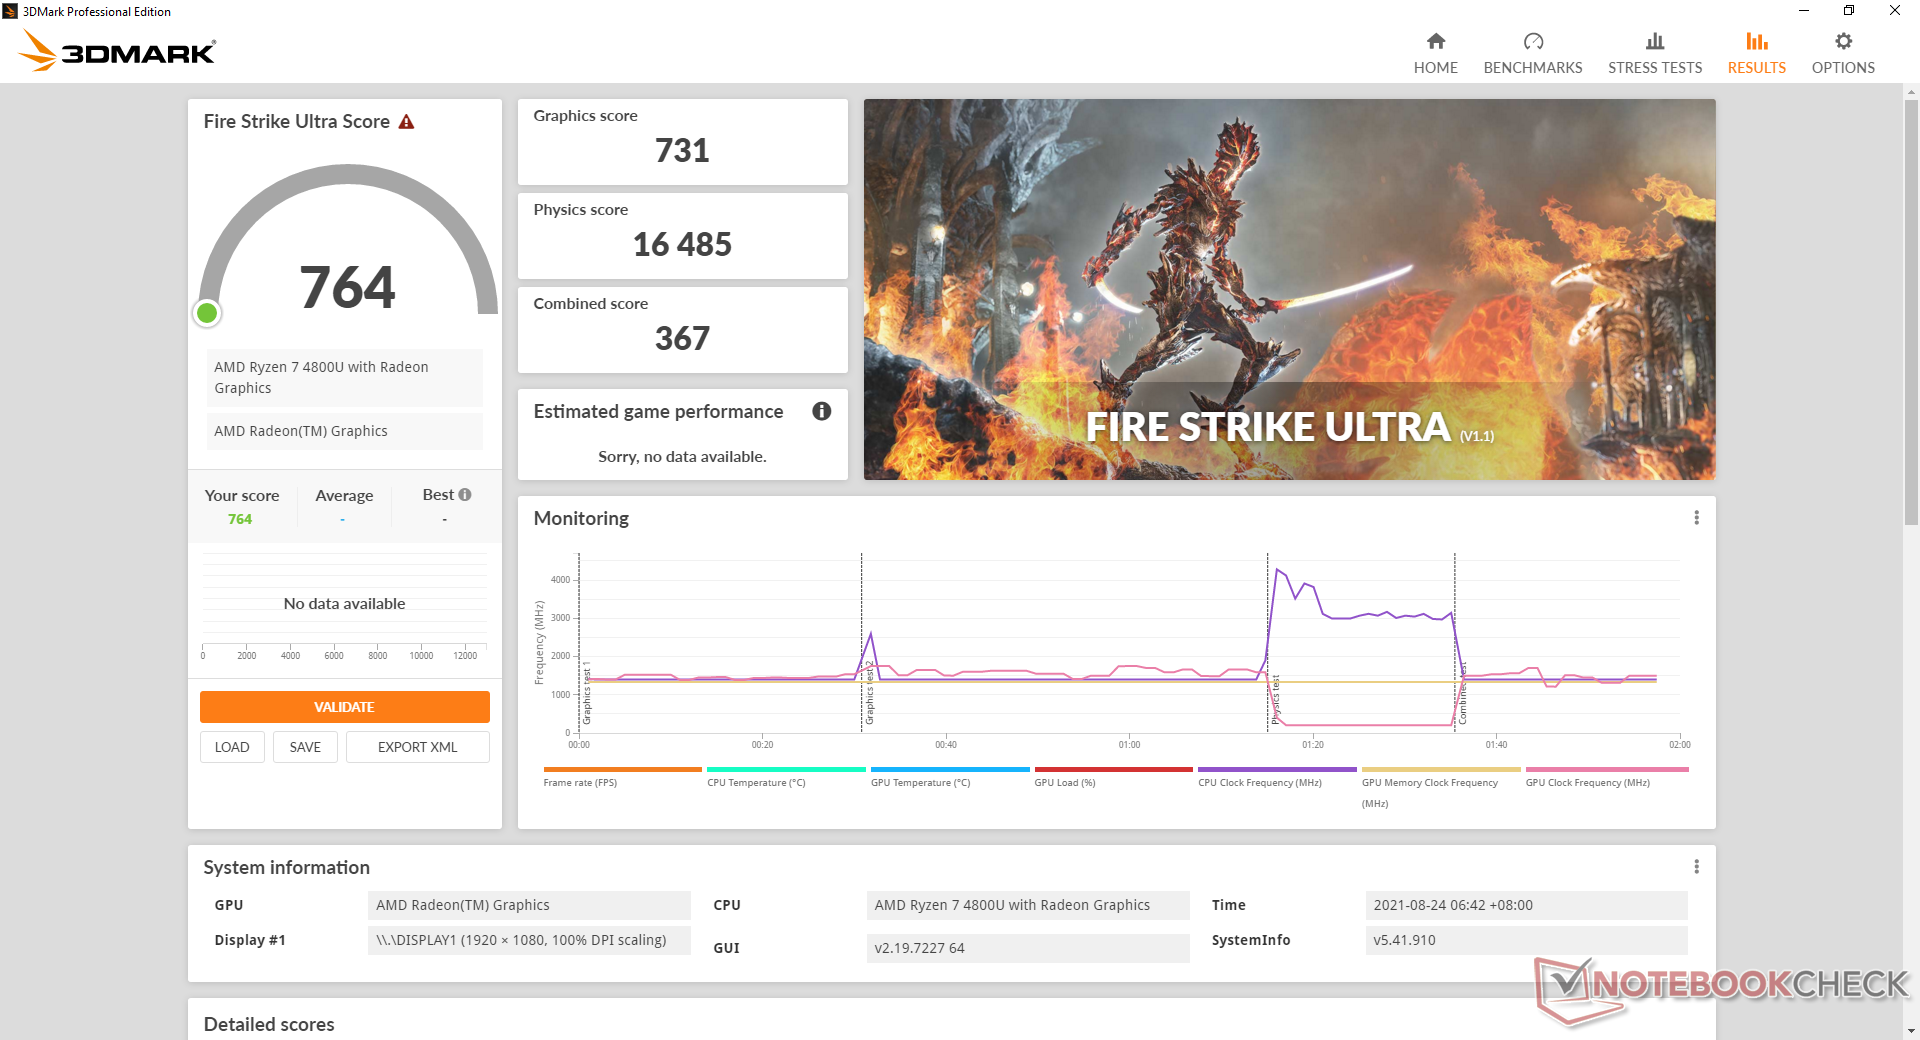
GPU性能
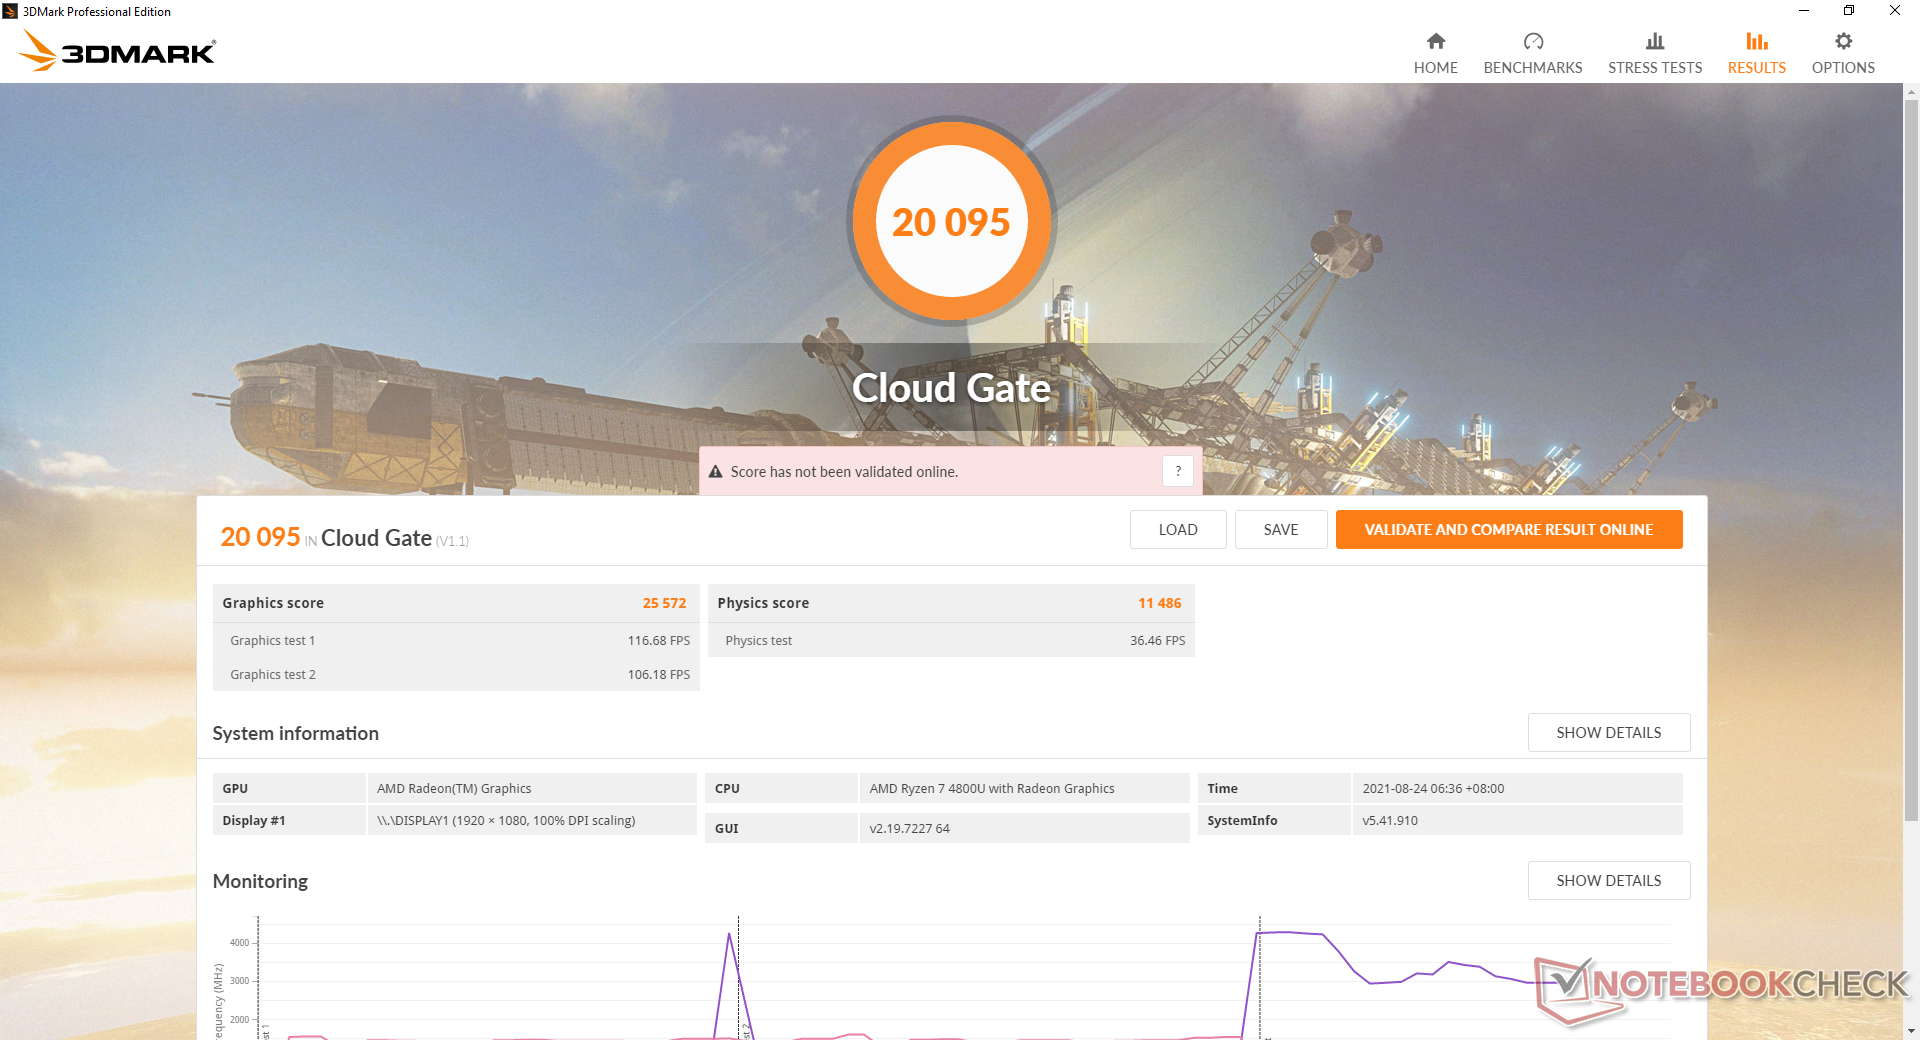
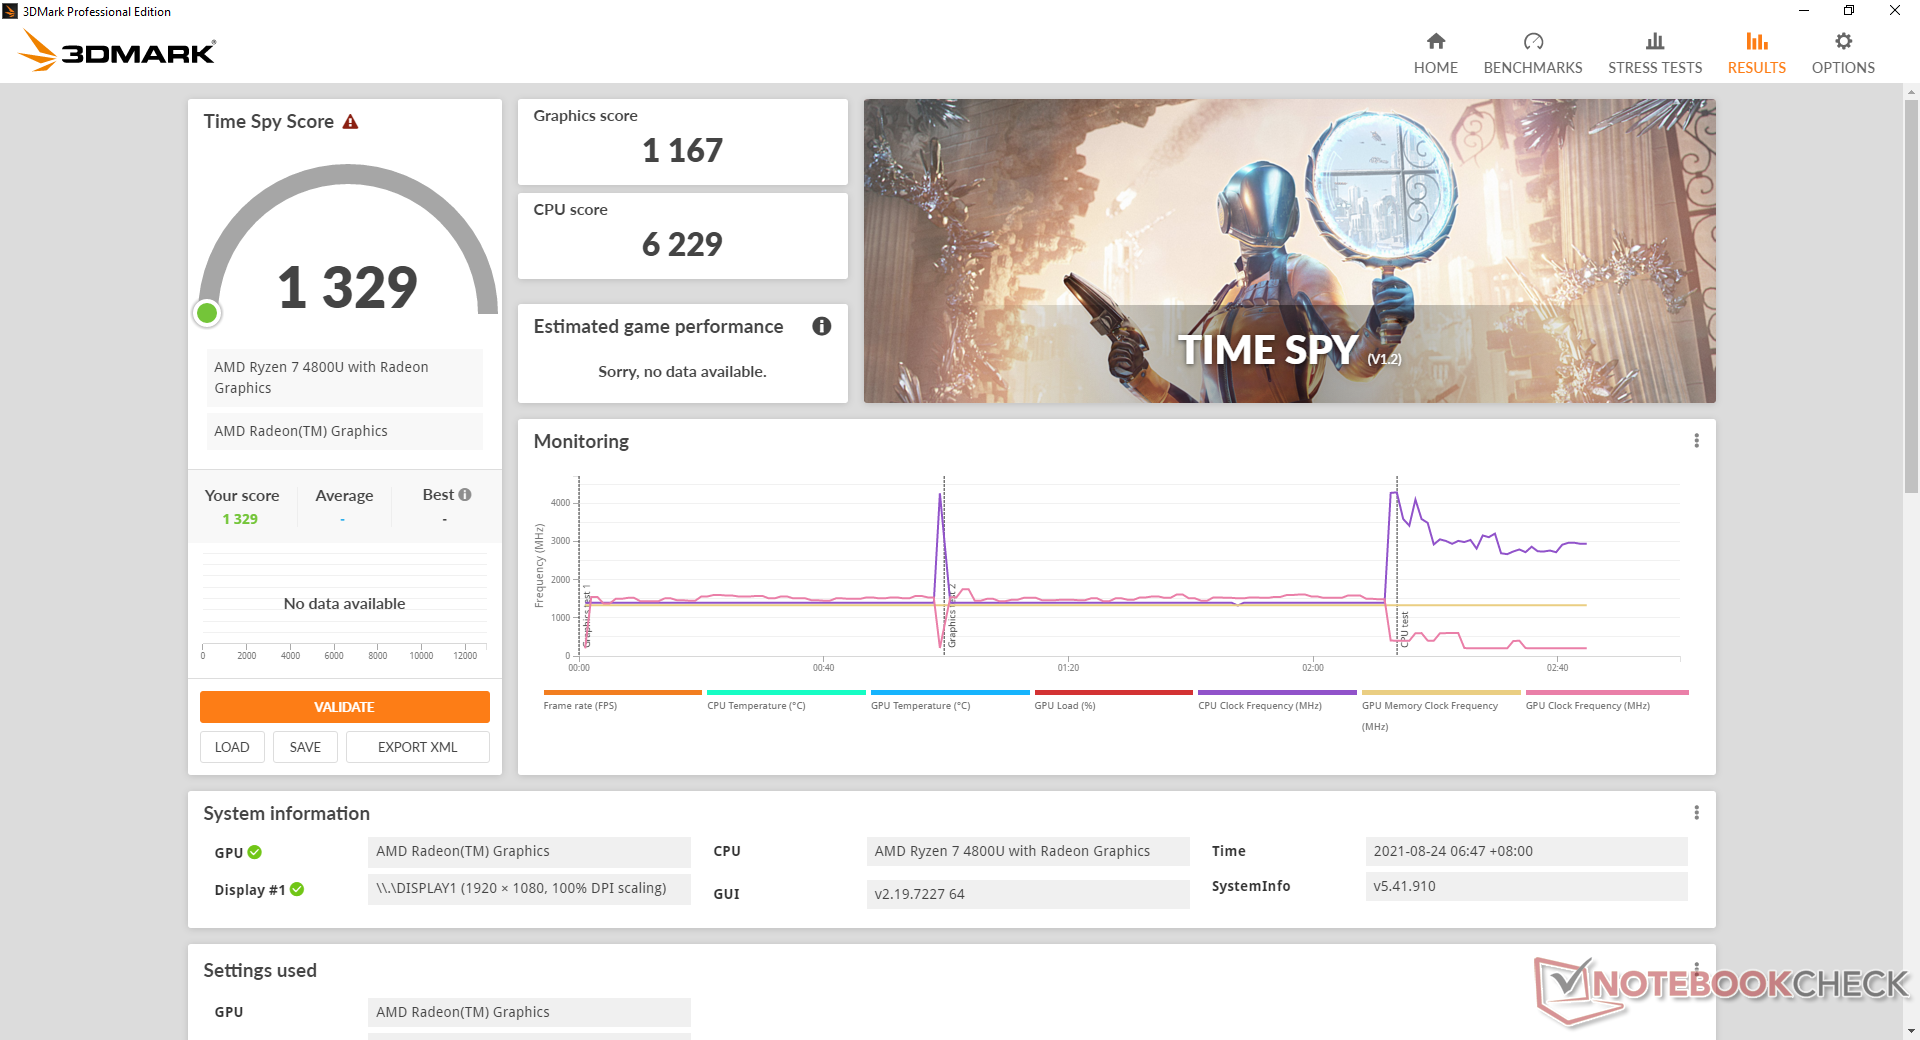
来自我们的图形性能 Radeon RX Vega 8比集成RX Vega 8的Ryzen 5 4500U快30%至40%。 RX Vega 6.然而,它仍然比Core i5和Iris Xe 80 EU都低一个档次。 Iris Xe 80 EUs和酷睿i7 Iris Xe 96 EUs在大多数游戏中,正如我们下面的对比图所示。
| 3DMark 11 | |
| 1280x720 Performance GPU | |
| MSI Summit E14 A11SCS | |
| MSI Modern 14 B11SB-085 | |
| Asus ZenBook 13 UX325EA | |
| Dell Inspiron 14 7400-VY8JW | |
| GPD Win 3 | |
| Average AMD Radeon RX Vega 8 (Ryzen 4000/5000) (3459 - 7591, n=57) | |
| HP Pavilion Aero 13 be0097nr | |
| GPD Win Max 2021 | |
| Lenovo Yoga Slim 7 14ARE05 82A20008GE | |
| Lenovo Yoga 6 13 82ND0009US | |
| HP Envy x360 13-ay0010nr | |
| Honor MagicBook 15 4500U | |
| Infinix INBook X1 Pro | |
| Asus ZenBook 14 UX434FL-DB77 | |
| Asus Zenbook 14 UX433FN-A6023T | |
| 1280x720 Performance Combined | |
| MSI Summit E14 A11SCS | |
| Asus ZenBook 13 UX325EA | |
| MSI Modern 14 B11SB-085 | |
| GPD Win 3 | |
| Dell Inspiron 14 7400-VY8JW | |
| Lenovo Yoga Slim 7 14ARE05 82A20008GE | |
| GPD Win Max 2021 | |
| Asus ZenBook 14 UX434FL-DB77 | |
| Average AMD Radeon RX Vega 8 (Ryzen 4000/5000) (1708 - 5798, n=57) | |
| HP Pavilion Aero 13 be0097nr | |
| Asus Zenbook 14 UX433FN-A6023T | |
| Lenovo Yoga 6 13 82ND0009US | |
| Infinix INBook X1 Pro | |
| Honor MagicBook 15 4500U | |
| HP Envy x360 13-ay0010nr | |
| 3DMark 11 Performance | 5675 points | |
| 3DMark Cloud Gate Standard Score | 20095 points | |
| 3DMark Fire Strike Score | 3368 points | |
| 3DMark Time Spy Score | 1329 points | |
Help | ||
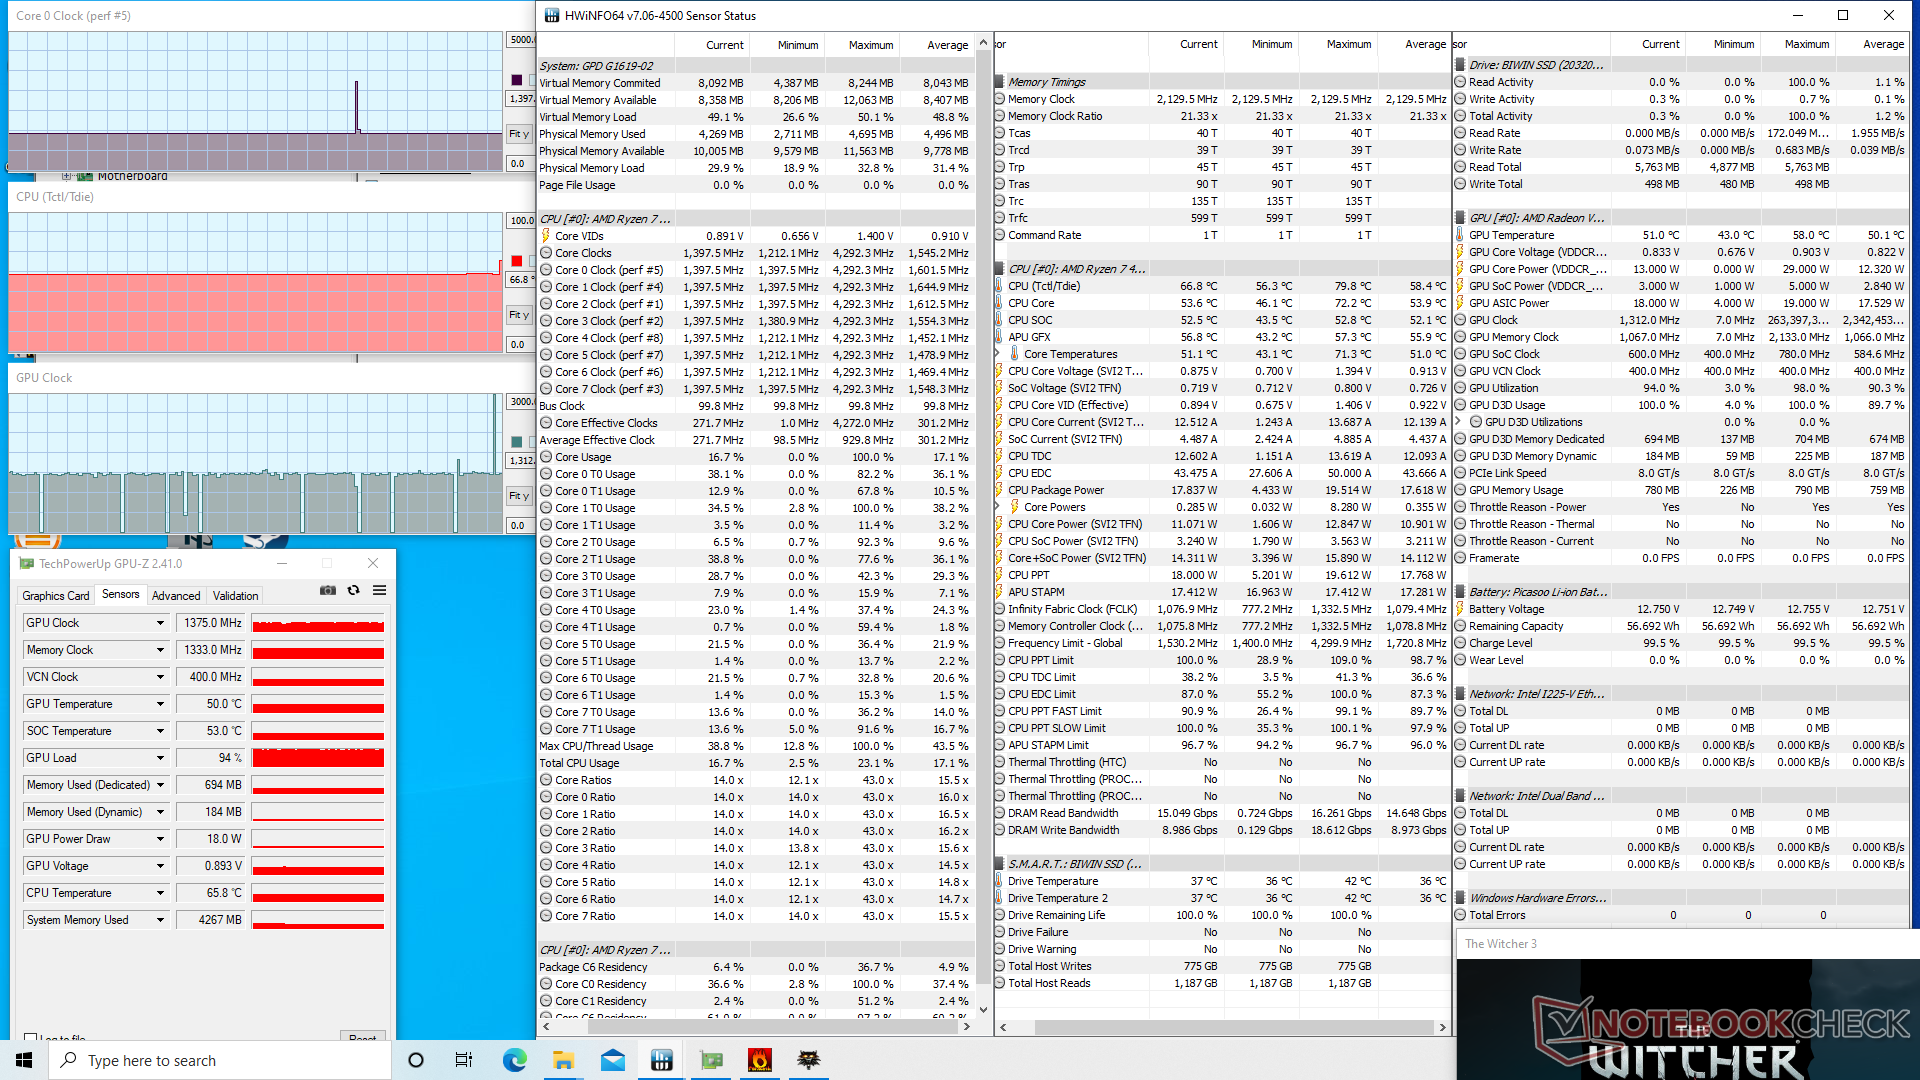
怠速运行 Witcher 3在低设置下显示出相对较差的性能一致性。在测试开始时,帧率会高达55FPS,然后下降到45FPS,然后再跳起来。性能甚至暂时下降到15FPS,表明背景活动影响了游戏性能。
Witcher 3 FPS Chart
| low | med. | high | ultra | |
|---|---|---|---|---|
| GTA V (2015) | 102 | 89.9 | 28 | 12.7 |
| The Witcher 3 (2015) | 73.6 | 45.3 | 24 | 15.2 |
| Dota 2 Reborn (2015) | 97.7 | 80.7 | 50.8 | 48.1 |
| Final Fantasy XV Benchmark (2018) | 35.3 | 17.6 | 12.8 | |
| X-Plane 11.11 (2018) | 40 | 31.8 | 27.9 | |
| Far Cry 5 (2018) | 43 | 20 | 19 | 18 |
| Strange Brigade (2018) | 77.9 | 31.8 | 26.3 | 22.7 |
Emissions
系统噪音
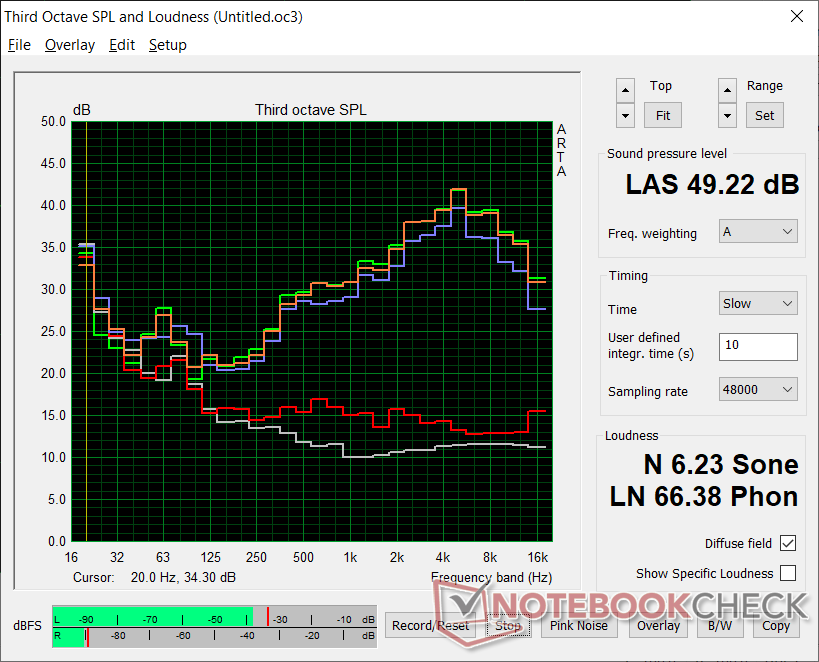
风扇噪音在很大程度上取决于是否切换了涡轮风扇模式。如果激活,在低至中度负荷(如网络浏览或视频流)时,风扇将频繁地脉冲,达到35 dB(A)或更高。在Turbo模式下玩游戏时,风扇噪音会超过49 dB(A),比大多数ULV超极本的噪音还要大。
如果关闭Turbo模式,即使在游戏时,风扇噪音最大也只有34 dB(A),明显更安静,更容易忍受。最重要的是,禁用涡轮增压模式只会影响温度,而不会影响性能,这意味着用户仍然可以从系统中获得全部性能,而不需要将风扇逼到最大。
| GPD Win Max 2021 Vega 8, R7 4800U, BIWIN NS200 512GB CNF82GS1G00-512 | GPD Win 3 Iris Xe G7 80EUs, i5-1135G7, BIWIN NS200 1TB CNF82GS1G02-1TB | HP Pavilion Aero 13 be0097nr Vega 8, R7 5800U, Intel SSD 660p SSDPEKNW512G8 | Lenovo Yoga 6 13 82ND0009US Vega 7, R5 5500U, WDC PC SN530 SDBPMPZ-265G | Asus ZenBook Flip 13 UX363EA-HP069T Iris Xe G7 96EUs, i7-1165G7, WDC PC SN730 SDBPNTY-1T00 | |
|---|---|---|---|---|---|
| Noise | -2% | 17% | 9% | -3% | |
| off / environment * (dB) | 23.3 | 27.4 -18% | 23.9 -3% | 25.1 -8% | 27 -16% |
| Idle Minimum * (dB) | 26.6 | 29.1 -9% | 23.9 10% | 25.1 6% | 27 -2% |
| Idle Average * (dB) | 26.6 | 29.1 -9% | 23.9 10% | 25.1 6% | 27 -2% |
| Idle Maximum * (dB) | 26.6 | 29.1 -9% | 23.9 10% | 25.1 6% | 27 -2% |
| Load Average * (dB) | 46.9 | 40.7 13% | 32.2 31% | 41 13% | 46 2% |
| Witcher 3 ultra * (dB) | 49 | 42.8 13% | 34.7 29% | 38.6 21% | |
| Load Maximum * (dB) | 49.2 | 46.3 6% | 34.8 29% | 38.7 21% | 46.6 5% |
* ... smaller is better
Noise level
| Idle |
| 26.6 / 26.6 / 26.6 dB(A) |
| Load |
| 46.9 / 49.2 dB(A) |
 | ||
30 dB silent 40 dB(A) audible 50 dB(A) loud |
||
min: | ||
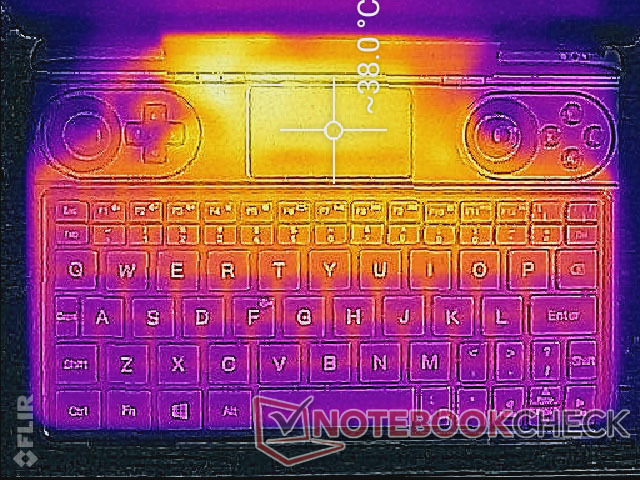
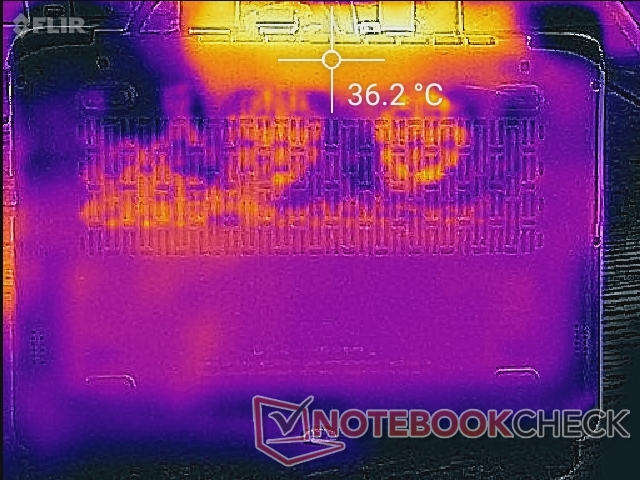
温度
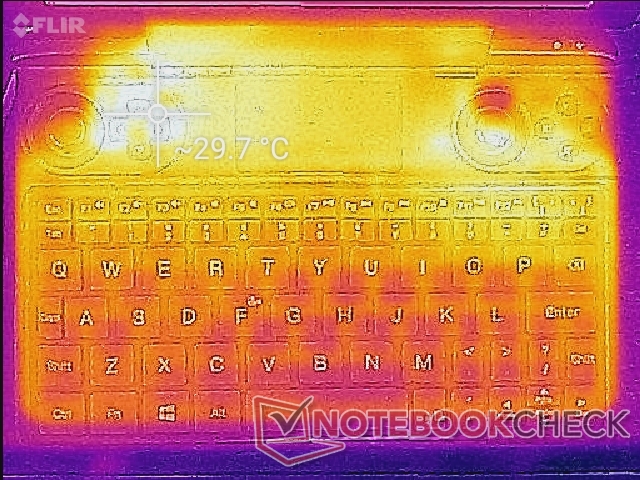
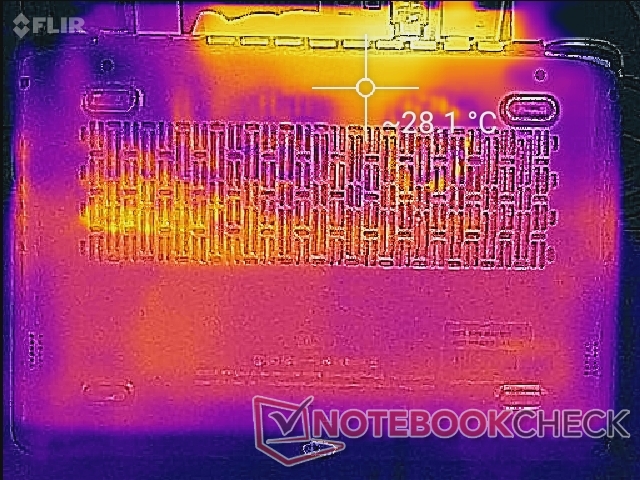
在涡轮风扇模式激活的情况下,游戏时的热点在点击板上只有38℃左右。靠近后角的键盘和控制器按钮等重要区域仍然比较凉爽舒适。当Turbo风扇关闭时,表面温度将略微升高。

(+) The maximum temperature on the upper side is 38 °C / 100 F, compared to the average of 37.9 °C / 100 F, ranging from 26.6 to 55 °C for the class Handheld / UMPC.
(+) The bottom heats up to a maximum of 36.4 °C / 98 F, compared to the average of 36.7 °C / 98 F
(+) In idle usage, the average temperature for the upper side is 27.7 °C / 82 F, compared to the device average of 32.8 °C / 91 F.
(+) The palmrests and touchpad are cooler than skin temperature with a maximum of 28.6 °C / 83.5 F and are therefore cool to the touch.
(+) The average temperature of the palmrest area of similar devices was 32.4 °C / 90.3 F (+3.8 °C / 6.8 F).
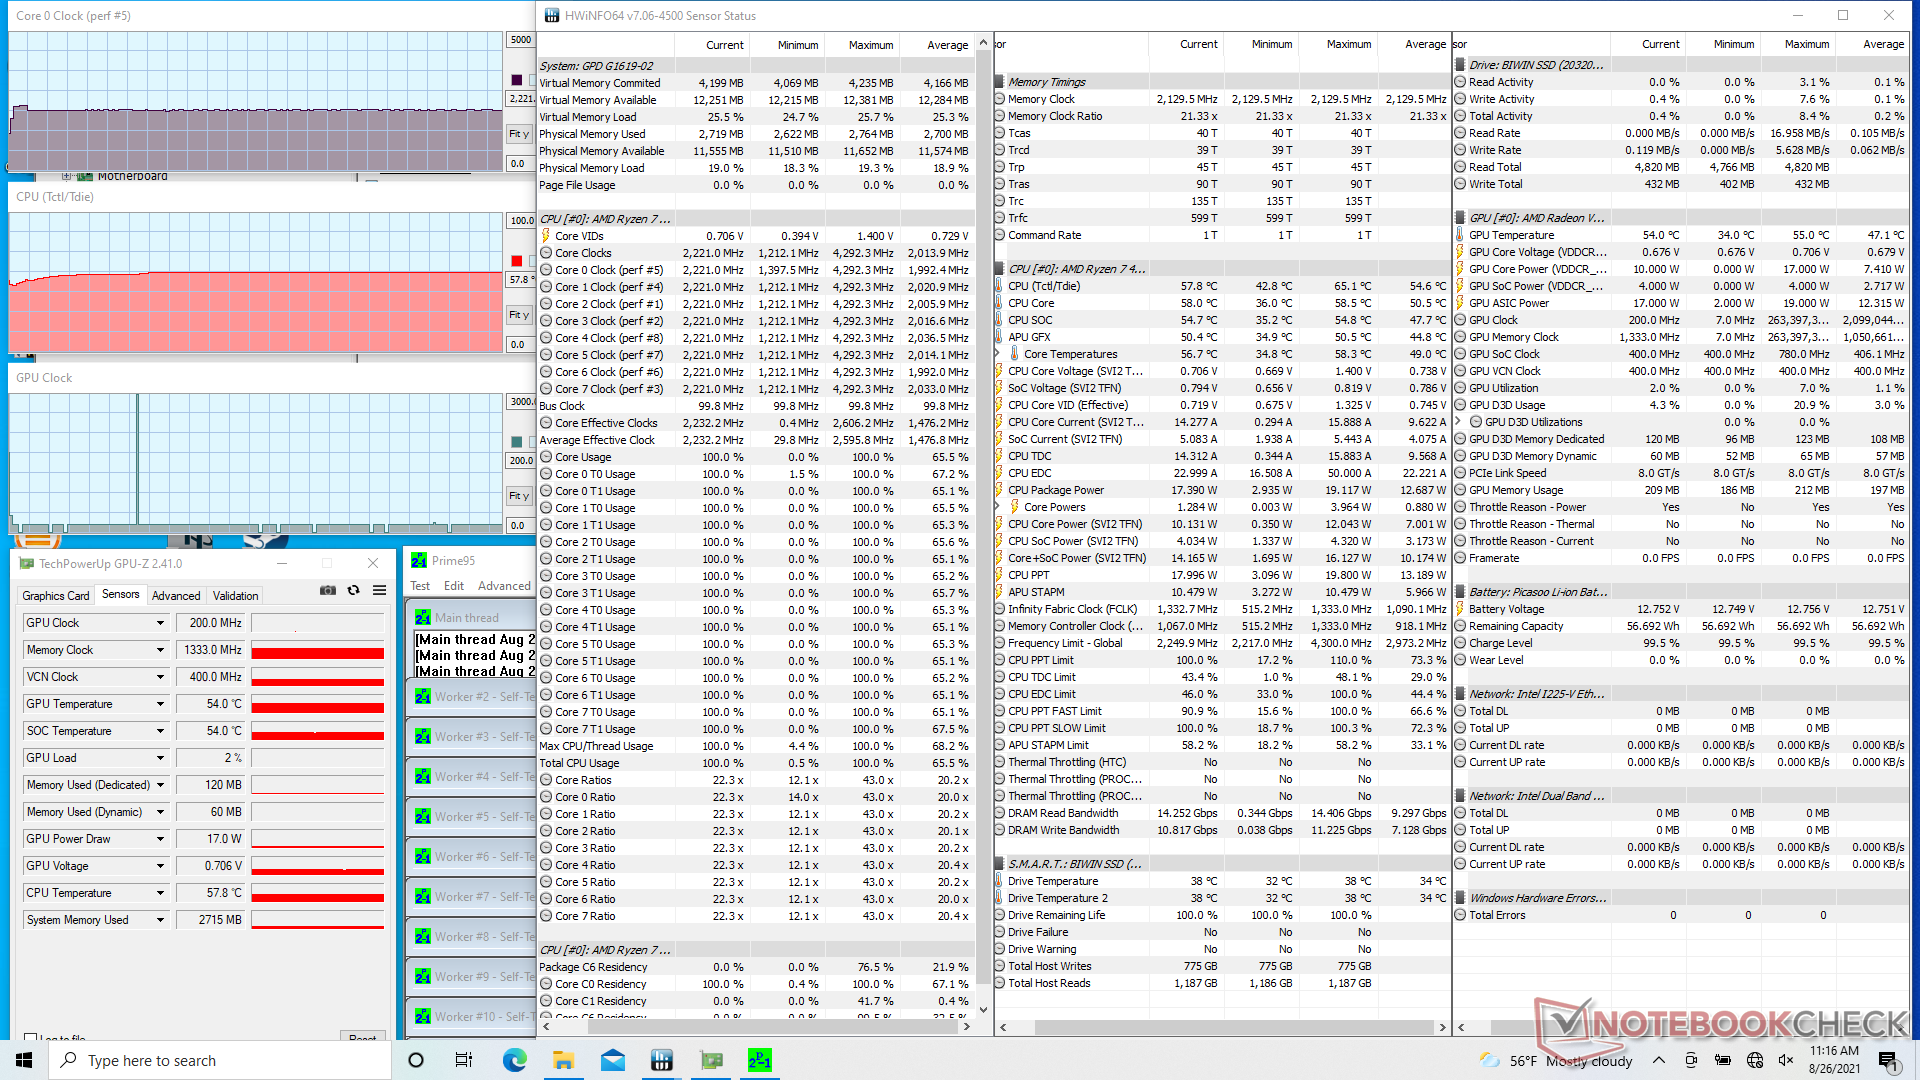
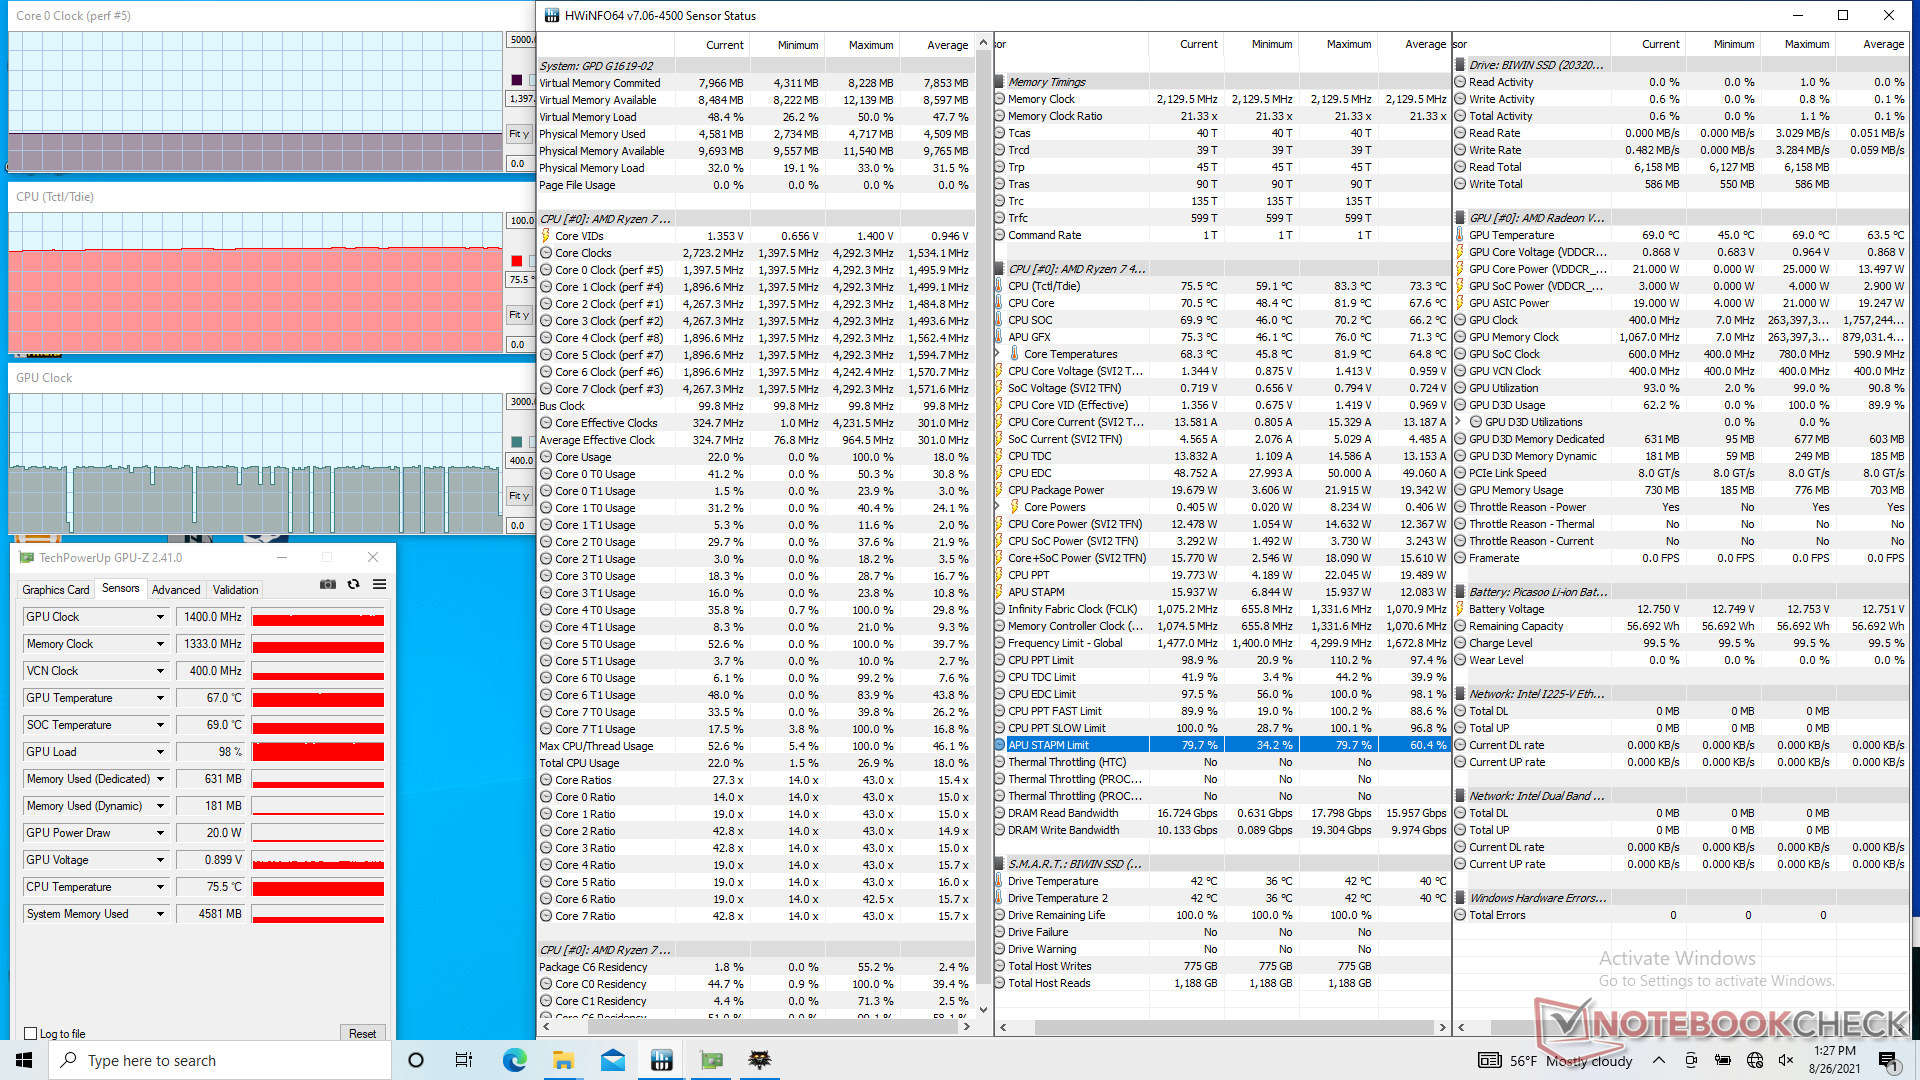
压力测试
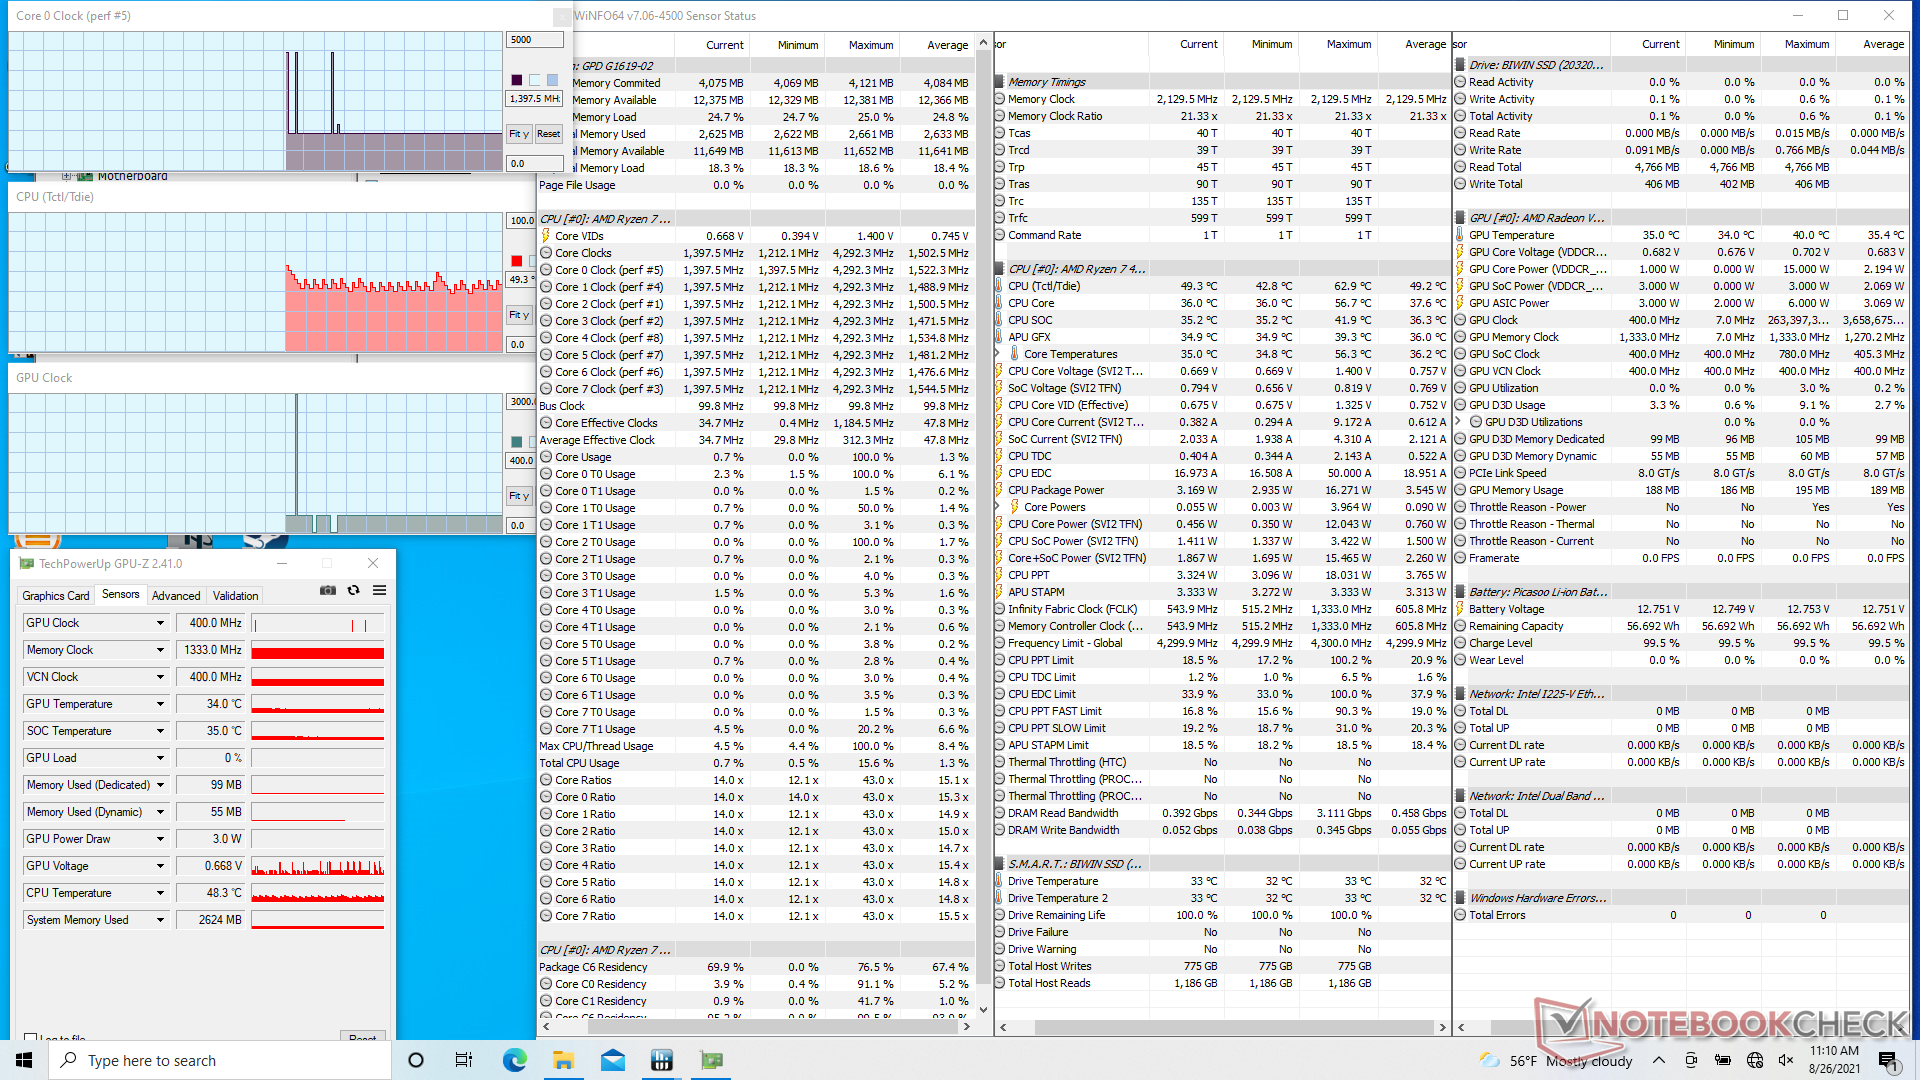
当运行Prime95对CPU施加压力时,时钟速率会在最初几秒钟内提升到2.4GHz,然后略微下降并稳定在2.2GHz。
有趣的是,涡轮风扇模式并没有提高游戏性能,因为CPU和GPU的时钟速率保持不变。相反,CPU温度将下降近10摄氏度,如果需要的话,为用户提供额外的超频空间。
用电池供电运行不会限制性能。在电池上进行的3DMark 11测试将返回物理和图形分数,分别为11664和5492分,而在主电源上则为11658和5397分。
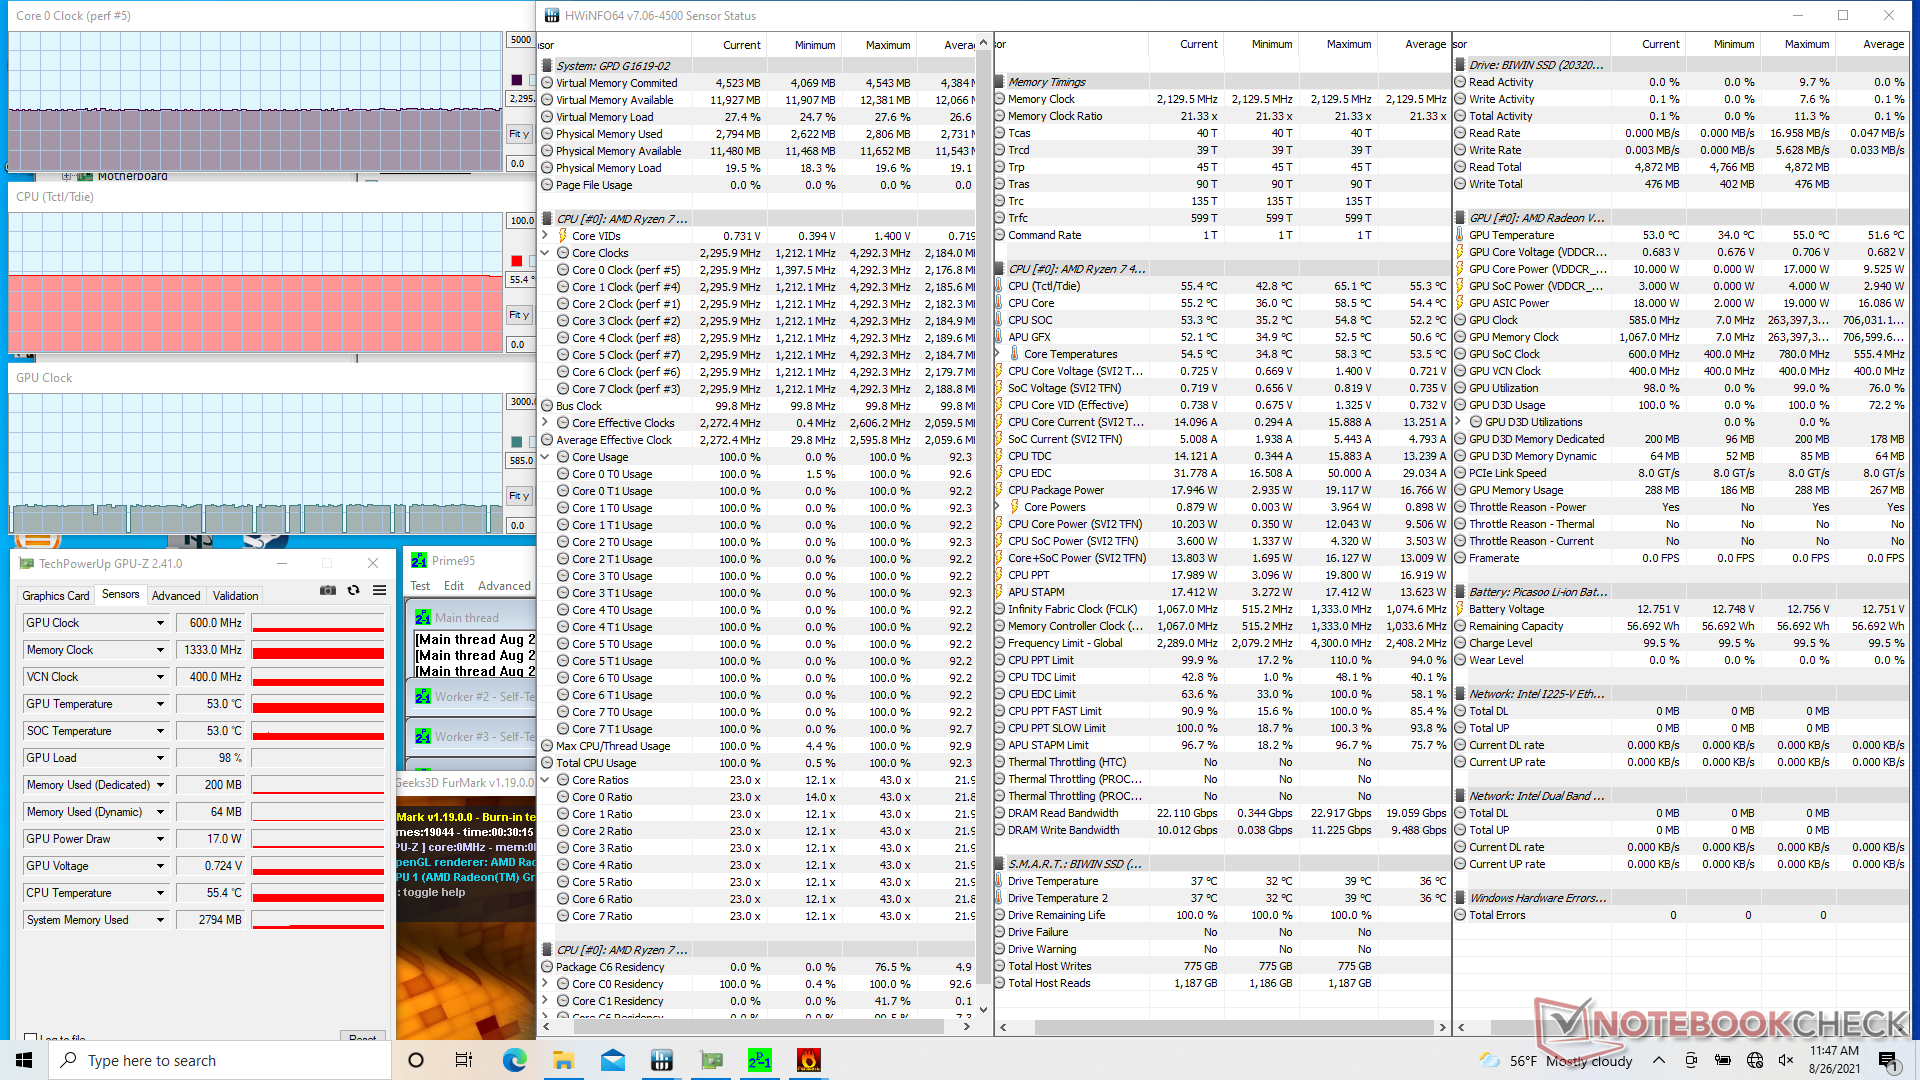
| CPU时钟(GHz) | GPU时钟(MHz) | CPU平均温度(℃) | |
| 系统空闲 | -- | -- | 49 |
| Prime95压力 | 2.2 | -- | 58 |
| Prime95 + FurMark压力 | 2.3 | 600 | 55 |
| Witcher 3 压力(涡轮风扇关闭) | 1.4 | 1400 | 76 |
| Witcher 3 Stress (Turbo fan on) | 1.4 | 1375 | 67 |
发言人


GPD Win Max 2021 audio analysis
(±) | speaker loudness is average but good (81.1 dB)
Bass 100 - 315 Hz
(-) | nearly no bass - on average 25.9% lower than median
(±) | linearity of bass is average (7.2% delta to prev. frequency)
Mids 400 - 2000 Hz
(+) | balanced mids - only 4% away from median
(+) | mids are linear (6.9% delta to prev. frequency)
Highs 2 - 16 kHz
(±) | higher highs - on average 6.4% higher than median
(±) | linearity of highs is average (8.4% delta to prev. frequency)
Overall 100 - 16.000 Hz
(±) | linearity of overall sound is average (23.4% difference to median)
Compared to same class
» 92% of all tested devices in this class were better, 8% similar, 0% worse
» The best had a delta of 12%, average was 17%, worst was 23%
Compared to all devices tested
» 70% of all tested devices were better, 6% similar, 24% worse
» The best had a delta of 4%, average was 23%, worst was 134%
Apple MacBook 12 (Early 2016) 1.1 GHz audio analysis
(+) | speakers can play relatively loud (83.6 dB)
Bass 100 - 315 Hz
(±) | reduced bass - on average 11.3% lower than median
(±) | linearity of bass is average (14.2% delta to prev. frequency)
Mids 400 - 2000 Hz
(+) | balanced mids - only 2.4% away from median
(+) | mids are linear (5.5% delta to prev. frequency)
Highs 2 - 16 kHz
(+) | balanced highs - only 2% away from median
(+) | highs are linear (4.5% delta to prev. frequency)
Overall 100 - 16.000 Hz
(+) | overall sound is linear (10.2% difference to median)
Compared to same class
» 7% of all tested devices in this class were better, 2% similar, 90% worse
» The best had a delta of 5%, average was 18%, worst was 53%
Compared to all devices tested
» 5% of all tested devices were better, 1% similar, 94% worse
» The best had a delta of 4%, average was 23%, worst was 134%
Energy Management
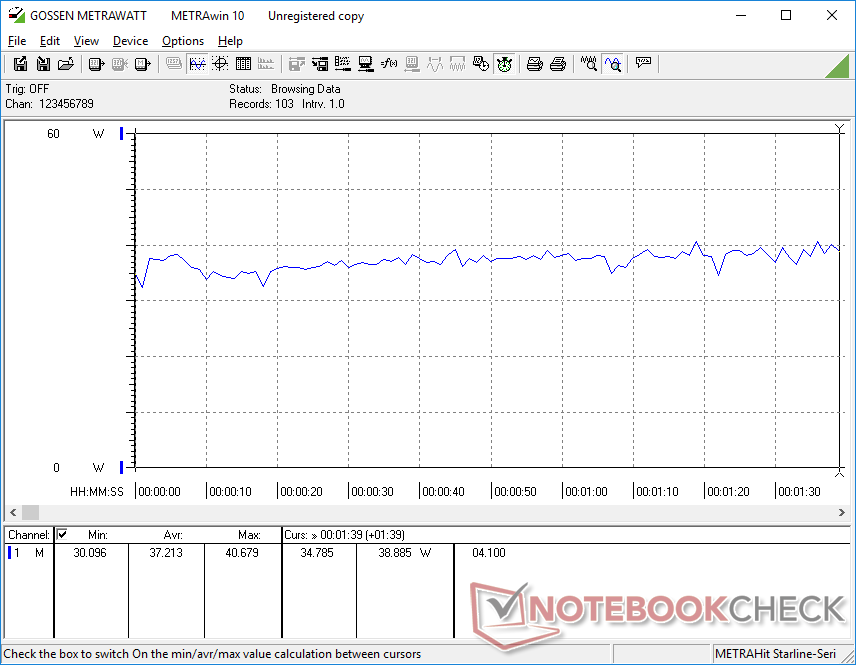
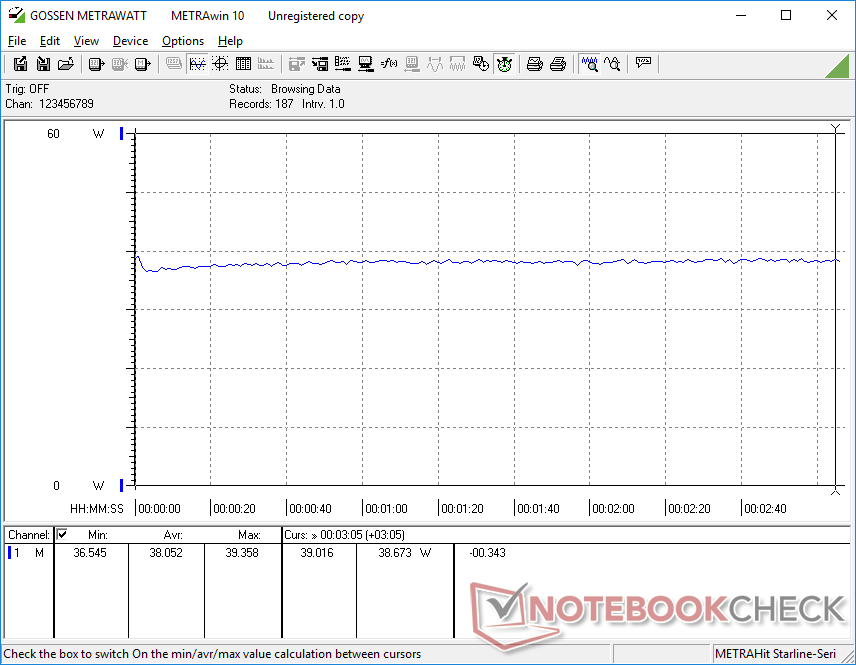
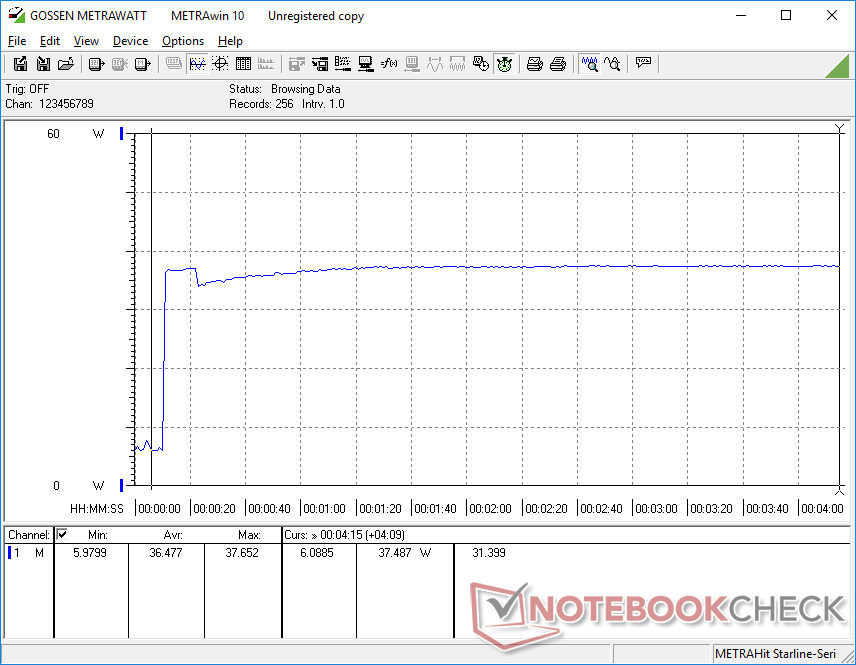
消耗功率
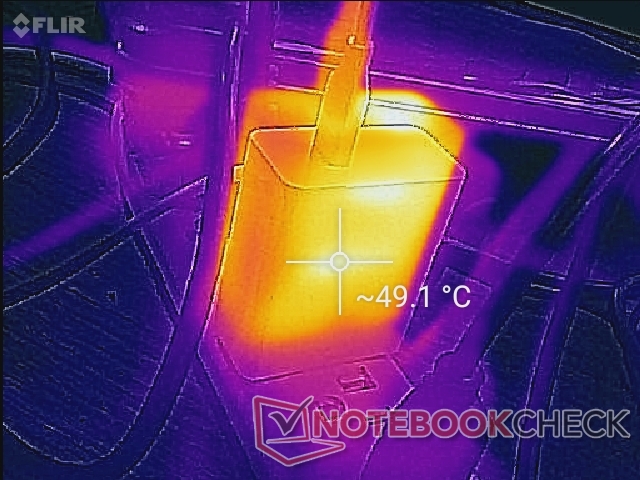
在没有运行应用程序的情况下,在桌面上空转,根据亮度水平和电源配置文件,消耗5W至8W,这与许多ULV笔记本电脑惊人地相似。使用小型(约6.4 x 5.5 x 2.8厘米)的65瓦USB-C交流适配器,游戏消耗约37瓦。
| Off / Standby | |
| Idle | |
| Load |
|
Key:
min: | |
| GPD Win Max 2021 R7 4800U, Vega 8, BIWIN NS200 512GB CNF82GS1G00-512, IPS, 1280x800, 8" | GPD Win 3 i5-1135G7, Iris Xe G7 80EUs, BIWIN NS200 1TB CNF82GS1G02-1TB, IPS, 1280x720, 5.5" | HP Pavilion Aero 13 be0097nr R7 5800U, Vega 8, Intel SSD 660p SSDPEKNW512G8, IPS, 1920x1200, 13.3" | Lenovo Yoga 6 13 82ND0009US R5 5500U, Vega 7, WDC PC SN530 SDBPMPZ-265G, IPS, 1920x1080, 13.3" | Asus ZenBook Flip 13 UX363EA-HP069T i7-1165G7, Iris Xe G7 96EUs, WDC PC SN730 SDBPNTY-1T00, OLED, 1920x1080, 13.3" | Asus ZenBook 13 UX325EA i7-1165G7, Iris Xe G7 96EUs, SK Hynix HFM001TD3JX013N, OLED, 1920x1080, 13.3" | |
|---|---|---|---|---|---|---|
| Power Consumption | 22% | 1% | -1% | 3% | 11% | |
| Idle Minimum * (Watt) | 5.2 | 2.9 44% | 3.4 35% | 5 4% | 4.4 15% | 3.6 31% |
| Idle Average * (Watt) | 6.5 | 4.5 31% | 6.9 -6% | 6.3 3% | 7.4 -14% | 6.3 3% |
| Idle Maximum * (Watt) | 7.4 | 4.5 39% | 8 -8% | 6.9 7% | 11.3 -53% | 7.6 -3% |
| Load Average * (Watt) | 37.2 | 38.5 -3% | 42.6 -15% | 41.5 -12% | 22 41% | 31 17% |
| Witcher 3 ultra * (Watt) | 38.1 | 28.9 24% | 35.2 8% | 33.2 13% | 22.8 40% | |
| Load Maximum * (Watt) | 39 | 41.4 -6% | 43.1 -11% | 46.5 -19% | 42.5 -9% | 36 8% |
* ... smaller is better
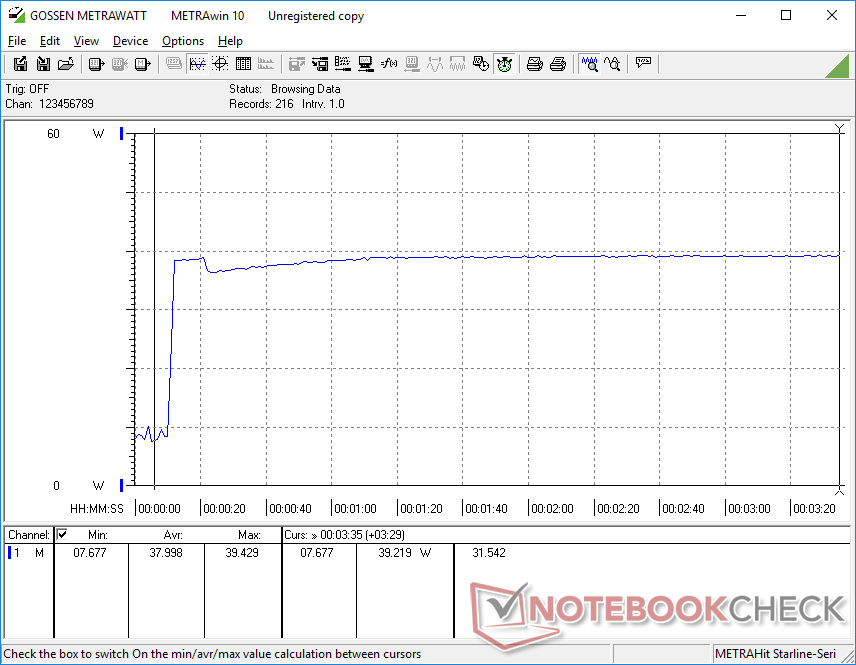
Power Consumption Witcher 3 / Stresstest
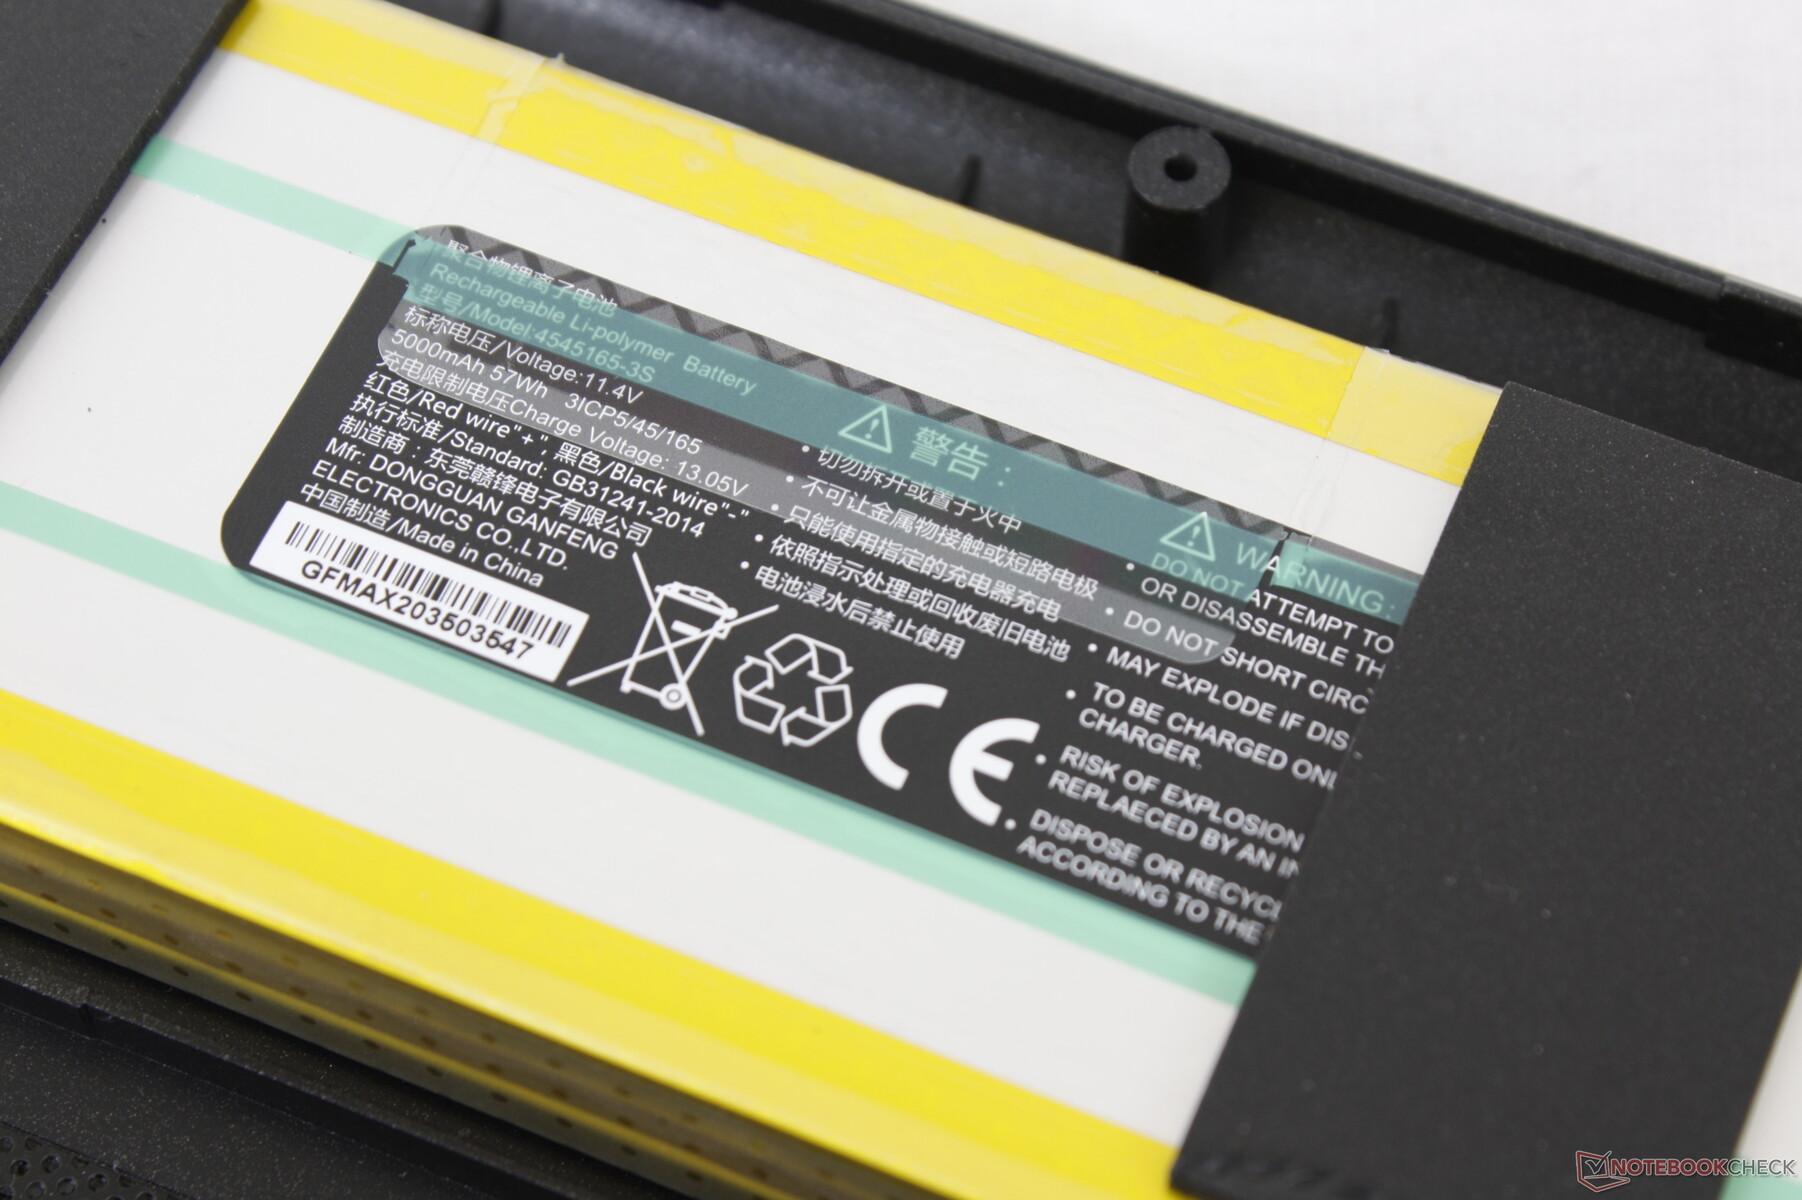
电池寿命
57瓦,内部电池比预期的手持设备要大。在浏览网页时,我们能挤出9个多小时,在不停地玩游戏时,能挤出2到3个小时。
从空电到满电大约需要90分钟。

| GPD Win Max 2021 R7 4800U, Vega 8, 57 Wh | GPD Win 3 i5-1135G7, Iris Xe G7 80EUs, 44 Wh | HP Pavilion Aero 13 be0097nr R7 5800U, Vega 8, 43 Wh | Lenovo Yoga 6 13 82ND0009US R5 5500U, Vega 7, 60 Wh | Asus ZenBook Flip 13 UX363EA-HP069T i7-1165G7, Iris Xe G7 96EUs, 67 Wh | Asus ZenBook 13 UX325EA i7-1165G7, Iris Xe G7 96EUs, 67 Wh | |
|---|---|---|---|---|---|---|
| Battery runtime | 22% | -3% | 42% | 15% | 15% | |
| WiFi v1.3 (h) | 9.3 | 11.3 22% | 9 -3% | 13.2 42% | 10.7 15% | 10.7 15% |
| Load (h) | 1.3 | 1.8 | 2 | 3.4 | 3 | |
| Reader / Idle (h) | 18.9 | 17.5 | 20.5 | |||
| Witcher 3 ultra (h) | 3.2 |
Pros
Cons
结论--有希望,但需要更多努力
我们喜欢Windows 10 UMPC的概念,它足够强大,可用于720p游戏,Ryzen 7 4800U在这方面能够实现。然而,围绕处理器的实际包装需要改进。机箱吱吱作响,不舒服,小操纵杆的运动范围太窄,触摸板是跳动的,没有集成网络摄像头,我们的MicroSD读卡器甚至不能工作。按照今天的标准,集成的WLAN很慢,不支持DP-over-USB,而且显示屏更倾向于预算范围,而不是高端或中端范围,不支持自适应同步。
性能令人钦佩,甚至可以与最新一批Tiger Lake 超极本相媲美。然而,围绕着处理器的硬件和显示屏需要更多的微调,才能真正将其击倒在地。
较长的电池寿命,涡轮模式下相对安静的风扇噪音,以及令人满意的按键反馈都值得称赞。然而,我们与Win Max相处的时间越长,就越难忽视更多的小问题。建议使用酷睿i7版本,以最大限度地提高游戏性能,而我们的Ryzen 7 SKU将是最大化原始多线程CPU性能的理想选择。
价格和可用性
截至本文撰写时,Win Max 2021尚未在各在线零售商中广泛销售。GPD正计划从今年10月开始供货。
GPD Win Max 2021
- 08/30/2021 v7 (old)
Allen Ngo
Price comparison

