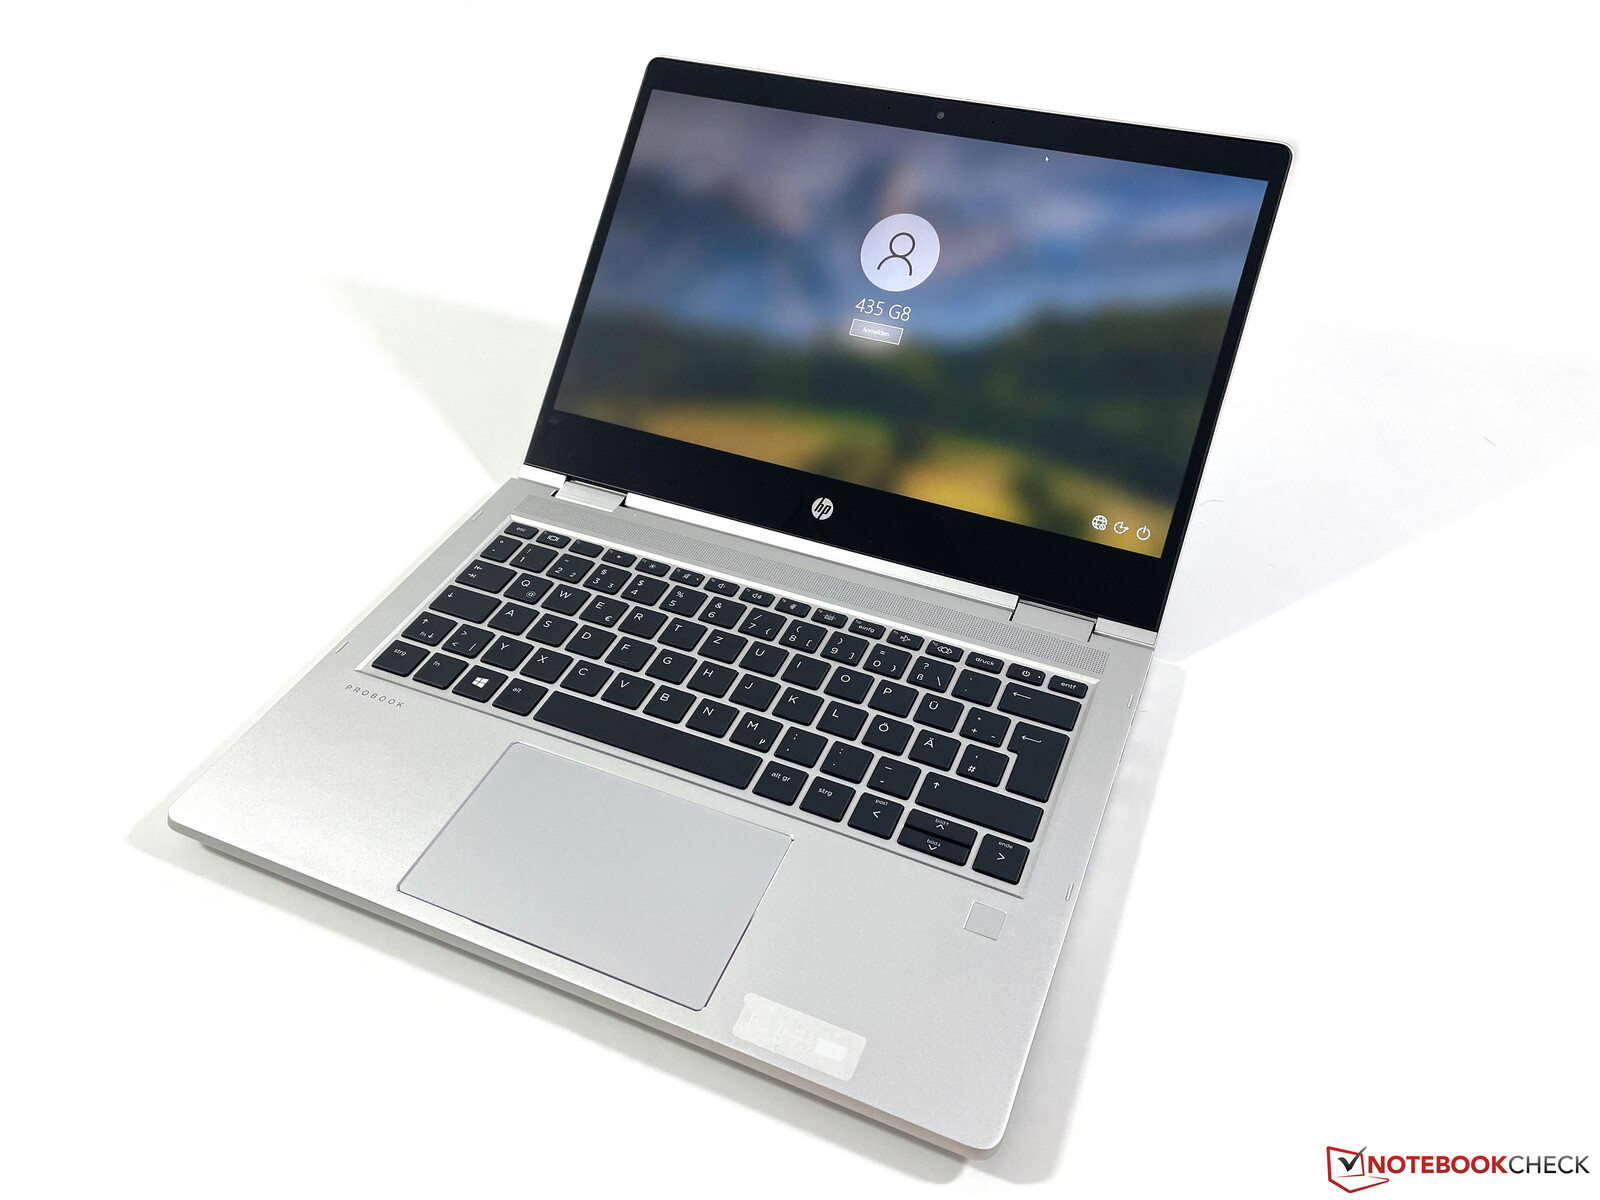
惠普ProBook x360 435 G8 AMD评测--入门级商务敞篷车配备Zen 3 Ryzen CPU
ProBook x360 435是惠普的一款入门级商务敞篷车,依靠AMD处理器(英特尔对应产品的后缀是430)。现在是第8代,它只是一个小更新,因为外壳和端口都没有改变。然而,来自AMD的新Ryzen 5000移动处理器提供了一个显著的性能提升,将这个紧凑的可折叠机变成一个真正的动力源。我们测试了32N18EA#ABD型号,价格约为1100欧元(约1305美元),它配备了快速的 Ryzen 7 5800U16GB内存、512GB PCI-SSD和光亮的1080p触摸屏;便宜的版本起价为880欧元(约1044美元)。
Possible competitors in comparison
Rating | Date | Model | Weight | Height | Size | Resolution | Price |
|---|---|---|---|---|---|---|---|
| 85.7 % v7 (old) | 08 / 2021 | HP ProBook x360 435 G8 R7-5800U R7 5800U, Vega 8 | 1.5 kg | 18 mm | 13.30" | 1920x1080 | |
| 88.3 % v7 (old) | 09 / 2021 | Lenovo ThinkPad L13 Yoga Gen2-20VK000VGE i5-1135G7, Iris Xe G7 80EUs | 1.5 kg | 17.6 mm | 13.30" | 1920x1080 | |
| 86.2 % v7 (old) | Fujitsu LifeBook U9310X i5-10210U, UHD Graphics 620 | 1 kg | 17 mm | 13.30" | 1920x1080 | ||
| 85.7 % v7 (old) | Acer Spin 3 SP313-51N-56YV i5-1135G7, Iris Xe G7 80EUs | 1.4 kg | 16 mm | 13.30" | 2560x1600 |
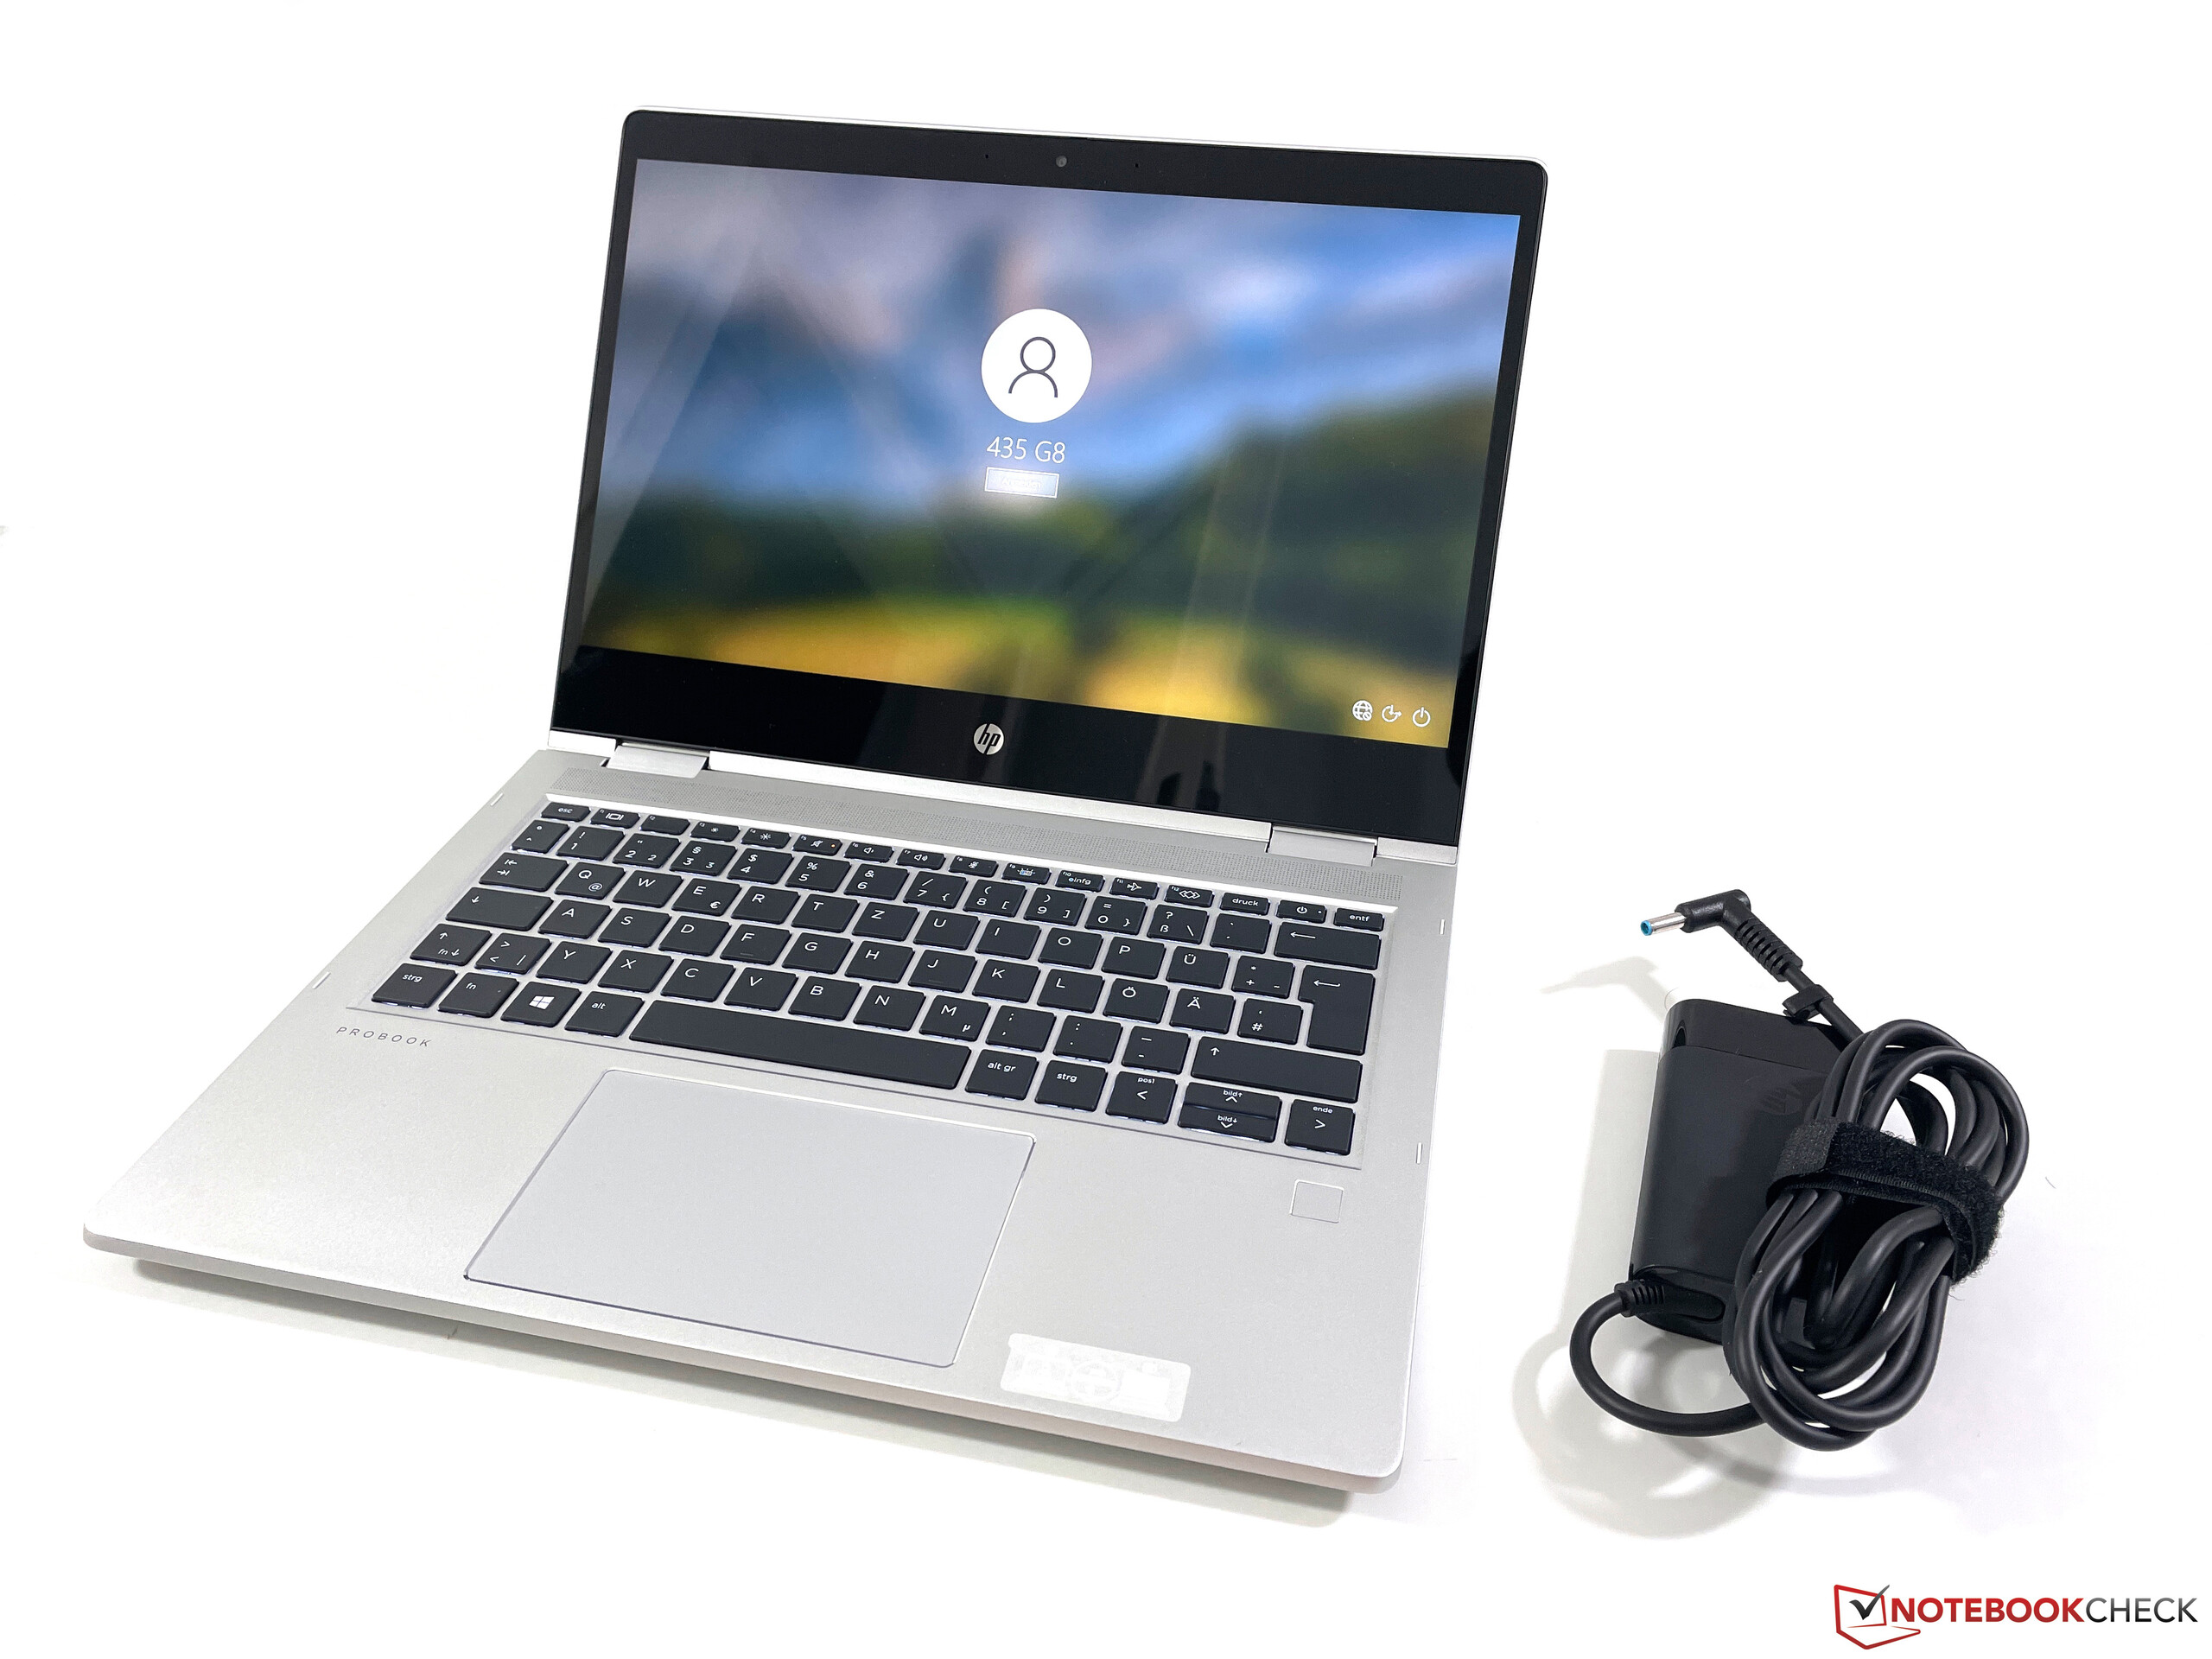
案例与设备
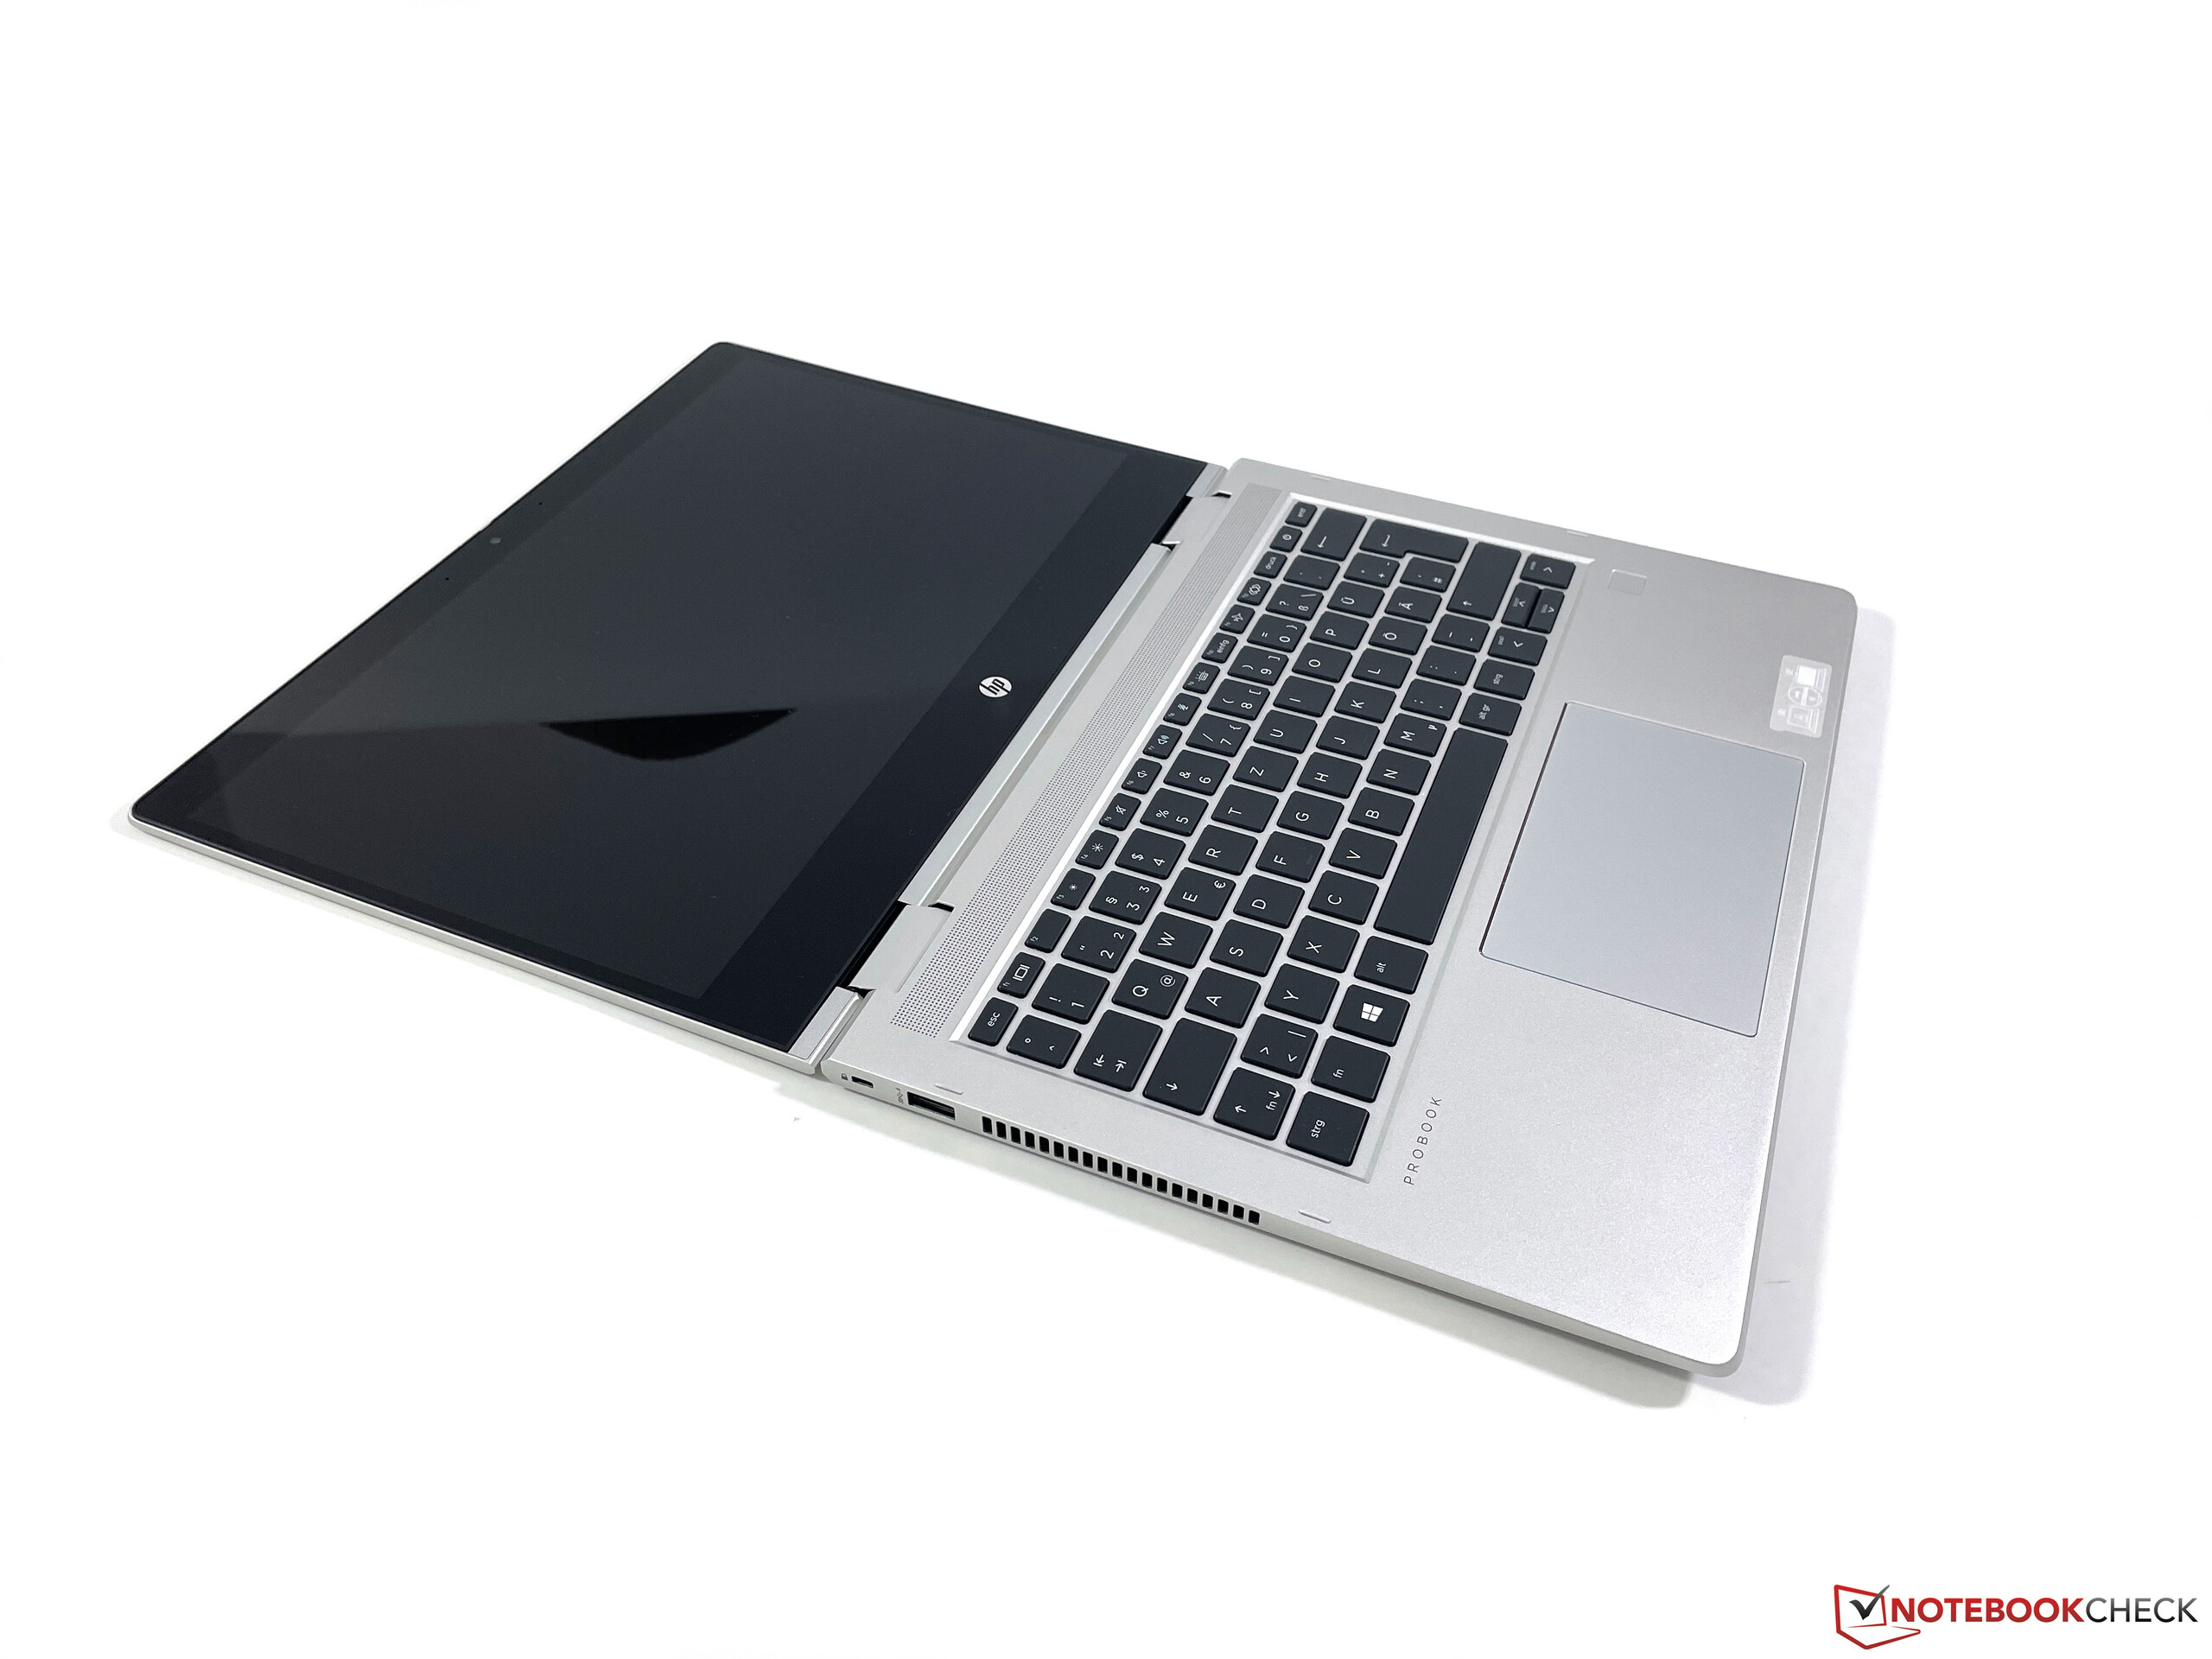
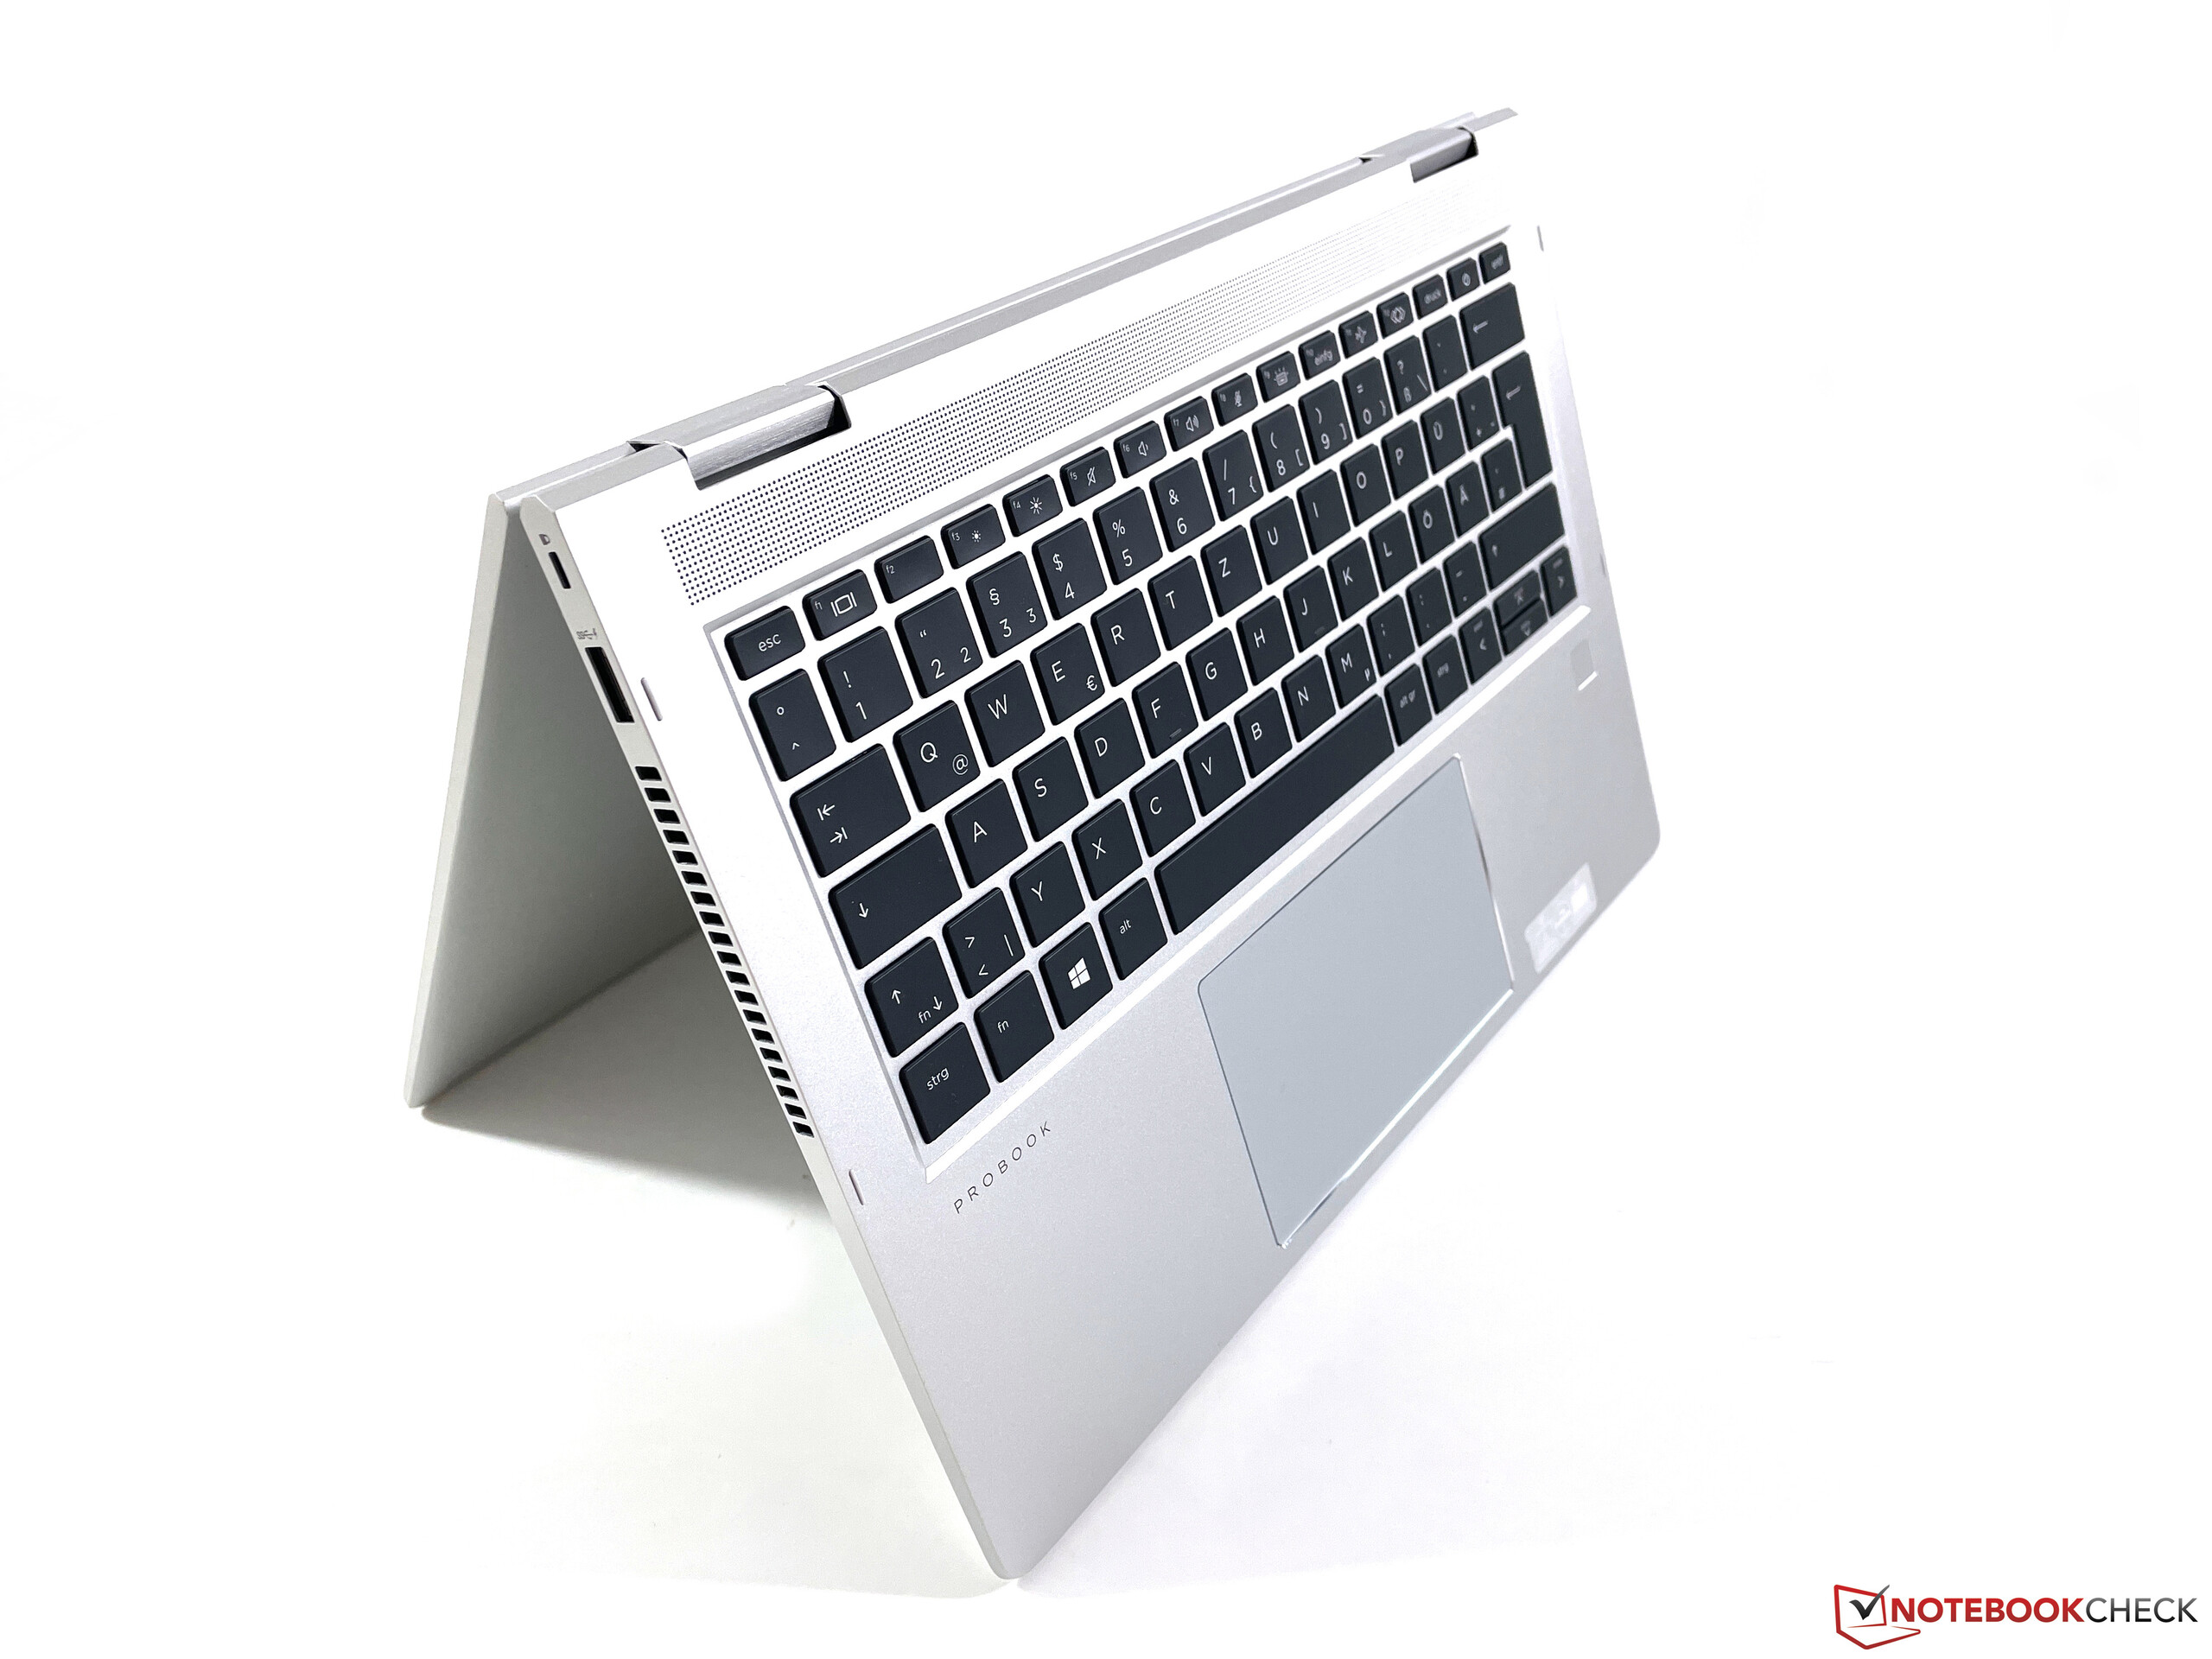
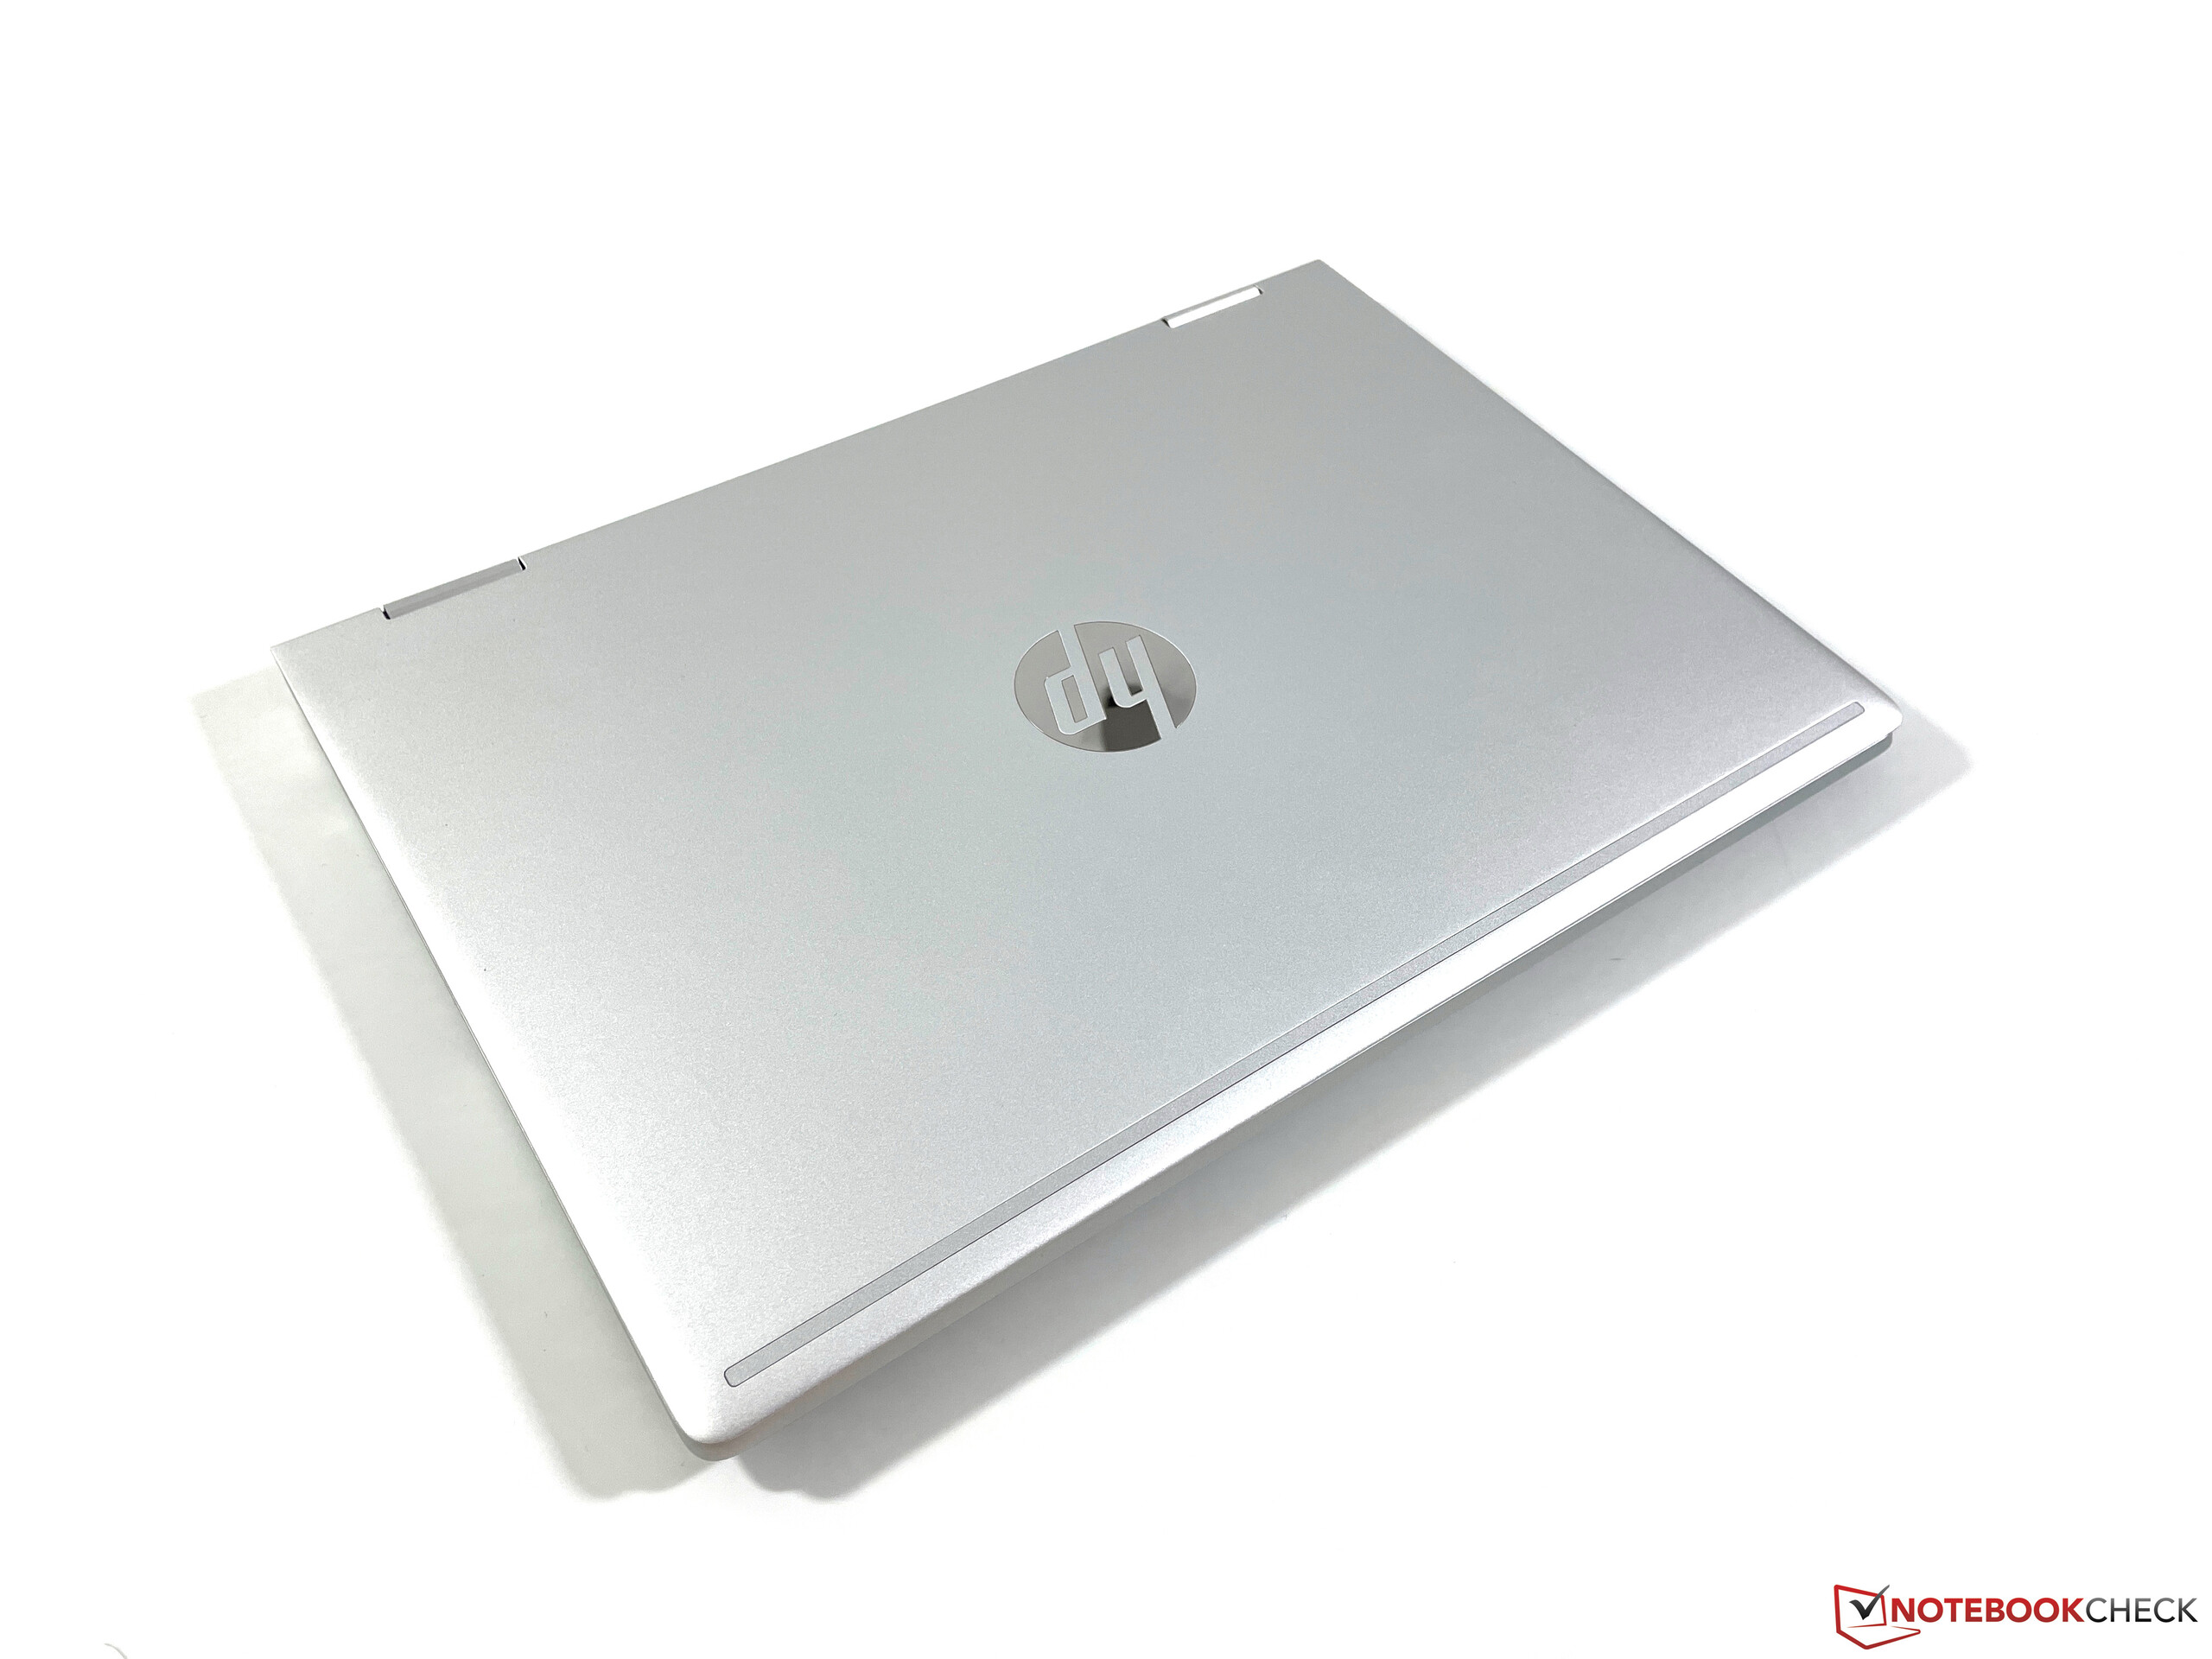
铝制外壳没有任何变化。从外观上看,该设备给人以高质量的印象,第一眼就看不出与惠普更昂贵的EliteBooks有什么区别。这也适用于稳定性和做工,它们都很出色。底座不受压力的影响,屏幕有额外的玻璃板保护,几乎不可能被扭曲。只有来自背后的压力才会很快在面板上出现明显的波纹。在这个类别中,ProBook与它的直接竞争对手联想的产品相比也有明显的优势,即 ThinkPad L13 Yoga G2.
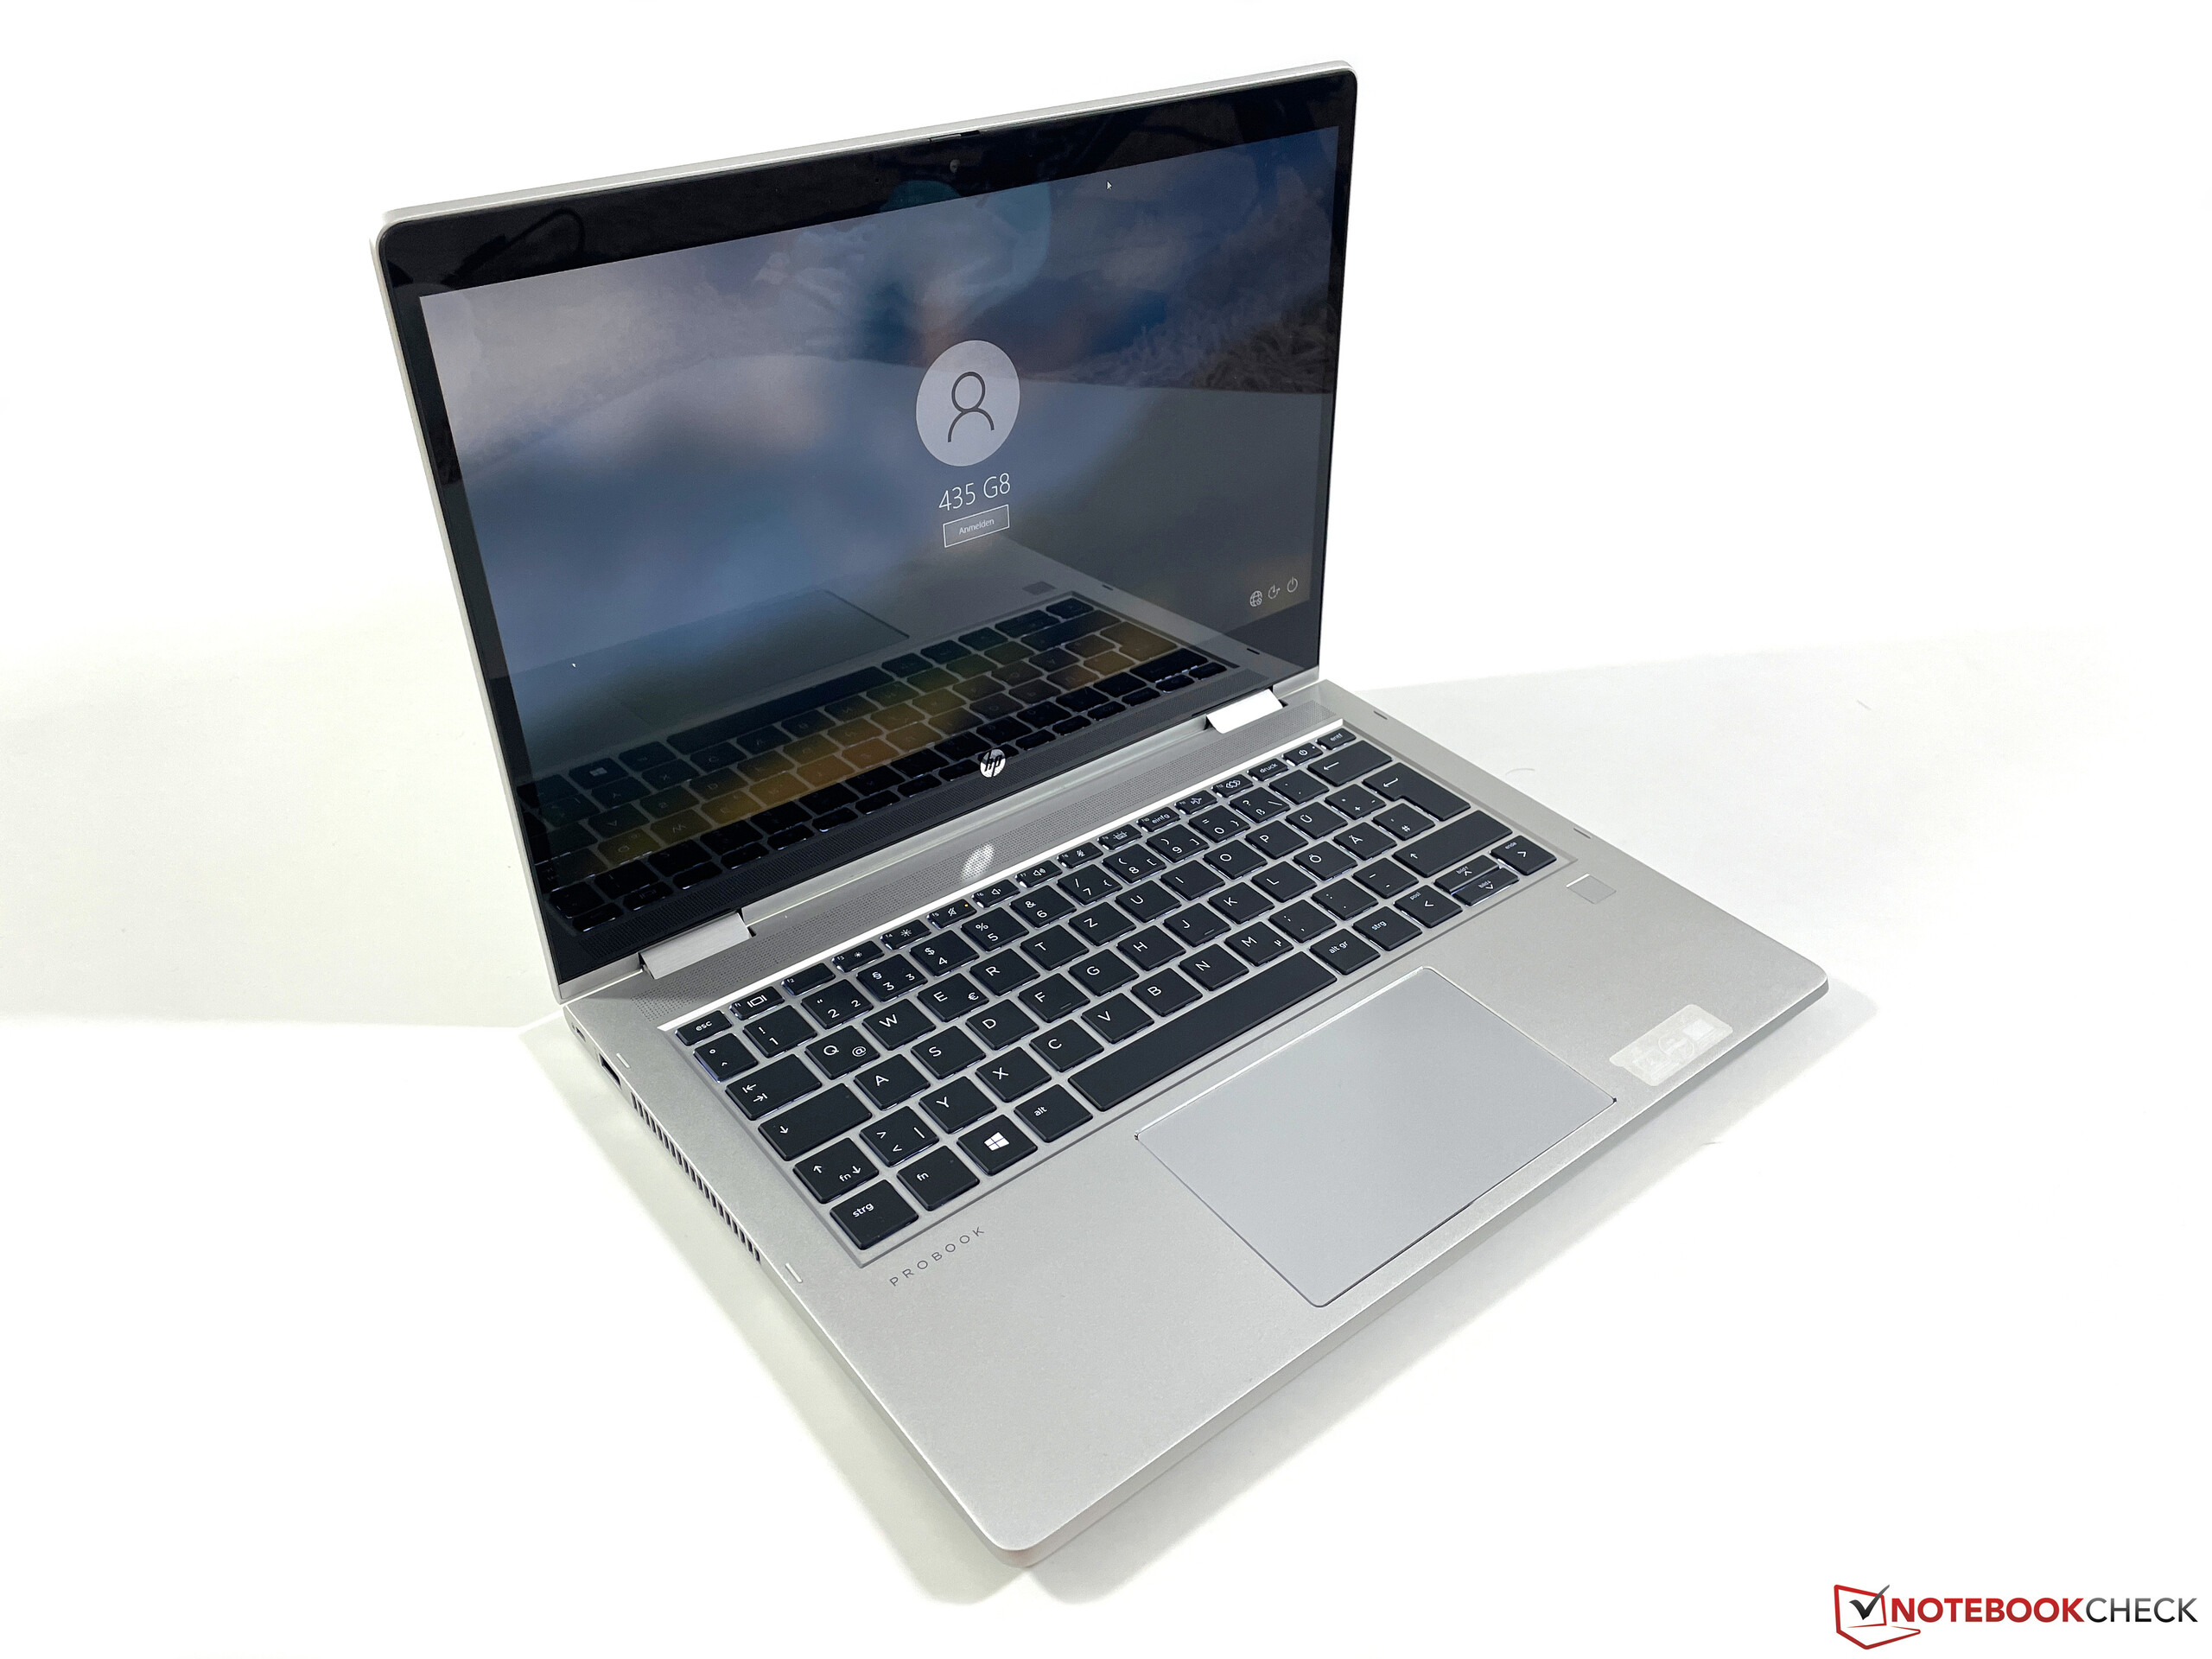
铰链也做得很好,但当你打开显示器时,你会立即看到非常宽的屏幕边缘,这就是为什么该设备看起来不是特别现代。更新为16:10的形式因素似乎只是一个时间问题。
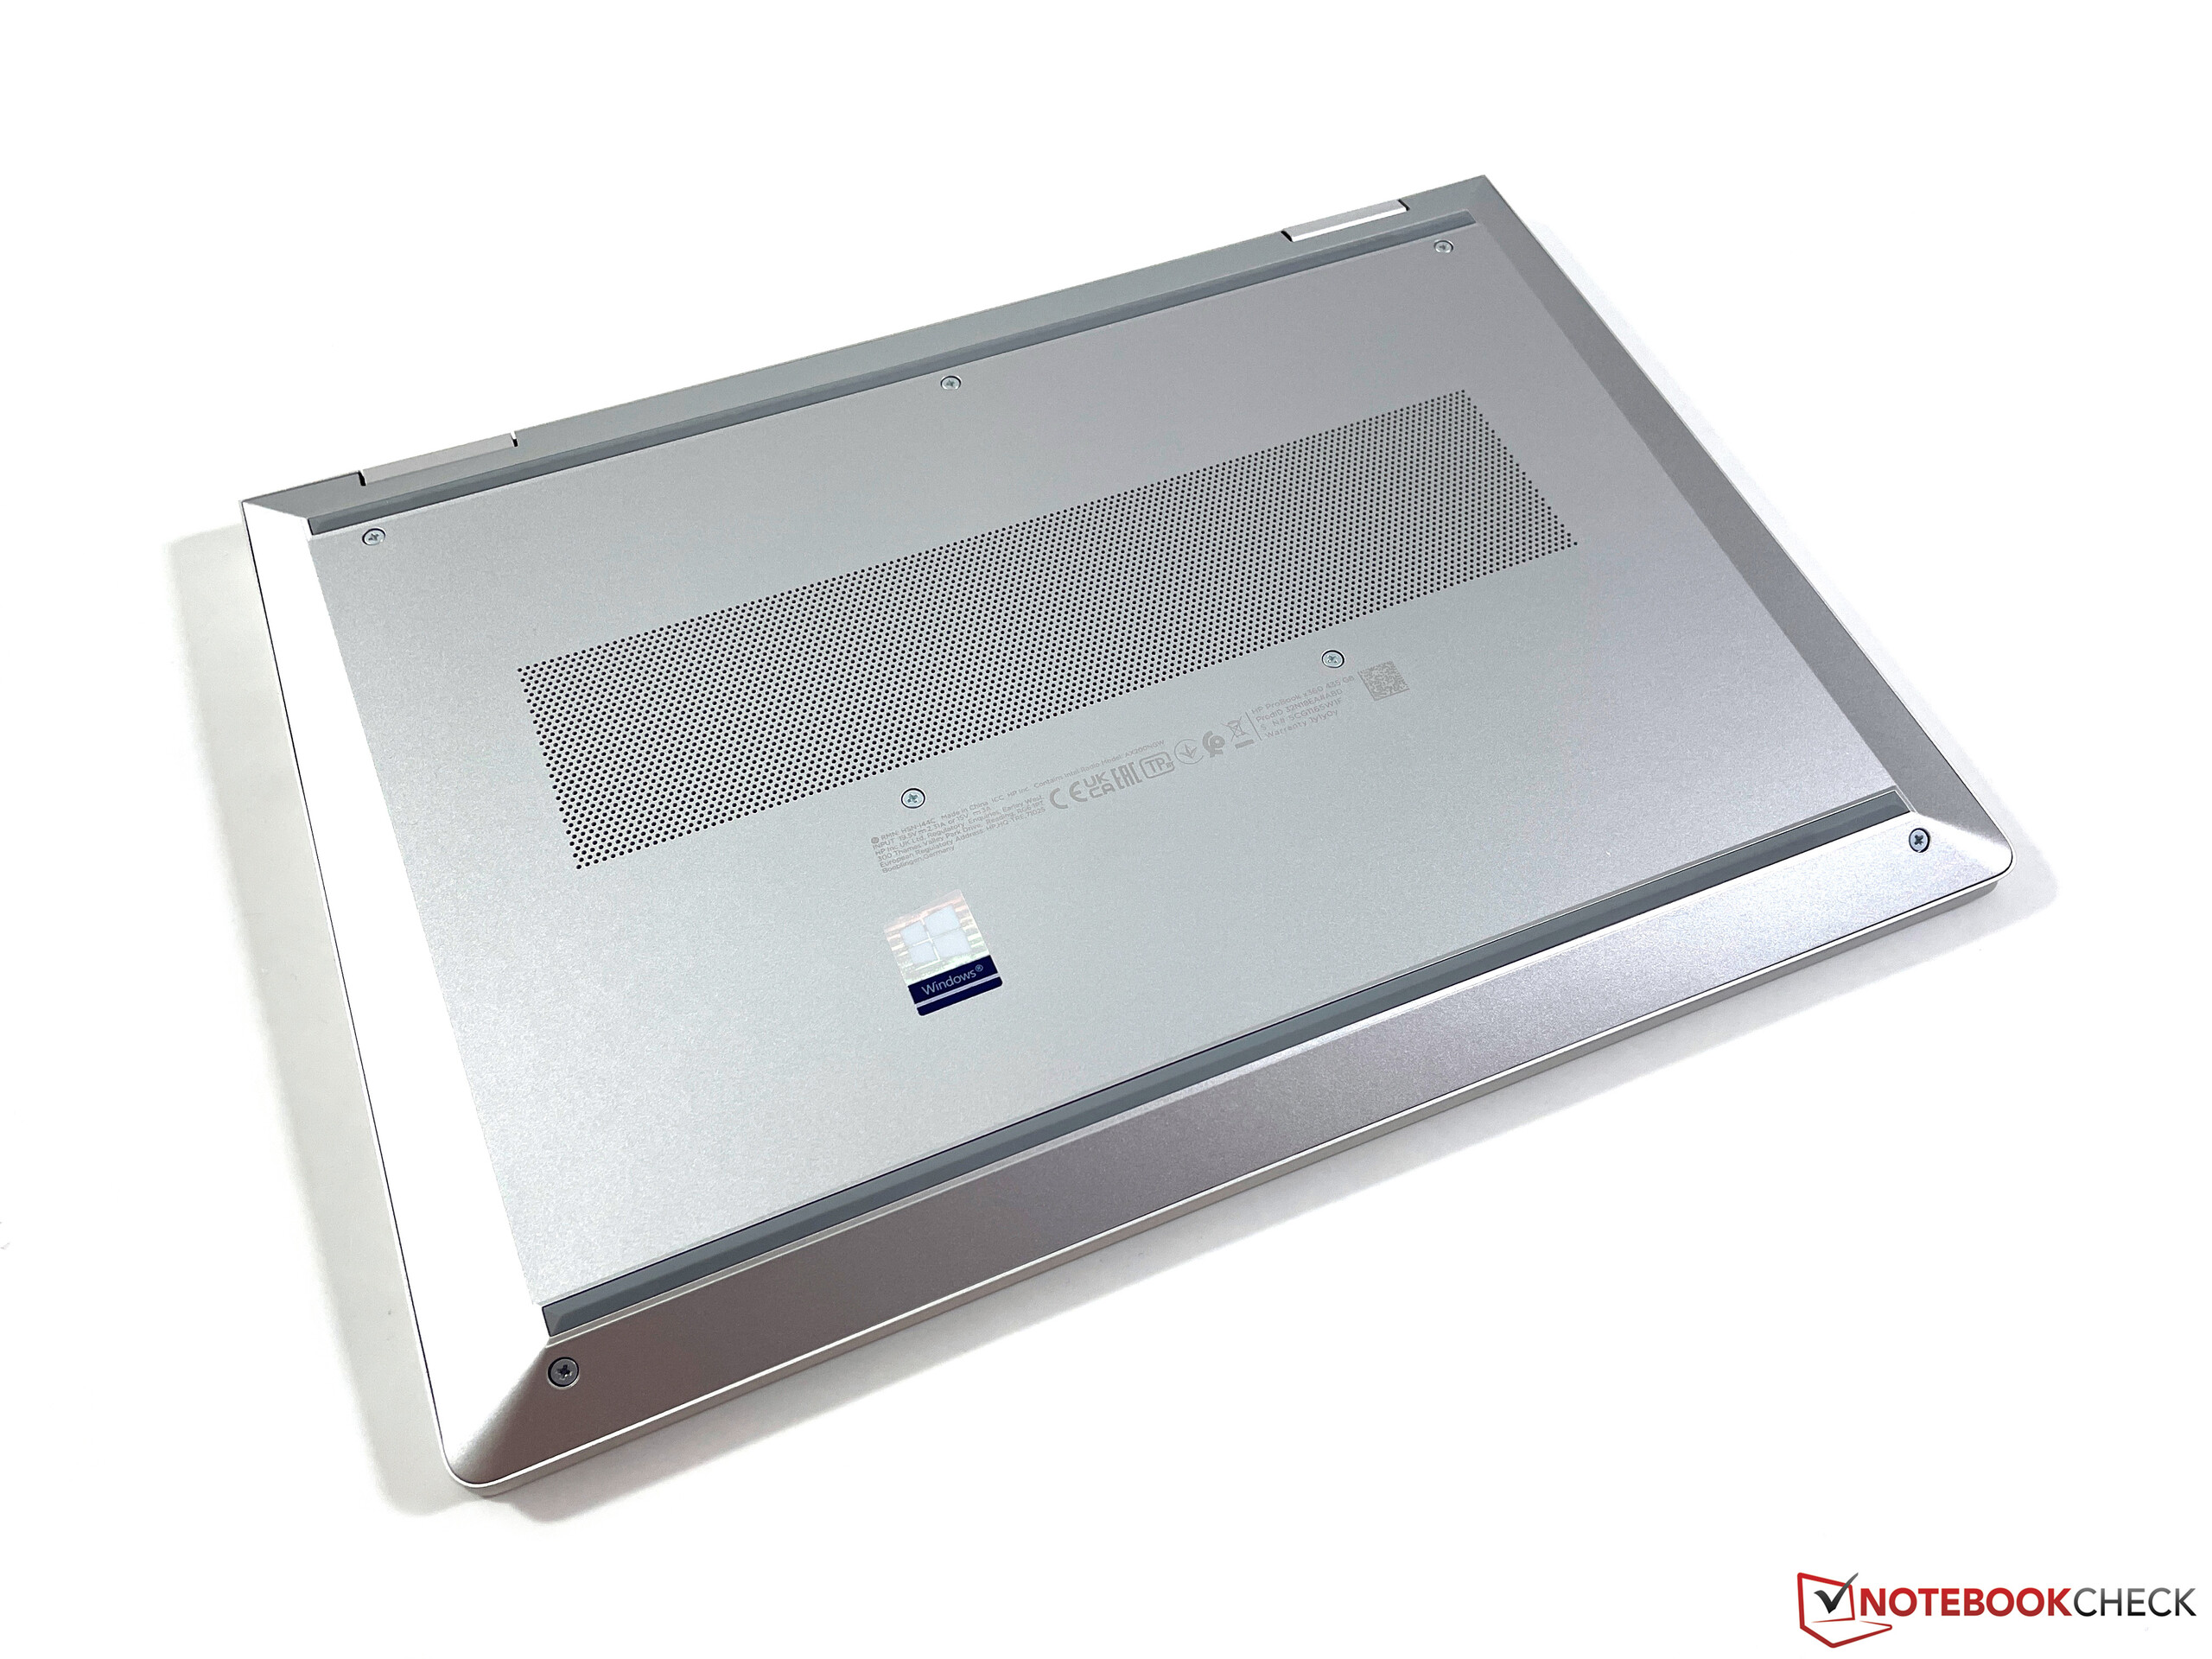
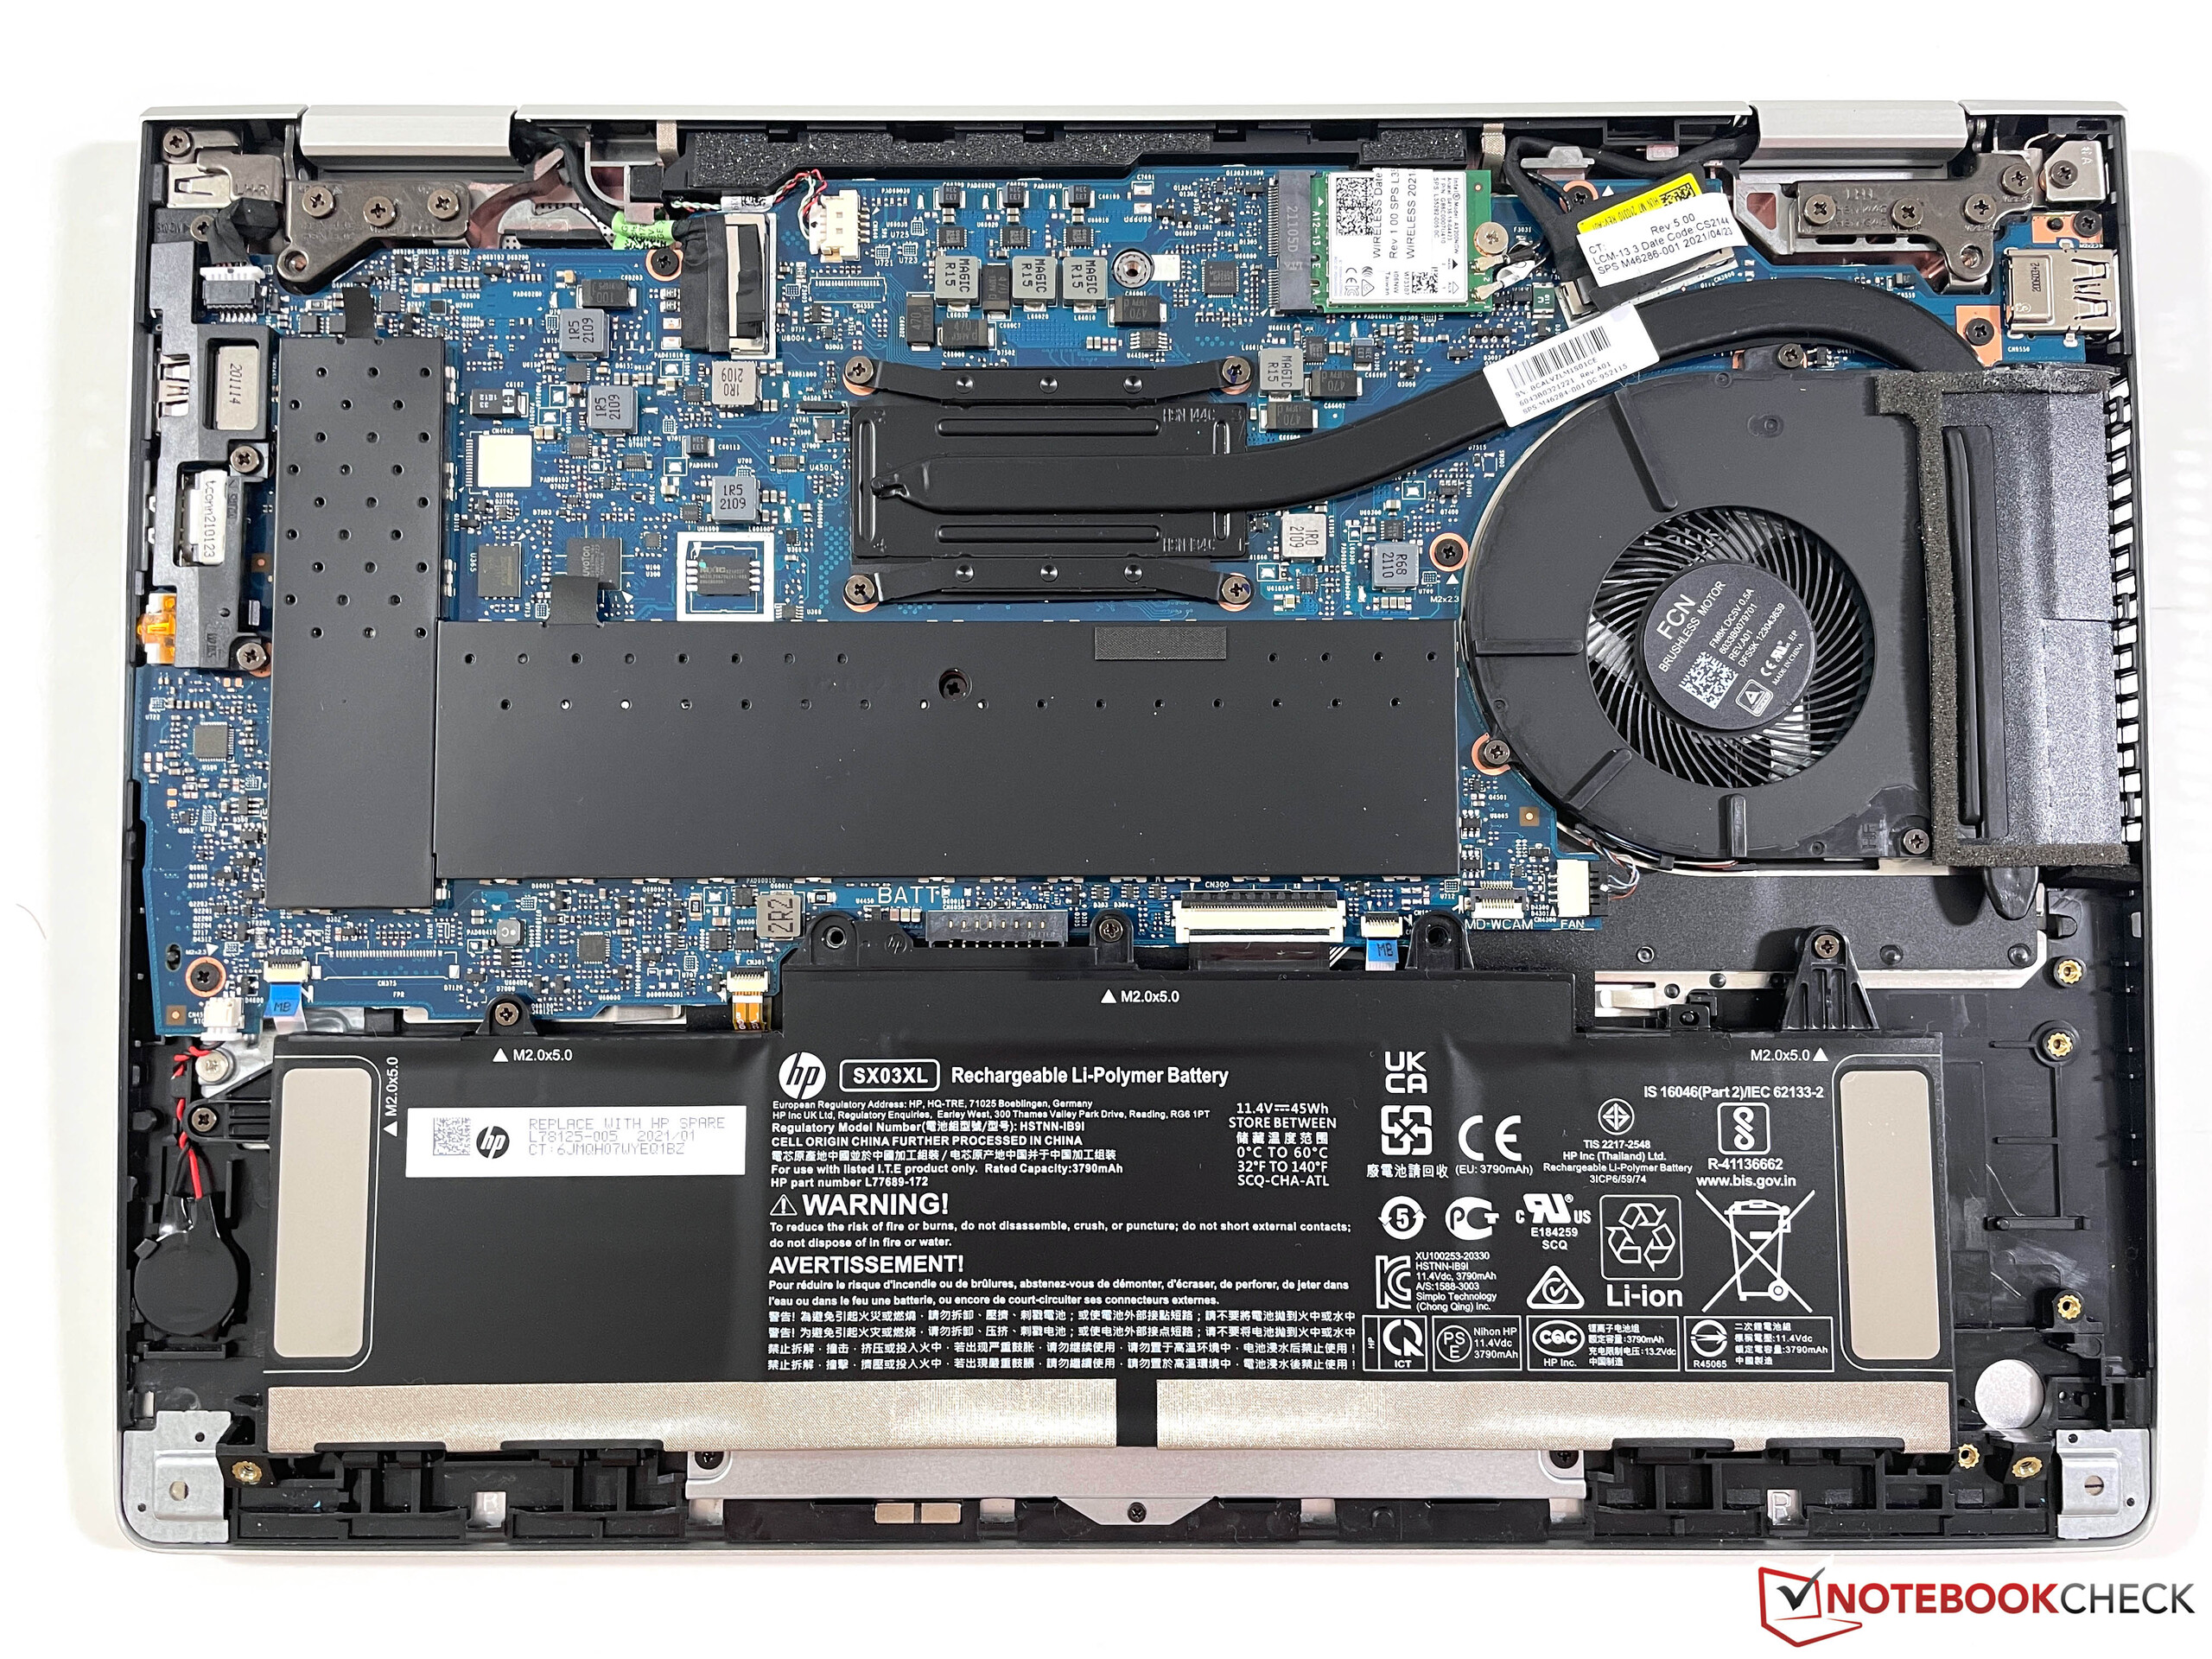
底部的盖子可以很容易地取下。工作内存和M.2-2280固态硬盘在一个额外的盖子下面,WLAN模块也可以被替换。
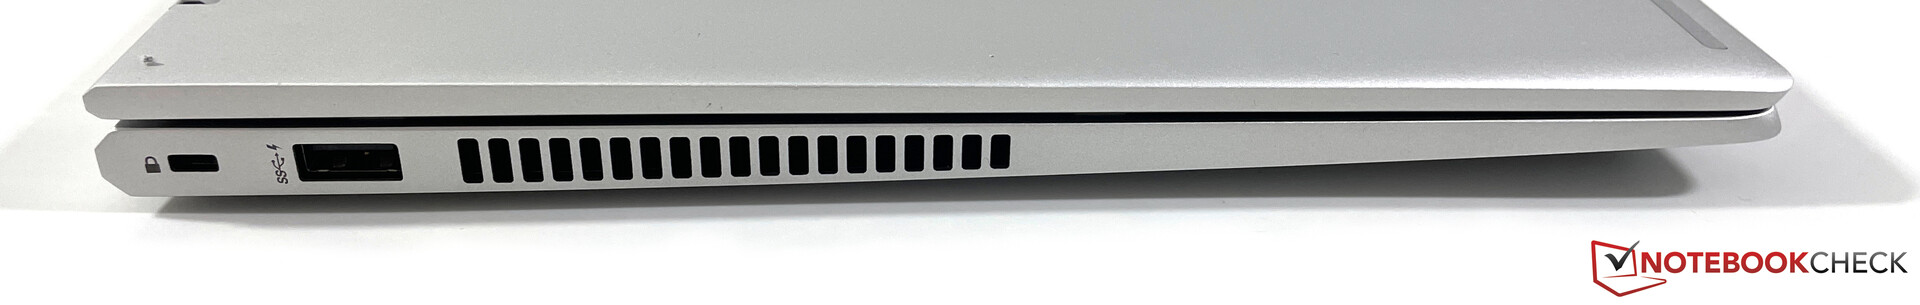
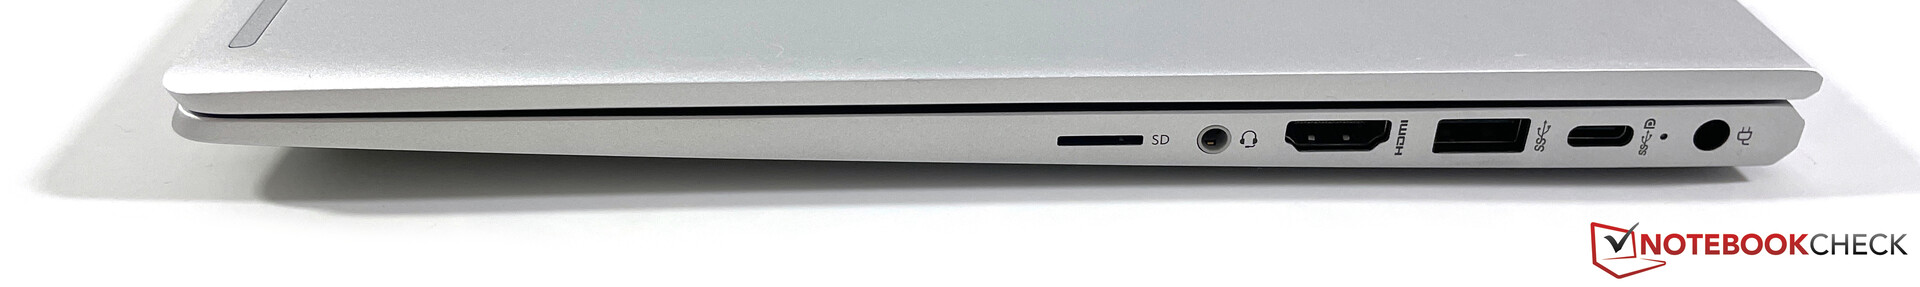
连接设备
所有的端口都可以使用,包括USB-C和普通的USB-A接口。然而,你必须做的是没有Thunderbolt或智能卡阅读器。microSD读卡器的速度达到了平均水平。我们的评测样品在发货时仍带有一个圆形插头的旧电源适配器,但通过USB-C也可以供电。
Wi-Fi模块来自英特尔(AX200),支持快速Wi-Fi 6标准。在我们用Netgear Nighthawk RAX120路由器进行的标准化测试中,ProBook取得了非常好的传输速率。
惠普安装了一个普通的720p网络摄像头,包括一个机械快门。即使在良好的照明条件下,图片质量也非常弱。它可以达到目的,但你不应该期望更多。
| SD Card Reader | |
| average JPG Copy Test (av. of 3 runs) | |
| Fujitsu LifeBook U9310X (Toshiba Exceria Pro SDXC 64 GB UHS-II) | |
| Lenovo ThinkPad L13 Yoga Gen2-20VK000VGE (AV PRO V60) | |
| HP ProBook x360 435 G7, Ryzen 5 4500U (Toshiba Exceria Pro M501 64 GB UHS-II) | |
| HP ProBook x360 435 G8 R7-5800U (AV Pro UHS-II V60) | |
| Average of class Convertible (29.4 - 141, n=20, last 2 years) | |
| Acer Spin 3 SP313-51N-56YV (AV PRO microSD 128 GB V60) | |
| maximum AS SSD Seq Read Test (1GB) | |
| Average of class Convertible (67.5 - 254, n=19, last 2 years) | |
| Fujitsu LifeBook U9310X (Toshiba Exceria Pro SDXC 64 GB UHS-II) | |
| HP ProBook x360 435 G8 R7-5800U (AV Pro UHS-II V60) | |
| HP ProBook x360 435 G7, Ryzen 5 4500U (Toshiba Exceria Pro M501 64 GB UHS-II) | |
| Lenovo ThinkPad L13 Yoga Gen2-20VK000VGE (AV PRO V60) | |
| Acer Spin 3 SP313-51N-56YV (AV PRO microSD 128 GB V60) | |
| Networking | |
| iperf3 transmit AX12 | |
| HP ProBook x360 435 G8 R7-5800U | |
| Lenovo ThinkPad L13 Yoga Gen2-20VK000VGE | |
| Average Intel Wi-Fi 6 AX200 (447 - 1645, n=127) | |
| HP ProBook x360 435 G7, Ryzen 5 4500U | |
| Acer Spin 3 SP313-51N-56YV | |
| Fujitsu LifeBook U9310X | |
| iperf3 receive AX12 | |
| Lenovo ThinkPad L13 Yoga Gen2-20VK000VGE | |
| HP ProBook x360 435 G8 R7-5800U | |
| Average Intel Wi-Fi 6 AX200 (523 - 1684, n=128) | |
| Fujitsu LifeBook U9310X | |
| Acer Spin 3 SP313-51N-56YV | |
| HP ProBook x360 435 G7, Ryzen 5 4500U | |


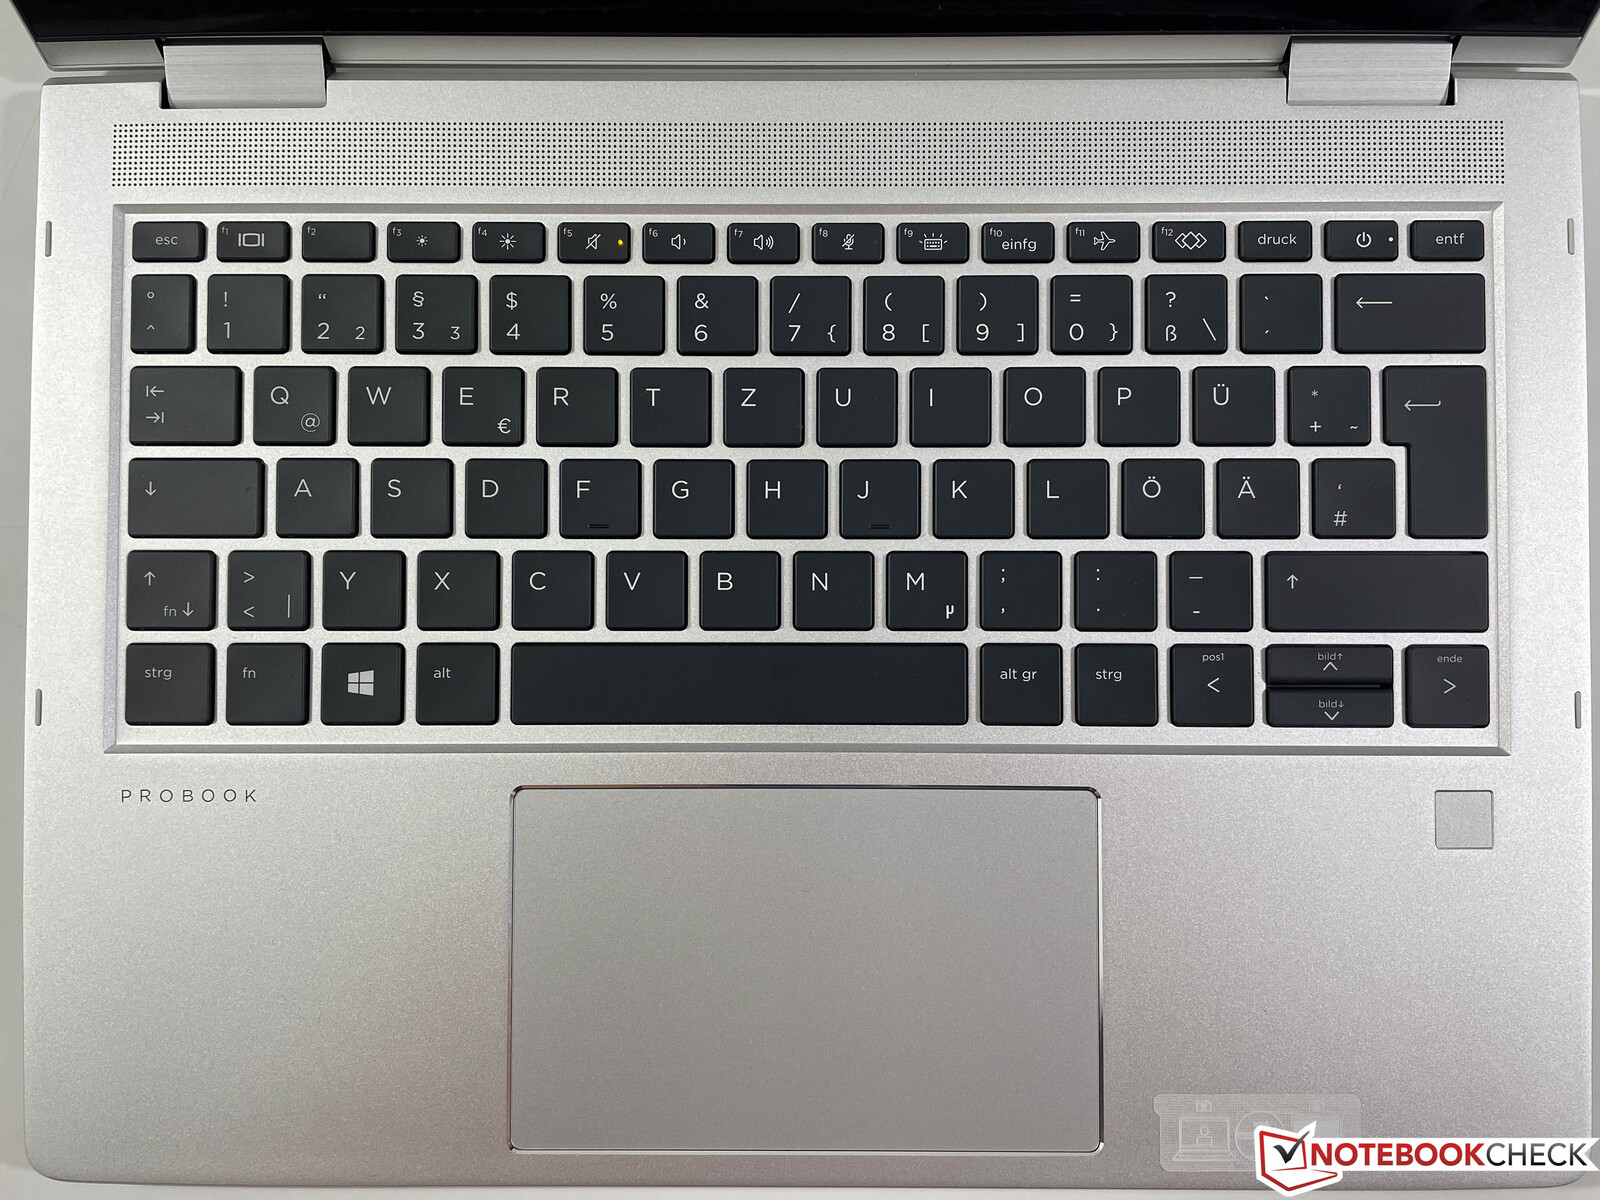
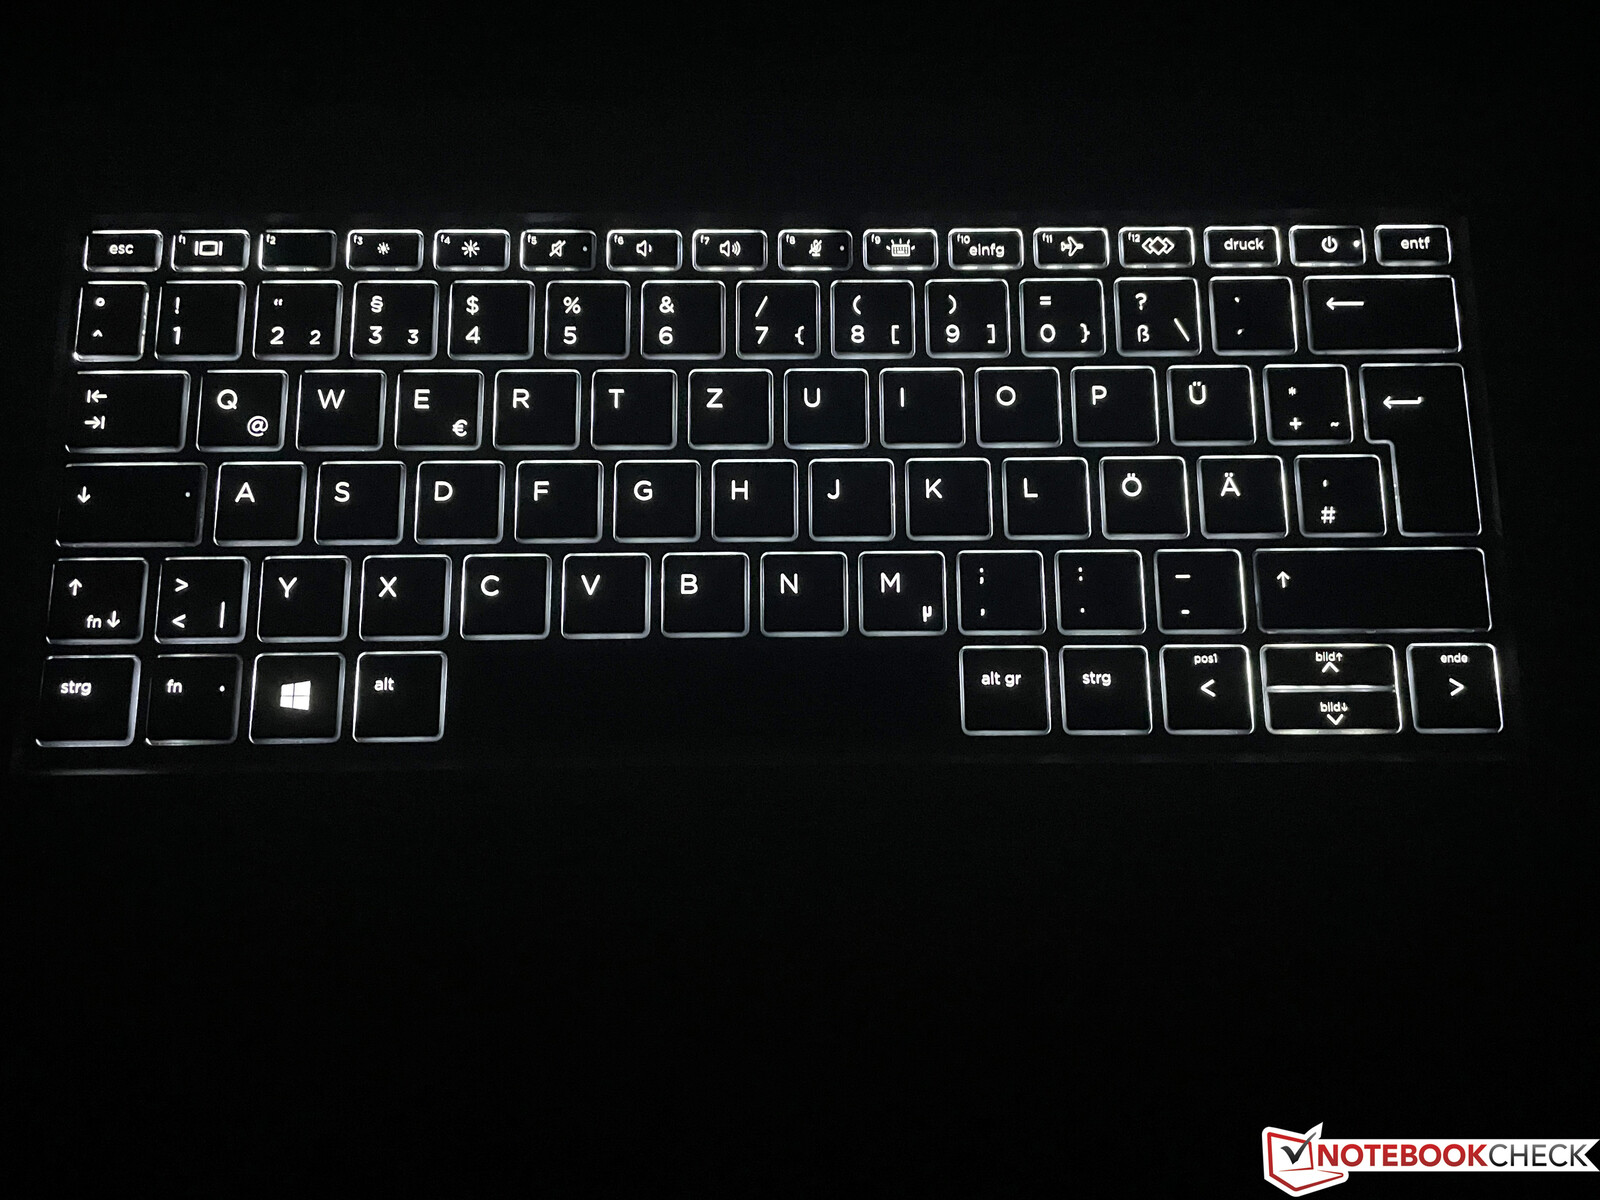
输入设备 - 防水键盘
输入设备没有变化,这完全不是一个问题。键提供足够的行程和精确的反馈。在这个键盘上甚至可以舒适地输入长文本。当你不使用键盘时,两级白色背光在默认情况下会在几秒钟后停用,但这个设置可以在BIOS中调整。
ClickPad支持微软的Precision 标准,普通的指针控制也能完美运行。垫子可以在下部区域被按下,这时会有一个相当响亮的消音来确认。由于它是一个可转换的产品,当然还有电容式触摸屏。我们在这里也看不到任何限制。
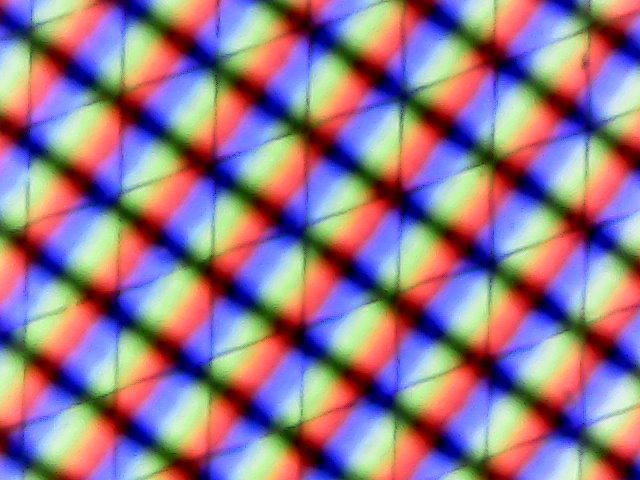
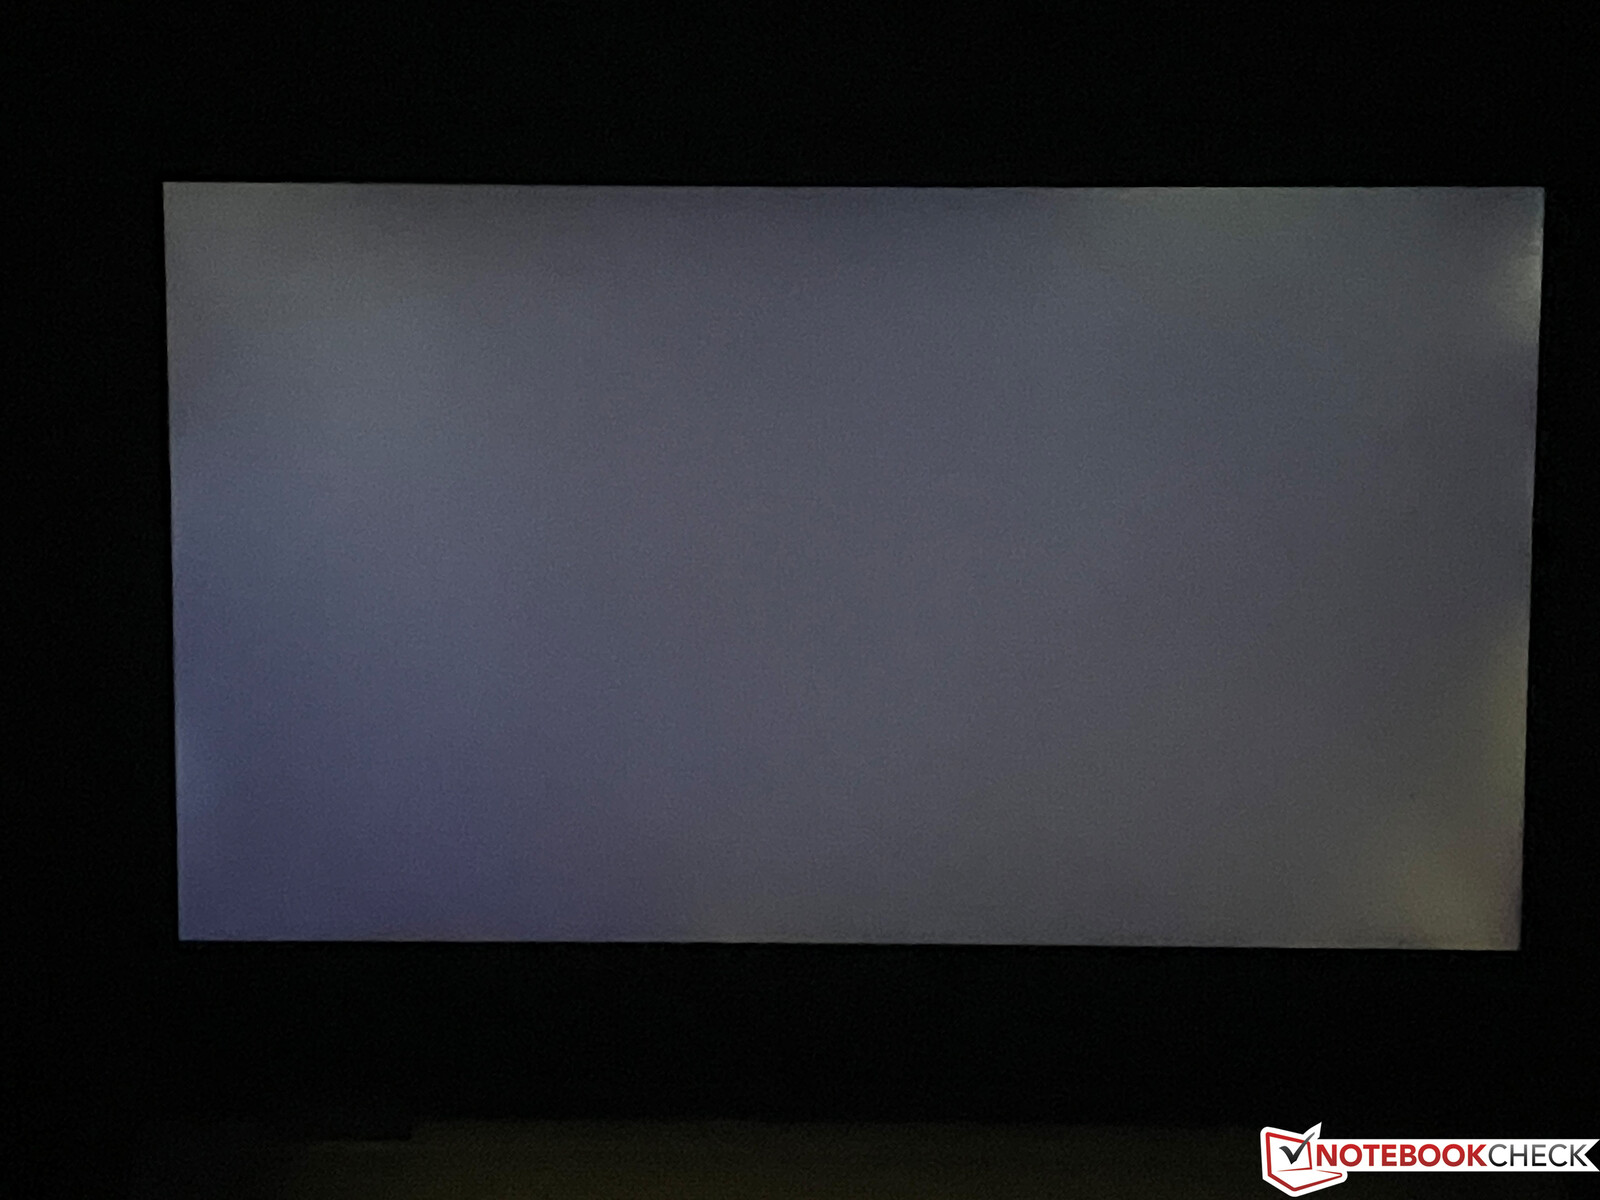
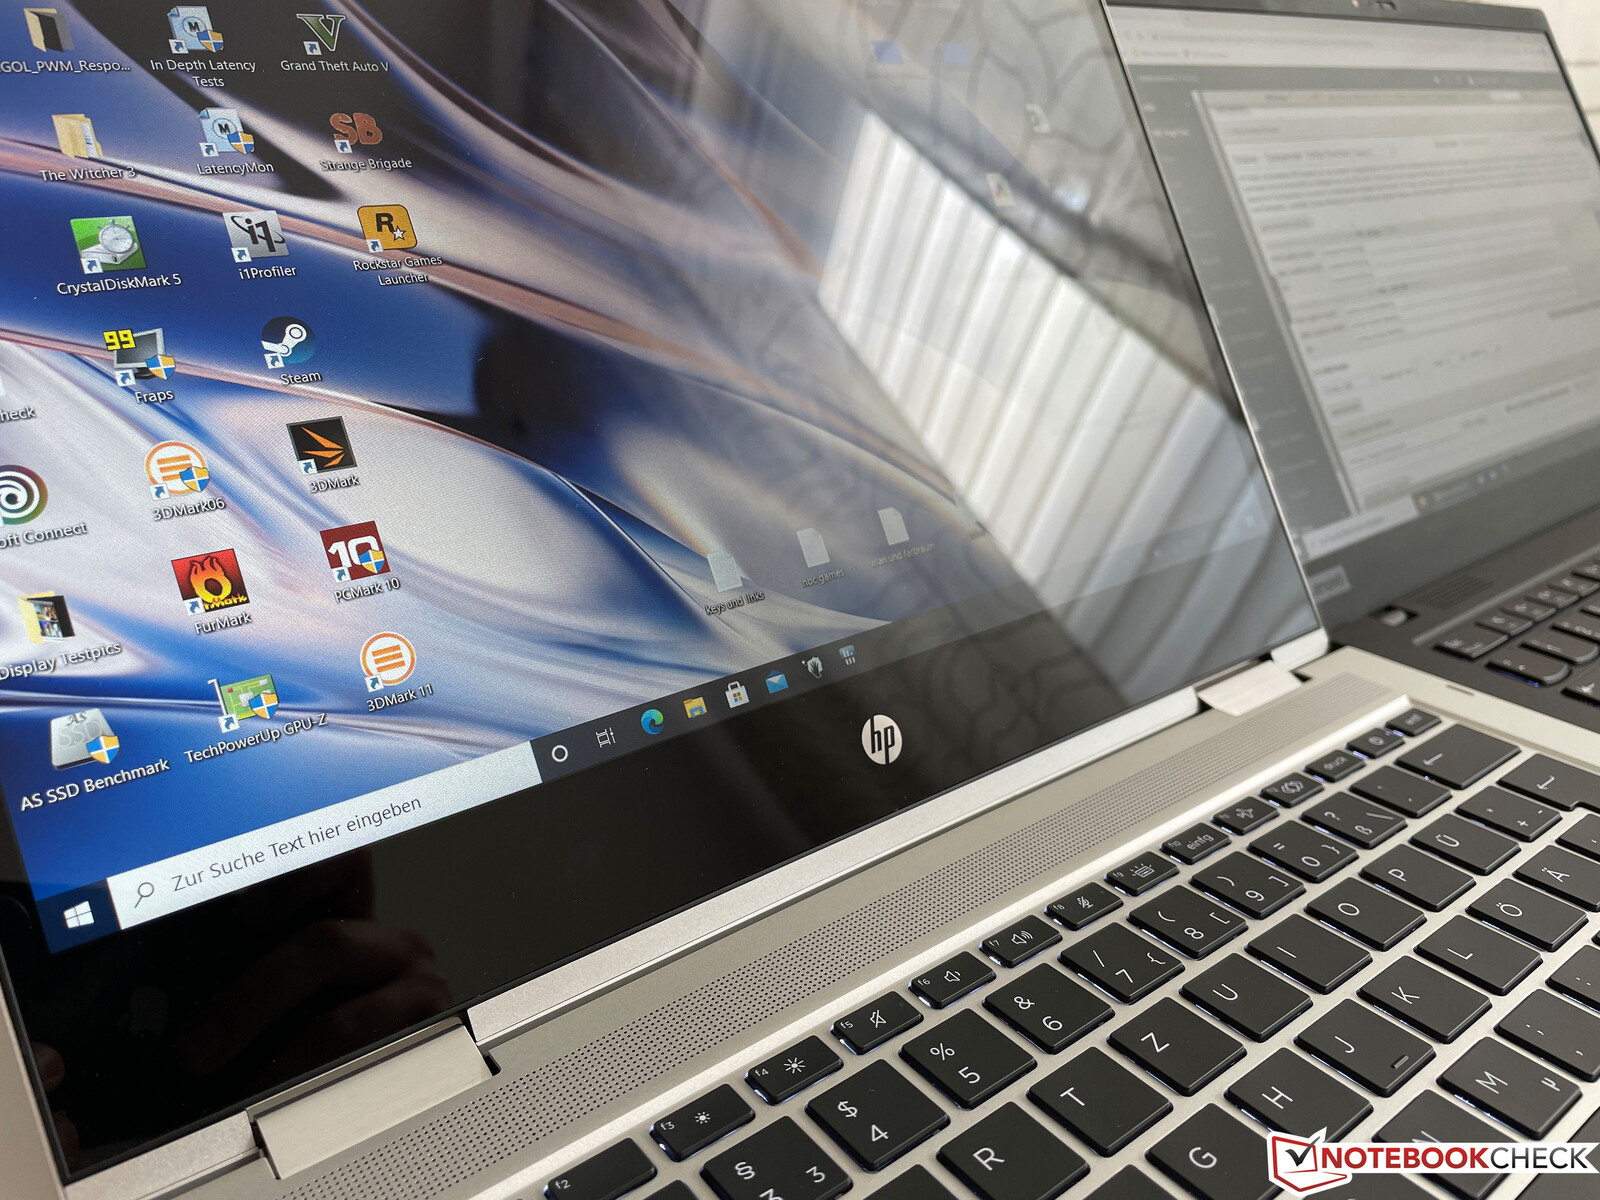
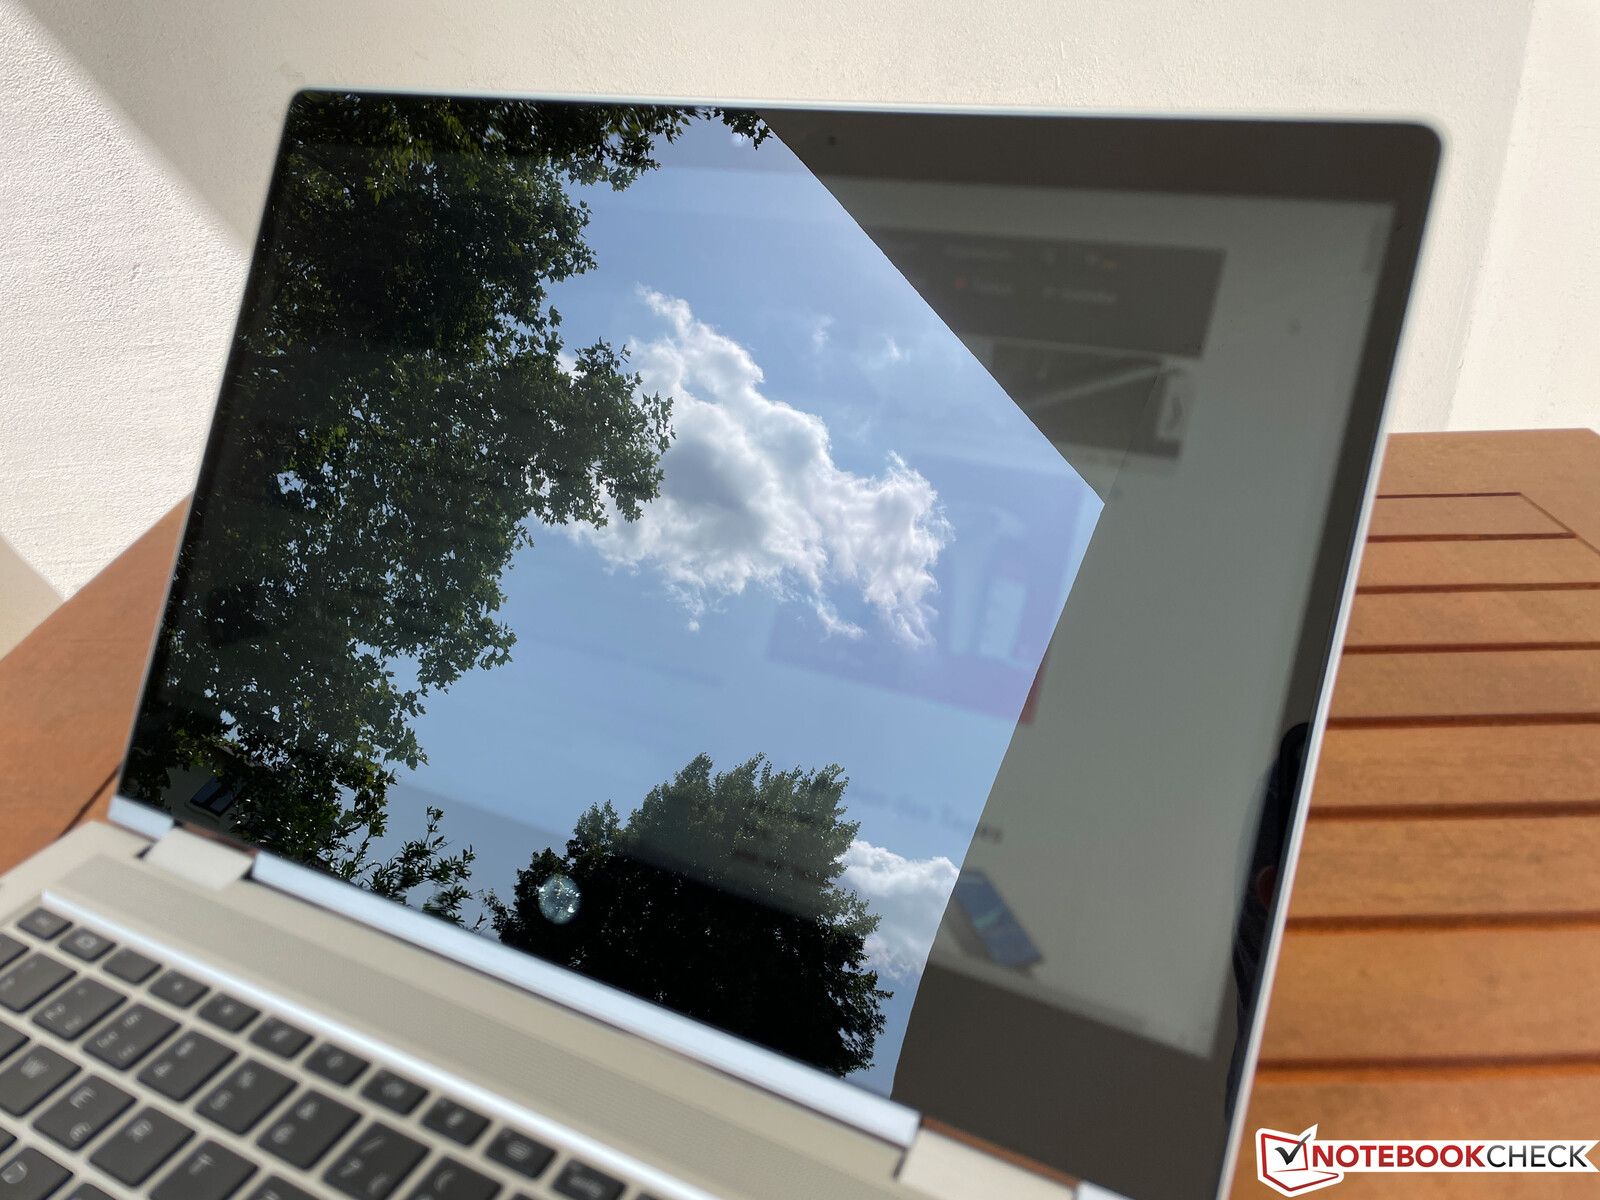
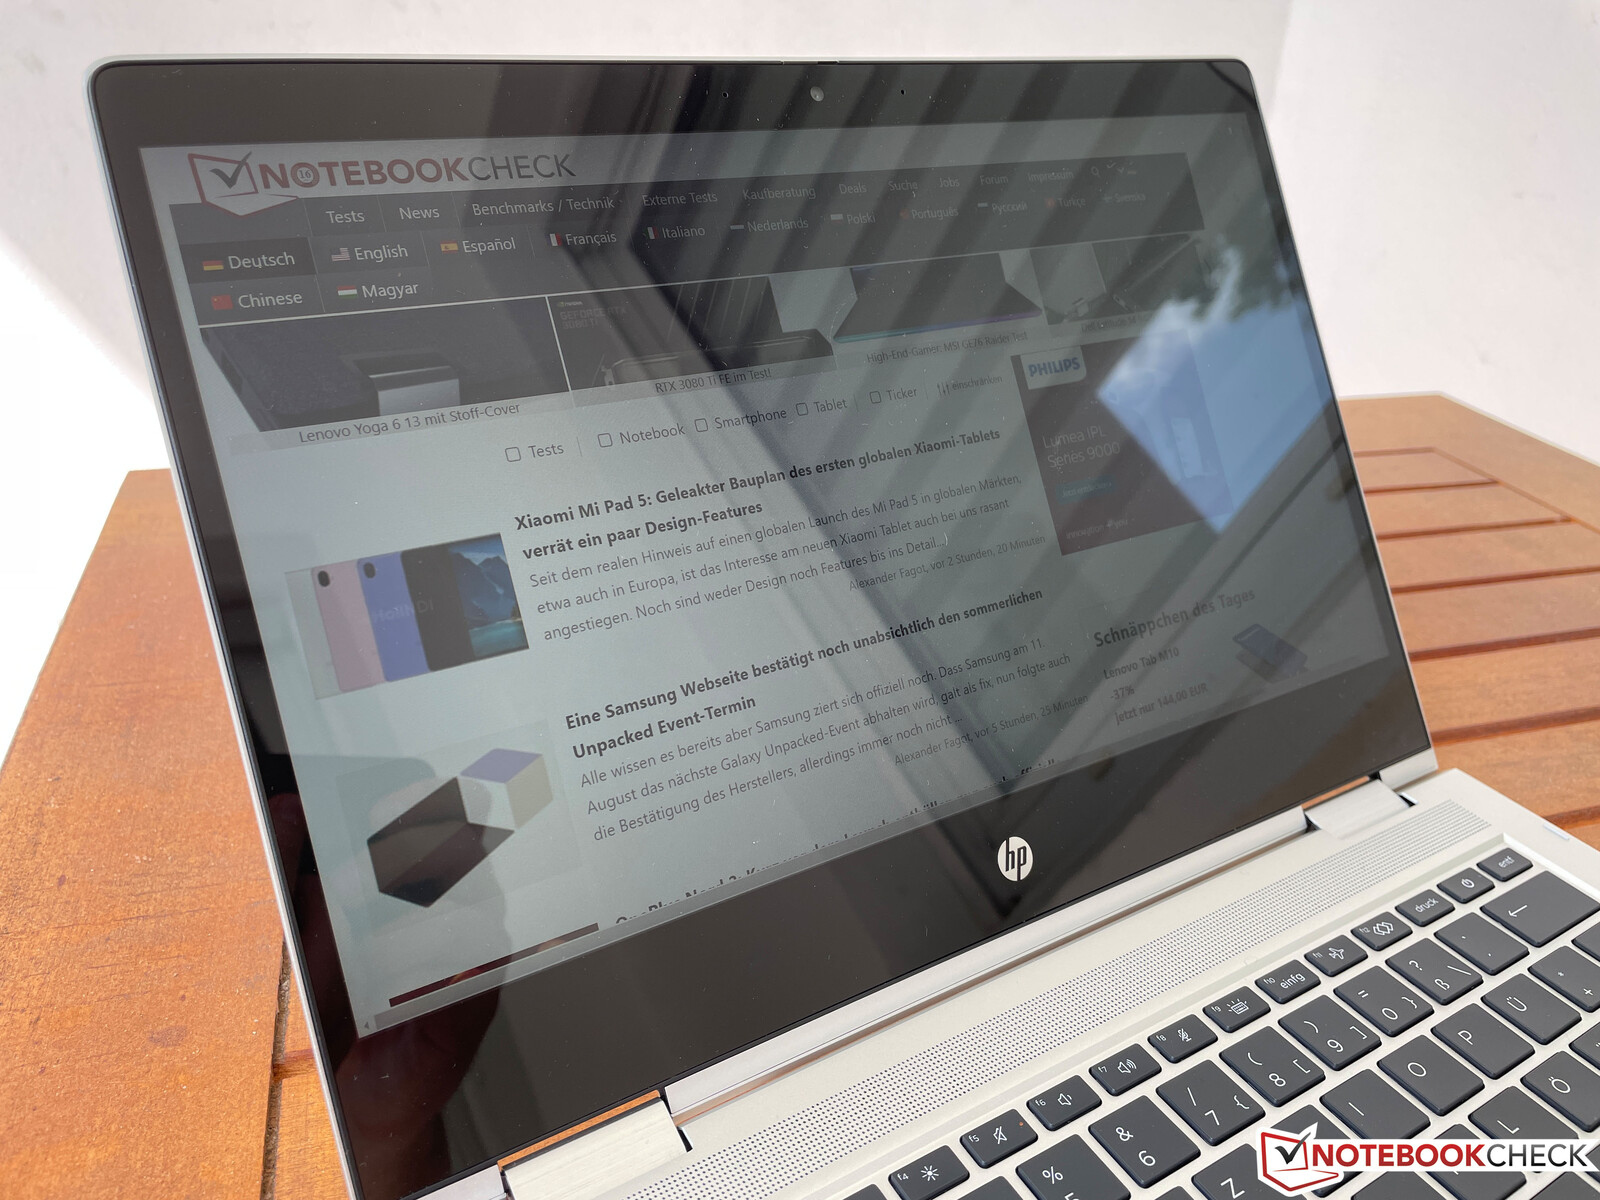
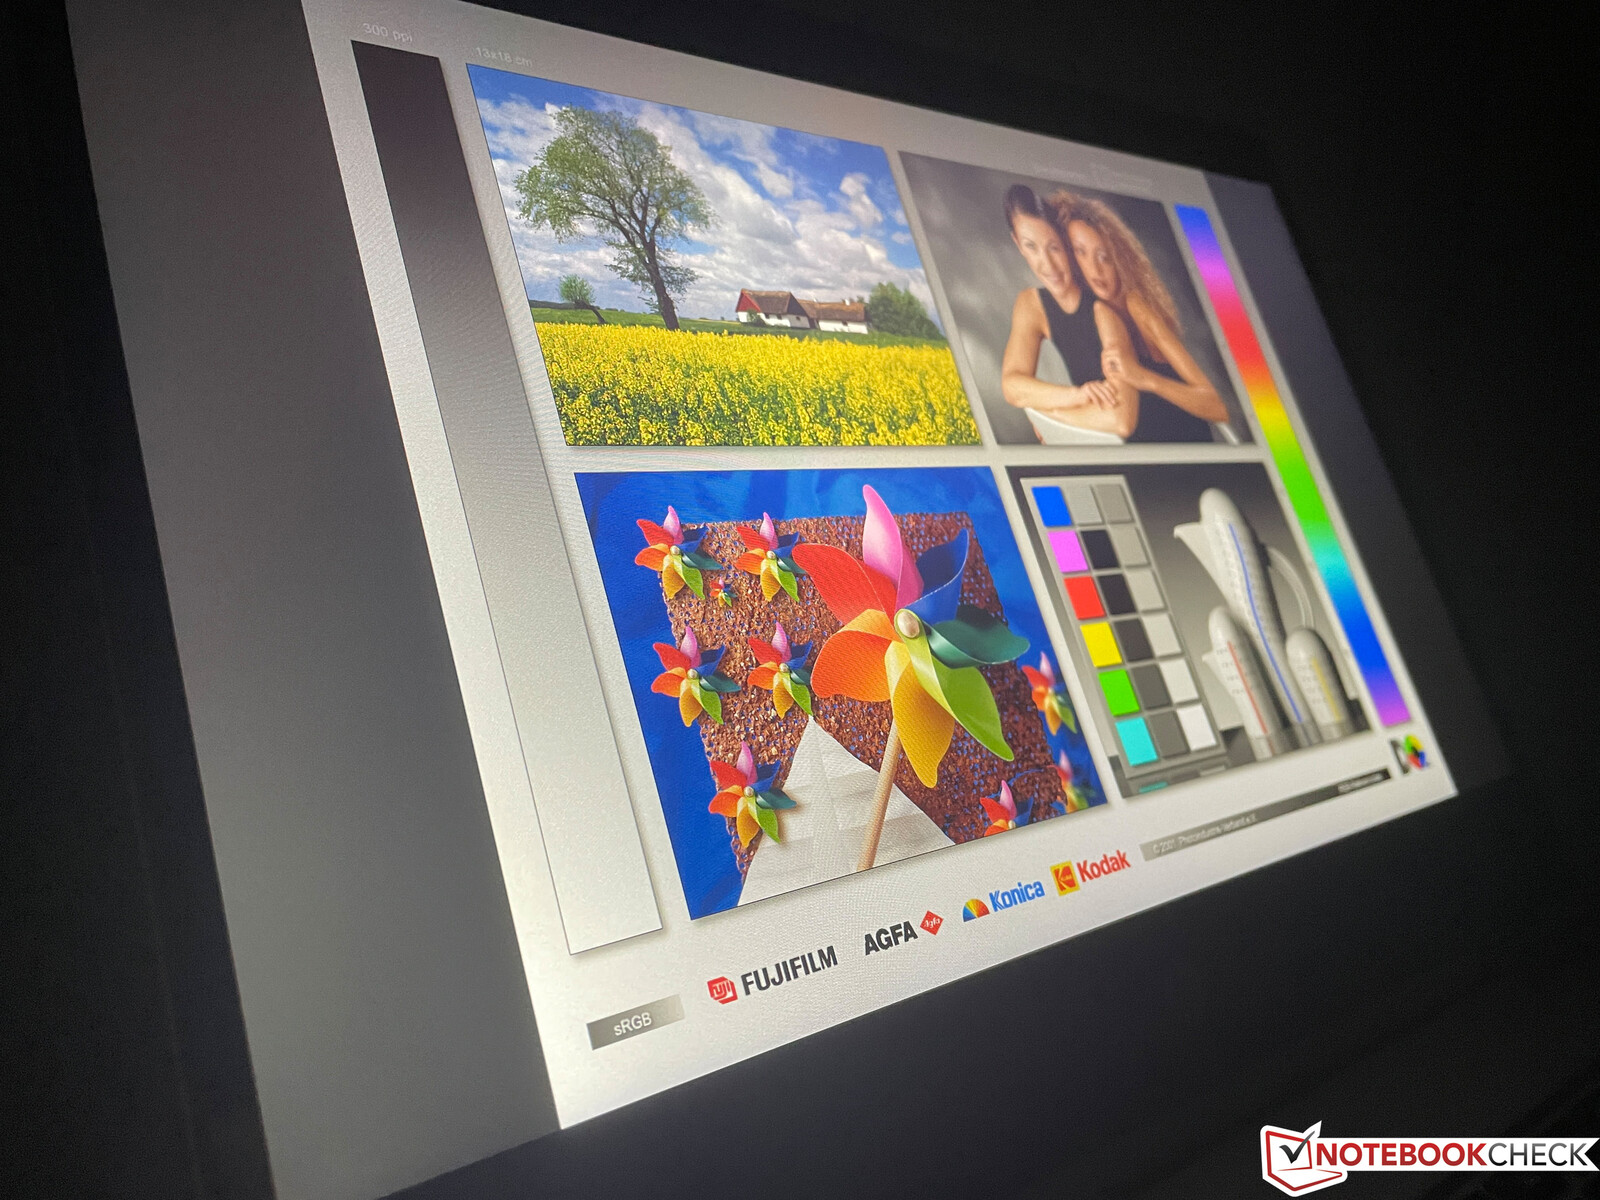
显示屏 - 全高清1080p镜面触摸屏
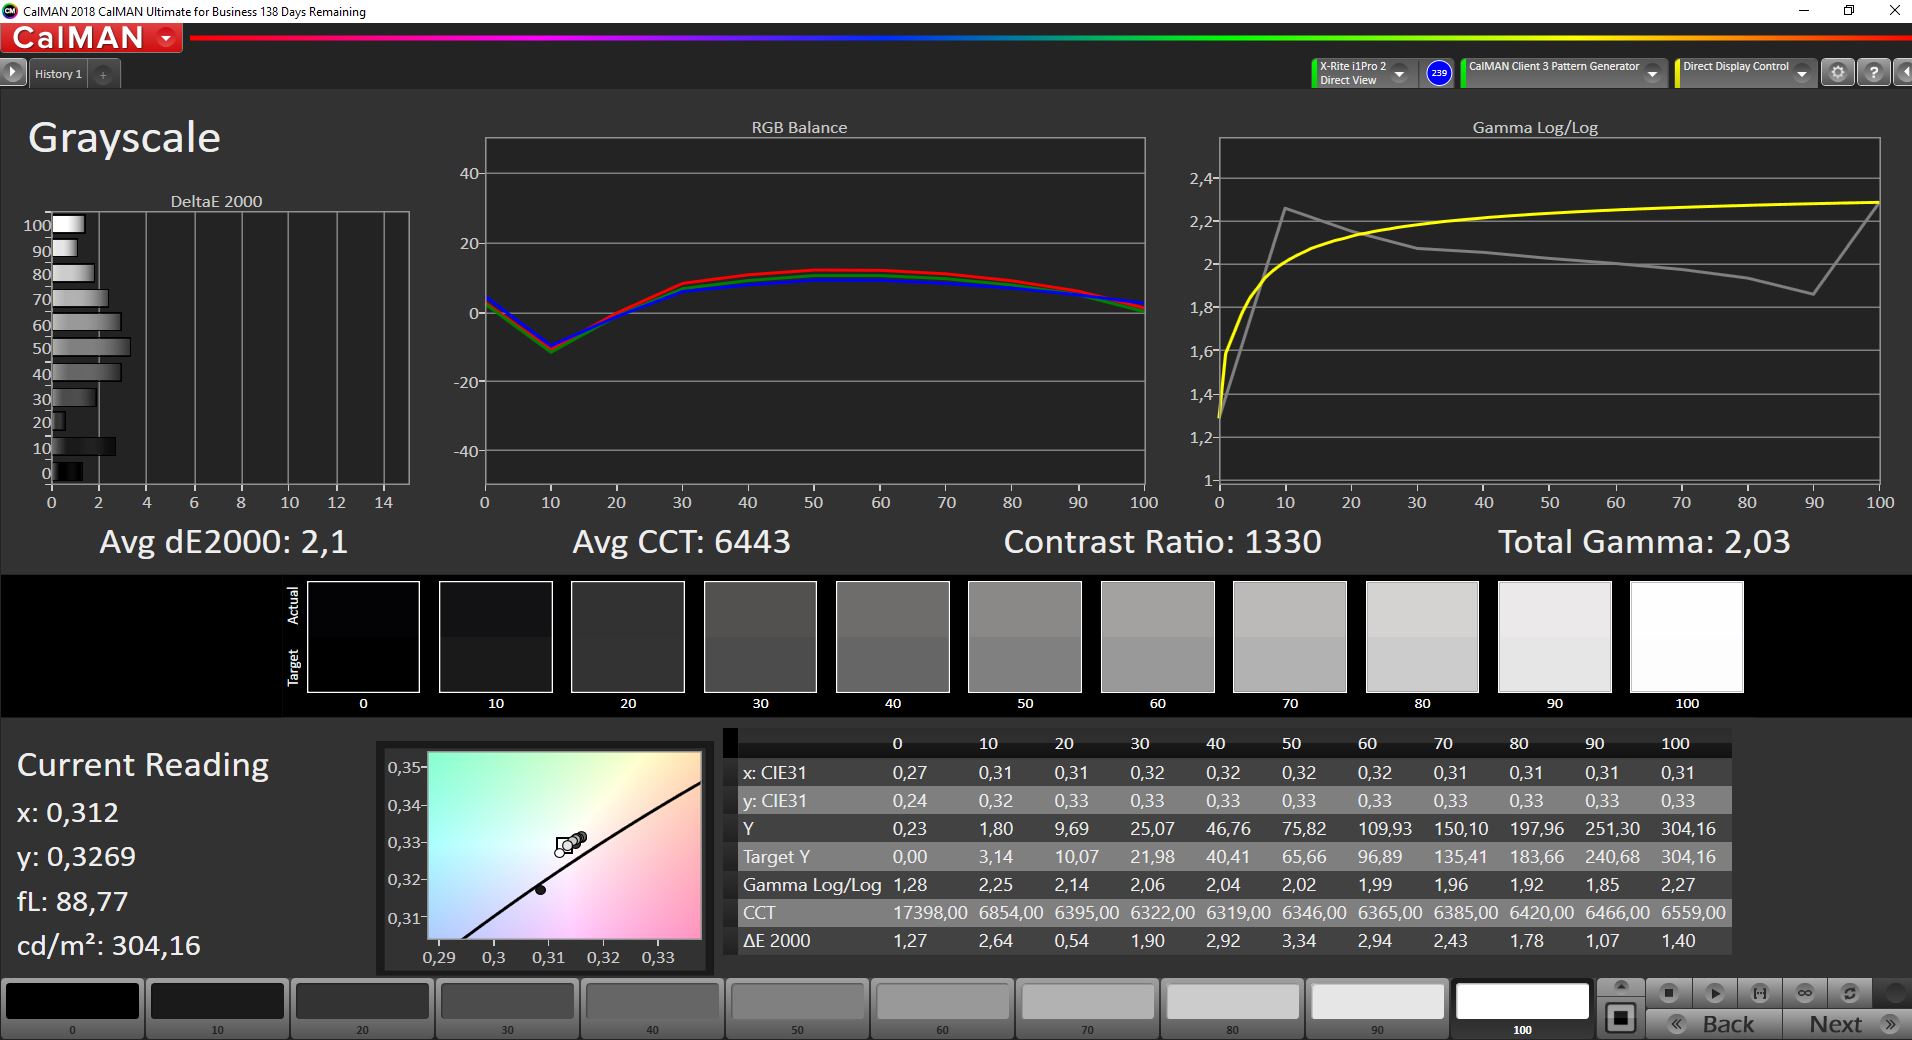
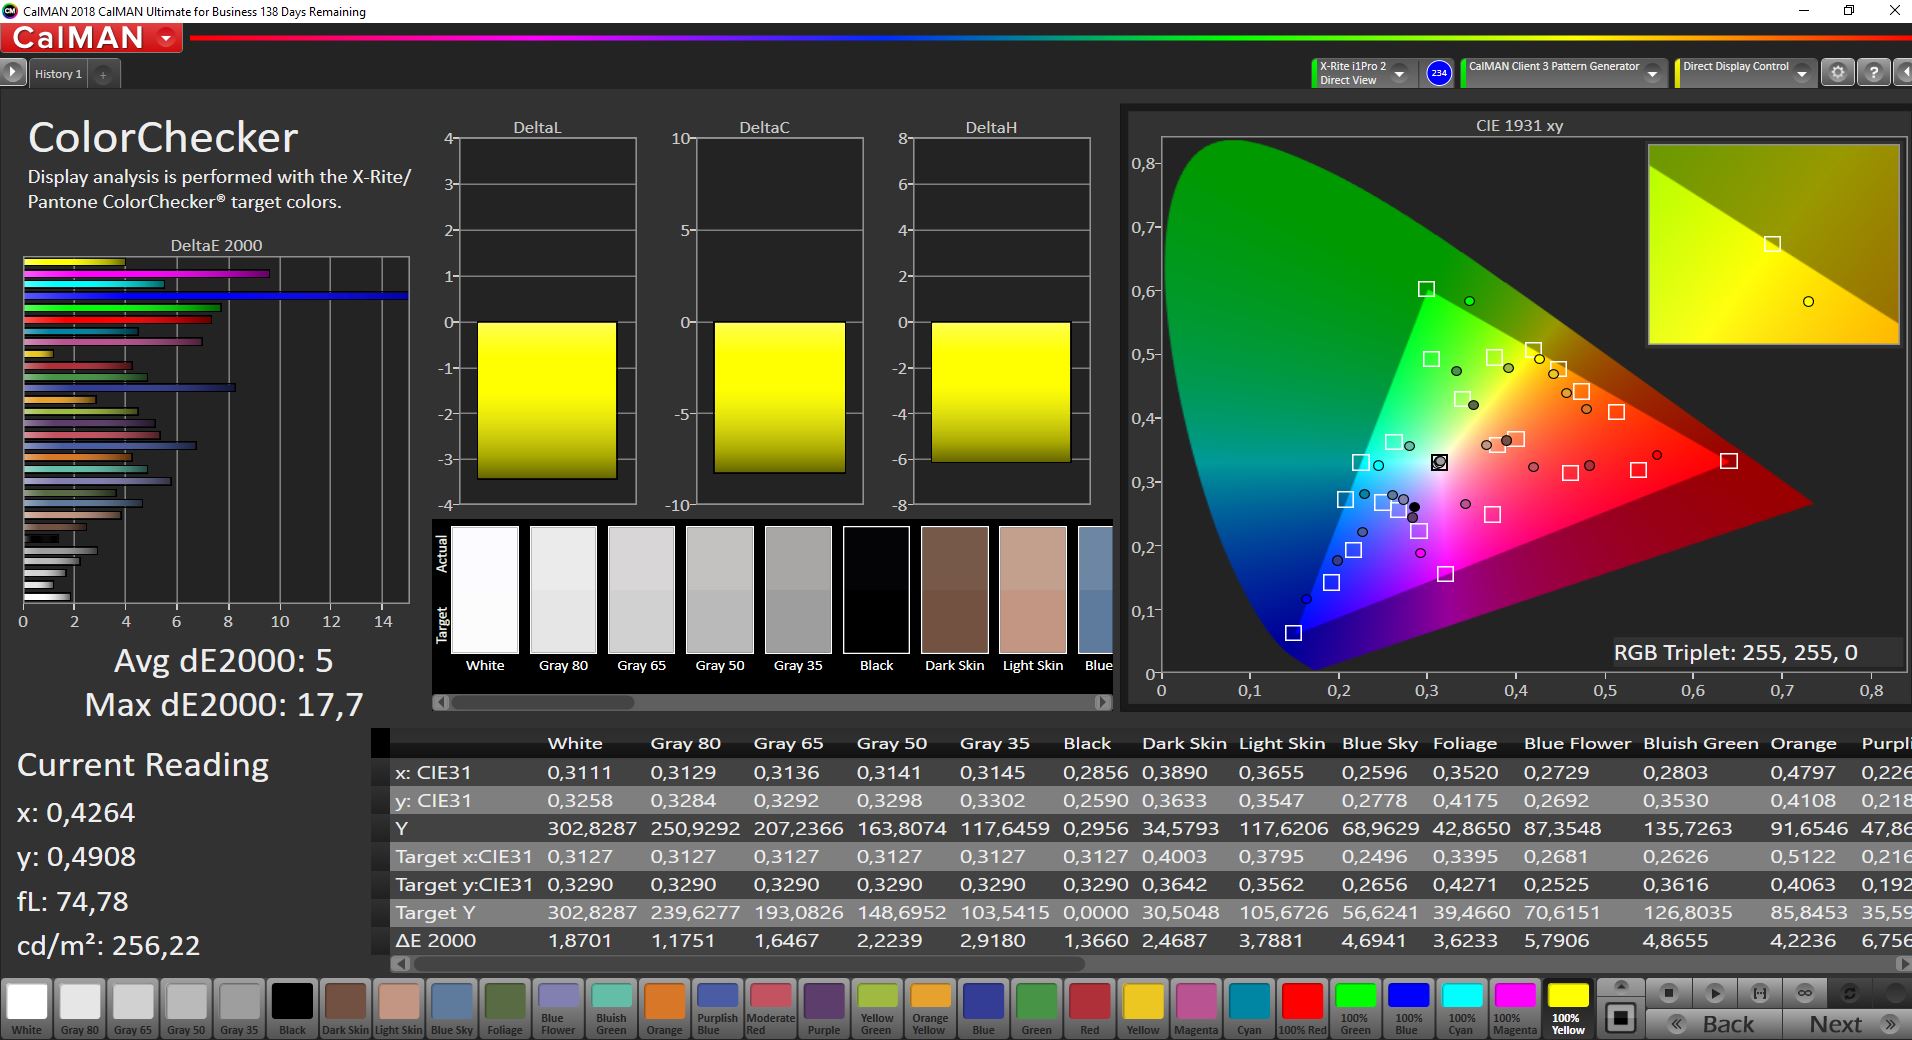
惠普提供各种IPS显示屏。我们的测试设备使用的是名义上最差的变体,亮度为250cd/m²。我们的面板来自AU Optronics,至少达到了290cd/m²左右的平均亮度。原则上,主观的画面印象是不错的,这也得益于良好的对比度,但电容式触摸屏的极度反射玻璃表面在室内已经是一个问题。在室外,你几乎看不到任何东西,而且几乎不可能正常工作。我们无法确定PWM的闪烁,屏幕出血在日常使用中不是一个大问题,可视角度的稳定性也很好,但反射往往是实践中的更大障碍。
| |||||||||||||||||||||||||
Brightness Distribution: 89 %
Center on Battery: 304 cd/m²
Contrast: 1322:1 (Black: 0.23 cd/m²)
ΔE ColorChecker Calman: 5 | ∀{0.5-29.43 Ø4.71}
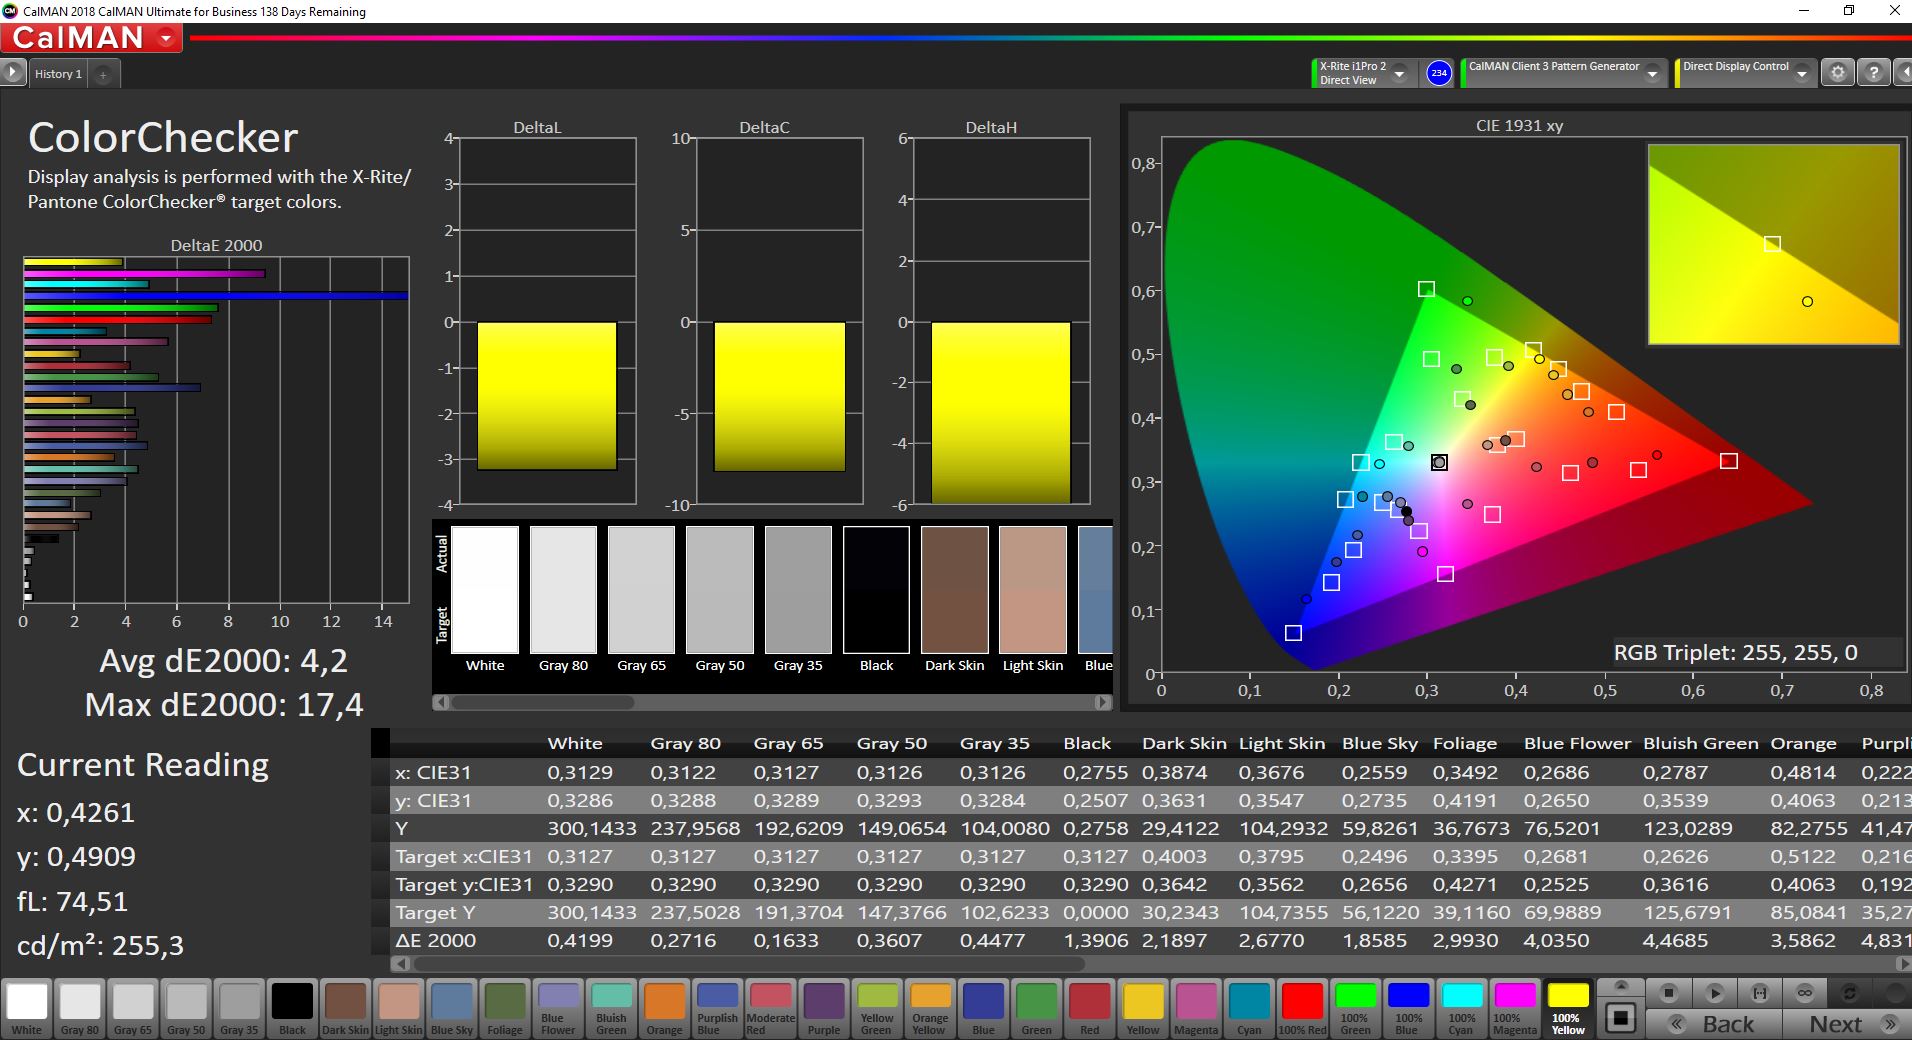
calibrated: 4.2
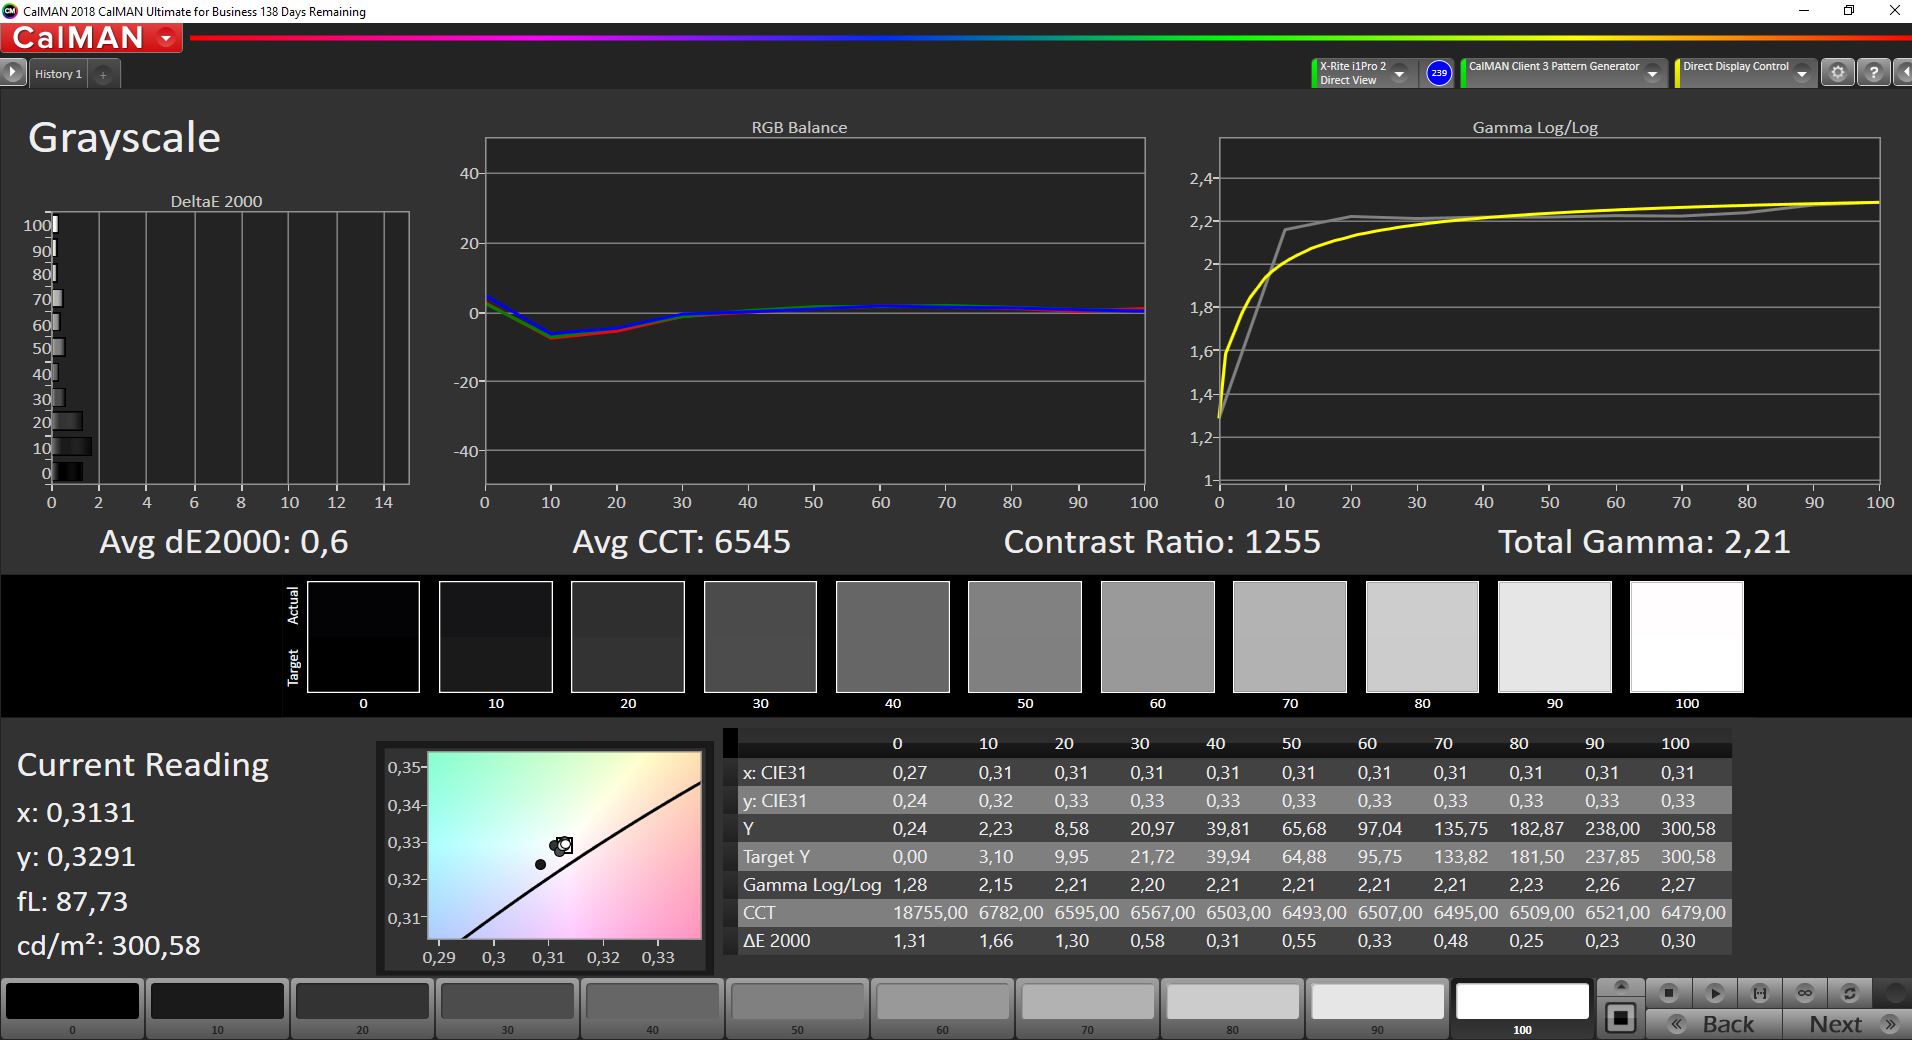
ΔE Greyscale Calman: 2.1 | ∀{0.09-98 Ø4.96}
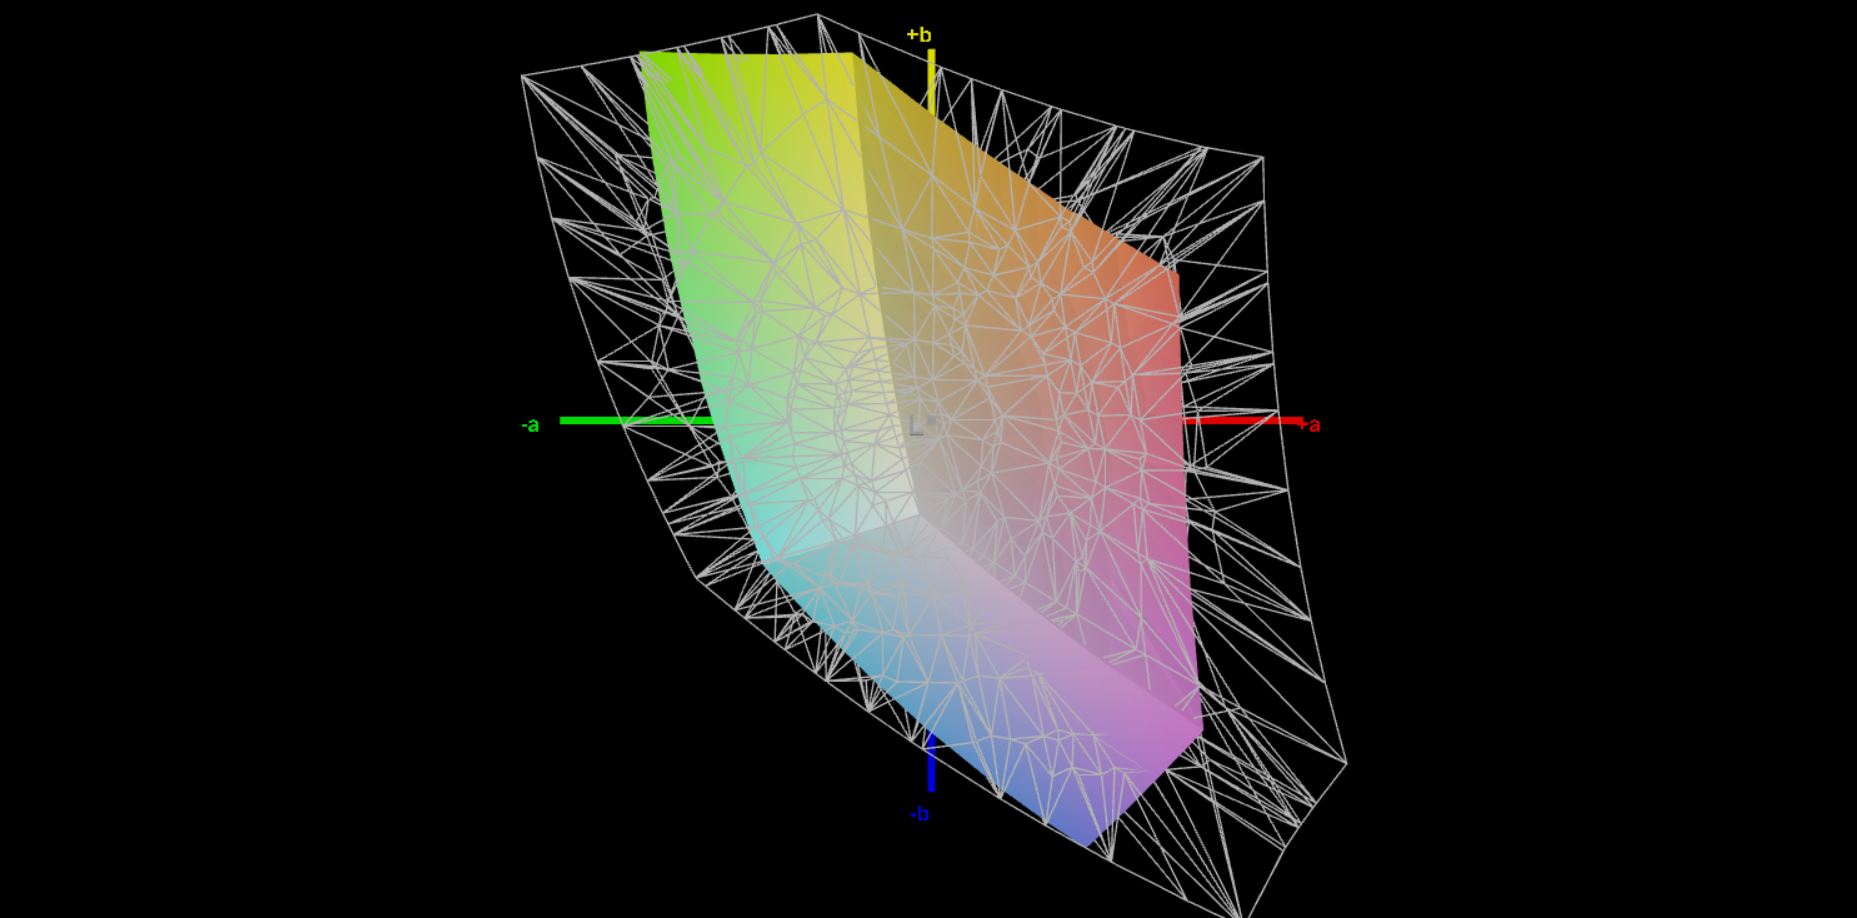
41.4% AdobeRGB 1998 (Argyll 3D)
59.9% sRGB (Argyll 3D)
40.1% Display P3 (Argyll 3D)
Gamma: 2.03
CCT: 6443 K
| HP ProBook x360 435 G8 R7-5800U AUO4B2D, IPS, 1920x1080, 13.3" | Lenovo ThinkPad L13 Yoga Gen2-20VK000VGE N133HCE-EP2, IPS, 1920x1080, 13.3" | Fujitsu LifeBook U9310X LQ133M1JW48, IPS, 1920x1080, 13.3" | Acer Spin 3 SP313-51N-56YV AU Optronics AUOB493, IPS, 2560x1600, 13.3" | HP ProBook x360 435 G7, Ryzen 5 4500U LGD0675, IPS LED, 1920x1080, 13.3" | |
|---|---|---|---|---|---|
| Display | 69% | 64% | 84% | 55% | |
| Display P3 Coverage (%) | 40.1 | 68.5 71% | 66.4 66% | 78.8 97% | 63.1 57% |
| sRGB Coverage (%) | 59.9 | 99.4 66% | 96.9 62% | 99.8 67% | 90.8 52% |
| AdobeRGB 1998 Coverage (%) | 41.4 | 70.7 71% | 67.4 63% | 77.6 87% | 64.5 56% |
| Response Times | -1% | -27% | -17% | -2% | |
| Response Time Grey 50% / Grey 80% * (ms) | 42.8 ? | 44.4 ? -4% | 62.4 ? -46% | 52 ? -21% | 45.6 ? -7% |
| Response Time Black / White * (ms) | 32 ? | 31.2 ? 2% | 34.4 ? -8% | 36 ? -13% | 30.8 ? 4% |
| PWM Frequency (Hz) | 25000 ? | 211.9 ? | |||
| Screen | 21% | 18% | -14% | 18% | |
| Brightness middle (cd/m²) | 304 | 316 4% | 345 13% | 338 11% | 354 16% |
| Brightness (cd/m²) | 292 | 299 2% | 317 9% | 307 5% | 344 18% |
| Brightness Distribution (%) | 89 | 92 3% | 86 -3% | 83 -7% | 83 -7% |
| Black Level * (cd/m²) | 0.23 | 0.25 -9% | 0.24 -4% | 0.27 -17% | 0.16 30% |
| Contrast (:1) | 1322 | 1264 -4% | 1438 9% | 1252 -5% | 2213 67% |
| Colorchecker dE 2000 * | 5 | 1.7 66% | 2.7 46% | 4.63 7% | 3.4 32% |
| Colorchecker dE 2000 max. * | 17.7 | 3.8 79% | 4.2 76% | 9.99 44% | 5.8 67% |
| Colorchecker dE 2000 calibrated * | 4.2 | 0.7 83% | 1 76% | 1.64 61% | 2 52% |
| Greyscale dE 2000 * | 2.1 | 2.8 -33% | 3.3 -57% | 6.76 -222% | 4.5 -114% |
| Gamma | 2.03 108% | 2.25 98% | 2.31 95% | 2.37 93% | 2.29 96% |
| CCT | 6443 101% | 6654 98% | 7188 90% | 5934 110% | 6046 108% |
| Color Space (Percent of AdobeRGB 1998) (%) | 64.5 | 62.4 | 68 | 59 | |
| Color Space (Percent of sRGB) (%) | 99.4 | 96.9 | 98 | 90.6 | |
| Total Average (Program / Settings) | 30% /
28% | 18% /
22% | 18% /
7% | 24% /
23% |
* ... smaller is better
Display Response Times
| ↔ Response Time Black to White | ||
|---|---|---|
| 32 ms ... rise ↗ and fall ↘ combined | ↗ 18 ms rise | 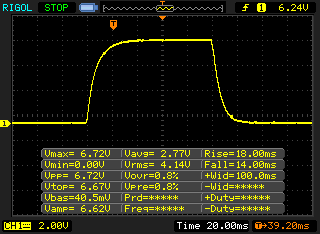 |
| ↘ 14 ms fall | ||
| The screen shows slow response rates in our tests and will be unsatisfactory for gamers. In comparison, all tested devices range from 0.1 (minimum) to 240 (maximum) ms. » 86 % of all devices are better. This means that the measured response time is worse than the average of all tested devices (19.8 ms). | ||
| ↔ Response Time 50% Grey to 80% Grey | ||
| 42.8 ms ... rise ↗ and fall ↘ combined | ↗ 20 ms rise | 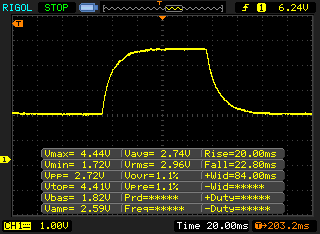 |
| ↘ 22.8 ms fall | ||
| The screen shows slow response rates in our tests and will be unsatisfactory for gamers. In comparison, all tested devices range from 0.165 (minimum) to 636 (maximum) ms. » 70 % of all devices are better. This means that the measured response time is worse than the average of all tested devices (31 ms). | ||
Screen Flickering / PWM (Pulse-Width Modulation)
| Screen flickering / PWM not detected | 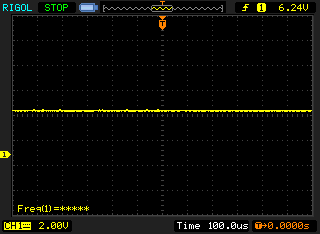 | ||
In comparison: 52 % of all tested devices do not use PWM to dim the display. If PWM was detected, an average of 7757 (minimum: 5 - maximum: 343500) Hz was measured. | |||
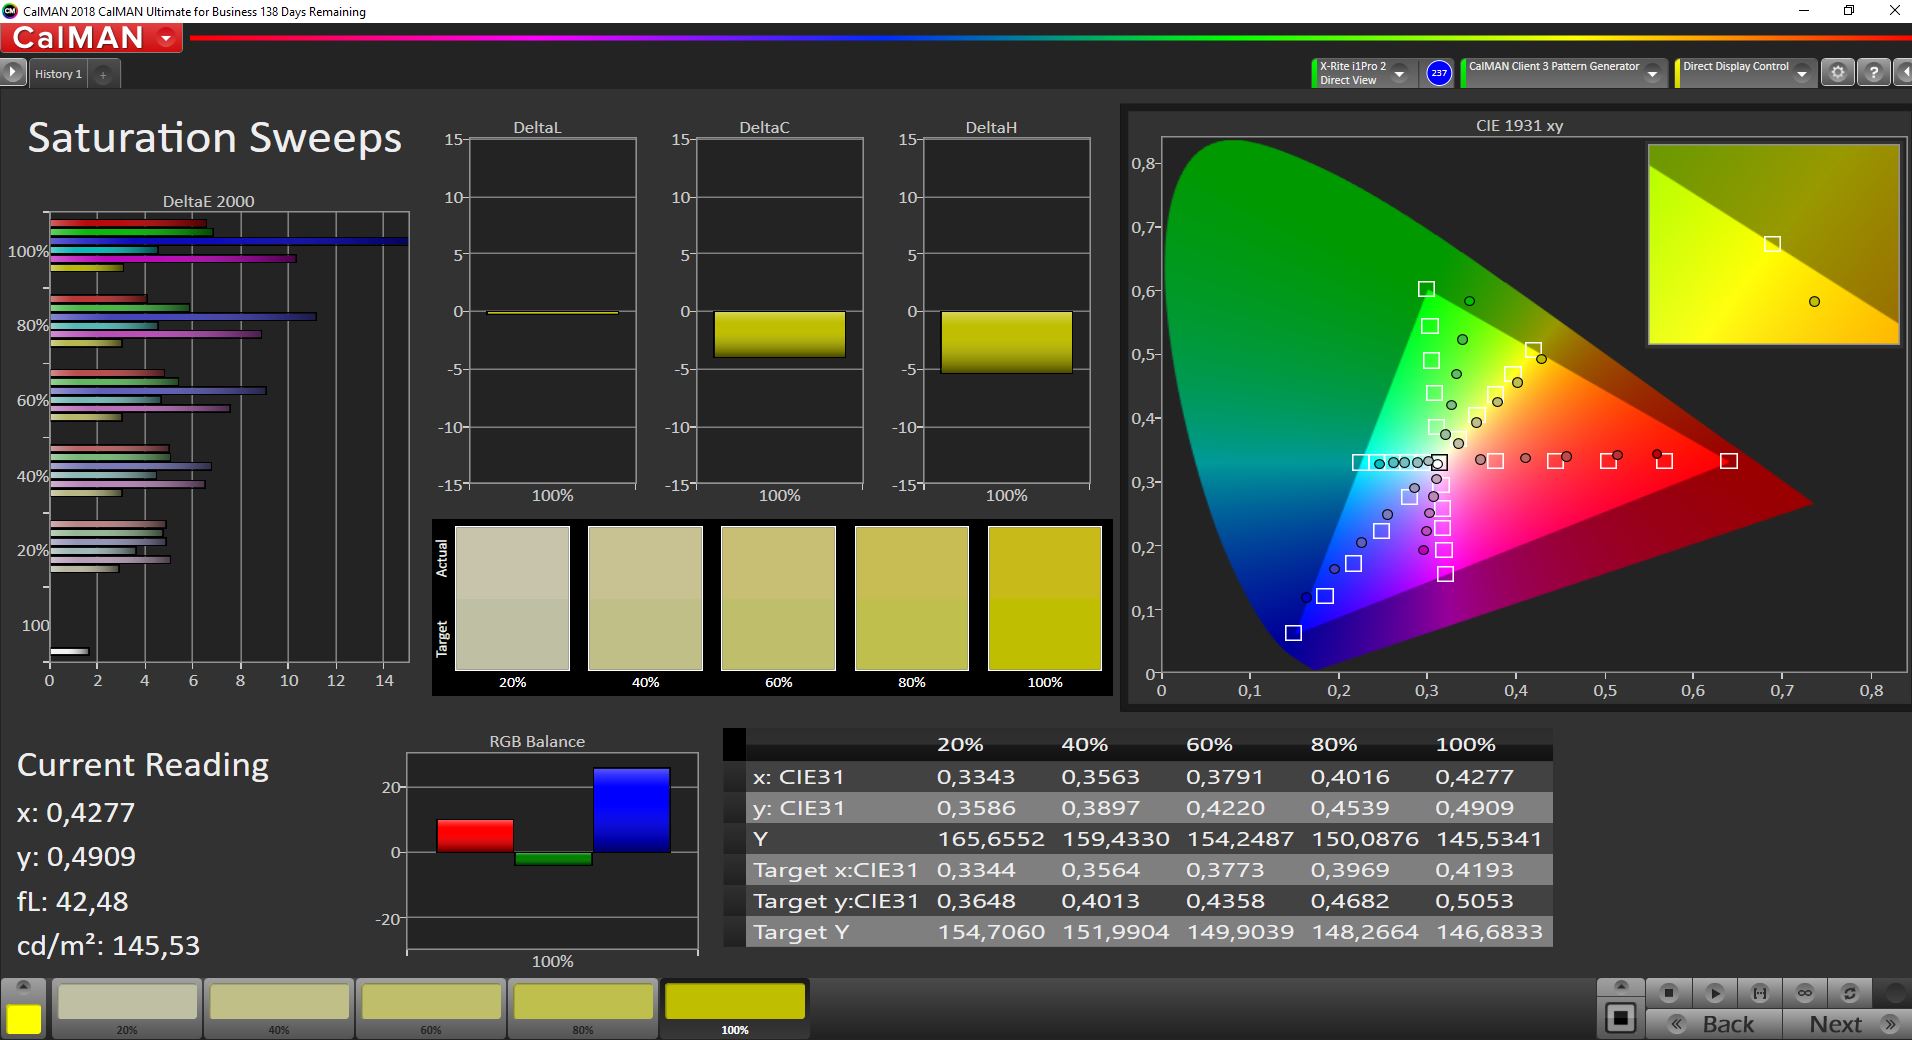
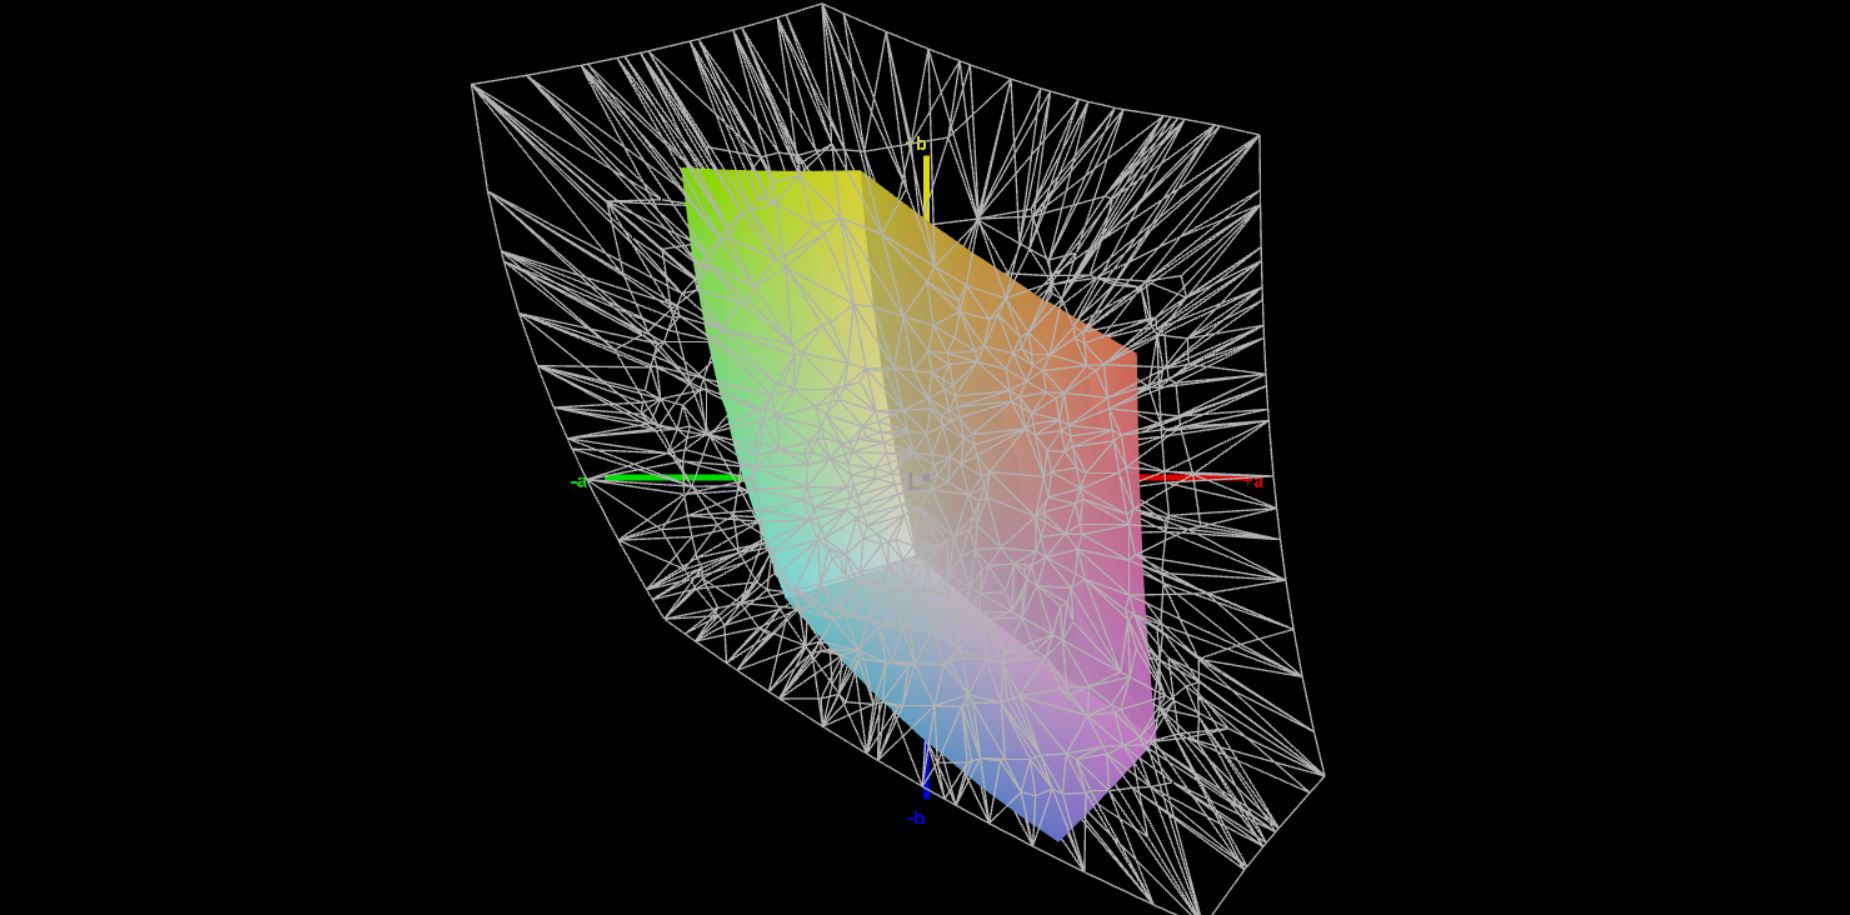
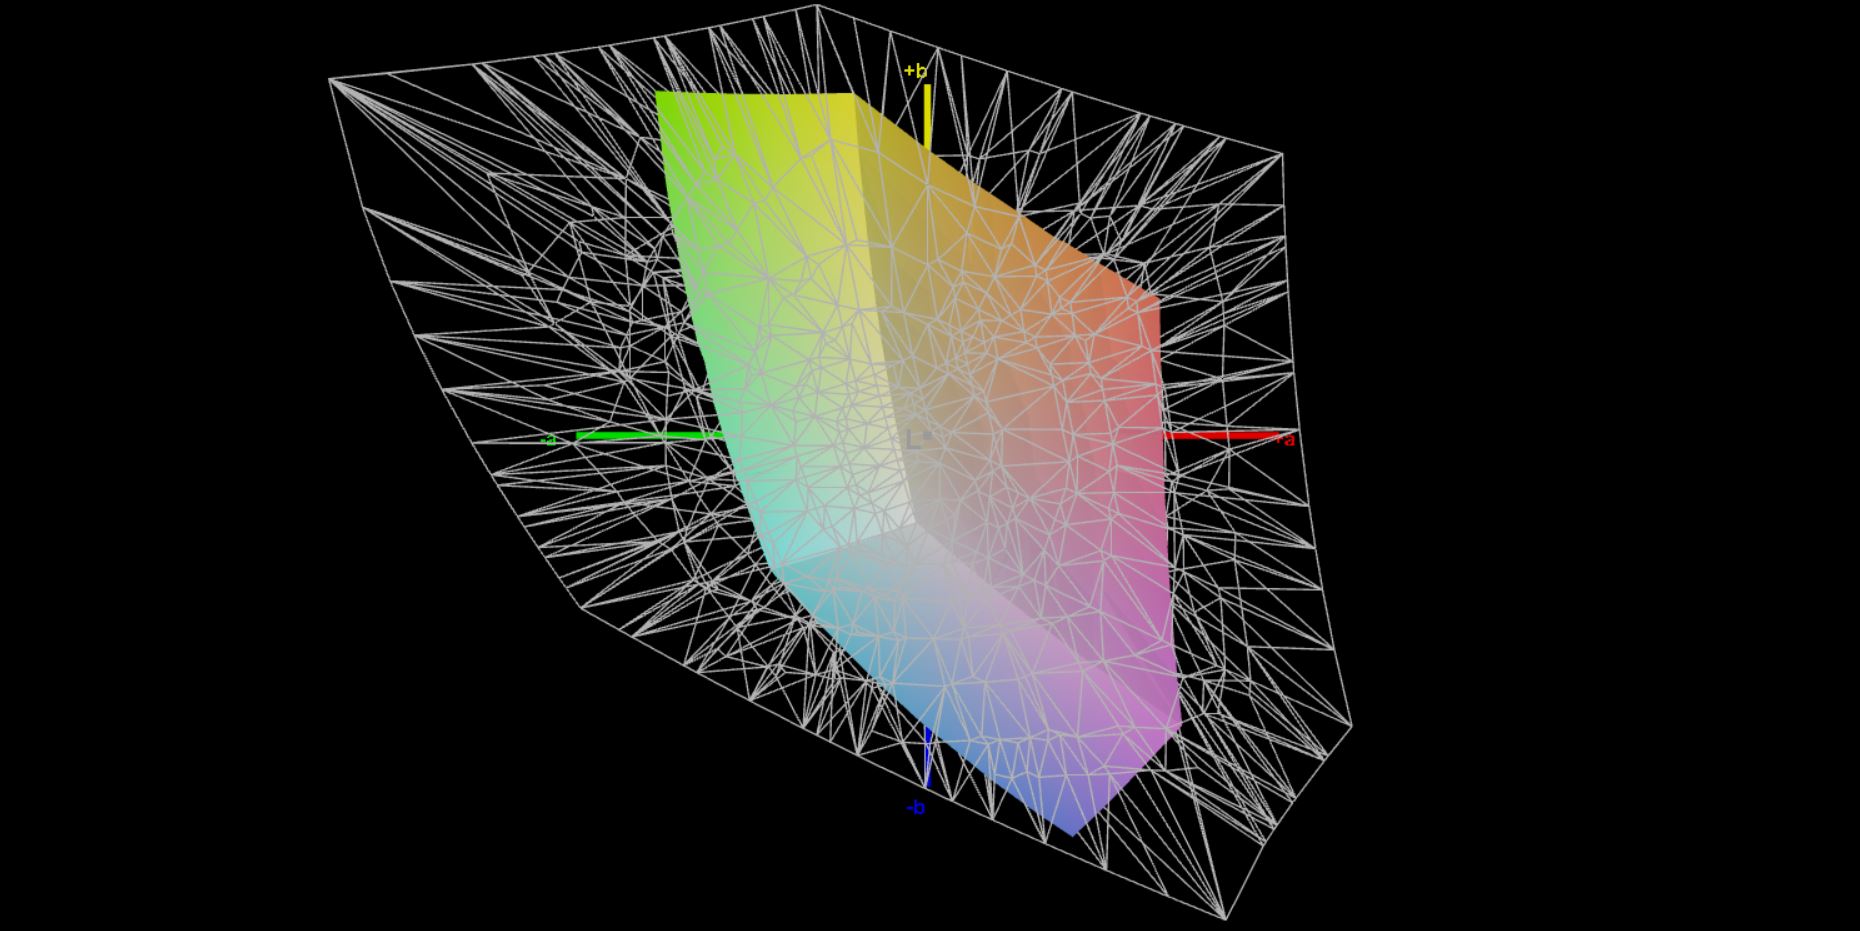
不仅在亮度方面,而且在色彩还原和可显示的色彩空间方面,测试设备中的面板明显弱于我们之前的模型,即 ProBook x360 435 G7.我们用专业的CalMAN软件进行分析,没有发现任何偏色现象,尤其是灰度,已经是令人信服的前作了。然而,即使使用我们的校准(X-Rite i1 Pro 2),我们也无法纠正颜色的高偏差;面板根本无法更准确地表达颜色。sRGB色彩空间也只覆盖了不到60%,所以这款面板不适合编辑图片/视频。然而,对于相当普通的办公应用来说,没有任何限制。

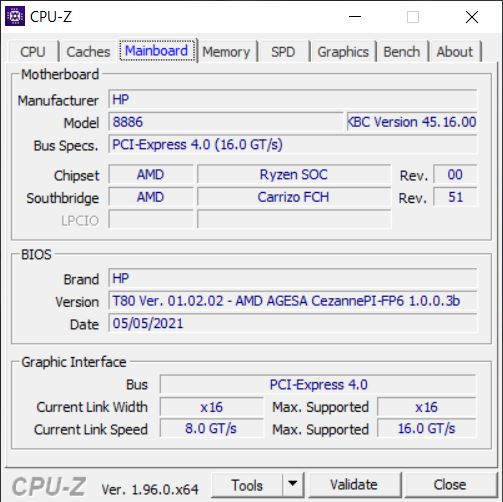
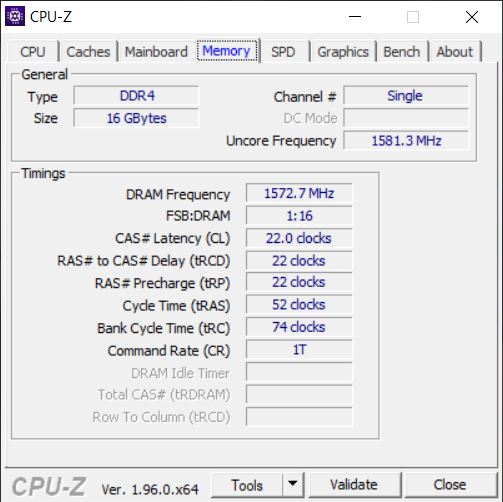
性能 - 比许多工作站更强大
除了常规的Ryzen 5000芯片(Ryzen 3、5和7),惠普还提供了带有Ryzen Pro CPU的ProBook x360 435 G8,它提供更多的安全功能(与英特尔的vPro功能相当)。工作内存有两个插槽,但在我们的测试设备中只安装了16GB条(单通道)。因此,如果你想利用iGPU的最大图形性能,你必须安装另一个RAM模块。
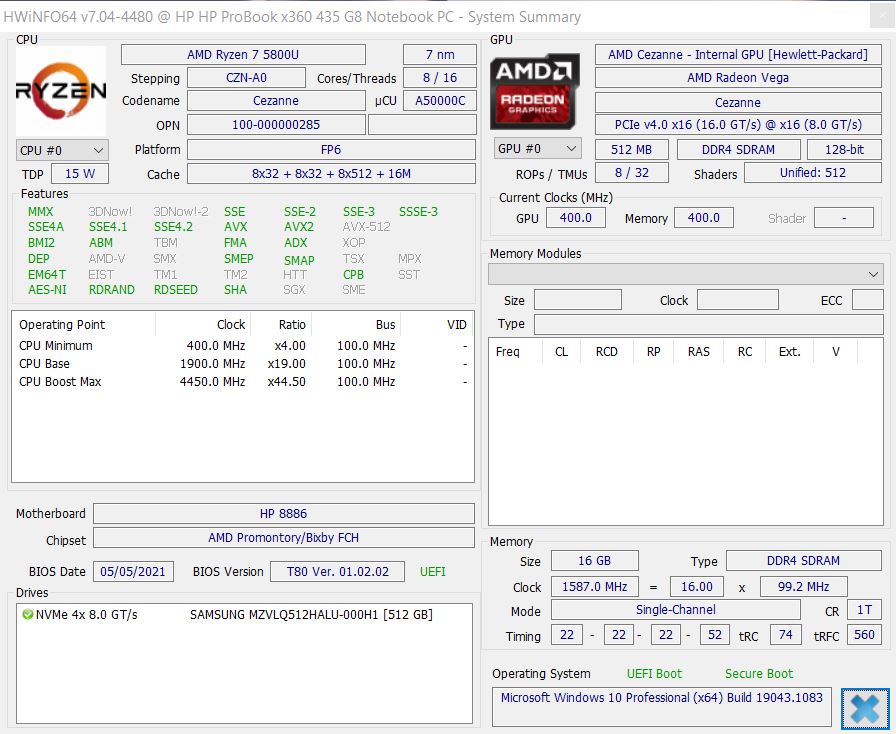
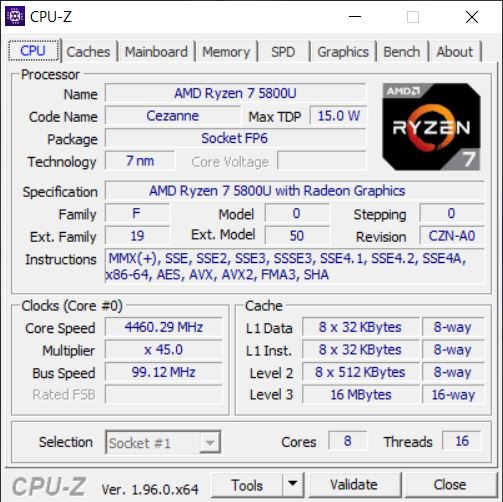
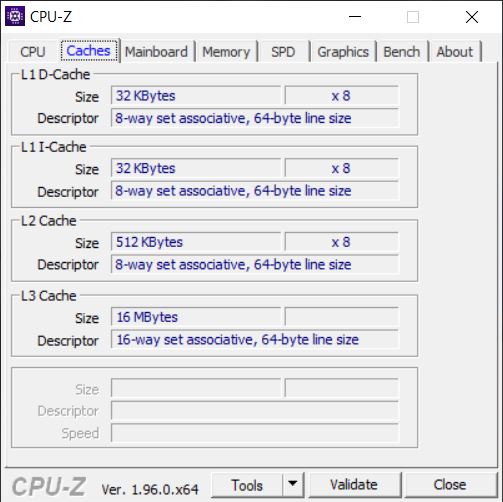
处理器 - AMD Ryzen 7 5800U
随着 锐真7 5800U这个紧凑的敞篷车几乎看起来过于强大了。凭借其八个核心,AMD的移动处理器甚至可以与配备英特尔第10代45瓦CPU的完全成熟的工作站竞争。只有英特尔的Tiger Lake CPU的快速实现在单核应用中略有优势,但差异很小,在日常使用中并不明显。
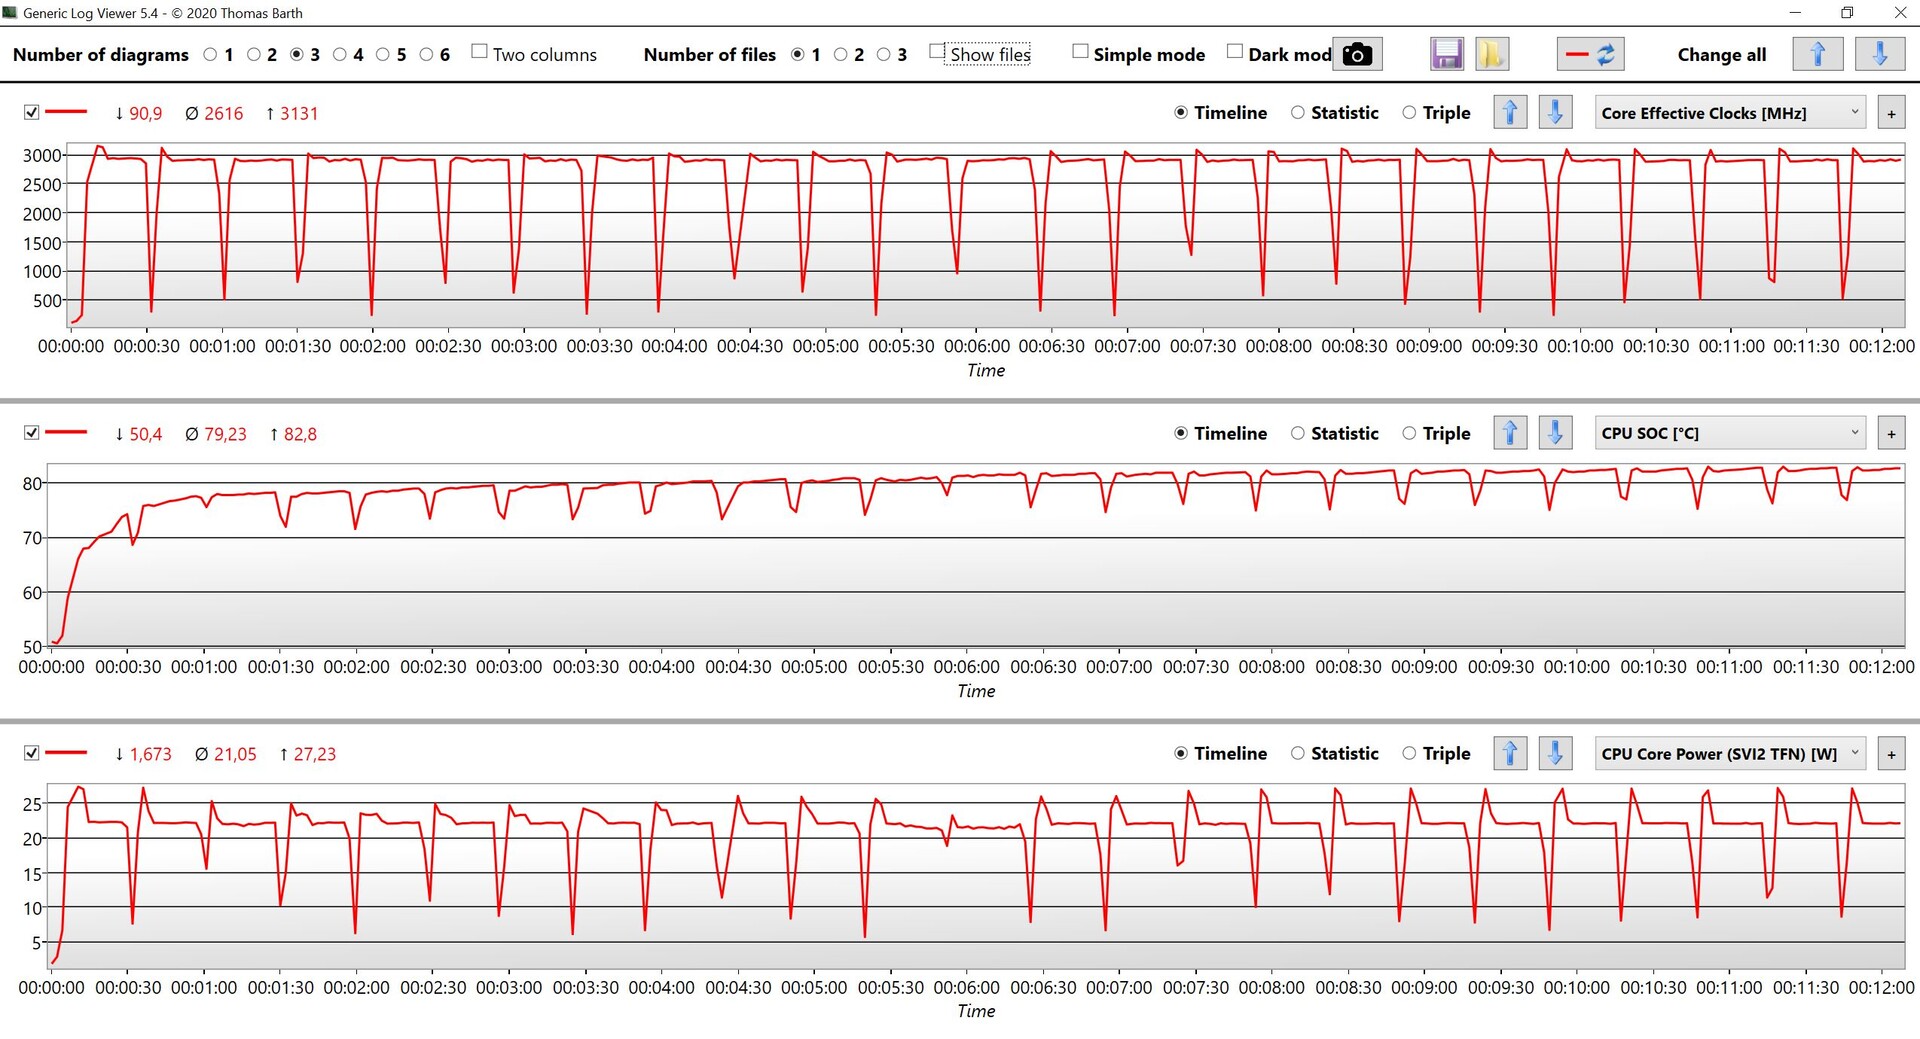
Cinebench R15 Multi Endurance test
性能也保持相当稳定,英特尔CPU所表现出的第一秒后的强烈下降,在这里并不存在。然而,不得不说,惠普的功率限制是相当保守的(几秒钟内最大27瓦,然后~22瓦),这就是为什么Ryzen 7 5800U理论上可能更快。在电池模式下,性能不会降低。
Cinebench R20: CPU (Single Core) | CPU (Multi Core)
Cinebench R15: CPU Single 64Bit | CPU Multi 64Bit
Blender: v2.79 BMW27 CPU
7-Zip 18.03: 7z b 4 -mmt1 | 7z b 4
Geekbench 5.5: Single-Core | Multi-Core
HWBOT x265 Benchmark v2.2: 4k Preset
LibreOffice : 20 Documents To PDF
R Benchmark 2.5: Overall mean
| Cinebench R23 / Single Core | |
| Average of class Convertible (740 - 2188, n=48, last 2 years) | |
| Lenovo ThinkPad X13 G2 20WK0024GE | |
| Average AMD Ryzen 7 5800U (1415 - 1430, n=5) | |
| HP ProBook x360 435 G8 R7-5800U | |
| Acer Spin 3 SP313-51N-56YV | |
| Lenovo ThinkPad L13 Yoga Gen2-20VK000VGE | |
| Cinebench R23 / Multi Core | |
| Average of class Convertible (1317 - 30959, n=48, last 2 years) | |
| HP ProBook x360 435 G8 R7-5800U | |
| Average AMD Ryzen 7 5800U (7872 - 10624, n=5) | |
| Lenovo ThinkPad X13 G2 20WK0024GE | |
| Acer Spin 3 SP313-51N-56YV | |
| Lenovo ThinkPad L13 Yoga Gen2-20VK000VGE | |
| Cinebench R20 / CPU (Single Core) | |
| Average of class Convertible (273 - 834, n=48, last 2 years) | |
| Lenovo ThinkPad X13 G2 20WK0024GE | |
| HP ProBook x360 435 G8 R7-5800U | |
| Average AMD Ryzen 7 5800U (551 - 560, n=5) | |
| Lenovo ThinkPad L13 Yoga Gen2-20VK000VGE | |
| Acer Spin 3 SP313-51N-56YV | |
| HP ProBook x360 435 G7, Ryzen 5 4500U | |
| Fujitsu LifeBook U9310X | |
| Cinebench R20 / CPU (Multi Core) | |
| Average of class Convertible (595 - 12102, n=48, last 2 years) | |
| HP ProBook x360 435 G8 R7-5800U | |
| Average AMD Ryzen 7 5800U (2995 - 3691, n=5) | |
| HP ProBook x360 435 G7, Ryzen 5 4500U | |
| Lenovo ThinkPad X13 G2 20WK0024GE | |
| Acer Spin 3 SP313-51N-56YV | |
| Lenovo ThinkPad L13 Yoga Gen2-20VK000VGE | |
| Fujitsu LifeBook U9310X | |
| Cinebench R15 / CPU Single 64Bit | |
| Average of class Convertible (149.8 - 317, n=47, last 2 years) | |
| HP ProBook x360 435 G8 R7-5800U | |
| Average AMD Ryzen 7 5800U (227 - 229, n=4) | |
| Lenovo ThinkPad X13 G2 20WK0024GE | |
| Acer Spin 3 SP313-51N-56YV | |
| Lenovo ThinkPad L13 Yoga Gen2-20VK000VGE | |
| HP ProBook x360 435 G7, Ryzen 5 4500U | |
| Fujitsu LifeBook U9310X | |
| Cinebench R15 / CPU Multi 64Bit | |
| Average of class Convertible (478 - 4940, n=47, last 2 years) | |
| Average AMD Ryzen 7 5800U (1390 - 1925, n=5) | |
| HP ProBook x360 435 G8 R7-5800U | |
| Lenovo ThinkPad X13 G2 20WK0024GE | |
| HP ProBook x360 435 G7, Ryzen 5 4500U | |
| Acer Spin 3 SP313-51N-56YV | |
| Lenovo ThinkPad L13 Yoga Gen2-20VK000VGE | |
| Fujitsu LifeBook U9310X | |
| Blender / v2.79 BMW27 CPU | |
| Fujitsu LifeBook U9310X | |
| Lenovo ThinkPad L13 Yoga Gen2-20VK000VGE | |
| Acer Spin 3 SP313-51N-56YV | |
| HP ProBook x360 435 G7, Ryzen 5 4500U | |
| Lenovo ThinkPad X13 G2 20WK0024GE | |
| Average AMD Ryzen 7 5800U (319 - 391, n=4) | |
| Average of class Convertible (105 - 1051, n=47, last 2 years) | |
| HP ProBook x360 435 G8 R7-5800U | |
| 7-Zip 18.03 / 7z b 4 -mmt1 | |
| Average of class Convertible (3672 - 6655, n=47, last 2 years) | |
| HP ProBook x360 435 G8 R7-5800U | |
| Average AMD Ryzen 7 5800U (5285 - 5405, n=4) | |
| Lenovo ThinkPad X13 G2 20WK0024GE | |
| Lenovo ThinkPad L13 Yoga Gen2-20VK000VGE | |
| Acer Spin 3 SP313-51N-56YV | |
| HP ProBook x360 435 G7, Ryzen 5 4500U | |
| Fujitsu LifeBook U9310X | |
| 7-Zip 18.03 / 7z b 4 | |
| HP ProBook x360 435 G8 R7-5800U | |
| Average of class Convertible (12977 - 121368, n=47, last 2 years) | |
| Average AMD Ryzen 7 5800U (39618 - 45985, n=4) | |
| Lenovo ThinkPad X13 G2 20WK0024GE | |
| HP ProBook x360 435 G7, Ryzen 5 4500U | |
| Acer Spin 3 SP313-51N-56YV | |
| Lenovo ThinkPad L13 Yoga Gen2-20VK000VGE | |
| Fujitsu LifeBook U9310X | |
| Geekbench 5.5 / Single-Core | |
| Average of class Convertible (806 - 2275, n=48, last 2 years) | |
| Lenovo ThinkPad X13 G2 20WK0024GE | |
| Average AMD Ryzen 7 5800U (1411 - 1450, n=4) | |
| HP ProBook x360 435 G8 R7-5800U | |
| Lenovo ThinkPad L13 Yoga Gen2-20VK000VGE | |
| Acer Spin 3 SP313-51N-56YV | |
| HP ProBook x360 435 G7, Ryzen 5 4500U | |
| Fujitsu LifeBook U9310X | |
| Geekbench 5.5 / Multi-Core | |
| Average of class Convertible (1608 - 22023, n=48, last 2 years) | |
| Average AMD Ryzen 7 5800U (6093 - 7026, n=4) | |
| HP ProBook x360 435 G8 R7-5800U | |
| Lenovo ThinkPad X13 G2 20WK0024GE | |
| Acer Spin 3 SP313-51N-56YV | |
| Lenovo ThinkPad L13 Yoga Gen2-20VK000VGE | |
| HP ProBook x360 435 G7, Ryzen 5 4500U | |
| Fujitsu LifeBook U9310X | |
| HWBOT x265 Benchmark v2.2 / 4k Preset | |
| Average of class Convertible (3.43 - 36.2, n=47, last 2 years) | |
| HP ProBook x360 435 G8 R7-5800U | |
| Average AMD Ryzen 7 5800U (9.68 - 11, n=4) | |
| Lenovo ThinkPad X13 G2 20WK0024GE | |
| HP ProBook x360 435 G7, Ryzen 5 4500U | |
| Acer Spin 3 SP313-51N-56YV | |
| Lenovo ThinkPad L13 Yoga Gen2-20VK000VGE | |
| Fujitsu LifeBook U9310X | |
| LibreOffice / 20 Documents To PDF | |
| HP ProBook x360 435 G7, Ryzen 5 4500U | |
| HP ProBook x360 435 G8 R7-5800U | |
| Lenovo ThinkPad L13 Yoga Gen2-20VK000VGE | |
| Average AMD Ryzen 7 5800U (50.9 - 60.2, n=4) | |
| Fujitsu LifeBook U9310X | |
| Average of class Convertible (42.5 - 84.3, n=47, last 2 years) | |
| Acer Spin 3 SP313-51N-56YV | |
| Lenovo ThinkPad X13 G2 20WK0024GE | |
| R Benchmark 2.5 / Overall mean | |
| Fujitsu LifeBook U9310X | |
| HP ProBook x360 435 G7, Ryzen 5 4500U | |
| Acer Spin 3 SP313-51N-56YV | |
| Lenovo ThinkPad L13 Yoga Gen2-20VK000VGE | |
| Lenovo ThinkPad X13 G2 20WK0024GE | |
| Average AMD Ryzen 7 5800U (0.54 - 0.546, n=4) | |
| HP ProBook x360 435 G8 R7-5800U | |
| Average of class Convertible (0.3915 - 0.84, n=47, last 2 years) | |
* ... smaller is better
系统性能
系统性能非常好,基准测试结果也经常领先于对手。然而,所有的现代笔记本电脑在日常使用中都是非常灵敏的,你几乎注意不到区别。我们的测试设备在待机模式下有一些问题(关键词:现代待机),例如,当我们关上盖子时,经常仍在活动(风扇也是如此)。当然,这并不限制使用,但仍应注意。
| PCMark 10 / Score | |
| Average of class Convertible (3229 - 10123, n=45, last 2 years) | |
| Average AMD Ryzen 7 5800U, AMD Radeon RX Vega 8 (Ryzen 4000/5000) (5334 - 6090, n=4) | |
| HP ProBook x360 435 G8 R7-5800U | |
| Acer Spin 3 SP313-51N-56YV | |
| Lenovo ThinkPad L13 Yoga Gen2-20VK000VGE | |
| HP ProBook x360 435 G7, Ryzen 5 4500U | |
| Fujitsu LifeBook U9310X | |
| PCMark 10 / Essentials | |
| Average of class Convertible (7233 - 12222, n=45, last 2 years) | |
| Average AMD Ryzen 7 5800U, AMD Radeon RX Vega 8 (Ryzen 4000/5000) (9476 - 10182, n=4) | |
| Lenovo ThinkPad L13 Yoga Gen2-20VK000VGE | |
| Acer Spin 3 SP313-51N-56YV | |
| HP ProBook x360 435 G8 R7-5800U | |
| Fujitsu LifeBook U9310X | |
| HP ProBook x360 435 G7, Ryzen 5 4500U | |
| PCMark 10 / Productivity | |
| Average of class Convertible (5062 - 17914, n=45, last 2 years) | |
| Average AMD Ryzen 7 5800U, AMD Radeon RX Vega 8 (Ryzen 4000/5000) (8336 - 9657, n=4) | |
| HP ProBook x360 435 G8 R7-5800U | |
| Fujitsu LifeBook U9310X | |
| HP ProBook x360 435 G7, Ryzen 5 4500U | |
| Acer Spin 3 SP313-51N-56YV | |
| Lenovo ThinkPad L13 Yoga Gen2-20VK000VGE | |
| PCMark 10 / Digital Content Creation | |
| Average of class Convertible (2496 - 16551, n=45, last 2 years) | |
| Average AMD Ryzen 7 5800U, AMD Radeon RX Vega 8 (Ryzen 4000/5000) (5214 - 6235, n=4) | |
| HP ProBook x360 435 G8 R7-5800U | |
| Acer Spin 3 SP313-51N-56YV | |
| Lenovo ThinkPad L13 Yoga Gen2-20VK000VGE | |
| HP ProBook x360 435 G7, Ryzen 5 4500U | |
| Fujitsu LifeBook U9310X | |
| PCMark 10 Score | 5334 points | |
Help | ||
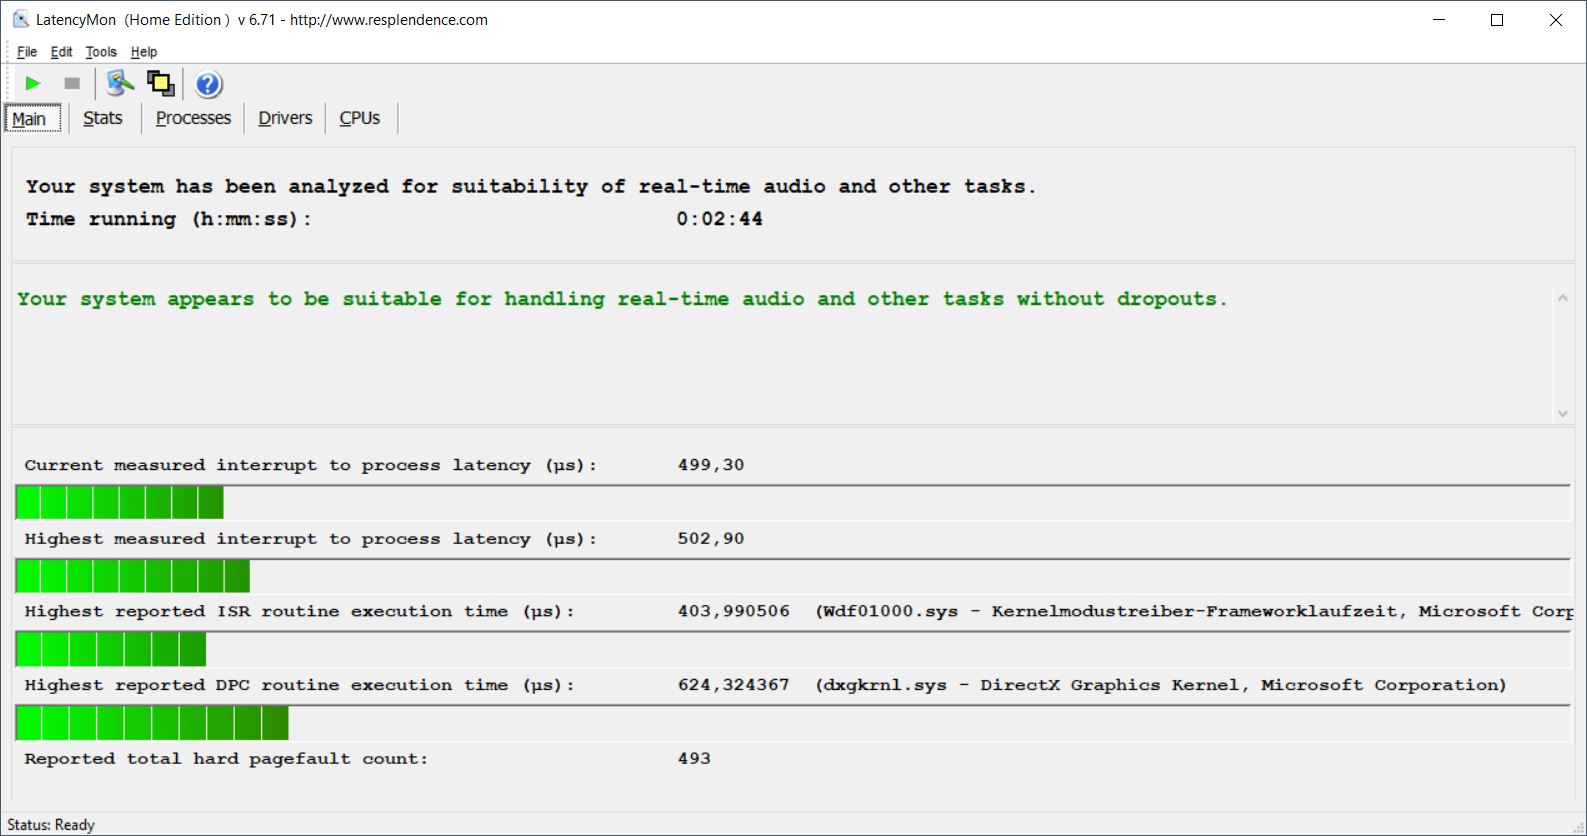
DPC延迟
在我们的标准化延迟测试中,ProBook没有任何限制。
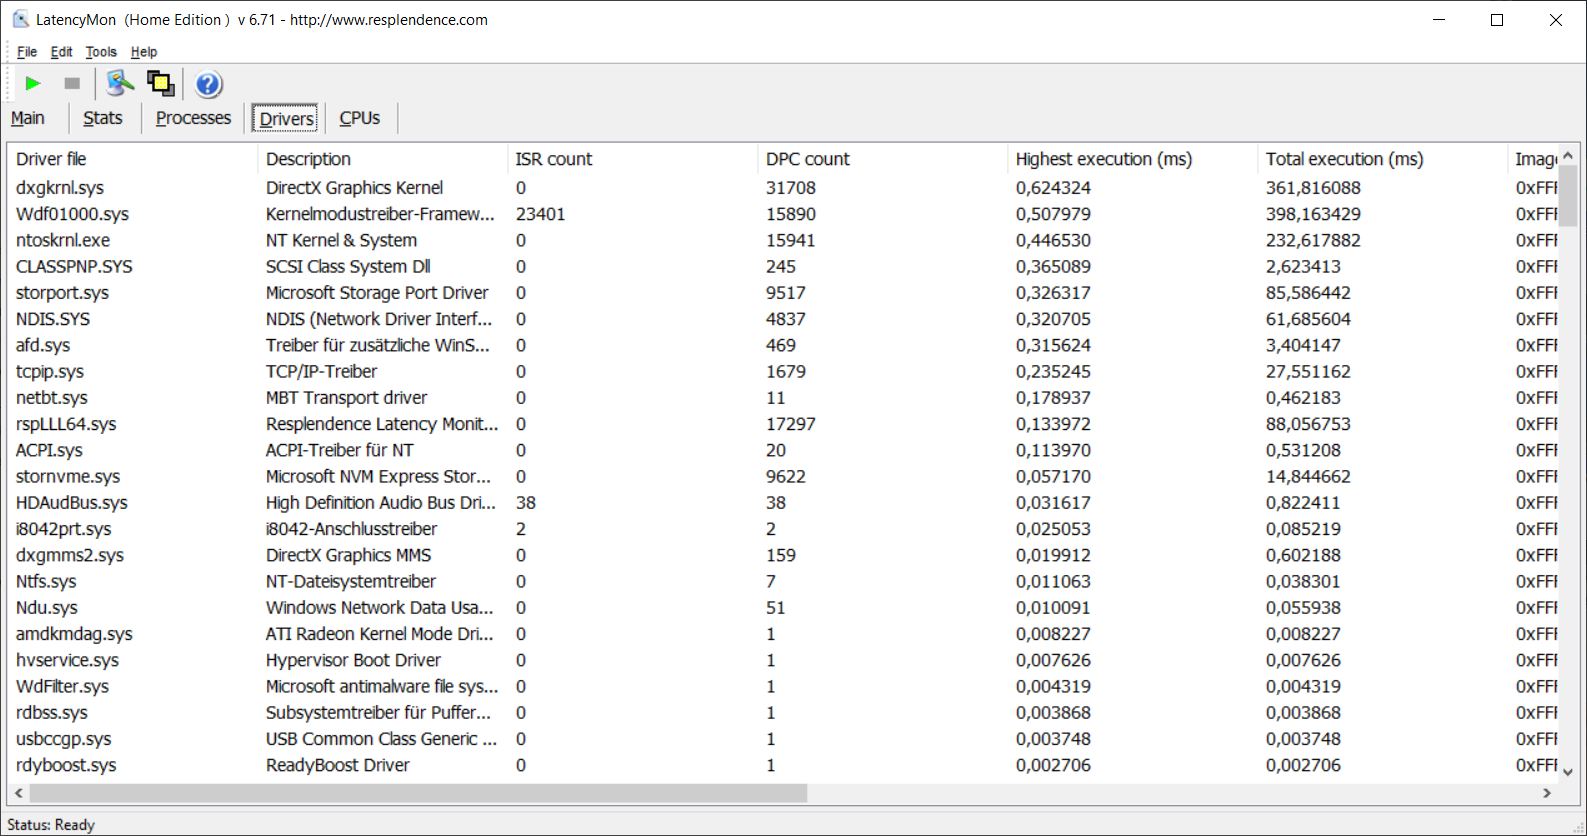
| DPC Latencies / LatencyMon - interrupt to process latency (max), Web, Youtube, Prime95 | |
| HP ProBook x360 435 G7, Ryzen 5 4500U | |
| Fujitsu LifeBook U9310X | |
| Acer Spin 3 SP313-51N-56YV | |
| Lenovo ThinkPad L13 Yoga Gen2-20VK000VGE | |
| HP ProBook x360 435 G8 R7-5800U | |
* ... smaller is better
大容量存储
M.2-2280固态硬盘通过PCIe-3.0-x4连接,在我们的测试设备中使用了存储容量为512GB的三星硬盘(PM991),其中425GB在首次启动后仍可供用户使用。传输速率还可以,在日常办公中没有任何限制,但市场上也有更快的驱动器。更多的SSD基准测试可在 这里.
| HP ProBook x360 435 G8 R7-5800U Samsung PM991 MZVLQ512HALU | Lenovo ThinkPad L13 Yoga Gen2-20VK000VGE WDC PC SN730 SDBPNTY-256G | Fujitsu LifeBook U9310X Toshiba KBG40ZNS512G NVMe | Acer Spin 3 SP313-51N-56YV Kingston OM8PCP3512F-AB | HP ProBook x360 435 G7, Ryzen 5 4500U WDC PC SN520 SDAPNUW-512G | Average Samsung PM991 MZVLQ512HALU | Average of class Convertible | |
|---|---|---|---|---|---|---|---|
| CrystalDiskMark 5.2 / 6 | 33% | 21% | 32% | 8% | 17% | 110% | |
| Write 4K (MB/s) | 86.7 | 119.7 38% | 134.2 55% | 286.1 230% | 94.1 9% | 131.8 ? 52% | 146.4 ? 69% |
| Read 4K (MB/s) | 32.45 | 38.54 19% | 53.4 65% | 48.89 51% | 41.01 26% | 44.9 ? 38% | 67.2 ? 107% |
| Write Seq (MB/s) | 1235 | 1754 42% | 1216 -2% | 982 -20% | 1465 19% | 1162 ? -6% | 2559 ? 107% |
| Read Seq (MB/s) | 1417 | 1709 21% | 1291 -9% | 1301 -8% | 1453 3% | 1473 ? 4% | 2959 ? 109% |
| Write 4K Q32T1 (MB/s) | 390.8 | 461.9 18% | 401.5 3% | 625 60% | 322.6 -17% | 399 ? 2% | 459 ? 17% |
| Read 4K Q32T1 (MB/s) | 291 | 390.5 34% | 491.4 69% | 301 3% | 421.8 45% | 426 ? 46% | 588 ? 102% |
| Write Seq Q32T1 (MB/s) | 1384 | 2185 58% | 1224 -12% | 981 -29% | 1463 6% | 1348 ? -3% | 4416 ? 219% |
| Read Seq Q32T1 (MB/s) | 2350 | 3118 33% | 2314 -2% | 1631 -31% | 1751 -25% | 2398 ? 2% | 5848 ? 149% |
| AS SSD | 86% | 10% | 30% | 43% | 58% | 166% | |
| Seq Read (MB/s) | 1936 | 2387 23% | 2030 5% | 1748 -10% | 1491 -23% | 1921 ? -1% | 4297 ? 122% |
| Seq Write (MB/s) | 1237 | 2000 62% | 1071 -13% | 941 -24% | 1306 6% | 1128 ? -9% | 3008 ? 143% |
| 4K Read (MB/s) | 40.35 | 41.18 2% | 49.16 22% | 44.06 9% | 41.2 2% | 47.6 ? 18% | 61 ? 51% |
| 4K Write (MB/s) | 99.5 | 169.6 70% | 117.3 18% | 77.7 -22% | 118.1 19% | 137.9 ? 39% | 165.4 ? 66% |
| 4K-64 Read (MB/s) | 645 | 681 6% | 1268 97% | 451.1 -30% | 1033 60% | 878 ? 36% | 940 ? 46% |
| 4K-64 Write (MB/s) | 365.8 | 571 56% | 699 91% | 926 153% | 1007 175% | 782 ? 114% | 1741 ? 376% |
| Access Time Read * (ms) | 0.104 | 0.051 51% | 0.067 36% | 0.188 -81% | 0.103 1% | 0.09367 ? 10% | 0.07626 ? 27% |
| Access Time Write * (ms) | 0.038 | 0.025 34% | 0.168 -342% | 0.043 -13% | 0.031 18% | 0.03708 ? 2% | 0.08551 ? -125% |
| Score Read (Points) | 879 | 961 9% | 1520 73% | 670 -24% | 1223 39% | 1118 ? 27% | 1430 ? 63% |
| Score Write (Points) | 589 | 941 60% | 923 57% | 1098 86% | 1256 113% | 1033 ? 75% | 2207 ? 275% |
| Score Total (Points) | 1892 | 2384 26% | 3179 68% | 2084 10% | 3102 64% | 2694 ? 42% | 4319 ? 128% |
| Copy ISO MB/s (MB/s) | 708 | 1855 162% | 969 37% | 1347 ? 90% | 2597 ? 267% | ||
| Copy Program MB/s (MB/s) | 132.1 | 565 328% | 609 361% | 421 ? 219% | 782 ? 492% | ||
| Copy Game MB/s (MB/s) | 326.7 | 1360 316% | 232.4 -29% | 825 ? 153% | 1607 ? 392% | ||
| Total Average (Program / Settings) | 60% /
67% | 16% /
15% | 31% /
31% | 26% /
28% | 38% /
43% | 138% /
146% |
* ... smaller is better

Continuous load read: DiskSpd Read Loop, Queue Depth 8
图形卡
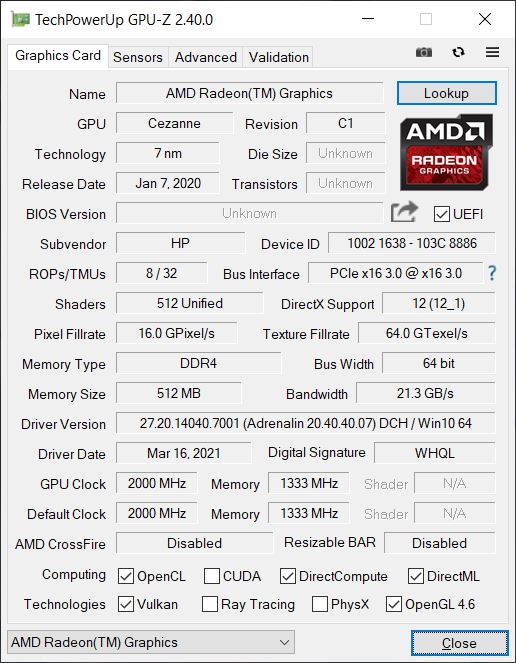
淘宝网 睿狮7 5800U配备了集成的 Radeon RX Vega 8.与上一代相比,主要是在细节上有改进。虽然我们的评测样本在单通道内存配置下无法发挥Vega 8的全部潜力,但总体上性能相当。英特尔目前的 Xe Graphics G7(有80或96个EU)在合成测试中稍快,但ProBook可以通过另一个RAM模块缩小差距。
Ryzen 5000芯片中的新iGPU的一个优势主要是提高了视频播放时的效率,然后对电池运行时间也有积极影响。在播放4K YouTube视频时,GPU的负载只有个位数的百分比,而在前代产品中仍然是~60%(Iris Xe Graphics~30%)。
至少可以用iGPU流畅地播放旧的或一些高要求的标题,尽管你在这里通常被限制在低到中等的细节。
在电池模式下,GPU的性能不会降低,即使在较长的负载下,性能也保持稳定。更多的GPU基准测试可在我们的技术部分 。
| 3DMark 11 - 1280x720 Performance GPU | |
| Average of class Convertible (1505 - 40732, n=47, last 2 years) | |
| Lenovo ThinkPad X13 G2 20WK0024GE | |
| Acer Spin 3 SP313-51N-56YV | |
| Average AMD Radeon RX Vega 8 (Ryzen 4000/5000) (3459 - 7591, n=57) | |
| Lenovo ThinkPad L13 Yoga Gen2-20VK000VGE | |
| HP ProBook x360 435 G8 R7-5800U | |
| HP ProBook x360 435 G7, Ryzen 5 4500U | |
| Fujitsu LifeBook U9310X | |
| 3DMark 11 Performance | 4663 points | |
| 3DMark Cloud Gate Standard Score | 18062 points | |
| 3DMark Fire Strike Score | 2356 points | |
| 3DMark Time Spy Score | 991 points | |
Help | ||
Witcher 3 FPS-Diagram
| GTA V | |
| 1920x1080 Highest AA:4xMSAA + FX AF:16x | |
| Average of class Convertible (7.14 - 90.6, n=40, last 2 years) | |
| Average AMD Radeon RX Vega 8 (Ryzen 4000/5000) (6 - 18.2, n=42) | |
| HP ProBook x360 435 G8 R7-5800U | |
| Acer Spin 3 SP313-51N-56YV | |
| 1920x1080 High/On (Advanced Graphics Off) AA:2xMSAA + FX AF:8x | |
| Average of class Convertible (6.88 - 166.9, n=40, last 2 years) | |
| Average AMD Radeon RX Vega 8 (Ryzen 4000/5000) (13.8 - 40.6, n=45) | |
| Acer Spin 3 SP313-51N-56YV | |
| HP ProBook x360 435 G8 R7-5800U | |
| 1366x768 Normal/Off AF:4x | |
| Average of class Convertible (46.6 - 161.6, n=31, last 2 years) | |
| Average AMD Radeon RX Vega 8 (Ryzen 4000/5000) (34 - 148, n=43) | |
| Acer Spin 3 SP313-51N-56YV | |
| HP ProBook x360 435 G8 R7-5800U | |
| 1024x768 Lowest Settings possible | |
| Average of class Convertible (50.6 - 172, n=38, last 2 years) | |
| Average AMD Radeon RX Vega 8 (Ryzen 4000/5000) (53.6 - 160, n=48) | |
| Acer Spin 3 SP313-51N-56YV | |
| HP ProBook x360 435 G8 R7-5800U | |
| Strange Brigade | |
| 1920x1080 ultra AA:ultra AF:16 | |
| Average of class Convertible (10.8 - 176.8, n=44, last 2 years) | |
| Average AMD Radeon RX Vega 8 (Ryzen 4000/5000) (12.8 - 32.1, n=48) | |
| HP ProBook x360 435 G8 R7-5800U | |
| 1920x1080 high AA:high AF:8 | |
| Average of class Convertible (12.5 - 198.2, n=44, last 2 years) | |
| Acer Spin 3 SP313-51N-56YV | |
| Average AMD Radeon RX Vega 8 (Ryzen 4000/5000) (14.6 - 37.7, n=50) | |
| HP ProBook x360 435 G8 R7-5800U | |
| 1920x1080 medium AA:medium AF:4 | |
| Average of class Convertible (14.9 - 224, n=45, last 2 years) | |
| Average AMD Radeon RX Vega 8 (Ryzen 4000/5000) (16.9 - 45.3, n=50) | |
| Acer Spin 3 SP313-51N-56YV | |
| HP ProBook x360 435 G8 R7-5800U | |
| 1280x720 lowest AF:1 | |
| Average of class Convertible (27.6 - 484, n=46, last 2 years) | |
| Average AMD Radeon RX Vega 8 (Ryzen 4000/5000) (43 - 117, n=51) | |
| Acer Spin 3 SP313-51N-56YV | |
| HP ProBook x360 435 G8 R7-5800U | |
| X-Plane 11.11 | |
| 1920x1080 high (fps_test=3) | |
| Acer Spin 3 SP313-51N-56YV | |
| Average of class Convertible (12.8 - 76.7, n=47, last 2 years) | |
| Average AMD Radeon RX Vega 8 (Ryzen 4000/5000) (16.9 - 43.1, n=59) | |
| HP ProBook x360 435 G8 R7-5800U | |
| Lenovo ThinkPad L13 Yoga Gen2-20VK000VGE | |
| HP ProBook x360 435 G7, Ryzen 5 4500U | |
| Fujitsu LifeBook U9310X | |
| 1920x1080 med (fps_test=2) | |
| Average of class Convertible (13.8 - 104.9, n=47, last 2 years) | |
| Average AMD Radeon RX Vega 8 (Ryzen 4000/5000) (18.7 - 49.6, n=59) | |
| Acer Spin 3 SP313-51N-56YV | |
| HP ProBook x360 435 G8 R7-5800U | |
| Lenovo ThinkPad L13 Yoga Gen2-20VK000VGE | |
| HP ProBook x360 435 G7, Ryzen 5 4500U | |
| Fujitsu LifeBook U9310X | |
| 1280x720 low (fps_test=1) | |
| Average of class Convertible (22.9 - 138.8, n=49, last 2 years) | |
| Average AMD Radeon RX Vega 8 (Ryzen 4000/5000) (25.3 - 64.9, n=59) | |
| Acer Spin 3 SP313-51N-56YV | |
| HP ProBook x360 435 G8 R7-5800U | |
| HP ProBook x360 435 G7, Ryzen 5 4500U | |
| Fujitsu LifeBook U9310X | |
| low | med. | high | ultra | |
|---|---|---|---|---|
| GTA V (2015) | 69.8 | 64.5 | 17.2 | 7.36 |
| The Witcher 3 (2015) | 42 | 14 | 9.33 | |
| Dota 2 Reborn (2015) | 108 | 79.2 | 38.6 | 36.4 |
| Final Fantasy XV Benchmark (2018) | 24.4 | 12 | 7.97 | |
| X-Plane 11.11 (2018) | 40 | 29.9 | 26.2 | |
| Strange Brigade (2018) | 48 | 18.7 | 15.8 | 13.9 |
Emissions & Energy
噪声排放
ProBook的单个风扇即使在负载情况下也不会令人不快,但问题是风扇的控制有些不成熟。特别是在Windows的高性能模式下,即使在空转时,风扇也会时不时地启动,没有任何明显的原因。在这里,待机模式的问题再次出现,因为我们有时会惊讶地发现风扇也会启动。在这些情况下,笔记本电脑根本没有正确进入待机模式。我们听不到任何其他电子噪音。
Noise level
| Idle |
| 23.7 / 27.5 / 34.4 dB(A) |
| Load |
| 36.2 / 38.7 dB(A) |
 | ||
30 dB silent 40 dB(A) audible 50 dB(A) loud |
||
min: | ||
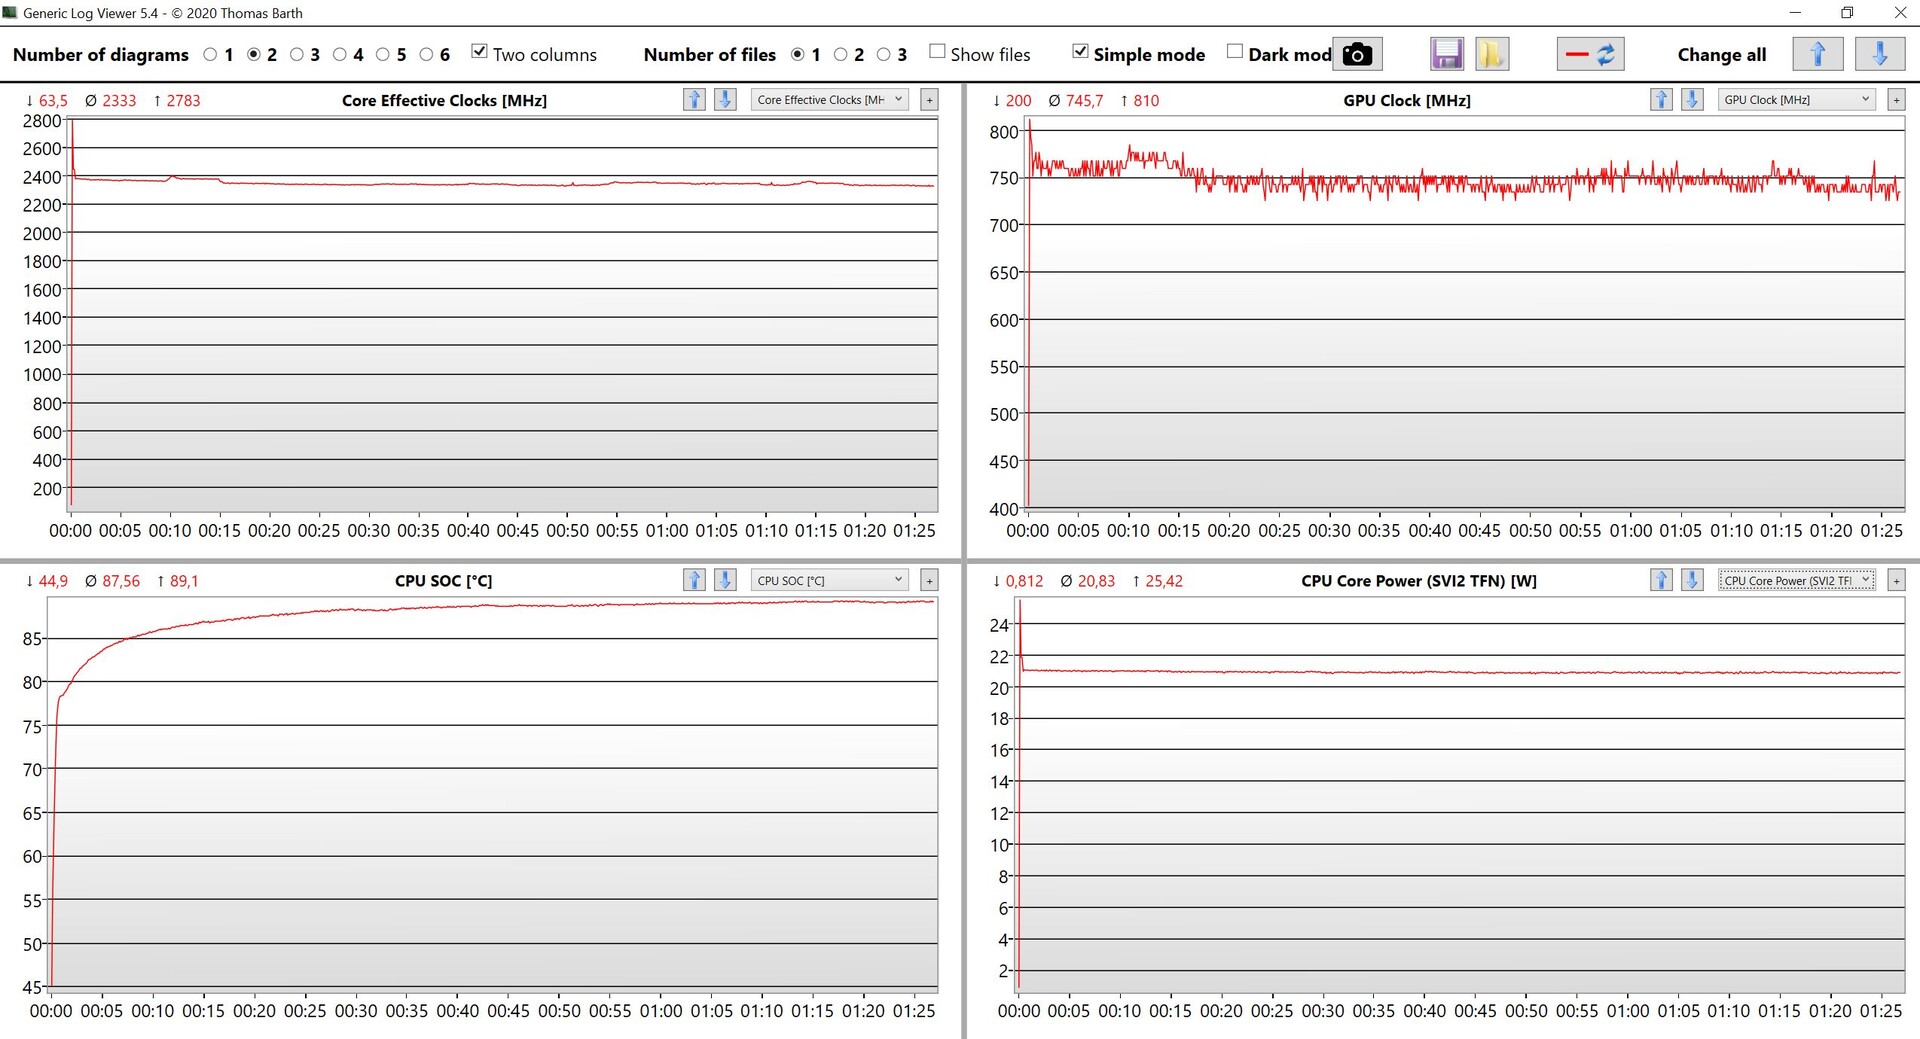
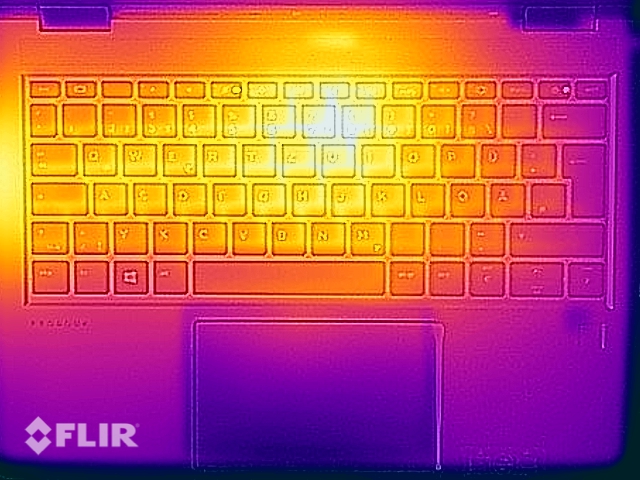
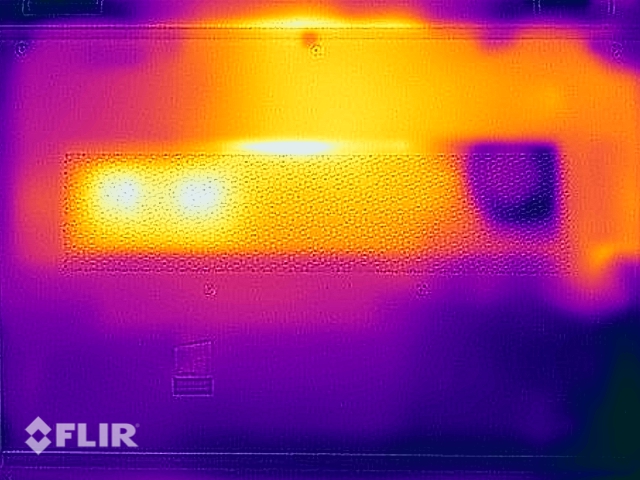
温度
在负载情况下,机箱在某些地方确实会明显发热(<45 °C,113 °F),皮肤直接接触会令人不快,但这绝不是关键。反正对于正常的办公任务没有任何限制。与纯处理器负载一样,SoC的消耗量很快就稳定在~21瓦,这对于8x 2.4 GHz(CPU)和~750 MHz(iGPU)来说仍然足够。压力测试后没有直接的性能损失。
(±) The maximum temperature on the upper side is 43.8 °C / 111 F, compared to the average of 35.4 °C / 96 F, ranging from 19.6 to 60 °C for the class Convertible.
(-) The bottom heats up to a maximum of 47.4 °C / 117 F, compared to the average of 36.9 °C / 98 F
(+) In idle usage, the average temperature for the upper side is 24.2 °C / 76 F, compared to the device average of 30.3 °C / 87 F.
(±) Playing The Witcher 3, the average temperature for the upper side is 34.2 °C / 94 F, compared to the device average of 30.3 °C / 87 F.
(+) The palmrests and touchpad are cooler than skin temperature with a maximum of 31.9 °C / 89.4 F and are therefore cool to the touch.
(-) The average temperature of the palmrest area of similar devices was 28 °C / 82.4 F (-3.9 °C / -7 F).
演讲者
HP ProBook x360 435 G8 R7-5800U audio analysis
(±) | speaker loudness is average but good (76.5 dB)
Bass 100 - 315 Hz
(-) | nearly no bass - on average 25.4% lower than median
(-) | bass is not linear (15.6% delta to prev. frequency)
Mids 400 - 2000 Hz
(+) | balanced mids - only 1.1% away from median
(+) | mids are linear (3% delta to prev. frequency)
Highs 2 - 16 kHz
(+) | balanced highs - only 2.9% away from median
(+) | highs are linear (3.8% delta to prev. frequency)
Overall 100 - 16.000 Hz
(±) | linearity of overall sound is average (18% difference to median)
Compared to same class
» 39% of all tested devices in this class were better, 7% similar, 54% worse
» The best had a delta of 6%, average was 20%, worst was 57%
Compared to all devices tested
» 38% of all tested devices were better, 8% similar, 54% worse
» The best had a delta of 4%, average was 23%, worst was 134%
Lenovo ThinkPad L13 Yoga Gen2-20VK000VGE audio analysis
(±) | speaker loudness is average but good (81.4 dB)
Bass 100 - 315 Hz
(-) | nearly no bass - on average 19.4% lower than median
(±) | linearity of bass is average (10.4% delta to prev. frequency)
Mids 400 - 2000 Hz
(+) | balanced mids - only 3.9% away from median
(+) | mids are linear (3.7% delta to prev. frequency)
Highs 2 - 16 kHz
(±) | reduced highs - on average 6.9% lower than median
(+) | highs are linear (6.2% delta to prev. frequency)
Overall 100 - 16.000 Hz
(±) | linearity of overall sound is average (19.5% difference to median)
Compared to same class
» 48% of all tested devices in this class were better, 6% similar, 46% worse
» The best had a delta of 6%, average was 20%, worst was 57%
Compared to all devices tested
» 49% of all tested devices were better, 7% similar, 44% worse
» The best had a delta of 4%, average was 23%, worst was 134%
Fujitsu LifeBook U9310X audio analysis
(±) | speaker loudness is average but good (74.6 dB)
Bass 100 - 315 Hz
(-) | nearly no bass - on average 15.4% lower than median
(±) | linearity of bass is average (11.9% delta to prev. frequency)
Mids 400 - 2000 Hz
(±) | higher mids - on average 11.1% higher than median
(±) | linearity of mids is average (12.5% delta to prev. frequency)
Highs 2 - 16 kHz
(±) | higher highs - on average 8.7% higher than median
(±) | linearity of highs is average (10.1% delta to prev. frequency)
Overall 100 - 16.000 Hz
(-) | overall sound is not linear (39.7% difference to median)
Compared to same class
» 97% of all tested devices in this class were better, 1% similar, 2% worse
» The best had a delta of 6%, average was 20%, worst was 57%
Compared to all devices tested
» 95% of all tested devices were better, 0% similar, 5% worse
» The best had a delta of 4%, average was 23%, worst was 134%
Acer Spin 3 SP313-51N-56YV audio analysis
(±) | speaker loudness is average but good (76.3 dB)
Bass 100 - 315 Hz
(-) | nearly no bass - on average 30.2% lower than median
(±) | linearity of bass is average (10.3% delta to prev. frequency)
Mids 400 - 2000 Hz
(+) | balanced mids - only 4.1% away from median
(±) | linearity of mids is average (7.8% delta to prev. frequency)
Highs 2 - 16 kHz
(±) | higher highs - on average 7.7% higher than median
(+) | highs are linear (6.9% delta to prev. frequency)
Overall 100 - 16.000 Hz
(-) | overall sound is not linear (31.9% difference to median)
Compared to same class
» 91% of all tested devices in this class were better, 2% similar, 7% worse
» The best had a delta of 6%, average was 20%, worst was 57%
Compared to all devices tested
» 91% of all tested devices were better, 2% similar, 7% worse
» The best had a delta of 4%, average was 23%, worst was 134%
能源消耗
在轻载情况下,ProBook比它的直接竞争对手略为节俭。 前辈.除了更高效的处理器,更暗的显示屏自然也起到了作用。我们看到负载下的最大功率为47.5瓦,很快就稳定在40瓦左右。因此,附带的65瓦电源是完全足够的。
| HP ProBook x360 435 G8 R7-5800U Vega 8, R7 5800U, Samsung PM991 MZVLQ512HALU | Lenovo ThinkPad L13 Yoga Gen2-20VK000VGE Iris Xe G7 80EUs, i5-1135G7, WDC PC SN730 SDBPNTY-256G | Fujitsu LifeBook U9310X UHD Graphics 620, i5-10210U, Toshiba KBG40ZNS512G NVMe | Acer Spin 3 SP313-51N-56YV Iris Xe G7 80EUs, i5-1135G7, Kingston OM8PCP3512F-AB | HP ProBook x360 435 G7, Ryzen 5 4500U Vega 6, R5 4500U, WDC PC SN520 SDAPNUW-512G | |
|---|---|---|---|---|---|
| Power Consumption | -27% | -10% | -3% | -6% | |
| Idle Minimum * (Watt) | 3.2 | 4.6 -44% | 2.9 9% | 3.5 -9% | 3.8 -19% |
| Idle Average * (Watt) | 5.5 | 7.3 -33% | 5.8 -5% | 6.6 -20% | 5.7 -4% |
| Idle Maximum * (Watt) | 6.4 | 10.2 -59% | 9.6 -50% | 8.5 -33% | 7.9 -23% |
| Load Average * (Watt) | 35.5 | 32.3 9% | 34.6 3% | 32.2 9% | 29.3 17% |
| Witcher 3 ultra * (Watt) | 36.4 | 35 4% | 32.5 11% | ||
| Load Maximum * (Watt) | 47.5 | 65.3 -37% | 50.7 -7% | 34.5 27% | 48.6 -2% |
* ... smaller is better
| Off / Standby | |
| Idle | |
| Load |
|
Key:
min: | |
Power consumption Witcher 3 / Stress test
电池寿命
使用45Wh电池的电池运行时间非常好,因为我们的WLAN测试运行了约9.5小时(在全亮度下约8小时),视频测试甚至超过了10小时。
| Battery Runtime | |
| WiFi Websurfing | |
| Average of class Convertible (5.08 - 22, n=50, last 2 years) | |
| Fujitsu LifeBook U9310X | |
| HP ProBook x360 435 G7, Ryzen 5 4500U | |
| HP ProBook x360 435 G8 R7-5800U | |
| Acer Spin 3 SP313-51N-56YV | |
| Lenovo ThinkPad L13 Yoga Gen2-20VK000VGE | |
| WiFi Websurfing max. Brightness | |
| Average of class Convertible (4.07 - 14.6, n=18, last 2 years) | |
| Fujitsu LifeBook U9310X | |
| HP ProBook x360 435 G7, Ryzen 5 4500U | |
| HP ProBook x360 435 G8 R7-5800U | |
| Acer Spin 3 SP313-51N-56YV | |
| Lenovo ThinkPad L13 Yoga Gen2-20VK000VGE | |
Pros
Cons
评语--有很多表现,但展示不力
有了新的Ryzen 5000处理器,第八代ProBook x360 435得到了大规模的性能更新,在多核性能方面,这款紧凑的可折叠电脑可以轻松跟上许多正式的工作站。然而,它是否真的需要顶级型号,即 Ryzen 7 5800U,我们敢于怀疑。考虑到作为入门级机型的分类,Ryzen 5或最多Ryzen 7 5700U就完全足够了。
在日常使用中,ProBook做了很多正确的事情,因为有良好的输入设备,所有重要的端口,电池运行时间也很好。此外,外壳的质量非常高,与更昂贵的EliteBooks几乎没有区别。在这方面,ProBook也比它的竞争对手有优势,如 联想ThinkPad L13 Yoga G2.
性能、外壳和输入设备都是顶级的,但标准显示屏的反射率太高,风扇控制也很烦人。对ProBook x360 435 G8感兴趣的人应该省去购买高端处理器的额外价格,而是把钱投入到可选的(更亮的)显示屏之一。
最大的两个问题是屏幕和风扇的行为。标准屏幕基本上为办公室使用提供了良好的画质,但亮度根本不足以补偿非常反光的面板的反射。此外,即使在空转时,风扇也经常启动,这很快就会变得很烦人。你肯定会选择不同的配置(Ryzen 5000和一个更明亮的显示屏)。
价格和可用性
我们的测试设备,ProBook x360 435 G8,目前在数码港有售,价格略低于1,100欧元(约1305美元)可用。在Notebooksbilliger有一个更便宜的配置,配备Ryzen 5 600U和更少的内存,价格为880欧元(约1044美元)。
HP ProBook x360 435 G8 R7-5800U
- 07/28/2021 v7 (old)
Andreas Osthoff
Price comparison

