结论 - 大部分为小规模升级
戴尔 16 Premium 本质上是一款性能增强型 XPS 16 9640.它配备了更新、更快、更高效的英特尔和 Nvidia 处理器,强大的用户可能会喜欢。不过,如果您的日常工作负载不需要强大的处理能力,那么价格较低的 XPS 16 9640 也能为您带来相同的用户体验。
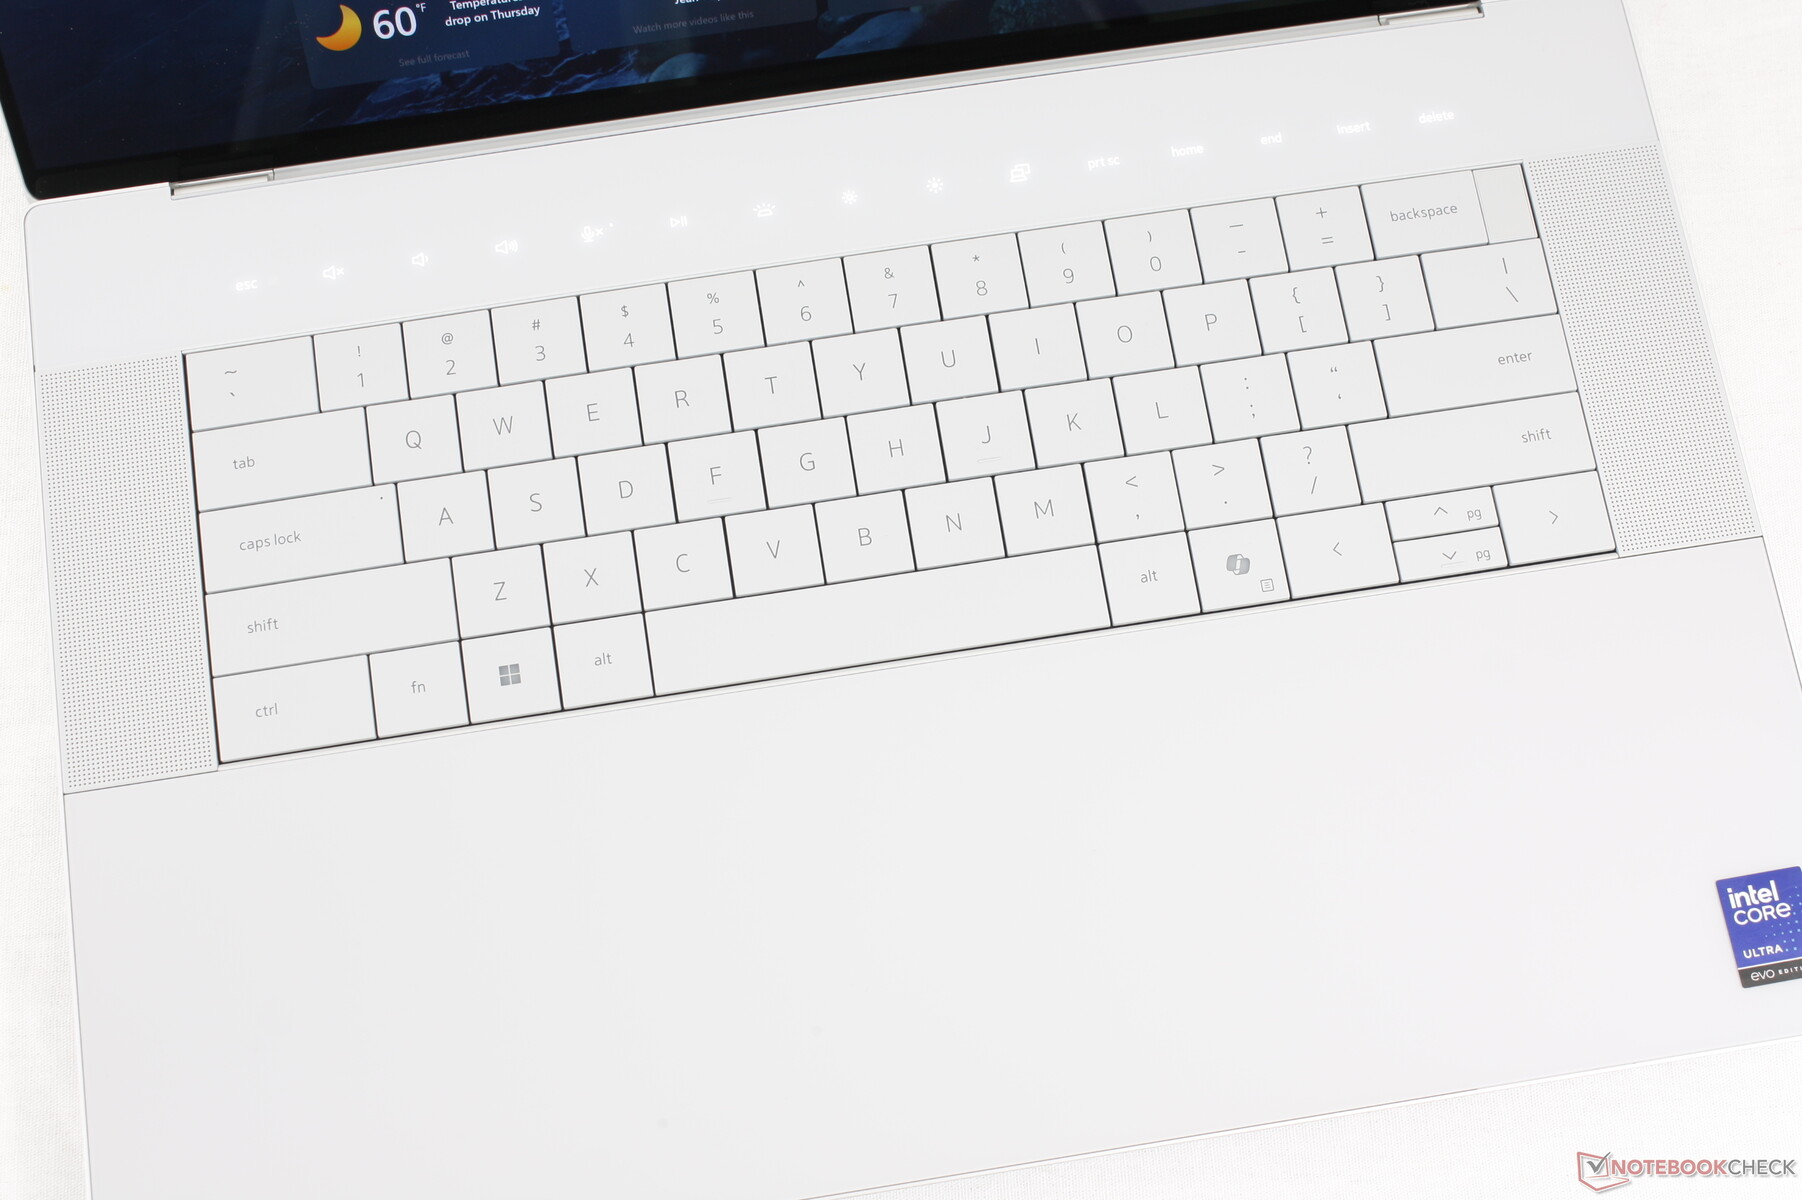
该系统保留了与 XPS 16 9640 重新设计相关的大部分(如果不是全部)缺点,包括备受争议的键盘和点击板变化。戴尔 16 Premium 还表现出比以前更严重的 CPU 性能节流现象。潜在买家需要注意的是,为了获得更小的尺寸和更紧凑的交流适配器,该系统需要牺牲一些图形处理性能。不介意系统稍大的用户可能会发现竞争产品 联想 Yoga Pro 9i 16是更快的选择,即使配置了类似的 CPU 和 GPU 规格。
Pros
Cons
价格和供应情况
戴尔现在出货的戴尔 16 Premium 基础 Core Ultra 7 RTX 5050 配置的起价为 2200 美元,Core Ultra 9 RTX 5070 配置的起价为 3400 美元。
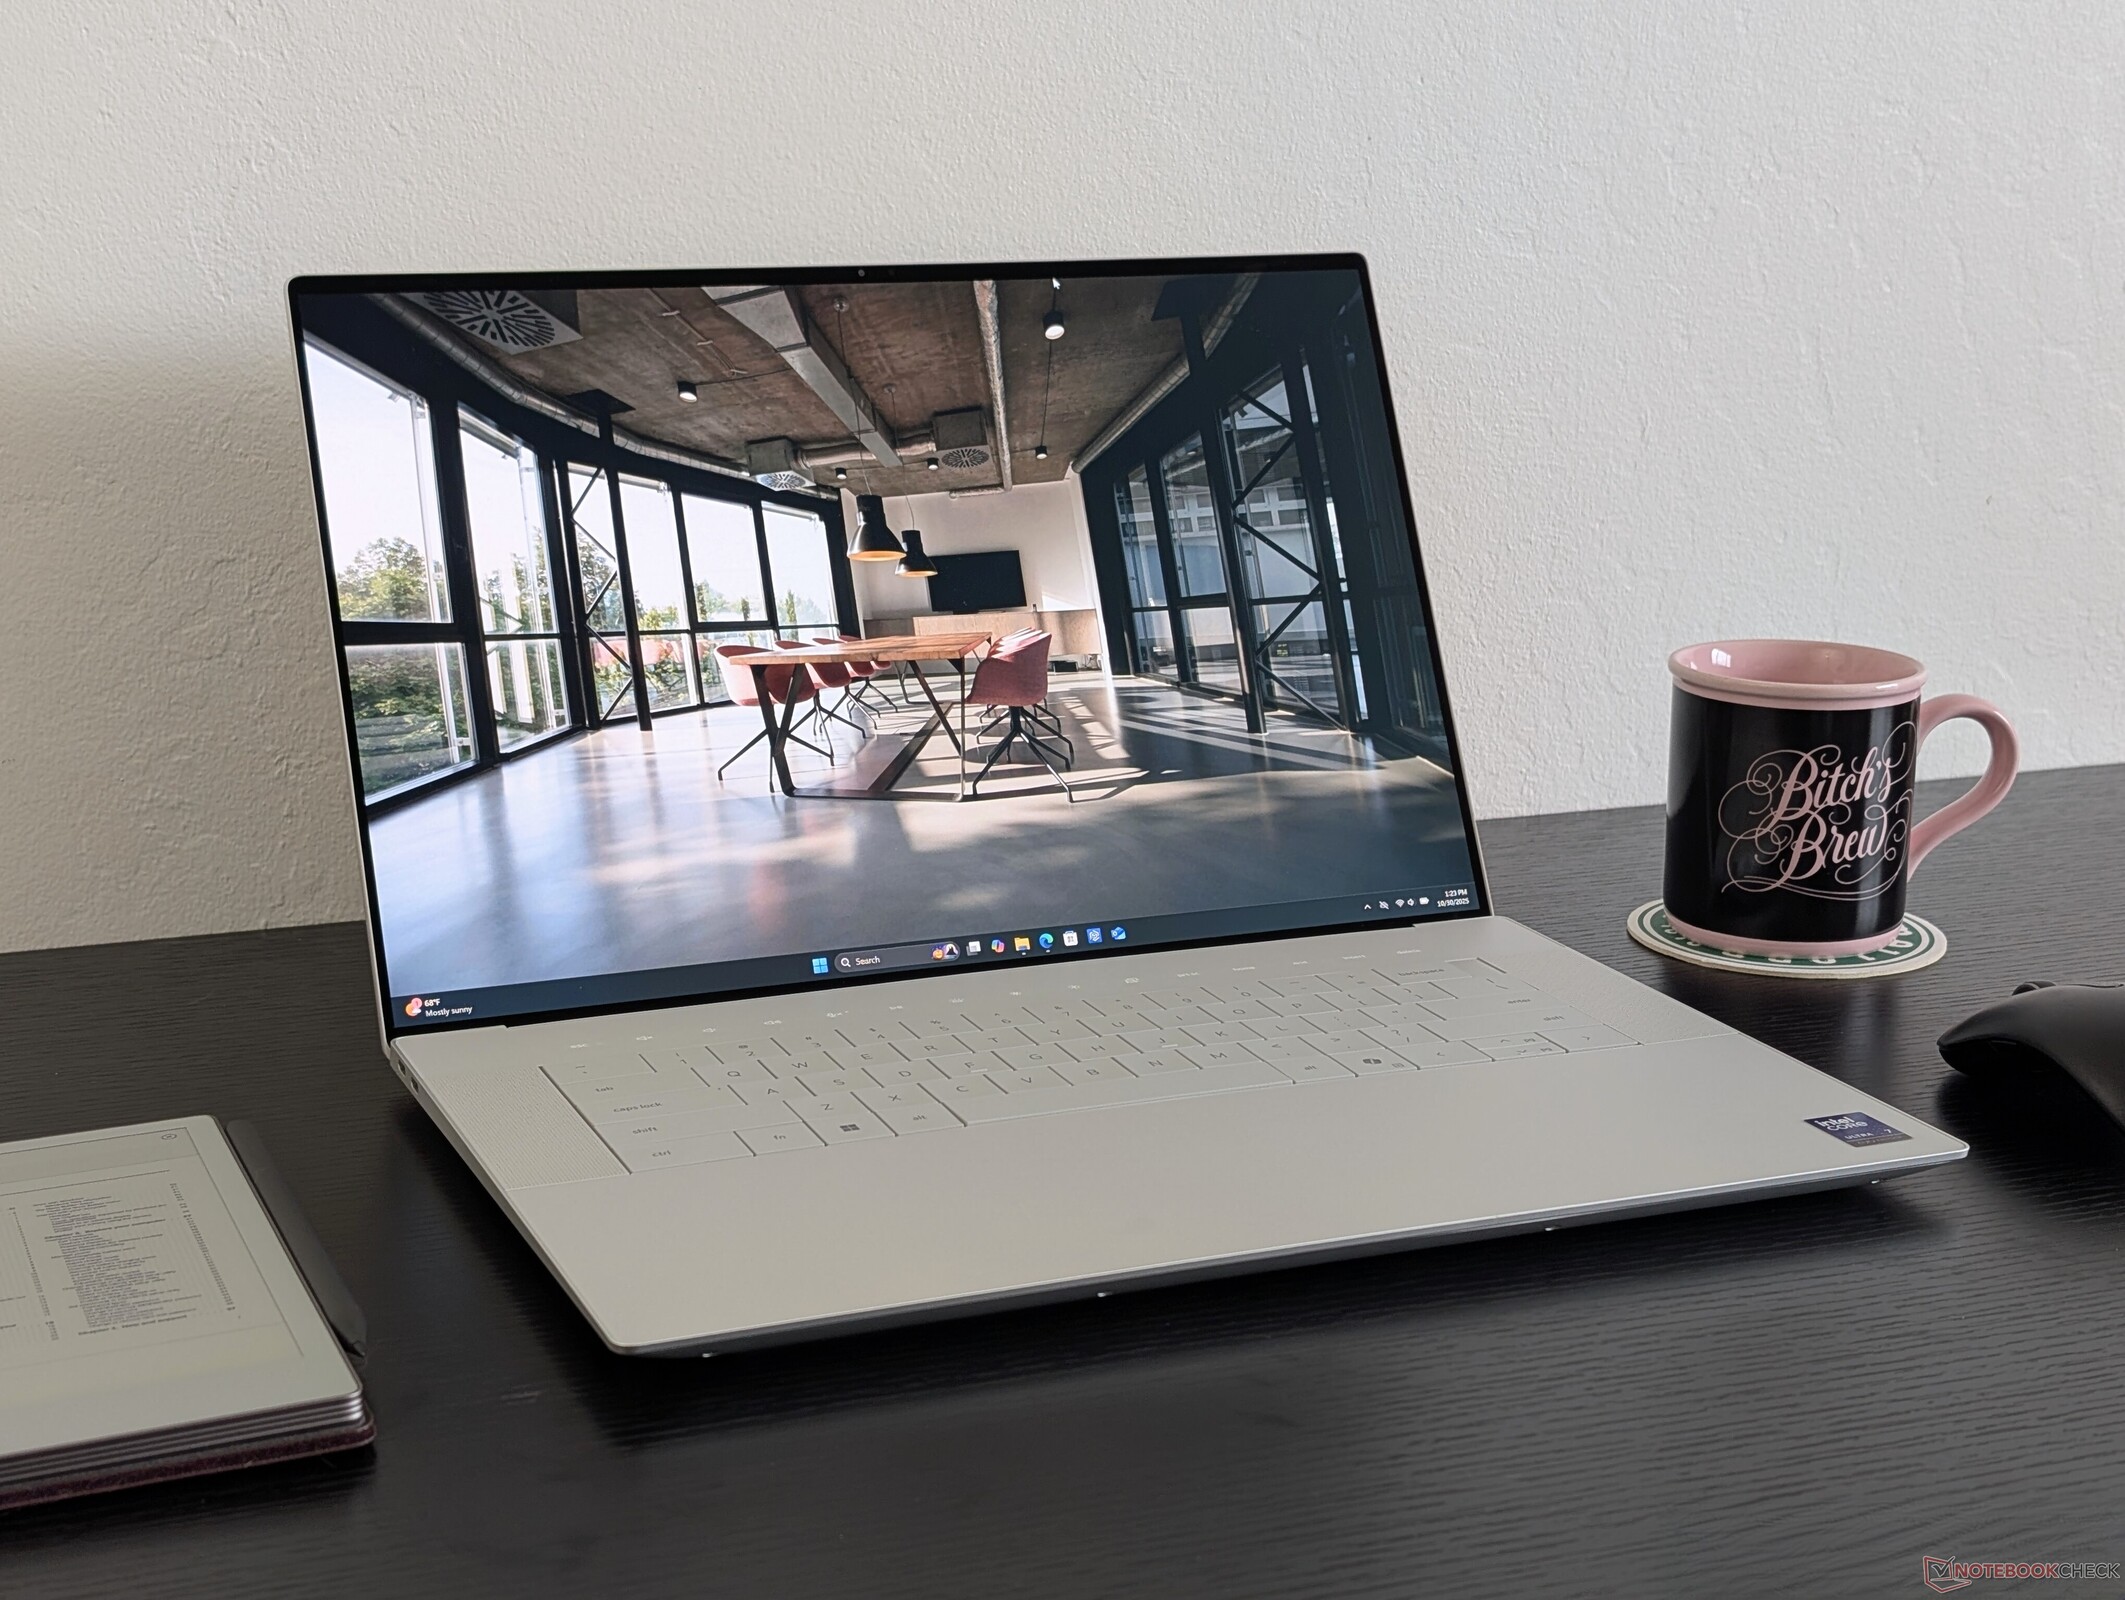
戴尔 16 Premium 是 XPS 16 系列的后续产品。虽然名称有所改变,但熟悉的设计依然存在,用户体验与 2024 版基本相同。我们对 XPS 16 9640的许多评论也适用于戴尔 16 Premium,因为更新的机型只引入了内部变化,而没有重大的外部更新。
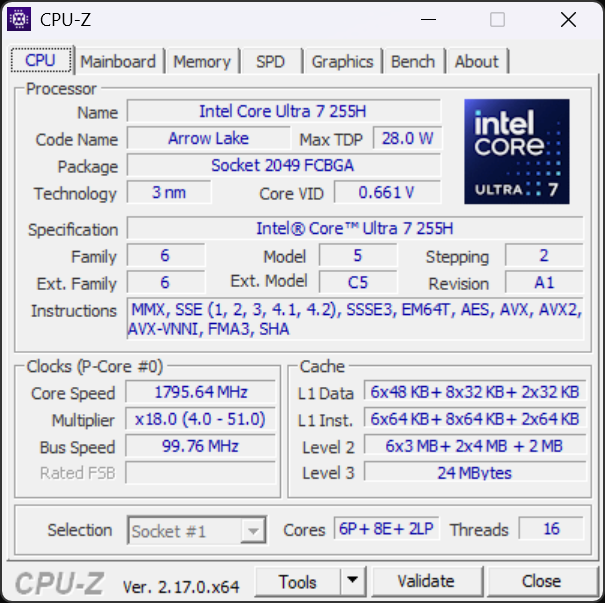
我们的测试机是更高端的配置,配备 Arrow Lake-H Core Ultra 7 255H CPU、60 W Nvidia BlackwellGeForce RTX 5070 GPU 和 16.3 英寸 4K 2400p 120 Hz OLED 触摸屏,价格约为 3300 美元,取代了去年的 Meteor Lake-H 和 Ada Lovelace 处理器选项。低端 SKU 可能只配备集成显卡、RTX 5050 或 2K 1200p 非触摸显示屏,而最高端配置则配备酷睿 Ultra 9 285H CPU。
戴尔 16 Premium 的替代产品包括其他高端多媒体笔记本电脑,如 联想 Yoga Pro 9i 16, 惠普 Spectre x360 16或 Apple MacBook Pro 16.戴尔 16 Premium 不能与戴尔 Pro 16 Premium 混淆。
更多戴尔评论:
规格
案例
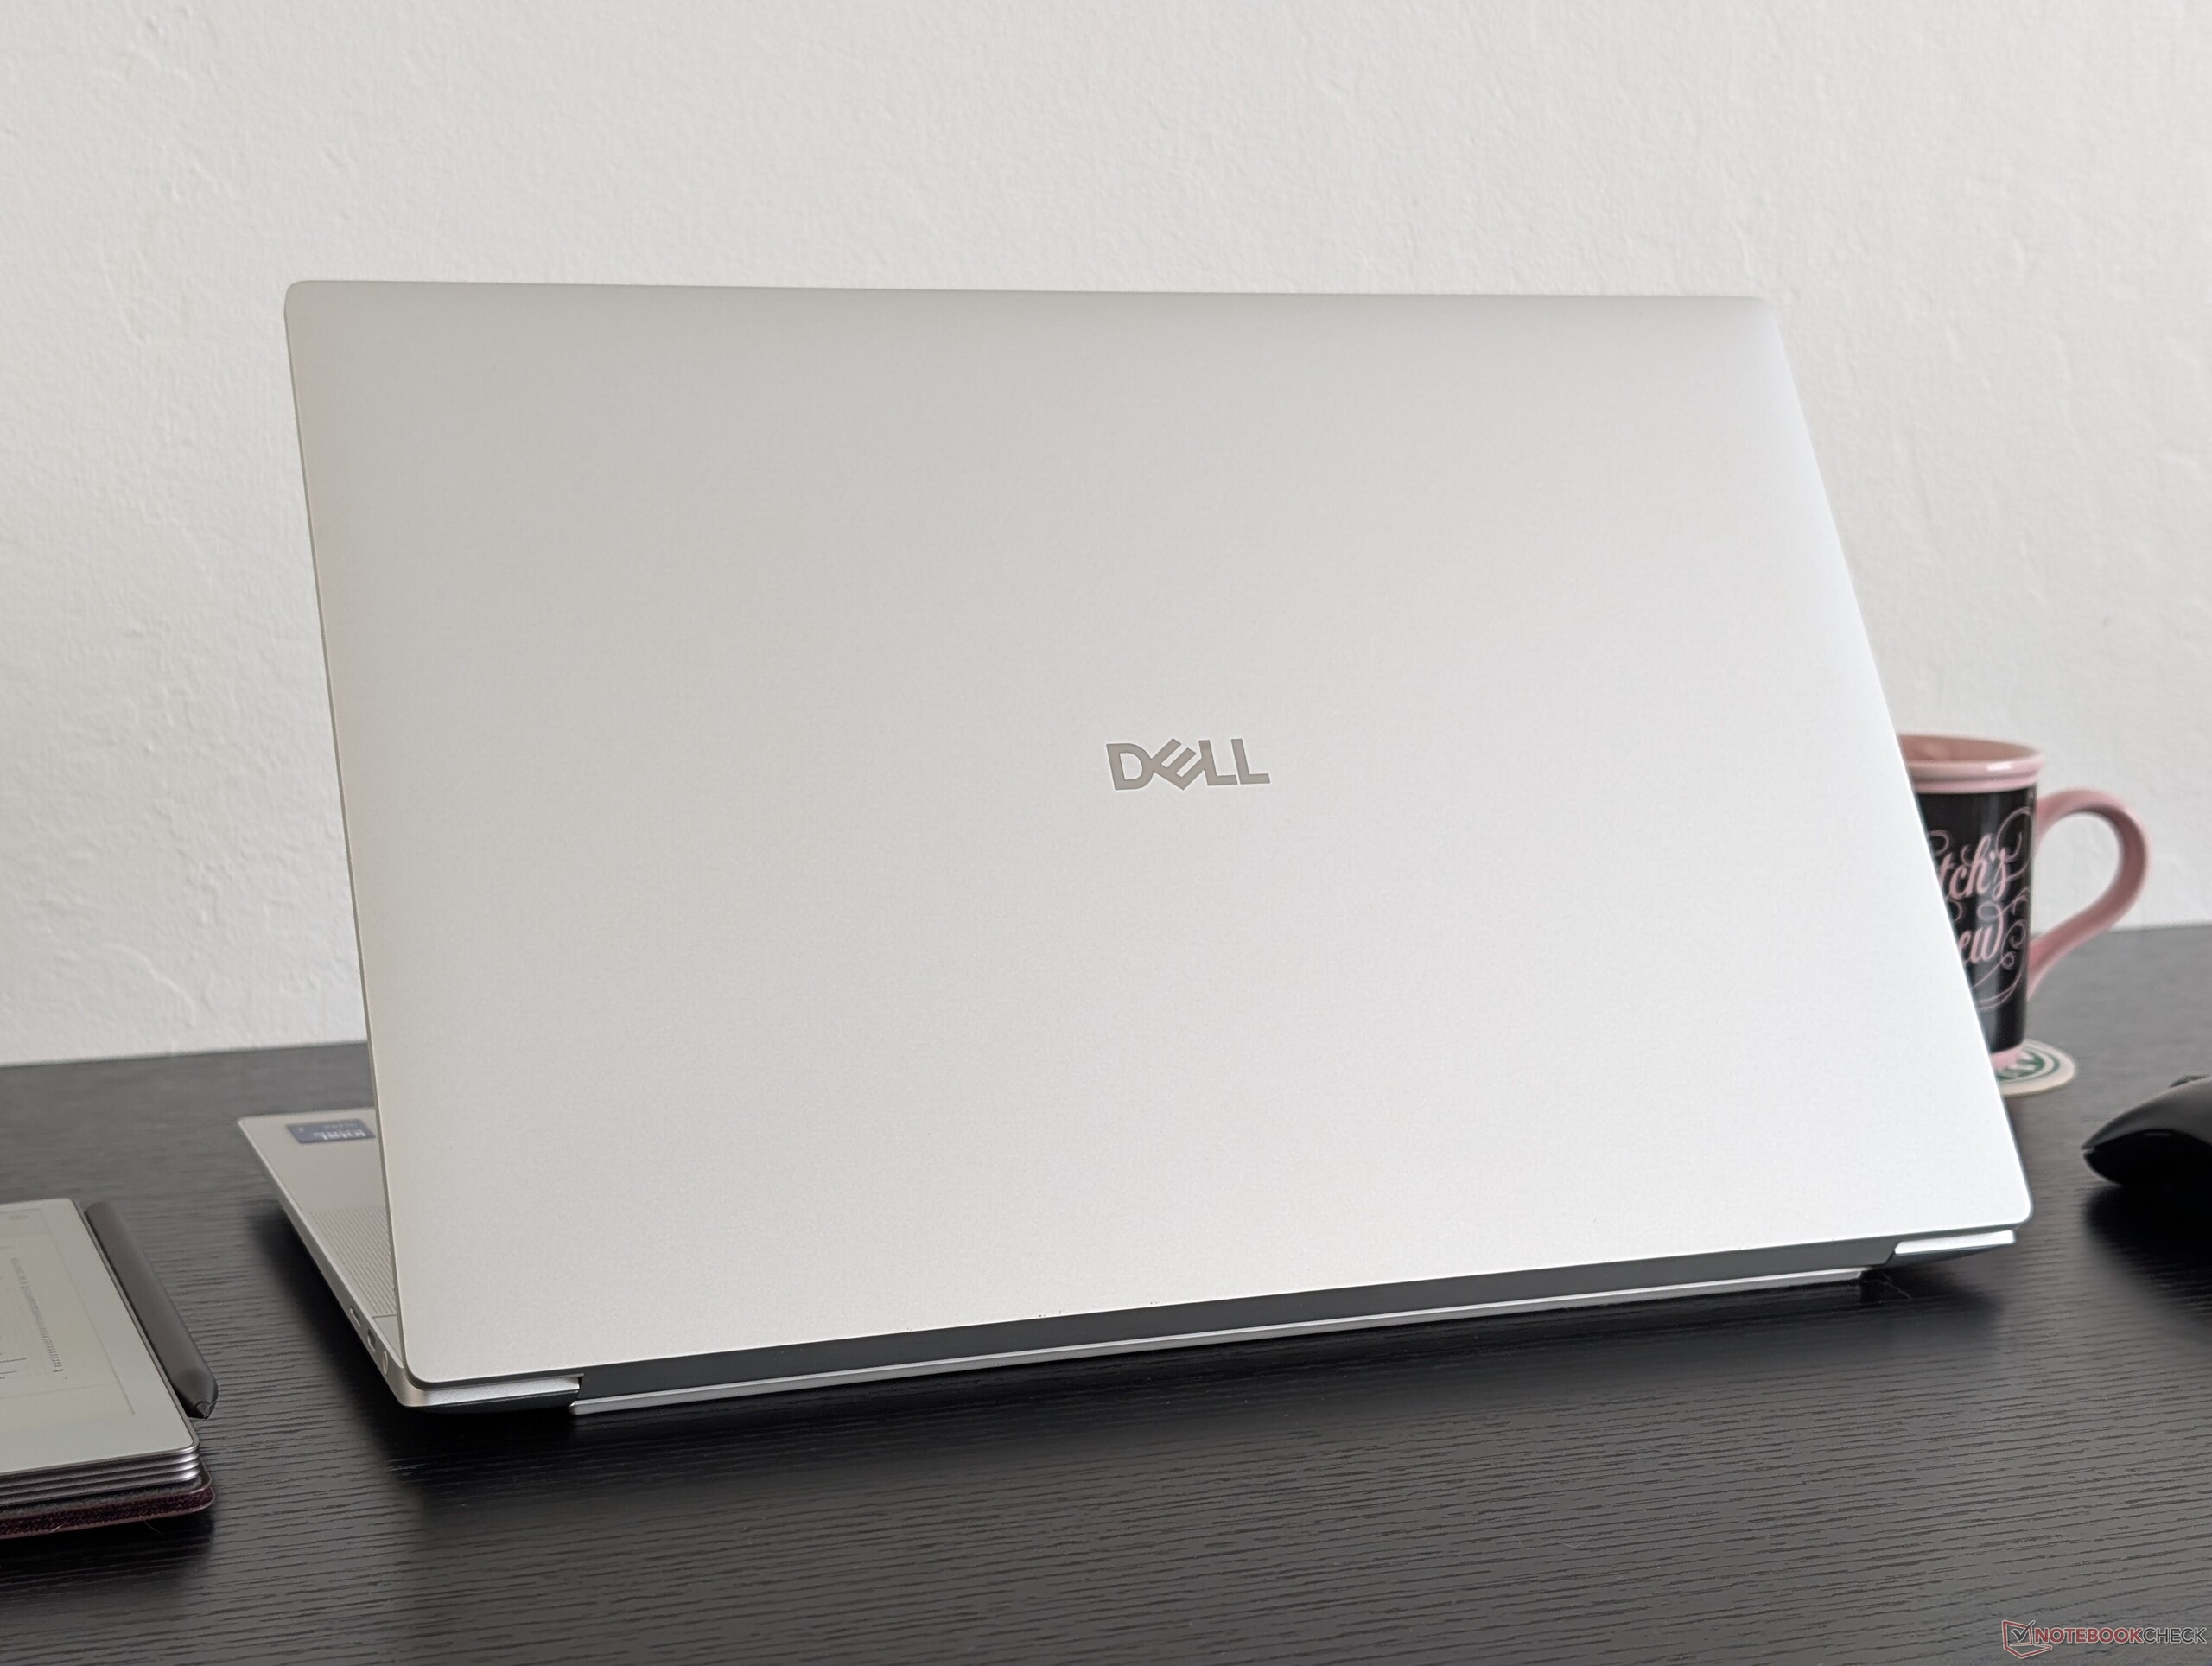
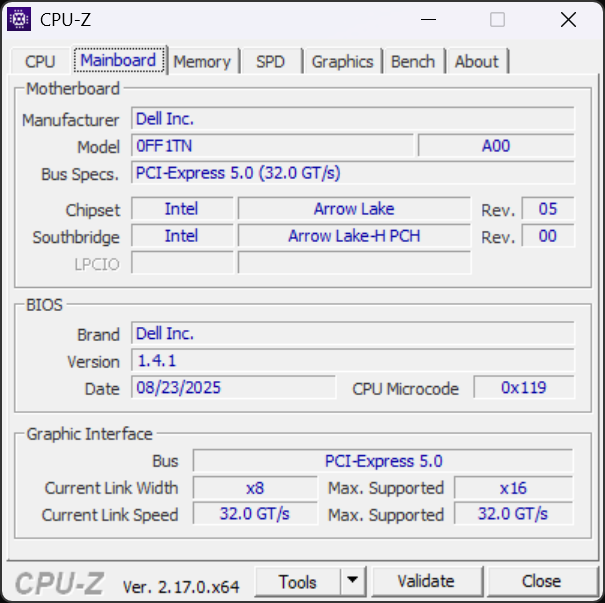
虽然戴尔 16 Premium 采用了与即将上市的 XPS 16 9640 相同的机身设计,但外盖上的徽标却做了改动,去掉了圆圈。这也是在视觉上区分戴尔 16 Premium 与旧款 XPS 机型的最简单方法之一。
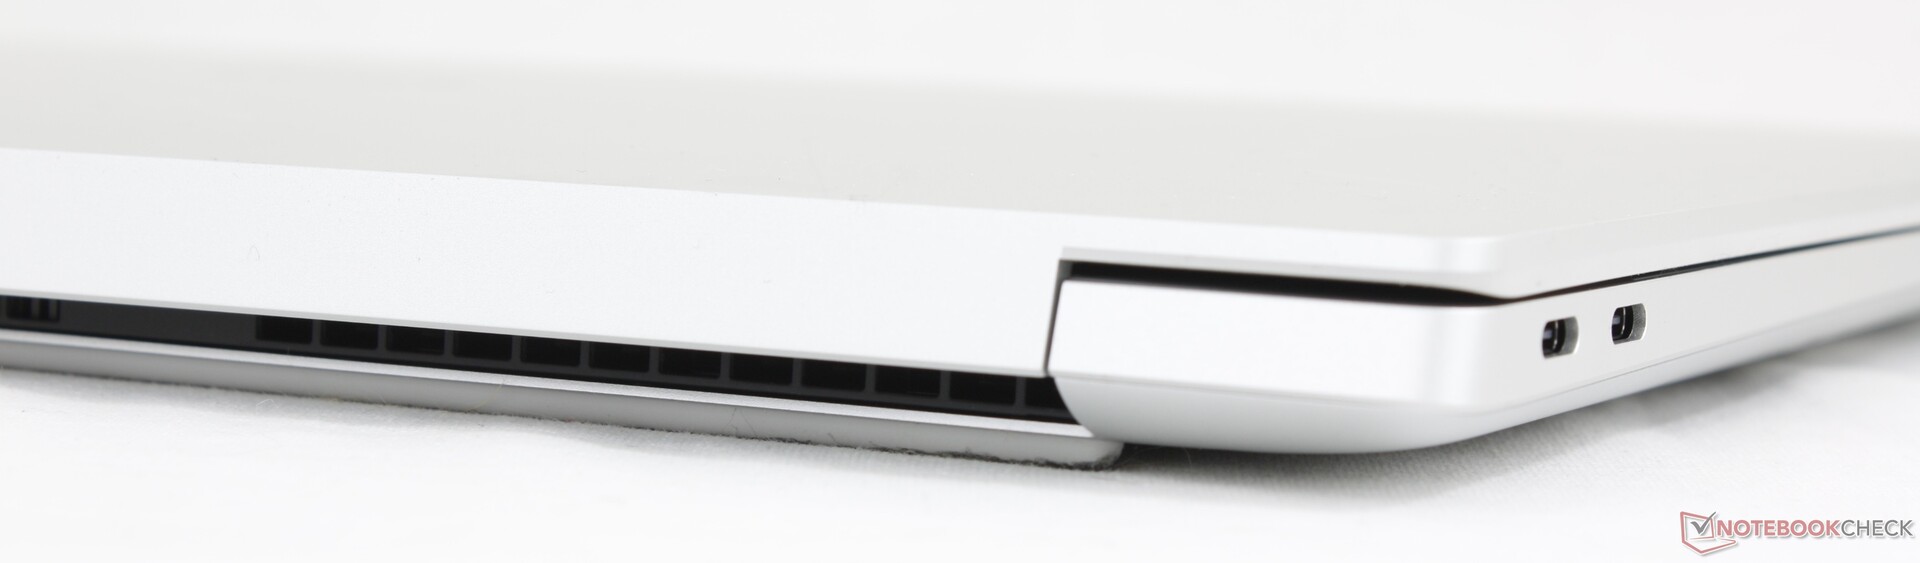
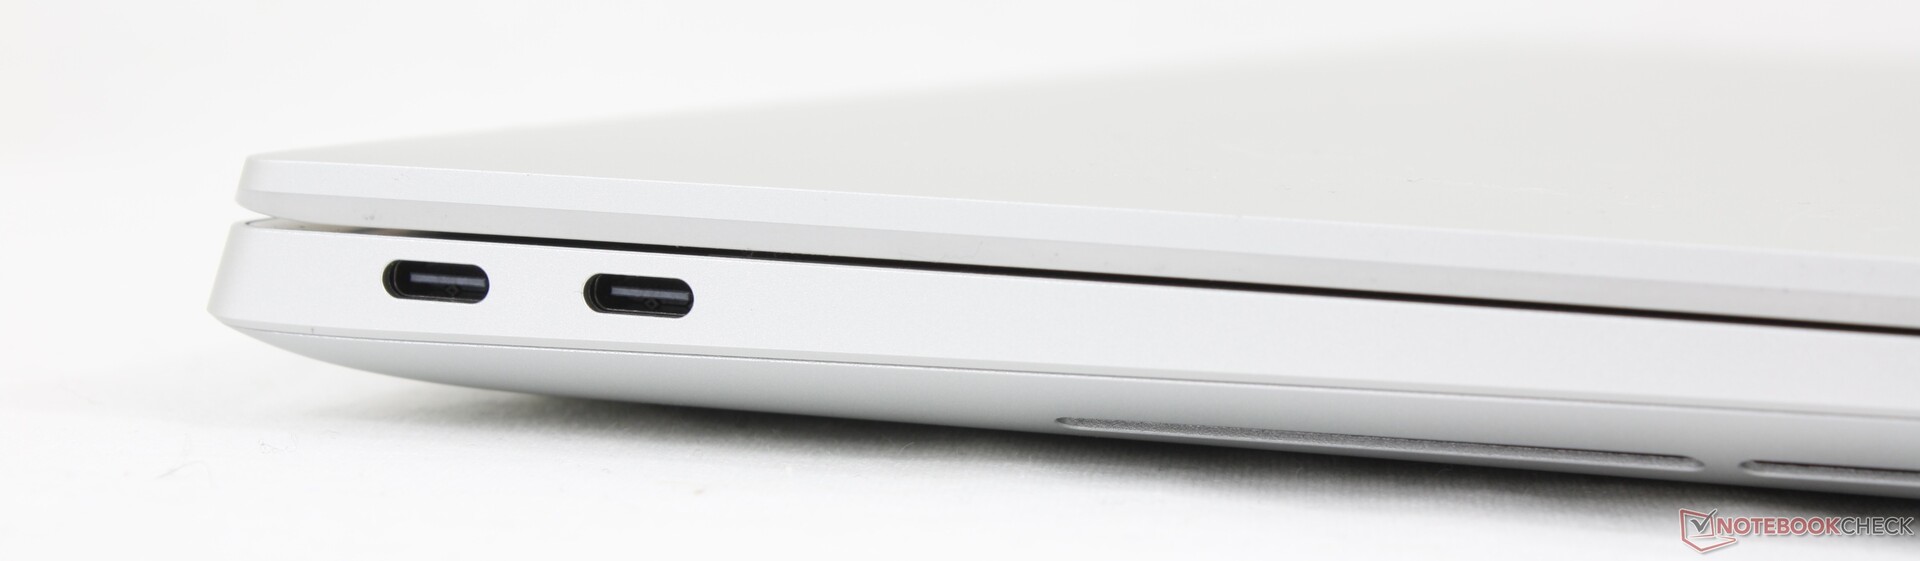
连接性
所有 USB-C 端口现在都是 40 Gbps 的 Thunderbolt 4,而 XPS 16 9640 并非如此。


交流
| Networking | |
| iperf3 transmit AXE11000 | |
| LG Gram Pro 16Z90TS-G.AU89G | |
| Asus Zenbook S 16 UM5606-RK333W | |
| Lenovo Yoga Pro 9i 16 RTX 5070 | |
| Dell XPS 16 9640 | |
| HP Spectre x360 16 RTX 4050 | |
| Dell 16 Premium DA16250 | |
| iperf3 receive AXE11000 | |
| Asus Zenbook S 16 UM5606-RK333W | |
| Lenovo Yoga Pro 9i 16 RTX 5070 | |
| LG Gram Pro 16Z90TS-G.AU89G | |
| Dell XPS 16 9640 | |
| HP Spectre x360 16 RTX 4050 | |
| Dell 16 Premium DA16250 | |
| iperf3 transmit AXE11000 6GHz | |
| LG Gram Pro 16Z90TS-G.AU89G | |
| Dell 16 Premium DA16250 | |
| HP Spectre x360 16 RTX 4050 | |
| iperf3 receive AXE11000 6GHz | |
| LG Gram Pro 16Z90TS-G.AU89G | |
| Dell 16 Premium DA16250 | |
| HP Spectre x360 16 RTX 4050 | |
网络摄像头


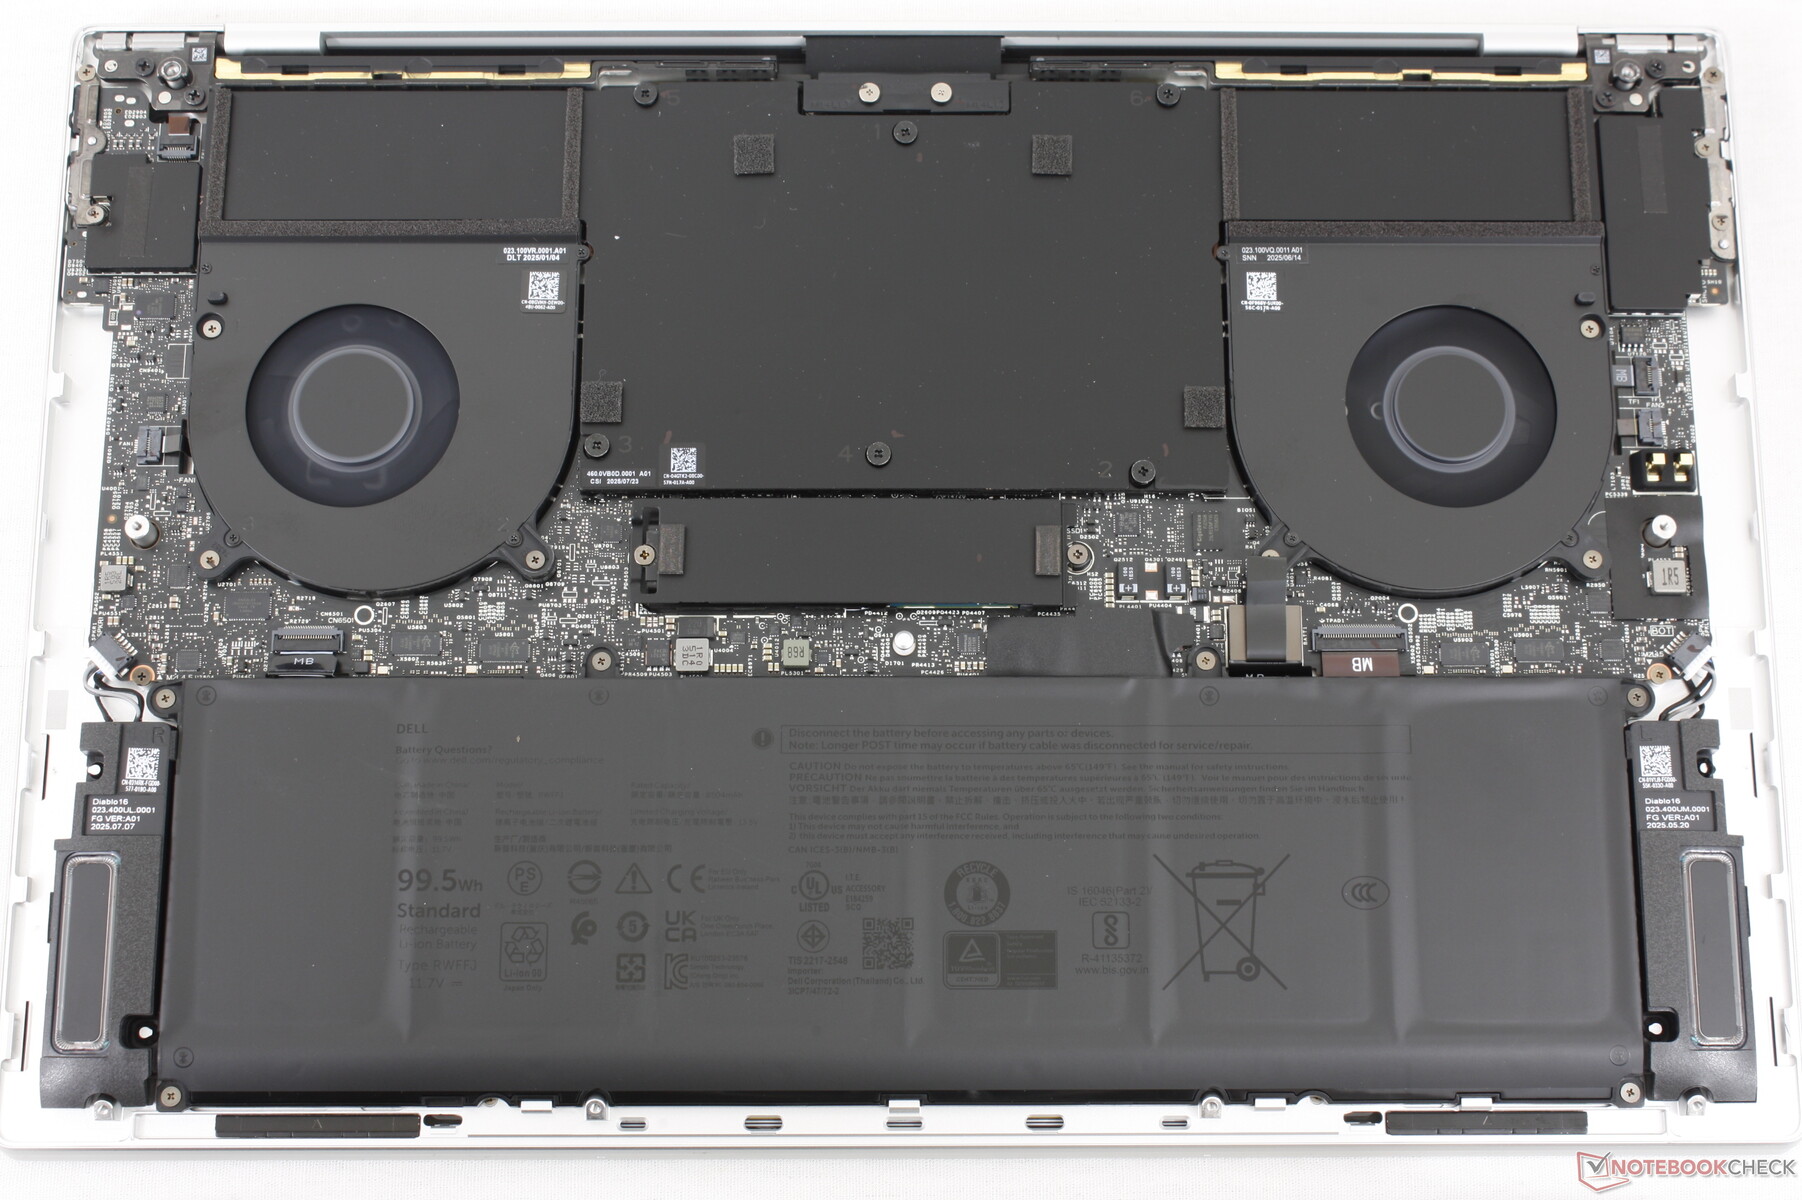
维护
可持续性
底盘或骨架由 75% 的可回收铝(用于顶盖)、22% 的可回收玻璃(用于屏幕)、25% 的低排放铝(用于掌托)、18.5% 的可回收塑料以及 100% 的可回收包装组成。
保修
如果在美国购买,制造商提供为期一年的有限保修。
输入设备
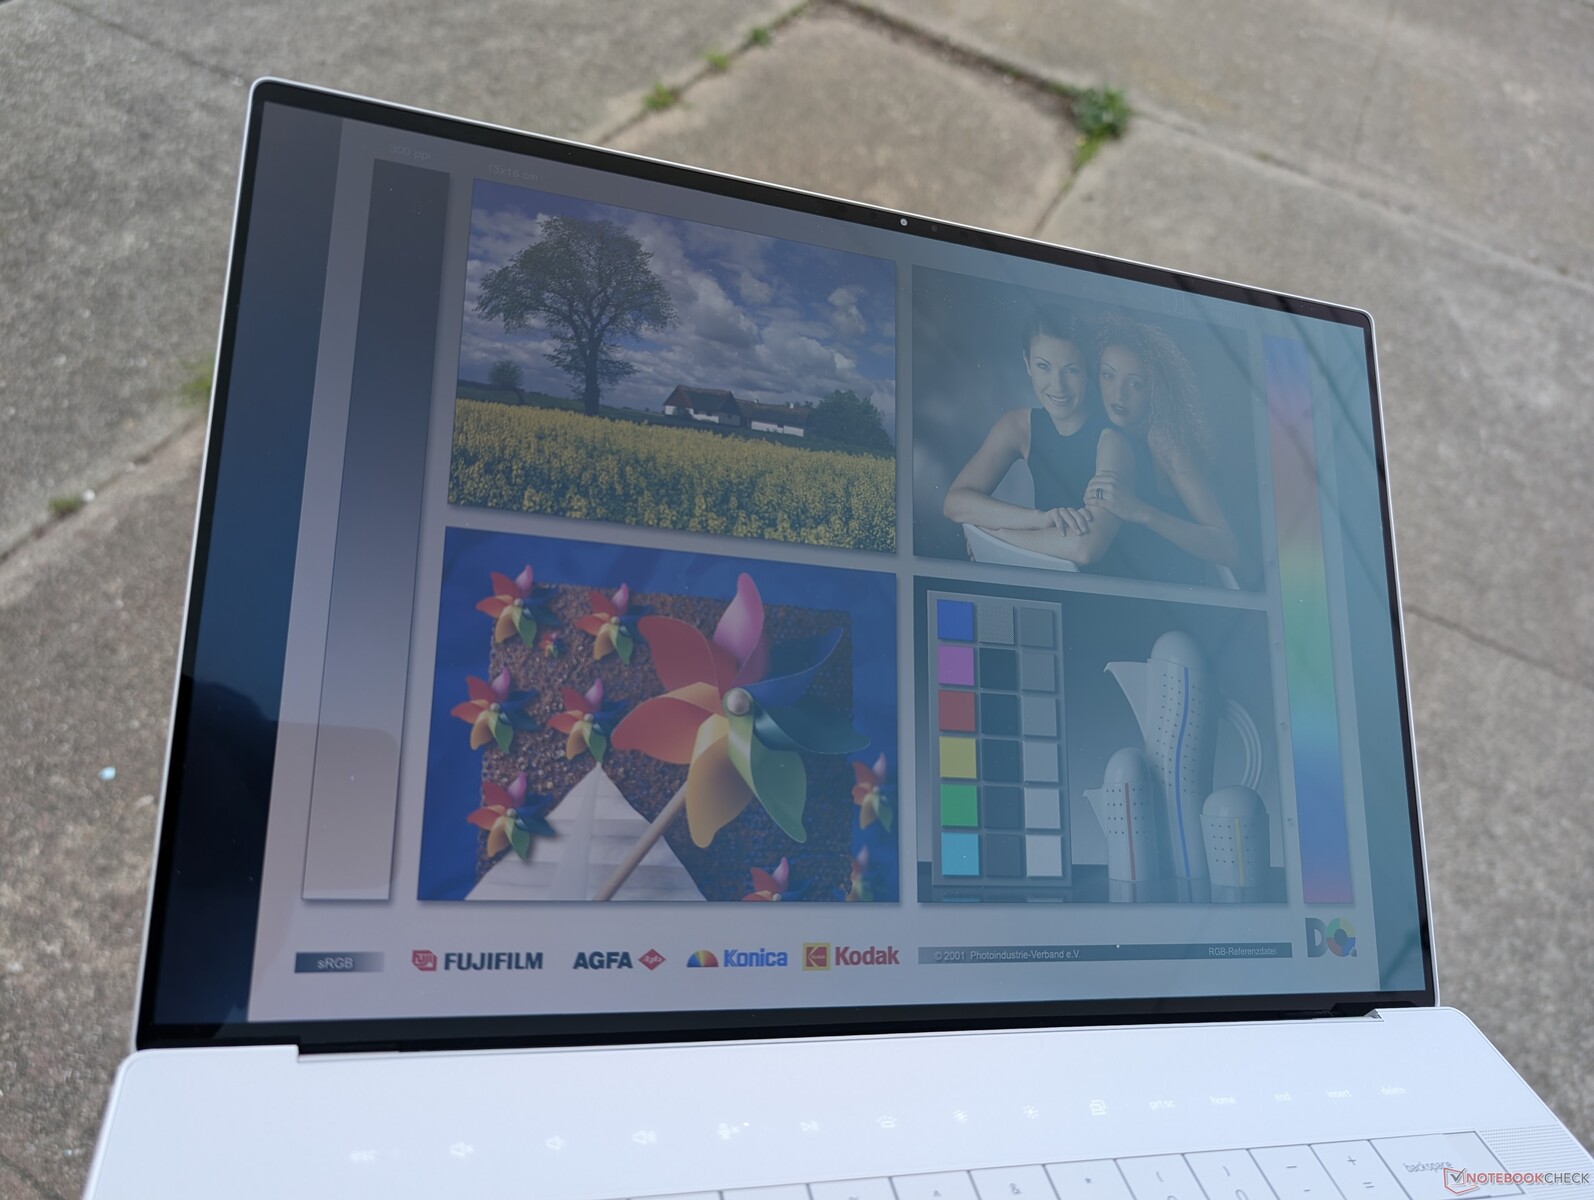
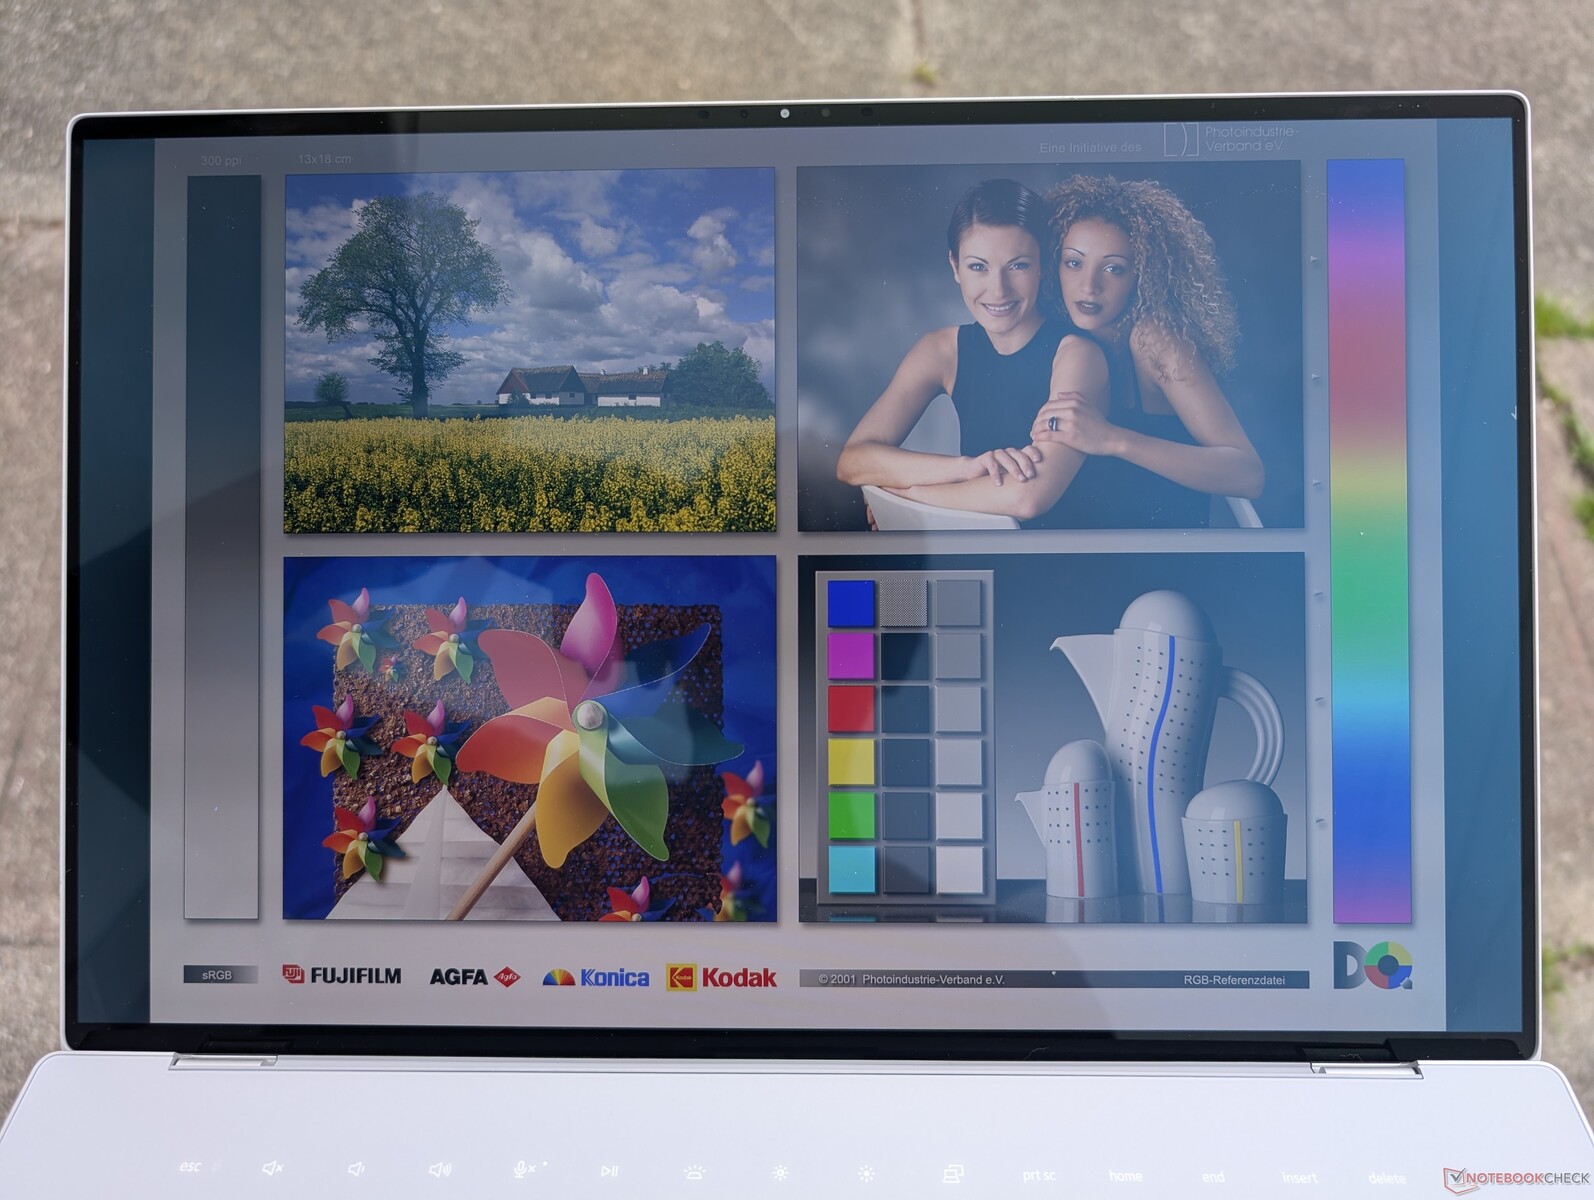
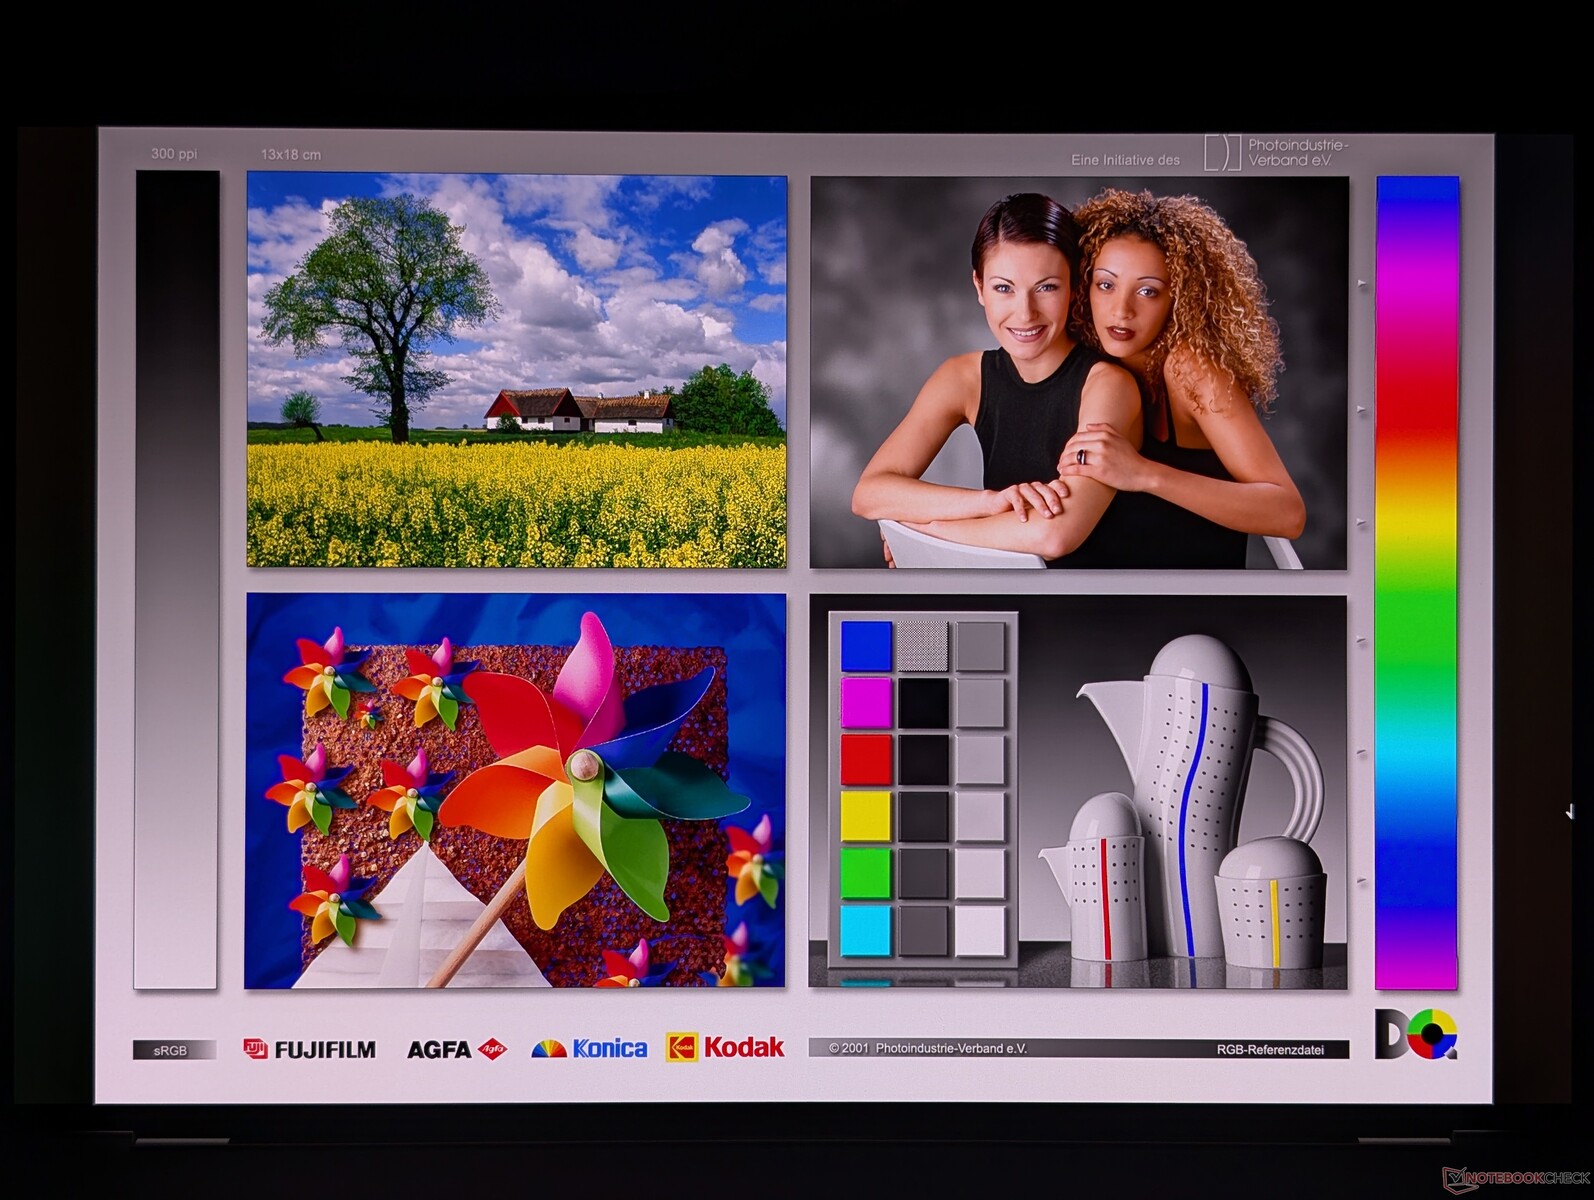
显示屏
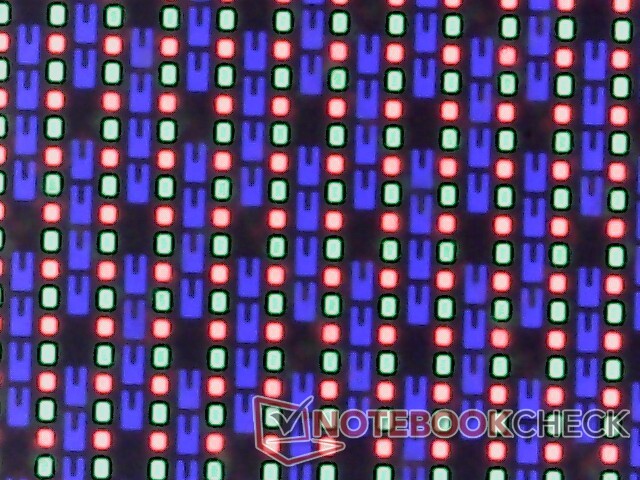
戴尔将去年 XPS 16 9640 上的 OLED 面板从 90 Hz 升级到了 120 Hz,而最大亮度仍保持在约 400 尼特。Windows VRR 支持低至 48 Hz,以节省电池电量。这些变化相对较小,但仍值得注意,因为 4K 2400p 120 Hz 显示屏在 16 英寸笔记本电脑上并不多见。
| |||||||||||||||||||||||||
Brightness Distribution: 98 %
Center on Battery: 385.7 cd/m²
Contrast: ∞:1 (Black: 0 cd/m²)
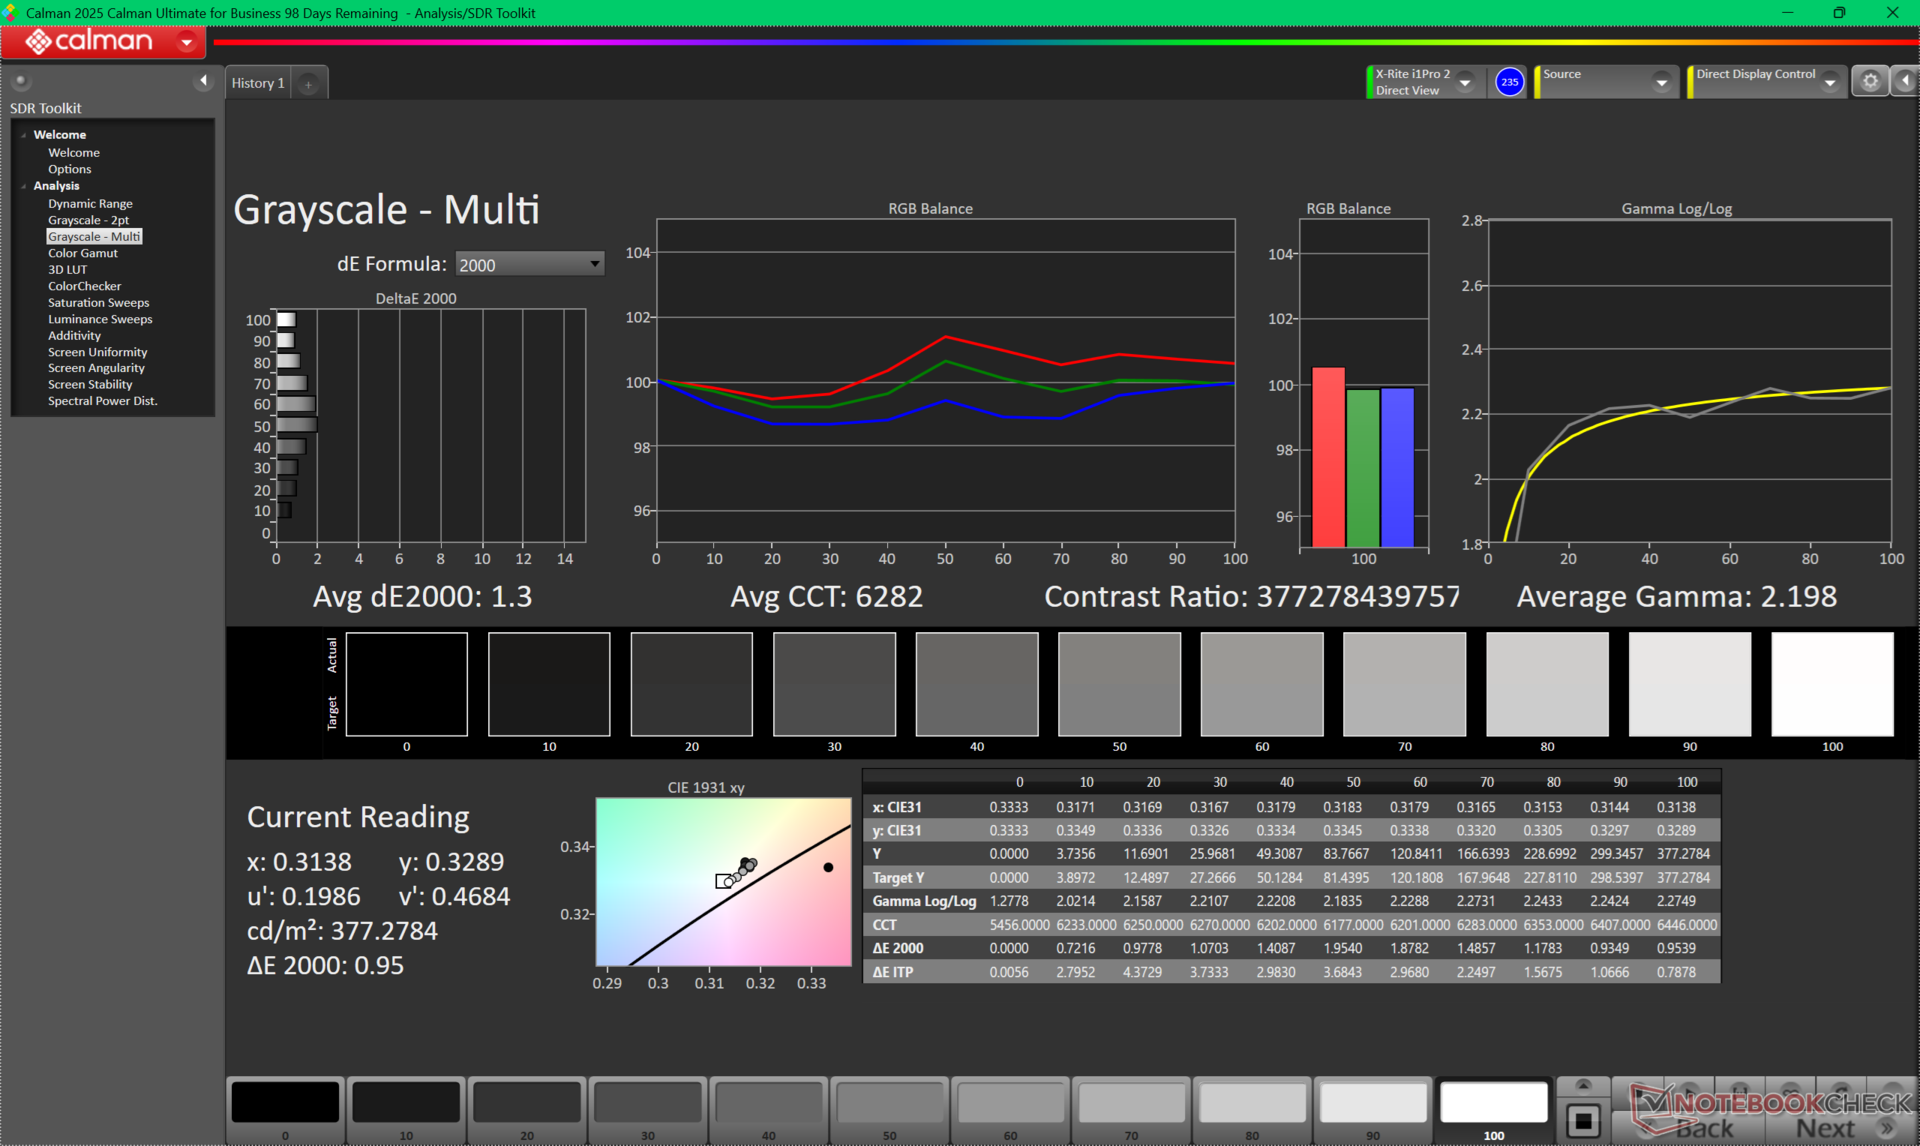
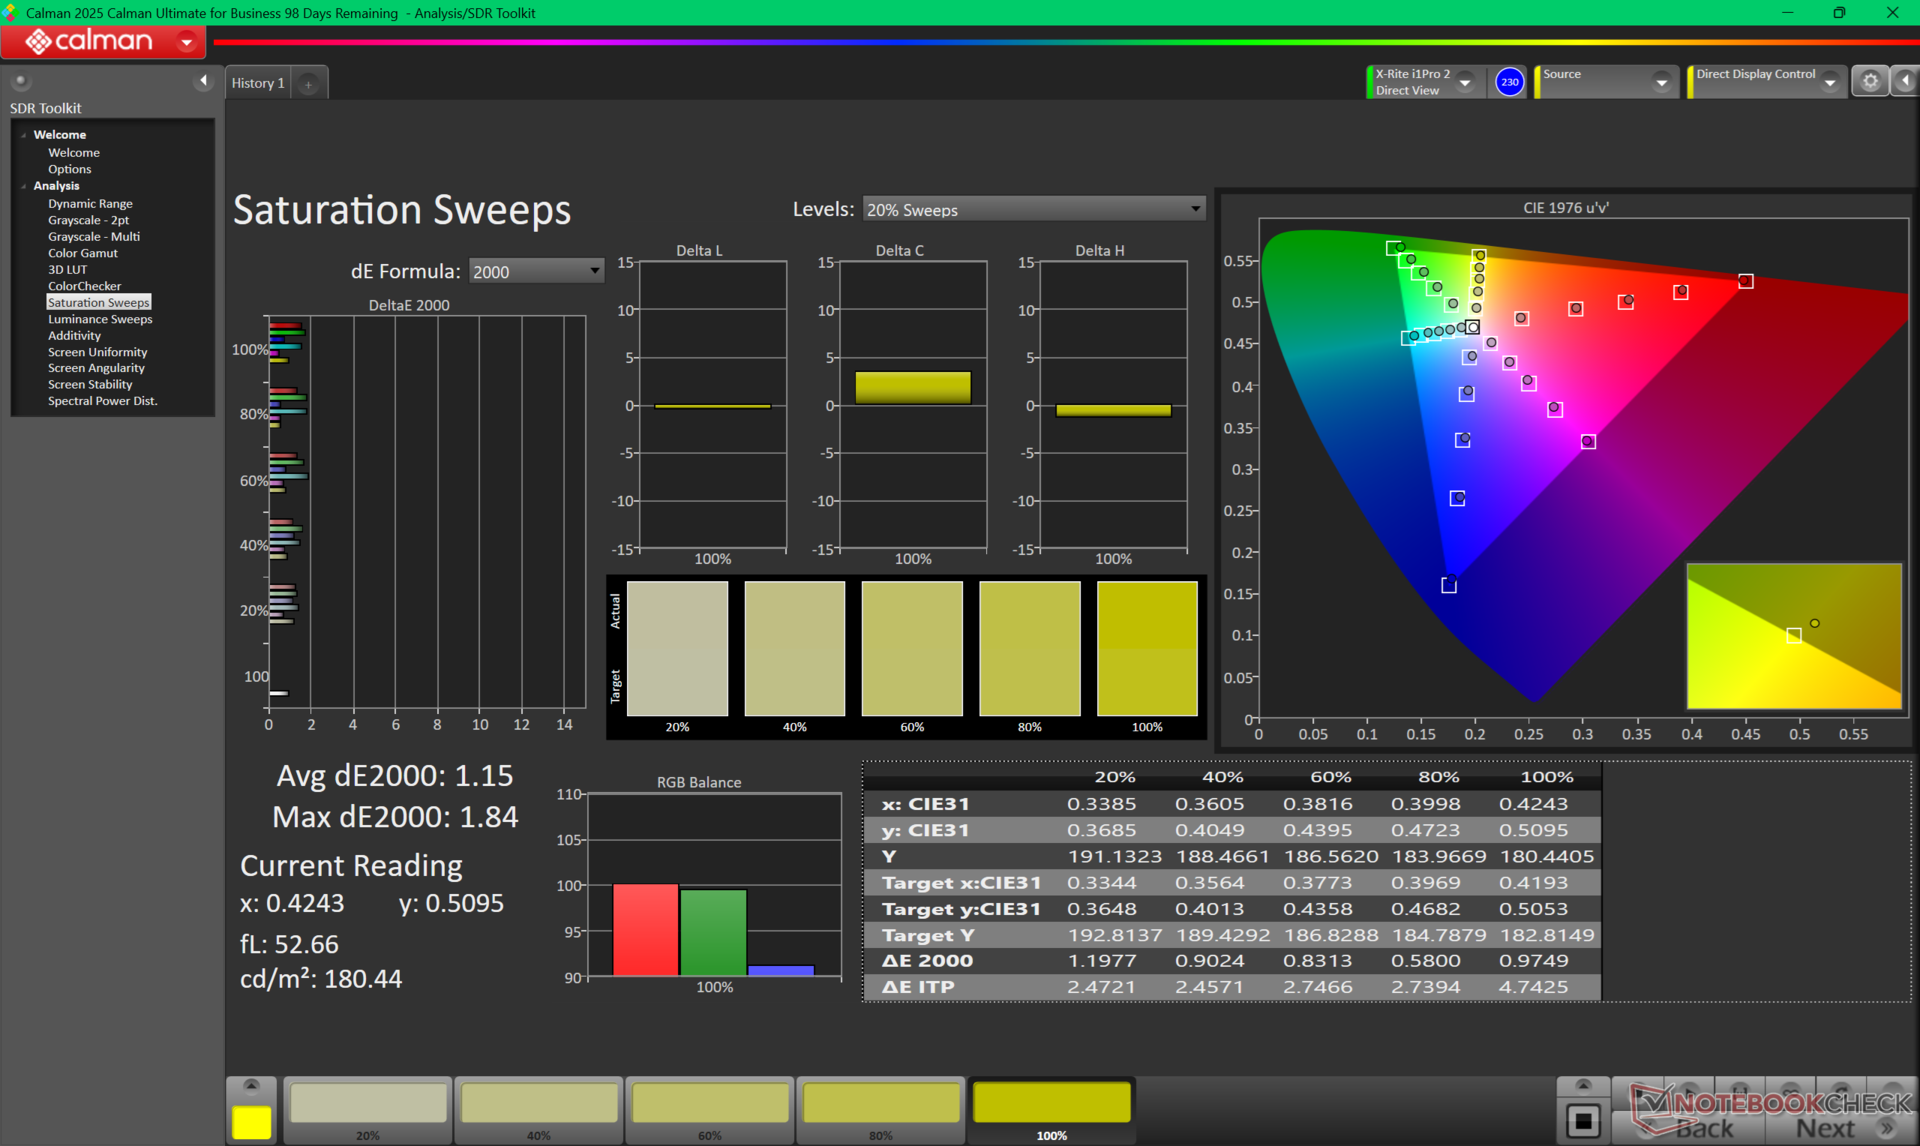
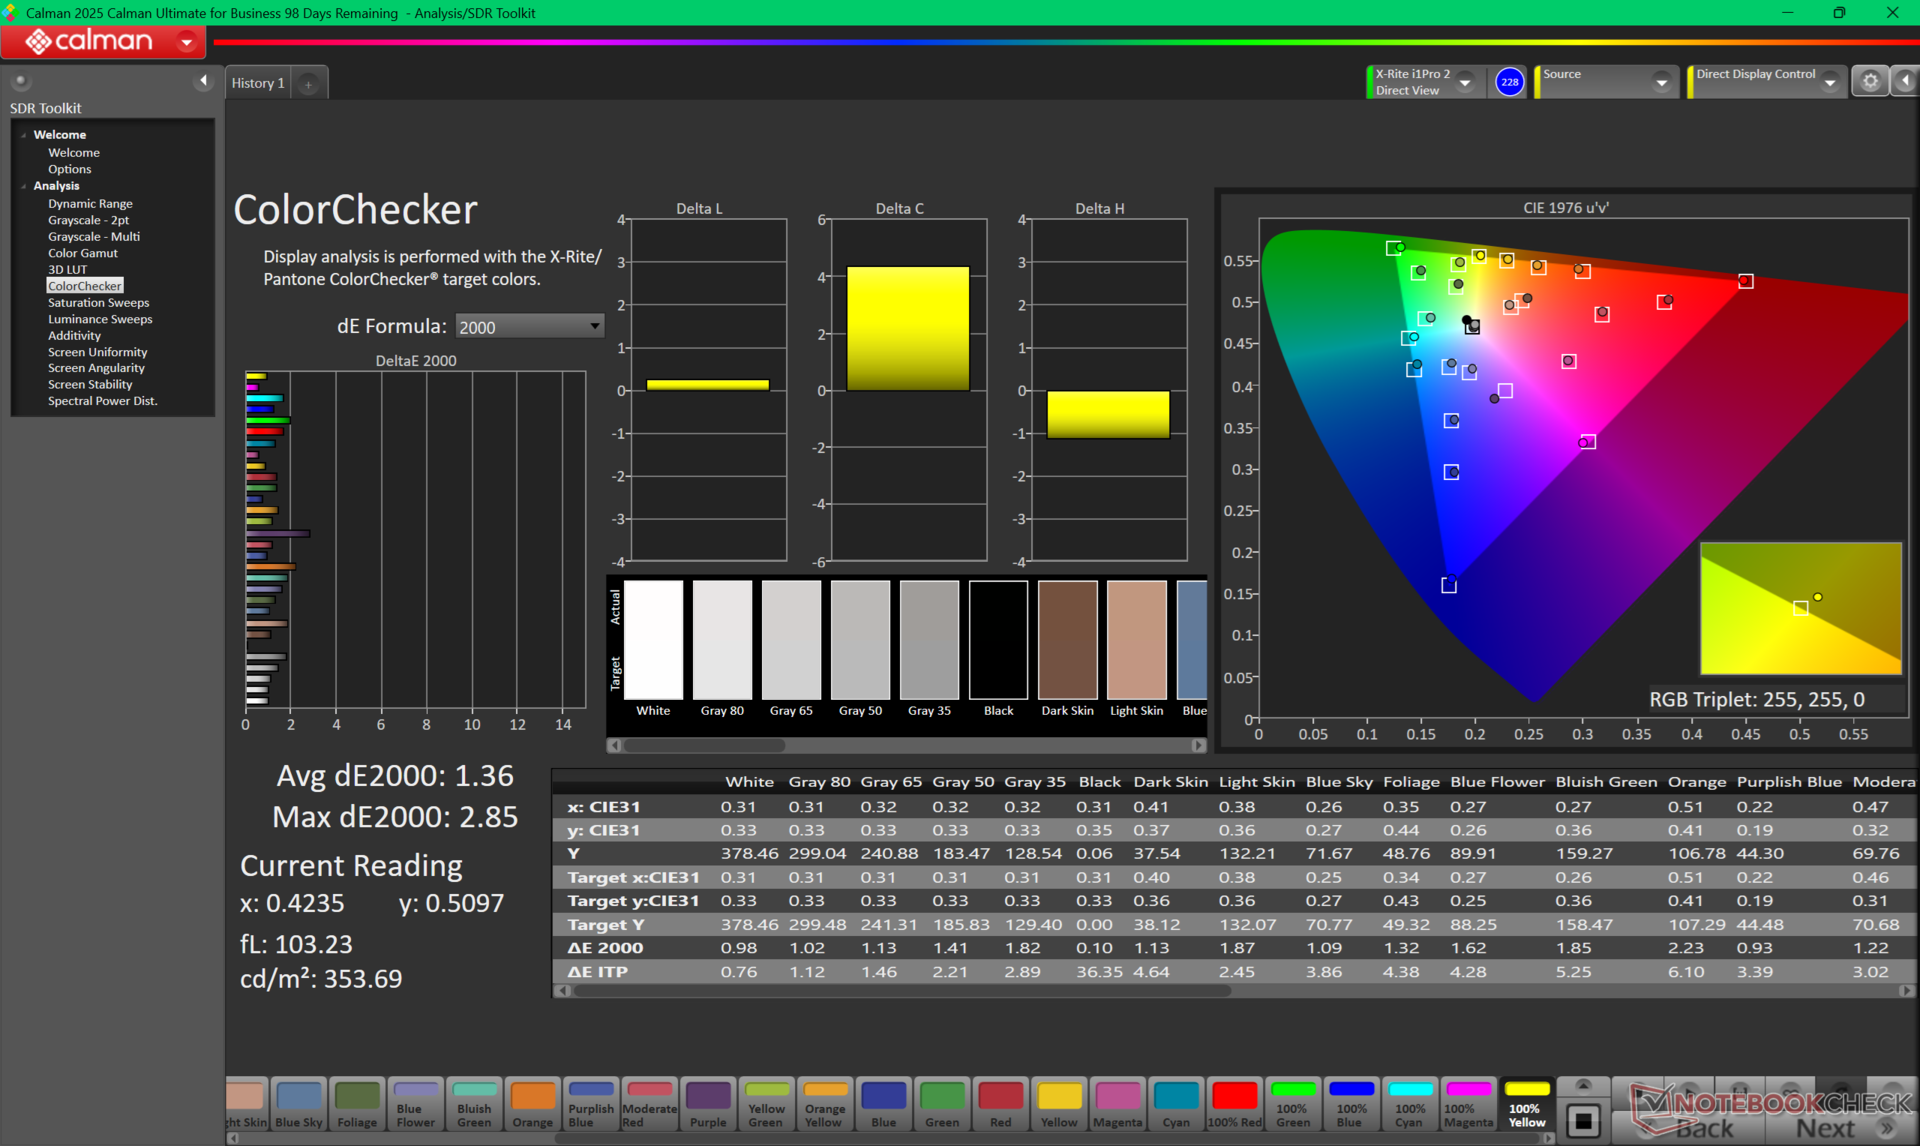
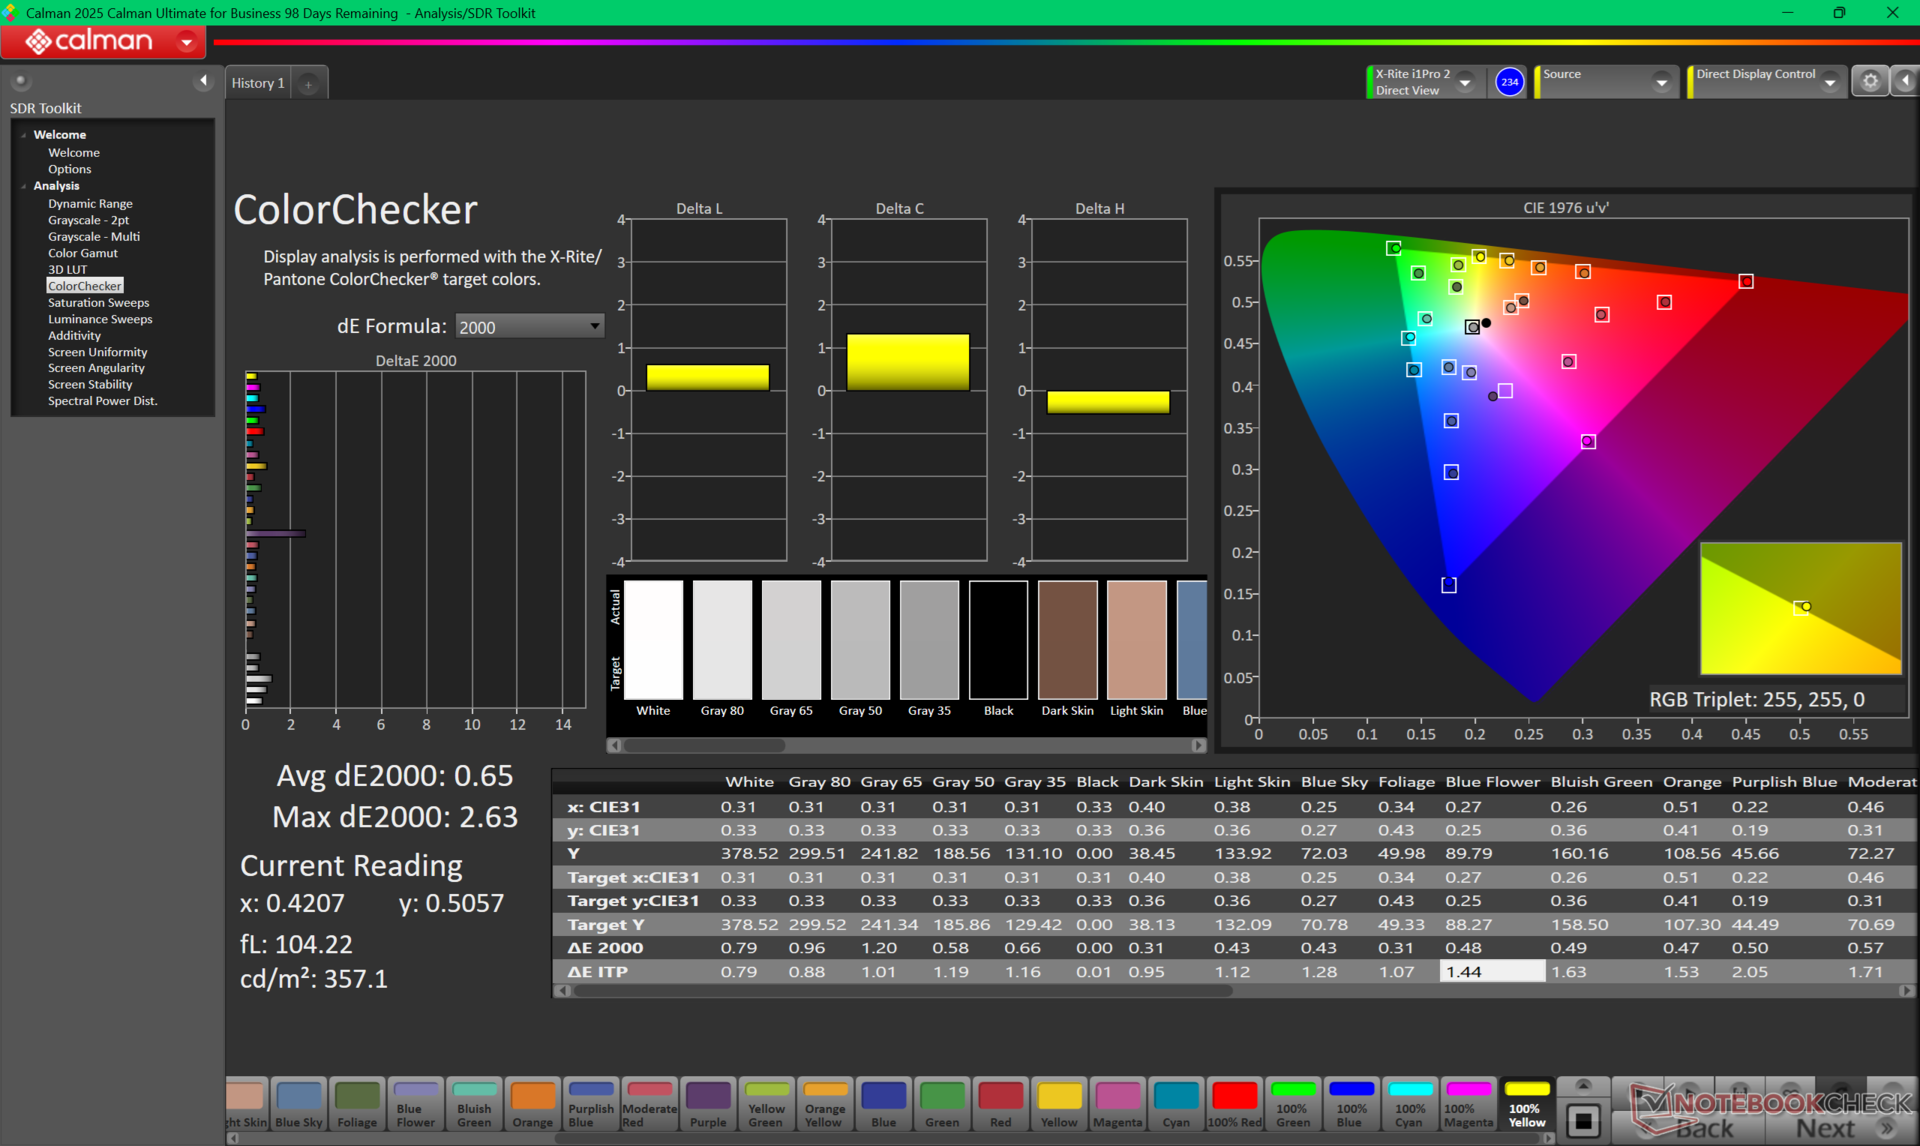
ΔE ColorChecker Calman: 1.36 | ∀{0.5-29.43 Ø4.71}
calibrated: 0.65
ΔE Greyscale Calman: 1.3 | ∀{0.09-98 Ø4.96}
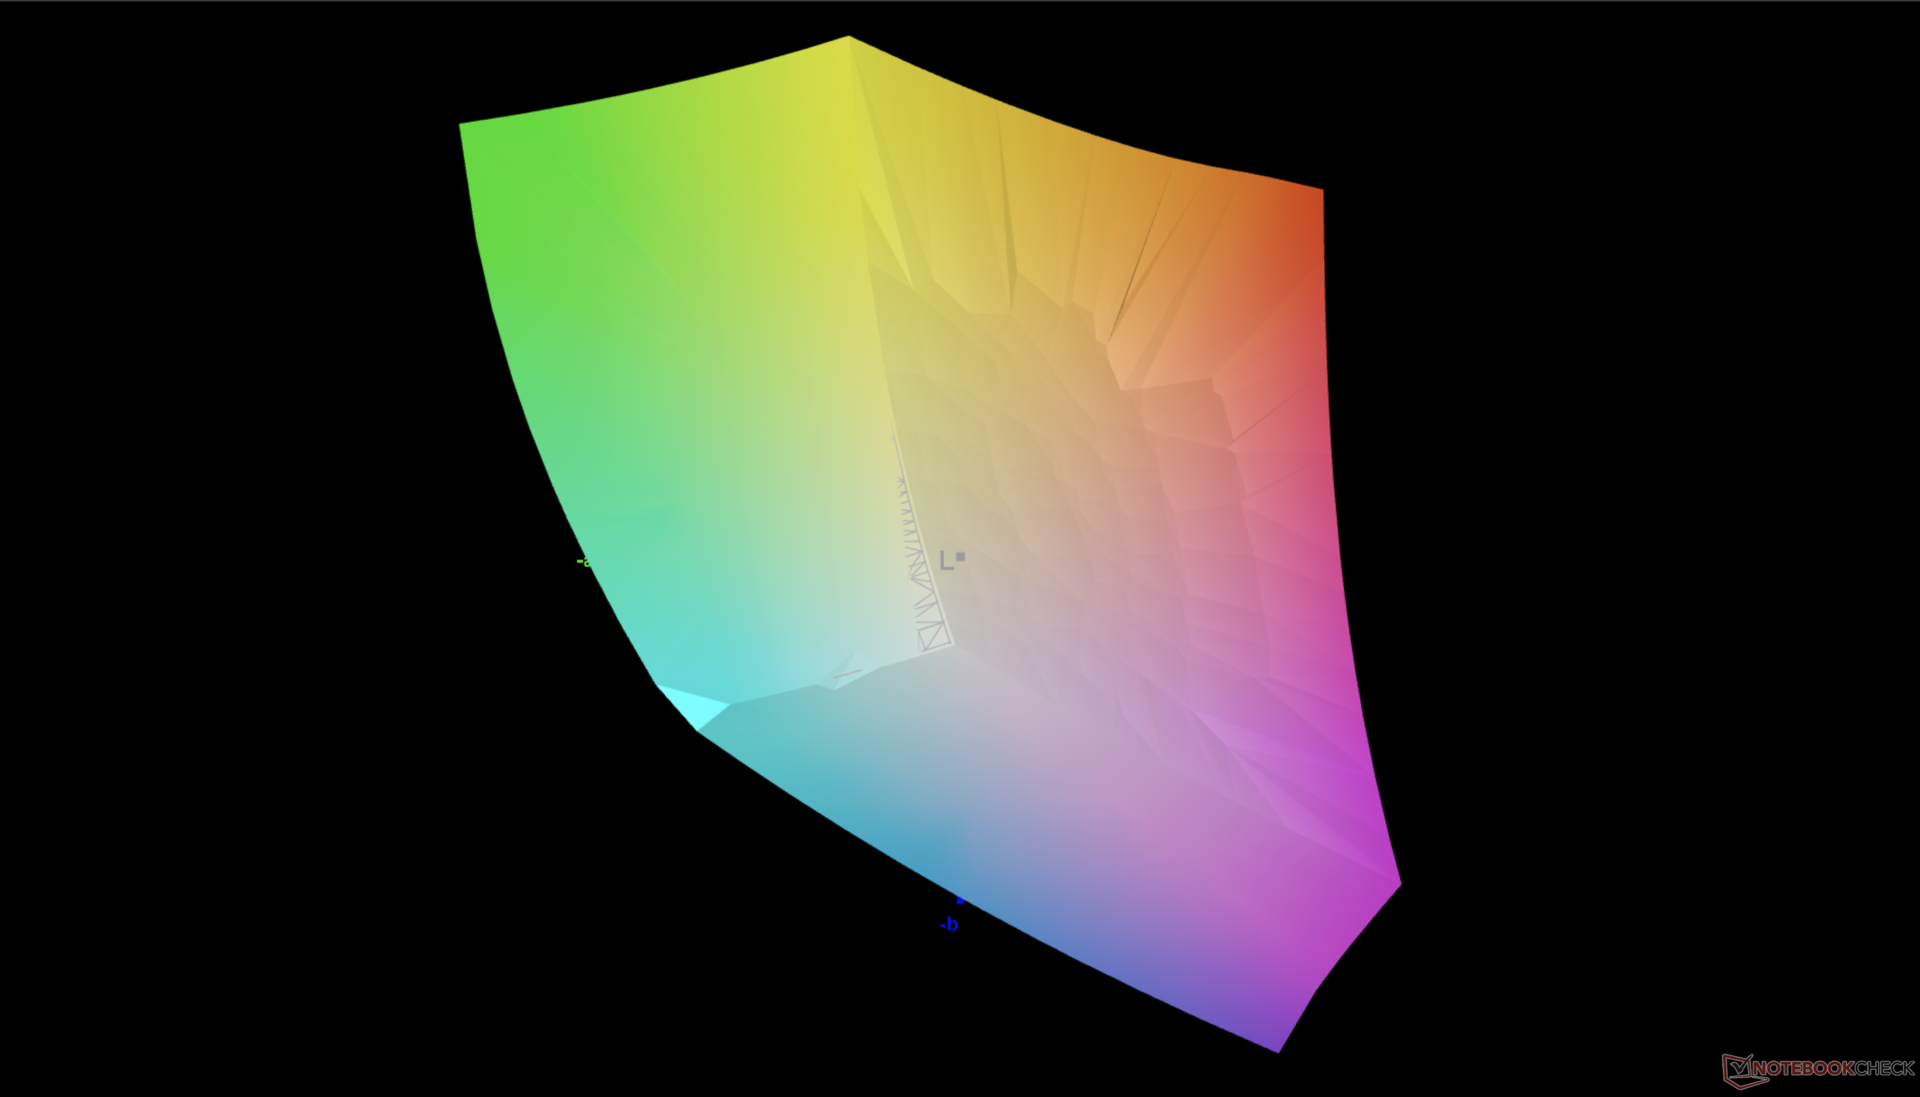
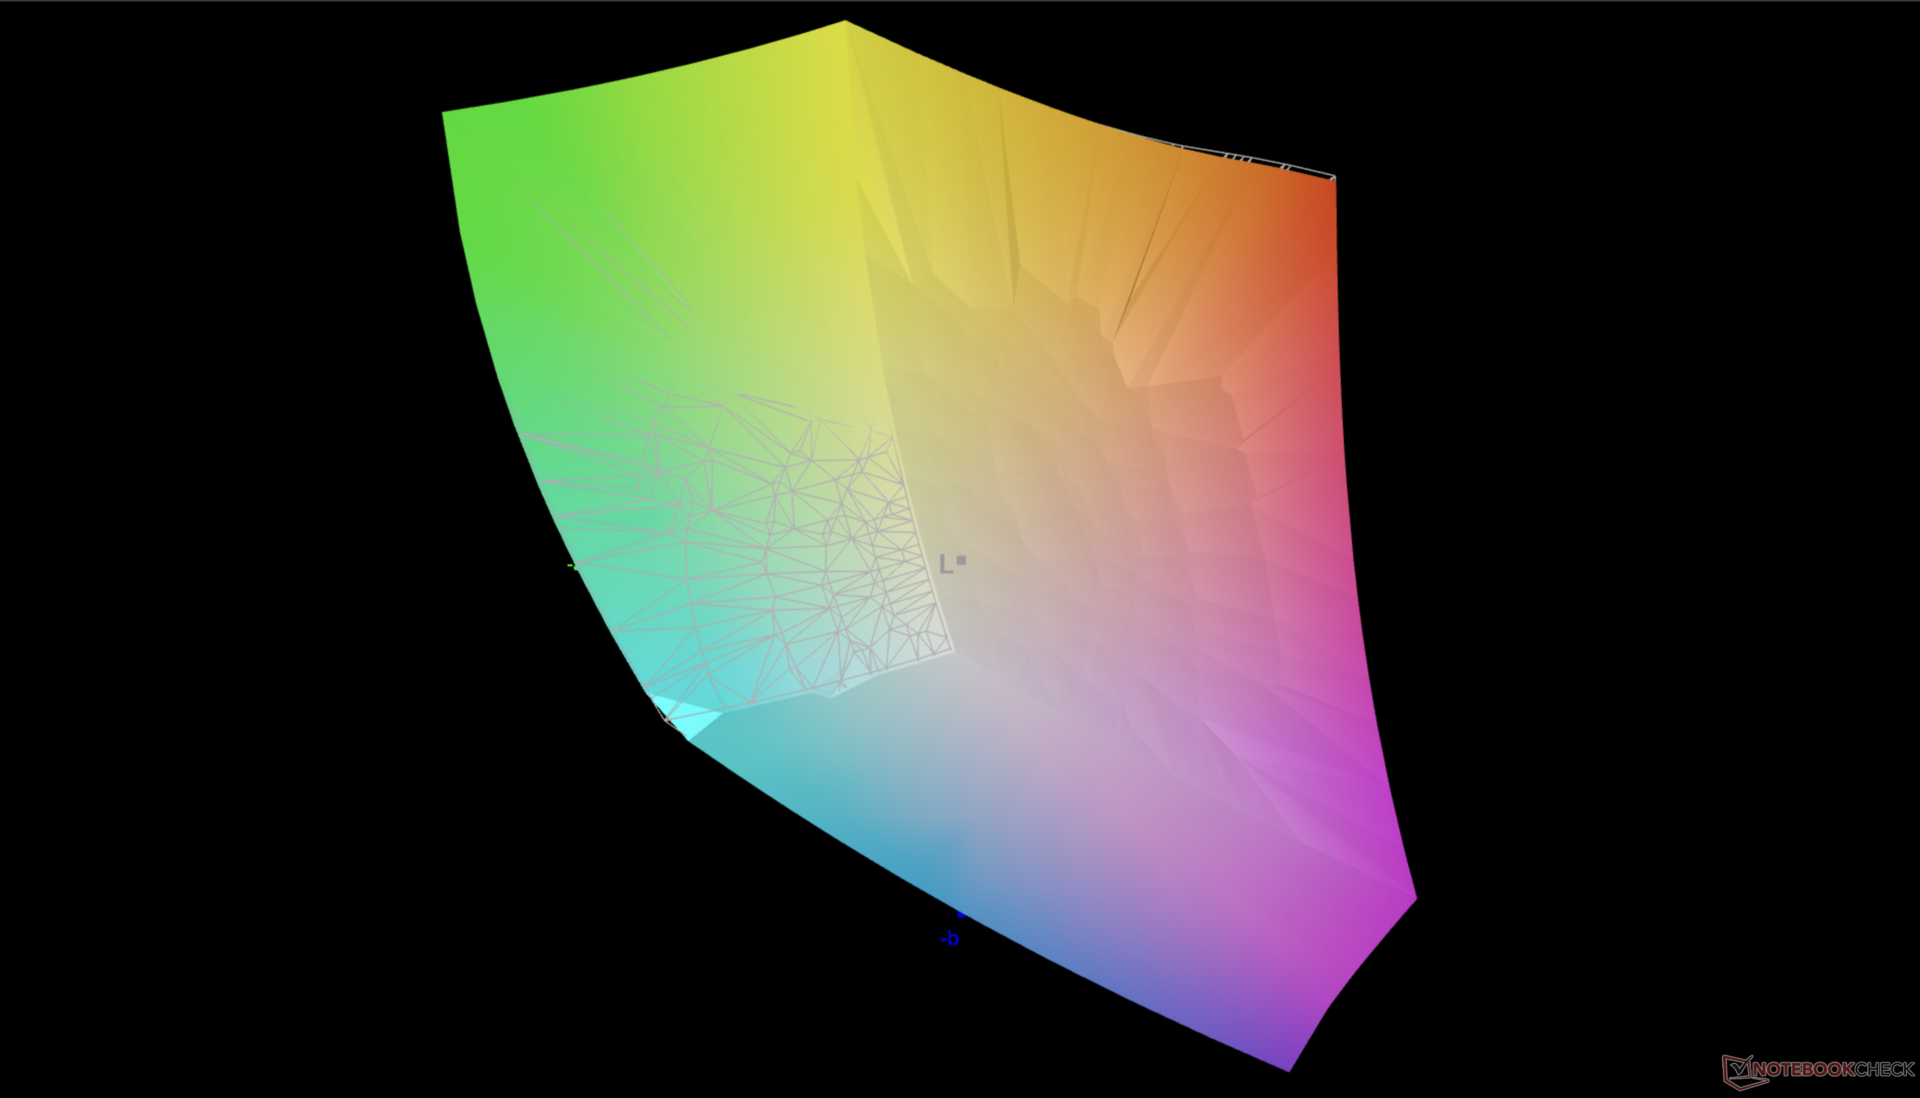
88.1% AdobeRGB 1998 (Argyll 3D)
100% sRGB (Argyll 3D)
99.7% Display P3 (Argyll 3D)
Gamma: 2.2
CCT: 6282 K
| Dell 16 Premium DA16250 Samsung 163DU02, OLED, 3840x2400, 16.3", 120 Hz | Dell XPS 16 9640 SDC4196, OLED, 3840x2400, 16.3", 90 Hz | HP Spectre x360 16 RTX 4050 Samsung SDC41A6, OLED, 2880x1800, 16", 120 Hz | Lenovo Yoga Pro 9i 16 RTX 5070 ATNA60KA01-0, OLED, 3200x2000, 16", 120 Hz | Asus Zenbook S 16 UM5606-RK333W ATNA60CL10-0, OLED, 2880x1800, 16", 120 Hz | LG Gram Pro 16Z90TS-G.AU89G LG DISPLAY LP160WQ2-SPF1, IPS, 2560x1600, 16", 144 Hz | |
|---|---|---|---|---|---|---|
| Display | -0% | 3% | 3% | 3% | -1% | |
| Display P3 Coverage (%) | 99.7 | 98.3 -1% | 99.6 0% | 97.4 -2% | 99.9 0% | 97.96 -2% |
| sRGB Coverage (%) | 100 | 100 0% | 100 0% | 100 0% | 100 0% | 100 0% |
| AdobeRGB 1998 Coverage (%) | 88.1 | 87.8 0% | 96.7 10% | 96.8 10% | 95.6 9% | 86.65 -2% |
| Response Times | -16% | -13% | 50% | 16% | -5457% | |
| Response Time Grey 50% / Grey 80% * (ms) | 0.61 ? | 0.82 ? -34% | 0.78 ? -28% | 0.27 ? 56% | 0.56 ? 8% | 47 ? -7605% |
| Response Time Black / White * (ms) | 0.88 ? | 0.85 ? 3% | 0.86 ? 2% | 0.37 ? 58% | 0.65 ? 26% | 30 ? -3309% |
| PWM Frequency (Hz) | 490.8 ? | 360 ? | 480 ? | 1200 | 480 | |
| PWM Amplitude * (%) | 35 | 22 37% | 30 14% | |||
| Screen | -22% | -28% | 63% | 31% | 5% | |
| Brightness middle (cd/m²) | 385.7 | 366 -5% | 385.2 0% | 974 153% | 407 6% | 442 15% |
| Brightness (cd/m²) | 387 | 367 -5% | 387 0% | 979 153% | 405 5% | 406 5% |
| Brightness Distribution (%) | 98 | 96 -2% | 99 1% | 98 0% | 97 -1% | 86 -12% |
| Black Level * (cd/m²) | 0.02 | 0.17 | ||||
| Colorchecker dE 2000 * | 1.36 | 1.3 4% | 1.73 -27% | 0.9 34% | 0.6 56% | 0.84 38% |
| Colorchecker dE 2000 max. * | 2.85 | 3.6 -26% | 3.95 -39% | 1.7 40% | 1.2 58% | 1.62 43% |
| Colorchecker dE 2000 calibrated * | 0.65 | 1 -54% | 0.88 -35% | |||
| Greyscale dE 2000 * | 1.3 | 2.2 -69% | 2.6 -100% | 1.3 -0% | 0.5 62% | 1.53 -18% |
| Gamma | 2.2 100% | 2.14 103% | 2.17 101% | 2.21 100% | 2.2 100% | 2.173 101% |
| CCT | 6282 103% | 6680 97% | 6133 106% | 6751 96% | 6453 101% | 6496 100% |
| Contrast (:1) | 20350 | 2600 | ||||
| Total Average (Program / Settings) | -13% /
-16% | -13% /
-16% | 39% /
45% | 17% /
20% | -1818% /
-907% |
* ... smaller is better


Display Response Times
| ↔ Response Time Black to White | ||
|---|---|---|
| 0.88 ms ... rise ↗ and fall ↘ combined | ↗ 0.41 ms rise | 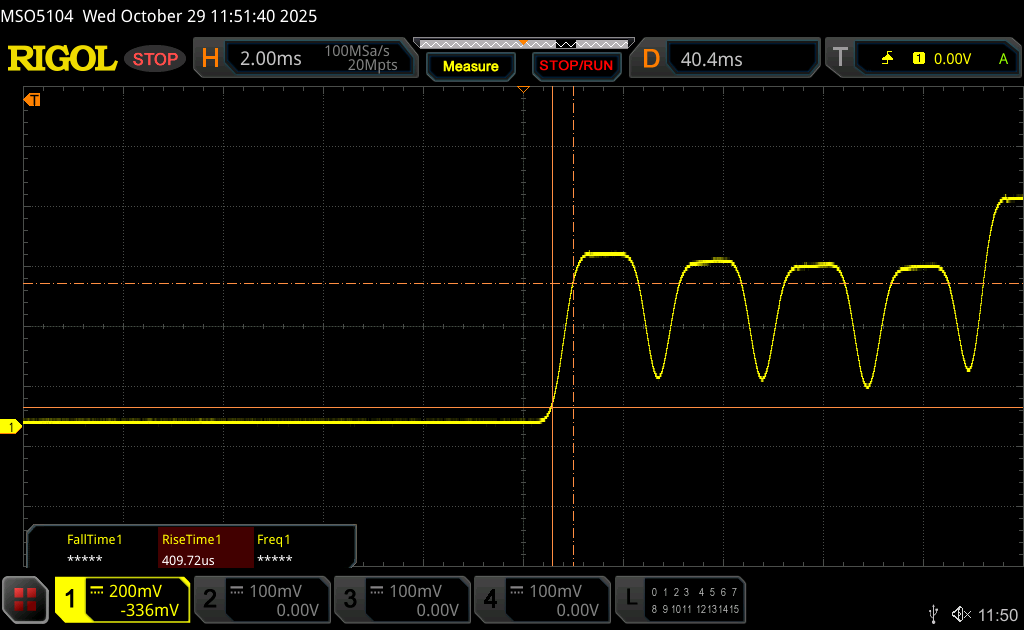 |
| ↘ 0.47 ms fall | ||
| The screen shows very fast response rates in our tests and should be very well suited for fast-paced gaming. In comparison, all tested devices range from 0.1 (minimum) to 240 (maximum) ms. » 3 % of all devices are better. This means that the measured response time is better than the average of all tested devices (19.8 ms). | ||
| ↔ Response Time 50% Grey to 80% Grey | ||
| 0.61 ms ... rise ↗ and fall ↘ combined | ↗ 0.31 ms rise | 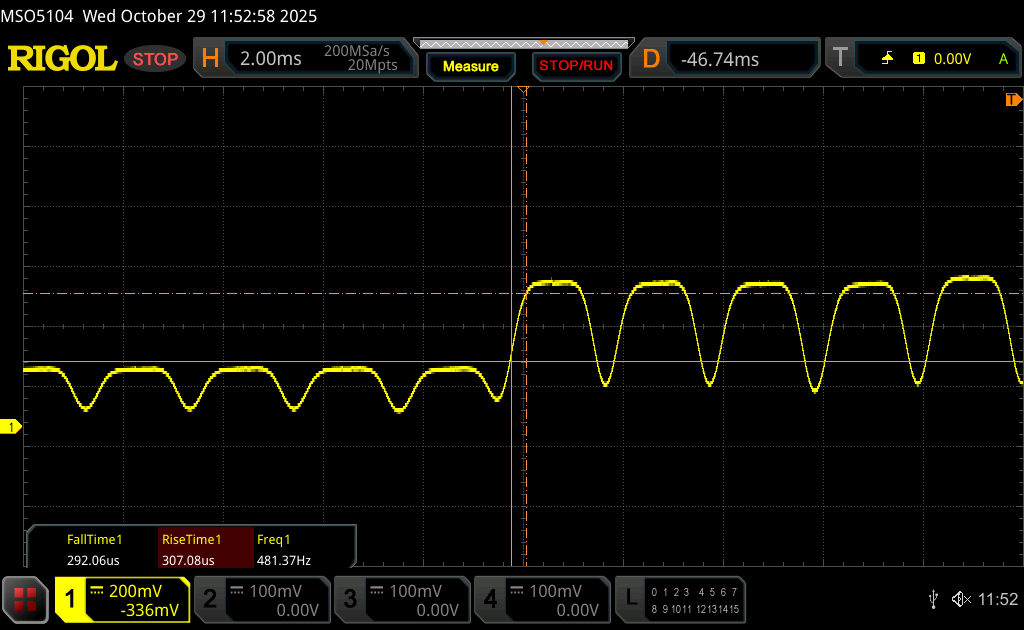 |
| ↘ 0.3 ms fall | ||
| The screen shows very fast response rates in our tests and should be very well suited for fast-paced gaming. In comparison, all tested devices range from 0.165 (minimum) to 636 (maximum) ms. » 2 % of all devices are better. This means that the measured response time is better than the average of all tested devices (31 ms). | ||
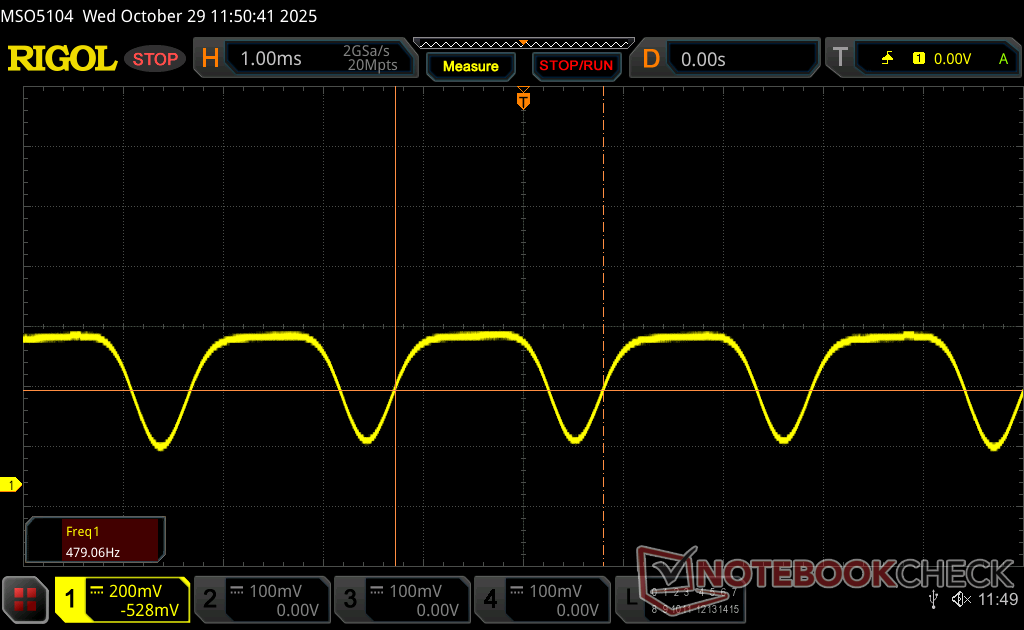
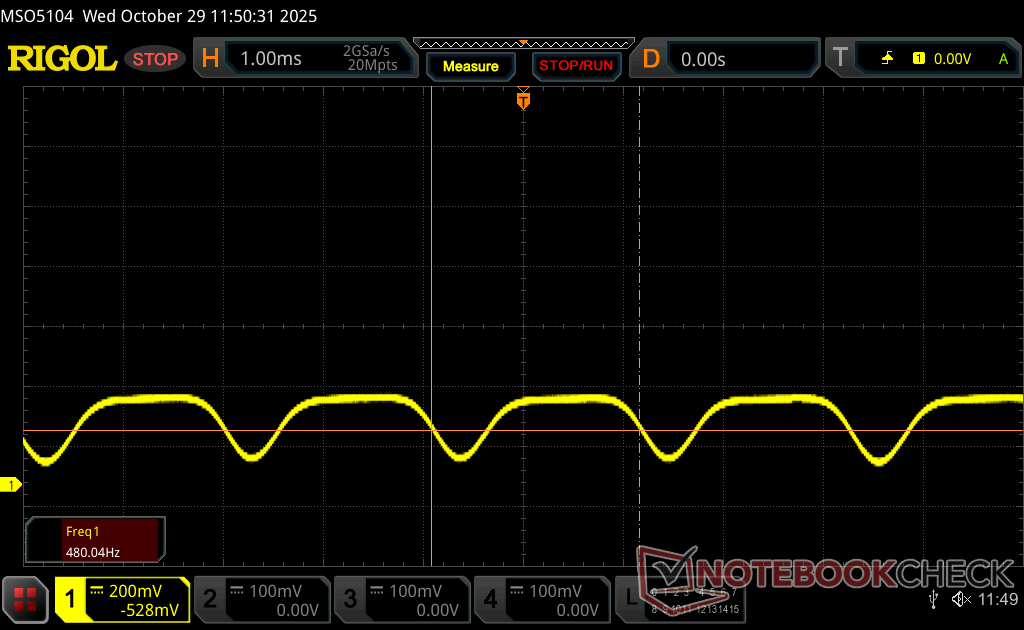
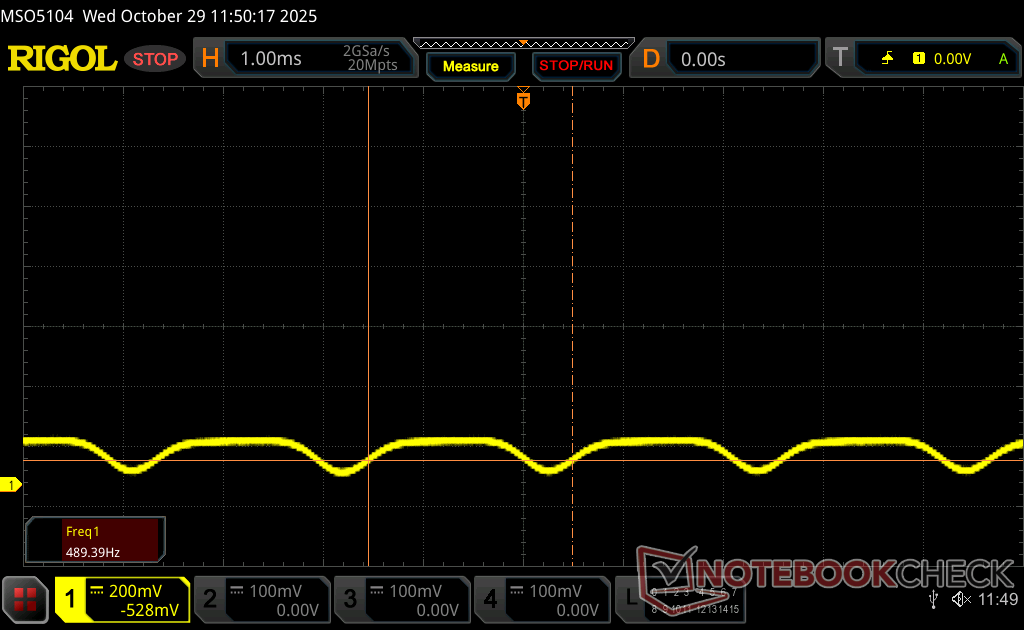
Screen Flickering / PWM (Pulse-Width Modulation)
| Screen flickering / PWM detected | 490.8 Hz Amplitude: 35 % | ≤ 100 % brightness setting | 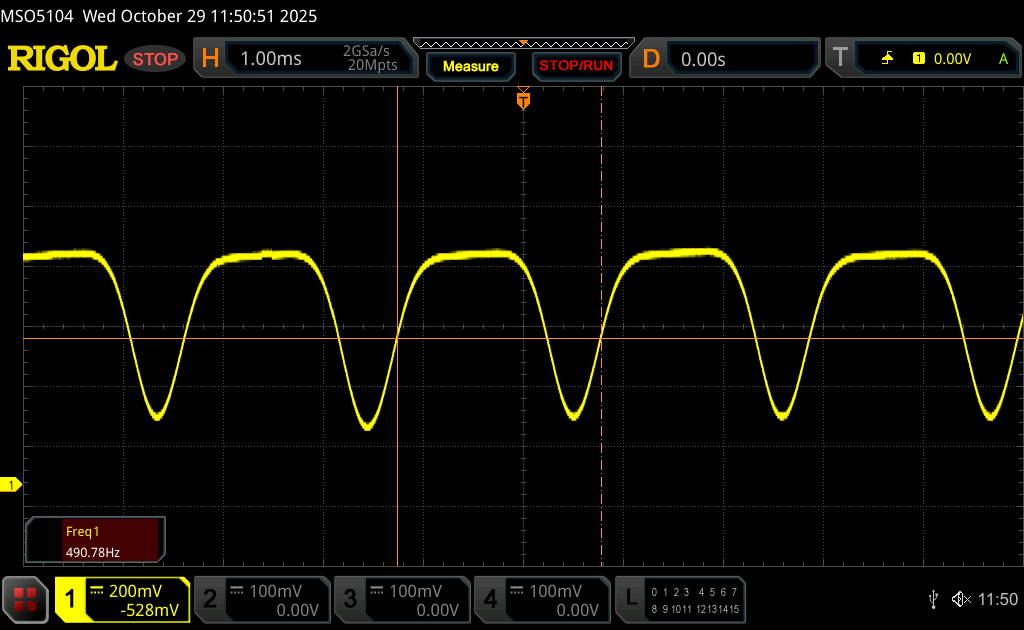 |
The display backlight flickers at 490.8 Hz (worst case, e.g., utilizing PWM) Flickering detected at a brightness setting of 100 % and below. There should be no flickering or PWM above this brightness setting. The frequency of 490.8 Hz is relatively high, so most users sensitive to PWM should not notice any flickering. However, there are reports that some users are still sensitive to PWM at 500 Hz and above, so be aware. In comparison: 52 % of all tested devices do not use PWM to dim the display. If PWM was detected, an average of 7754 (minimum: 5 - maximum: 343500) Hz was measured. | |||


性能
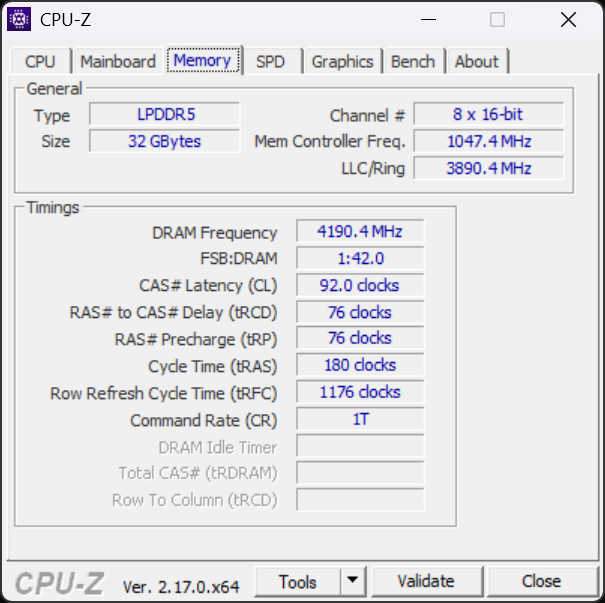
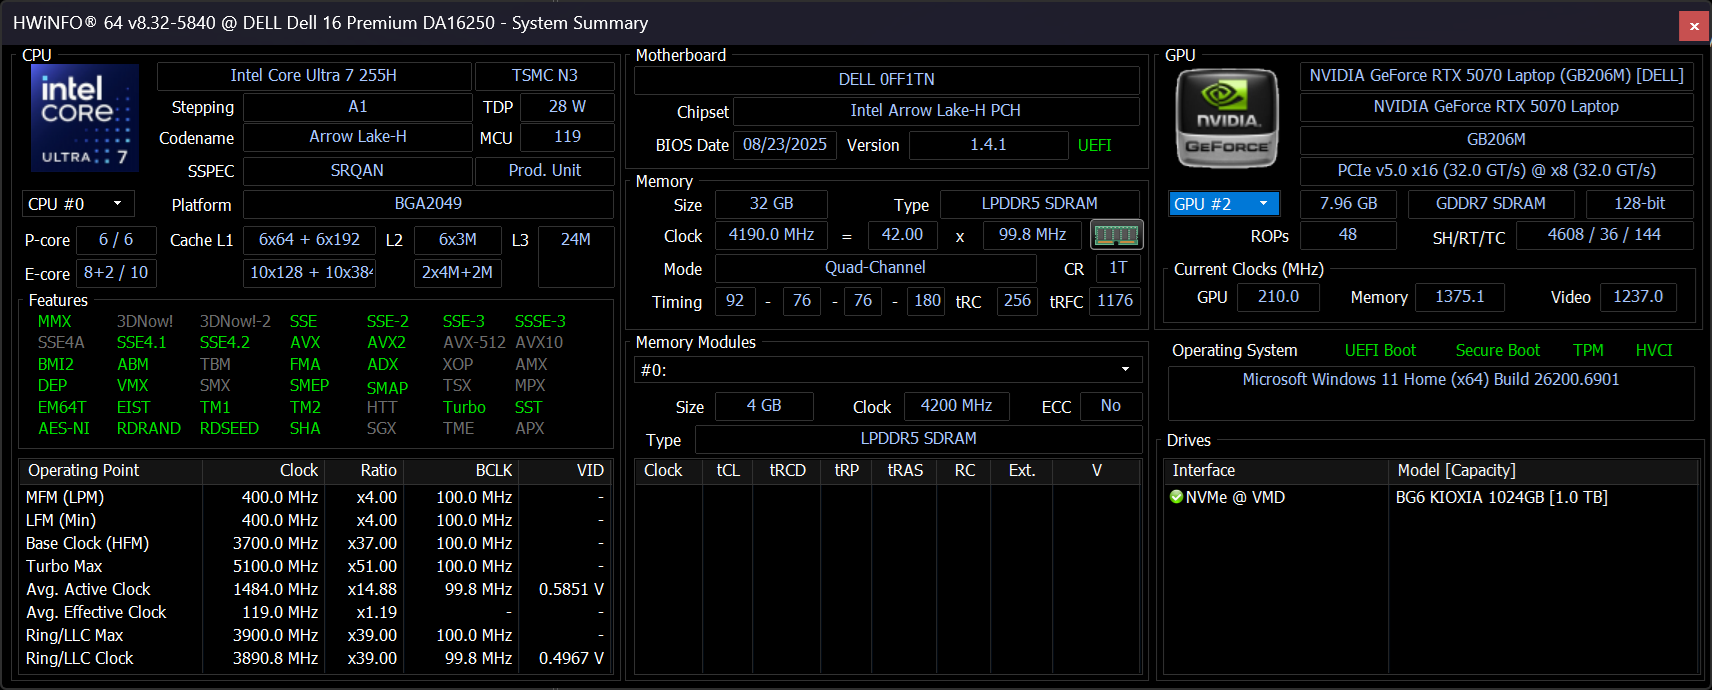
测试条件
在运行以下基准测试之前,我们将戴尔优化大师设置为性能模式,将 Nvidia 控制面板设置为独立显卡模式。
处理器
酷睿至尊 7 255H 酷睿至尊 7 255H运行速度比 酷睿至尊 7 155H快 20%。升级到价格更贵的 酷睿至尊 9 285H配置,预计性能也只能提高几个百分点。
Turbo Boost 的持续性可能会更好。如下图所示,当循环运行 CineBench R15 xT 时,分数会随着时间的推移下降近 15%。去年机型的 Core Ultra 7 255H 和 Core Ultra 7 155H 的性能差距在系统受压时变得越来越小。
Cinebench R15 多回路运行
Cinebench R23: Multi Core | Single Core
Cinebench R20: CPU (Multi Core) | CPU (Single Core)
Cinebench R15: CPU Multi 64Bit | CPU Single 64Bit
Blender: v2.79 BMW27 CPU
7-Zip 18.03: 7z b 4 | 7z b 4 -mmt1
Geekbench 6.7: Multi-Core | Single-Core
Geekbench 5.5: Multi-Core | Single-Core
HWBOT x265 Benchmark v2.2: 4k Preset
LibreOffice : 20 Documents To PDF
R Benchmark 2.5: Overall mean
* ... smaller is better
压力测试
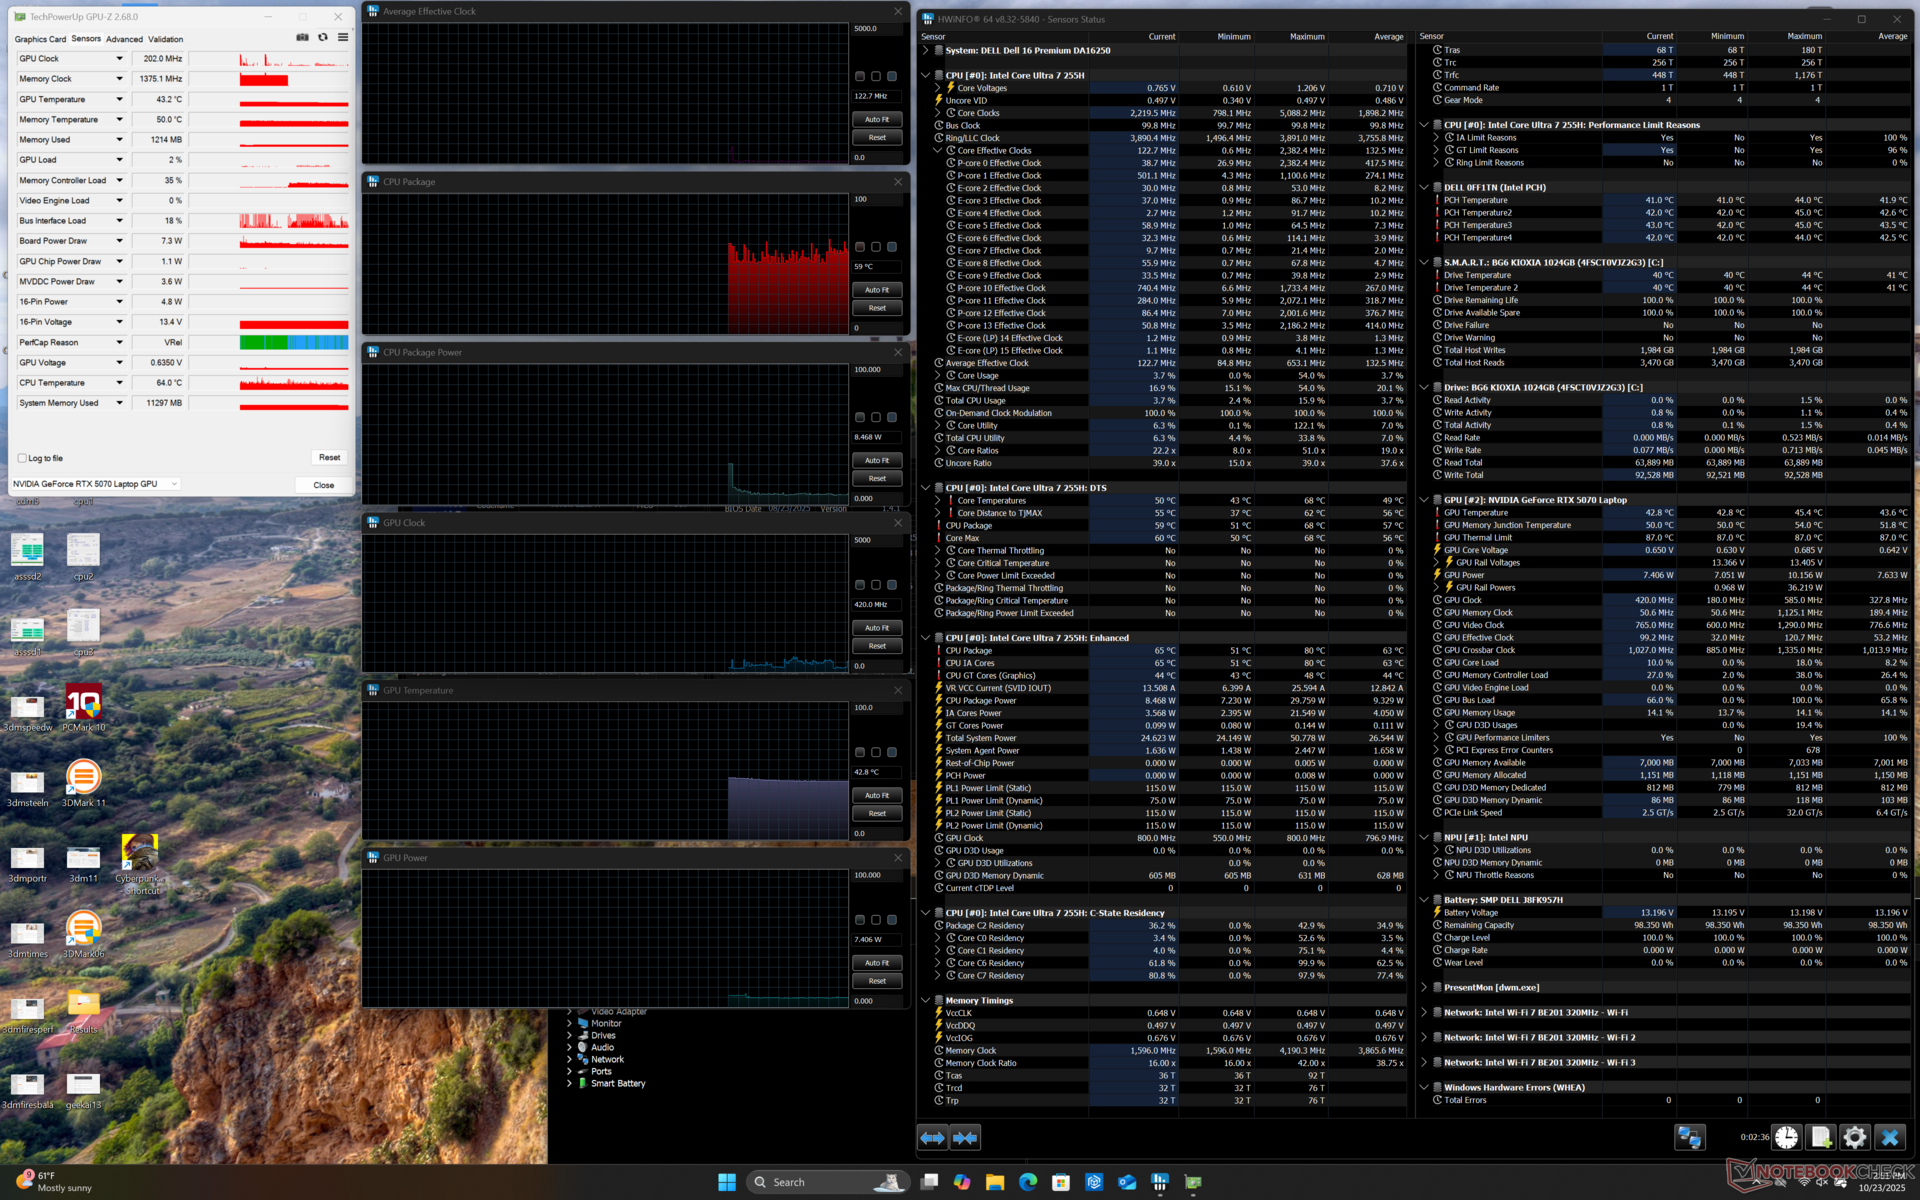
核心温度仍然可以达到相对较高的水平,尤其是 CPU。例如,在运行 Prime95 时,CPU 会升至 3.7 GHz、105 C 和 115 W,然后很快降至 3 GHz、93 C 和 67 W。因此,最大 Turbo Boost 持续性受到限制,如上文 CPU 性能部分所述。
运行《赛博朋克 2077》时,GPU 板的功耗平均约为 55 瓦至 65 瓦,而游戏笔记本电脑(如 Alienware 16X 极光采用相同 RTX 5070 GPU 的游戏笔记本电脑则为 115 W。


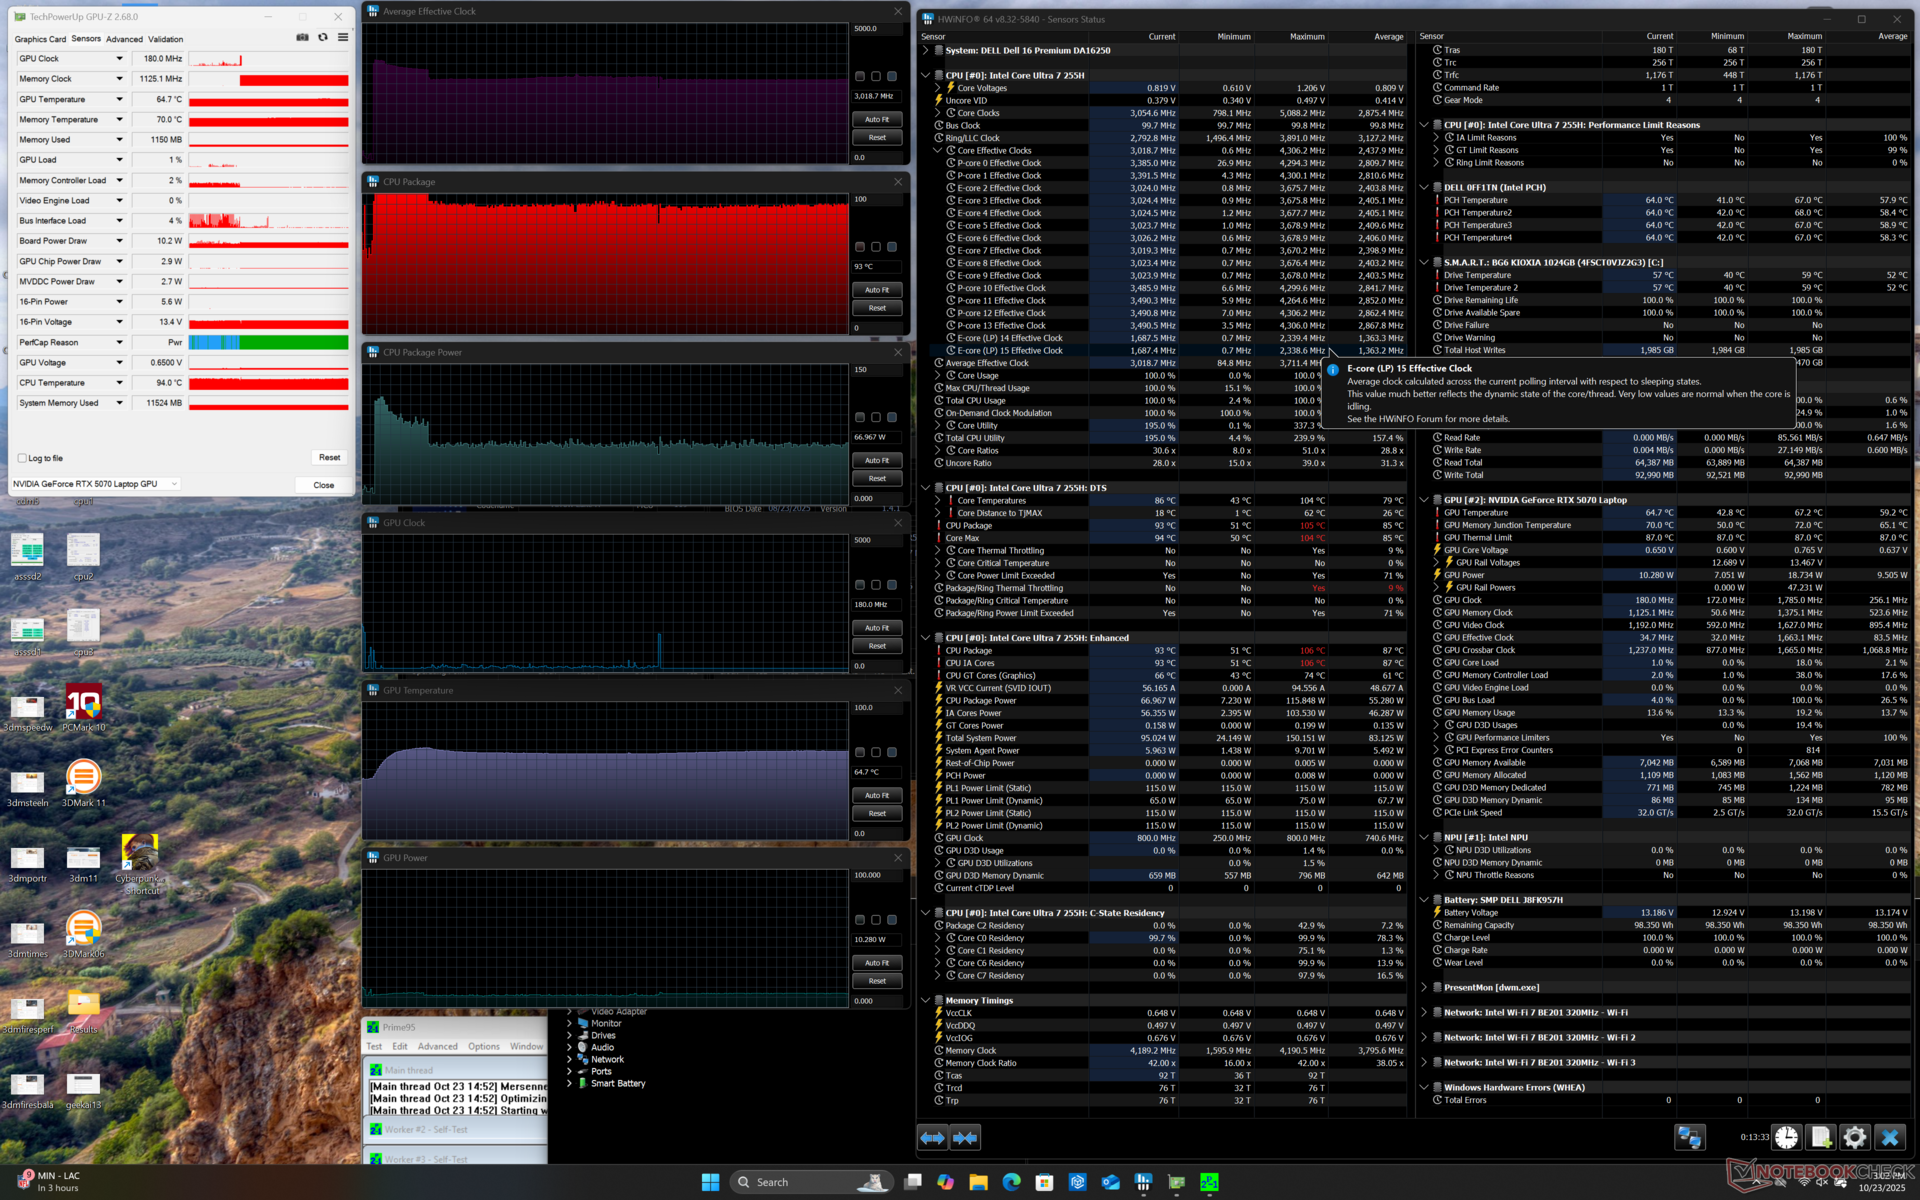
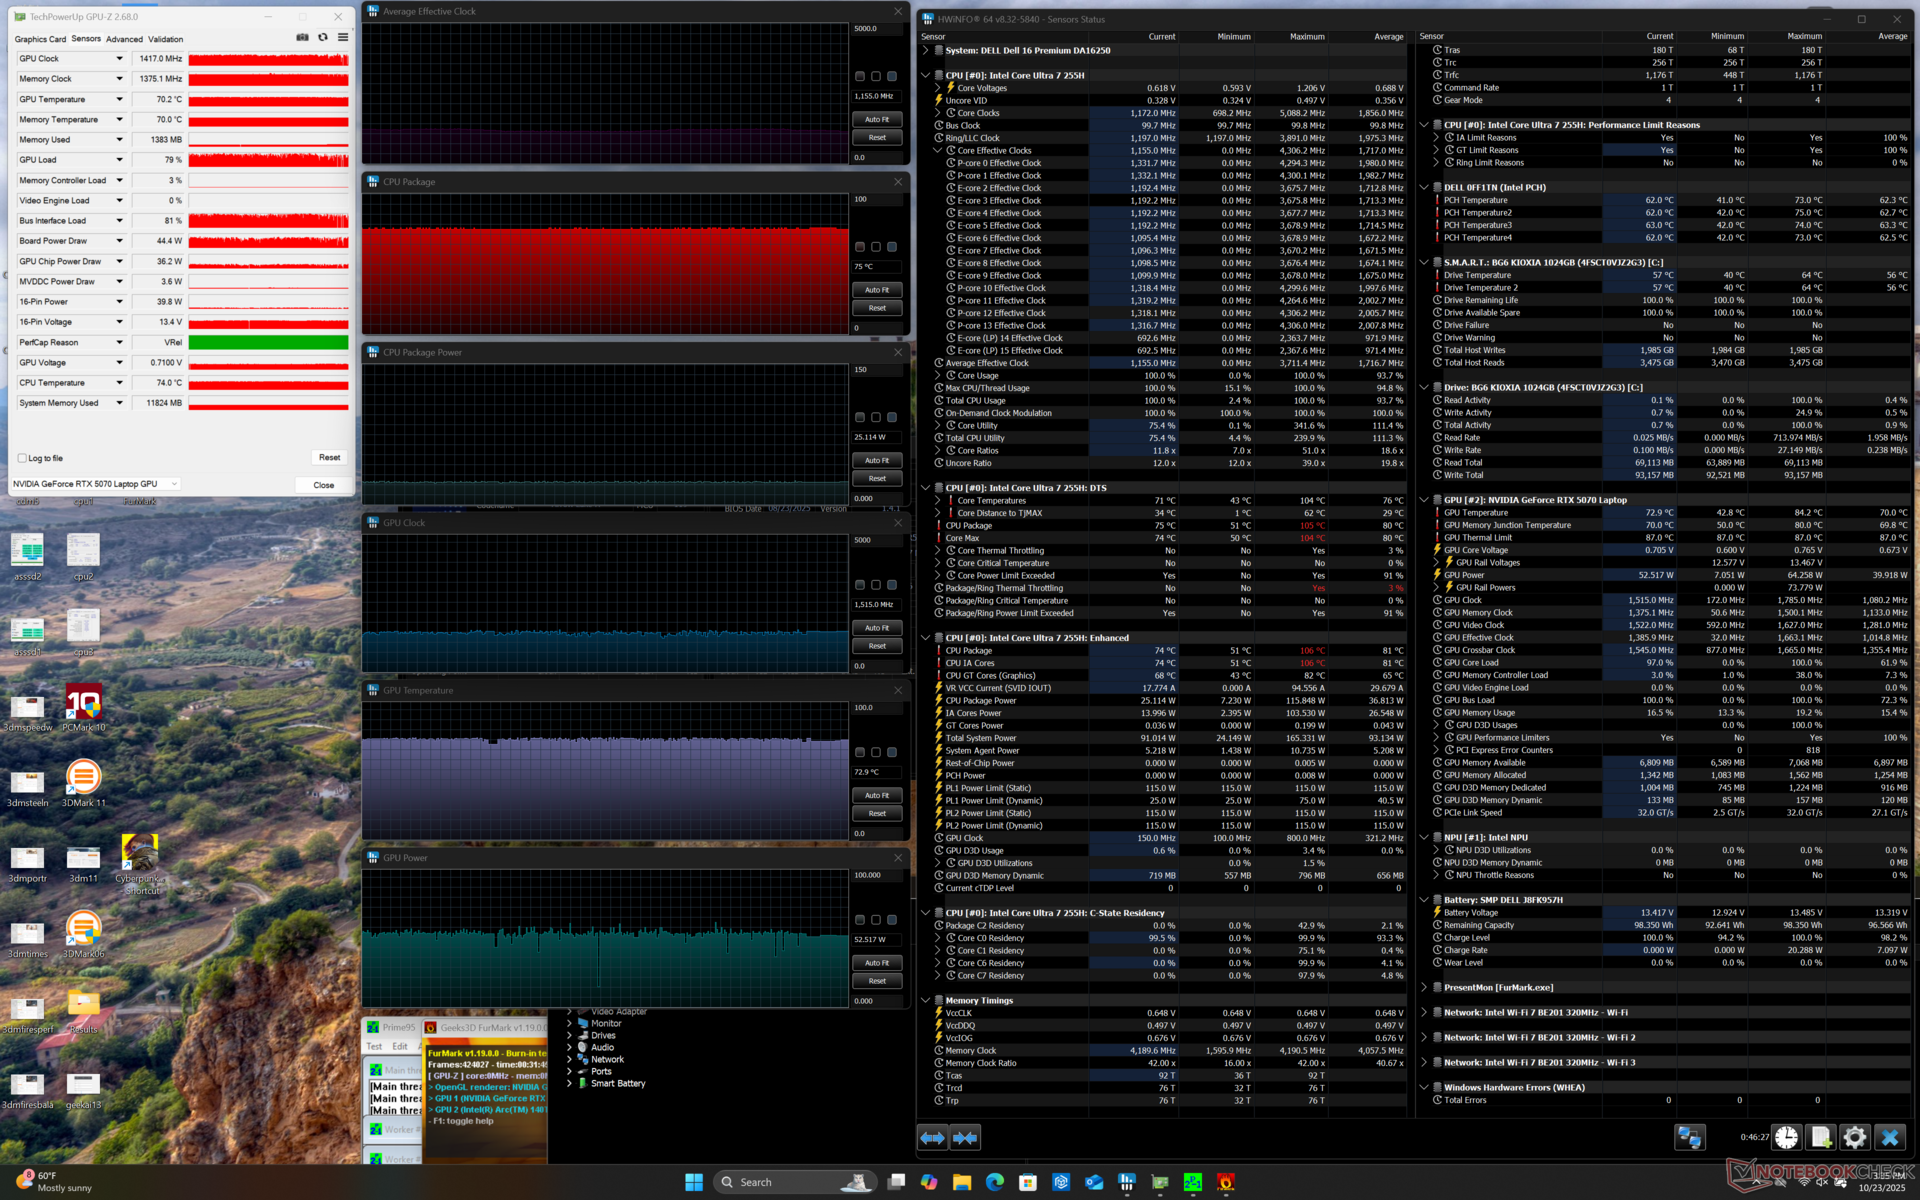
| 平均 CPU 时钟 (GHz) | GPU 时钟 (MHz) | 平均 CPU 温度 (°C) | 平均 GPU 温度 (°C) | |
| 系统闲置 | -- | -- | 59 | 43 |
| Prime95 压力 | 3.0 | -- | 93 | 65 |
| 赛博朋克 2077》压力(平衡模式) | 1.5 | 1672 | 75 | 73 |
| 赛博朋克 2077》压力(性能模式) | 1.5 | 1687 | 76 | 73 |
| Prime95 + FurMark Stress | 1.2 | 1417 | 75 | 73 |
系统性能
AIDA64 和 PCMark 10 都无法在我们的设备上运行,因此下面省略了分数。
CrossMark: Overall | Productivity | Creativity | Responsiveness
WebXPRT 3: Overall
WebXPRT 4: Overall
Mozilla Kraken 1.1: Total
| Performance rating | |
| Lenovo Yoga Pro 9i 16 RTX 5070 | |
| Dell XPS 16 9640 -1! | |
| Dell 16 Premium DA16250 | |
| Average Intel Core Ultra 7 255H, NVIDIA GeForce RTX 5070 Laptop | |
| Asus Zenbook S 16 UM5606-RK333W | |
| LG Gram Pro 16Z90TS-G.AU89G | |
| HP Spectre x360 16 RTX 4050 | |
| CrossMark / Overall | |
| Lenovo Yoga Pro 9i 16 RTX 5070 | |
| Dell 16 Premium DA16250 | |
| Average Intel Core Ultra 7 255H, NVIDIA GeForce RTX 5070 Laptop (n=1) | |
| Dell XPS 16 9640 | |
| Asus Zenbook S 16 UM5606-RK333W | |
| LG Gram Pro 16Z90TS-G.AU89G | |
| HP Spectre x360 16 RTX 4050 | |
| CrossMark / Productivity | |
| Lenovo Yoga Pro 9i 16 RTX 5070 | |
| Dell 16 Premium DA16250 | |
| Average Intel Core Ultra 7 255H, NVIDIA GeForce RTX 5070 Laptop (n=1) | |
| Dell XPS 16 9640 | |
| Asus Zenbook S 16 UM5606-RK333W | |
| LG Gram Pro 16Z90TS-G.AU89G | |
| HP Spectre x360 16 RTX 4050 | |
| CrossMark / Creativity | |
| Lenovo Yoga Pro 9i 16 RTX 5070 | |
| Dell 16 Premium DA16250 | |
| Average Intel Core Ultra 7 255H, NVIDIA GeForce RTX 5070 Laptop (n=1) | |
| Asus Zenbook S 16 UM5606-RK333W | |
| Dell XPS 16 9640 | |
| LG Gram Pro 16Z90TS-G.AU89G | |
| HP Spectre x360 16 RTX 4050 | |
| CrossMark / Responsiveness | |
| Dell 16 Premium DA16250 | |
| Average Intel Core Ultra 7 255H, NVIDIA GeForce RTX 5070 Laptop (n=1) | |
| Dell XPS 16 9640 | |
| Lenovo Yoga Pro 9i 16 RTX 5070 | |
| Asus Zenbook S 16 UM5606-RK333W | |
| LG Gram Pro 16Z90TS-G.AU89G | |
| HP Spectre x360 16 RTX 4050 | |
| WebXPRT 3 / Overall | |
| Lenovo Yoga Pro 9i 16 RTX 5070 | |
| Dell 16 Premium DA16250 | |
| Average Intel Core Ultra 7 255H, NVIDIA GeForce RTX 5070 Laptop (n=1) | |
| Asus Zenbook S 16 UM5606-RK333W | |
| Dell XPS 16 9640 | |
| HP Spectre x360 16 RTX 4050 | |
| LG Gram Pro 16Z90TS-G.AU89G | |
| WebXPRT 4 / Overall | |
| Lenovo Yoga Pro 9i 16 RTX 5070 | |
| Dell 16 Premium DA16250 | |
| Average Intel Core Ultra 7 255H, NVIDIA GeForce RTX 5070 Laptop (n=1) | |
| LG Gram Pro 16Z90TS-G.AU89G | |
| Asus Zenbook S 16 UM5606-RK333W | |
| HP Spectre x360 16 RTX 4050 | |
| Dell XPS 16 9640 | |
| Mozilla Kraken 1.1 / Total | |
| HP Spectre x360 16 RTX 4050 | |
| LG Gram Pro 16Z90TS-G.AU89G | |
| Dell 16 Premium DA16250 | |
| Average Intel Core Ultra 7 255H, NVIDIA GeForce RTX 5070 Laptop (n=1) | |
| Asus Zenbook S 16 UM5606-RK333W | |
| Lenovo Yoga Pro 9i 16 RTX 5070 | |
* ... smaller is better
DPC 延迟
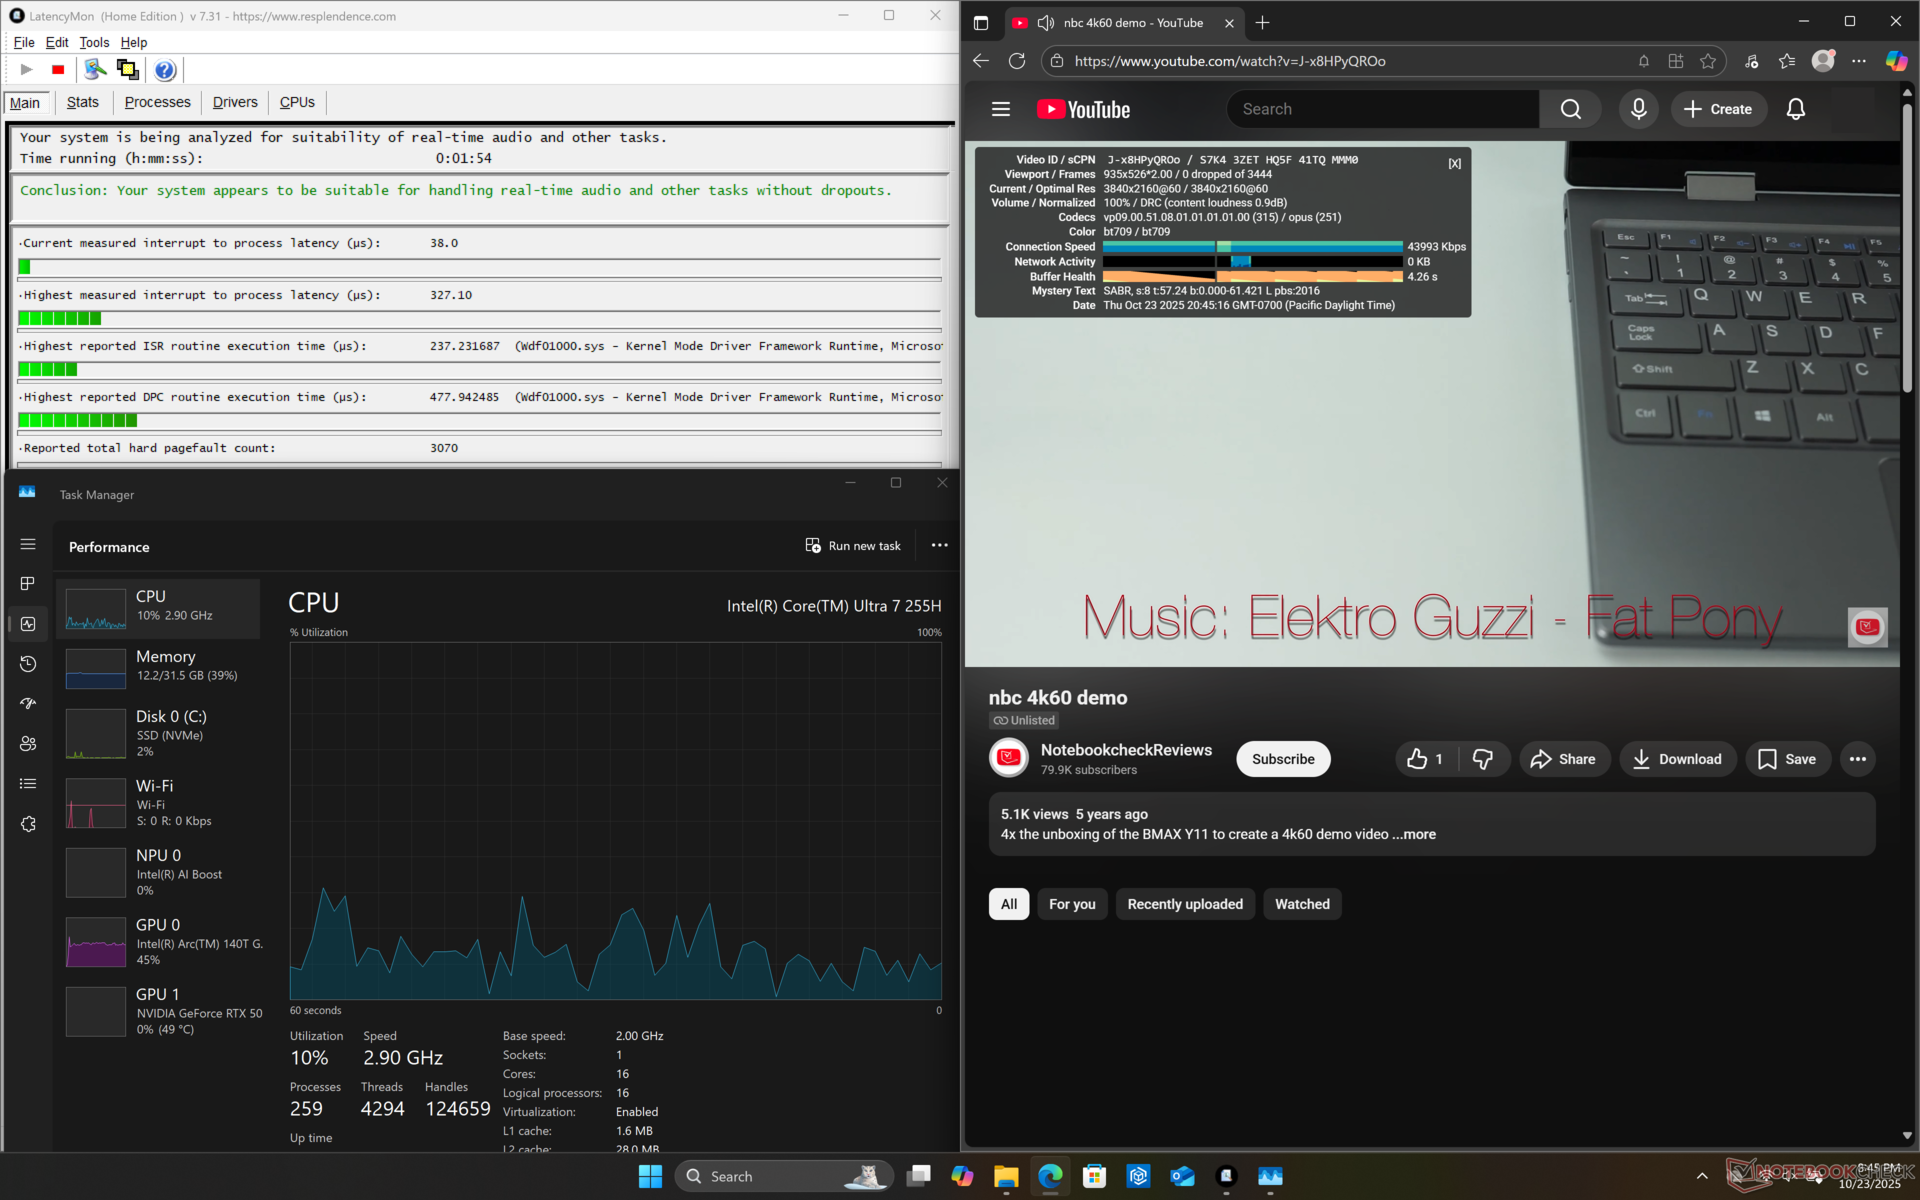

| DPC Latencies / LatencyMon - interrupt to process latency (max), Web, Youtube, Prime95 | |
| HP Spectre x360 16 RTX 4050 | |
| Lenovo Yoga Pro 9i 16 RTX 5070 | |
| Dell XPS 16 9640 | |
| Dell 16 Premium DA16250 | |
* ... smaller is better
存储设备
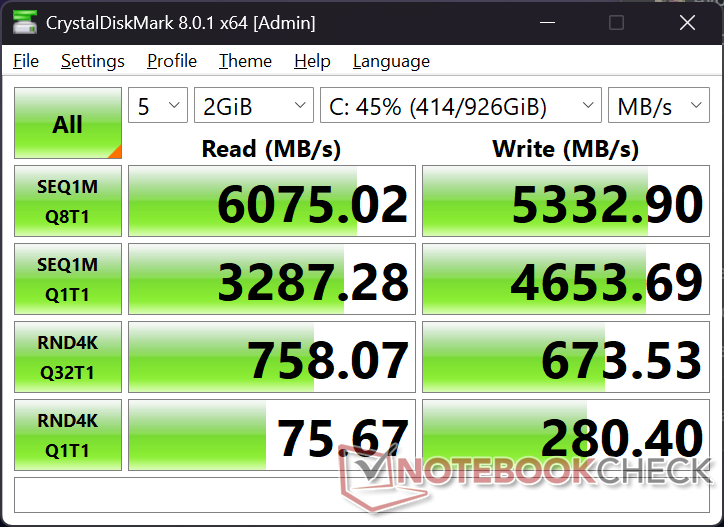
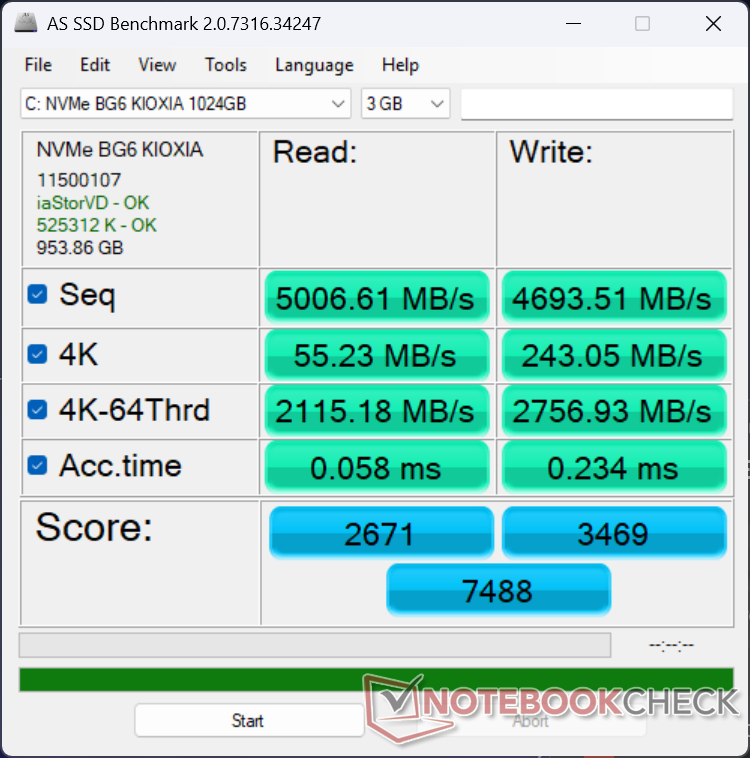

| Drive Performance rating - Percent | |
| Dell XPS 16 9640 | |
| Dell 16 Premium DA16250 | |
| Lenovo Yoga Pro 9i 16 RTX 5070 | |
| HP Spectre x360 16 RTX 4050 | |
| LG Gram Pro 16Z90TS-G.AU89G -11! | |
| Asus Zenbook S 16 UM5606-RK333W | |
* ... smaller is better
磁盘节流DiskSpd 读取循环,队列深度 8
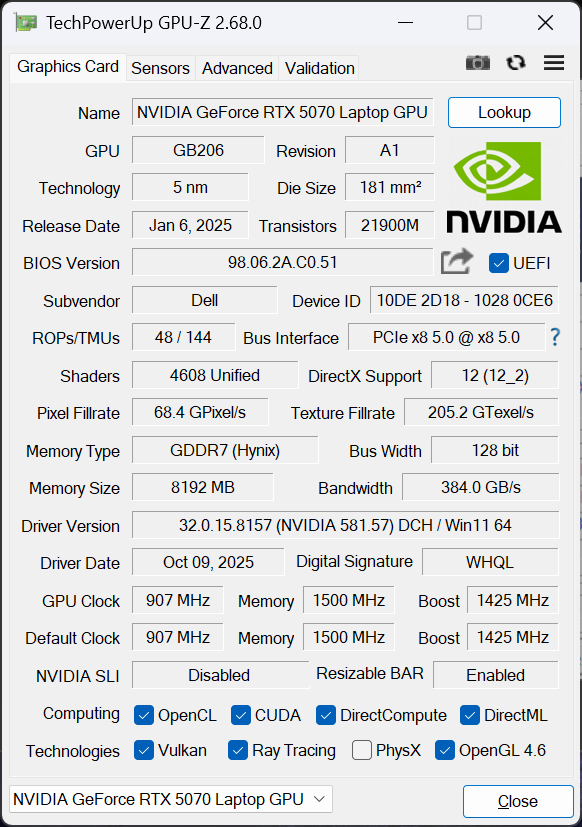
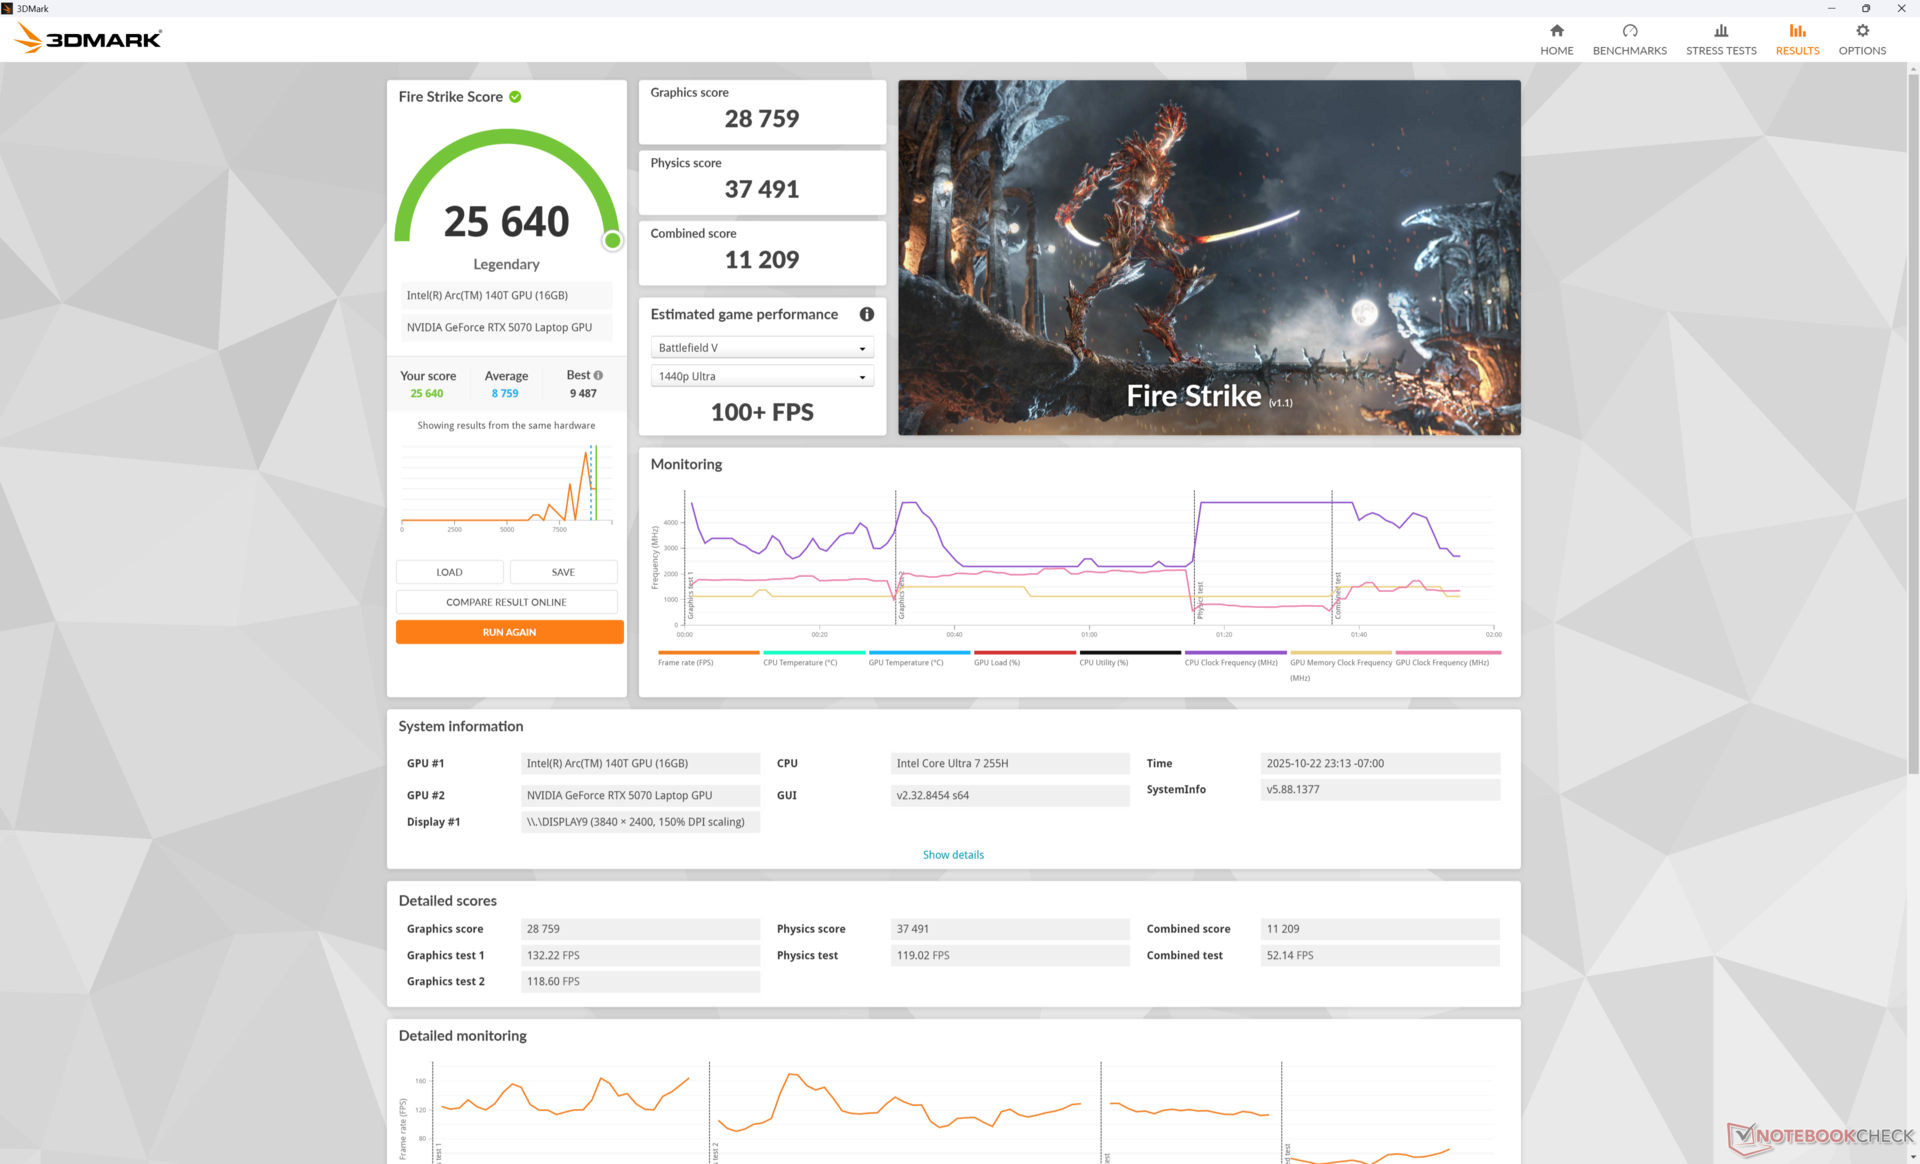
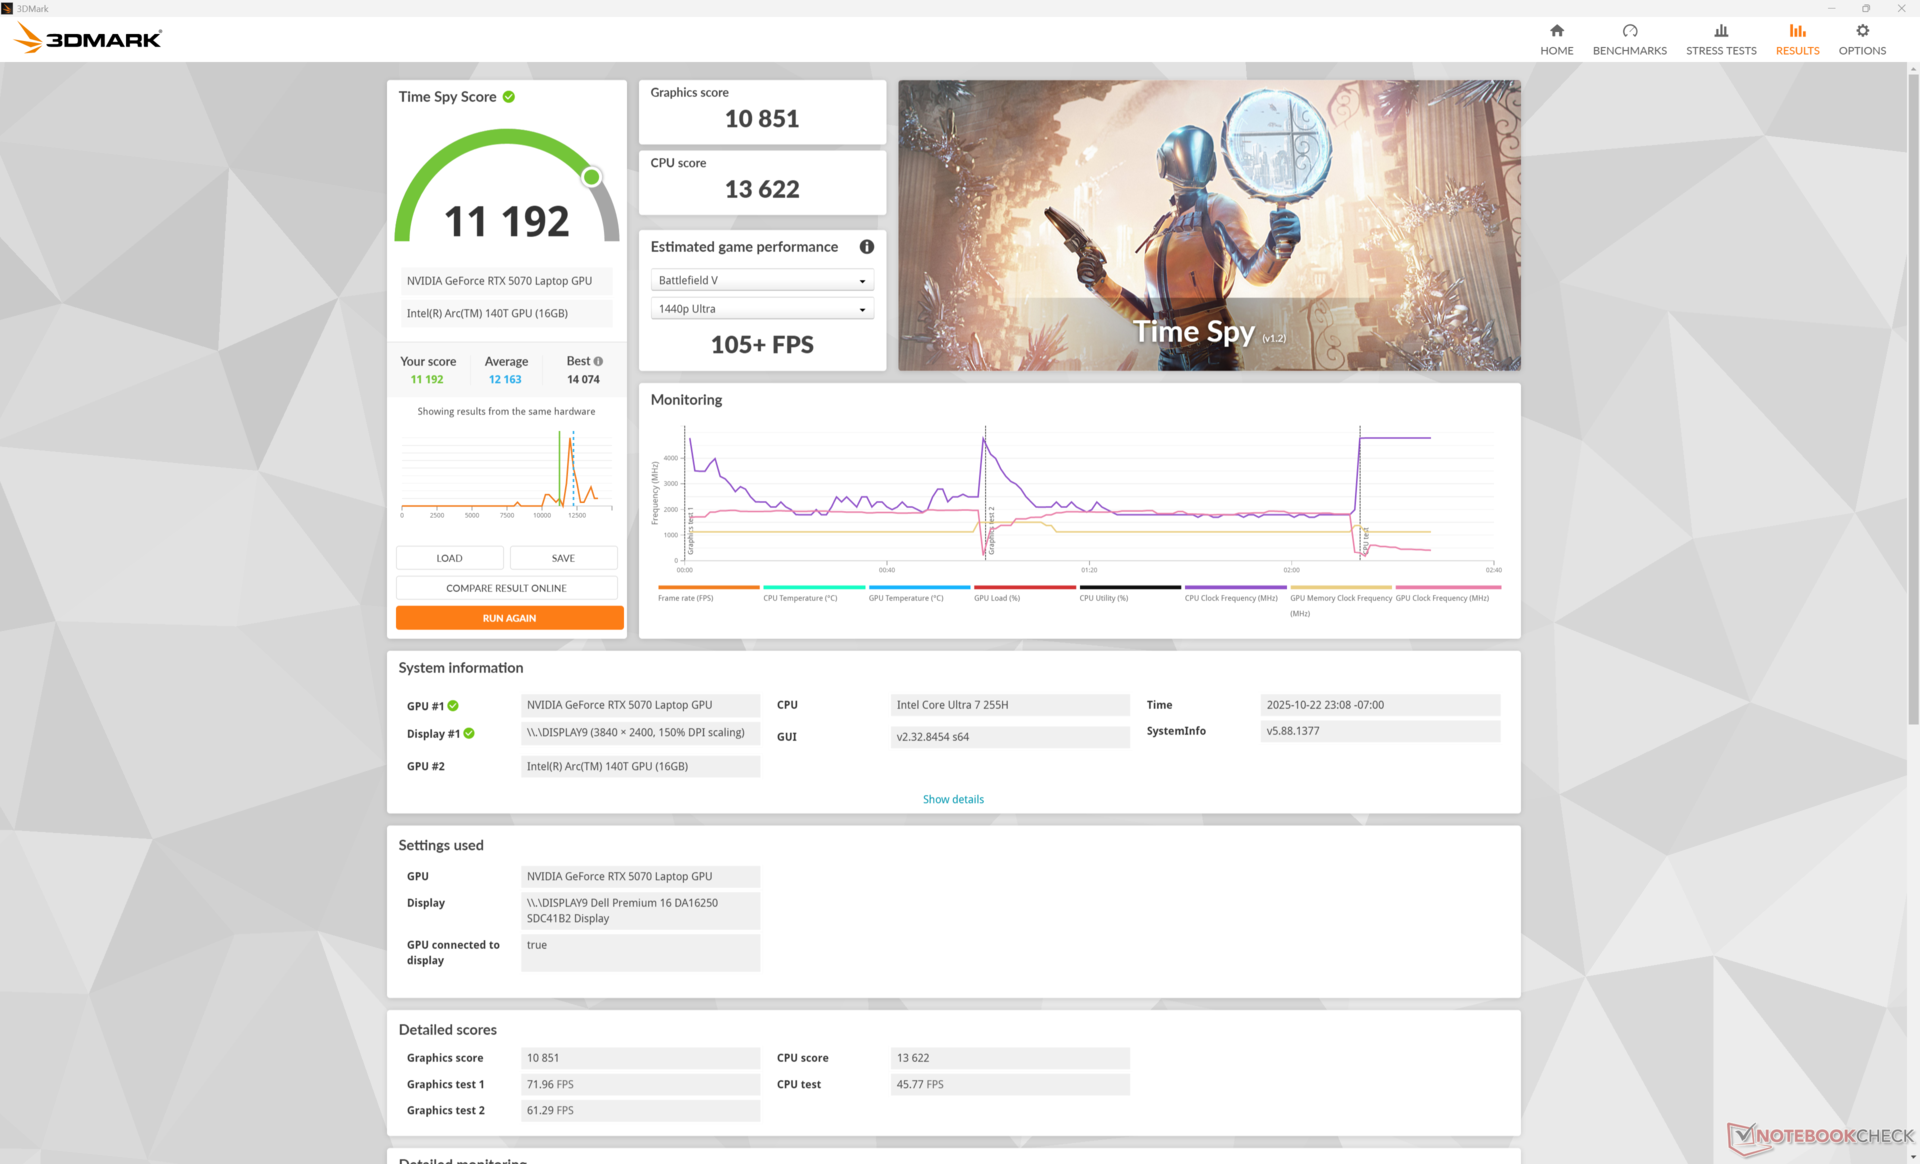
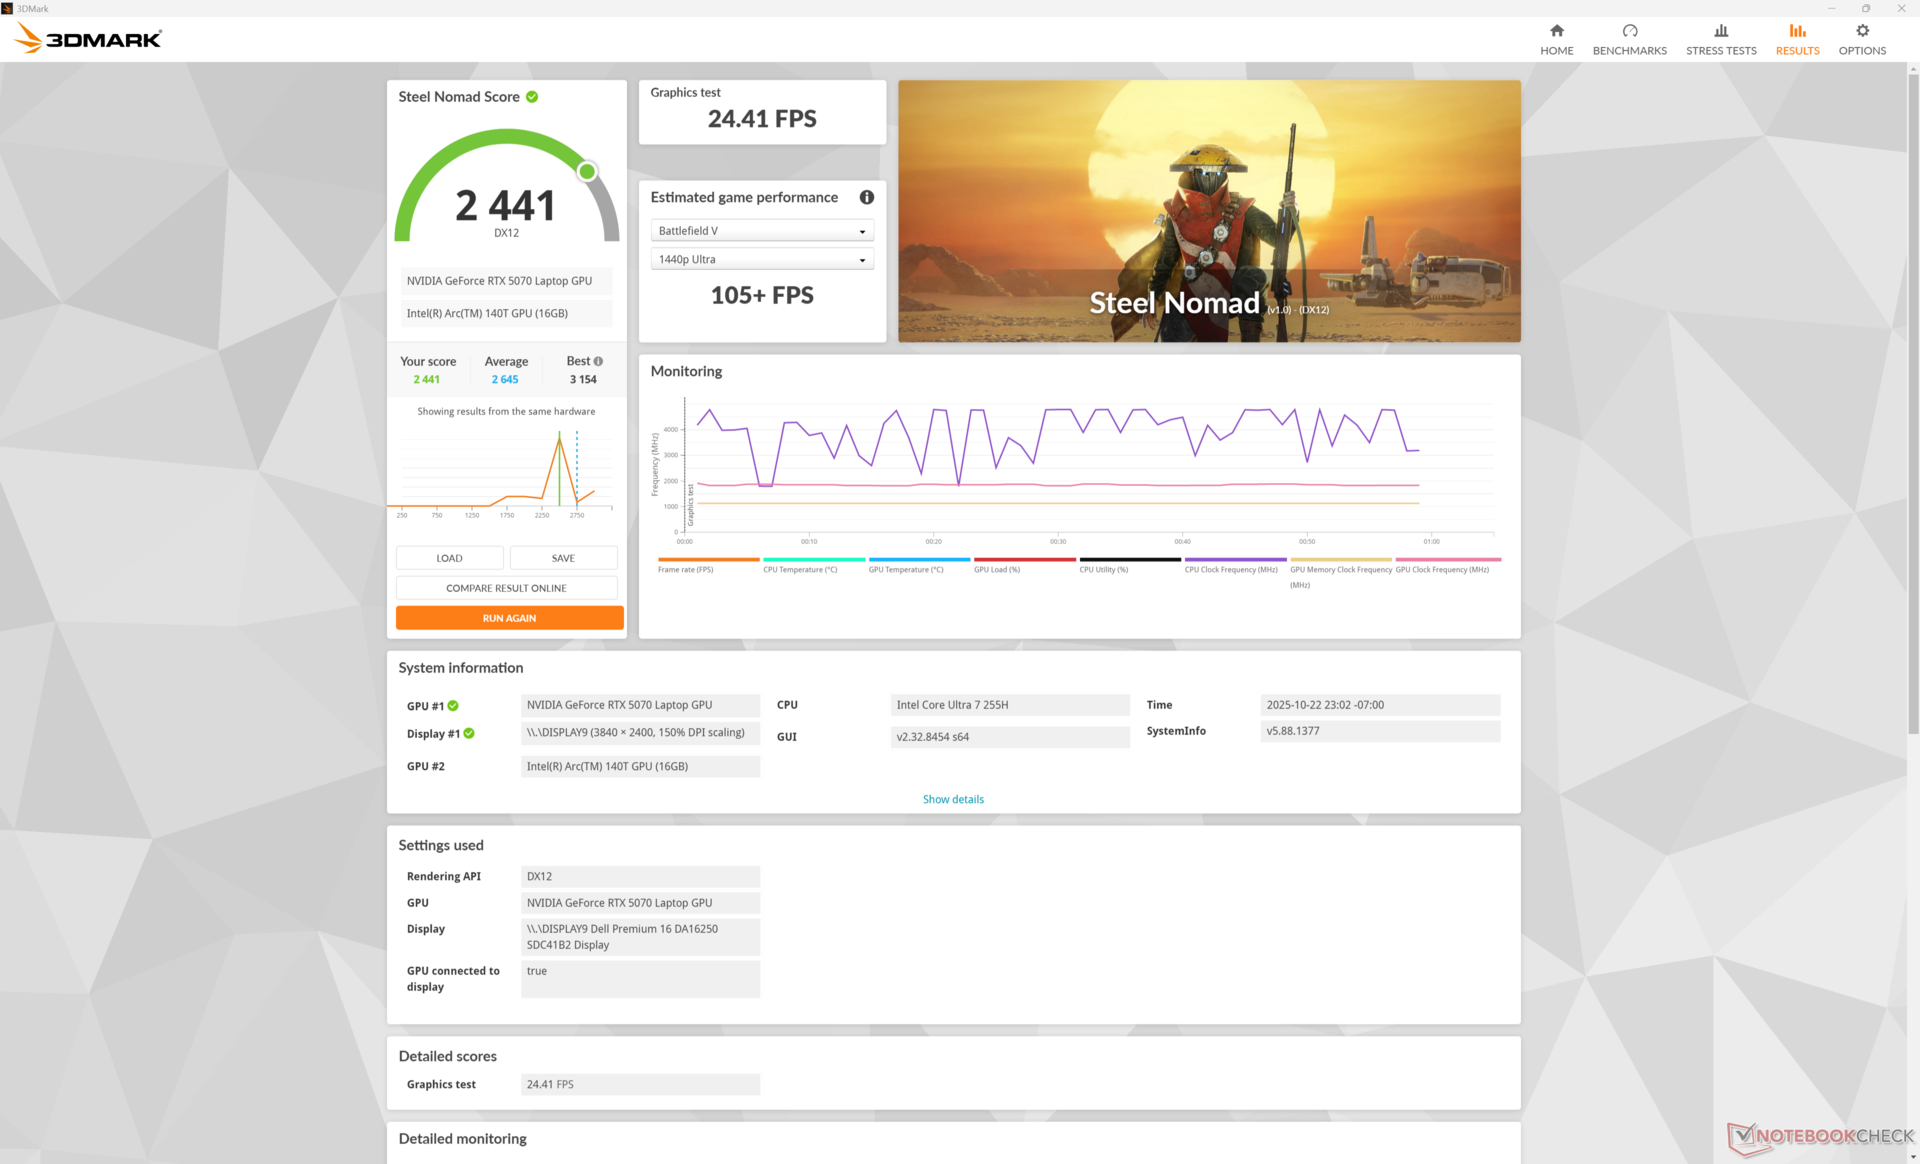
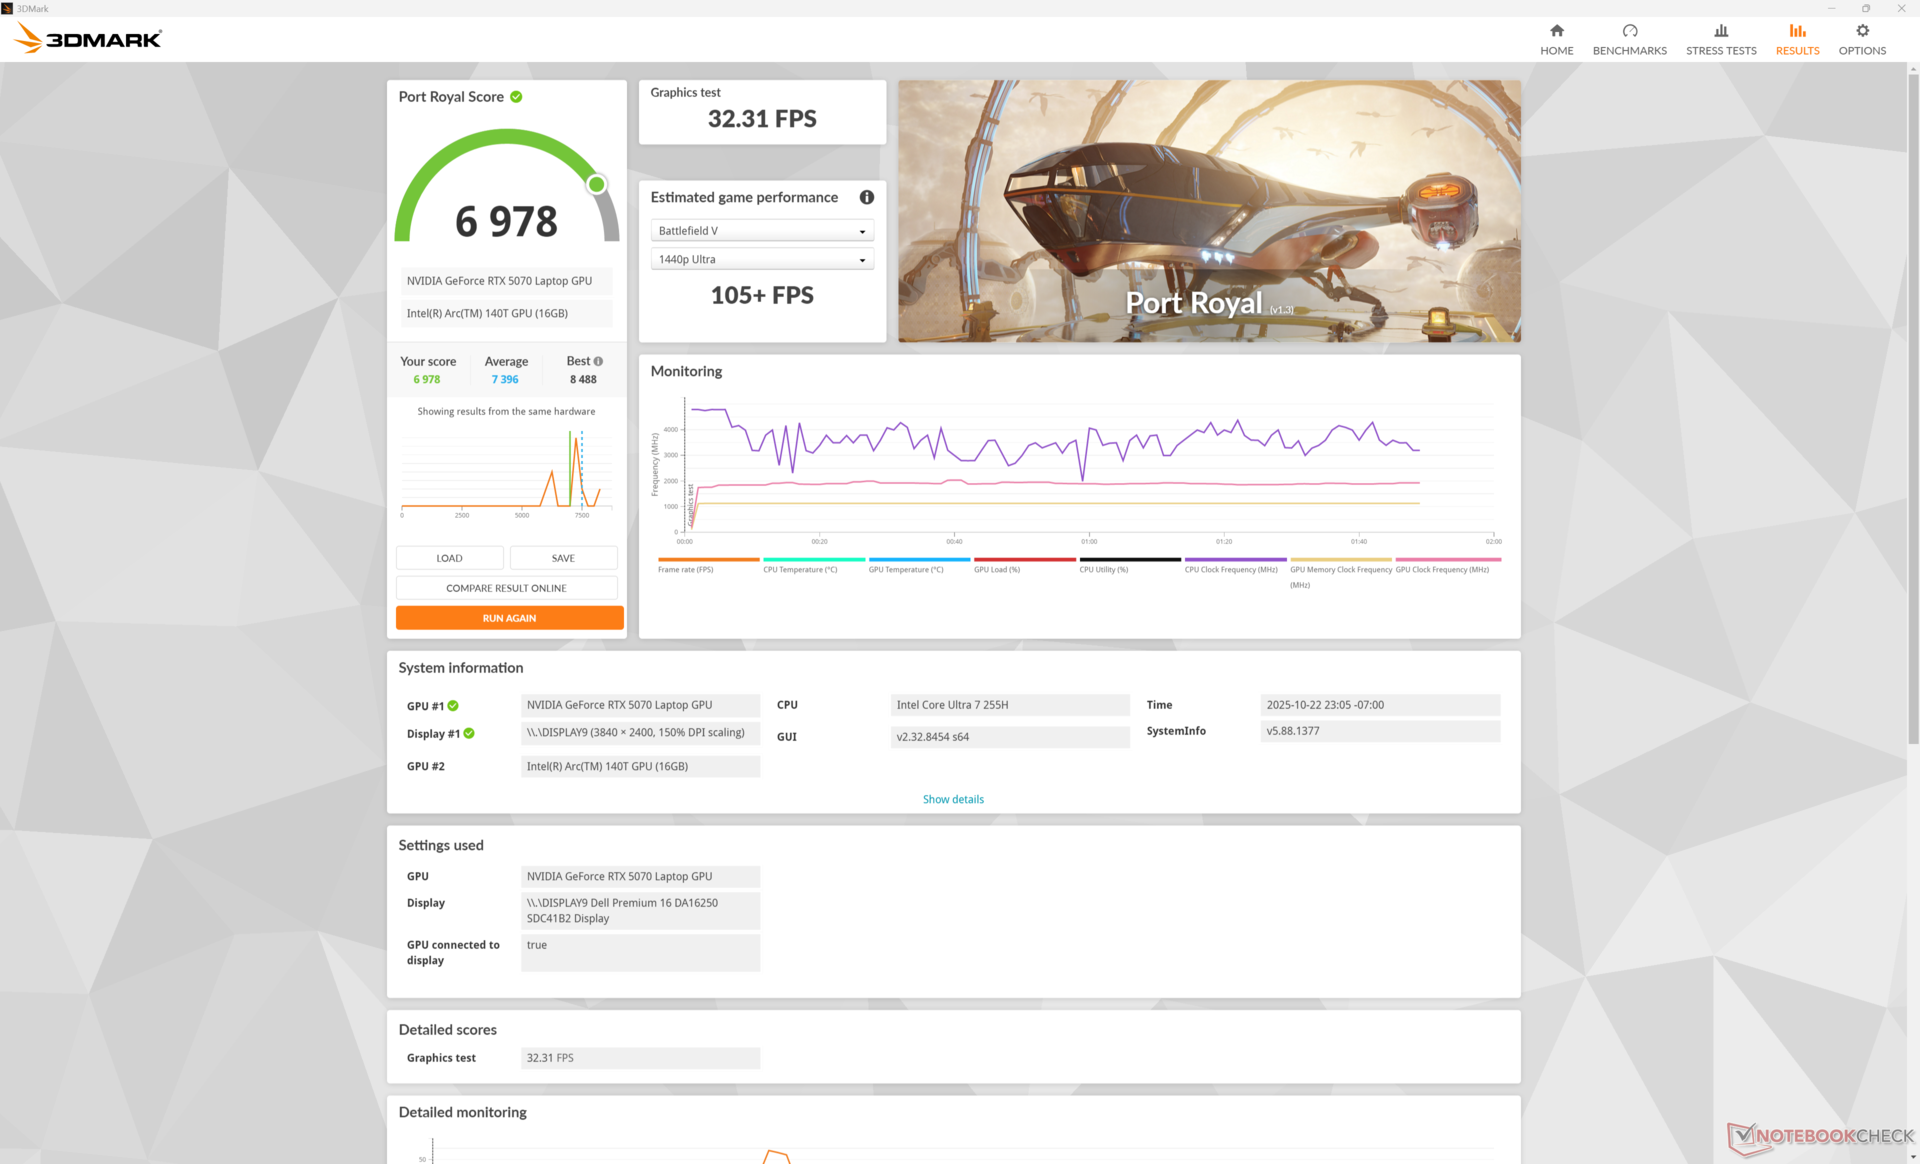
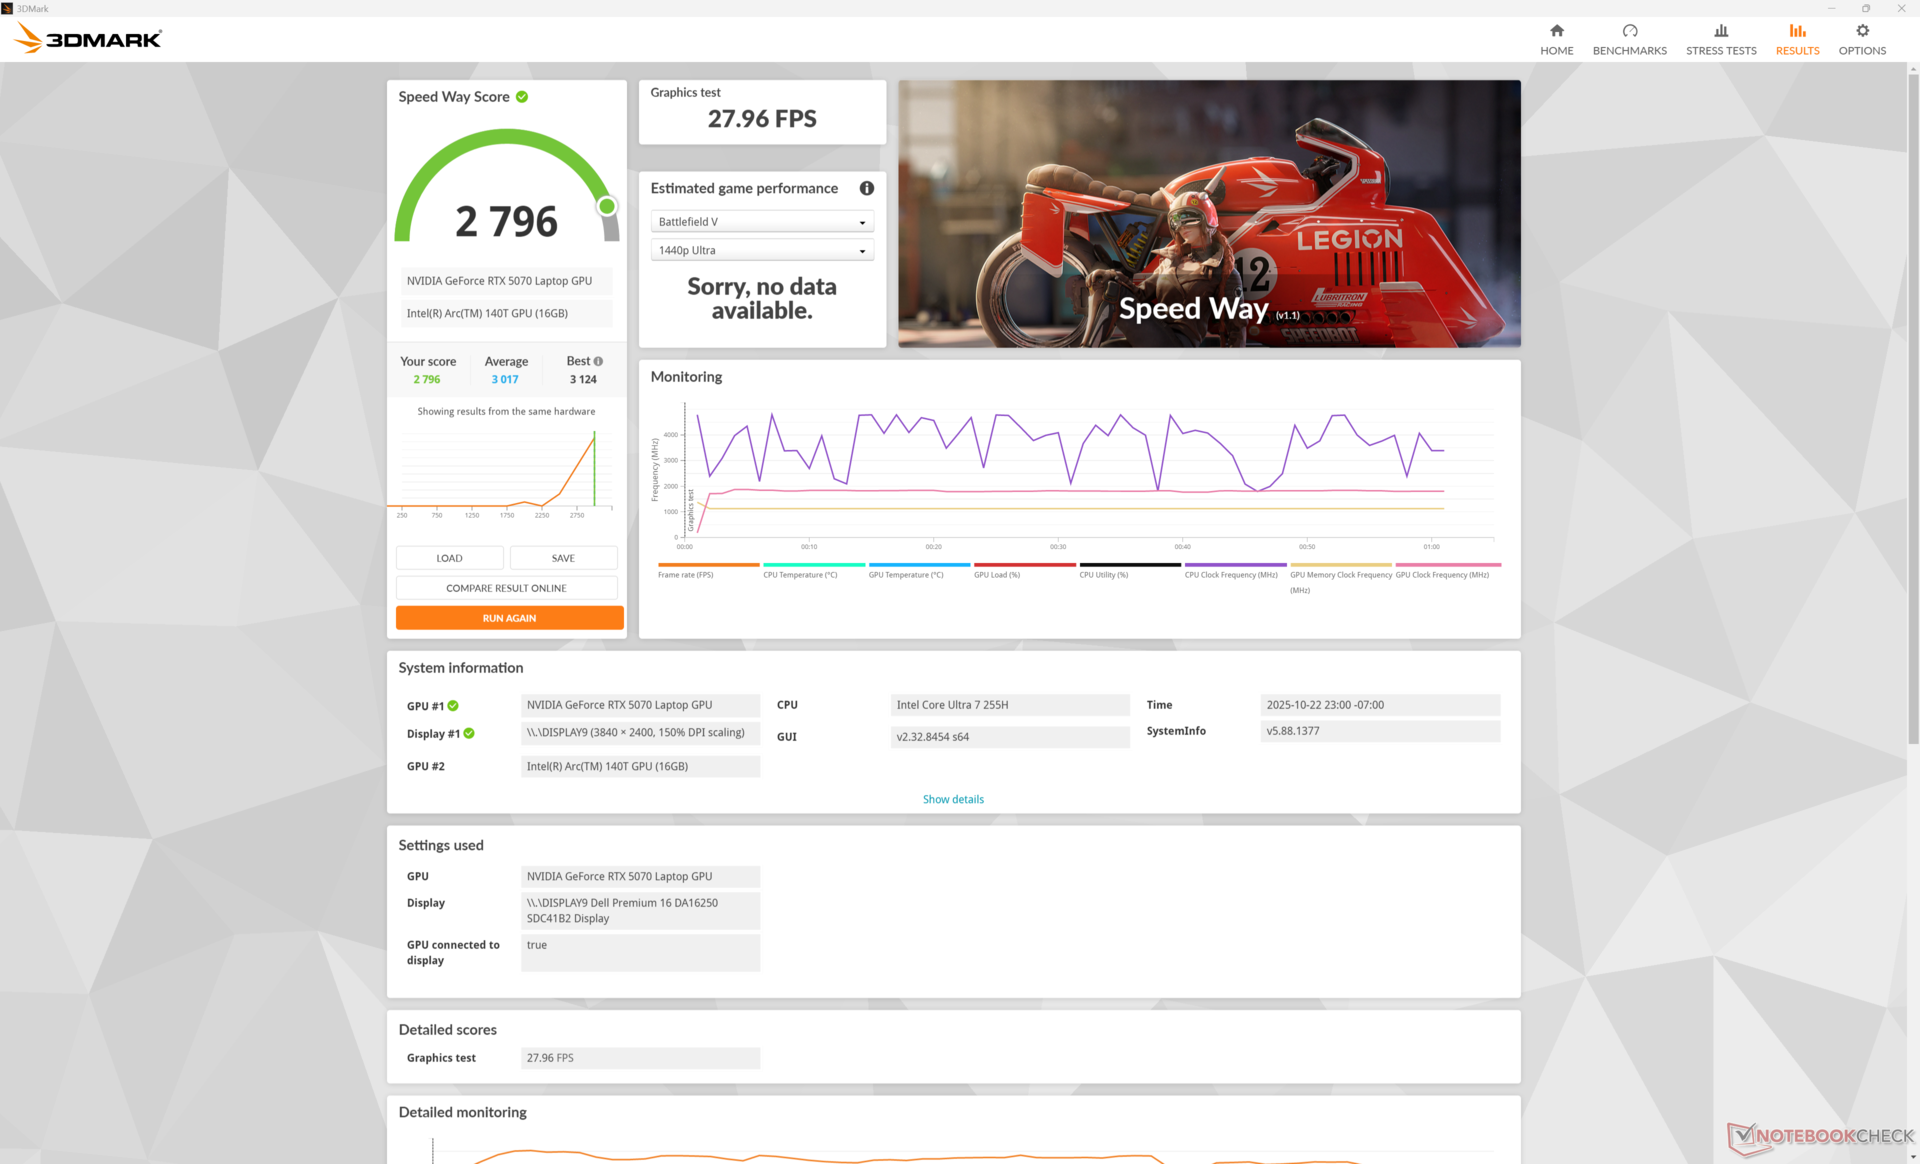
图形处理器性能
戴尔 16 Premium 的移动GeForce RTX 5070 GPU 运行速度比我们数据库中配备相同 RTX 5070 GPU 的普通笔记本电脑慢近 20%。 同样的 RTX 5070 GPU因为大多数配备相同 GPU 的笔记本电脑往往都是游戏笔记本电脑,具有较高的 TGP 目标。因此,传统光栅化性能更接近配备 RTX 5060.
对于 Blender 等专业任务,与其他 RTX 5070 笔记本电脑的性能差距平均缩小了约 10%。戴尔 16 Premium 首先是一款专业 PC,其次才是游戏笔记本电脑。
| 电源配置文件 | 图形得分 | 物理得分 | 综合得分 |
| 性能模式 | 28759 | 37491 | 11209 |
| 均衡模式 | 27915 (-3%) | 35948 (-4%) | 9874 (-12%) |
| 电池供电 | 25880 (-10%) | 32601 (-13%) | 11046 (-1%) |

| 3DMark 11 Performance | 32410 points | |
| 3DMark Cloud Gate Standard Score | 65334 points | |
| 3DMark Fire Strike Score | 25640 points | |
| 3DMark Time Spy Score | 11192 points | |
| 3DMark Steel Nomad Score | 2441 points | |
Help | ||
* ... smaller is better
游戏性能
与采用相同 GPU 的大多数其他笔记本电脑相比,游戏运行速度最多可降低 20%。例如,在联想 Yoga Pro 9i 16 上,《刺客信条:暗影》在所有测试设置下的运行速度都更快。
| Performance rating - Percent | |
| Lenovo Yoga Pro 9i 16 RTX 5070 | |
| Dell 16 Premium DA16250 | |
| Dell XPS 16 9640 | |
| HP Spectre x360 16 RTX 4050 | |
| Asus Zenbook S 16 UM5606-RK333W | |
| LG Gram Pro 16Z90TS-G.AU89G | |
| Cyberpunk 2077 - 1920x1080 Ultra Preset (FSR off) | |
| Lenovo Yoga Pro 9i 16 RTX 5070 | |
| Dell 16 Premium DA16250 | |
| Dell XPS 16 9640 | |
| HP Spectre x360 16 RTX 4050 | |
| Asus Zenbook S 16 UM5606-RK333W | |
| LG Gram Pro 16Z90TS-G.AU89G | |
| Baldur's Gate 3 - 1920x1080 Ultra Preset AA:T | |
| Dell 16 Premium DA16250 | |
| Dell XPS 16 9640 | |
| Lenovo Yoga Pro 9i 16 RTX 5070 | |
| HP Spectre x360 16 RTX 4050 | |
| Asus Zenbook S 16 UM5606-RK333W | |
| LG Gram Pro 16Z90TS-G.AU89G | |
| GTA V - 1920x1080 Highest AA:4xMSAA + FX AF:16x | |
| Lenovo Yoga Pro 9i 16 RTX 5070 | |
| Dell 16 Premium DA16250 | |
| Dell XPS 16 9640 | |
| HP Spectre x360 16 RTX 4050 | |
| Asus Zenbook S 16 UM5606-RK333W | |
| LG Gram Pro 16Z90TS-G.AU89G | |
| Final Fantasy XV Benchmark - 1920x1080 High Quality | |
| Lenovo Yoga Pro 9i 16 RTX 5070 | |
| Dell 16 Premium DA16250 | |
| Dell XPS 16 9640 | |
| HP Spectre x360 16 RTX 4050 | |
| LG Gram Pro 16Z90TS-G.AU89G | |
| Asus Zenbook S 16 UM5606-RK333W | |
| Strange Brigade - 1920x1080 ultra AA:ultra AF:16 | |
| Lenovo Yoga Pro 9i 16 RTX 5070 | |
| Dell 16 Premium DA16250 | |
| Dell XPS 16 9640 | |
| HP Spectre x360 16 RTX 4050 | |
| LG Gram Pro 16Z90TS-G.AU89G | |
| Asus Zenbook S 16 UM5606-RK333W | |
| Dota 2 Reborn - 1920x1080 ultra (3/3) best looking | |
| Lenovo Yoga Pro 9i 16 RTX 5070 | |
| Dell 16 Premium DA16250 | |
| HP Spectre x360 16 RTX 4050 | |
| Dell XPS 16 9640 | |
| LG Gram Pro 16Z90TS-G.AU89G | |
| Asus Zenbook S 16 UM5606-RK333W | |
| X-Plane 11.11 - 1920x1080 high (fps_test=3) | |
| Lenovo Yoga Pro 9i 16 RTX 5070 | |
| Dell 16 Premium DA16250 | |
| Dell XPS 16 9640 | |
| Dell XPS 16 9640 | |
| HP Spectre x360 16 RTX 4050 | |
| Asus Zenbook S 16 UM5606-RK333W | |
| LG Gram Pro 16Z90TS-G.AU89G | |
| Assassin's Creed Shadows | |
| 1920x1080 Low | |
| Average NVIDIA GeForce RTX 5070 Laptop (39 - 100, n=9) | |
| Lenovo Yoga Pro 9i 16 RTX 5070 | |
| Dell 16 Premium DA16250 | |
| 1920x1080 Medium | |
| Average NVIDIA GeForce RTX 5070 Laptop (36 - 93, n=10) | |
| Lenovo Yoga Pro 9i 16 RTX 5070 | |
| Dell 16 Premium DA16250 | |
| 1920x1080 High | |
| Average NVIDIA GeForce RTX 5070 Laptop (32 - 77, n=11) | |
| Lenovo Yoga Pro 9i 16 RTX 5070 | |
| Dell 16 Premium DA16250 | |
| 1920x1080 Ultra High | |
| Lenovo Yoga Pro 9i 16 RTX 5070 | |
| Average NVIDIA GeForce RTX 5070 Laptop (25 - 53, n=12) | |
| Dell 16 Premium DA16250 | |
| 2560x1440 Ultra High | |
| Average NVIDIA GeForce RTX 5070 Laptop (22 - 40, n=12) | |
| Lenovo Yoga Pro 9i 16 RTX 5070 | |
| Dell 16 Premium DA16250 | |
| 2560x1440 Ultra High + DLSS Quality | |
| Average NVIDIA GeForce RTX 5070 Laptop (25 - 45, n=6) | |
| Dell 16 Premium DA16250 | |
| 2560x1440 Ultra High + GI + DLSS Quality + FG | |
| Average NVIDIA GeForce RTX 5070 Laptop (33 - 57, n=4) | |
| Dell 16 Premium DA16250 | |
| Monster Hunter Wilds | |
| 1920x1080 lowest, no upscaling | |
| Average NVIDIA GeForce RTX 5070 Laptop (69.1 - 86.5, n=3) | |
| Dell 16 Premium DA16250 | |
| 1920x1080 medium, no upscaling | |
| Average NVIDIA GeForce RTX 5070 Laptop (61.6 - 78.2, n=4) | |
| Dell 16 Premium DA16250 | |
| Black Myth: Wukong | |
| 1280x720 low TSR 100 | |
| Average NVIDIA GeForce RTX 5070 Laptop (127 - 206, n=2) | |
| Dell 16 Premium DA16250 | |
| 1920x1080 low TSR 100 | |
| Average NVIDIA GeForce RTX 5070 Laptop (83 - 197, n=4) | |
| Dell 16 Premium DA16250 | |
| 1920x1080 medium TSR 100 | |
| Average NVIDIA GeForce RTX 5070 Laptop (63 - 112, n=4) | |
| Dell 16 Premium DA16250 | |
| 1920x1080 high TSR 100 | |
| Average NVIDIA GeForce RTX 5070 Laptop (49 - 86, n=5) | |
| Dell 16 Premium DA16250 | |
| 1920x1080 cinematic TSR 100 | |
| Average NVIDIA GeForce RTX 5070 Laptop (28 - 44, n=5) | |
| Dell 16 Premium DA16250 | |
| 2560x1440 cinematic TSR 100 | |
| Average NVIDIA GeForce RTX 5070 Laptop (20 - 27, n=5) | |
| Dell 16 Premium DA16250 | |
| 2560x1440 cinematic DLSS 68 | |
| Average NVIDIA GeForce RTX 5070 Laptop (31 - 41, n=5) | |
| Dell 16 Premium DA16250 | |
| 2560x1440 cinematic RT: Very High DLSS 68 FG | |
| Average NVIDIA GeForce RTX 5070 Laptop (18 - 45, n=4) | |
| Dell 16 Premium DA16250 | |
| Alan Wake 2 | |
| 1280x720 Low Preset | |
| Dell 16 Premium DA16250 | |
| Average NVIDIA GeForce RTX 5070 Laptop (106.8 - 115.2, n=2) | |
| 1920x1080 Low Preset | |
| Average NVIDIA GeForce RTX 5070 Laptop (68.8 - 86.1, n=4) | |
| Dell 16 Premium DA16250 | |
| 1920x1080 Medium Preset | |
| Average NVIDIA GeForce RTX 5070 Laptop (68.4 - 82.4, n=4) | |
| Dell 16 Premium DA16250 | |
| 1920x1080 High Preset | |
| Average NVIDIA GeForce RTX 5070 Laptop (60 - 72.5, n=6) | |
| Dell 16 Premium DA16250 | |
| 2560x1440 High Preset | |
| Average NVIDIA GeForce RTX 5070 Laptop (35.8 - 45.1, n=6) | |
| Dell 16 Premium DA16250 | |
赛博朋克 2077》超 FPS 图表
| low | med. | high | ultra | QHD DLSS | QHD | 4K | |
|---|---|---|---|---|---|---|---|
| GTA V (2015) | 185.6 | 180.9 | 175.7 | 123.7 | 96.9 | ||
| Dota 2 Reborn (2015) | 168.4 | 152.9 | 147.8 | 140.4 | 106.4 | ||
| Final Fantasy XV Benchmark (2018) | 218 | 148.7 | 113.1 | 82.5 | |||
| X-Plane 11.11 (2018) | 114.3 | 110 | 91.9 | 65.7 | |||
| Strange Brigade (2018) | 507 | 282 | 232 | 204 | 140.2 | ||
| Baldur's Gate 3 (2023) | 149.5 | 125.5 | 109.8 | 109 | 107.3 | 73.8 | |
| Cyberpunk 2077 (2023) | 134.9 | 107.8 | 91 | 81.5 | 61.4 | 51.9 | |
| Alan Wake 2 (2023) | 68.8 | 68.4 | 60 | 35.8 | |||
| F1 24 (2024) | 242 | 241 | 186 | 63.8 | 62.9 | 40.3 | |
| Black Myth: Wukong (2024) | 83 | 63 | 49 | 28 | 31 | 20 | |
| Monster Hunter Wilds (2025) | 69.1 | 61.6 | |||||
| Assassin's Creed Shadows (2025) | 61 | 57 | 49 | 33 | 35 | 28 |
排放量
系统噪音
由于冷却解决方案和电源包络线保持不变,因此风扇噪音表现和上限与去年的机型基本相同。
Noise level
| Idle |
| 23.2 / 23.2 / 26.6 dB(A) |
| Load |
| 39.4 / 48.9 dB(A) |
 | ||
30 dB silent 40 dB(A) audible 50 dB(A) loud |
||
min: | ||
| Dell 16 Premium DA16250 Ultra 7 255H, GeForce RTX 5070 Laptop | Dell XPS 16 9640 Ultra 7 155H, GeForce RTX 4070 Laptop GPU | HP Spectre x360 16 RTX 4050 Ultra 7 155H, GeForce RTX 4050 Laptop GPU | Lenovo Yoga Pro 9i 16 RTX 5070 Ultra 9 285H, GeForce RTX 5070 Laptop | Asus Zenbook S 16 UM5606-RK333W Ryzen AI 9 HX 370, Radeon 890M | LG Gram Pro 16Z90TS-G.AU89G Core Ultra 7 256V, Arc 140V | |
|---|---|---|---|---|---|---|
| Noise | -4% | 11% | -5% | 6% | -1% | |
| off / environment * (dB) | 23.2 | 24.5 -6% | 23.3 -0% | 24.1 -4% | 24.7 -6% | 25.2 -9% |
| Idle Minimum * (dB) | 23.2 | 24.5 -6% | 23.6 -2% | 24.1 -4% | 24.7 -6% | 25.2 -9% |
| Idle Average * (dB) | 23.2 | 24.5 -6% | 23.6 -2% | 24.1 -4% | 24.7 -6% | 25.2 -9% |
| Idle Maximum * (dB) | 26.6 | 27.5 -3% | 23.6 11% | 25.1 6% | 26.4 1% | 27.7 -4% |
| Load Average * (dB) | 39.4 | 39.6 -1% | 29.2 26% | 44.2 -12% | 35.7 9% | |
| Cyberpunk 2077 ultra * (dB) | 47.3 | 52.7 -11% | 36.8 22% | 42.6 10% | ||
| Load Maximum * (dB) | 48.9 | 49.7 -2% | 32.1 34% | 52.7 -8% | 36.8 25% | 42.7 13% |
| Witcher 3 ultra * (dB) | 49.7 | 32.1 |
* ... smaller is better
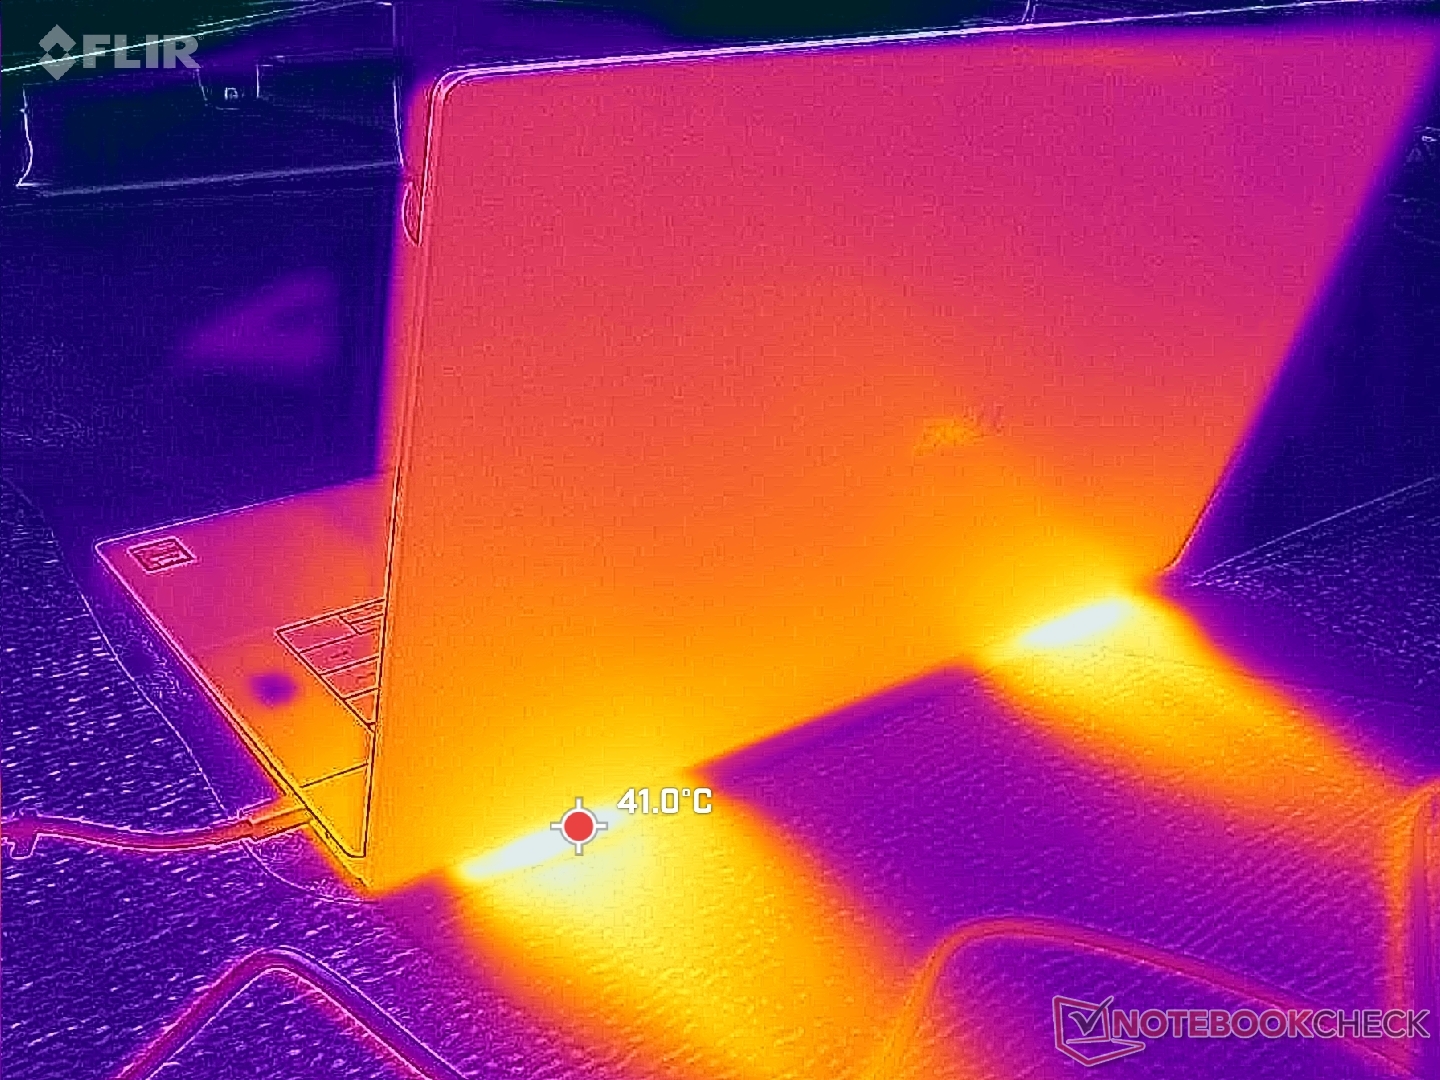
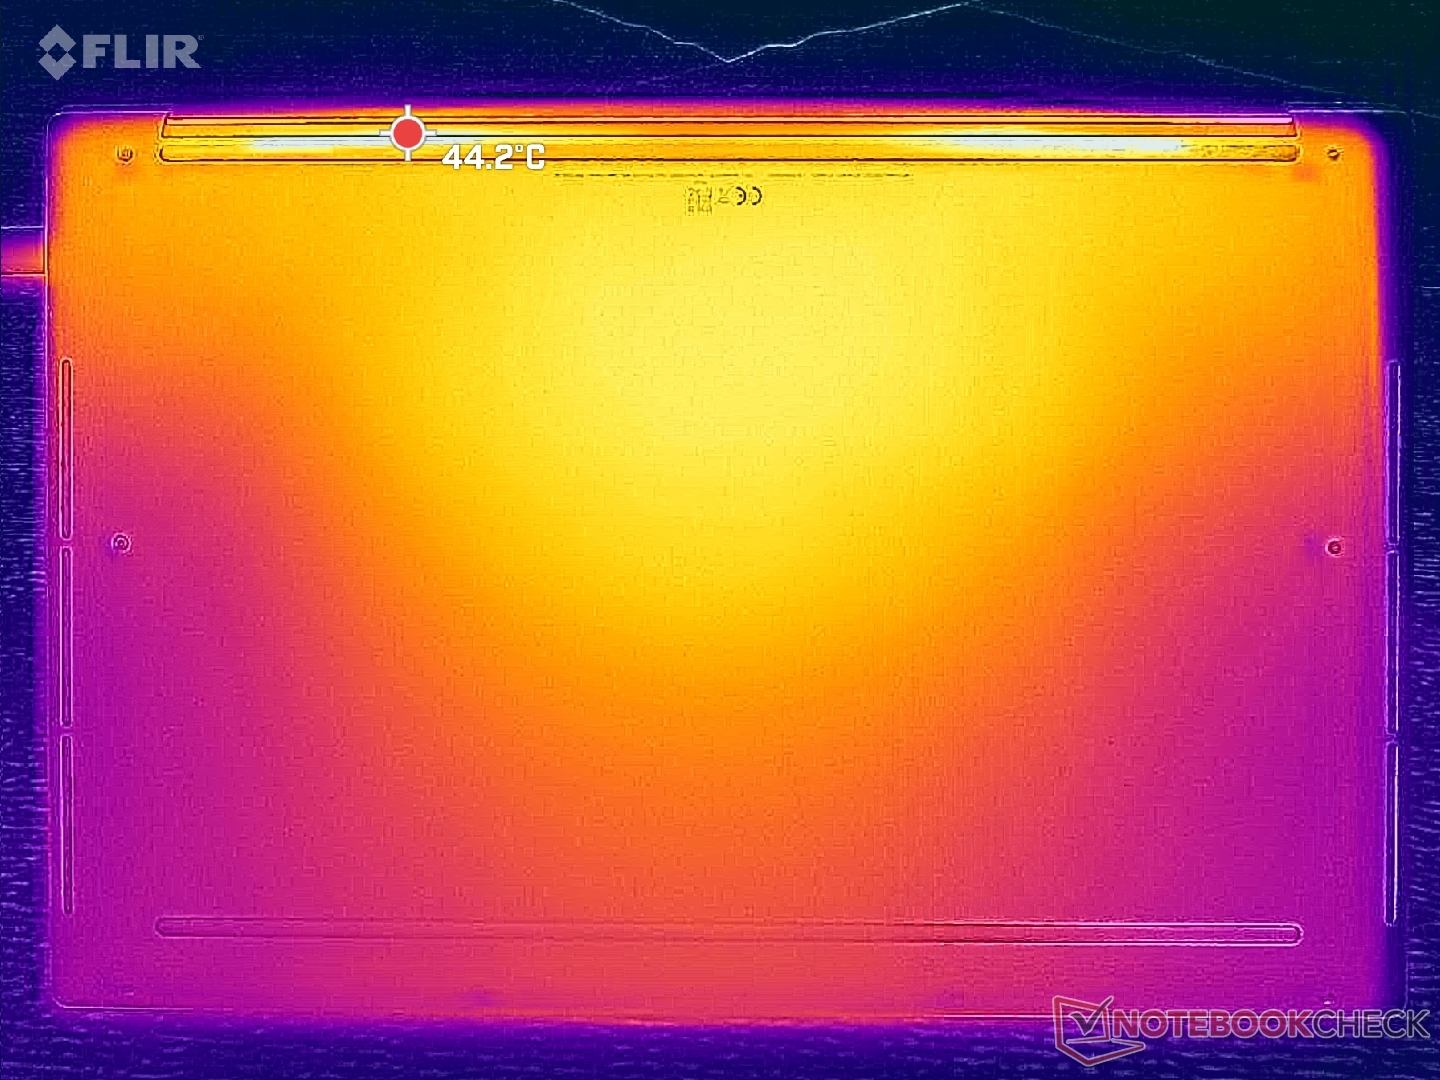
温度
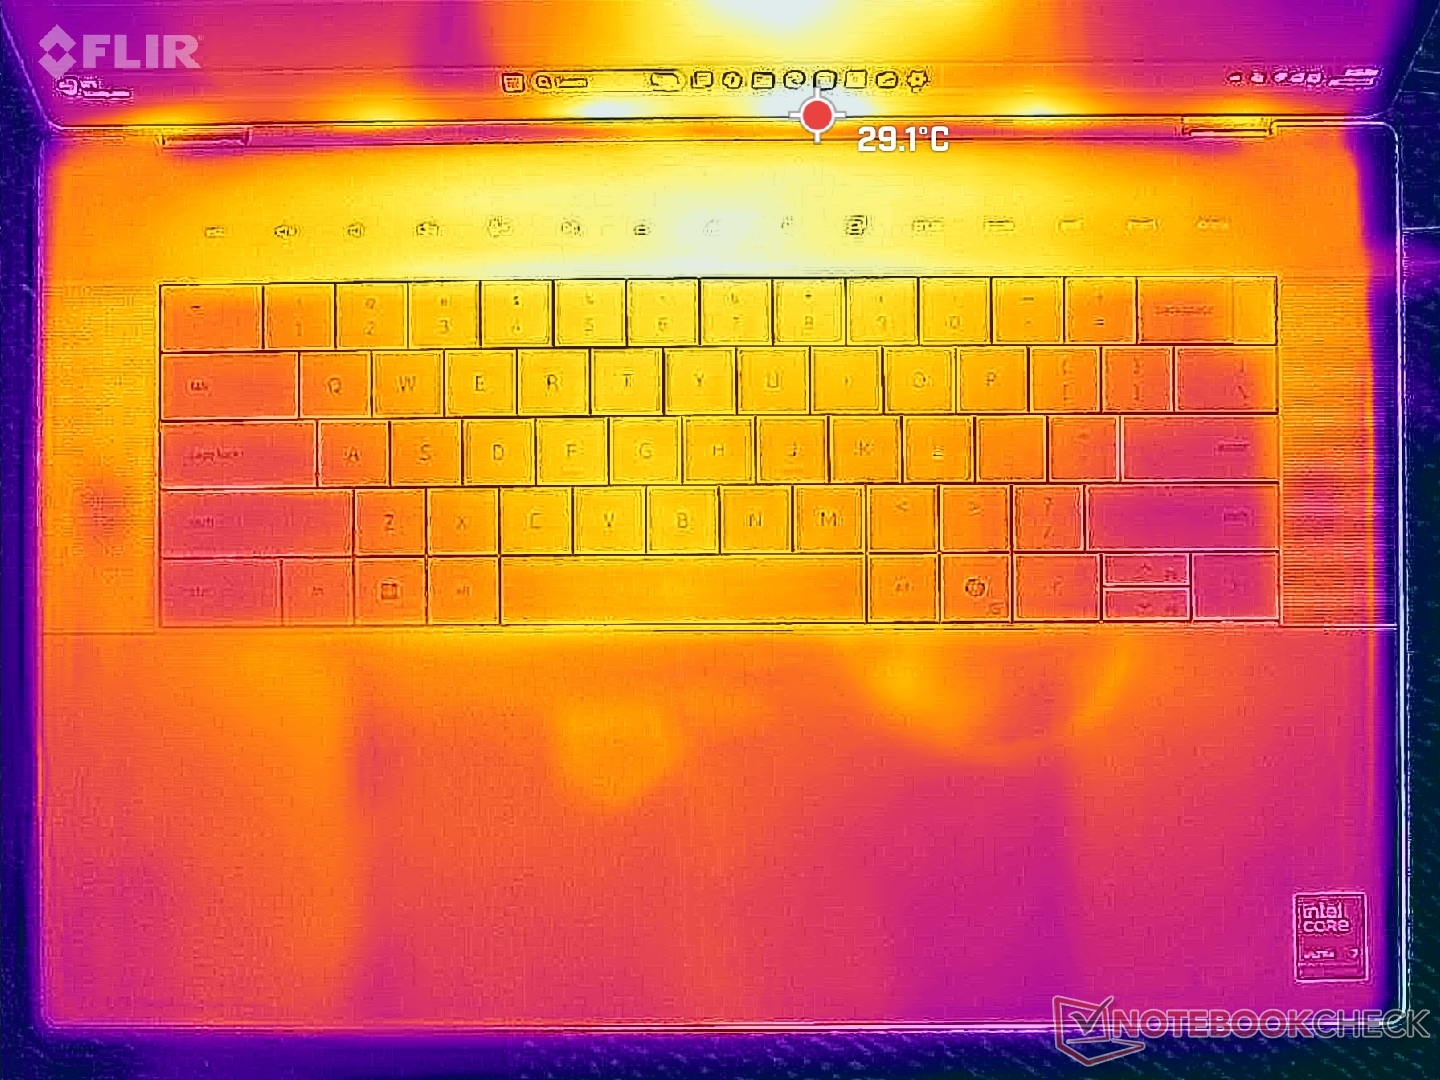
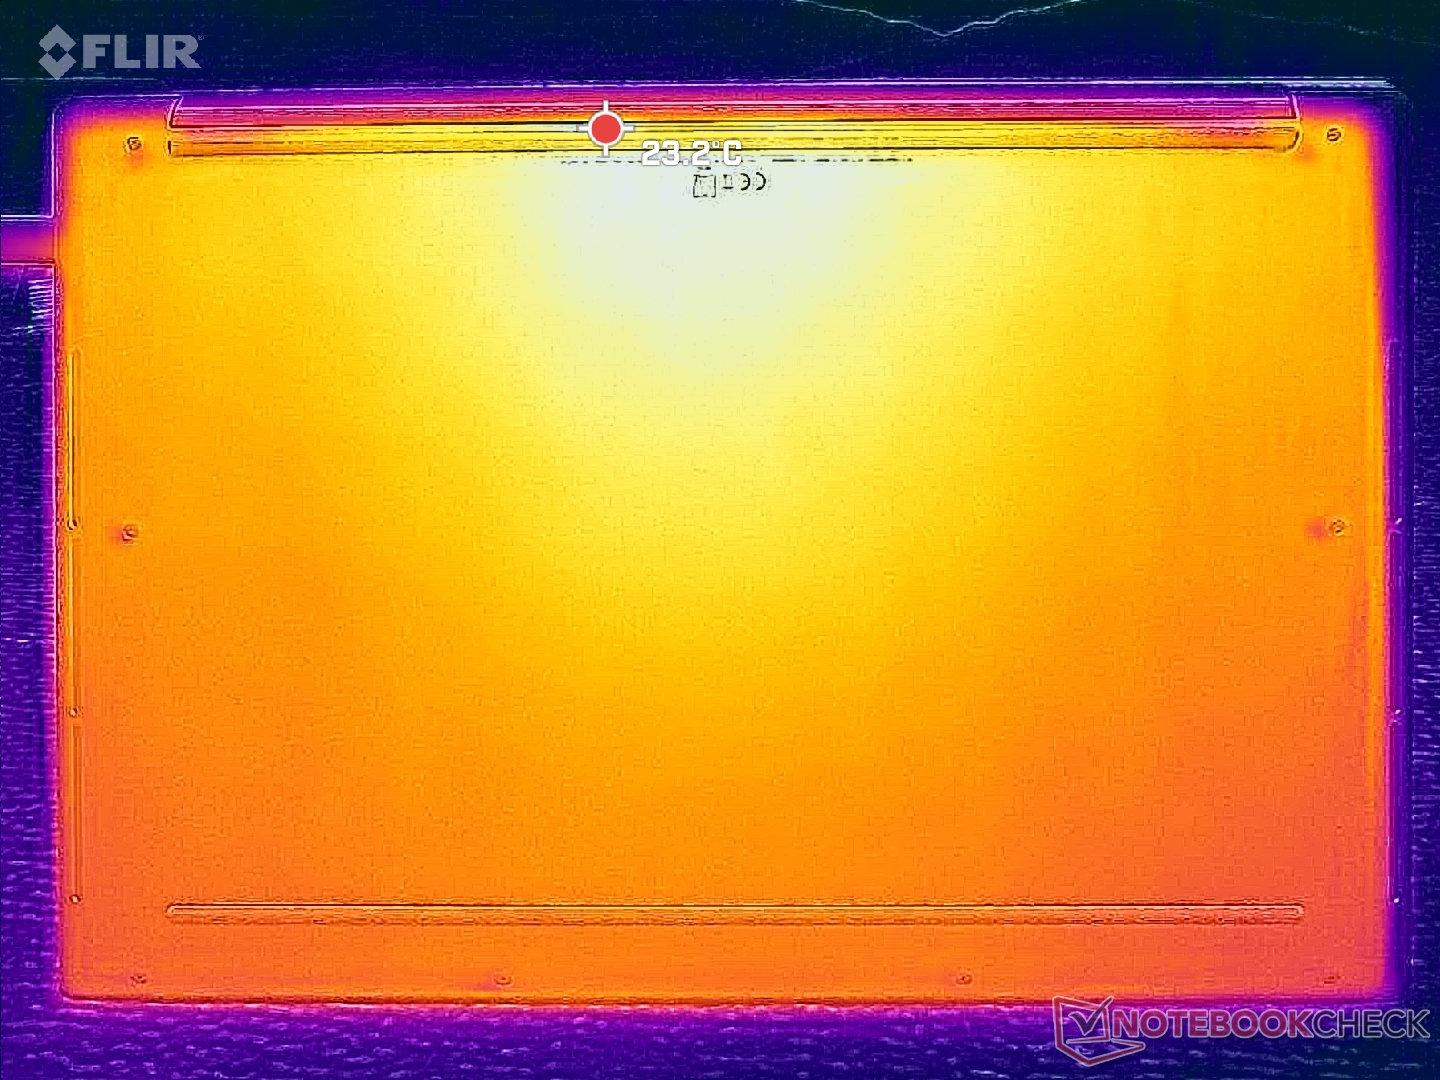
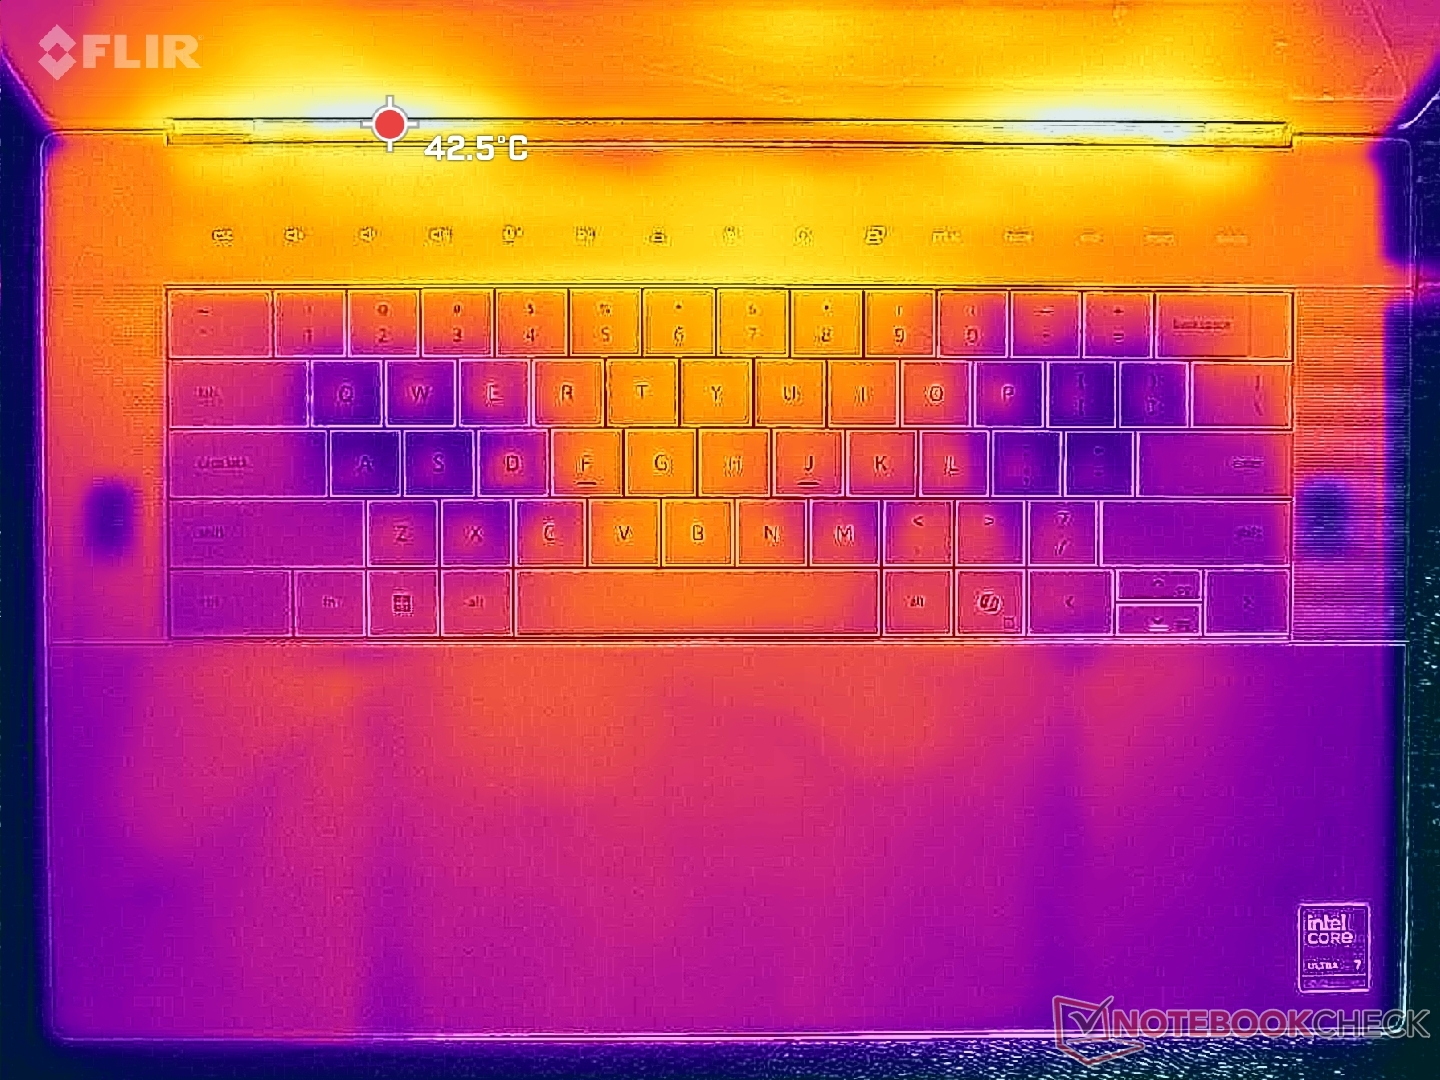
在运行高负载时,底盖上通风口附近的热点温度可达近 45 摄氏度。我们不禁要问,增加通风孔是否能改善整体温度,但戴尔显然优先考虑了更简洁的无通风孔视觉设计,就像 MacBook 系列一样。
(+) The maximum temperature on the upper side is 36.8 °C / 98 F, compared to the average of 36.8 °C / 98 F, ranging from 21 to 71 °C for the class Multimedia.
(+) The bottom heats up to a maximum of 34.8 °C / 95 F, compared to the average of 39.1 °C / 102 F
(+) In idle usage, the average temperature for the upper side is 28.7 °C / 84 F, compared to the device average of 31.3 °C / 88 F.
(+) The palmrests and touchpad are cooler than skin temperature with a maximum of 28.6 °C / 83.5 F and are therefore cool to the touch.
(±) The average temperature of the palmrest area of similar devices was 28.7 °C / 83.7 F (+0.1 °C / 0.2 F).
| Dell 16 Premium DA16250 Ultra 7 255H, GeForce RTX 5070 Laptop | Dell XPS 16 9640 Ultra 7 155H, GeForce RTX 4070 Laptop GPU | HP Spectre x360 16 RTX 4050 Ultra 7 155H, GeForce RTX 4050 Laptop GPU | Lenovo Yoga Pro 9i 16 RTX 5070 Ultra 9 285H, GeForce RTX 5070 Laptop | Asus Zenbook S 16 UM5606-RK333W Ryzen AI 9 HX 370, Radeon 890M | LG Gram Pro 16Z90TS-G.AU89G Core Ultra 7 256V, Arc 140V | |
|---|---|---|---|---|---|---|
| Heat | 2% | -4% | -7% | -19% | -5% | |
| Maximum Upper Side * (°C) | 36.8 | 39.4 -7% | 39.6 -8% | 41.8 -14% | 46.9 -27% | 40.5 -10% |
| Maximum Bottom * (°C) | 34.8 | 36.9 -6% | 39.2 -13% | 47.9 -38% | 53.5 -54% | 45 -29% |
| Idle Upper Side * (°C) | 31.2 | 28.2 10% | 29 7% | 26.3 16% | 29.5 5% | 27.1 13% |
| Idle Bottom * (°C) | 30.8 | 27.4 11% | 31.6 -3% | 27.6 10% | 30.2 2% | 28.8 6% |
* ... smaller is better
发言人
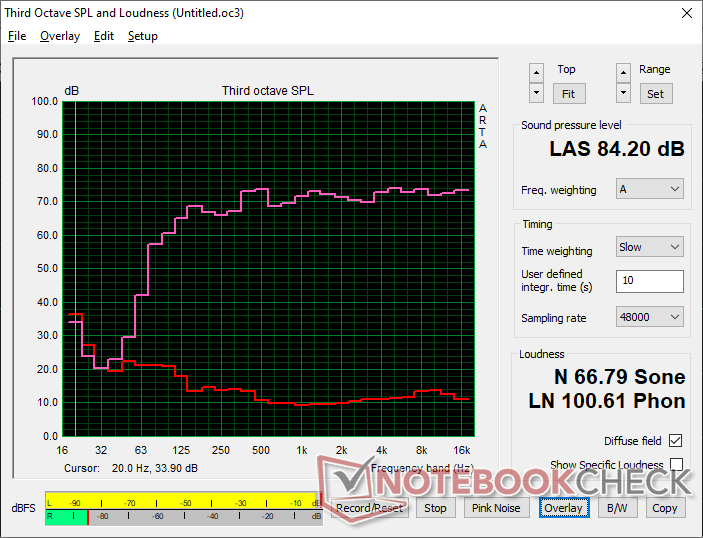
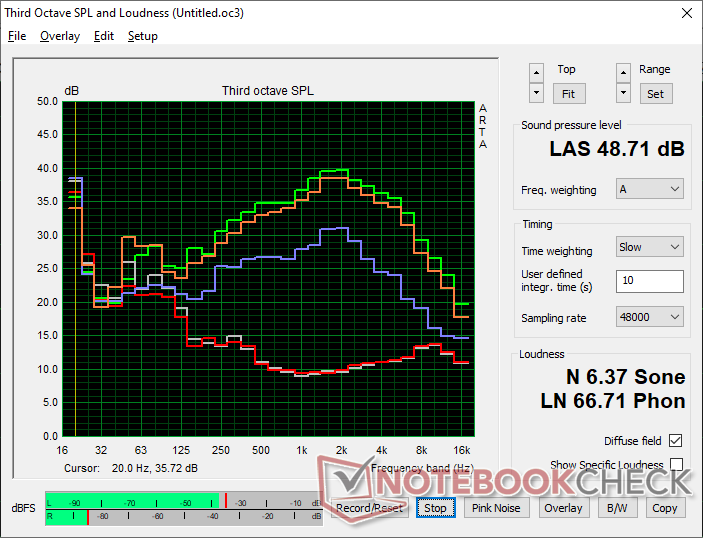
Dell 16 Premium DA16250 audio analysis
(+) | speakers can play relatively loud (84.2 dB)
Bass 100 - 315 Hz
(±) | reduced bass - on average 6.1% lower than median
(+) | bass is linear (4.2% delta to prev. frequency)
Mids 400 - 2000 Hz
(+) | balanced mids - only 1.4% away from median
(+) | mids are linear (3.6% delta to prev. frequency)
Highs 2 - 16 kHz
(+) | balanced highs - only 1.5% away from median
(+) | highs are linear (2.2% delta to prev. frequency)
Overall 100 - 16.000 Hz
(+) | overall sound is linear (5.1% difference to median)
Compared to same class
» 1% of all tested devices in this class were better, 0% similar, 99% worse
» The best had a delta of 5%, average was 17%, worst was 45%
Compared to all devices tested
» 0% of all tested devices were better, 0% similar, 100% worse
» The best had a delta of 4%, average was 23%, worst was 134%
Apple MacBook Pro 16 2021 M1 Pro audio analysis
(+) | speakers can play relatively loud (84.7 dB)
Bass 100 - 315 Hz
(+) | good bass - only 3.8% away from median
(+) | bass is linear (5.2% delta to prev. frequency)
Mids 400 - 2000 Hz
(+) | balanced mids - only 1.3% away from median
(+) | mids are linear (2.1% delta to prev. frequency)
Highs 2 - 16 kHz
(+) | balanced highs - only 1.9% away from median
(+) | highs are linear (2.7% delta to prev. frequency)
Overall 100 - 16.000 Hz
(+) | overall sound is linear (4.6% difference to median)
Compared to same class
» 0% of all tested devices in this class were better, 0% similar, 100% worse
» The best had a delta of 5%, average was 17%, worst was 45%
Compared to all devices tested
» 0% of all tested devices were better, 0% similar, 100% worse
» The best had a delta of 4%, average was 23%, worst was 134%
能源管理
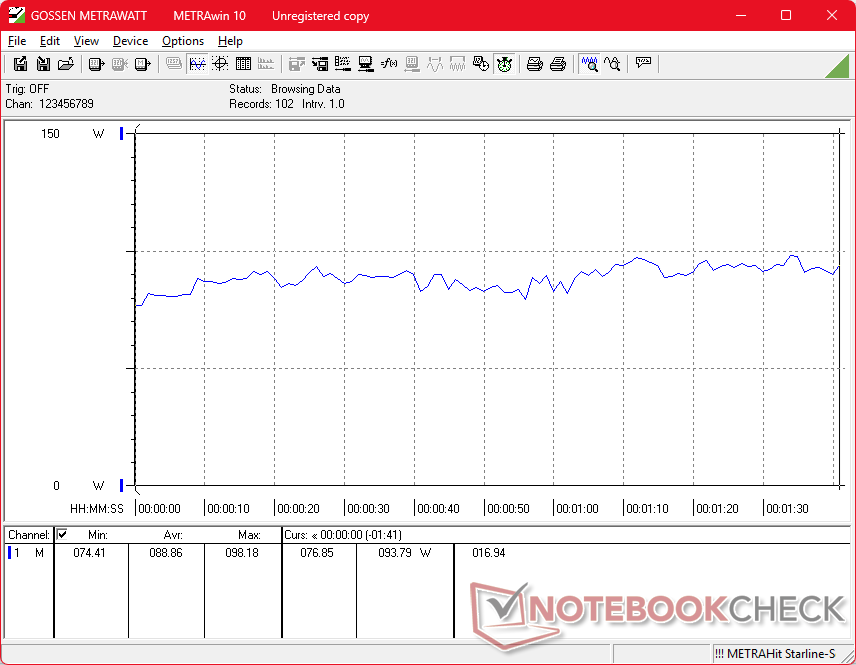
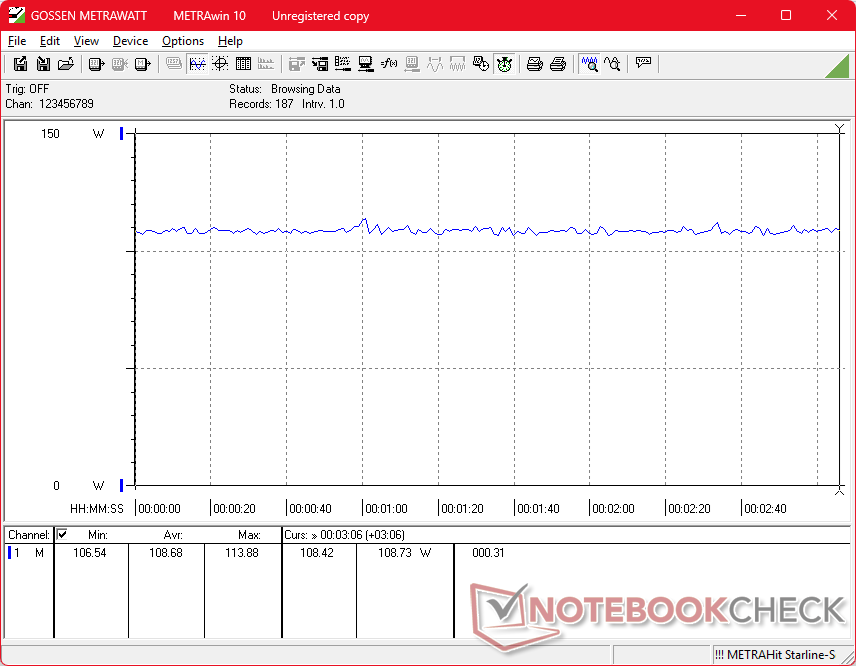
耗电量
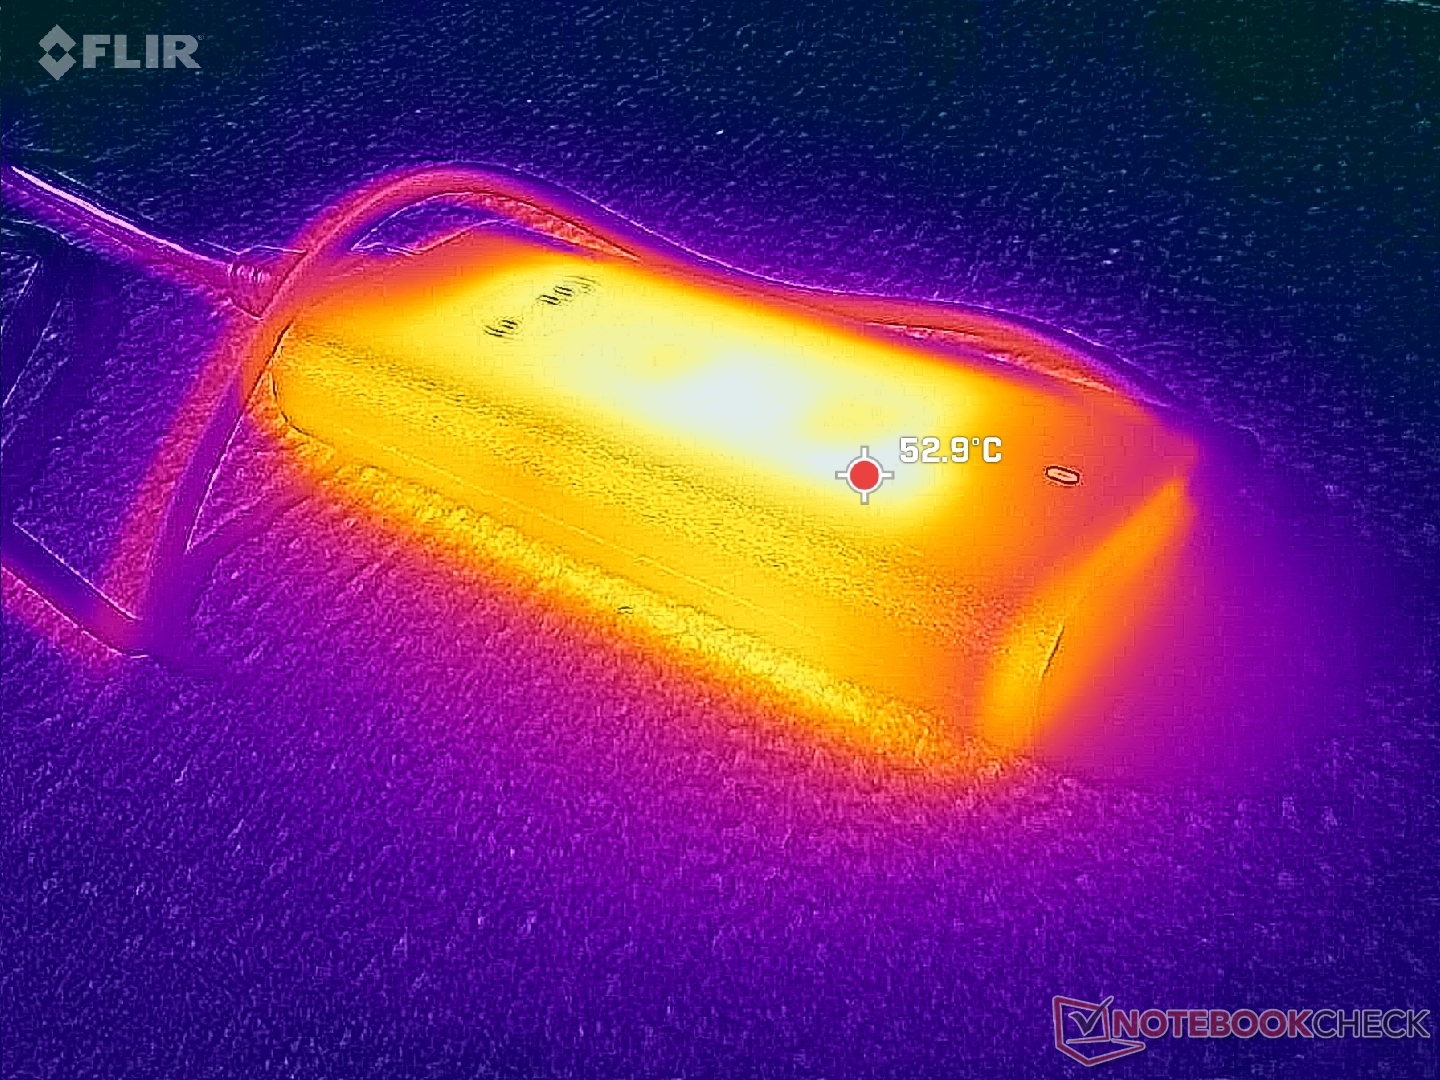
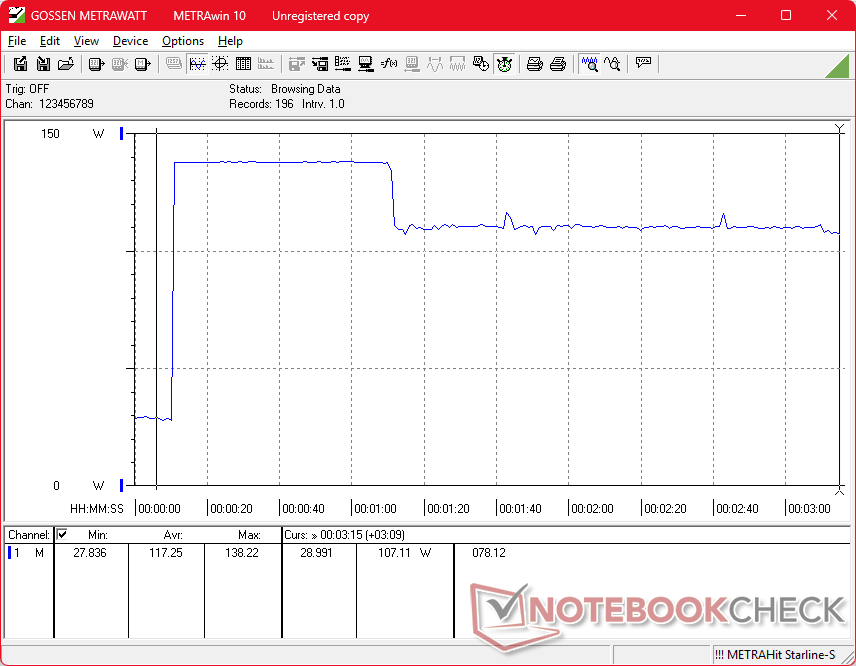
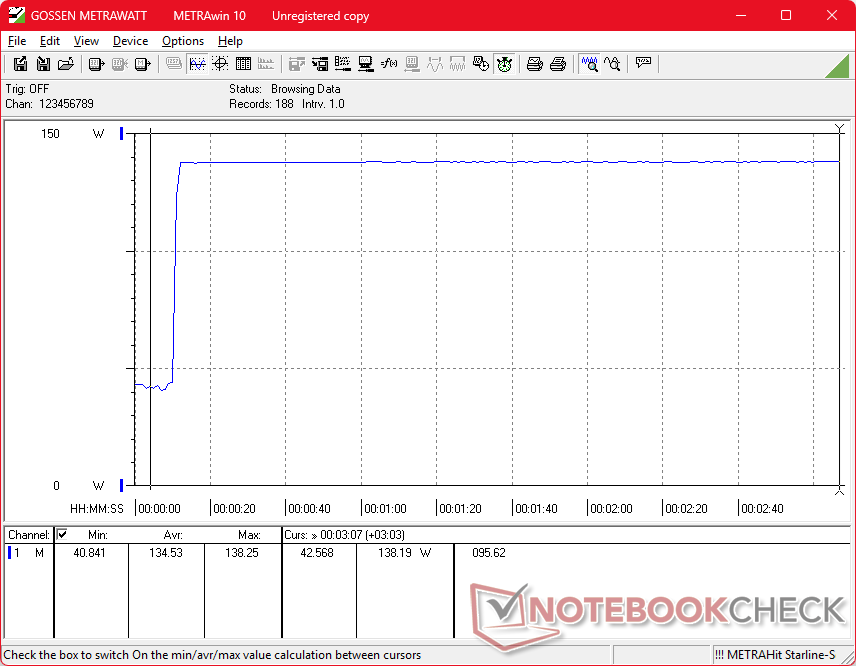
在 iGPU 启用的节能模式下,桌面闲置功耗可低至 6 瓦;在 dGPU 启用的性能模式下,功耗可高达 33 瓦,OLED 屏幕显示的大部分颜色为白色(如浏览网页时)。在运行要求更高的负载时,功耗与去年的机型相似,甚至略低于去年的机型,特别是因为戴尔 16 Premium 配备了与去年相同的 130 W USB-C AC 适配器(约 12.8 x 5.5 x 2.3 厘米),每瓦性能得到了提升。
请注意,Prime95 压力测试开始时的功耗较高,此时 Turbo Boost 的潜力最大。
| Off / Standby | |
| Idle | |
| Load |
|
Key:
min: | |
| Dell 16 Premium DA16250 Ultra 7 255H, GeForce RTX 5070 Laptop, Kioxia BG6 KBG6AZNV1T02, OLED, 3840x2400, 16.3" | Dell XPS 16 9640 Ultra 7 155H, GeForce RTX 4070 Laptop GPU, Kioxia XG8 KXG80ZNV1T02, OLED, 3840x2400, 16.3" | HP Spectre x360 16 RTX 4050 Ultra 7 155H, GeForce RTX 4050 Laptop GPU, SK hynix PC801 HFS001TEJ9X101N, OLED, 2880x1800, 16" | Lenovo Yoga Pro 9i 16 RTX 5070 Ultra 9 285H, GeForce RTX 5070 Laptop, WD PC SN7100S SDFPMSL-1T00-1101, OLED, 3200x2000, 16" | Asus Zenbook S 16 UM5606-RK333W Ryzen AI 9 HX 370, Radeon 890M, Micron 2400 MTFDKBA1T0QFM, OLED, 2880x1800, 16" | LG Gram Pro 16Z90TS-G.AU89G Core Ultra 7 256V, Arc 140V, Samsung PM9A1a MZVL21T0HDLU, IPS, 2560x1600, 16" | |
|---|---|---|---|---|---|---|
| Power Consumption | 7% | -5% | -29% | 39% | 50% | |
| Idle Minimum * (Watt) | 6.5 | 7.7 -18% | 5.8 11% | 8.8 -35% | 5.4 17% | 4.15 36% |
| Idle Average * (Watt) | 8.1 | 10.3 -27% | 12.3 -52% | 16.1 -99% | 10.5 -30% | 5.4 33% |
| Idle Maximum * (Watt) | 33 | 10.6 68% | 33.9 -3% | 16.5 50% | 10.9 67% | 12.4 62% |
| Load Average * (Watt) | 88.9 | 76.5 14% | 83.3 6% | 89.3 -0% | 47.8 46% | |
| Cyberpunk 2077 ultra external monitor * (Watt) | 108.9 | 157.9 -45% | 46.7 57% | 48.1 56% | ||
| Cyberpunk 2077 ultra * (Watt) | 108.7 | 160.6 -48% | 49.2 55% | 48.2 56% | ||
| Load Maximum * (Watt) | 138.3 | 138.5 -0% | 120.8 13% | 177.4 -28% | 58.6 58% | 60.049 57% |
| Witcher 3 ultra * (Watt) | 126.4 | 89.1 |
* ... smaller is better
功耗 赛博朋克/压力测试
外部显示器功耗
电池寿命
尽管处理器升级了,刷新率也提高到了 120 赫兹,但运行时间与以前大致相同。
| Dell 16 Premium DA16250 Ultra 7 255H, GeForce RTX 5070 Laptop, 99.5 Wh | Dell XPS 16 9640 Ultra 7 155H, GeForce RTX 4070 Laptop GPU, 99.5 Wh | HP Spectre x360 16 RTX 4050 Ultra 7 155H, GeForce RTX 4050 Laptop GPU, 83 Wh | Lenovo Yoga Pro 9i 16 RTX 5070 Ultra 9 285H, GeForce RTX 5070 Laptop, 84 Wh | Asus Zenbook S 16 UM5606-RK333W Ryzen AI 9 HX 370, Radeon 890M, 78 Wh | LG Gram Pro 16Z90TS-G.AU89G Core Ultra 7 256V, Arc 140V, 77 Wh | |
|---|---|---|---|---|---|---|
| Battery runtime | -5% | 0% | 1% | -3% | 78% | |
| WiFi v1.3 (h) | 11 | 10.5 -5% | 11 0% | 11.1 1% | 10.7 -3% | 19.6 78% |
| H.264 (h) | 16.5 | 14.4 | 20.1 | |||
| Load (h) | 1.5 | 1.8 |
笔记本检查评级
戴尔 16 Premium 提供与 XPS 16 9640 相同的用户体验,但配备了更快、更高效的处理器和 120 Hz OLED 显示屏选项。
Dell 16 Premium DA16250
- 10/31/2025 v8
Allen Ngo
 Total Sustainability Score:
 潜在竞争对手比较
Image | Model / Review | Price | Weight | Height | Display |
|---|---|---|---|---|---|
1. 87.9%  | Dell 16 Premium DA16250 Intel Core Ultra 7 255H ⎘ NVIDIA GeForce RTX 5070 Laptop ⎘ 32 GB Memory, 1024 GB SSD | Amazon: List Price: 3300 USD | 2.3 kg | 18.7 mm | 16.30" 3840x2400 278 PPI OLED |
2. 88.6% v7 (old)  | Dell XPS 16 9640 Intel Core Ultra 7 155H ⎘ NVIDIA GeForce RTX 4070 Laptop GPU ⎘ 32 GB Memory, 1024 GB SSD | Amazon: 1. $2,199.00 New XPS 16 9640 Business Lap... 2. $2,499.00 Dell XPS 16 9640 16.3" Touch... 3. $2,199.00 New XPS 16 9640 Powerful AI ... | 2.3 kg | 18.7 mm | 16.30" 3840x2400 139 PPI OLED |
3. 91.1% v7 (old)  | HP Spectre x360 16 RTX 4050 Intel Core Ultra 7 155H ⎘ NVIDIA GeForce RTX 4050 Laptop GPU ⎘ 16 GB Memory, 1024 GB SSD | Amazon: List Price: 1600 USD | 2 kg | 19.8 mm | 16.00" 2880x1800 212 PPI OLED |
4. 90.4%  | Lenovo Yoga Pro 9i 16 RTX 5070 Intel Core Ultra 9 285H ⎘ NVIDIA GeForce RTX 5070 Laptop ⎘ 64 GB Memory, 1024 GB SSD | Amazon: List Price: 2800€ | 1.9 kg | 17.9 mm | 16.00" 3200x2000 236 PPI OLED |
5. 84.7%  | Asus Zenbook S 16 UM5606-RK333W AMD Ryzen AI 9 HX 370 ⎘ AMD Radeon 890M ⎘ 32 GB Memory, 1024 GB SSD | Amazon: List Price: 2100€ | 1.5 kg | 12.9 mm | 16.00" 2880x1800 212 PPI OLED |
6. 83.9%  | LG Gram Pro 16Z90TS-G.AU89G Intel Core Ultra 7 256V ⎘ Intel Arc Graphics 140V ⎘ 16 GB Memory, 1024 GB SSD | Amazon: List Price: 2050€ | 1.2 kg | 13 mm | 16.00" 2560x1600 189 PPI IPS |
Transparency
The selection of devices to be reviewed is made by our editorial team. The test sample was provided to the author as a loan by the manufacturer or retailer for the purpose of this review. The lender had no influence on this review, nor did the manufacturer receive a copy of this review before publication. There was no obligation to publish this review. As an independent media company, Notebookcheck is not subjected to the authority of manufacturers, retailers or publishers.
This is how Notebookcheck is testing
Every year, Notebookcheck independently reviews hundreds of laptops and smartphones using standardized procedures to ensure that all results are comparable. We have continuously developed our test methods for around 20 years and set industry standards in the process. In our test labs, high-quality measuring equipment is utilized by experienced technicians and editors. These tests involve a multi-stage validation process. Our complex rating system is based on hundreds of well-founded measurements and benchmarks, which maintains objectivity. Further information on our test methods can be found here.

