
结论 - 配备 OLED 的 XMG Fusion 16 值得考虑
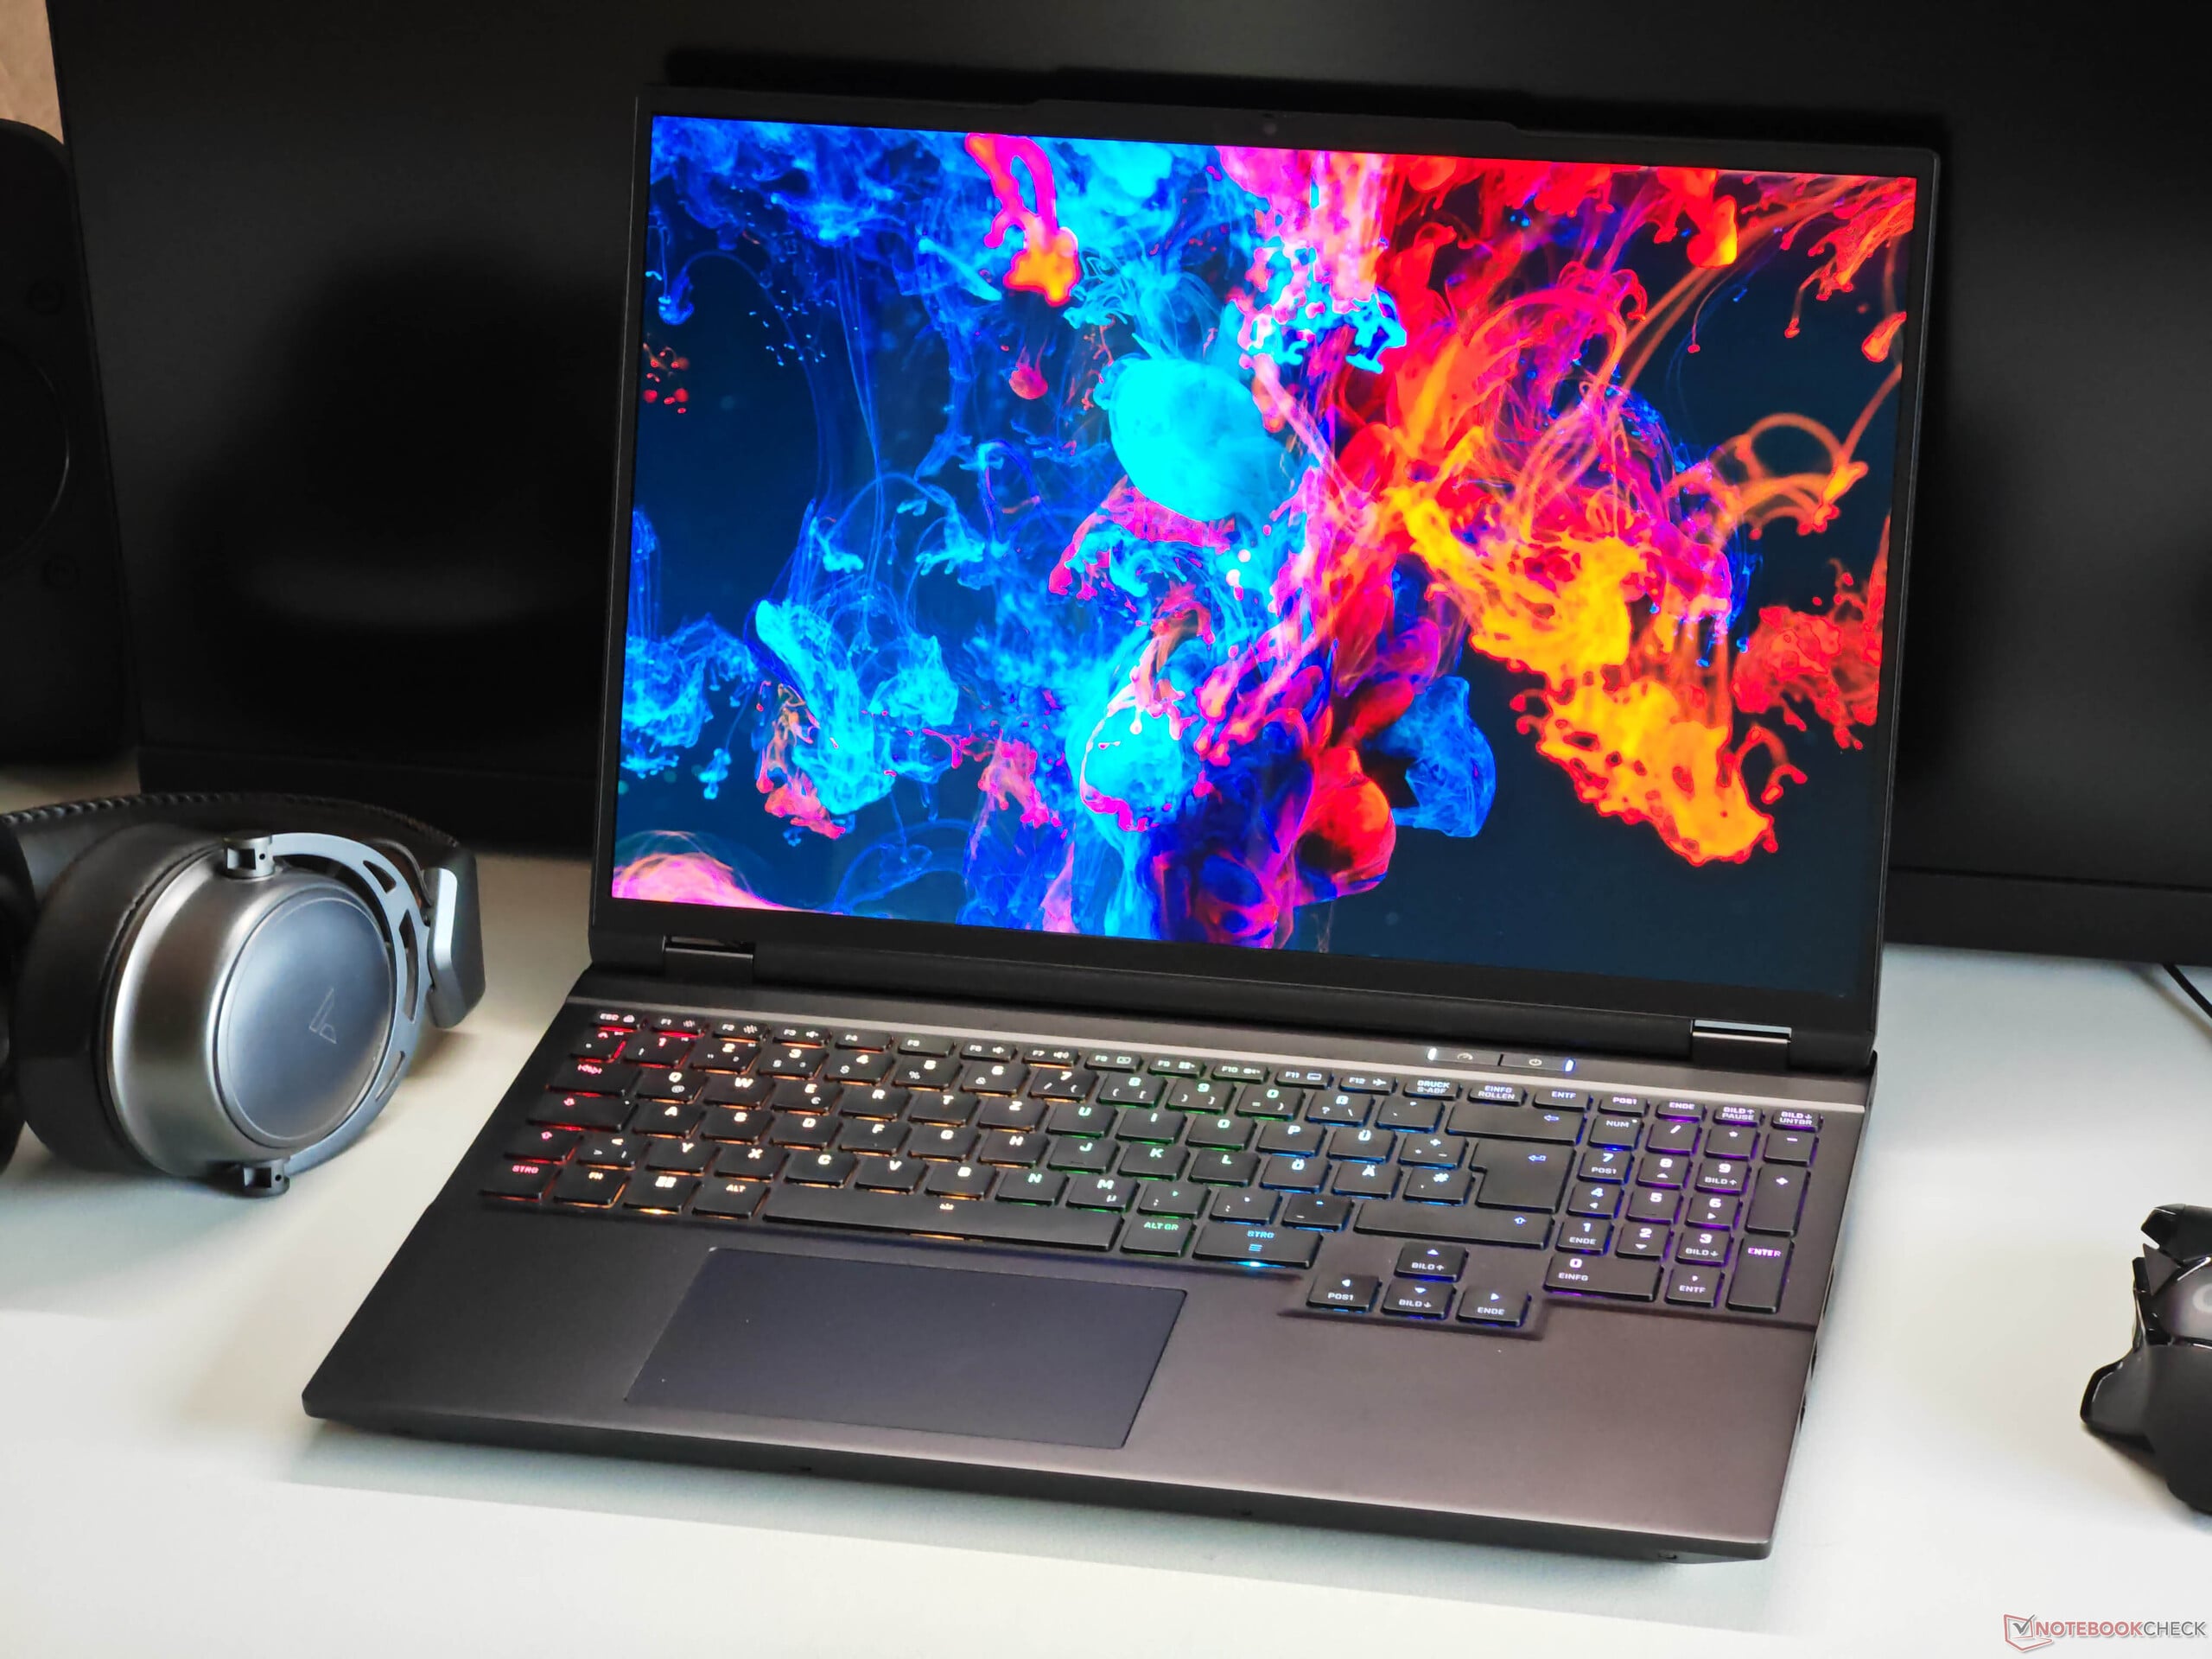
XMG 推出的 Fusion 16 是著名的 Core 16 的升级版。它的突出特点是采用了全新的 OLED 面板,能提供出色的图像质量,视觉效果明显比 IPS 版更鲜艳。只是 HDR 亮度可能会更高一些。尽管如此,刷新率为 300 Hz 的 IPS 面板仍然是一个可靠的选择,而且不会出现 PWM 问题。
速度更快的英特尔 HX 处理器大大提高了 CPU 的原始性能,但对游戏的影响有限。总体而言,风扇的噪音仍略低于竞争对手,XMG 提供了更多的配置选项,包括高达 128 GB 的内存和 16 TB 的固态硬盘存储空间。
总的来说,新款 XMG Fusion 16 是一款非常强大的全能型产品,如果你想获得最佳的图像质量,OLED 显示屏值得选择。电池续航时间基本保持不变。不过,如果你更喜欢 IPS 面板,价格更实惠的酷睿 16 也是一个不错的选择,因为 AMD 处理器的游戏性能仅略低于酷睿 16。
Pros
Cons
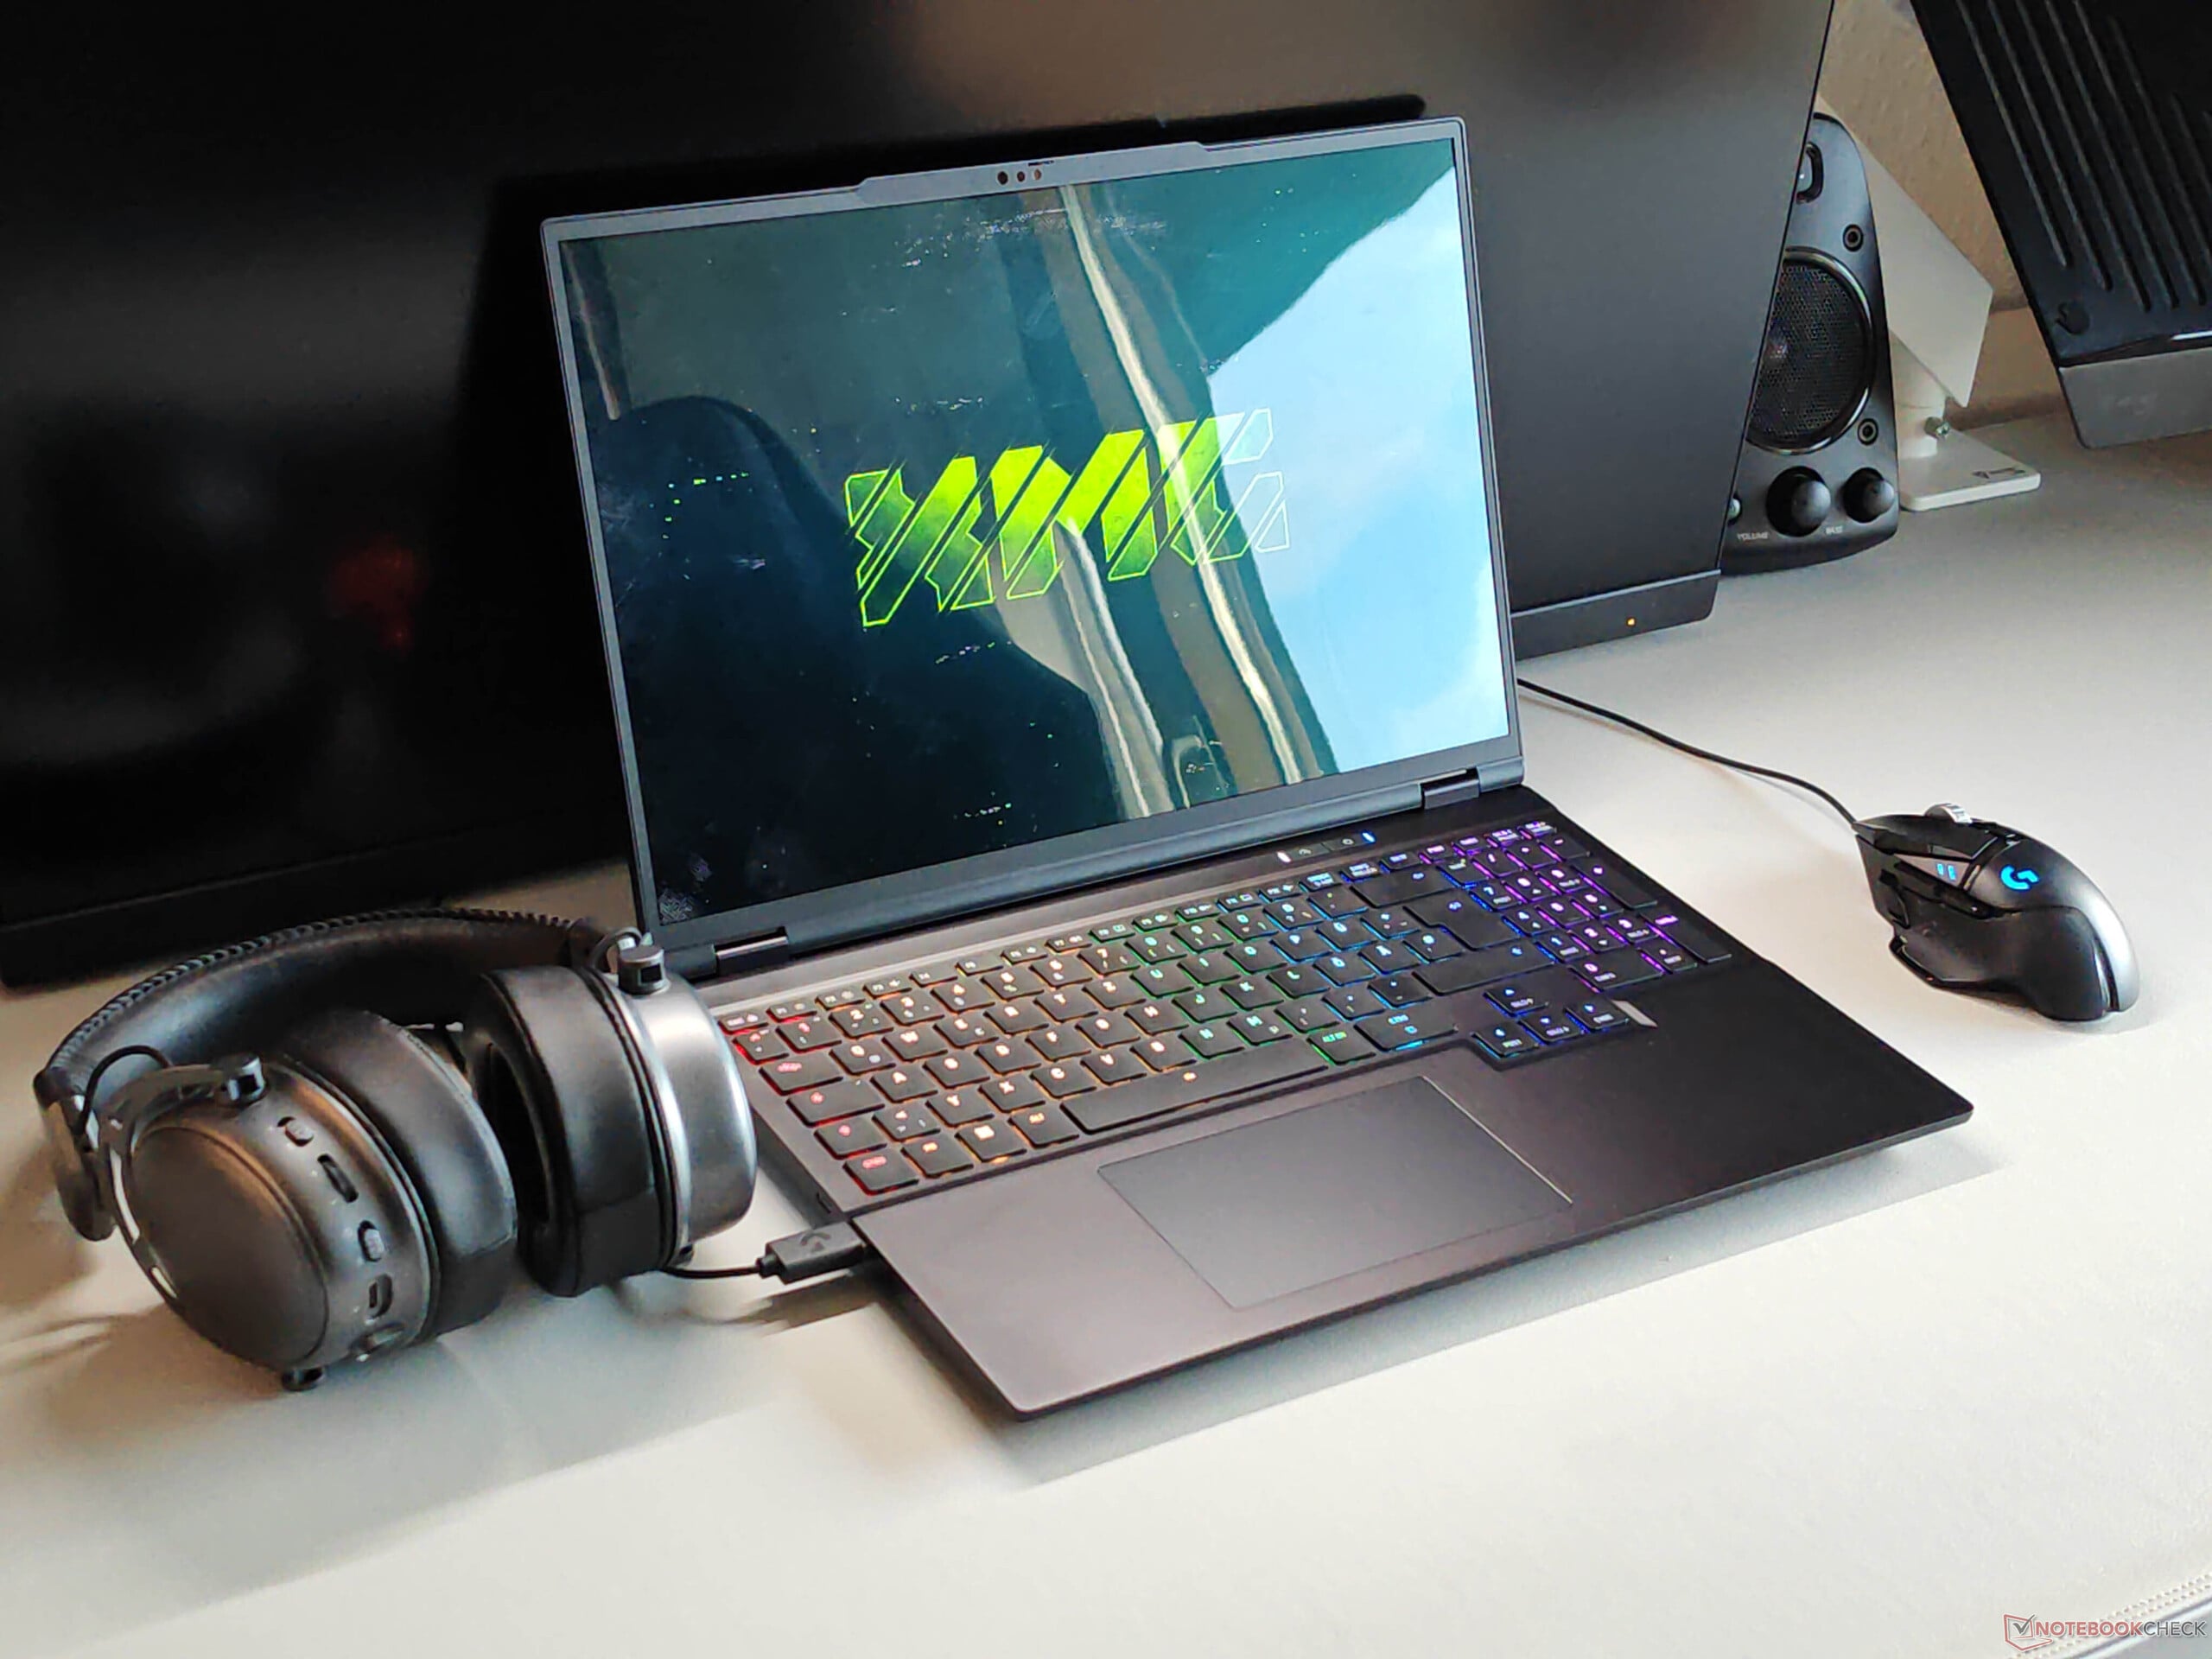
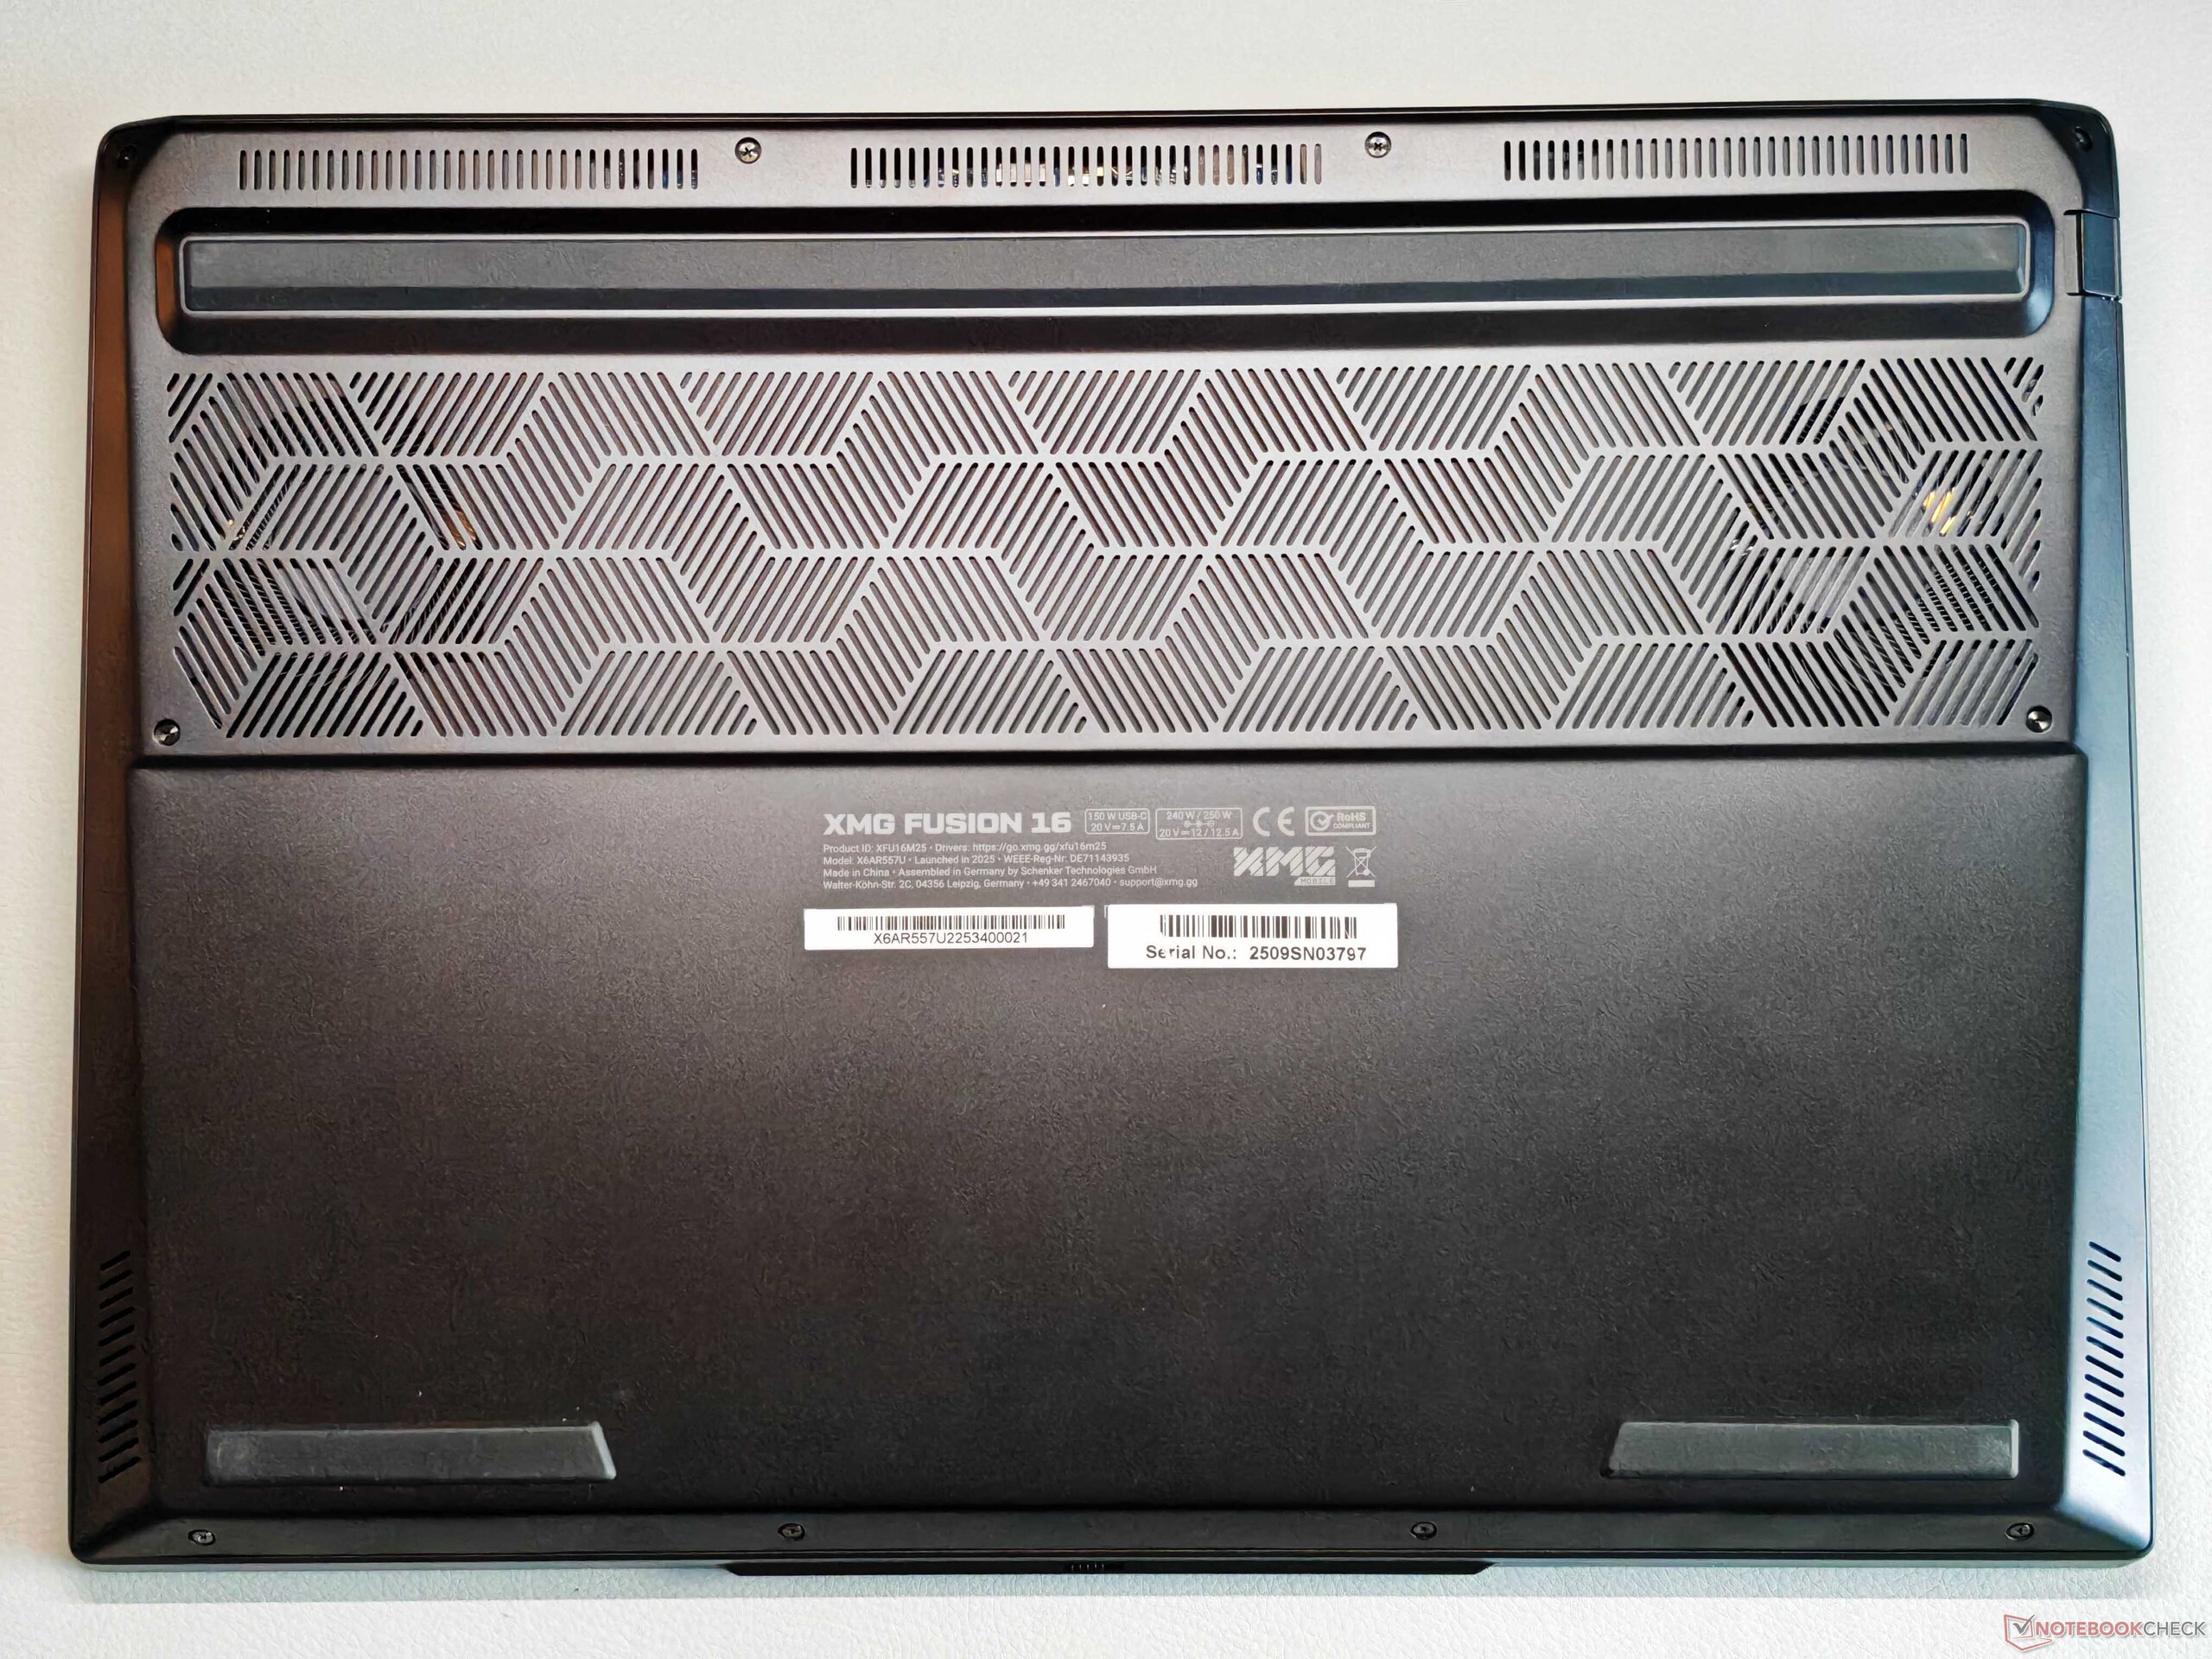
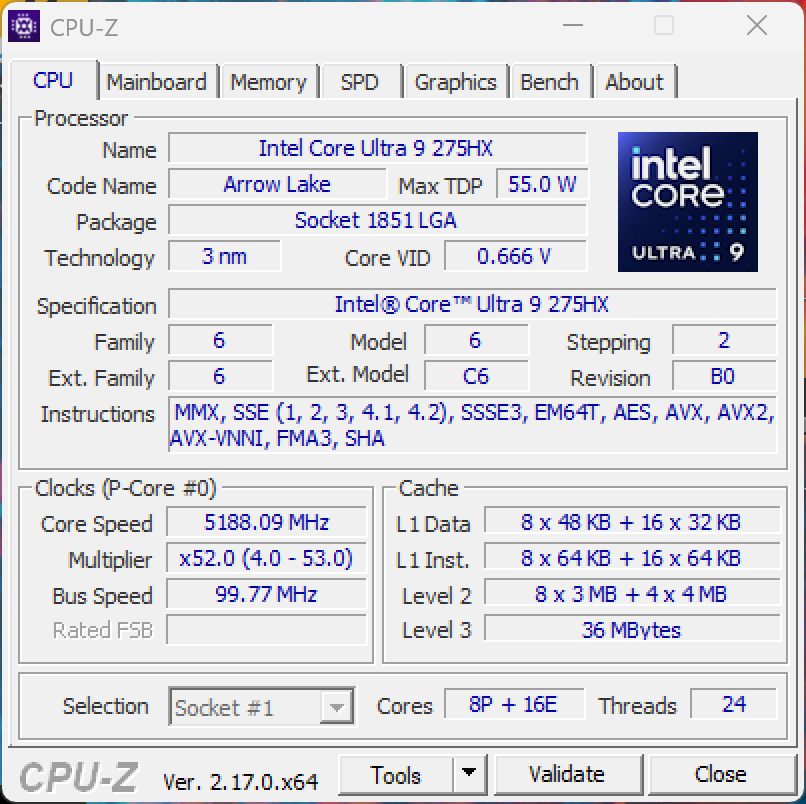
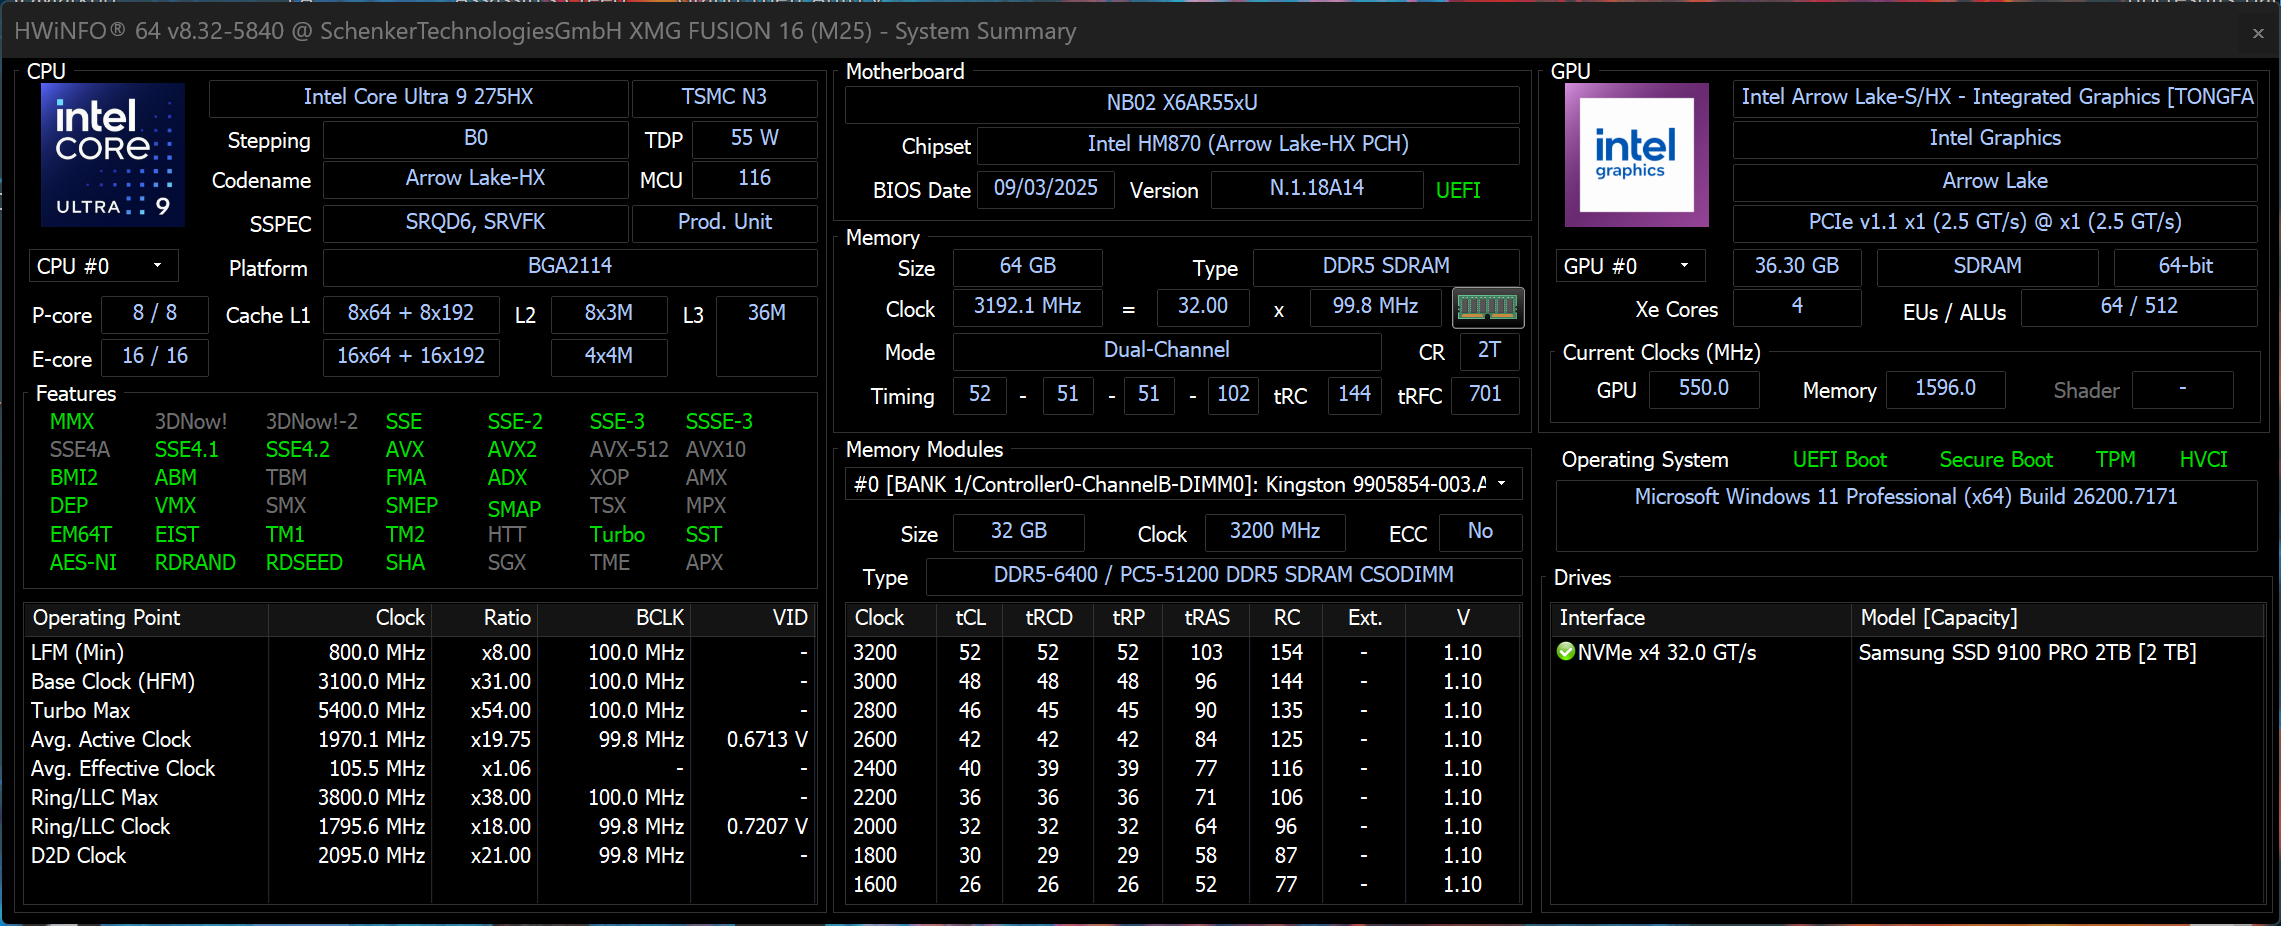
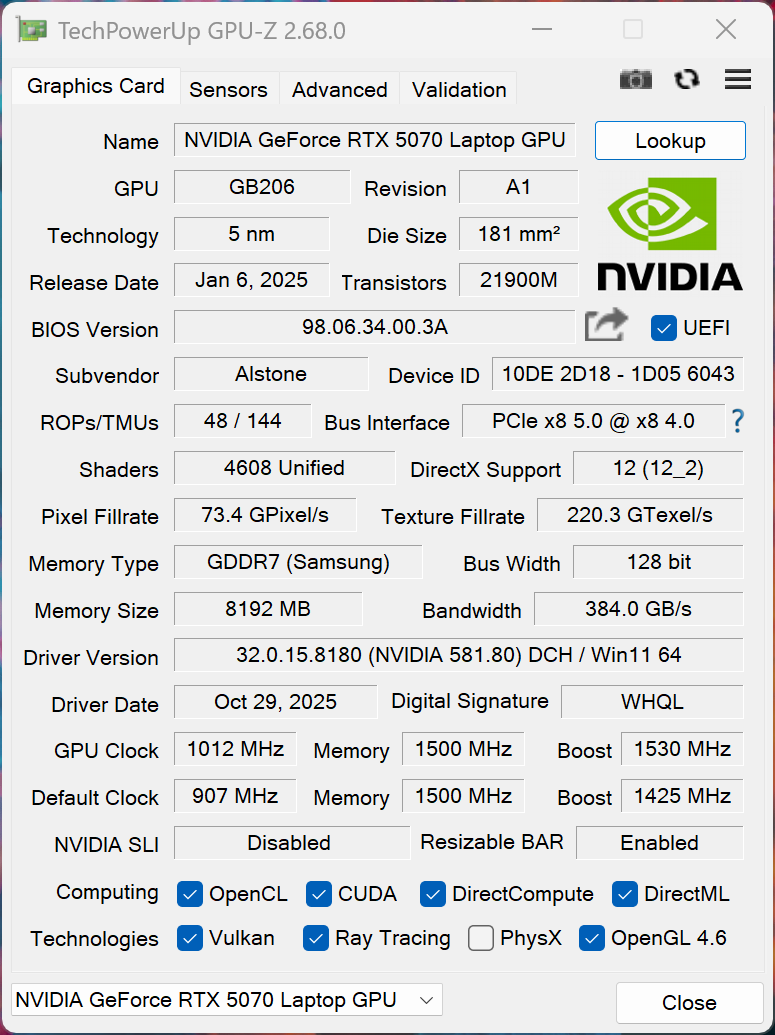
Fusion 16 是 XMG 首款采用 OLED 面板的游戏笔记本电脑。这款笔记本的机身与目前的 酷睿 16(AMD Ryzen with IPS),但 Fusion 16 配备了高性能的英特尔酷睿 Ultra 9 275HX、熟悉的GeForce RTX 5070 Laptop GPU 和全新的 120 Hz OLED 显示屏。
规格
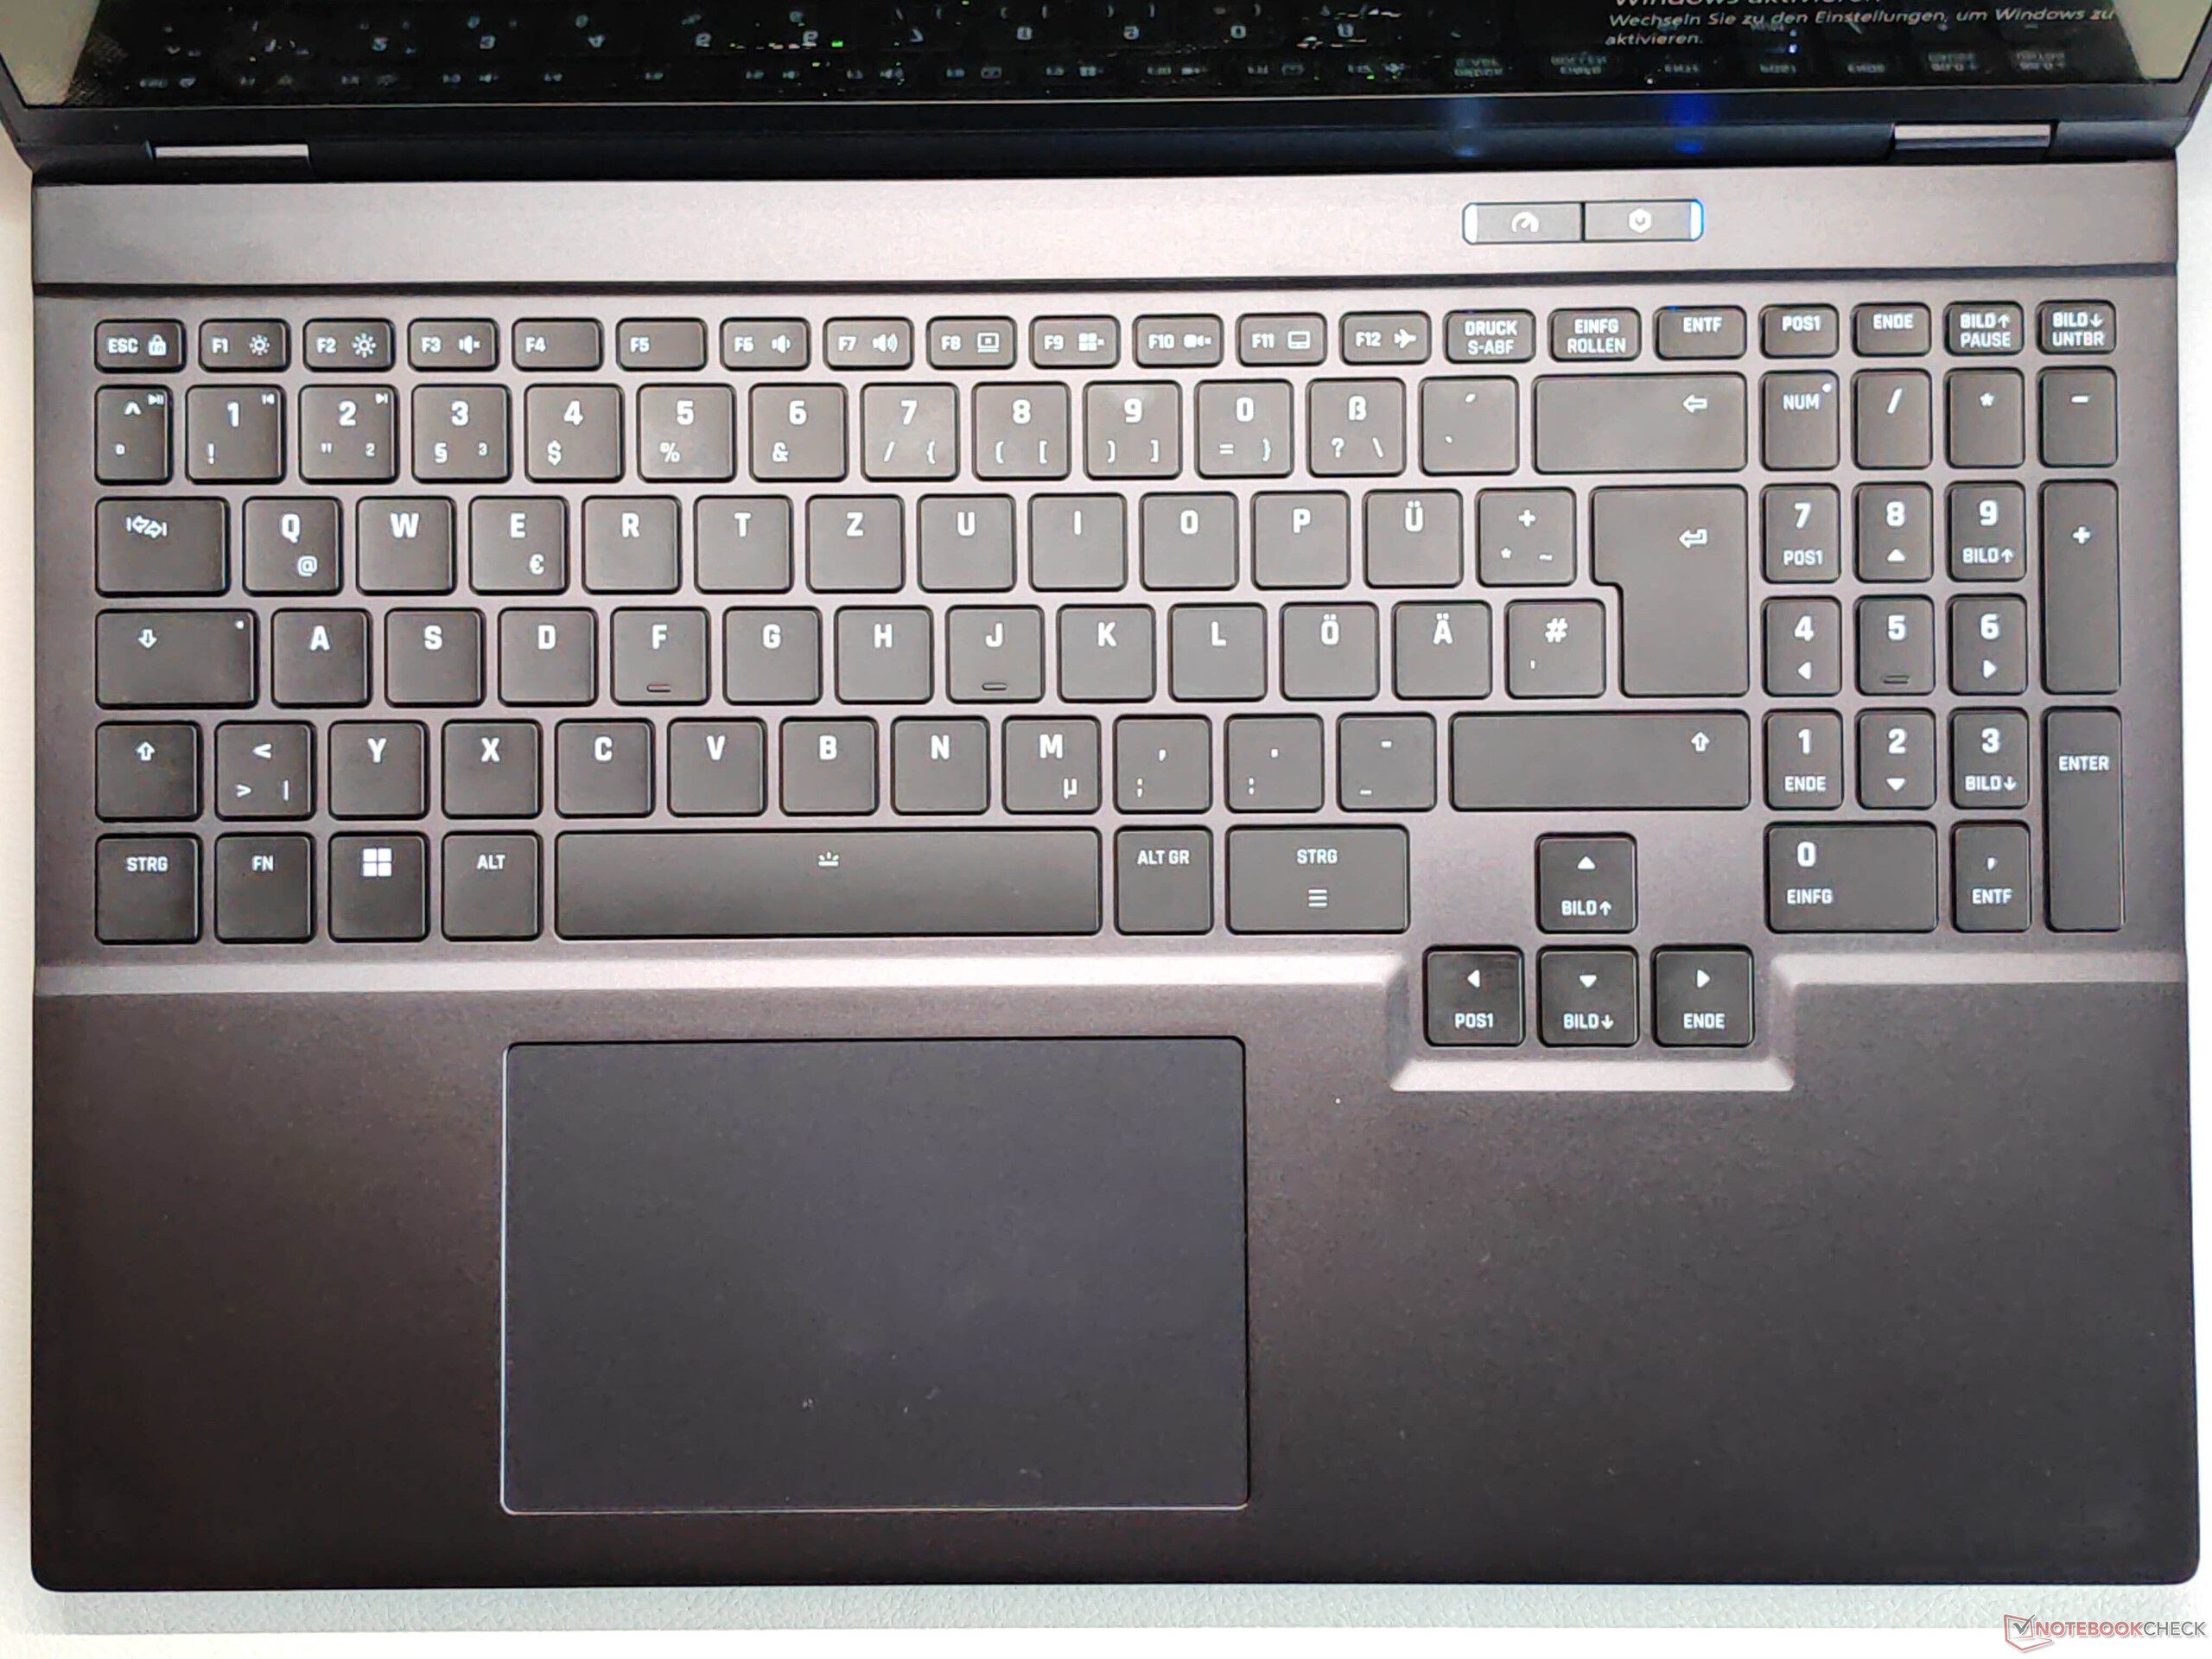
箱子和设备
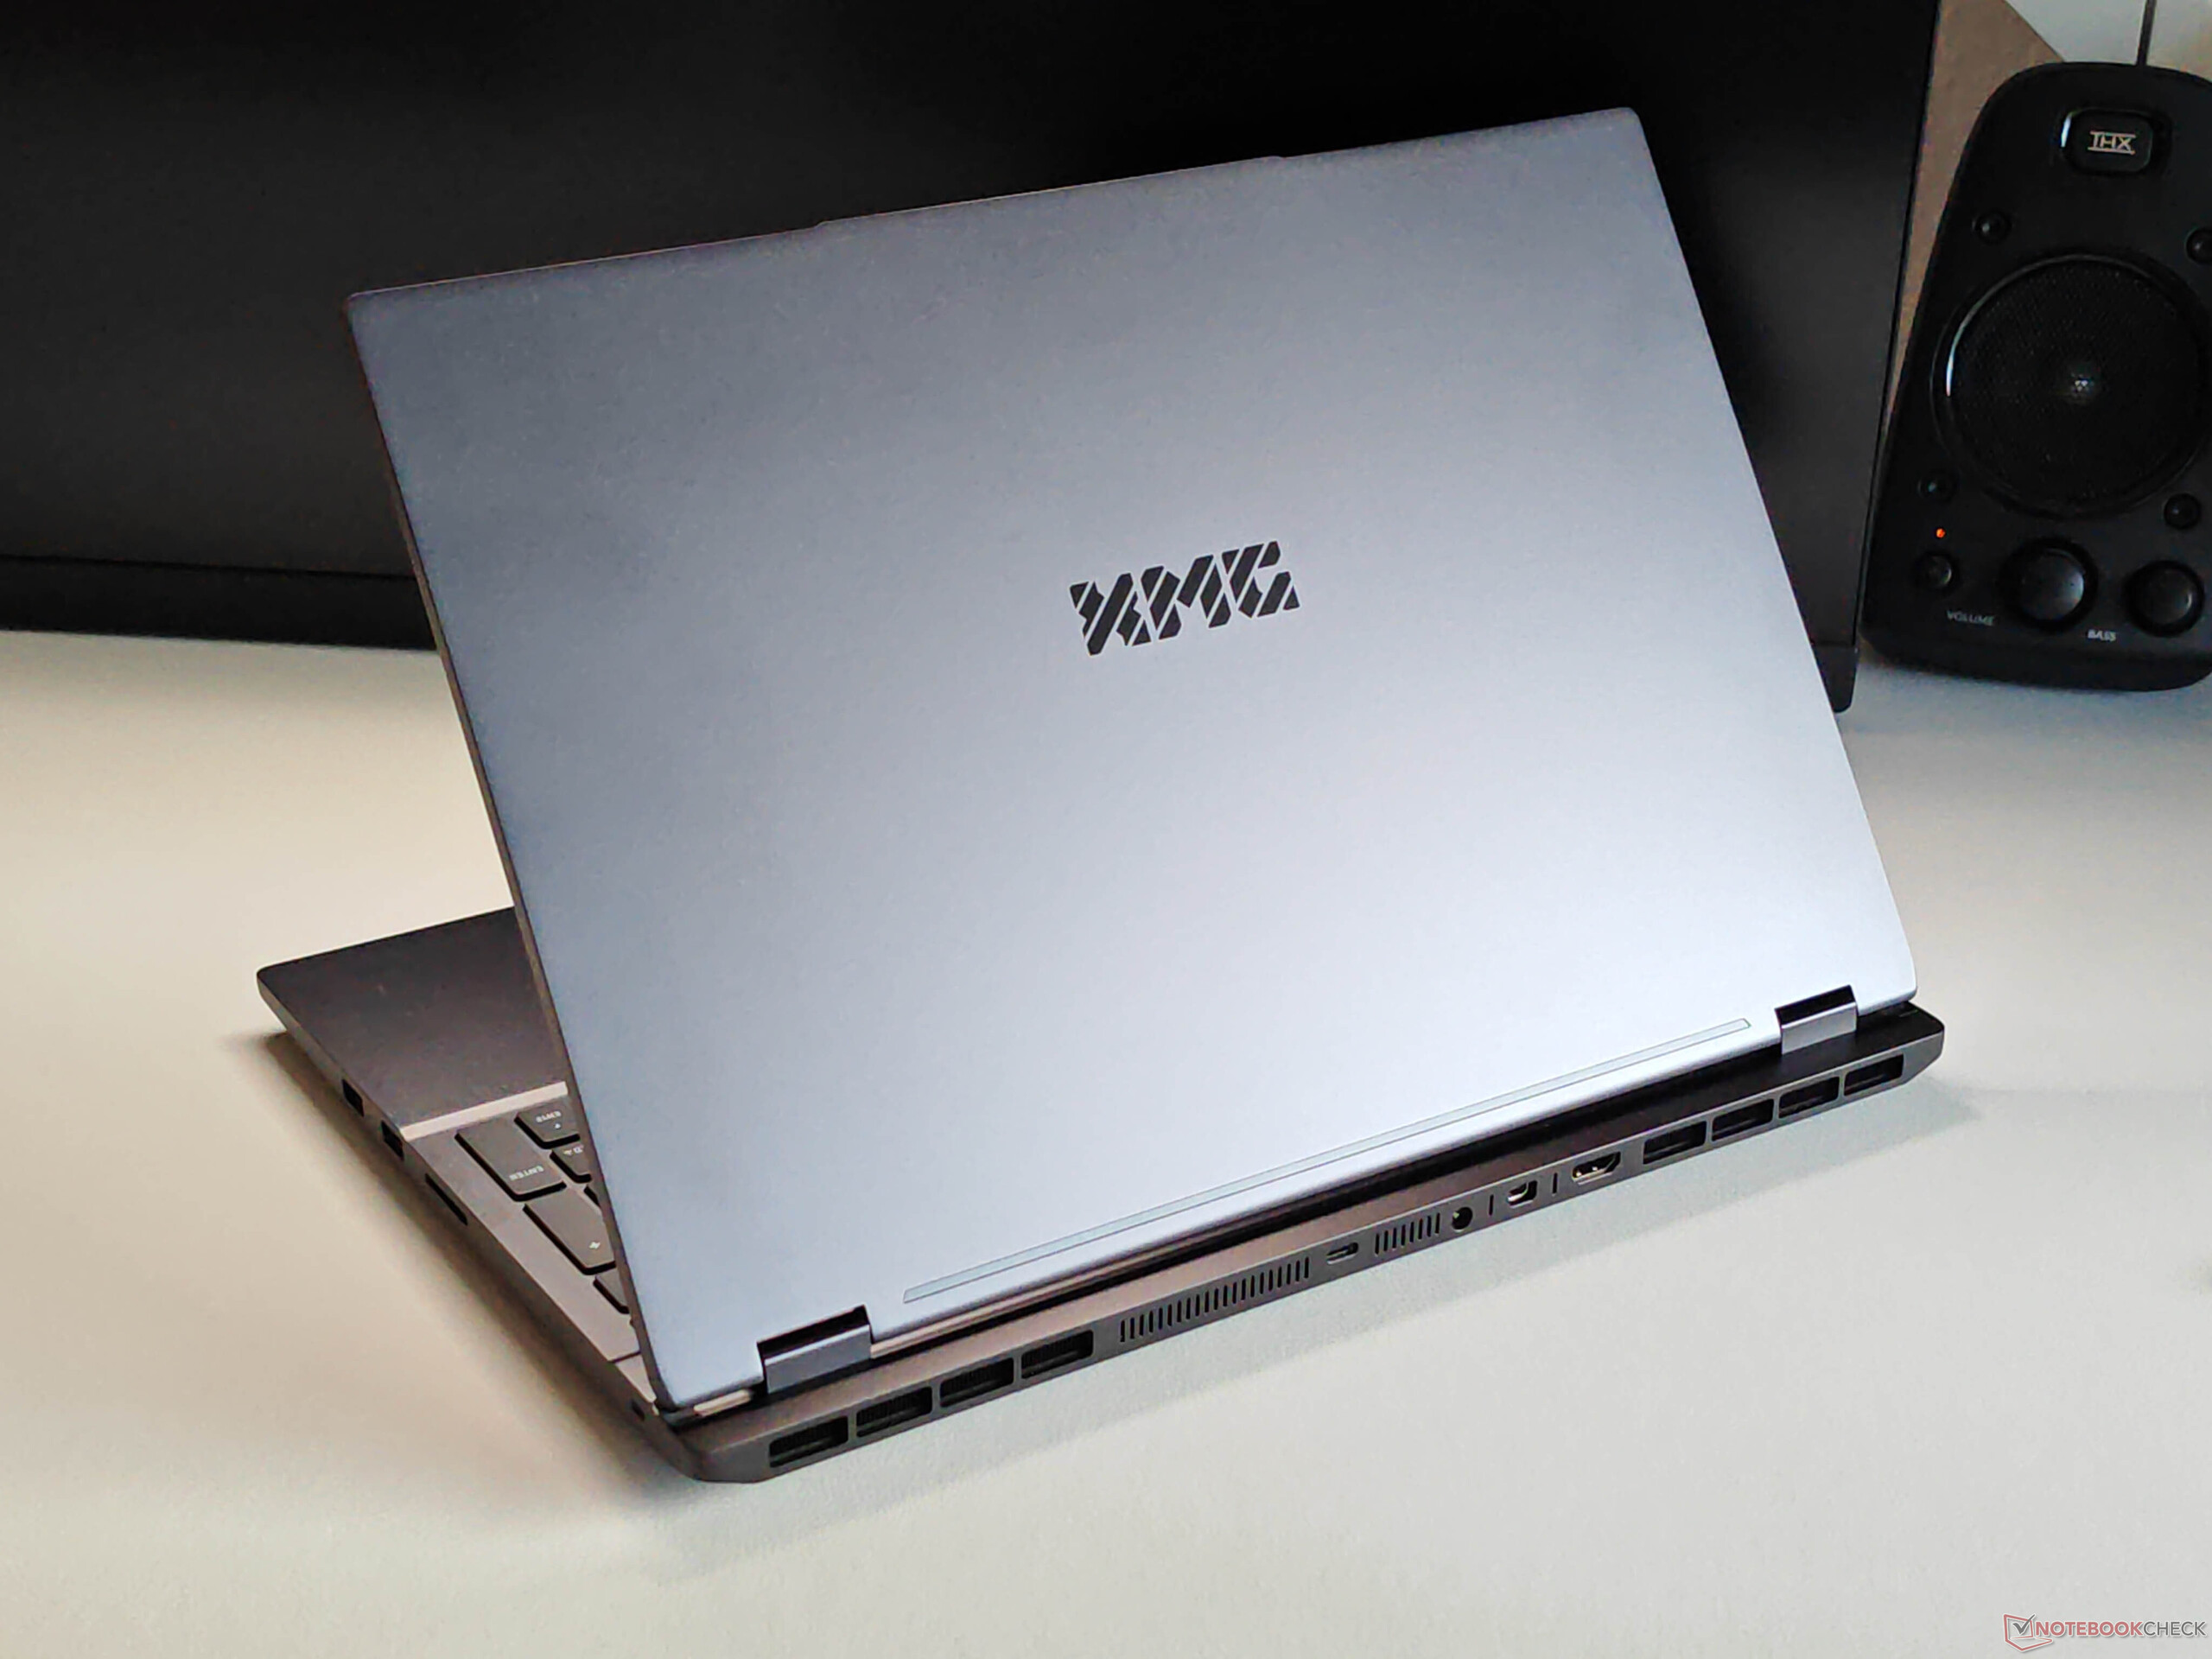
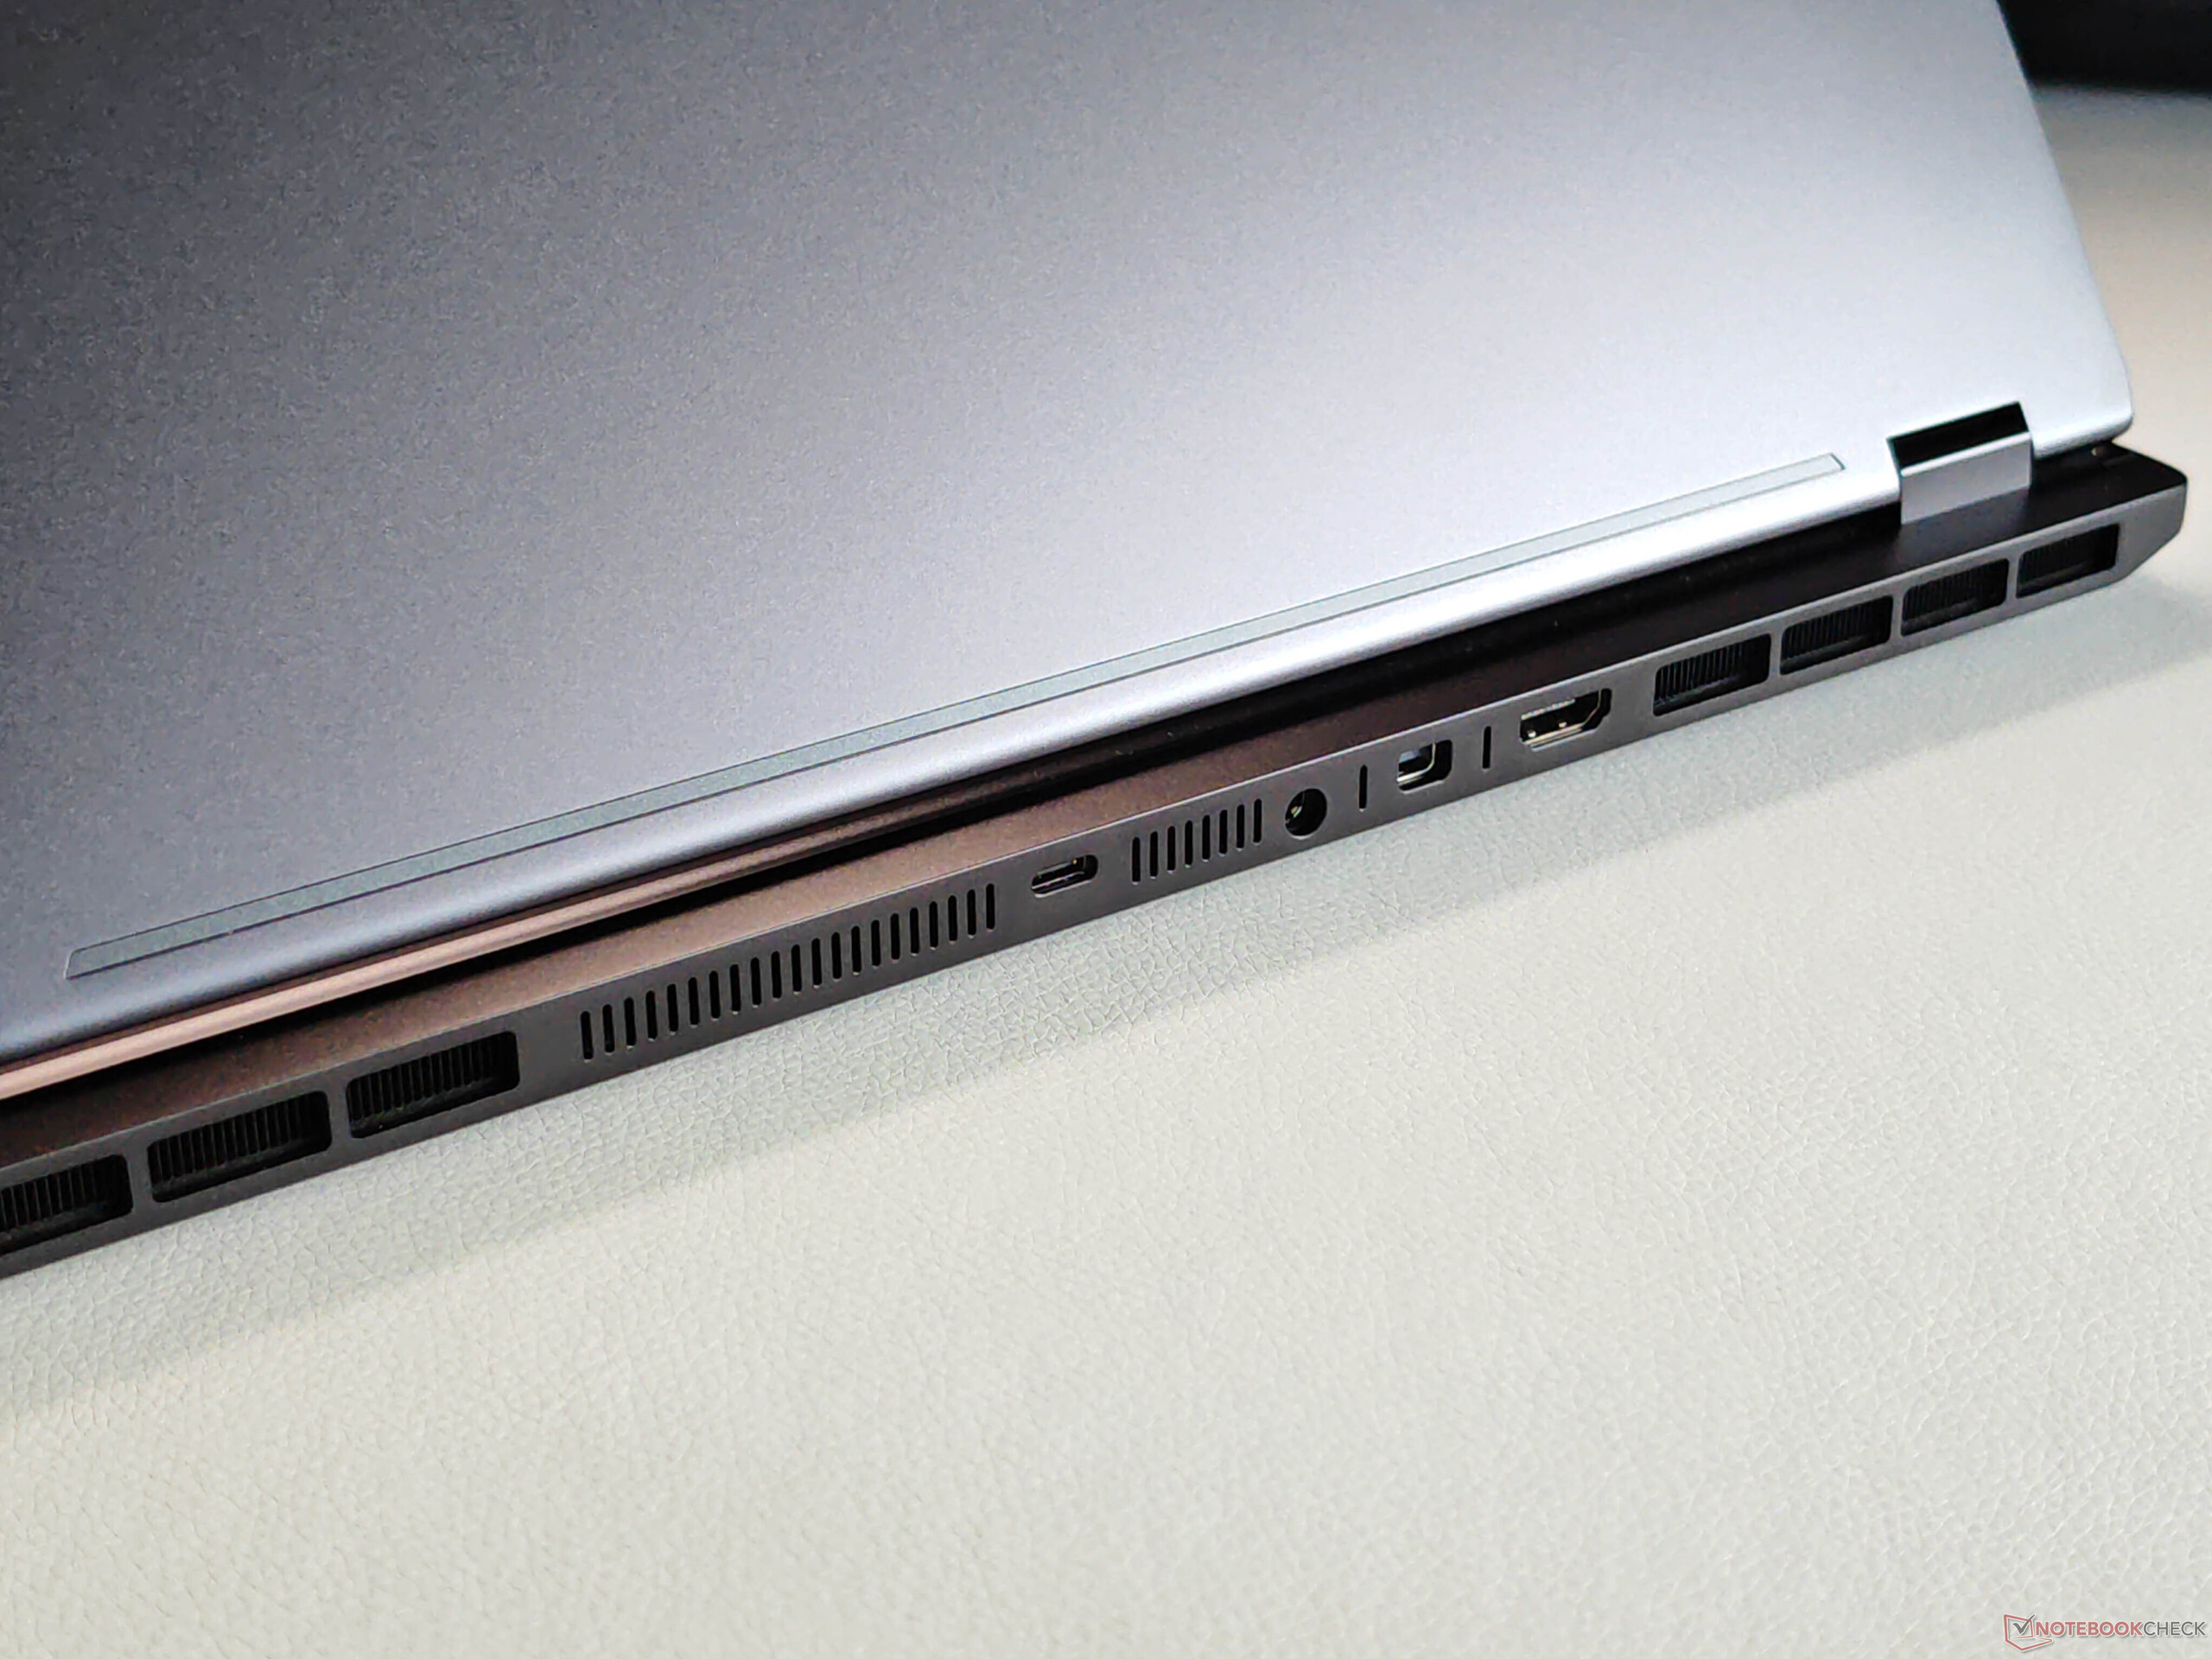
与已测试过的 XMG Core 16 相比,机箱和输入设备没有任何区别 XMG Core 16新的 OLED 版仅比 IPS 版轻几克。不过,新款 Fusion 16 的功能略胜一筹,除了 Wi-Fi 7 模块外,还配备了雷电 4 端口。


| SD Card Reader | |
| average JPG Copy Test (av. of 3 runs) | |
| Aorus Elite 16 AE6H (AV PRO microSD 128 GB V60) | |
| Schenker XMG Core 16 M25 (Angelbird AV Pro V60) | |
| Average of class Gaming (20.9 - 210, n=54, last 2 years) | |
| Schenker XMG FUSION 16 (M25) (Angelbird AV Pro V60) | |
| maximum AS SSD Seq Read Test (1GB) | |
| Schenker XMG Core 16 M25 (Angelbird AV Pro V60) | |
| Aorus Elite 16 AE6H (AV PRO microSD 128 GB V60) | |
| Average of class Gaming (25.5 - 261, n=51, last 2 years) | |
| Schenker XMG FUSION 16 (M25) (Angelbird AV Pro V60) | |
| Networking | |
| Schenker XMG FUSION 16 (M25) | |
| iperf3 transmit AXE11000 | |
| iperf3 receive AXE11000 | |
| Lenovo Legion Pro 5 16IAX10, RTX 5070 | |
| iperf3 transmit AXE11000 | |
| iperf3 receive AXE11000 | |
| iperf3 transmit AXE11000 6GHz | |
| Schenker XMG Core 16 M25 | |
| iperf3 transmit AXE11000 | |
| iperf3 receive AXE11000 | |
| Asus TUF Gaming A16 FA608UP | |
| iperf3 transmit AXE11000 | |
| iperf3 receive AXE11000 | |
| MSI Crosshair 16 HX AI D2XWGKG | |
| iperf3 transmit AXE11000 | |
| iperf3 receive AXE11000 | |
| iperf3 transmit AXE11000 6GHz | |
| iperf3 receive AXE11000 6GHz | |
| Aorus Elite 16 AE6H | |
| iperf3 transmit AXE11000 | |
| iperf3 receive AXE11000 | |
| Gigabyte Gaming A16 GA6H | |
| iperf3 transmit AXE11000 | |
| iperf3 receive AXE11000 | |

 GeForce RTX 5070 Laptop, Ultra 9 275HX, Samsung 9100 Pro 2 TB")
 GeForce RTX 5070 Laptop, Ultra 9 275HX, Samsung 9100 Pro 2 TB")
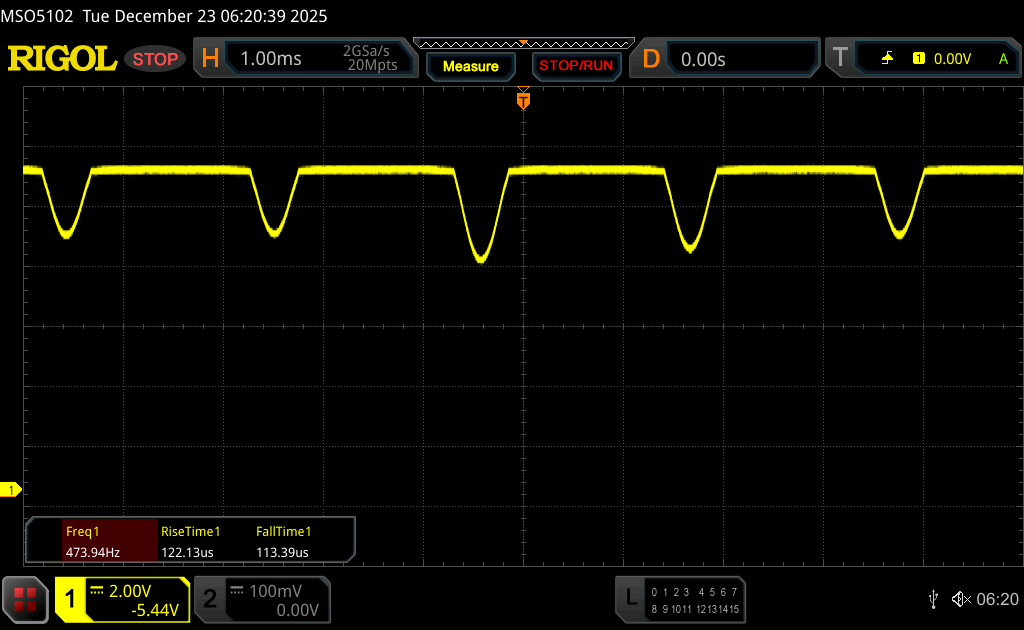
显示屏 - 120 Hz OLED
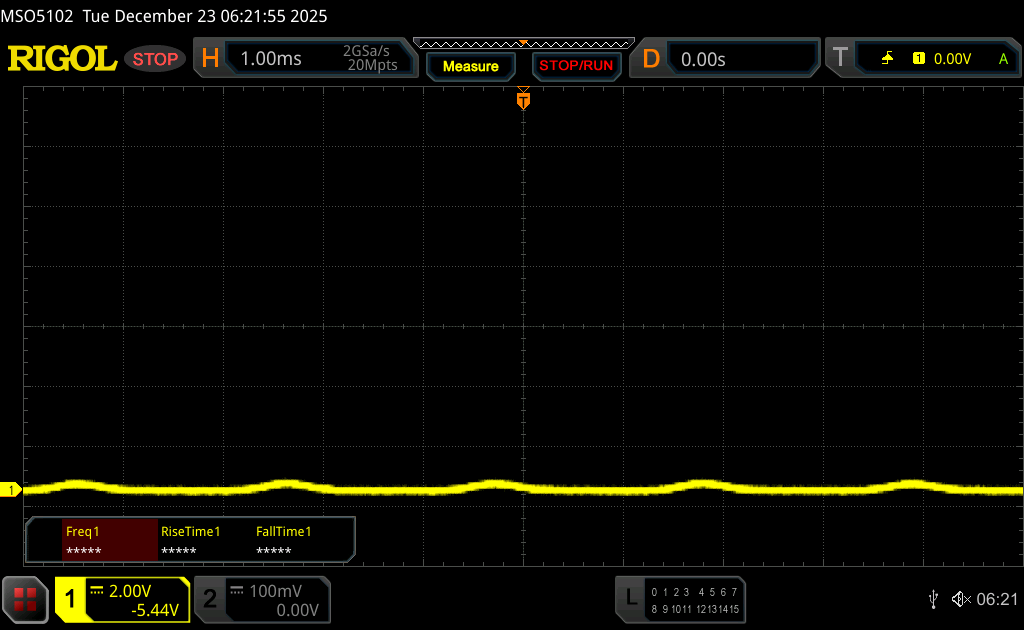
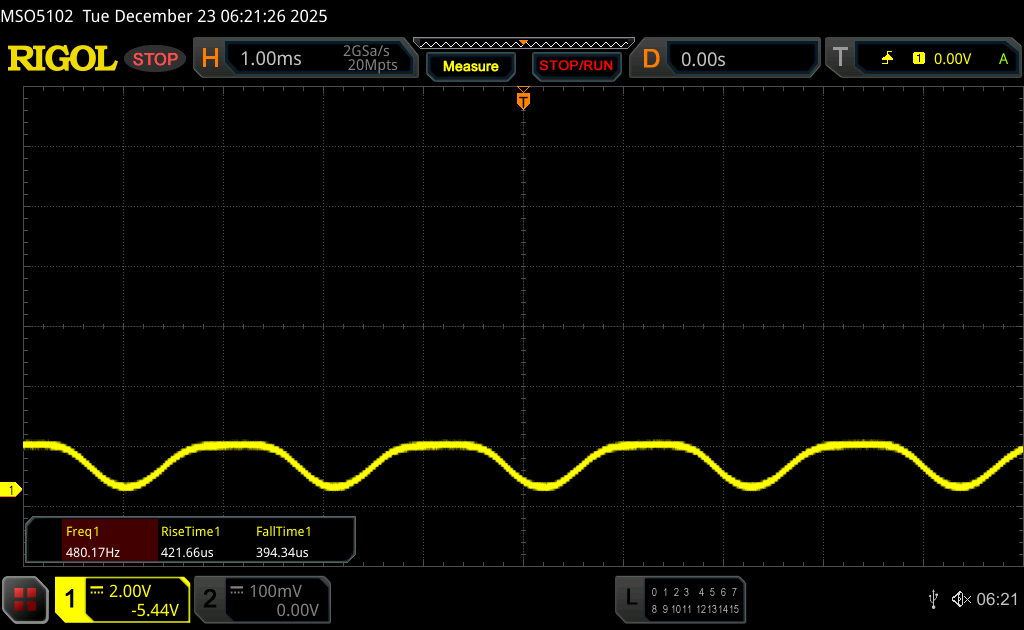
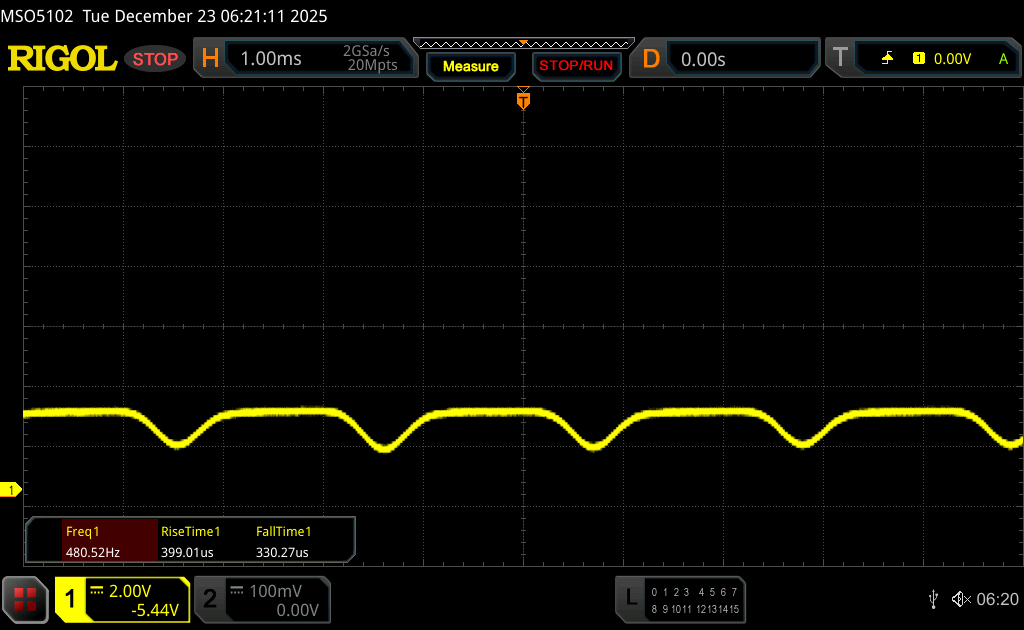
Fusion 16 可配备我们熟悉的 IPS 面板(300 Hz)。 核心 16或全新的三星 OLED 面板(2,880 × 1,800 像素,16:10,120 Hz,附加费 130 欧元)。光面 OLED 屏幕的图像质量非常出色,色彩鲜艳,对比度高,响应速度极快。不过,在 480 Hz 时会出现 PWM 闪烁,不过幅度相对较小。
SDR 模式下的平均亮度为 433 cd/m²(黑电平为 0),而 HDR 亮度峰值略低于 500 cd/m²。如果能有更高的亮度就更好了,尤其是在 HDR 模式下。XMG 提供了多个出厂校准配置文件,但没有一个是完全令人信服的。在我们使用专业 CalMAN 软件进行的分析中,sRGB 配置文件的效果最好。通过我们自己的校准(该配置文件可在下面的框中免费下载),显示效果可以得到进一步改善,使面板也适用于图像编辑。
| |||||||||||||||||||||||||
Brightness Distribution: 99 %
Center on Battery: 434 cd/m²
Contrast: ∞:1 (Black: 0 cd/m²)
ΔE ColorChecker Calman: 3 | ∀{0.5-29.43 Ø4.72}
calibrated: 1.4
ΔE Greyscale Calman: 3.4 | ∀{0.09-98 Ø4.97}
93.3% AdobeRGB 1998 (Argyll 3D)
100% sRGB (Argyll 3D)
99.9% Display P3 (Argyll 3D)
Gamma: 2.47
CCT: 6452 K
| Schenker XMG FUSION 16 (M25) ATNA60CL10_0, OLED, 2880x1800, 16", 120 Hz | Lenovo Legion Pro 5 16IAX10, RTX 5070 ATNA60HS01-0 (Samsung SDC420A), OLED, 2650x1600, 16", 165 Hz | Schenker XMG Core 16 M25 MNG007DA6-4, IPS, 2560x1600, 16", 300 Hz | Asus TUF Gaming A16 FA608UP MNG007DA5-3, IPS, 2560x1600, 16", 165 Hz | MSI Crosshair 16 HX AI D2XWGKG AUO B160QAN02.3, IPS, 2560x1600, 16", 240 Hz | Aorus Elite 16 AE6H NE160QDM-NYJ, IPS, 2560x1600, 16", 165 Hz | Gigabyte Gaming A16 GA6H NE160QDM-NYJ (BOE0C80), IPS, 2560x1600, 16", 165 Hz | |
|---|---|---|---|---|---|---|---|
| Display | 0% | -2% | -19% | -5% | -17% | -18% | |
| Display P3 Coverage (%) | 99.9 | 99.3 -1% | 98.8 -1% | 69.4 -31% | 95.5 -4% | 70.8 -29% | 69.4 -31% |
| sRGB Coverage (%) | 100 | 100 0% | 100 0% | 97.2 -3% | 99.7 0% | 99.8 0% | 99.5 0% |
| AdobeRGB 1998 Coverage (%) | 93.3 | 93.9 1% | 88.4 -5% | 71.9 -23% | 83.9 -10% | 72.6 -22% | 71.6 -23% |
| Response Times | -121% | -1278% | -877% | -832% | -2081% | -1781% | |
| Response Time Grey 50% / Grey 80% * (ms) | 0.56 ? | 2 ? -257% | 10.7 ? -1811% | 6.3 ? -1025% | 3.59 ? -541% | 16.8 ? -2900% | 14.3 ? -2454% |
| Response Time Black / White * (ms) | 0.58 ? | 1.4 ? -141% | 4.9 ? -745% | 4.8 ? -728% | 7.09 ? -1122% | 7.9 ? -1262% | 7 ? -1107% |
| PWM Frequency (Hz) | 480 ? | 1300 | |||||
| PWM Amplitude * (%) | 26 | 16.7 36% | |||||
| Screen | -2% | 16% | 26% | -49% | -20% | -29% | |
| Brightness middle (cd/m²) | 434 | 521 20% | 512 18% | 480 11% | 472 9% | 443 2% | 432 0% |
| Brightness (cd/m²) | 433 | 519 20% | 483 12% | 456 5% | 438 1% | 433 0% | 425 -2% |
| Brightness Distribution (%) | 99 | 98 -1% | 91 -8% | 91 -8% | 88 -11% | 90 -9% | 91 -8% |
| Black Level * (cd/m²) | 0.075 | 0.43 | 0.32 | 0.4 | 0.42 | 0.37 | |
| Colorchecker dE 2000 * | 3 | 2.5 17% | 2.4 20% | 1.4 53% | 6.07 -102% | 3.82 -27% | 4.76 -59% |
| Colorchecker dE 2000 max. * | 5.1 | 4.85 5% | 3.8 25% | 2.5 51% | 9.76 -91% | 7.61 -49% | 8.59 -68% |
| Colorchecker dE 2000 calibrated * | 1.4 | 2.5 -79% | 0.9 36% | 1.3 7% | 2.25 -61% | 1.33 5% | 1.18 16% |
| Greyscale dE 2000 * | 3.4 | 3.17 7% | 3.1 9% | 1.2 65% | 6.4 -88% | 5.5 -62% | 6.2 -82% |
| Gamma | 2.47 89% | 2.35 94% | 2.41 91% | 2.16 102% | 2.52 87% | 2.249 98% | 2.079 106% |
| CCT | 6452 101% | 6454 101% | 6534 99% | 6620 98% | 7987 81% | 6549 99% | 6690 97% |
| Contrast (:1) | 6947 | 1191 | 1500 | 1180 | 1055 | 1168 | |
| Total Average (Program / Settings) | -41% /
-29% | -421% /
-204% | -290% /
-136% | -295% /
-168% | -706% /
-363% | -609% /
-318% |
* ... smaller is better


Display Response Times
| ↔ Response Time Black to White | ||
|---|---|---|
| 0.58 ms ... rise ↗ and fall ↘ combined | ↗ 0.33 ms rise |  |
| ↘ 0.25 ms fall | ||
| The screen shows very fast response rates in our tests and should be very well suited for fast-paced gaming. In comparison, all tested devices range from 0.1 (minimum) to 240 (maximum) ms. » 1 % of all devices are better. This means that the measured response time is better than the average of all tested devices (19.8 ms). | ||
| ↔ Response Time 50% Grey to 80% Grey | ||
| 0.56 ms ... rise ↗ and fall ↘ combined | ↗ 0.3 ms rise | 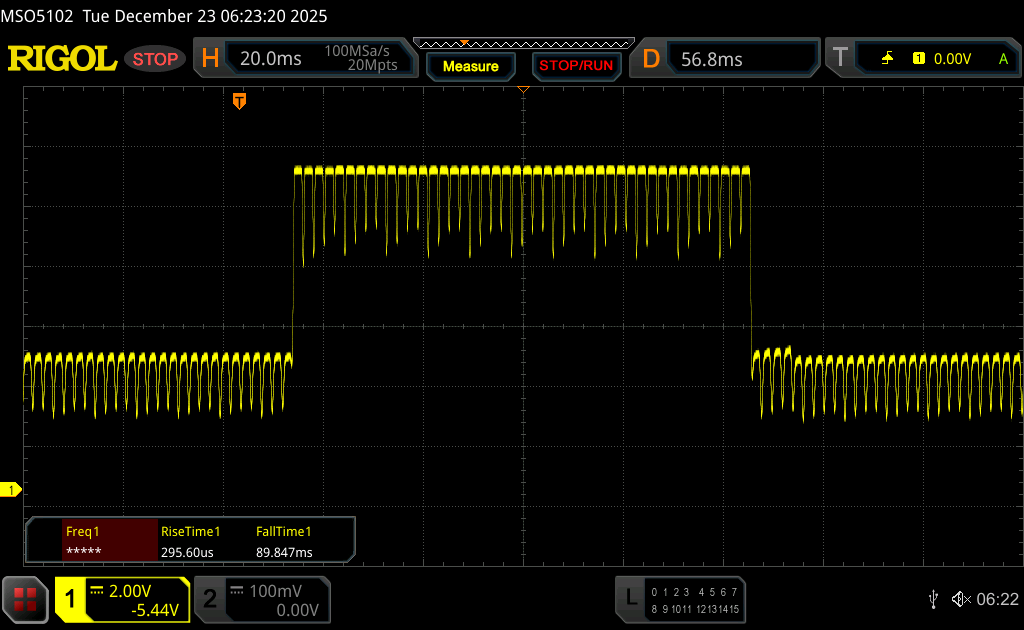 |
| ↘ 0.26 ms fall | ||
| The screen shows very fast response rates in our tests and should be very well suited for fast-paced gaming. In comparison, all tested devices range from 0.165 (minimum) to 636 (maximum) ms. » 1 % of all devices are better. This means that the measured response time is better than the average of all tested devices (31 ms). | ||
Screen Flickering / PWM (Pulse-Width Modulation)
| Screen flickering / PWM detected | 480 Hz Amplitude: 26 % | ≤ 92 % brightness setting | 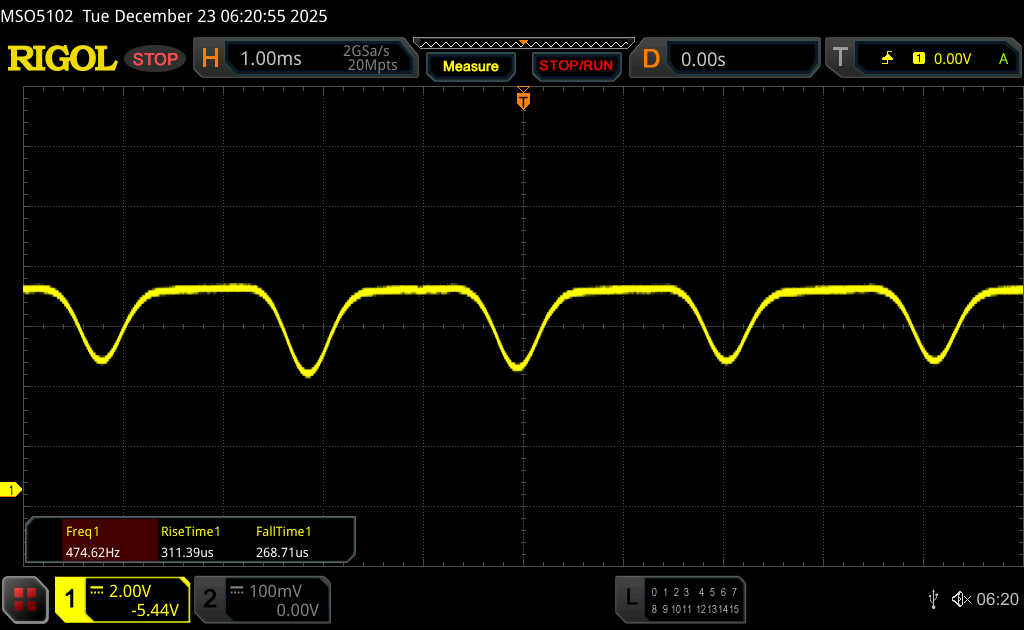 |
The display backlight flickers at 480 Hz (worst case, e.g., utilizing PWM) Flickering detected at a brightness setting of 92 % and below. There should be no flickering or PWM above this brightness setting. The frequency of 480 Hz is relatively high, so most users sensitive to PWM should not notice any flickering. However, there are reports that some users are still sensitive to PWM at 500 Hz and above, so be aware. In comparison: 52 % of all tested devices do not use PWM to dim the display. If PWM was detected, an average of 7781 (minimum: 5 - maximum: 343500) Hz was measured. | |||


性能 - 箭湖 HX 和布莱克韦尔
测试条件
XMG 提供多种电源配置文件,我们在 "超频-正常"模式下进行了基准测试。此外,还提供了 "超频-极致 "模式,但该模式在游戏中并未带来任何额外的性能提升。
处理器
英特尔 英特尔酷睿至尊 9 275HX在 Fusion 16 中的功耗可达 150/140 瓦,整体性能出色。与 XMG Core 16 中的 AMD Ryzen AI 9 HX 370 相比,在所有 CPU 基准测试中,275HX 平均快 28%。使用电池供电时,处理器的功率限制在 40 瓦,导致多核性能下降 35%。
Cinebench R15 多耐久性测试
Cinebench 2024: CPU Multi Core | CPU Single Core
Cinebench R23: Multi Core | Single Core
Cinebench R20: CPU (Multi Core) | CPU (Single Core)
Cinebench R15: CPU Multi 64Bit | CPU Single 64Bit
Blender: v2.79 BMW27 CPU
7-Zip 18.03: 7z b 4 | 7z b 4 -mmt1
Geekbench 6.7: Multi-Core | Single-Core
Geekbench 5.5: Multi-Core | Single-Core
HWBOT x265 Benchmark v2.2: 4k Preset
LibreOffice : 20 Documents To PDF
R Benchmark 2.5: Overall mean
| CPU Performance rating | |
| Average Intel Core Ultra 9 275HX | |
| Aorus Elite 16 AE6H -1! | |
| MSI Crosshair 16 HX AI D2XWGKG | |
| Schenker XMG FUSION 16 (M25) | |
| Lenovo Legion Pro 5 16IAX10, RTX 5070 -2! | |
| Average of class Gaming | |
| Schenker XMG Core 16 M25 | |
| Asus TUF Gaming A16 FA608UP | |
| Gigabyte Gaming A16 GA6H | |
| Cinebench 2024 / CPU Multi Core | |
| Average Intel Core Ultra 9 275HX (1547 - 2288, n=27) | |
| Schenker XMG FUSION 16 (M25) | |
| Aorus Elite 16 AE6H | |
| MSI Crosshair 16 HX AI D2XWGKG | |
| Average of class Gaming (486 - 2298, n=92, last 2 years) | |
| Schenker XMG Core 16 M25 | |
| Asus TUF Gaming A16 FA608UP | |
| Gigabyte Gaming A16 GA6H | |
| Cinebench 2024 / CPU Single Core | |
| Schenker XMG FUSION 16 (M25) | |
| MSI Crosshair 16 HX AI D2XWGKG | |
| Average Intel Core Ultra 9 275HX (123.1 - 138.2, n=27) | |
| Aorus Elite 16 AE6H | |
| Average of class Gaming (95 - 138.2, n=92, last 2 years) | |
| Schenker XMG Core 16 M25 | |
| Gigabyte Gaming A16 GA6H | |
| Asus TUF Gaming A16 FA608UP | |
| Cinebench R23 / Multi Core | |
| Average Intel Core Ultra 9 275HX (30712 - 40970, n=31) | |
| MSI Crosshair 16 HX AI D2XWGKG | |
| Schenker XMG FUSION 16 (M25) | |
| Aorus Elite 16 AE6H | |
| Lenovo Legion Pro 5 16IAX10, RTX 5070 | |
| Average of class Gaming (10488 - 40970, n=112, last 2 years) | |
| Schenker XMG Core 16 M25 | |
| Asus TUF Gaming A16 FA608UP | |
| Gigabyte Gaming A16 GA6H | |
| Cinebench R23 / Single Core | |
| Schenker XMG FUSION 16 (M25) | |
| MSI Crosshair 16 HX AI D2XWGKG | |
| Average Intel Core Ultra 9 275HX (2009 - 2267, n=31) | |
| Lenovo Legion Pro 5 16IAX10, RTX 5070 | |
| Aorus Elite 16 AE6H | |
| Schenker XMG Core 16 M25 | |
| Average of class Gaming (1166 - 2356, n=112, last 2 years) | |
| Gigabyte Gaming A16 GA6H | |
| Asus TUF Gaming A16 FA608UP | |
| Cinebench R20 / CPU (Multi Core) | |
| Average Intel Core Ultra 9 275HX (12026 - 16108, n=30) | |
| MSI Crosshair 16 HX AI D2XWGKG | |
| Schenker XMG FUSION 16 (M25) | |
| Aorus Elite 16 AE6H | |
| Lenovo Legion Pro 5 16IAX10, RTX 5070 | |
| Average of class Gaming (4029 - 16108, n=111, last 2 years) | |
| Schenker XMG Core 16 M25 | |
| Asus TUF Gaming A16 FA608UP | |
| Gigabyte Gaming A16 GA6H | |
| Cinebench R20 / CPU (Single Core) | |
| Schenker XMG FUSION 16 (M25) | |
| MSI Crosshair 16 HX AI D2XWGKG | |
| Average Intel Core Ultra 9 275HX (774 - 870, n=30) | |
| Aorus Elite 16 AE6H | |
| Lenovo Legion Pro 5 16IAX10, RTX 5070 | |
| Schenker XMG Core 16 M25 | |
| Average of class Gaming (442 - 895, n=111, last 2 years) | |
| Gigabyte Gaming A16 GA6H | |
| Asus TUF Gaming A16 FA608UP | |
| Cinebench R15 / CPU Multi 64Bit | |
| Average Intel Core Ultra 9 275HX (4737 - 6271, n=30) | |
| MSI Crosshair 16 HX AI D2XWGKG | |
| Aorus Elite 16 AE6H | |
| Schenker XMG FUSION 16 (M25) | |
| Lenovo Legion Pro 5 16IAX10, RTX 5070 | |
| Average of class Gaming (1578 - 6271, n=111, last 2 years) | |
| Schenker XMG Core 16 M25 | |
| Asus TUF Gaming A16 FA608UP | |
| Gigabyte Gaming A16 GA6H | |
| Cinebench R15 / CPU Single 64Bit | |
| Schenker XMG FUSION 16 (M25) | |
| Average Intel Core Ultra 9 275HX (306 - 343, n=31) | |
| MSI Crosshair 16 HX AI D2XWGKG | |
| Lenovo Legion Pro 5 16IAX10, RTX 5070 | |
| Aorus Elite 16 AE6H | |
| Average of class Gaming (188.8 - 343, n=111, last 2 years) | |
| Asus TUF Gaming A16 FA608UP | |
| Gigabyte Gaming A16 GA6H | |
| Schenker XMG Core 16 M25 | |
| Blender / v2.79 BMW27 CPU | |
| Gigabyte Gaming A16 GA6H | |
| Asus TUF Gaming A16 FA608UP | |
| Average of class Gaming (80 - 330, n=109, last 2 years) | |
| Schenker XMG Core 16 M25 | |
| Lenovo Legion Pro 5 16IAX10, RTX 5070 | |
| Schenker XMG FUSION 16 (M25) | |
| MSI Crosshair 16 HX AI D2XWGKG | |
| Average Intel Core Ultra 9 275HX (82 - 116, n=29) | |
| 7-Zip 18.03 / 7z b 4 | |
| Average Intel Core Ultra 9 275HX (98236 - 124155, n=30) | |
| Schenker XMG FUSION 16 (M25) | |
| Aorus Elite 16 AE6H | |
| MSI Crosshair 16 HX AI D2XWGKG | |
| Lenovo Legion Pro 5 16IAX10, RTX 5070 | |
| Average of class Gaming (33491 - 148086, n=110, last 2 years) | |
| Schenker XMG Core 16 M25 | |
| Asus TUF Gaming A16 FA608UP | |
| Gigabyte Gaming A16 GA6H | |
| 7-Zip 18.03 / 7z b 4 -mmt1 | |
| Schenker XMG FUSION 16 (M25) | |
| MSI Crosshair 16 HX AI D2XWGKG | |
| Average Intel Core Ultra 9 275HX (6026 - 7149, n=30) | |
| Lenovo Legion Pro 5 16IAX10, RTX 5070 | |
| Schenker XMG Core 16 M25 | |
| Average of class Gaming (4199 - 7436, n=110, last 2 years) | |
| Aorus Elite 16 AE6H | |
| Asus TUF Gaming A16 FA608UP | |
| Gigabyte Gaming A16 GA6H | |
| Geekbench 6.7 / Multi-Core | |
| Lenovo Legion Pro 5 16IAX10, RTX 5070 | |
| Average Intel Core Ultra 9 275HX (16033 - 21668, n=33) | |
| Schenker XMG FUSION 16 (M25) | |
| Aorus Elite 16 AE6H | |
| MSI Crosshair 16 HX AI D2XWGKG | |
| Schenker XMG Core 16 M25 | |
| Average of class Gaming (6625 - 22104, n=111, last 2 years) | |
| Asus TUF Gaming A16 FA608UP | |
| Gigabyte Gaming A16 GA6H | |
| Geekbench 6.7 / Single-Core | |
| Schenker XMG FUSION 16 (M25) | |
| MSI Crosshair 16 HX AI D2XWGKG | |
| Average Intel Core Ultra 9 275HX (2843 - 3160, n=33) | |
| Lenovo Legion Pro 5 16IAX10, RTX 5070 | |
| Aorus Elite 16 AE6H | |
| Schenker XMG Core 16 M25 | |
| Average of class Gaming (1490 - 3259, n=111, last 2 years) | |
| Asus TUF Gaming A16 FA608UP | |
| Gigabyte Gaming A16 GA6H | |
| Geekbench 5.5 / Multi-Core | |
| Schenker XMG FUSION 16 (M25) | |
| Average Intel Core Ultra 9 275HX (19105 - 25855, n=31) | |
| Aorus Elite 16 AE6H | |
| MSI Crosshair 16 HX AI D2XWGKG | |
| Lenovo Legion Pro 5 16IAX10, RTX 5070 | |
| Average of class Gaming (6460 - 27010, n=110, last 2 years) | |
| Schenker XMG Core 16 M25 | |
| Asus TUF Gaming A16 FA608UP | |
| Gigabyte Gaming A16 GA6H | |
| Geekbench 5.5 / Single-Core | |
| Schenker XMG FUSION 16 (M25) | |
| MSI Crosshair 16 HX AI D2XWGKG | |
| Lenovo Legion Pro 5 16IAX10, RTX 5070 | |
| Average Intel Core Ultra 9 275HX (2033 - 2292, n=31) | |
| Aorus Elite 16 AE6H | |
| Schenker XMG Core 16 M25 | |
| Average of class Gaming (986 - 2474, n=110, last 2 years) | |
| Asus TUF Gaming A16 FA608UP | |
| Gigabyte Gaming A16 GA6H | |
| HWBOT x265 Benchmark v2.2 / 4k Preset | |
| Average Intel Core Ultra 9 275HX (30.7 - 43.8, n=30) | |
| Lenovo Legion Pro 5 16IAX10, RTX 5070 | |
| MSI Crosshair 16 HX AI D2XWGKG | |
| Aorus Elite 16 AE6H | |
| Schenker XMG FUSION 16 (M25) | |
| Schenker XMG Core 16 M25 | |
| Average of class Gaming (11.5 - 44.3, n=110, last 2 years) | |
| Asus TUF Gaming A16 FA608UP | |
| Gigabyte Gaming A16 GA6H | |
| LibreOffice / 20 Documents To PDF | |
| Asus TUF Gaming A16 FA608UP | |
| Gigabyte Gaming A16 GA6H | |
| Schenker XMG Core 16 M25 | |
| Schenker XMG FUSION 16 (M25) | |
| Average of class Gaming (19 - 88.8, n=110, last 2 years) | |
| Lenovo Legion Pro 5 16IAX10, RTX 5070 | |
| Average Intel Core Ultra 9 275HX (33.2 - 62.1, n=30) | |
| MSI Crosshair 16 HX AI D2XWGKG | |
| Aorus Elite 16 AE6H | |
| R Benchmark 2.5 / Overall mean | |
| Gigabyte Gaming A16 GA6H | |
| Asus TUF Gaming A16 FA608UP | |
| Average of class Gaming (0.3439 - 0.759, n=111, last 2 years) | |
| Aorus Elite 16 AE6H | |
| Lenovo Legion Pro 5 16IAX10, RTX 5070 | |
| Average Intel Core Ultra 9 275HX (0.3943 - 0.4568, n=30) | |
| Schenker XMG FUSION 16 (M25) | |
| MSI Crosshair 16 HX AI D2XWGKG | |
| Schenker XMG Core 16 M25 | |
* ... smaller is better
AIDA64: FP32 Ray-Trace | FPU Julia | CPU SHA3 | CPU Queen | FPU SinJulia | FPU Mandel | CPU AES | CPU ZLib | FP64 Ray-Trace | CPU PhotoWorxx
| Performance rating | |
| Average Intel Core Ultra 9 275HX | |
| MSI Crosshair 16 HX AI D2XWGKG | |
| Schenker XMG FUSION 16 (M25) | |
| Lenovo Legion Pro 5 16IAX10, RTX 5070 | |
| Aorus Elite 16 AE6H | |
| Schenker XMG Core 16 M25 | |
| Average of class Gaming | |
| Asus TUF Gaming A16 FA608UP | |
| Gigabyte Gaming A16 GA6H | |
| AIDA64 / FP32 Ray-Trace | |
| Schenker XMG Core 16 M25 | |
| MSI Crosshair 16 HX AI D2XWGKG | |
| Average Intel Core Ultra 9 275HX (28039 - 39895, n=30) | |
| Schenker XMG FUSION 16 (M25) | |
| Lenovo Legion Pro 5 16IAX10, RTX 5070 | |
| Aorus Elite 16 AE6H | |
| Average of class Gaming (10227 - 85542, n=109, last 2 years) | |
| Asus TUF Gaming A16 FA608UP | |
| Gigabyte Gaming A16 GA6H | |
| AIDA64 / FPU Julia | |
| MSI Crosshair 16 HX AI D2XWGKG | |
| Average Intel Core Ultra 9 275HX (140254 - 200744, n=30) | |
| Schenker XMG FUSION 16 (M25) | |
| Lenovo Legion Pro 5 16IAX10, RTX 5070 | |
| Aorus Elite 16 AE6H | |
| Schenker XMG Core 16 M25 | |
| Average of class Gaming (51376 - 238426, n=109, last 2 years) | |
| Asus TUF Gaming A16 FA608UP | |
| Gigabyte Gaming A16 GA6H | |
| AIDA64 / CPU SHA3 | |
| Average Intel Core Ultra 9 275HX (6710 - 9817, n=30) | |
| MSI Crosshair 16 HX AI D2XWGKG | |
| Schenker XMG FUSION 16 (M25) | |
| Aorus Elite 16 AE6H | |
| Lenovo Legion Pro 5 16IAX10, RTX 5070 | |
| Average of class Gaming (2180 - 9817, n=109, last 2 years) | |
| Schenker XMG Core 16 M25 | |
| Asus TUF Gaming A16 FA608UP | |
| Gigabyte Gaming A16 GA6H | |
| AIDA64 / CPU Queen | |
| Lenovo Legion Pro 5 16IAX10, RTX 5070 | |
| Average Intel Core Ultra 9 275HX (113887 - 140937, n=30) | |
| Aorus Elite 16 AE6H | |
| MSI Crosshair 16 HX AI D2XWGKG | |
| Schenker XMG FUSION 16 (M25) | |
| Asus TUF Gaming A16 FA608UP | |
| Average of class Gaming (49785 - 173351, n=98, last 2 years) | |
| Schenker XMG Core 16 M25 | |
| Gigabyte Gaming A16 GA6H | |
| AIDA64 / FPU SinJulia | |
| Schenker XMG Core 16 M25 | |
| Asus TUF Gaming A16 FA608UP | |
| Average of class Gaming (4424 - 33636, n=109, last 2 years) | |
| Average Intel Core Ultra 9 275HX (11172 - 14425, n=30) | |
| MSI Crosshair 16 HX AI D2XWGKG | |
| Aorus Elite 16 AE6H | |
| Schenker XMG FUSION 16 (M25) | |
| Lenovo Legion Pro 5 16IAX10, RTX 5070 | |
| Gigabyte Gaming A16 GA6H | |
| AIDA64 / FPU Mandel | |
| MSI Crosshair 16 HX AI D2XWGKG | |
| Average Intel Core Ultra 9 275HX (72596 - 104508, n=30) | |
| Schenker XMG FUSION 16 (M25) | |
| Lenovo Legion Pro 5 16IAX10, RTX 5070 | |
| Aorus Elite 16 AE6H | |
| Schenker XMG Core 16 M25 | |
| Average of class Gaming (25115 - 128721, n=109, last 2 years) | |
| Asus TUF Gaming A16 FA608UP | |
| Gigabyte Gaming A16 GA6H | |
| AIDA64 / CPU AES | |
| Average Intel Core Ultra 9 275HX (105608 - 247074, n=30) | |
| MSI Crosshair 16 HX AI D2XWGKG | |
| Schenker XMG FUSION 16 (M25) | |
| Schenker XMG Core 16 M25 | |
| Lenovo Legion Pro 5 16IAX10, RTX 5070 | |
| Aorus Elite 16 AE6H | |
| Average of class Gaming (39258 - 247074, n=109, last 2 years) | |
| Asus TUF Gaming A16 FA608UP | |
| Gigabyte Gaming A16 GA6H | |
| AIDA64 / CPU ZLib | |
| Average Intel Core Ultra 9 275HX (1582 - 2263, n=30) | |
| MSI Crosshair 16 HX AI D2XWGKG | |
| Schenker XMG FUSION 16 (M25) | |
| Aorus Elite 16 AE6H | |
| Lenovo Legion Pro 5 16IAX10, RTX 5070 | |
| Average of class Gaming (574 - 2531, n=109, last 2 years) | |
| Schenker XMG Core 16 M25 | |
| Asus TUF Gaming A16 FA608UP | |
| Gigabyte Gaming A16 GA6H | |
| AIDA64 / FP64 Ray-Trace | |
| Schenker XMG Core 16 M25 | |
| MSI Crosshair 16 HX AI D2XWGKG | |
| Average Intel Core Ultra 9 275HX (14847 - 21854, n=30) | |
| Schenker XMG FUSION 16 (M25) | |
| Lenovo Legion Pro 5 16IAX10, RTX 5070 | |
| Aorus Elite 16 AE6H | |
| Average of class Gaming (5509 - 45446, n=109, last 2 years) | |
| Asus TUF Gaming A16 FA608UP | |
| Gigabyte Gaming A16 GA6H | |
| AIDA64 / CPU PhotoWorxx | |
| Lenovo Legion Pro 5 16IAX10, RTX 5070 | |
| Schenker XMG Core 16 M25 | |
| Schenker XMG FUSION 16 (M25) | |
| Average Intel Core Ultra 9 275HX (37482 - 62916, n=30) | |
| Aorus Elite 16 AE6H | |
| Average of class Gaming (12271 - 89891, n=109, last 2 years) | |
| Asus TUF Gaming A16 FA608UP | |
| MSI Crosshair 16 HX AI D2XWGKG | |
| Gigabyte Gaming A16 GA6H | |
系统性能
主观性能印象极佳,合成基准测试结果也非常好。
PCMark 10: Score | Essentials | Productivity | Digital Content Creation
CrossMark: Overall | Productivity | Creativity | Responsiveness
WebXPRT 3: Overall
WebXPRT 4: Overall
Mozilla Kraken 1.1: Total
| Performance rating | |
| Schenker XMG FUSION 16 (M25) | |
| Lenovo Legion Pro 5 16IAX10, RTX 5070 | |
| Average Intel Core Ultra 9 275HX, NVIDIA GeForce RTX 5070 Laptop | |
| Schenker XMG Core 16 M25 -4! | |
| MSI Crosshair 16 HX AI D2XWGKG | |
| Aorus Elite 16 AE6H | |
| Average of class Gaming | |
| Gigabyte Gaming A16 GA6H | |
| Asus TUF Gaming A16 FA608UP -4! | |
| PCMark 10 / Score | |
| Schenker XMG FUSION 16 (M25) | |
| Lenovo Legion Pro 5 16IAX10, RTX 5070 | |
| Average Intel Core Ultra 9 275HX, NVIDIA GeForce RTX 5070 Laptop (8018 - 9667, n=4) | |
| Average of class Gaming (5828 - 11574, n=96, last 2 years) | |
| MSI Crosshair 16 HX AI D2XWGKG | |
| Aorus Elite 16 AE6H | |
| Gigabyte Gaming A16 GA6H | |
| PCMark 10 / Essentials | |
| Lenovo Legion Pro 5 16IAX10, RTX 5070 | |
| Aorus Elite 16 AE6H | |
| MSI Crosshair 16 HX AI D2XWGKG | |
| Average Intel Core Ultra 9 275HX, NVIDIA GeForce RTX 5070 Laptop (10259 - 11025, n=4) | |
| Average of class Gaming (8810 - 12600, n=100, last 2 years) | |
| Schenker XMG FUSION 16 (M25) | |
| Gigabyte Gaming A16 GA6H | |
| PCMark 10 / Productivity | |
| Schenker XMG FUSION 16 (M25) | |
| Average Intel Core Ultra 9 275HX, NVIDIA GeForce RTX 5070 Laptop (8307 - 16716, n=4) | |
| Average of class Gaming (6845 - 21327, n=98, last 2 years) | |
| Lenovo Legion Pro 5 16IAX10, RTX 5070 | |
| Aorus Elite 16 AE6H | |
| MSI Crosshair 16 HX AI D2XWGKG | |
| Gigabyte Gaming A16 GA6H | |
| PCMark 10 / Digital Content Creation | |
| Lenovo Legion Pro 5 16IAX10, RTX 5070 | |
| MSI Crosshair 16 HX AI D2XWGKG | |
| Average Intel Core Ultra 9 275HX, NVIDIA GeForce RTX 5070 Laptop (13010 - 16417, n=4) | |
| Schenker XMG FUSION 16 (M25) | |
| Aorus Elite 16 AE6H | |
| Average of class Gaming (7602 - 19657, n=98, last 2 years) | |
| Gigabyte Gaming A16 GA6H | |
| CrossMark / Overall | |
| Average Intel Core Ultra 9 275HX, NVIDIA GeForce RTX 5070 Laptop (2084 - 2269, n=5) | |
| Aorus Elite 16 AE6H | |
| MSI Crosshair 16 HX AI D2XWGKG | |
| Schenker XMG FUSION 16 (M25) | |
| Lenovo Legion Pro 5 16IAX10, RTX 5070 | |
| Schenker XMG Core 16 M25 | |
| Average of class Gaming (1366 - 2409, n=97, last 2 years) | |
| Gigabyte Gaming A16 GA6H | |
| Asus TUF Gaming A16 FA608UP | |
| CrossMark / Productivity | |
| Aorus Elite 16 AE6H | |
| Average Intel Core Ultra 9 275HX, NVIDIA GeForce RTX 5070 Laptop (1931 - 2173, n=5) | |
| MSI Crosshair 16 HX AI D2XWGKG | |
| Schenker XMG FUSION 16 (M25) | |
| Lenovo Legion Pro 5 16IAX10, RTX 5070 | |
| Average of class Gaming (1386 - 2254, n=97, last 2 years) | |
| Schenker XMG Core 16 M25 | |
| Gigabyte Gaming A16 GA6H | |
| Asus TUF Gaming A16 FA608UP | |
| CrossMark / Creativity | |
| Schenker XMG Core 16 M25 | |
| Schenker XMG FUSION 16 (M25) | |
| Average Intel Core Ultra 9 275HX, NVIDIA GeForce RTX 5070 Laptop (2322 - 2430, n=5) | |
| MSI Crosshair 16 HX AI D2XWGKG | |
| Aorus Elite 16 AE6H | |
| Lenovo Legion Pro 5 16IAX10, RTX 5070 | |
| Average of class Gaming (1343 - 2729, n=97, last 2 years) | |
| Asus TUF Gaming A16 FA608UP | |
| Gigabyte Gaming A16 GA6H | |
| CrossMark / Responsiveness | |
| Aorus Elite 16 AE6H | |
| Average Intel Core Ultra 9 275HX, NVIDIA GeForce RTX 5070 Laptop (1754 - 2143, n=5) | |
| Gigabyte Gaming A16 GA6H | |
| MSI Crosshair 16 HX AI D2XWGKG | |
| Schenker XMG FUSION 16 (M25) | |
| Lenovo Legion Pro 5 16IAX10, RTX 5070 | |
| Average of class Gaming (1226 - 2334, n=97, last 2 years) | |
| Schenker XMG Core 16 M25 | |
| Asus TUF Gaming A16 FA608UP | |
| WebXPRT 3 / Overall | |
| Schenker XMG Core 16 M25 | |
| Schenker XMG FUSION 16 (M25) | |
| Lenovo Legion Pro 5 16IAX10, RTX 5070 | |
| Average Intel Core Ultra 9 275HX, NVIDIA GeForce RTX 5070 Laptop (309 - 364, n=5) | |
| MSI Crosshair 16 HX AI D2XWGKG | |
| Average of class Gaming (242 - 532, n=101, last 2 years) | |
| Aorus Elite 16 AE6H | |
| Asus TUF Gaming A16 FA608UP | |
| Gigabyte Gaming A16 GA6H | |
| WebXPRT 4 / Overall | |
| Schenker XMG Core 16 M25 | |
| Aorus Elite 16 AE6H | |
| Lenovo Legion Pro 5 16IAX10, RTX 5070 | |
| Average Intel Core Ultra 9 275HX, NVIDIA GeForce RTX 5070 Laptop (297 - 330, n=5) | |
| MSI Crosshair 16 HX AI D2XWGKG | |
| Schenker XMG FUSION 16 (M25) | |
| Average of class Gaming (176.4 - 354, n=101, last 2 years) | |
| Gigabyte Gaming A16 GA6H | |
| Asus TUF Gaming A16 FA608UP | |
| Mozilla Kraken 1.1 / Total | |
| Asus TUF Gaming A16 FA608UP | |
| Gigabyte Gaming A16 GA6H | |
| Average of class Gaming (391 - 590, n=106, last 2 years) | |
| Lenovo Legion Pro 5 16IAX10, RTX 5070 | |
| Schenker XMG FUSION 16 (M25) | |
| Aorus Elite 16 AE6H | |
| Average Intel Core Ultra 9 275HX, NVIDIA GeForce RTX 5070 Laptop (407 - 431, n=5) | |
| Schenker XMG Core 16 M25 | |
| MSI Crosshair 16 HX AI D2XWGKG | |
* ... smaller is better
| PCMark 10 Score | 9667 points | |
Help | ||
| AIDA64 / Memory Copy | |
| Lenovo Legion Pro 5 16IAX10, RTX 5070 | |
| Schenker XMG FUSION 16 (M25) | |
| Average Intel Core Ultra 9 275HX (56003 - 94460, n=30) | |
| Aorus Elite 16 AE6H | |
| Schenker XMG Core 16 M25 | |
| Average of class Gaming (21750 - 129946, n=109, last 2 years) | |
| MSI Crosshair 16 HX AI D2XWGKG | |
| Asus TUF Gaming A16 FA608UP | |
| Gigabyte Gaming A16 GA6H | |
| AIDA64 / Memory Read | |
| Lenovo Legion Pro 5 16IAX10, RTX 5070 | |
| Schenker XMG FUSION 16 (M25) | |
| Aorus Elite 16 AE6H | |
| Schenker XMG Core 16 M25 | |
| Average Intel Core Ultra 9 275HX (55795 - 97151, n=30) | |
| MSI Crosshair 16 HX AI D2XWGKG | |
| Average of class Gaming (22956 - 118858, n=109, last 2 years) | |
| Asus TUF Gaming A16 FA608UP | |
| Gigabyte Gaming A16 GA6H | |
| AIDA64 / Memory Write | |
| Aorus Elite 16 AE6H | |
| Asus TUF Gaming A16 FA608UP | |
| Lenovo Legion Pro 5 16IAX10, RTX 5070 | |
| Schenker XMG FUSION 16 (M25) | |
| Schenker XMG Core 16 M25 | |
| Average Intel Core Ultra 9 275HX (55663 - 116129, n=30) | |
| Average of class Gaming (22297 - 135096, n=109, last 2 years) | |
| MSI Crosshair 16 HX AI D2XWGKG | |
| Gigabyte Gaming A16 GA6H | |
| AIDA64 / Memory Latency | |
| Average Intel Core Ultra 9 275HX (105.8 - 161.6, n=30) | |
| Aorus Elite 16 AE6H | |
| MSI Crosshair 16 HX AI D2XWGKG | |
| Schenker XMG FUSION 16 (M25) | |
| Average of class Gaming (75.3 - 259, n=109, last 2 years) | |
| Lenovo Legion Pro 5 16IAX10, RTX 5070 | |
| Gigabyte Gaming A16 GA6H | |
| Asus TUF Gaming A16 FA608UP | |
| Schenker XMG Core 16 M25 | |
* ... smaller is better
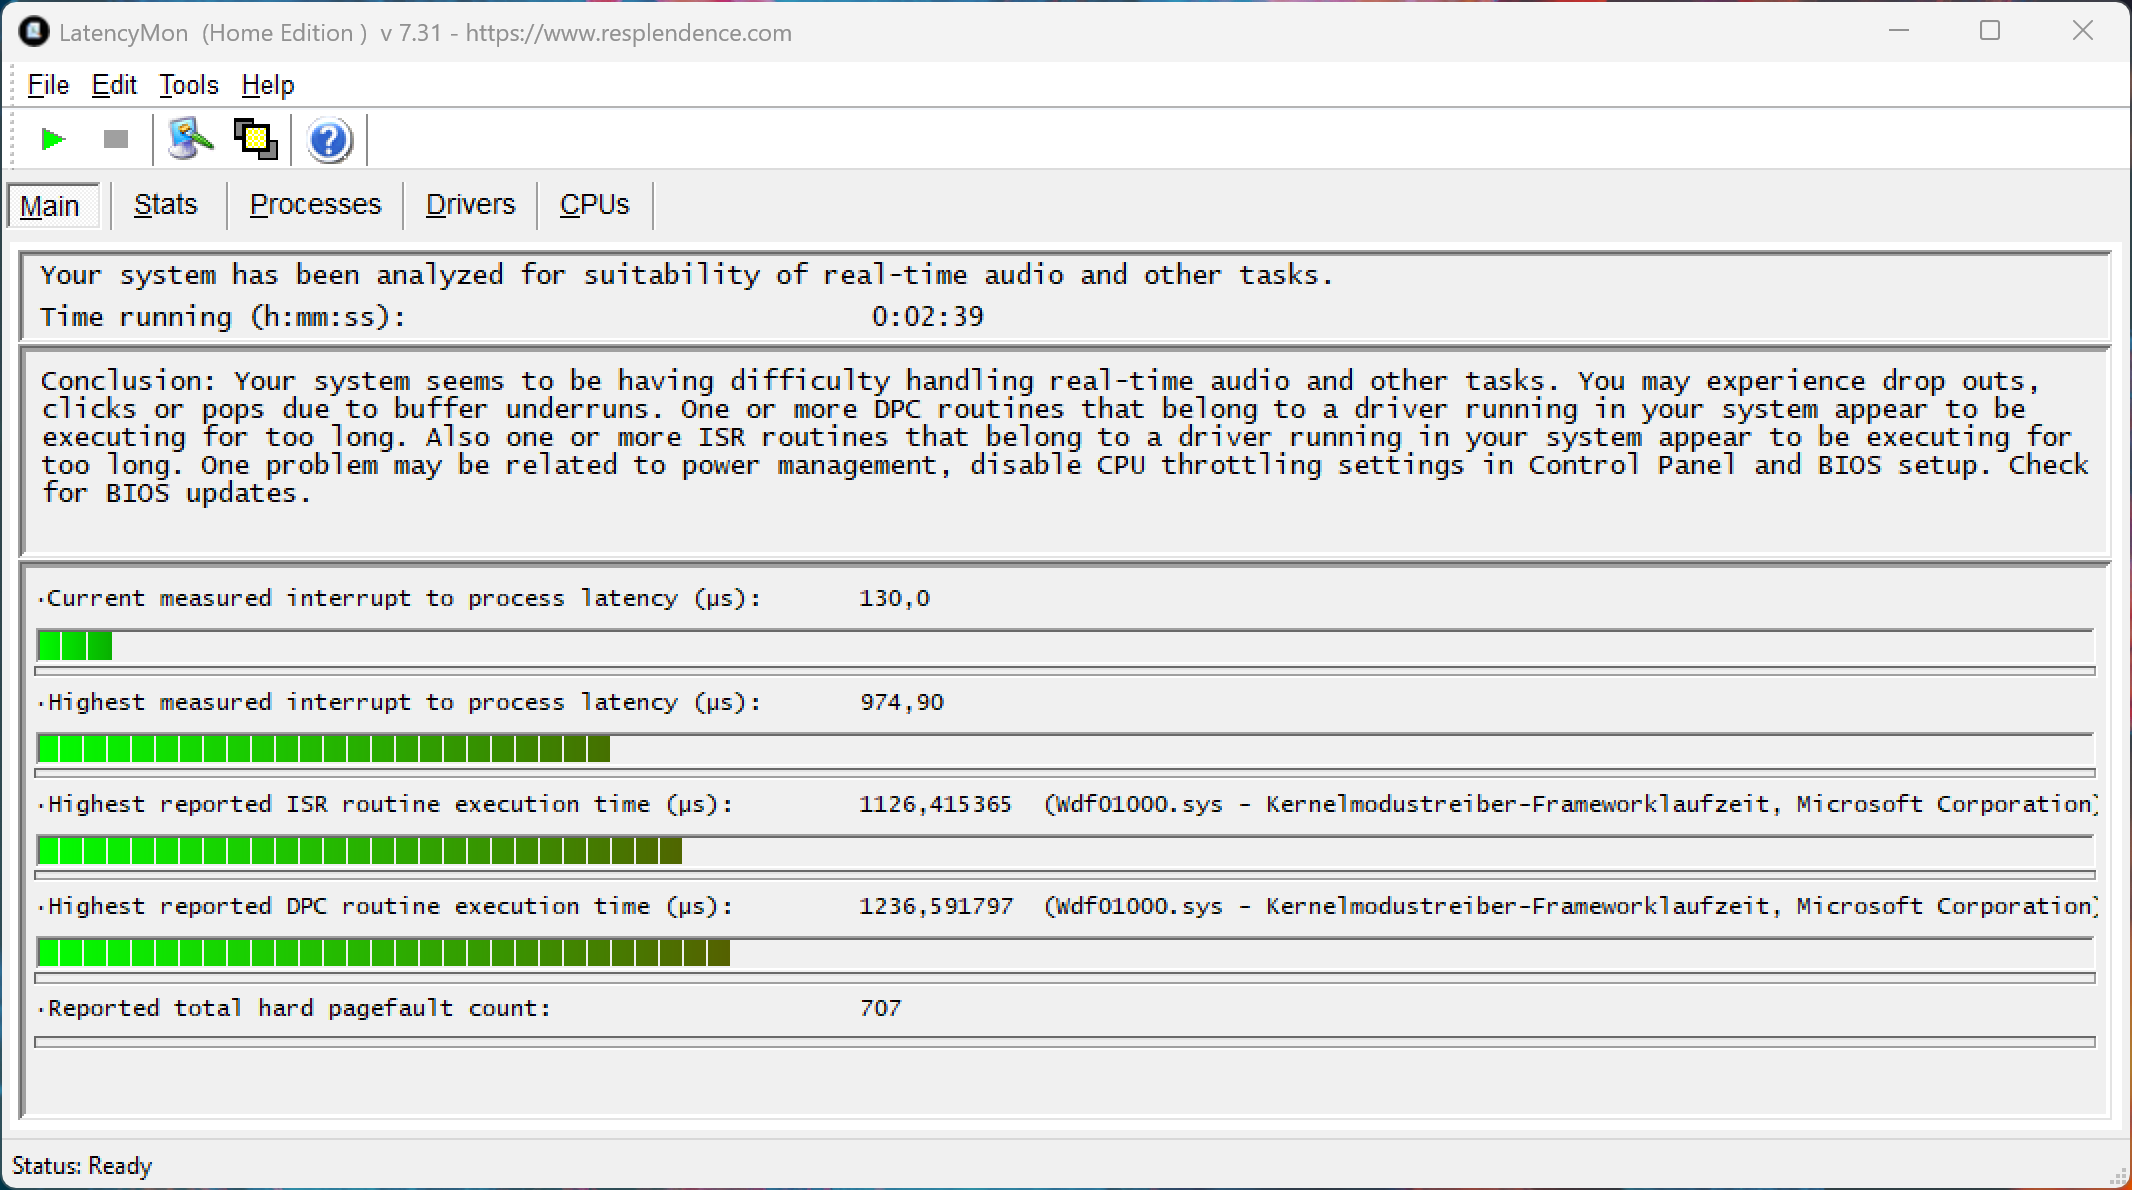
DPC 延迟
在我们的标准化延迟测试中,采用当前 BIOS 版本的评测设备在使用实时音频应用程序时显示出轻微的局限性。

| DPC Latencies / LatencyMon - interrupt to process latency (max), Web, Youtube, Prime95 | |
| Gigabyte Gaming A16 GA6H | |
| MSI Crosshair 16 HX AI D2XWGKG | |
| Schenker XMG FUSION 16 (M25) | |
| Aorus Elite 16 AE6H | |
| Lenovo Legion Pro 5 16IAX10, RTX 5070 | |
| Schenker XMG Core 16 M25 | |
| Asus TUF Gaming A16 FA608UP | |
* ... smaller is better
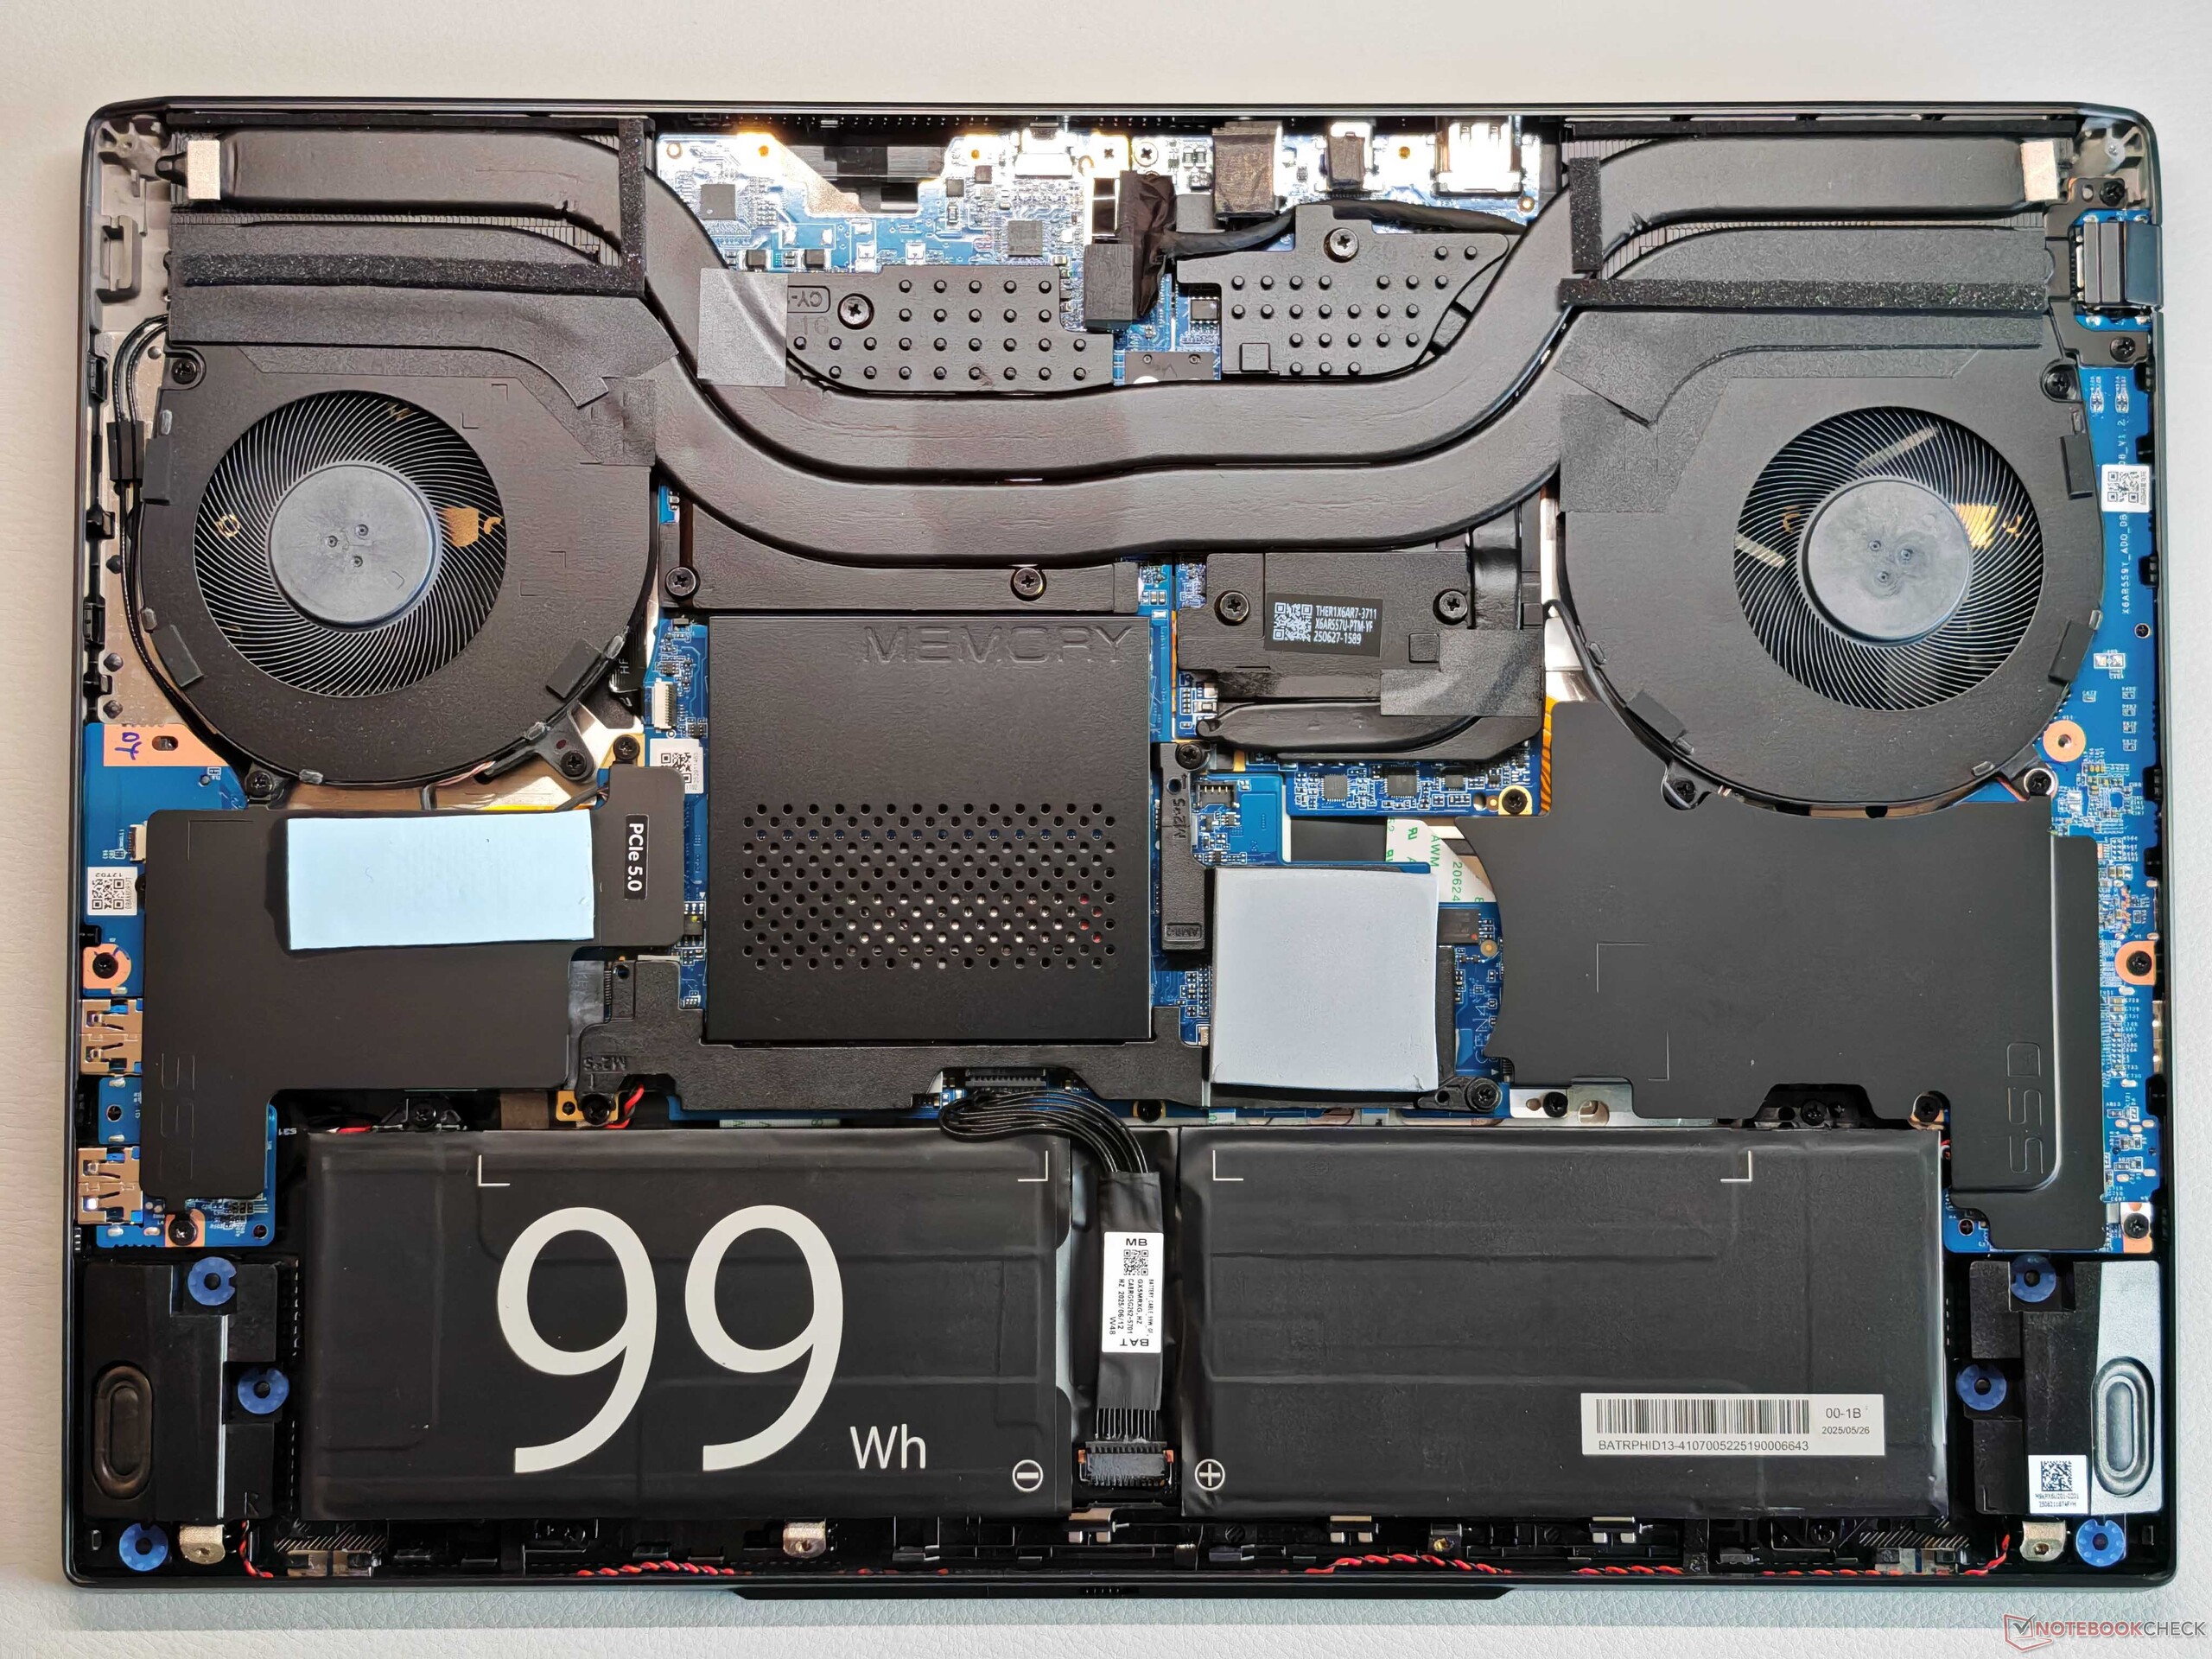
存储设备
Fusion 16 支持 PCIe 5.0,我们的测试设备配备了相应的 2 TB 三星 9100 Pro 固态硬盘(可用容量为 1.73 TB)。性能非常出色,即使在持续负载的情况下也能保持稳定。

* ... smaller is better
磁盘节流DiskSpd 读取循环,队列深度 8
图形处理器性能
与酷睿 16 一样,最快版本的 RTX 5070 笔记本电脑GPU 安装(115 瓦),性能符合预期。不过,与酷睿 16 中的 AMD 处理器相比,速度更快的酷睿 Ultra 9 275HX 并不具备重大优势。在合理的设置下,所有现代游戏都能流畅运行,不过 8GB 的 VRAM 在更高分辨率下可能会受到限制(更多详情,请访问。).使用电池供电时,GPU 的最大功率限制为 50 瓦,大约降低了 50%。
| 3DMark 11 Performance | 37410 points | |
| 3DMark Fire Strike Score | 28680 points | |
| 3DMark Time Spy Score | 13439 points | |
| 3DMark Steel Nomad Score | 3075 points | |
| 3DMark Steel Nomad Light Score | 13426 points | |
Help | ||
| Blender / v3.3 Classroom OPTIX/RTX | |
| Schenker XMG Core 16 M25 | |
| Gigabyte Gaming A16 GA6H | |
| MSI Crosshair 16 HX AI D2XWGKG | |
| Asus TUF Gaming A16 FA608UP | |
| Schenker XMG FUSION 16 (M25) | |
| Average NVIDIA GeForce RTX 5070 Laptop (17 - 24, n=28) | |
| Aorus Elite 16 AE6H | |
| Average of class Gaming (9 - 32, n=111, last 2 years) | |
| Lenovo Legion Pro 5 16IAX10, RTX 5070 | |
| Blender / v3.3 Classroom CUDA | |
| Average NVIDIA GeForce RTX 5070 Laptop (29 - 228, n=29) | |
| Schenker XMG Core 16 M25 | |
| Schenker XMG FUSION 16 (M25) | |
| Gigabyte Gaming A16 GA6H | |
| Asus TUF Gaming A16 FA608UP | |
| Average of class Gaming (15 - 228, n=111, last 2 years) | |
| Aorus Elite 16 AE6H | |
| MSI Crosshair 16 HX AI D2XWGKG | |
| Lenovo Legion Pro 5 16IAX10, RTX 5070 | |
| Blender / v3.3 Classroom CPU | |
| Gigabyte Gaming A16 GA6H | |
| Asus TUF Gaming A16 FA608UP | |
| Average NVIDIA GeForce RTX 5070 Laptop (137 - 507, n=26) | |
| Average of class Gaming (122 - 565, n=107, last 2 years) | |
| Schenker XMG Core 16 M25 | |
| Lenovo Legion Pro 5 16IAX10, RTX 5070 | |
| MSI Crosshair 16 HX AI D2XWGKG | |
| Schenker XMG FUSION 16 (M25) | |
* ... smaller is better

赛博朋克 2077》超 FPS 图表
| low | med. | high | ultra | QHD | |
|---|---|---|---|---|---|
| GTA V (2015) | 143.7 | 124.5 | |||
| Dota 2 Reborn (2015) | 211 | 185.7 | 177 | 164.3 | |
| Final Fantasy XV Benchmark (2018) | 231 | 179.7 | 136.2 | 97.4 | |
| X-Plane 11.11 (2018) | 142.4 | 117.4 | 99.3 | ||
| Strange Brigade (2018) | 519 | 335 | 278 | 242 | 165.7 |
| Baldur's Gate 3 (2023) | 179.1 | 142.7 | 123.4 | 121 | 84.1 |
| Cyberpunk 2077 (2023) | 164.9 | 137.6 | 115.3 | 103.8 | 65.2 |
| F1 24 (2024) | 296 | 291 | 241 | 86.4 | 55.2 |
| F1 25 (2025) | 243 | 218 | 172.3 | 27.7 | 15.5 |
| Call of Duty Black Ops 7 (2025) | 224 | 152 | 117 | 44 | 28 |
排放量
系统噪音
风扇在日常使用时依然非常安静,Fusion 16 也比大多数竞争对手更安静,游戏时最大噪音为 49.7 dB(A)。没有检测到其他电子噪音。
Noise level
| Idle |
| 25.7 / 25.7 / 28 dB(A) |
| Load |
| 38.9 / 49.7 dB(A) |
 | ||
30 dB silent 40 dB(A) audible 50 dB(A) loud |
||
min: | ||
| Schenker XMG FUSION 16 (M25) Ultra 9 275HX, GeForce RTX 5070 Laptop | Lenovo Legion Pro 5 16IAX10, RTX 5070 Ultra 7 255HX, GeForce RTX 5070 Laptop | Schenker XMG Core 16 M25 Ryzen AI 9 HX 370, GeForce RTX 5070 Laptop | Asus TUF Gaming A16 FA608UP R7 260, GeForce RTX 5070 Laptop | MSI Crosshair 16 HX AI D2XWGKG Ultra 9 275HX, GeForce RTX 5070 Laptop | Aorus Elite 16 AE6H Ultra 9 275HX, GeForce RTX 5070 Laptop | Gigabyte Gaming A16 GA6H i7-13620H, GeForce RTX 5070 Laptop | |
|---|---|---|---|---|---|---|---|
| Noise | 4% | 2% | -12% | -12% | -16% | -7% | |
| off / environment * (dB) | 25.7 | 23 11% | 24.8 4% | 25.1 2% | 25.56 1% | 24 7% | 24 7% |
| Idle Minimum * (dB) | 25.7 | 23 11% | 24.8 4% | 32.2 -25% | 28.3 -10% | 25 3% | 25 3% |
| Idle Average * (dB) | 25.7 | 23 11% | 24.8 4% | 32.2 -25% | 28.3 -10% | 29 -13% | 26 -1% |
| Idle Maximum * (dB) | 28 | 23 18% | 27.1 3% | 32.2 -15% | 28.3 -1% | 32 -14% | 27 4% |
| Load Average * (dB) | 38.9 | 43.85 -13% | 40.2 -3% | 38.1 2% | 50.26 -29% | 60 -54% | 54 -39% |
| Cyberpunk 2077 ultra * (dB) | 49.7 | 50.27 -1% | 49.2 1% | 53.9 -8% | 57.8 -16% | 59 -19% | 54 -9% |
| Load Maximum * (dB) | 49.7 | 52.9 -6% | 49.2 1% | 57.1 -15% | 57.95 -17% | 61 -23% | 55 -11% |
* ... smaller is better
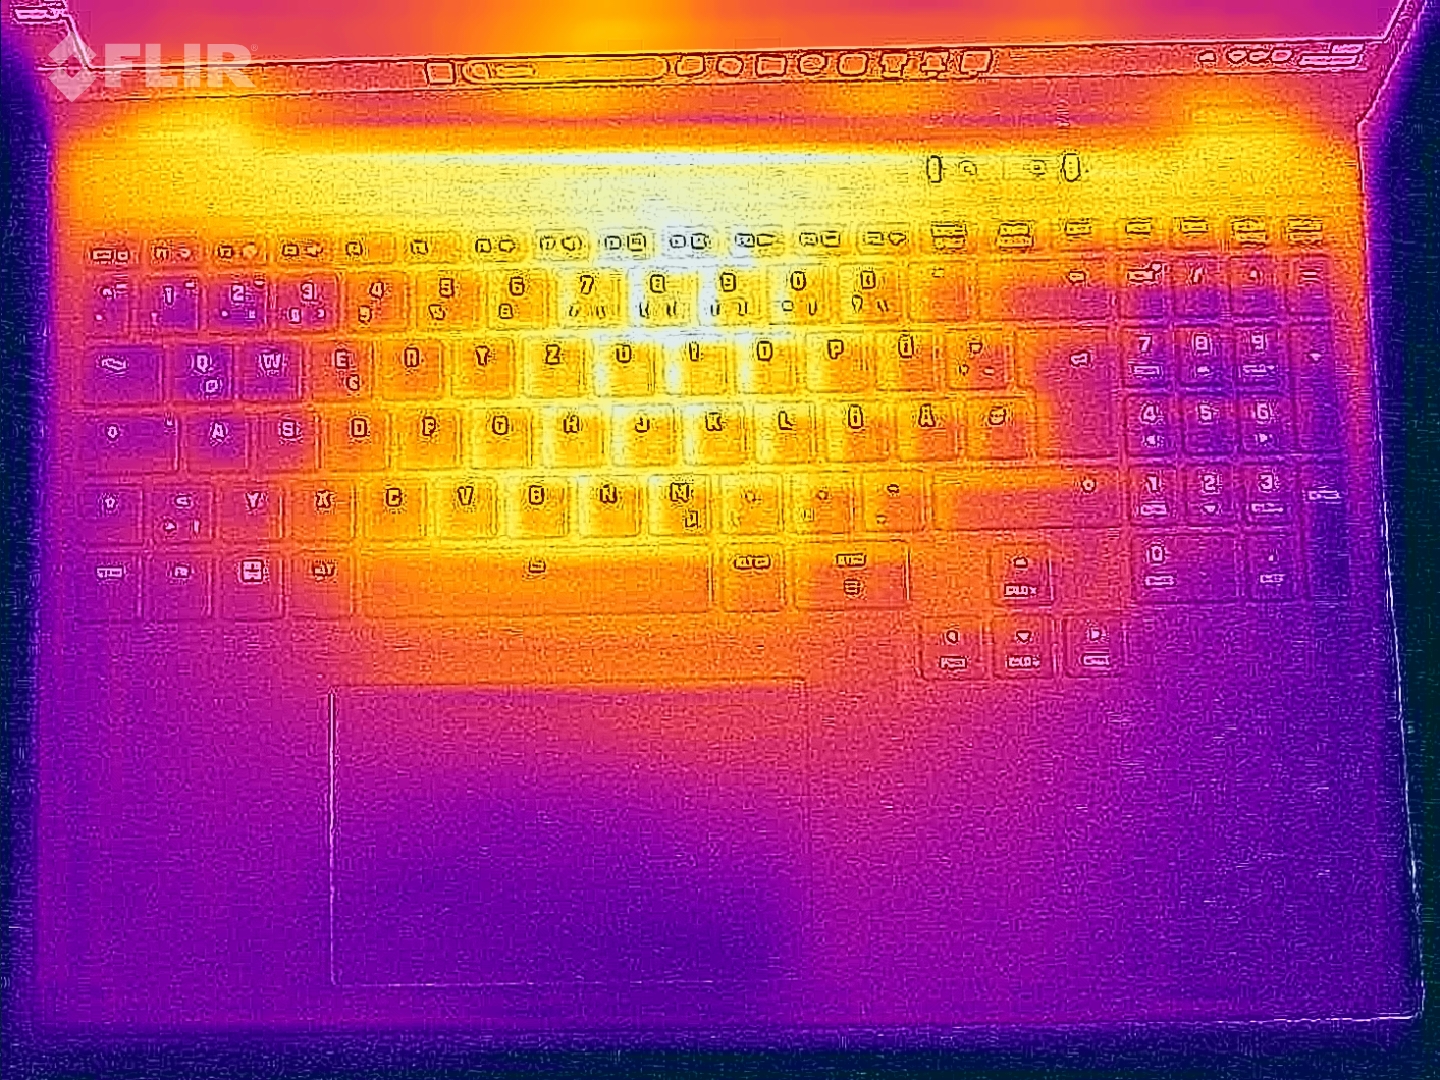
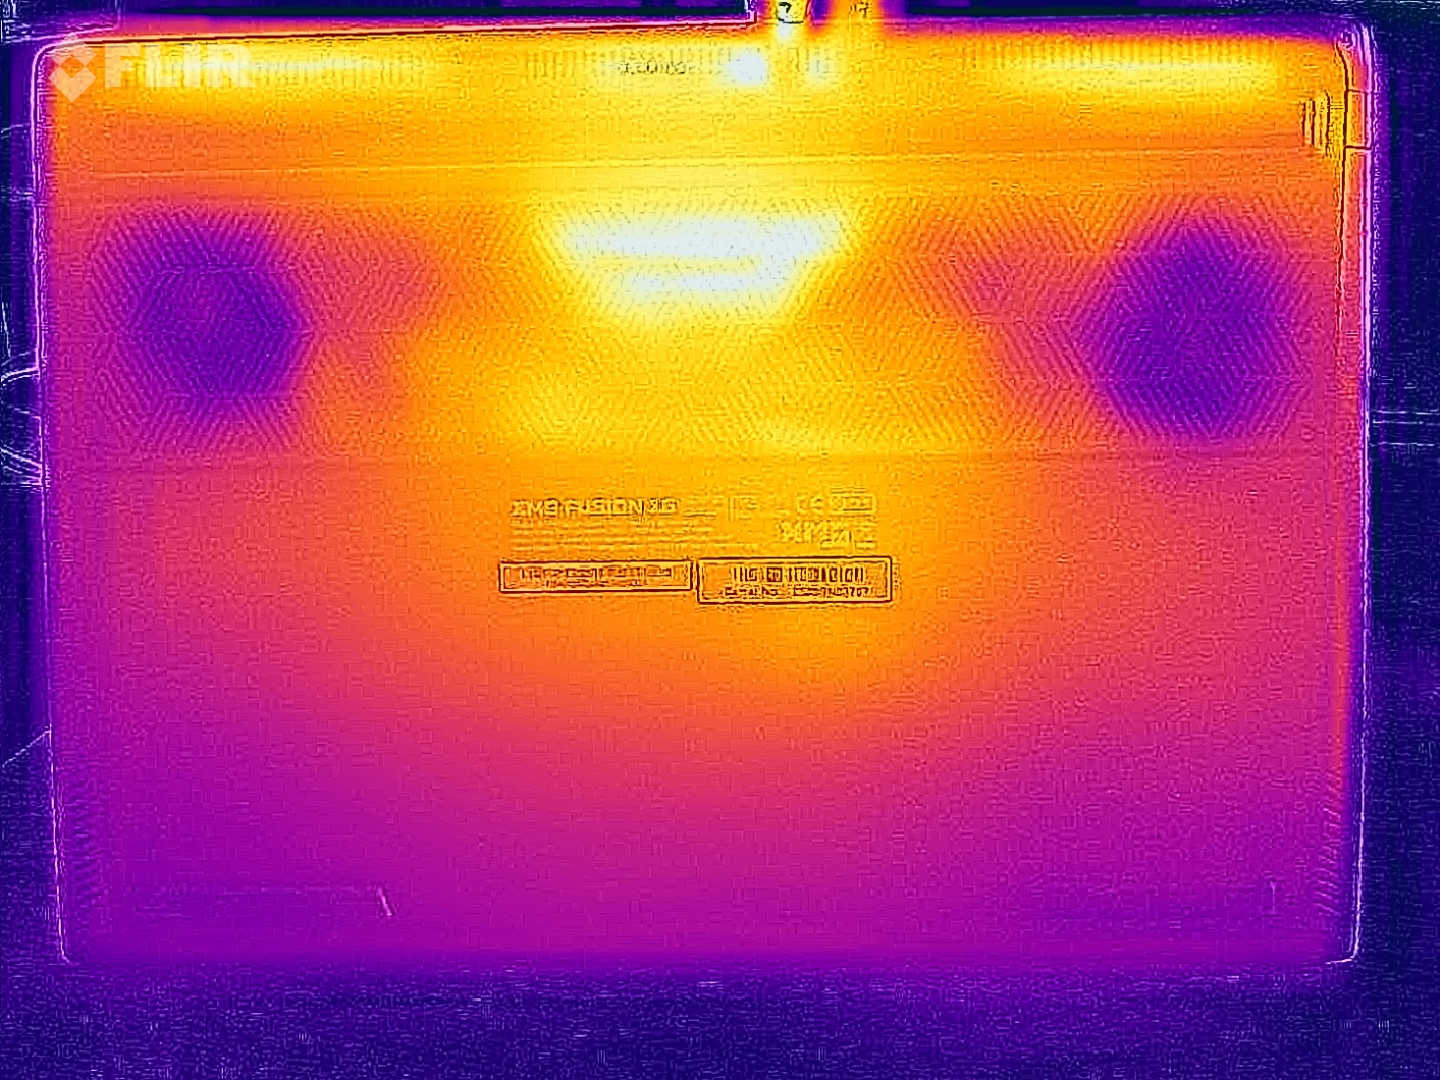
温度
Fusion 16 在温度方面并不显眼,底部最高 48 °C 的温度在游戏过程中并不重要。

(±) The maximum temperature on the upper side is 43.2 °C / 110 F, compared to the average of 40.4 °C / 105 F, ranging from 21.2 to 68.8 °C for the class Gaming.
(-) The bottom heats up to a maximum of 48 °C / 118 F, compared to the average of 43.2 °C / 110 F
(+) In idle usage, the average temperature for the upper side is 25.8 °C / 78 F, compared to the device average of 33.9 °C / 93 F.
(±) 3: The average temperature for the upper side is 36.6 °C / 98 F, compared to the average of 33.9 °C / 93 F for the class Gaming.
(+) The palmrests and touchpad are cooler than skin temperature with a maximum of 31.4 °C / 88.5 F and are therefore cool to the touch.
(-) The average temperature of the palmrest area of similar devices was 28.8 °C / 83.8 F (-2.6 °C / -4.7 F).
| Schenker XMG FUSION 16 (M25) Ultra 9 275HX, GeForce RTX 5070 Laptop | Lenovo Legion Pro 5 16IAX10, RTX 5070 Ultra 7 255HX, GeForce RTX 5070 Laptop | Schenker XMG Core 16 M25 Ryzen AI 9 HX 370, GeForce RTX 5070 Laptop | Asus TUF Gaming A16 FA608UP R7 260, GeForce RTX 5070 Laptop | MSI Crosshair 16 HX AI D2XWGKG Ultra 9 275HX, GeForce RTX 5070 Laptop | Aorus Elite 16 AE6H Ultra 9 275HX, GeForce RTX 5070 Laptop | Gigabyte Gaming A16 GA6H i7-13620H, GeForce RTX 5070 Laptop | |
|---|---|---|---|---|---|---|---|
| Heat | -9% | -11% | 7% | -4% | -13% | -18% | |
| Maximum Upper Side * (°C) | 43.2 | 42 3% | 46.7 -8% | 39.5 9% | 44.8 -4% | 41 5% | 50 -16% |
| Maximum Bottom * (°C) | 48 | 44 8% | 58.5 -22% | 45.1 6% | 43.4 10% | 45 6% | 49 -2% |
| Idle Upper Side * (°C) | 26.6 | 33 -24% | 28.3 -6% | 25.7 3% | 31.2 -17% | 35 -32% | 35 -32% |
| Idle Bottom * (°C) | 27.6 | 34 -23% | 29.9 -8% | 25.5 8% | 28.8 -4% | 36 -30% | 34 -23% |
* ... smaller is better
发言人
Schenker XMG FUSION 16 (M25) audio analysis
(+) | speakers can play relatively loud (85.1 dB)
Bass 100 - 315 Hz
(-) | nearly no bass - on average 17.9% lower than median
(±) | linearity of bass is average (10.5% delta to prev. frequency)
Mids 400 - 2000 Hz
(±) | higher mids - on average 5.7% higher than median
(+) | mids are linear (4.6% delta to prev. frequency)
Highs 2 - 16 kHz
(+) | balanced highs - only 3.1% away from median
(+) | highs are linear (4.8% delta to prev. frequency)
Overall 100 - 16.000 Hz
(+) | overall sound is linear (14.8% difference to median)
Compared to same class
» 29% of all tested devices in this class were better, 7% similar, 64% worse
» The best had a delta of 6%, average was 18%, worst was 132%
Compared to all devices tested
» 20% of all tested devices were better, 4% similar, 76% worse
» The best had a delta of 4%, average was 24%, worst was 134%
Lenovo Legion Pro 5 16IAX10, RTX 5070 audio analysis
(±) | speaker loudness is average but good (75.73 dB)
Bass 100 - 315 Hz
(-) | nearly no bass - on average 20% lower than median
(±) | linearity of bass is average (9.3% delta to prev. frequency)
Mids 400 - 2000 Hz
(±) | higher mids - on average 6.1% higher than median
(±) | linearity of mids is average (7.9% delta to prev. frequency)
Highs 2 - 16 kHz
(+) | balanced highs - only 2.2% away from median
(+) | highs are linear (6.3% delta to prev. frequency)
Overall 100 - 16.000 Hz
(±) | linearity of overall sound is average (19.4% difference to median)
Compared to same class
» 67% of all tested devices in this class were better, 7% similar, 26% worse
» The best had a delta of 6%, average was 18%, worst was 132%
Compared to all devices tested
» 48% of all tested devices were better, 7% similar, 45% worse
» The best had a delta of 4%, average was 24%, worst was 134%
Asus TUF Gaming A16 FA608UP audio analysis
(±) | speaker loudness is average but good (80.2 dB)
Bass 100 - 315 Hz
(±) | reduced bass - on average 11.8% lower than median
(±) | linearity of bass is average (8.7% delta to prev. frequency)
Mids 400 - 2000 Hz
(+) | balanced mids - only 3% away from median
(+) | mids are linear (3% delta to prev. frequency)
Highs 2 - 16 kHz
(+) | balanced highs - only 4.4% away from median
(±) | linearity of highs is average (7.4% delta to prev. frequency)
Overall 100 - 16.000 Hz
(+) | overall sound is linear (12.6% difference to median)
Compared to same class
» 16% of all tested devices in this class were better, 3% similar, 81% worse
» The best had a delta of 6%, average was 18%, worst was 132%
Compared to all devices tested
» 11% of all tested devices were better, 2% similar, 86% worse
» The best had a delta of 4%, average was 24%, worst was 134%
MSI Crosshair 16 HX AI D2XWGKG audio analysis
(±) | speaker loudness is average but good (81.5 dB)
Bass 100 - 315 Hz
(-) | nearly no bass - on average 15.6% lower than median
(±) | linearity of bass is average (10.5% delta to prev. frequency)
Mids 400 - 2000 Hz
(±) | higher mids - on average 6.6% higher than median
(±) | linearity of mids is average (7.1% delta to prev. frequency)
Highs 2 - 16 kHz
(+) | balanced highs - only 1.6% away from median
(+) | highs are linear (5.8% delta to prev. frequency)
Overall 100 - 16.000 Hz
(+) | overall sound is linear (14.7% difference to median)
Compared to same class
» 28% of all tested devices in this class were better, 7% similar, 64% worse
» The best had a delta of 6%, average was 18%, worst was 132%
Compared to all devices tested
» 19% of all tested devices were better, 4% similar, 77% worse
» The best had a delta of 4%, average was 24%, worst was 134%
Aorus Elite 16 AE6H audio analysis
(+) | speakers can play relatively loud (87 dB)
Bass 100 - 315 Hz
(±) | reduced bass - on average 10.8% lower than median
(±) | linearity of bass is average (7.5% delta to prev. frequency)
Mids 400 - 2000 Hz
(+) | balanced mids - only 2.1% away from median
(+) | mids are linear (4.8% delta to prev. frequency)
Highs 2 - 16 kHz
(+) | balanced highs - only 2.5% away from median
(+) | highs are linear (4.3% delta to prev. frequency)
Overall 100 - 16.000 Hz
(+) | overall sound is linear (8.1% difference to median)
Compared to same class
» 1% of all tested devices in this class were better, 1% similar, 98% worse
» The best had a delta of 6%, average was 18%, worst was 132%
Compared to all devices tested
» 2% of all tested devices were better, 1% similar, 98% worse
» The best had a delta of 4%, average was 24%, worst was 134%
能源管理
功耗方面没有任何意外。我们在压力测试中测得的峰值功率为 243 瓦,但很快就稳定在 170 瓦左右。因此,紧凑型 250 瓦电源适配器已经足够。1.8 瓦的待机功耗相对较高。
| Off / Standby | |
| Idle | |
| Load |
|
Key:
min: | |
| Schenker XMG FUSION 16 (M25) Ultra 9 275HX, GeForce RTX 5070 Laptop, Samsung 9100 Pro 2 TB, OLED, 2880x1800, 16" | Lenovo Legion Pro 5 16IAX10, RTX 5070 Ultra 7 255HX, GeForce RTX 5070 Laptop, SK Hynix HFS001TEJ9X115N, OLED, 2650x1600, 16" | Schenker XMG Core 16 M25 Ryzen AI 9 HX 370, GeForce RTX 5070 Laptop, Samsung 990 Pro 2 TB MZVL72T0HDLB, IPS, 2560x1600, 16" | Asus TUF Gaming A16 FA608UP R7 260, GeForce RTX 5070 Laptop, Western Digital PC SN5000S SDEQNSJ-1T00, IPS, 2560x1600, 16" | MSI Crosshair 16 HX AI D2XWGKG Ultra 9 275HX, GeForce RTX 5070 Laptop, Micron 2500 1TB MTFDKBA1T0QGN, IPS, 2560x1600, 16" | Aorus Elite 16 AE6H Ultra 9 275HX, GeForce RTX 5070 Laptop, Gigabyte AG470S1TB-SI B10, IPS, 2560x1600, 16" | Gigabyte Gaming A16 GA6H i7-13620H, GeForce RTX 5070 Laptop, Kingston OM8PGP41024Q-A0, IPS, 2560x1600, 16" | Average NVIDIA GeForce RTX 5070 Laptop | Average of class Gaming | |
|---|---|---|---|---|---|---|---|---|---|
| Power Consumption | -2% | 9% | 23% | -51% | -4% | 20% | 4% | -11% | |
| Idle Minimum * (Watt) | 15.3 | 10.6 31% | 7.4 52% | 4.6 70% | 26.2 -71% | 8.5 44% | 9 41% | 10.8 ? 29% | 13.1 ? 14% |
| Idle Average * (Watt) | 16.8 | 12.3 27% | 14.9 11% | 9.8 42% | 33.8 -101% | 13.6 19% | 11 35% | 15.4 ? 8% | 18.7 ? -11% |
| Idle Maximum * (Watt) | 17.3 | 18.6 -8% | 15.2 12% | 10.2 41% | 34 -97% | 22 -27% | 23 -33% | 21 ? -21% | 24.4 ? -41% |
| Load Average * (Watt) | 94.7 | 104 -10% | 100.8 -6% | 76.1 20% | 112 -18% | 113 -19% | 91 4% | 98.7 ? -4% | 108.1 ? -14% |
| Cyberpunk 2077 ultra external monitor * (Watt) | 180.9 | 227 -25% | 181.4 -0% | 198.1 -10% | 220 -22% | 219 -21% | 130 28% | ||
| Cyberpunk 2077 ultra * (Watt) | 185.3 | 231 -25% | 184.8 -0% | 198.9 -7% | 224 -21% | 223 -20% | 132.5 28% | ||
| Load Maximum * (Watt) | 242.7 | 248 -2% | 251.1 -3% | 235.2 3% | 315 -30% | 257 -6% | 155 36% | 218 ? 10% | 254 ? -5% |
* ... smaller is better
功耗 赛博朋克/压力测试
外部显示器功耗
电池寿命
尽管采用了 OLED 面板,但电池续航时间基本上与 酷睿 16的电池寿命非常相似。在 150 cd/m² 的 Wi-Fi 测试中,我们测得的电池使用时间为 10:15 小时,全亮度下为 7:39 小时。


| Schenker XMG FUSION 16 (M25) Ultra 9 275HX, GeForce RTX 5070 Laptop, 99.8 Wh | Lenovo Legion Pro 5 16IAX10, RTX 5070 Ultra 7 255HX, GeForce RTX 5070 Laptop, 80 Wh | Schenker XMG Core 16 M25 Ryzen AI 9 HX 370, GeForce RTX 5070 Laptop, 99.8 Wh | Asus TUF Gaming A16 FA608UP R7 260, GeForce RTX 5070 Laptop, 90 Wh | MSI Crosshair 16 HX AI D2XWGKG Ultra 9 275HX, GeForce RTX 5070 Laptop, 90 Wh | Aorus Elite 16 AE6H Ultra 9 275HX, GeForce RTX 5070 Laptop, 99 Wh | Gigabyte Gaming A16 GA6H i7-13620H, GeForce RTX 5070 Laptop, 76 Wh | Average of class Gaming | |
|---|---|---|---|---|---|---|---|---|
| Battery Runtime | -40% | -2% | 21% | 8% | -17% | -25% | -31% | |
| WiFi Websurfing (h) | 10.3 | 6.2 -40% | 10.9 6% | 13 26% | 11.1 8% | 8.5 -17% | 7.7 -25% | 7.04 ? -32% |
| WiFi Websurfing max. Brightness (h) | 7.7 | 7 -9% | 8.9 16% | 5.45 ? -29% |
Notebookcheck 总体评分
Schenker XMG FUSION 16 (M25)
- 12/29/2025 v8
Andreas Osthoff
 Total Sustainability Score:
 可比较的替代品
Image | Model / Review | Price | Weight | Height | Display |
|---|---|---|---|---|---|
1. 87.5%  | Schenker XMG FUSION 16 (M25) Intel Core Ultra 9 275HX ⎘ NVIDIA GeForce RTX 5070 Laptop ⎘ 64 GB Memory, 2048 GB SSD | Amazon: List Price: 2700€ | 2.1 kg | 23 mm | 16.00" 2880x1800 212 PPI OLED |
2. 86.2%  | Lenovo Legion Pro 5 16IAX10, RTX 5070 Intel Core Ultra 7 255HX ⎘ NVIDIA GeForce RTX 5070 Laptop ⎘ 32 GB Memory, 1024 GB SSD | Amazon: List Price: 1800 Euro | 2.3 kg | 25.95 mm | 16.00" 2650x1600 189 PPI OLED |
3. 86.2%  | Schenker XMG Core 16 M25 AMD Ryzen AI 9 HX 370 ⎘ NVIDIA GeForce RTX 5070 Laptop ⎘ 64 GB Memory, 2048 GB SSD | Amazon: List Price: 2100€ | 2.1 kg | 23 mm | 16.00" 2560x1600 189 PPI IPS |
4. 83.8%  | Asus TUF Gaming A16 FA608UP AMD Ryzen 7 260 ⎘ NVIDIA GeForce RTX 5070 Laptop ⎘ 32 GB Memory, 1024 GB SSD | Amazon: List Price: 2199€ | 2.2 kg | 25.7 mm | 16.00" 2560x1600 189 PPI IPS |
5. 81.9%  | MSI Crosshair 16 HX AI D2XWGKG Intel Core Ultra 9 275HX ⎘ NVIDIA GeForce RTX 5070 Laptop ⎘ 16 GB Memory, 1024 GB SSD | Amazon: List Price: 2500 EUR | 2.5 kg | 27.9 mm | 16.00" 2560x1600 189 PPI IPS |
6. 84.4%  | Aorus Elite 16 AE6H Intel Core Ultra 9 275HX ⎘ NVIDIA GeForce RTX 5070 Laptop ⎘ 32 GB Memory, 1024 GB SSD | List Price: 2300 EUR | 2.4 kg | 26 mm | 16.00" 2560x1600 189 PPI IPS |
7. 80.1%  | Gigabyte Gaming A16 GA6H Intel Core i7-13620H ⎘ NVIDIA GeForce RTX 5070 Laptop ⎘ 16 GB Memory, 1024 GB SSD | Amazon: 1. $1,341.81 GIGABYTE - Gaming A16 Gaming... 2. $1,229.98 GIGABYTE - Gaming A16 Gaming... 3. $1,029.00 GIGABYTE - Gaming A16 Gaming... List Price: 1700 EUR | 2.3 kg | 23 mm | 16.00" 2560x1600 189 PPI IPS |
Transparency
The selection of devices to be reviewed is made by our editorial team. The test sample was provided to the author as a loan by the manufacturer or retailer for the purpose of this review. The lender had no influence on this review, nor did the manufacturer receive a copy of this review before publication. There was no obligation to publish this review. As an independent media company, Notebookcheck is not subjected to the authority of manufacturers, retailers or publishers.
This is how Notebookcheck is testing
Every year, Notebookcheck independently reviews hundreds of laptops and smartphones using standardized procedures to ensure that all results are comparable. We have continuously developed our test methods for around 20 years and set industry standards in the process. In our test labs, high-quality measuring equipment is utilized by experienced technicians and editors. These tests involve a multi-stage validation process. Our complex rating system is based on hundreds of well-founded measurements and benchmarks, which maintains objectivity. Further information on our test methods can be found here.
