结论 - 华硕 ROG Strix G18 落后于 G16
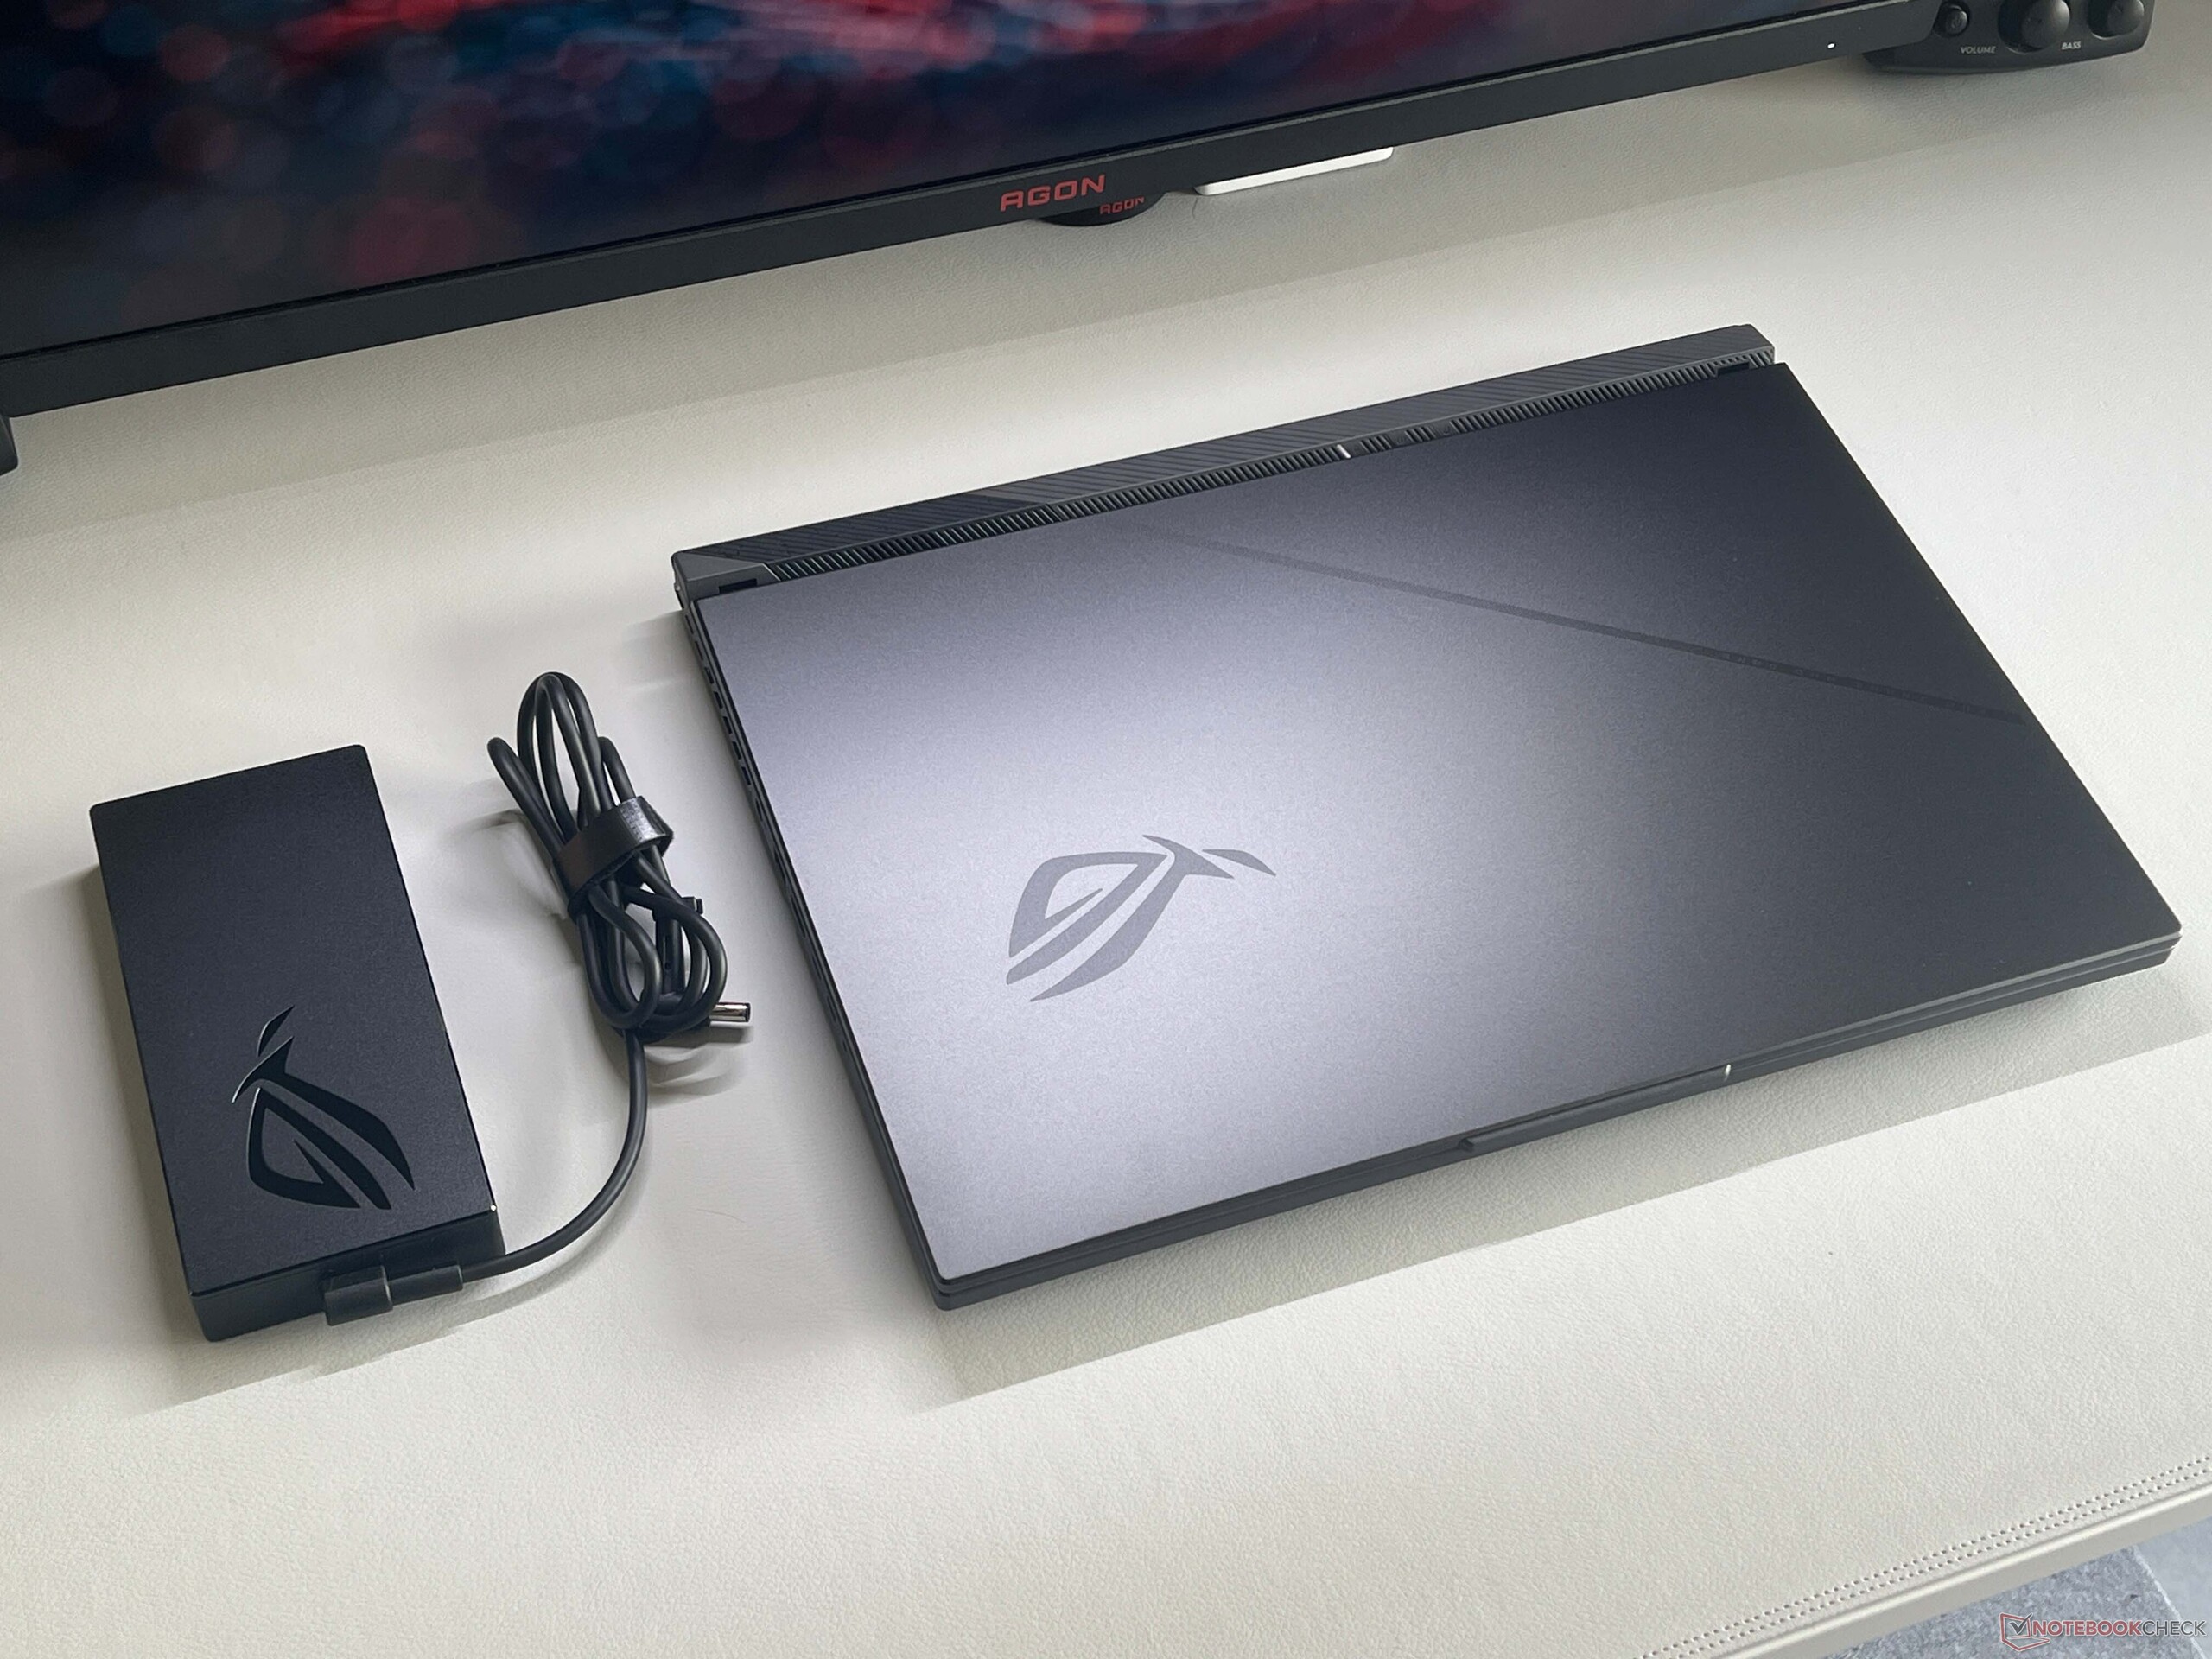
新款 ROG Strix G18 是一款 18 英寸大型游戏笔记本电脑,售价明显低于 Strix SCAR 型号。这主要是因为 GeForce RTX 5070 笔记本电脑 GPU机箱也是你不得不妥协的地方(有趣的是,这也适用于 Strix G16).总而言之,我们发现风扇的声音对于所提供的性能来说有点太大了,尤其是即使在轻负载的情况下,风扇也几乎总是处于活动状态。
原则上,安装一块性能较弱的显卡来降低价格是完全可以接受的。然而,我们不禁要问,为什么华硕使用 Ryzen 995HX 而不是更小的 AMD 处理器。
两侧的端口布局也不理想,但内置的 240 Hz IPS 显示屏是游戏的绝佳选择。由于色彩准确,甚至可以轻松编辑图像。
但问题在于价格。由于 RTX 5070 笔记本电脑的游戏性能,即使其他规格都不错,但 2449 美元的建议零售价也难以令人信服。我们更希望看到的是,为了 5070 Ti 而放弃一些功能。
Pros
Cons
价格和供应情况
我们评测的 ROG Strix G18 配置目前在亚马逊上有售。
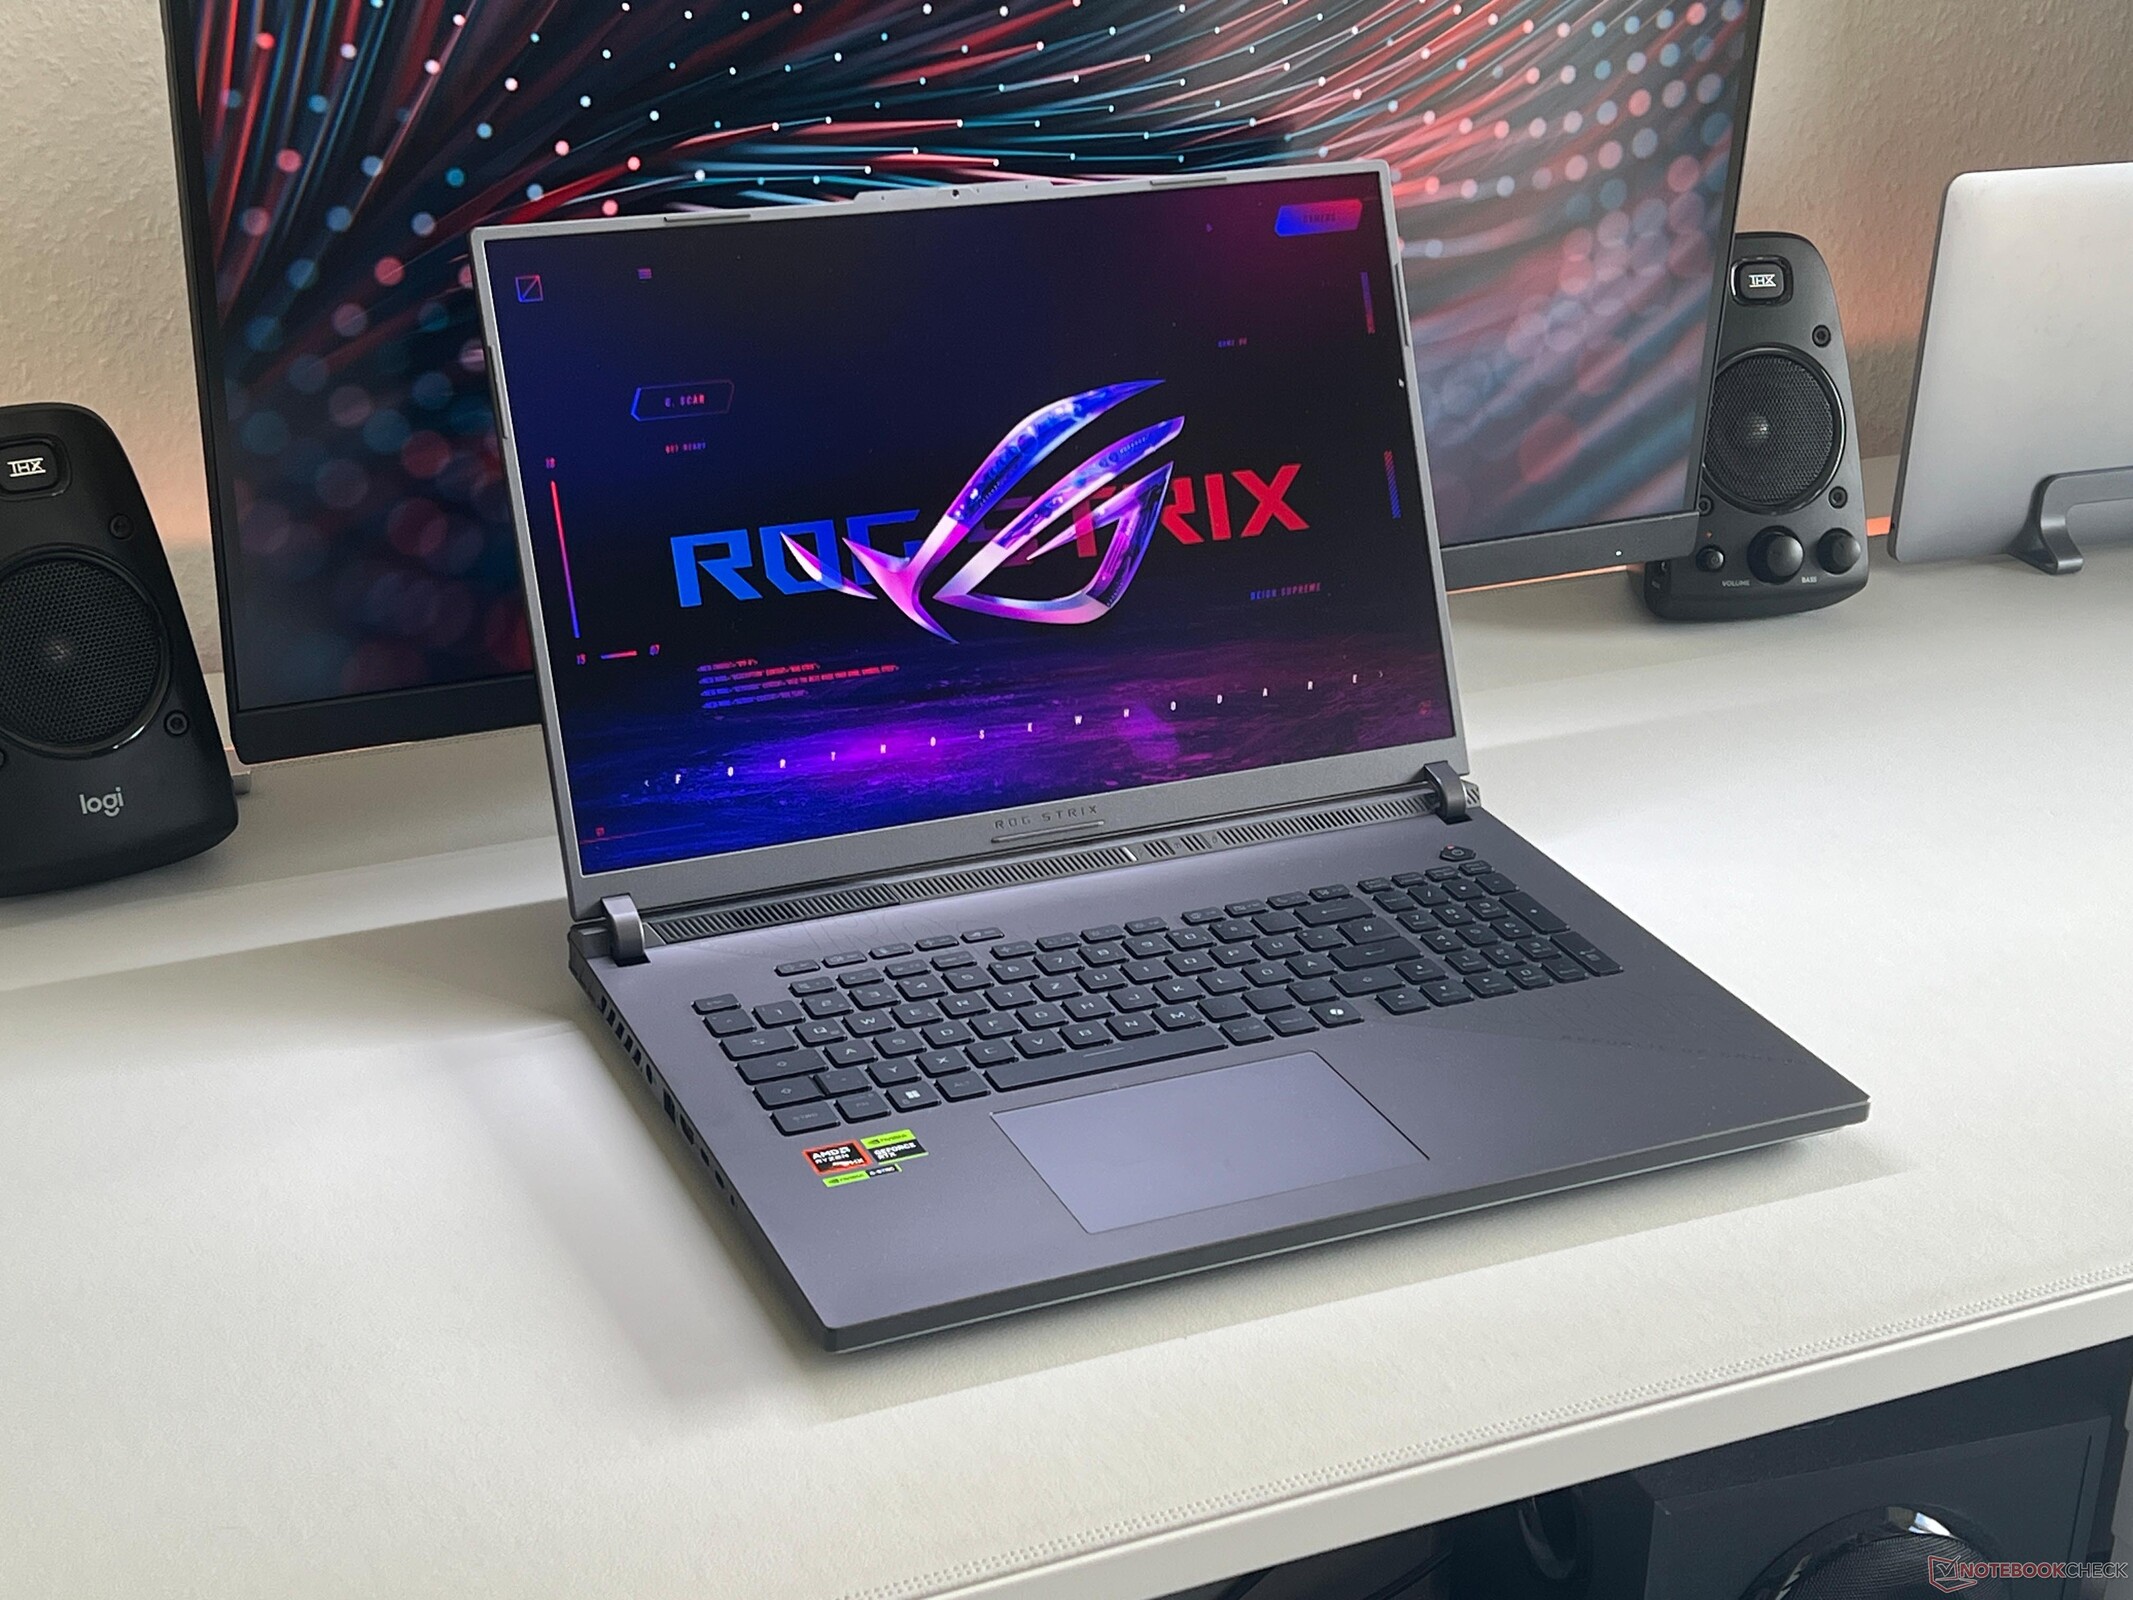
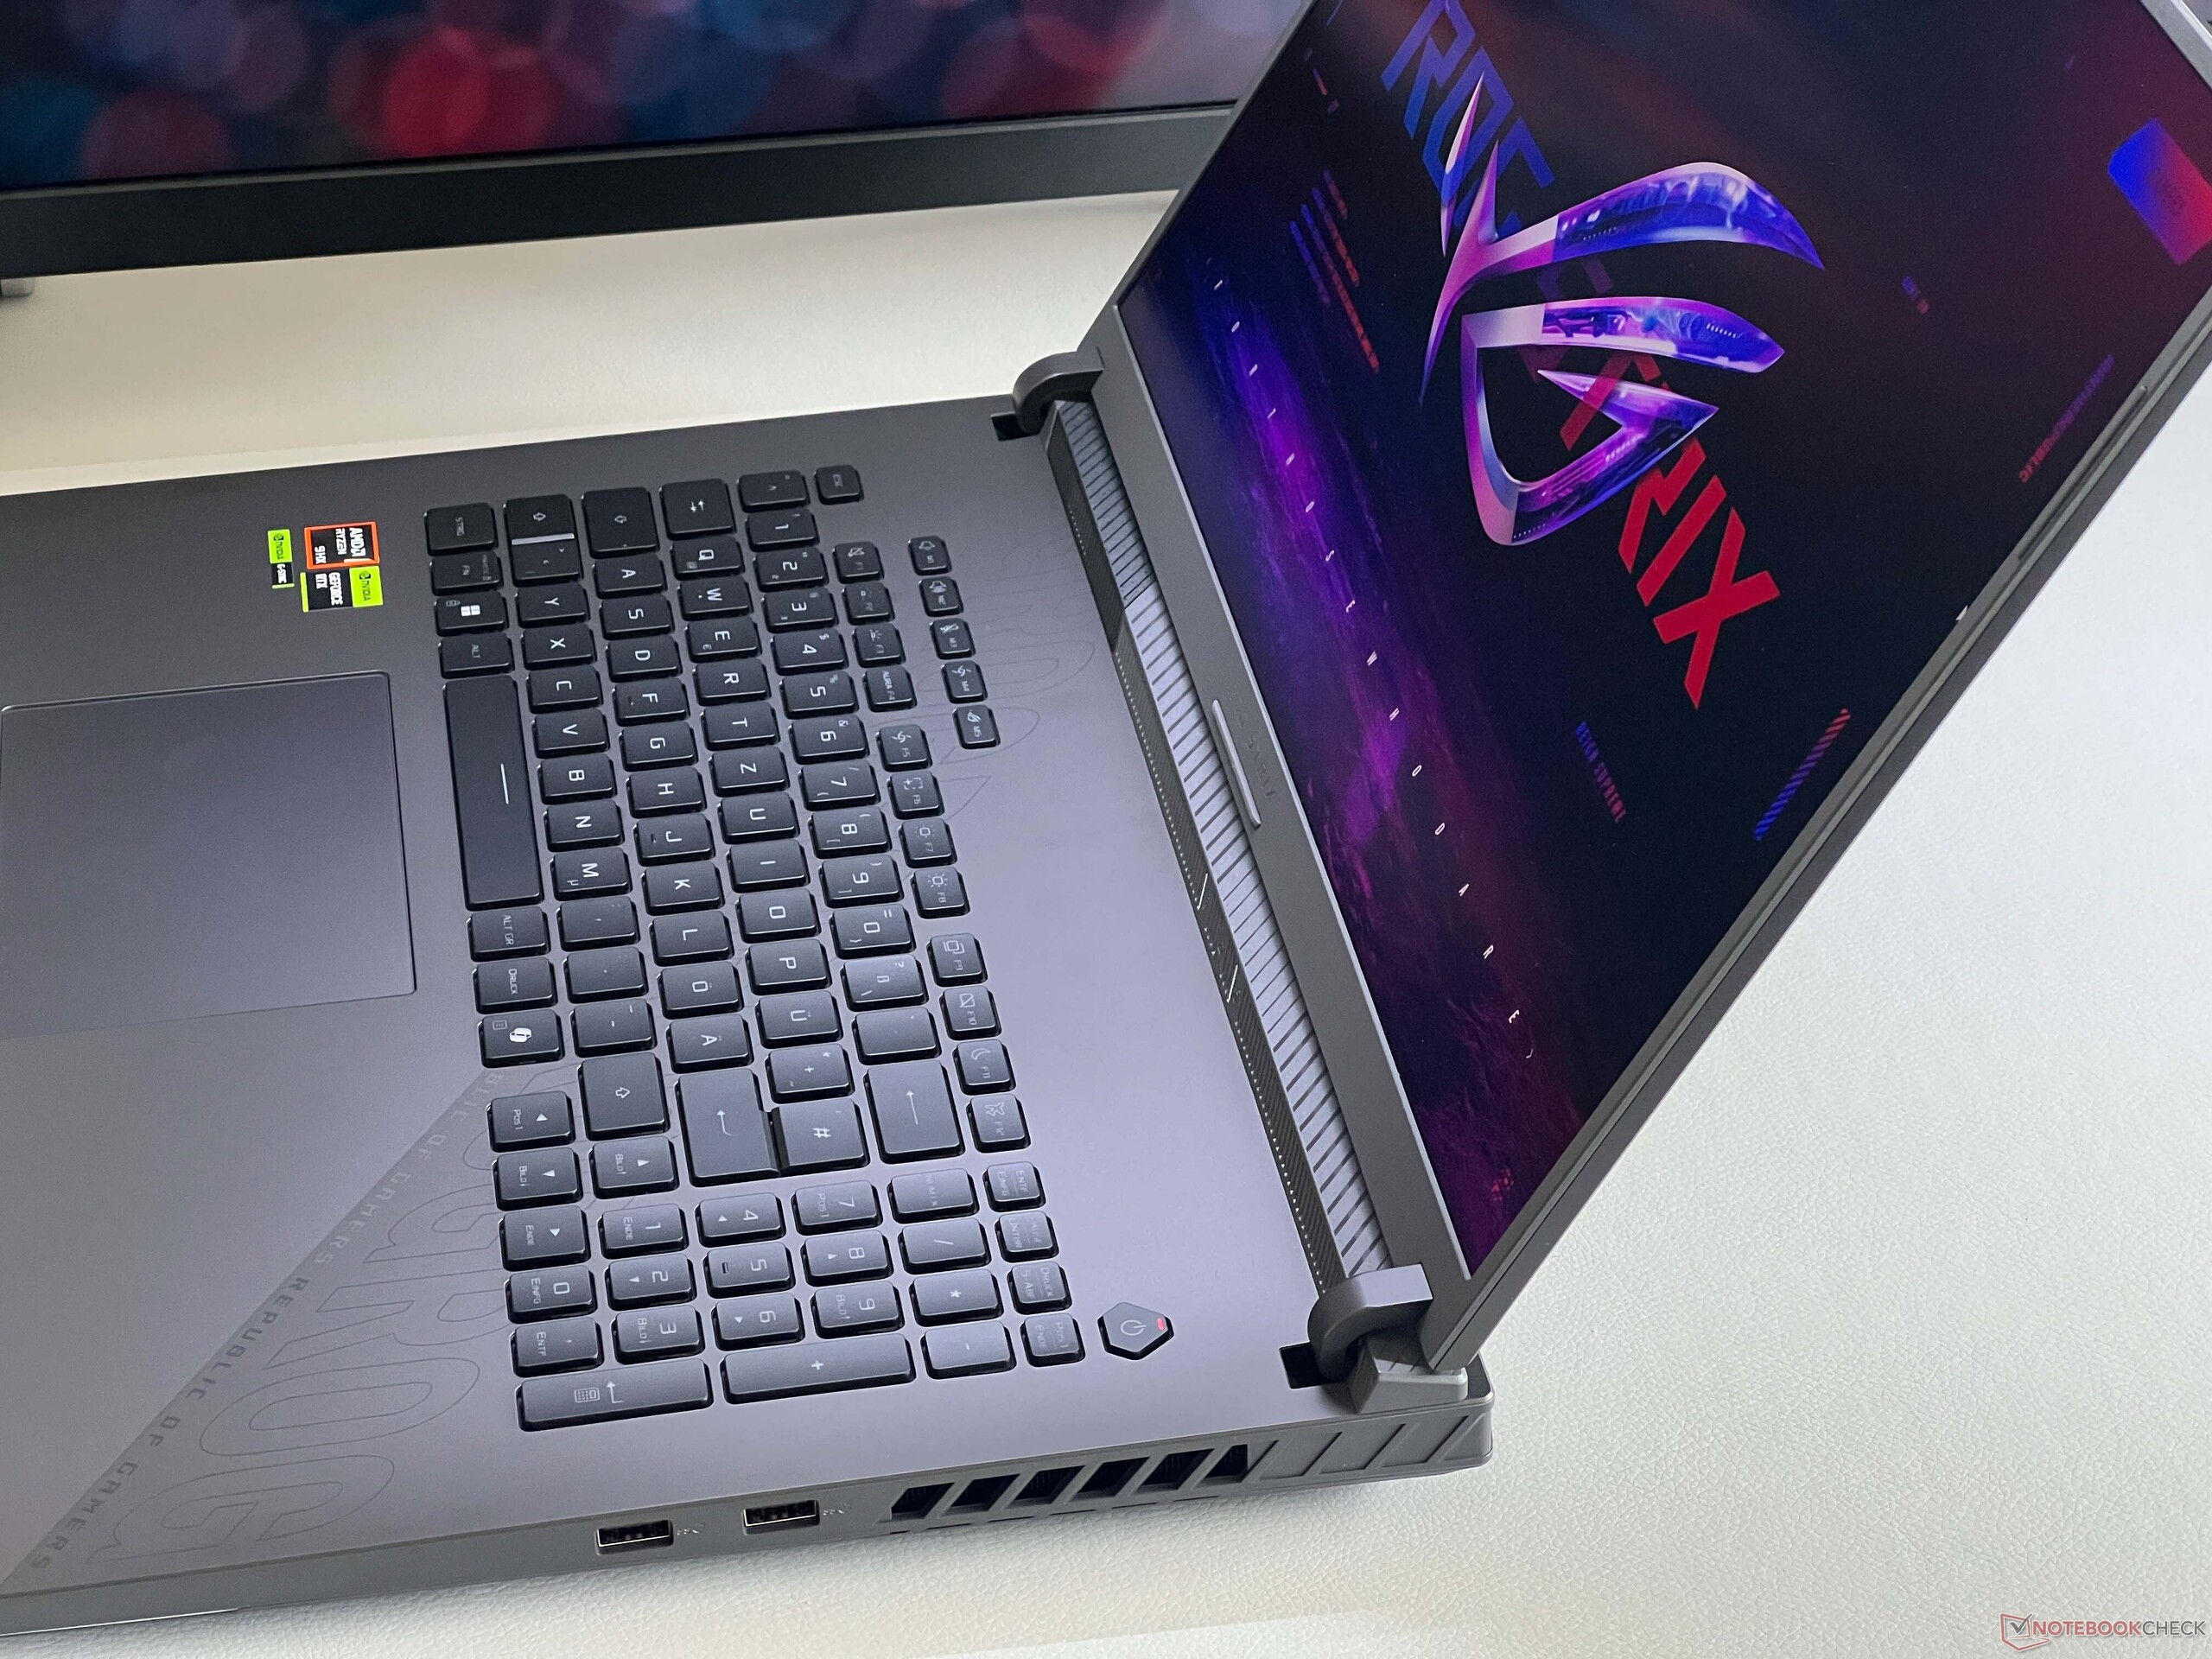
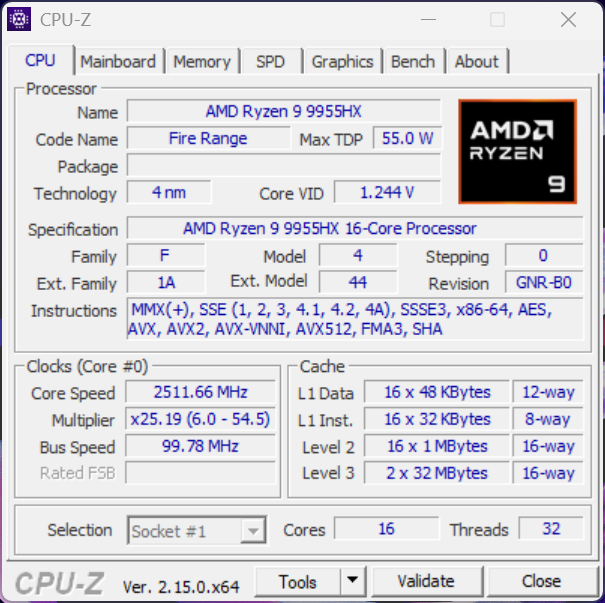
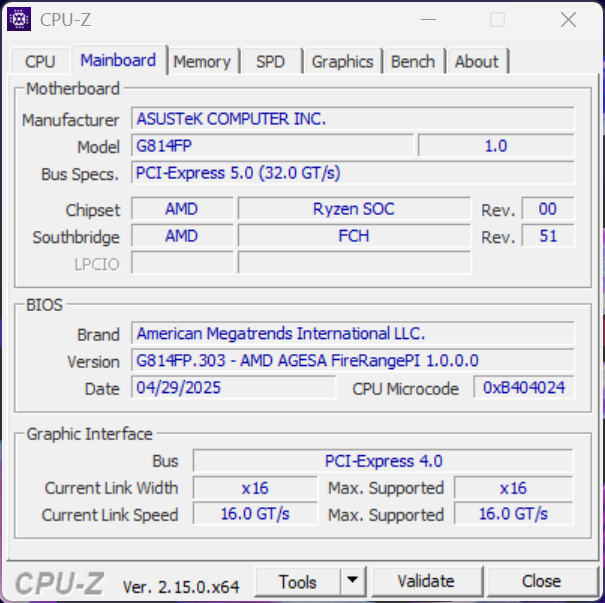
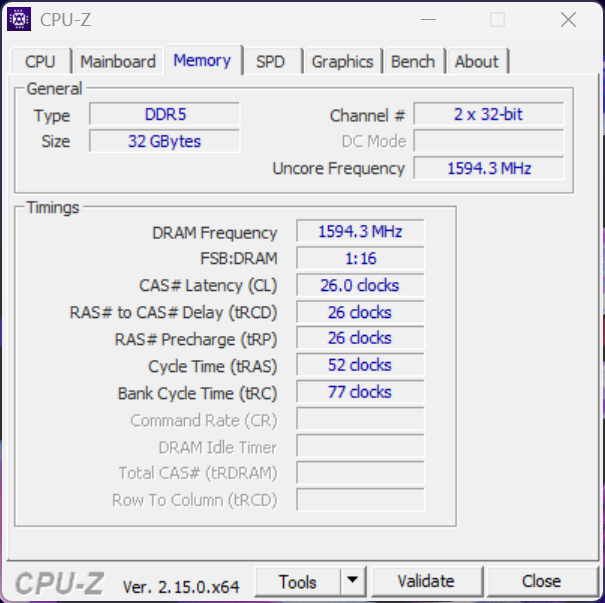
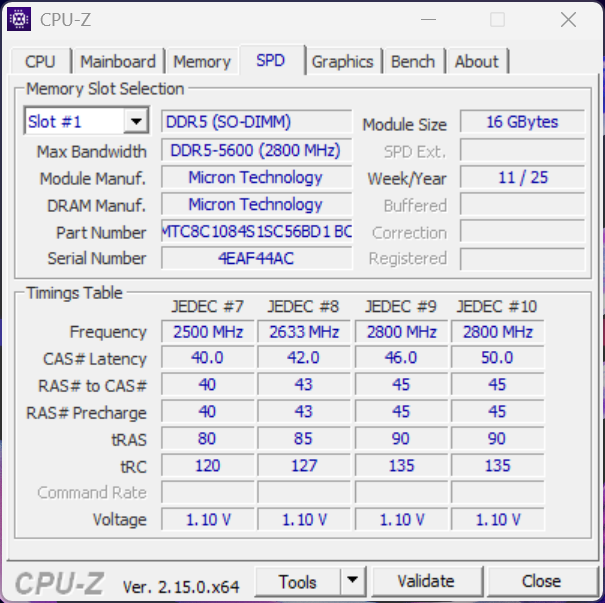
华硕推出的 ROG Strix G18 G814 是一款 18 英寸大型游戏笔记本电脑,配备了强大的 AMD Ryzen 处理器和良好的功能集。我们的评测机型配备了 AMD Ryzen 9 9955HX32 GB 内存、240 Hz 快速 IPS 显示屏和 NvidiaGeForce RTX 5070 笔记本电脑 GPU,售价为 2,449 美元。
迄今为止,我们评测过的大多数 18 英寸游戏笔记本电脑通常都配备了最快的移动 GPU(RTX 5090/5080 笔记本电脑),这也是我们选择 17 英寸设备作为对比设备的原因。
规格
外壳和功能
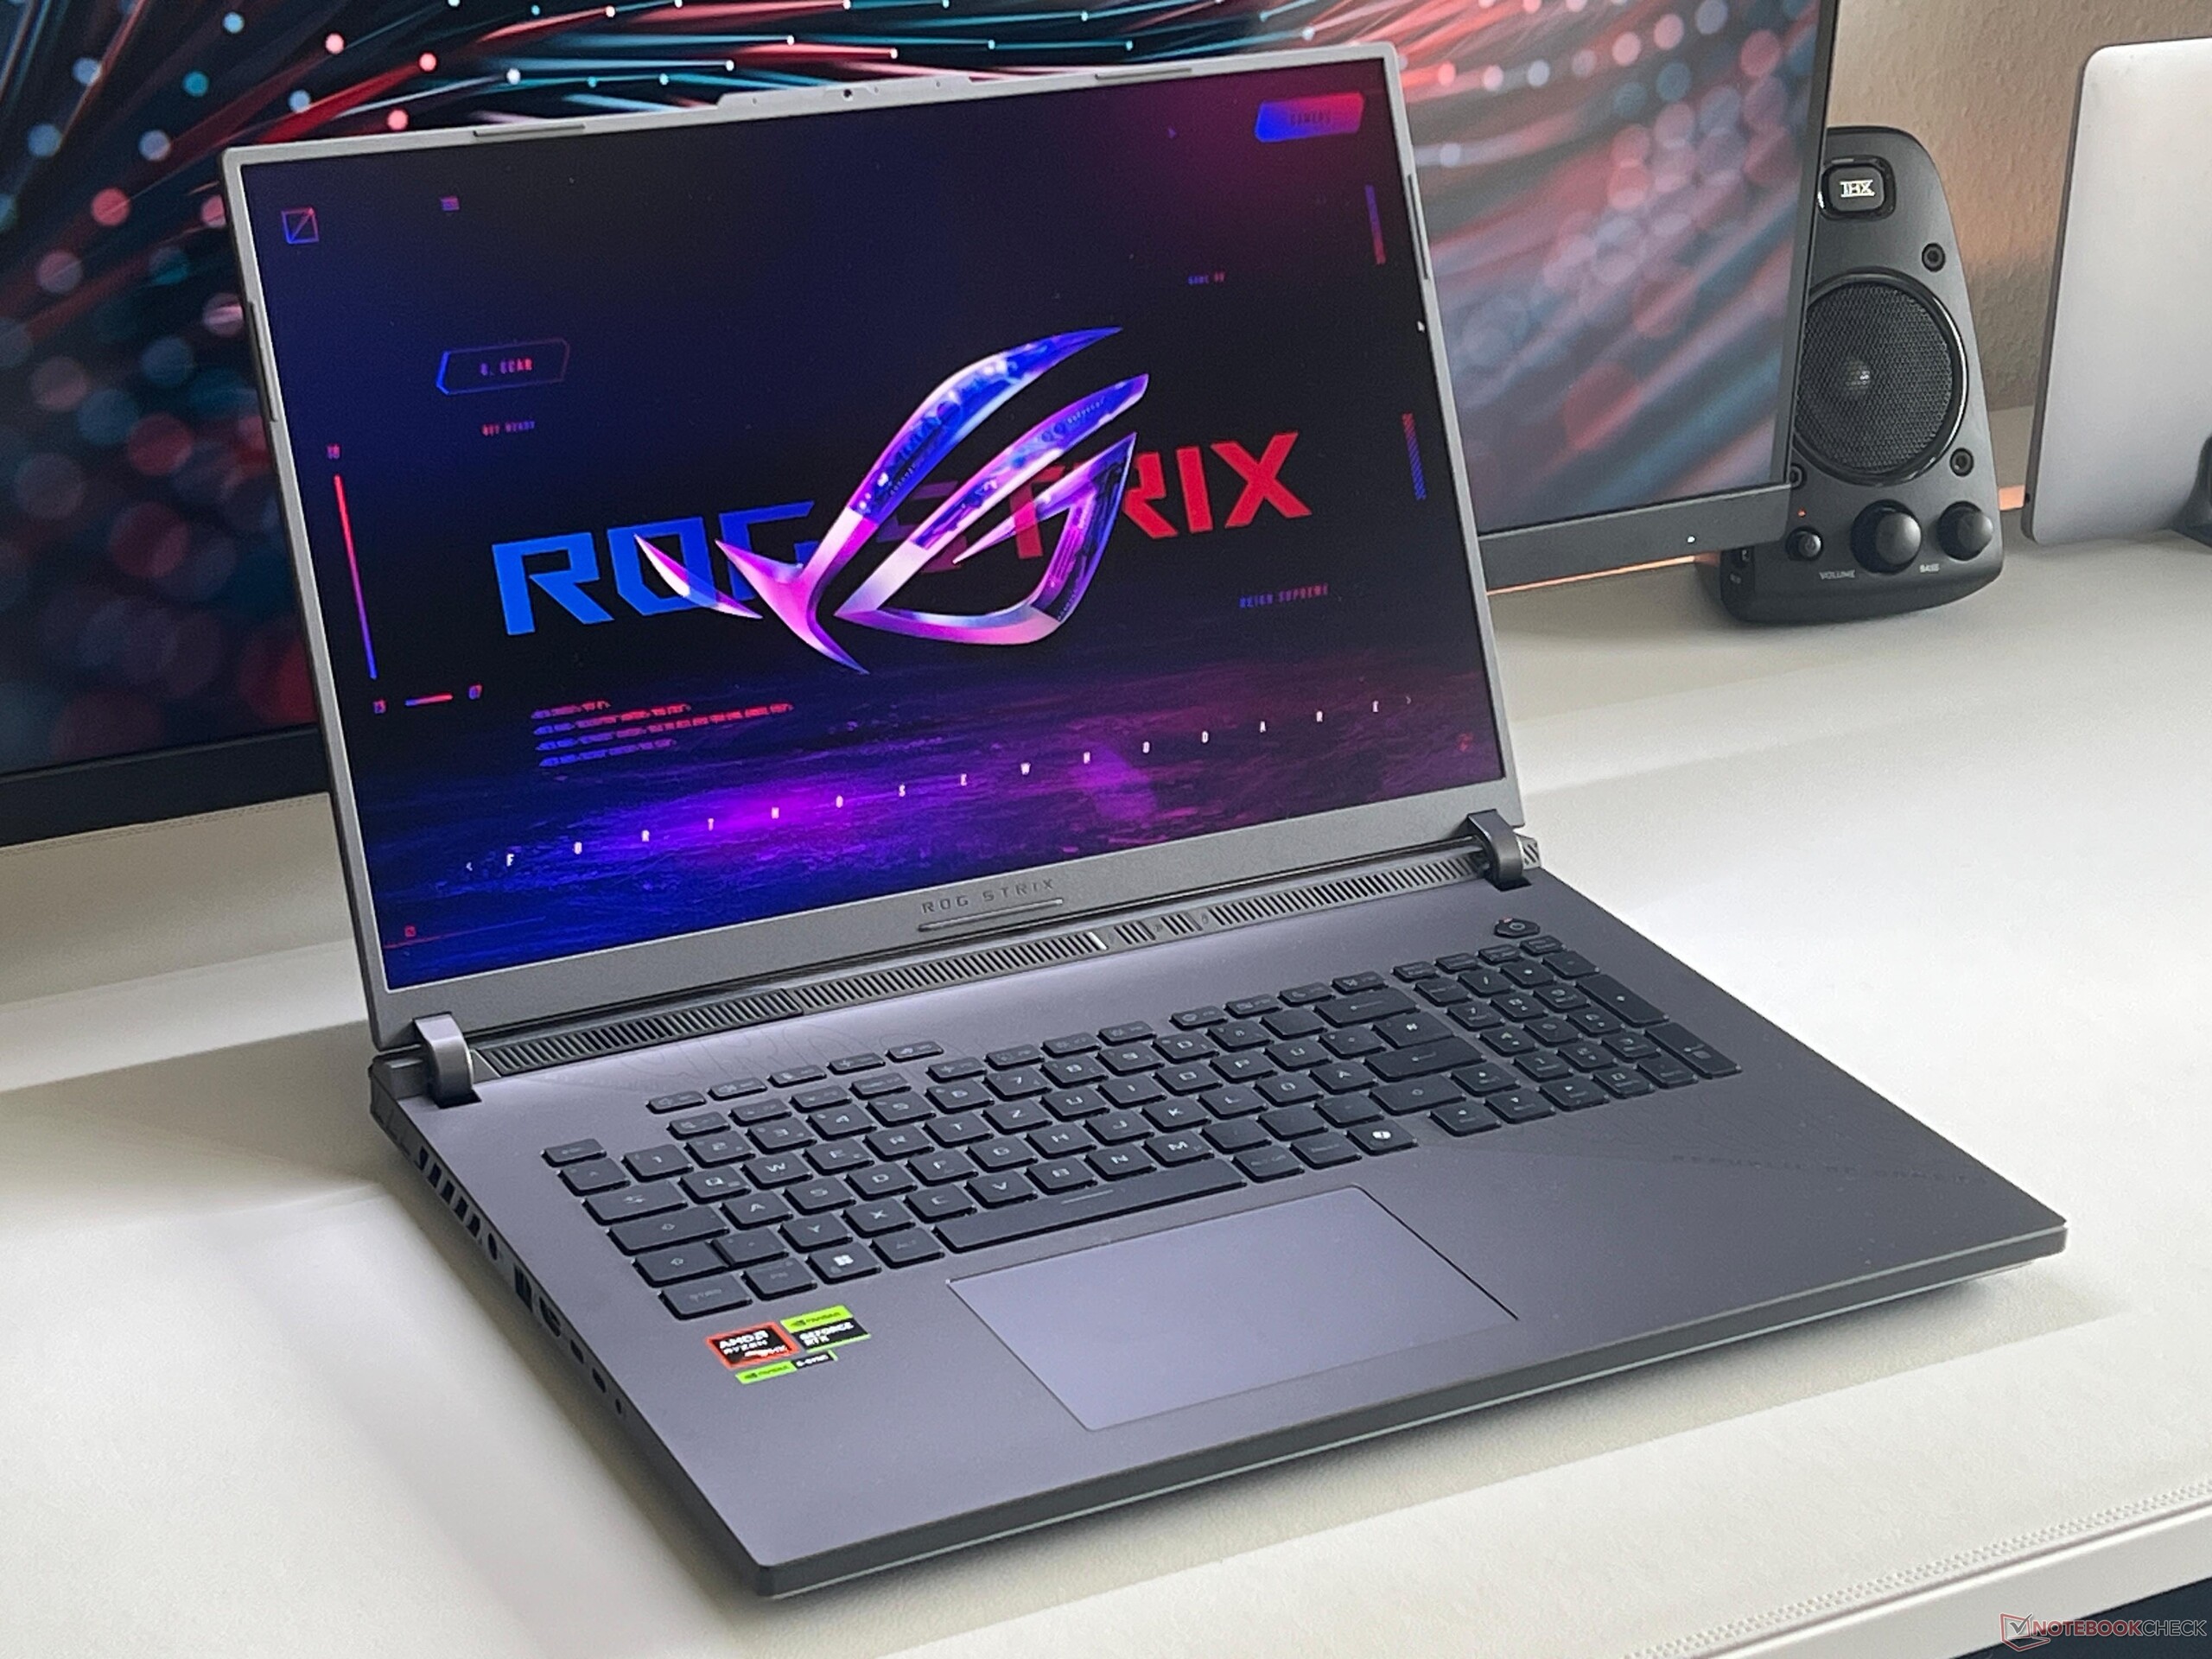
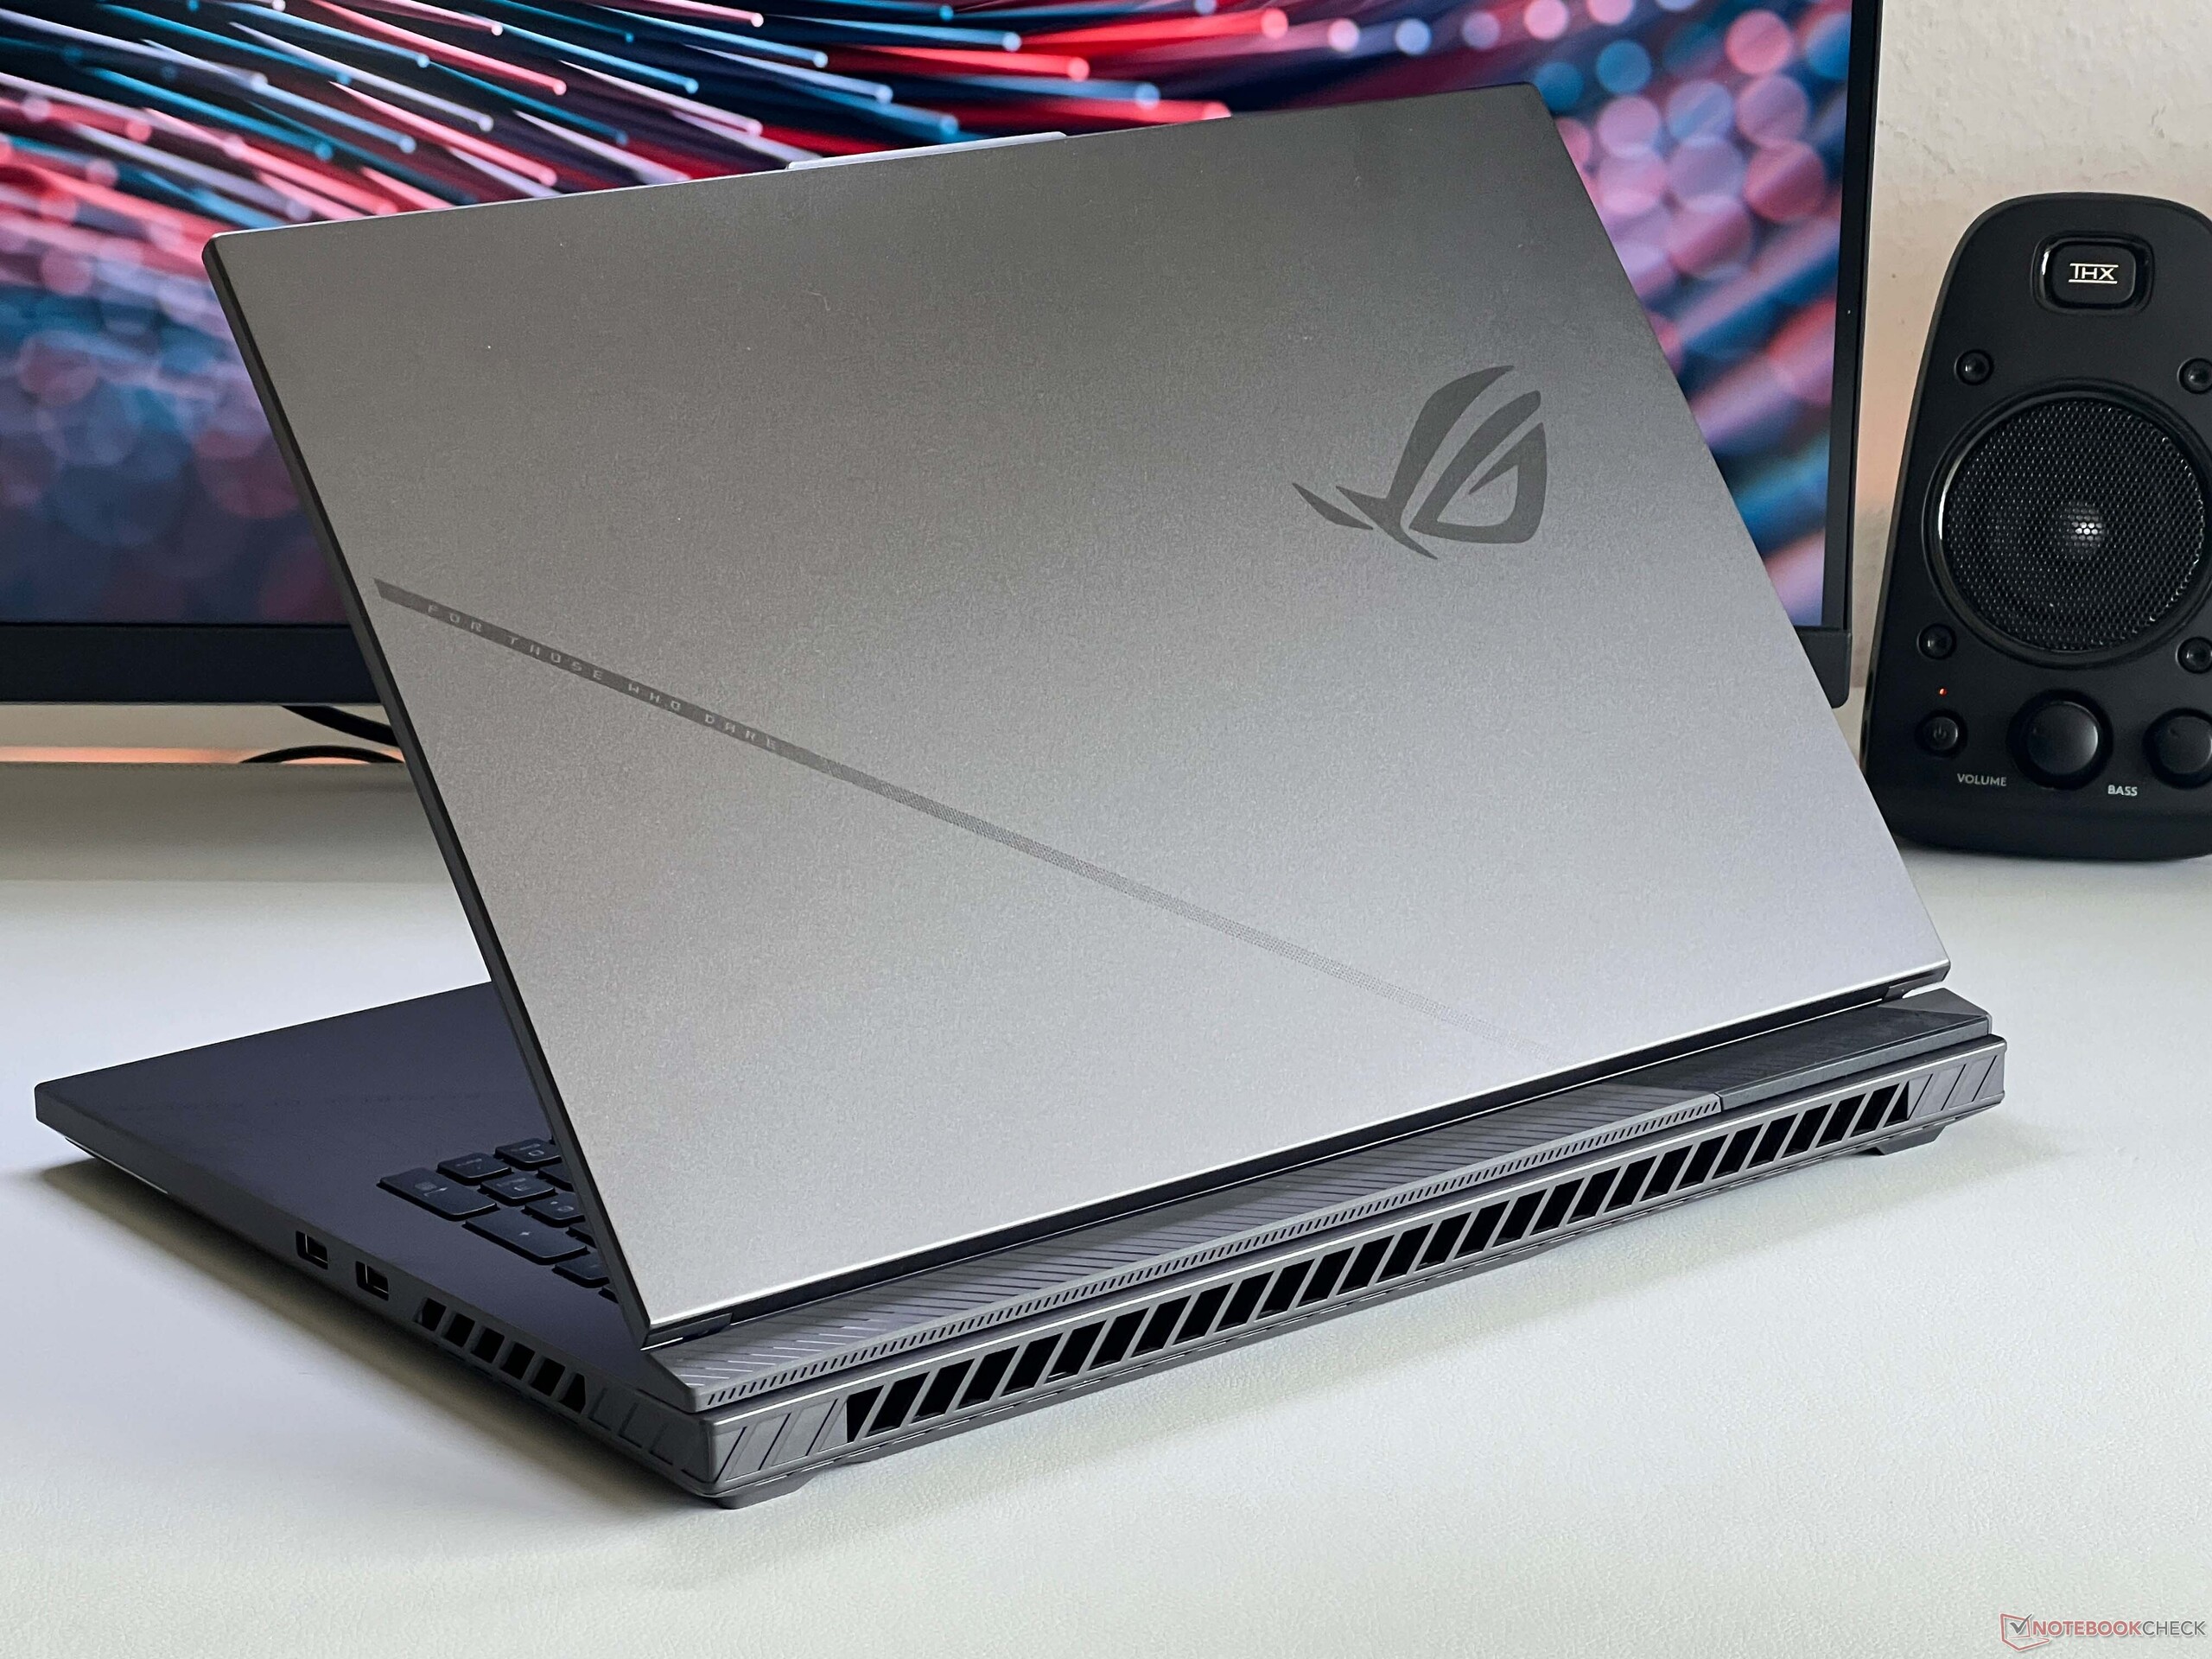
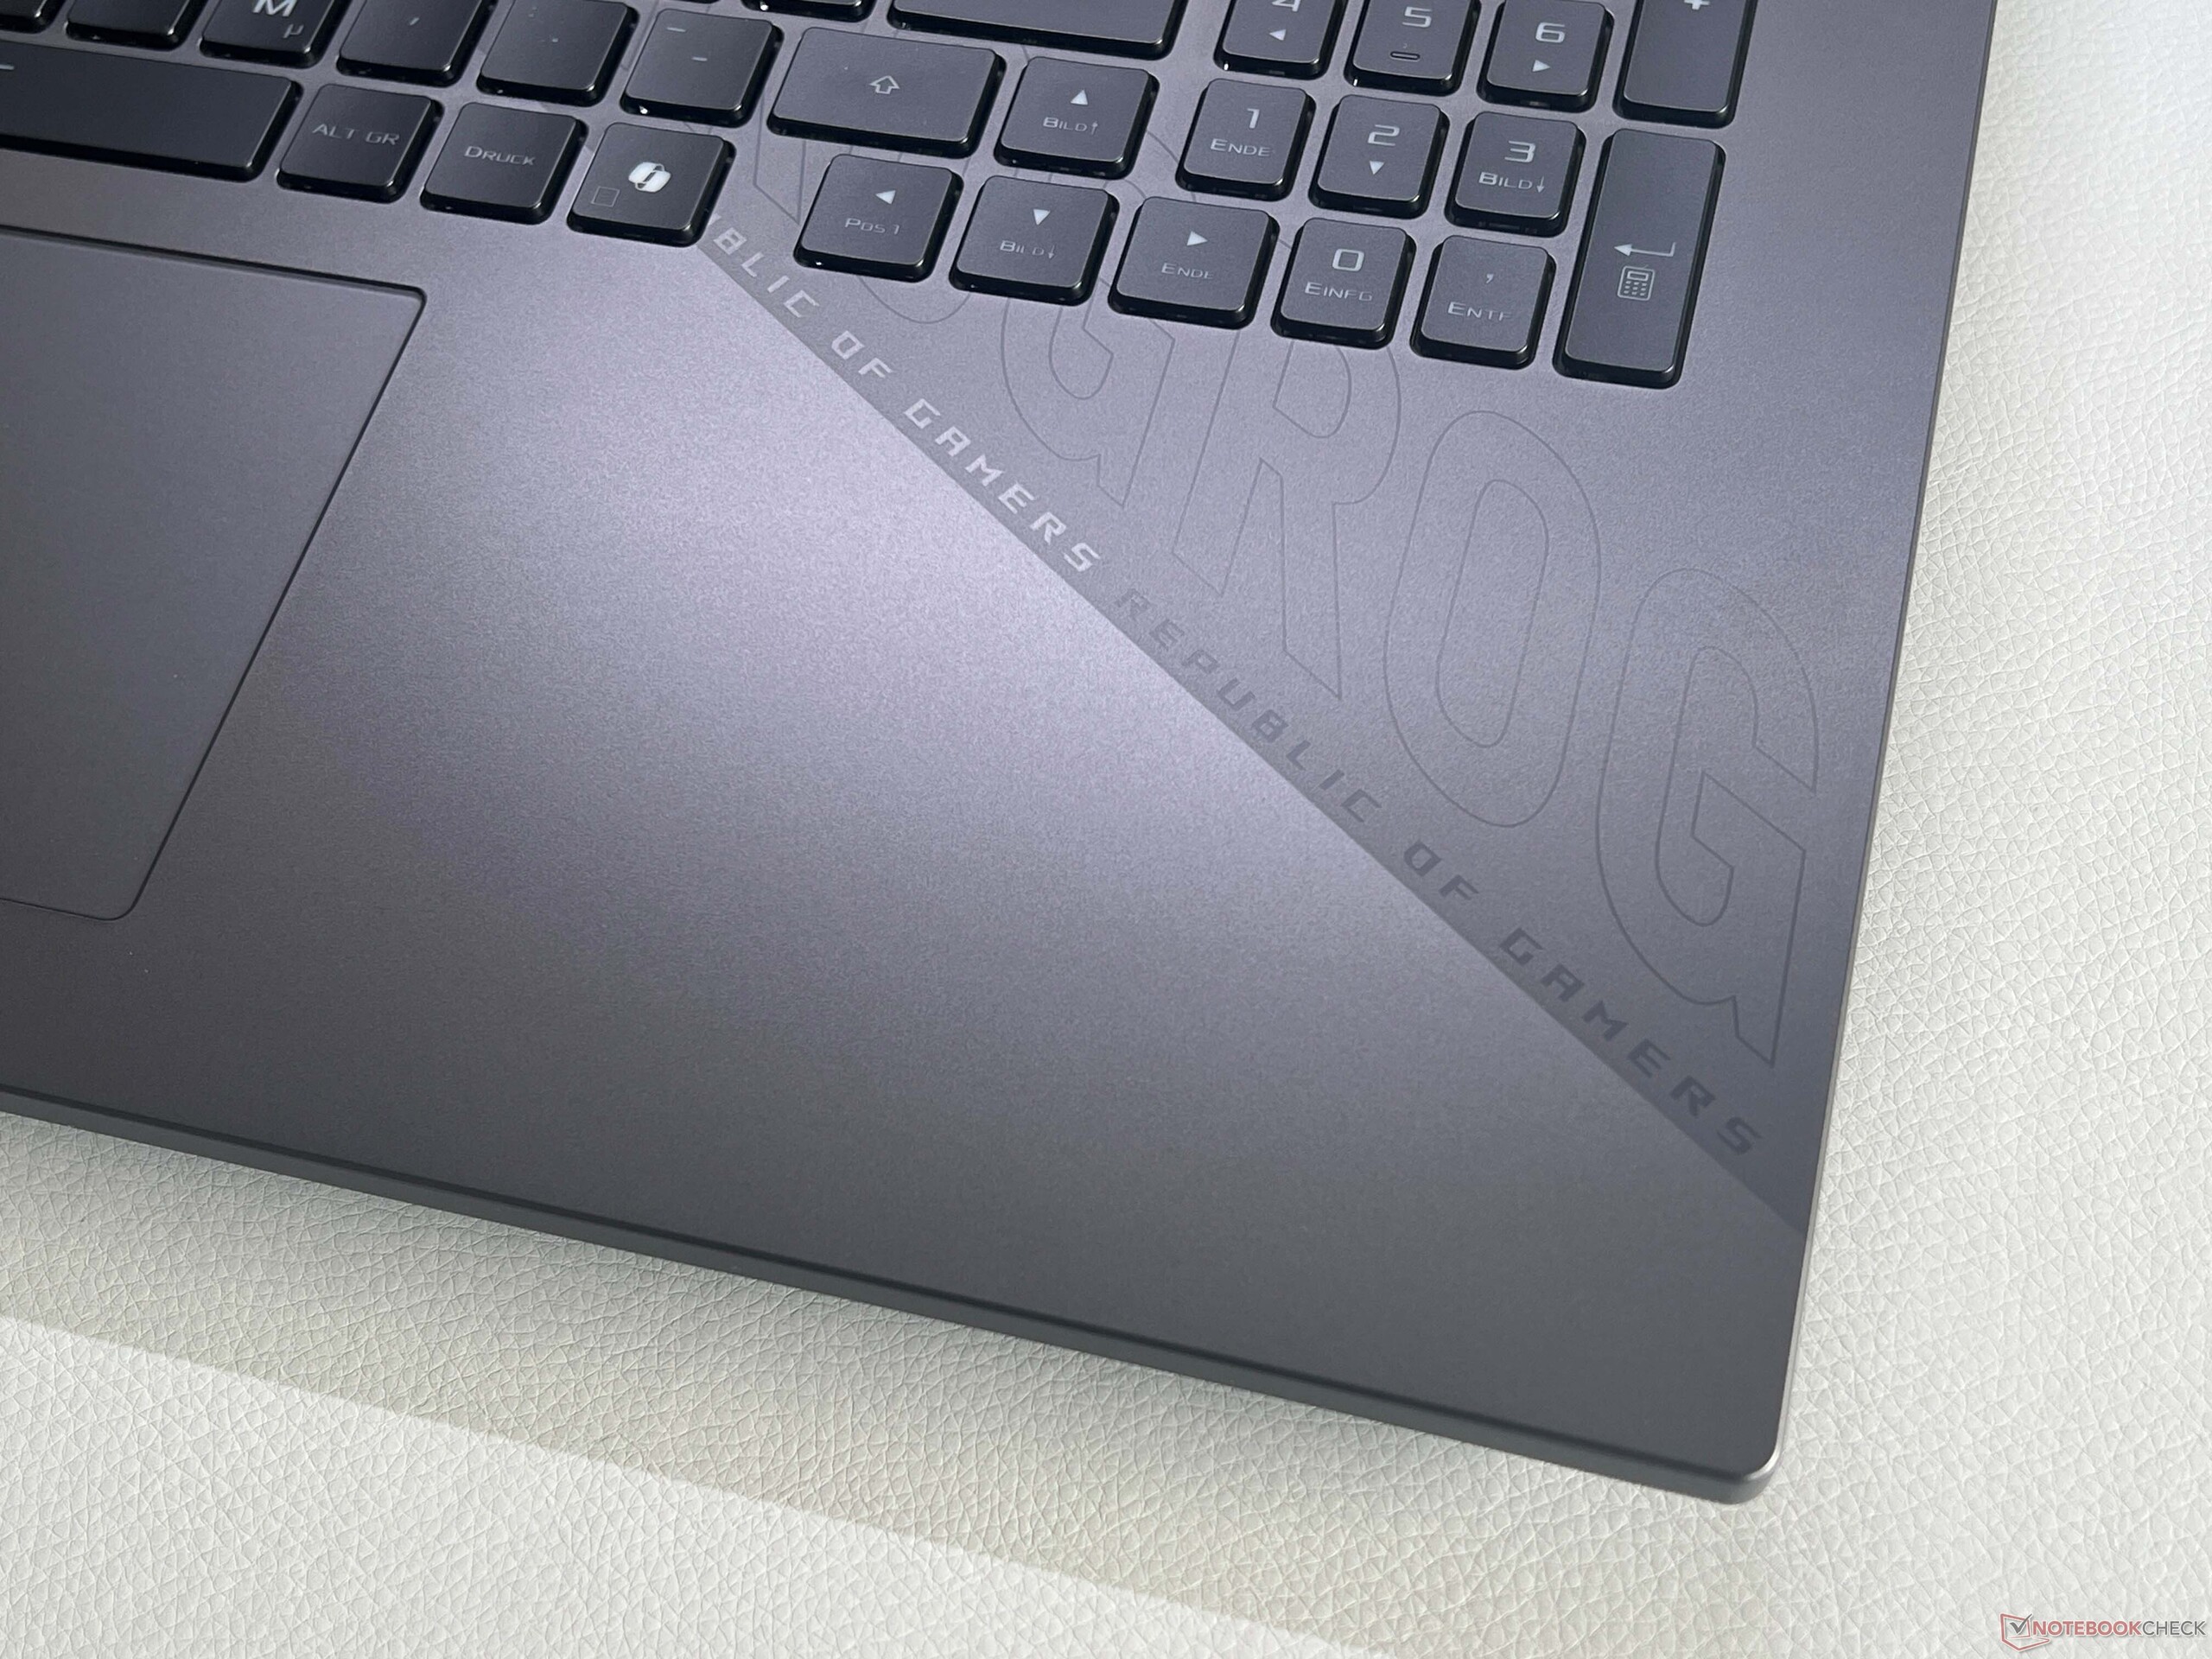
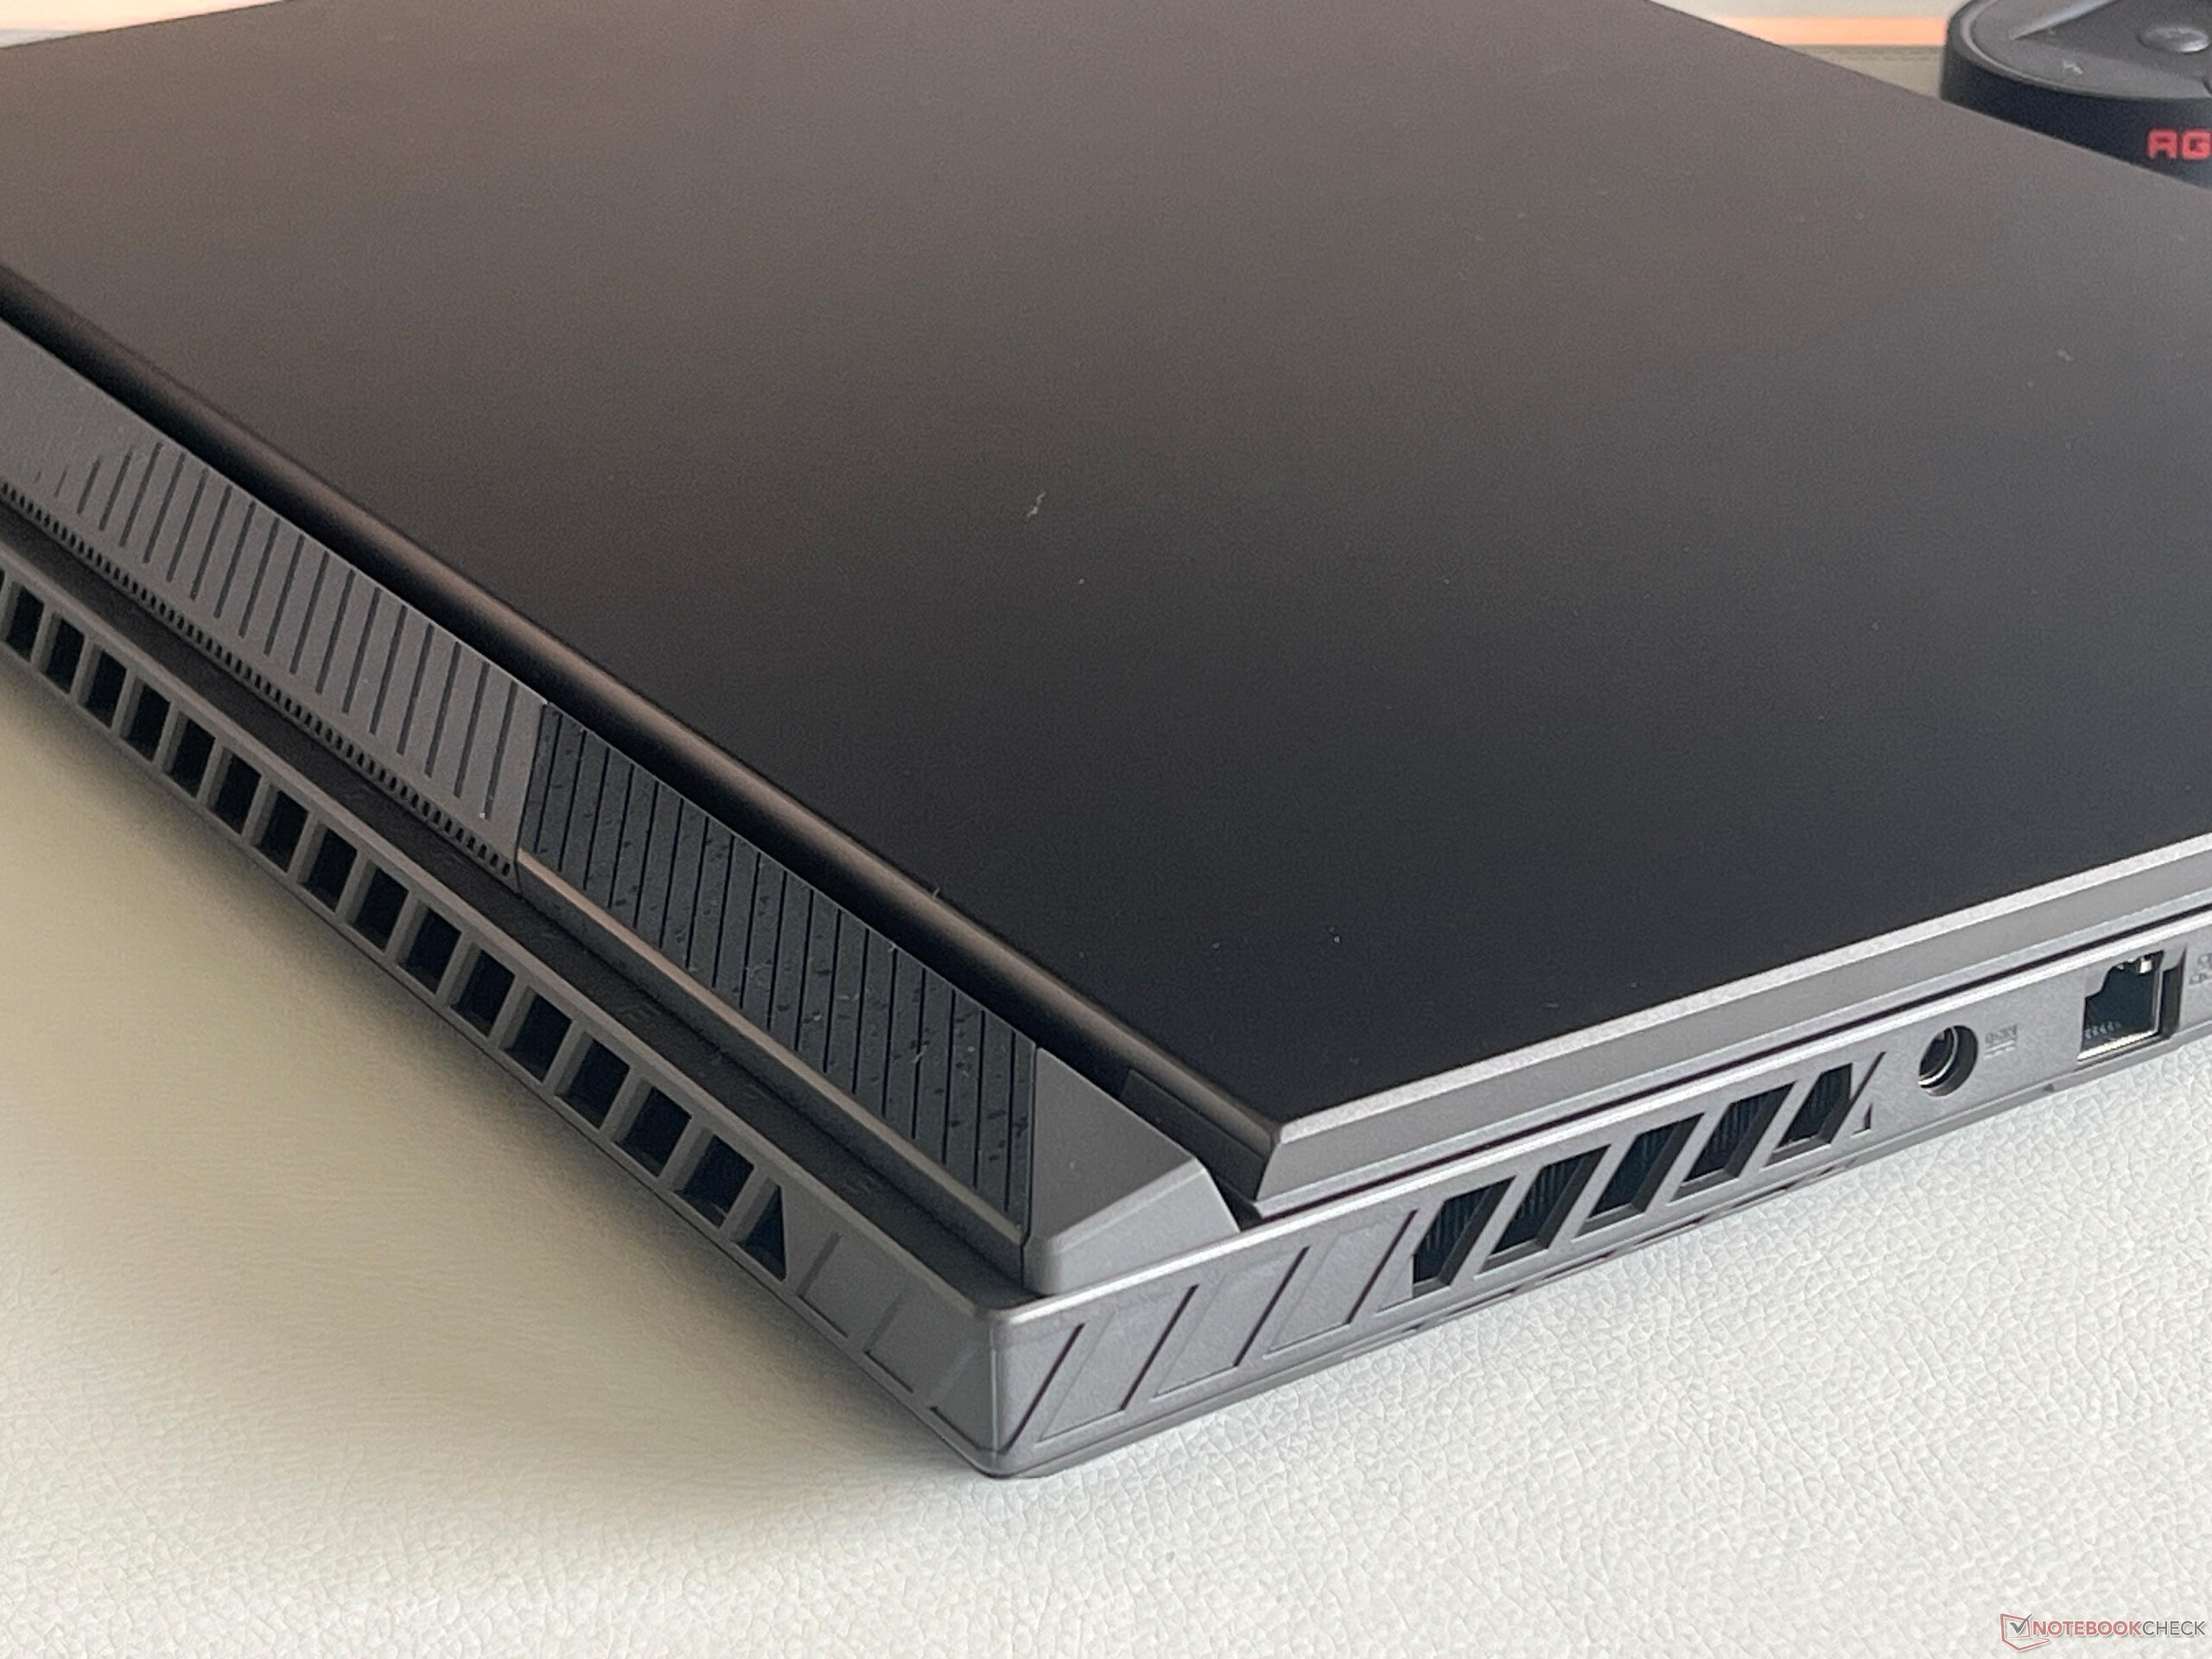
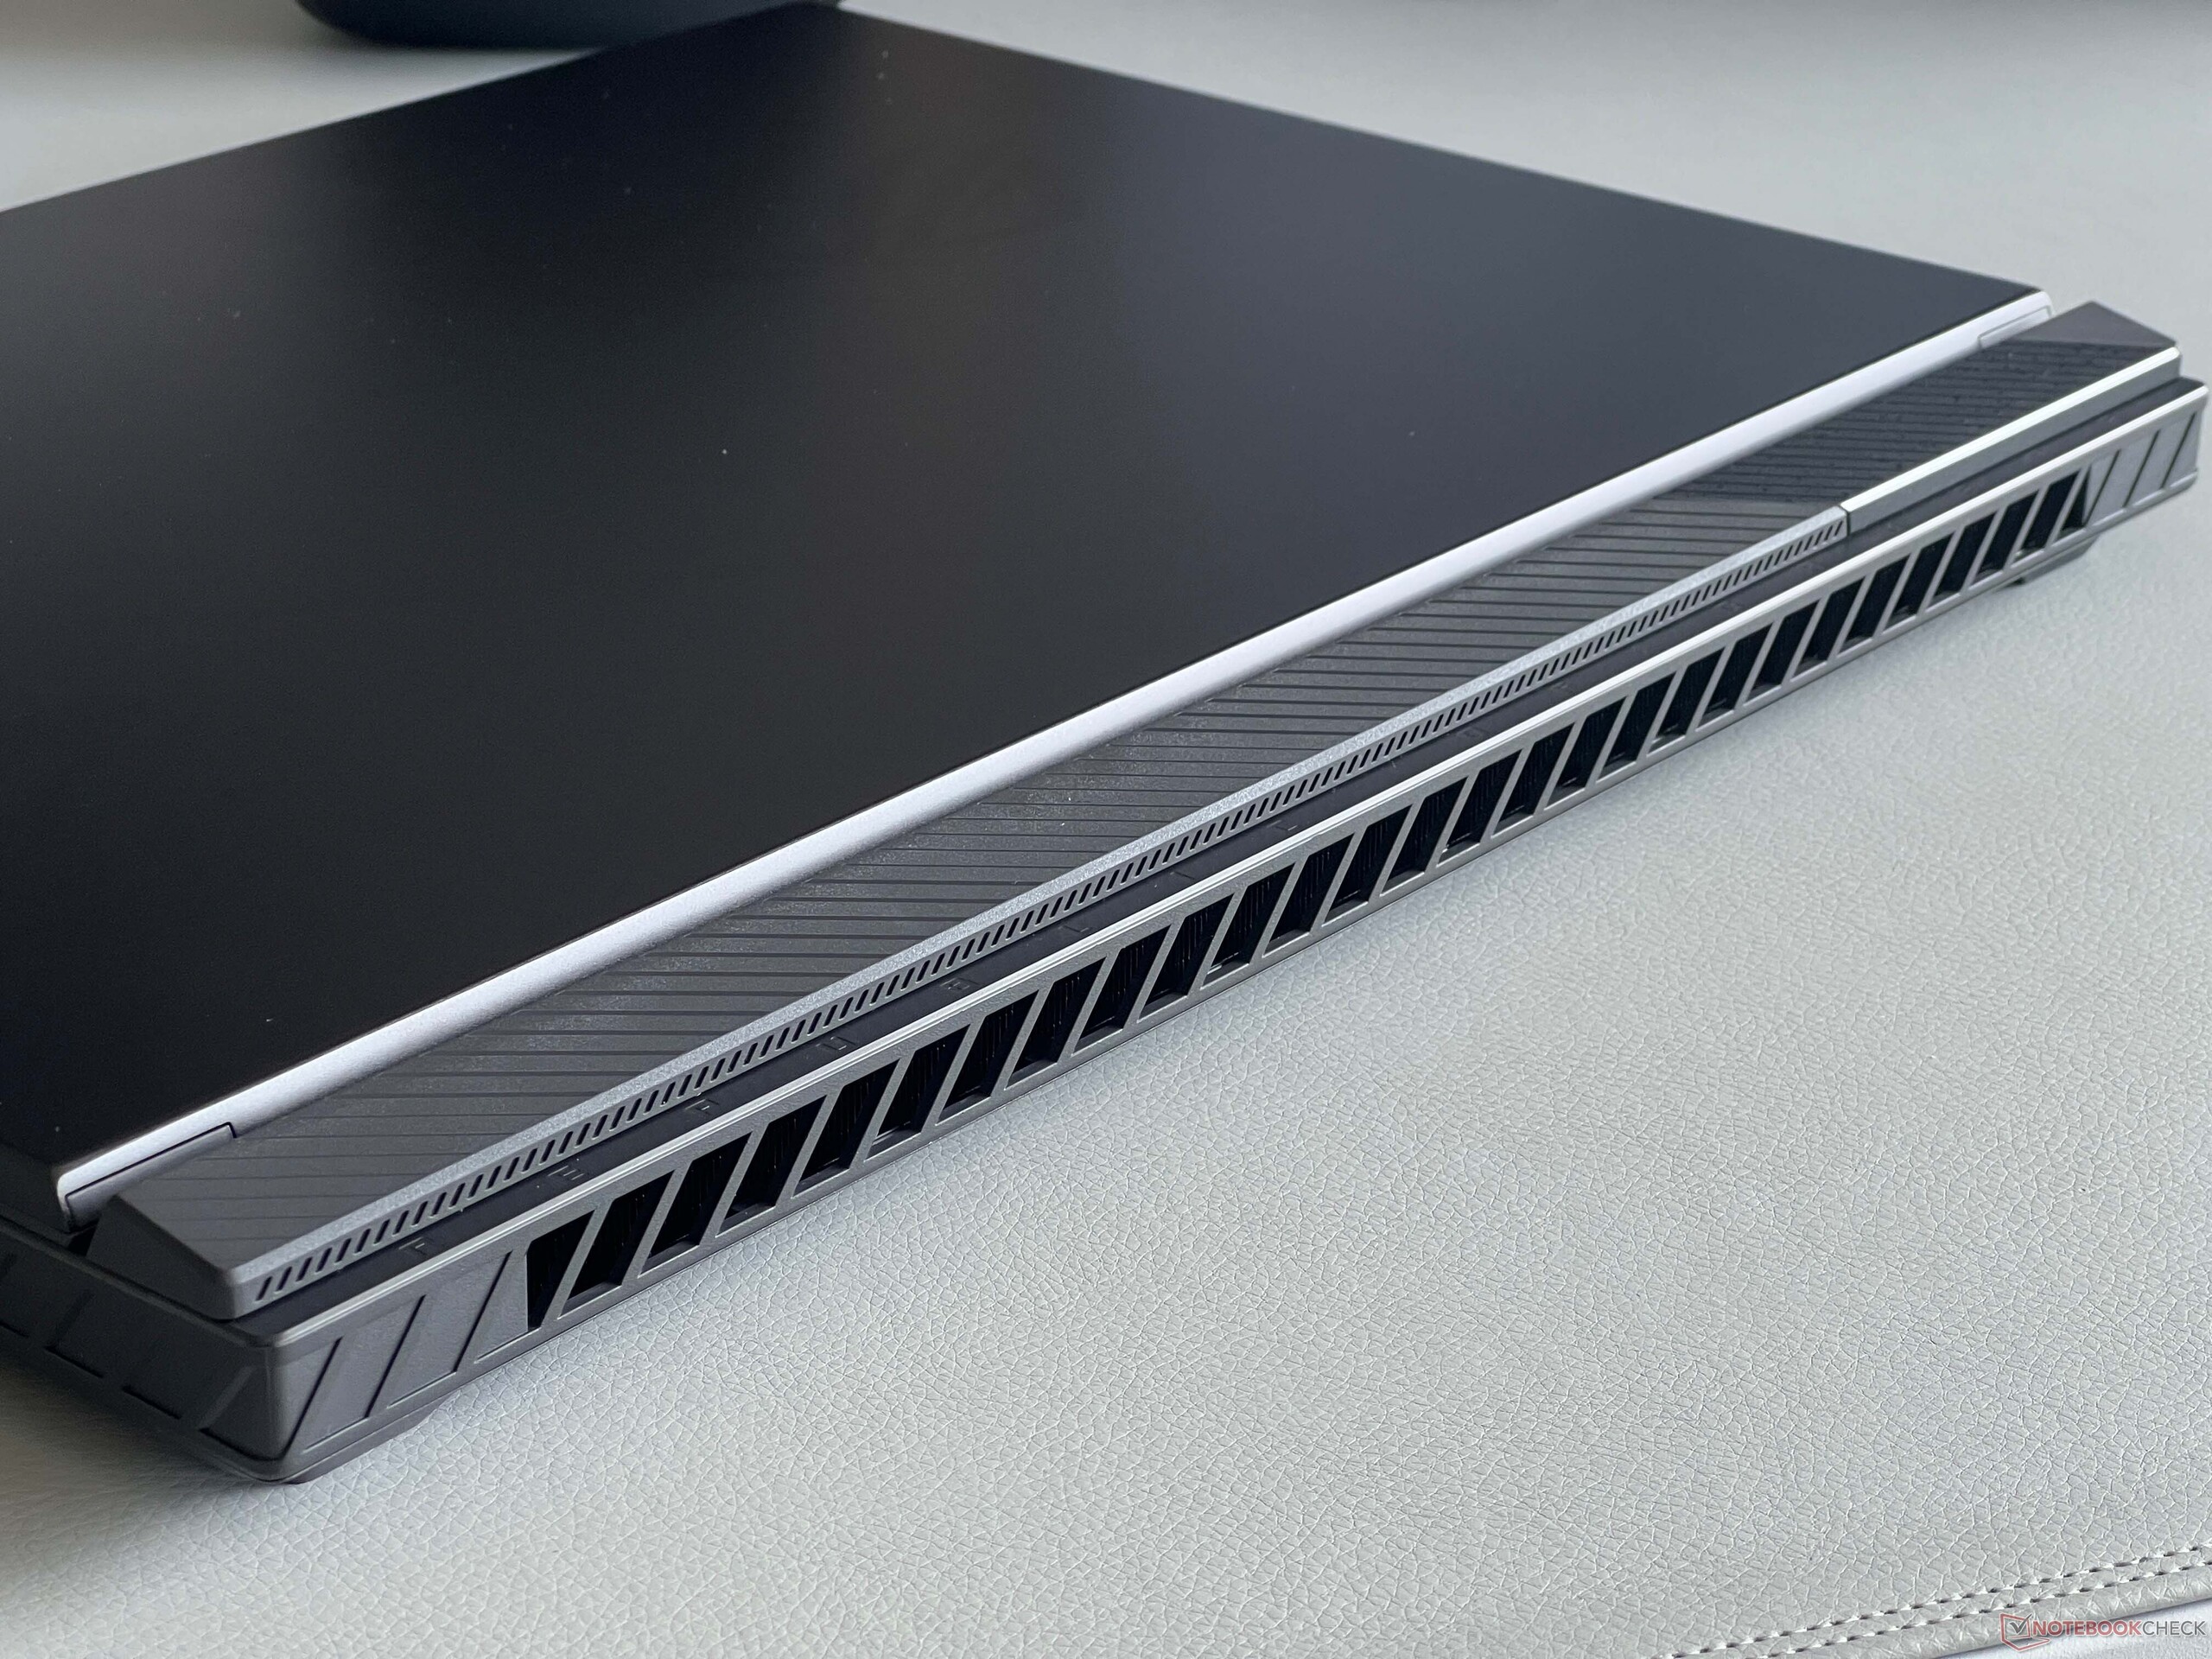
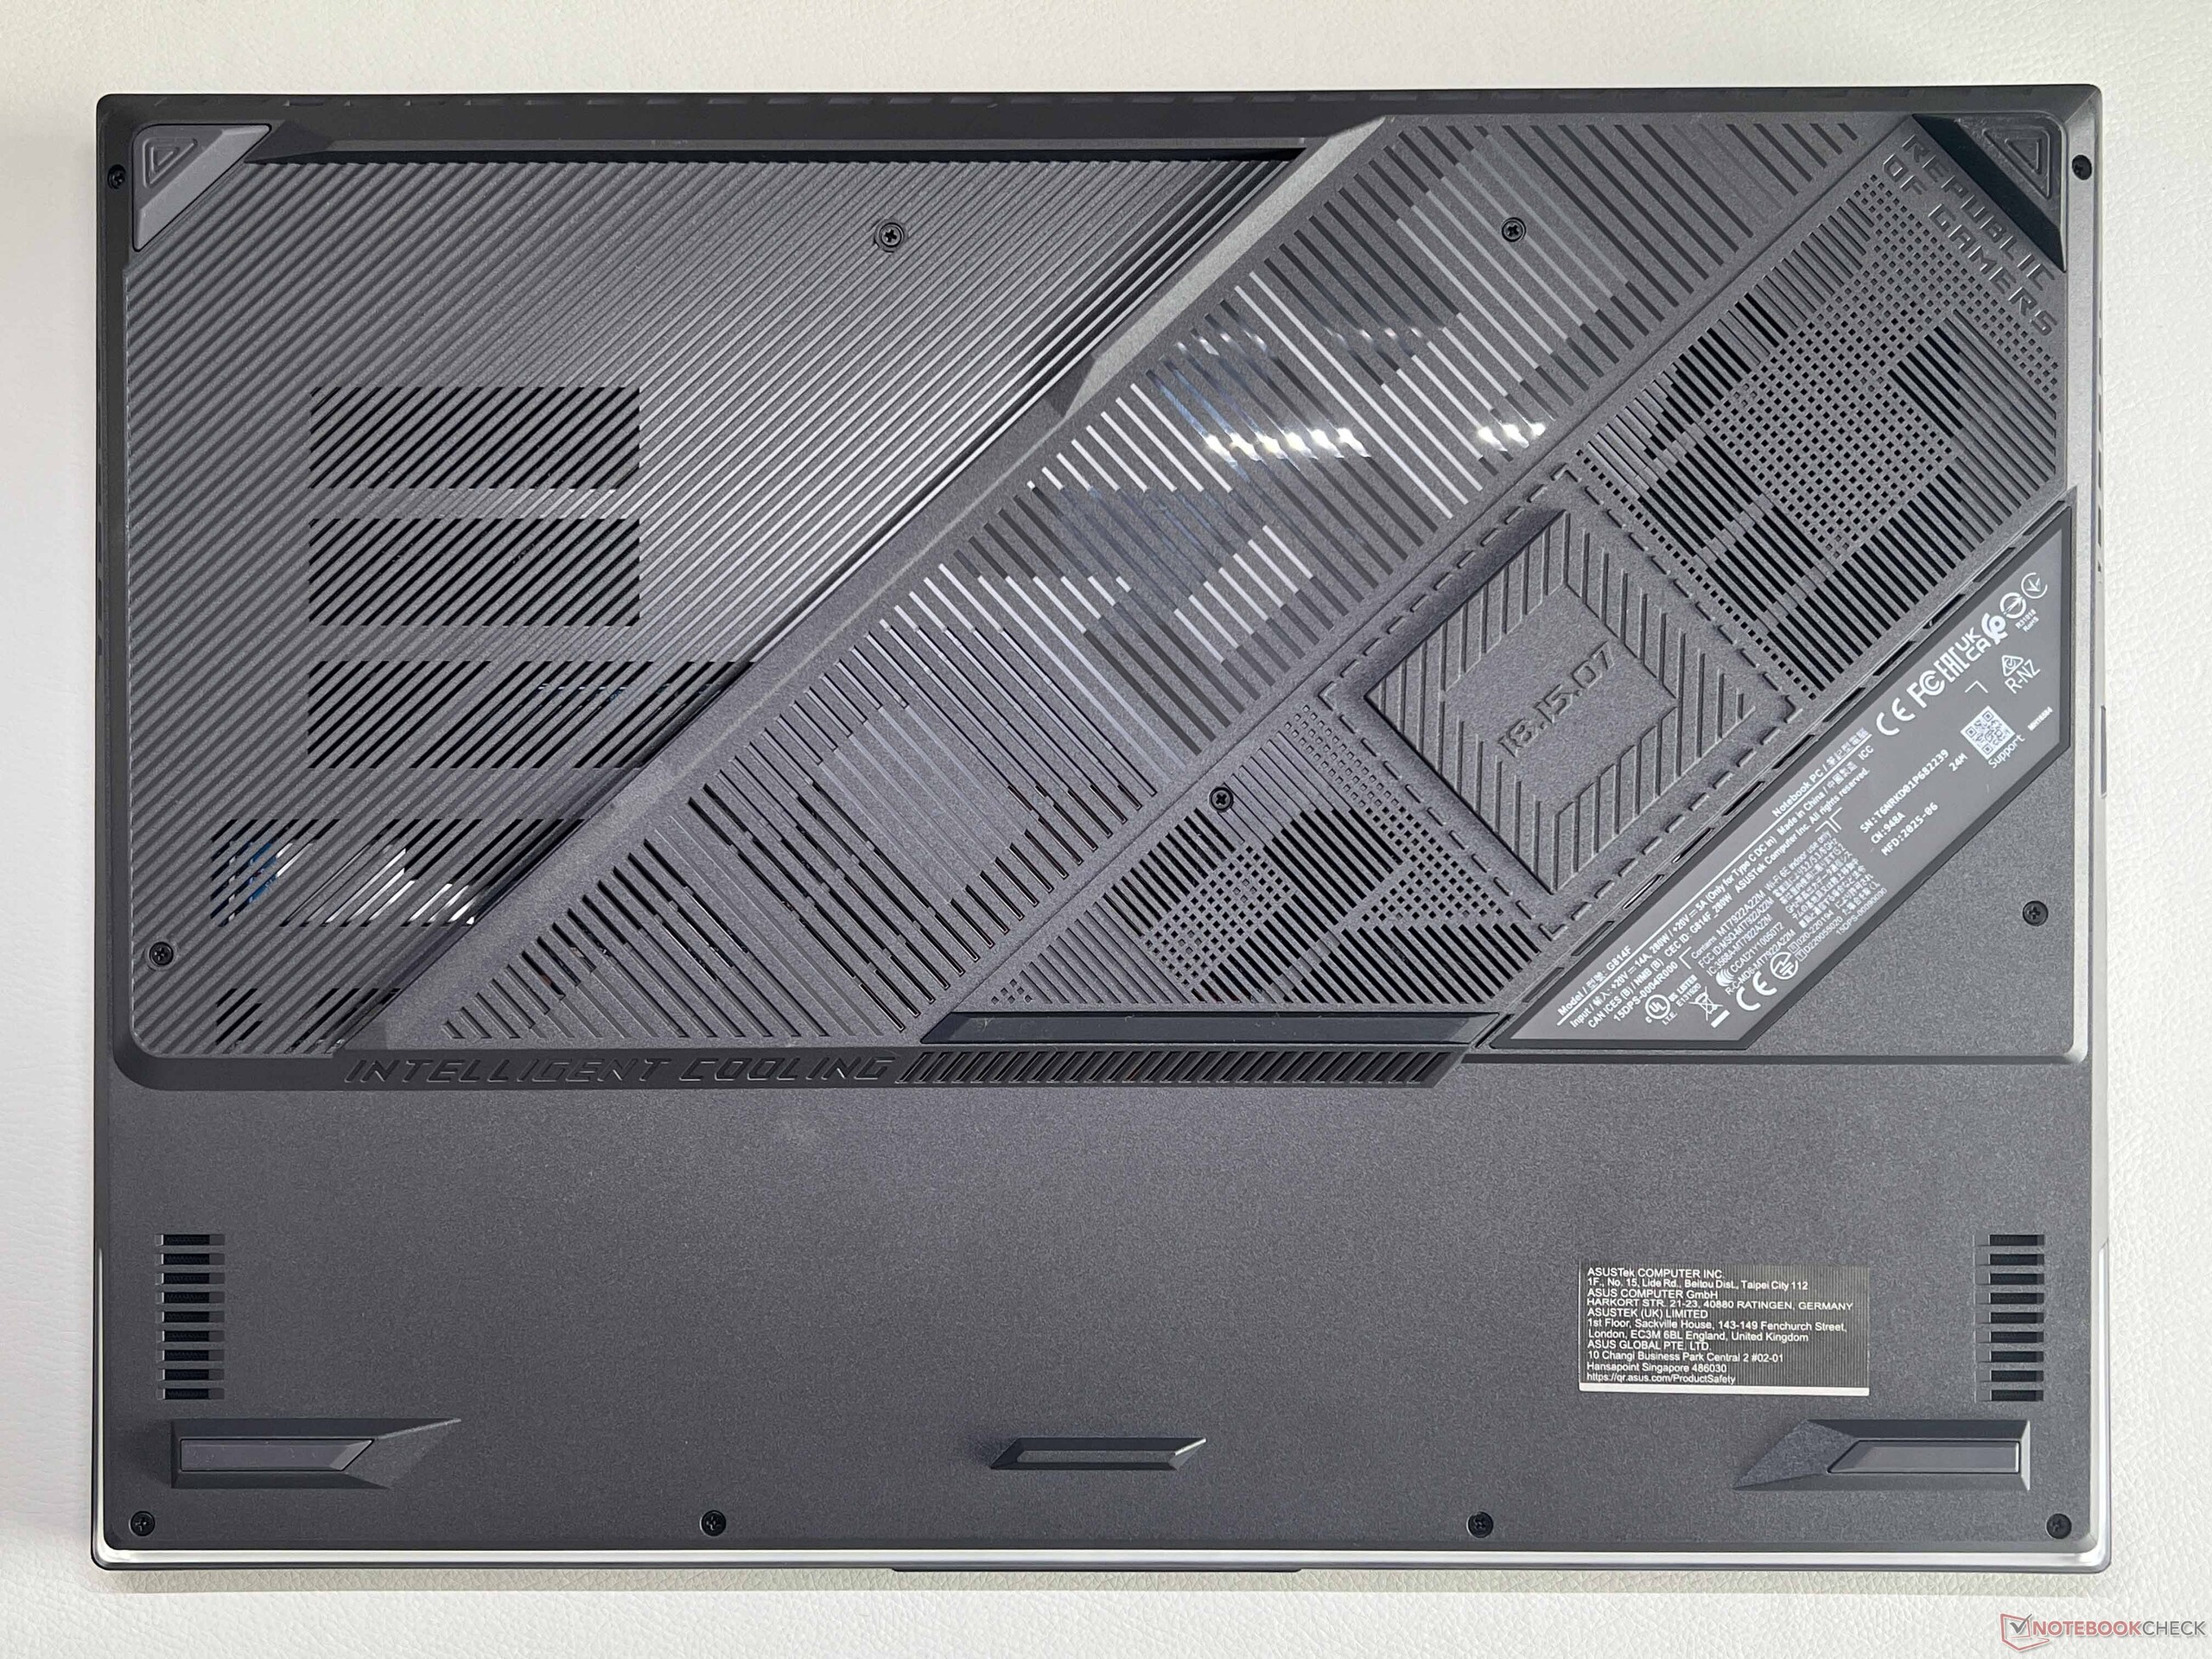
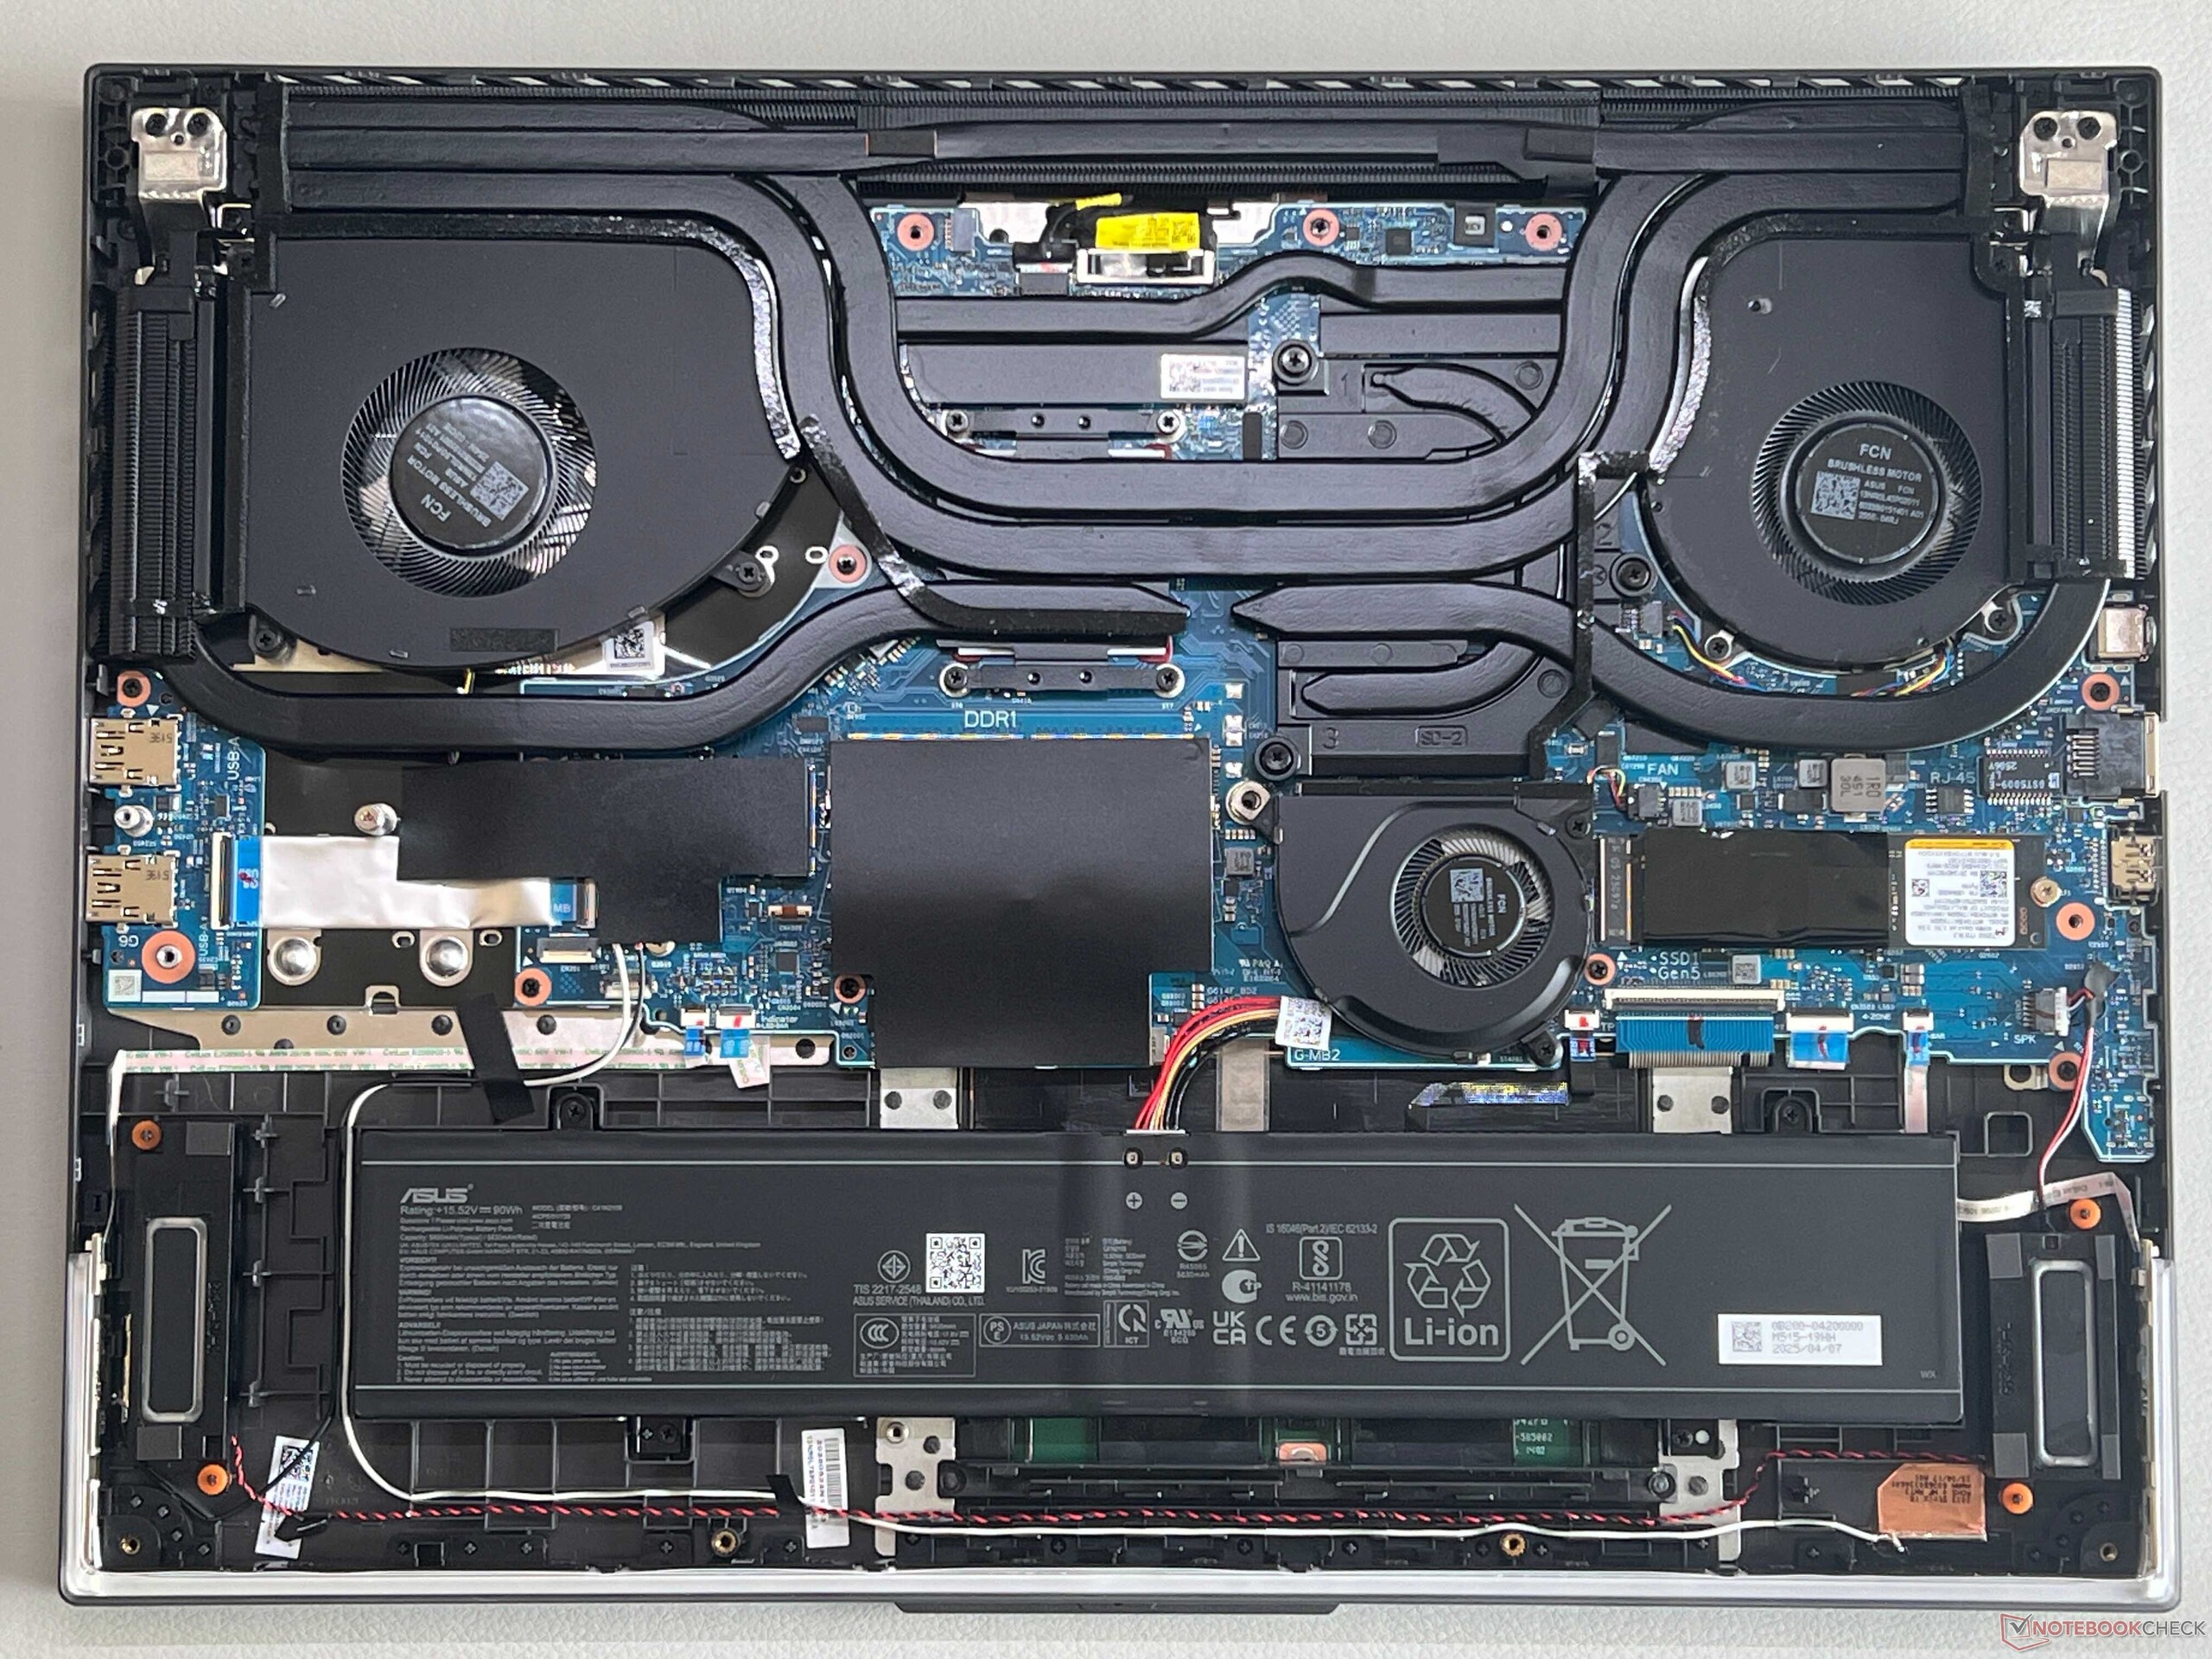
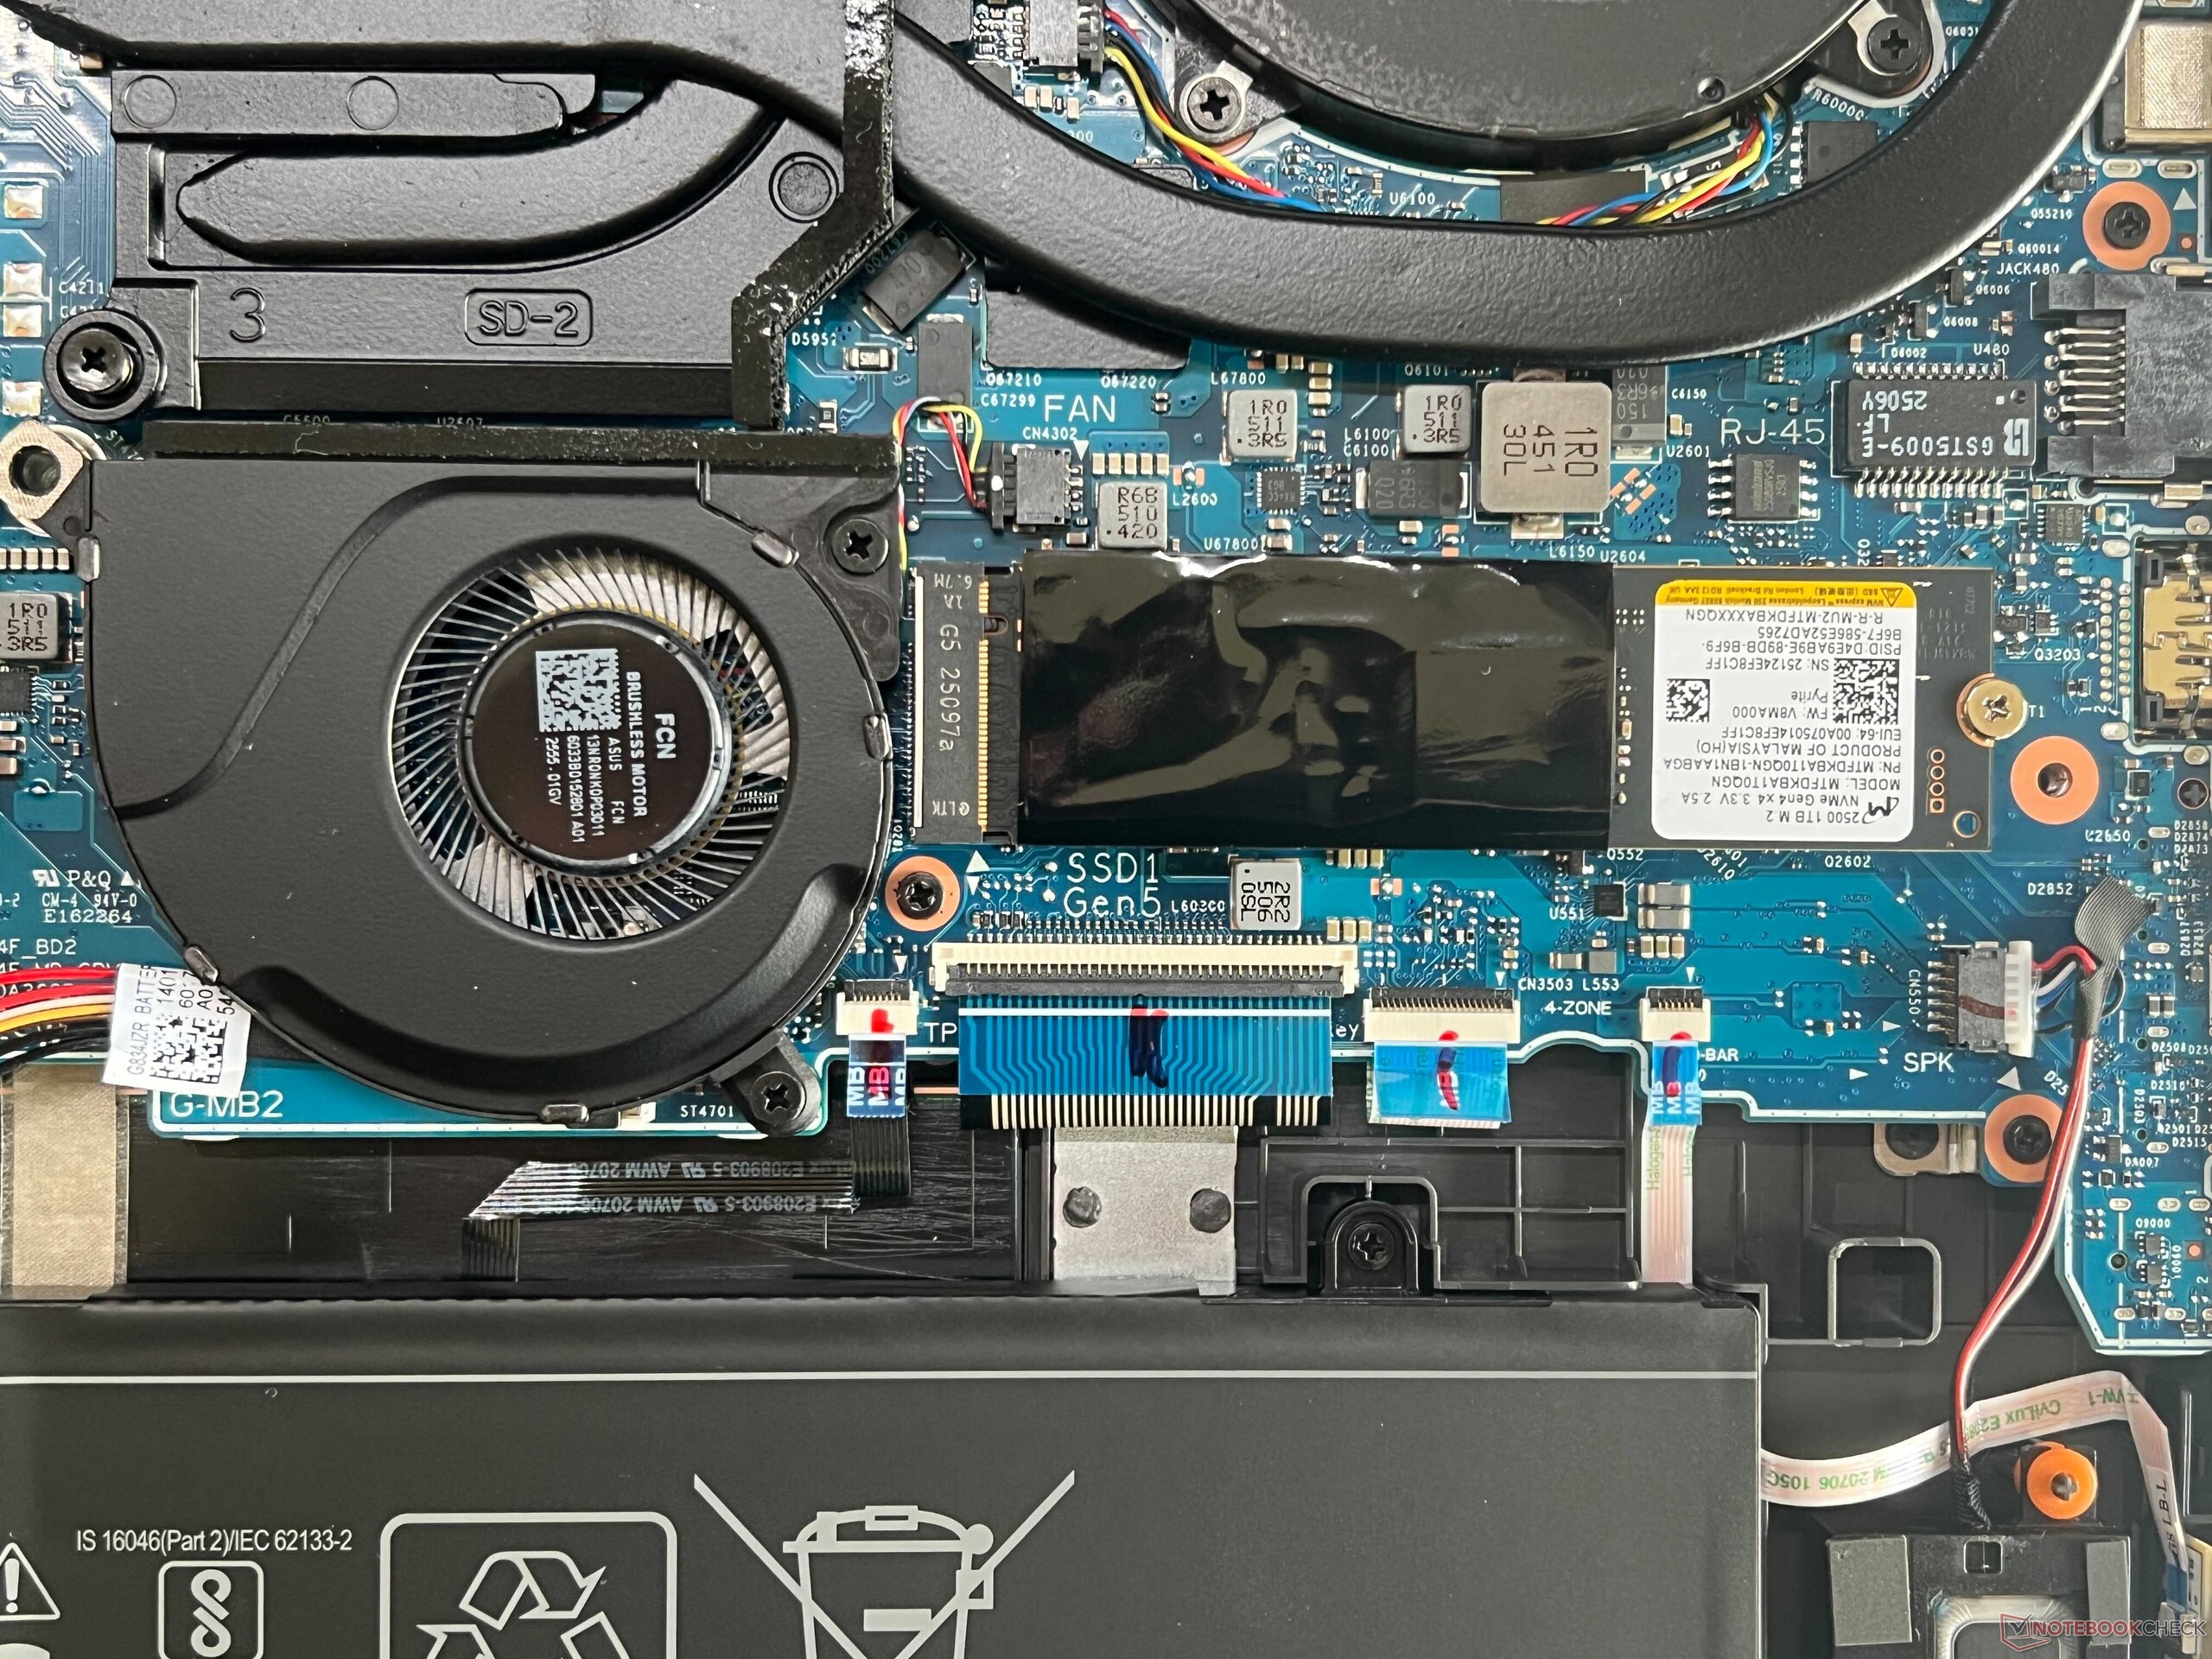
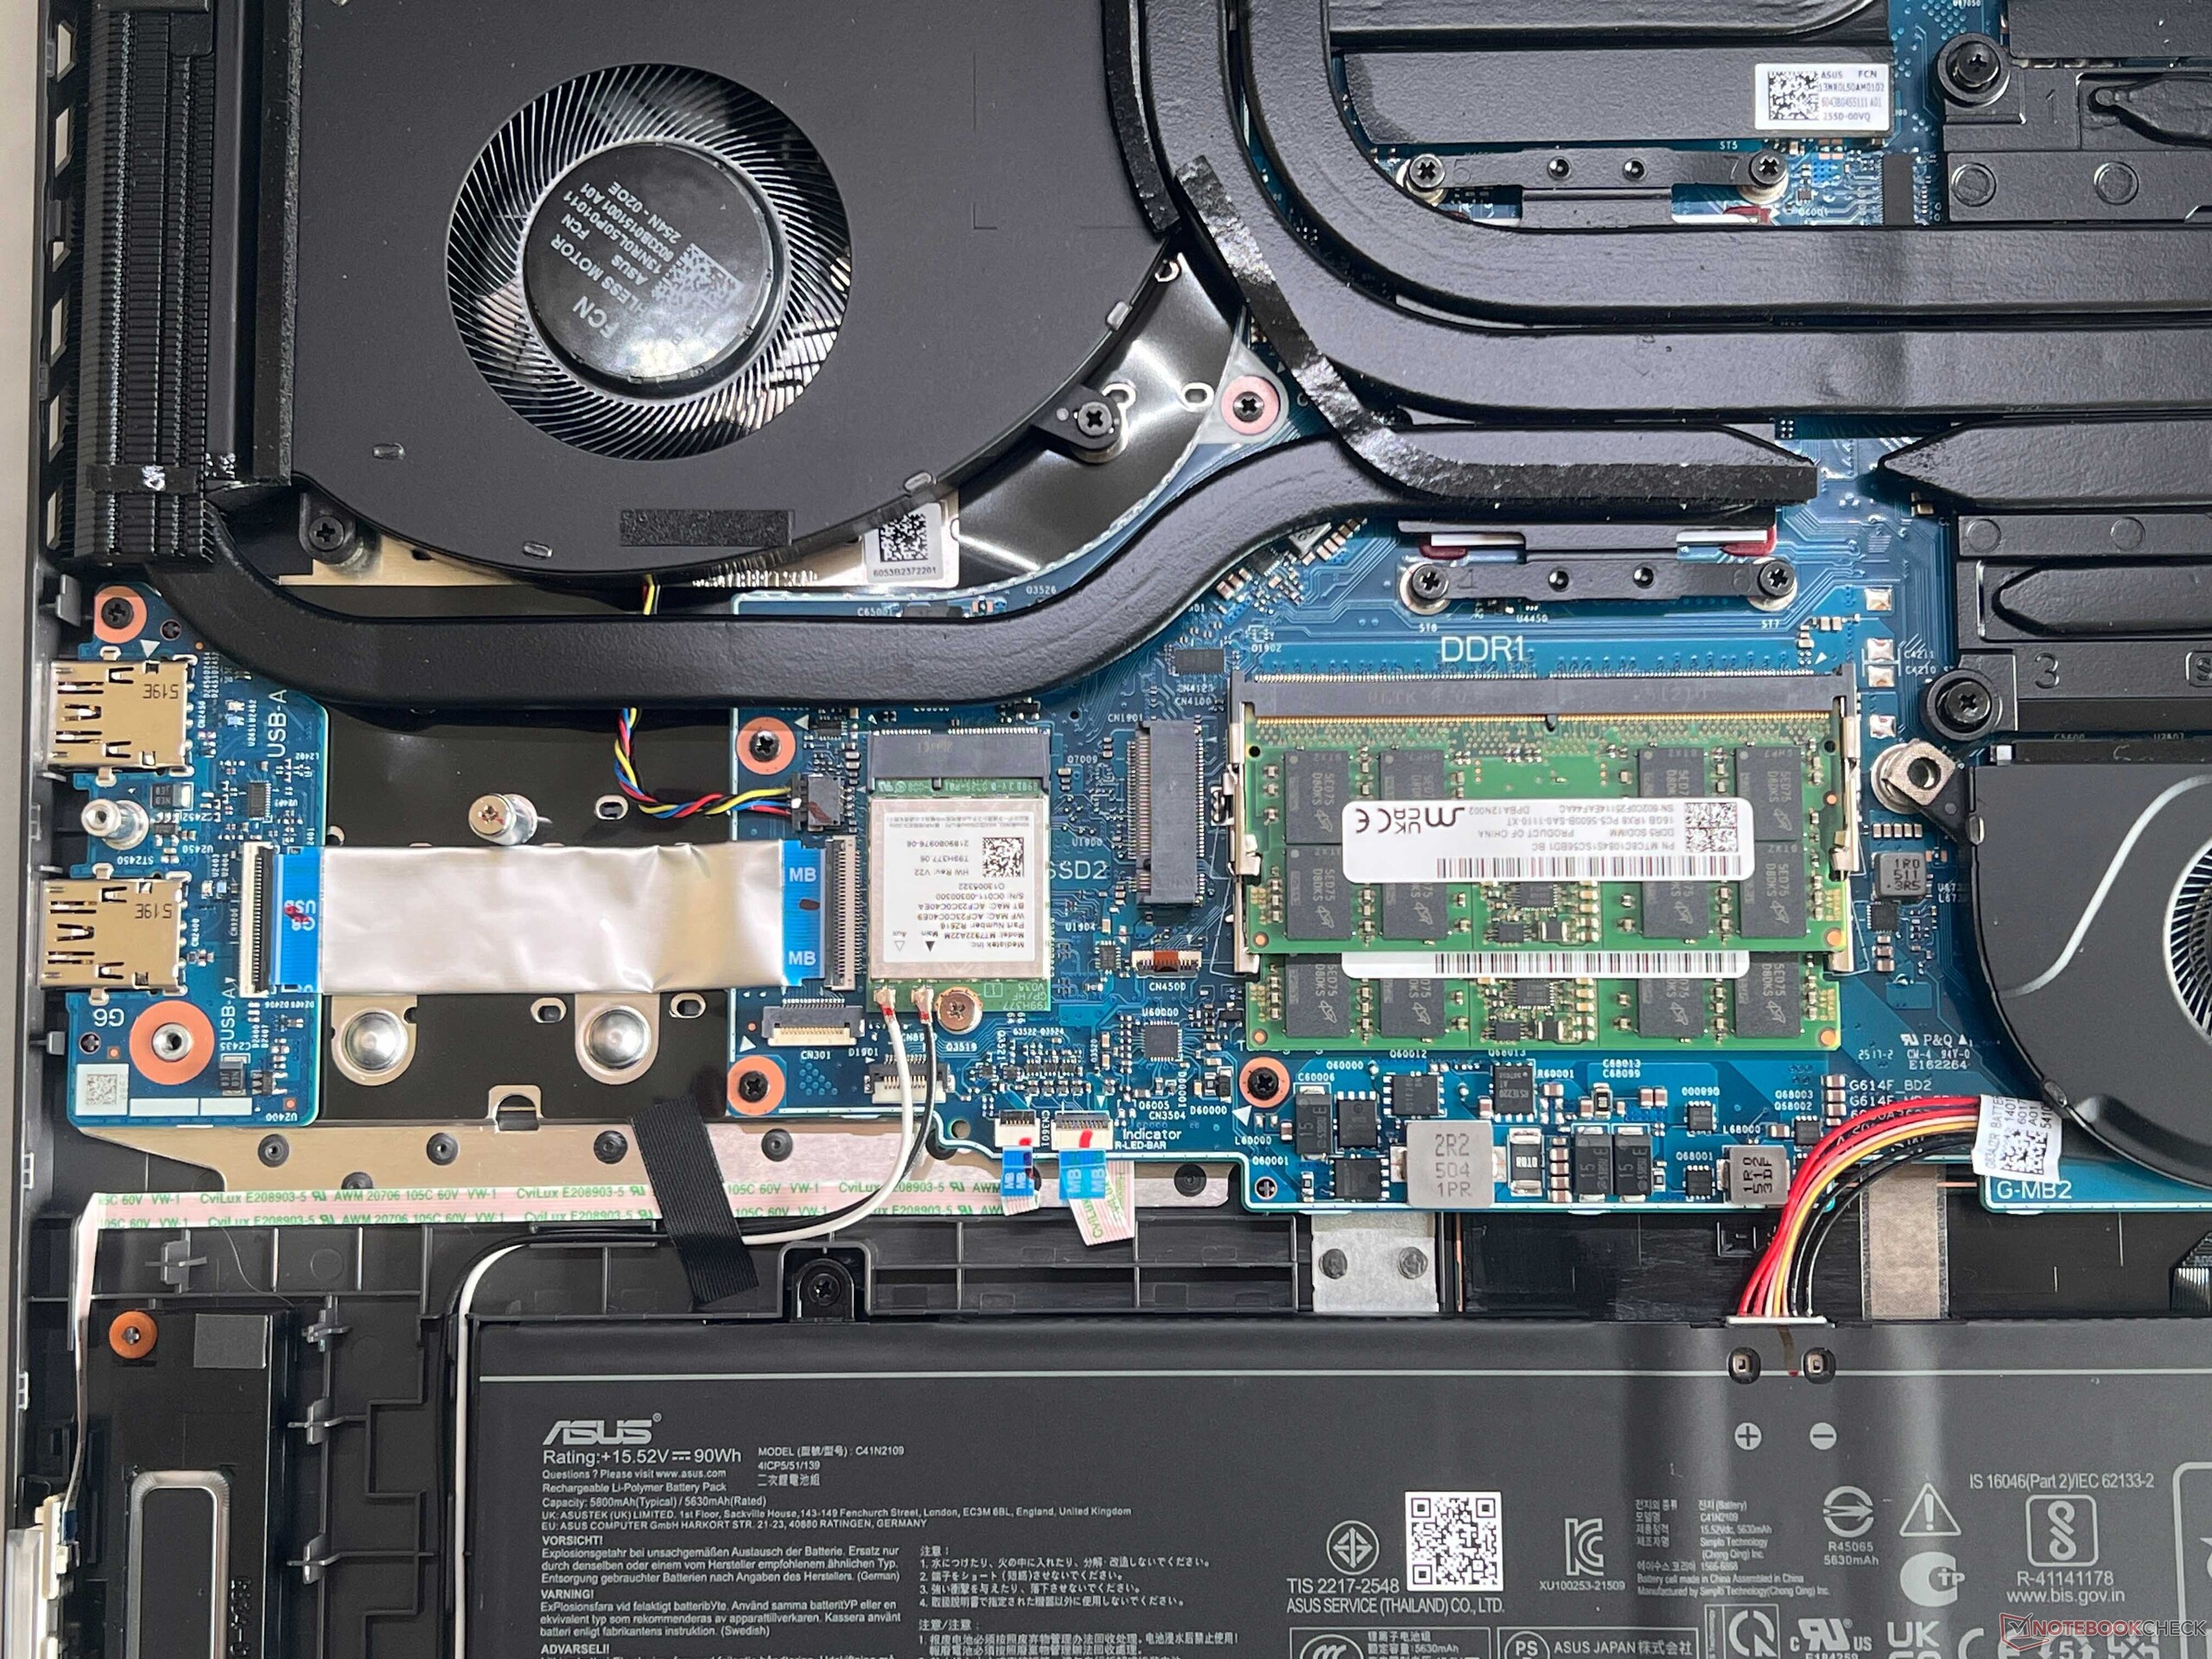
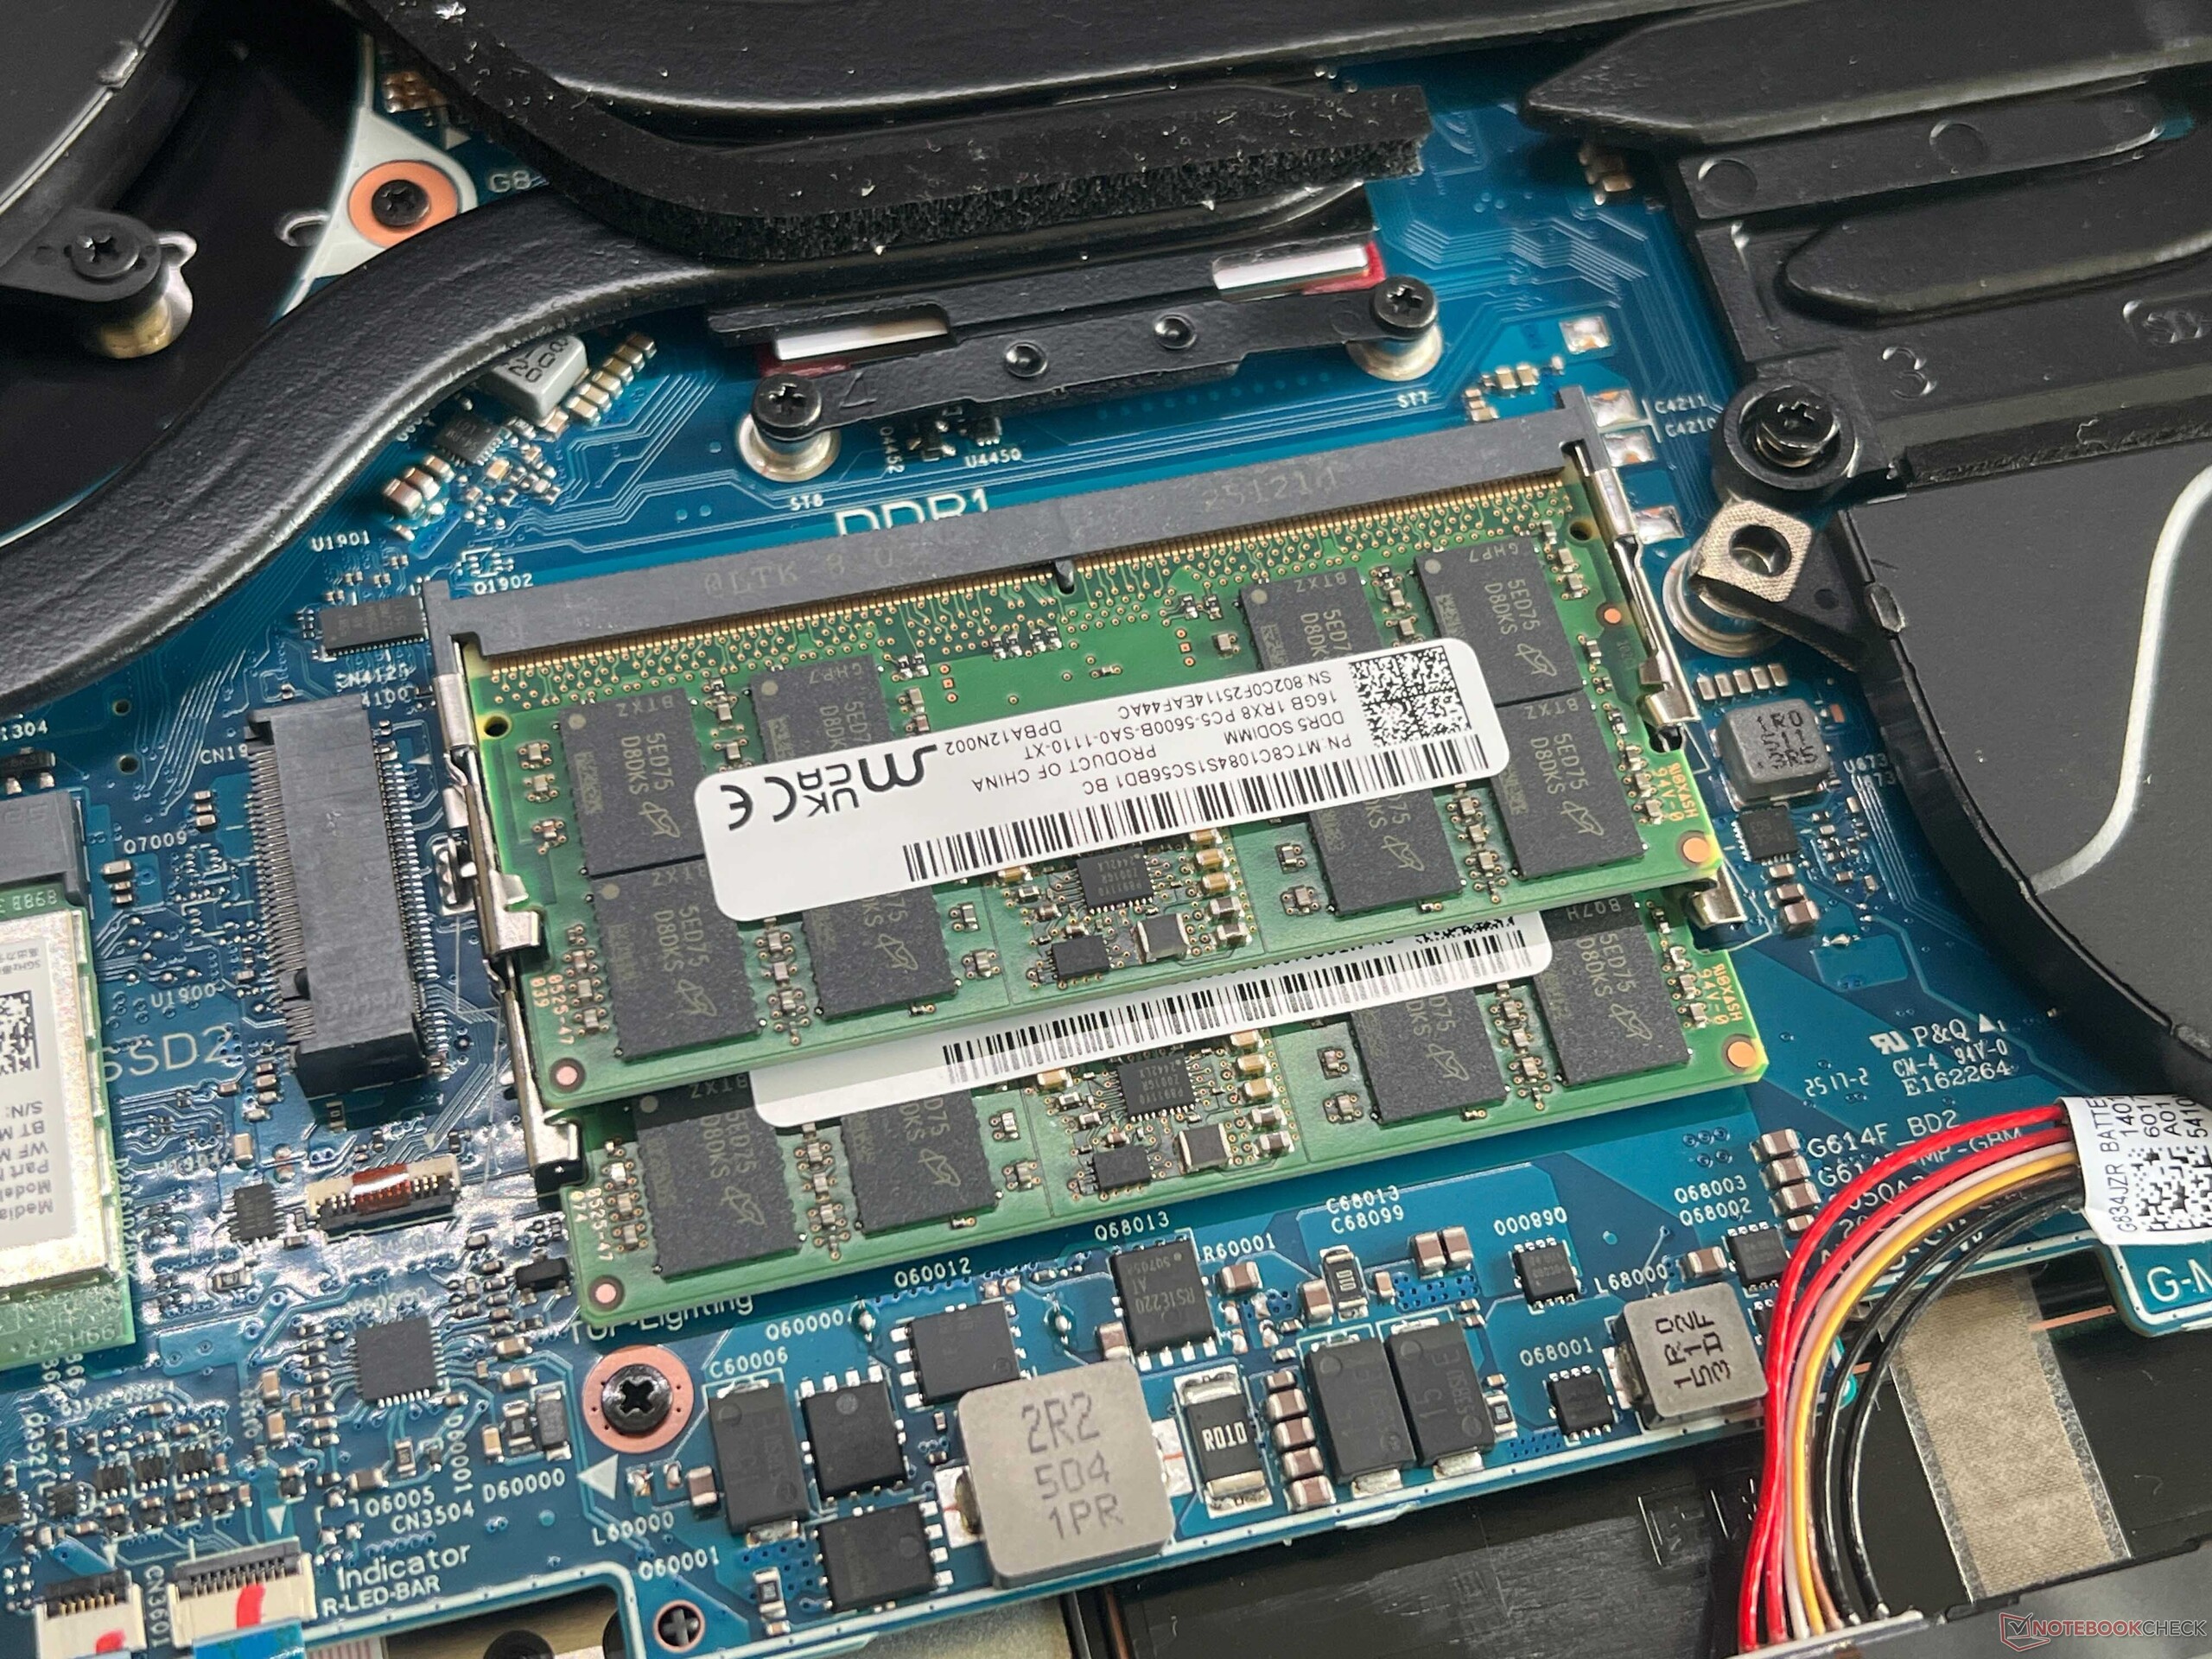
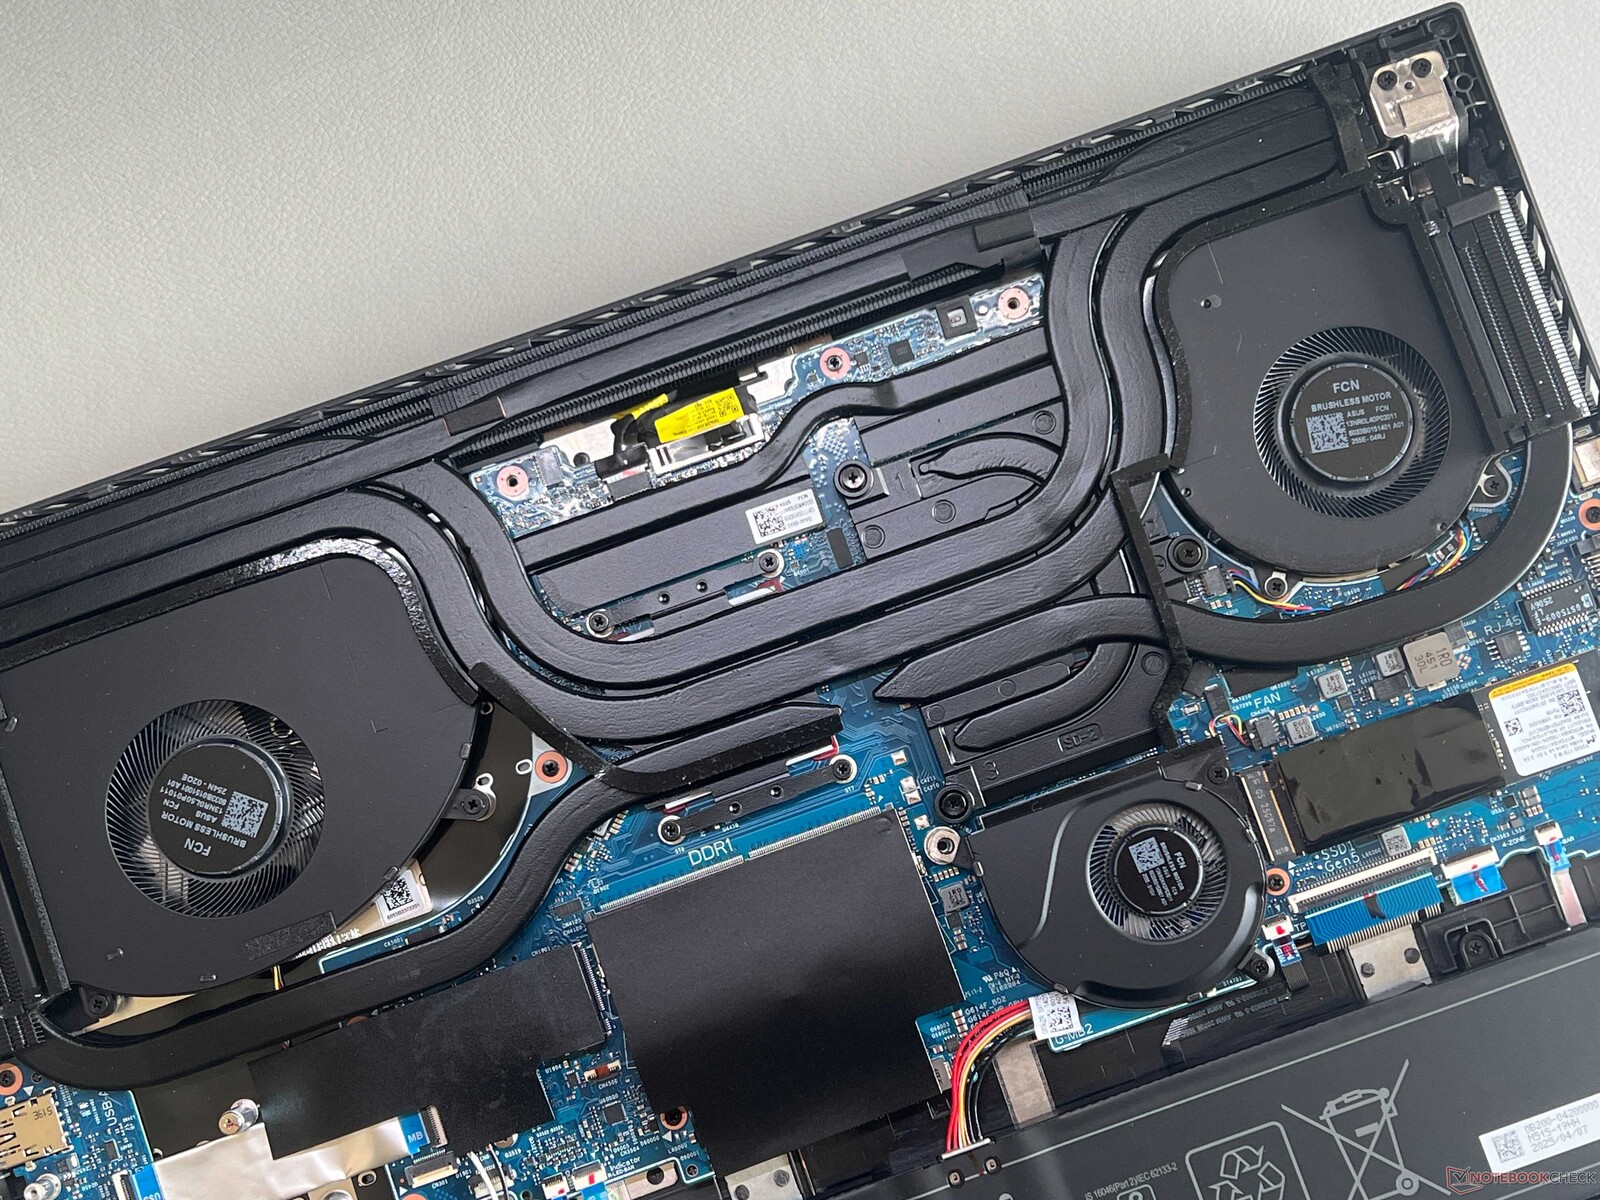
ROG Strix G18 采用深灰色塑料机箱,带有一些设计元素和 ROG 字样,但与较小的 Strix G16 相比,灯光效果明显缩减。Aura Sync 条并没有环绕整个机箱,而是只分布在前边缘和两侧前部区域。优质的机身给人留下了良好的印象,2.9 千克的笔记本电脑在稳定性方面也令人印象深刻。底座和机盖都是如此。铰链调节良好,仅允许极小的摇晃(最大开启角度约为 130 度)。不过,光滑的表面很容易沾上灰尘。底部用螺丝固定,可以轻松拆卸,从而可以接触到风扇、电池、Wi-Fi 模块和两个固态硬盘/内存驱动器。
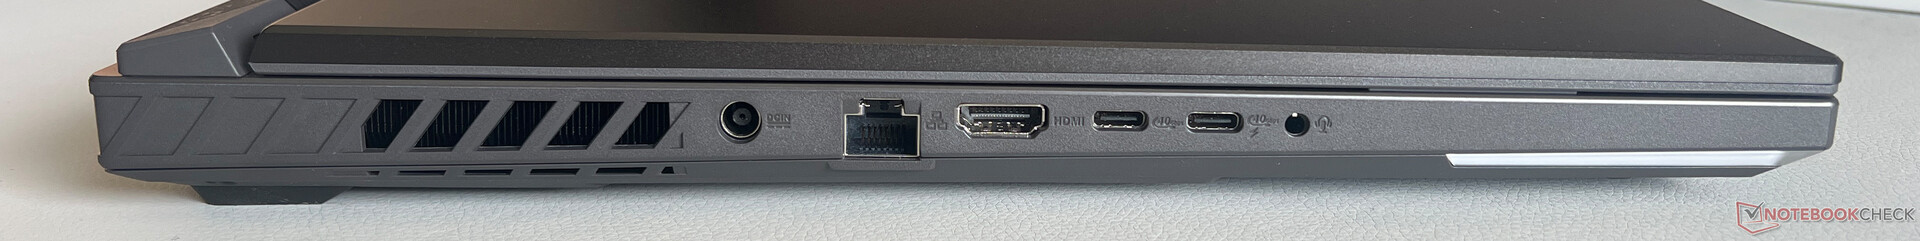
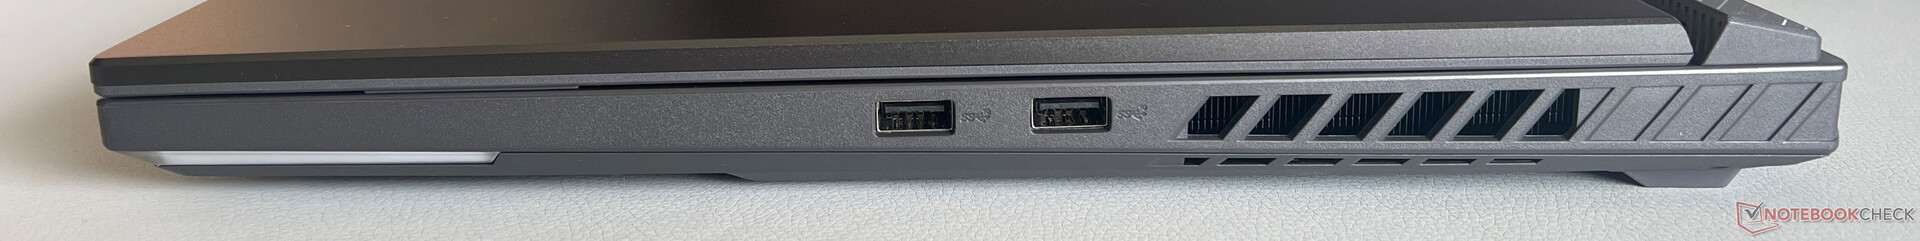
端口完全分布在两侧中间,这并不总是一个完美的解决方案。有两个 USB-C 4.0 端口(其中一个带 Power Delivery)和一个网络端口。在我们的测试中,Wi-Fi 模块的传输速度非常好且稳定,但它还不支持当前的 Wi-Fi 7 标准。1080p 网络摄像头(无 Studio Effects)拍摄的照片效果一般。

| Networking | |
| Asus ROG Strix G18 2025 G814 | |
| iperf3 transmit AXE11000 | |
| iperf3 receive AXE11000 | |
| Razer Blade 18 RTX 4070 | |
| iperf3 transmit AXE11000 | |
| iperf3 receive AXE11000 | |
| iperf3 transmit AXE11000 6GHz | |
| iperf3 receive AXE11000 6GHz | |
| MSI Crosshair A17 HX D8WGKG | |
| iperf3 transmit AXE11000 | |
| iperf3 receive AXE11000 | |
| Schenker XMG Focus 17 M25 | |
| iperf3 transmit AXE11000 | |
| iperf3 receive AXE11000 | |
| MSI Katana 17 HX B14WGK | |
| iperf3 transmit AXE11000 | |
| iperf3 receive AXE11000 | |
| MSI Vector A18 HX A9W | |
| iperf3 transmit AXE11000 | |
| iperf3 receive AXE11000 | |
| iperf3 transmit AXE11000 6GHz | |
| iperf3 receive AXE11000 6GHz | |


可持续性
华硕没有提供有关该设备或其包装的任何可持续发展信息,但后者是完全可回收的。
输入设备
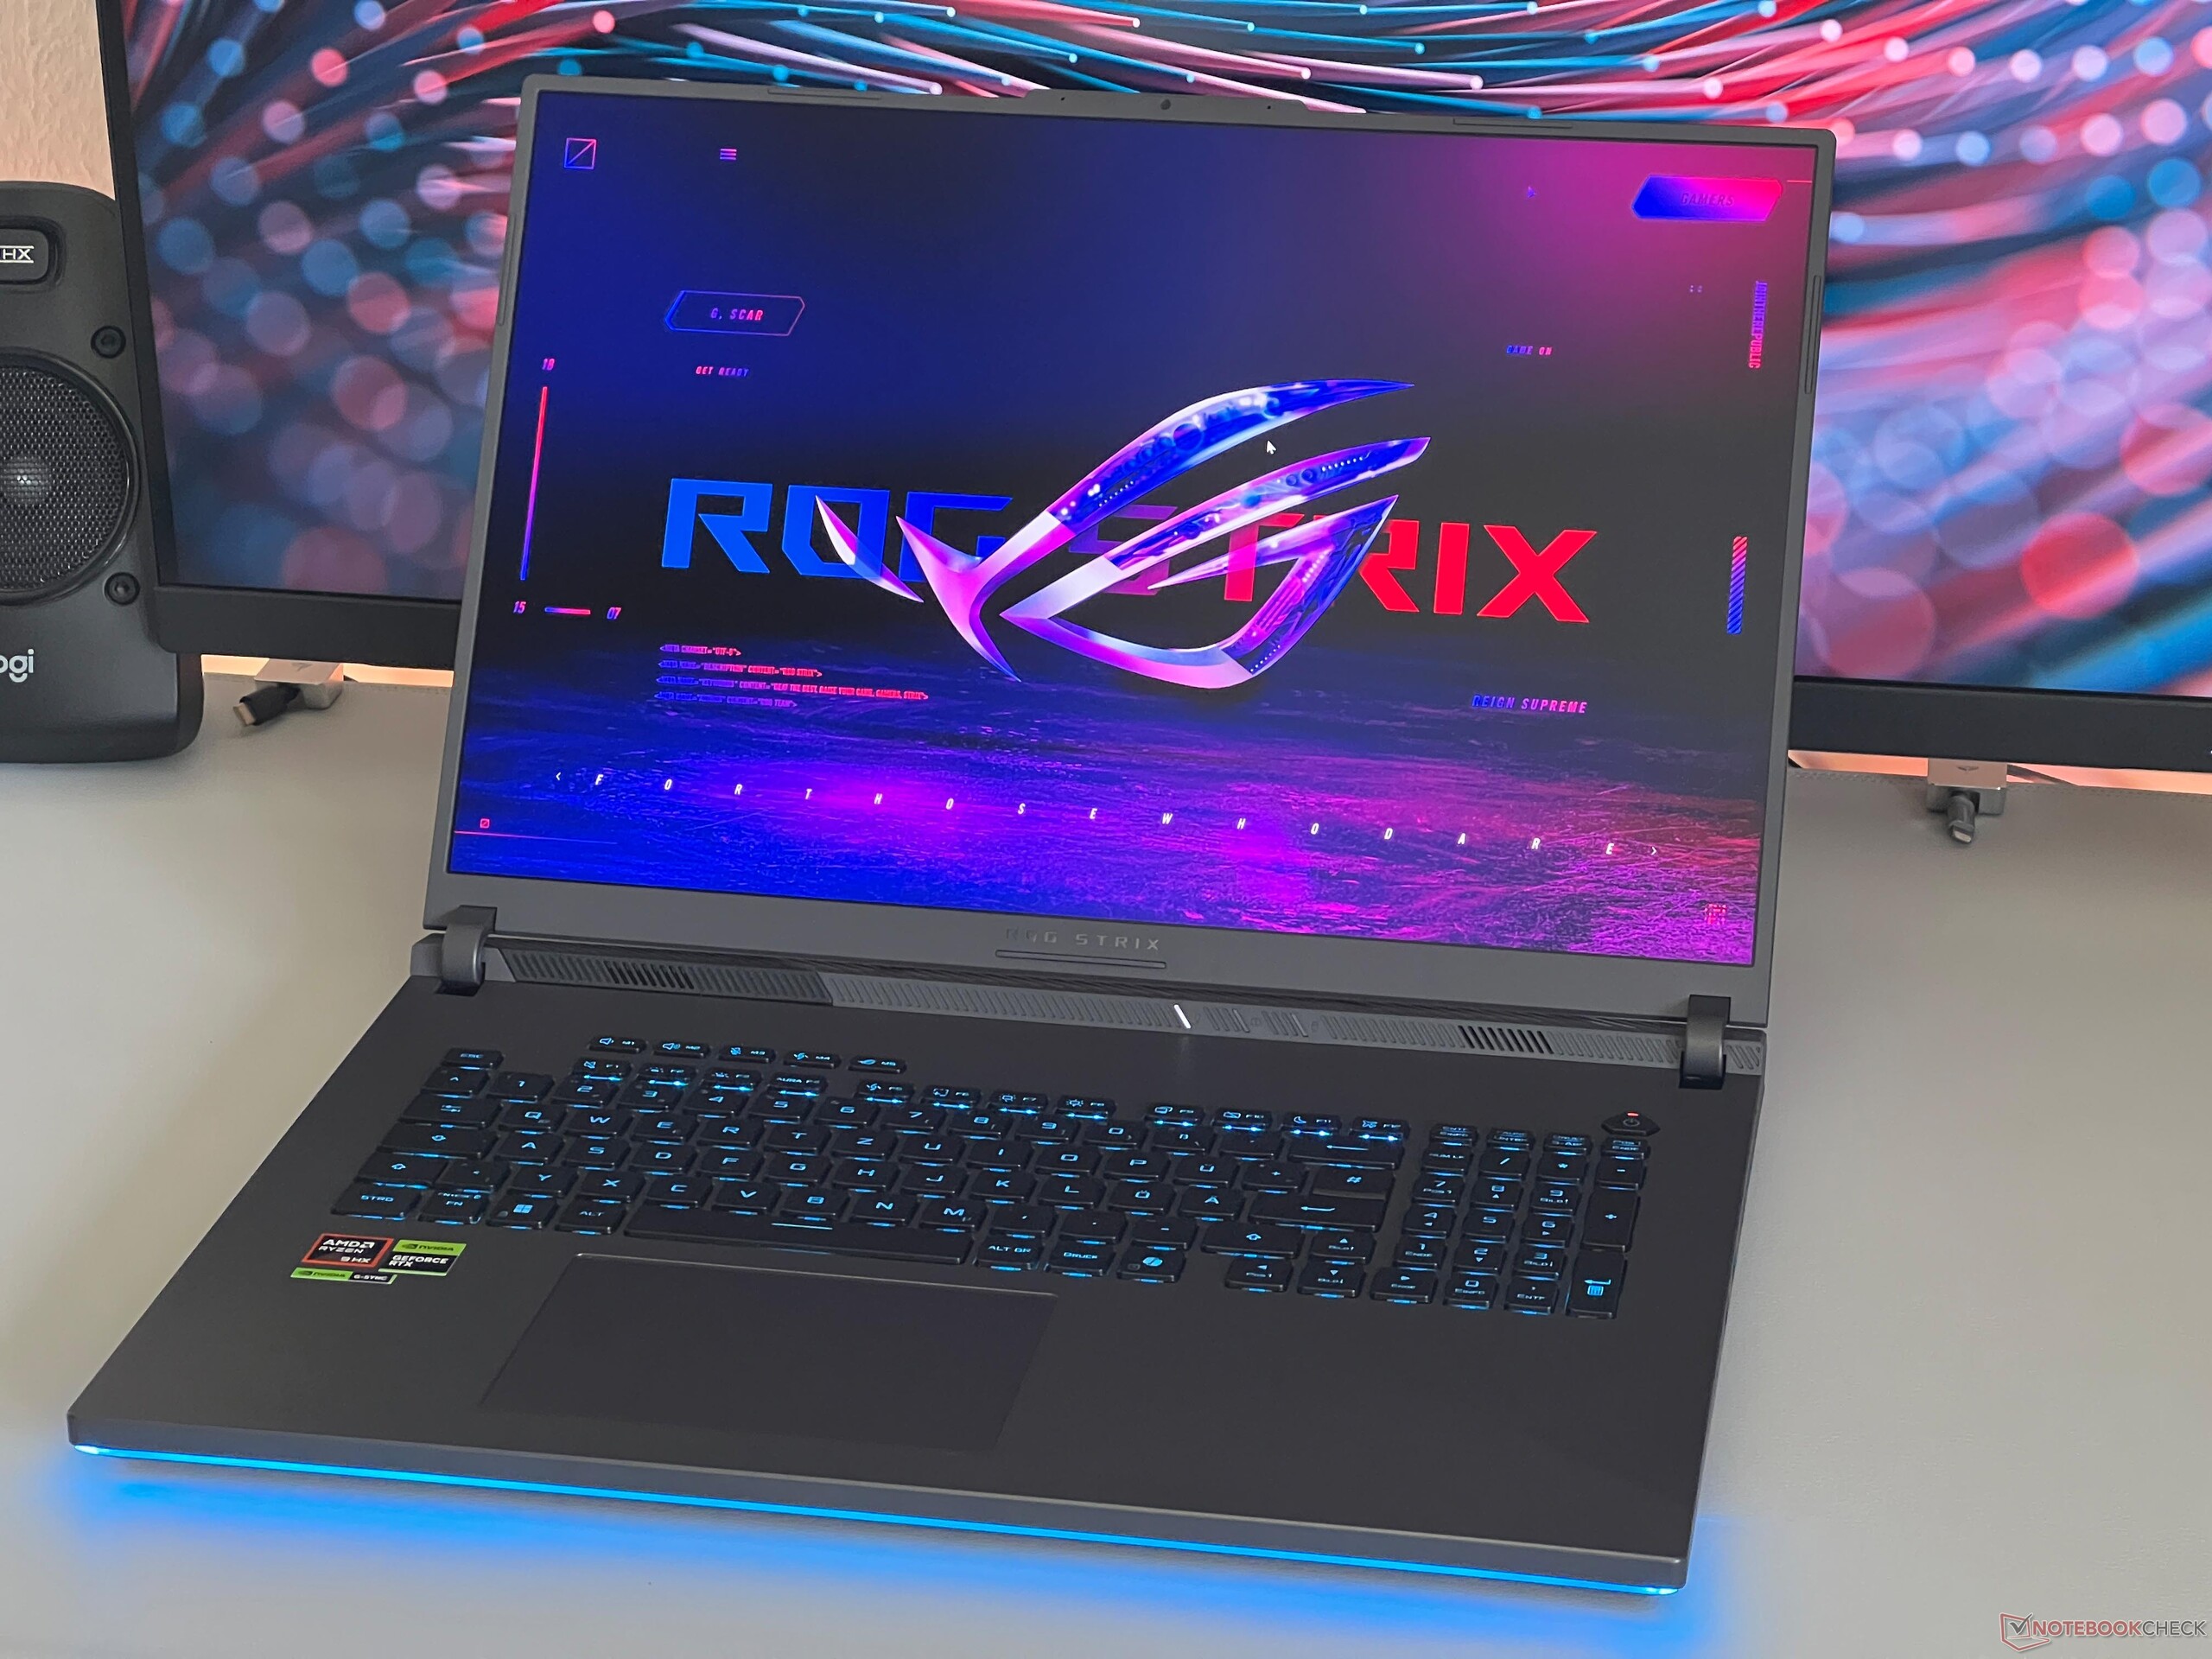
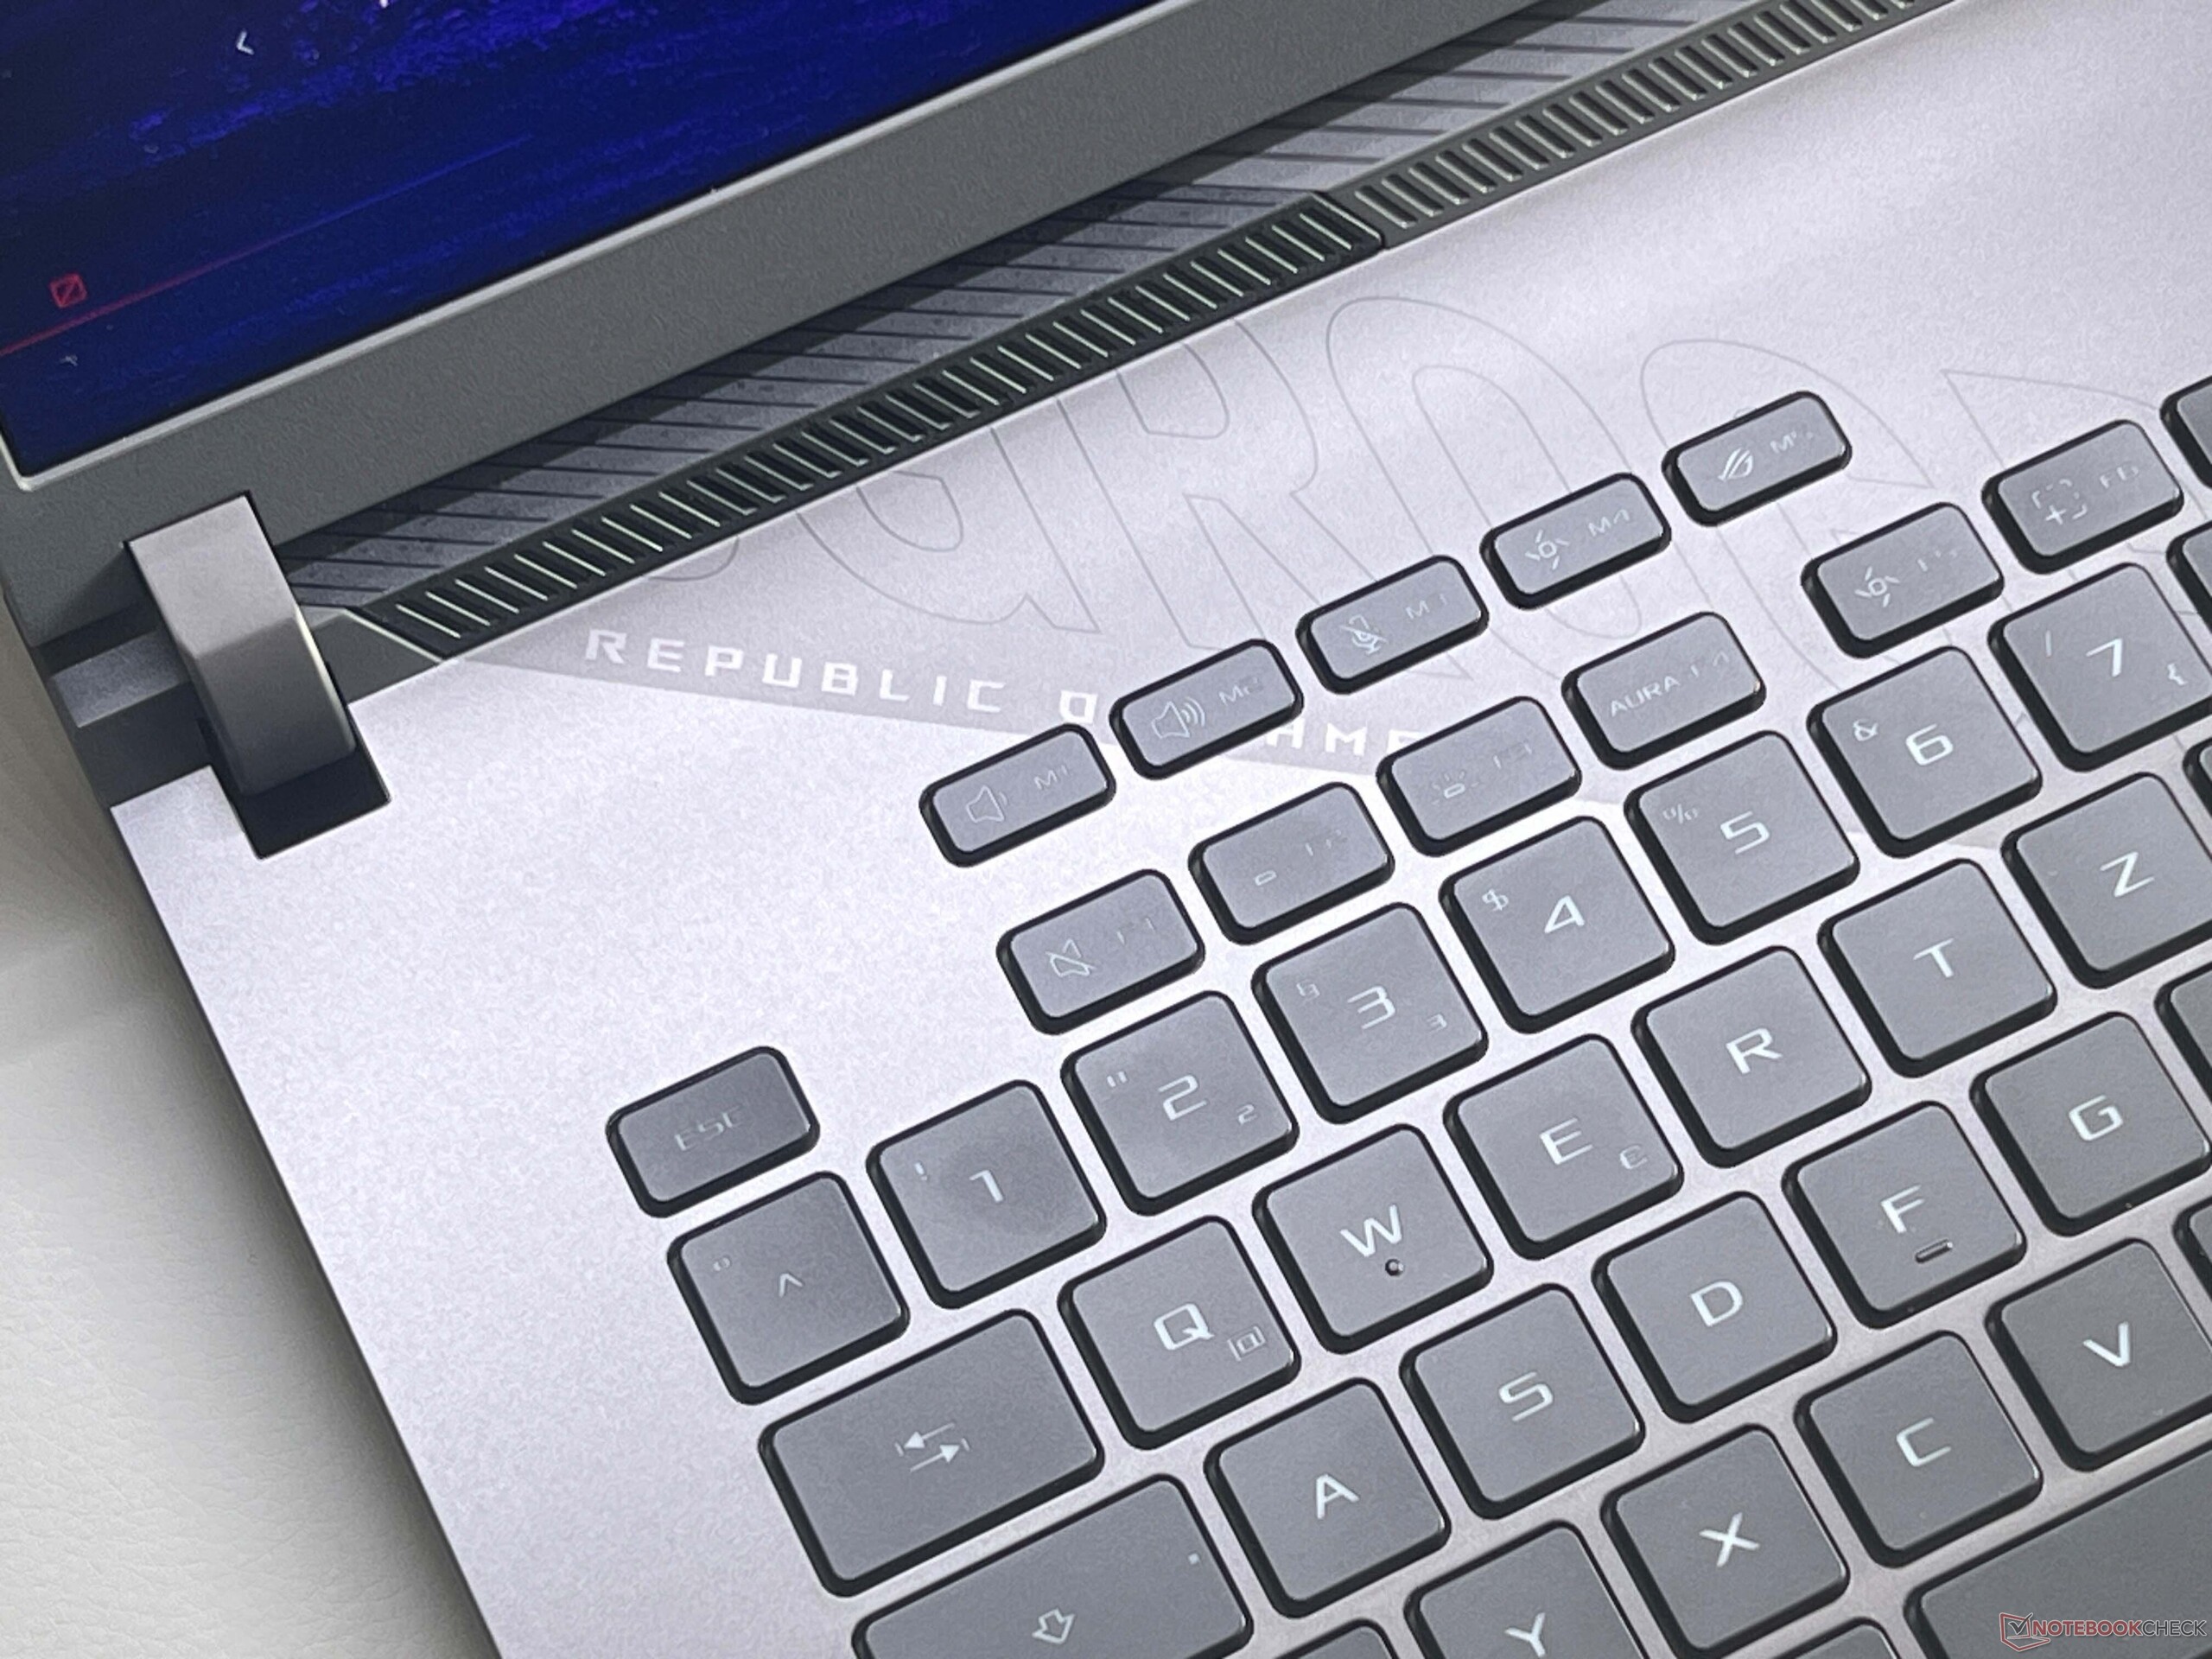
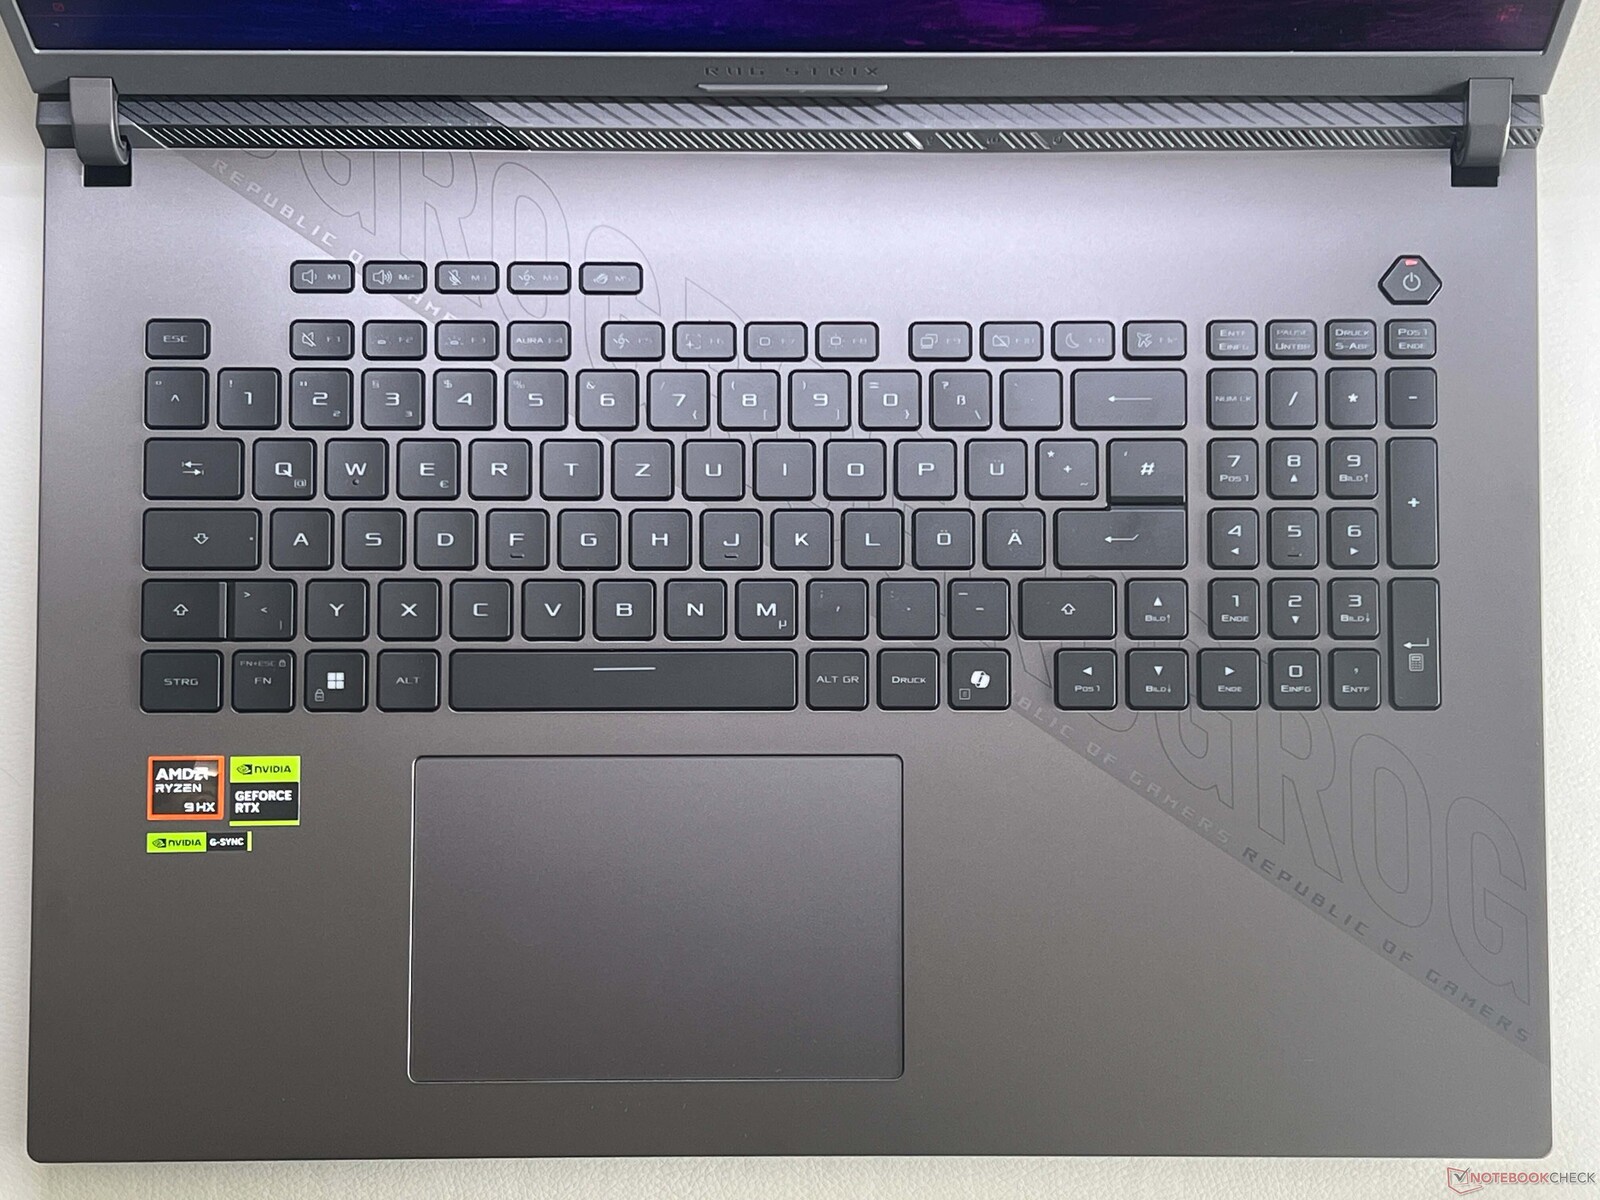
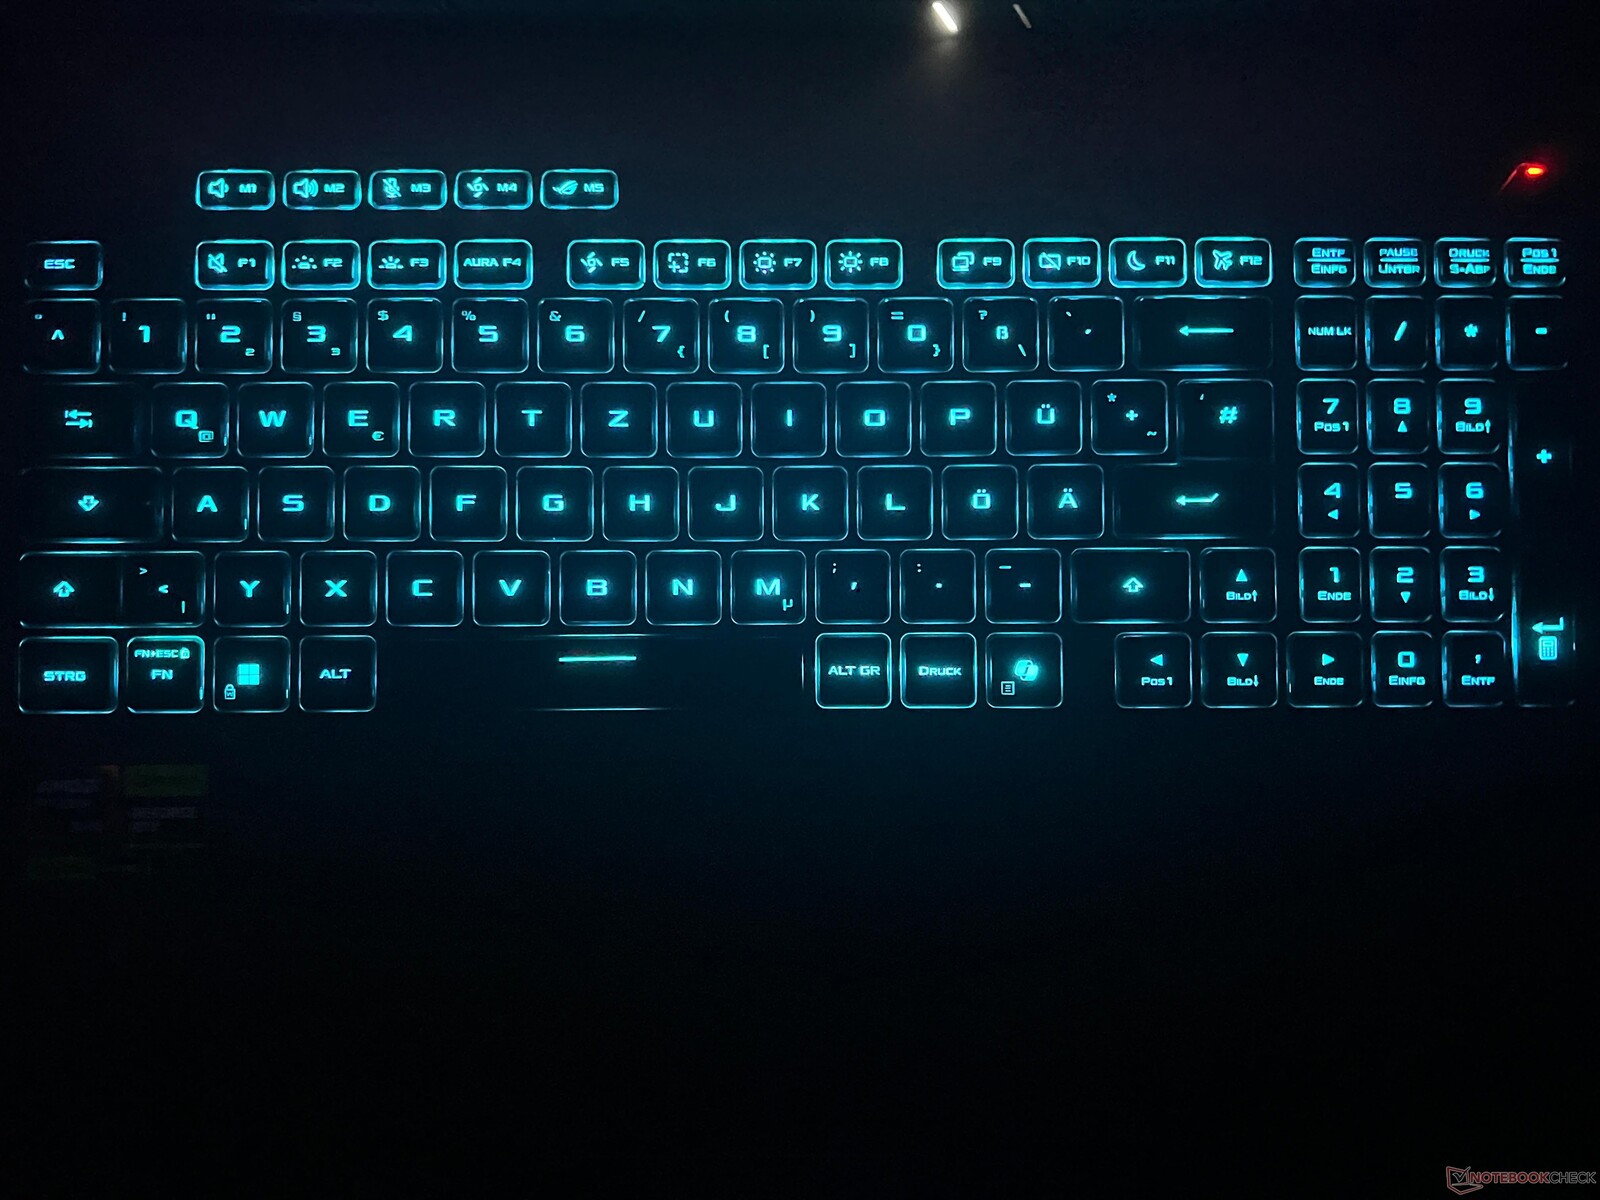
黑色键盘具有专用的数字键盘和全尺寸方向键,不过方向键周围的布局需要一些时间来适应。键入时,键盘给我们留下了丰富、精确和安静的印象,即使撰写长篇文字也很轻松。RGB 键盘照明(按键可调)提供三个亮度级别,并可通过光条上的 Aura Sync 根据显示内容进行动态调节。
点击板触感顺滑,尺寸为 13 x 8.5 厘米,虽然略微偏左,但足够大。它易于使用,但下部区域的机械点击声太大。
显示屏 - 240 Hz IPS
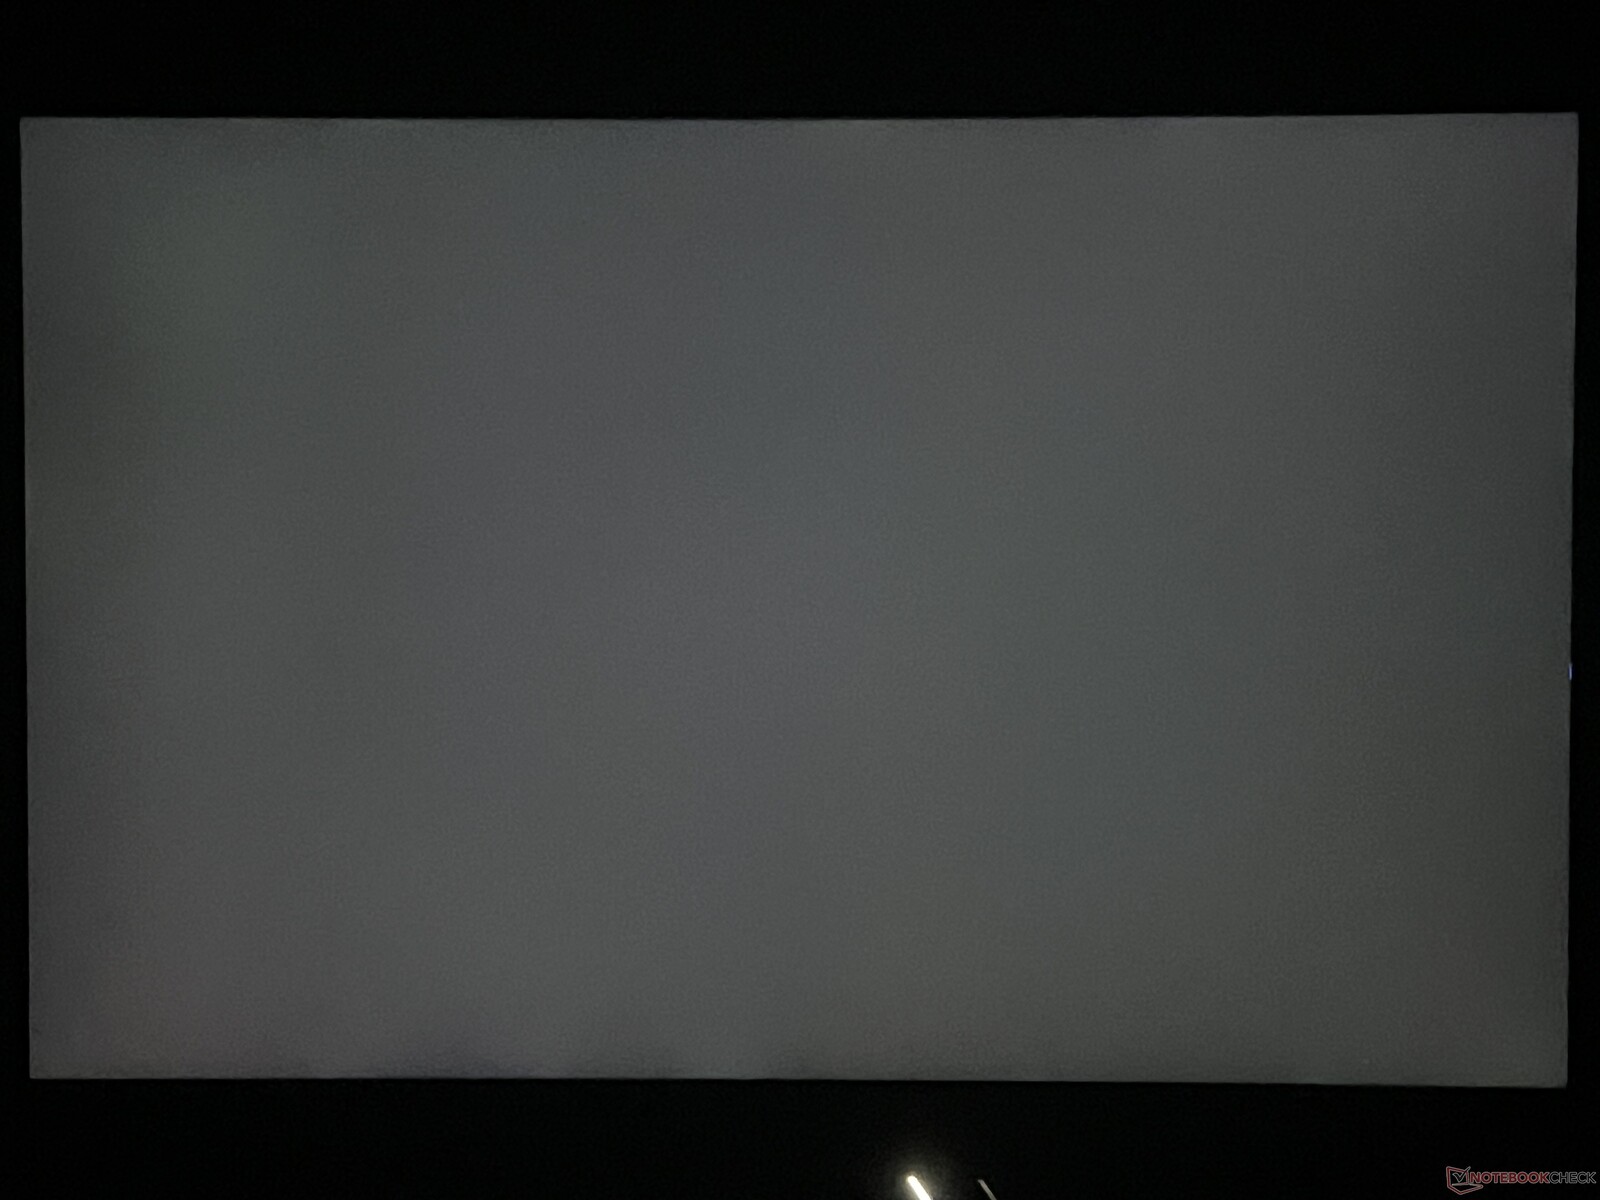
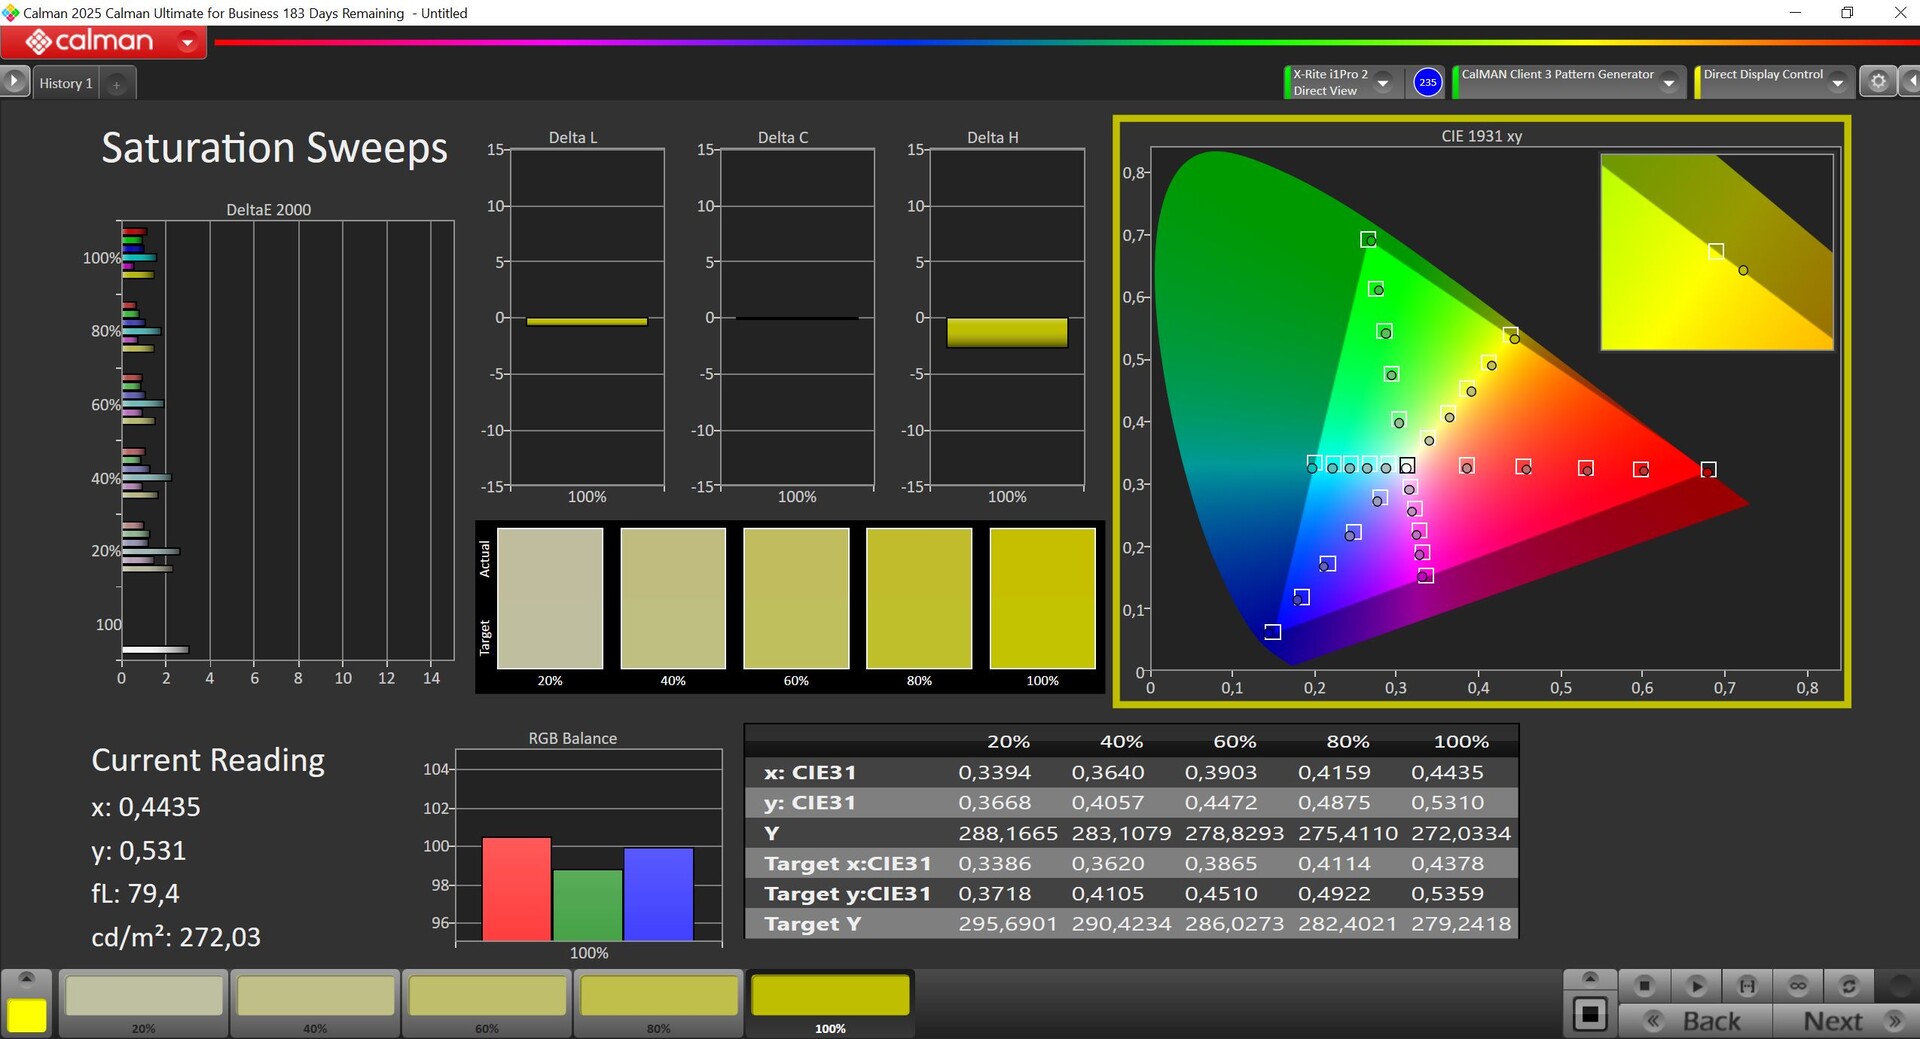
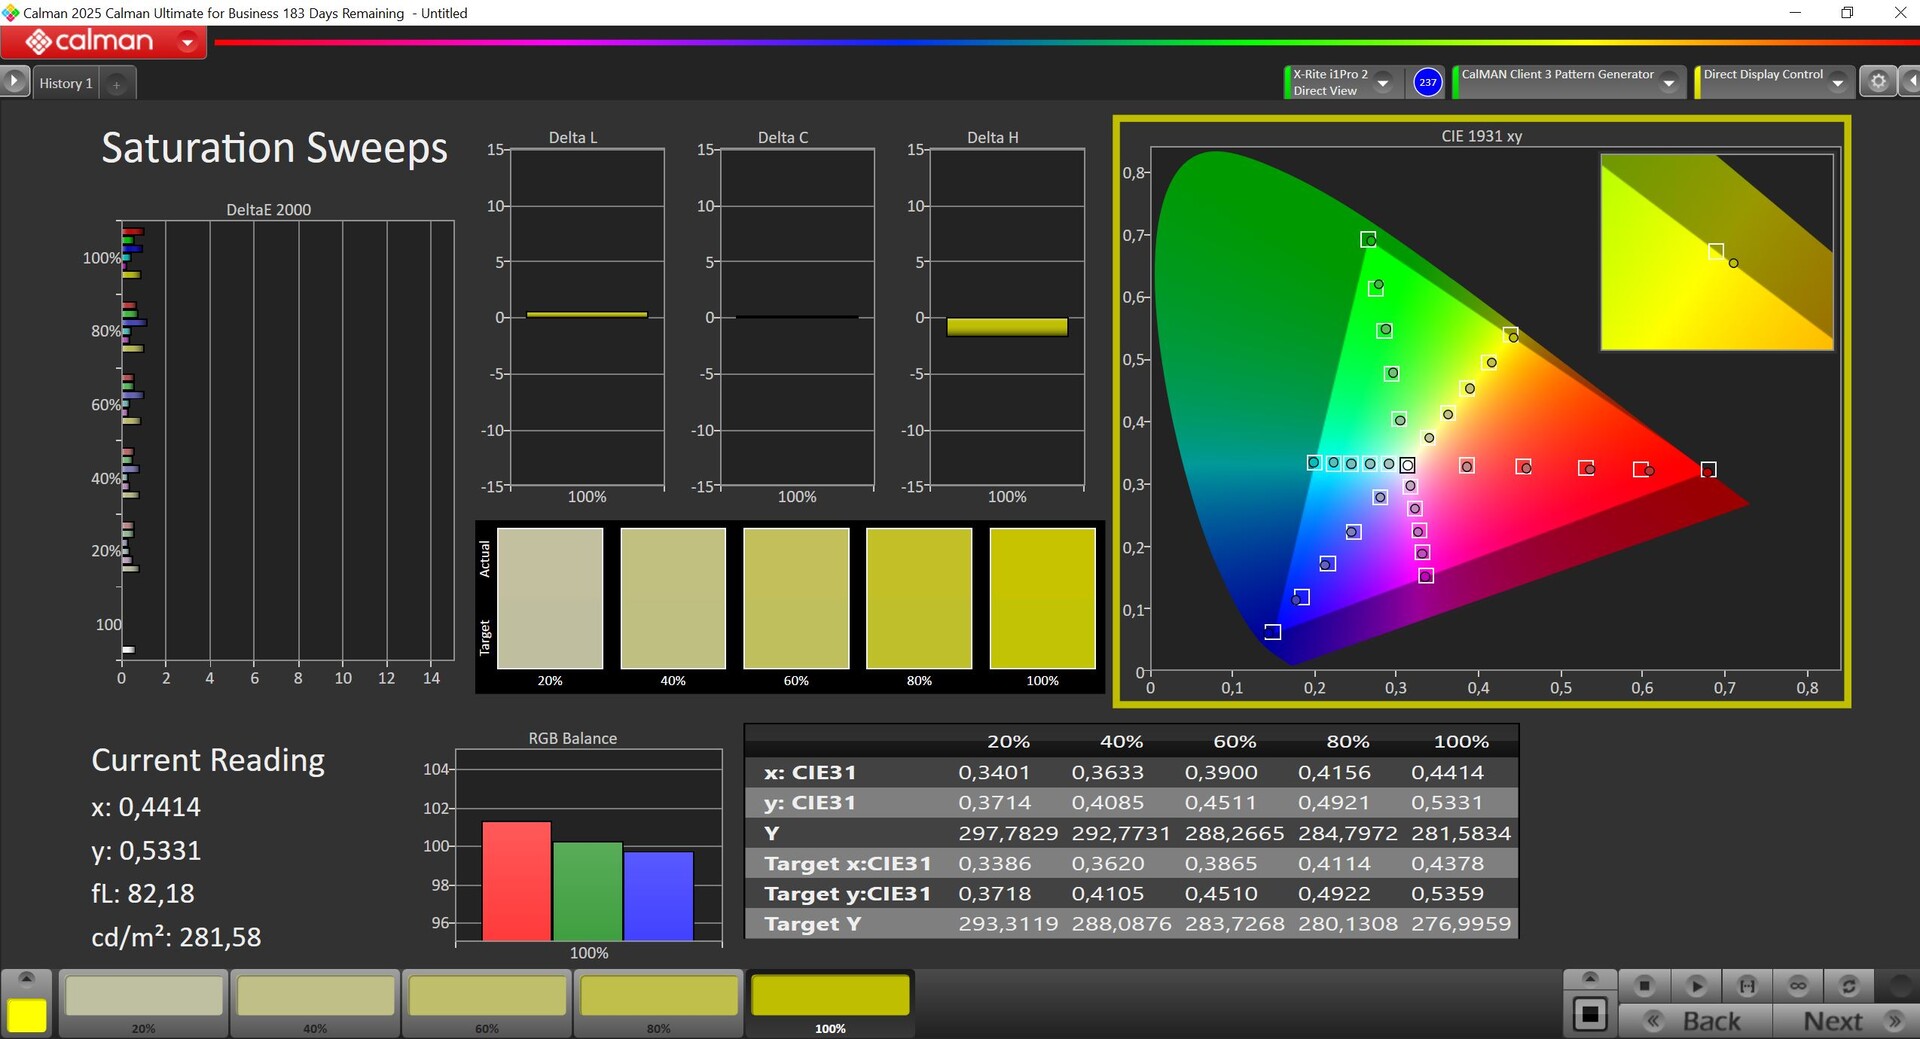
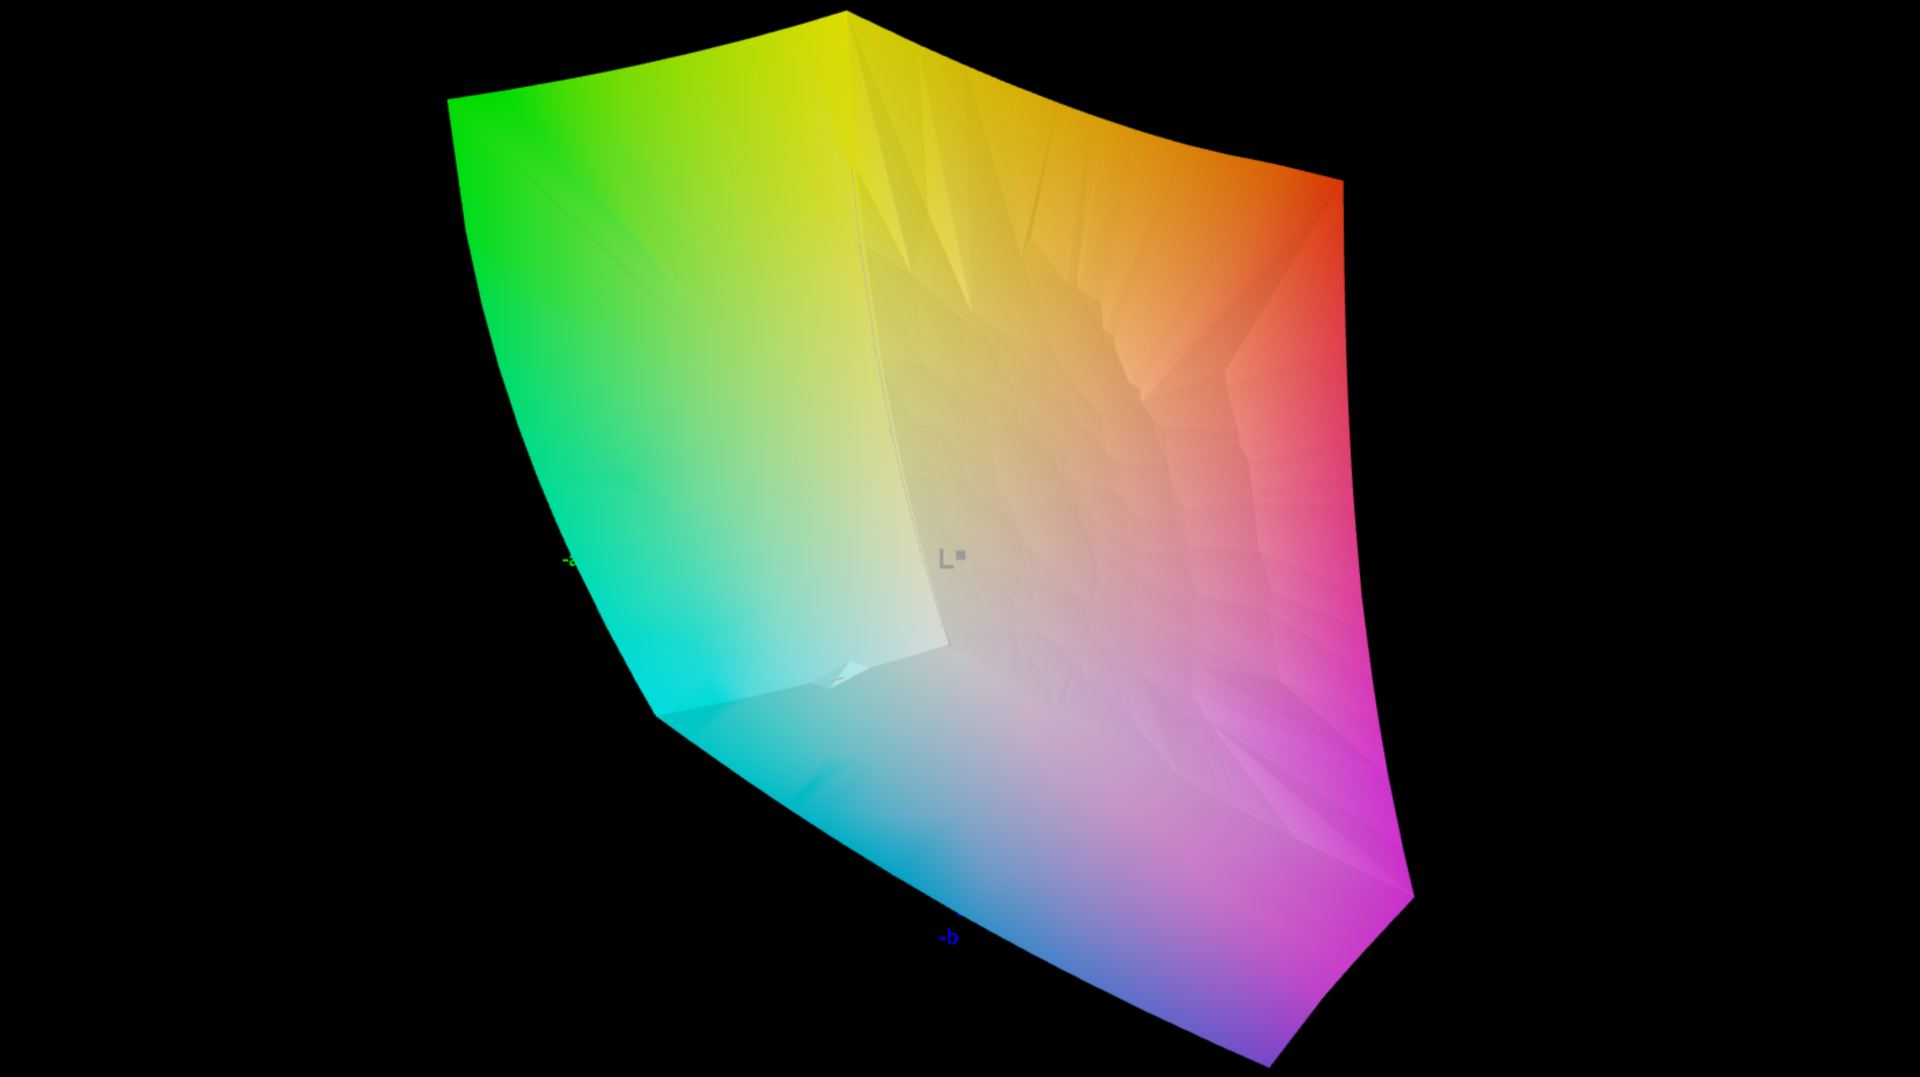
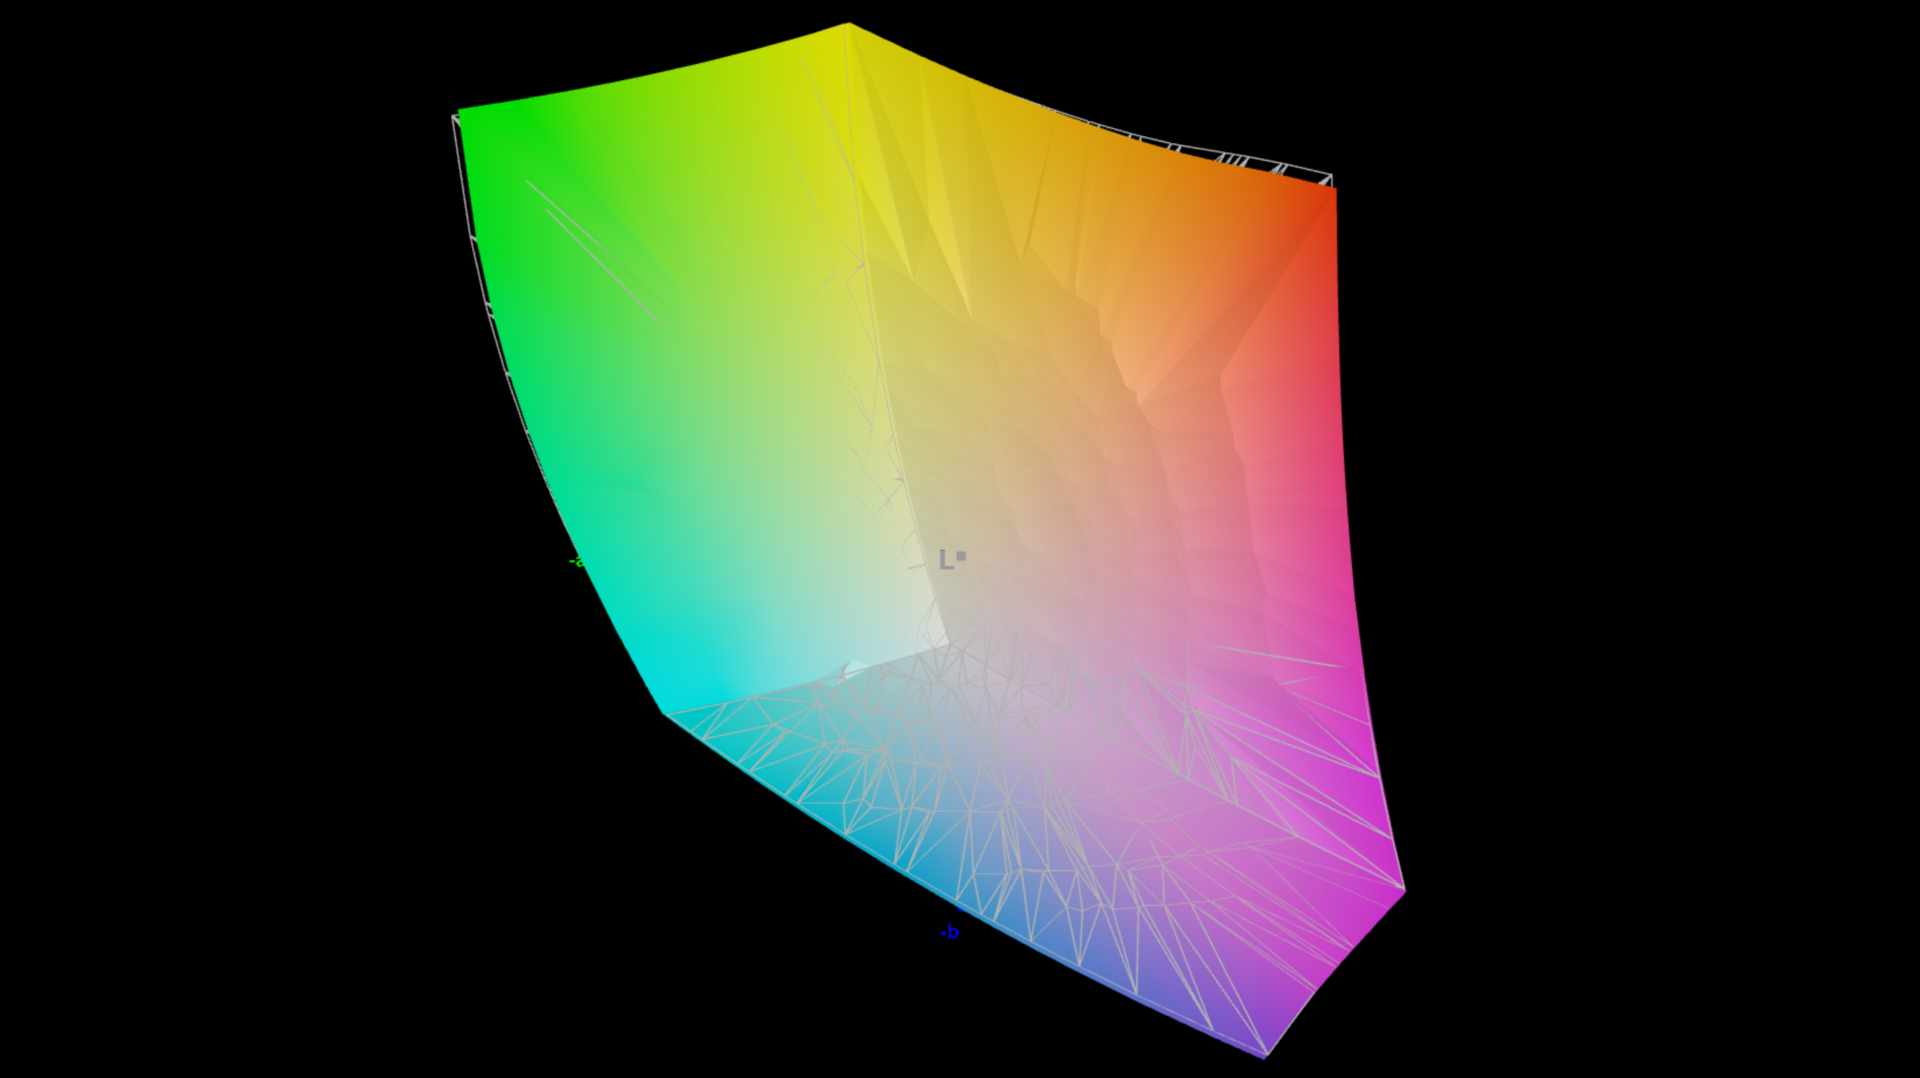
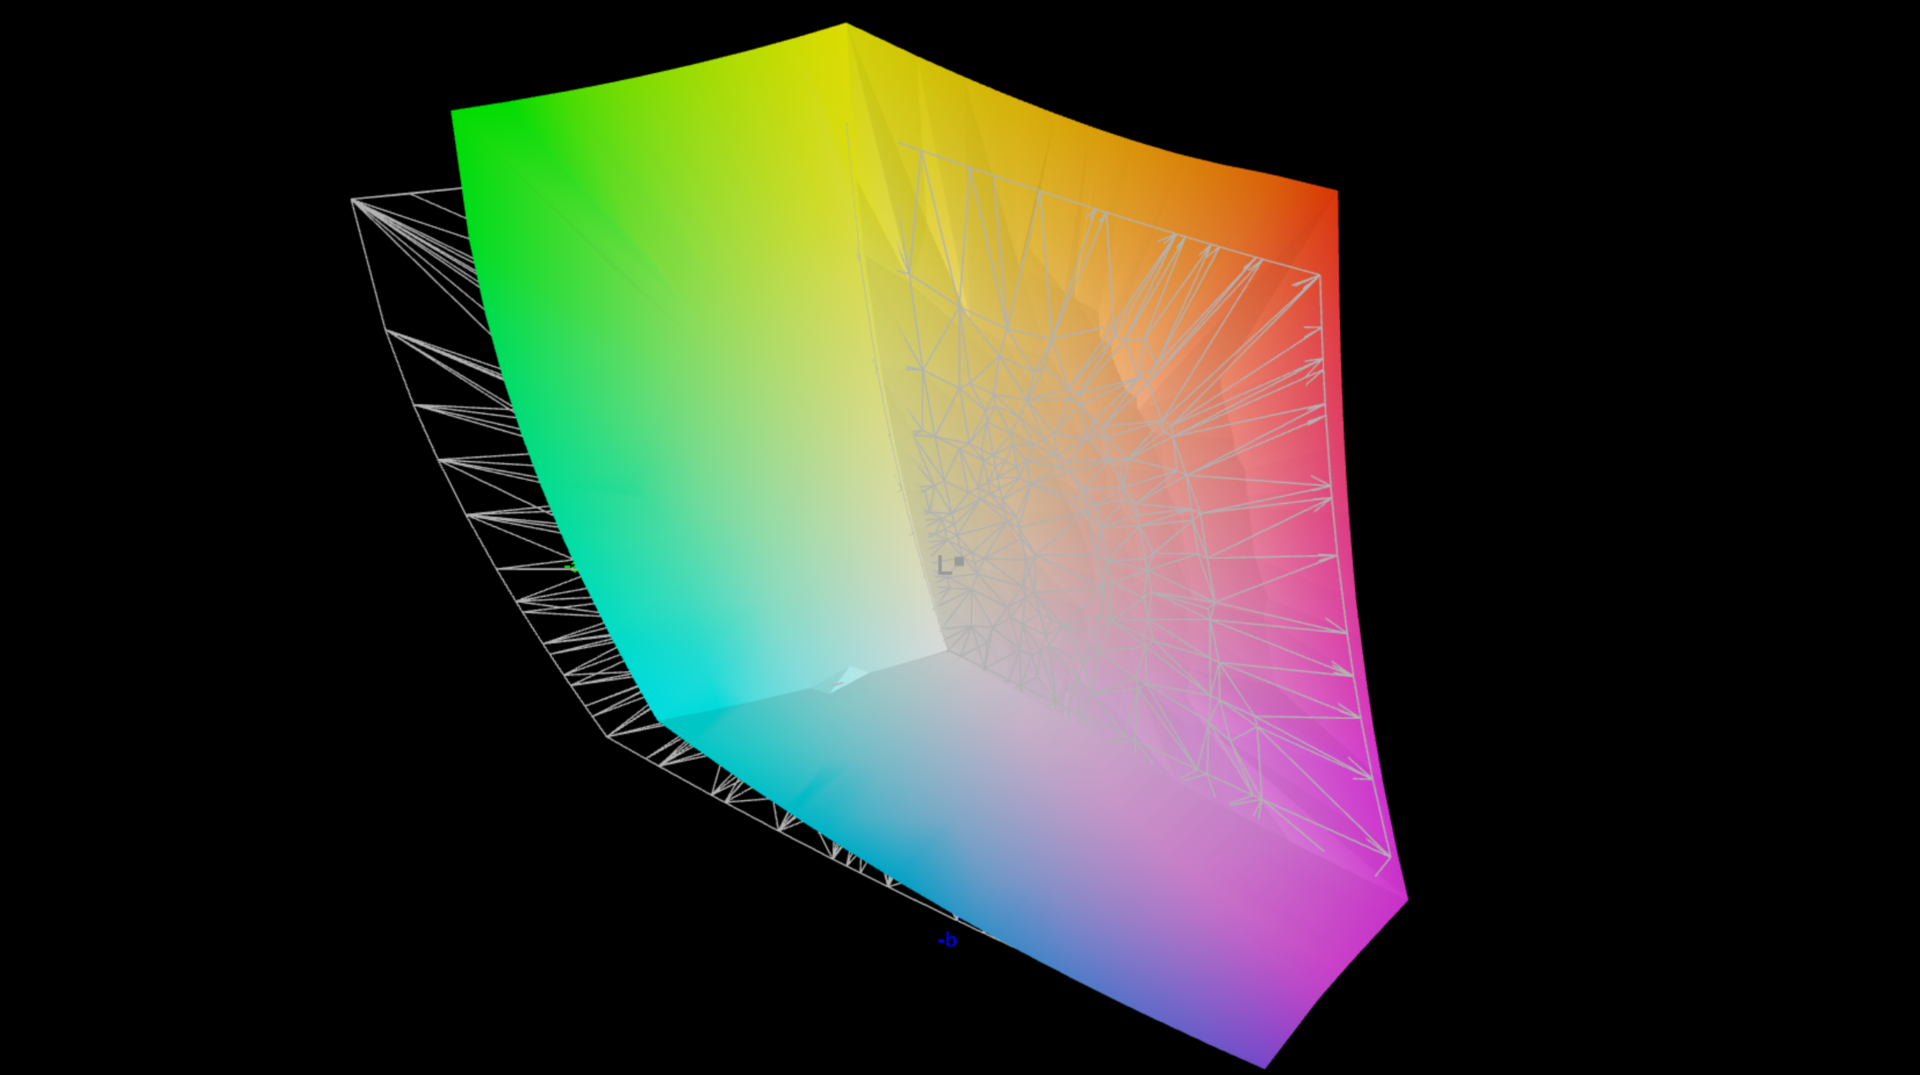
华硕使用的是刷新率为 240 Hz 的雾面 IPS 面板(2560 x 1600 像素,16:10)。从主观上看,图像质量非常好,明亮区域仅出现微小颗粒,不过在正常观看距离下并不明显。没有 PWM 闪烁,响应时间也很快。
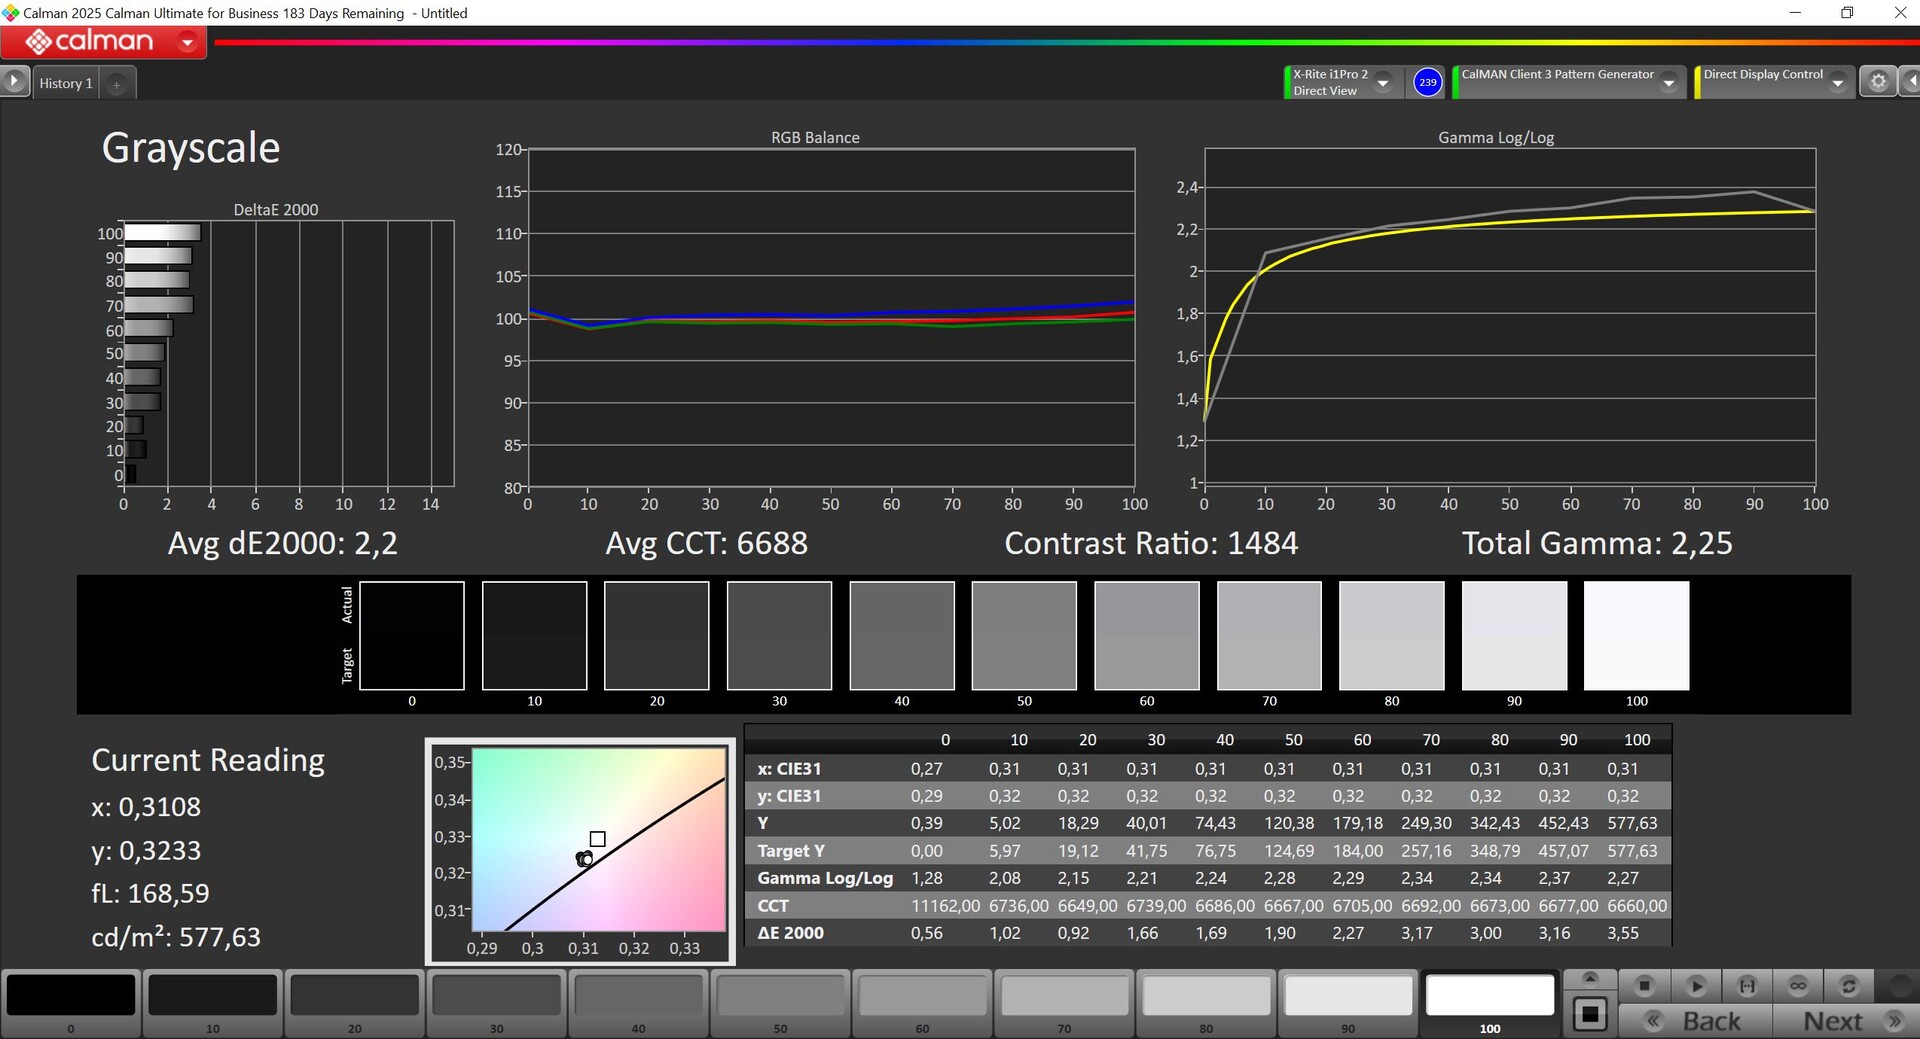
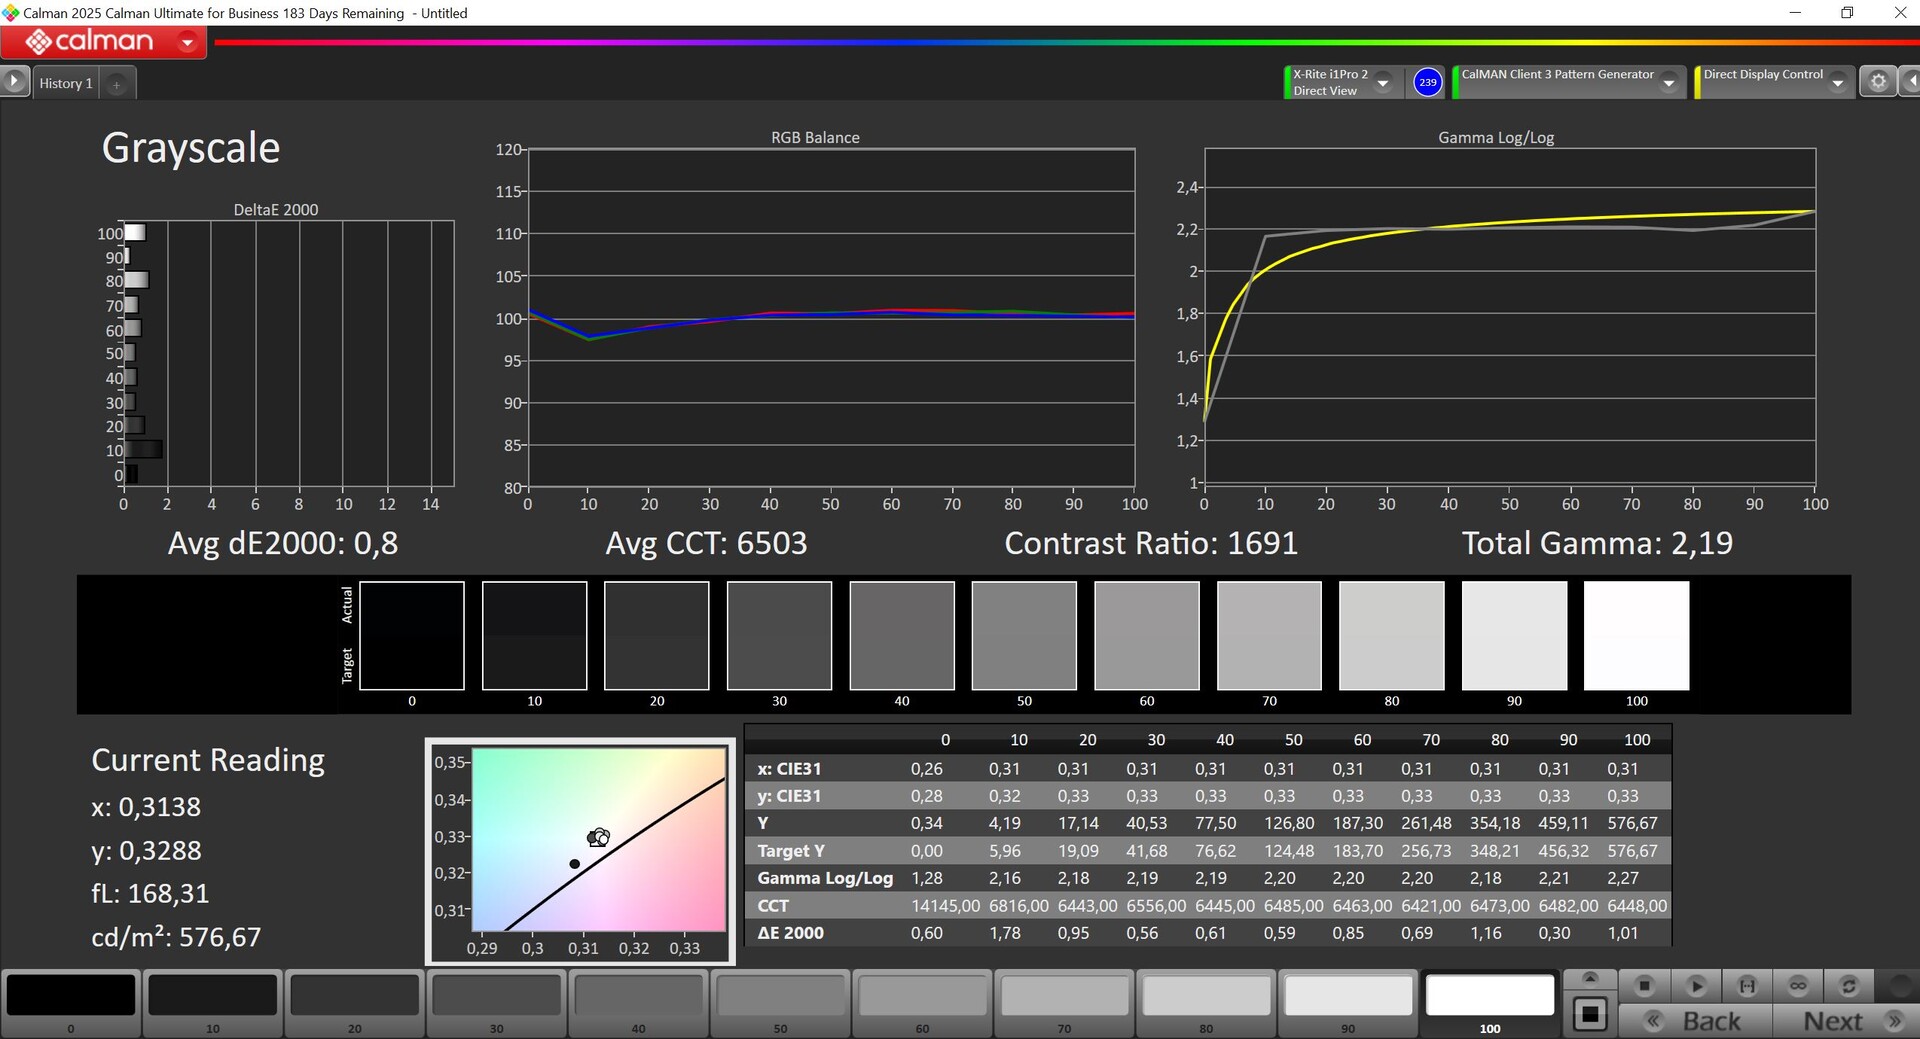
在我们使用专业的 CalMAN 软件进行分析时,该面板的表现也令人印象深刻。最大亮度为 582 cd/m²(平均约为 560 cd/m²),对比度接近 1,500:1。华硕提供了各种色彩配置文件(P3 和 sRGB),这些配置文件已经过很好的调整。通过我们的校准(可在右侧框中免费下载配置文件),我们能够进一步改善显示效果。有了全色彩空间覆盖,图像编辑也变得简单易行。
| |||||||||||||||||||||||||
Brightness Distribution: 93 %
Center on Battery: 582 cd/m²
Contrast: 1455:1 (Black: 0.4 cd/m²)
ΔE ColorChecker Calman: 1.4 | ∀{0.5-29.43 Ø4.73}
calibrated: 0.7
ΔE Greyscale Calman: 1.8 | ∀{0.09-98 Ø4.97}
87.7% AdobeRGB 1998 (Argyll 3D)
100% sRGB (Argyll 3D)
99.4% Display P3 (Argyll 3D)
Gamma: 2.24
CCT: 6633 K
| Asus ROG Strix G18 2025 G814 NE180QDM-NZC, IPS, 2560x1600, 18", 240 Hz | Razer Blade 18 RTX 4070 AU Optronics B180QAN01.0, IPS, 2560x1600, 18", 240 Hz | MSI Crosshair A17 HX D8WGKG B170QAN01.2, IPS, 2560x1600, 17", 240 Hz | Schenker XMG Focus 17 M25 NE173QHM-NZ1, IPS, 2560x1440, 17.3", 240 Hz | MSI Katana 17 HX B14WGK CSOT MNH301CA3-1, IPS, 2560x1440, 17.3", 240 Hz | MSI Vector A18 HX A9W AU Optronics B180QAN01.0, IPS, 2560x1600, 18", 240 Hz | |
|---|---|---|---|---|---|---|
| Display | -2% | -2% | -1% | -0% | -1% | |
| Display P3 Coverage (%) | 99.4 | 96.9 -3% | 97.1 -2% | 98.3 -1% | 97.3 -2% | 98.1 -1% |
| sRGB Coverage (%) | 100 | 99.8 0% | 99.9 0% | 99.9 0% | 99.6 0% | 99.9 0% |
| AdobeRGB 1998 Coverage (%) | 87.7 | 85.3 -3% | 84.9 -3% | 86 -2% | 89 1% | 86.3 -2% |
| Response Times | -25% | -124% | -146% | -48% | -27% | |
| Response Time Grey 50% / Grey 80% * (ms) | 3.8 ? | 4.2 ? -11% | 13.3 ? -250% | 13.7 ? -261% | 5.2 ? -37% | 4.3 ? -13% |
| Response Time Black / White * (ms) | 5.8 ? | 8 ? -38% | 5.7 ? 2% | 7.6 ? -31% | 9.2 ? -59% | 8.1 ? -40% |
| PWM Frequency (Hz) | ||||||
| Screen | -67% | -38% | -59% | -22% | -46% | |
| Brightness middle (cd/m²) | 582 | 549.6 -6% | 471 -19% | 347 -40% | 296 -49% | 543 -7% |
| Brightness (cd/m²) | 557 | 524 -6% | 468 -16% | 325 -42% | 272 -51% | 502 -10% |
| Brightness Distribution (%) | 93 | 89 -4% | 96 3% | 84 -10% | 87 -6% | 86 -8% |
| Black Level * (cd/m²) | 0.4 | 0.53 -33% | 0.4 -0% | 0.26 35% | 0.27 32% | 0.56 -40% |
| Contrast (:1) | 1455 | 1037 -29% | 1178 -19% | 1335 -8% | 1096 -25% | 970 -33% |
| Colorchecker dE 2000 * | 1.4 | 3.32 -137% | 2.72 -94% | 3.3 -136% | 1.35 4% | 3.41 -144% |
| Colorchecker dE 2000 max. * | 3.4 | 6.63 -95% | 5.49 -61% | 8.4 -147% | 4.76 -40% | 6.4 -88% |
| Colorchecker dE 2000 calibrated * | 0.7 | 2.7 -286% | 1.12 -60% | 0.9 -29% | 0.78 -11% | 0.66 6% |
| Greyscale dE 2000 * | 1.8 | 2 -11% | 3.2 -78% | 4.5 -150% | 2.7 -50% | 3.4 -89% |
| Gamma | 2.24 98% | 2.29 96% | 2.227 99% | 2.05 107% | 2.201 100% | 2.3 96% |
| CCT | 6633 98% | 6319 103% | 6925 94% | 7365 88% | 6770 96% | 6070 107% |
| Total Average (Program / Settings) | -31% /
-47% | -55% /
-43% | -69% /
-59% | -23% /
-21% | -25% /
-34% |
* ... smaller is better


Display Response Times
| ↔ Response Time Black to White | ||
|---|---|---|
| 5.8 ms ... rise ↗ and fall ↘ combined | ↗ 1.5 ms rise | 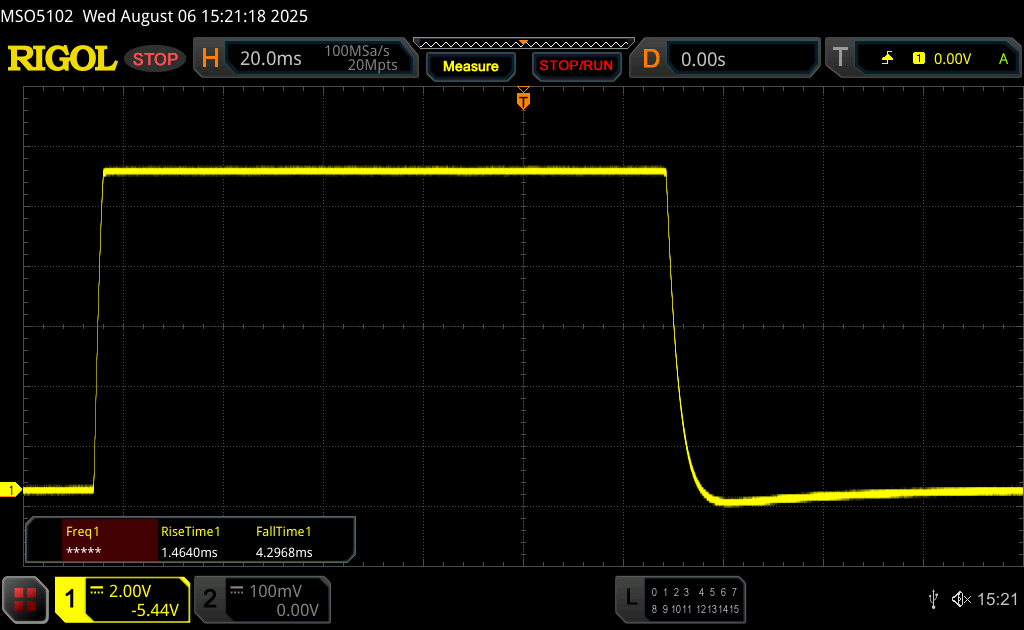 |
| ↘ 4.3 ms fall | ||
| The screen shows very fast response rates in our tests and should be very well suited for fast-paced gaming. In comparison, all tested devices range from 0.1 (minimum) to 240 (maximum) ms. » 18 % of all devices are better. This means that the measured response time is better than the average of all tested devices (19.9 ms). | ||
| ↔ Response Time 50% Grey to 80% Grey | ||
| 3.8 ms ... rise ↗ and fall ↘ combined | ↗ 1.6 ms rise | 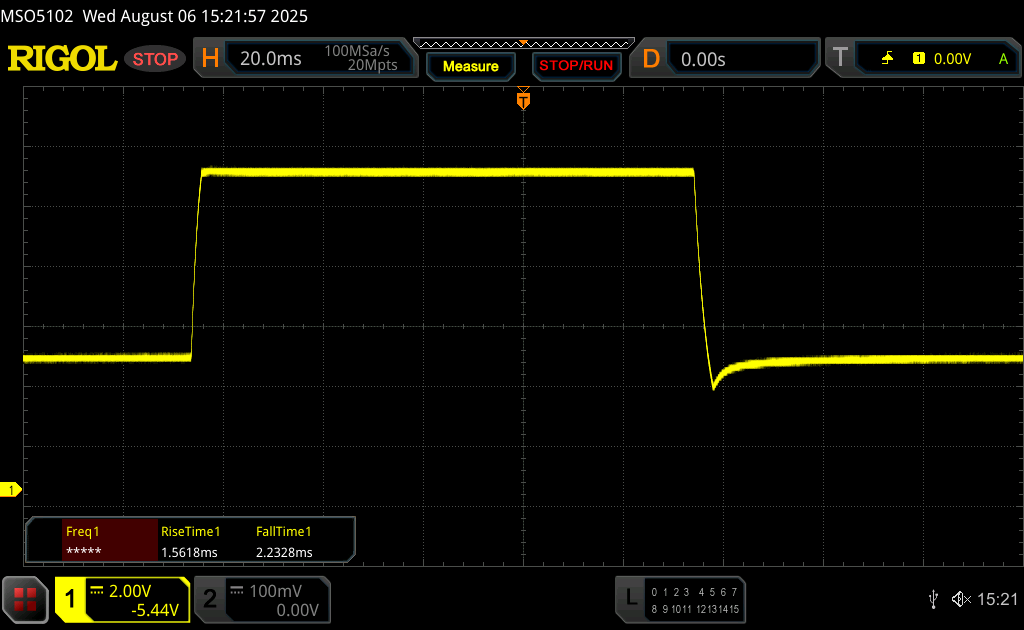 |
| ↘ 2.2 ms fall | ||
| The screen shows very fast response rates in our tests and should be very well suited for fast-paced gaming. In comparison, all tested devices range from 0.165 (minimum) to 636 (maximum) ms. » 15 % of all devices are better. This means that the measured response time is better than the average of all tested devices (31.1 ms). | ||
Screen Flickering / PWM (Pulse-Width Modulation)
| Screen flickering / PWM not detected |  | ||
In comparison: 52 % of all tested devices do not use PWM to dim the display. If PWM was detected, an average of 7798 (minimum: 5 - maximum: 343500) Hz was measured. | |||


性能 - Ryzen HX 和 Blackwell
测试条件
华硕提供各种电源配置文件,如下表所示。Turbo 模式只有在插上电源后才可用,只有在需要最大 CPU 性能时才值得使用。不过,GPU 和游戏性能都比不上性能模式。因此,我们使用性能模式进行基准测试和测量。
| 能耗曲线 | CPU TDP | CB24 Multi | GPU TGP | Time Spy Graphics | CP2077 QHD Ultra | 最大风扇体积 |
|---|---|---|---|---|---|---|
| 静音 | 95/65 瓦 | 1,711 分 | 42 瓦 | 8,805 分 | 43fps | 44.1 dB(A) |
| 性能 | 120/90 瓦 | 1,862 分 | 115 瓦 | 14,224 分 | 67.8fps | 49.7 dB(A) |
| 涡轮 | 140 瓦 | 2,036 分 | 115 瓦 | 14,213 分 | 68.2fps | 57.4 dB(A) |
| 电池(性能) | 75/60 瓦 | 1,638 分 | 42 瓦 | 8,884 分 | 43.2fps | 40.9 dB(A) |
处理器 - Ryzen 9 9955HX
使用 AMD Ryzen 9 9955HX是一款速度极快的移动处理器,在基准测试中也表现出色。如前所述,CPU 性能可以在Turbo模式下进一步提升。
Cinebench R15 Multi Sustained Test
Cinebench R23: Multi Core | Single Core
Cinebench R20: CPU (Multi Core) | CPU (Single Core)
Cinebench R15: CPU Multi 64Bit | CPU Single 64Bit
Blender: v2.79 BMW27 CPU
7-Zip 18.03: 7z b 4 | 7z b 4 -mmt1
Geekbench 6.7: Multi-Core | Single-Core
Geekbench 5.5: Multi-Core | Single-Core
HWBOT x265 Benchmark v2.2: 4k Preset
LibreOffice : 20 Documents To PDF
R Benchmark 2.5: Overall mean
| CPU Performance rating | |
| Average AMD Ryzen 9 9955HX | |
| Asus ROG Strix G18 2025 G814 | |
| MSI Vector A18 HX A9W | |
| MSI Crosshair A17 HX D8WGKG | |
| Schenker XMG Focus 17 M25 | |
| Razer Blade 18 RTX 4070 -2! | |
| Average of class Gaming | |
| MSI Katana 17 HX B14WGK | |
| Cinebench R23 / Multi Core | |
| MSI Vector A18 HX A9W | |
| Average AMD Ryzen 9 9955HX (35960 - 39690, n=9) | |
| Asus ROG Strix G18 2025 G814 | |
| MSI Crosshair A17 HX D8WGKG | |
| Schenker XMG Focus 17 M25 | |
| Razer Blade 18 RTX 4070 | |
| Average of class Gaming (10488 - 40970, n=113, last 2 years) | |
| MSI Katana 17 HX B14WGK | |
| Cinebench R23 / Single Core | |
| Asus ROG Strix G18 2025 G814 | |
| Average AMD Ryzen 9 9955HX (1828 - 2183, n=9) | |
| Razer Blade 18 RTX 4070 | |
| Schenker XMG Focus 17 M25 | |
| Average of class Gaming (1166 - 2356, n=113, last 2 years) | |
| MSI Katana 17 HX B14WGK | |
| MSI Crosshair A17 HX D8WGKG | |
| MSI Vector A18 HX A9W | |
| Cinebench R20 / CPU (Multi Core) | |
| MSI Vector A18 HX A9W | |
| Average AMD Ryzen 9 9955HX (13963 - 15524, n=9) | |
| Asus ROG Strix G18 2025 G814 | |
| MSI Crosshair A17 HX D8WGKG | |
| Schenker XMG Focus 17 M25 | |
| Razer Blade 18 RTX 4070 | |
| Average of class Gaming (4029 - 16108, n=112, last 2 years) | |
| MSI Katana 17 HX B14WGK | |
| Cinebench R20 / CPU (Single Core) | |
| Asus ROG Strix G18 2025 G814 | |
| Average AMD Ryzen 9 9955HX (819 - 856, n=9) | |
| MSI Vector A18 HX A9W | |
| Razer Blade 18 RTX 4070 | |
| Schenker XMG Focus 17 M25 | |
| Average of class Gaming (442 - 895, n=112, last 2 years) | |
| MSI Katana 17 HX B14WGK | |
| MSI Crosshair A17 HX D8WGKG | |
| Cinebench R15 / CPU Multi 64Bit | |
| MSI Vector A18 HX A9W | |
| Asus ROG Strix G18 2025 G814 | |
| Average AMD Ryzen 9 9955HX (5624 - 6103, n=9) | |
| MSI Crosshair A17 HX D8WGKG | |
| Schenker XMG Focus 17 M25 | |
| Razer Blade 18 RTX 4070 | |
| Average of class Gaming (1578 - 6271, n=113, last 2 years) | |
| MSI Katana 17 HX B14WGK | |
| Cinebench R15 / CPU Single 64Bit | |
| Asus ROG Strix G18 2025 G814 | |
| Average AMD Ryzen 9 9955HX (320 - 338, n=9) | |
| MSI Vector A18 HX A9W | |
| Schenker XMG Focus 17 M25 | |
| Razer Blade 18 RTX 4070 | |
| Average of class Gaming (188.8 - 343, n=112, last 2 years) | |
| MSI Crosshair A17 HX D8WGKG | |
| MSI Katana 17 HX B14WGK | |
| Blender / v2.79 BMW27 CPU | |
| MSI Katana 17 HX B14WGK | |
| Average of class Gaming (80 - 330, n=110, last 2 years) | |
| Schenker XMG Focus 17 M25 | |
| Razer Blade 18 RTX 4070 | |
| MSI Crosshair A17 HX D8WGKG | |
| Asus ROG Strix G18 2025 G814 | |
| Average AMD Ryzen 9 9955HX (80 - 91, n=9) | |
| MSI Vector A18 HX A9W | |
| 7-Zip 18.03 / 7z b 4 | |
| MSI Vector A18 HX A9W | |
| Average AMD Ryzen 9 9955HX (132435 - 144064, n=9) | |
| Asus ROG Strix G18 2025 G814 | |
| MSI Crosshair A17 HX D8WGKG | |
| Schenker XMG Focus 17 M25 | |
| Razer Blade 18 RTX 4070 | |
| Average of class Gaming (33491 - 148086, n=111, last 2 years) | |
| MSI Katana 17 HX B14WGK | |
| 7-Zip 18.03 / 7z b 4 -mmt1 | |
| Asus ROG Strix G18 2025 G814 | |
| MSI Crosshair A17 HX D8WGKG | |
| Average AMD Ryzen 9 9955HX (7061 - 7462, n=9) | |
| MSI Vector A18 HX A9W | |
| Schenker XMG Focus 17 M25 | |
| Razer Blade 18 RTX 4070 | |
| Average of class Gaming (4199 - 7436, n=111, last 2 years) | |
| MSI Katana 17 HX B14WGK | |
| Geekbench 6.7 / Multi-Core | |
| Asus ROG Strix G18 2025 G814 | |
| Average AMD Ryzen 9 9955HX (16313 - 19725, n=9) | |
| Schenker XMG Focus 17 M25 | |
| MSI Crosshair A17 HX D8WGKG | |
| MSI Vector A18 HX A9W | |
| Average of class Gaming (6625 - 22104, n=112, last 2 years) | |
| MSI Katana 17 HX B14WGK | |
| Geekbench 6.7 / Single-Core | |
| Asus ROG Strix G18 2025 G814 | |
| Average AMD Ryzen 9 9955HX (3156 - 3259, n=9) | |
| MSI Vector A18 HX A9W | |
| Schenker XMG Focus 17 M25 | |
| MSI Crosshair A17 HX D8WGKG | |
| Average of class Gaming (1490 - 3259, n=112, last 2 years) | |
| MSI Katana 17 HX B14WGK | |
| Geekbench 5.5 / Multi-Core | |
| MSI Vector A18 HX A9W | |
| Asus ROG Strix G18 2025 G814 | |
| Average AMD Ryzen 9 9955HX (20576 - 22716, n=9) | |
| Schenker XMG Focus 17 M25 | |
| Razer Blade 18 RTX 4070 | |
| MSI Crosshair A17 HX D8WGKG | |
| Average of class Gaming (6460 - 27010, n=111, last 2 years) | |
| MSI Katana 17 HX B14WGK | |
| Geekbench 5.5 / Single-Core | |
| Average AMD Ryzen 9 9955HX (2307 - 2474, n=9) | |
| Asus ROG Strix G18 2025 G814 | |
| MSI Vector A18 HX A9W | |
| Schenker XMG Focus 17 M25 | |
| Average of class Gaming (986 - 2474, n=111, last 2 years) | |
| Razer Blade 18 RTX 4070 | |
| MSI Katana 17 HX B14WGK | |
| MSI Crosshair A17 HX D8WGKG | |
| HWBOT x265 Benchmark v2.2 / 4k Preset | |
| MSI Vector A18 HX A9W | |
| Average AMD Ryzen 9 9955HX (38.9 - 43, n=9) | |
| Asus ROG Strix G18 2025 G814 | |
| MSI Crosshair A17 HX D8WGKG | |
| Razer Blade 18 RTX 4070 | |
| Schenker XMG Focus 17 M25 | |
| Average of class Gaming (11.5 - 44.3, n=111, last 2 years) | |
| MSI Katana 17 HX B14WGK | |
| LibreOffice / 20 Documents To PDF | |
| MSI Katana 17 HX B14WGK | |
| Average of class Gaming (19 - 88.8, n=111, last 2 years) | |
| Schenker XMG Focus 17 M25 | |
| Average AMD Ryzen 9 9955HX (42.2 - 52.4, n=9) | |
| Asus ROG Strix G18 2025 G814 | |
| MSI Vector A18 HX A9W | |
| Razer Blade 18 RTX 4070 | |
| MSI Crosshair A17 HX D8WGKG | |
| R Benchmark 2.5 / Overall mean | |
| MSI Crosshair A17 HX D8WGKG | |
| Average of class Gaming (0.3439 - 0.759, n=112, last 2 years) | |
| MSI Katana 17 HX B14WGK | |
| Schenker XMG Focus 17 M25 | |
| Razer Blade 18 RTX 4070 | |
| Average AMD Ryzen 9 9955HX (0.3439 - 0.3737, n=9) | |
| Asus ROG Strix G18 2025 G814 | |
| MSI Vector A18 HX A9W | |
* ... smaller is better
AIDA64: FP32 Ray-Trace | FPU Julia | CPU SHA3 | CPU Queen | FPU SinJulia | FPU Mandel | CPU AES | CPU ZLib | FP64 Ray-Trace | CPU PhotoWorxx
| Performance rating | |
| MSI Vector A18 HX A9W | |
| Asus ROG Strix G18 2025 G814 | |
| Average AMD Ryzen 9 9955HX | |
| MSI Crosshair A17 HX D8WGKG | |
| Schenker XMG Focus 17 M25 | |
| Razer Blade 18 RTX 4070 | |
| Average of class Gaming | |
| MSI Katana 17 HX B14WGK | |
| AIDA64 / FP32 Ray-Trace | |
| MSI Vector A18 HX A9W | |
| Average AMD Ryzen 9 9955HX (66596 - 85542, n=9) | |
| Asus ROG Strix G18 2025 G814 | |
| MSI Crosshair A17 HX D8WGKG | |
| Average of class Gaming (10227 - 85542, n=110, last 2 years) | |
| Schenker XMG Focus 17 M25 | |
| Razer Blade 18 RTX 4070 | |
| MSI Katana 17 HX B14WGK | |
| AIDA64 / FPU Julia | |
| MSI Vector A18 HX A9W | |
| Average AMD Ryzen 9 9955HX (191535 - 232031, n=9) | |
| Asus ROG Strix G18 2025 G814 | |
| MSI Crosshair A17 HX D8WGKG | |
| Average of class Gaming (51376 - 238426, n=110, last 2 years) | |
| Schenker XMG Focus 17 M25 | |
| Razer Blade 18 RTX 4070 | |
| MSI Katana 17 HX B14WGK | |
| AIDA64 / CPU SHA3 | |
| MSI Vector A18 HX A9W | |
| Average AMD Ryzen 9 9955HX (8489 - 9780, n=9) | |
| Asus ROG Strix G18 2025 G814 | |
| MSI Crosshair A17 HX D8WGKG | |
| Schenker XMG Focus 17 M25 | |
| Razer Blade 18 RTX 4070 | |
| Average of class Gaming (2180 - 9817, n=110, last 2 years) | |
| MSI Katana 17 HX B14WGK | |
| AIDA64 / CPU Queen | |
| MSI Crosshair A17 HX D8WGKG | |
| Asus ROG Strix G18 2025 G814 | |
| MSI Vector A18 HX A9W | |
| Average AMD Ryzen 9 9955HX (153027 - 164154, n=9) | |
| Razer Blade 18 RTX 4070 | |
| Schenker XMG Focus 17 M25 | |
| Average of class Gaming (49785 - 173351, n=101, last 2 years) | |
| MSI Katana 17 HX B14WGK | |
| AIDA64 / FPU SinJulia | |
| MSI Vector A18 HX A9W | |
| Average AMD Ryzen 9 9955HX (29876 - 32647, n=9) | |
| Asus ROG Strix G18 2025 G814 | |
| MSI Crosshair A17 HX D8WGKG | |
| Razer Blade 18 RTX 4070 | |
| Schenker XMG Focus 17 M25 | |
| Average of class Gaming (4424 - 33636, n=110, last 2 years) | |
| MSI Katana 17 HX B14WGK | |
| AIDA64 / FPU Mandel | |
| MSI Vector A18 HX A9W | |
| Average AMD Ryzen 9 9955HX (101131 - 128721, n=9) | |
| MSI Crosshair A17 HX D8WGKG | |
| Asus ROG Strix G18 2025 G814 | |
| Average of class Gaming (25115 - 128721, n=110, last 2 years) | |
| Schenker XMG Focus 17 M25 | |
| Razer Blade 18 RTX 4070 | |
| MSI Katana 17 HX B14WGK | |
| AIDA64 / CPU AES | |
| Asus ROG Strix G18 2025 G814 | |
| Average AMD Ryzen 9 9955HX (146979 - 218385, n=9) | |
| MSI Crosshair A17 HX D8WGKG | |
| MSI Vector A18 HX A9W | |
| Razer Blade 18 RTX 4070 | |
| Schenker XMG Focus 17 M25 | |
| Average of class Gaming (39258 - 247074, n=110, last 2 years) | |
| MSI Katana 17 HX B14WGK | |
| AIDA64 / CPU ZLib | |
| MSI Vector A18 HX A9W | |
| Average AMD Ryzen 9 9955HX (2186 - 2531, n=9) | |
| Asus ROG Strix G18 2025 G814 | |
| MSI Crosshair A17 HX D8WGKG | |
| Schenker XMG Focus 17 M25 | |
| Razer Blade 18 RTX 4070 | |
| Average of class Gaming (574 - 2531, n=110, last 2 years) | |
| MSI Katana 17 HX B14WGK | |
| AIDA64 / FP64 Ray-Trace | |
| MSI Vector A18 HX A9W | |
| Average AMD Ryzen 9 9955HX (35252 - 45446, n=9) | |
| Asus ROG Strix G18 2025 G814 | |
| MSI Crosshair A17 HX D8WGKG | |
| Average of class Gaming (5509 - 45446, n=110, last 2 years) | |
| Razer Blade 18 RTX 4070 | |
| Schenker XMG Focus 17 M25 | |
| MSI Katana 17 HX B14WGK | |
| AIDA64 / CPU PhotoWorxx | |
| Razer Blade 18 RTX 4070 | |
| Schenker XMG Focus 17 M25 | |
| Average of class Gaming (12271 - 89891, n=110, last 2 years) | |
| Asus ROG Strix G18 2025 G814 | |
| MSI Vector A18 HX A9W | |
| Average AMD Ryzen 9 9955HX (35974 - 42495, n=9) | |
| MSI Crosshair A17 HX D8WGKG | |
| MSI Katana 17 HX B14WGK | |
系统性能
总的来说,Strix G18 是一款速度非常快的电脑,基准测试结果也不相上下。虽然我们在测试过程中没有遇到任何稳定性问题,但与往常一样,当激活 Nvidia GPU 时,Advanced Optimus GPU 切换确实会导致短暂的冻结。
PCMark 10: Score | Essentials | Productivity | Digital Content Creation
CrossMark: Overall | Productivity | Creativity | Responsiveness
WebXPRT 3: Overall
WebXPRT 4: Overall
Mozilla Kraken 1.1: Total
| Performance rating | |
| MSI Vector A18 HX A9W | |
| Asus ROG Strix G18 2025 G814 | |
| Average AMD Ryzen 9 9955HX, NVIDIA GeForce RTX 5070 Laptop | |
| Razer Blade 18 RTX 4070 | |
| Schenker XMG Focus 17 M25 | |
| Average of class Gaming | |
| MSI Crosshair A17 HX D8WGKG | |
| MSI Katana 17 HX B14WGK | |
| PCMark 10 / Score | |
| MSI Vector A18 HX A9W | |
| Asus ROG Strix G18 2025 G814 | |
| Average AMD Ryzen 9 9955HX, NVIDIA GeForce RTX 5070 Laptop (n=1) | |
| Average of class Gaming (5828 - 11574, n=96, last 2 years) | |
| MSI Crosshair A17 HX D8WGKG | |
| Razer Blade 18 RTX 4070 | |
| Schenker XMG Focus 17 M25 | |
| MSI Katana 17 HX B14WGK | |
| PCMark 10 / Essentials | |
| Asus ROG Strix G18 2025 G814 | |
| Average AMD Ryzen 9 9955HX, NVIDIA GeForce RTX 5070 Laptop (n=1) | |
| Razer Blade 18 RTX 4070 | |
| MSI Vector A18 HX A9W | |
| MSI Crosshair A17 HX D8WGKG | |
| Schenker XMG Focus 17 M25 | |
| Average of class Gaming (8810 - 12600, n=100, last 2 years) | |
| MSI Katana 17 HX B14WGK | |
| PCMark 10 / Productivity | |
| Asus ROG Strix G18 2025 G814 | |
| Average AMD Ryzen 9 9955HX, NVIDIA GeForce RTX 5070 Laptop (n=1) | |
| MSI Vector A18 HX A9W | |
| Average of class Gaming (6845 - 18766, n=98, last 2 years) | |
| Razer Blade 18 RTX 4070 | |
| MSI Crosshair A17 HX D8WGKG | |
| Schenker XMG Focus 17 M25 | |
| MSI Katana 17 HX B14WGK | |
| PCMark 10 / Digital Content Creation | |
| MSI Vector A18 HX A9W | |
| Asus ROG Strix G18 2025 G814 | |
| Average AMD Ryzen 9 9955HX, NVIDIA GeForce RTX 5070 Laptop (n=1) | |
| Average of class Gaming (7602 - 19657, n=98, last 2 years) | |
| Schenker XMG Focus 17 M25 | |
| MSI Crosshair A17 HX D8WGKG | |
| MSI Katana 17 HX B14WGK | |
| Razer Blade 18 RTX 4070 | |
| CrossMark / Overall | |
| Asus ROG Strix G18 2025 G814 | |
| Average AMD Ryzen 9 9955HX, NVIDIA GeForce RTX 5070 Laptop (n=1) | |
| Schenker XMG Focus 17 M25 | |
| MSI Vector A18 HX A9W | |
| Razer Blade 18 RTX 4070 | |
| Average of class Gaming (1366 - 2409, n=98, last 2 years) | |
| MSI Crosshair A17 HX D8WGKG | |
| MSI Katana 17 HX B14WGK | |
| CrossMark / Productivity | |
| Schenker XMG Focus 17 M25 | |
| Asus ROG Strix G18 2025 G814 | |
| Average AMD Ryzen 9 9955HX, NVIDIA GeForce RTX 5070 Laptop (n=1) | |
| Razer Blade 18 RTX 4070 | |
| MSI Vector A18 HX A9W | |
| MSI Katana 17 HX B14WGK | |
| Average of class Gaming (1386 - 2254, n=98, last 2 years) | |
| MSI Crosshair A17 HX D8WGKG | |
| CrossMark / Creativity | |
| Asus ROG Strix G18 2025 G814 | |
| Average AMD Ryzen 9 9955HX, NVIDIA GeForce RTX 5070 Laptop (n=1) | |
| MSI Vector A18 HX A9W | |
| Schenker XMG Focus 17 M25 | |
| Razer Blade 18 RTX 4070 | |
| Average of class Gaming (1343 - 2729, n=98, last 2 years) | |
| MSI Crosshair A17 HX D8WGKG | |
| MSI Katana 17 HX B14WGK | |
| CrossMark / Responsiveness | |
| Schenker XMG Focus 17 M25 | |
| MSI Katana 17 HX B14WGK | |
| Razer Blade 18 RTX 4070 | |
| Asus ROG Strix G18 2025 G814 | |
| Average AMD Ryzen 9 9955HX, NVIDIA GeForce RTX 5070 Laptop (n=1) | |
| MSI Crosshair A17 HX D8WGKG | |
| Average of class Gaming (1226 - 2334, n=98, last 2 years) | |
| MSI Vector A18 HX A9W | |
| WebXPRT 3 / Overall | |
| MSI Vector A18 HX A9W | |
| Razer Blade 18 RTX 4070 | |
| Asus ROG Strix G18 2025 G814 | |
| Average AMD Ryzen 9 9955HX, NVIDIA GeForce RTX 5070 Laptop (n=1) | |
| Average of class Gaming (242 - 532, n=101, last 2 years) | |
| Schenker XMG Focus 17 M25 | |
| MSI Katana 17 HX B14WGK | |
| MSI Crosshair A17 HX D8WGKG | |
| WebXPRT 4 / Overall | |
| MSI Vector A18 HX A9W | |
| Razer Blade 18 RTX 4070 | |
| Schenker XMG Focus 17 M25 | |
| Asus ROG Strix G18 2025 G814 | |
| Average AMD Ryzen 9 9955HX, NVIDIA GeForce RTX 5070 Laptop (n=1) | |
| Average of class Gaming (176.4 - 354, n=101, last 2 years) | |
| MSI Katana 17 HX B14WGK | |
| MSI Crosshair A17 HX D8WGKG | |
| Mozilla Kraken 1.1 / Total | |
| MSI Crosshair A17 HX D8WGKG | |
| MSI Katana 17 HX B14WGK | |
| Schenker XMG Focus 17 M25 | |
| Average of class Gaming (391 - 590, n=106, last 2 years) | |
| Razer Blade 18 RTX 4070 | |
| Asus ROG Strix G18 2025 G814 | |
| Average AMD Ryzen 9 9955HX, NVIDIA GeForce RTX 5070 Laptop (n=1) | |
| MSI Vector A18 HX A9W | |
* ... smaller is better
| PCMark 10 Score | 8879 points | |
Help | ||
| AIDA64 / Memory Copy | |
| Schenker XMG Focus 17 M25 | |
| Razer Blade 18 RTX 4070 | |
| Average of class Gaming (21750 - 129946, n=110, last 2 years) | |
| Asus ROG Strix G18 2025 G814 | |
| MSI Vector A18 HX A9W | |
| Average AMD Ryzen 9 9955HX (53598 - 62777, n=9) | |
| MSI Katana 17 HX B14WGK | |
| MSI Crosshair A17 HX D8WGKG | |
| AIDA64 / Memory Read | |
| Schenker XMG Focus 17 M25 | |
| Razer Blade 18 RTX 4070 | |
| Average of class Gaming (22956 - 118858, n=110, last 2 years) | |
| MSI Katana 17 HX B14WGK | |
| Average AMD Ryzen 9 9955HX (63953 - 67256, n=9) | |
| Asus ROG Strix G18 2025 G814 | |
| MSI Vector A18 HX A9W | |
| MSI Crosshair A17 HX D8WGKG | |
| AIDA64 / Memory Write | |
| Average of class Gaming (22297 - 135096, n=110, last 2 years) | |
| Razer Blade 18 RTX 4070 | |
| Schenker XMG Focus 17 M25 | |
| MSI Vector A18 HX A9W | |
| Average AMD Ryzen 9 9955HX (65421 - 72060, n=9) | |
| Asus ROG Strix G18 2025 G814 | |
| MSI Crosshair A17 HX D8WGKG | |
| MSI Katana 17 HX B14WGK | |
| AIDA64 / Memory Latency | |
| Average of class Gaming (75.3 - 259, n=110, last 2 years) | |
| MSI Vector A18 HX A9W | |
| Asus ROG Strix G18 2025 G814 | |
| Average AMD Ryzen 9 9955HX (92.1 - 103.5, n=9) | |
| MSI Katana 17 HX B14WGK | |
| Razer Blade 18 RTX 4070 | |
| MSI Crosshair A17 HX D8WGKG | |
| Schenker XMG Focus 17 M25 | |
* ... smaller is better
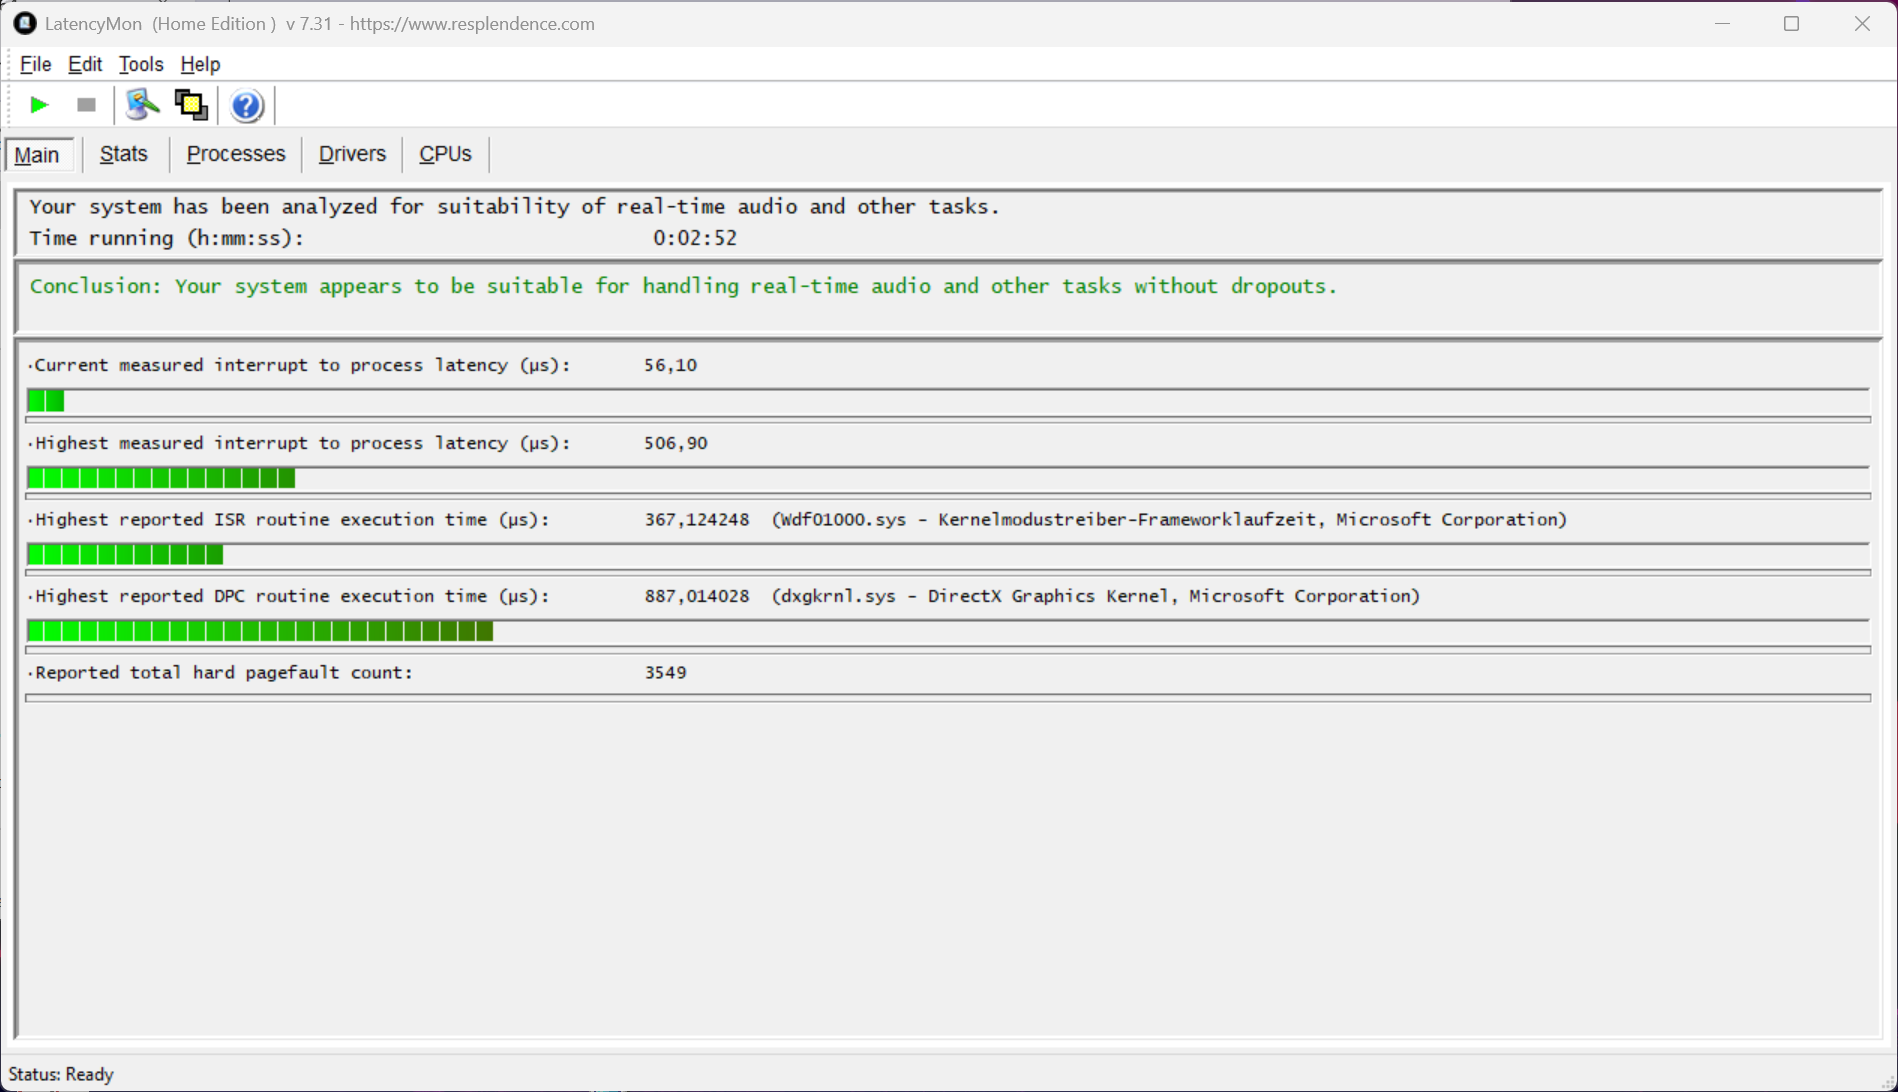
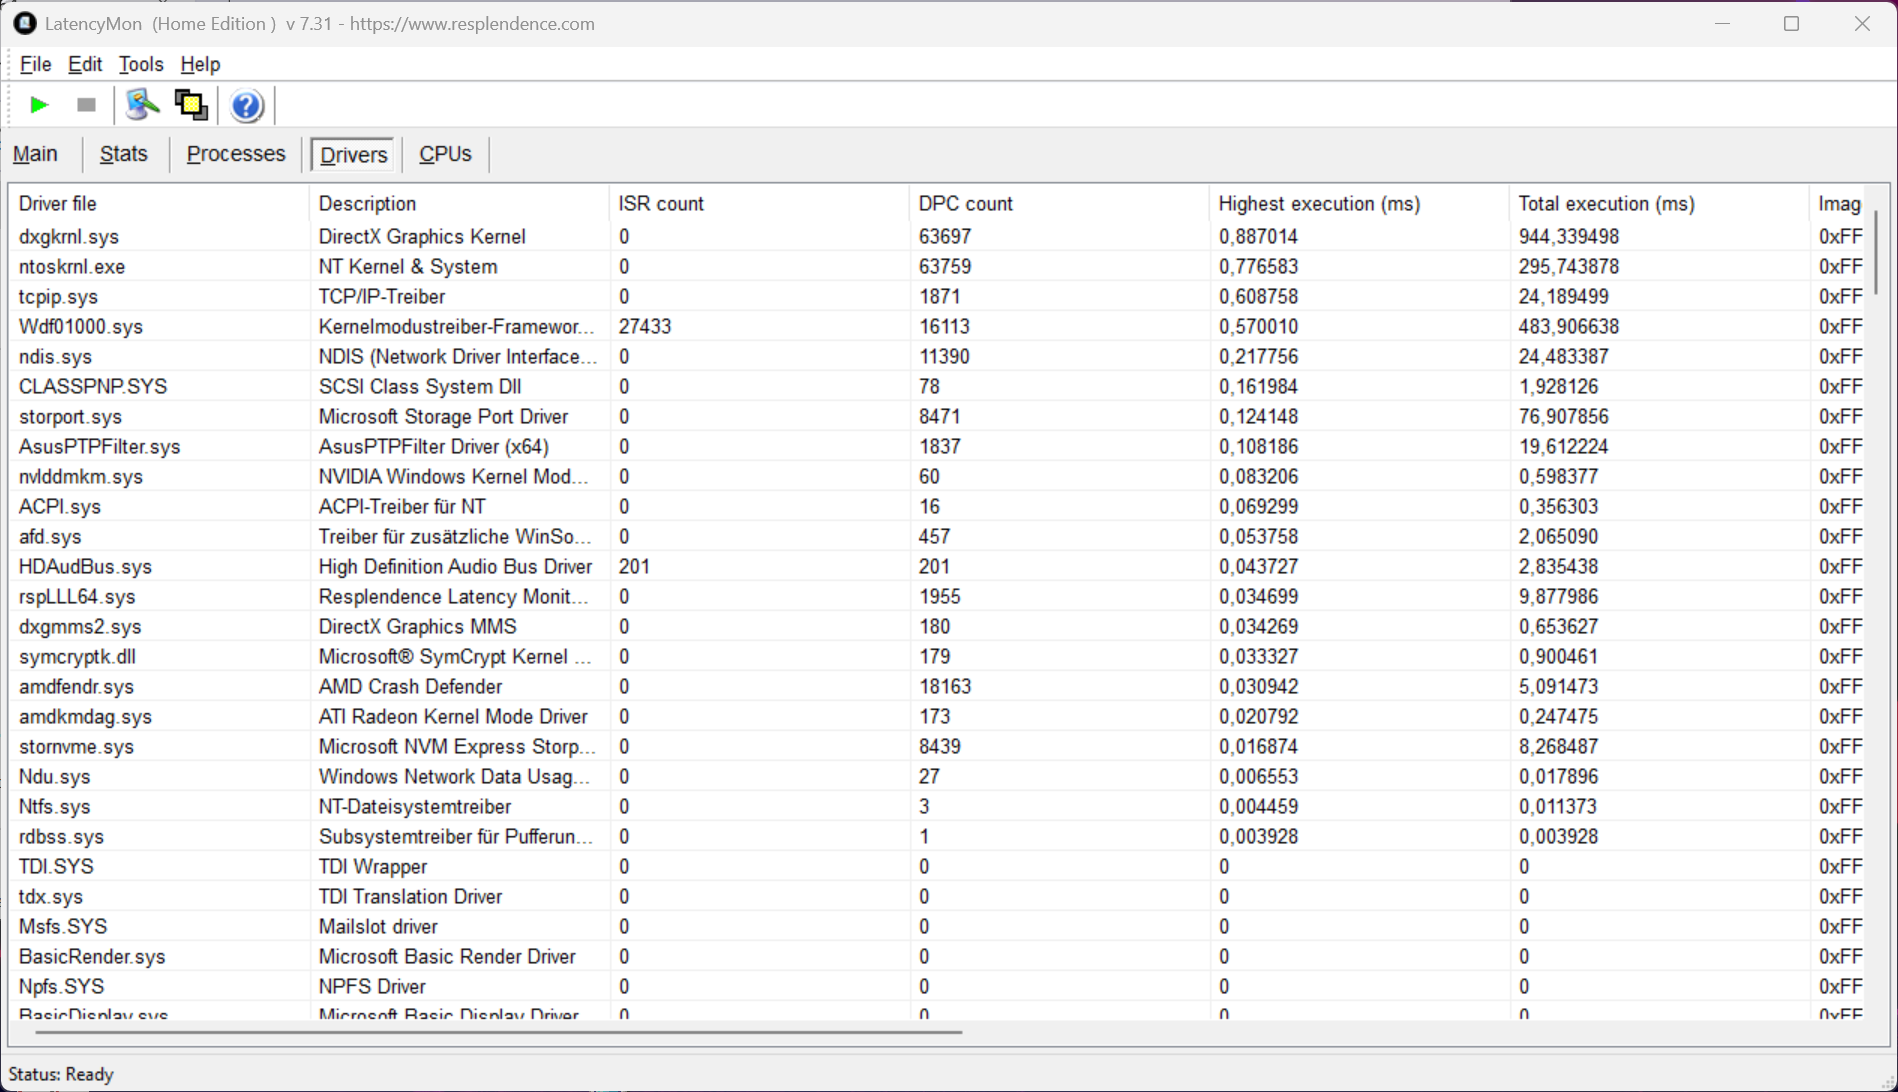
DPC 延迟
在我们的标准化延迟测试(网页浏览、4K YouTube 播放、CPU 负载)中,采用当前 BIOS 版本的评测设备在使用实时音频应用程序时没有显示出任何限制。
| DPC Latencies / LatencyMon - interrupt to process latency (max), Web, Youtube, Prime95 | |
| MSI Katana 17 HX B14WGK | |
| Schenker XMG Focus 17 M25 | |
| Razer Blade 18 RTX 4070 | |
| MSI Crosshair A17 HX D8WGKG | |
| Asus ROG Strix G18 2025 G814 | |
| MSI Vector A18 HX A9W | |
* ... smaller is better
大容量存储器
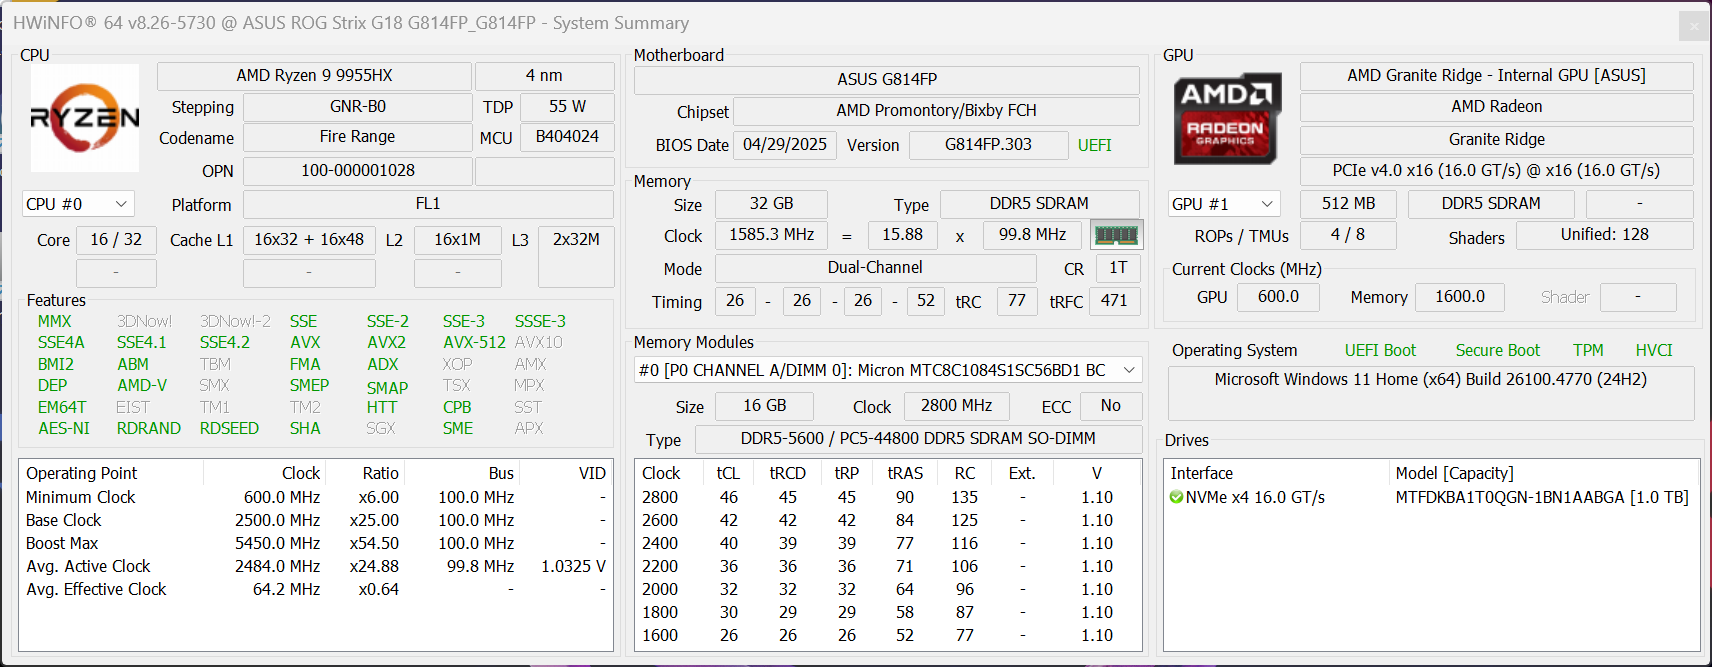
提供两个 M.2 2280 插槽(1 个 PCIe 5.0,1 个 PCIe 4.0)。评测机配备的是美光 2500 的 1 TB 版本(可用容量为 855 GB),传输速度不错。在我们的耐用性测试中,性能在某些时候略有下降,但这对日常使用并无重大影响。

* ... smaller is better
Sustained Performance: DiskSpd Read Loop, Queue Depth 8
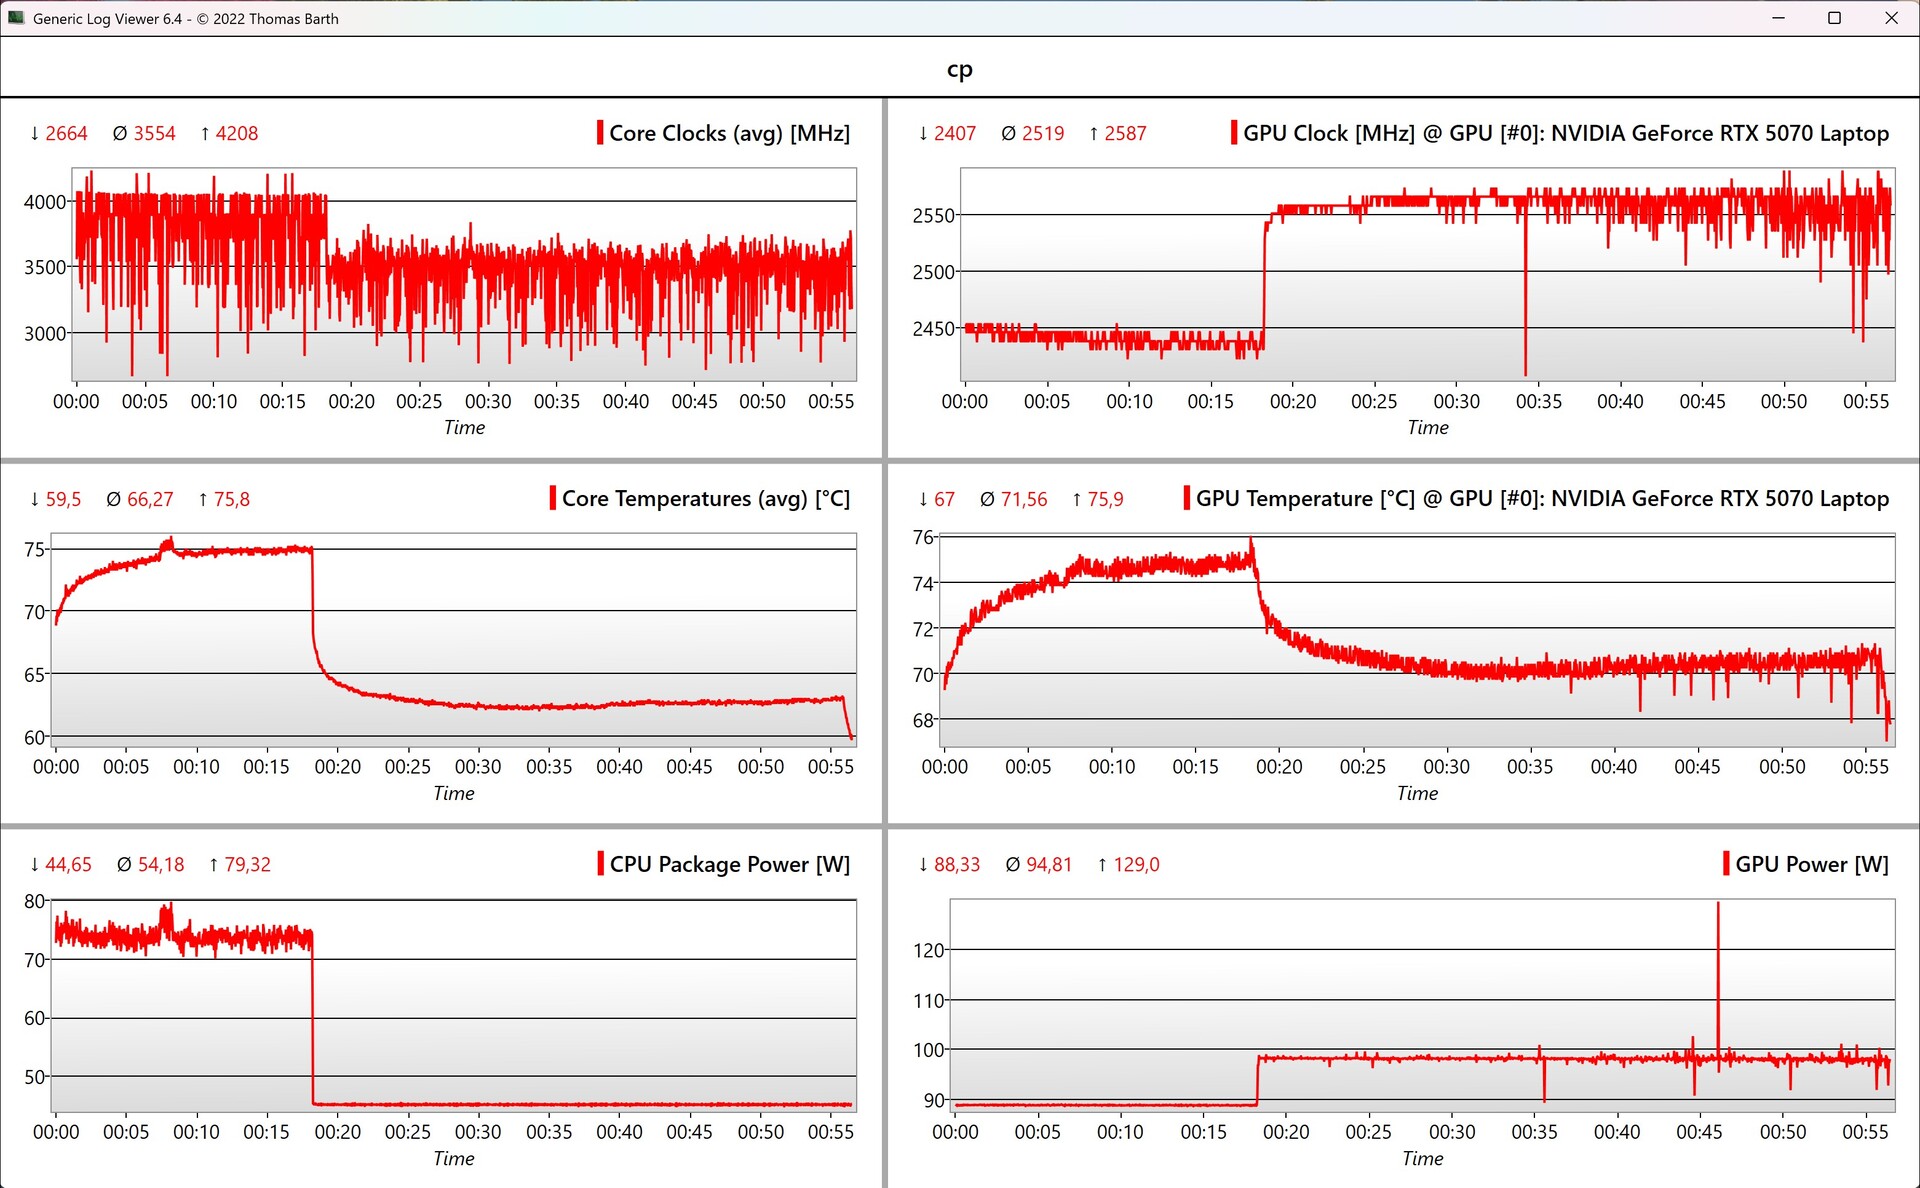
图形处理器性能
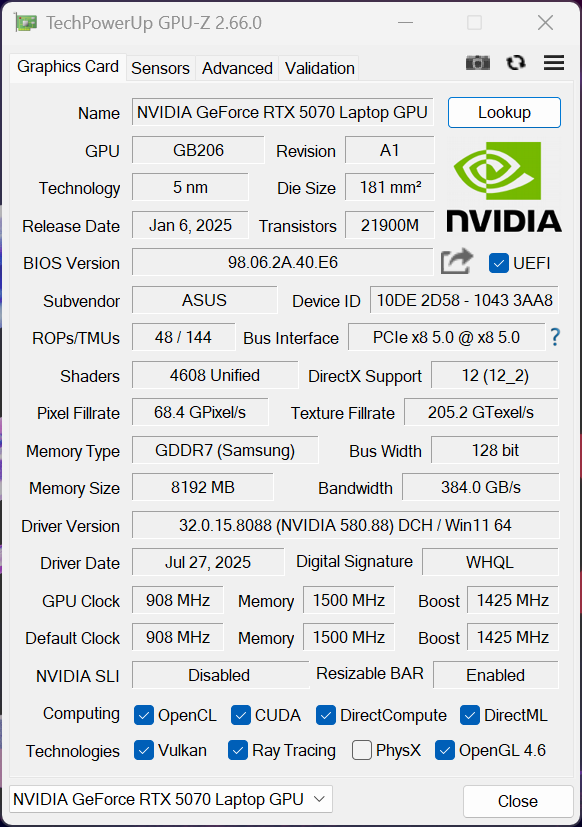
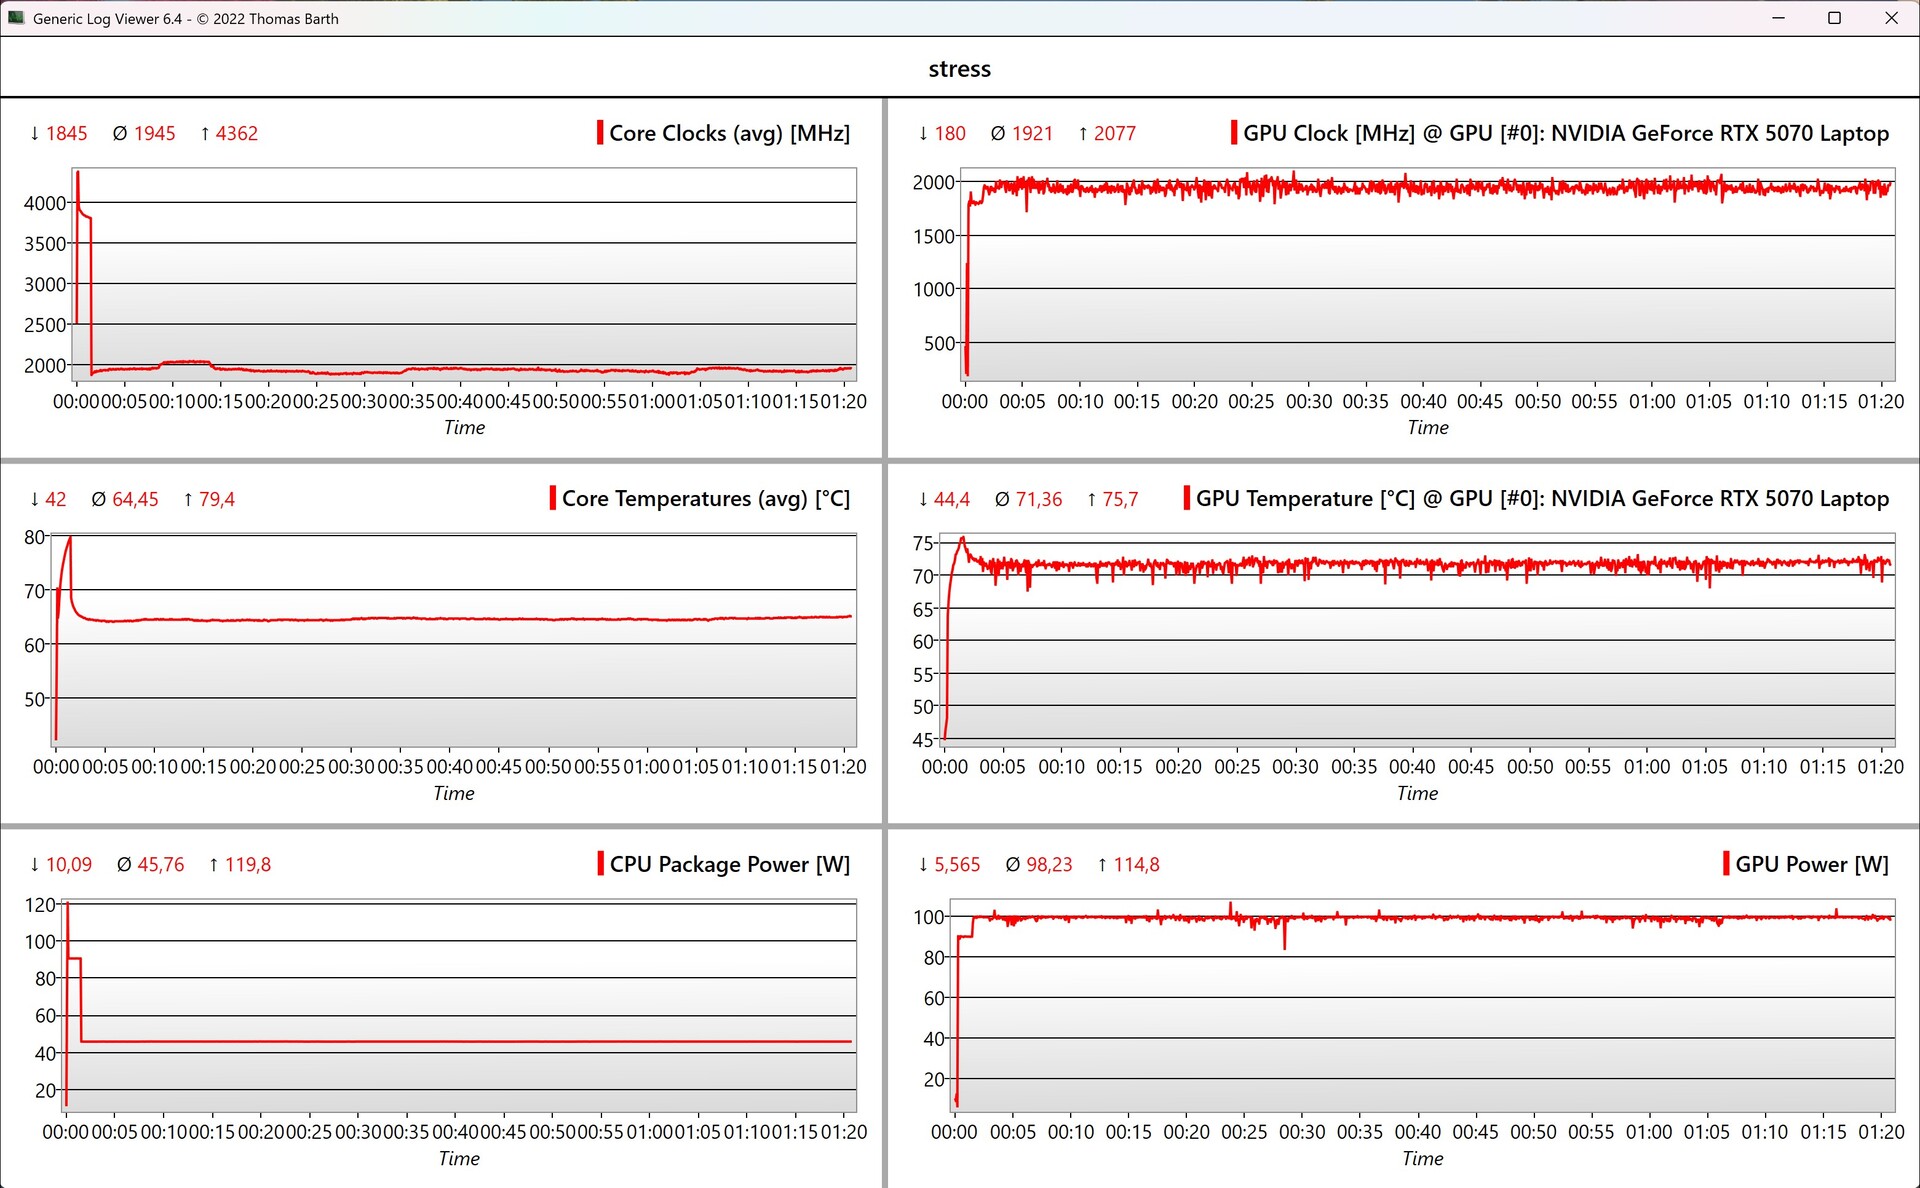
该设备配备了 英伟达GeForce RTX 5070 笔记本电脑 GPU使用的是 115 瓦版本(100 瓦 + 15 瓦 Dynamic Boost)。图形切换通过 Advanced Optimus 处理,性能总体良好,尽管 GPU 仍仅提供 8 GB 的 VRAM。根据不同的游戏,这可能会在 QHD 分辨率下造成问题,因此最好坚持使用全高清分辨率。
在游戏时,华硕显然应该重新设计电源配置文件。在最初的几分钟里,GPU 无法以全功率运行,因为处理器最初的运行功率为 80 瓦,过了一会儿才稳定在 50 瓦。只有这样,GPU 才能以 100 瓦的全功率运行。这一点在赛博朋克循环的数据中也很明显。
| 3DMark 11 Performance | 38780 points | |
| 3DMark Fire Strike Score | 34042 points | |
| 3DMark Time Spy Score | 14085 points | |
| 3DMark Steel Nomad Score | 3123 points | |
| 3DMark Steel Nomad Light Score | 14399 points | |
| 3DMark Steel Nomad Light Unlimited Score | 14291 points | |
Help | ||
| Blender / v3.3 Classroom OPTIX/RTX | |
| Razer Blade 18 RTX 4070 | |
| MSI Katana 17 HX B14WGK | |
| Average NVIDIA GeForce RTX 5070 Laptop (17 - 24, n=27) | |
| Average of class Gaming (9 - 32, n=112, last 2 years) | |
| Asus ROG Strix G18 2025 G814 | |
| MSI Crosshair A17 HX D8WGKG | |
| MSI Vector A18 HX A9W | |
| Schenker XMG Focus 17 M25 | |
| Blender / v3.3 Classroom CUDA | |
| Average NVIDIA GeForce RTX 5070 Laptop (29 - 228, n=28) | |
| Razer Blade 18 RTX 4070 | |
| Average of class Gaming (15 - 228, n=112, last 2 years) | |
| Schenker XMG Focus 17 M25 | |
| MSI Katana 17 HX B14WGK | |
| MSI Crosshair A17 HX D8WGKG | |
| Asus ROG Strix G18 2025 G814 | |
| MSI Vector A18 HX A9W | |
| Blender / v3.3 Classroom CPU | |
| MSI Katana 17 HX B14WGK | |
| Average NVIDIA GeForce RTX 5070 Laptop (137 - 507, n=25) | |
| Average of class Gaming (122 - 565, n=108, last 2 years) | |
| Razer Blade 18 RTX 4070 | |
| Schenker XMG Focus 17 M25 | |
| Asus ROG Strix G18 2025 G814 | |
| MSI Vector A18 HX A9W | |
* ... smaller is better
| Performance rating - Percent | |
| MSI Vector A18 HX A9W -1! | |
| Schenker XMG Focus 17 M25 | |
| MSI Crosshair A17 HX D8WGKG -1! | |
| Asus ROG Strix G18 2025 G814 | |
| Razer Blade 18 RTX 4070 -2! | |
| Average of class Gaming | |
| MSI Katana 17 HX B14WGK -2! | |
| Cyberpunk 2077 - 1920x1080 Ultra Preset (FSR off) | |
| MSI Vector A18 HX A9W | |
| Schenker XMG Focus 17 M25 | |
| MSI Crosshair A17 HX D8WGKG | |
| Asus ROG Strix G18 2025 G814 | |
| Average of class Gaming (17.7 - 169.9, n=121, last 2 years) | |
| MSI Katana 17 HX B14WGK | |
| Baldur's Gate 3 - 1920x1080 Ultra Preset AA:T | |
| MSI Vector A18 HX A9W | |
| Schenker XMG Focus 17 M25 | |
| Average of class Gaming (59.4 - 246, n=107, last 2 years) | |
| MSI Crosshair A17 HX D8WGKG | |
| Asus ROG Strix G18 2025 G814 | |
| MSI Katana 17 HX B14WGK | |
| GTA V - 1920x1080 Highest AA:4xMSAA + FX AF:16x | |
| MSI Crosshair A17 HX D8WGKG | |
| Asus ROG Strix G18 2025 G814 | |
| Schenker XMG Focus 17 M25 | |
| Average of class Gaming (48.3 - 186.9, n=103, last 2 years) | |
| Razer Blade 18 RTX 4070 | |
| MSI Katana 17 HX B14WGK | |
| Final Fantasy XV Benchmark - 1920x1080 High Quality | |
| MSI Vector A18 HX A9W | |
| Schenker XMG Focus 17 M25 | |
| Average of class Gaming (41 - 215, n=104, last 2 years) | |
| MSI Crosshair A17 HX D8WGKG | |
| Asus ROG Strix G18 2025 G814 | |
| Razer Blade 18 RTX 4070 | |
| Strange Brigade - 1920x1080 ultra AA:ultra AF:16 | |
| MSI Vector A18 HX A9W | |
| Schenker XMG Focus 17 M25 | |
| Average of class Gaming (76.3 - 456, n=94, last 2 years) | |
| Asus ROG Strix G18 2025 G814 | |
| Razer Blade 18 RTX 4070 | |
| Dota 2 Reborn - 1920x1080 ultra (3/3) best looking | |
| MSI Vector A18 HX A9W | |
| MSI Crosshair A17 HX D8WGKG | |
| Asus ROG Strix G18 2025 G814 | |
| Razer Blade 18 RTX 4070 | |
| Schenker XMG Focus 17 M25 | |
| Average of class Gaming (84.8 - 248, n=113, last 2 years) | |
| MSI Katana 17 HX B14WGK | |
Cyberpunk 2077 ultra FPS diagram
| low | med. | high | ultra | QHD DLSS | QHD | |
|---|---|---|---|---|---|---|
| GTA V (2015) | 153.5 | 124.7 | ||||
| Dota 2 Reborn (2015) | 252 | 204 | 201 | 180.9 | ||
| Final Fantasy XV Benchmark (2018) | 232 | 189.3 | 140.6 | 102.3 | ||
| X-Plane 11.11 (2018) | 161.3 | 146.8 | 116.3 | |||
| Strange Brigade (2018) | 649 | 369 | 300 | 259 | 168.9 | |
| Baldur's Gate 3 (2023) | 179.1 | 144 | 126.1 | 121.9 | 88.6 | |
| Cyberpunk 2077 (2023) | 169.7 | 138.3 | 118.6 | 106.4 | 80.1 | 67.8 |
| F1 24 (2024) | 333 | 312 | 247 | 85.3 | 81.8 | 52.7 |
| Assassin's Creed Shadows (2025) | 80 | 76 | 64 | 43 | 34 | |
| F1 25 (2025) | 274 | 242 | 198.4 | 31.2 | 33.4 | 14.1 |
排放与能源
噪音排放
我们对冷却系统有些失望,因为即使在空转和轻负载时,风扇也几乎总是会产生可听到的噪音(约 30 dB(A))。虽然可以通过静音模式在一定程度上抵消噪音,但 G18 在日常使用中并非真正静音。即使在负载情况下(游戏/压力测试),考虑到相对较低的功率限制(对于 18 英寸屏幕而言),噪音水平也过高。在性能模式下,它的噪音值略低于 50 dB(A),几乎会让你不得不戴上耳机。例如,最近测试的配备 RTX 5070 Ti 的 XMG Focus 17 在 46 dB(A) 时也能达到同样的游戏性能。在涡轮增压模式下,我们测得 G18 的噪音为 57.4 dB(A)。评测设备没有发出其他电子噪音。
Noise level
| Idle |
| 24.6 / 30 / 30 dB(A) |
| Load |
| 34.4 / 49.7 dB(A) |
 | ||
30 dB silent 40 dB(A) audible 50 dB(A) loud |
||
min: | ||
| Asus ROG Strix G18 2025 G814 GeForce RTX 5070 Laptop, R9 9955HX, Micron 2500 1TB MTFDKBA1T0QGN | Razer Blade 18 RTX 4070 GeForce RTX 4070 Laptop GPU, i9-13950HX, SSSTC CA6-8D1024 | MSI Crosshair A17 HX D8WGKG GeForce RTX 5070 Laptop, R9 8940HX, Samsung PM9C1 MZVL81T0HELB-00BTW | Schenker XMG Focus 17 M25 GeForce RTX 5070 Ti Laptop, i9-13900HX, Kingston Fury Renegade SFYRS500G | MSI Katana 17 HX B14WGK GeForce RTX 5070 Laptop, i7-14650HX, Micron 2500 1TB MTFDKBA1T0QGN | MSI Vector A18 HX A9W GeForce RTX 5070 Ti Laptop, R9 9955HX | |
|---|---|---|---|---|---|---|
| Noise | 4% | -22% | -7% | -18% | -6% | |
| off / environment * (dB) | 24.6 | 23.5 4% | 24 2% | 24.8 -1% | 25 -2% | 22.5 9% |
| Idle Minimum * (dB) | 24.6 | 23.8 3% | 25 -2% | 24.8 -1% | 31 -26% | 26 -6% |
| Idle Average * (dB) | 30 | 23.8 21% | 30 -0% | 24.8 17% | 32 -7% | 26 13% |
| Idle Maximum * (dB) | 30 | 26.8 11% | 47 -57% | 27.7 8% | 34 -13% | 32 -7% |
| Load Average * (dB) | 34.4 | 37.3 -8% | 57 -66% | 51 -48% | 50 -45% | 44.4 -29% |
| Cyberpunk 2077 ultra * (dB) | 49.7 | 57 -15% | 56.2 -13% | 58 -17% | 49.8 -0% | |
| Load Maximum * (dB) | 49.7 | 53.5 -8% | 58 -17% | 56.2 -13% | 59 -19% | 61.6 -24% |
| Witcher 3 ultra * (dB) | 48 |
* ... smaller is better
温度
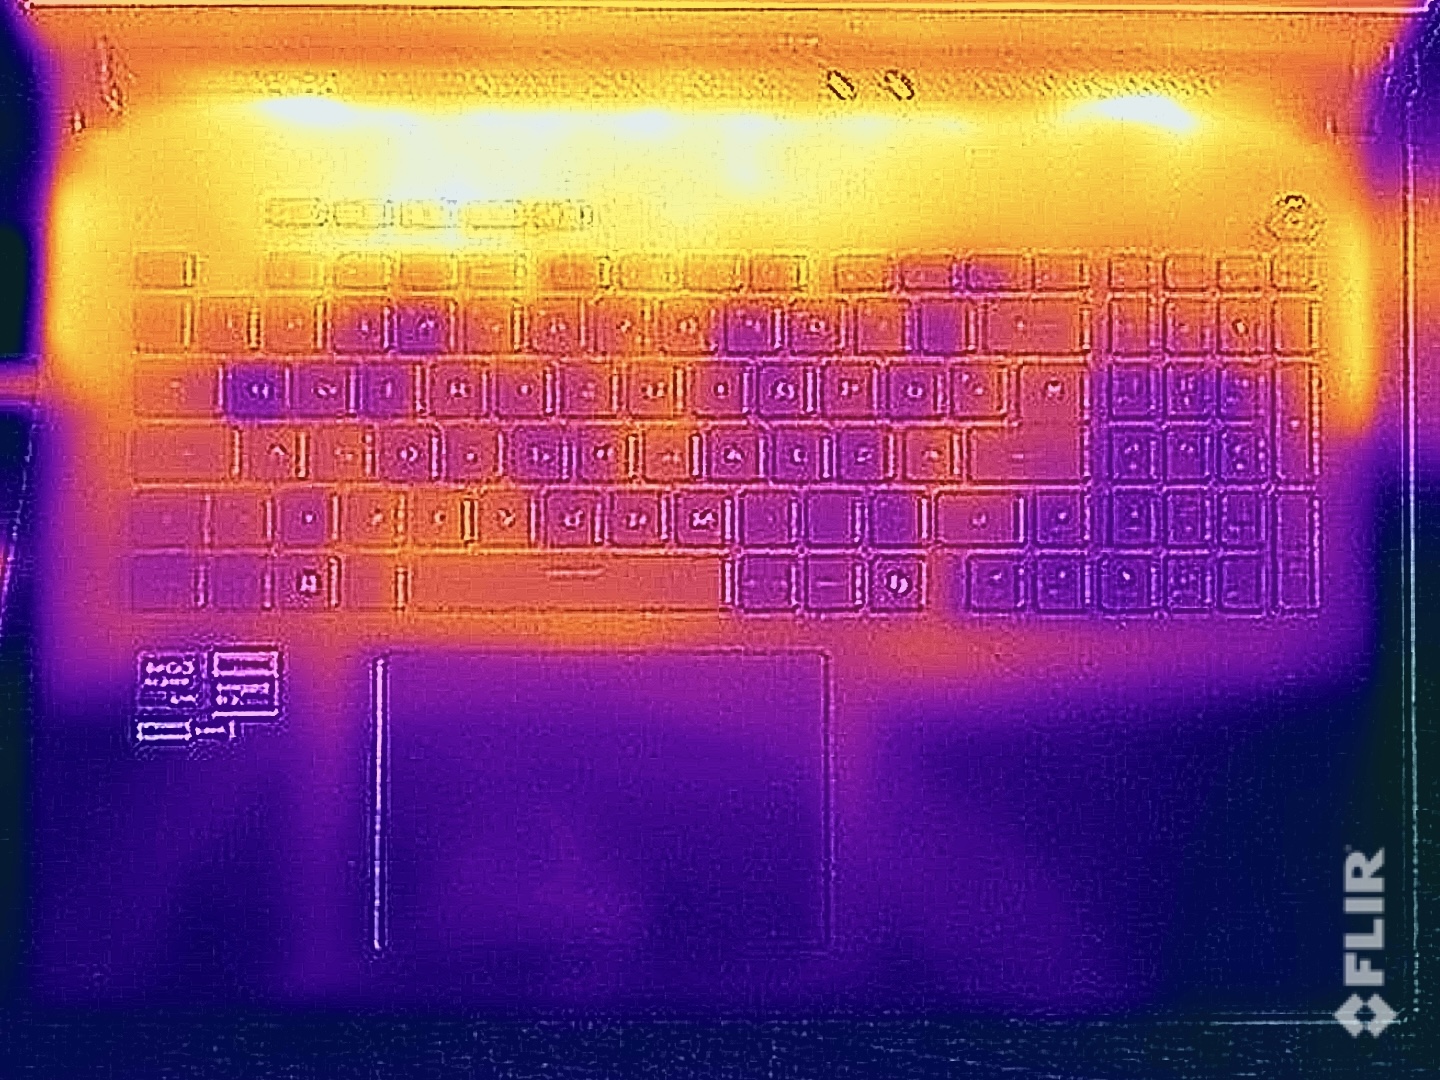
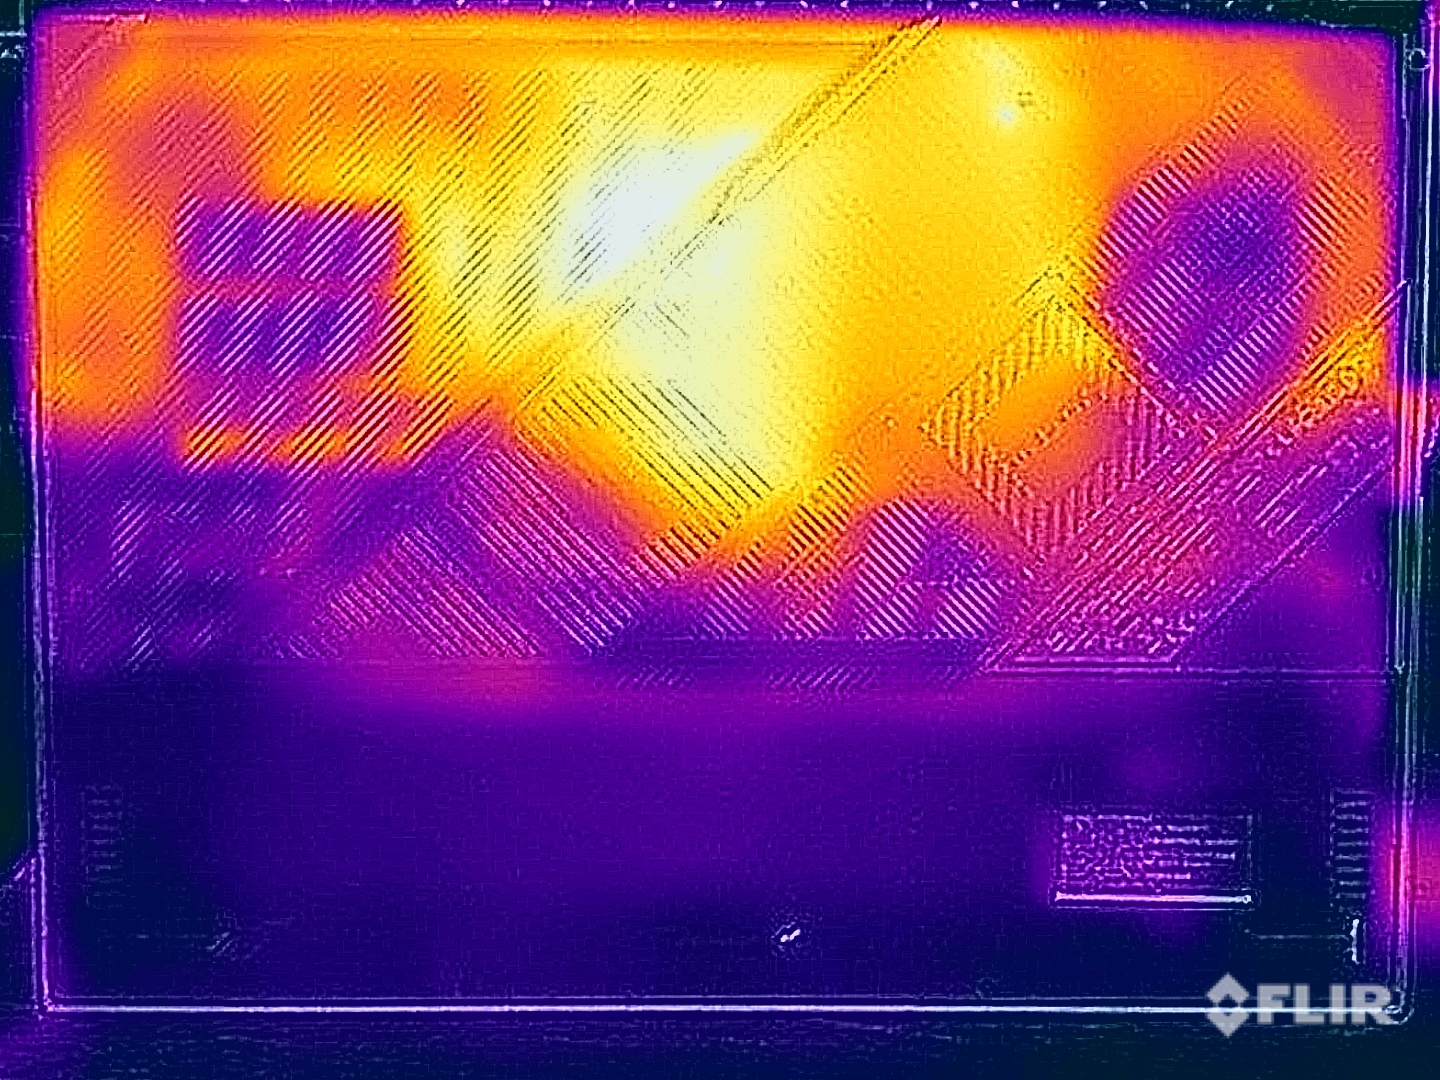
风扇转速高的一个好处是表面温度低。在压力测试中,我们甚至测得最高温度为 43°C,因此没有任何限制。在压力测试中,CPU/GPU 分别稳定在 45 瓦(65°C)和 100 瓦(72°C)。
(±) The maximum temperature on the upper side is 42.8 °C / 109 F, compared to the average of 40.4 °C / 105 F, ranging from 21.2 to 68.8 °C for the class Gaming.
(±) The bottom heats up to a maximum of 43.1 °C / 110 F, compared to the average of 43.2 °C / 110 F
(+) In idle usage, the average temperature for the upper side is 25.4 °C / 78 F, compared to the device average of 33.9 °C / 93 F.
(±) 3: The average temperature for the upper side is 32.3 °C / 90 F, compared to the average of 33.9 °C / 93 F for the class Gaming.
(+) The palmrests and touchpad are cooler than skin temperature with a maximum of 26.8 °C / 80.2 F and are therefore cool to the touch.
(±) The average temperature of the palmrest area of similar devices was 28.8 °C / 83.8 F (+2 °C / 3.6 F).
| Asus ROG Strix G18 2025 G814 AMD Ryzen 9 9955HX, NVIDIA GeForce RTX 5070 Laptop | Razer Blade 18 RTX 4070 Intel Core i9-13950HX, NVIDIA GeForce RTX 4070 Laptop GPU | MSI Crosshair A17 HX D8WGKG AMD Ryzen 9 8940HX, NVIDIA GeForce RTX 5070 Laptop | Schenker XMG Focus 17 M25 Intel Core i9-13900HX, NVIDIA GeForce RTX 5070 Ti Laptop | MSI Katana 17 HX B14WGK Intel Core i7-14650HX, NVIDIA GeForce RTX 5070 Laptop | MSI Vector A18 HX A9W AMD Ryzen 9 9955HX, NVIDIA GeForce RTX 5070 Ti Laptop | |
|---|---|---|---|---|---|---|
| Heat | -5% | -29% | -6% | -24% | -10% | |
| Maximum Upper Side * (°C) | 42.8 | 39.2 8% | 51 -19% | 41.2 4% | 52 -21% | 46.6 -9% |
| Maximum Bottom * (°C) | 43.1 | 35.6 17% | 49 -14% | 48.8 -13% | 56 -30% | 45.6 -6% |
| Idle Upper Side * (°C) | 26.8 | 31.8 -19% | 40 -49% | 27.6 -3% | 33 -23% | 31.2 -16% |
| Idle Bottom * (°C) | 26.6 | 33.2 -25% | 36 -35% | 30.1 -13% | 32 -20% | 28.6 -8% |
* ... smaller is better
发言人
立体声扬声器的效果不错,但风扇的噪音很大,尤其是在玩游戏时很烦人。
Asus ROG Strix G18 2025 G814 audio analysis
(+) | speakers can play relatively loud (83.3 dB)
Bass 100 - 315 Hz
(±) | reduced bass - on average 11% lower than median
(±) | linearity of bass is average (8.4% delta to prev. frequency)
Mids 400 - 2000 Hz
(+) | balanced mids - only 4.4% away from median
(+) | mids are linear (3.1% delta to prev. frequency)
Highs 2 - 16 kHz
(+) | balanced highs - only 2.7% away from median
(+) | highs are linear (4.8% delta to prev. frequency)
Overall 100 - 16.000 Hz
(+) | overall sound is linear (12.1% difference to median)
Compared to same class
» 12% of all tested devices in this class were better, 4% similar, 84% worse
» The best had a delta of 6%, average was 18%, worst was 132%
Compared to all devices tested
» 9% of all tested devices were better, 2% similar, 88% worse
» The best had a delta of 4%, average was 24%, worst was 134%
Razer Blade 18 RTX 4070 audio analysis
(+) | speakers can play relatively loud (85.7 dB)
Bass 100 - 315 Hz
(±) | reduced bass - on average 7.5% lower than median
(±) | linearity of bass is average (9.2% delta to prev. frequency)
Mids 400 - 2000 Hz
(+) | balanced mids - only 3.5% away from median
(+) | mids are linear (4.1% delta to prev. frequency)
Highs 2 - 16 kHz
(+) | balanced highs - only 4.8% away from median
(+) | highs are linear (3.8% delta to prev. frequency)
Overall 100 - 16.000 Hz
(+) | overall sound is linear (9.2% difference to median)
Compared to same class
» 3% of all tested devices in this class were better, 1% similar, 95% worse
» The best had a delta of 6%, average was 18%, worst was 132%
Compared to all devices tested
» 3% of all tested devices were better, 1% similar, 96% worse
» The best had a delta of 4%, average was 24%, worst was 134%
MSI Crosshair A17 HX D8WGKG audio analysis
(±) | speaker loudness is average but good (81 dB)
Bass 100 - 315 Hz
(-) | nearly no bass - on average 18% lower than median
(±) | linearity of bass is average (12.4% delta to prev. frequency)
Mids 400 - 2000 Hz
(±) | higher mids - on average 6.6% higher than median
(±) | linearity of mids is average (7% delta to prev. frequency)
Highs 2 - 16 kHz
(+) | balanced highs - only 3% away from median
(+) | highs are linear (5.1% delta to prev. frequency)
Overall 100 - 16.000 Hz
(±) | linearity of overall sound is average (17.8% difference to median)
Compared to same class
» 53% of all tested devices in this class were better, 10% similar, 37% worse
» The best had a delta of 6%, average was 18%, worst was 132%
Compared to all devices tested
» 36% of all tested devices were better, 8% similar, 56% worse
» The best had a delta of 4%, average was 24%, worst was 134%
Schenker XMG Focus 17 M25 audio analysis
(±) | speaker loudness is average but good (78.5 dB)
Bass 100 - 315 Hz
(-) | nearly no bass - on average 21.9% lower than median
(±) | linearity of bass is average (13.4% delta to prev. frequency)
Mids 400 - 2000 Hz
(+) | balanced mids - only 2.8% away from median
(±) | linearity of mids is average (7.3% delta to prev. frequency)
Highs 2 - 16 kHz
(+) | balanced highs - only 3.9% away from median
(+) | highs are linear (5.8% delta to prev. frequency)
Overall 100 - 16.000 Hz
(±) | linearity of overall sound is average (18.8% difference to median)
Compared to same class
» 62% of all tested devices in this class were better, 8% similar, 30% worse
» The best had a delta of 6%, average was 18%, worst was 132%
Compared to all devices tested
» 43% of all tested devices were better, 8% similar, 49% worse
» The best had a delta of 4%, average was 24%, worst was 134%
MSI Katana 17 HX B14WGK audio analysis
(+) | speakers can play relatively loud (84 dB)
Bass 100 - 315 Hz
(-) | nearly no bass - on average 19% lower than median
(±) | linearity of bass is average (10.6% delta to prev. frequency)
Mids 400 - 2000 Hz
(±) | higher mids - on average 8.7% higher than median
(±) | linearity of mids is average (7.5% delta to prev. frequency)
Highs 2 - 16 kHz
(+) | balanced highs - only 4.6% away from median
(±) | linearity of highs is average (9.7% delta to prev. frequency)
Overall 100 - 16.000 Hz
(±) | linearity of overall sound is average (20.6% difference to median)
Compared to same class
» 74% of all tested devices in this class were better, 5% similar, 21% worse
» The best had a delta of 6%, average was 18%, worst was 132%
Compared to all devices tested
» 55% of all tested devices were better, 8% similar, 37% worse
» The best had a delta of 4%, average was 24%, worst was 134%
MSI Vector A18 HX A9W audio analysis
(+) | speakers can play relatively loud (86.2 dB)
Bass 100 - 315 Hz
(-) | nearly no bass - on average 16% lower than median
(±) | linearity of bass is average (10.9% delta to prev. frequency)
Mids 400 - 2000 Hz
(±) | higher mids - on average 5.7% higher than median
(±) | linearity of mids is average (7.2% delta to prev. frequency)
Highs 2 - 16 kHz
(+) | balanced highs - only 3.3% away from median
(+) | highs are linear (6.8% delta to prev. frequency)
Overall 100 - 16.000 Hz
(+) | overall sound is linear (13.5% difference to median)
Compared to same class
» 19% of all tested devices in this class were better, 7% similar, 73% worse
» The best had a delta of 6%, average was 18%, worst was 132%
Compared to all devices tested
» 14% of all tested devices were better, 4% similar, 82% worse
» The best had a delta of 4%, average was 24%, worst was 134%
耗电量
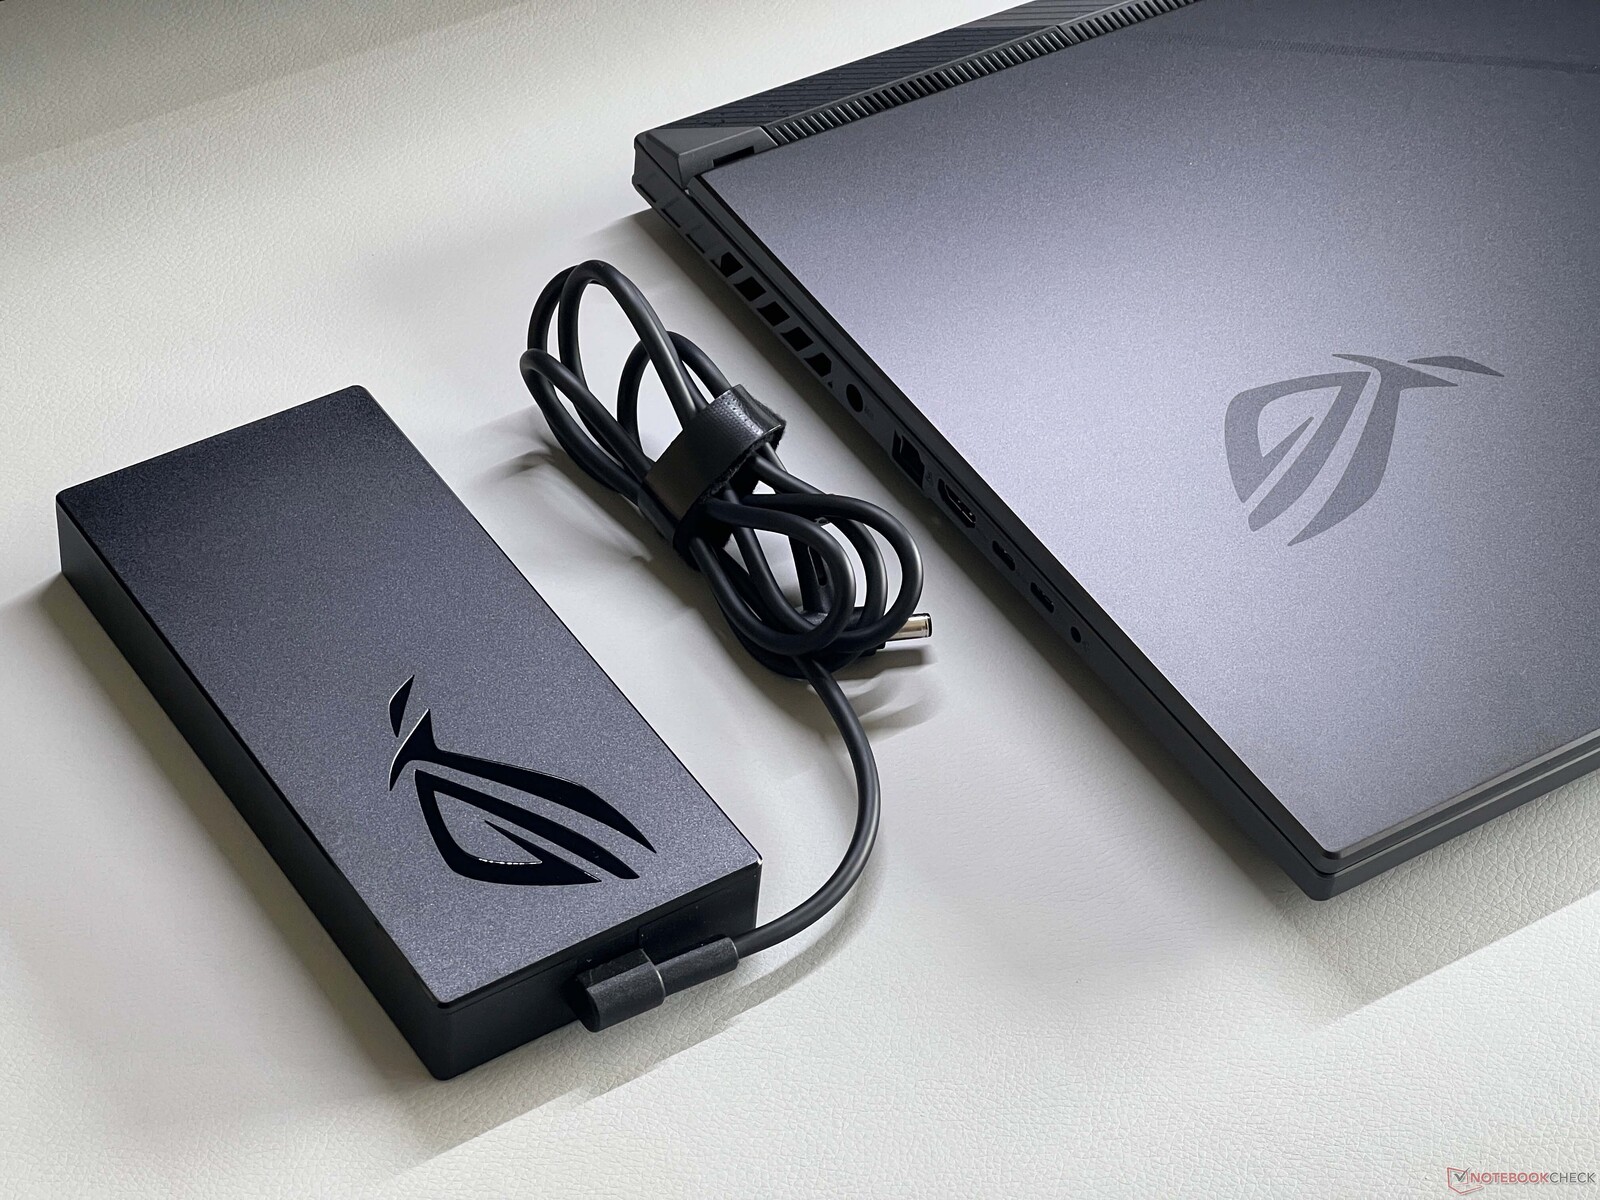
在功耗方面没有任何惊喜。我们在空闲时测得的最大功耗为 21 瓦,在压力测试期间曾短暂达到 249 瓦,随后很快降至 193 瓦左右。因此,附带的 280 瓦电源完全够用。
| Off / Standby | |
| Idle | |
| Load |
|
Key:
min: | |
| Asus ROG Strix G18 2025 G814 GeForce RTX 5070 Laptop, R9 9955HX, Micron 2500 1TB MTFDKBA1T0QGN | Razer Blade 18 RTX 4070 GeForce RTX 4070 Laptop GPU, i9-13950HX, SSSTC CA6-8D1024 | MSI Crosshair A17 HX D8WGKG GeForce RTX 5070 Laptop, R9 8940HX, Samsung PM9C1 MZVL81T0HELB-00BTW | Schenker XMG Focus 17 M25 GeForce RTX 5070 Ti Laptop, i9-13900HX, Kingston Fury Renegade SFYRS500G | MSI Katana 17 HX B14WGK GeForce RTX 5070 Laptop, i7-14650HX, Micron 2500 1TB MTFDKBA1T0QGN | MSI Vector A18 HX A9W GeForce RTX 5070 Ti Laptop, R9 9955HX | |
|---|---|---|---|---|---|---|
| Power Consumption | -59% | -54% | -5% | 6% | -71% | |
| Idle Minimum * (Watt) | 13.1 | 24.5 -87% | 32 -144% | 12 8% | 9.7 26% | 20.8 -59% |
| Idle Average * (Watt) | 20.6 | 34.1 -66% | 36 -75% | 17.5 15% | 15 27% | 52.8 -156% |
| Idle Maximum * (Watt) | 21.1 | 47.7 -126% | 47 -123% | 18.1 14% | 23.7 -12% | 54.5 -158% |
| Load Average * (Watt) | 123.4 | 140 -13% | 132 -7% | 121.1 2% | 126 -2% | 146.6 -19% |
| Cyberpunk 2077 ultra * (Watt) | 215 | 222 -3% | 255 -19% | 205 5% | 285 -33% | |
| Cyberpunk 2077 ultra external monitor * (Watt) | 179.2 | 216 -21% | 244 -36% | 202 -13% | 278 -55% | |
| Load Maximum * (Watt) | 249.7 | 261 -5% | 261 -5% | 292.1 -17% | 227 9% | 297.3 -19% |
| Witcher 3 ultra * (Watt) | 202 |
* ... smaller is better
Power consumption Cyberpunk / stress test
Power consumption with an external monitor
电池寿命
90 Wh 的电池提供了合理的运行时间。在 150 cd/m²(最大亮度的 39%)和 60 Hz 的 Wi-Fi 测试中,它能持续运行 7 个小时,而在全亮度条件下,大约能运行 4.5 个小时。
Notebookcheck 总体评分
Asus ROG Strix G18 2025 G814
- 08/07/2025 v8
Andreas Osthoff
 Total Sustainability Score:
 可能的替代品比较
Transparency
The selection of devices to be reviewed is made by our editorial team. The test sample was provided to the author as a loan by the manufacturer or retailer for the purpose of this review. The lender had no influence on this review, nor did the manufacturer receive a copy of this review before publication. There was no obligation to publish this review. As an independent media company, Notebookcheck is not subjected to the authority of manufacturers, retailers or publishers.
This is how Notebookcheck is testing
Every year, Notebookcheck independently reviews hundreds of laptops and smartphones using standardized procedures to ensure that all results are comparable. We have continuously developed our test methods for around 20 years and set industry standards in the process. In our test labs, high-quality measuring equipment is utilized by experienced technicians and editors. These tests involve a multi-stage validation process. Our complex rating system is based on hundreds of well-founded measurements and benchmarks, which maintains objectivity. Further information on our test methods can be found here.

