结论 - ProArt P16 现在具有 120 Hz,但 HDR 亮度较低
ProArt P16 是 ROG Zephyrus G16 的创意分支。 ROG Zephyrus G16游戏笔记本电脑,主要面向内容创作者,因为它配备了触摸屏,支持手写笔和 DialPad。它的新显示屏刷新率为 120 Hz,但分辨率比以前低,尤其是最大 HDR 亮度非常低,这一点我们在 Zephyrus G16 上已经批评过了。华硕提供了超级精确的色彩配置文件,ProArt 适合编辑图像/视频。
除了铰链略显薄弱外,这款笔记本电脑的外壳非常出色,并配备了所有重要的连接装置。它的键盘和音响系统在移动领域也是数一数二的。另一方面,它的性能没有太大变化,因为处理器是一样的,新的 RTX 5070 笔记本电脑并不比旧的 RTX 4070 笔记本电脑快多少。与 Zephyrus G16 相比,您无法选择任何更强大的 GPU--我们至少希望看到 RTX 5070 Ti 笔记本电脑.在负载情况下,它的风扇也会变得非常响。
ProArt P16 仍然是一款非常出色的多媒体笔记本电脑,但与 MacBook Pro 16在 CPU 性能、风扇控制、显示屏和电池续航时间方面的优势尤为明显。
Pros
Cons
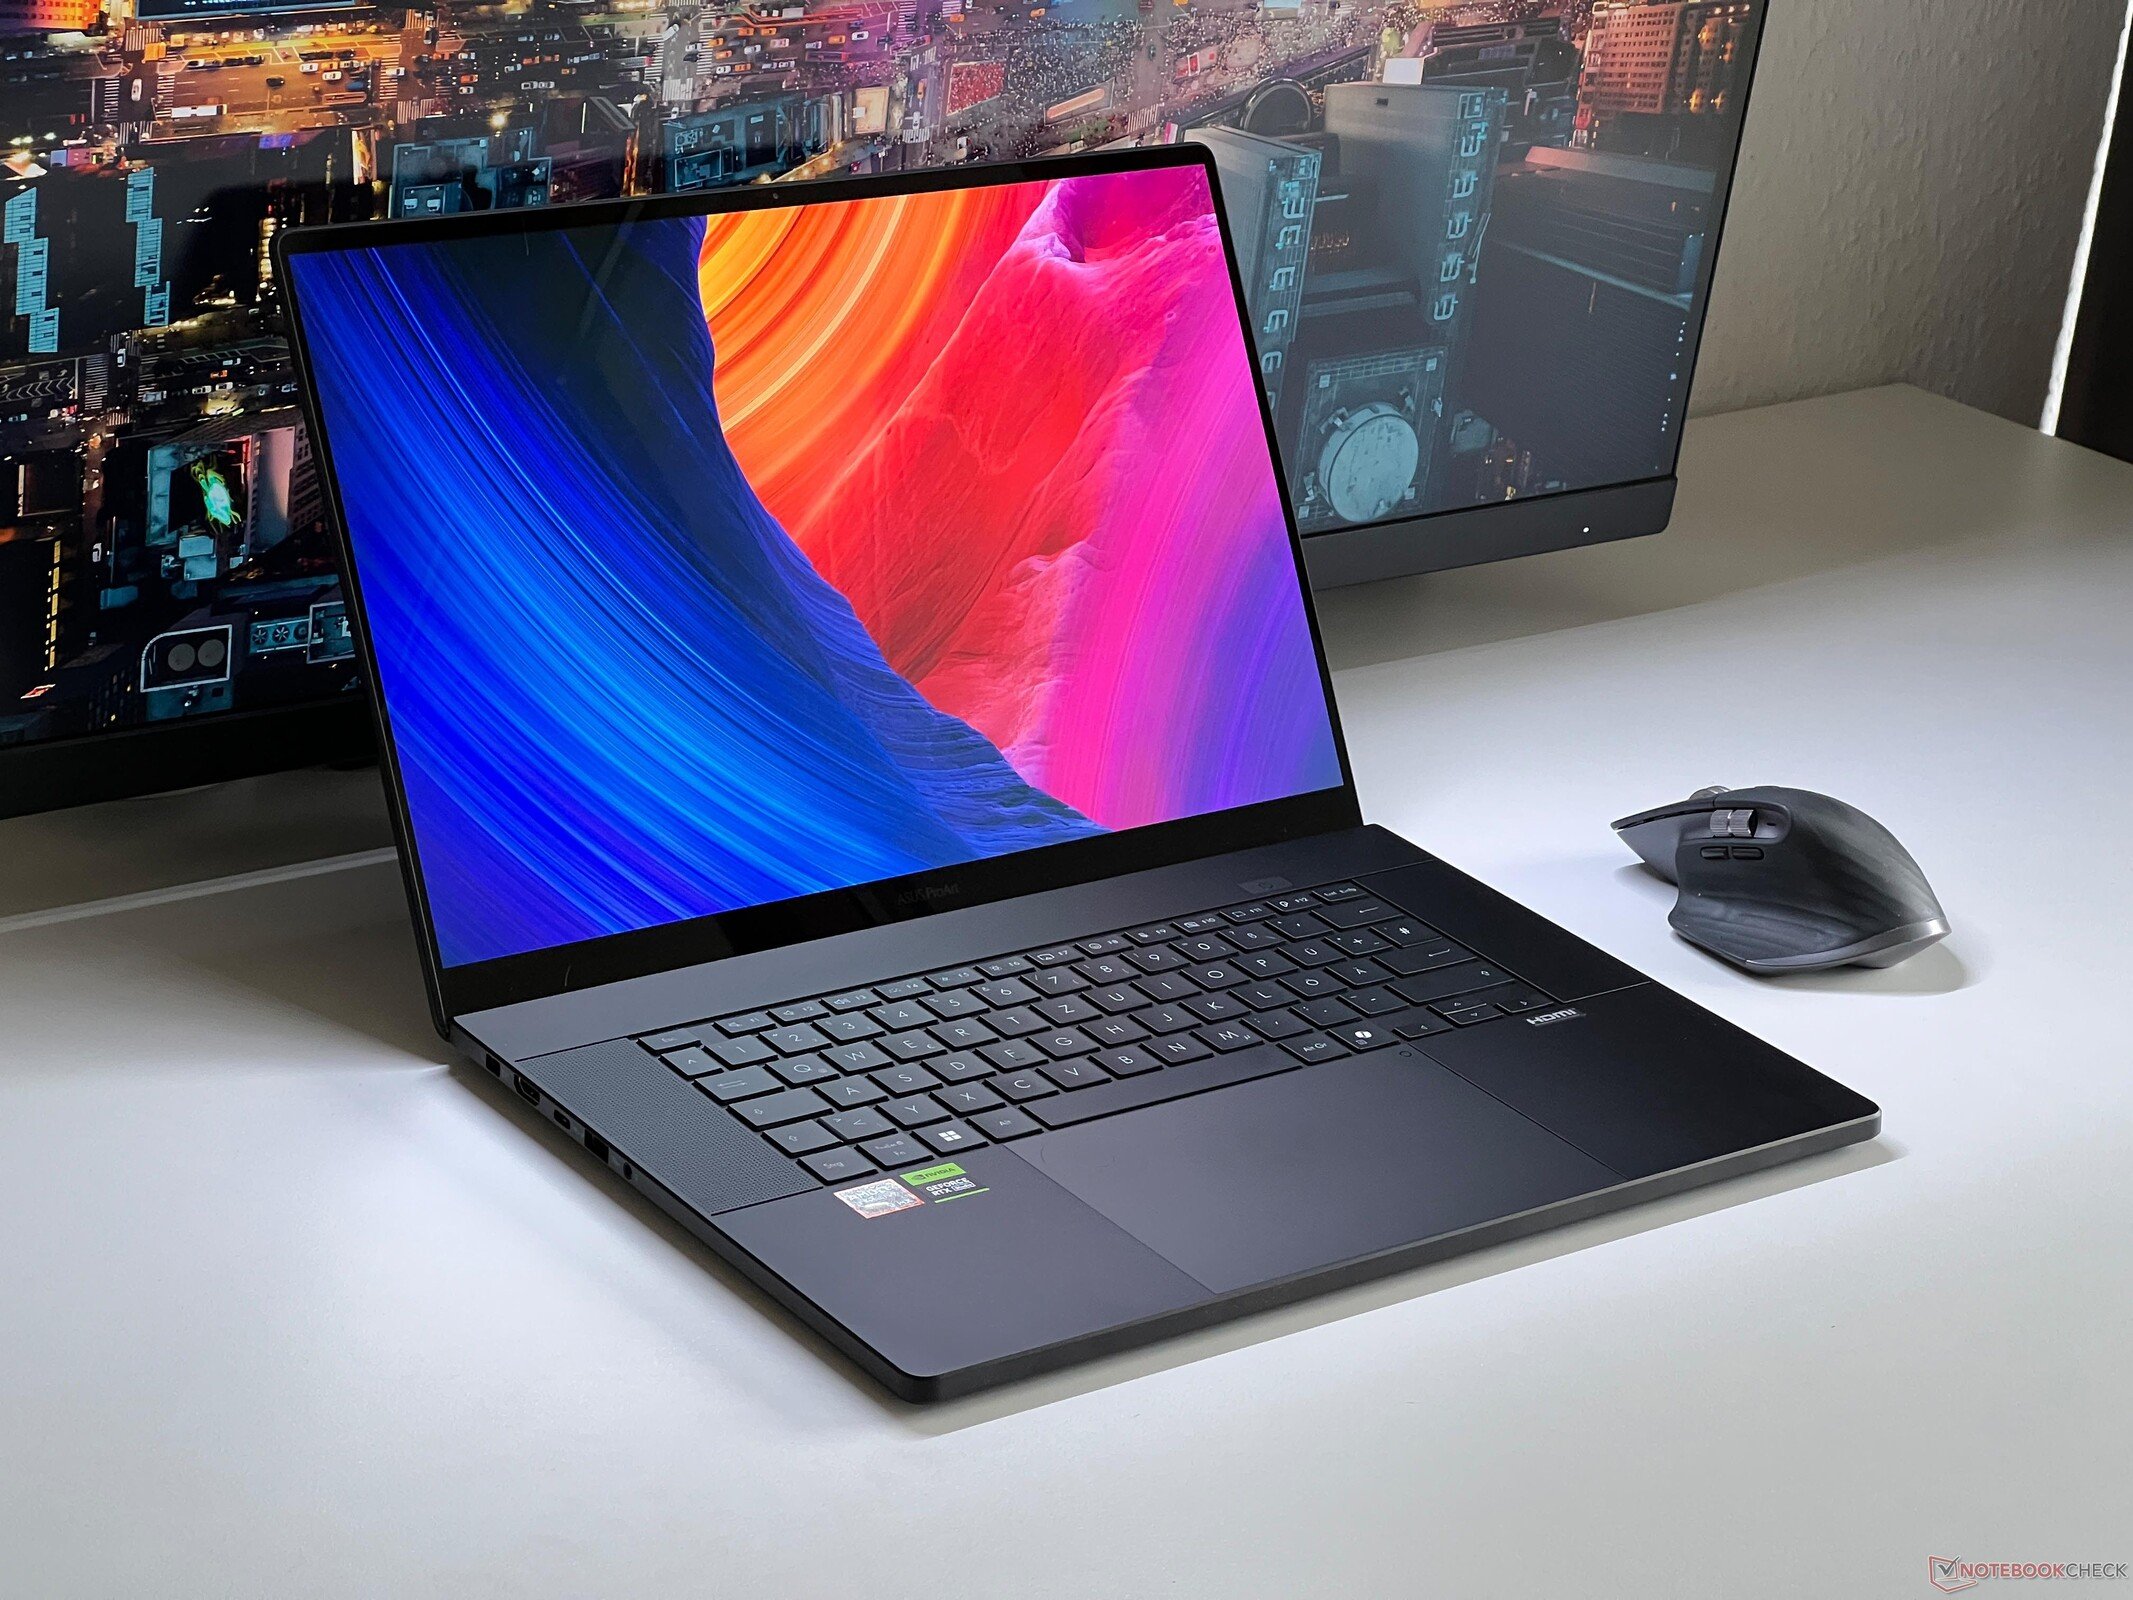
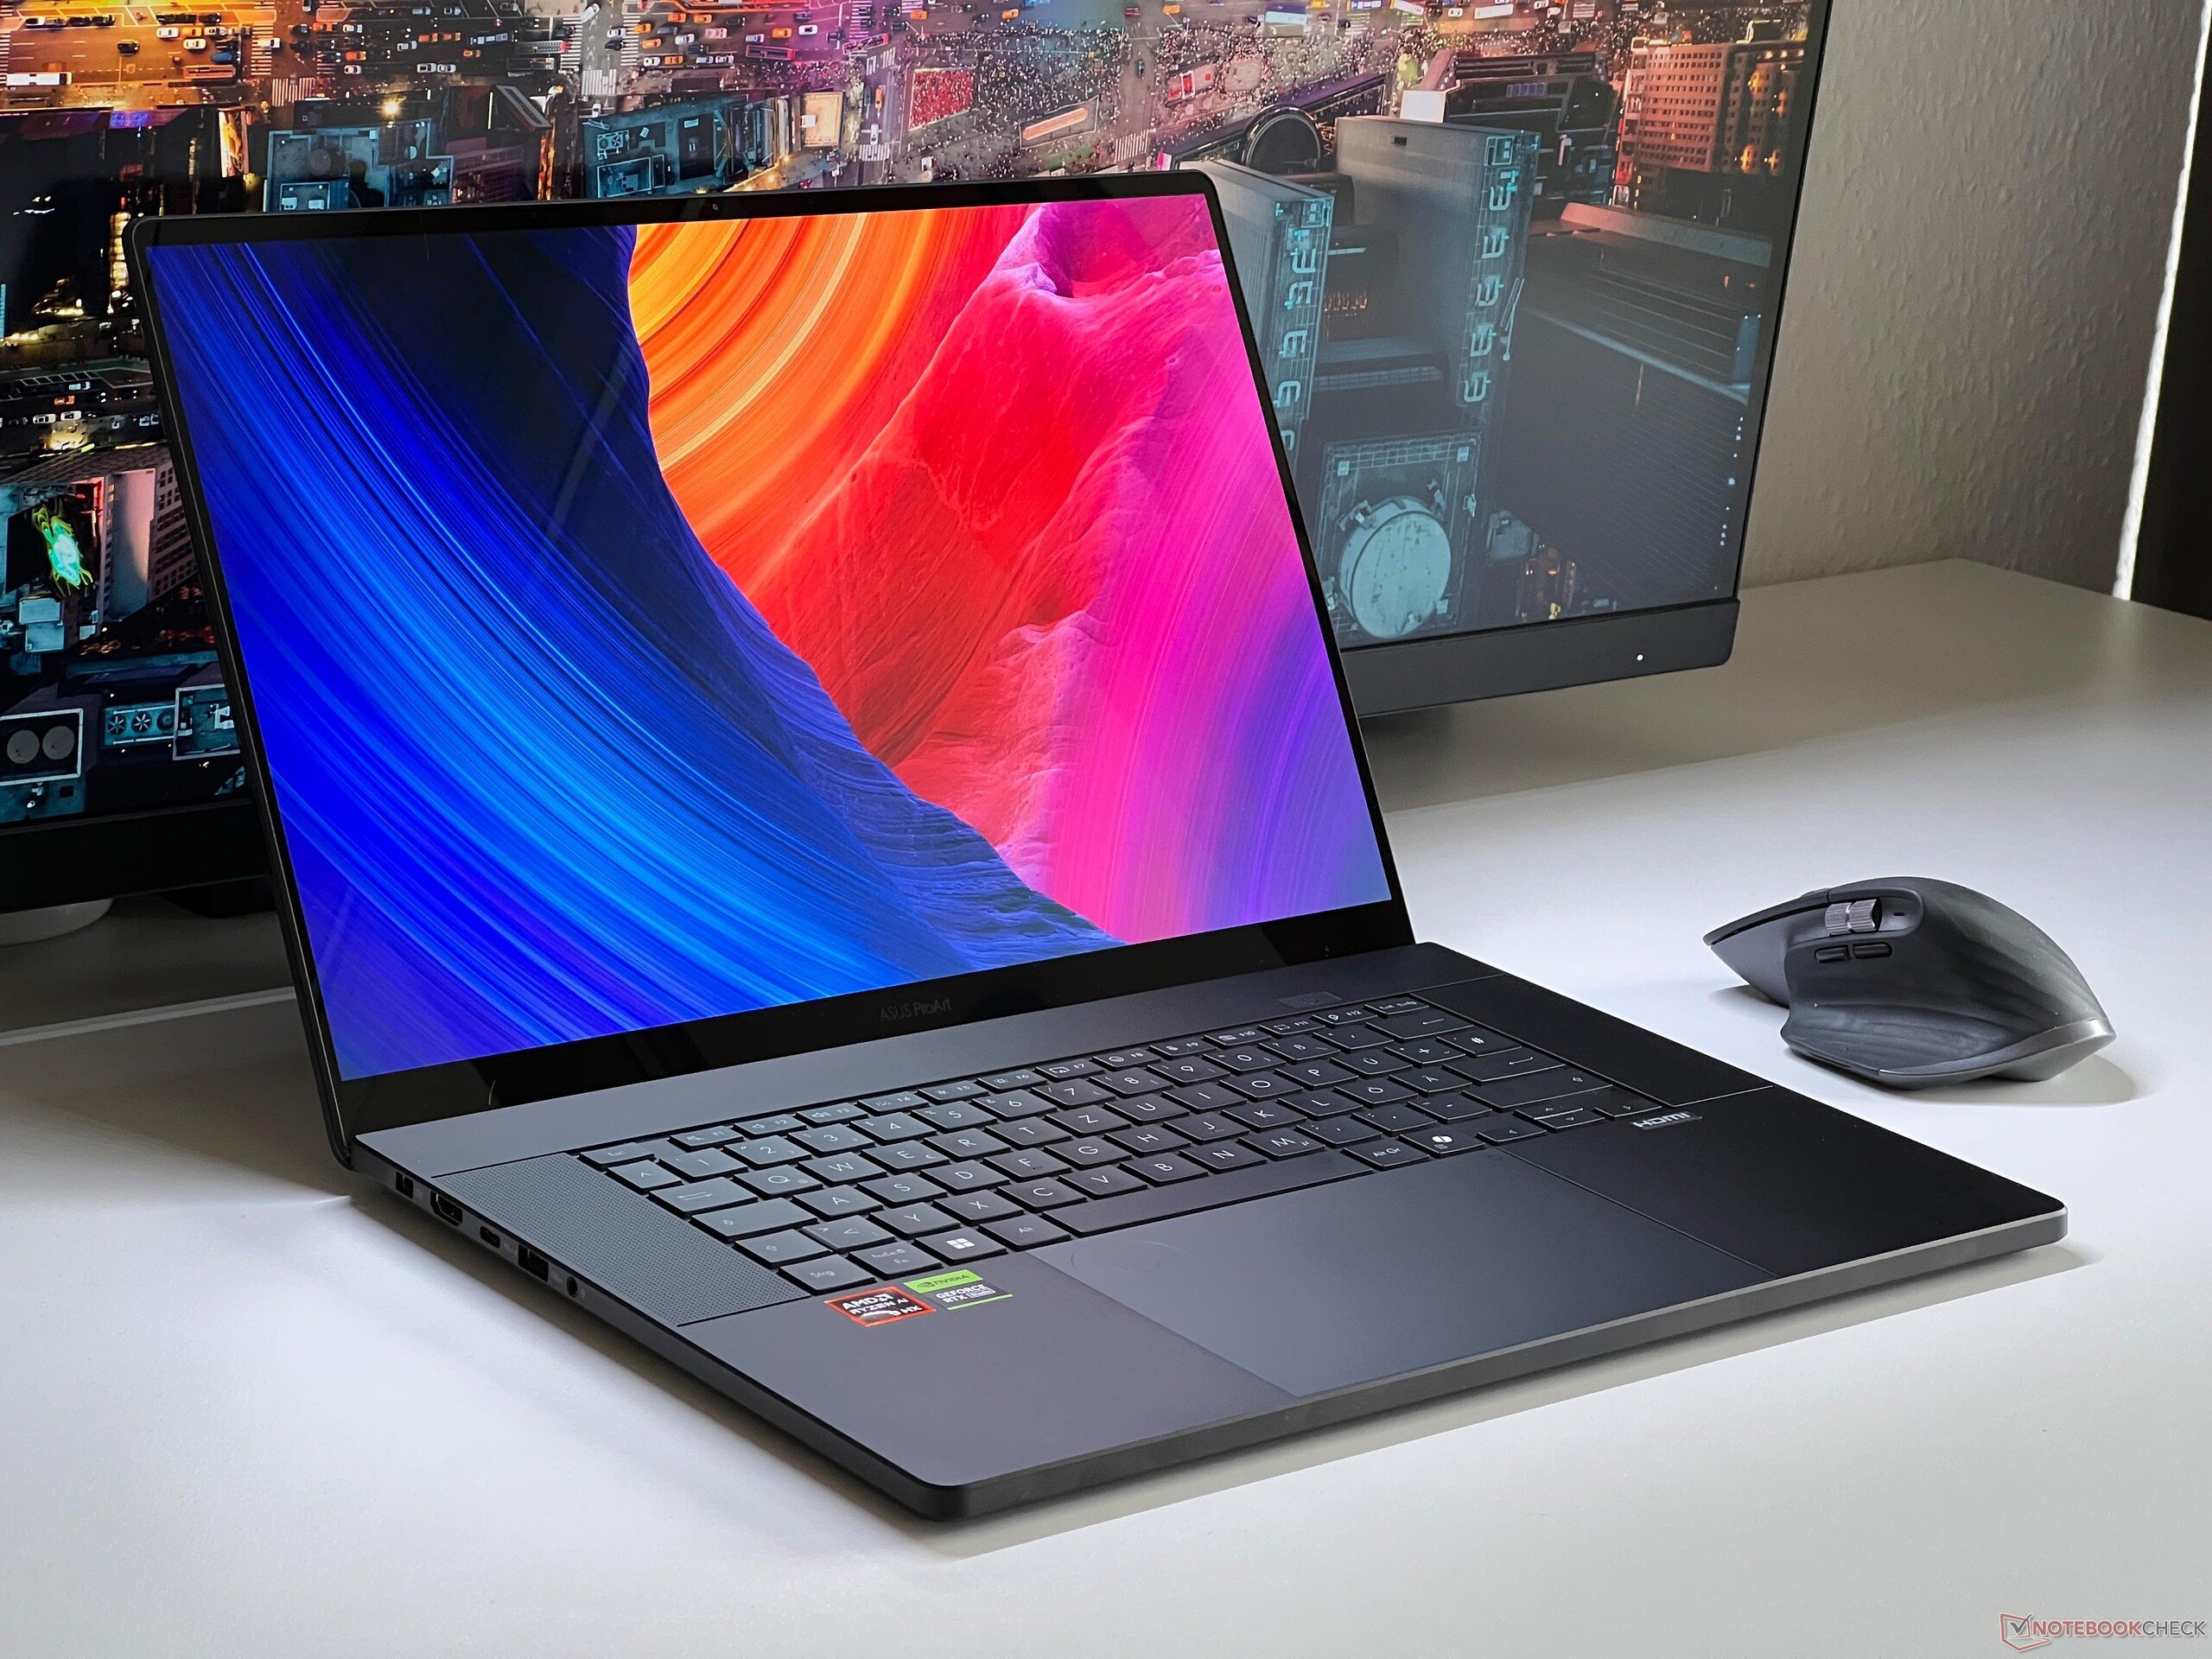
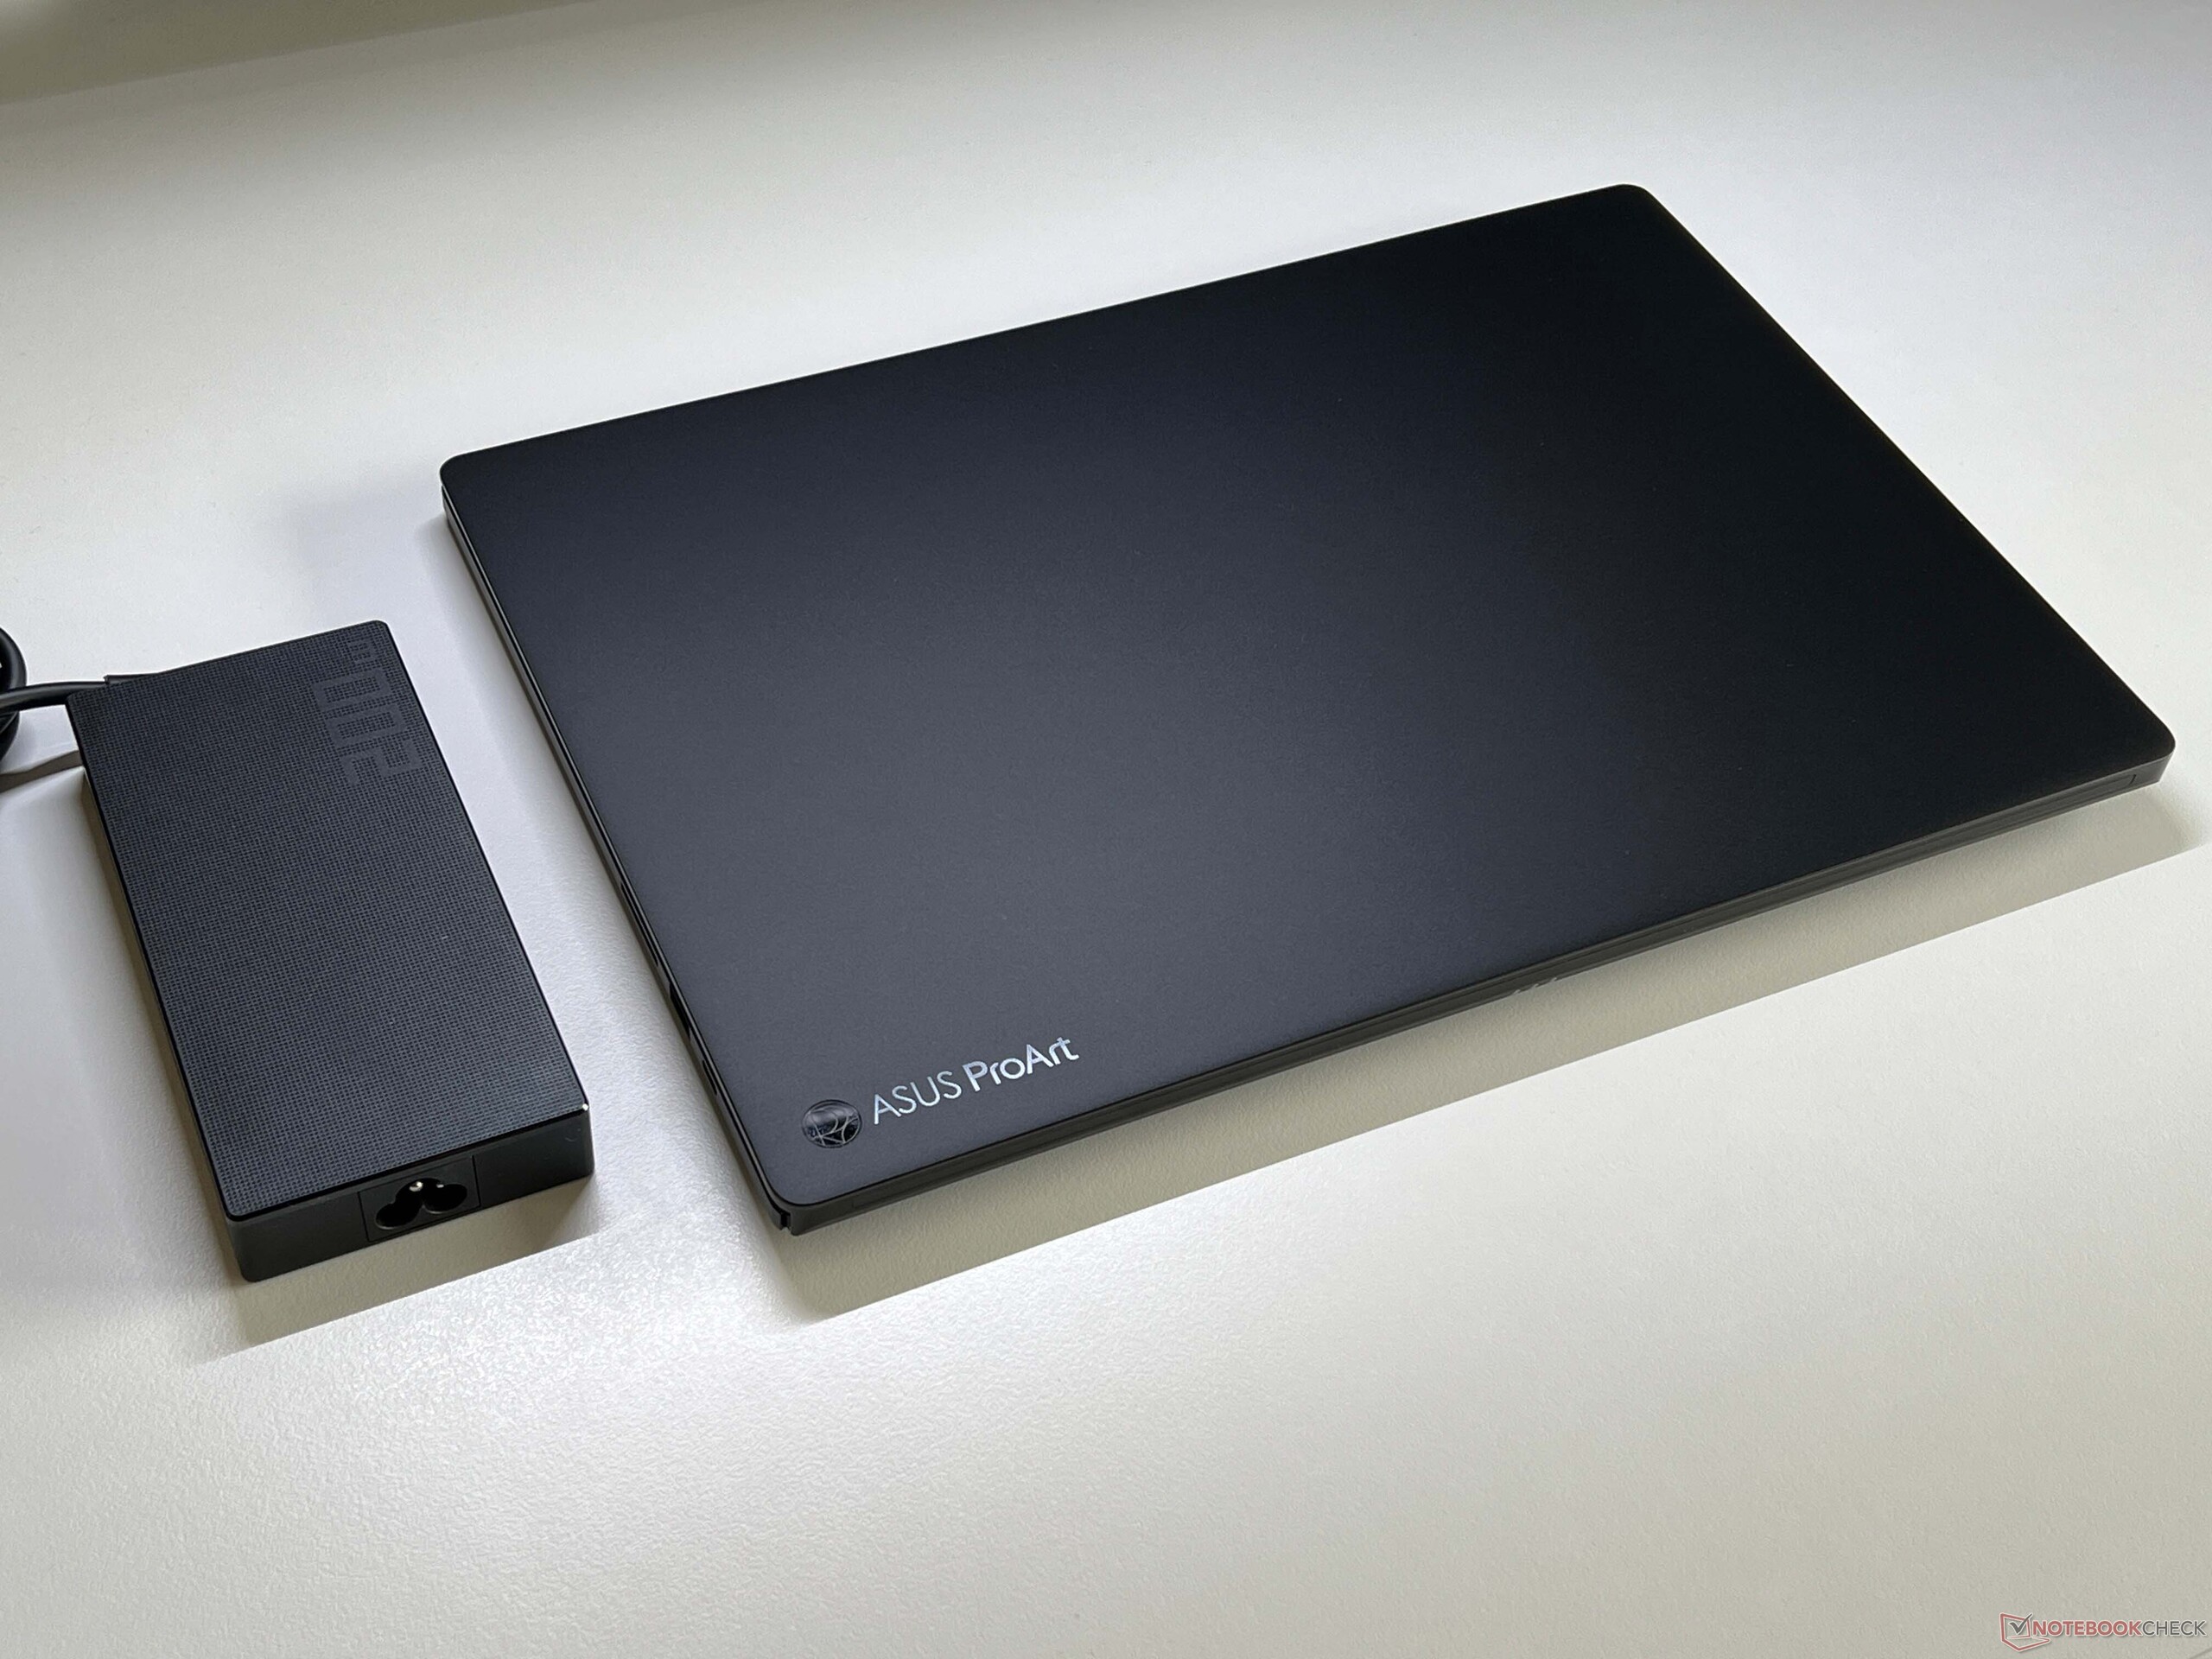
华硕更新了其 ProArt P16,虽然这款多媒体笔记本电脑保留了相同的 AMD 处理器,但现在采用了新的 RTX-5000 GPU。此外,它的 60 Hz 4K OLED 显示屏也换成了 120 Hz 2.8K OLED 面板。 ROG Zephyrus G16游戏笔记本电脑的 120 Hz 2.8K OLED 面板。我们的测试设备是配备 RTX 5070 笔记本电脑、64 GB 内存和 2 TB SSD 的高端版本,价格约为 3860 美元。
规格
外壳和连接
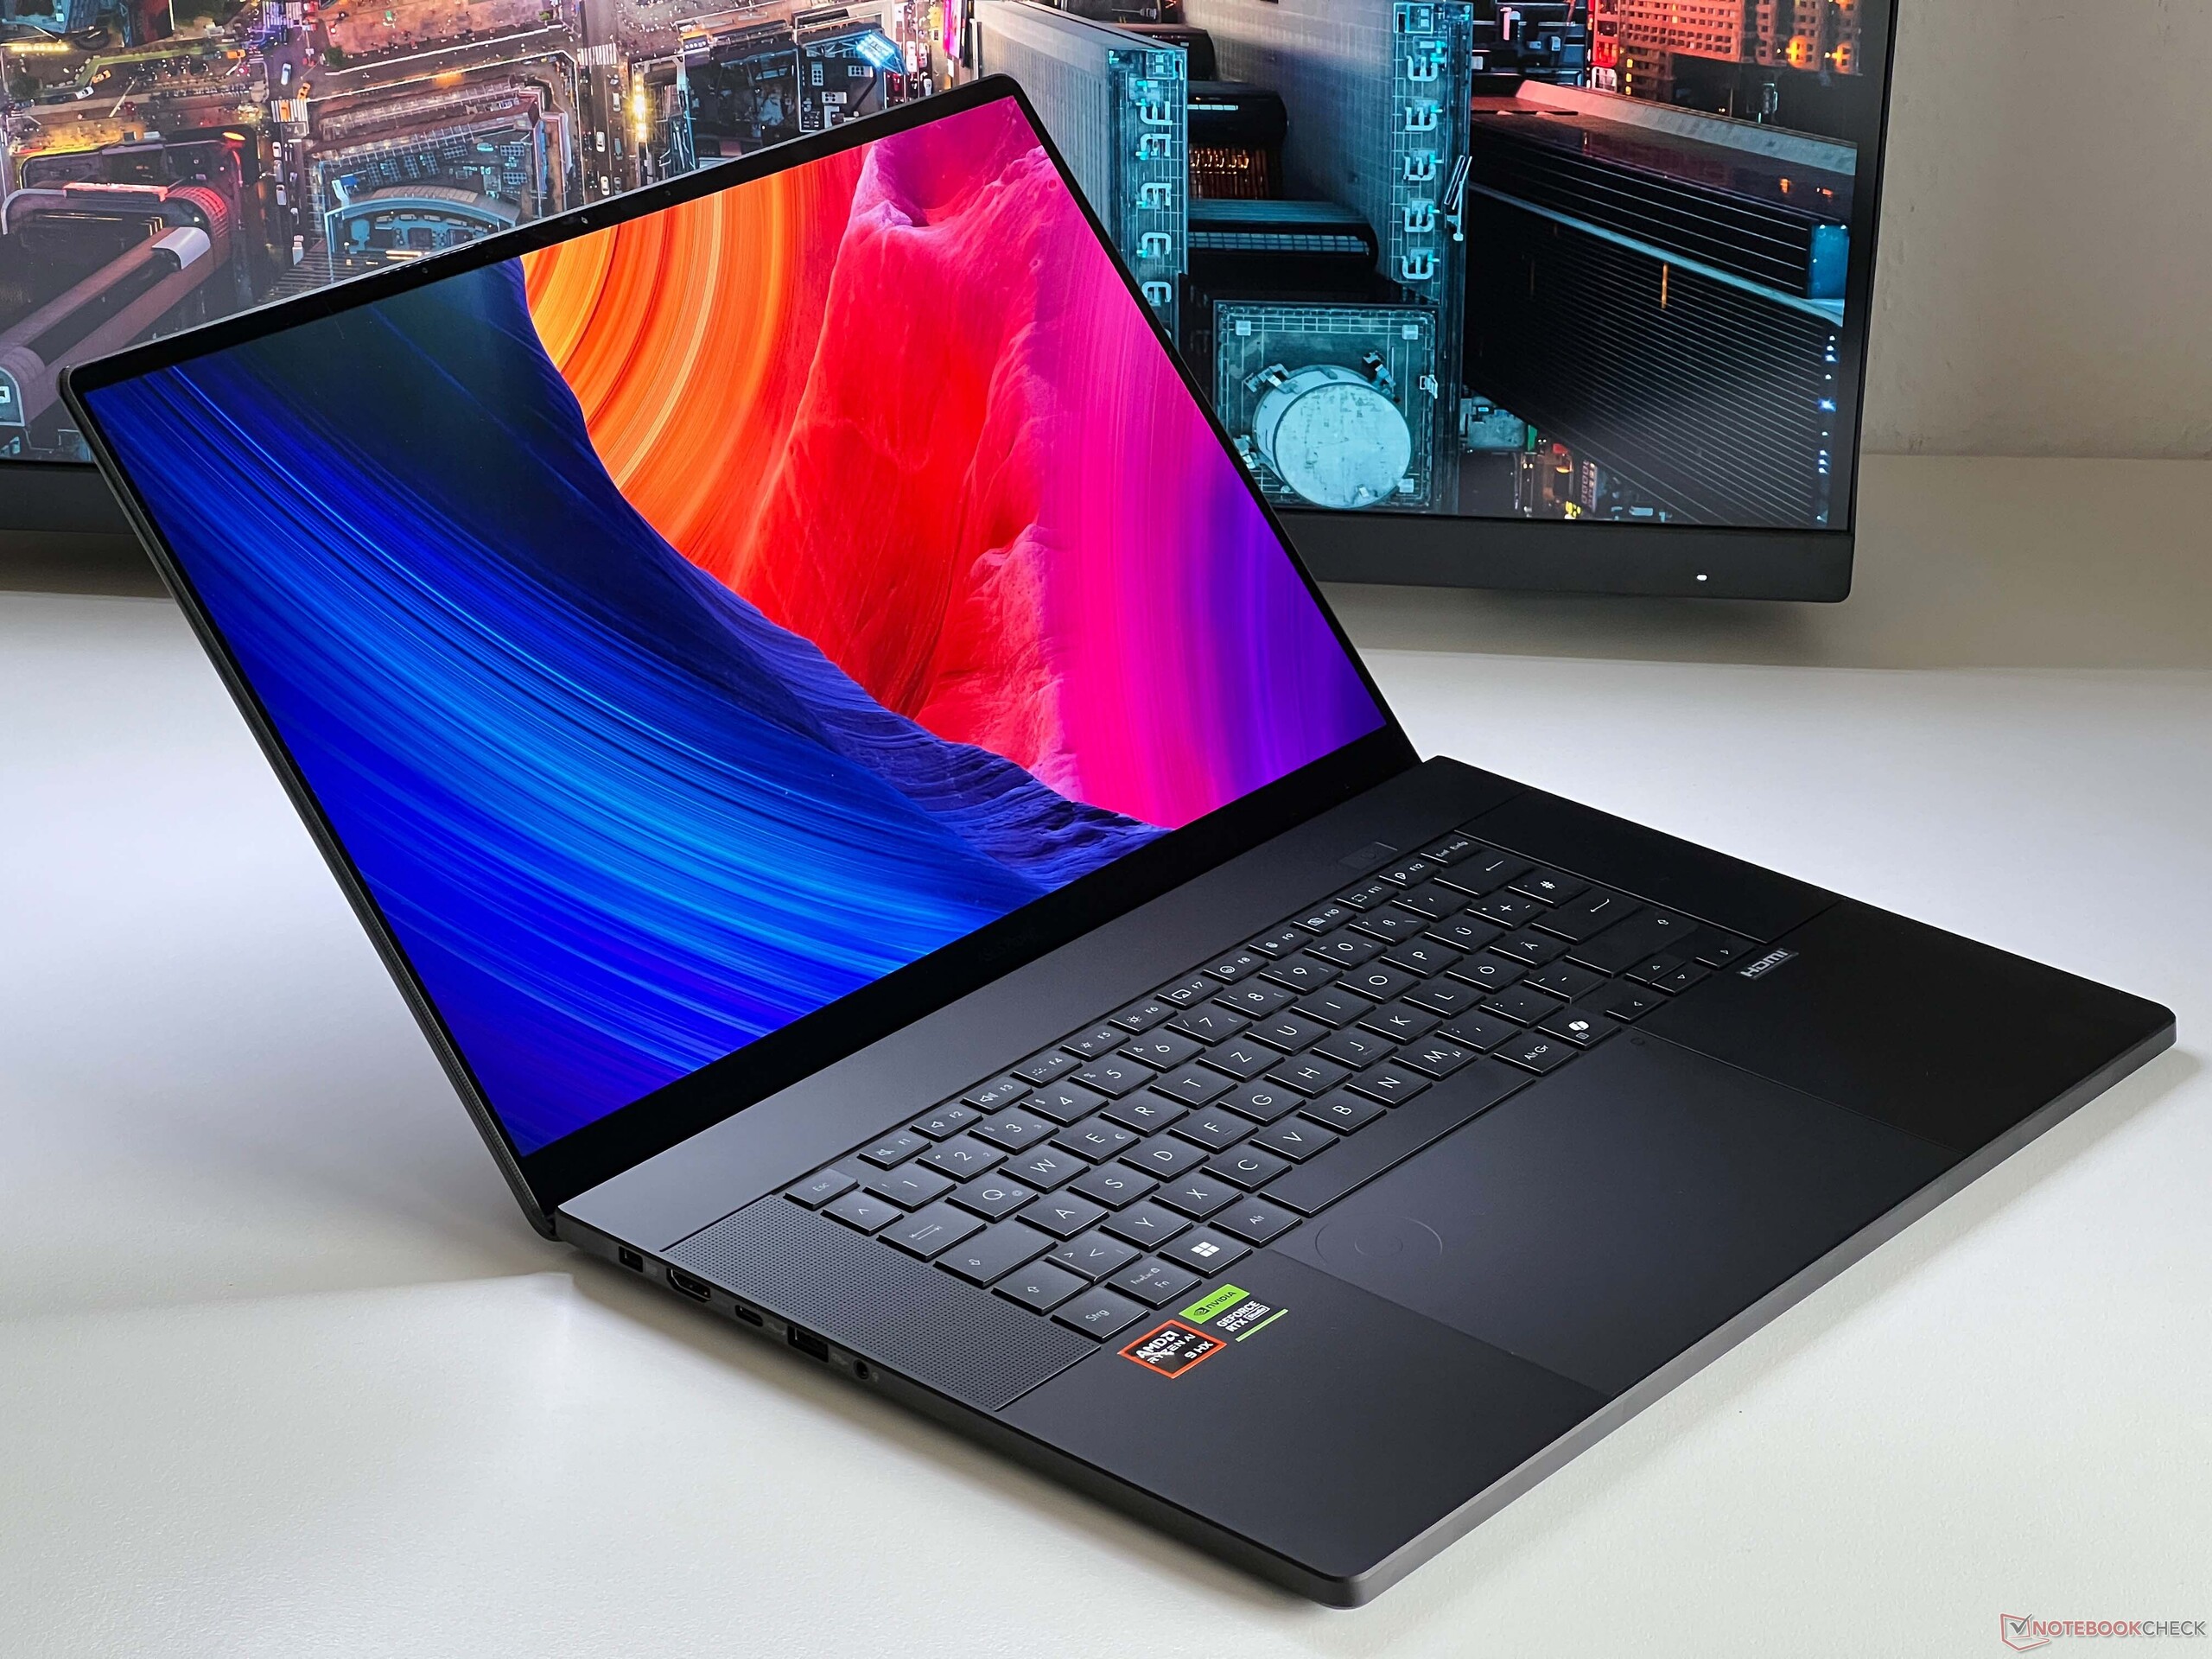
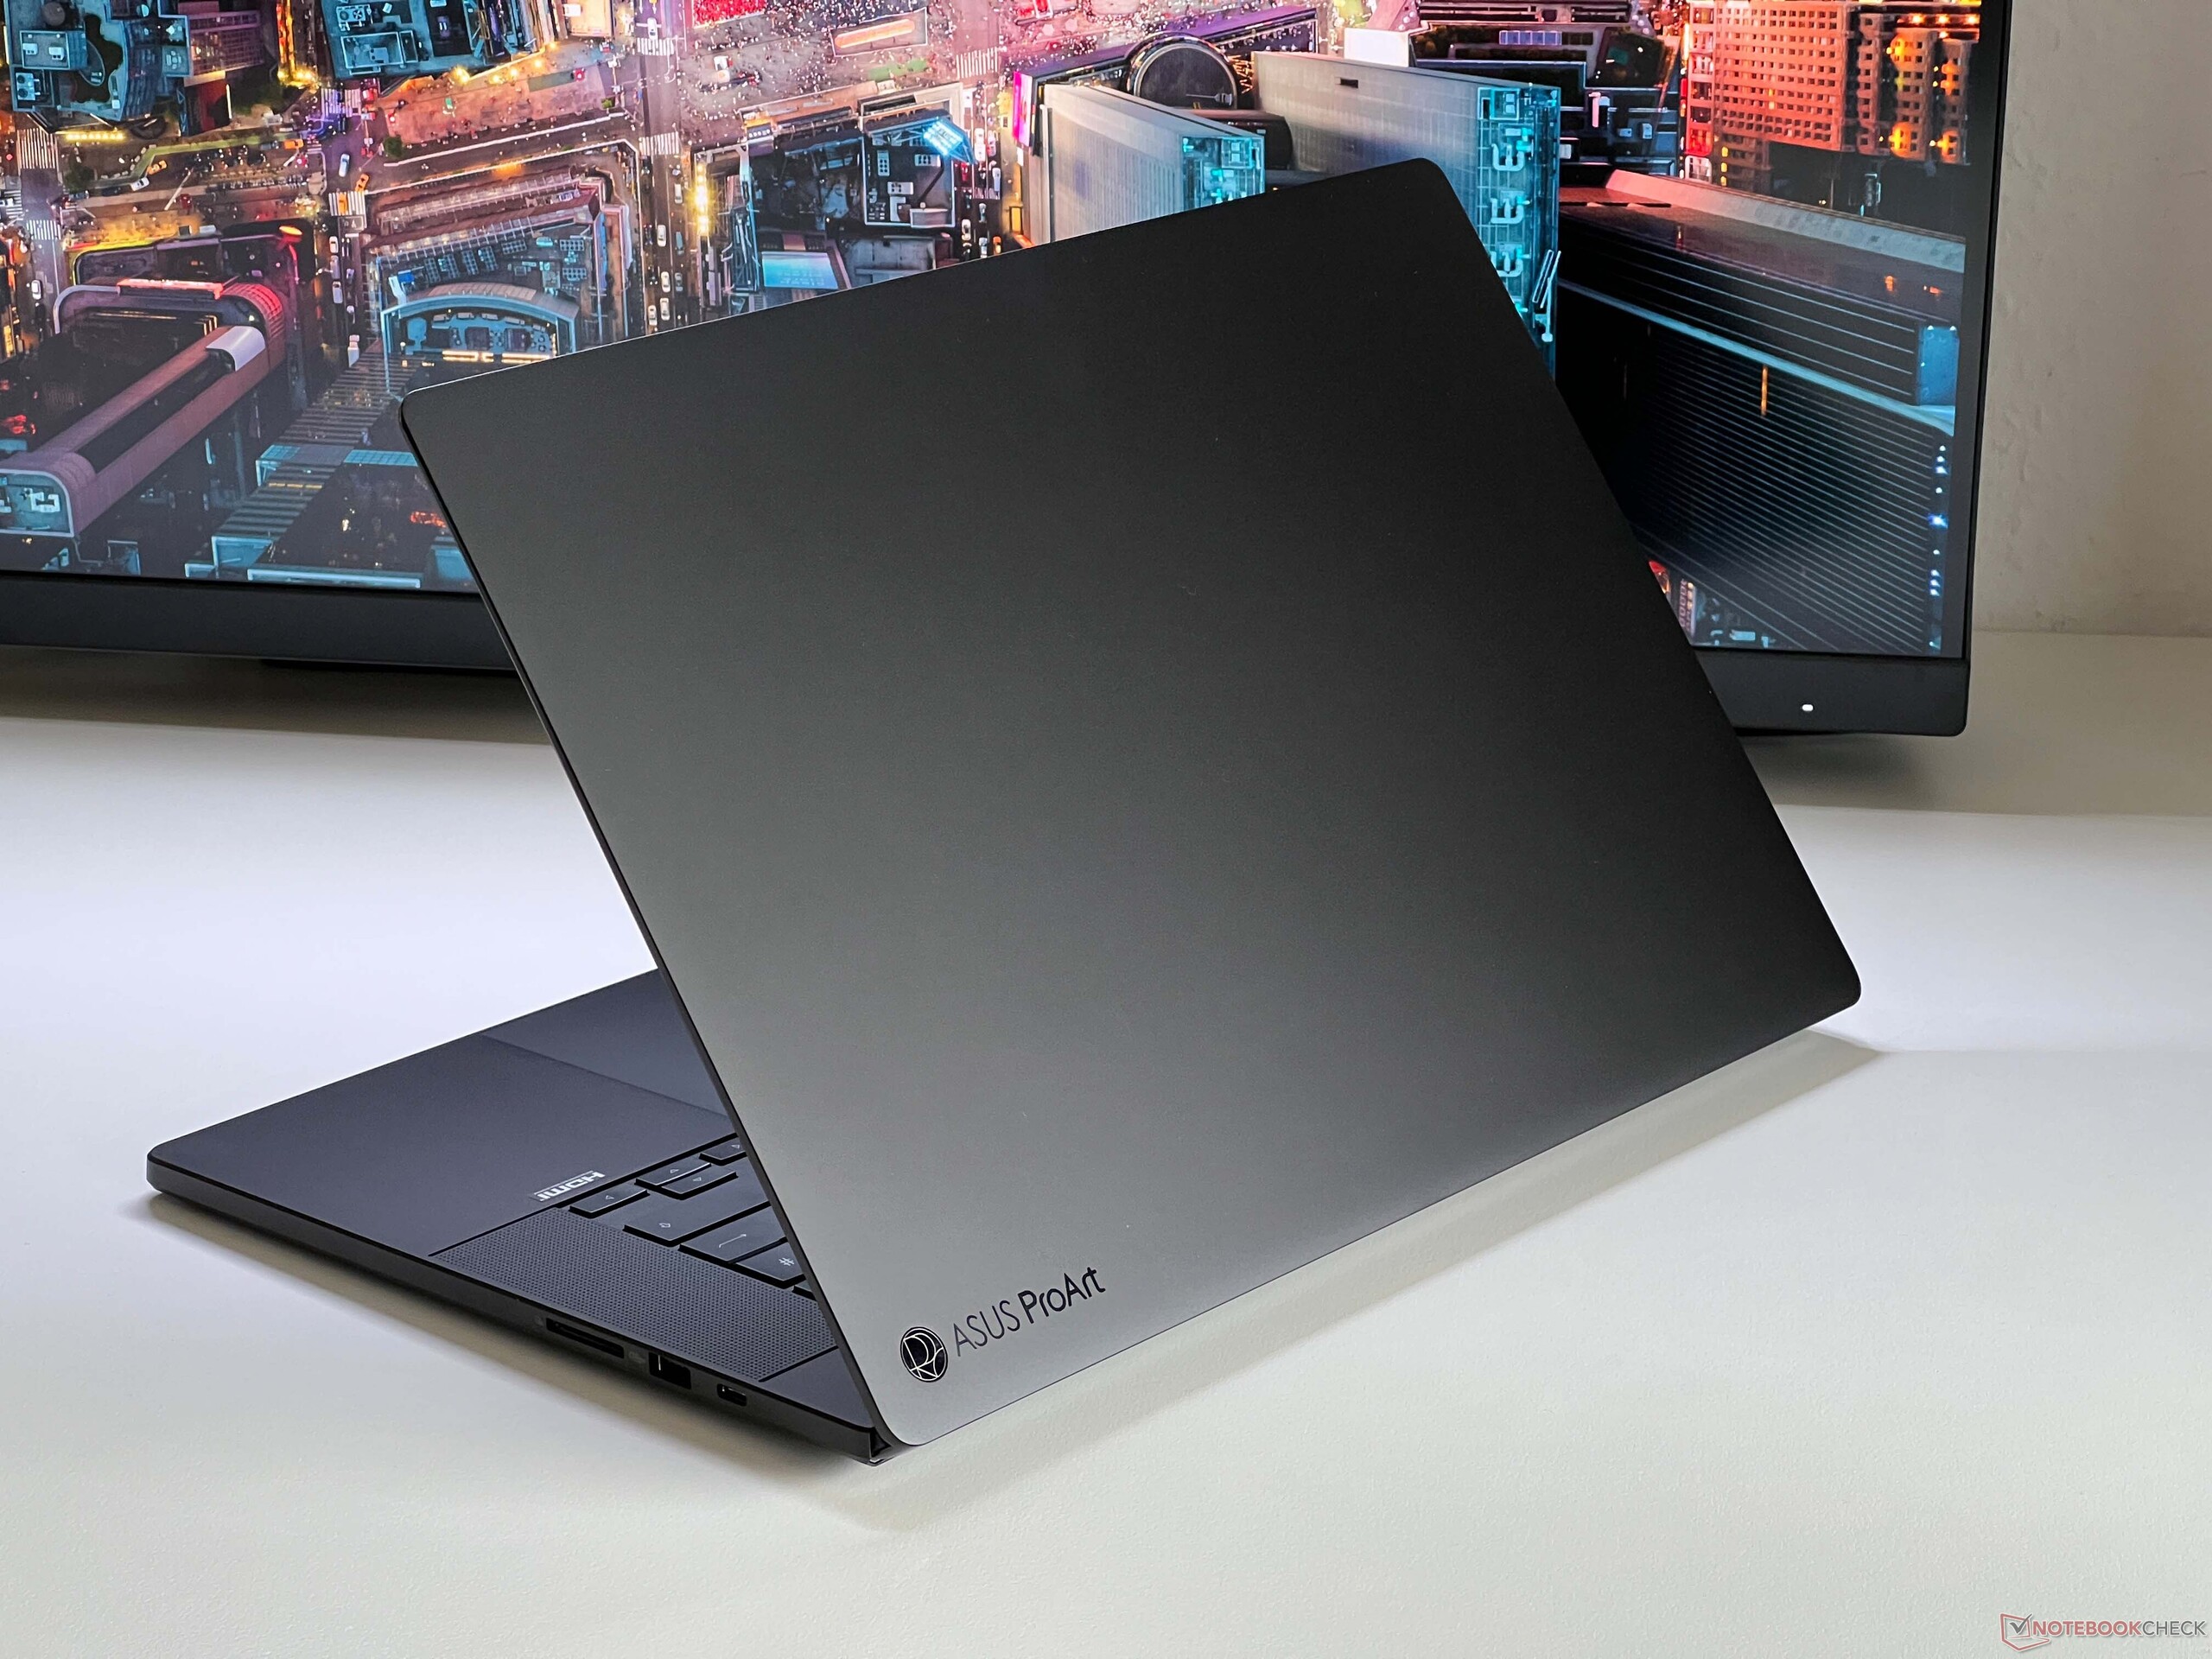
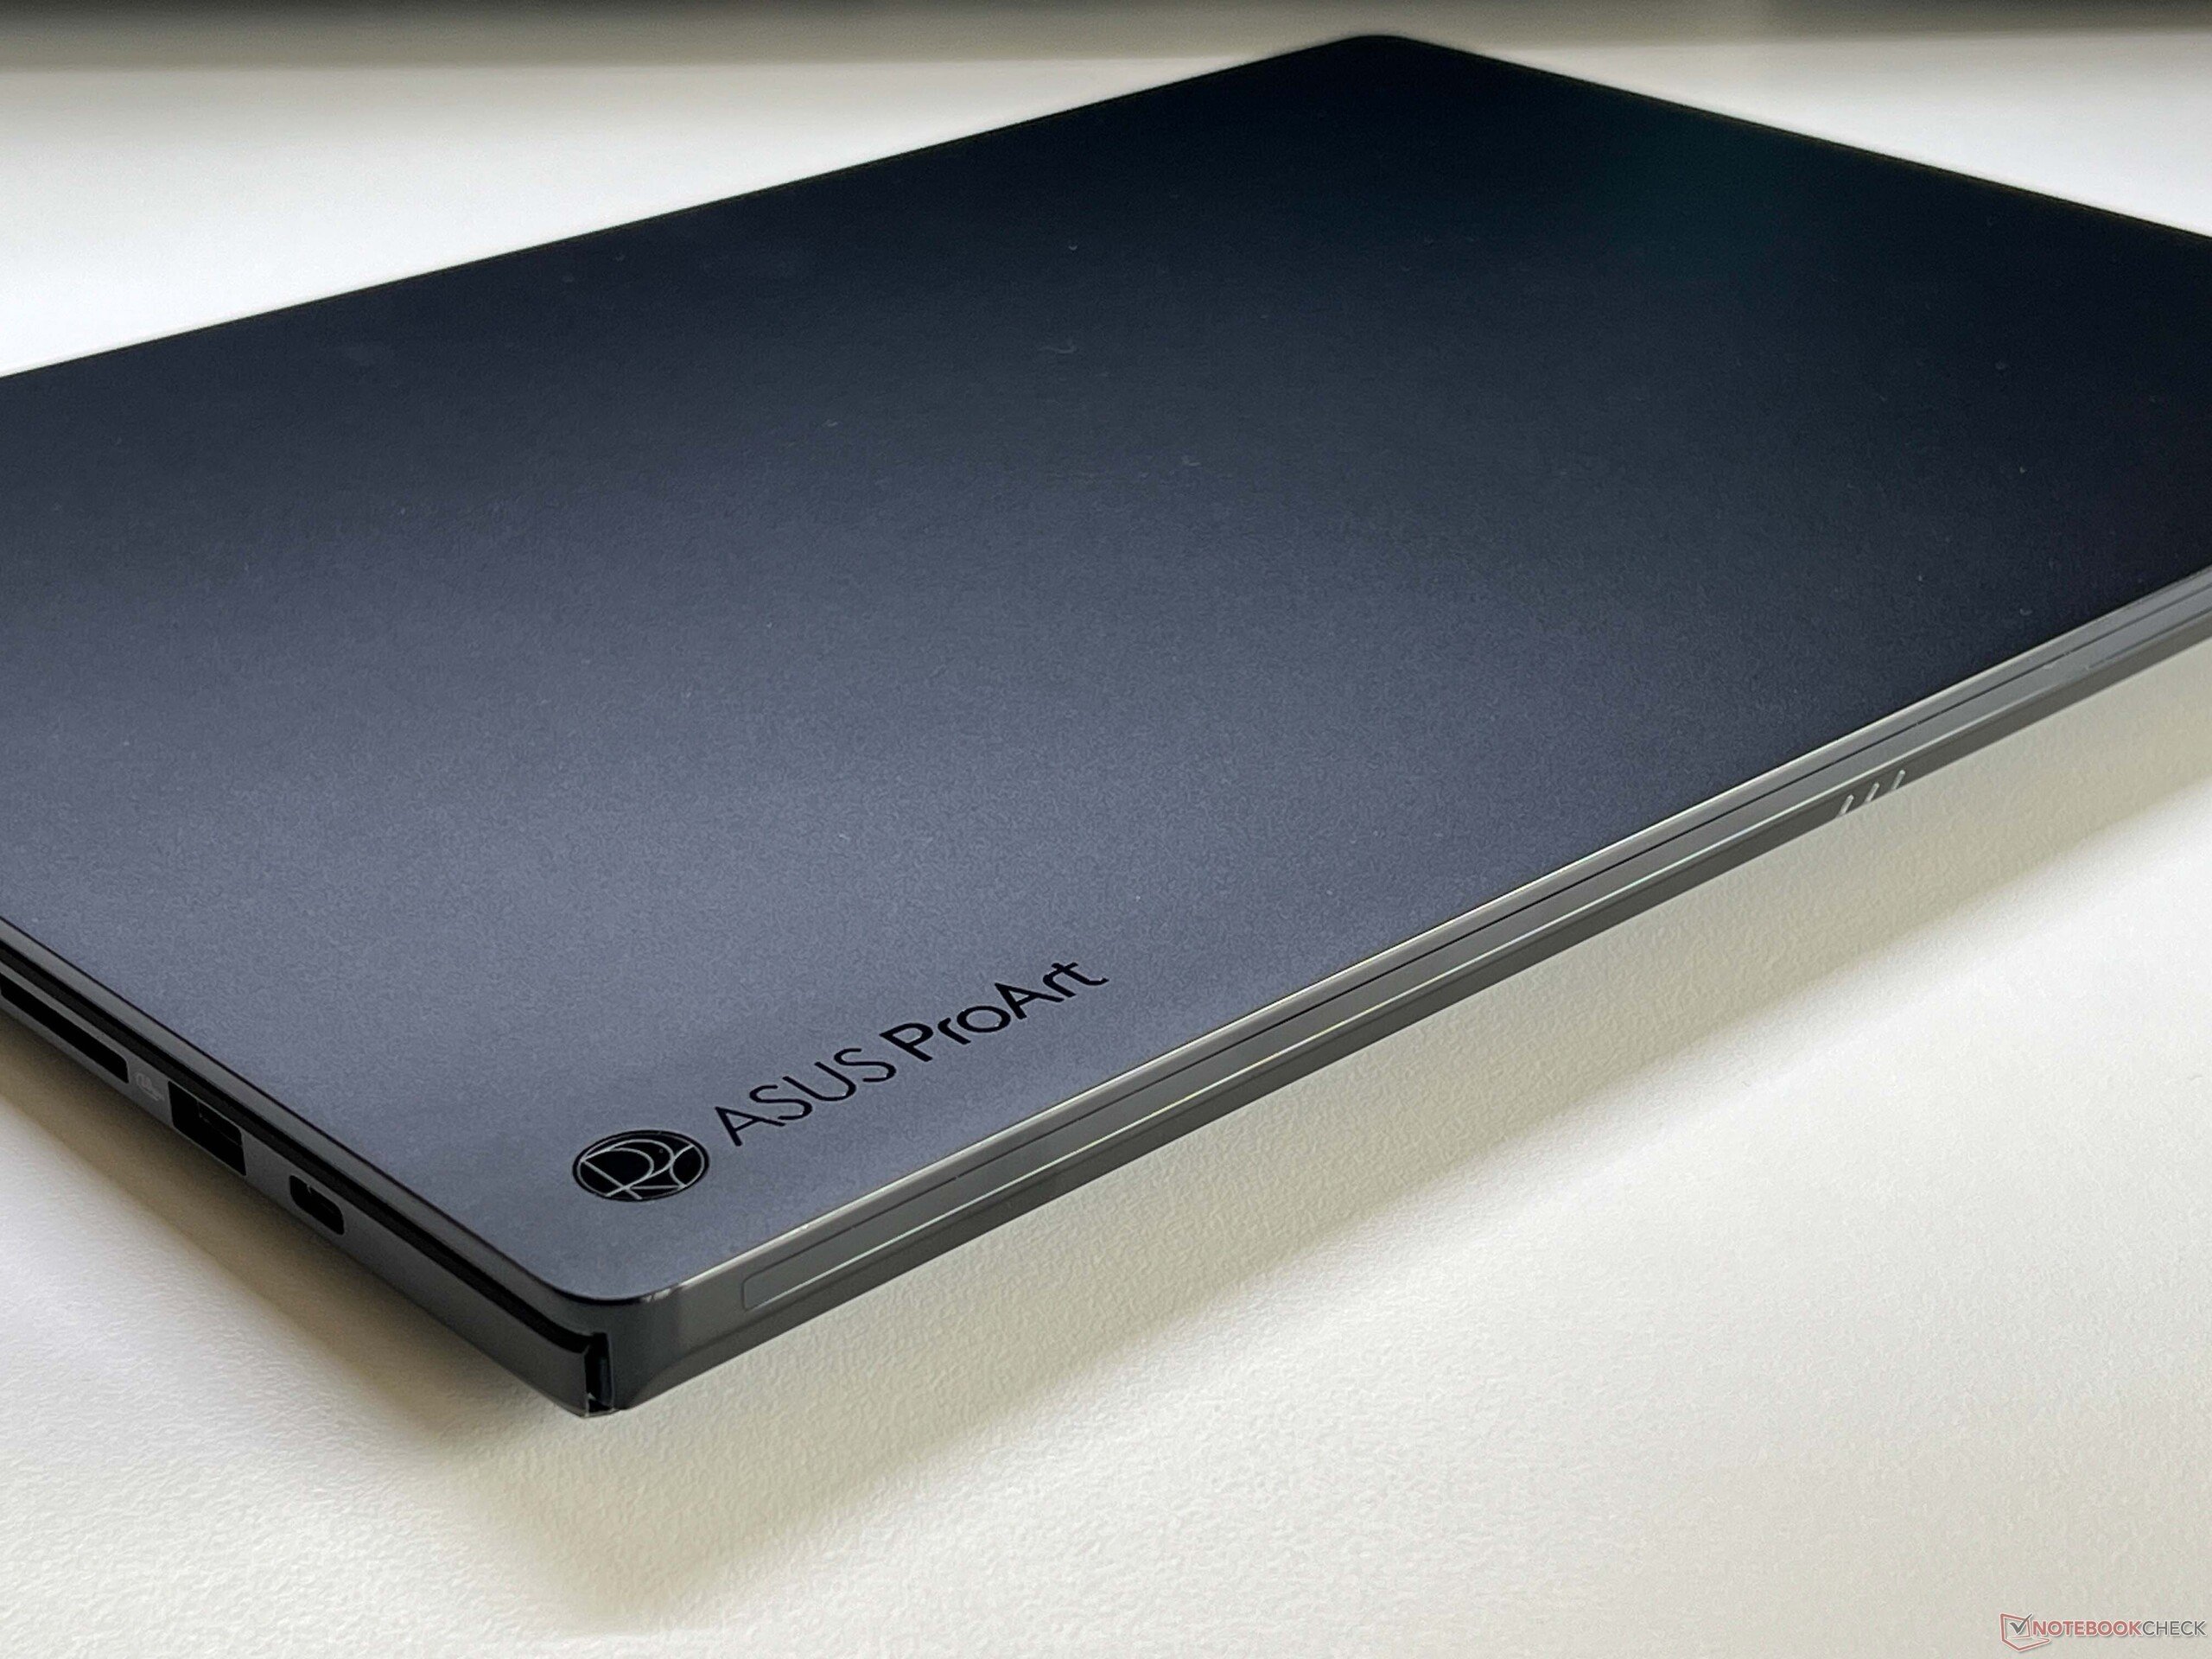
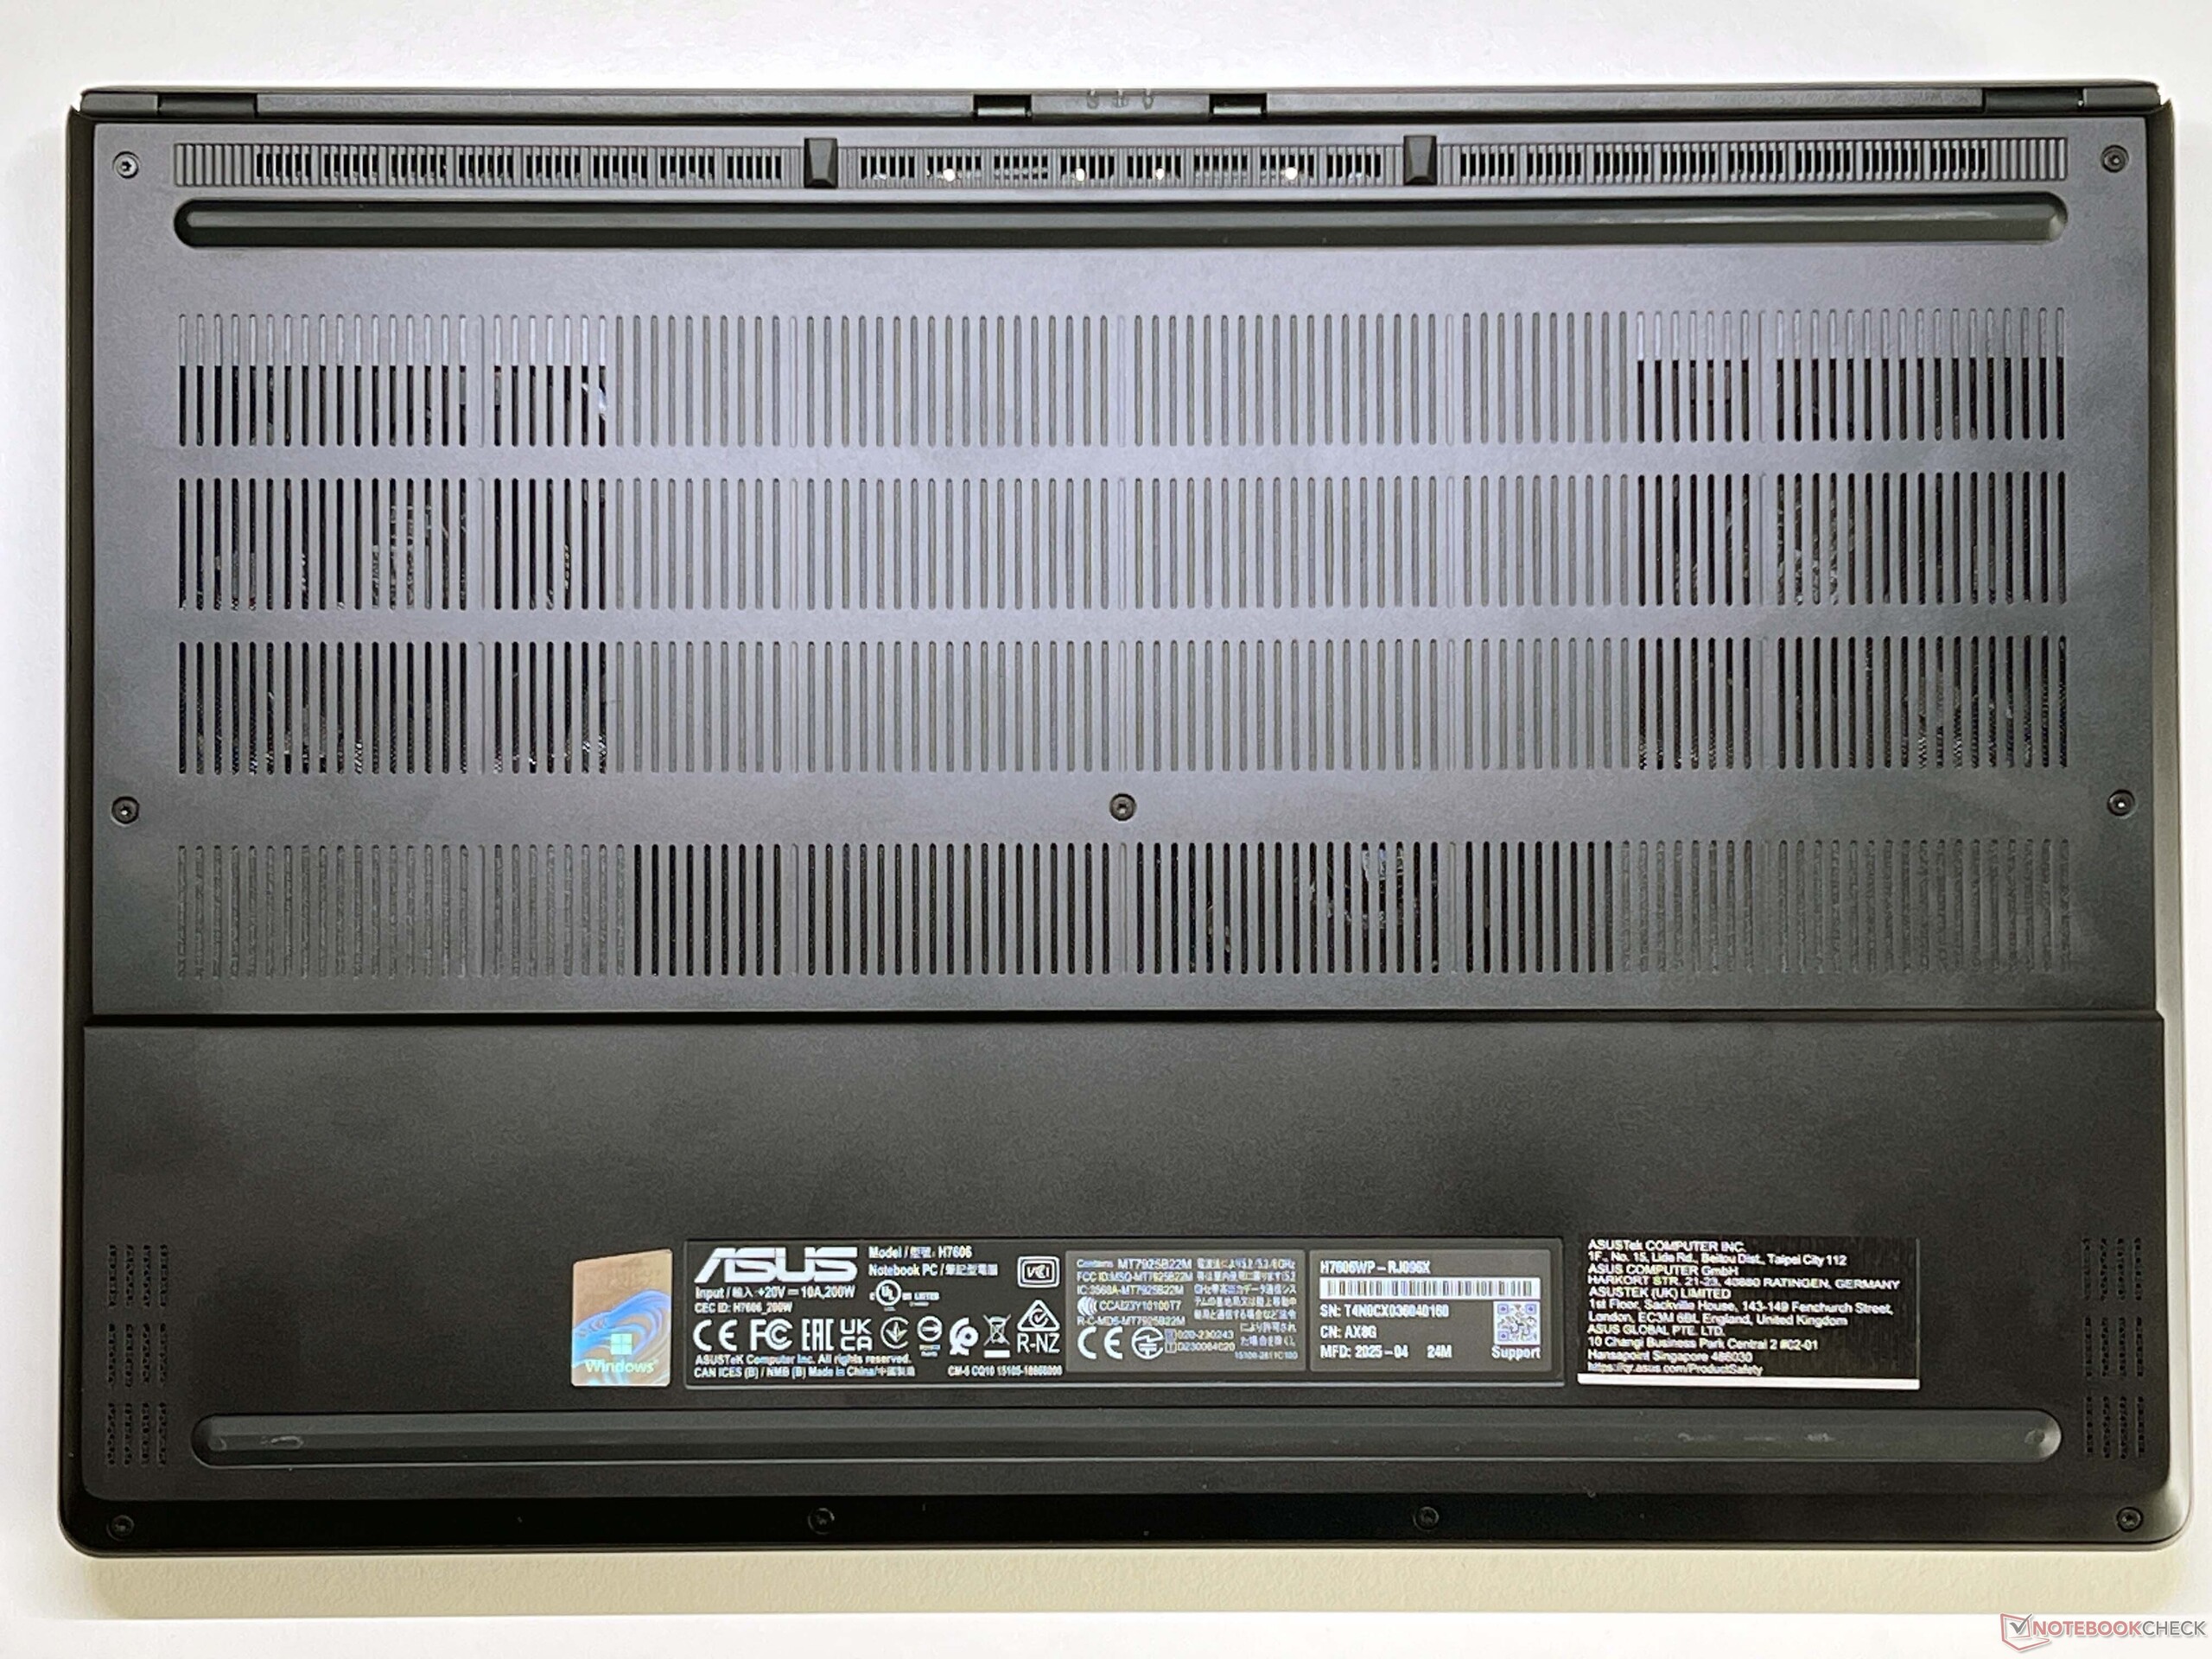
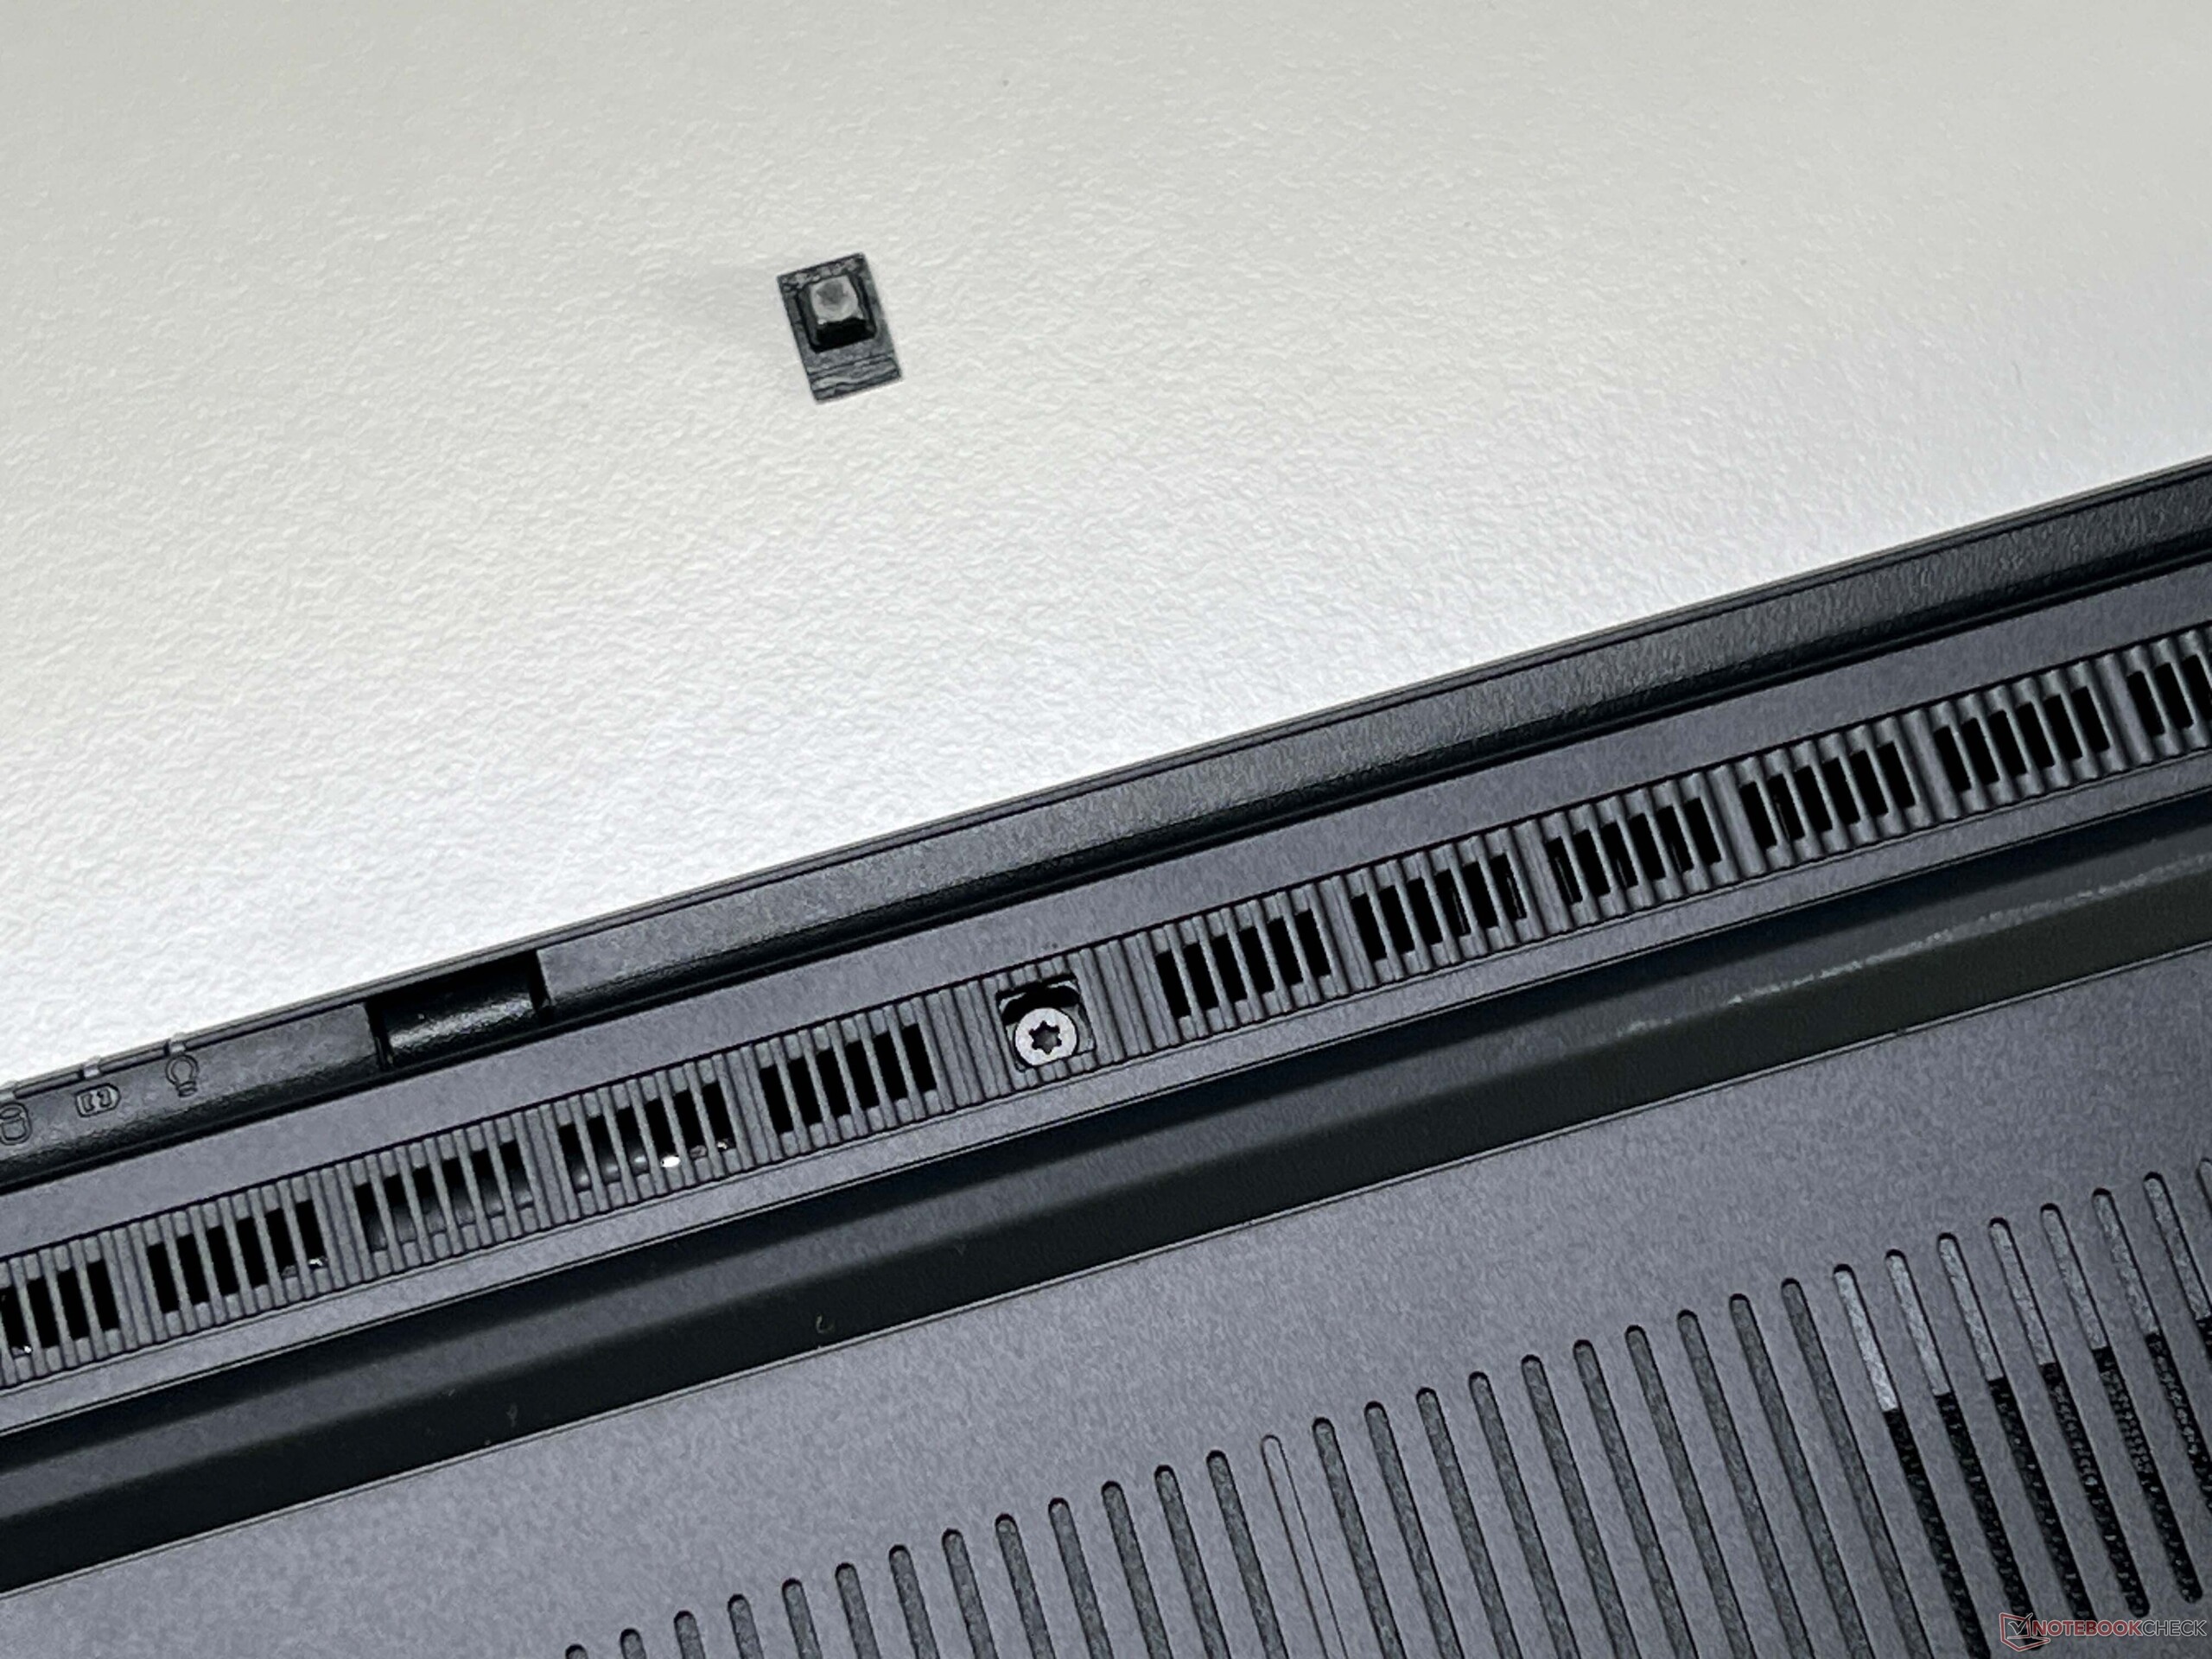
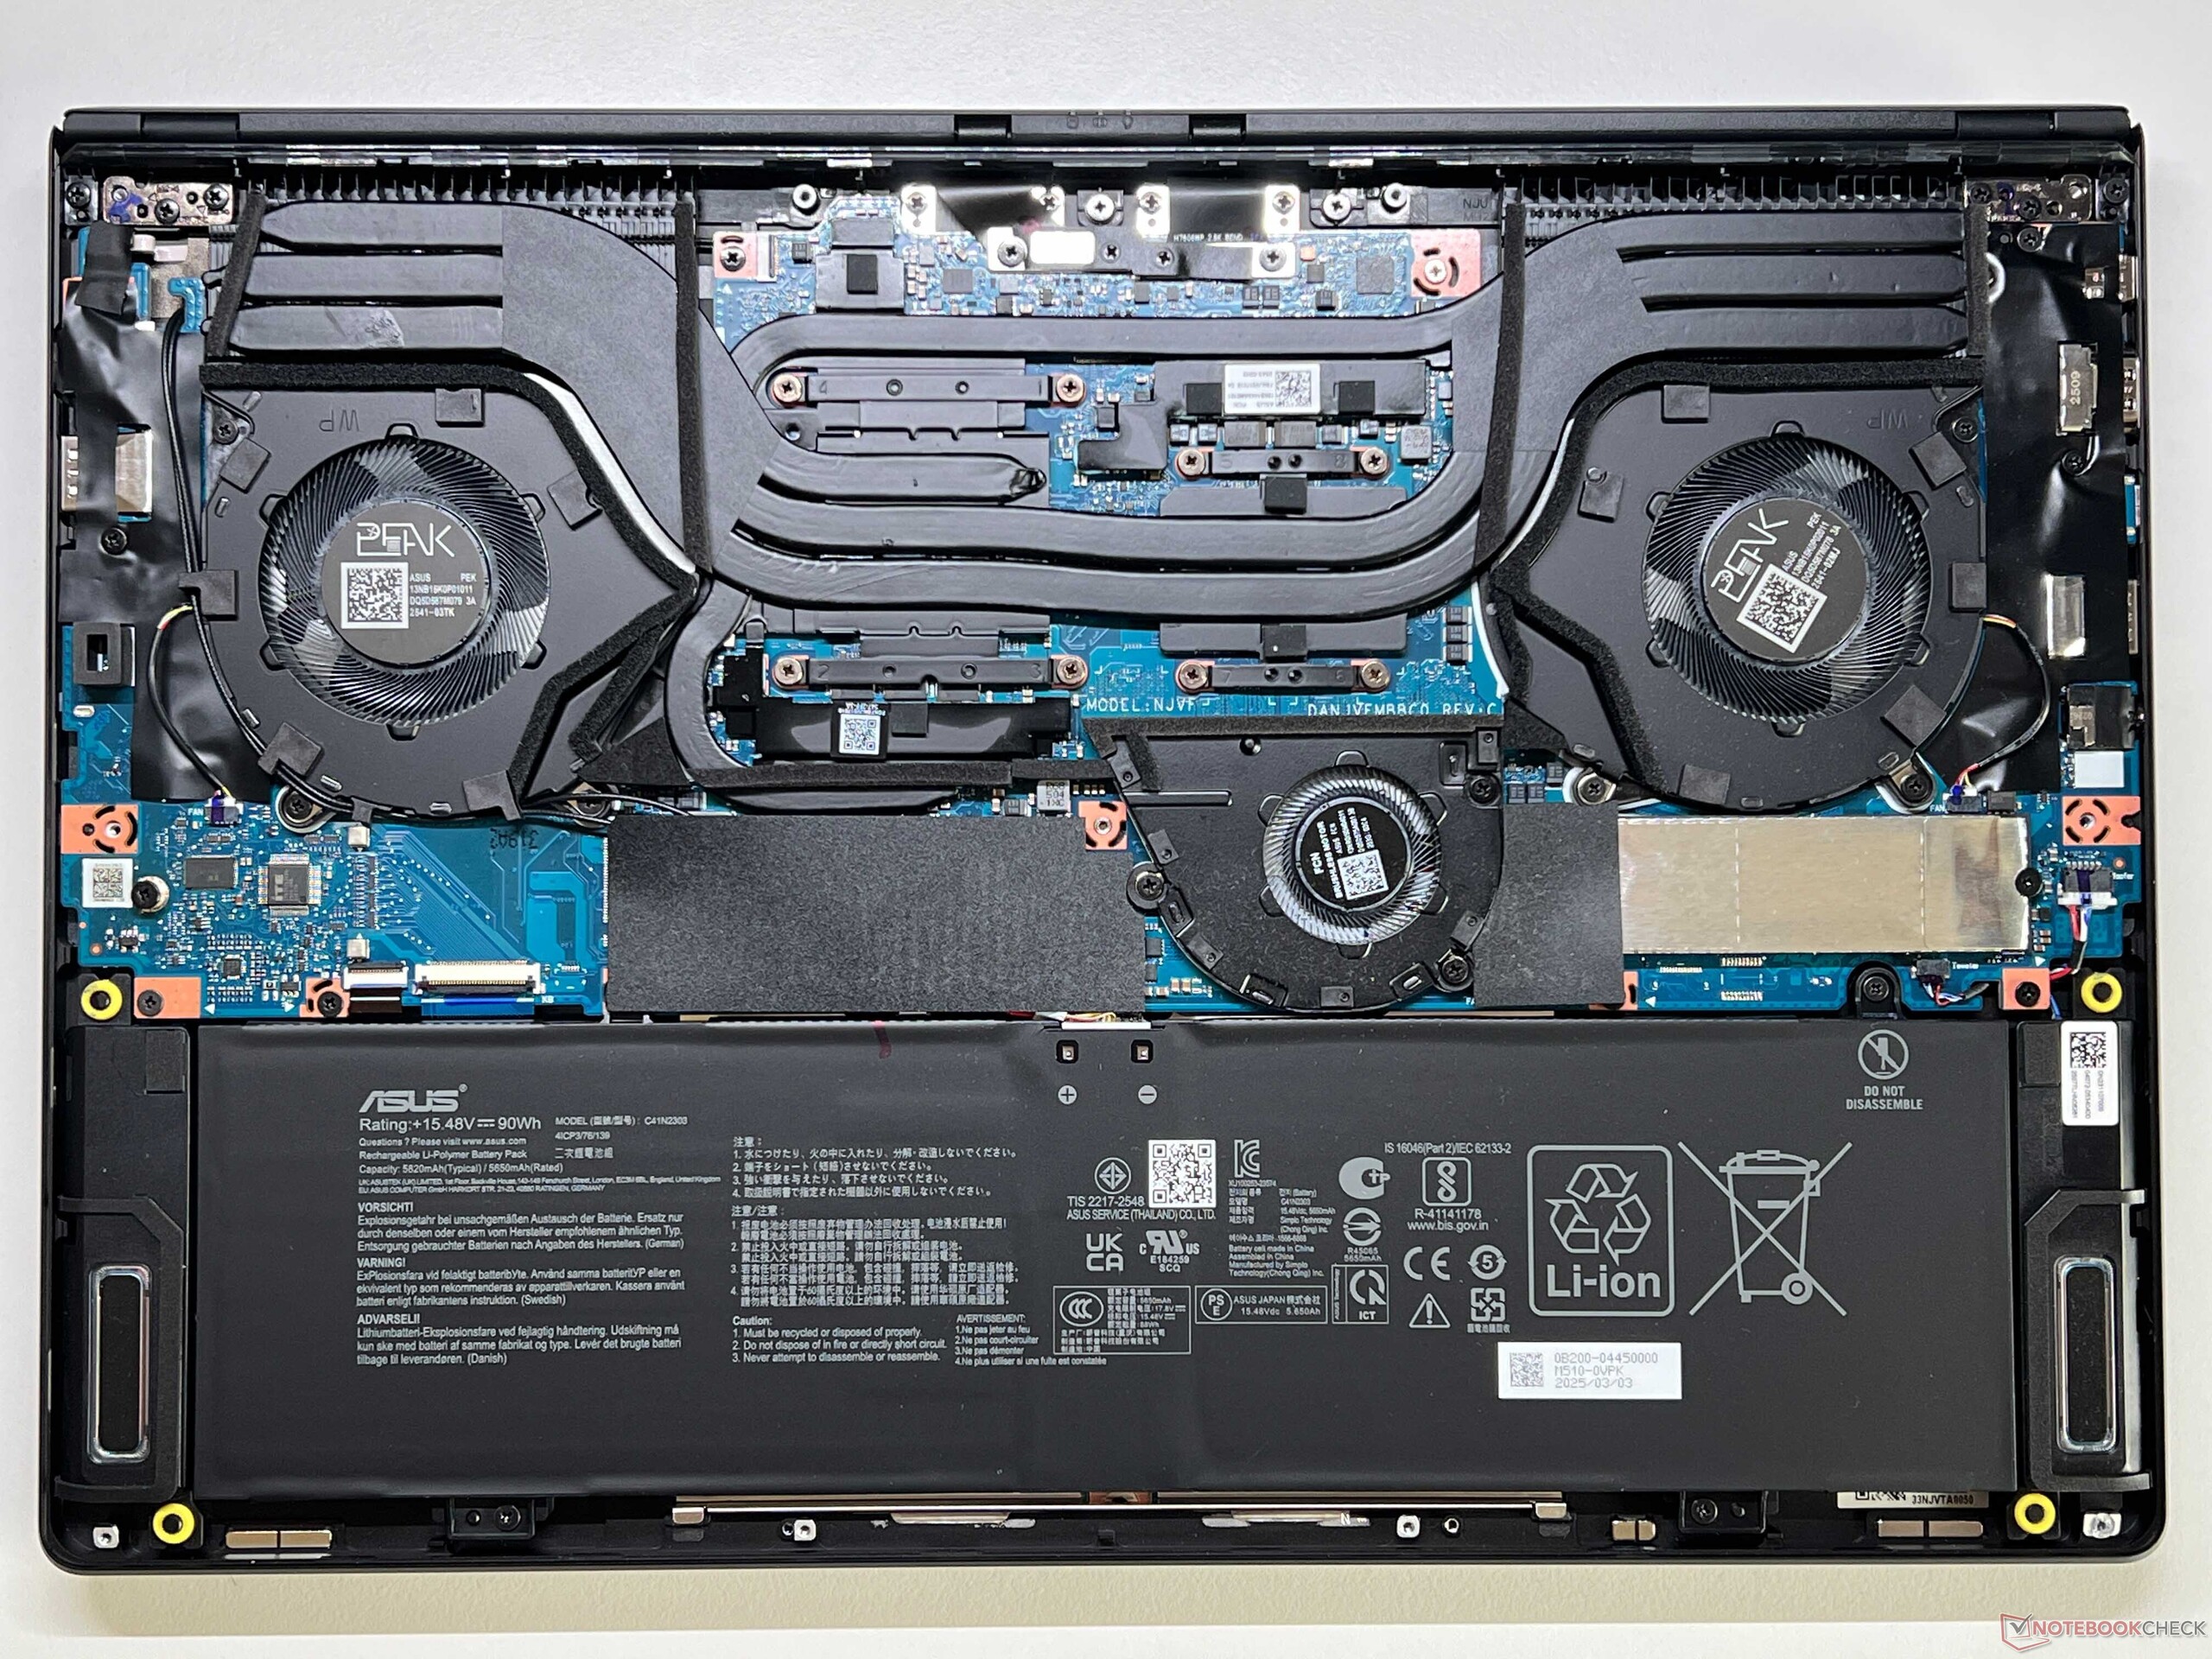
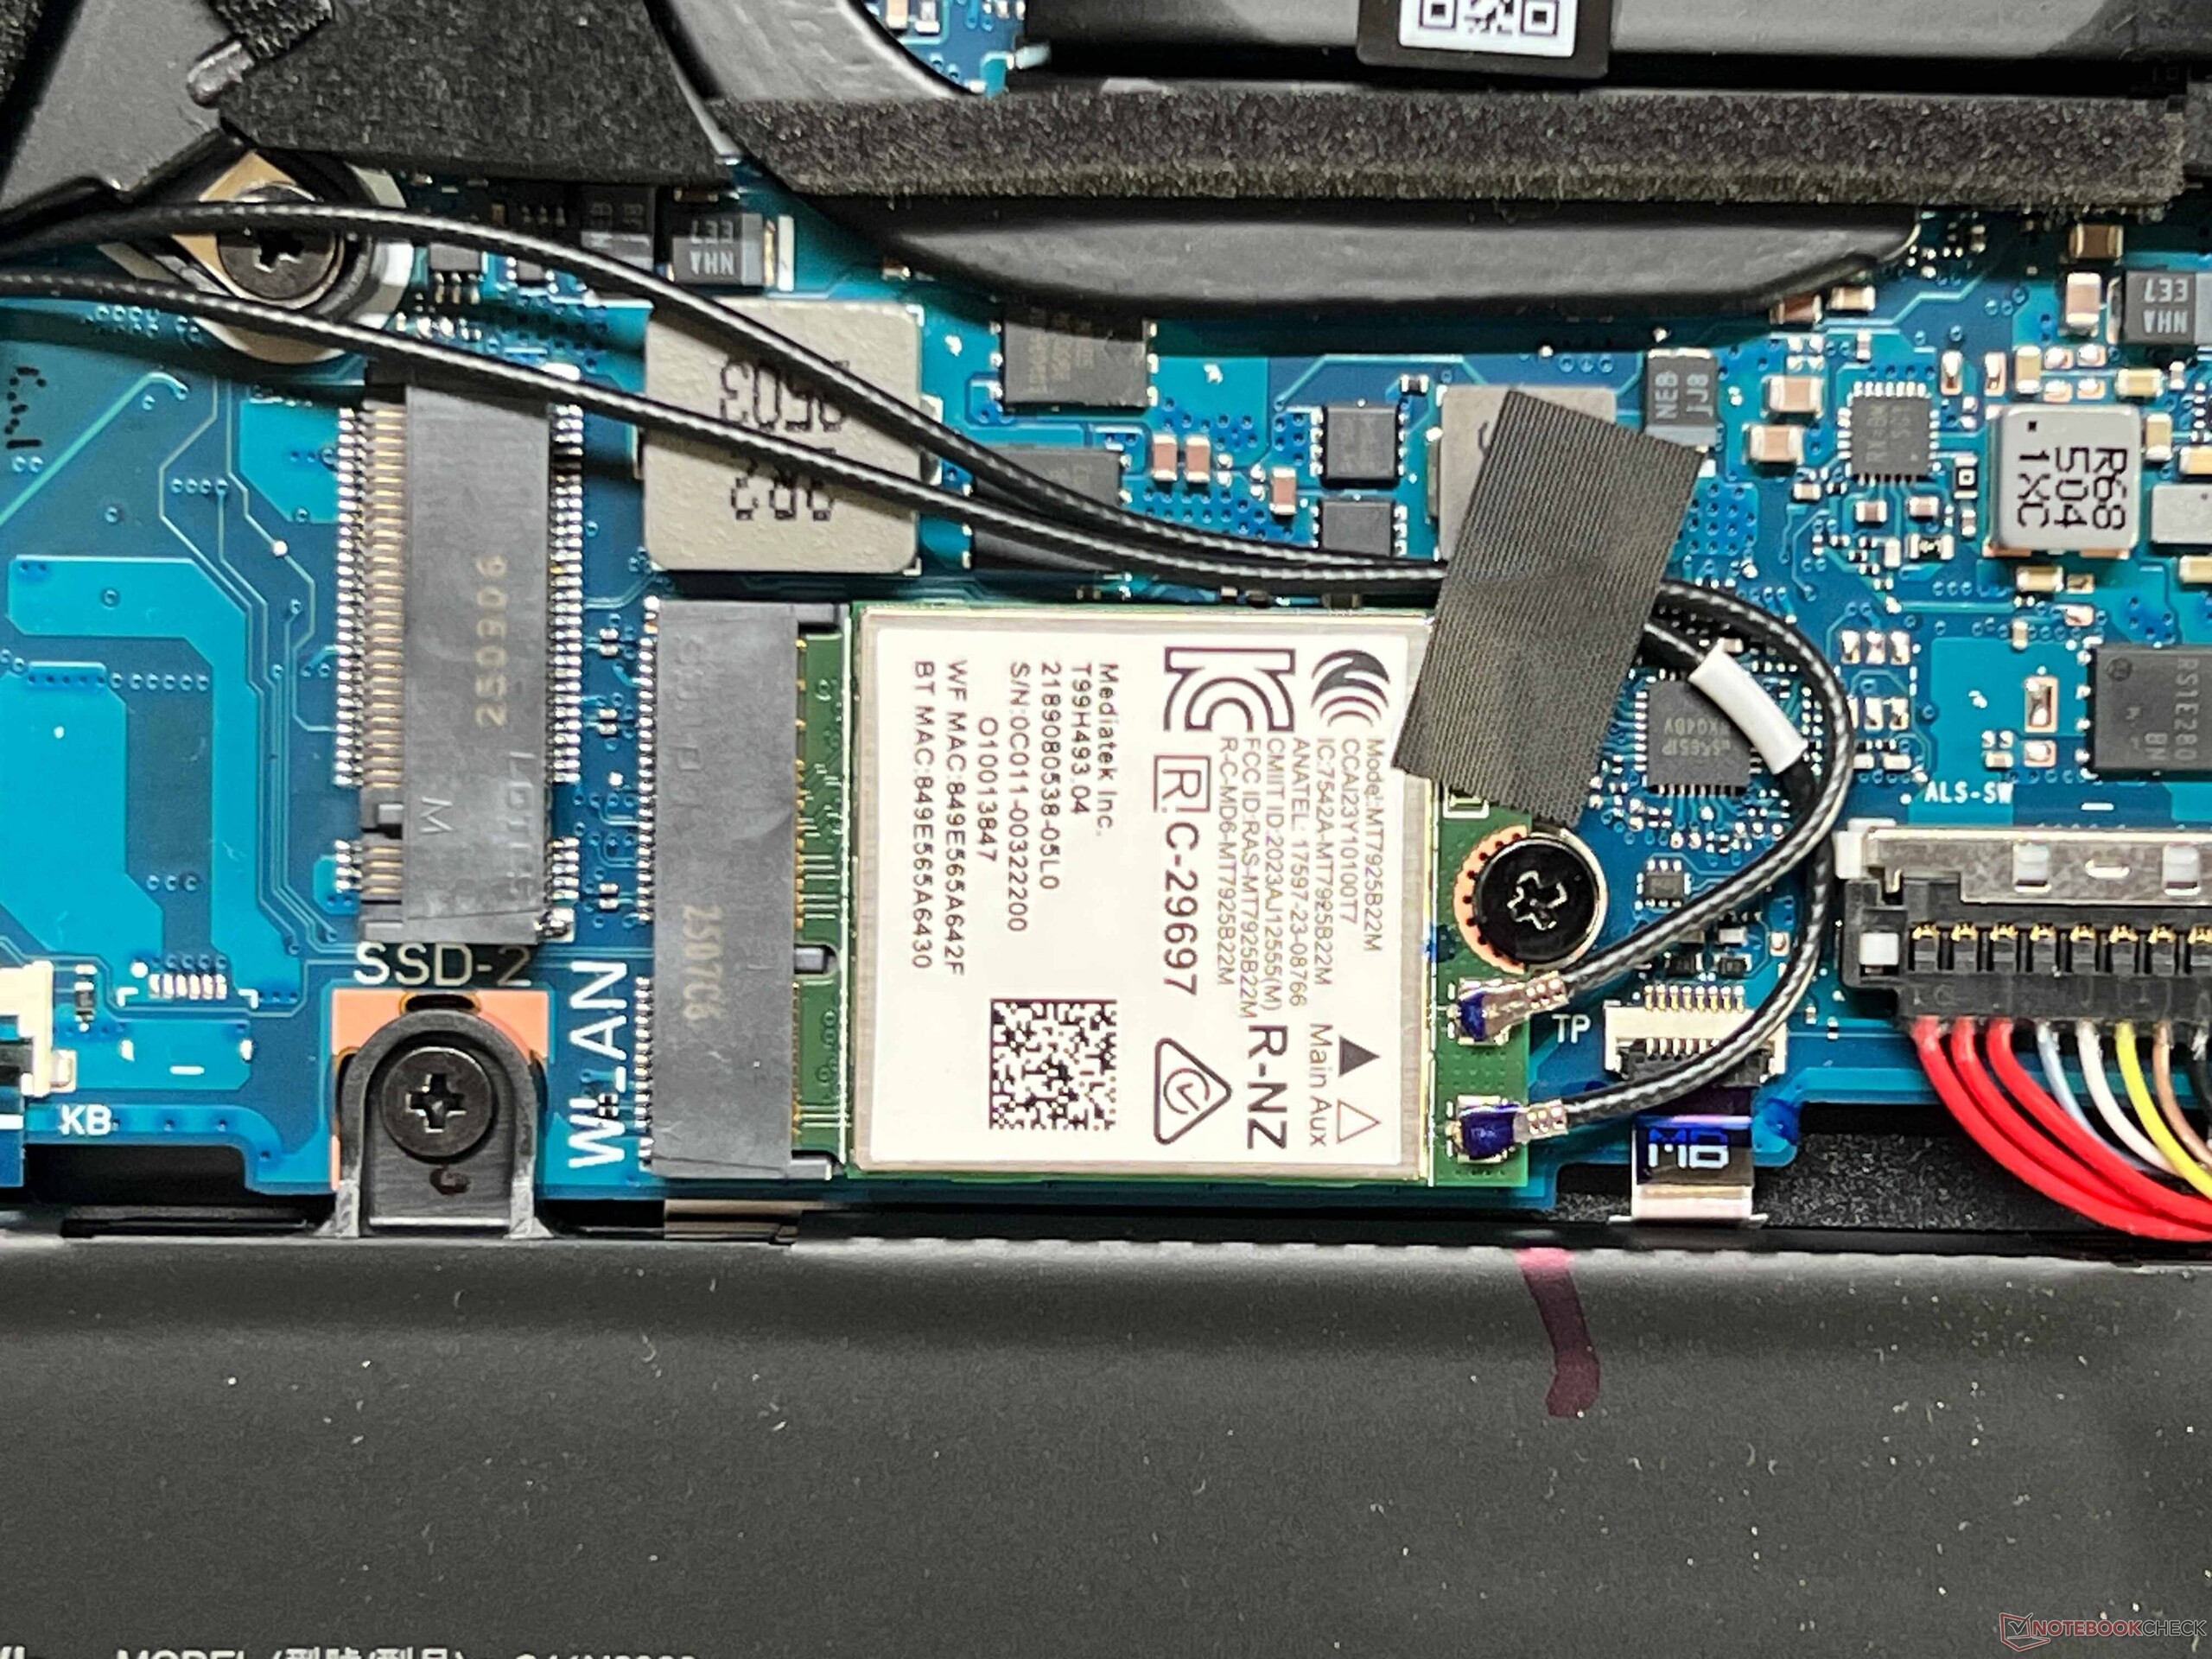
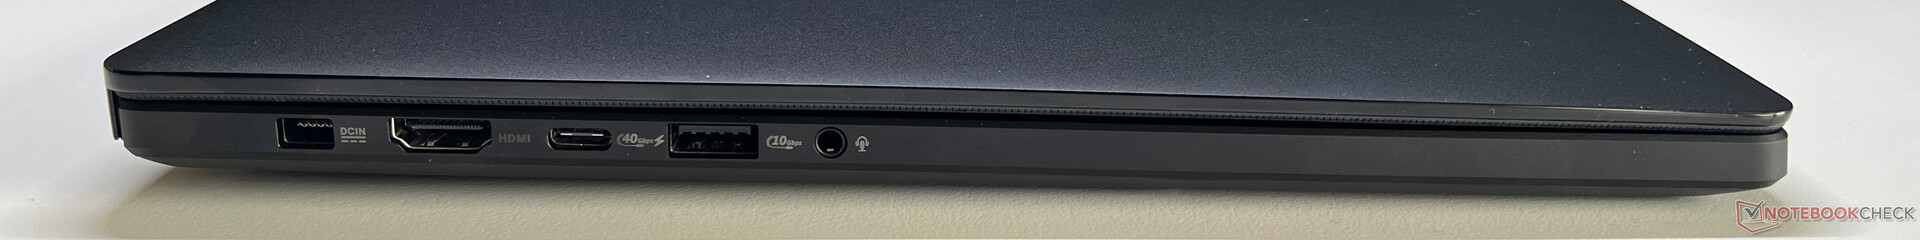
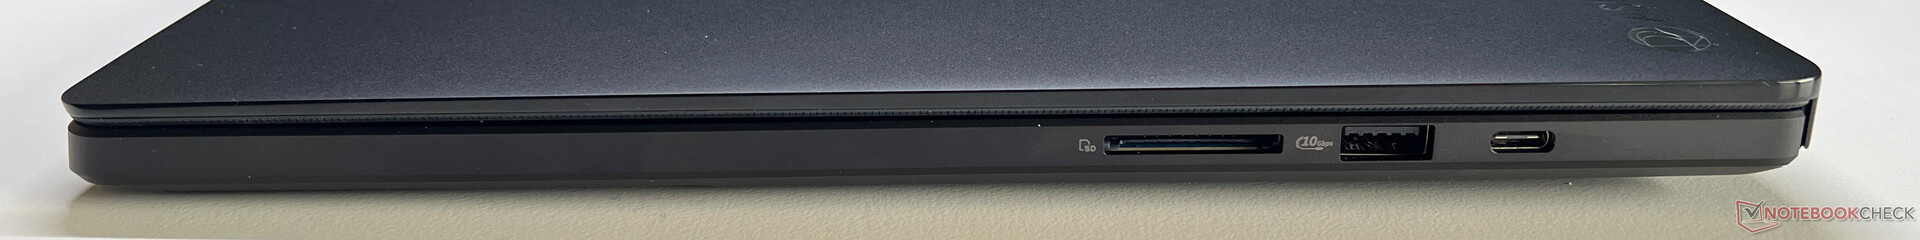
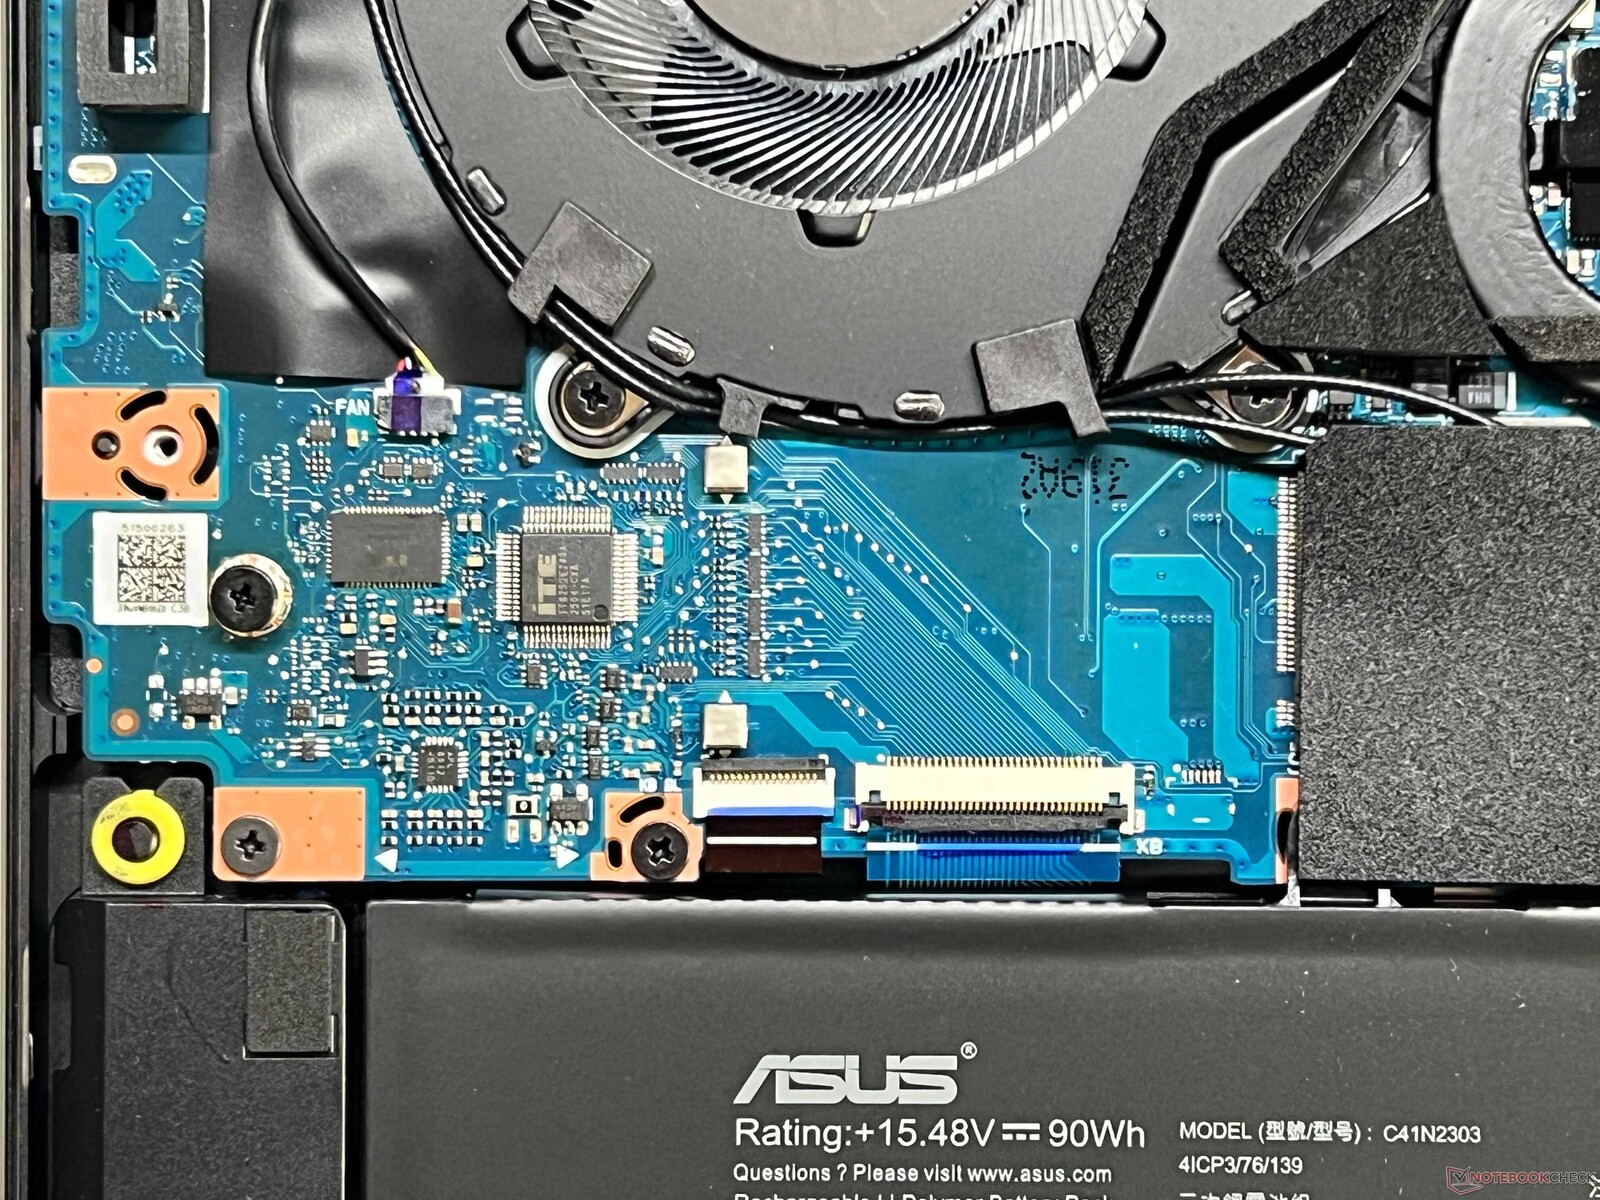
该笔记本电脑的黑色外壳与旧型号的 旧型号与 Zephyrus G16 相比,它的盖子上没有照明元素。这款笔记本的外壳也是黑色的,很容易留下指纹。它的整体质量非常出色,但其弱点仍然是铰链,因为在调整角度后,显示屏的盖子会明显反弹。通过两颗隐藏的螺丝仍很难接触到设备的组件(风扇、电池、WLAN 模块、2x SSD)。该机的连接性没有任何变化,所有重要的标准(USB 4.0、Wi-Fi 7)都已配备。它的读卡器速度超快,但笔记本电脑的 1080p 网络摄像头拍出的照片不是特别好。ProArt P16 是一款 Copilot+ 笔记本电脑。

| SD Card Reader | |
| average JPG Copy Test (av. of 3 runs) | |
| Asus ProArt P16 H7606WP (Angelbird AV Pro V60) | |
| Apple MacBook Pro 16 2024 M4 Pro (Angelbird AV Pro V60) | |
| Dell XPS 16 9640 (Angelbird AV Pro V60) | |
| Asus ProArt P16 H7606WI (Angelbird AV Pro V60) | |
| Average of class Multimedia (23 - 531, n=42, last 2 years) | |
| Lenovo Yoga Pro 9 16IMH9 (Angelbird AV Pro V60) | |
| Lenovo ThinkBook 16p G5 IRX 21N50011GE (AV Pro V60) | |
| maximum AS SSD Seq Read Test (1GB) | |
| Asus ProArt P16 H7606WP (Angelbird AV Pro V60) | |
| Asus ProArt P16 H7606WI (Angelbird AV Pro V60) | |
| Apple MacBook Pro 16 2024 M4 Pro (Angelbird AV Pro V60) | |
| Dell XPS 16 9640 (Angelbird AV Pro V60) | |
| Average of class Multimedia (37.3 - 1455, n=41, last 2 years) | |
| Lenovo ThinkBook 16p G5 IRX 21N50011GE (AV Pro V60) | |
| Lenovo Yoga Pro 9 16IMH9 (Angelbird AV Pro V60) | |
| Networking | |
| Asus ProArt P16 H7606WP | |
| iperf3 transmit AXE11000 | |
| iperf3 receive AXE11000 | |
| Apple MacBook Pro 16 2024 M4 Pro | |
| iperf3 transmit AXE11000 | |
| iperf3 receive AXE11000 | |
| Lenovo ThinkBook 16p G5 IRX 21N50011GE | |
| iperf3 transmit AXE11000 | |
| iperf3 receive AXE11000 | |
| iperf3 transmit AXE11000 6GHz | |
| iperf3 receive AXE11000 6GHz | |
| Asus ProArt P16 H7606WI | |
| iperf3 transmit AXE11000 | |
| iperf3 receive AXE11000 | |
| Lenovo Yoga Pro 9 16IMH9 | |
| iperf3 transmit AXE11000 | |
| iperf3 receive AXE11000 | |
| Dell XPS 16 9640 | |
| iperf3 transmit AXE11000 | |
| iperf3 receive AXE11000 | |


可持续性
华硕没有提供有关该笔记本电脑二氧化碳排放量 或环保标准的信息。与 ROG Zephyrus G16 不同,ProArt 的包装完全不使用塑料。
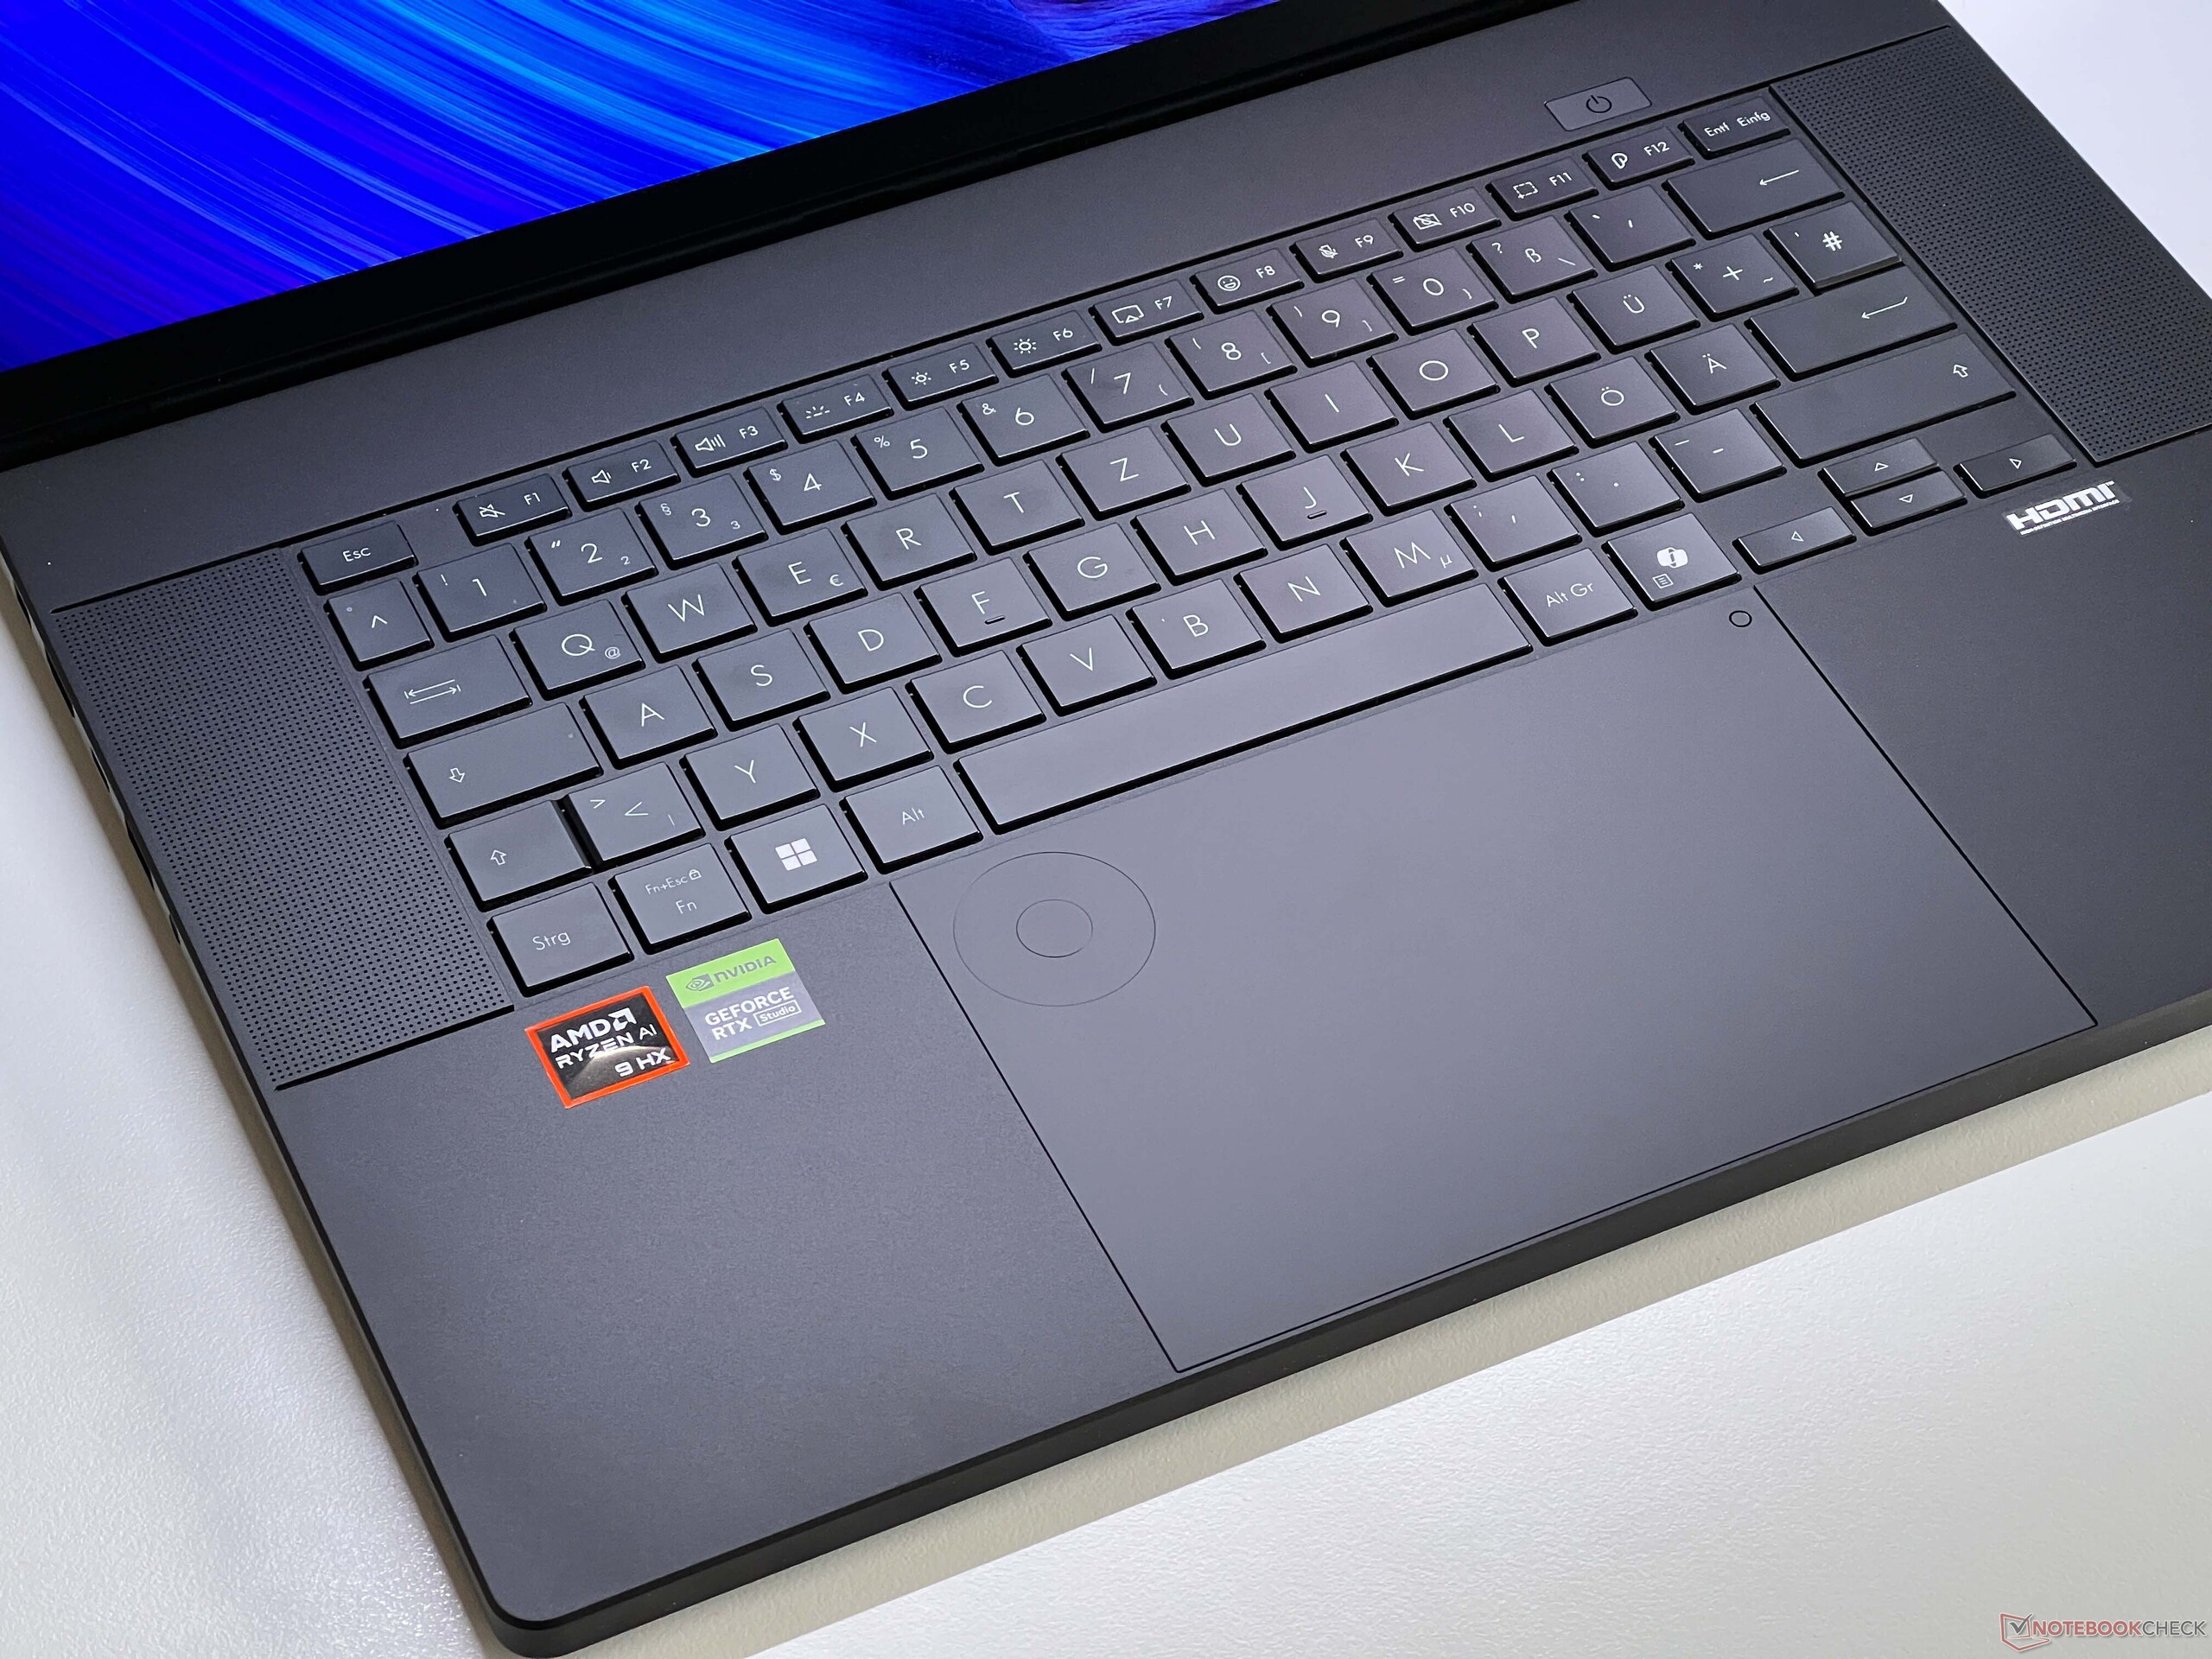
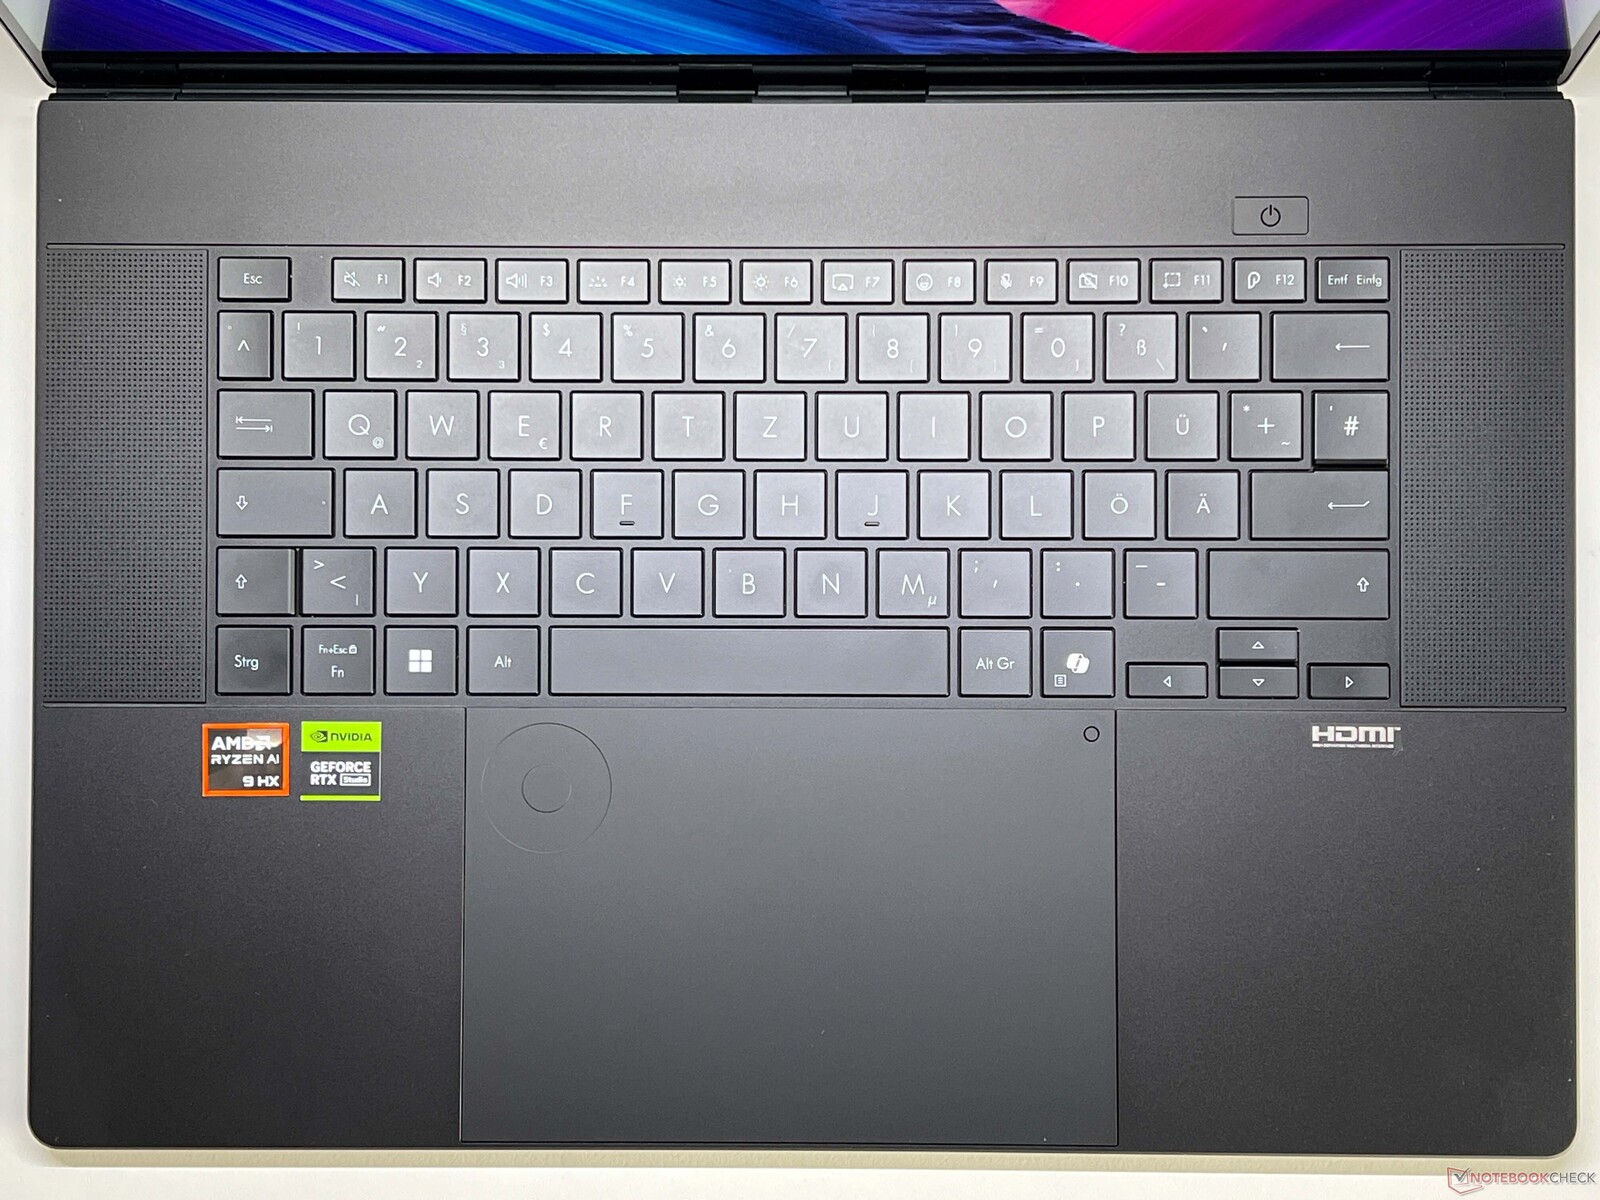
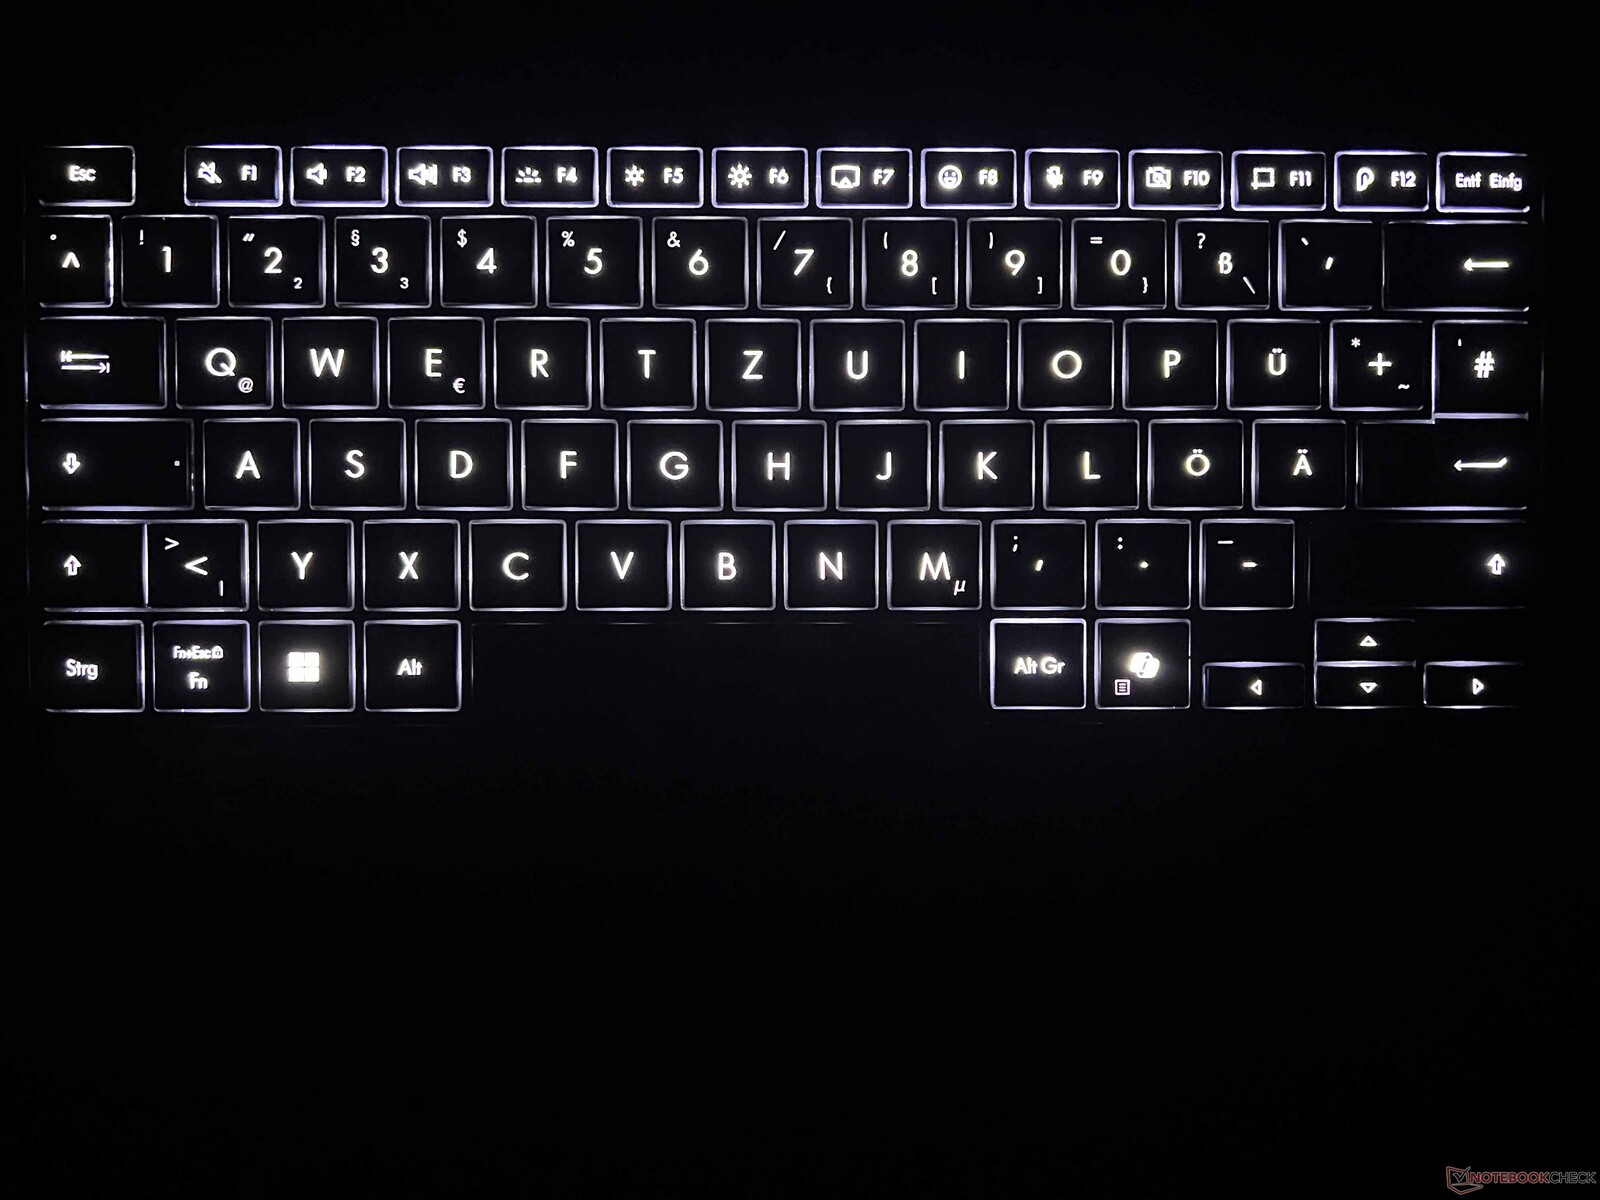
输入设备 - 1.7 毫米行程和拨号键盘
该设备的输入设备保持不变,因此用户仍然可以享受到非常舒适的键盘。对于笔记本电脑来说,1.7 毫米的键程非常宽松,按键精准,白色背光有助于在较暗环境中的可视性。宽大的 ClickPad 手感舒适顺滑,并能发出低沉、高质量的机械点击声。此外,它还在左上角安装了一个 DialPad,这对 Adobe Photoshop 或 Premiere Pro 等程序特别有用。
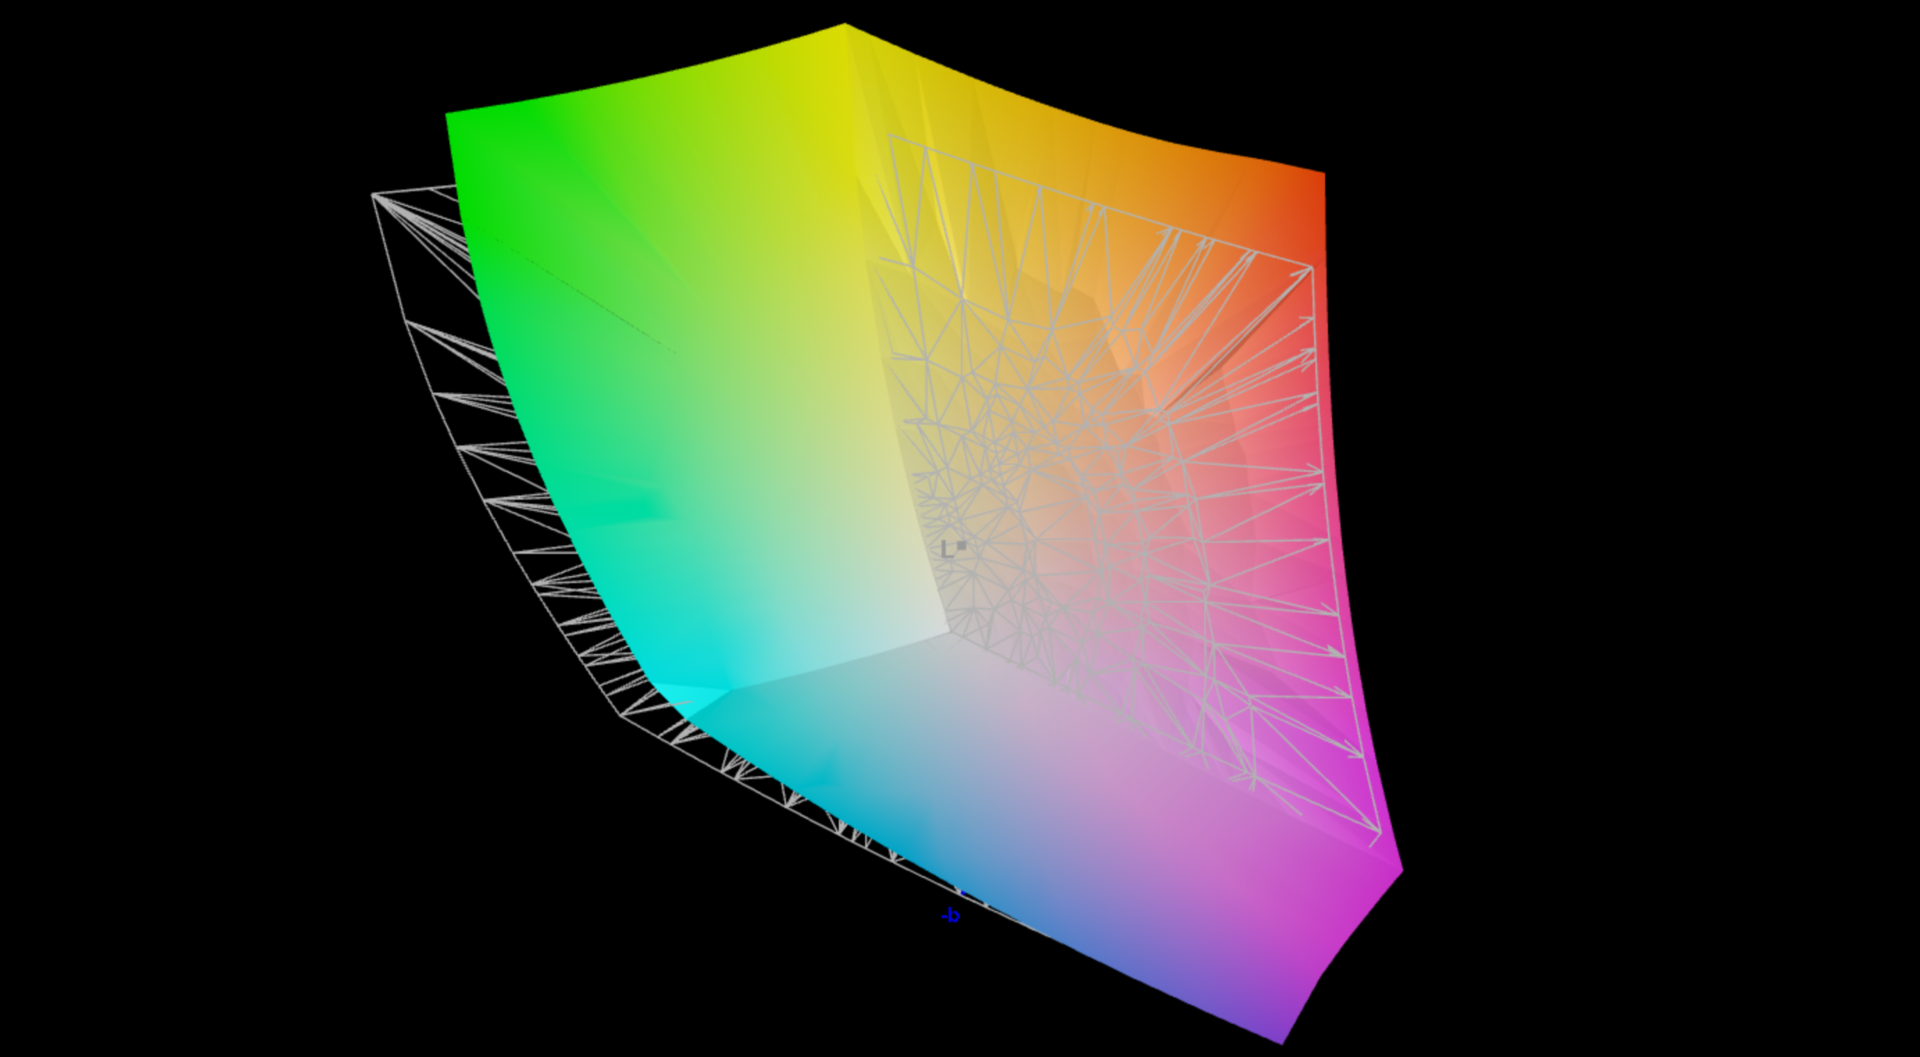
显示屏 - 2.8K OLED,而非 4K
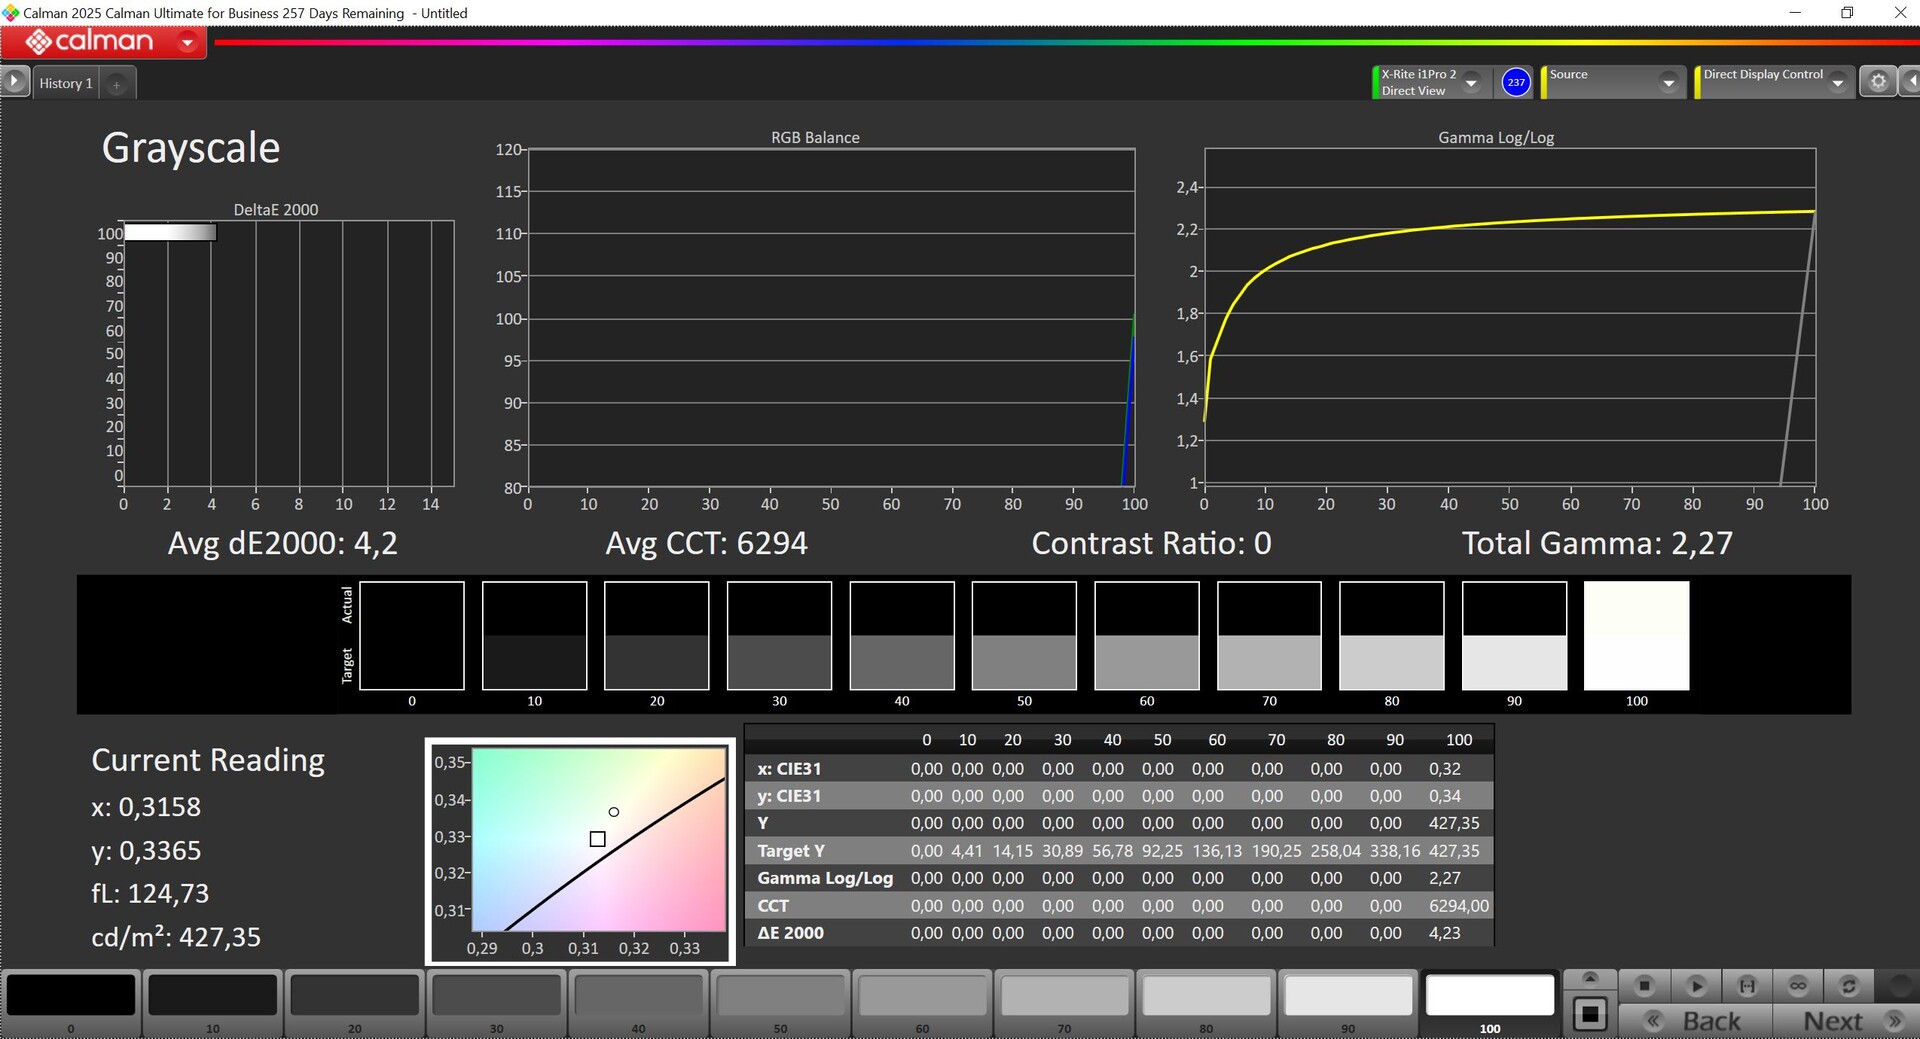
去年的 ProArt P16 配备了高分辨率 4K OLED 显示屏,但频率只有 60 Hz,我们在测试中对此提出了批评。在 2025 机型上,华硕现在采用了 120 Hz 2.8K OLED 面板,除了频率之外(Zephyrus 为 240 Hz),它与 Zephyrus G16 上安装的面板有很多相似之处。不过,由于现在又是触摸屏,在描绘明亮的内容时,图像看起来有些颗粒感。除此之外,它的主观画质非常好,但与所有其他 OLED 面板一样,我们注意到它使用了 PWM 闪烁(480 Hz)。此外,OLED 面板的反射率很高。
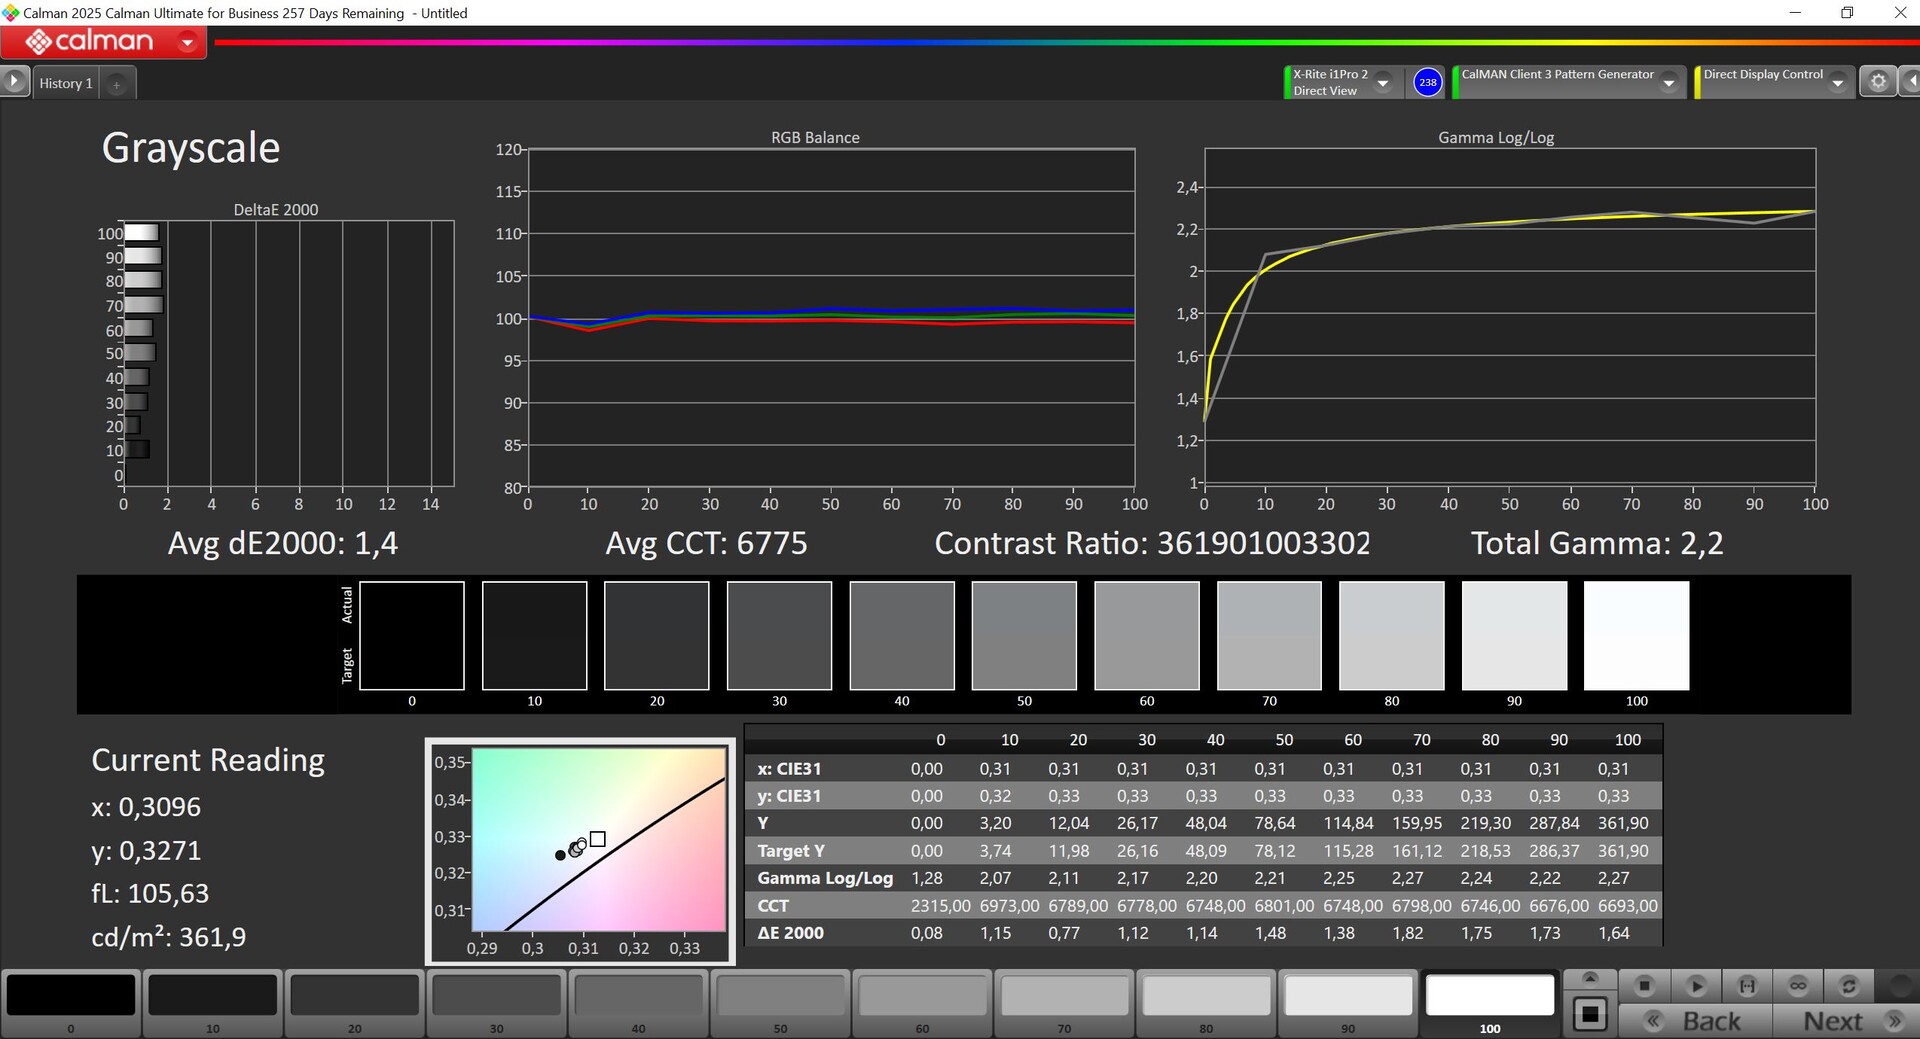
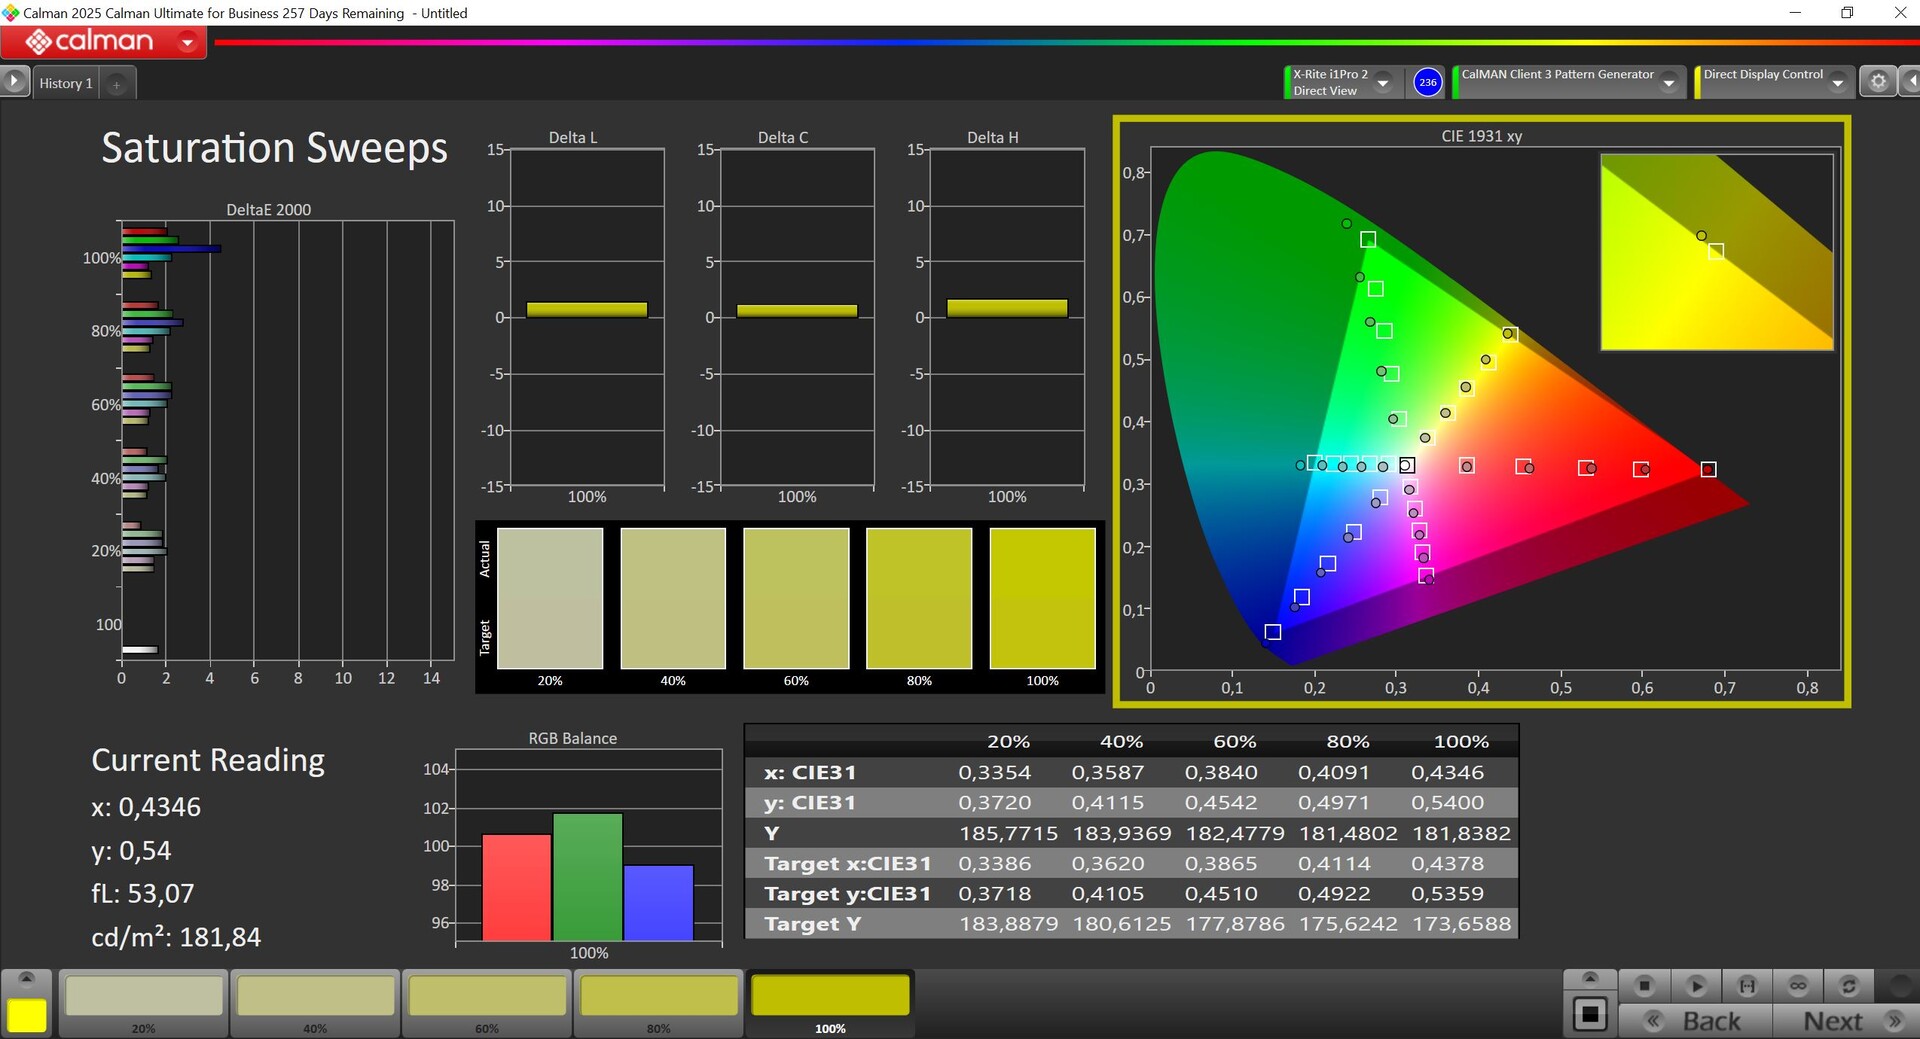
亮度似乎仍然是笔记本电脑的一个问题,因为我们在 SDR 模式下测得的亮度仅为 360 cd/m²,明显低于一些竞争对手。它的 HDR 功能甚至比旧款更差,因为我们只测到了略低于 430 cd/m²的最大值(以前的最大值约为 600 cd/m²)。因此,它的 HDR 功能非常有限。与往常一样,华硕为 P3 和 sRGB 色彩空间提供了非常准确的色彩配置文件,我们无法通过自己的校准进一步改善显示器。
| |||||||||||||||||||||||||
Brightness Distribution: 99 %
Center on Battery: 362 cd/m²
Contrast: ∞:1 (Black: 0 cd/m²)
ΔE ColorChecker Calman: 0.8 | ∀{0.5-29.43 Ø4.72}
ΔE Greyscale Calman: 1.3 | ∀{0.09-98 Ø4.97}
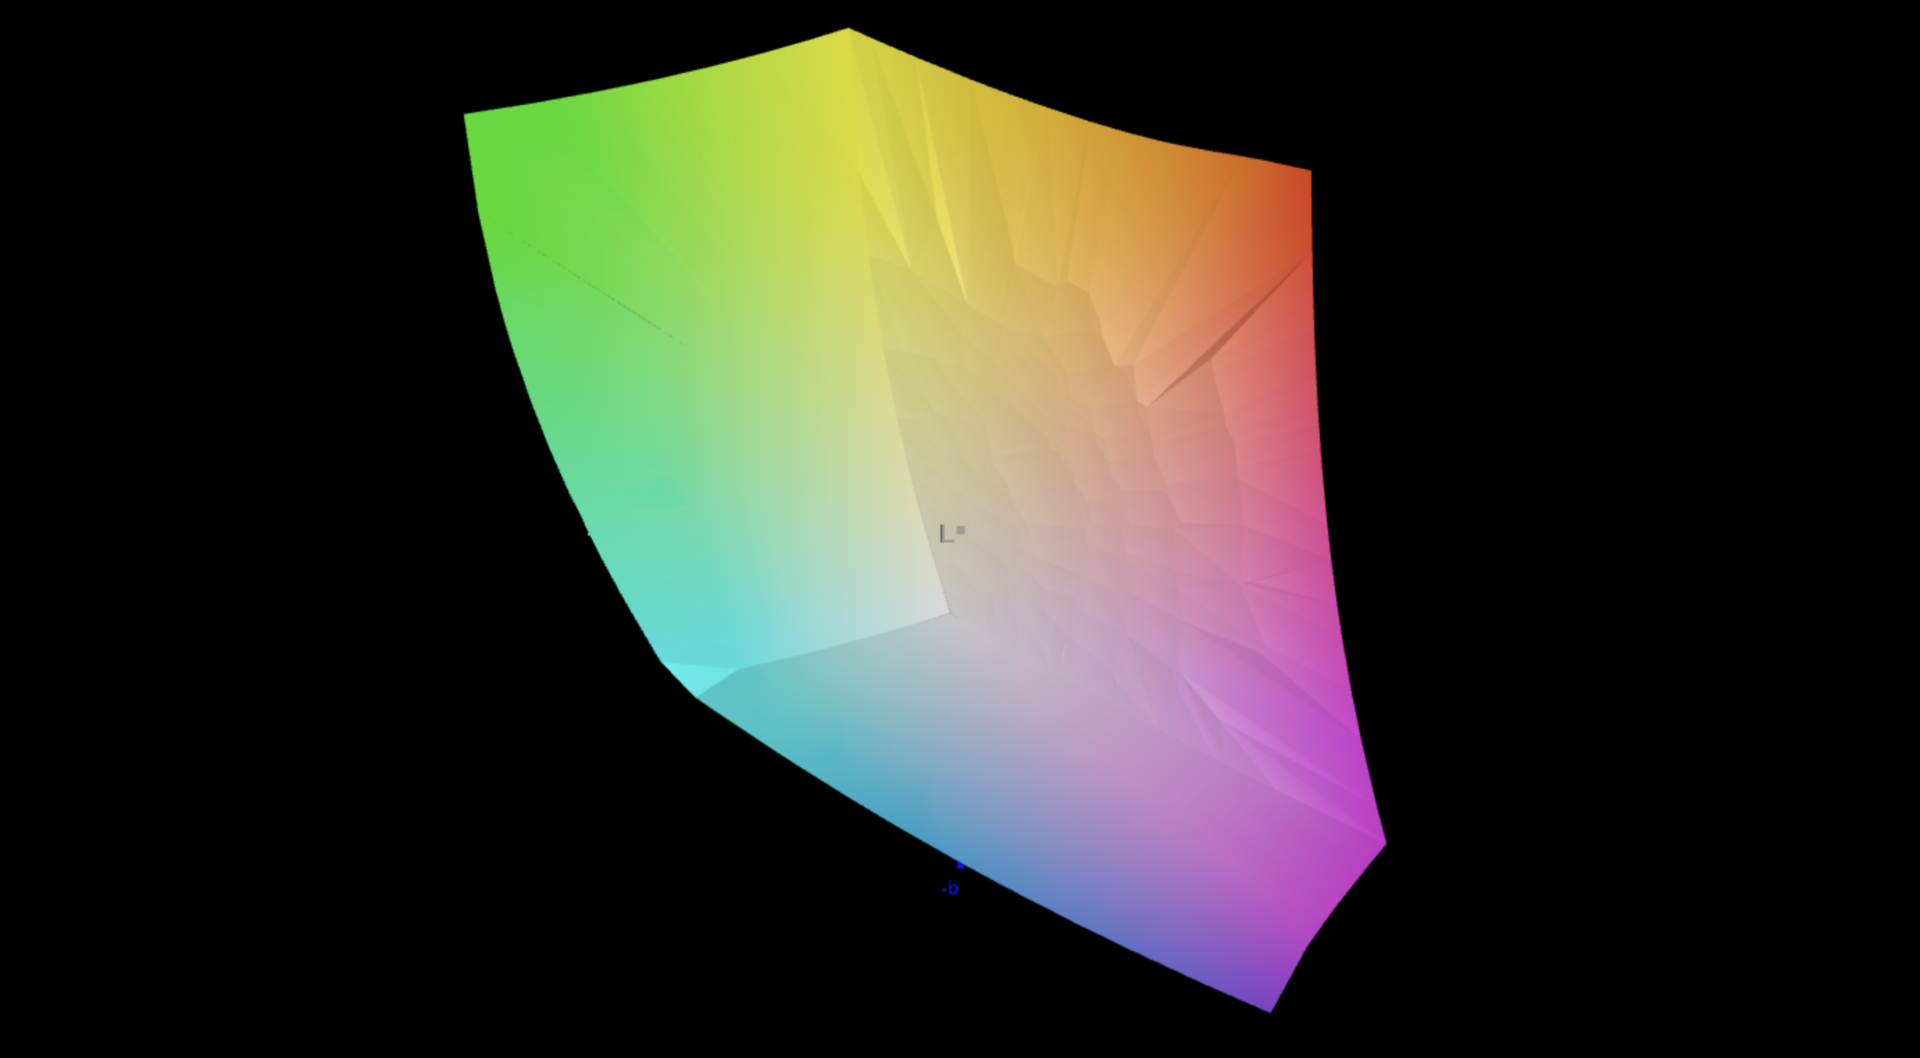
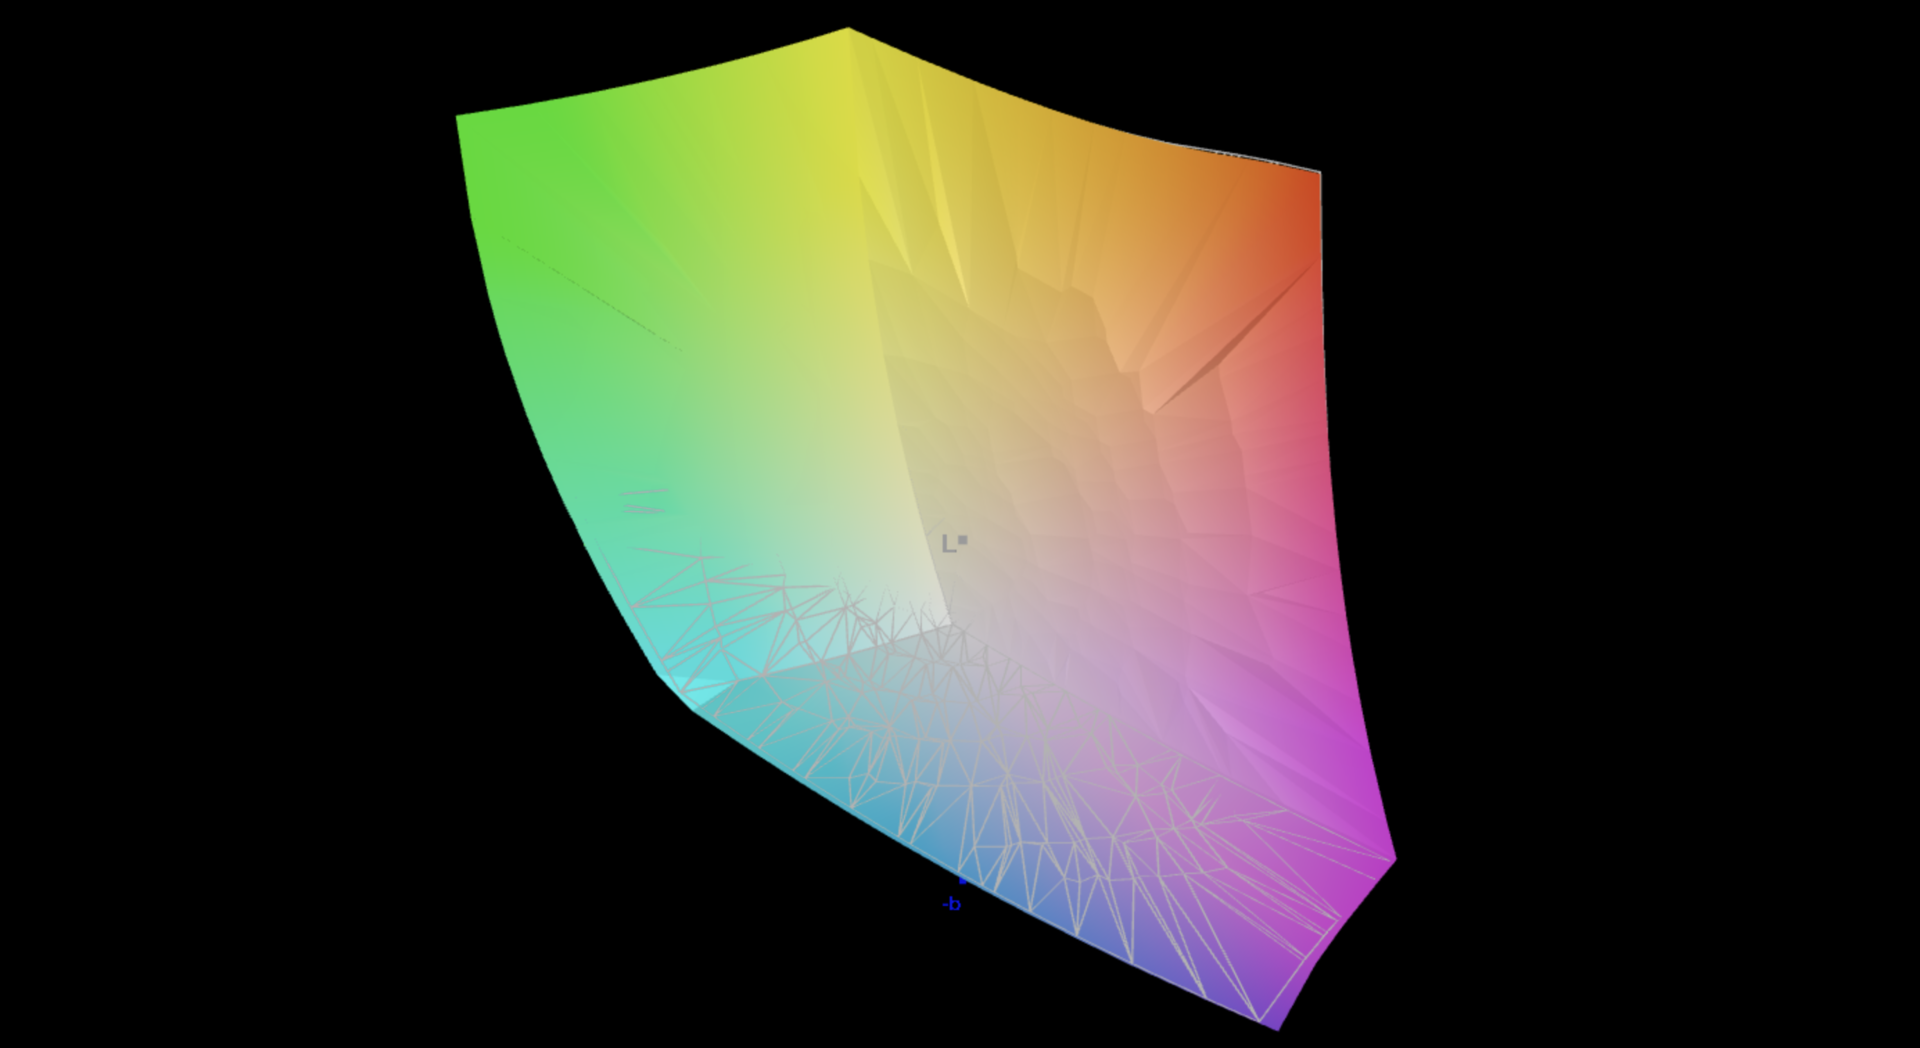
89.5% AdobeRGB 1998 (Argyll 3D)
100% sRGB (Argyll 3D)
99.5% Display P3 (Argyll 3D)
Gamma: 2.2
CCT: 6741 K
| Asus ProArt P16 H7606WP ATNA60CL10-0, OLED, 2880x1800, 16", 120 Hz | Asus ProArt P16 H7606WI ATNA60YV02-0, OLED, 3840x2400, 16", 60 Hz | Apple MacBook Pro 16 2024 M4 Pro Mini-LED, 3456x2234, 16.2", 120 Hz | Lenovo ThinkBook 16p G5 IRX 21N50011GE MNG007ZA1-2 , IPS LCD, 3200x2000, 16", 165 Hz | Lenovo Yoga Pro 9 16IMH9 LEN160-3.2K, Mini-LED, 3200x2000, 16", 165 Hz | Dell XPS 16 9640 SDC4196, OLED, 3840x2400, 16.3", 90 Hz | |
|---|---|---|---|---|---|---|
| Display | 4% | -0% | -3% | -2% | -1% | |
| Display P3 Coverage (%) | 99.5 | 99.9 0% | 99.7 0% | 94.4 -5% | 97 -3% | 98.3 -1% |
| sRGB Coverage (%) | 100 | 100 0% | 100 0% | 99.9 0% | 99.9 0% | 100 0% |
| AdobeRGB 1998 Coverage (%) | 89.5 | 99.1 11% | 88.8 -1% | 86 -4% | 86.6 -3% | 87.8 -2% |
| Response Times | -96% | -4470% | -1868% | -3011% | -33% | |
| Response Time Grey 50% / Grey 80% * (ms) | 0.63 ? | 1.58 ? -151% | 43 ? -6725% | 15.5 ? -2360% | 22.2 ? -3424% | 0.82 ? -30% |
| Response Time Black / White * (ms) | 0.63 ? | 1.25 ? -98% | 41.2 ? -6440% | 9.3 ? -1376% | 17 ? -2598% | 0.85 ? -35% |
| PWM Frequency (Hz) | 480 ? | 240 ? | 14880 | 4840 ? | 360 ? | |
| PWM Amplitude * (%) | 26 | 36 -38% | 90 -246% | |||
| Screen | -15% | 40% | -103% | -40% | -39% | |
| Brightness middle (cd/m²) | 362 | 355 -2% | 632 75% | 448 24% | 651 80% | 366 1% |
| Brightness (cd/m²) | 363 | 360 -1% | 616 70% | 426 17% | 673 85% | 367 1% |
| Brightness Distribution (%) | 99 | 98 -1% | 95 -4% | 84 -15% | 93 -6% | 96 -3% |
| Black Level * (cd/m²) | 0.4 | 0.22 | ||||
| Colorchecker dE 2000 * | 0.8 | 1.2 -50% | 0.6 25% | 3.3 -312% | 1.9 -137% | 1.3 -63% |
| Colorchecker dE 2000 max. * | 1.8 | 2.6 -44% | 1.2 33% | 5.4 -200% | 4.2 -133% | 3.6 -100% |
| Greyscale dE 2000 * | 1.3 | 1.2 8% | 0.8 38% | 3 -131% | 3 -131% | 2.2 -69% |
| Gamma | 2.2 100% | 2.14 103% | 2.21 100% | 2.27 97% | 2.18 101% | 2.14 103% |
| CCT | 6741 96% | 6526 100% | 6450 101% | 7110 91% | 6738 96% | 6680 97% |
| Contrast (:1) | 1120 | 2959 | ||||
| Colorchecker dE 2000 calibrated * | 2.7 | 0.6 | 1 | |||
| Total Average (Program / Settings) | -36% /
-31% | -1477% /
-1098% | -658% /
-397% | -1018% /
-570% | -24% /
-27% |
* ... smaller is better


Display Response Times
| ↔ Response Time Black to White | ||
|---|---|---|
| 0.63 ms ... rise ↗ and fall ↘ combined | ↗ 0.36 ms rise | 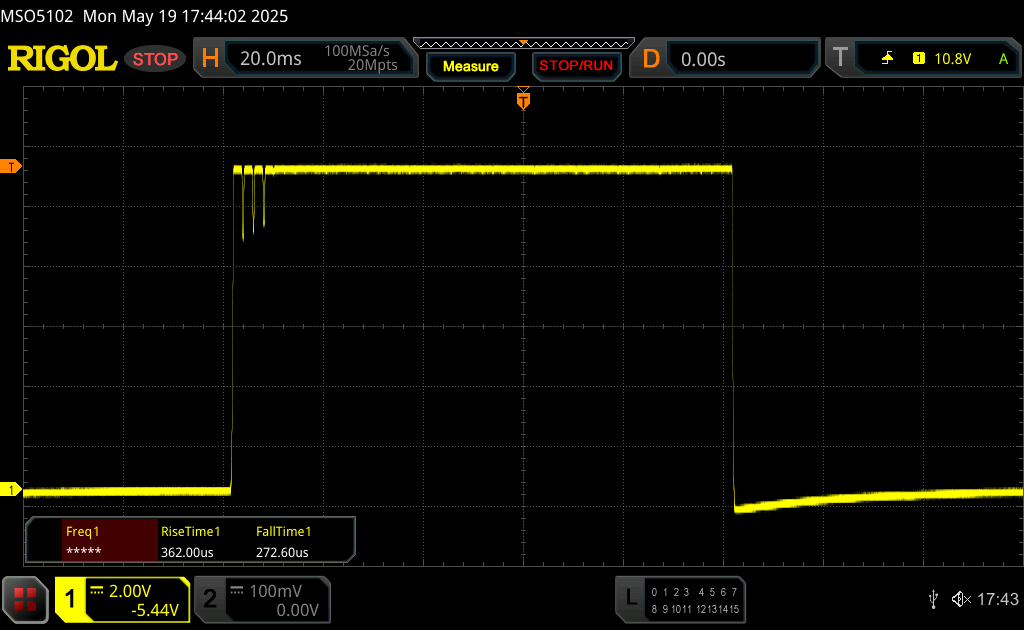 |
| ↘ 0.27 ms fall | ||
| The screen shows very fast response rates in our tests and should be very well suited for fast-paced gaming. In comparison, all tested devices range from 0.1 (minimum) to 240 (maximum) ms. » 1 % of all devices are better. This means that the measured response time is better than the average of all tested devices (19.8 ms). | ||
| ↔ Response Time 50% Grey to 80% Grey | ||
| 0.63 ms ... rise ↗ and fall ↘ combined | ↗ 0.34 ms rise | 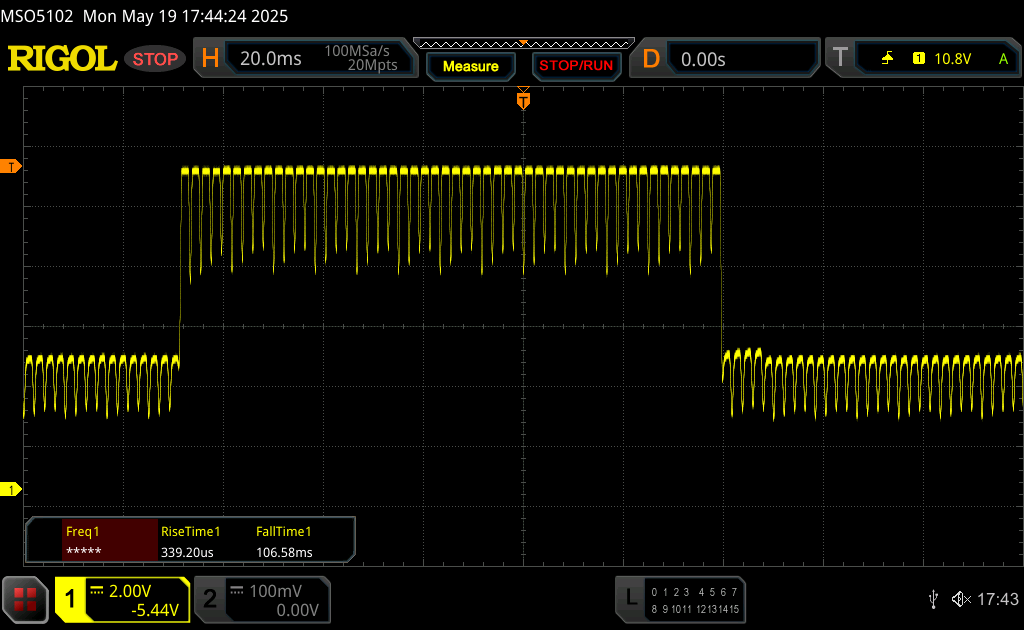 |
| ↘ 0.29 ms fall | ||
| The screen shows very fast response rates in our tests and should be very well suited for fast-paced gaming. In comparison, all tested devices range from 0.165 (minimum) to 636 (maximum) ms. » 2 % of all devices are better. This means that the measured response time is better than the average of all tested devices (31 ms). | ||
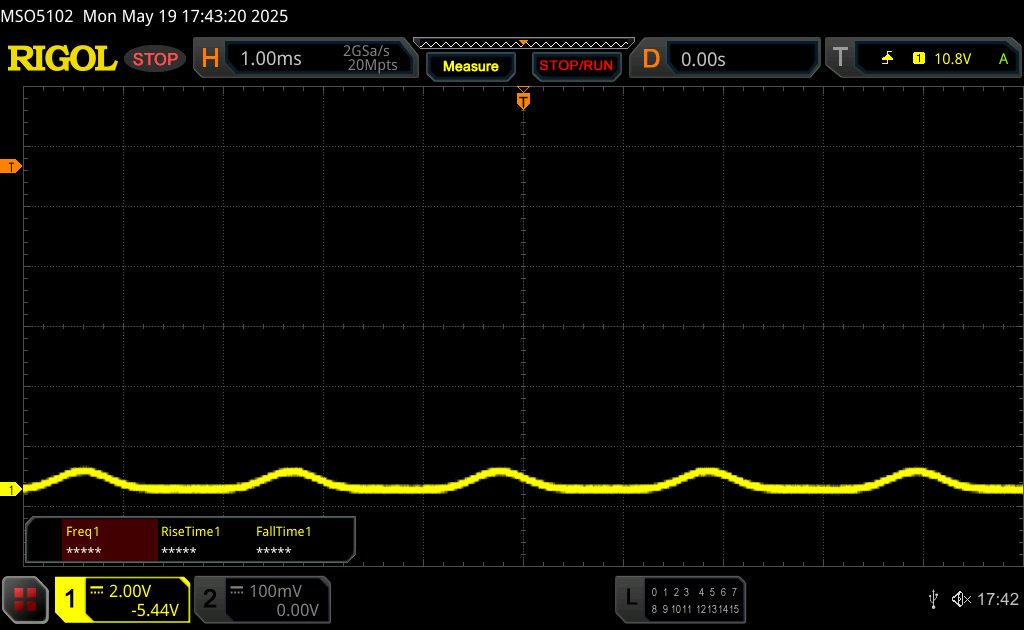
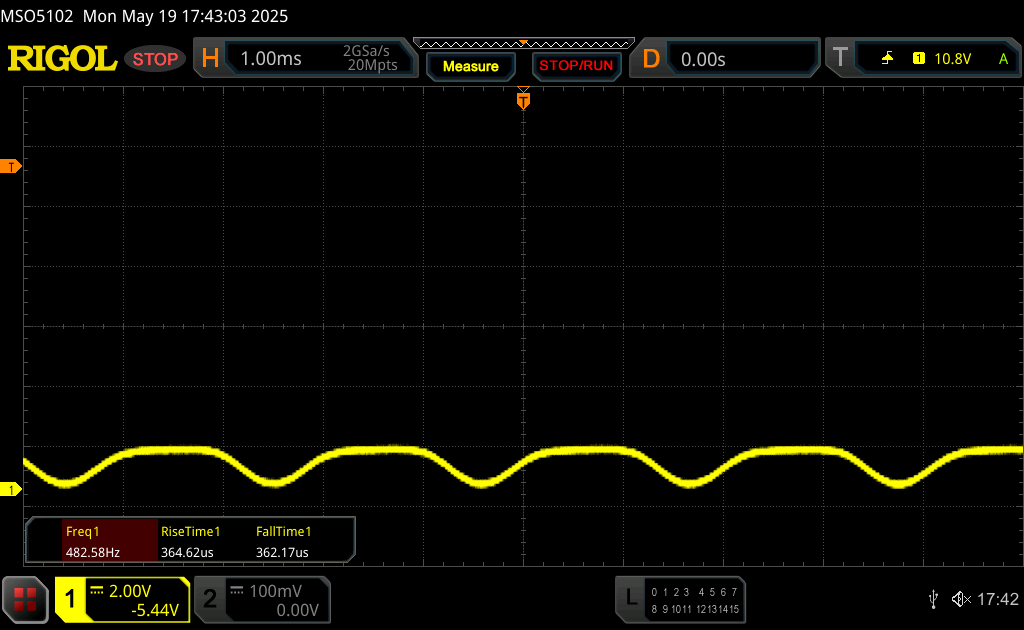
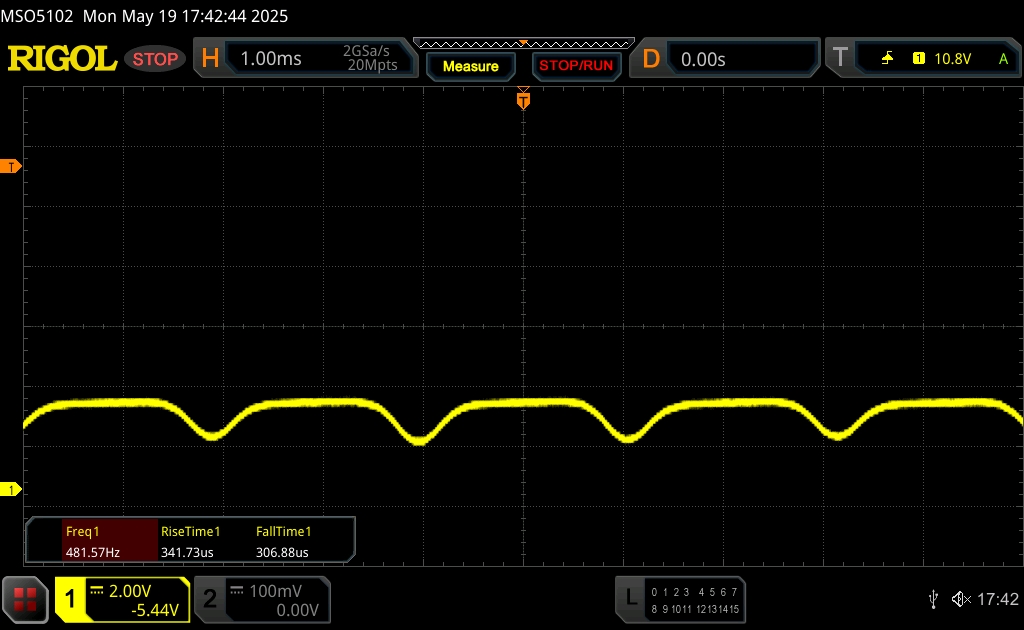
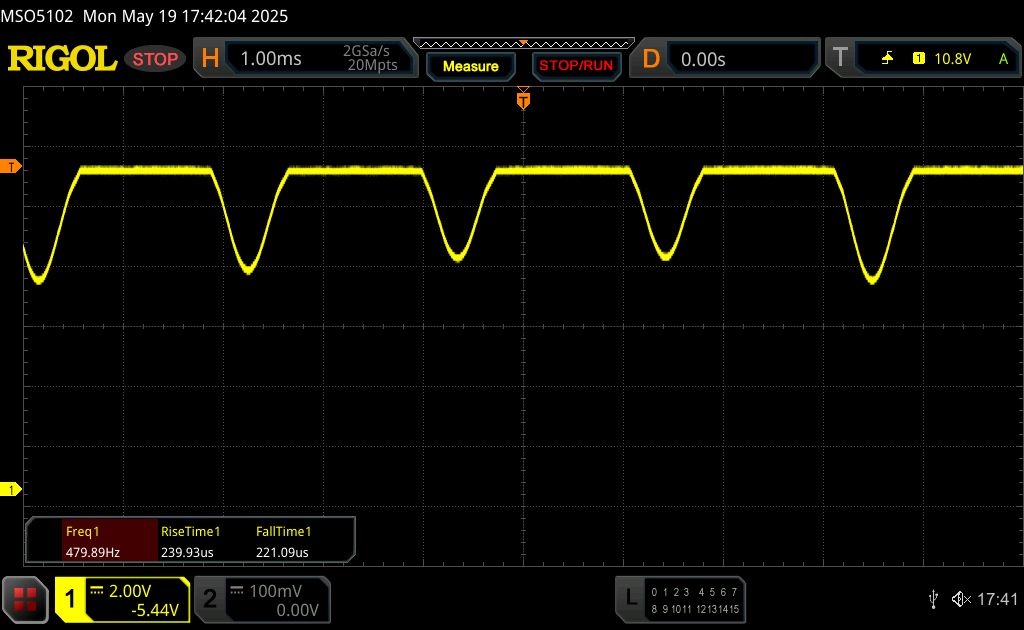
Screen Flickering / PWM (Pulse-Width Modulation)
| Screen flickering / PWM detected | 480 Hz Amplitude: 26 % | ≤ 100 % brightness setting | 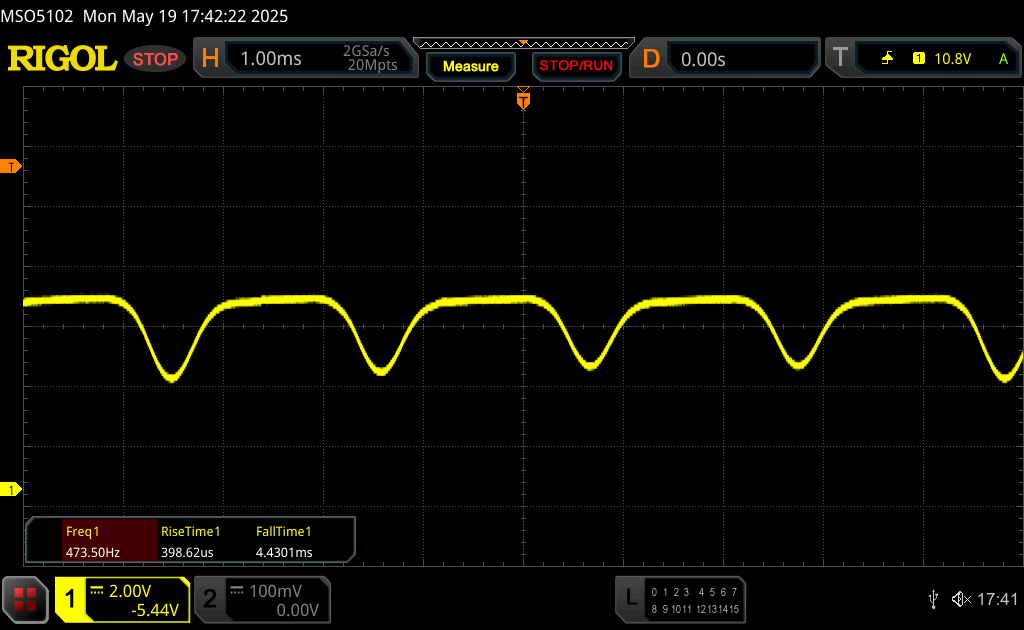 |
The display backlight flickers at 480 Hz (worst case, e.g., utilizing PWM) Flickering detected at a brightness setting of 100 % and below. There should be no flickering or PWM above this brightness setting. The frequency of 480 Hz is relatively high, so most users sensitive to PWM should not notice any flickering. However, there are reports that some users are still sensitive to PWM at 500 Hz and above, so be aware. In comparison: 52 % of all tested devices do not use PWM to dim the display. If PWM was detected, an average of 7753 (minimum: 5 - maximum: 343500) Hz was measured. | |||


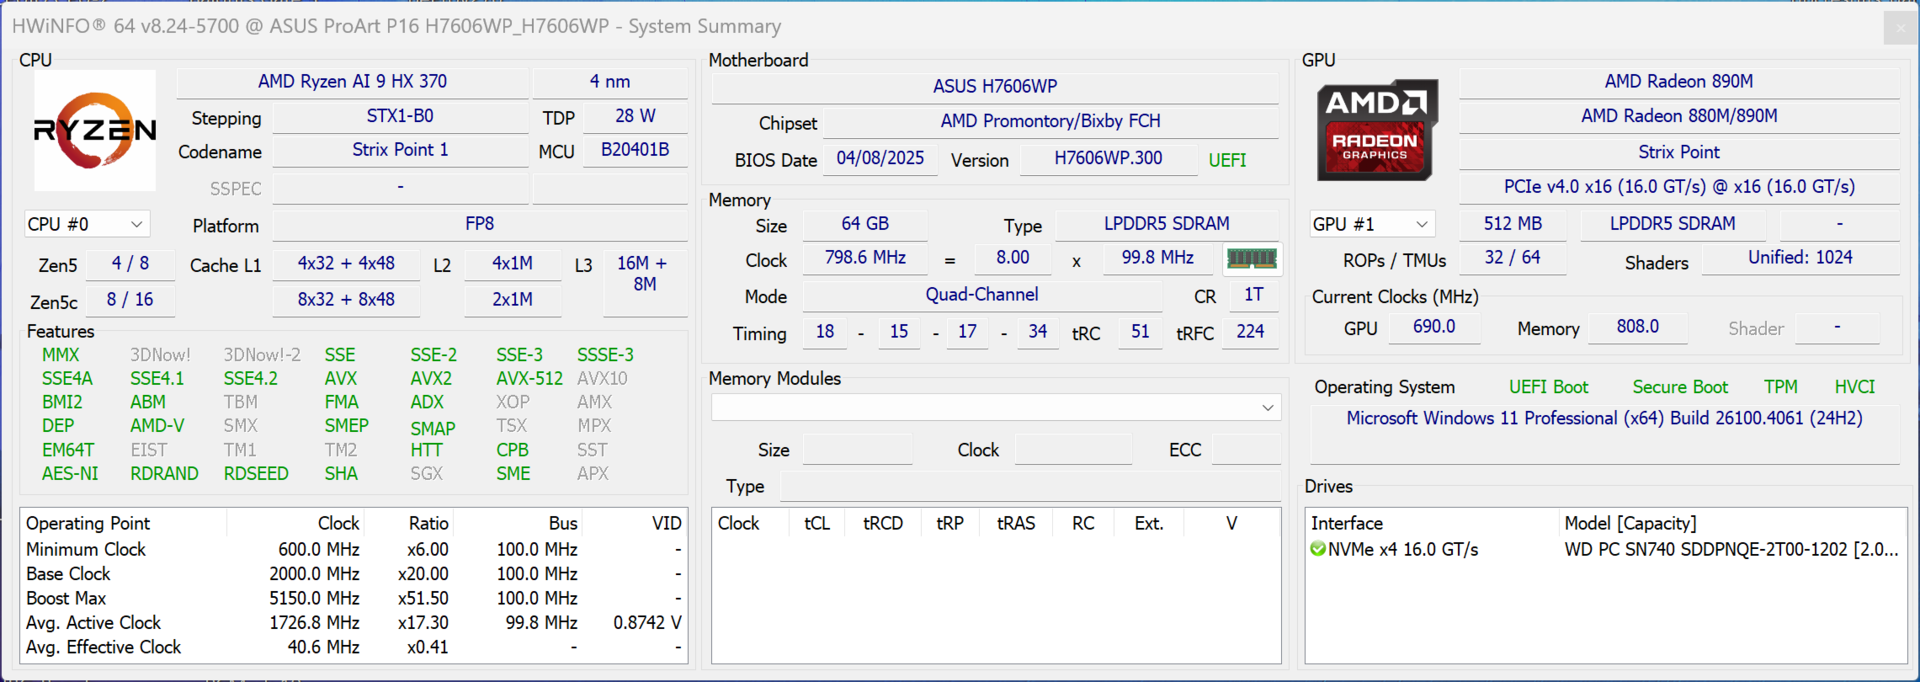
性能 - Ryzen AI 9 HX 370
测试条件
华硕提供了多种能耗配置文件,在以下基准测试/测量中,我们使用了性能模式。
| 能源概况 | CPU TDP | CB24 Multi | GPU TGP | Time Spy 图形 | 赛博朋克 2077 QHD | 最大风扇噪音排放 |
|---|---|---|---|---|---|---|
| 耳语模式 | 55 瓦 | 1,169 分 | 42 瓦 | 8,687 分 | 66fps | 42.8 dB(A) |
| 标准模式 | 70/55 瓦 | 1,178 分 | 80 瓦 | 11,603 分 | 86.7fps | 49.3 dB(A) |
| 性能模式 | 80 瓦 | 1,215 分 | 105 瓦 | 13,010 分 | 97.8fps | 53.7 dB(A) |
| 电池 | 70/50 瓦 | 1,193 分 | 42 瓦 | 8,141 分 | 64.4fps | 44.2 dB(A) |


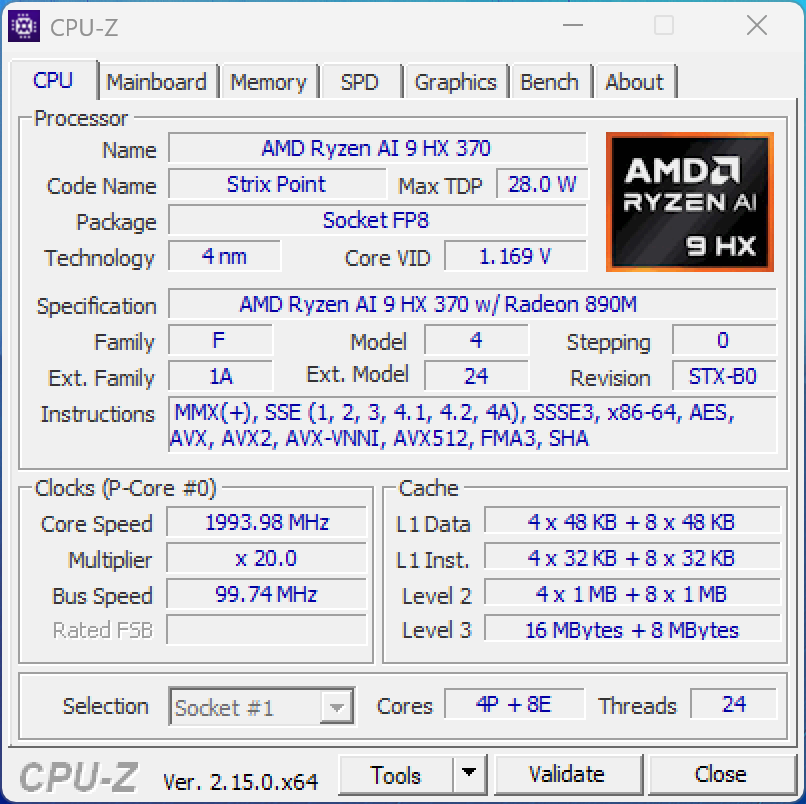
处理器 - Ryzen AI 9 HX 370
这款笔记本电脑仍然使用 Ryzen AI 9 HX 370处理器,其永久功耗为 80 瓦。因此,它的性能与前代产品持平,即使在持续负载的情况下也能保持稳定。即便如此,ThinkBook 16p 配备的 酷睿 i9-14900HX和Apple 的 M4 Pro CPU要快得多。
Cinebench R15 Multi continuous test
Cinebench 2024: CPU Multi Core | CPU Single Core
Cinebench R23: Multi Core | Single Core
Cinebench R20: CPU (Multi Core) | CPU (Single Core)
Cinebench R15: CPU Multi 64Bit | CPU Single 64Bit
Blender: v2.79 BMW27 CPU
7-Zip 18.03: 7z b 4 | 7z b 4 -mmt1
Geekbench 6.7: Multi-Core | Single-Core
Geekbench 5.5: Multi-Core | Single-Core
HWBOT x265 Benchmark v2.2: 4k Preset
LibreOffice : 20 Documents To PDF
R Benchmark 2.5: Overall mean
| CPU Performance rating | |
| Apple MacBook Pro 16 2024 M4 Pro -12! | |
| Lenovo ThinkBook 16p G5 IRX 21N50011GE -2! | |
| Asus ProArt P16 H7606WI | |
| Asus ProArt P16 H7606WP | |
| Average AMD Ryzen AI 9 HX 370 | |
| Lenovo Yoga Pro 9 16IMH9 -2! | |
| Dell XPS 16 9640 | |
| Average of class Multimedia | |
| Cinebench 2024 / CPU Multi Core | |
| Apple MacBook Pro 16 2024 M4 Pro | |
| Asus ProArt P16 H7606WP | |
| Asus ProArt P16 H7606WI | |
| Average AMD Ryzen AI 9 HX 370 (621 - 1299, n=33) | |
| Average of class Multimedia (327 - 2437, n=78, last 2 years) | |
| Dell XPS 16 9640 | |
| Cinebench 2024 / CPU Single Core | |
| Apple MacBook Pro 16 2024 M4 Pro | |
| Average of class Multimedia (72.5 - 201, n=62, last 2 years) | |
| Asus ProArt P16 H7606WP | |
| Average AMD Ryzen AI 9 HX 370 (113.6 - 121, n=23) | |
| Asus ProArt P16 H7606WI | |
| Dell XPS 16 9640 | |
| Cinebench R23 / Multi Core | |
| Lenovo ThinkBook 16p G5 IRX 21N50011GE | |
| Asus ProArt P16 H7606WP | |
| Asus ProArt P16 H7606WI | |
| Apple MacBook Pro 16 2024 M4 Pro | |
| Average AMD Ryzen AI 9 HX 370 (10435 - 23902, n=32) | |
| Lenovo Yoga Pro 9 16IMH9 | |
| Dell XPS 16 9640 | |
| Average of class Multimedia (4861 - 33362, n=79, last 2 years) | |
| Cinebench R23 / Single Core | |
| Apple MacBook Pro 16 2024 M4 Pro | |
| Lenovo ThinkBook 16p G5 IRX 21N50011GE | |
| Asus ProArt P16 H7606WI | |
| Asus ProArt P16 H7606WP | |
| Average AMD Ryzen AI 9 HX 370 (1921 - 2049, n=25) | |
| Average of class Multimedia (1128 - 2459, n=71, last 2 years) | |
| Lenovo Yoga Pro 9 16IMH9 | |
| Dell XPS 16 9640 | |
| Cinebench R20 / CPU (Multi Core) | |
| Lenovo ThinkBook 16p G5 IRX 21N50011GE | |
| Asus ProArt P16 H7606WP | |
| Asus ProArt P16 H7606WI | |
| Average AMD Ryzen AI 9 HX 370 (6449 - 9280, n=24) | |
| Lenovo Yoga Pro 9 16IMH9 | |
| Dell XPS 16 9640 | |
| Average of class Multimedia (1887 - 12912, n=62, last 2 years) | |
| Cinebench R20 / CPU (Single Core) | |
| Lenovo ThinkBook 16p G5 IRX 21N50011GE | |
| Asus ProArt P16 H7606WI | |
| Asus ProArt P16 H7606WP | |
| Average AMD Ryzen AI 9 HX 370 (737 - 804, n=24) | |
| Lenovo Yoga Pro 9 16IMH9 | |
| Average of class Multimedia (425 - 853, n=62, last 2 years) | |
| Dell XPS 16 9640 | |
| Cinebench R15 / CPU Multi 64Bit | |
| Lenovo ThinkBook 16p G5 IRX 21N50011GE | |
| Asus ProArt P16 H7606WI | |
| Asus ProArt P16 H7606WP | |
| Average AMD Ryzen AI 9 HX 370 (2498 - 3551, n=24) | |
| Lenovo Yoga Pro 9 16IMH9 | |
| Dell XPS 16 9640 | |
| Average of class Multimedia (856 - 5224, n=66, last 2 years) | |
| Cinebench R15 / CPU Single 64Bit | |
| Lenovo ThinkBook 16p G5 IRX 21N50011GE | |
| Asus ProArt P16 H7606WI | |
| Average AMD Ryzen AI 9 HX 370 (188.8 - 315, n=24) | |
| Lenovo Yoga Pro 9 16IMH9 | |
| Average of class Multimedia (184.8 - 326, n=64, last 2 years) | |
| Dell XPS 16 9640 | |
| Asus ProArt P16 H7606WP | |
| Blender / v2.79 BMW27 CPU | |
| Average of class Multimedia (100 - 557, n=63, last 2 years) | |
| Dell XPS 16 9640 | |
| Lenovo Yoga Pro 9 16IMH9 | |
| Average AMD Ryzen AI 9 HX 370 (139 - 192, n=25) | |
| Asus ProArt P16 H7606WP | |
| Asus ProArt P16 H7606WI | |
| Lenovo ThinkBook 16p G5 IRX 21N50011GE | |
| 7-Zip 18.03 / 7z b 4 | |
| Lenovo ThinkBook 16p G5 IRX 21N50011GE | |
| Asus ProArt P16 H7606WI | |
| Asus ProArt P16 H7606WP | |
| Average AMD Ryzen AI 9 HX 370 (66154 - 84735, n=24) | |
| Lenovo Yoga Pro 9 16IMH9 | |
| Dell XPS 16 9640 | |
| Average of class Multimedia (26062 - 130368, n=60, last 2 years) | |
| 7-Zip 18.03 / 7z b 4 -mmt1 | |
| Lenovo ThinkBook 16p G5 IRX 21N50011GE | |
| Asus ProArt P16 H7606WI | |
| Average AMD Ryzen AI 9 HX 370 (5859 - 6497, n=24) | |
| Asus ProArt P16 H7606WP | |
| Average of class Multimedia (3666 - 7545, n=61, last 2 years) | |
| Lenovo Yoga Pro 9 16IMH9 | |
| Dell XPS 16 9640 | |
| Geekbench 6.7 / Multi-Core | |
| Apple MacBook Pro 16 2024 M4 Pro | |
| Lenovo ThinkBook 16p G5 IRX 21N50011GE | |
| Asus ProArt P16 H7606WP | |
| Asus ProArt P16 H7606WI | |
| Average of class Multimedia (4983 - 29415, n=74, last 2 years) | |
| Average AMD Ryzen AI 9 HX 370 (11973 - 16311, n=26) | |
| Lenovo Yoga Pro 9 16IMH9 | |
| Dell XPS 16 9640 | |
| Geekbench 6.7 / Single-Core | |
| Apple MacBook Pro 16 2024 M4 Pro | |
| Lenovo ThinkBook 16p G5 IRX 21N50011GE | |
| Asus ProArt P16 H7606WP | |
| Average of class Multimedia (1534 - 4335, n=73, last 2 years) | |
| Average AMD Ryzen AI 9 HX 370 (2780 - 2965, n=26) | |
| Asus ProArt P16 H7606WI | |
| Lenovo Yoga Pro 9 16IMH9 | |
| Dell XPS 16 9640 | |
| Geekbench 5.5 / Multi-Core | |
| Lenovo ThinkBook 16p G5 IRX 21N50011GE | |
| Asus ProArt P16 H7606WP | |
| Asus ProArt P16 H7606WI | |
| Average AMD Ryzen AI 9 HX 370 (11394 - 16322, n=25) | |
| Lenovo Yoga Pro 9 16IMH9 | |
| Dell XPS 16 9640 | |
| Average of class Multimedia (4652 - 20422, n=60, last 2 years) | |
| Geekbench 5.5 / Single-Core | |
| Lenovo ThinkBook 16p G5 IRX 21N50011GE | |
| Asus ProArt P16 H7606WP | |
| Average AMD Ryzen AI 9 HX 370 (1957 - 2175, n=25) | |
| Asus ProArt P16 H7606WI | |
| Average of class Multimedia (805 - 2974, n=60, last 2 years) | |
| Lenovo Yoga Pro 9 16IMH9 | |
| Dell XPS 16 9640 | |
| HWBOT x265 Benchmark v2.2 / 4k Preset | |
| Lenovo ThinkBook 16p G5 IRX 21N50011GE | |
| Asus ProArt P16 H7606WP | |
| Average AMD Ryzen AI 9 HX 370 (20.3 - 28.7, n=24) | |
| Asus ProArt P16 H7606WI | |
| Lenovo Yoga Pro 9 16IMH9 | |
| Dell XPS 16 9640 | |
| Average of class Multimedia (5.26 - 36.1, n=61, last 2 years) | |
| LibreOffice / 20 Documents To PDF | |
| Asus ProArt P16 H7606WI | |
| Average AMD Ryzen AI 9 HX 370 (46.8 - 66.6, n=24) | |
| Asus ProArt P16 H7606WP | |
| Average of class Multimedia (23.9 - 146.7, n=62, last 2 years) | |
| Lenovo ThinkBook 16p G5 IRX 21N50011GE | |
| Dell XPS 16 9640 | |
| Lenovo Yoga Pro 9 16IMH9 | |
| R Benchmark 2.5 / Overall mean | |
| Dell XPS 16 9640 | |
| Average of class Multimedia (0.3604 - 0.947, n=61, last 2 years) | |
| Lenovo Yoga Pro 9 16IMH9 | |
| Average AMD Ryzen AI 9 HX 370 (0.3892 - 0.529, n=24) | |
| Asus ProArt P16 H7606WI | |
| Asus ProArt P16 H7606WP | |
| Lenovo ThinkBook 16p G5 IRX 21N50011GE | |
* ... smaller is better
AIDA64: FP32 Ray-Trace | FPU Julia | CPU SHA3 | CPU Queen | FPU SinJulia | FPU Mandel | CPU AES | CPU ZLib | FP64 Ray-Trace | CPU PhotoWorxx
| Performance rating | |
| Asus ProArt P16 H7606WP | |
| Lenovo ThinkBook 16p G5 IRX 21N50011GE | |
| Asus ProArt P16 H7606WI -2! | |
| Average AMD Ryzen AI 9 HX 370 | |
| Lenovo Yoga Pro 9 16IMH9 | |
| Dell XPS 16 9640 | |
| Average of class Multimedia | |
| AIDA64 / FP32 Ray-Trace | |
| Asus ProArt P16 H7606WP | |
| Average AMD Ryzen AI 9 HX 370 (24673 - 37804, n=25) | |
| Lenovo ThinkBook 16p G5 IRX 21N50011GE | |
| Lenovo Yoga Pro 9 16IMH9 | |
| Average of class Multimedia (2214 - 50388, n=58, last 2 years) | |
| Dell XPS 16 9640 | |
| AIDA64 / FPU Julia | |
| Asus ProArt P16 H7606WI | |
| Asus ProArt P16 H7606WP | |
| Lenovo ThinkBook 16p G5 IRX 21N50011GE | |
| Average AMD Ryzen AI 9 HX 370 (95655 - 148045, n=26) | |
| Lenovo Yoga Pro 9 16IMH9 | |
| Dell XPS 16 9640 | |
| Average of class Multimedia (12867 - 201874, n=59, last 2 years) | |
| AIDA64 / CPU SHA3 | |
| Lenovo ThinkBook 16p G5 IRX 21N50011GE | |
| Asus ProArt P16 H7606WP | |
| Asus ProArt P16 H7606WI | |
| Average AMD Ryzen AI 9 HX 370 (4421 - 5932, n=26) | |
| Lenovo Yoga Pro 9 16IMH9 | |
| Dell XPS 16 9640 | |
| Average of class Multimedia (626 - 8623, n=59, last 2 years) | |
| AIDA64 / CPU Queen | |
| Lenovo ThinkBook 16p G5 IRX 21N50011GE | |
| Asus ProArt P16 H7606WP | |
| Asus ProArt P16 H7606WI | |
| Lenovo Yoga Pro 9 16IMH9 | |
| Dell XPS 16 9640 | |
| Average AMD Ryzen AI 9 HX 370 (41744 - 99088, n=24) | |
| Average of class Multimedia (13483 - 181505, n=46, last 2 years) | |
| AIDA64 / FPU SinJulia | |
| Asus ProArt P16 H7606WI | |
| Asus ProArt P16 H7606WP | |
| Average AMD Ryzen AI 9 HX 370 (16445 - 19120, n=26) | |
| Lenovo ThinkBook 16p G5 IRX 21N50011GE | |
| Lenovo Yoga Pro 9 16IMH9 | |
| Dell XPS 16 9640 | |
| Average of class Multimedia (886 - 28794, n=59, last 2 years) | |
| AIDA64 / FPU Mandel | |
| Asus ProArt P16 H7606WP | |
| Average AMD Ryzen AI 9 HX 370 (50357 - 93798, n=25) | |
| Lenovo ThinkBook 16p G5 IRX 21N50011GE | |
| Lenovo Yoga Pro 9 16IMH9 | |
| Dell XPS 16 9640 | |
| Average of class Multimedia (6395 - 105740, n=58, last 2 years) | |
| AIDA64 / CPU AES | |
| Lenovo ThinkBook 16p G5 IRX 21N50011GE | |
| Asus ProArt P16 H7606WP | |
| Lenovo Yoga Pro 9 16IMH9 | |
| Average AMD Ryzen AI 9 HX 370 (67015 - 118993, n=26) | |
| Dell XPS 16 9640 | |
| Asus ProArt P16 H7606WI | |
| Average of class Multimedia (8171 - 126790, n=59, last 2 years) | |
| AIDA64 / CPU ZLib | |
| Lenovo ThinkBook 16p G5 IRX 21N50011GE | |
| Asus ProArt P16 H7606WI | |
| Asus ProArt P16 H7606WP | |
| Average AMD Ryzen AI 9 HX 370 (1077 - 1530, n=26) | |
| Lenovo Yoga Pro 9 16IMH9 | |
| Dell XPS 16 9640 | |
| Average of class Multimedia (143.8 - 2022, n=59, last 2 years) | |
| AIDA64 / FP64 Ray-Trace | |
| Asus ProArt P16 H7606WI | |
| Asus ProArt P16 H7606WP | |
| Average AMD Ryzen AI 9 HX 370 (13665 - 20648, n=26) | |
| Lenovo ThinkBook 16p G5 IRX 21N50011GE | |
| Lenovo Yoga Pro 9 16IMH9 | |
| Average of class Multimedia (1014 - 26875, n=59, last 2 years) | |
| Dell XPS 16 9640 | |
| AIDA64 / CPU PhotoWorxx | |
| Lenovo Yoga Pro 9 16IMH9 | |
| Dell XPS 16 9640 | |
| Average of class Multimedia (8187 - 88154, n=59, last 2 years) | |
| Lenovo ThinkBook 16p G5 IRX 21N50011GE | |
| Average AMD Ryzen AI 9 HX 370 (36752 - 52671, n=26) | |
| Asus ProArt P16 H7606WI | |
| Asus ProArt P16 H7606WP | |
系统性能
新的 ProArt P16 在合成系统测试中速度非常快,在日常使用中也能快速执行所有输入。在测试过程中,我们没有发现任何稳定性问题。
PCMark 10: Score | Essentials | Productivity | Digital Content Creation
CrossMark: Overall | Productivity | Creativity | Responsiveness
WebXPRT 3: Overall
WebXPRT 4: Overall
Mozilla Kraken 1.1: Total
| Performance rating | |
| Apple MacBook Pro 16 2024 M4 Pro -4! | |
| Lenovo ThinkBook 16p G5 IRX 21N50011GE | |
| Average AMD Ryzen AI 9 HX 370, NVIDIA GeForce RTX 5070 Laptop | |
| Dell XPS 16 9640 -1! | |
| Asus ProArt P16 H7606WP | |
| Average of class Multimedia | |
| Asus ProArt P16 H7606WI | |
| Lenovo Yoga Pro 9 16IMH9 | |
| PCMark 10 / Score | |
| Lenovo ThinkBook 16p G5 IRX 21N50011GE | |
| Asus ProArt P16 H7606WP | |
| Average AMD Ryzen AI 9 HX 370, NVIDIA GeForce RTX 5070 Laptop (n=1) | |
| Asus ProArt P16 H7606WI | |
| Average of class Multimedia (4325 - 10386, n=56, last 2 years) | |
| Lenovo Yoga Pro 9 16IMH9 | |
| Dell XPS 16 9640 | |
| PCMark 10 / Essentials | |
| Lenovo ThinkBook 16p G5 IRX 21N50011GE | |
| Lenovo Yoga Pro 9 16IMH9 | |
| Asus ProArt P16 H7606WP | |
| Average AMD Ryzen AI 9 HX 370, NVIDIA GeForce RTX 5070 Laptop (n=1) | |
| Average of class Multimedia (8025 - 11664, n=55, last 2 years) | |
| Dell XPS 16 9640 | |
| Asus ProArt P16 H7606WI | |
| PCMark 10 / Productivity | |
| Average of class Multimedia (7323 - 18233, n=55, last 2 years) | |
| Lenovo ThinkBook 16p G5 IRX 21N50011GE | |
| Asus ProArt P16 H7606WI | |
| Dell XPS 16 9640 | |
| Lenovo Yoga Pro 9 16IMH9 | |
| Asus ProArt P16 H7606WP | |
| Average AMD Ryzen AI 9 HX 370, NVIDIA GeForce RTX 5070 Laptop (n=1) | |
| PCMark 10 / Digital Content Creation | |
| Asus ProArt P16 H7606WP | |
| Average AMD Ryzen AI 9 HX 370, NVIDIA GeForce RTX 5070 Laptop (n=1) | |
| Lenovo ThinkBook 16p G5 IRX 21N50011GE | |
| Asus ProArt P16 H7606WI | |
| Lenovo Yoga Pro 9 16IMH9 | |
| Average of class Multimedia (3651 - 16240, n=55, last 2 years) | |
| Dell XPS 16 9640 | |
| CrossMark / Overall | |
| Lenovo ThinkBook 16p G5 IRX 21N50011GE | |
| Apple MacBook Pro 16 2024 M4 Pro | |
| Average AMD Ryzen AI 9 HX 370, NVIDIA GeForce RTX 5070 Laptop (1897 - 2028, n=2) | |
| Asus ProArt P16 H7606WP | |
| Average of class Multimedia (866 - 2728, n=65, last 2 years) | |
| Dell XPS 16 9640 | |
| Asus ProArt P16 H7606WI | |
| Lenovo Yoga Pro 9 16IMH9 | |
| CrossMark / Productivity | |
| Lenovo ThinkBook 16p G5 IRX 21N50011GE | |
| Apple MacBook Pro 16 2024 M4 Pro | |
| Average AMD Ryzen AI 9 HX 370, NVIDIA GeForce RTX 5070 Laptop (1718 - 1820, n=2) | |
| Dell XPS 16 9640 | |
| Average of class Multimedia (931 - 2489, n=65, last 2 years) | |
| Asus ProArt P16 H7606WP | |
| Lenovo Yoga Pro 9 16IMH9 | |
| Asus ProArt P16 H7606WI | |
| CrossMark / Creativity | |
| Apple MacBook Pro 16 2024 M4 Pro | |
| Lenovo ThinkBook 16p G5 IRX 21N50011GE | |
| Average AMD Ryzen AI 9 HX 370, NVIDIA GeForce RTX 5070 Laptop (2259 - 2455, n=2) | |
| Asus ProArt P16 H7606WI | |
| Asus ProArt P16 H7606WP | |
| Average of class Multimedia (907 - 3465, n=65, last 2 years) | |
| Dell XPS 16 9640 | |
| Lenovo Yoga Pro 9 16IMH9 | |
| CrossMark / Responsiveness | |
| Lenovo ThinkBook 16p G5 IRX 21N50011GE | |
| Dell XPS 16 9640 | |
| Apple MacBook Pro 16 2024 M4 Pro | |
| Average AMD Ryzen AI 9 HX 370, NVIDIA GeForce RTX 5070 Laptop (1516 - 1581, n=2) | |
| Asus ProArt P16 H7606WP | |
| Average of class Multimedia (605 - 2024, n=65, last 2 years) | |
| Lenovo Yoga Pro 9 16IMH9 | |
| Asus ProArt P16 H7606WI | |
| WebXPRT 3 / Overall | |
| Apple MacBook Pro 16 2024 M4 Pro | |
| Lenovo ThinkBook 16p G5 IRX 21N50011GE | |
| Average AMD Ryzen AI 9 HX 370, NVIDIA GeForce RTX 5070 Laptop (326 - 352, n=2) | |
| Average of class Multimedia (136.4 - 596, n=68, last 2 years) | |
| Asus ProArt P16 H7606WP | |
| Asus ProArt P16 H7606WI | |
| Lenovo Yoga Pro 9 16IMH9 | |
| Dell XPS 16 9640 | |
| WebXPRT 4 / Overall | |
| Apple MacBook Pro 16 2024 M4 Pro | |
| Lenovo ThinkBook 16p G5 IRX 21N50011GE | |
| Average AMD Ryzen AI 9 HX 370, NVIDIA GeForce RTX 5070 Laptop (275 - 345, n=2) | |
| Average of class Multimedia (167.3 - 402, n=70, last 2 years) | |
| Asus ProArt P16 H7606WP | |
| Lenovo Yoga Pro 9 16IMH9 | |
| Dell XPS 16 9640 | |
| Asus ProArt P16 H7606WI | |
| Mozilla Kraken 1.1 / Total | |
| Lenovo Yoga Pro 9 16IMH9 | |
| Average of class Multimedia (228 - 835, n=71, last 2 years) | |
| Asus ProArt P16 H7606WP | |
| Asus ProArt P16 H7606WI | |
| Lenovo ThinkBook 16p G5 IRX 21N50011GE | |
| Average AMD Ryzen AI 9 HX 370, NVIDIA GeForce RTX 5070 Laptop (416 - 444, n=2) | |
| Apple MacBook Pro 16 2024 M4 Pro | |
* ... smaller is better
| PCMark 10 Score | 8114 points | |
Help | ||
| AIDA64 / Memory Copy | |
| Lenovo Yoga Pro 9 16IMH9 | |
| Dell XPS 16 9640 | |
| Asus ProArt P16 H7606WI | |
| Asus ProArt P16 H7606WP | |
| Average AMD Ryzen AI 9 HX 370 (71902 - 93640, n=26) | |
| Average of class Multimedia (11299 - 132135, n=59, last 2 years) | |
| Lenovo ThinkBook 16p G5 IRX 21N50011GE | |
| AIDA64 / Memory Read | |
| Asus ProArt P16 H7606WI | |
| Asus ProArt P16 H7606WP | |
| Average AMD Ryzen AI 9 HX 370 (81367 - 102937, n=26) | |
| Lenovo Yoga Pro 9 16IMH9 | |
| Lenovo ThinkBook 16p G5 IRX 21N50011GE | |
| Dell XPS 16 9640 | |
| Average of class Multimedia (11624 - 174586, n=59, last 2 years) | |
| AIDA64 / Memory Write | |
| Asus ProArt P16 H7606WI | |
| Asus ProArt P16 H7606WP | |
| Average AMD Ryzen AI 9 HX 370 (78939 - 108954, n=26) | |
| Average of class Multimedia (11755 - 134998, n=59, last 2 years) | |
| Lenovo ThinkBook 16p G5 IRX 21N50011GE | |
| Lenovo Yoga Pro 9 16IMH9 | |
| Dell XPS 16 9640 | |
| AIDA64 / Memory Latency | |
| Dell XPS 16 9640 | |
| Lenovo Yoga Pro 9 16IMH9 | |
| Average of class Multimedia (7 - 535, n=58, last 2 years) | |
| Asus ProArt P16 H7606WI | |
| Asus ProArt P16 H7606WP | |
| Average AMD Ryzen AI 9 HX 370 (86.7 - 119.4, n=26) | |
| Lenovo ThinkBook 16p G5 IRX 21N50011GE | |
* ... smaller is better
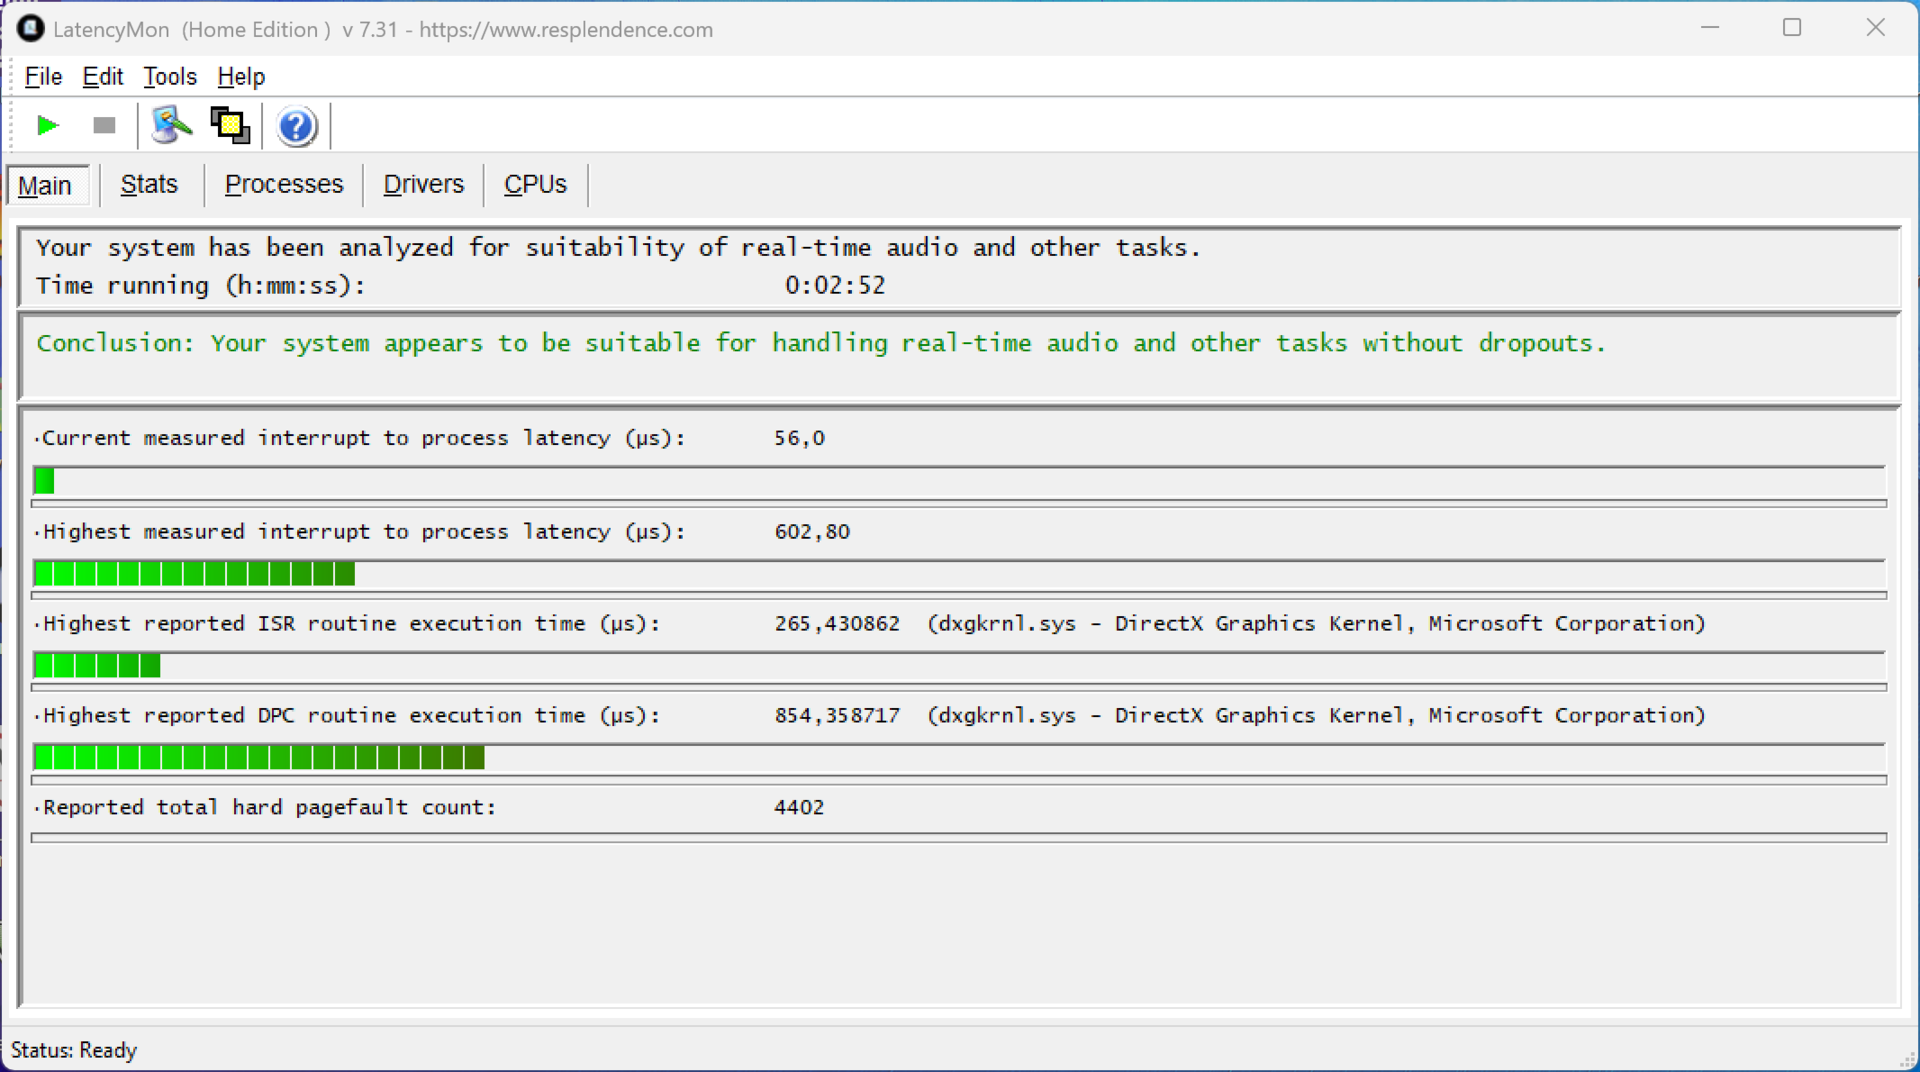
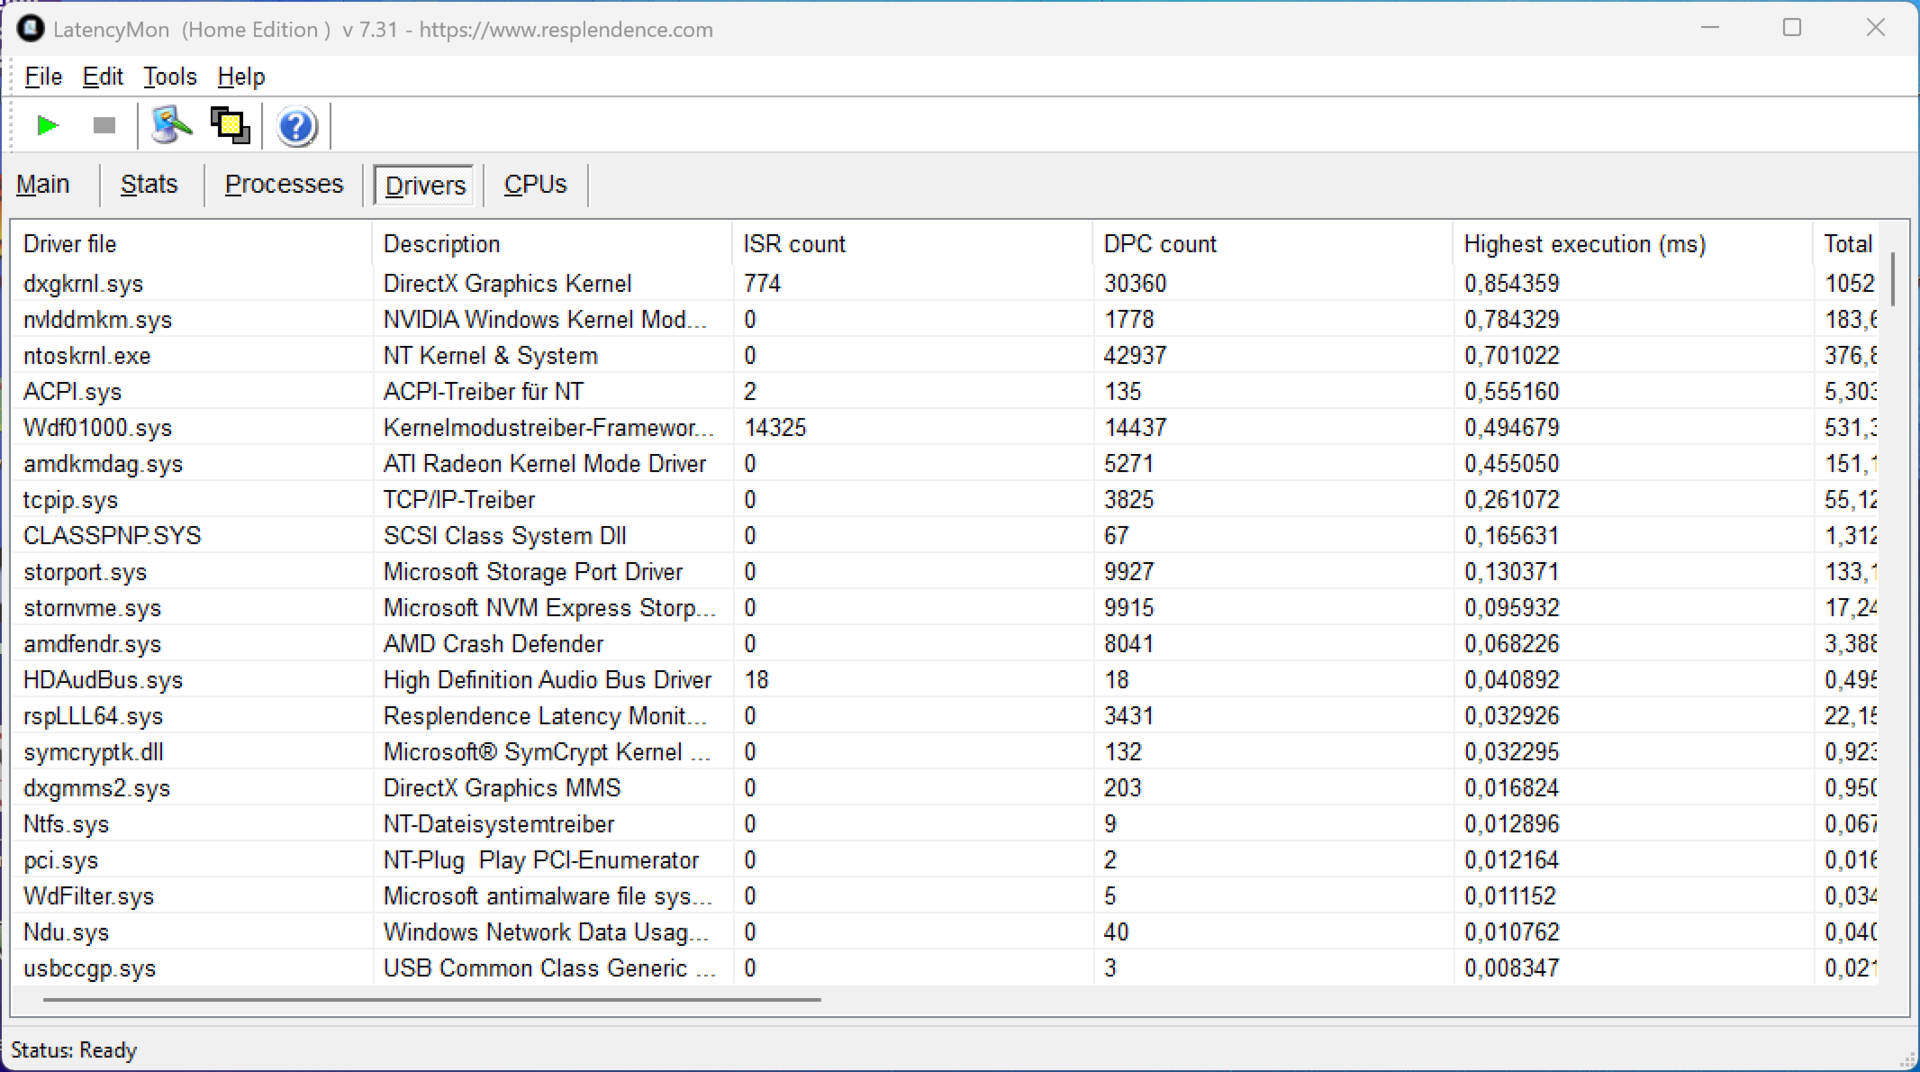
DPC 延迟
在我们的标准延迟测试中(上网、4K YouTube 播放、CPU 负载),我们的测试设备在使用实时音频应用程序时,当前 BIOS 版本没有显示任何限制。
| DPC Latencies / LatencyMon - interrupt to process latency (max), Web, Youtube, Prime95 | |
| Dell XPS 16 9640 | |
| Asus ProArt P16 H7606WP | |
| Lenovo ThinkBook 16p G5 IRX 21N50011GE | |
| Lenovo Yoga Pro 9 16IMH9 | |
* ... smaller is better
存储设备
ProArt P16 有两个用于固态硬盘的 M.2-2280 插槽,其中一个仅以一半的速度连接(1x PCIe 4.0 x4、1x PCIe 4.0 x2)。我们的测试设备安装了 2 TB 版本的 WD SN740(用户可免费使用 1.75 TB),其传输速率即使在长期负载的情况下也不会下降。


* ... smaller is better
Reading continuous performance: DiskSpd Read Loop, Queue Depth 8
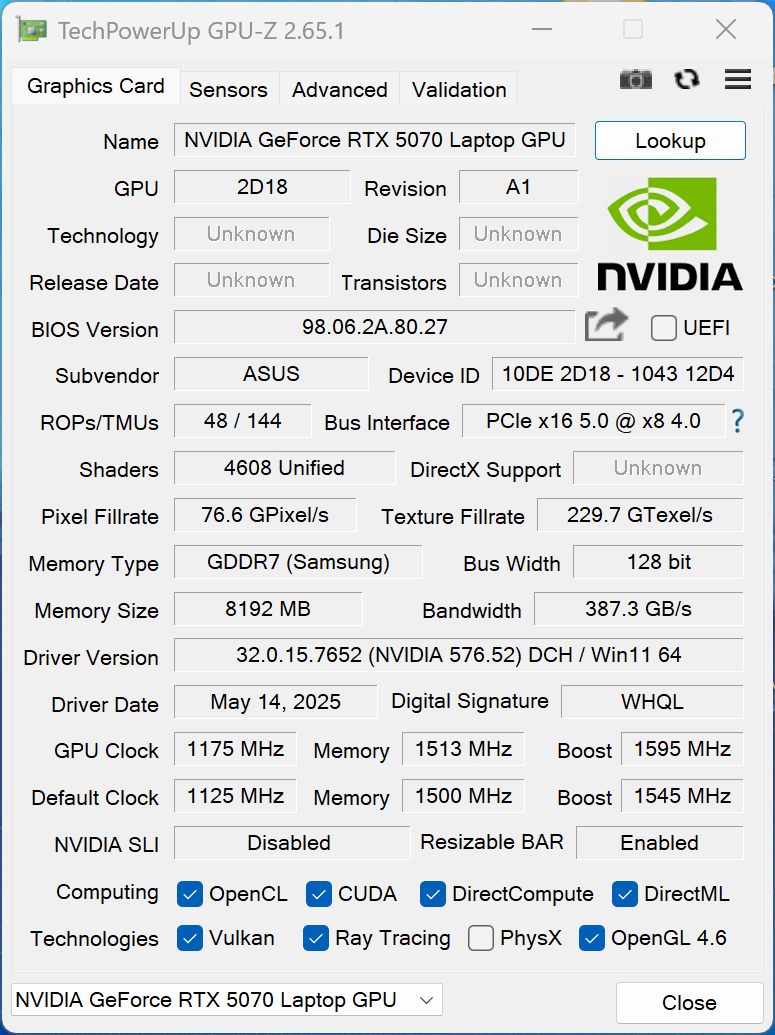
图形处理器性能
我们的测试设备配备了全新的 GeForce RTX 5070 笔记本电脑显卡切换采用的是普通的 Optimus 技术。这是 105 瓦版本的 RTX 5070 笔记本电脑,该笔记本电脑仍配备 8 GB VRAM,在玩某些游戏时可能会受到限制。就其纯性能而言,在我们的测试中,新机型仅比配备 RTX 4070 笔记本电脑的旧 ProArt P16 领先 6-12%。在游戏方面,在运行我们的标准测试游戏时,它的领先优势为 16%,当然根据游戏的不同也会有差异。
| 3DMark 11 Performance | 35945 points | |
| 3DMark Fire Strike Score | 29156 points | |
| 3DMark Time Spy Score | 12466 points | |
| 3DMark Steel Nomad Score | 2935 points | |
| 3DMark Steel Nomad Light Score | 13261 points | |
| 3DMark Steel Nomad Light Unlimited Score | 13765 points | |
Help | ||
| Blender / v3.3 Classroom OPTIX/RTX | |
| Average of class Multimedia (12 - 105, n=24, last 2 years) | |
| Lenovo ThinkBook 16p G5 IRX 21N50011GE | |
| Asus ProArt P16 H7606WI | |
| Dell XPS 16 9640 | |
| Average NVIDIA GeForce RTX 5070 Laptop (17 - 24, n=28) | |
| Lenovo Yoga Pro 9 16IMH9 | |
| Asus ProArt P16 H7606WP | |
| Blender / v3.3 Classroom CUDA | |
| Average of class Multimedia (20 - 186, n=24, last 2 years) | |
| Lenovo ThinkBook 16p G5 IRX 21N50011GE | |
| Average NVIDIA GeForce RTX 5070 Laptop (29 - 228, n=29) | |
| Dell XPS 16 9640 | |
| Asus ProArt P16 H7606WI | |
| Asus ProArt P16 H7606WP | |
| Lenovo Yoga Pro 9 16IMH9 | |
| Blender / v3.3 Classroom CPU | |
| Average of class Multimedia (134.5 - 1042, n=65, last 2 years) | |
| Dell XPS 16 9640 | |
| Lenovo Yoga Pro 9 16IMH9 | |
| Average NVIDIA GeForce RTX 5070 Laptop (137 - 507, n=26) | |
| Asus ProArt P16 H7606WI | |
| Asus ProArt P16 H7606WP | |
| Lenovo ThinkBook 16p G5 IRX 21N50011GE | |
* ... smaller is better
| Performance rating - Percent | |
| Asus ProArt P16 H7606WP | |
| Lenovo ThinkBook 16p G5 IRX 21N50011GE -1! | |
| Lenovo Yoga Pro 9 16IMH9 | |
| Asus ProArt P16 H7606WI | |
| Dell XPS 16 9640 | |
| Average of class Multimedia | |
| Cyberpunk 2077 - 1920x1080 Ultra Preset (FSR off) | |
| Asus ProArt P16 H7606WP | |
| Asus ProArt P16 H7606WI | |
| Lenovo Yoga Pro 9 16IMH9 | |
| Lenovo ThinkBook 16p G5 IRX 21N50011GE | |
| Dell XPS 16 9640 | |
| Average of class Multimedia (6.41 - 112.3, n=76, last 2 years) | |
| Baldur's Gate 3 - 1920x1080 Ultra Preset AA:T | |
| Asus ProArt P16 H7606WP | |
| Lenovo Yoga Pro 9 16IMH9 | |
| Lenovo ThinkBook 16p G5 IRX 21N50011GE | |
| Dell XPS 16 9640 | |
| Asus ProArt P16 H7606WI | |
| Average of class Multimedia (7.8 - 158.7, n=70, last 2 years) | |
| GTA V - 1920x1080 Highest AA:4xMSAA + FX AF:16x | |
| Lenovo ThinkBook 16p G5 IRX 21N50011GE | |
| Asus ProArt P16 H7606WP | |
| Asus ProArt P16 H7606WI | |
| Lenovo Yoga Pro 9 16IMH9 | |
| Dell XPS 16 9640 | |
| Average of class Multimedia (7.92 - 141.6, n=61, last 2 years) | |
| Final Fantasy XV Benchmark - 1920x1080 High Quality | |
| Asus ProArt P16 H7606WP | |
| Lenovo Yoga Pro 9 16IMH9 | |
| Asus ProArt P16 H7606WI | |
| Lenovo ThinkBook 16p G5 IRX 21N50011GE | |
| Dell XPS 16 9640 | |
| Average of class Multimedia (7.61 - 144.4, n=63, last 2 years) | |
| Strange Brigade - 1920x1080 ultra AA:ultra AF:16 | |
| Asus ProArt P16 H7606WP | |
| Lenovo Yoga Pro 9 16IMH9 | |
| Asus ProArt P16 H7606WI | |
| Dell XPS 16 9640 | |
| Average of class Multimedia (13.3 - 303, n=63, last 2 years) | |
| Dota 2 Reborn - 1920x1080 ultra (3/3) best looking | |
| Lenovo ThinkBook 16p G5 IRX 21N50011GE | |
| Asus ProArt P16 H7606WI | |
| Lenovo Yoga Pro 9 16IMH9 | |
| Asus ProArt P16 H7606WP | |
| Average of class Multimedia (29 - 179.9, n=65, last 2 years) | |
| Dell XPS 16 9640 | |
Cyberpunk 2077 ultra FPS diagram
| low | med. | high | ultra | QHD | |
|---|---|---|---|---|---|
| GTA V (2015) | 121.1 | 109.9 | |||
| Dota 2 Reborn (2015) | 170.3 | 151.8 | 138.8 | 130.9 | |
| Final Fantasy XV Benchmark (2018) | 202 | 165.5 | 132 | 100.5 | |
| X-Plane 11.11 (2018) | 102.8 | 94.1 | 73.9 | ||
| Strange Brigade (2018) | 391 | 318 | 281 | 247 | 166.6 |
| Baldur's Gate 3 (2023) | 165.1 | 143.6 | 129.3 | 127.3 | 88.4 |
| Cyberpunk 2077 (2023) | 127 | 121.1 | 108.3 | 97.8 | 64.6 |
| Alan Wake 2 (2023) | 84.1 | 76.8 | 71.3 | 43.8 | |
| F1 24 (2024) | 199.3 | 80.7 | 51.1 | ||
| Assassin's Creed Shadows (2025) | 81 | 71 | 61 | 43 | 31 |
| F1 25 (2025) | 176.5 | 171 | 161 | 27.7 | 9.17 |
排放与能源
噪音排放
在日常使用中,我们建议使用耳语模式,因为在执行简单任务时,设备的两个风扇通常会被关闭。不过,在 "性能"模式下,风扇几乎总是处于激活状态,而且风扇还会发出轻微的脉冲,这可能会让人感觉有点恼火。在负载情况下,噪音也会迅速增大,我们在游戏和压力测试中测得的噪音接近 54 分贝(A)。我们的测试设备上没有其他电子噪音。
Noise level
| Idle |
| 26.7 / 26.7 / 31.1 dB(A) |
| Load |
| 44.8 / 53.7 dB(A) |
 | ||
30 dB silent 40 dB(A) audible 50 dB(A) loud |
||
min: | ||
| Asus ProArt P16 H7606WP GeForce RTX 5070 Laptop, Ryzen AI 9 HX 370, WD PC SN740 SDDPNQE-2T00 | Apple MacBook Pro 16 2024 M4 Pro M4 Pro 20-Core GPU, M4 Pro 14-Core, Apple SSD AP2048Z | Lenovo ThinkBook 16p G5 IRX 21N50011GE GeForce RTX 4060 Laptop GPU, i9-14900HX, SK Hynix HFS001TEJ9X115N | Asus ProArt P16 H7606WI GeForce RTX 4070 Laptop GPU, Ryzen AI 9 HX 370, Micron 2400 MTFDKBA1T0QFM | Lenovo Yoga Pro 9 16IMH9 GeForce RTX 4070 Laptop GPU, Ultra 9 185H, SK Hynix HFS001TEJ9X115N | Dell XPS 16 9640 GeForce RTX 4070 Laptop GPU, Ultra 7 155H, Kioxia XG8 KXG80ZNV1T02 | |
|---|---|---|---|---|---|---|
| Noise | 20% | 1% | 1% | 4% | 7% | |
| off / environment * (dB) | 23.5 | 24 -2% | 25 -6% | 24.4 -4% | 24.3 -3% | 24.5 -4% |
| Idle Minimum * (dB) | 26.7 | 24 10% | 25 6% | 24.4 9% | 24.3 9% | 24.5 8% |
| Idle Average * (dB) | 26.7 | 24 10% | 25 6% | 27.7 -4% | 24.3 9% | 24.5 8% |
| Idle Maximum * (dB) | 31.1 | 24 23% | 25 20% | 32.3 -4% | 25.8 17% | 27.5 12% |
| Load Average * (dB) | 44.8 | 25.3 44% | 47.9 -7% | 42.2 6% | 48.1 -7% | 39.6 12% |
| Cyberpunk 2077 ultra * (dB) | 53.7 | 33.9 37% | 57.3 -7% | 53.2 1% | ||
| Load Maximum * (dB) | 53.7 | 42.3 21% | 57.4 -7% | 53.2 1% | 53.9 -0% | 49.7 7% |
| Witcher 3 ultra * (dB) | 49.7 | 49.7 |
* ... smaller is better
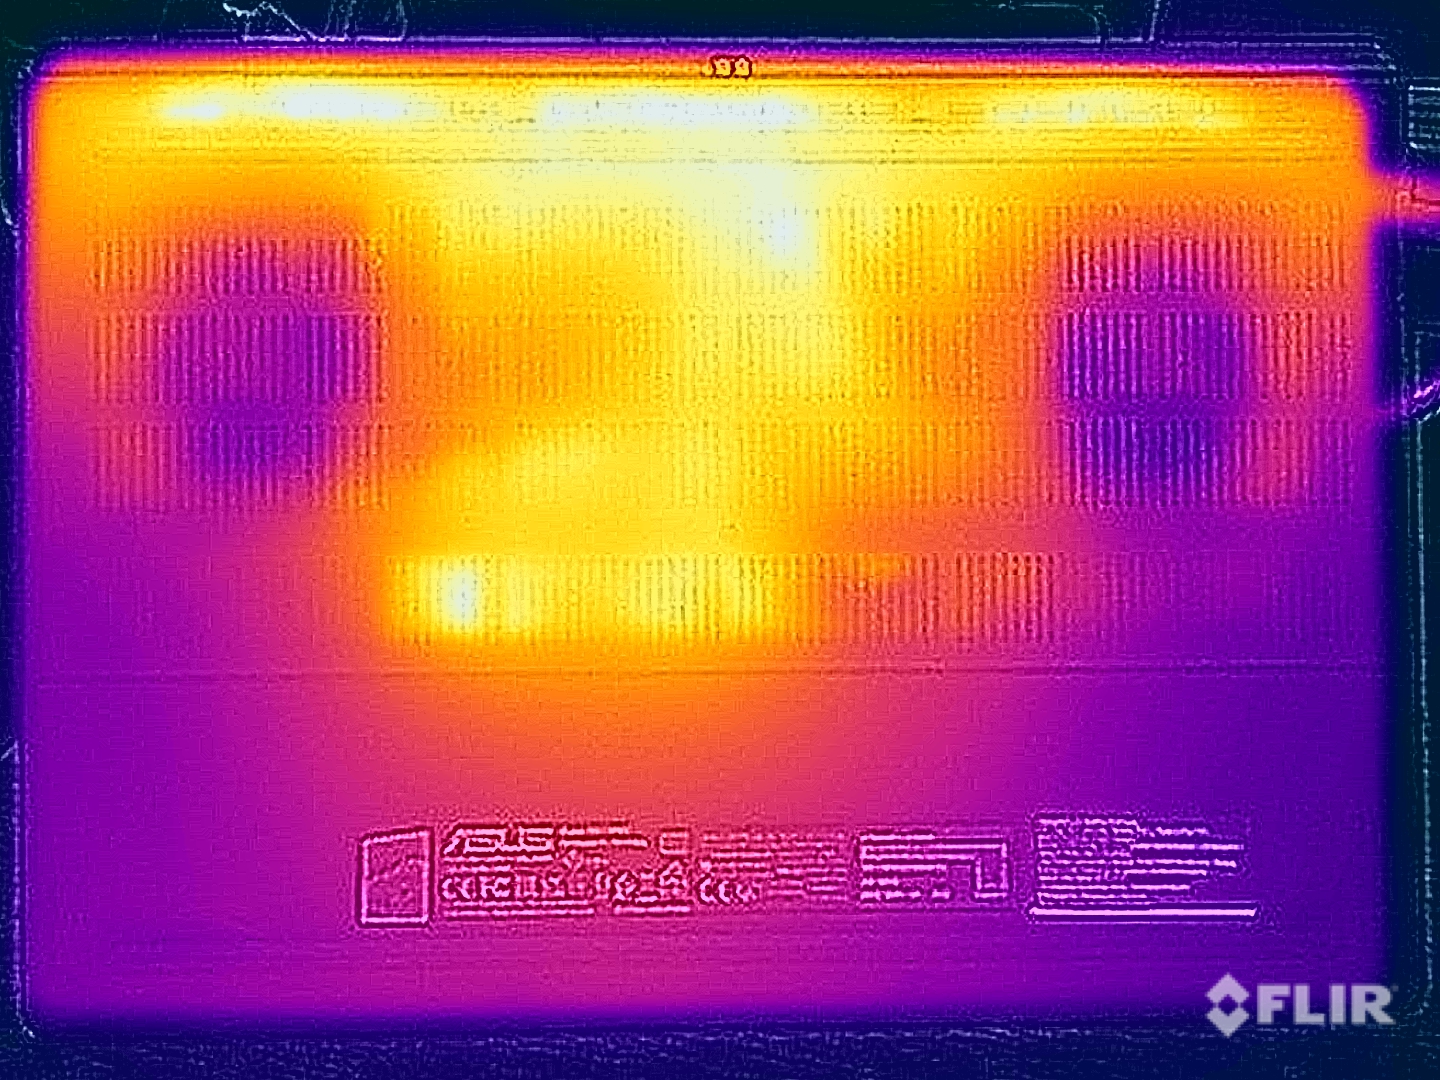
温度
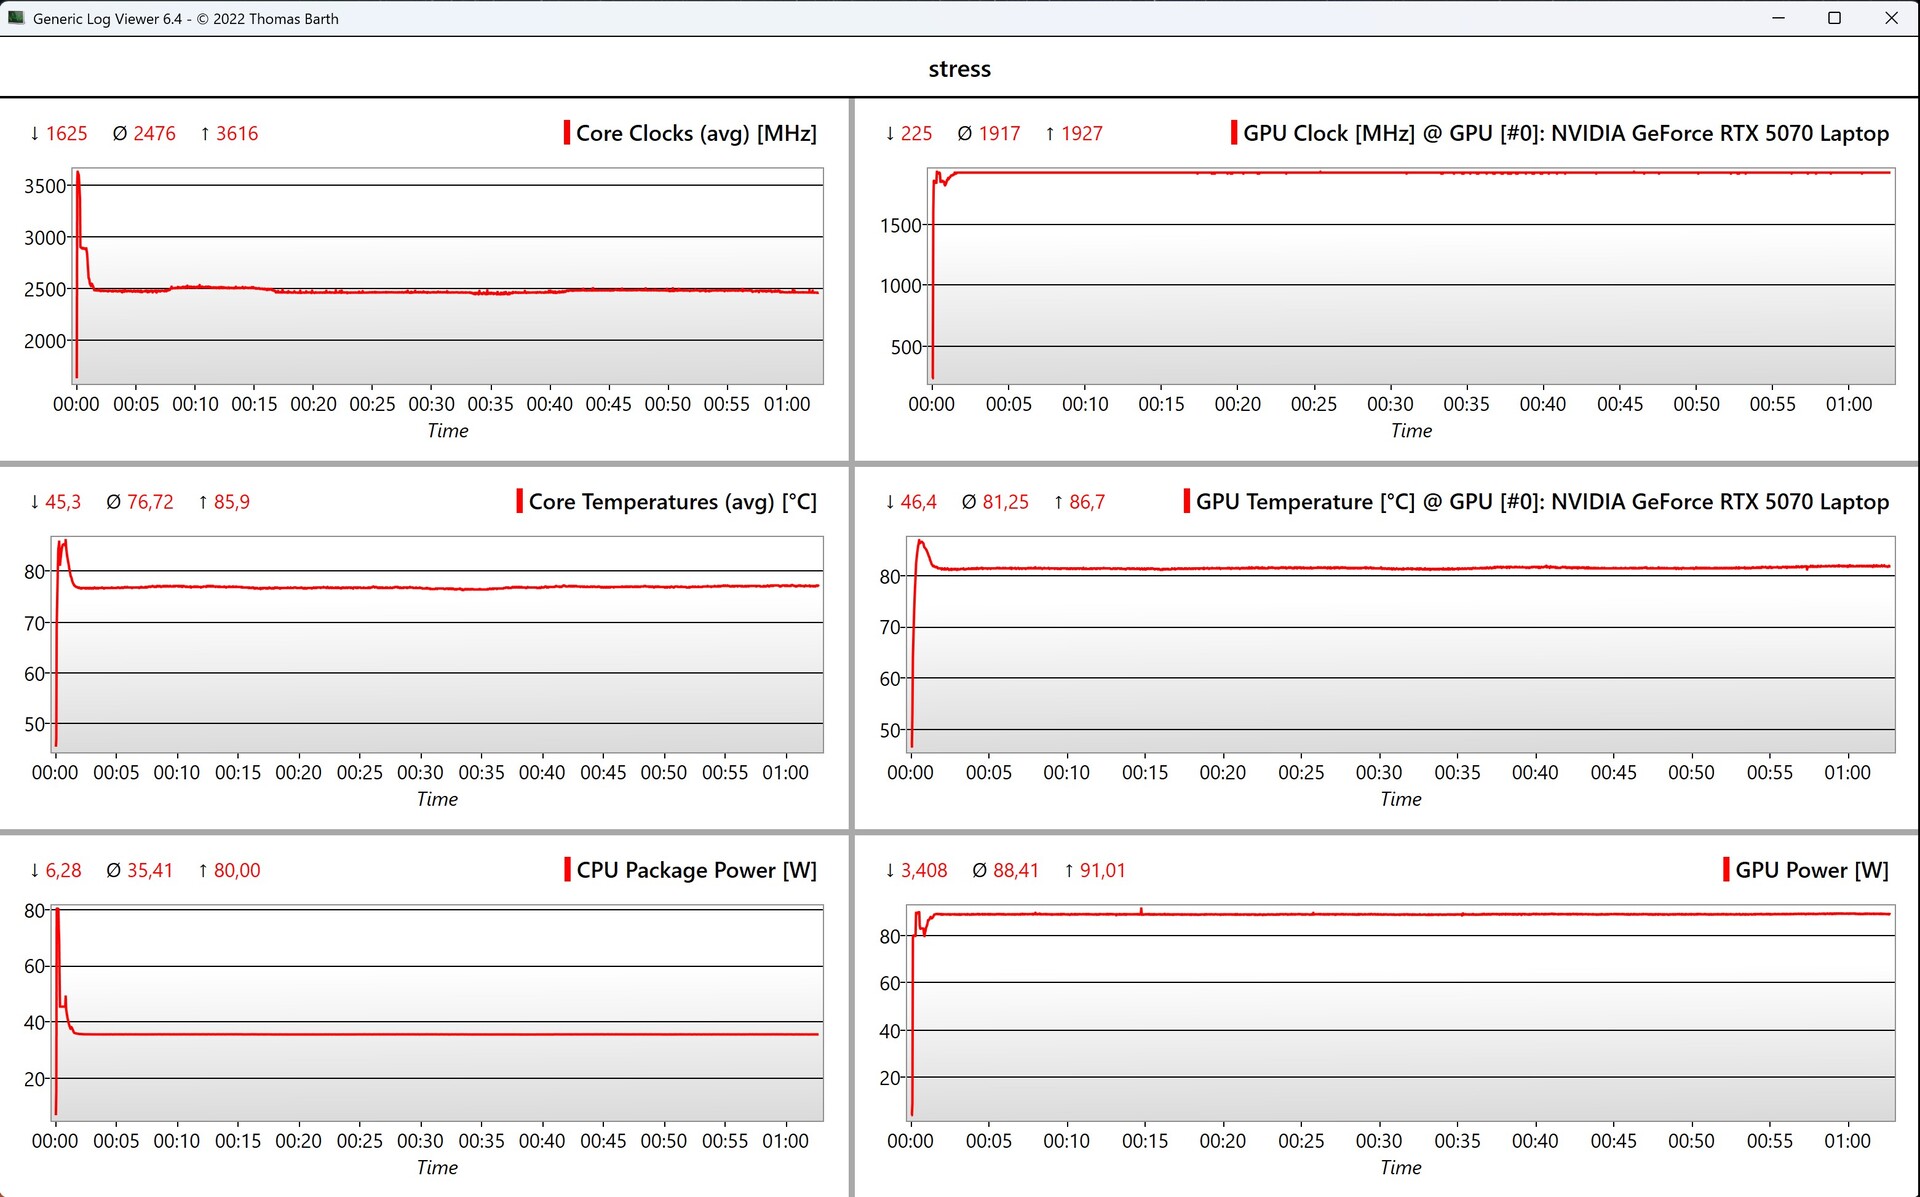
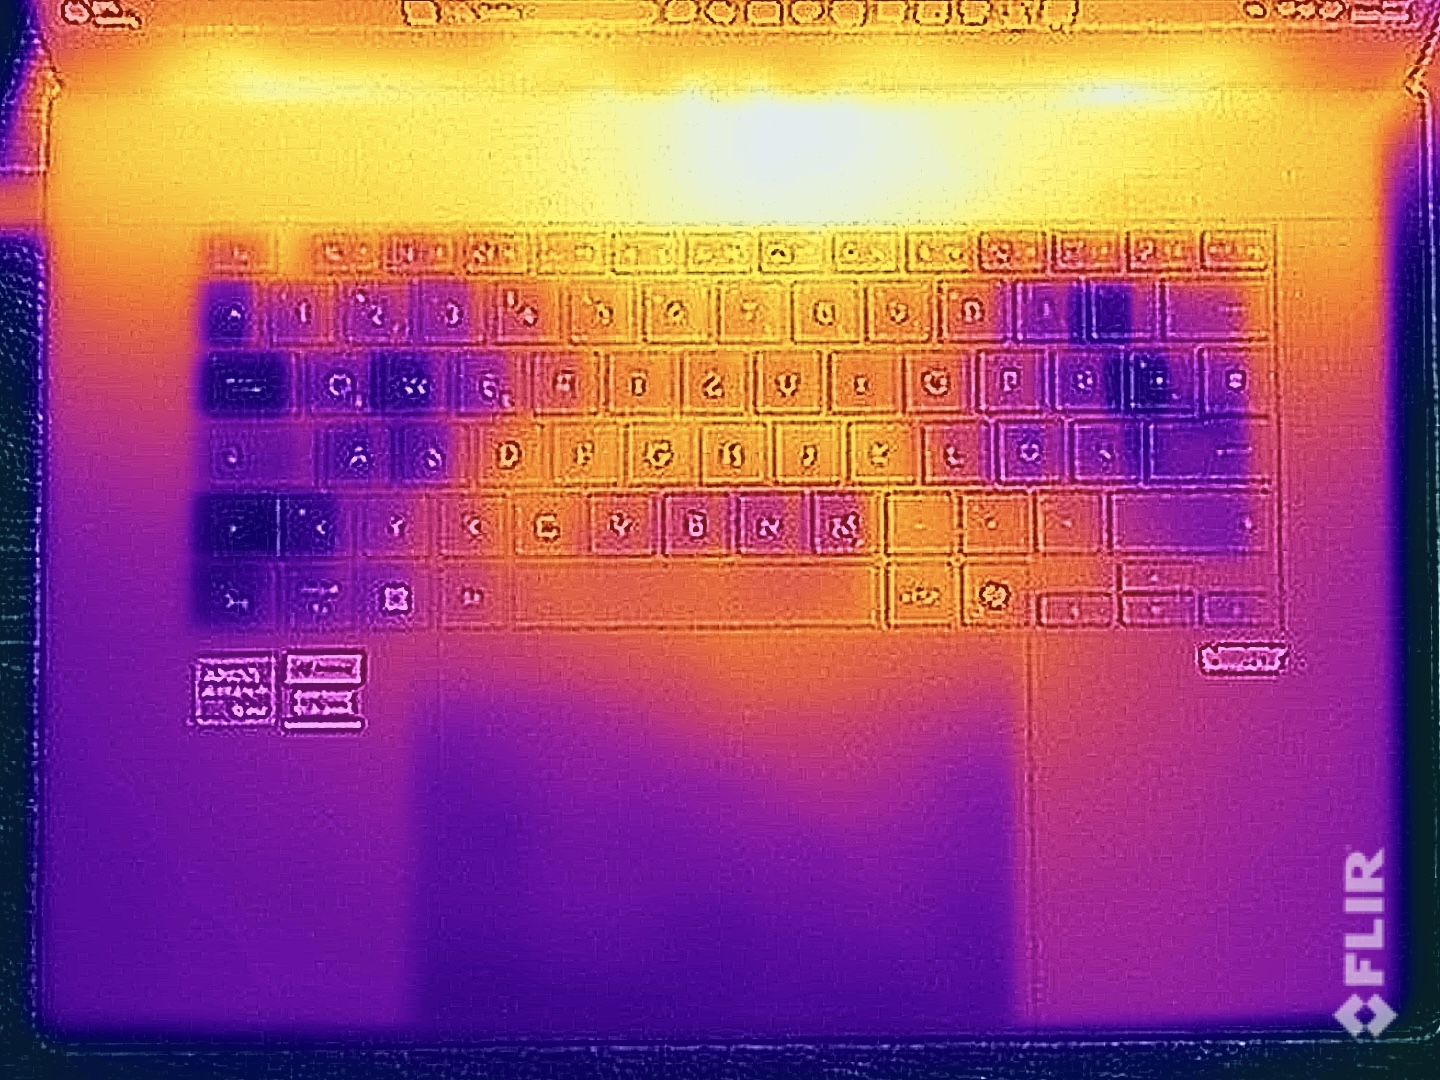
笔记本电脑的表面温度比旧款略低,但 ProArt P16 在负载情况下仍会变得相当热。不过,由于底部中间区域的最高温度为 47 °C,这并不严重,设备仍然可以放在大腿上。键盘上方有一个热点,但键盘本身的温度要低得多。在压力测试中,CPU 和 GPU 分别稳定在 35 瓦和 88 瓦。
(-) The maximum temperature on the upper side is 47 °C / 117 F, compared to the average of 36.8 °C / 98 F, ranging from 21 to 71 °C for the class Multimedia.
(-) The bottom heats up to a maximum of 47.4 °C / 117 F, compared to the average of 39.1 °C / 102 F
(+) In idle usage, the average temperature for the upper side is 25.4 °C / 78 F, compared to the device average of 31.3 °C / 88 F.
(±) 3: The average temperature for the upper side is 37.7 °C / 100 F, compared to the average of 31.3 °C / 88 F for the class Multimedia.
(+) The palmrests and touchpad are reaching skin temperature as a maximum (32.5 °C / 90.5 F) and are therefore not hot.
(-) The average temperature of the palmrest area of similar devices was 28.7 °C / 83.7 F (-3.8 °C / -6.8 F).
| Asus ProArt P16 H7606WP AMD Ryzen AI 9 HX 370, NVIDIA GeForce RTX 5070 Laptop | Apple MacBook Pro 16 2024 M4 Pro Apple M4 Pro 14-Core, Apple M4 Pro 20-Core GPU | Lenovo ThinkBook 16p G5 IRX 21N50011GE Intel Core i9-14900HX, NVIDIA GeForce RTX 4060 Laptop GPU | Asus ProArt P16 H7606WI AMD Ryzen AI 9 HX 370, NVIDIA GeForce RTX 4070 Laptop GPU | Lenovo Yoga Pro 9 16IMH9 Intel Core Ultra 9 185H, NVIDIA GeForce RTX 4070 Laptop GPU | Dell XPS 16 9640 Intel Core Ultra 7 155H, NVIDIA GeForce RTX 4070 Laptop GPU | |
|---|---|---|---|---|---|---|
| Heat | 14% | 7% | -8% | 3% | 7% | |
| Maximum Upper Side * (°C) | 47 | 42.7 9% | 41.1 13% | 46.9 -0% | 41.7 11% | 39.4 16% |
| Maximum Bottom * (°C) | 47.4 | 43.1 9% | 40.8 14% | 50.9 -7% | 46.3 2% | 36.9 22% |
| Idle Upper Side * (°C) | 26.1 | 21.5 18% | 26 -0% | 28.9 -11% | 26.2 -0% | 28.2 -8% |
| Idle Bottom * (°C) | 26.4 | 21.5 19% | 26 2% | 30 -14% | 27.2 -3% | 27.4 -4% |
* ... smaller is better
发言人
ProArt P16 的音响系统依然出色,是市场上这方面最好的笔记本电脑之一。
Asus ProArt P16 H7606WP audio analysis
(+) | speakers can play relatively loud (82 dB)
Bass 100 - 315 Hz
(+) | good bass - only 4.2% away from median
(±) | linearity of bass is average (8.8% delta to prev. frequency)
Mids 400 - 2000 Hz
(+) | balanced mids - only 4.4% away from median
(+) | mids are linear (3.2% delta to prev. frequency)
Highs 2 - 16 kHz
(+) | balanced highs - only 1.3% away from median
(+) | highs are linear (3.3% delta to prev. frequency)
Overall 100 - 16.000 Hz
(+) | overall sound is linear (7.8% difference to median)
Compared to same class
» 6% of all tested devices in this class were better, 3% similar, 91% worse
» The best had a delta of 5%, average was 17%, worst was 45%
Compared to all devices tested
» 1% of all tested devices were better, 0% similar, 98% worse
» The best had a delta of 4%, average was 23%, worst was 134%
Apple MacBook Pro 16 2024 M4 Pro audio analysis
(+) | speakers can play relatively loud (84.6 dB)
Bass 100 - 315 Hz
(±) | reduced bass - on average 5.1% lower than median
(+) | bass is linear (5.6% delta to prev. frequency)
Mids 400 - 2000 Hz
(+) | balanced mids - only 1.4% away from median
(+) | mids are linear (2.4% delta to prev. frequency)
Highs 2 - 16 kHz
(+) | balanced highs - only 1.6% away from median
(+) | highs are linear (3% delta to prev. frequency)
Overall 100 - 16.000 Hz
(+) | overall sound is linear (4.8% difference to median)
Compared to same class
» 0% of all tested devices in this class were better, 0% similar, 99% worse
» The best had a delta of 5%, average was 17%, worst was 45%
Compared to all devices tested
» 0% of all tested devices were better, 0% similar, 100% worse
» The best had a delta of 4%, average was 23%, worst was 134%
Lenovo ThinkBook 16p G5 IRX 21N50011GE audio analysis
(±) | speaker loudness is average but good (78.9 dB)
Bass 100 - 315 Hz
(±) | reduced bass - on average 7.6% lower than median
(±) | linearity of bass is average (10.1% delta to prev. frequency)
Mids 400 - 2000 Hz
(+) | balanced mids - only 3.3% away from median
(+) | mids are linear (6.8% delta to prev. frequency)
Highs 2 - 16 kHz
(+) | balanced highs - only 0.9% away from median
(+) | highs are linear (3.1% delta to prev. frequency)
Overall 100 - 16.000 Hz
(+) | overall sound is linear (8.8% difference to median)
Compared to same class
» 11% of all tested devices in this class were better, 2% similar, 87% worse
» The best had a delta of 5%, average was 17%, worst was 45%
Compared to all devices tested
» 3% of all tested devices were better, 1% similar, 97% worse
» The best had a delta of 4%, average was 23%, worst was 134%
Asus ProArt P16 H7606WI audio analysis
(±) | speaker loudness is average but good (81.4 dB)
Bass 100 - 315 Hz
(+) | good bass - only 3% away from median
(±) | linearity of bass is average (8.3% delta to prev. frequency)
Mids 400 - 2000 Hz
(+) | balanced mids - only 3.5% away from median
(+) | mids are linear (2.5% delta to prev. frequency)
Highs 2 - 16 kHz
(+) | balanced highs - only 3% away from median
(+) | highs are linear (3.6% delta to prev. frequency)
Overall 100 - 16.000 Hz
(+) | overall sound is linear (8.5% difference to median)
Compared to same class
» 9% of all tested devices in this class were better, 3% similar, 88% worse
» The best had a delta of 5%, average was 17%, worst was 45%
Compared to all devices tested
» 2% of all tested devices were better, 1% similar, 97% worse
» The best had a delta of 4%, average was 23%, worst was 134%
Lenovo Yoga Pro 9 16IMH9 audio analysis
(+) | speakers can play relatively loud (84.5 dB)
Bass 100 - 315 Hz
(±) | reduced bass - on average 7% lower than median
(±) | linearity of bass is average (7.2% delta to prev. frequency)
Mids 400 - 2000 Hz
(+) | balanced mids - only 3.9% away from median
(+) | mids are linear (4.5% delta to prev. frequency)
Highs 2 - 16 kHz
(+) | balanced highs - only 2.8% away from median
(+) | highs are linear (3.2% delta to prev. frequency)
Overall 100 - 16.000 Hz
(+) | overall sound is linear (8.8% difference to median)
Compared to same class
» 11% of all tested devices in this class were better, 2% similar, 87% worse
» The best had a delta of 5%, average was 17%, worst was 45%
Compared to all devices tested
» 3% of all tested devices were better, 1% similar, 97% worse
» The best had a delta of 4%, average was 23%, worst was 134%
Dell XPS 16 9640 audio analysis
(+) | speakers can play relatively loud (83.4 dB)
Bass 100 - 315 Hz
(±) | reduced bass - on average 11.2% lower than median
(±) | linearity of bass is average (8.9% delta to prev. frequency)
Mids 400 - 2000 Hz
(+) | balanced mids - only 4.5% away from median
(+) | mids are linear (3% delta to prev. frequency)
Highs 2 - 16 kHz
(+) | balanced highs - only 1.4% away from median
(+) | highs are linear (2% delta to prev. frequency)
Overall 100 - 16.000 Hz
(+) | overall sound is linear (10% difference to median)
Compared to same class
» 13% of all tested devices in this class were better, 2% similar, 84% worse
» The best had a delta of 5%, average was 17%, worst was 45%
Compared to all devices tested
» 4% of all tested devices were better, 1% similar, 94% worse
» The best had a delta of 4%, average was 23%, worst was 134%
耗电量
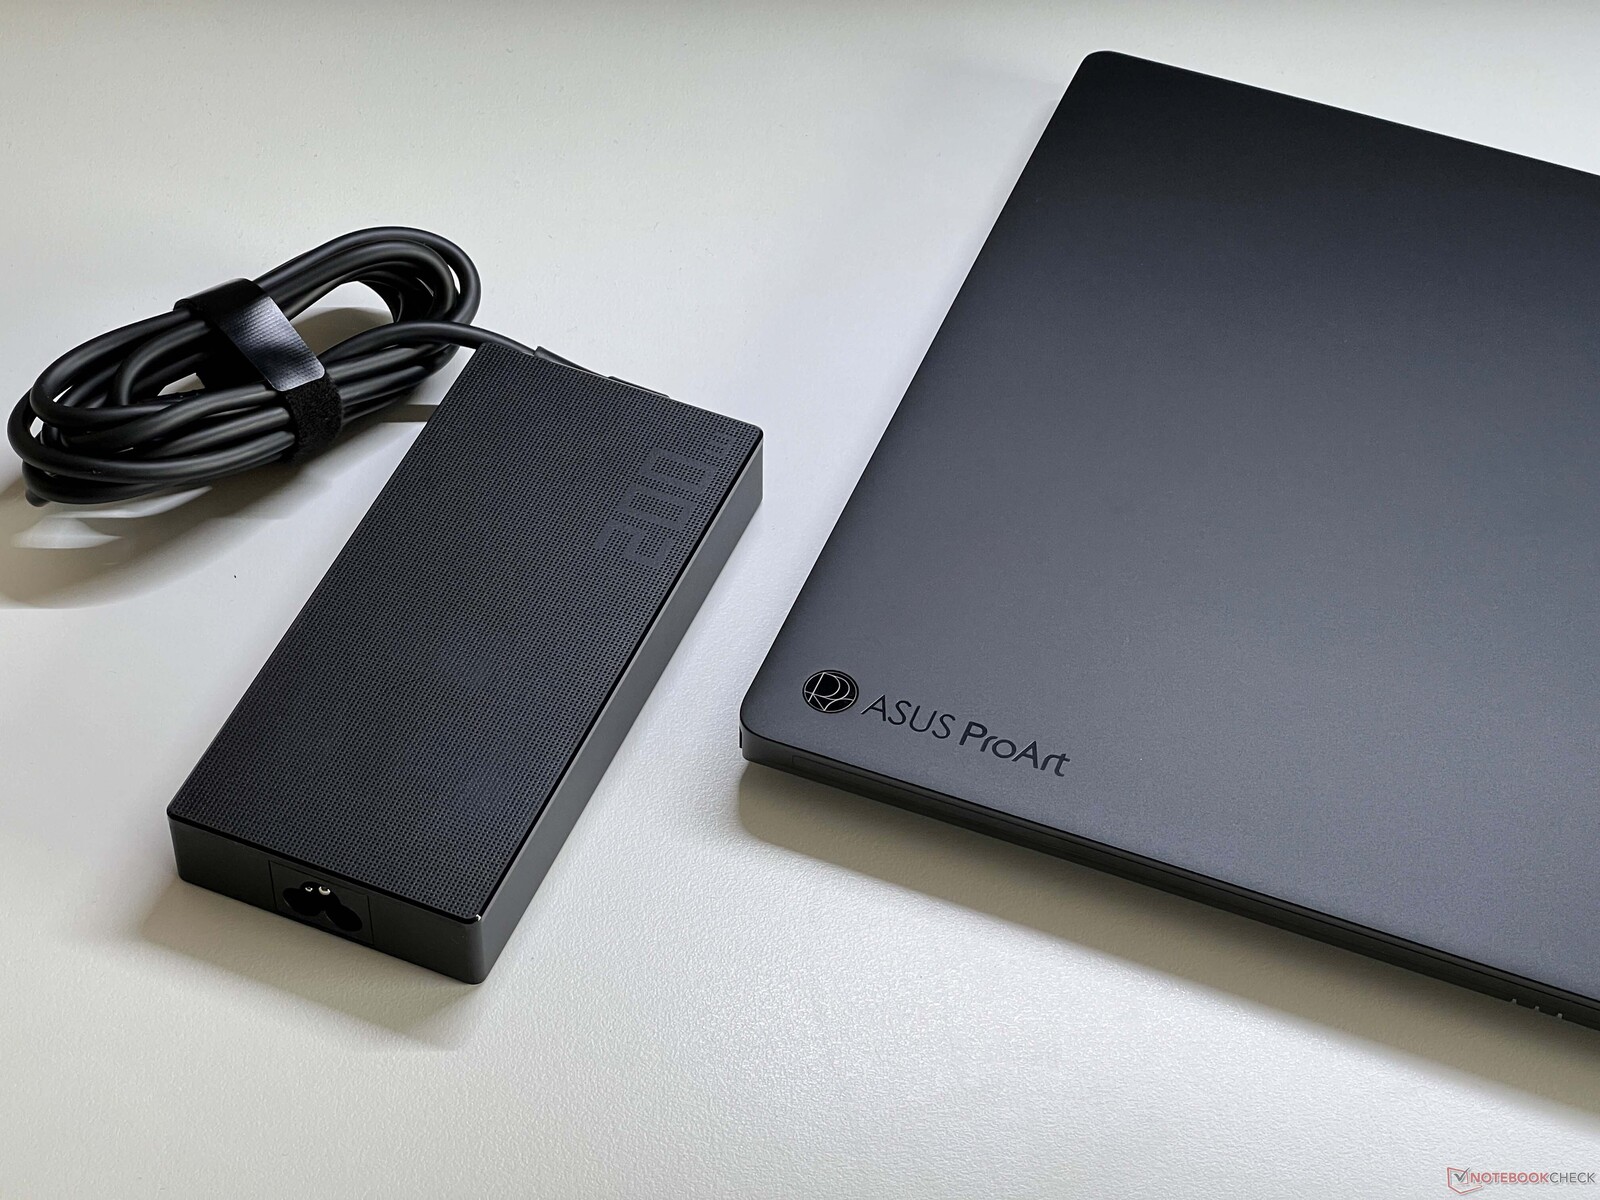
配备 120 Hz 屏幕的新 ProArt P16 在空闲模式下所需功耗略高于前代产品,在负载情况下功耗也略有增加。在压力测试中,我们短暂测得的最大功率为 229 瓦,随后稳定在 180-190 瓦。所提供的 200 瓦电源虽然不是特别大,但也足够了。
| Off / Standby | |
| Idle | |
| Load |
|
Key:
min: | |
| Asus ProArt P16 H7606WP Ryzen AI 9 HX 370, GeForce RTX 5070 Laptop, WD PC SN740 SDDPNQE-2T00, OLED, 2880x1800, 16" | Apple MacBook Pro 16 2024 M4 Pro M4 Pro 14-Core, M4 Pro 20-Core GPU, Apple SSD AP2048Z, Mini-LED, 3456x2234, 16.2" | Lenovo ThinkBook 16p G5 IRX 21N50011GE i9-14900HX, GeForce RTX 4060 Laptop GPU, SK Hynix HFS001TEJ9X115N, IPS LCD, 3200x2000, 16" | Asus ProArt P16 H7606WI Ryzen AI 9 HX 370, GeForce RTX 4070 Laptop GPU, Micron 2400 MTFDKBA1T0QFM, OLED, 3840x2400, 16" | Lenovo Yoga Pro 9 16IMH9 Ultra 9 185H, GeForce RTX 4070 Laptop GPU, SK Hynix HFS001TEJ9X115N, Mini-LED, 3200x2000, 16" | Dell XPS 16 9640 Ultra 7 155H, GeForce RTX 4070 Laptop GPU, Kioxia XG8 KXG80ZNV1T02, OLED, 3840x2400, 16.3" | |
|---|---|---|---|---|---|---|
| Power Consumption | 24% | -35% | 13% | -21% | 26% | |
| Idle Minimum * (Watt) | 9.9 | 4.6 54% | 11.6 -17% | 8 19% | 10.3 -4% | 7.7 22% |
| Idle Average * (Watt) | 13.6 | 16.8 -24% | 18.5 -36% | 9.9 27% | 21.9 -61% | 10.3 24% |
| Idle Maximum * (Watt) | 14 | 17.1 -22% | 19.9 -42% | 11.6 17% | 22.4 -60% | 10.6 24% |
| Load Average * (Watt) | 93.8 | 76.4 19% | 126.3 -35% | 76.9 18% | 96.9 -3% | 76.5 18% |
| Cyberpunk 2077 ultra * (Watt) | 162.1 | 83.4 49% | 233 -44% | 157.7 3% | ||
| Cyberpunk 2077 ultra external monitor * (Watt) | 158.3 | 79.3 50% | 237 -50% | 156.6 1% | ||
| Load Maximum * (Watt) | 229 | 138.1 40% | 270.4 -18% | 212.6 7% | 173.8 24% | 138.5 40% |
| Witcher 3 ultra * (Watt) | 159.6 | 126.4 |
* ... smaller is better
Power consumption Cyberpunk / stress test
Power consumption with external monitor
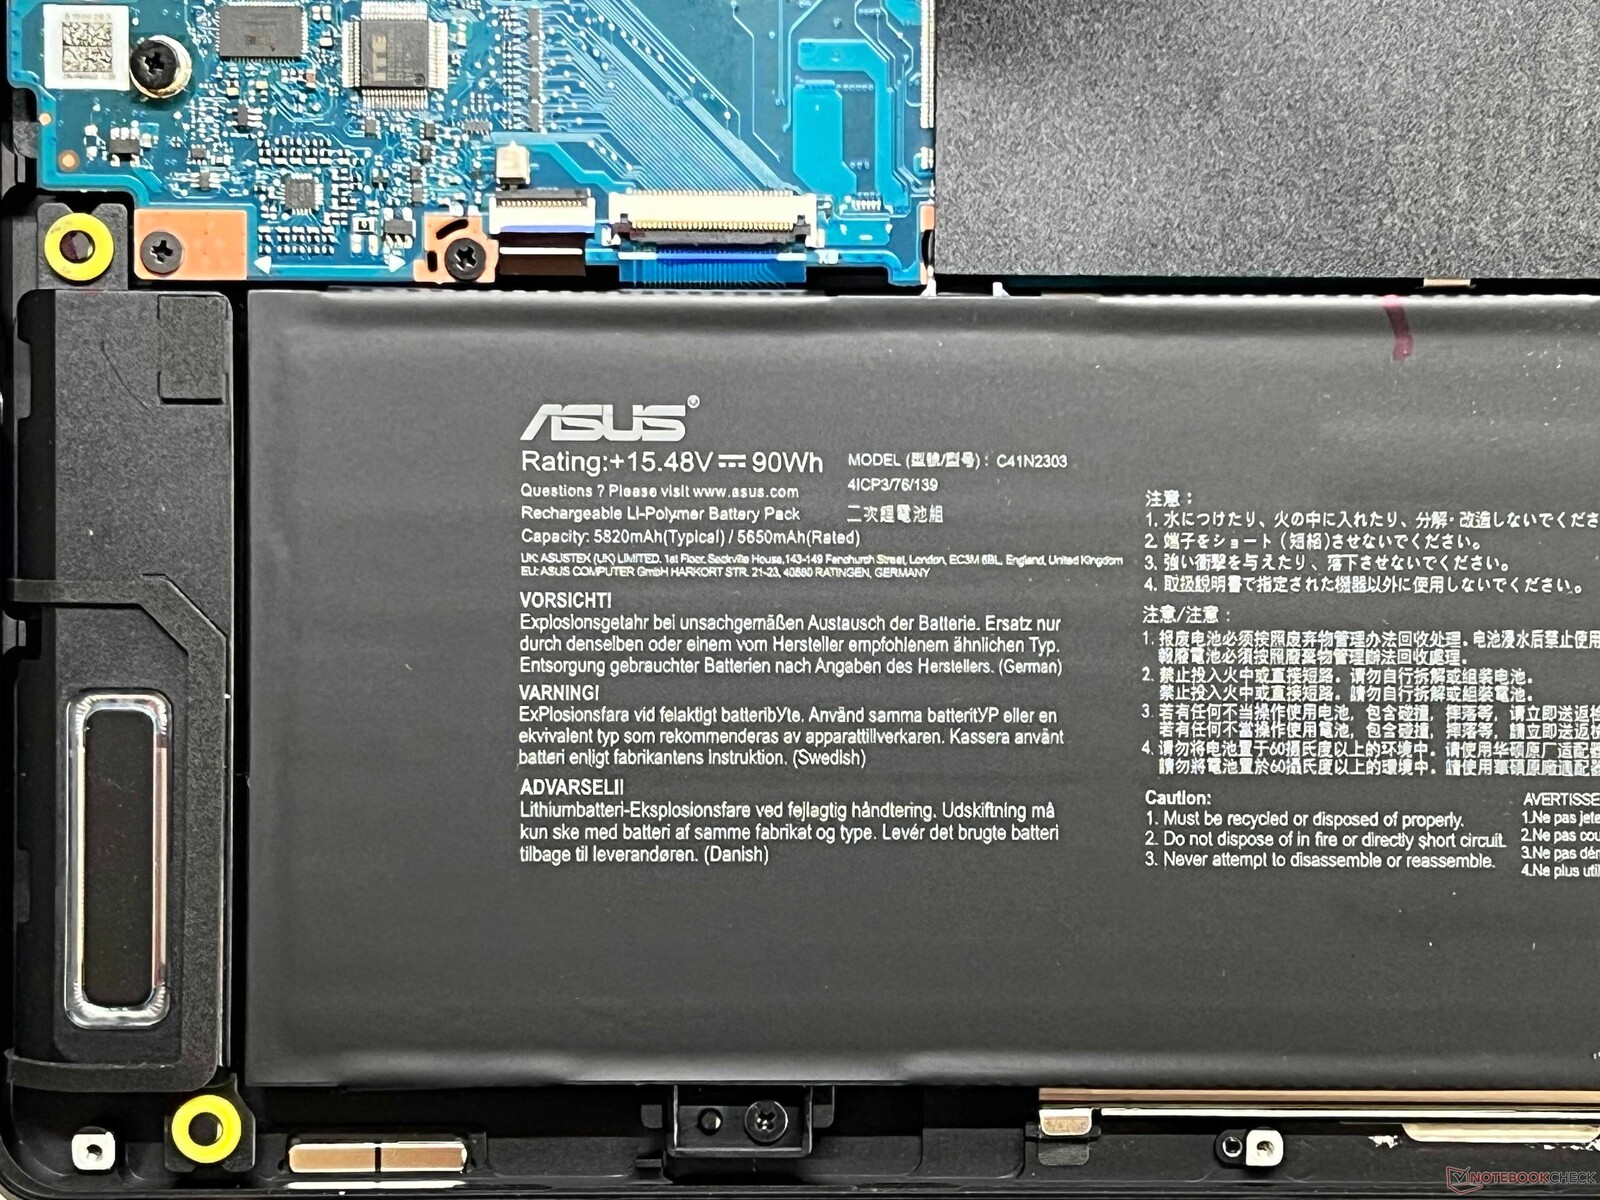
运行时间
它的电池容量没有变化(90 Wh),在我们的 WLAN 测试中,笔记本电脑在全亮度下的运行时间仍为 6.5 小时左右。另一方面,新机型在 150 cd/m²(测试设备最大亮度的 70%)下的续航时间延长了近一个小时(09:14 小时)。总体而言,ProArt P16 在电池寿命方面仍处于中游水平。
Notebookcheck 总评分
Asus ProArt P16 H7606WP
- 05/28/2025 v8
Andreas Osthoff
 Total Sustainability Score:
 可能的替代品比较
Transparency
The selection of devices to be reviewed is made by our editorial team. The test sample was provided to the author as a loan by the manufacturer or retailer for the purpose of this review. The lender had no influence on this review, nor did the manufacturer receive a copy of this review before publication. There was no obligation to publish this review. As an independent media company, Notebookcheck is not subjected to the authority of manufacturers, retailers or publishers.
This is how Notebookcheck is testing
Every year, Notebookcheck independently reviews hundreds of laptops and smartphones using standardized procedures to ensure that all results are comparable. We have continuously developed our test methods for around 20 years and set industry standards in the process. In our test labs, high-quality measuring equipment is utilized by experienced technicians and editors. These tests involve a multi-stage validation process. Our complex rating system is based on hundreds of well-founded measurements and benchmarks, which maintains objectivity. Further information on our test methods can be found here.

