
结论 -Legion 5 15 性价比极高
联想Legion 5 15 配备了英特尔酷睿 i7-13650HX 和GeForce RTX 5070,再次提供了出色的全面配置,并以 1499 欧元的价格成为最实惠的 RTX 5070 游戏笔记本电脑之一。其游戏性能与更昂贵的Legion 5 Pro 16 不相上下。再加上出色的 OLED 显示屏,拥有 165 Hz 的刷新率和令人印象深刻的亮度,游戏绝对是一种享受。由于预装了色彩配置文件,即使是要求苛刻的照片和视频编辑,也能获得高度准确的色彩。
英特尔酷睿 i7-13650HX 的耗电量明显高于 Ryzen 7 260,但性能却没有多大提升。这也导致电池使用时间明显缩短。英特尔机型不支持 USB 4.0,也没有高级 Optimus 功能,但这并不是主要缺点,因为它配备了 MUX 开关。
当然,它也有一些较小的缺点,比如在游戏过程中风扇声音较大,不过竞争对手在这方面的表现往往更差。但总的来说,没有什么可抱怨的。Legion 5 15 始终是一款出色的游戏笔记本电脑。
Pros
Cons
- $1,996.00Lenovo Legion 5 15IRX10 15.1" WQXGA OLED, Gaming Laptop, Intel Core i9 14th Gen 14900HX 1.6GHz; NVIDIA GeForce RTX 5070 8GB GDDR7; 32GB DDR5 RAM; 1TB NVMe M.2 SSD; Gigabit LAN, 2x2 WiFi 7
- $1,904.00Lenovo 2025 Gaming Laptop Legion 5 Intel Core i9-14900HX 24-Core GeForce RTX 5070 8 GB 16 GB DDR5 1 TB SSD 15.1" 2560 x 1600 165 Hz Win11 Home Wi-Fi 7 Bluetooth 5.4 HD Audio 5.0MP Camera
- $2,499.00Lenovo Legion 5 15IRX10 Gaming Laptop 2025 15.1” WQXGA 2560x1600 Display165 Hertz Intel Core i9-14900HX GeForce RTX 5070 8G GDDR7 32GB DDR5 4TB SSD 24-Zone RGB Backlit KB Wi-Fi 7 Windows 11 Pro
规格


性能 - Raptor Lake 和 RTX 5070
测试条件
我们在性能模式下进行了以下基准测试和测量。使用电池供电时,最高可用设置为"自动 "模式。
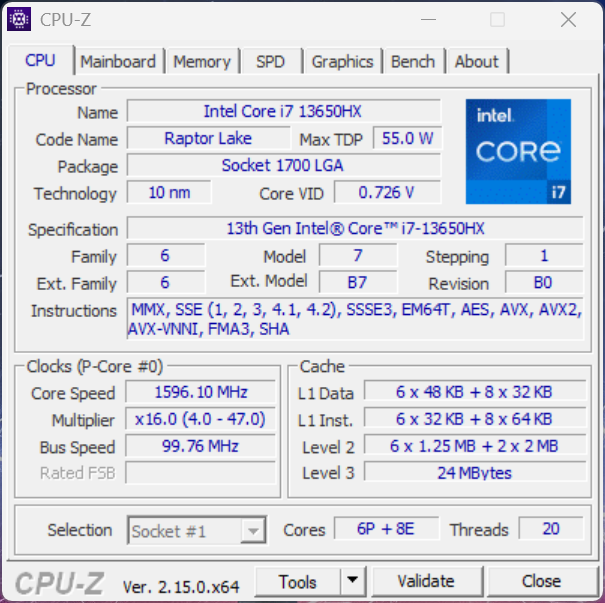
处理器
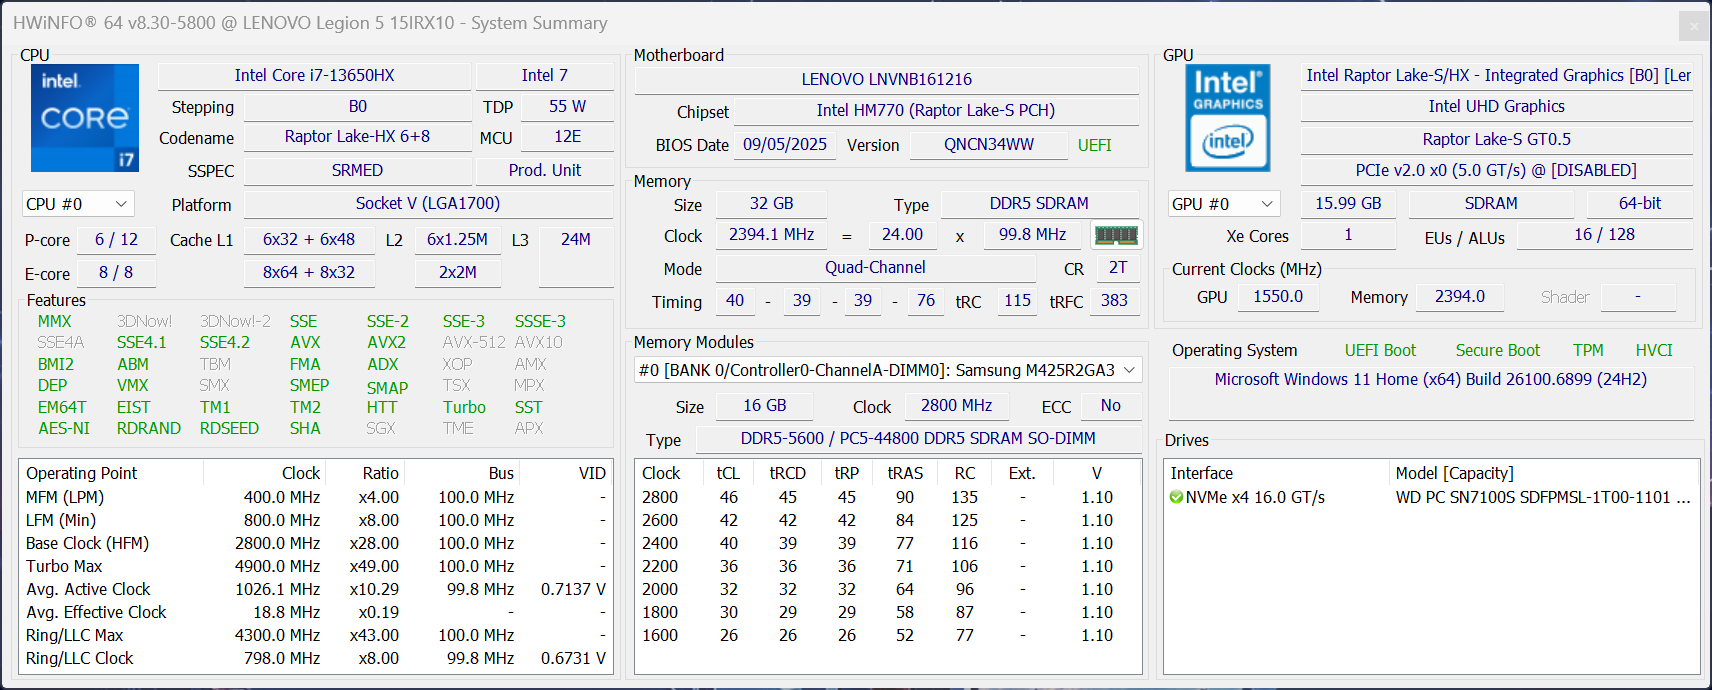
处理器采用英特尔酷睿 i7-13650HX(猛禽湖),功率极限分别为 140 瓦和 95 瓦,明显高于 AMD 版本。但总体而言,CPU 性能仅略高于 Zen 4 芯片。在电池模式下,CPU 性能下降约 40%。
Cinebench R15 多耐久性测试
Cinebench R23: Multi Core | Single Core
Cinebench R20: CPU (Multi Core) | CPU (Single Core)
Cinebench R15: CPU Multi 64Bit | CPU Single 64Bit
Blender: v2.79 BMW27 CPU
7-Zip 18.03: 7z b 4 | 7z b 4 -mmt1
Geekbench 6.7: Multi-Core | Single-Core
Geekbench 5.5: Multi-Core | Single-Core
HWBOT x265 Benchmark v2.2: 4k Preset
LibreOffice : 20 Documents To PDF
R Benchmark 2.5: Overall mean
| CPU Performance rating | |
| Lenovo Legion Pro 5 16IAX10, RTX 5070 | |
| Average of class Gaming | |
| Lenovo Legion 5 15IRX10 5070 | |
| Average Intel Core i7-13650HX | |
| Lenovo Legion 5 15AHP G10 | |
| Schenker XMG Core 15 (M25) | |
| Asus TUF Gaming A16 FA608UP | |
| MSI Katana A15 AI B8VG | |
| Cinebench R23 / Multi Core | |
| Lenovo Legion Pro 5 16IAX10, RTX 5070 | |
| Average of class Gaming (10488 - 42661, n=107, last 2 years) | |
| Lenovo Legion 5 15IRX10 5070 | |
| Average Intel Core i7-13650HX (18744 - 21006, n=6) | |
| Lenovo Legion 5 15AHP G10 | |
| Asus TUF Gaming A16 FA608UP | |
| MSI Katana A15 AI B8VG | |
| Schenker XMG Core 15 (M25) | |
| Cinebench R23 / Single Core | |
| Lenovo Legion Pro 5 16IAX10, RTX 5070 | |
| Average of class Gaming (1166 - 2415, n=107, last 2 years) | |
| Schenker XMG Core 15 (M25) | |
| Lenovo Legion 5 15IRX10 5070 | |
| Average Intel Core i7-13650HX (1693 - 1903, n=6) | |
| Lenovo Legion 5 15AHP G10 | |
| Asus TUF Gaming A16 FA608UP | |
| MSI Katana A15 AI B8VG | |
| Cinebench R20 / CPU (Multi Core) | |
| Lenovo Legion Pro 5 16IAX10, RTX 5070 | |
| Average of class Gaming (4029 - 16433, n=106, last 2 years) | |
| Lenovo Legion 5 15IRX10 5070 | |
| Average Intel Core i7-13650HX (7197 - 8021, n=5) | |
| Lenovo Legion 5 15AHP G10 | |
| Asus TUF Gaming A16 FA608UP | |
| MSI Katana A15 AI B8VG | |
| Schenker XMG Core 15 (M25) | |
| Cinebench R20 / CPU (Single Core) | |
| Lenovo Legion Pro 5 16IAX10, RTX 5070 | |
| Average of class Gaming (442 - 913, n=106, last 2 years) | |
| Schenker XMG Core 15 (M25) | |
| Lenovo Legion 5 15IRX10 5070 | |
| Average Intel Core i7-13650HX (700 - 728, n=5) | |
| Lenovo Legion 5 15AHP G10 | |
| Asus TUF Gaming A16 FA608UP | |
| MSI Katana A15 AI B8VG | |
| Cinebench R15 / CPU Multi 64Bit | |
| Lenovo Legion Pro 5 16IAX10, RTX 5070 | |
| Average of class Gaming (1578 - 6330, n=105, last 2 years) | |
| Lenovo Legion 5 15IRX10 5070 | |
| Average Intel Core i7-13650HX (2864 - 3147, n=5) | |
| Lenovo Legion 5 15AHP G10 | |
| Asus TUF Gaming A16 FA608UP | |
| Schenker XMG Core 15 (M25) | |
| MSI Katana A15 AI B8VG | |
| Cinebench R15 / CPU Single 64Bit | |
| Lenovo Legion Pro 5 16IAX10, RTX 5070 | |
| Schenker XMG Core 15 (M25) | |
| Average of class Gaming (188.8 - 350, n=106, last 2 years) | |
| Lenovo Legion 5 15AHP G10 | |
| Asus TUF Gaming A16 FA608UP | |
| Lenovo Legion 5 15IRX10 5070 | |
| Average Intel Core i7-13650HX (256 - 275, n=5) | |
| MSI Katana A15 AI B8VG | |
| Blender / v2.79 BMW27 CPU | |
| MSI Katana A15 AI B8VG | |
| Lenovo Legion 5 15AHP G10 | |
| Asus TUF Gaming A16 FA608UP | |
| Schenker XMG Core 15 (M25) | |
| Average Intel Core i7-13650HX (158 - 226, n=5) | |
| Lenovo Legion 5 15IRX10 5070 | |
| Average of class Gaming (79 - 330, n=104, last 2 years) | |
| Lenovo Legion Pro 5 16IAX10, RTX 5070 | |
| 7-Zip 18.03 / 7z b 4 | |
| Lenovo Legion Pro 5 16IAX10, RTX 5070 | |
| Average of class Gaming (33491 - 148086, n=105, last 2 years) | |
| Lenovo Legion 5 15IRX10 5070 | |
| Average Intel Core i7-13650HX (73927 - 80057, n=5) | |
| Lenovo Legion 5 15AHP G10 | |
| Asus TUF Gaming A16 FA608UP | |
| MSI Katana A15 AI B8VG | |
| Schenker XMG Core 15 (M25) | |
| 7-Zip 18.03 / 7z b 4 -mmt1 | |
| Lenovo Legion Pro 5 16IAX10, RTX 5070 | |
| MSI Katana A15 AI B8VG | |
| Lenovo Legion 5 15AHP G10 | |
| Average of class Gaming (4199 - 7436, n=105, last 2 years) | |
| Schenker XMG Core 15 (M25) | |
| Asus TUF Gaming A16 FA608UP | |
| Lenovo Legion 5 15IRX10 5070 | |
| Average Intel Core i7-13650HX (5828 - 6125, n=5) | |
| Geekbench 6.7 / Multi-Core | |
| Lenovo Legion Pro 5 16IAX10, RTX 5070 | |
| Average of class Gaming (6625 - 22850, n=106, last 2 years) | |
| Lenovo Legion 5 15IRX10 5070 | |
| Schenker XMG Core 15 (M25) | |
| Average Intel Core i7-13650HX (13554 - 14378, n=3) | |
| Lenovo Legion 5 15AHP G10 | |
| Asus TUF Gaming A16 FA608UP | |
| MSI Katana A15 AI B8VG | |
| Geekbench 6.7 / Single-Core | |
| Lenovo Legion Pro 5 16IAX10, RTX 5070 | |
| Schenker XMG Core 15 (M25) | |
| Average of class Gaming (1490 - 3259, n=106, last 2 years) | |
| Lenovo Legion 5 15AHP G10 | |
| Asus TUF Gaming A16 FA608UP | |
| Lenovo Legion 5 15IRX10 5070 | |
| Average Intel Core i7-13650HX (2505 - 2595, n=3) | |
| MSI Katana A15 AI B8VG | |
| Geekbench 5.5 / Multi-Core | |
| Lenovo Legion Pro 5 16IAX10, RTX 5070 | |
| Average of class Gaming (6460 - 28263, n=105, last 2 years) | |
| Lenovo Legion 5 15IRX10 5070 | |
| Average Intel Core i7-13650HX (12509 - 14778, n=5) | |
| Schenker XMG Core 15 (M25) | |
| Lenovo Legion 5 15AHP G10 | |
| Asus TUF Gaming A16 FA608UP | |
| MSI Katana A15 AI B8VG | |
| Geekbench 5.5 / Single-Core | |
| Lenovo Legion Pro 5 16IAX10, RTX 5070 | |
| Schenker XMG Core 15 (M25) | |
| Average of class Gaming (986 - 2474, n=105, last 2 years) | |
| Lenovo Legion 5 15AHP G10 | |
| Asus TUF Gaming A16 FA608UP | |
| MSI Katana A15 AI B8VG | |
| Lenovo Legion 5 15IRX10 5070 | |
| Average Intel Core i7-13650HX (1810 - 1866, n=5) | |
| HWBOT x265 Benchmark v2.2 / 4k Preset | |
| Lenovo Legion Pro 5 16IAX10, RTX 5070 | |
| Average of class Gaming (11.5 - 44.4, n=105, last 2 years) | |
| Schenker XMG Core 15 (M25) | |
| Lenovo Legion 5 15AHP G10 | |
| Lenovo Legion 5 15IRX10 5070 | |
| Asus TUF Gaming A16 FA608UP | |
| Average Intel Core i7-13650HX (18.9 - 23.6, n=5) | |
| MSI Katana A15 AI B8VG | |
| LibreOffice / 20 Documents To PDF | |
| Schenker XMG Core 15 (M25) | |
| Asus TUF Gaming A16 FA608UP | |
| MSI Katana A15 AI B8VG | |
| Average of class Gaming (33.2 - 88.8, n=105, last 2 years) | |
| Lenovo Legion 5 15AHP G10 | |
| Average Intel Core i7-13650HX (38.9 - 58.8, n=5) | |
| Lenovo Legion Pro 5 16IAX10, RTX 5070 | |
| Lenovo Legion 5 15IRX10 5070 | |
| R Benchmark 2.5 / Overall mean | |
| Asus TUF Gaming A16 FA608UP | |
| Lenovo Legion 5 15IRX10 5070 | |
| Lenovo Legion 5 15AHP G10 | |
| MSI Katana A15 AI B8VG | |
| Average Intel Core i7-13650HX (0.4217 - 0.4461, n=6) | |
| Average of class Gaming (0.3439 - 0.759, n=106, last 2 years) | |
| Lenovo Legion Pro 5 16IAX10, RTX 5070 | |
| Schenker XMG Core 15 (M25) | |
* ... smaller is better
AIDA64: FP32 Ray-Trace | FPU Julia | CPU SHA3 | CPU Queen | FPU SinJulia | FPU Mandel | CPU AES | CPU ZLib | FP64 Ray-Trace | CPU PhotoWorxx
| Performance rating | |
| Lenovo Legion Pro 5 16IAX10, RTX 5070 | |
| Average of class Gaming | |
| Lenovo Legion 5 15AHP G10 | |
| Asus TUF Gaming A16 FA608UP | |
| MSI Katana A15 AI B8VG | |
| Schenker XMG Core 15 (M25) | |
| Lenovo Legion 5 15IRX10 5070 | |
| Average Intel Core i7-13650HX | |
| AIDA64 / FP32 Ray-Trace | |
| Lenovo Legion Pro 5 16IAX10, RTX 5070 | |
| Average of class Gaming (10227 - 85542, n=105, last 2 years) | |
| Lenovo Legion 5 15AHP G10 | |
| Asus TUF Gaming A16 FA608UP | |
| Schenker XMG Core 15 (M25) | |
| MSI Katana A15 AI B8VG | |
| Lenovo Legion 5 15IRX10 5070 | |
| Average Intel Core i7-13650HX (13404 - 20012, n=5) | |
| AIDA64 / FPU Julia | |
| Lenovo Legion Pro 5 16IAX10, RTX 5070 | |
| Average of class Gaming (51376 - 238426, n=105, last 2 years) | |
| Lenovo Legion 5 15AHP G10 | |
| Asus TUF Gaming A16 FA608UP | |
| MSI Katana A15 AI B8VG | |
| Schenker XMG Core 15 (M25) | |
| Lenovo Legion 5 15IRX10 5070 | |
| Average Intel Core i7-13650HX (68241 - 97317, n=5) | |
| AIDA64 / CPU SHA3 | |
| Lenovo Legion Pro 5 16IAX10, RTX 5070 | |
| Average of class Gaming (2180 - 10115, n=105, last 2 years) | |
| Asus TUF Gaming A16 FA608UP | |
| Lenovo Legion 5 15AHP G10 | |
| MSI Katana A15 AI B8VG | |
| Schenker XMG Core 15 (M25) | |
| Lenovo Legion 5 15IRX10 5070 | |
| Average Intel Core i7-13650HX (3127 - 4487, n=5) | |
| AIDA64 / CPU Queen | |
| Lenovo Legion Pro 5 16IAX10, RTX 5070 | |
| Lenovo Legion 5 15AHP G10 | |
| MSI Katana A15 AI B8VG | |
| Asus TUF Gaming A16 FA608UP | |
| Average of class Gaming (49785 - 173351, n=90, last 2 years) | |
| Lenovo Legion 5 15IRX10 5070 | |
| Average Intel Core i7-13650HX (108627 - 110589, n=5) | |
| Schenker XMG Core 15 (M25) | |
| AIDA64 / FPU SinJulia | |
| Lenovo Legion 5 15AHP G10 | |
| MSI Katana A15 AI B8VG | |
| Asus TUF Gaming A16 FA608UP | |
| Average of class Gaming (4424 - 33636, n=105, last 2 years) | |
| Schenker XMG Core 15 (M25) | |
| Lenovo Legion Pro 5 16IAX10, RTX 5070 | |
| Lenovo Legion 5 15IRX10 5070 | |
| Average Intel Core i7-13650HX (9134 - 10887, n=5) | |
| AIDA64 / FPU Mandel | |
| Lenovo Legion Pro 5 16IAX10, RTX 5070 | |
| Average of class Gaming (25115 - 128721, n=105, last 2 years) | |
| Lenovo Legion 5 15AHP G10 | |
| Asus TUF Gaming A16 FA608UP | |
| MSI Katana A15 AI B8VG | |
| Schenker XMG Core 15 (M25) | |
| Lenovo Legion 5 15IRX10 5070 | |
| Average Intel Core i7-13650HX (33391 - 48323, n=5) | |
| AIDA64 / CPU AES | |
| Lenovo Legion Pro 5 16IAX10, RTX 5070 | |
| Average of class Gaming (39258 - 247074, n=105, last 2 years) | |
| Asus TUF Gaming A16 FA608UP | |
| Schenker XMG Core 15 (M25) | |
| MSI Katana A15 AI B8VG | |
| Lenovo Legion 5 15IRX10 5070 | |
| Average Intel Core i7-13650HX (64436 - 85343, n=5) | |
| Lenovo Legion 5 15AHP G10 | |
| AIDA64 / CPU ZLib | |
| Lenovo Legion Pro 5 16IAX10, RTX 5070 | |
| Average of class Gaming (574 - 2531, n=105, last 2 years) | |
| Lenovo Legion 5 15IRX10 5070 | |
| Average Intel Core i7-13650HX (1136 - 1285, n=5) | |
| Schenker XMG Core 15 (M25) | |
| Lenovo Legion 5 15AHP G10 | |
| MSI Katana A15 AI B8VG | |
| Asus TUF Gaming A16 FA608UP | |
| AIDA64 / FP64 Ray-Trace | |
| Lenovo Legion Pro 5 16IAX10, RTX 5070 | |
| Average of class Gaming (5509 - 45446, n=105, last 2 years) | |
| Lenovo Legion 5 15AHP G10 | |
| Asus TUF Gaming A16 FA608UP | |
| Schenker XMG Core 15 (M25) | |
| MSI Katana A15 AI B8VG | |
| Lenovo Legion 5 15IRX10 5070 | |
| Average Intel Core i7-13650HX (7270 - 10900, n=5) | |
| AIDA64 / CPU PhotoWorxx | |
| Lenovo Legion Pro 5 16IAX10, RTX 5070 | |
| Schenker XMG Core 15 (M25) | |
| Average of class Gaming (12271 - 89891, n=105, last 2 years) | |
| Lenovo Legion 5 15IRX10 5070 | |
| Lenovo Legion 5 15AHP G10 | |
| Asus TUF Gaming A16 FA608UP | |
| Average Intel Core i7-13650HX (36170 - 43289, n=5) | |
| MSI Katana A15 AI B8VG | |
系统性能
Legion 的运行速度非常快,我们在测试过程中没有遇到任何稳定性问题。
PCMark 10: Score | Essentials | Productivity | Digital Content Creation
CrossMark: Overall | Productivity | Creativity | Responsiveness
WebXPRT 3: Overall
WebXPRT 4: Overall
Mozilla Kraken 1.1: Total
| Performance rating | |
| Lenovo Legion Pro 5 16IAX10, RTX 5070 | |
| Average of class Gaming | |
| Lenovo Legion 5 15AHP G10 | |
| Lenovo Legion 5 15IRX10 5070 | |
| Average Intel Core i7-13650HX, NVIDIA GeForce RTX 5070 Laptop | |
| Schenker XMG Core 15 (M25) -3! | |
| Asus TUF Gaming A16 FA608UP -4! | |
| MSI Katana A15 AI B8VG -4! | |
| PCMark 10 / Score | |
| Lenovo Legion Pro 5 16IAX10, RTX 5070 | |
| Average of class Gaming (5828 - 12414, n=93, last 2 years) | |
| Lenovo Legion 5 15AHP G10 | |
| MSI Katana A15 AI B8VG | |
| Lenovo Legion 5 15IRX10 5070 | |
| Average Intel Core i7-13650HX, NVIDIA GeForce RTX 5070 Laptop (n=1) | |
| PCMark 10 / Essentials | |
| Lenovo Legion Pro 5 16IAX10, RTX 5070 | |
| Lenovo Legion 5 15AHP G10 | |
| Schenker XMG Core 15 (M25) | |
| Average of class Gaming (8810 - 11935, n=97, last 2 years) | |
| Lenovo Legion 5 15IRX10 5070 | |
| Average Intel Core i7-13650HX, NVIDIA GeForce RTX 5070 Laptop (n=1) | |
| MSI Katana A15 AI B8VG | |
| PCMark 10 / Productivity | |
| Average of class Gaming (6845 - 25323, n=95, last 2 years) | |
| Lenovo Legion 5 15AHP G10 | |
| Lenovo Legion Pro 5 16IAX10, RTX 5070 | |
| MSI Katana A15 AI B8VG | |
| Lenovo Legion 5 15IRX10 5070 | |
| Average Intel Core i7-13650HX, NVIDIA GeForce RTX 5070 Laptop (n=1) | |
| PCMark 10 / Digital Content Creation | |
| Lenovo Legion Pro 5 16IAX10, RTX 5070 | |
| Average of class Gaming (7602 - 19954, n=95, last 2 years) | |
| Lenovo Legion 5 15AHP G10 | |
| Lenovo Legion 5 15IRX10 5070 | |
| Average Intel Core i7-13650HX, NVIDIA GeForce RTX 5070 Laptop (n=1) | |
| MSI Katana A15 AI B8VG | |
| CrossMark / Overall | |
| Lenovo Legion Pro 5 16IAX10, RTX 5070 | |
| Average of class Gaming (1366 - 2409, n=94, last 2 years) | |
| Lenovo Legion 5 15IRX10 5070 | |
| Average Intel Core i7-13650HX, NVIDIA GeForce RTX 5070 Laptop (n=1) | |
| Lenovo Legion 5 15AHP G10 | |
| Schenker XMG Core 15 (M25) | |
| Asus TUF Gaming A16 FA608UP | |
| CrossMark / Productivity | |
| Lenovo Legion Pro 5 16IAX10, RTX 5070 | |
| Average of class Gaming (1386 - 2254, n=94, last 2 years) | |
| Lenovo Legion 5 15IRX10 5070 | |
| Average Intel Core i7-13650HX, NVIDIA GeForce RTX 5070 Laptop (n=1) | |
| Lenovo Legion 5 15AHP G10 | |
| Asus TUF Gaming A16 FA608UP | |
| Schenker XMG Core 15 (M25) | |
| CrossMark / Creativity | |
| Lenovo Legion Pro 5 16IAX10, RTX 5070 | |
| Average of class Gaming (1343 - 2786, n=94, last 2 years) | |
| Lenovo Legion 5 15IRX10 5070 | |
| Average Intel Core i7-13650HX, NVIDIA GeForce RTX 5070 Laptop (n=1) | |
| Lenovo Legion 5 15AHP G10 | |
| Schenker XMG Core 15 (M25) | |
| Asus TUF Gaming A16 FA608UP | |
| CrossMark / Responsiveness | |
| Lenovo Legion Pro 5 16IAX10, RTX 5070 | |
| Average of class Gaming (1226 - 2334, n=94, last 2 years) | |
| Lenovo Legion 5 15IRX10 5070 | |
| Average Intel Core i7-13650HX, NVIDIA GeForce RTX 5070 Laptop (n=1) | |
| Lenovo Legion 5 15AHP G10 | |
| Schenker XMG Core 15 (M25) | |
| Asus TUF Gaming A16 FA608UP | |
| WebXPRT 3 / Overall | |
| Lenovo Legion Pro 5 16IAX10, RTX 5070 | |
| Average of class Gaming (220 - 532, n=98, last 2 years) | |
| Lenovo Legion 5 15AHP G10 | |
| Asus TUF Gaming A16 FA608UP | |
| Lenovo Legion 5 15IRX10 5070 | |
| Average Intel Core i7-13650HX, NVIDIA GeForce RTX 5070 Laptop (n=1) | |
| MSI Katana A15 AI B8VG | |
| Schenker XMG Core 15 (M25) | |
| WebXPRT 4 / Overall | |
| Lenovo Legion Pro 5 16IAX10, RTX 5070 | |
| Average of class Gaming (165 - 354, n=98, last 2 years) | |
| Lenovo Legion 5 15IRX10 5070 | |
| Average Intel Core i7-13650HX, NVIDIA GeForce RTX 5070 Laptop (n=1) | |
| Lenovo Legion 5 15AHP G10 | |
| Asus TUF Gaming A16 FA608UP | |
| MSI Katana A15 AI B8VG | |
| Schenker XMG Core 15 (M25) | |
| Mozilla Kraken 1.1 / Total | |
| MSI Katana A15 AI B8VG | |
| MSI Katana A15 AI B8VG | |
| Asus TUF Gaming A16 FA608UP | |
| Lenovo Legion 5 15IRX10 5070 | |
| Average Intel Core i7-13650HX, NVIDIA GeForce RTX 5070 Laptop (n=1) | |
| Lenovo Legion 5 15AHP G10 | |
| Average of class Gaming (391 - 590, n=100, last 2 years) | |
| Schenker XMG Core 15 (M25) | |
| Lenovo Legion Pro 5 16IAX10, RTX 5070 | |
* ... smaller is better
| PCMark 10 Score | 7187 points | |
Help | ||
| AIDA64 / Memory Copy | |
| Lenovo Legion Pro 5 16IAX10, RTX 5070 | |
| Schenker XMG Core 15 (M25) | |
| Average of class Gaming (21750 - 129946, n=105, last 2 years) | |
| Lenovo Legion 5 15AHP G10 | |
| Asus TUF Gaming A16 FA608UP | |
| Lenovo Legion 5 15IRX10 5070 | |
| MSI Katana A15 AI B8VG | |
| Average Intel Core i7-13650HX (59266 - 66372, n=5) | |
| AIDA64 / Memory Read | |
| Lenovo Legion Pro 5 16IAX10, RTX 5070 | |
| Average of class Gaming (22956 - 118858, n=105, last 2 years) | |
| Lenovo Legion 5 15IRX10 5070 | |
| Average Intel Core i7-13650HX (67305 - 71022, n=5) | |
| Schenker XMG Core 15 (M25) | |
| MSI Katana A15 AI B8VG | |
| Asus TUF Gaming A16 FA608UP | |
| Lenovo Legion 5 15AHP G10 | |
| AIDA64 / Memory Write | |
| Lenovo Legion 5 15AHP G10 | |
| Asus TUF Gaming A16 FA608UP | |
| Lenovo Legion Pro 5 16IAX10, RTX 5070 | |
| Schenker XMG Core 15 (M25) | |
| MSI Katana A15 AI B8VG | |
| Average of class Gaming (22297 - 135096, n=105, last 2 years) | |
| Lenovo Legion 5 15IRX10 5070 | |
| Average Intel Core i7-13650HX (58028 - 68225, n=5) | |
| AIDA64 / Memory Latency | |
| Average of class Gaming (75.3 - 259, n=105, last 2 years) | |
| Lenovo Legion Pro 5 16IAX10, RTX 5070 | |
| Asus TUF Gaming A16 FA608UP | |
| Lenovo Legion 5 15AHP G10 | |
| MSI Katana A15 AI B8VG | |
| Schenker XMG Core 15 (M25) | |
| Average Intel Core i7-13650HX (83.7 - 90.8, n=5) | |
| Lenovo Legion 5 15IRX10 5070 | |
* ... smaller is better
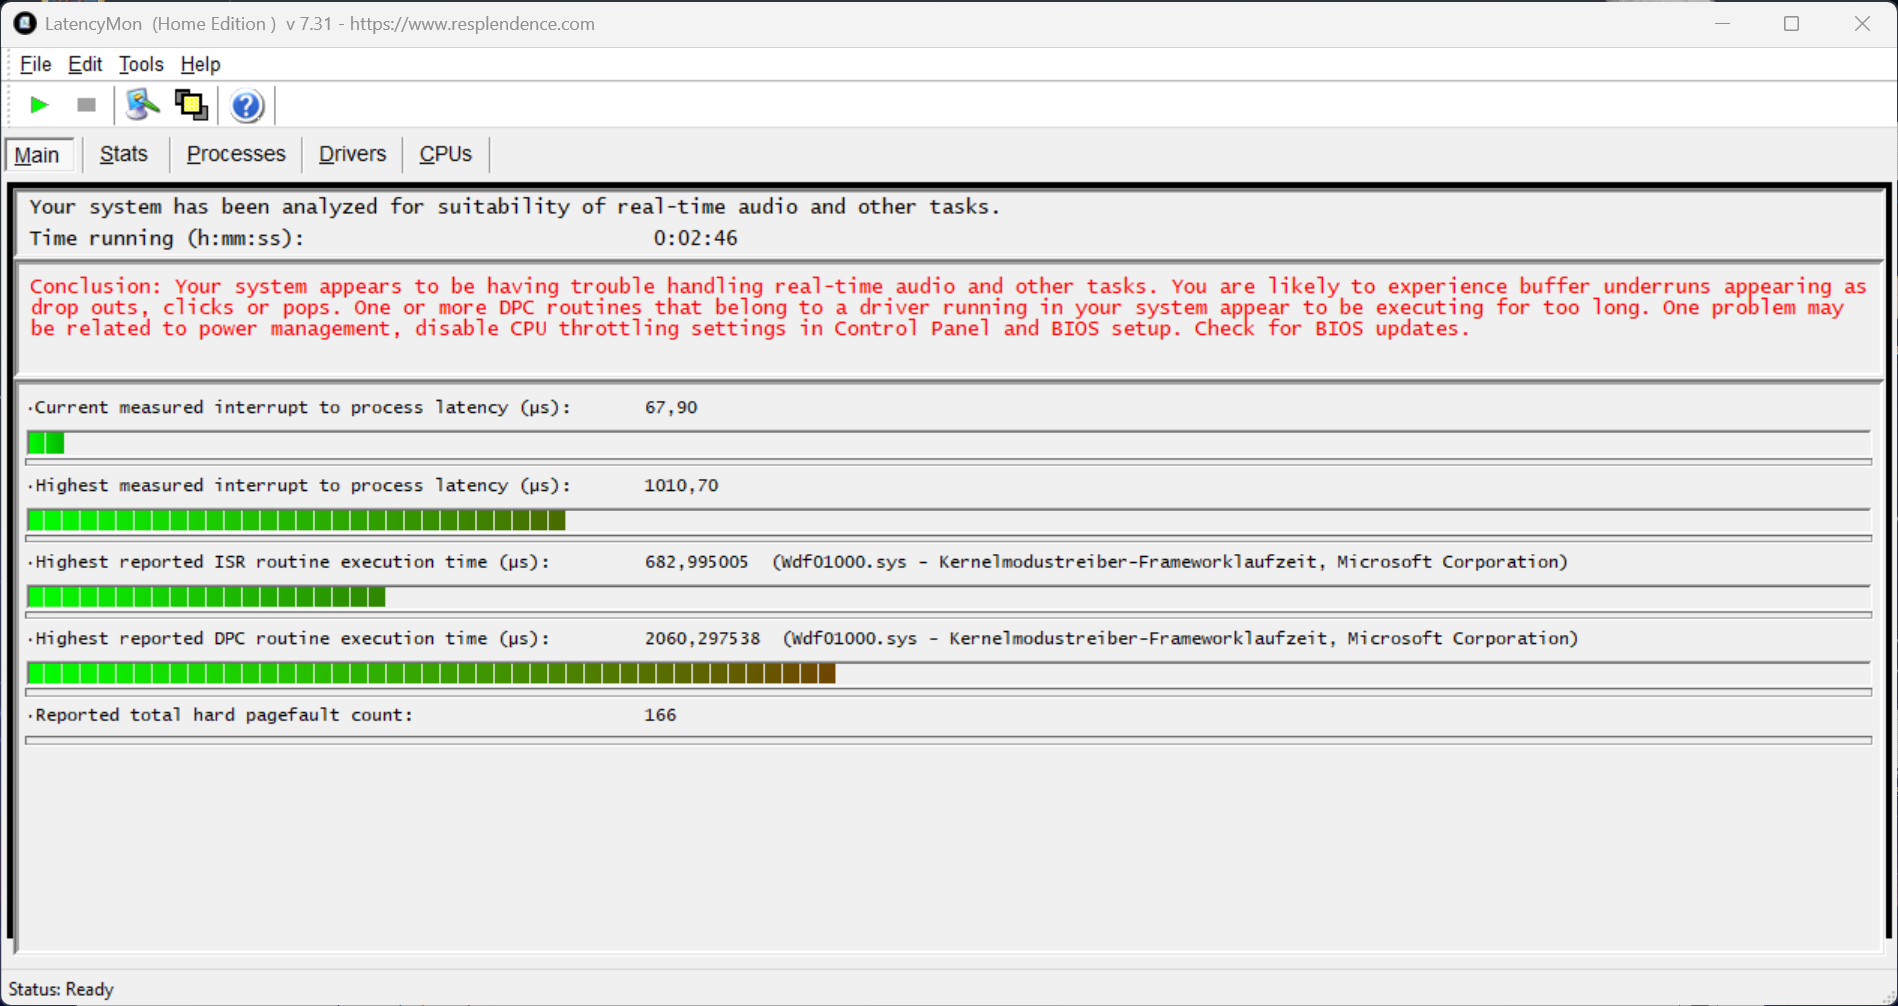
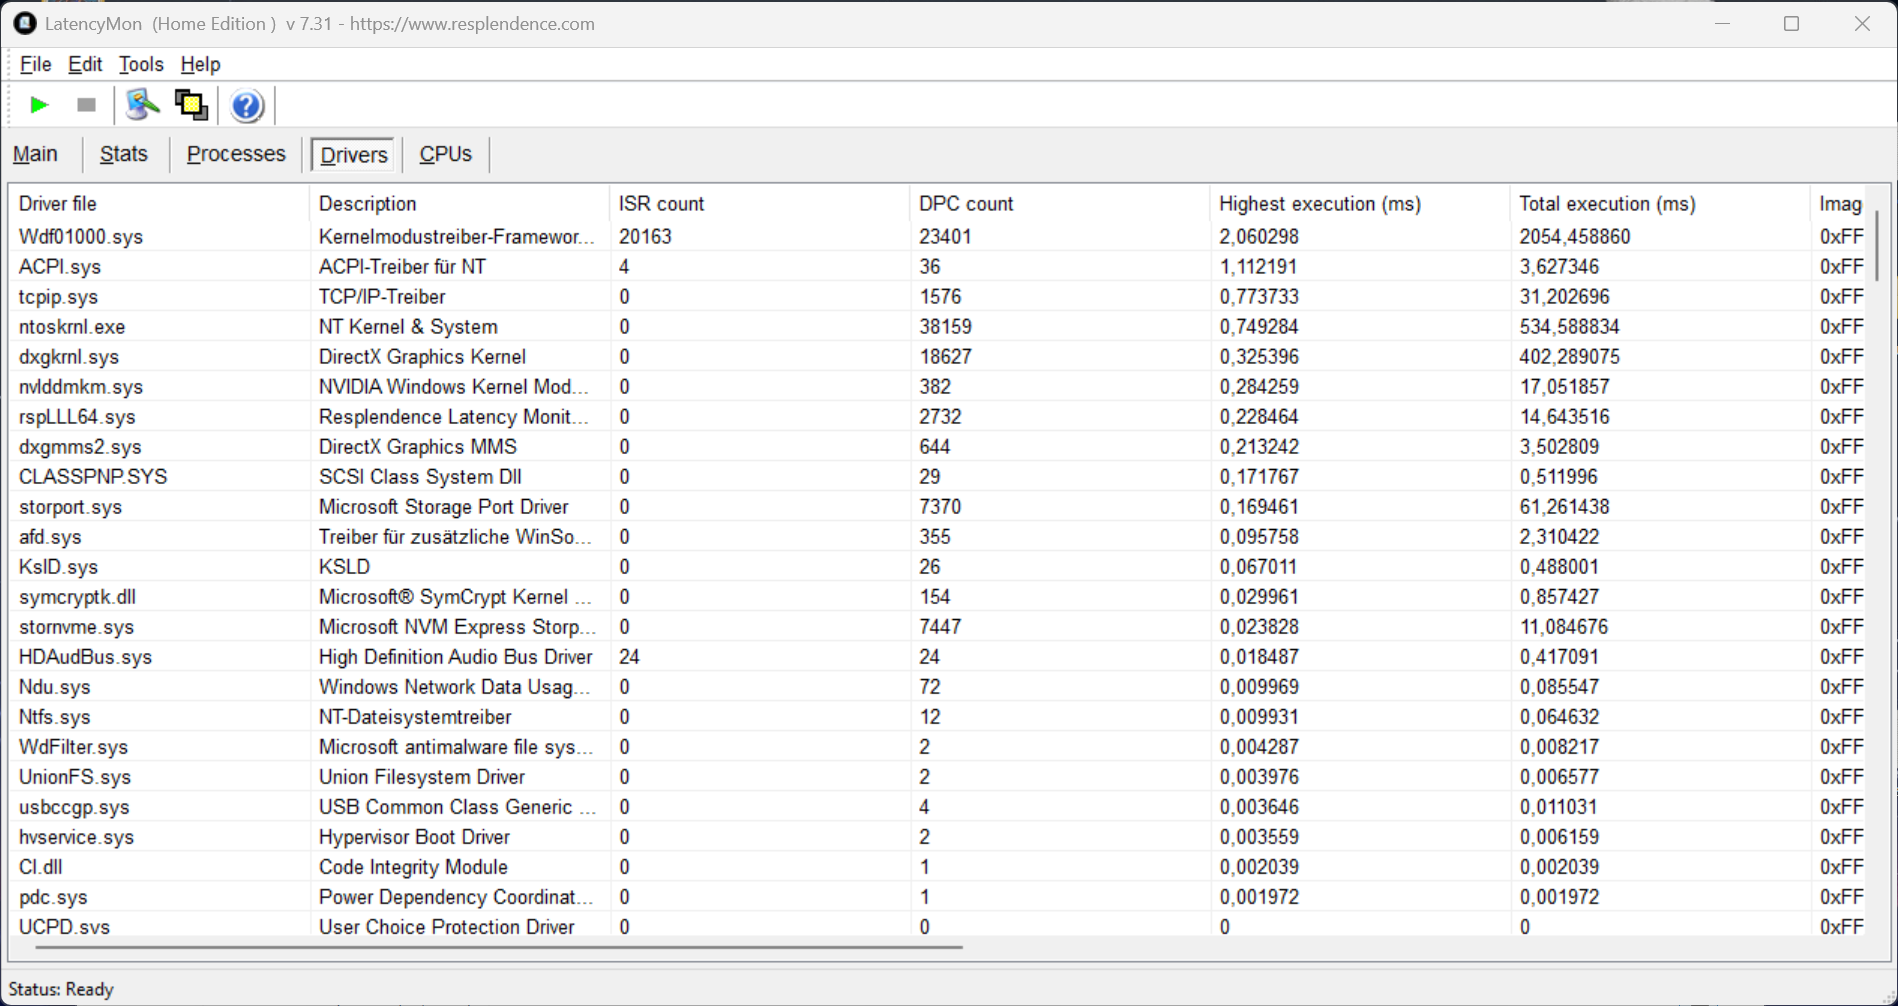
DPC 延迟
在我们的标准化延迟测试中,采用当前 BIOS 版本的英特尔机型在运行实时音频应用程序时表现出了轻微的局限性。
| DPC Latencies / LatencyMon - interrupt to process latency (max), Web, Youtube, Prime95 | |
| MSI Katana A15 AI B8VG | |
| Lenovo Legion 5 15AHP G10 | |
| Lenovo Legion 5 15IRX10 5070 | |
| Schenker XMG Core 15 (M25) | |
| Lenovo Legion Pro 5 16IAX10, RTX 5070 | |
| Asus TUF Gaming A16 FA608UP | |
* ... smaller is better
大容量存储器
西部数据的 1 TB M.2-2242 固态硬盘(873 GB 可用)具有良好、稳定的传输速度。此外,还提供一个全尺寸 M.2-2280 插槽用于存储扩展。

* ... smaller is better
连续读取性能DiskSpd 读取循环,队列深度 8
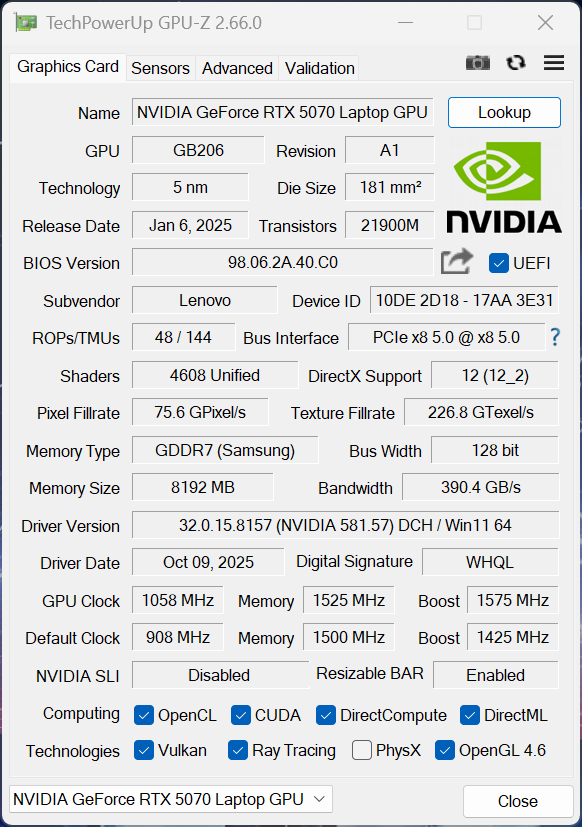
图形处理器性能
联想为这款笔记本电脑配备了最高功率配置的 NvidiaGeForce RTX 5070 笔记本电脑图形处理器,额定功率为 115 瓦。图形切换通过 Optimus 技术处理,但也提供 MUX 开关。在合成基准测试中,Legion 的性能普遍优于竞争对手,甚至超过了 Legion Pro 5 16也不落下风。GPU 性能在持续负载情况下保持完全稳定,但在使用电池供电(最大 55 瓦)时则会下降约 30%。
| 3DMark 11 Performance | 39444 points | |
| 3DMark Fire Strike Score | 31655 points | |
| 3DMark Time Spy Score | 14448 points | |
| 3DMark Steel Nomad Score | 3178 points | |
| 3DMark Steel Nomad Light Score | 14880 points | |
Help | ||
| Blender / v3.3 Classroom OPTIX/RTX | |
| Schenker XMG Core 15 (M25) | |
| MSI Katana A15 AI B8VG | |
| Lenovo Legion 5 15AHP G10 | |
| Asus TUF Gaming A16 FA608UP | |
| Average NVIDIA GeForce RTX 5070 Laptop (17 - 24, n=28) | |
| Average of class Gaming (9 - 32, n=106, last 2 years) | |
| Lenovo Legion Pro 5 16IAX10, RTX 5070 | |
| Lenovo Legion 5 15IRX10 5070 | |
| Blender / v3.3 Classroom CUDA | |
| Schenker XMG Core 15 (M25) | |
| Average NVIDIA GeForce RTX 5070 Laptop (29 - 228, n=29) | |
| Lenovo Legion 5 15AHP G10 | |
| MSI Katana A15 AI B8VG | |
| Asus TUF Gaming A16 FA608UP | |
| Average of class Gaming (15 - 228, n=106, last 2 years) | |
| Lenovo Legion Pro 5 16IAX10, RTX 5070 | |
| Lenovo Legion 5 15IRX10 5070 | |
| Blender / v3.3 Classroom CPU | |
| MSI Katana A15 AI B8VG | |
| Lenovo Legion 5 15IRX10 5070 | |
| Asus TUF Gaming A16 FA608UP | |
| Lenovo Legion 5 15AHP G10 | |
| Schenker XMG Core 15 (M25) | |
| Average NVIDIA GeForce RTX 5070 Laptop (137 - 507, n=26) | |
| Average of class Gaming (122 - 565, n=102, last 2 years) | |
| Lenovo Legion Pro 5 16IAX10, RTX 5070 | |
* ... smaller is better
游戏性能
Legion Pro 5 16 的游戏性能也非常出色,虽然在某些游戏中稍快一些。不过,这种差异几乎看不出来,即使在 QHD 分辨率下,大多数游戏也能流畅运行。由于 8GB 的显存容量有限,只有内存极其密集的游戏才会出现问题。
| Final Fantasy XV Benchmark - 1920x1080 High Quality | |
| Average of class Gaming (41 - 215, n=95, last 2 years) | |
| Lenovo Legion Pro 5 16IAX10, RTX 5070 | |
| Asus TUF Gaming A16 FA608UP | |
| Lenovo Legion 5 15IRX10 5070 | |
| Lenovo Legion 5 15AHP G10 | |
| MSI Katana A15 AI B8VG | |
| Strange Brigade - 1920x1080 ultra AA:ultra AF:16 | |
| Average of class Gaming (76.3 - 458, n=87, last 2 years) | |
| Lenovo Legion Pro 5 16IAX10, RTX 5070 | |
| Lenovo Legion 5 15AHP G10 | |
| Asus TUF Gaming A16 FA608UP | |
| Lenovo Legion 5 15IRX10 5070 | |
| Assassin's Creed Shadows - 2560x1440 Ultra High | |
| Average of class Gaming (22 - 65, n=49, last 2 years) | |
| Lenovo Legion 5 15IRX10 5070 | |
| Lenovo Legion Pro 5 16IAX10, RTX 5070 | |
| Average NVIDIA GeForce RTX 5070 Laptop (22 - 40, n=12) | |
| Lenovo Legion 5 15AHP G10 | |
| F1 24 - 2560x1440 Ultra High Preset AA:T AF:16x | |
| Average of class Gaming (36.7 - 109.4, n=58, last 2 years) | |
| Asus TUF Gaming A16 FA608UP | |
| Lenovo Legion 5 15IRX10 5070 | |
| Average NVIDIA GeForce RTX 5070 Laptop (40.3 - 59.3, n=18) | |
| Lenovo Legion 5 15AHP G10 | |
赛博朋克 2077》超 FPS 图表
| low | med. | high | ultra | QHD | |
|---|---|---|---|---|---|
| GTA V (2015) | 143.7 | 120.1 | |||
| Dota 2 Reborn (2015) | 178 | 166.2 | 161.5 | 150.2 | |
| Final Fantasy XV Benchmark (2018) | 207 | 180.5 | 139.7 | 108.7 | |
| X-Plane 11.11 (2018) | 132.4 | 121.5 | 100.2 | ||
| Strange Brigade (2018) | 470 | 281 | 240 | 208 | 137 |
| Baldur's Gate 3 (2023) | 176.7 | 146.5 | 130.8 | 127.2 | 90.1 |
| Cyberpunk 2077 (2023) | 157.8 | 132.5 | 112.8 | 101.5 | 66 |
| F1 24 (2024) | 244 | 90.2 | 55.3 | ||
| Assassin's Creed Shadows (2025) | 83 | 77 | 66 | 45 | 39 |
排放量
系统噪音
风扇性能与 AMD 型号完全相同。在 "性能 "模式下,游戏时的噪音高达 50.1 dB(A),清晰可闻("自动 "模式:~44.5 dB(A);"电池保护 "模式:~44.5 dB(A)自动模式:~44.5 dB(A);省电模式:~40.5 dB(A):~40.5 dB(A))。我们建议在执行轻量任务时使用 "电池保护 "模式,因为在此设置下风扇通常处于不活动状态。没有检测到其他电子噪音。
Noise level
| Idle |
| 24 / 24 / 28.3 dB(A) |
| Load |
| 39.6 / 50.1 dB(A) |
 | ||
30 dB silent 40 dB(A) audible 50 dB(A) loud |
||
min: | ||
| Lenovo Legion 5 15IRX10 5070 i7-13650HX, GeForce RTX 5070 Laptop | Lenovo Legion Pro 5 16IAX10, RTX 5070 Ultra 7 255HX, GeForce RTX 5070 Laptop | Lenovo Legion 5 15AHP G10 R7 260, GeForce RTX 5060 Laptop | Schenker XMG Core 15 (M25) Ryzen AI 7 350, GeForce RTX 5060 Laptop | MSI Katana A15 AI B8VG R9 8945HS, GeForce RTX 4070 Laptop GPU | no name | Asus TUF Gaming A16 FA608UP R7 260, GeForce RTX 5070 Laptop | |
|---|---|---|---|---|---|---|---|
| Noise | 2% | 0% | -5% | -2% | -3% | -15% | |
| off / environment * (dB) | 24 | 23 4% | 25.5 -6% | 24 -0% | 25 -4% | 22.9 5% | 25.1 -5% |
| Idle Minimum * (dB) | 24 | 23 4% | 25.5 -6% | 25 -4% | 25 -4% | 24 -0% | 32.2 -34% |
| Idle Average * (dB) | 24 | 23 4% | 25.5 -6% | 27 -13% | 26 -8% | 25.6 -7% | 32.2 -34% |
| Idle Maximum * (dB) | 28.3 | 23 19% | 26.9 5% | 29 -2% | 27 5% | 25.6 10% | 32.2 -14% |
| Load Average * (dB) | 39.6 | 43.85 -11% | 34.6 13% | 48 -21% | 40 -1% | 46.8 -18% | 38.1 4% |
| Cyberpunk 2077 ultra * (dB) | 50.1 | 50.27 -0% | 50.1 -0% | 49 2% | 52 -4% | 49.9 -0% | 53.9 -8% |
| Load Maximum * (dB) | 50.1 | 52.9 -6% | 50.1 -0% | 50 -0% | 50 -0% | 55.6 -11% | 57.1 -14% |
* ... smaller is better
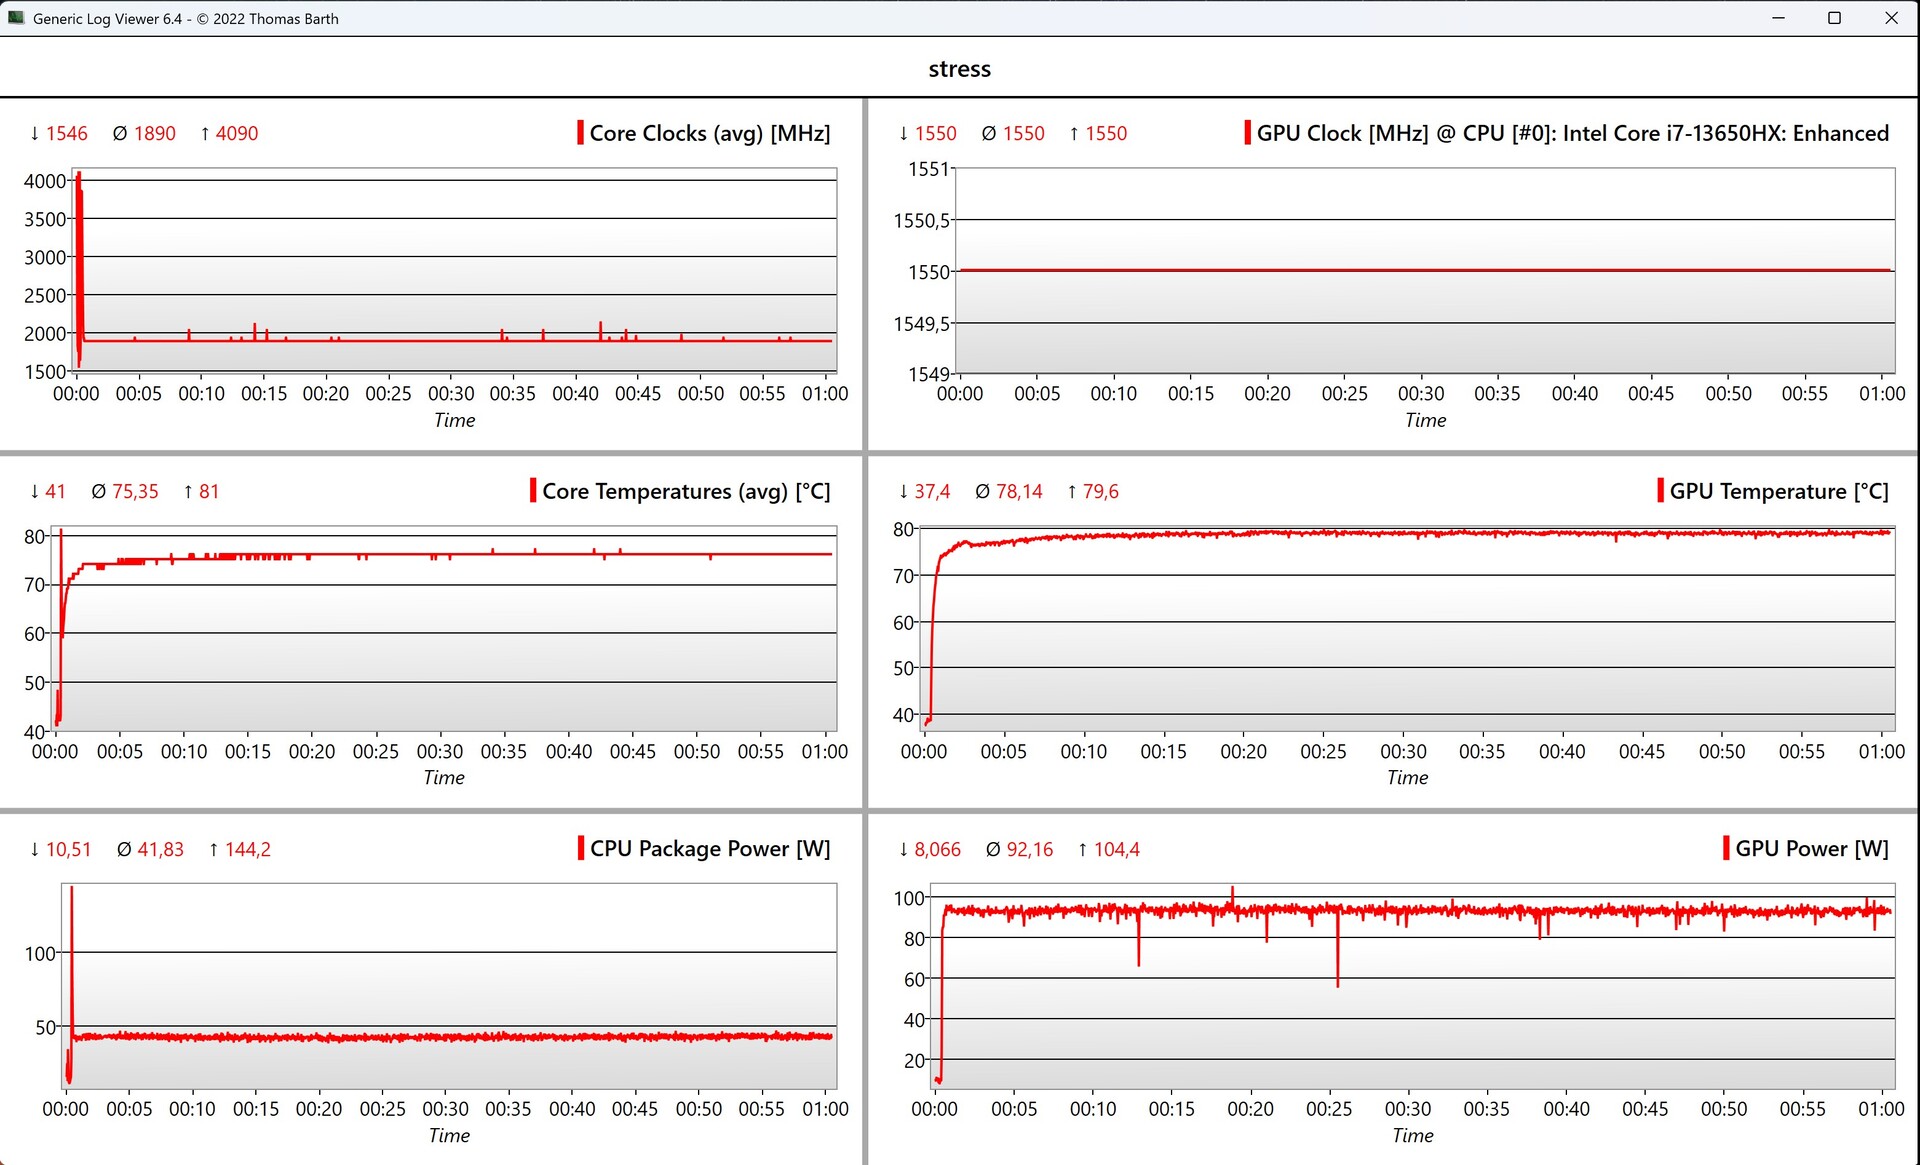
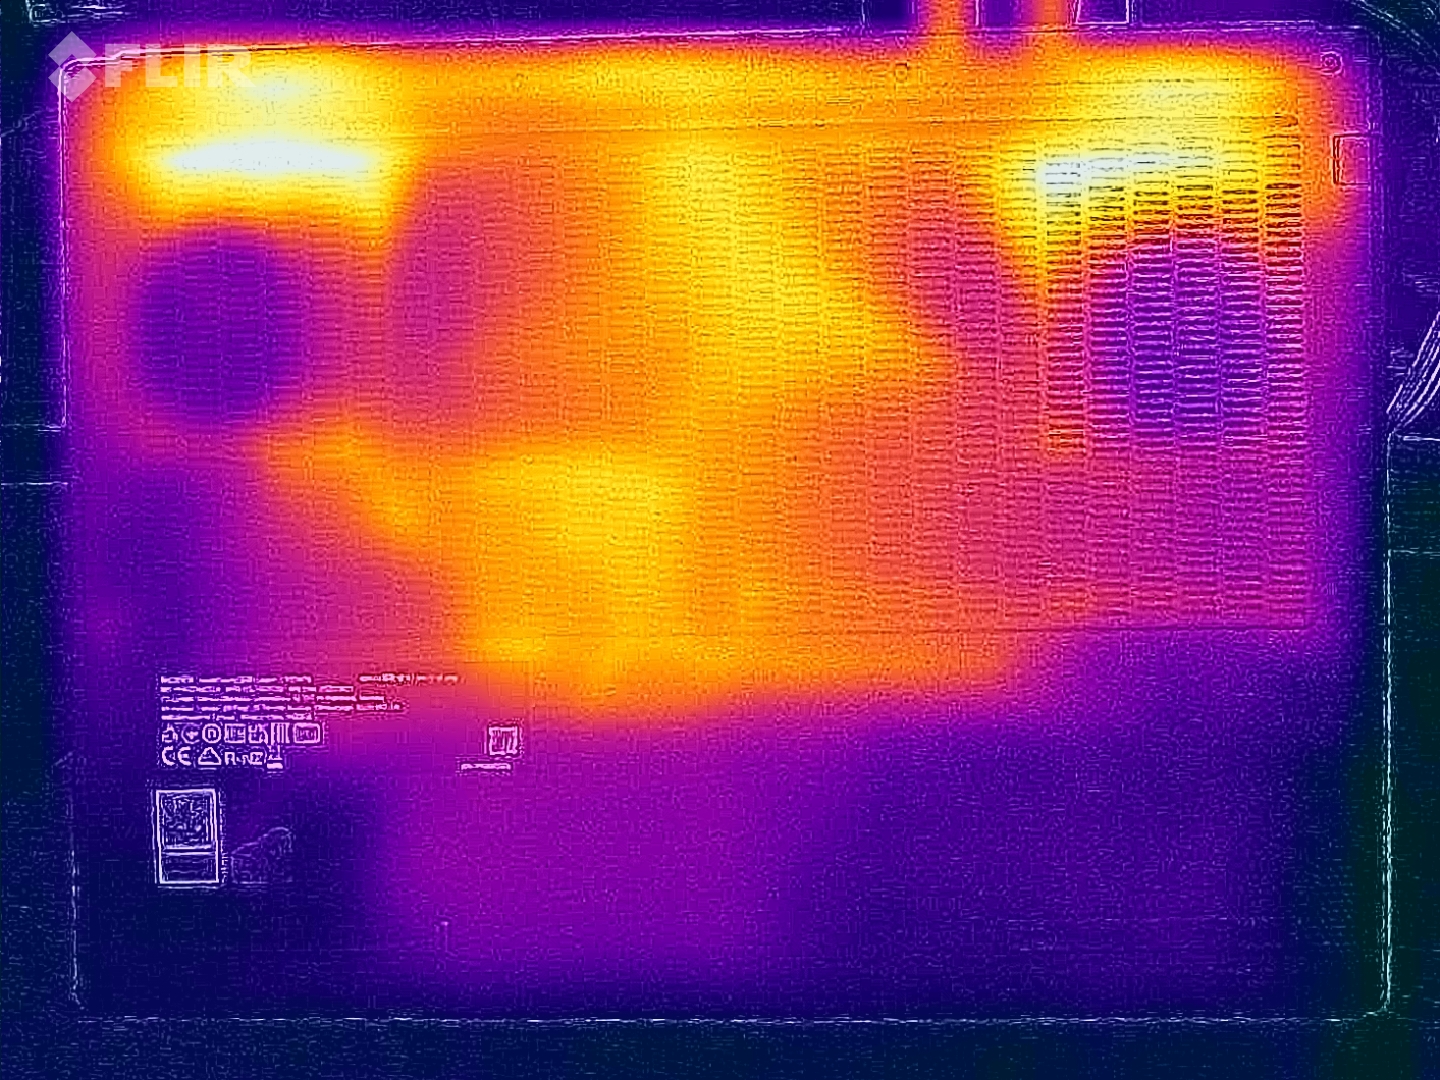
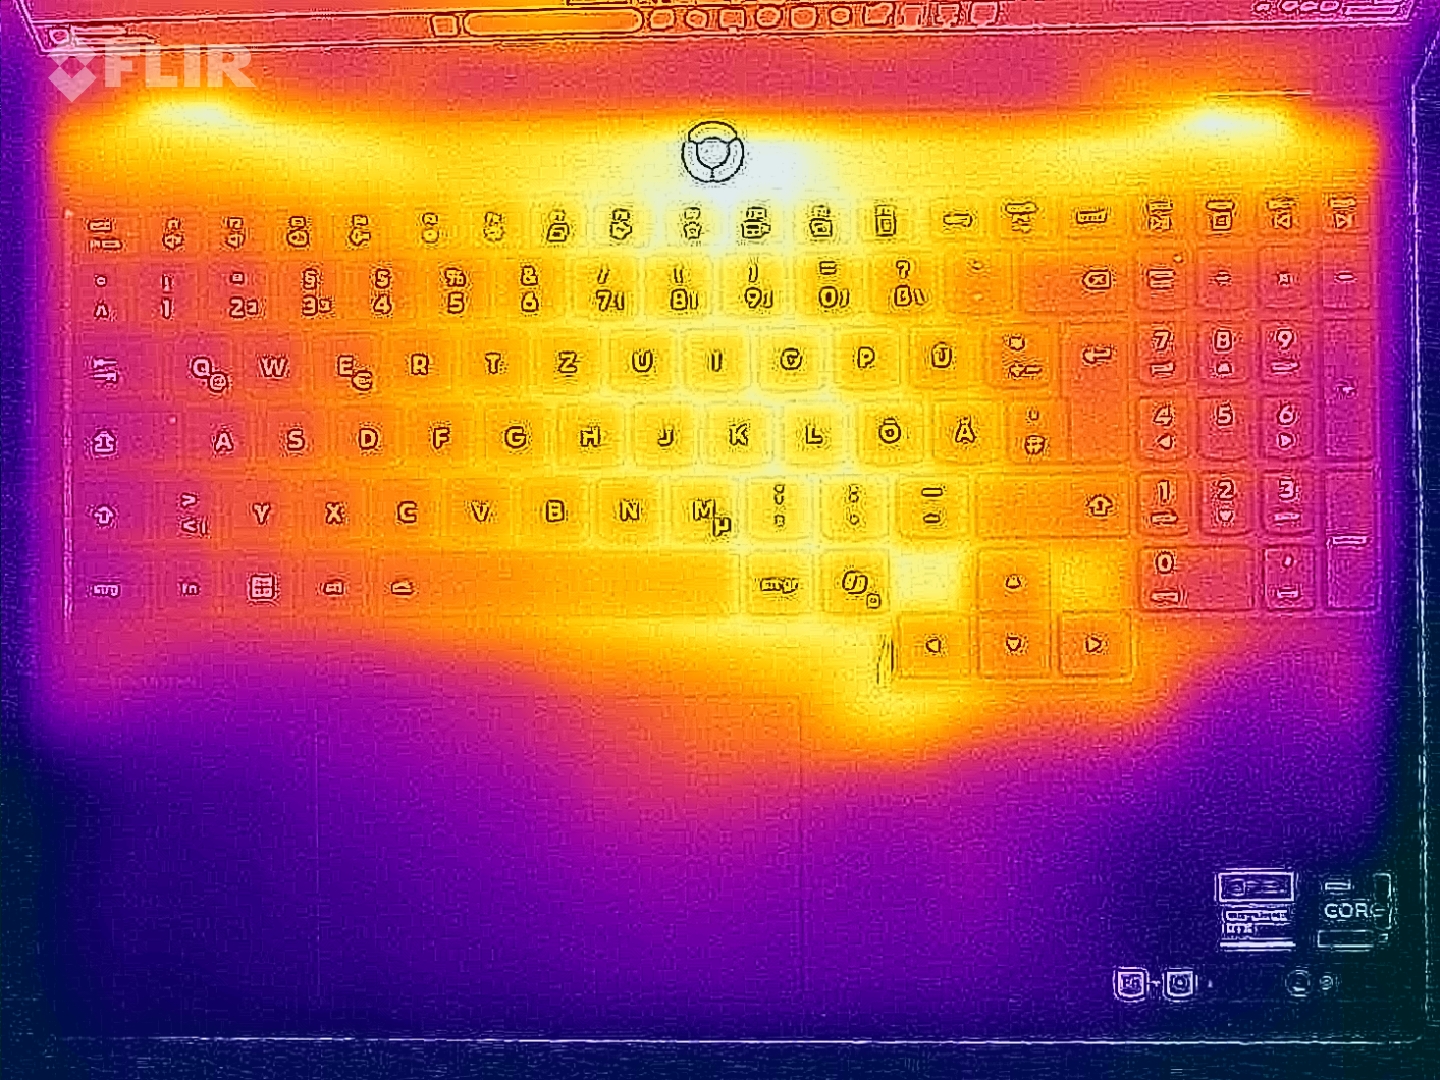
温度
在日常使用中,机身表面温度保持在很低的水平,但在游戏过程中,我们记录到的温度超过了 50 °C,因此这款设备不应该放在腿上使用。在压力测试中,GPU 稳定在 92 瓦,CPU 稳定在 42 瓦左右。
(±) The maximum temperature on the upper side is 41.6 °C / 107 F, compared to the average of 40.4 °C / 105 F, ranging from 21.2 to 68.8 °C for the class Gaming.
(-) The bottom heats up to a maximum of 52.7 °C / 127 F, compared to the average of 43.2 °C / 110 F
(+) In idle usage, the average temperature for the upper side is 29.4 °C / 85 F, compared to the device average of 33.9 °C / 93 F.
(±) 3: The average temperature for the upper side is 35.9 °C / 97 F, compared to the average of 33.9 °C / 93 F for the class Gaming.
(+) The palmrests and touchpad are reaching skin temperature as a maximum (33.3 °C / 91.9 F) and are therefore not hot.
(-) The average temperature of the palmrest area of similar devices was 28.8 °C / 83.8 F (-4.5 °C / -8.1 F).
| Lenovo Legion 5 15IRX10 5070 i7-13650HX, GeForce RTX 5070 Laptop | Lenovo Legion Pro 5 16IAX10, RTX 5070 Ultra 7 255HX, GeForce RTX 5070 Laptop | Lenovo Legion 5 15AHP G10 R7 260, GeForce RTX 5060 Laptop | Schenker XMG Core 15 (M25) Ryzen AI 7 350, GeForce RTX 5060 Laptop | MSI Katana A15 AI B8VG R9 8945HS, GeForce RTX 4070 Laptop GPU | no name | Asus TUF Gaming A16 FA608UP R7 260, GeForce RTX 5070 Laptop | |
|---|---|---|---|---|---|---|---|
| Heat | 4% | 7% | -2% | -2% | 16% | ||
| Maximum Upper Side * (°C) | 41.6 | 42 -1% | 42.2 -1% | 49 -18% | 48 -15% | 39.5 5% | |
| Maximum Bottom * (°C) | 52.7 | 44 17% | 51.7 2% | 59 -12% | 46 13% | 45.1 14% | |
| Idle Upper Side * (°C) | 32.6 | 33 -1% | 28.5 13% | 28 14% | 34 -4% | 25.7 21% | |
| Idle Bottom * (°C) | 33.9 | 34 -0% | 29.2 14% | 31 9% | 34 -0% | 25.5 25% |
* ... smaller is better
发言人
Lenovo Legion 5 15IRX10 5070 audio analysis
(±) | speaker loudness is average but good (81.5 dB)
Bass 100 - 315 Hz
(-) | nearly no bass - on average 21% lower than median
(±) | linearity of bass is average (8.2% delta to prev. frequency)
Mids 400 - 2000 Hz
(+) | balanced mids - only 4.7% away from median
(+) | mids are linear (5.4% delta to prev. frequency)
Highs 2 - 16 kHz
(+) | balanced highs - only 3.1% away from median
(+) | highs are linear (6.4% delta to prev. frequency)
Overall 100 - 16.000 Hz
(±) | linearity of overall sound is average (16.7% difference to median)
Compared to same class
» 43% of all tested devices in this class were better, 10% similar, 47% worse
» The best had a delta of 6%, average was 18%, worst was 132%
Compared to all devices tested
» 29% of all tested devices were better, 7% similar, 64% worse
» The best had a delta of 4%, average was 23%, worst was 134%
Lenovo Legion Pro 5 16IAX10, RTX 5070 audio analysis
(±) | speaker loudness is average but good (75.73 dB)
Bass 100 - 315 Hz
(-) | nearly no bass - on average 20% lower than median
(±) | linearity of bass is average (9.3% delta to prev. frequency)
Mids 400 - 2000 Hz
(±) | higher mids - on average 6.1% higher than median
(±) | linearity of mids is average (7.9% delta to prev. frequency)
Highs 2 - 16 kHz
(+) | balanced highs - only 2.2% away from median
(+) | highs are linear (6.3% delta to prev. frequency)
Overall 100 - 16.000 Hz
(±) | linearity of overall sound is average (19.4% difference to median)
Compared to same class
» 67% of all tested devices in this class were better, 7% similar, 26% worse
» The best had a delta of 6%, average was 18%, worst was 132%
Compared to all devices tested
» 48% of all tested devices were better, 7% similar, 45% worse
» The best had a delta of 4%, average was 23%, worst was 134%
Lenovo Legion 5 15AHP G10 audio analysis
(±) | speaker loudness is average but good (81.5 dB)
Bass 100 - 315 Hz
(-) | nearly no bass - on average 21% lower than median
(±) | linearity of bass is average (8.2% delta to prev. frequency)
Mids 400 - 2000 Hz
(+) | balanced mids - only 4.7% away from median
(+) | mids are linear (5.4% delta to prev. frequency)
Highs 2 - 16 kHz
(+) | balanced highs - only 3.1% away from median
(+) | highs are linear (6.4% delta to prev. frequency)
Overall 100 - 16.000 Hz
(±) | linearity of overall sound is average (16.7% difference to median)
Compared to same class
» 43% of all tested devices in this class were better, 10% similar, 47% worse
» The best had a delta of 6%, average was 18%, worst was 132%
Compared to all devices tested
» 29% of all tested devices were better, 7% similar, 64% worse
» The best had a delta of 4%, average was 23%, worst was 134%
Schenker XMG Core 15 (M25) audio analysis
(+) | speakers can play relatively loud (82 dB)
Bass 100 - 315 Hz
(-) | nearly no bass - on average 18.3% lower than median
(±) | linearity of bass is average (9.8% delta to prev. frequency)
Mids 400 - 2000 Hz
(+) | balanced mids - only 3.4% away from median
(+) | mids are linear (5.9% delta to prev. frequency)
Highs 2 - 16 kHz
(+) | balanced highs - only 3.2% away from median
(+) | highs are linear (4.1% delta to prev. frequency)
Overall 100 - 16.000 Hz
(+) | overall sound is linear (14.3% difference to median)
Compared to same class
» 26% of all tested devices in this class were better, 7% similar, 67% worse
» The best had a delta of 6%, average was 18%, worst was 132%
Compared to all devices tested
» 18% of all tested devices were better, 4% similar, 78% worse
» The best had a delta of 4%, average was 23%, worst was 134%
MSI Katana A15 AI B8VG audio analysis
(±) | speaker loudness is average but good (81 dB)
Bass 100 - 315 Hz
(-) | nearly no bass - on average 21.6% lower than median
(±) | linearity of bass is average (10% delta to prev. frequency)
Mids 400 - 2000 Hz
(±) | higher mids - on average 6.2% higher than median
(±) | linearity of mids is average (8.6% delta to prev. frequency)
Highs 2 - 16 kHz
(+) | balanced highs - only 2.8% away from median
(+) | highs are linear (6% delta to prev. frequency)
Overall 100 - 16.000 Hz
(±) | linearity of overall sound is average (19.2% difference to median)
Compared to same class
» 65% of all tested devices in this class were better, 7% similar, 28% worse
» The best had a delta of 6%, average was 18%, worst was 132%
Compared to all devices tested
» 46% of all tested devices were better, 7% similar, 46% worse
» The best had a delta of 4%, average was 23%, worst was 134%
Asus TUF Gaming A16 FA608UP audio analysis
(±) | speaker loudness is average but good (80.2 dB)
Bass 100 - 315 Hz
(±) | reduced bass - on average 11.8% lower than median
(±) | linearity of bass is average (8.7% delta to prev. frequency)
Mids 400 - 2000 Hz
(+) | balanced mids - only 3% away from median
(+) | mids are linear (3% delta to prev. frequency)
Highs 2 - 16 kHz
(+) | balanced highs - only 4.4% away from median
(±) | linearity of highs is average (7.4% delta to prev. frequency)
Overall 100 - 16.000 Hz
(+) | overall sound is linear (12.6% difference to median)
Compared to same class
» 16% of all tested devices in this class were better, 4% similar, 81% worse
» The best had a delta of 6%, average was 18%, worst was 132%
Compared to all devices tested
» 11% of all tested devices were better, 3% similar, 86% worse
» The best had a delta of 4%, average was 23%, worst was 134%
能源管理
空闲时,英特尔型号的功耗略高于 AMD 型号。在中等负载情况下,差异会变得更加明显,功率略低于 30 瓦时,HX 处理器的影响就很明显了。在压力测试中,我们测得的峰值功耗为 247 瓦,很快稳定在 175 瓦左右。因此,随机附带的 245 瓦电源适配器大小适中。
| Off / Standby | |
| Idle | |
| Load |
|
Key:
min: | |
| Lenovo Legion 5 15IRX10 5070 i7-13650HX, GeForce RTX 5070 Laptop, WD PC SN7100S SDFPMSL-1T00-1101, OLED, 2560x1600, 15.1" | Lenovo Legion Pro 5 16IAX10, RTX 5070 Ultra 7 255HX, GeForce RTX 5070 Laptop, SK Hynix HFS001TEJ9X115N, OLED, 2650x1600, 16" | Lenovo Legion 5 15AHP G10 R7 260, GeForce RTX 5060 Laptop, SK hynix PVC10 HFS001TEM4X182N, OLED, 2560x1600, 15.1" | Schenker XMG Core 15 (M25) Ryzen AI 7 350, GeForce RTX 5060 Laptop, Samsung 990 Pro 2 TB MZVL72T0HDLB, IPS, 2560x1600, 15.3" | MSI Katana A15 AI B8VG R9 8945HS, GeForce RTX 4070 Laptop GPU, WD PC SN560 SDDPNQE-1T00, IPS, 1920x1080, 15.6" | no name | Asus TUF Gaming A16 FA608UP R7 260, GeForce RTX 5070 Laptop, Western Digital PC SN5000S SDEQNSJ-1T00, IPS, 2560x1600, 16" | Average NVIDIA GeForce RTX 5070 Laptop | Average of class Gaming | |
|---|---|---|---|---|---|---|---|---|---|
| Power Consumption | -14% | 17% | 4% | -5% | 12% | 15% | -11% | -32% | |
| Idle Minimum * (Watt) | 11.4 | 10.6 7% | 6.9 39% | 10.6 7% | 13 -14% | 4.4 61% | 4.6 60% | 10.8 ? 5% | 13 ? -14% |
| Idle Average * (Watt) | 12.8 | 12.3 4% | 10.7 16% | 12.1 5% | 18 -41% | 18 -41% | 9.8 23% | 15.4 ? -20% | 19 ? -48% |
| Idle Maximum * (Watt) | 13.4 | 18.6 -39% | 11.3 16% | 15.9 -19% | 23 -72% | 18.2 -36% | 10.2 24% | 21 ? -57% | 24.6 ? -84% |
| Load Average * (Watt) | 103.7 | 104 -0% | 69.7 33% | 95 8% | 63 39% | 87.1 16% | 76.1 27% | 98.7 ? 5% | 110.7 ? -7% |
| Cyberpunk 2077 ultra external monitor * (Watt) | 171.5 | 227 -32% | 165 4% | 165 4% | 156 9% | 120.6 30% | 198.1 -16% | ||
| Cyberpunk 2077 ultra * (Watt) | 171.5 | 231 -35% | 162.6 5% | 169 1% | 156.8 9% | 123 28% | 198.9 -16% | ||
| Load Maximum * (Watt) | 246.8 | 248 -0% | 233.6 5% | 192 22% | 159 36% | 183 26% | 235.2 5% | 218 ? 12% | 259 ? -5% |
* ... smaller is better
能耗 赛博朋克/压力测试
带外部监控器的能耗
电池寿命
电池续航时间明显短于 AMD 型号。在亮度为 150 cd/m²、刷新率为 60 Hz 的条件下,我们测得的电池使用时间不到 5 小时。
| Lenovo Legion 5 15IRX10 5070 i7-13650HX, GeForce RTX 5070 Laptop, 80 Wh | Lenovo Legion Pro 5 16IAX10, RTX 5070 Ultra 7 255HX, GeForce RTX 5070 Laptop, 80 Wh | Lenovo Legion 5 15AHP G10 R7 260, GeForce RTX 5060 Laptop, 80 Wh | Schenker XMG Core 15 (M25) Ryzen AI 7 350, GeForce RTX 5060 Laptop, 99.8 Wh | MSI Katana A15 AI B8VG R9 8945HS, GeForce RTX 4070 Laptop GPU, 53.5 Wh | no name Wh | Asus TUF Gaming A16 FA608UP R7 260, GeForce RTX 5070 Laptop, 90 Wh | Average of class Gaming | |
|---|---|---|---|---|---|---|---|---|
| Battery Runtime | ||||||||
| WiFi Websurfing (h) | 4.9 | 6.2 27% | 9.7 98% | 9.9 102% | 4 -18% | 13 165% | 7.11 ? 45% |
Notebookcheck 总体评分
Lenovo Legion 5 15IRX10 5070
- 10/26/2025 v8
Andreas Osthoff
 Total Sustainability Score:
 可比较的替代品
Image | Model / Review | Price | Weight | Height | Display |
|---|---|---|---|---|---|
1. 86.5%  | Lenovo Legion 5 15IRX10 5070 Intel Core i7-13650HX ⎘ NVIDIA GeForce RTX 5070 Laptop ⎘ 32 GB Memory, 1024 GB SSD | Amazon: List Price: 1499€ | 1.9 kg | 21.5 mm | 15.10" 2560x1600 200 PPI OLED |
2. 86.4%  | Lenovo Legion Pro 5 16IAX10, RTX 5070 Intel Core Ultra 7 255HX ⎘ NVIDIA GeForce RTX 5070 Laptop ⎘ 32 GB Memory, 1024 GB SSD | Amazon: List Price: 1800 Euro | 2.3 kg | 25.95 mm | 16.00" 2650x1600 189 PPI OLED |
3. 87.2%  | Lenovo Legion 5 15AHP G10 AMD Ryzen 7 260 ⎘ NVIDIA GeForce RTX 5060 Laptop ⎘ 32 GB Memory, 1024 GB SSD | Amazon: List Price: 1449€ | 1.9 kg | 21.5 mm | 15.10" 2560x1600 200 PPI OLED |
4. 84.7%  | Schenker XMG Core 15 (M25) AMD Ryzen AI 7 350 ⎘ NVIDIA GeForce RTX 5060 Laptop ⎘ 64 GB Memory, 2048 GB SSD | Amazon: List Price: 1840 EUR | 1.9 kg | 22 mm | 15.30" 2560x1600 197 PPI IPS |
5. 76.4%  | MSI Katana A15 AI B8VG AMD Ryzen 9 8945HS ⎘ NVIDIA GeForce RTX 4070 Laptop GPU ⎘ 16 GB Memory, 1024 GB SSD | Amazon: List Price: 1500 EUR | 2.3 kg | 24.9 mm | 15.60" 1920x1080 141 PPI IPS |
| no name ⎘ ⎘ | Amazon: 1. $9.99 Hobby Lobby No Name School S... 2. $16.99 No Name 3. No Name | ||||
7. 83.8%  | Asus TUF Gaming A16 FA608UP AMD Ryzen 7 260 ⎘ NVIDIA GeForce RTX 5070 Laptop ⎘ 32 GB Memory, 1024 GB SSD | Amazon: List Price: 2199€ | 2.2 kg | 25.7 mm | 16.00" 2560x1600 189 PPI IPS |
Transparency
The selection of devices to be reviewed is made by our editorial team. The test sample was provided to the author as a loan by the manufacturer or retailer for the purpose of this review. The lender had no influence on this review, nor did the manufacturer receive a copy of this review before publication. There was no obligation to publish this review. As an independent media company, Notebookcheck is not subjected to the authority of manufacturers, retailers or publishers.
This is how Notebookcheck is testing
Every year, Notebookcheck independently reviews hundreds of laptops and smartphones using standardized procedures to ensure that all results are comparable. We have continuously developed our test methods for around 20 years and set industry standards in the process. In our test labs, high-quality measuring equipment is utilized by experienced technicians and editors. These tests involve a multi-stage validation process. Our complex rating system is based on hundreds of well-founded measurements and benchmarks, which maintains objectivity. Further information on our test methods can be found here.
