结论 - 工作和游戏的平衡动力
Alienware 16X Aurora 的显著特点是其高质量的结构和 240 Hz IPS 显示屏,在当前所有配置中均采用 P3 色彩。其他低端或中端游戏笔记本电脑往往使用更多塑料或配备更便宜的 IPS 面板以节省成本,因此我们非常欣赏戴尔为 16X Aurora 设立的更高标准。即使是价格较低(非 X)的 16 Aurora 也承诺在基准线上显示完整的 sRGB 色彩。
风扇性能是另一个亮点,因为风扇在运行低负载时不会出现脉冲。虽然这种情况在采用 ULV CPU 的超极本上很常见,但我们希望在大型游戏笔记本电脑上看到更多。
16X Aurora 的许多缺点与51区.更高质量的结构意味着更重的机身,而功耗可能相当高,即使对于游戏笔记本电脑来说,电池续航时间也最多只能达到一般水平。同时,GPU 最高可选 GeForce RTX 5070而不是 RTX 5070 Ti更适合 1600p 游戏。戴尔为价格更高的 Area-51 系列保留了 RTX 5070 Ti 选项,以鼓励潜在买家升级。
Pros
Cons
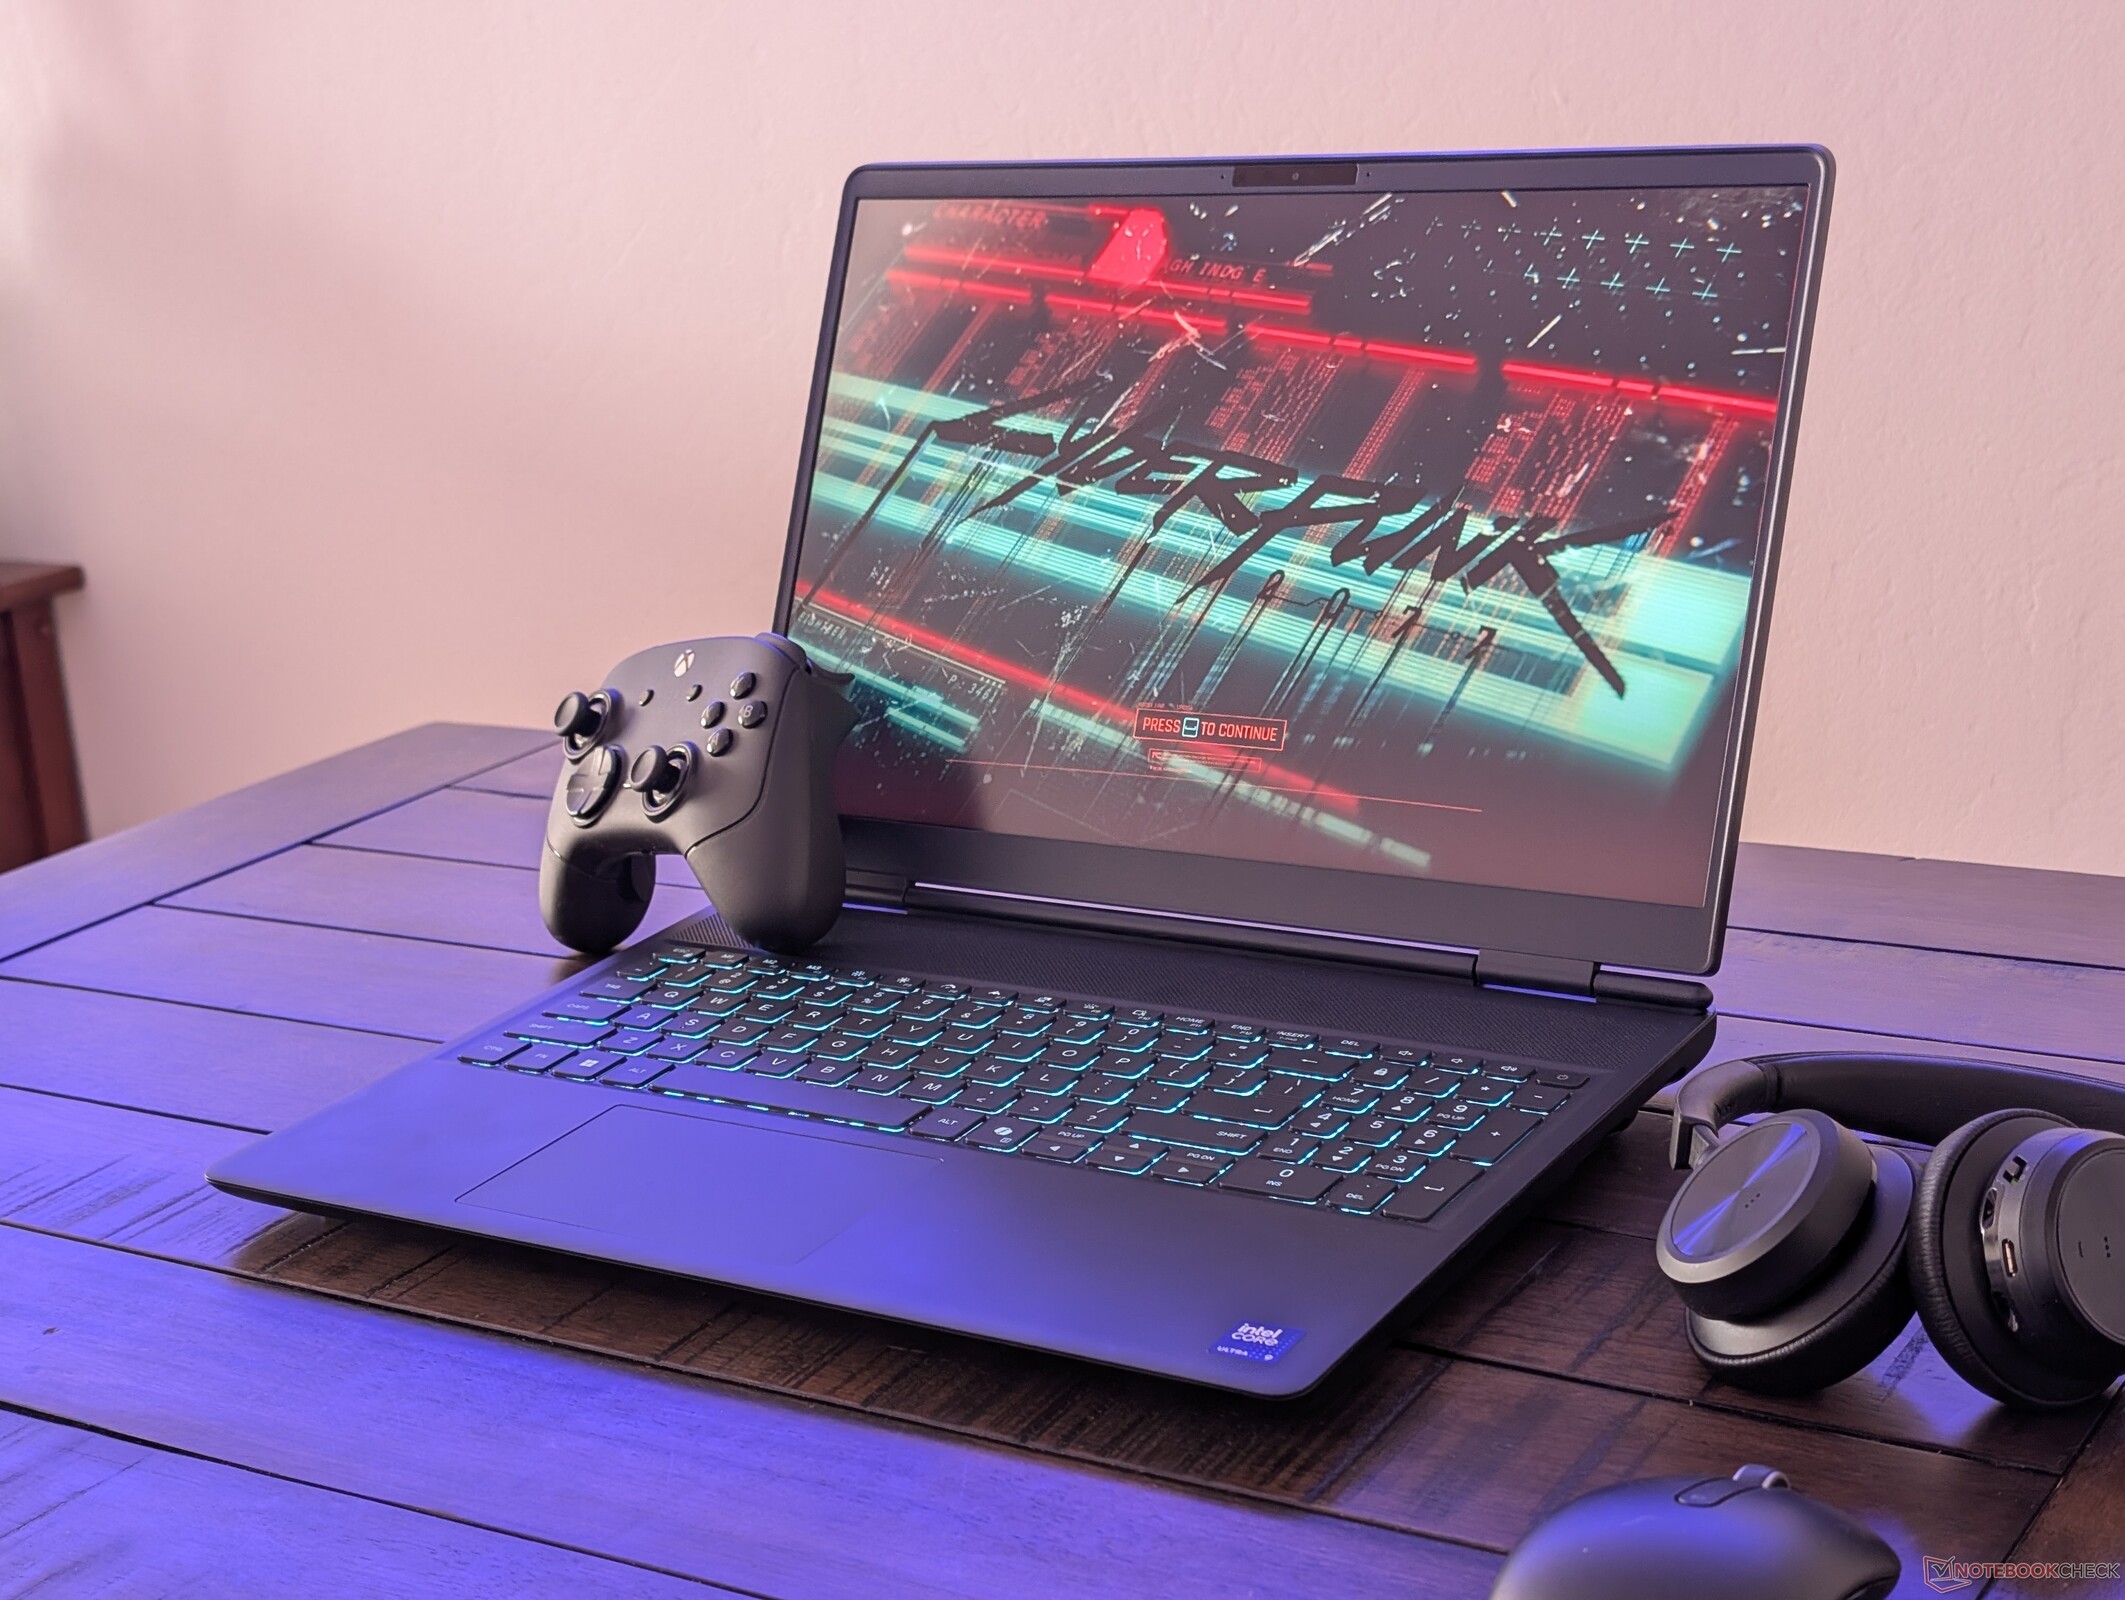
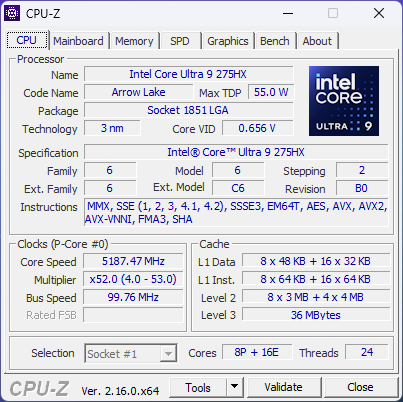
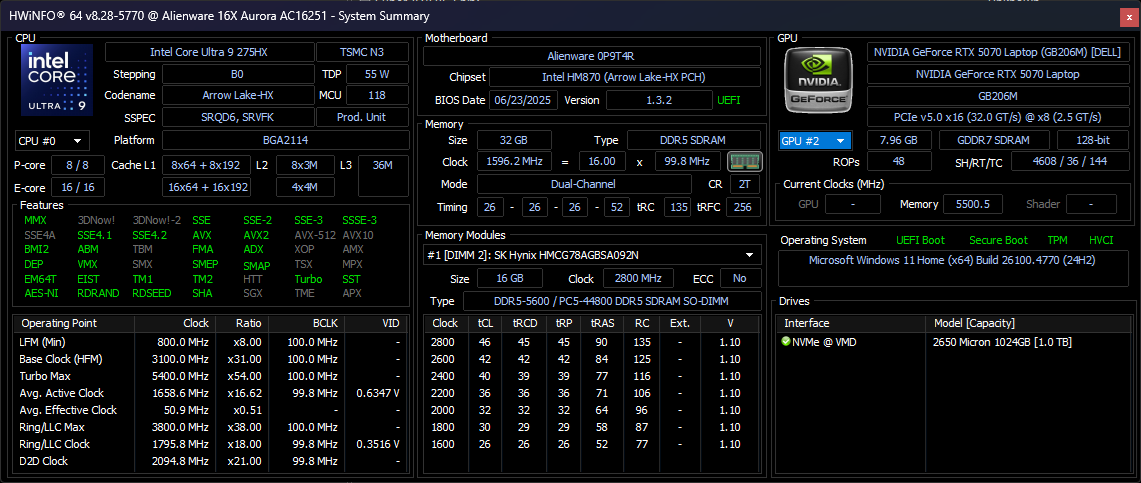
Alienware Aurora 16X 是戴尔推出的一款中端游戏笔记本电脑,仅次于高端的 Alienware Area-51 系列.它采用了与 Area-51 相同的英特尔箭湖-HX CPU,但为了节省成本,它采用了低端的 Nvidia Blackwell 选件,以较低的功率上限运行。16X Aurora 可被视为旧版 Alienware m16 系列.
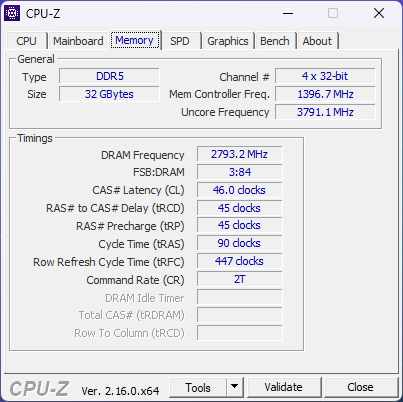
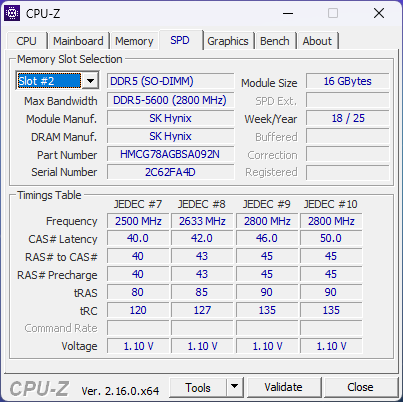
我们的测试机是一款高端配置,配备酷睿至尊 9 275HX CPU、115 WGeForce RTX 5070 GPU 和 1600p240 Hz IPS P3 显示屏,售价约为 1600 美元。低端 SKU(称为 16 Aurora)配备 Core Ultra 7 255HX 和/或 RTX 5060 以及 1600p120 IPS sRGB 显示屏。
极光 16X 的替代产品包括其他中端 16 英寸游戏笔记本电脑,如 微星 Vector 16 HX, 华硕 TUF Gaming A16或 联想Legion 5 Pro.
更多戴尔评论:
规格
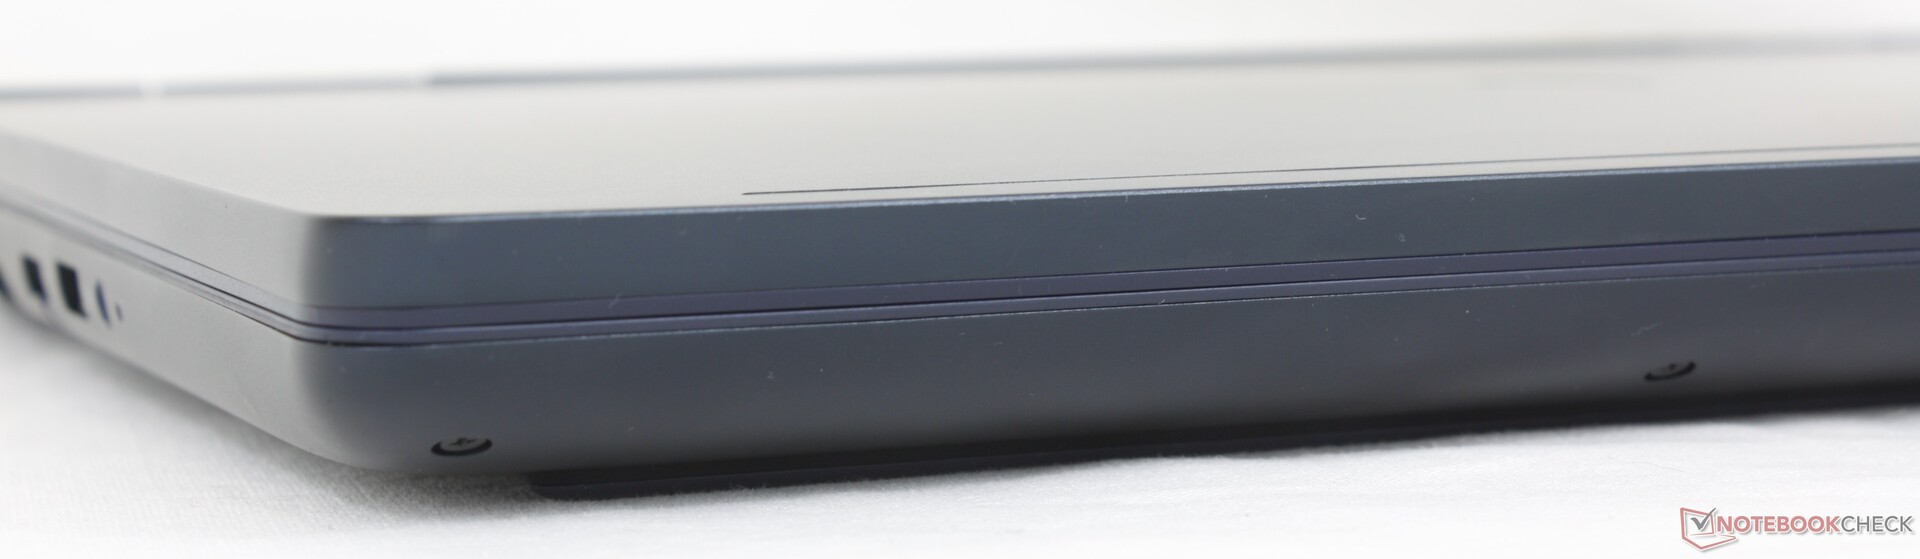
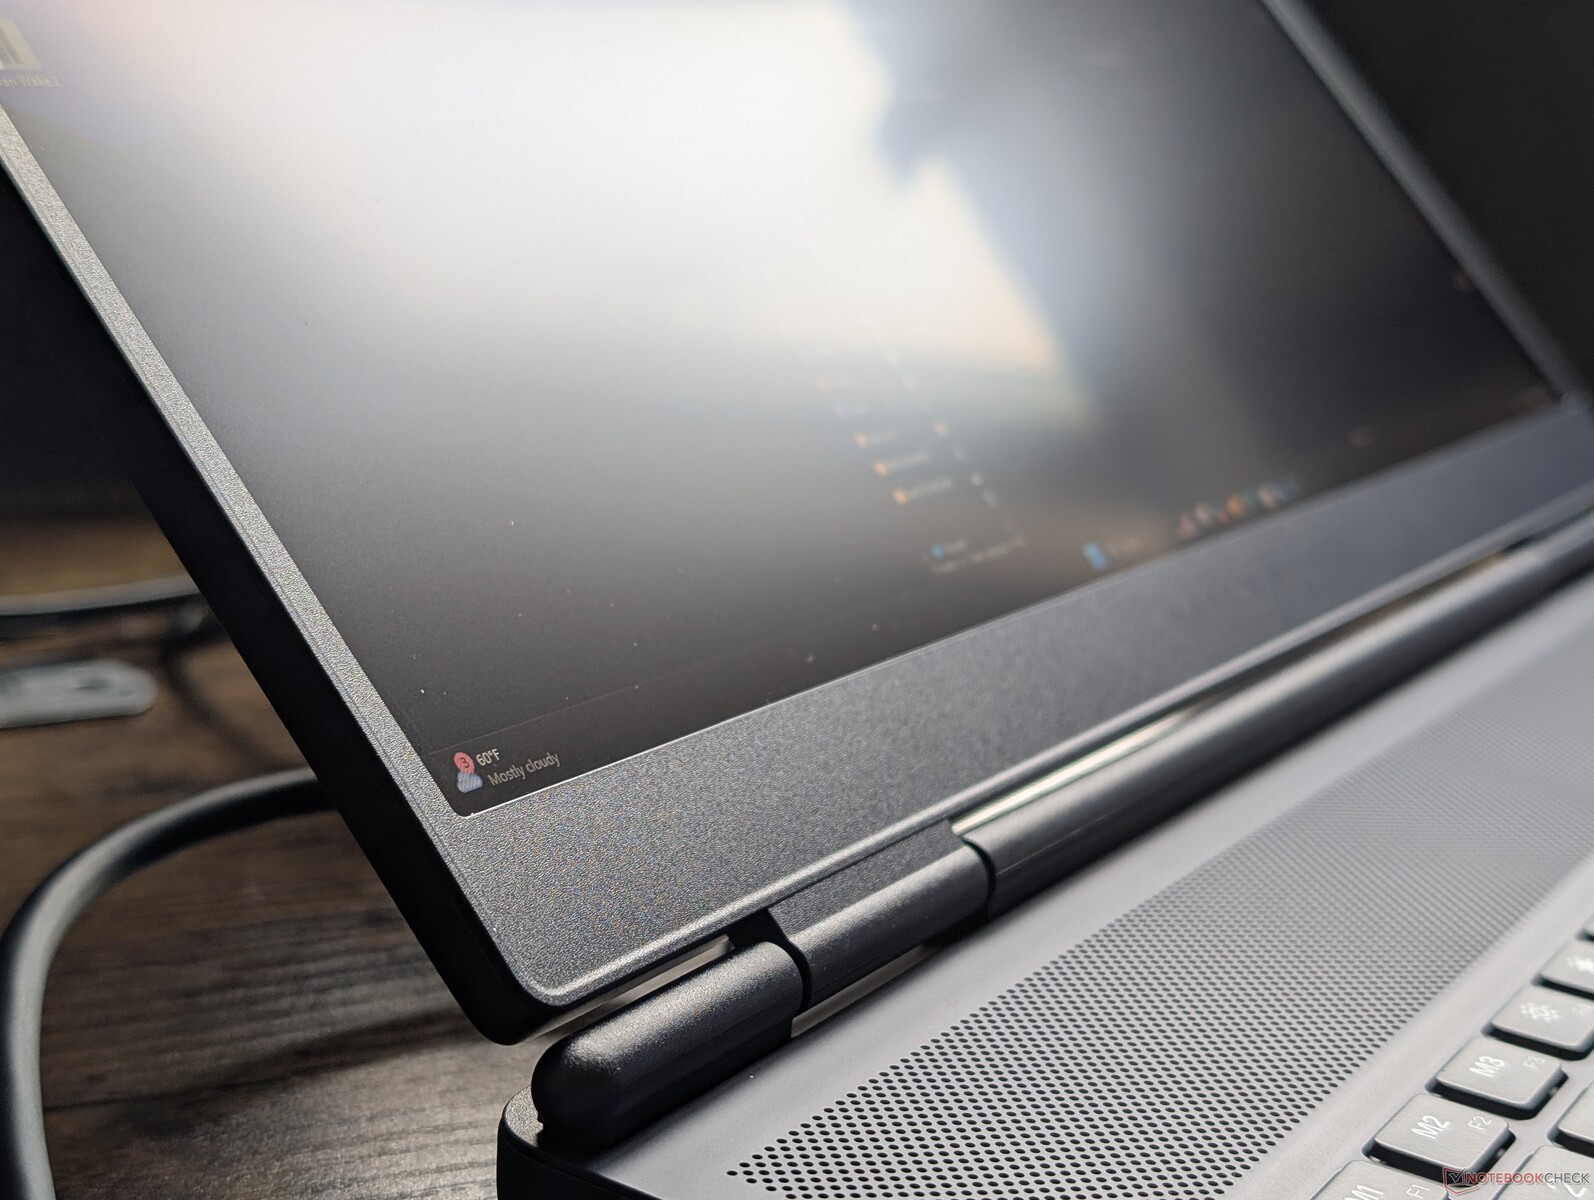
案例
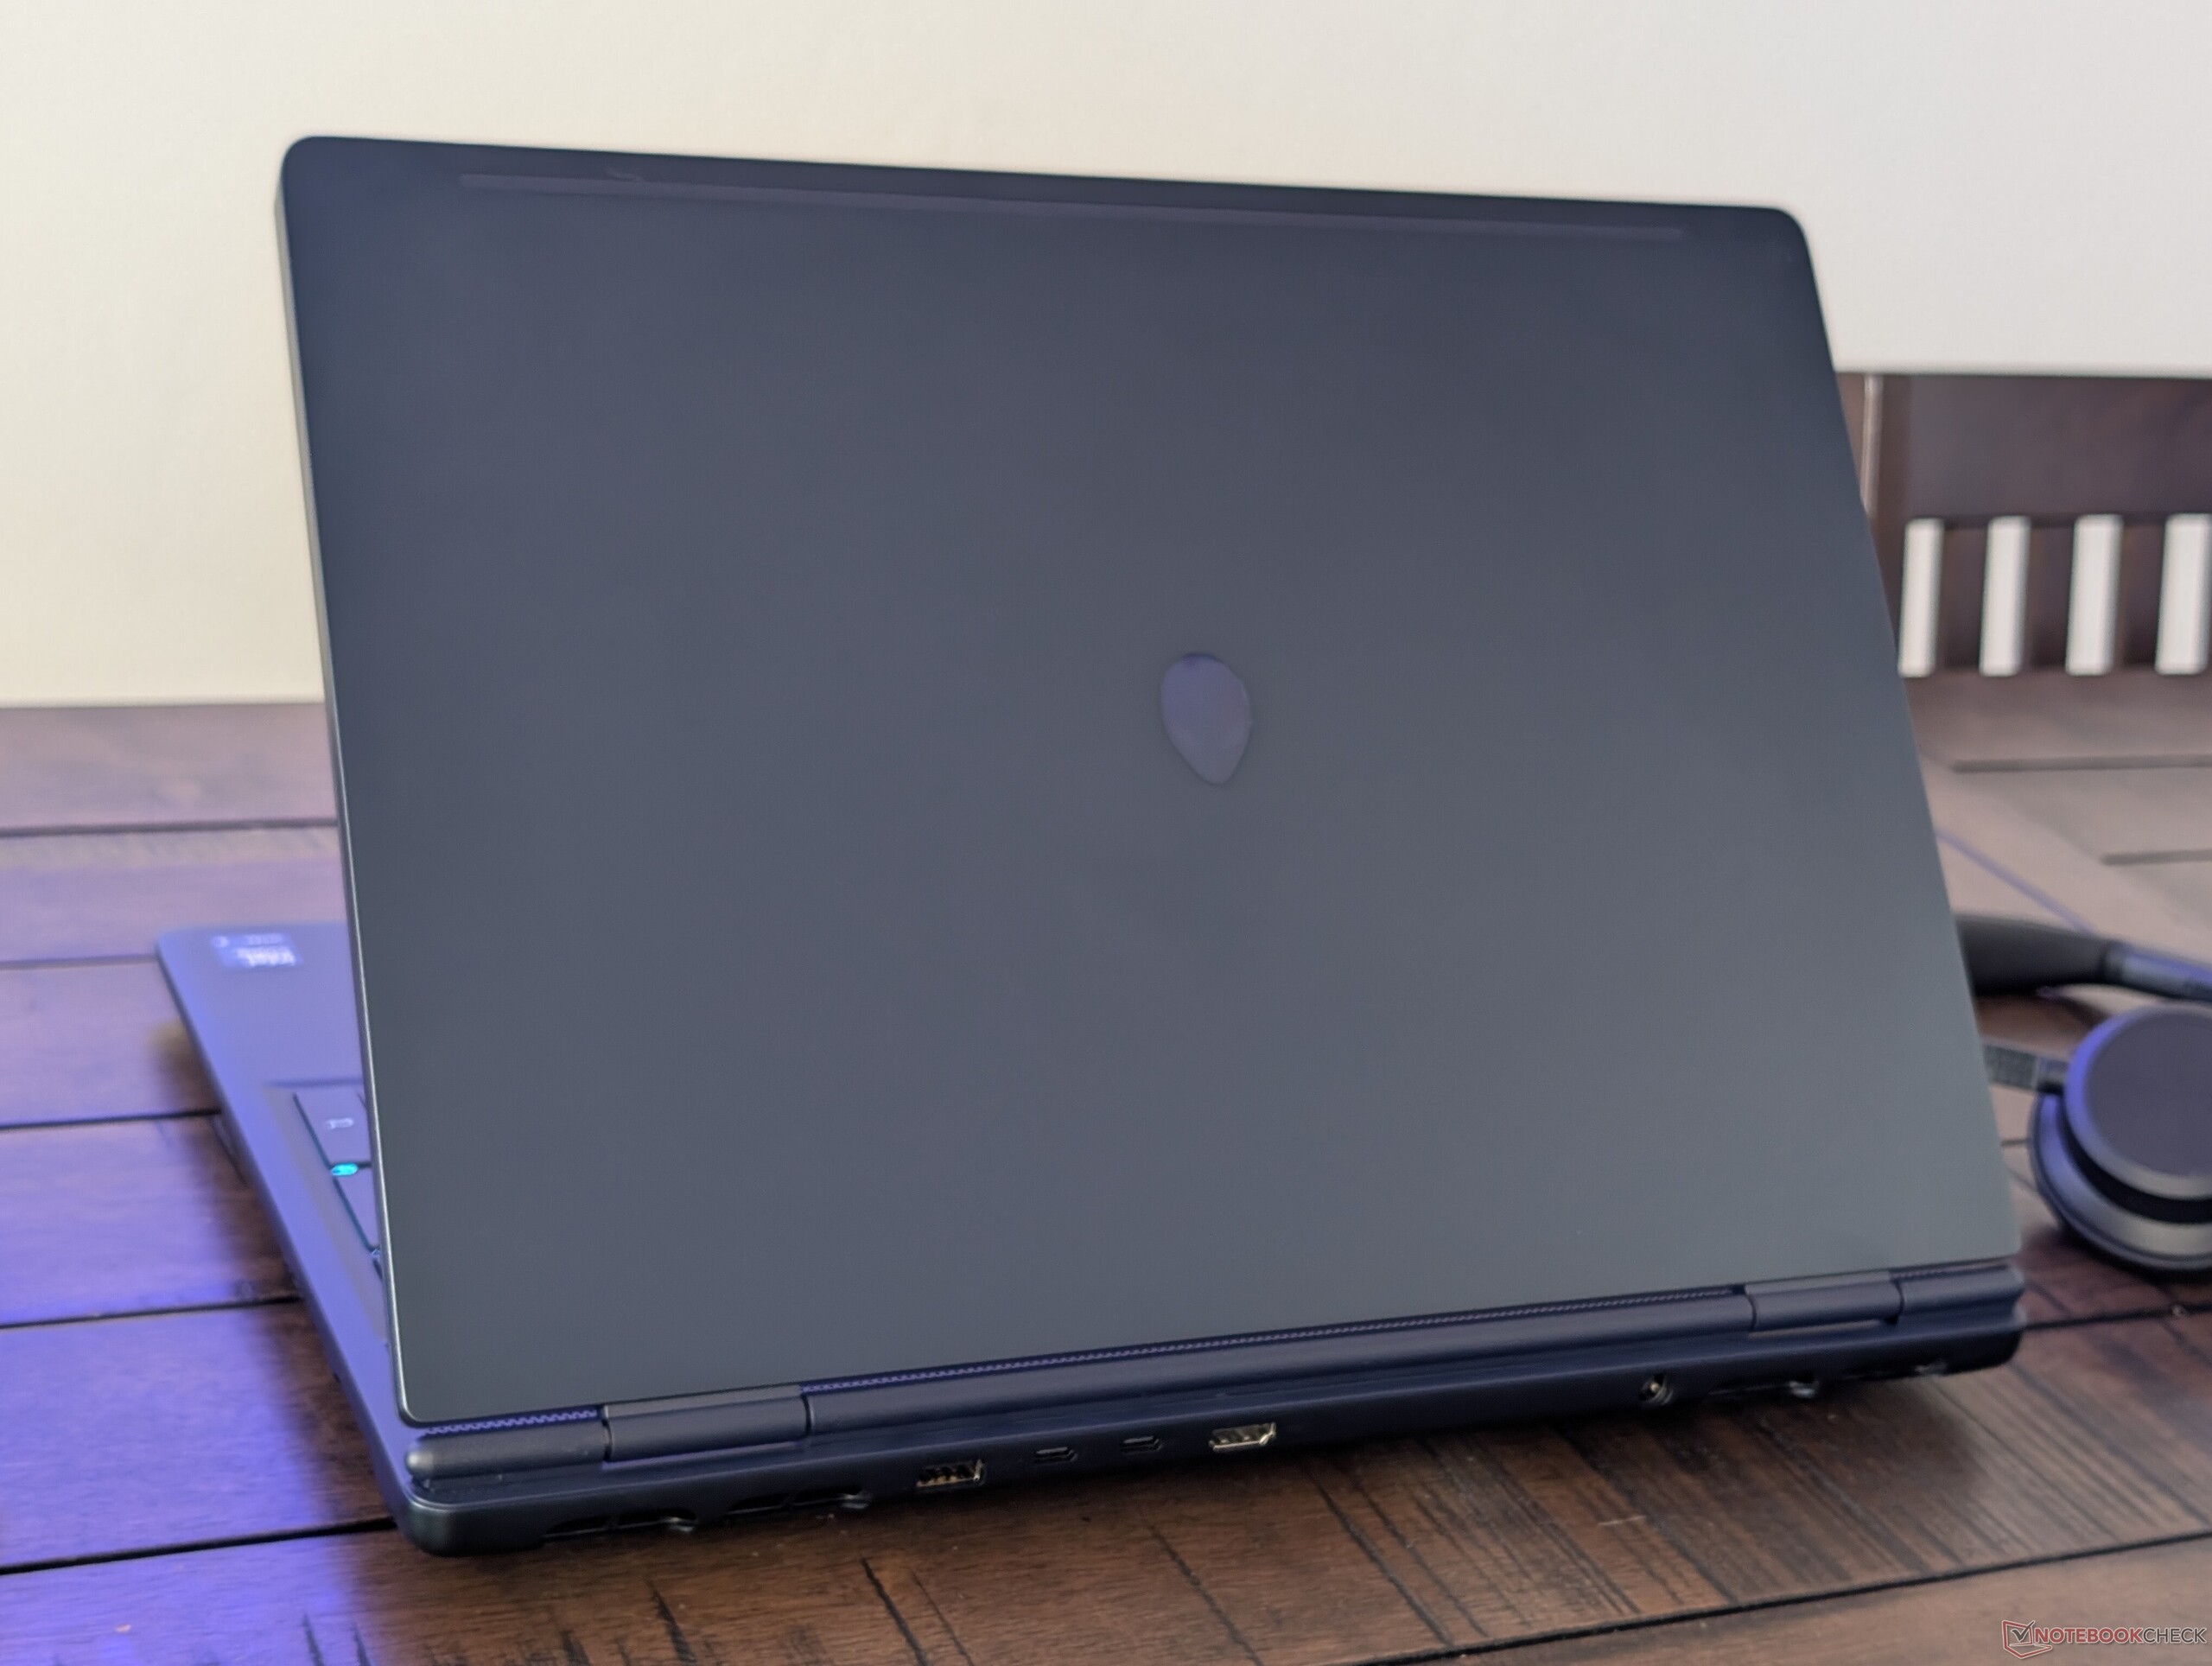
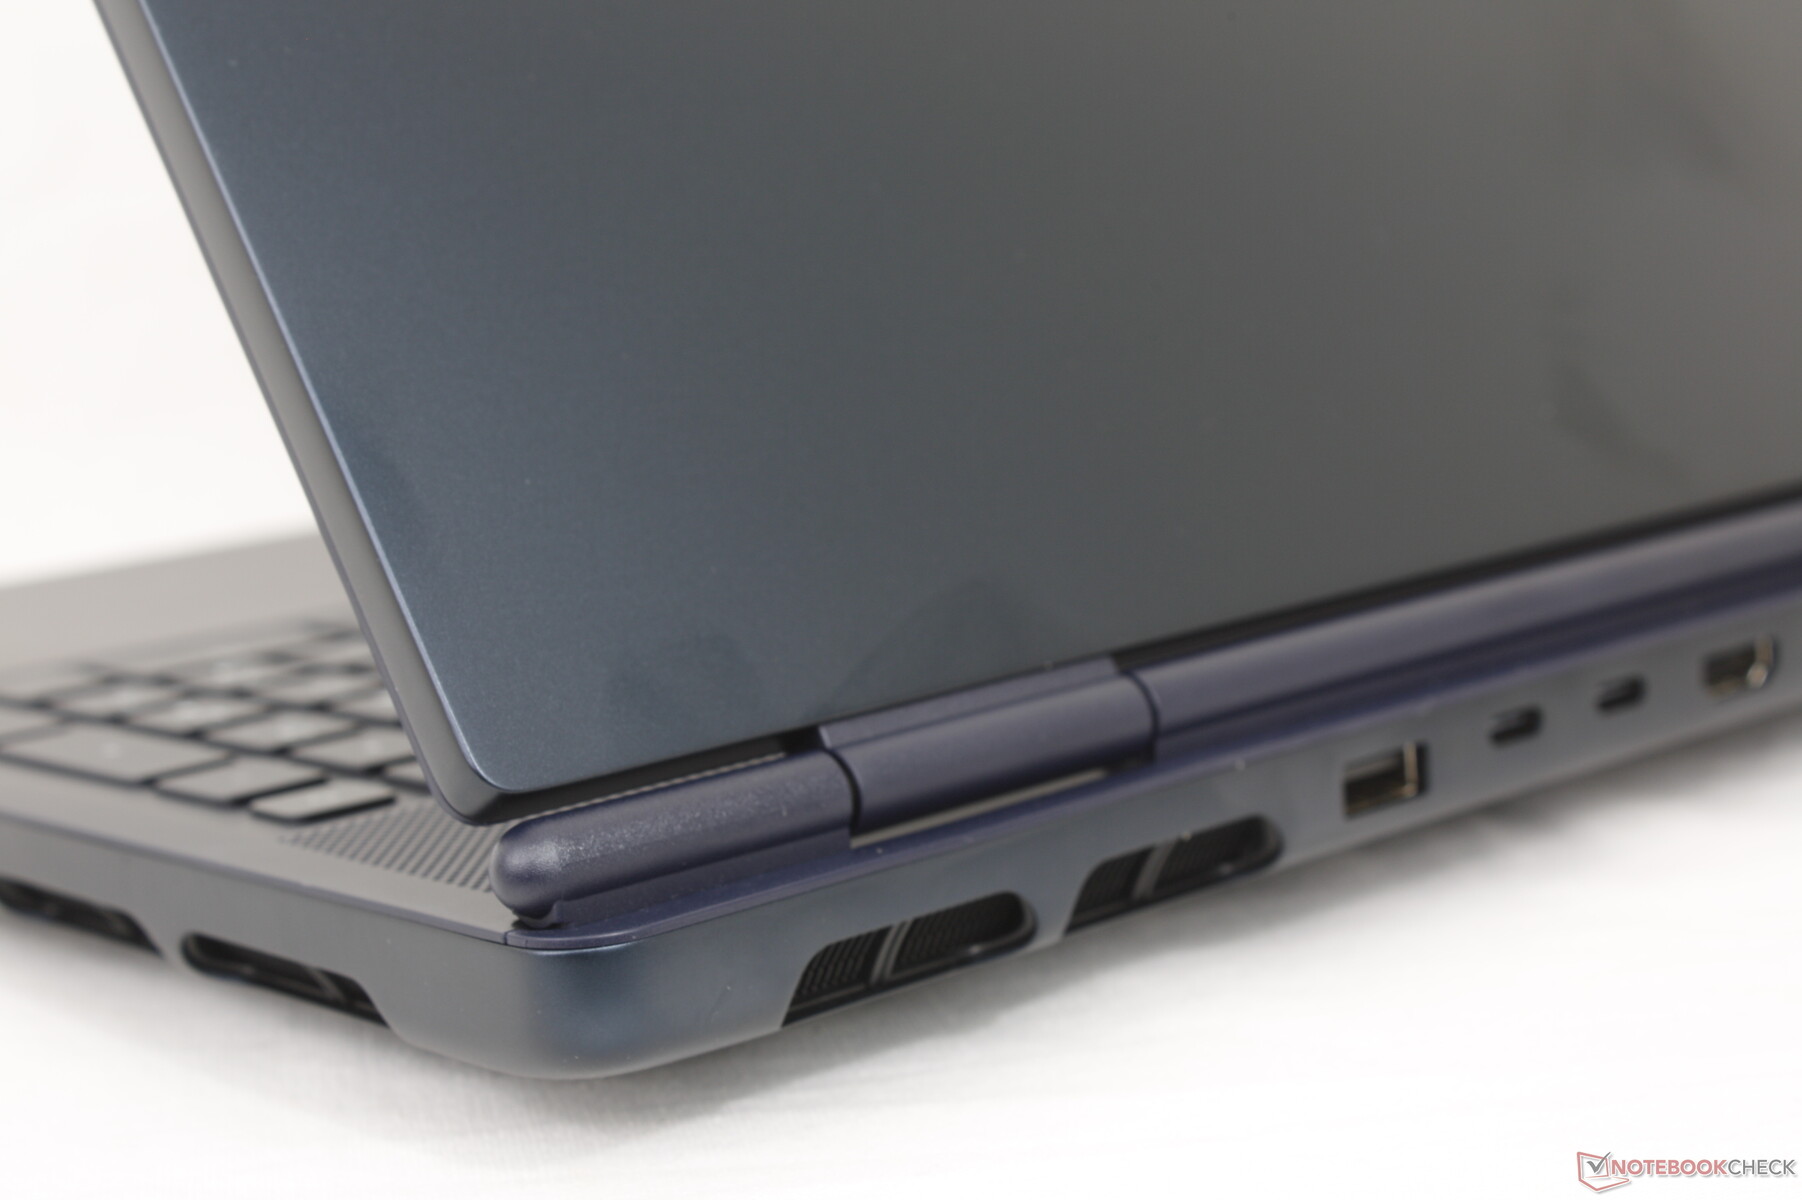
这款机箱可以说是 Alienware 16 Area-51 的缩小版。机箱后部的 RGB 灯、底部的大猩猩玻璃视窗、每个按键的 RGB 灯光和双色选项都不见了,取而代之的是直截了当的黑色外观。也许最重要的是,由于大部分机箱仍然由镁合金和阳极氧化铝组成,塑料被保持在最低限度,这一点值得庆幸。因此,就价格而言,机箱的刚性感觉非常好。
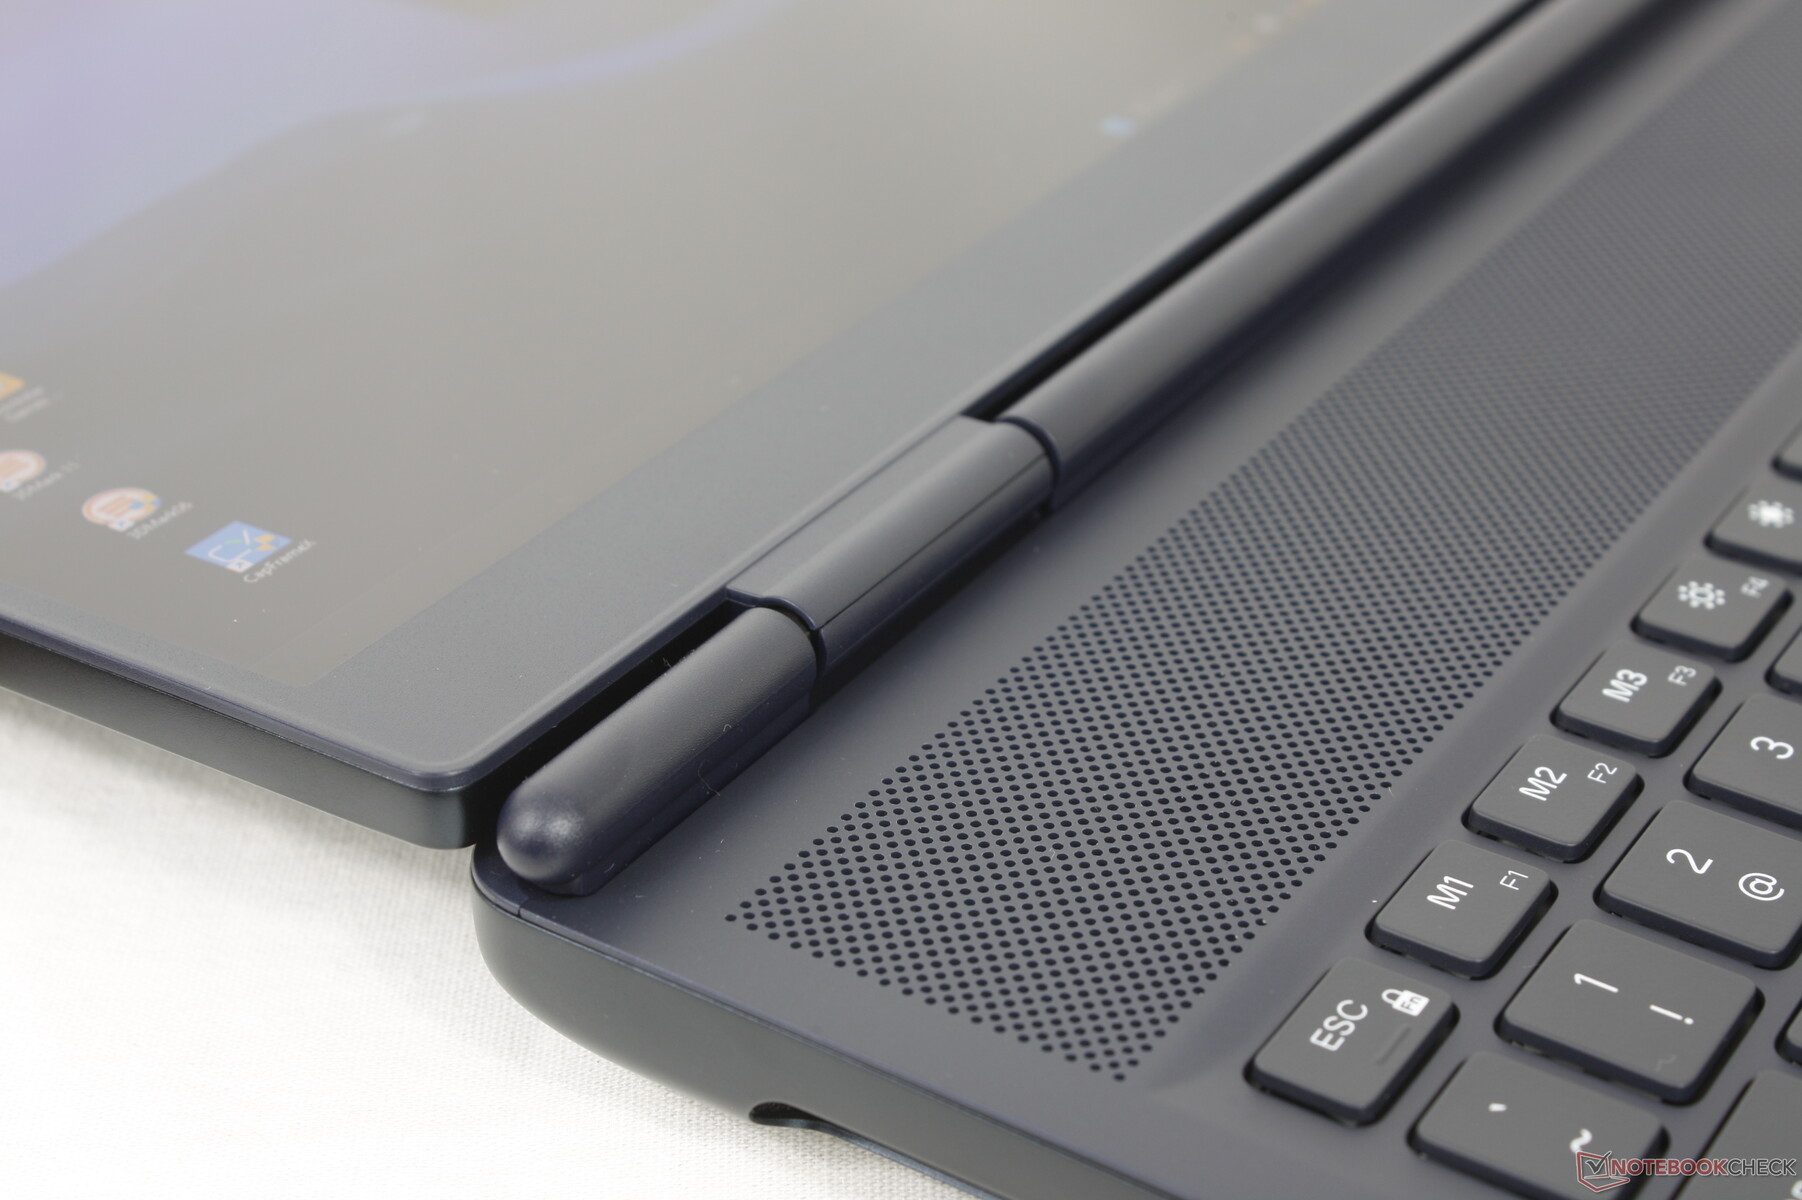
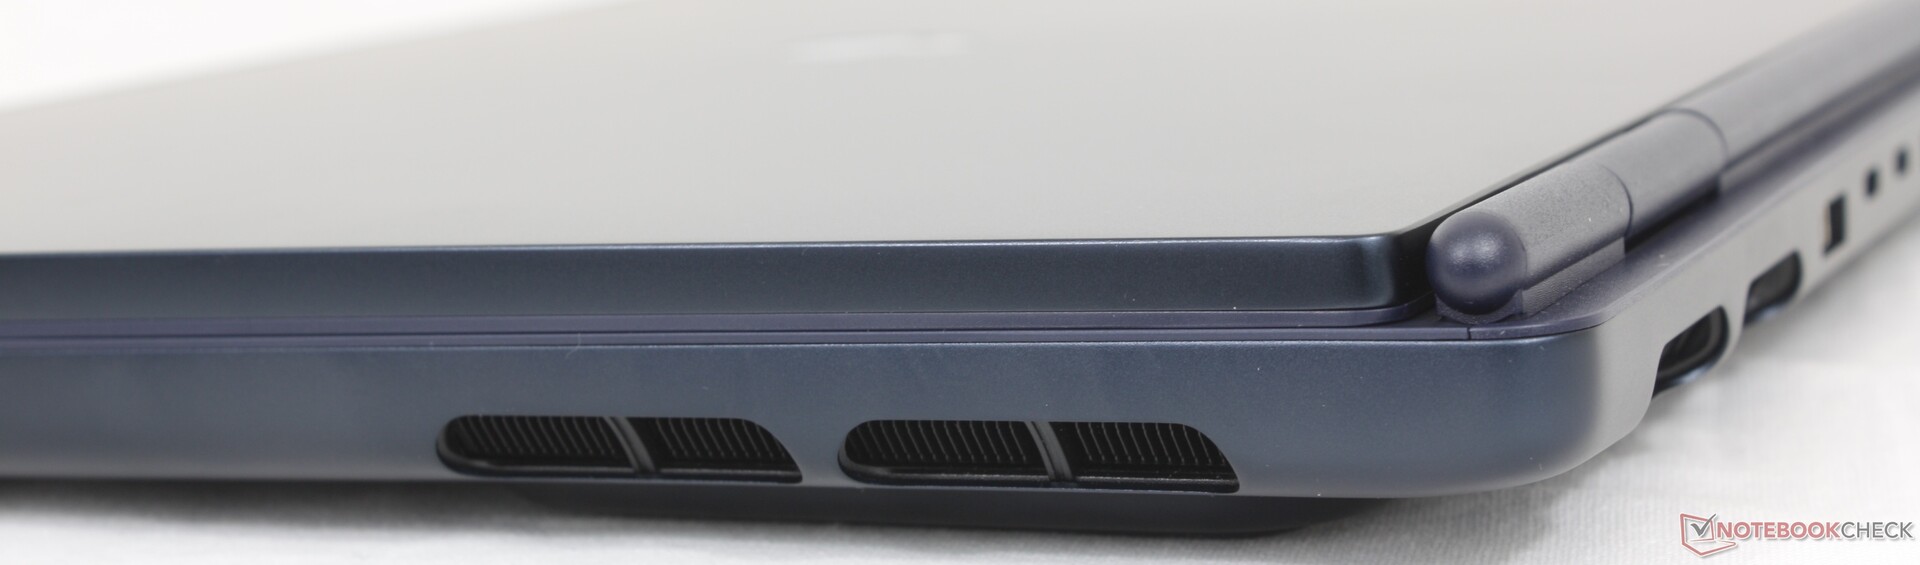
不过,铰链的刚度可以更硬一些,以获得更好的使用寿命,因为它们可以完全打开 180 度,这与 Area-51 不同。请准备好经常清洁掌托和按键,因为机器上很容易留下指纹。
虽然极光 16X 的重量远不及 Area-51,但作为一款 16 英寸游戏笔记本电脑,它仍然相当沉重。华硕 TUF GAMING A16 或技嘉 GAMING A16 GA6H 等替代产品的重量都要轻几百克,尽管前者还略厚一些。
连接性
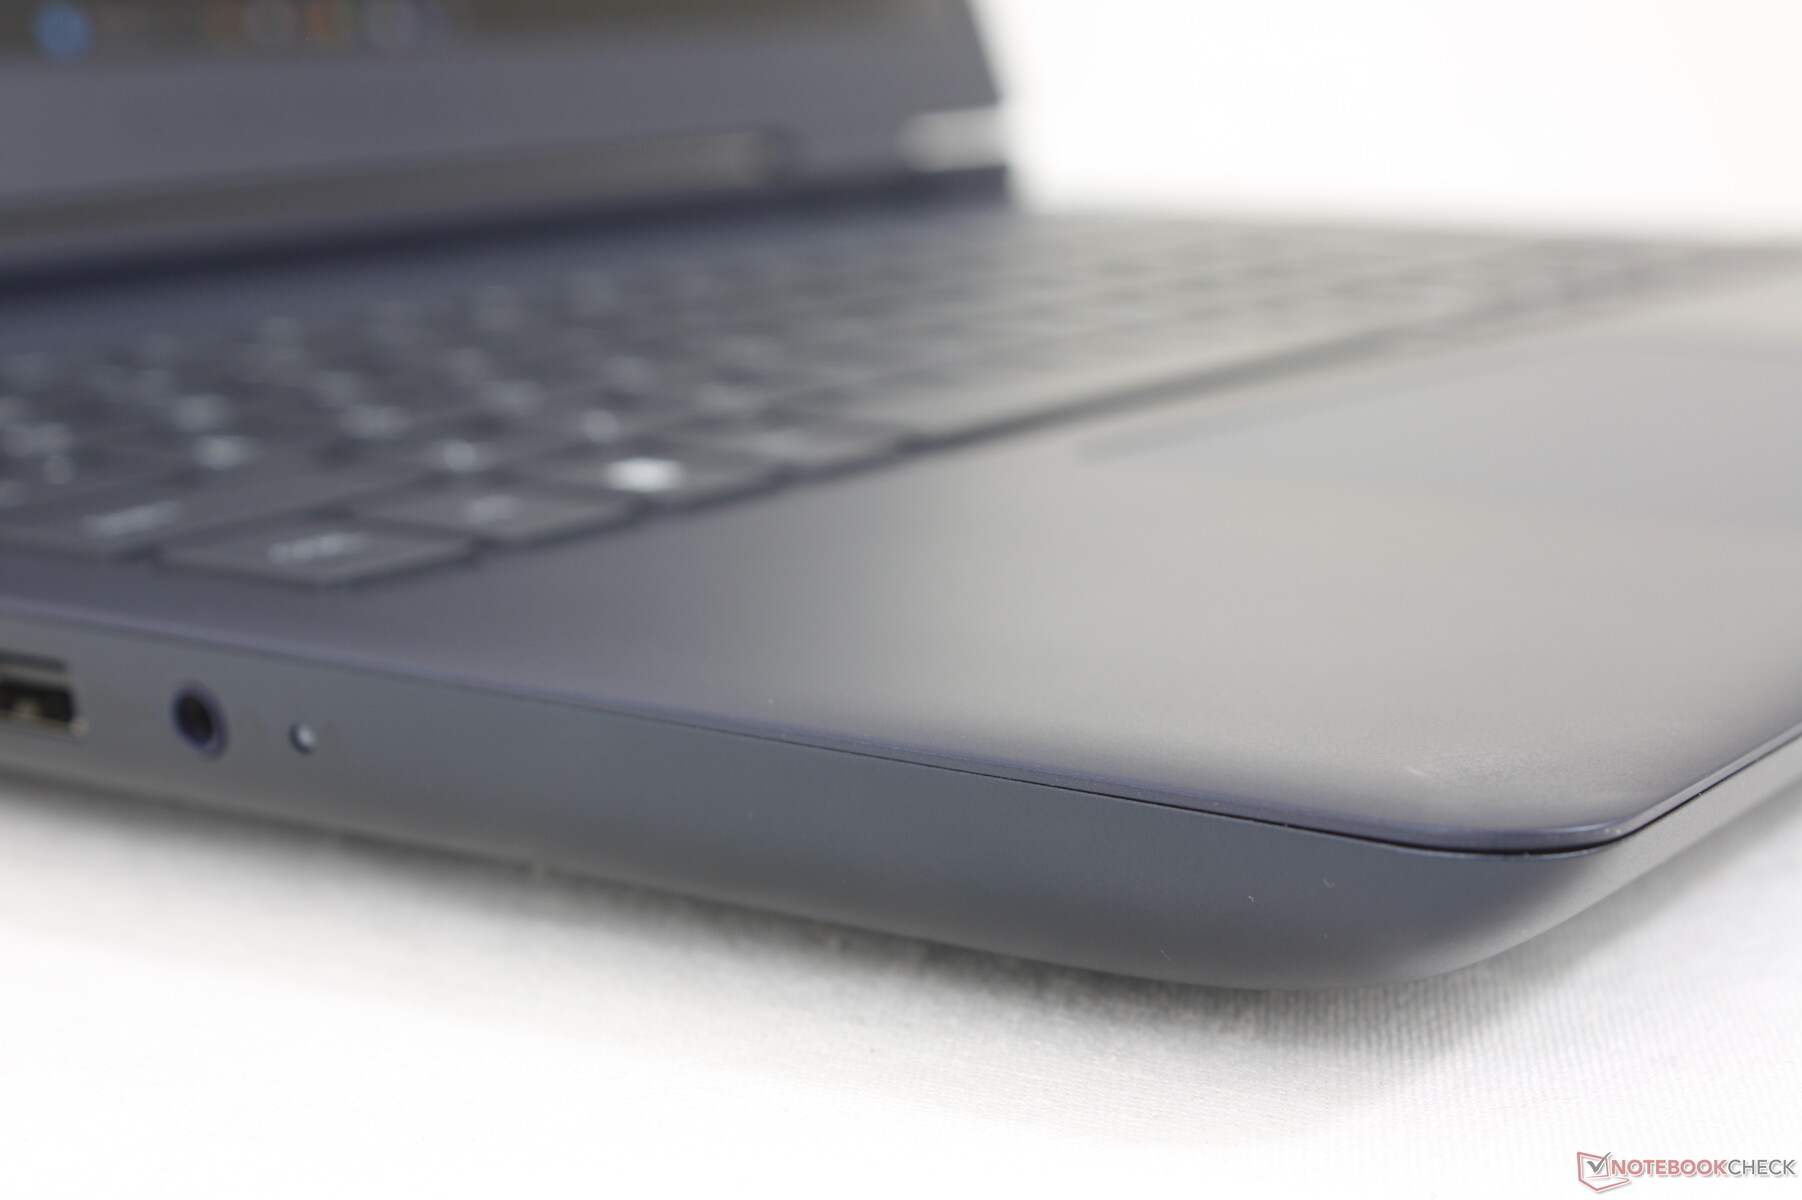
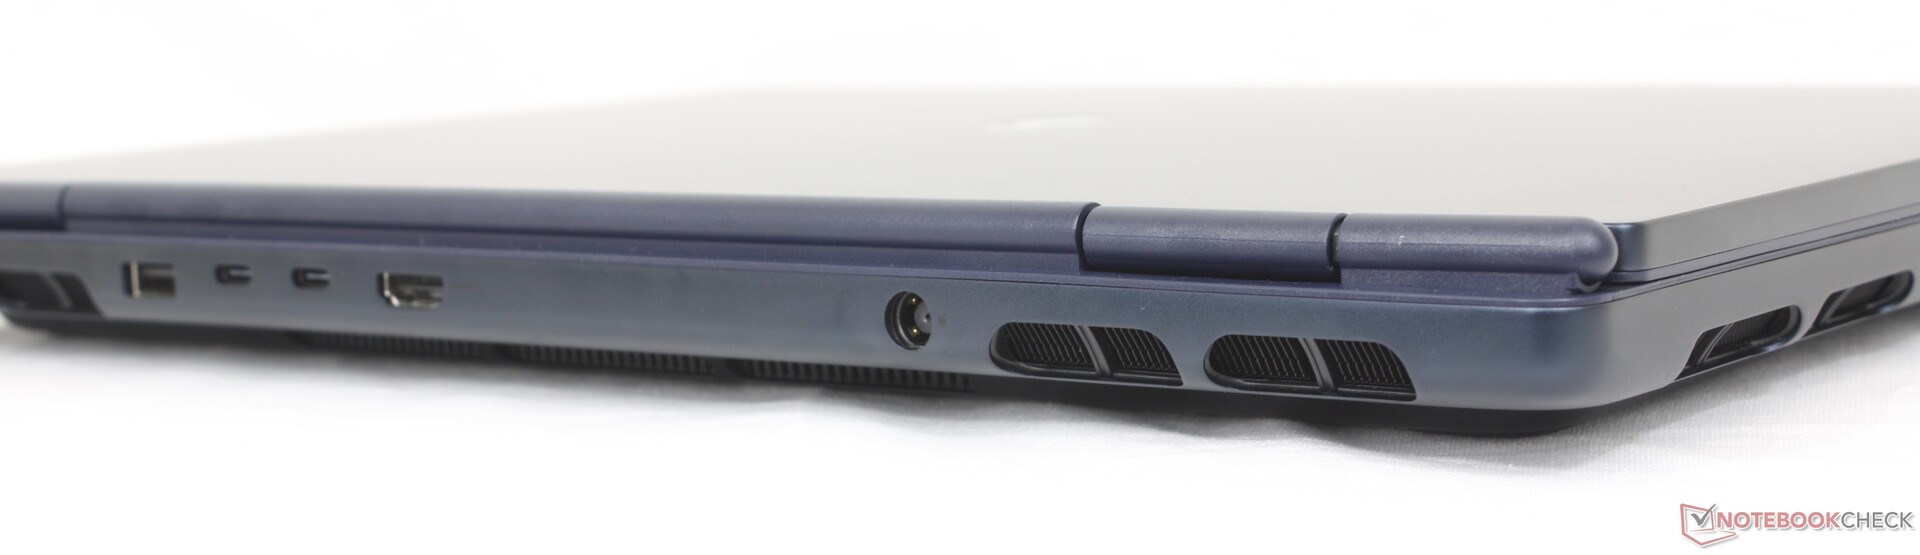
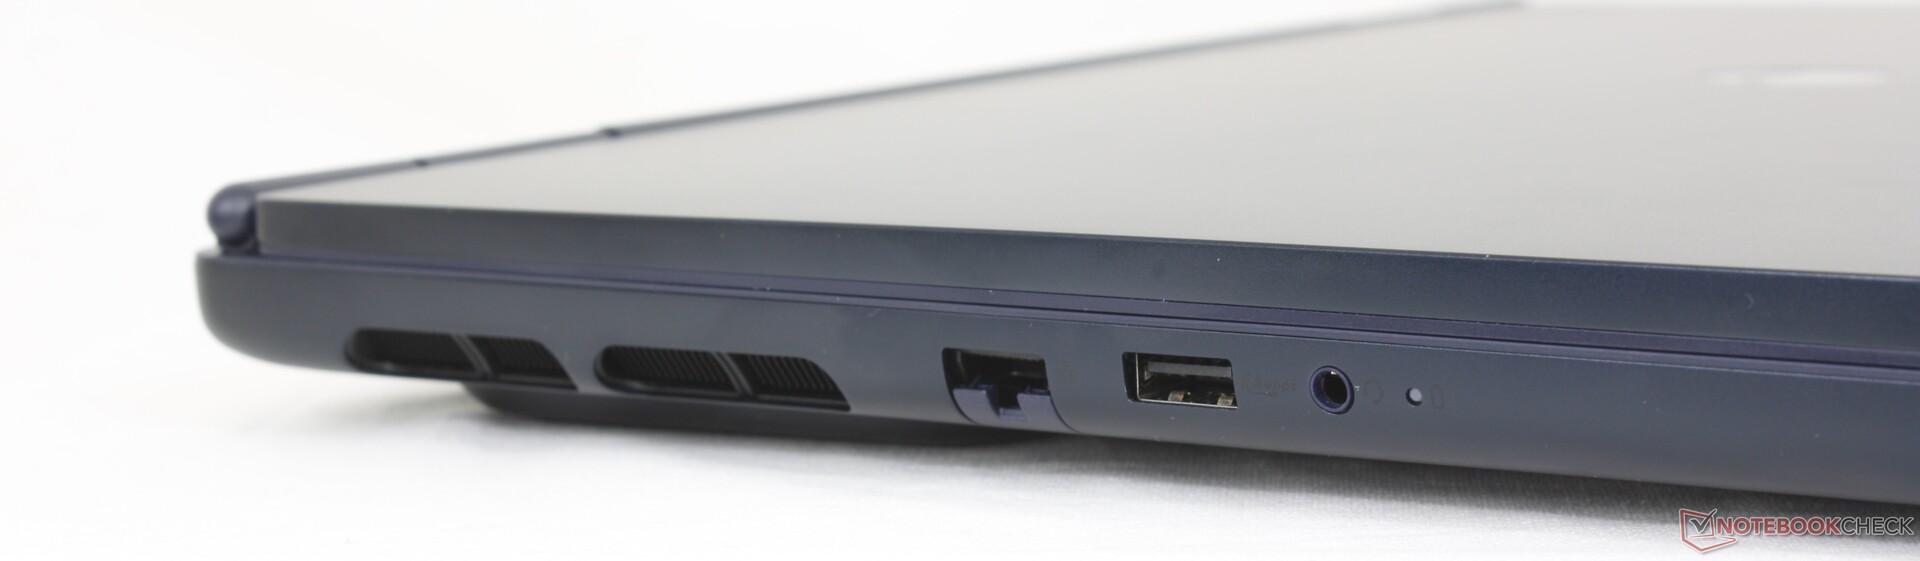
该机型标配 RJ-45 端口,而 Alienware Area-51 却没有。不过,为了节约成本,该机型减少了 USB-A 端口,也没有 SD 读卡器。
需要注意的是,Power Delivery 或使用第三方 USB-C AC 适配器充电仅支持 USB-C 3.2 Gen.2 端口,不支持 Thunderbolt 4 端口。
交流
| Networking | |
| iperf3 transmit AXE11000 | |
| Asus TUF Gaming A16 FA608WV | |
| Gigabyte Gaming A16 GA6H | |
| Alienware 16 Area-51 | |
| MSI Vector 16 HX AI A2XWHG | |
| Lenovo Legion 5 Pro 16IAX10H | |
| Alienware 16X Aurora, RTX 5070 | |
| iperf3 receive AXE11000 | |
| Asus TUF Gaming A16 FA608WV | |
| MSI Vector 16 HX AI A2XWHG | |
| Gigabyte Gaming A16 GA6H | |
| Alienware 16 Area-51 | |
| Alienware 16X Aurora, RTX 5070 | |
| Lenovo Legion 5 Pro 16IAX10H | |
| iperf3 transmit AXE11000 6GHz | |
| Asus TUF Gaming A16 FA608WV | |
| Alienware 16X Aurora, RTX 5070 | |
| Alienware 16 Area-51 | |
| iperf3 receive AXE11000 6GHz | |
| Asus TUF Gaming A16 FA608WV | |
| Alienware 16X Aurora, RTX 5070 | |
| Alienware 16 Area-51 | |
网络摄像头
标配 200 万像素网络摄像头,带红外功能,但没有隐私快门。


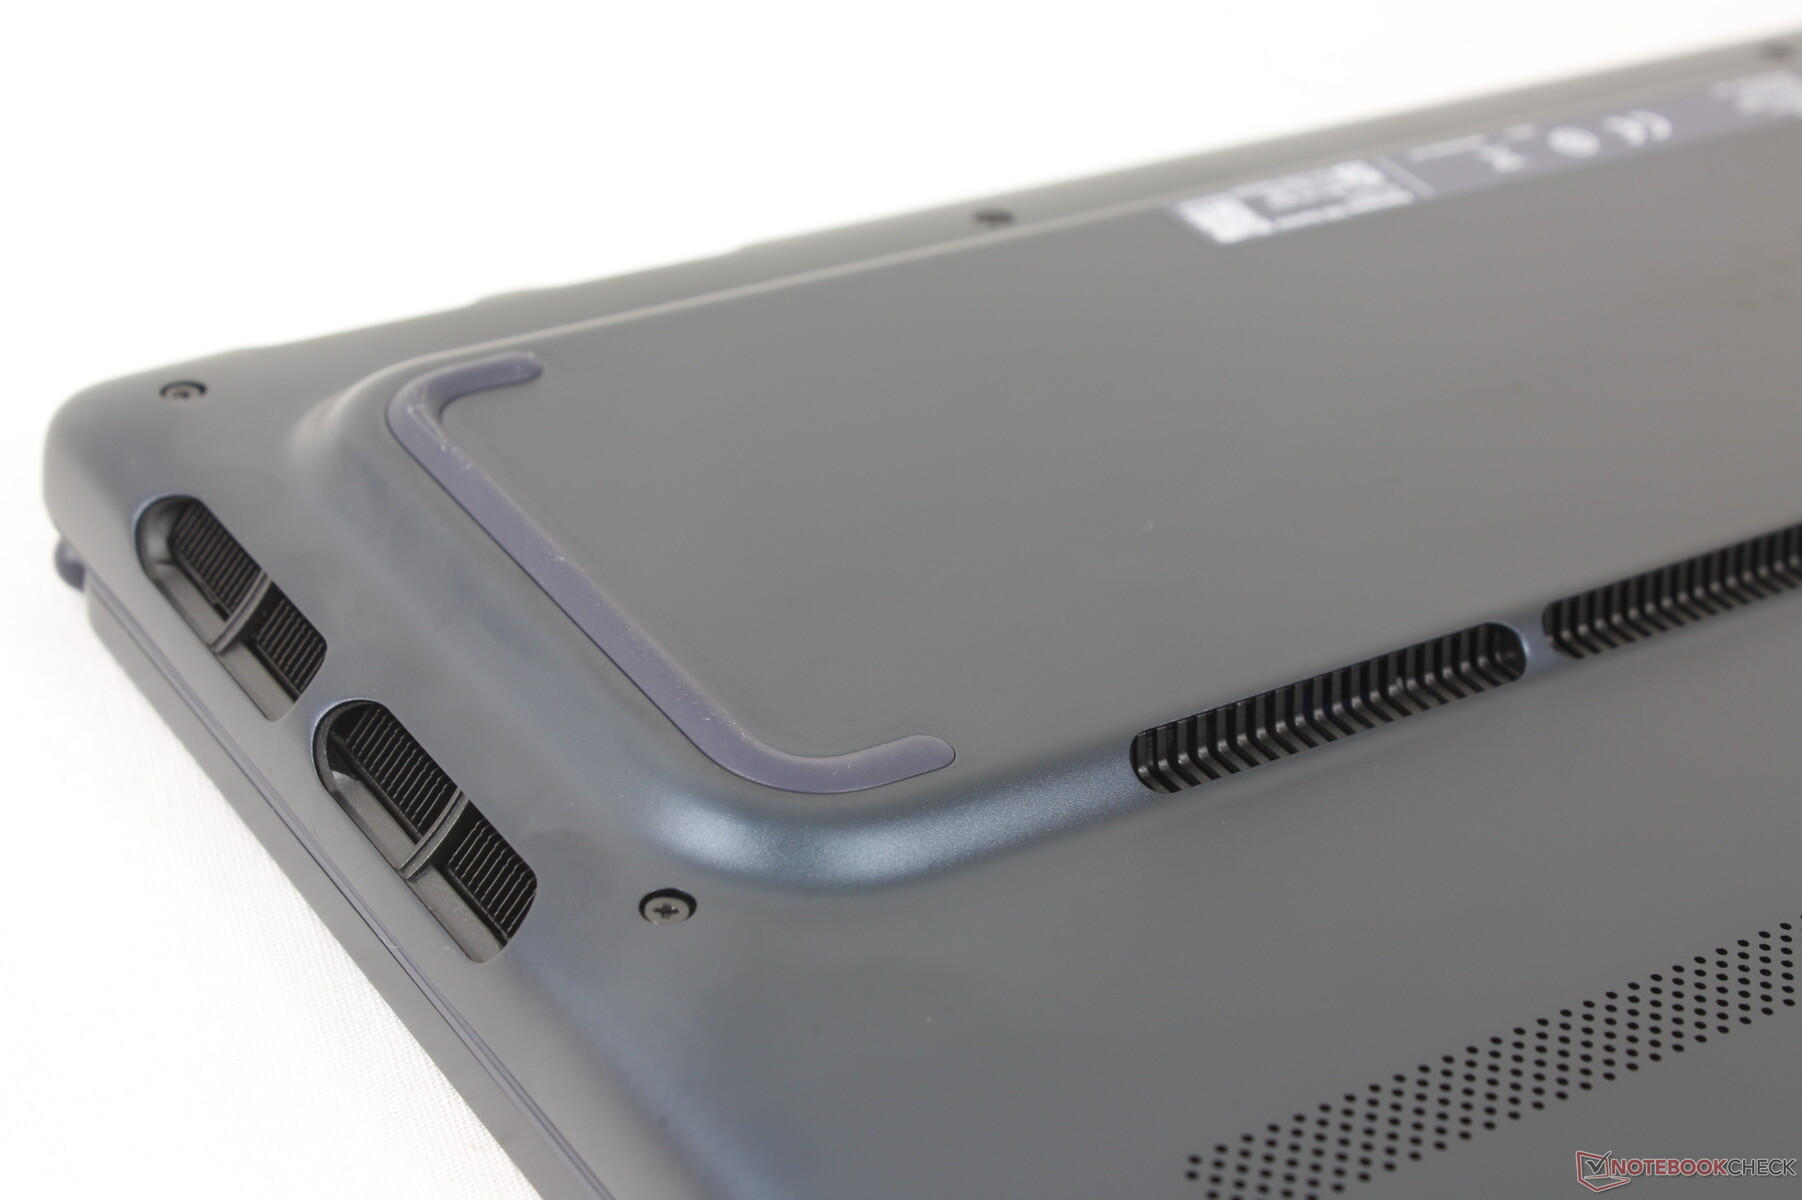
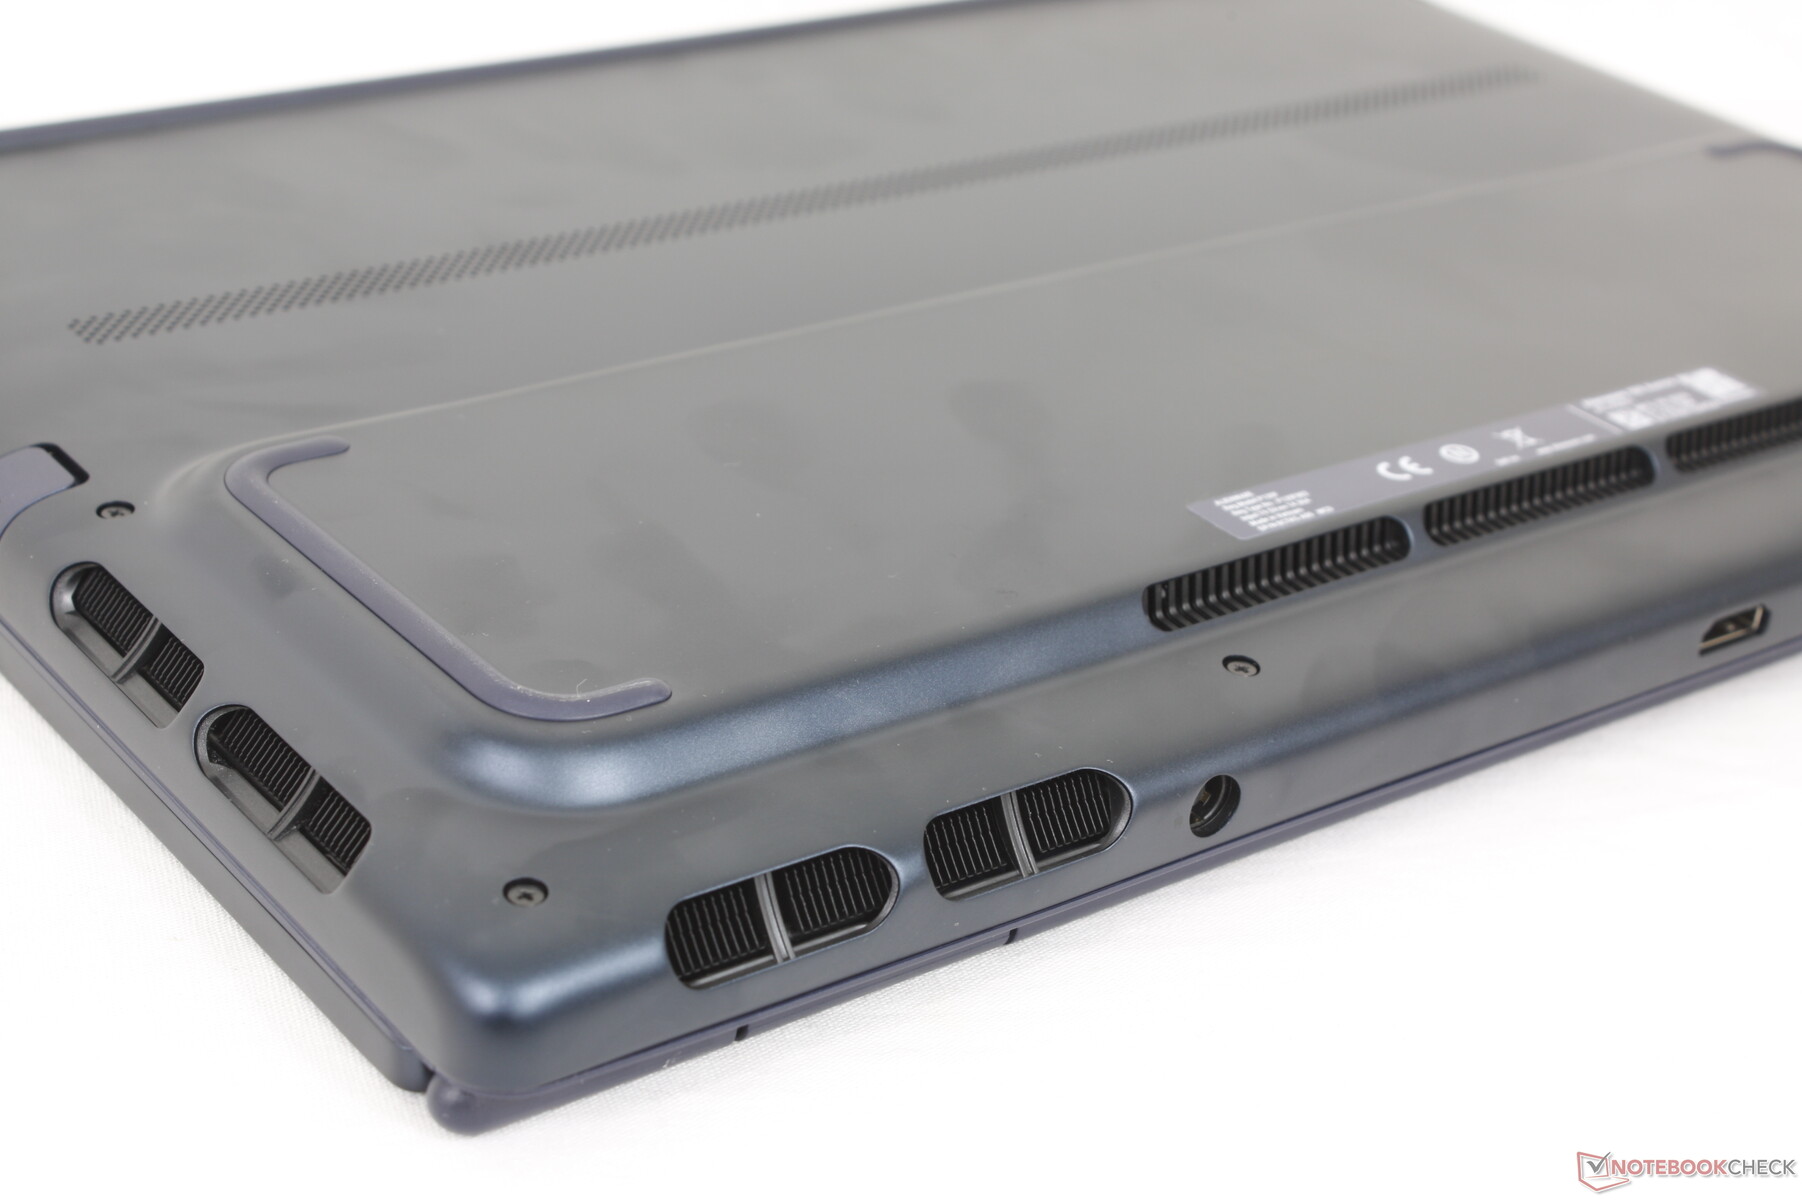
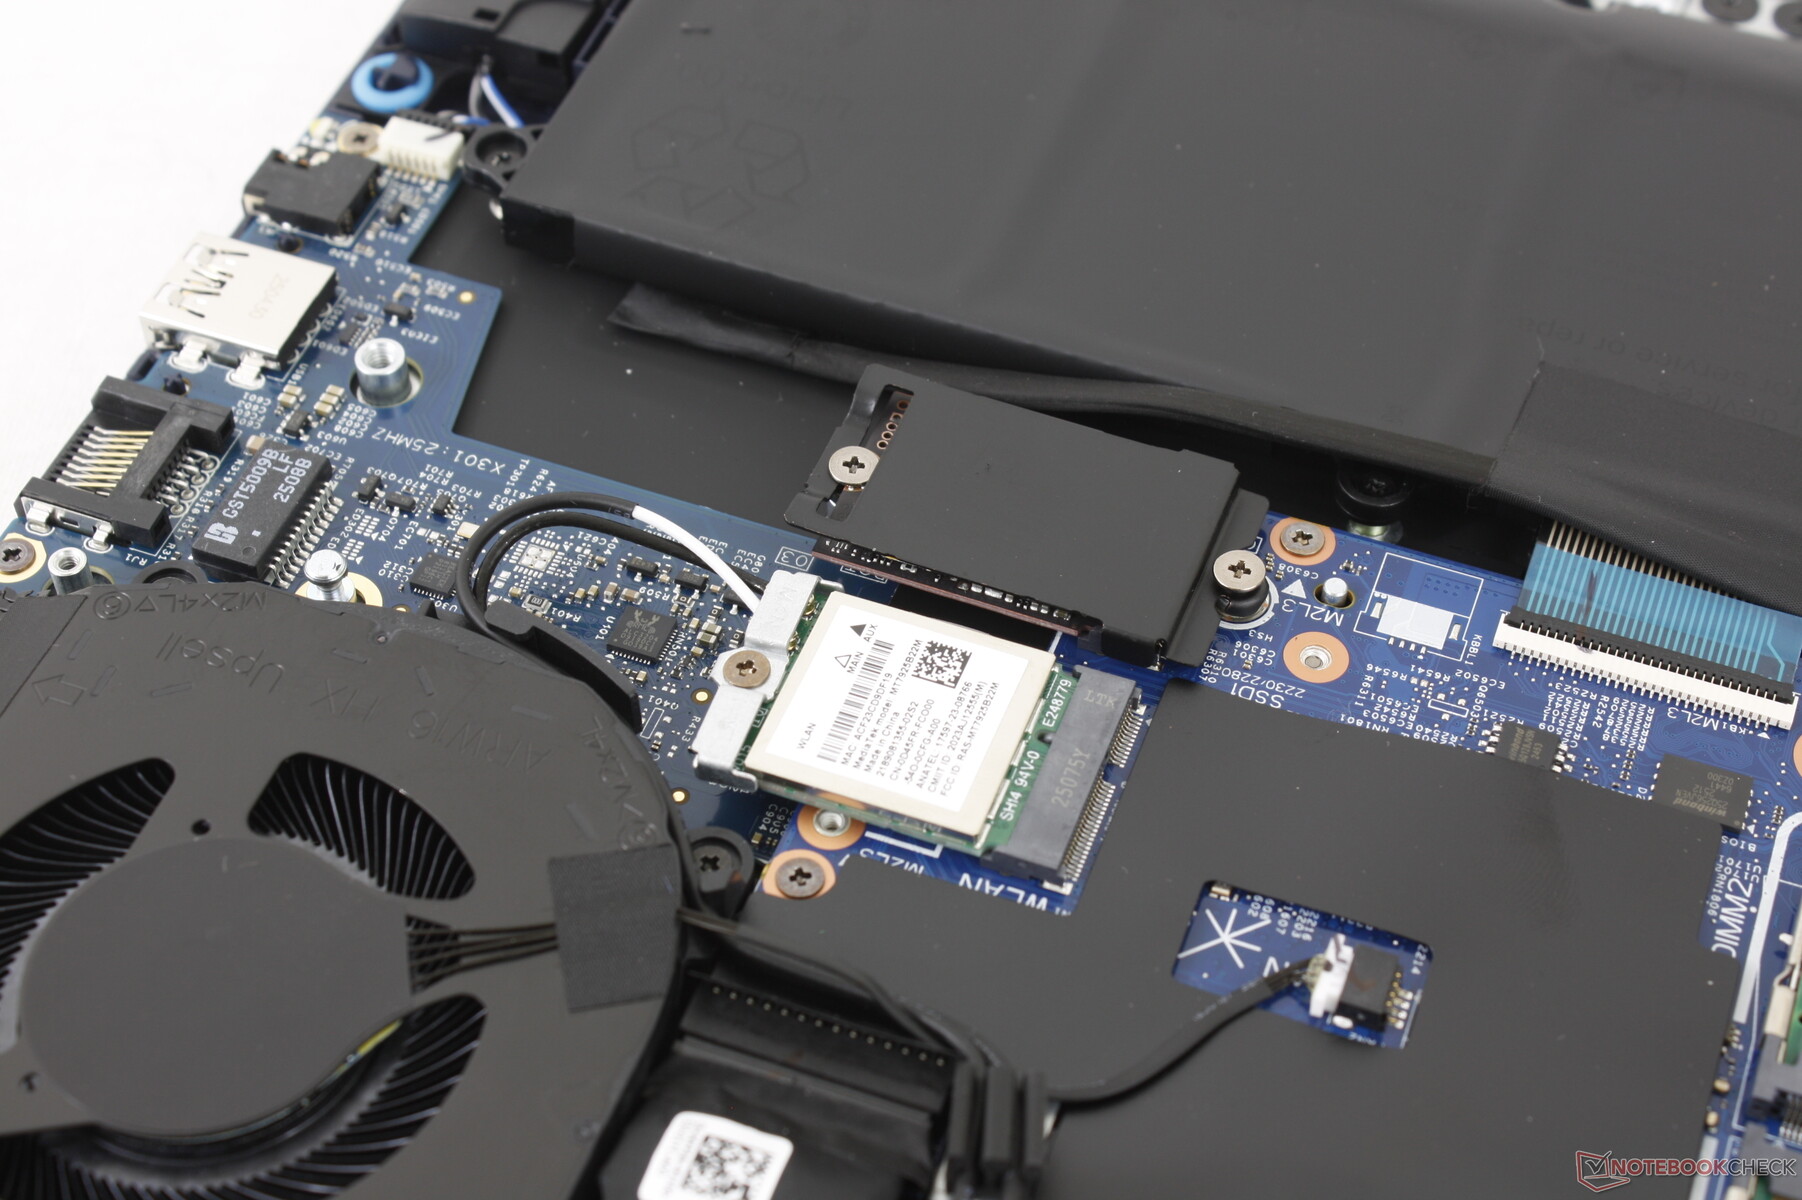
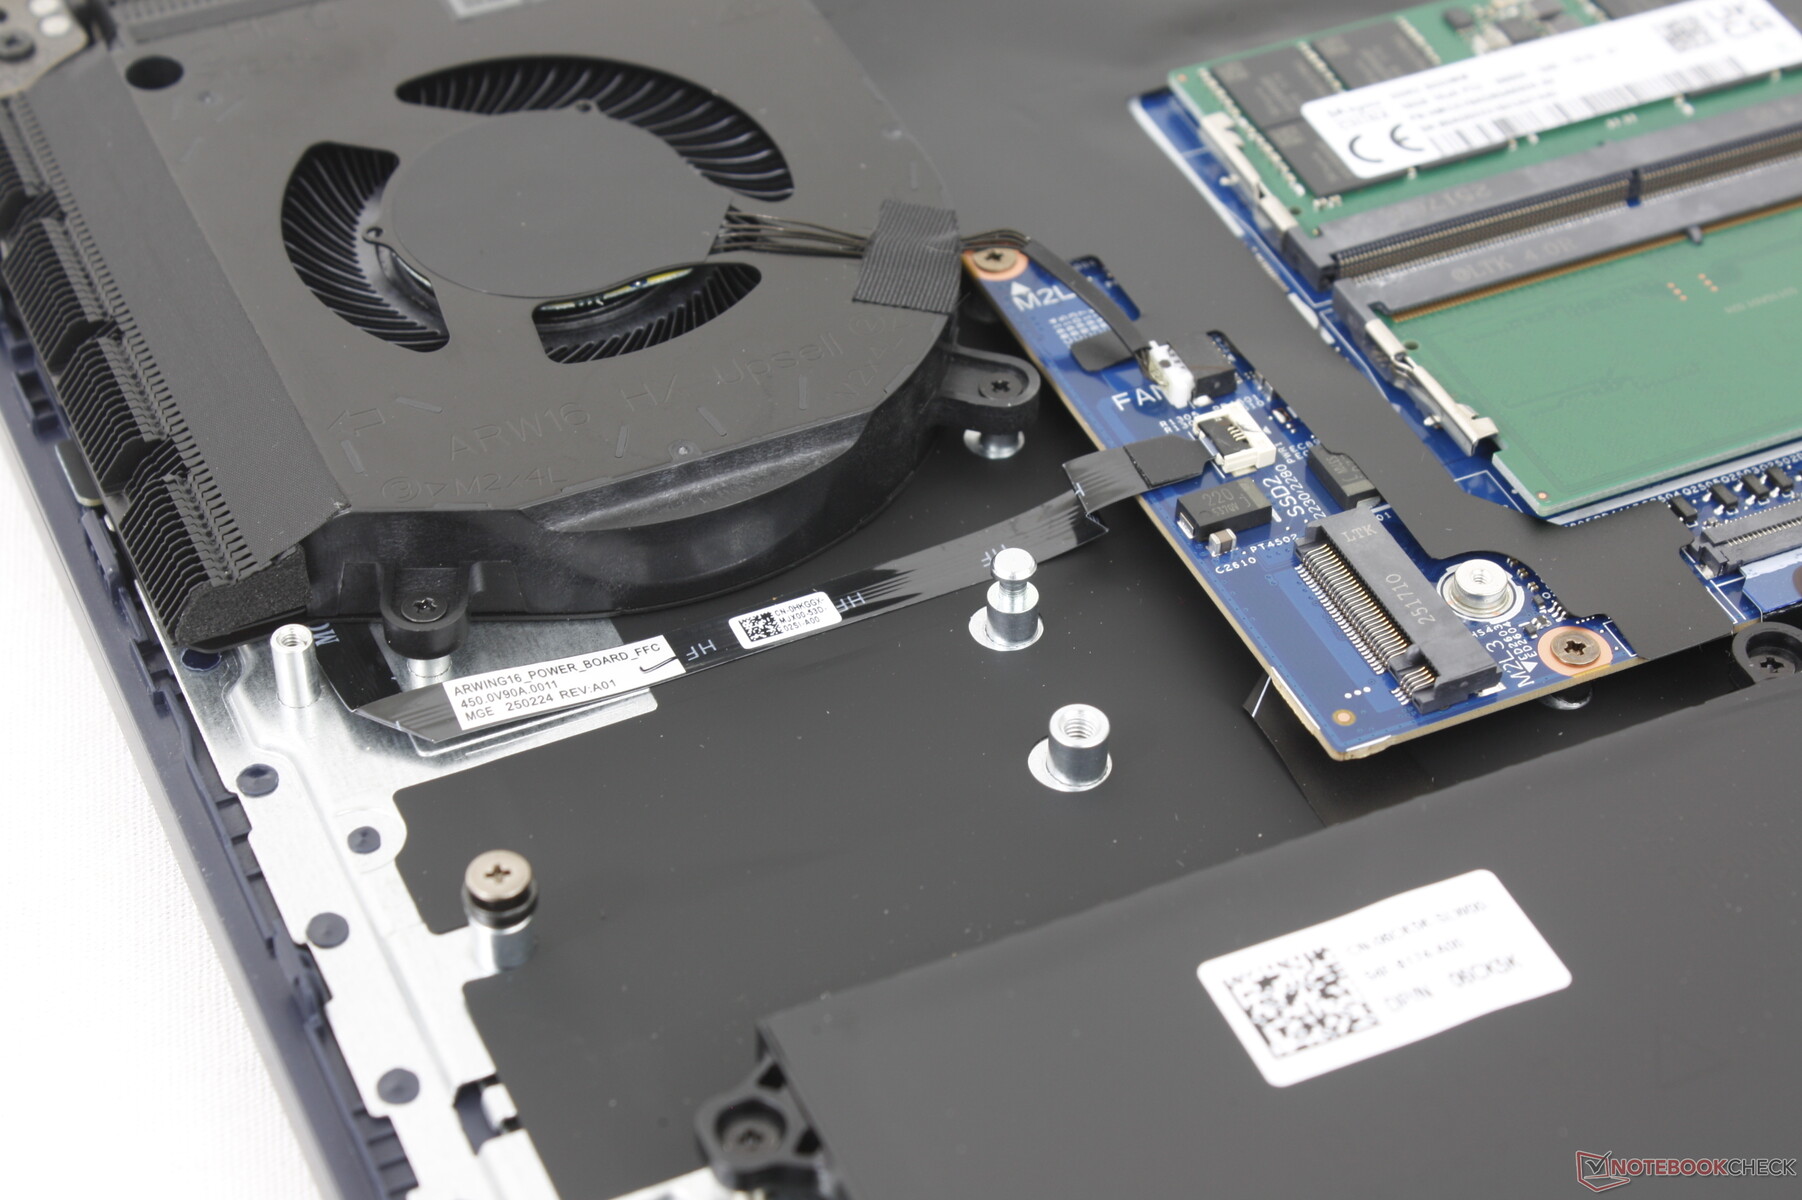
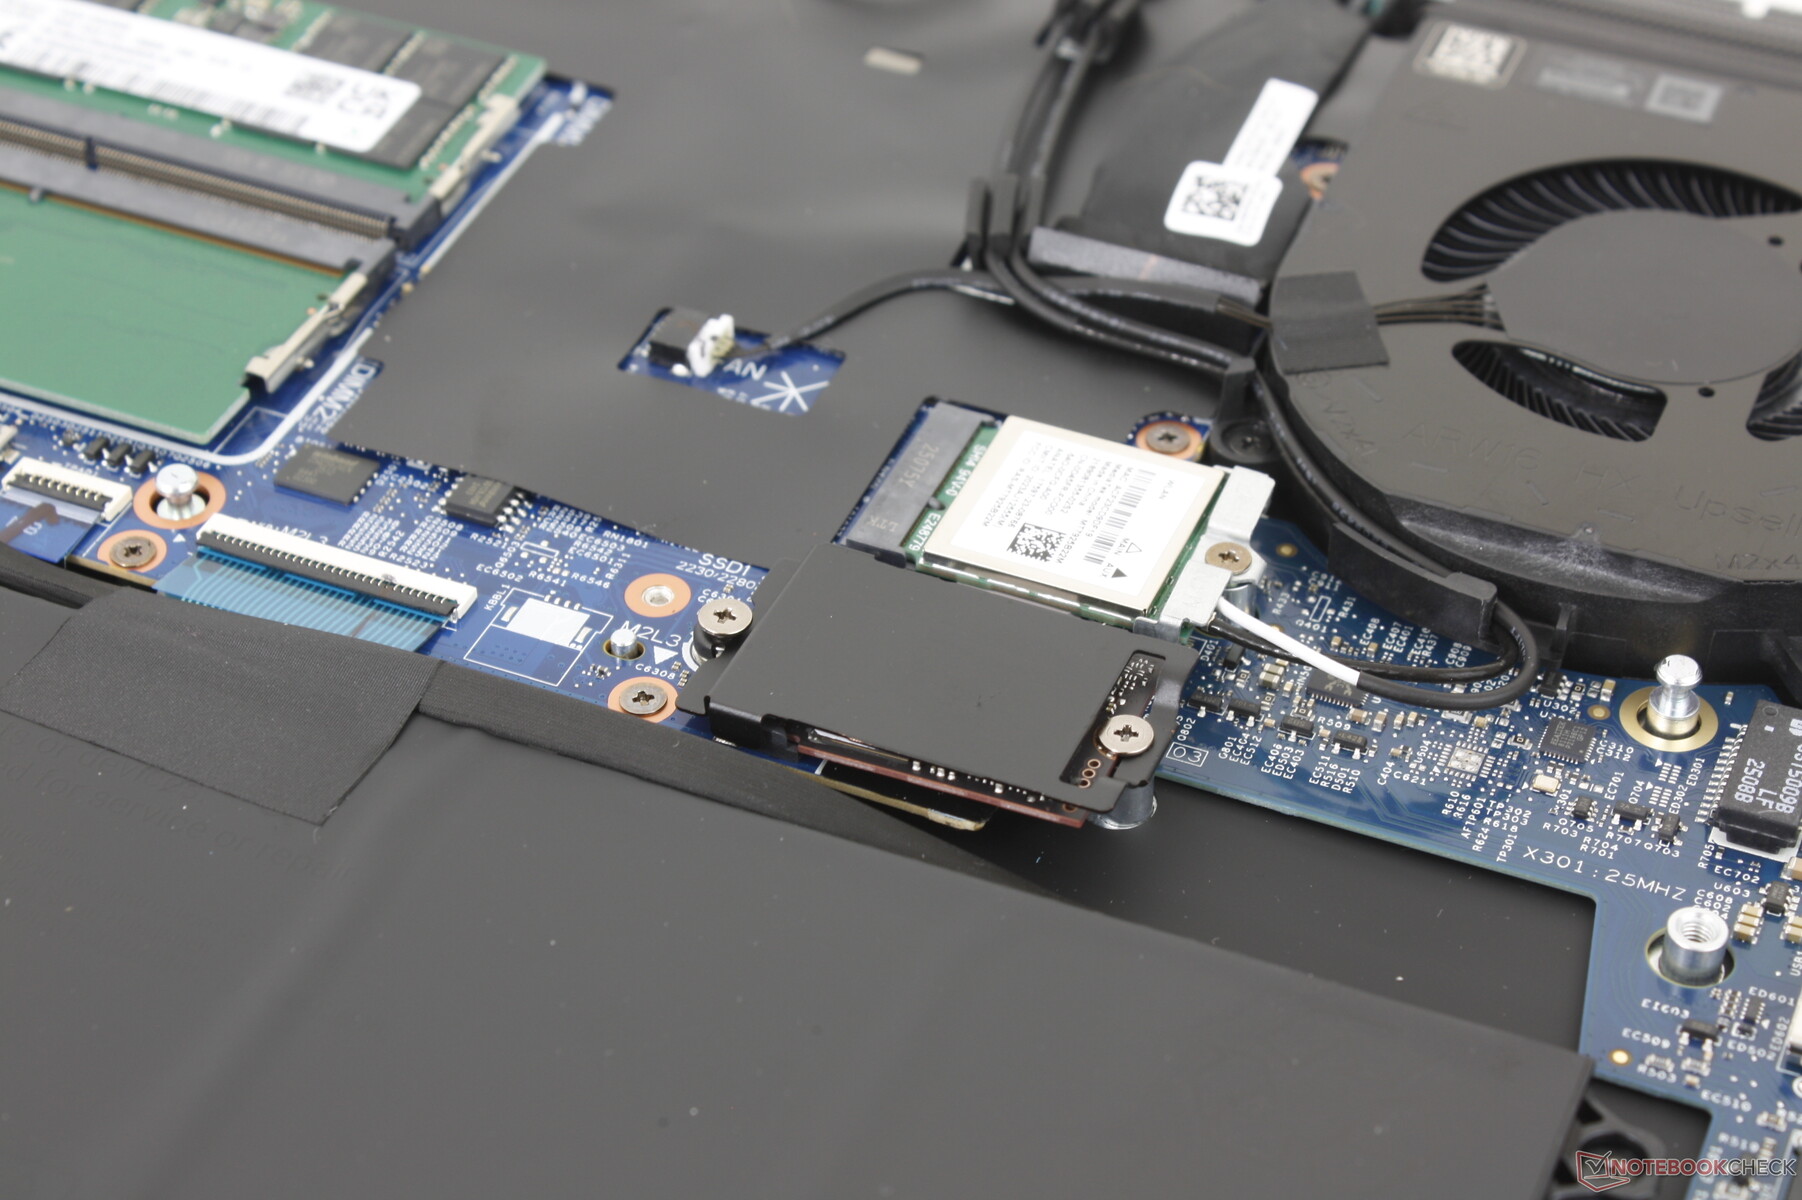
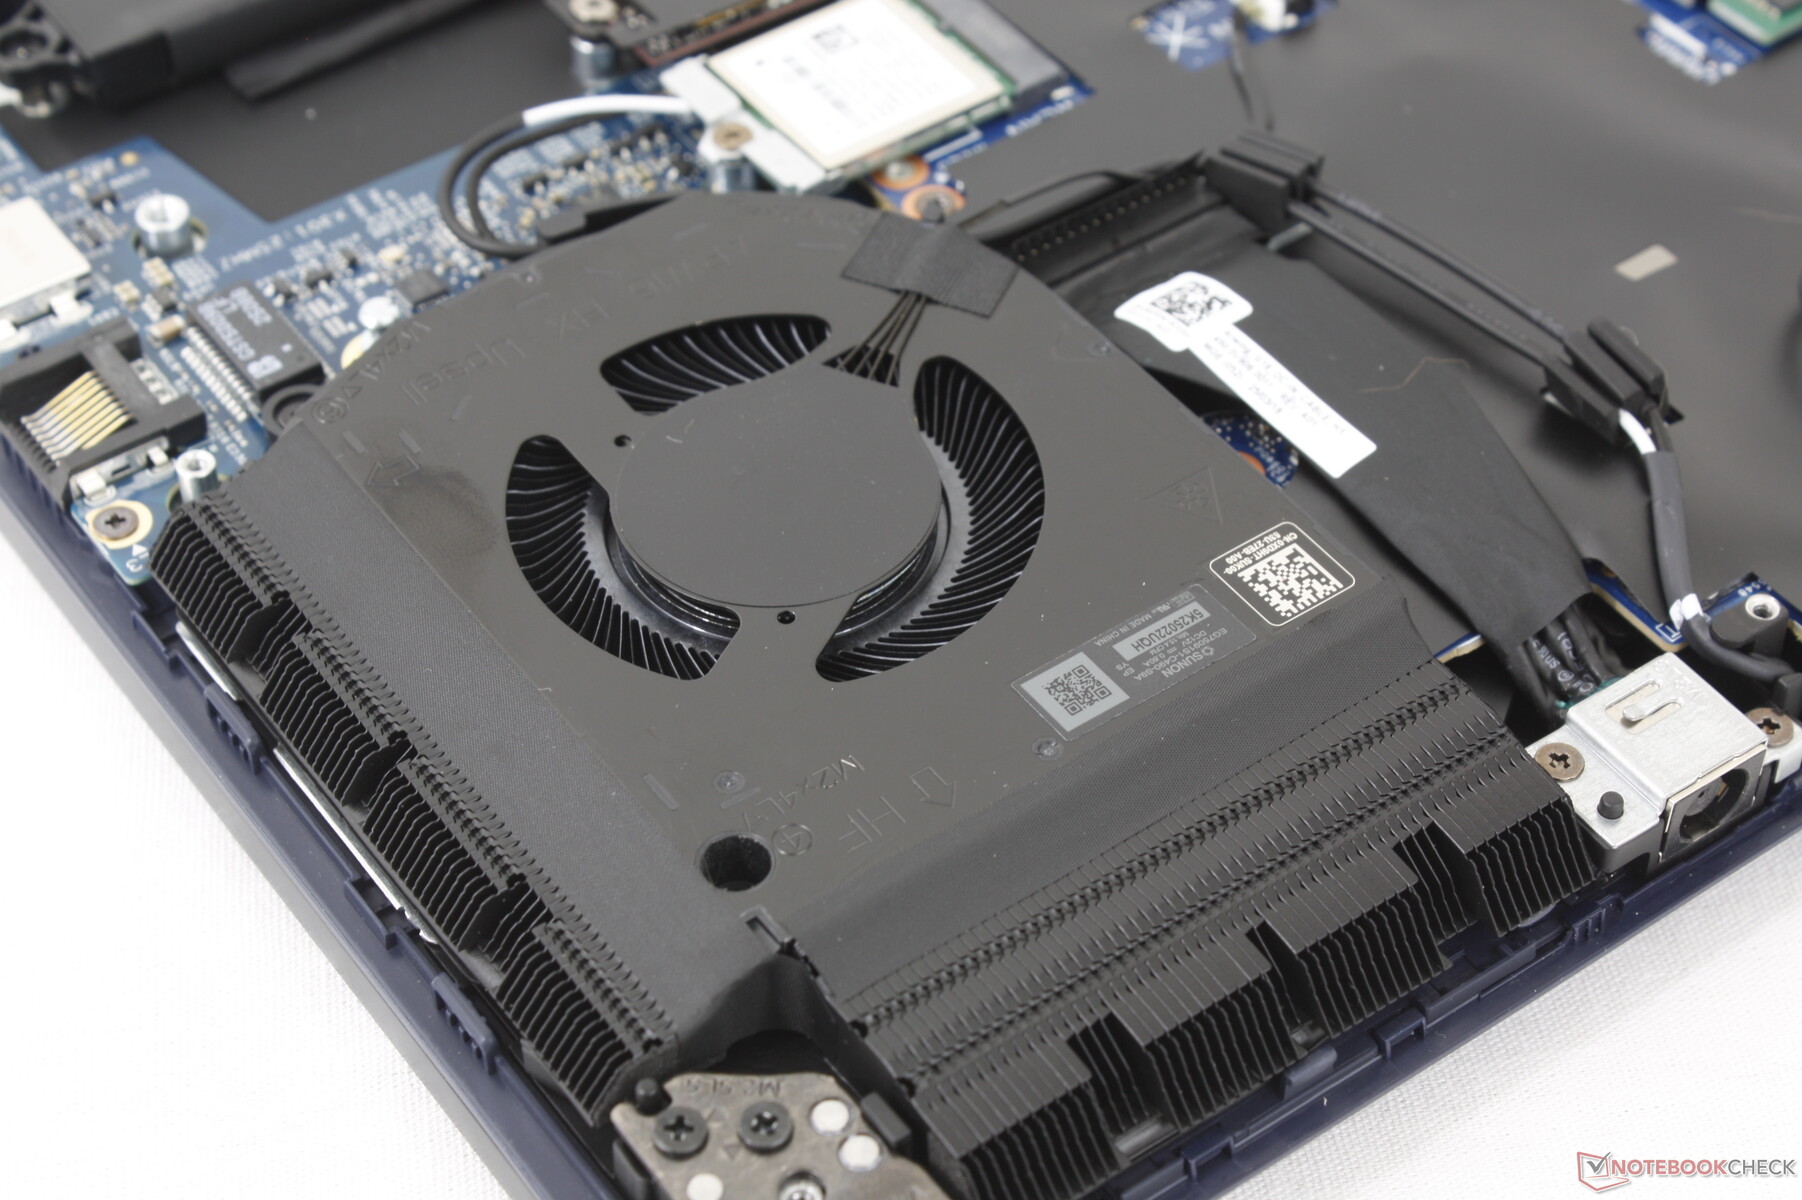
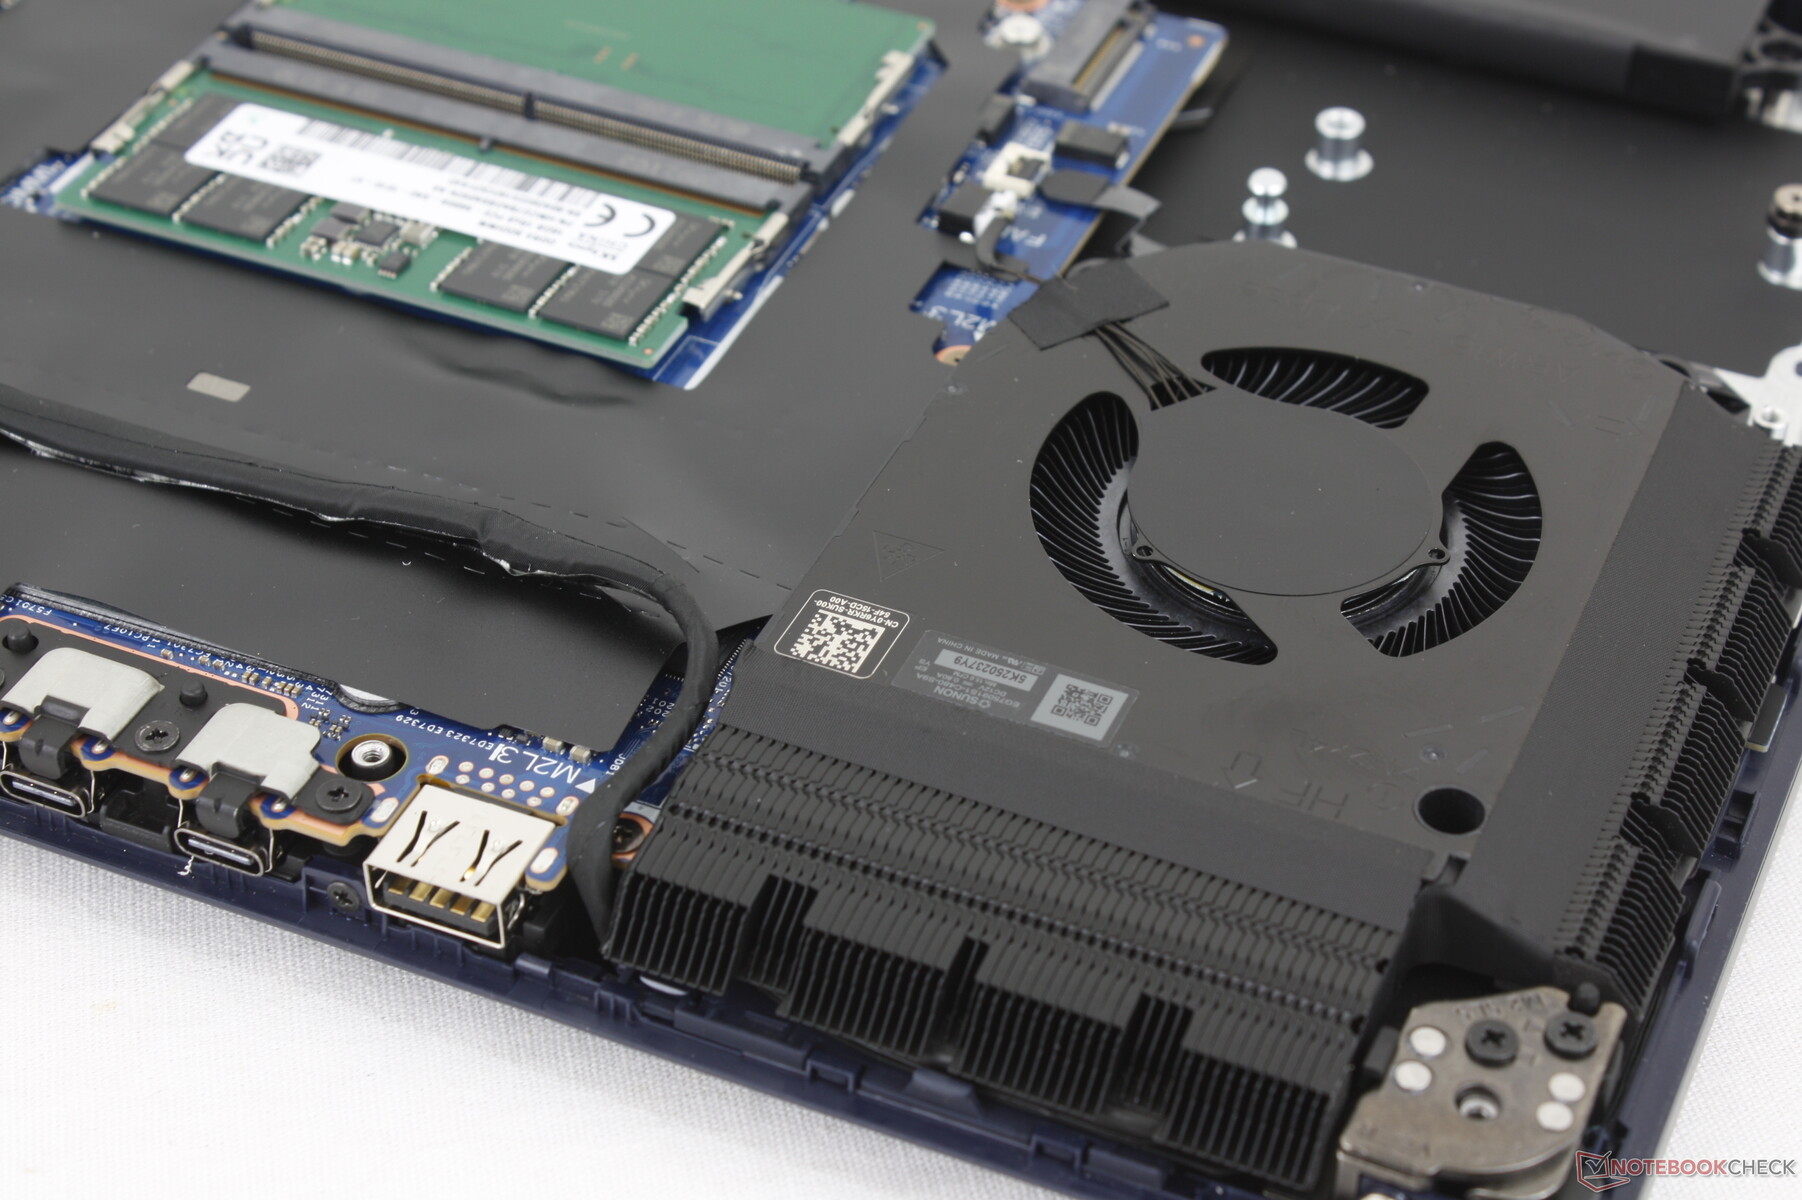
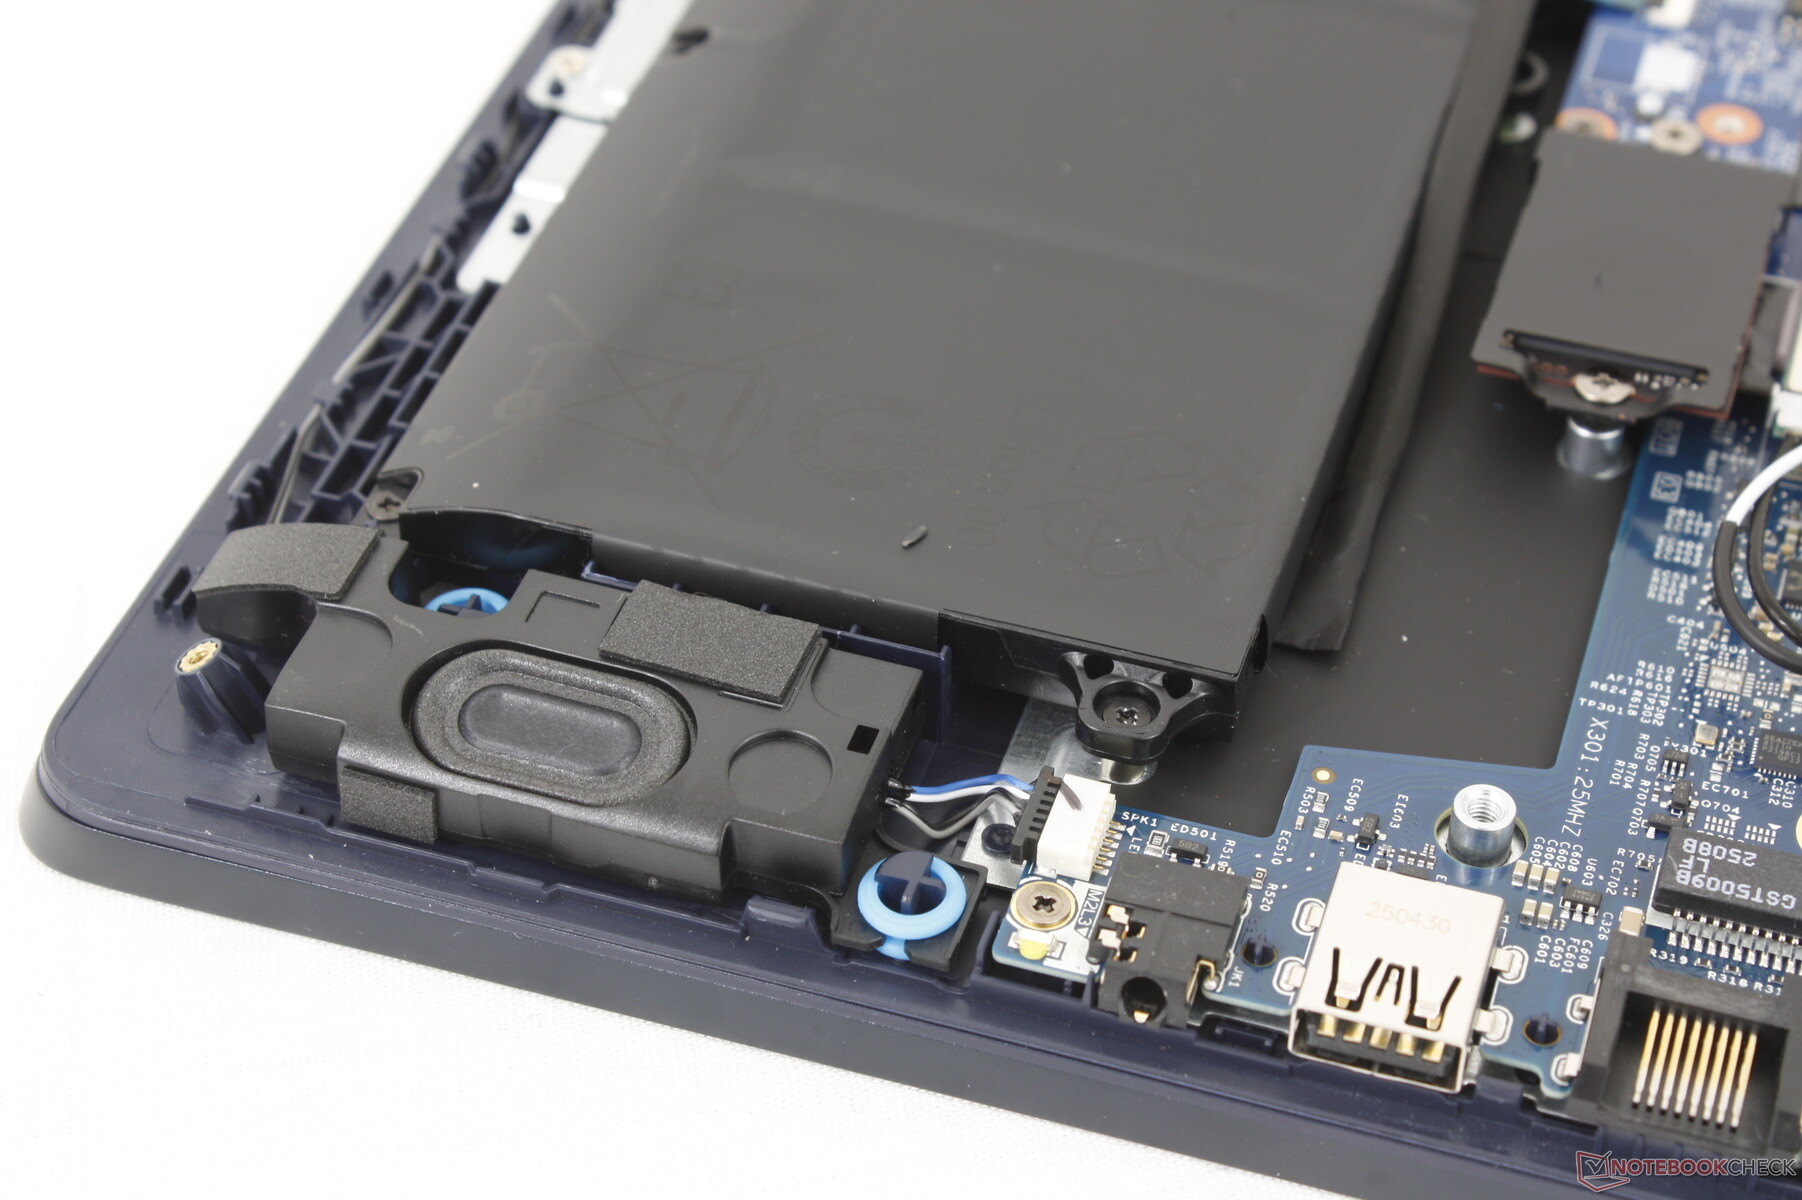
维护
底部面板只需一把十字螺丝刀即可拆卸,维修相对简单。用户可以使用两个 M.2 2280 固态硬盘插槽、两个 DDR5 SODIMM 插槽和可拆卸的 WLAN 模块,从而获得良好的升级能力。

可持续性
戴尔利用回收的塑料和金属来制造笔记本电脑,而且随着时间的推移,使用的比例会越来越高。尽管如此,戴尔并未明确说明 16X Aurora 系列所使用的可回收材料的具体比例。在其他方面,其包装完全可回收,不含塑料。
配件和保修
包装盒内除了交流适配器和文件外,没有其他附件。如果在美国购买,制造商通常提供一年有限保修。
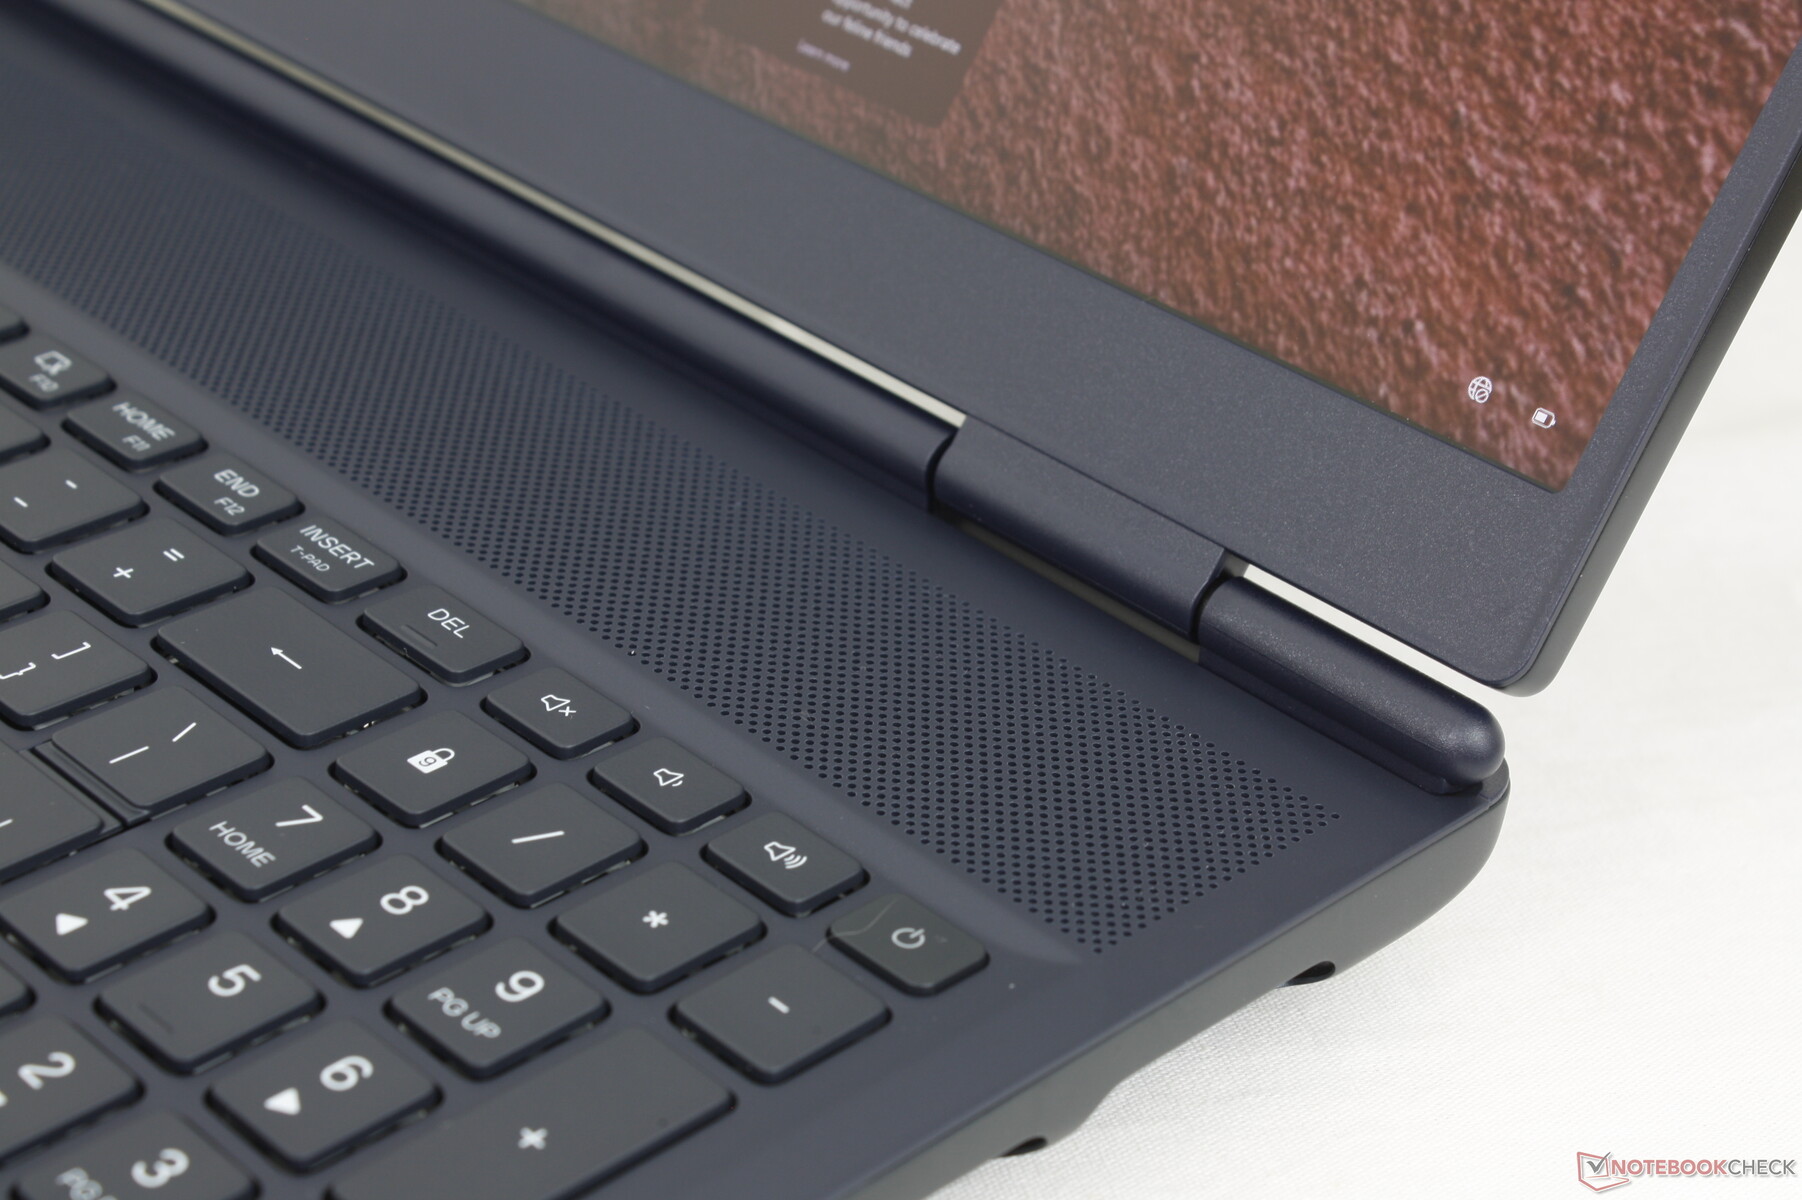
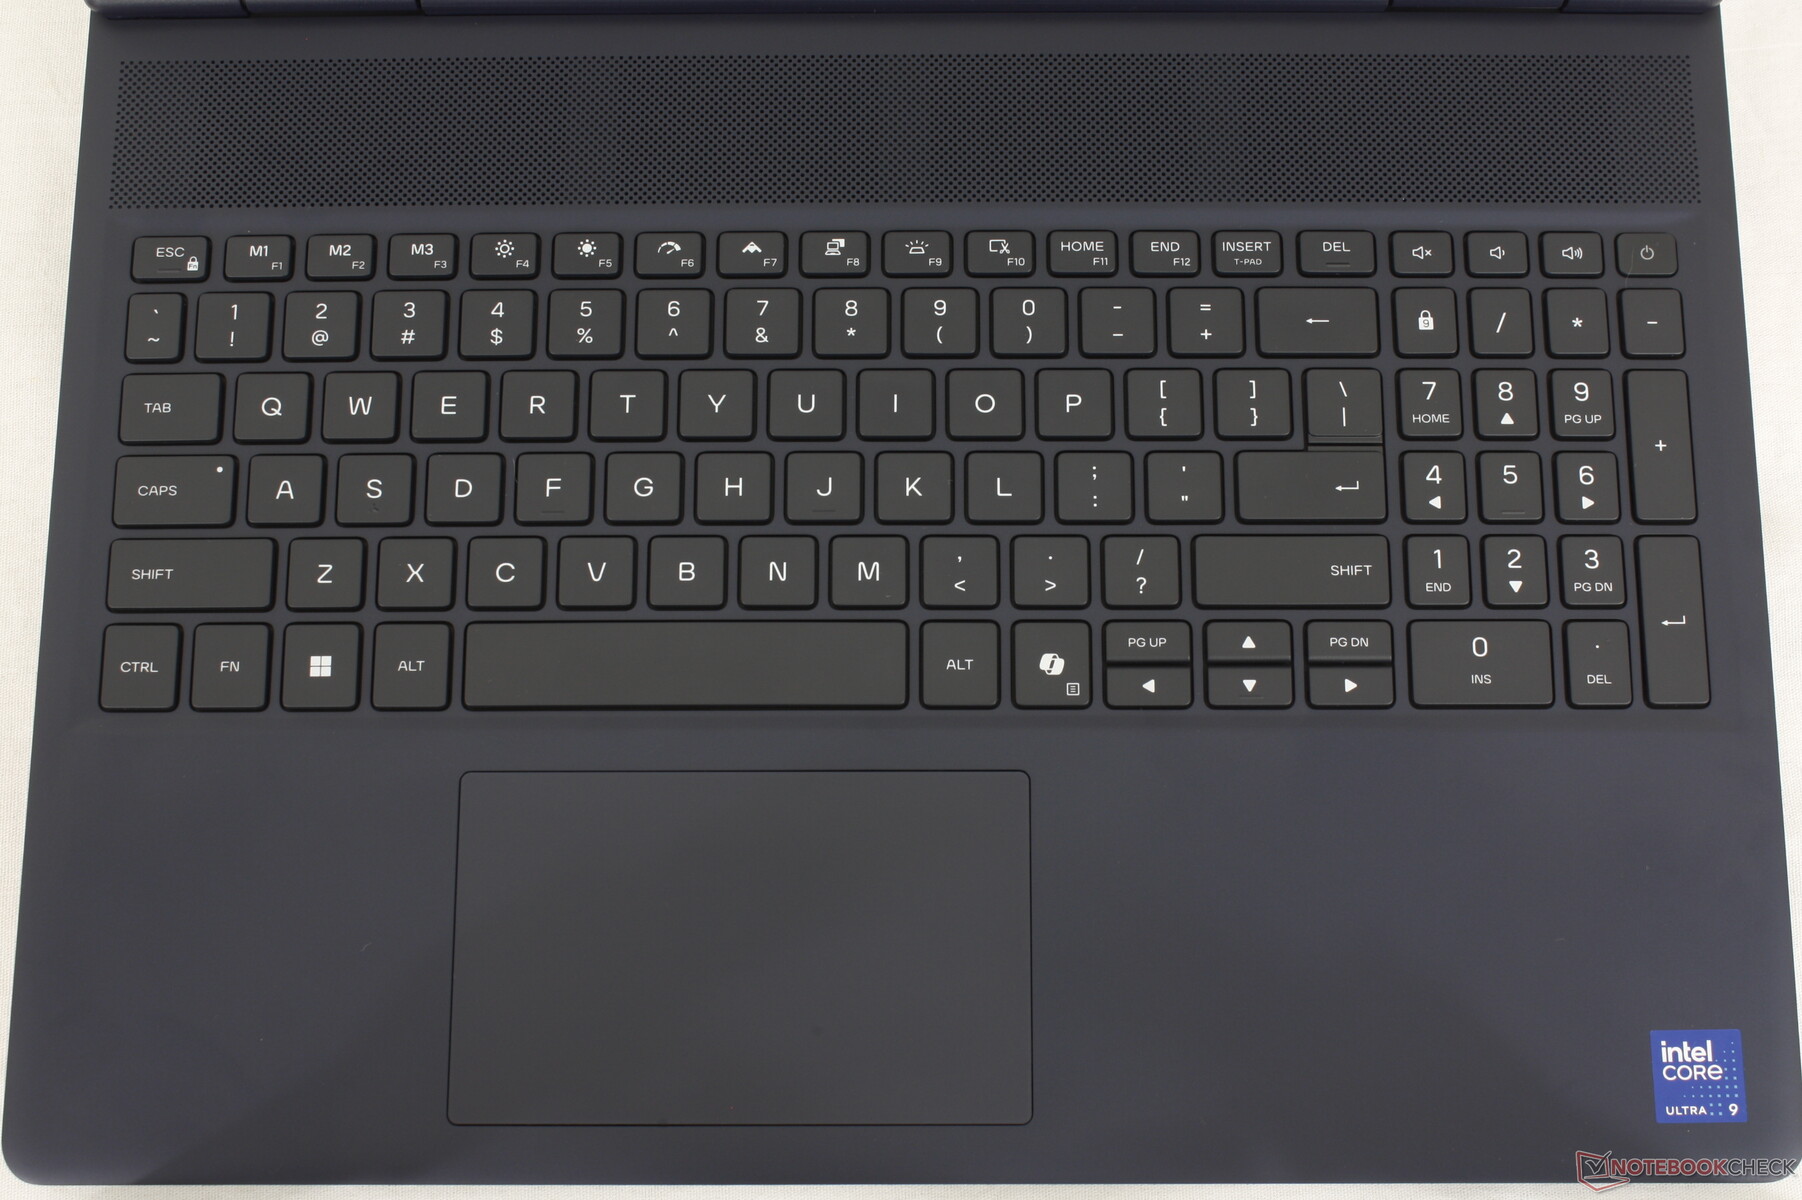
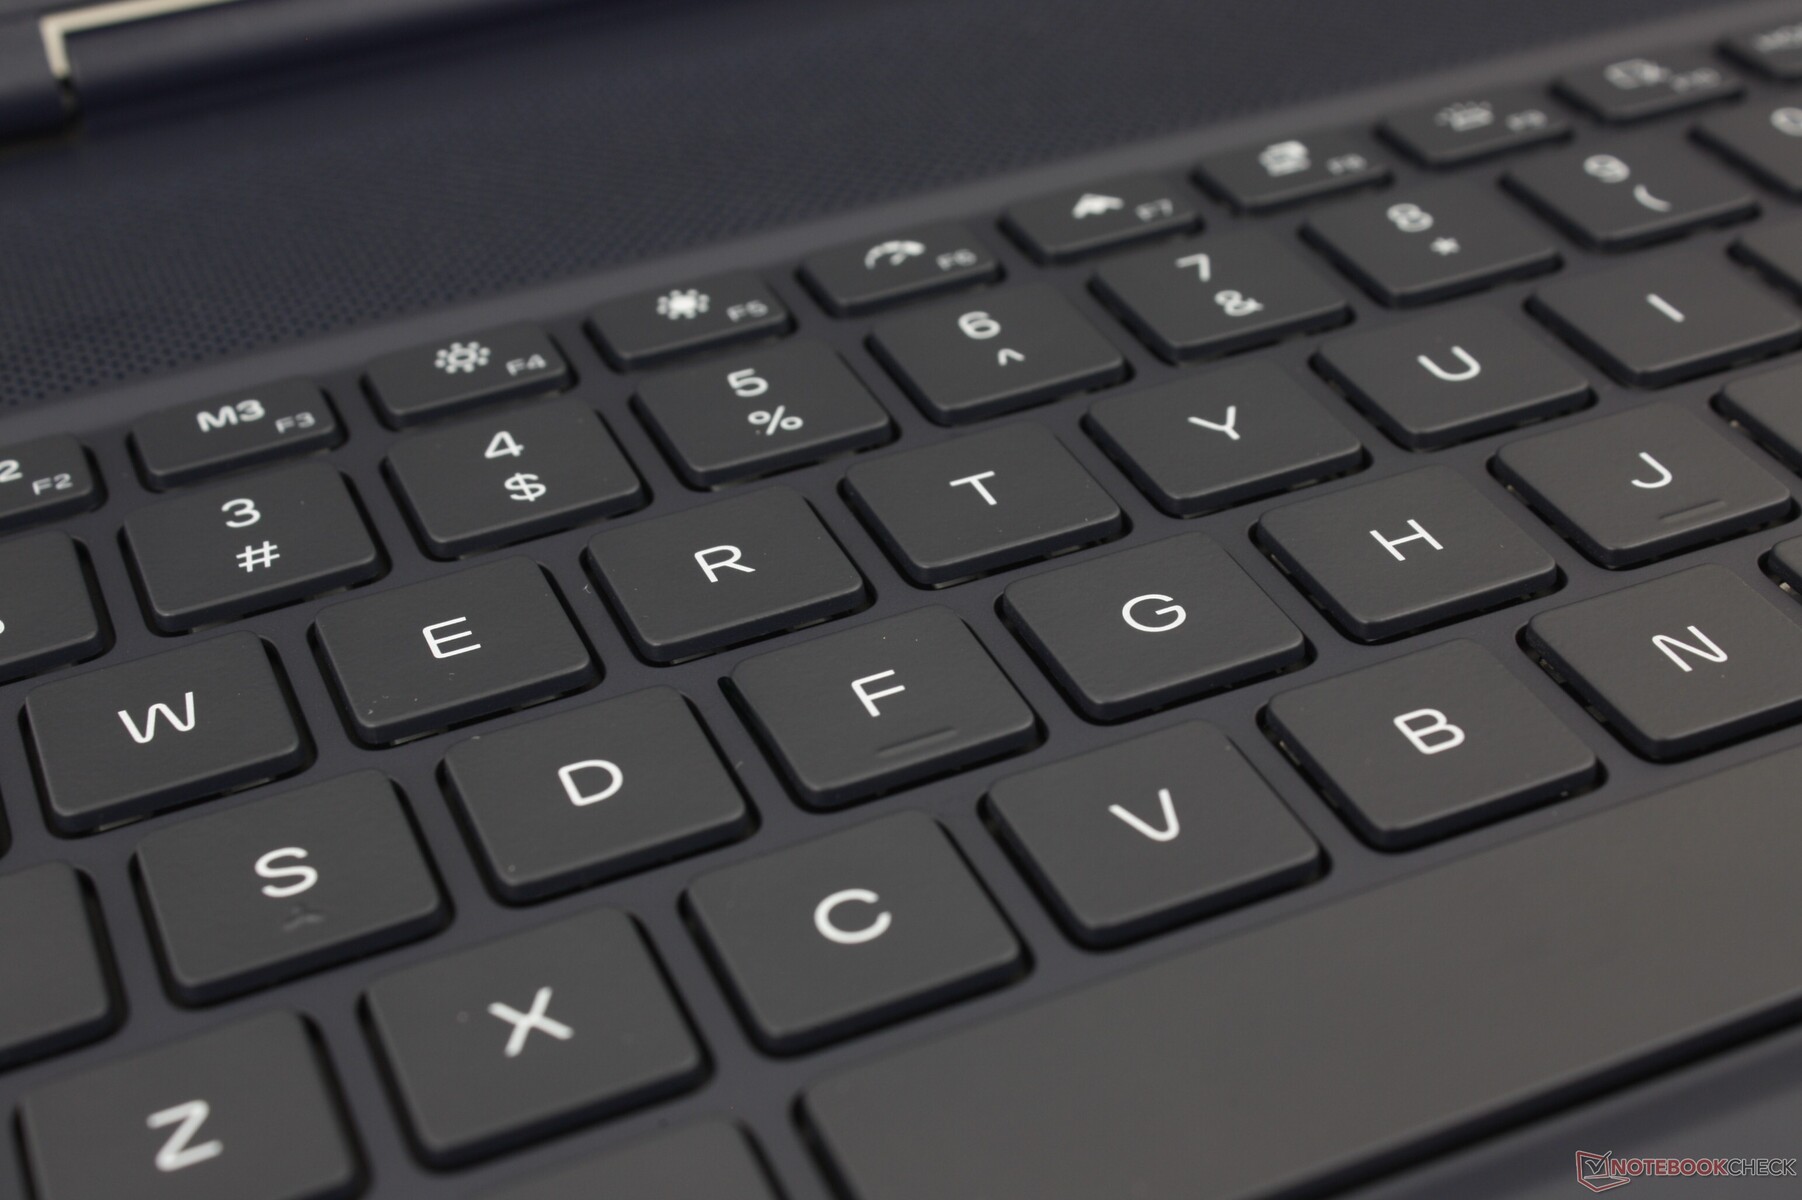
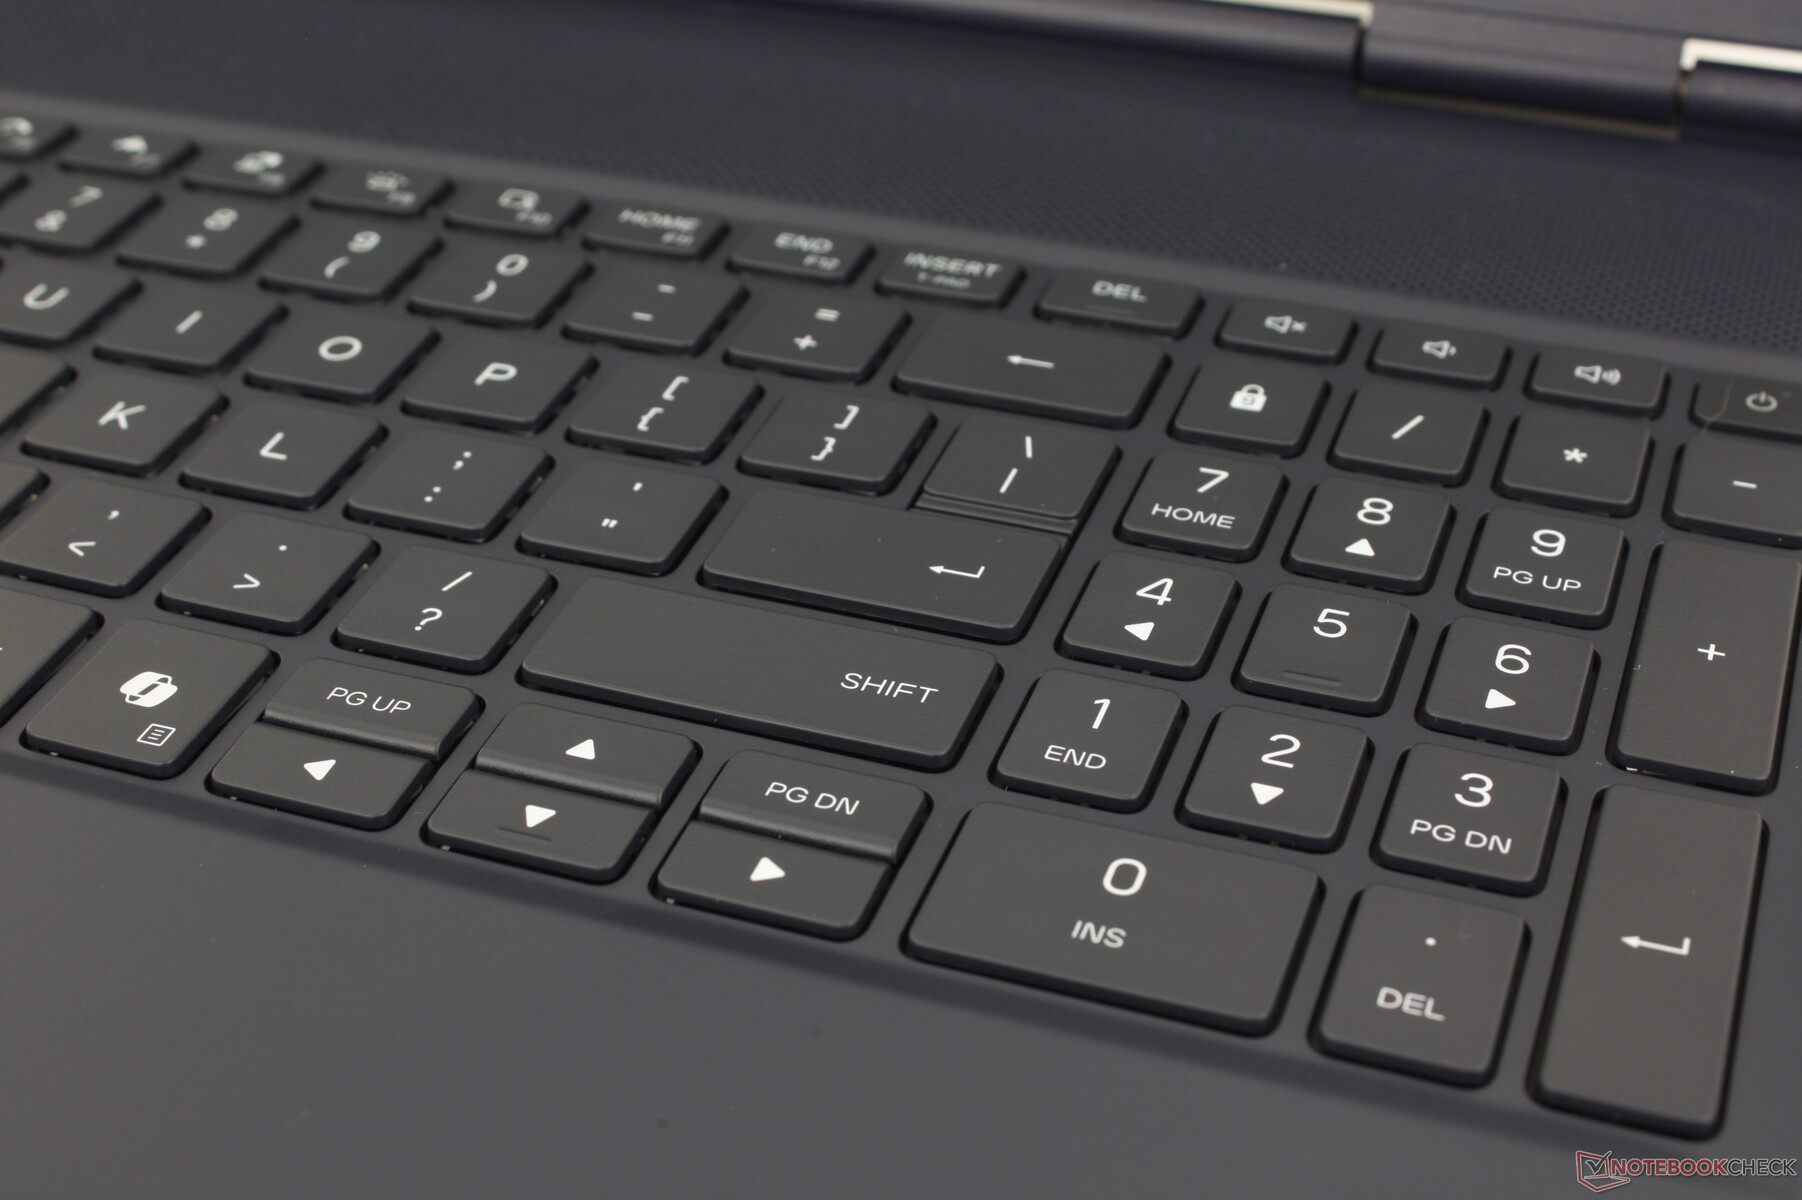
输入设备
键盘
按键比预期的要安静,同时还能提供类似超极本的输入体验。不过,它给人的感觉有点像在戴尔 Inspiron 上打字,而 Inspiron 是戴尔的廉价笔记本电脑型号之一。特别是轻巧的回车键,可能需要更深和/或更坚硬的反馈。
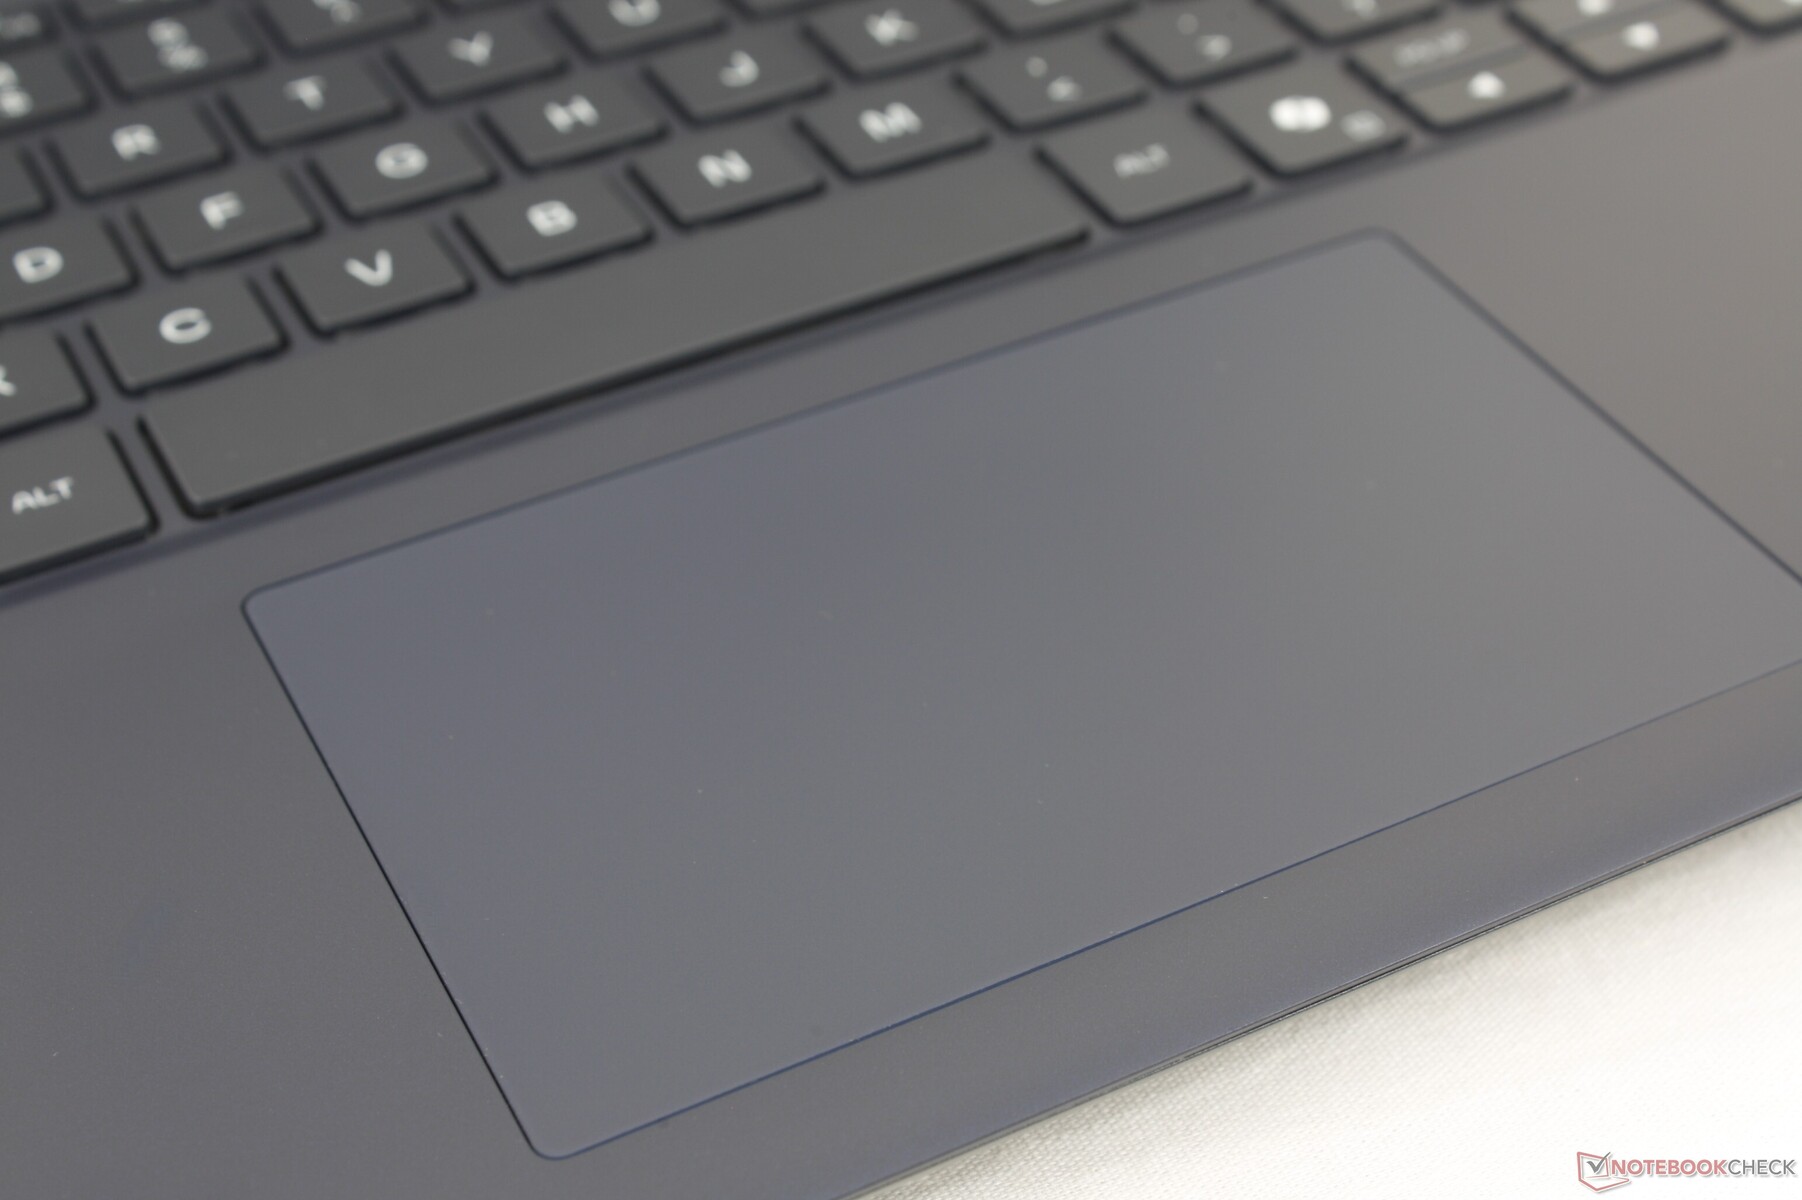
触摸板
实际上,它比 Alienware Area-51 的点击板稍大(11.5 x 7 厘米对 11.2 x 6.5 厘米)。不过,与技嘉 Aero X16 等竞争对手的点击板相比,它还是小了不少。虽然光标控制在任何速度下都流畅可靠,但点击时的反馈过于柔和,有一种令人不满意的海绵感。
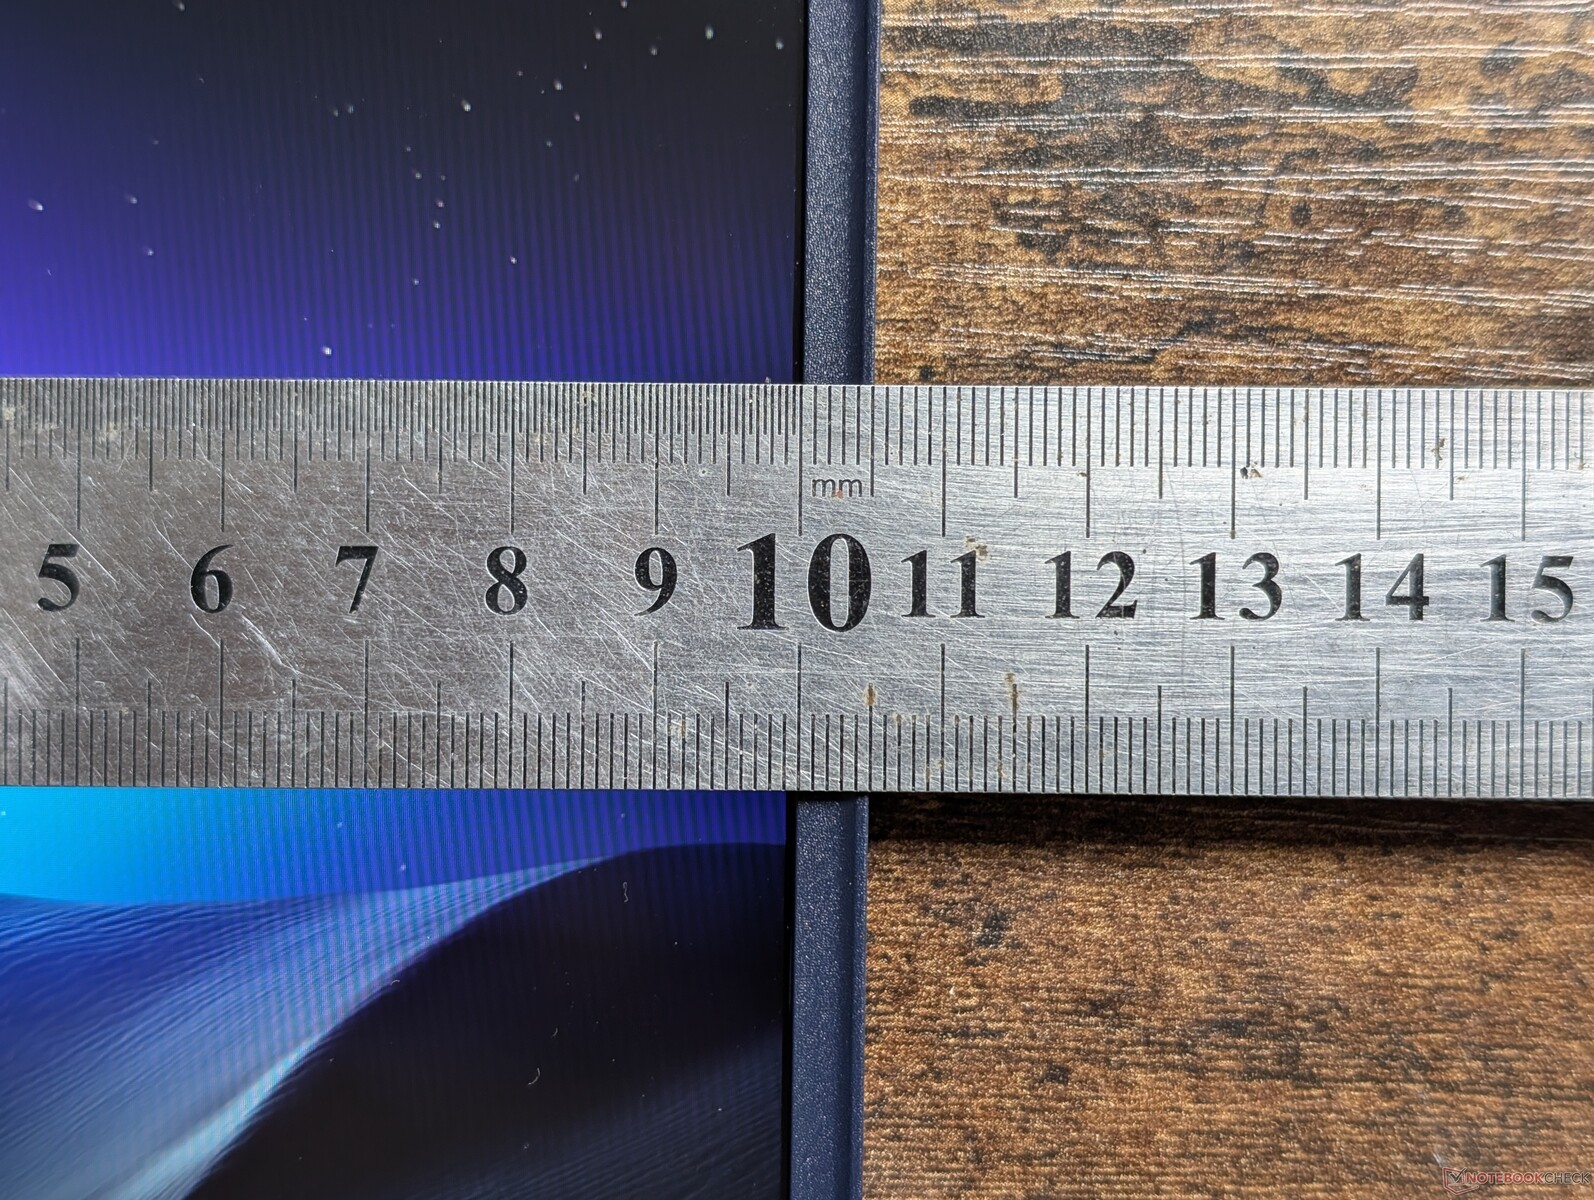
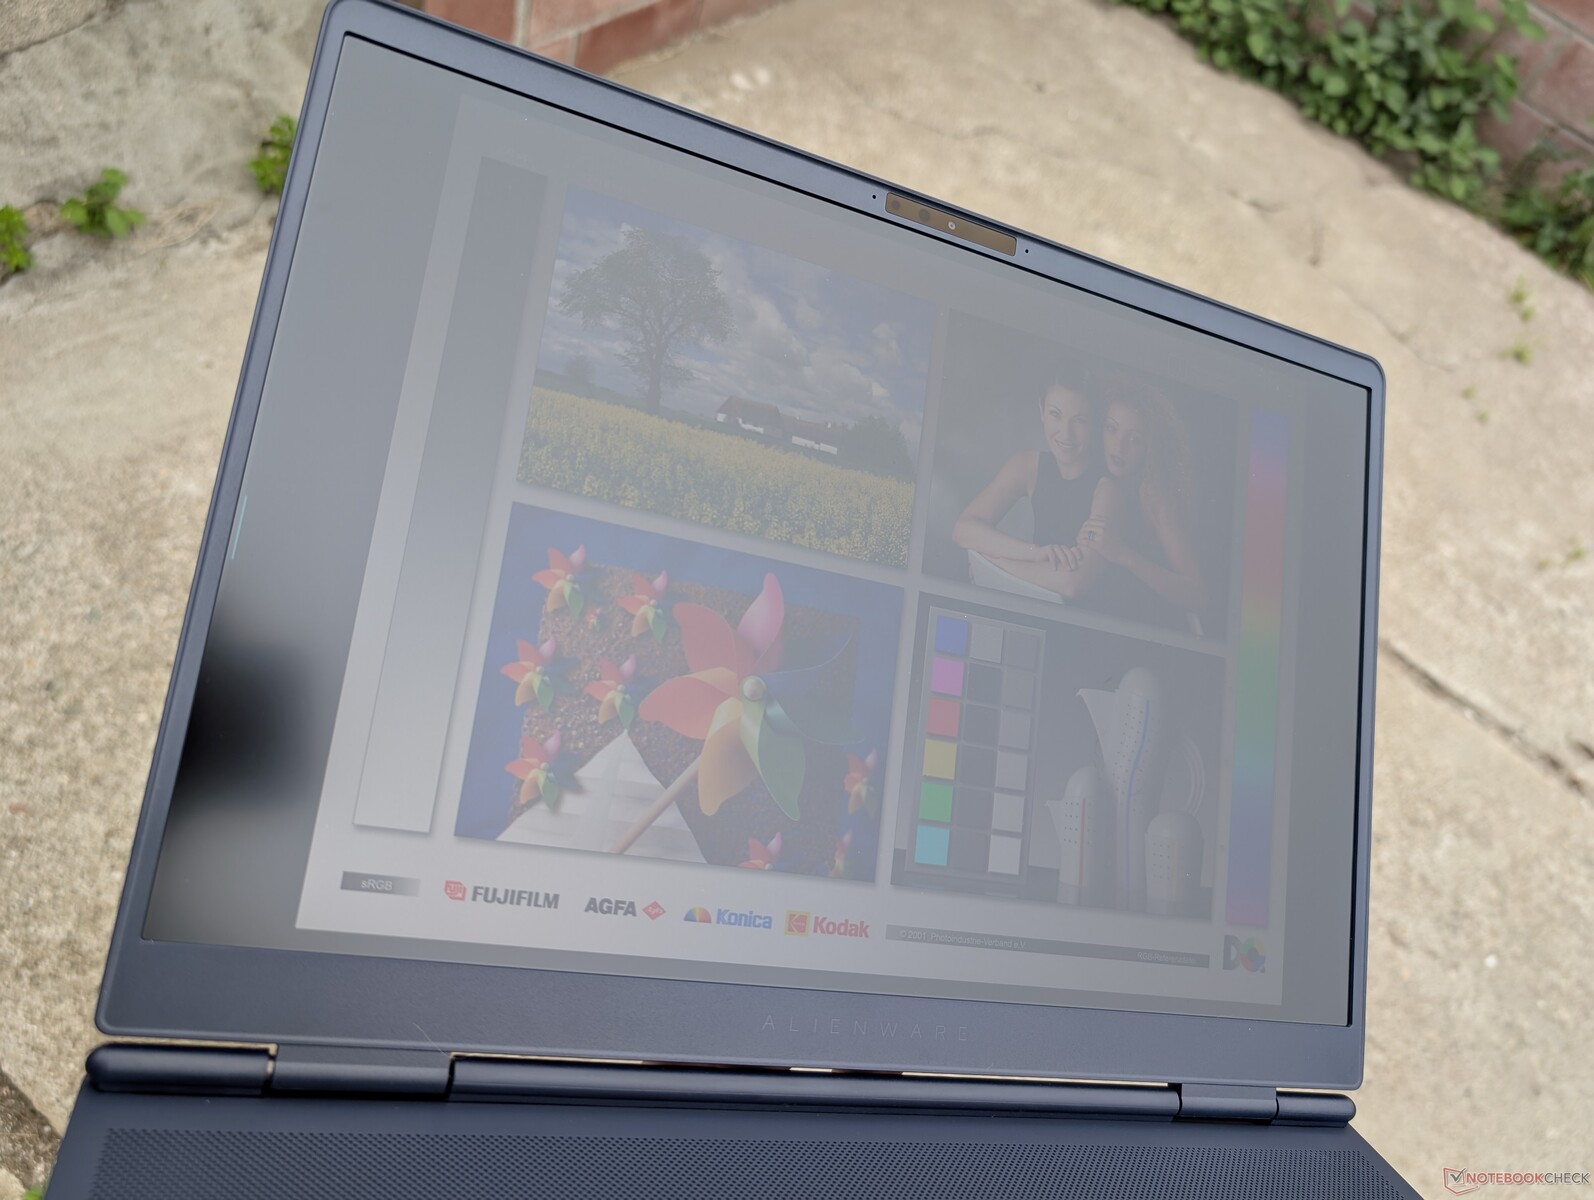
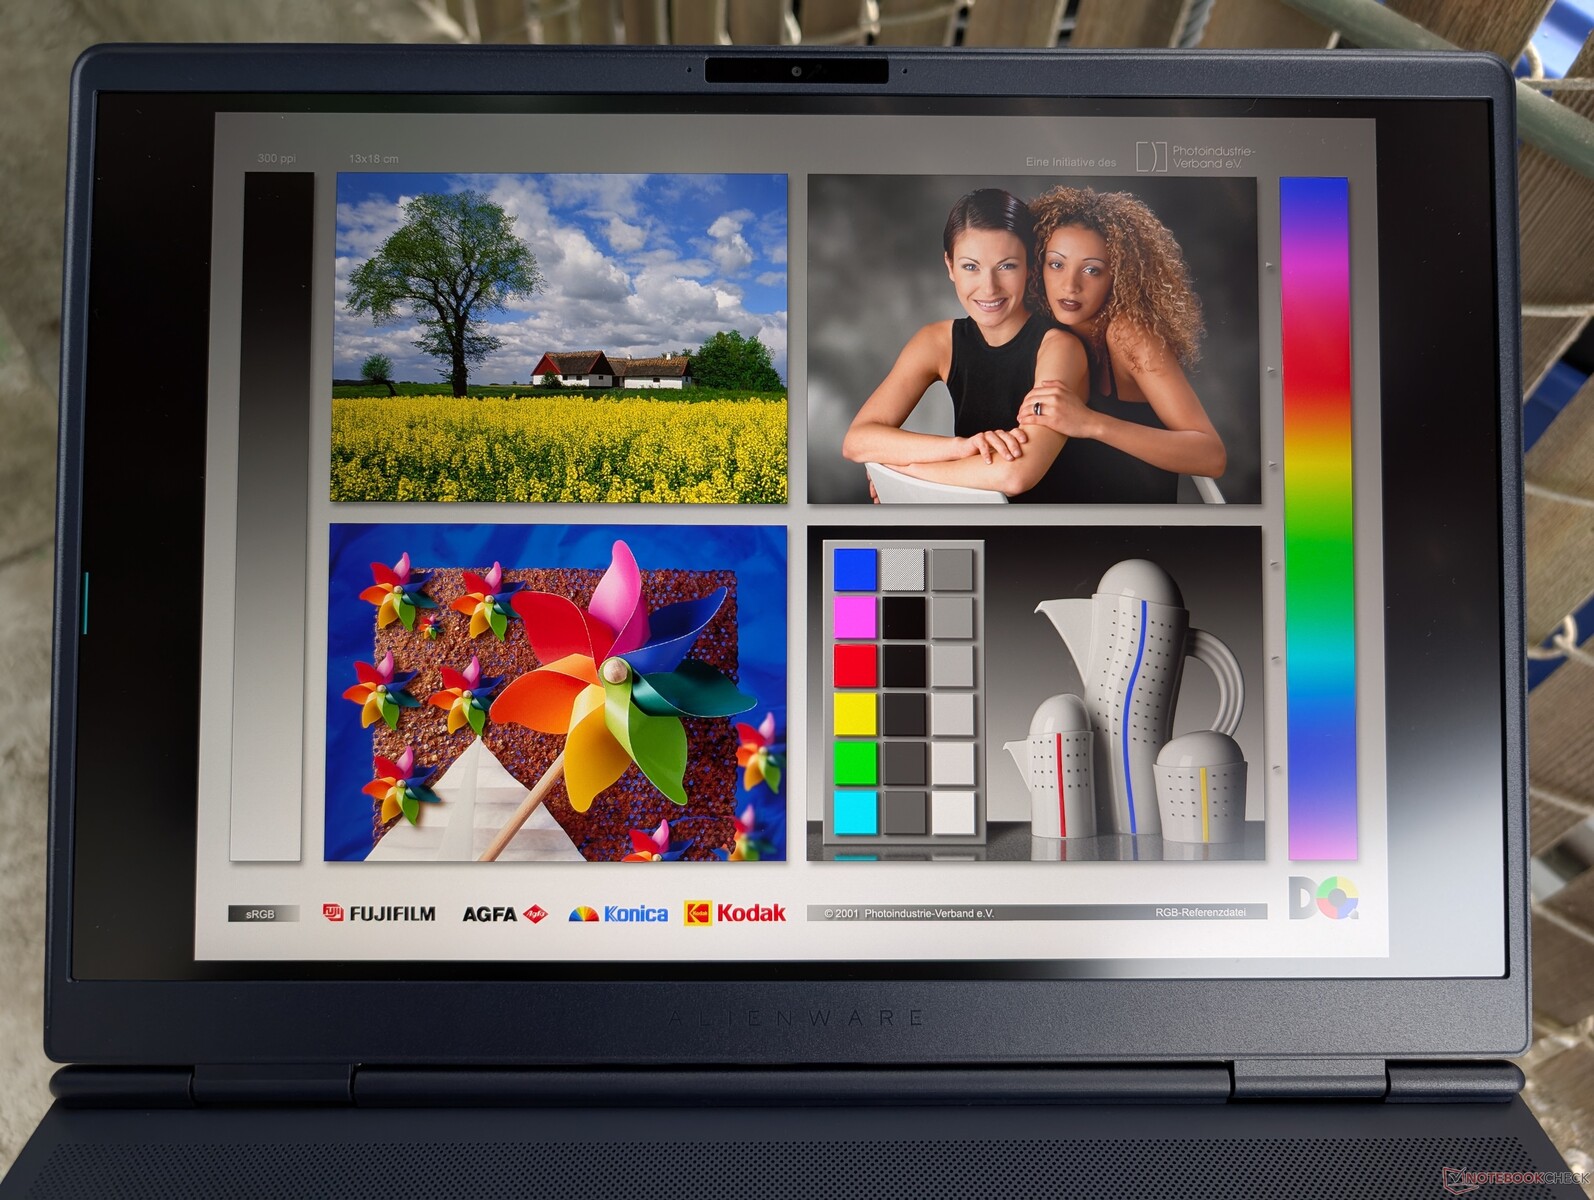
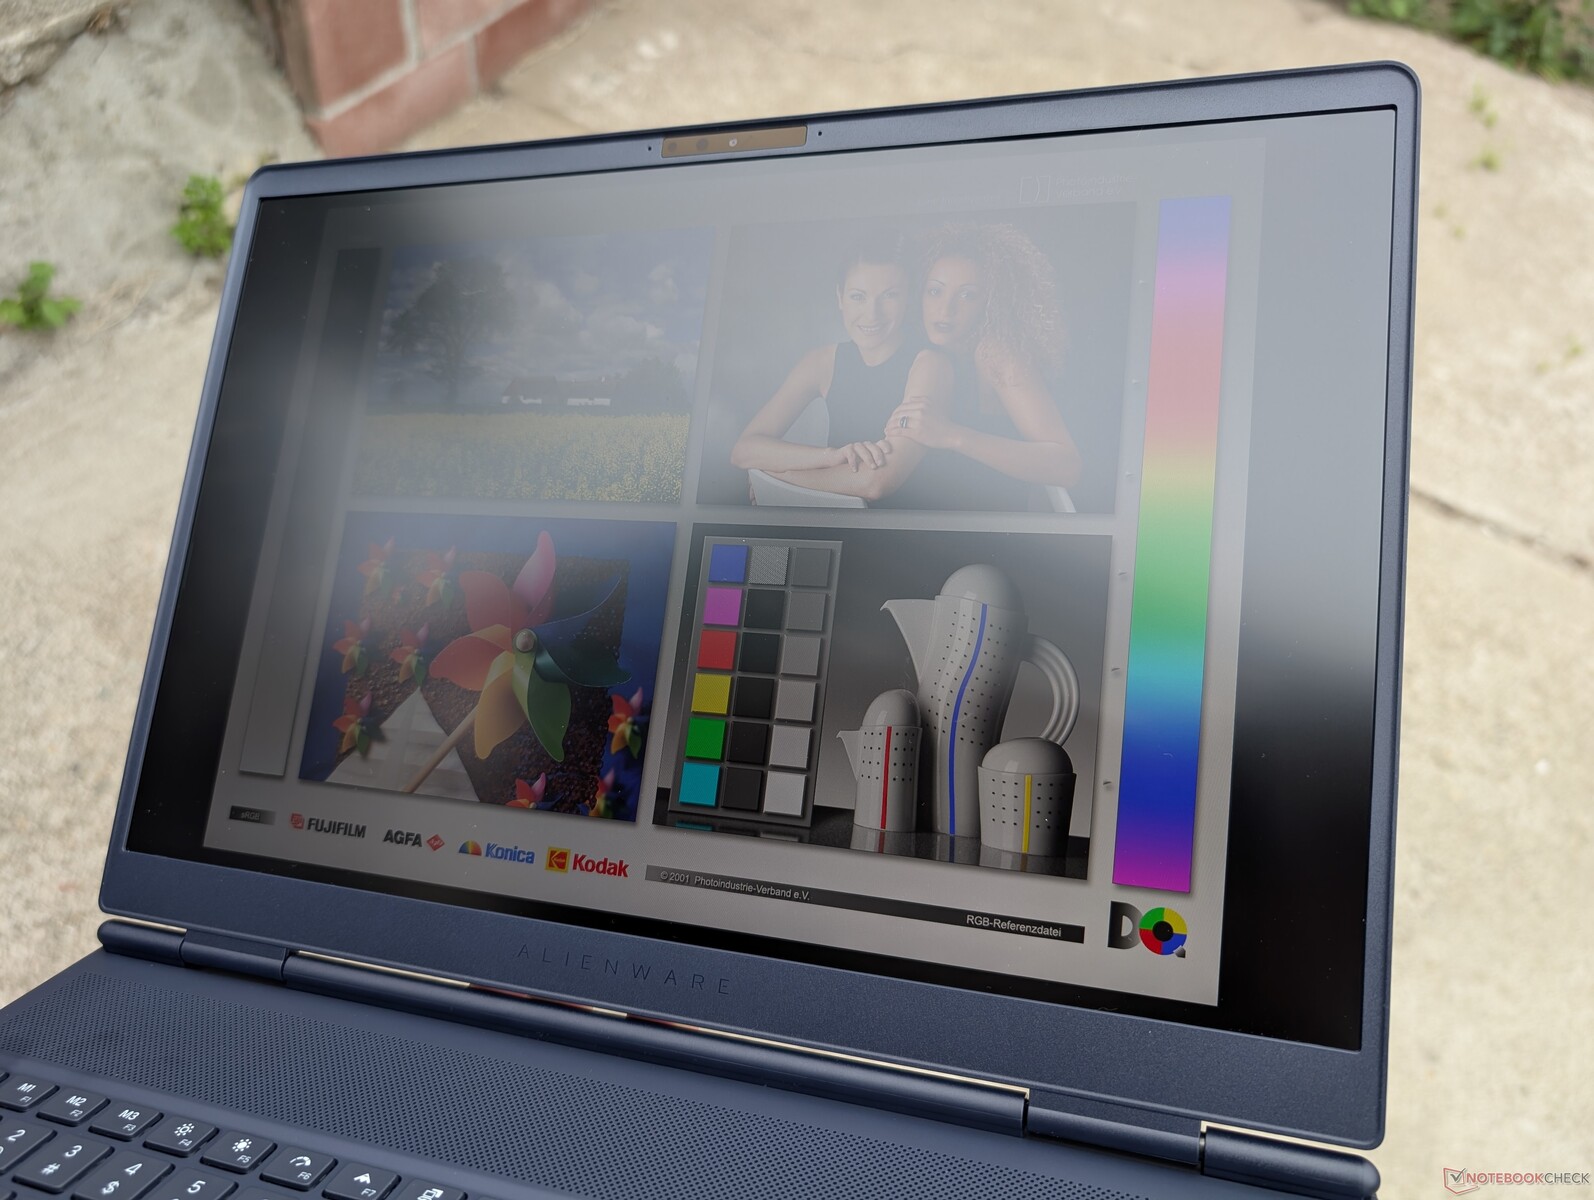
显示屏 - 对于 IPS 而言相当不错
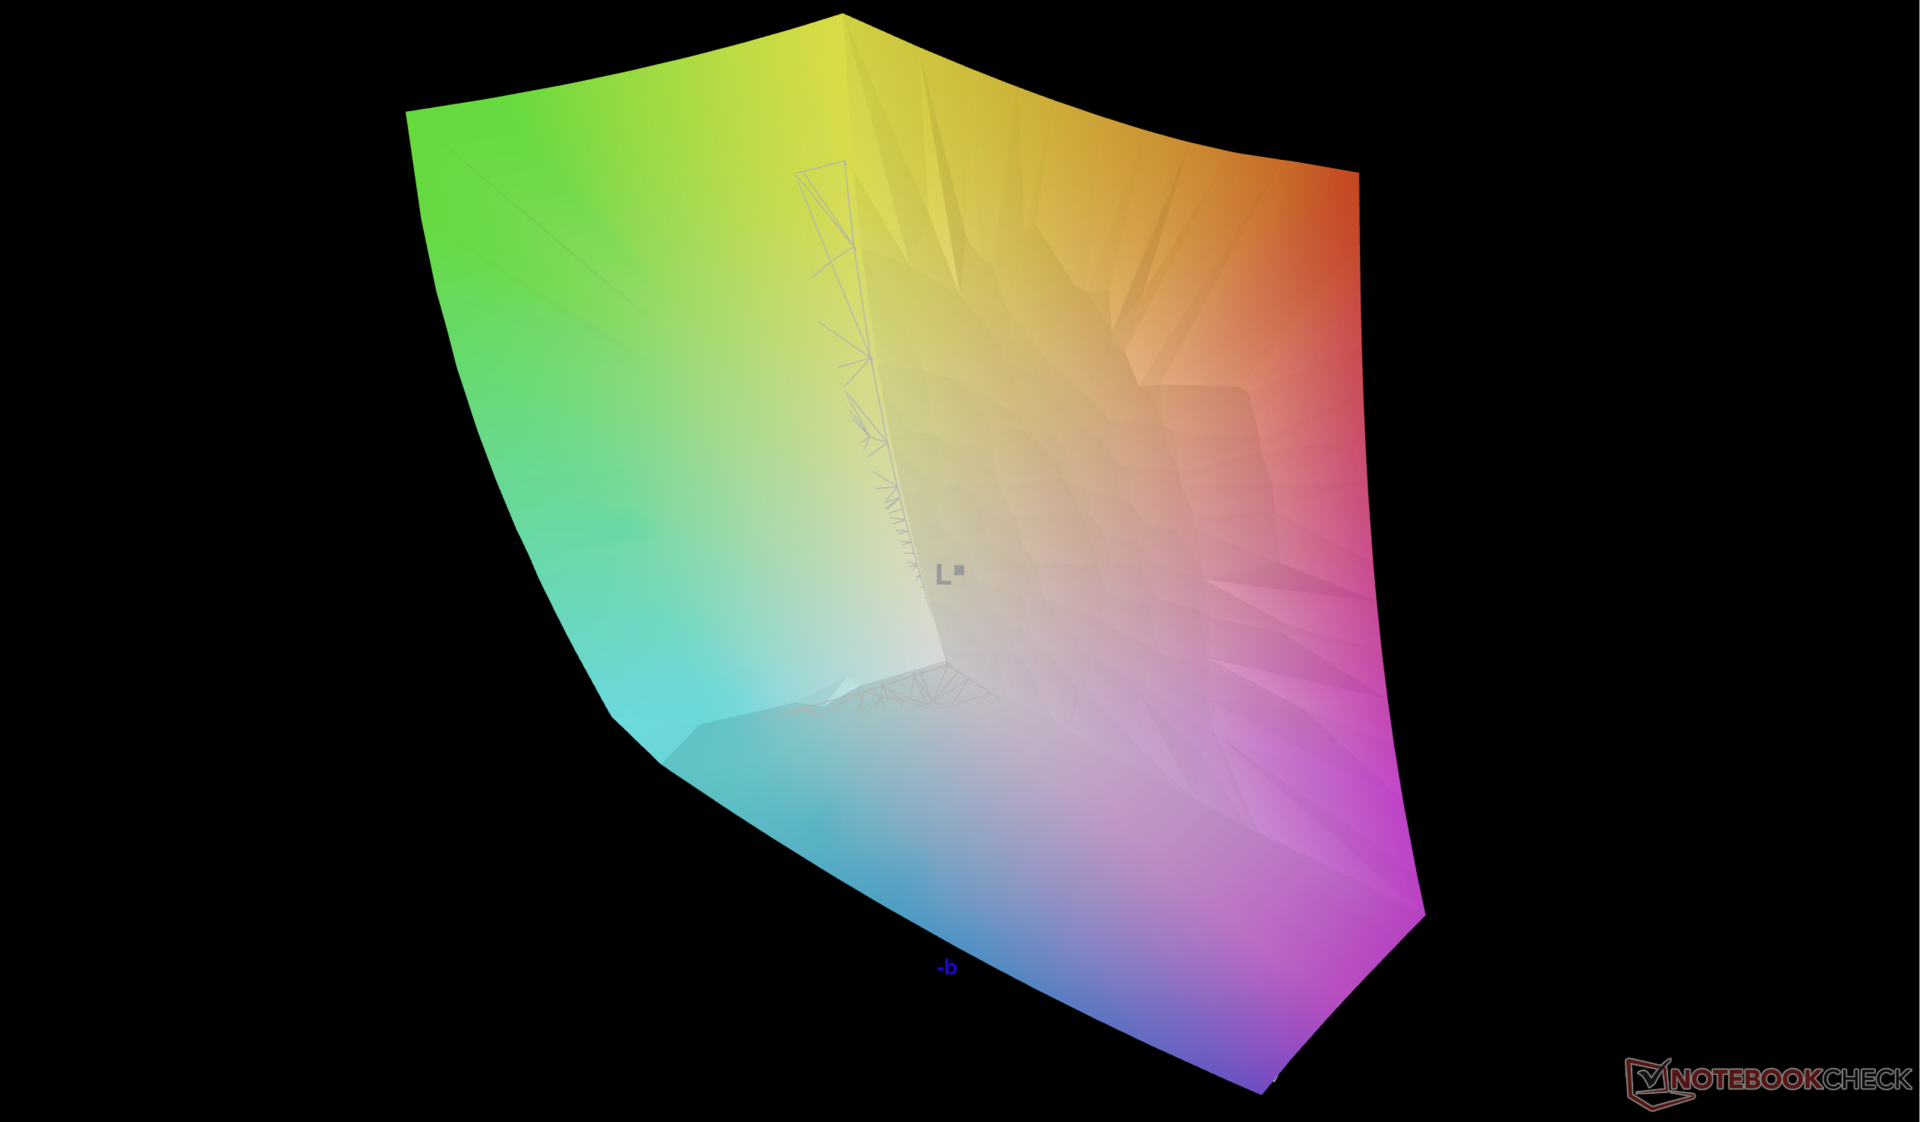
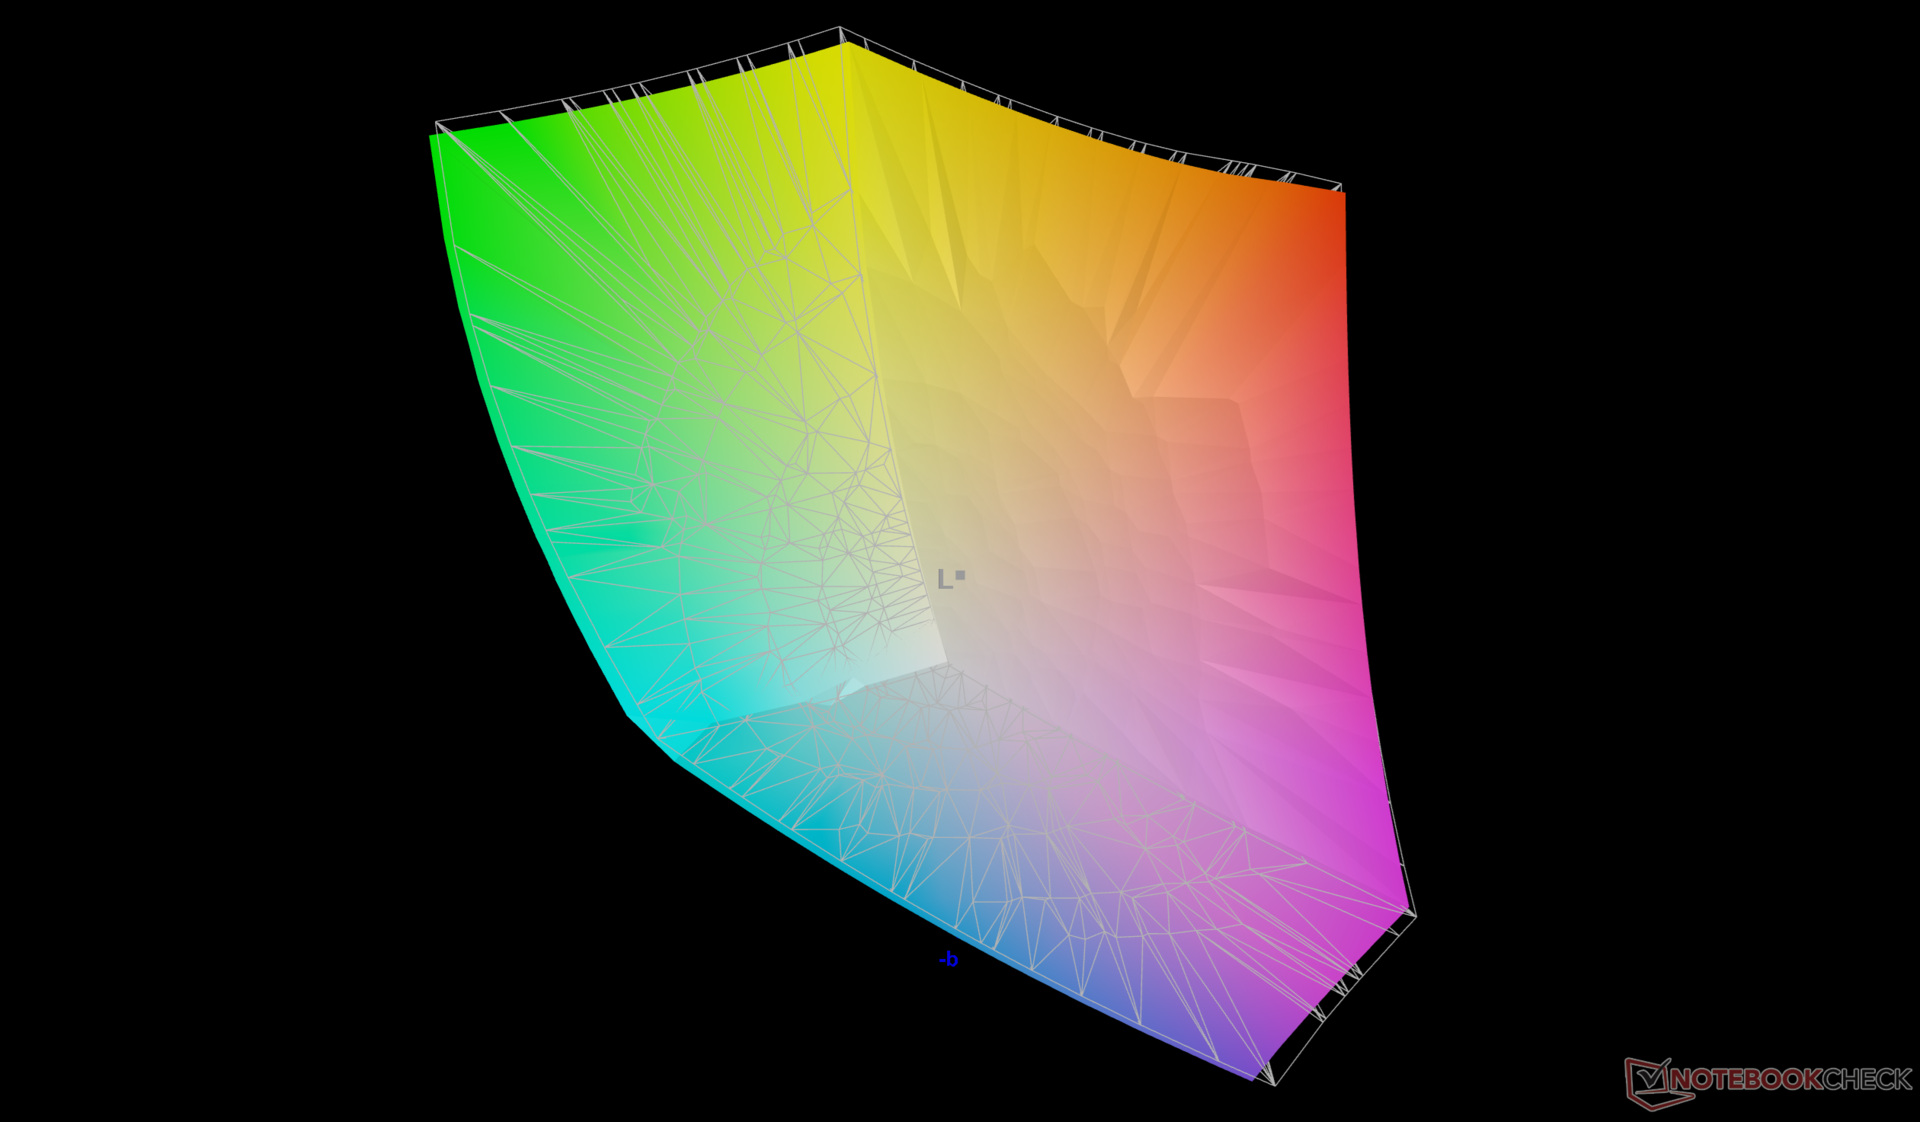
QHD+ IPS 面板具有全 DCI-P3 色彩、快速响应时间和 240 Hz 快速刷新率,适合游戏和编辑任务。其属性与 AU Optronics 1600p240 显示器基本相同。 Alienware Area-51尽管 Aurora 16X 的面板来自 LG 飞利浦。
可以说,该显示器最糟糕的方面是对比度较低,只有约 1000:1,黑色层次较差,而且不支持 HDR。没有 Mini-LED 或 OLED 选项,这可能是为了降低极光 16X 系列的成本。

| |||||||||||||||||||||||||
Brightness Distribution: 93 %
Center on Battery: 493.2 cd/m²
Contrast: 986:1 (Black: 0.5 cd/m²)
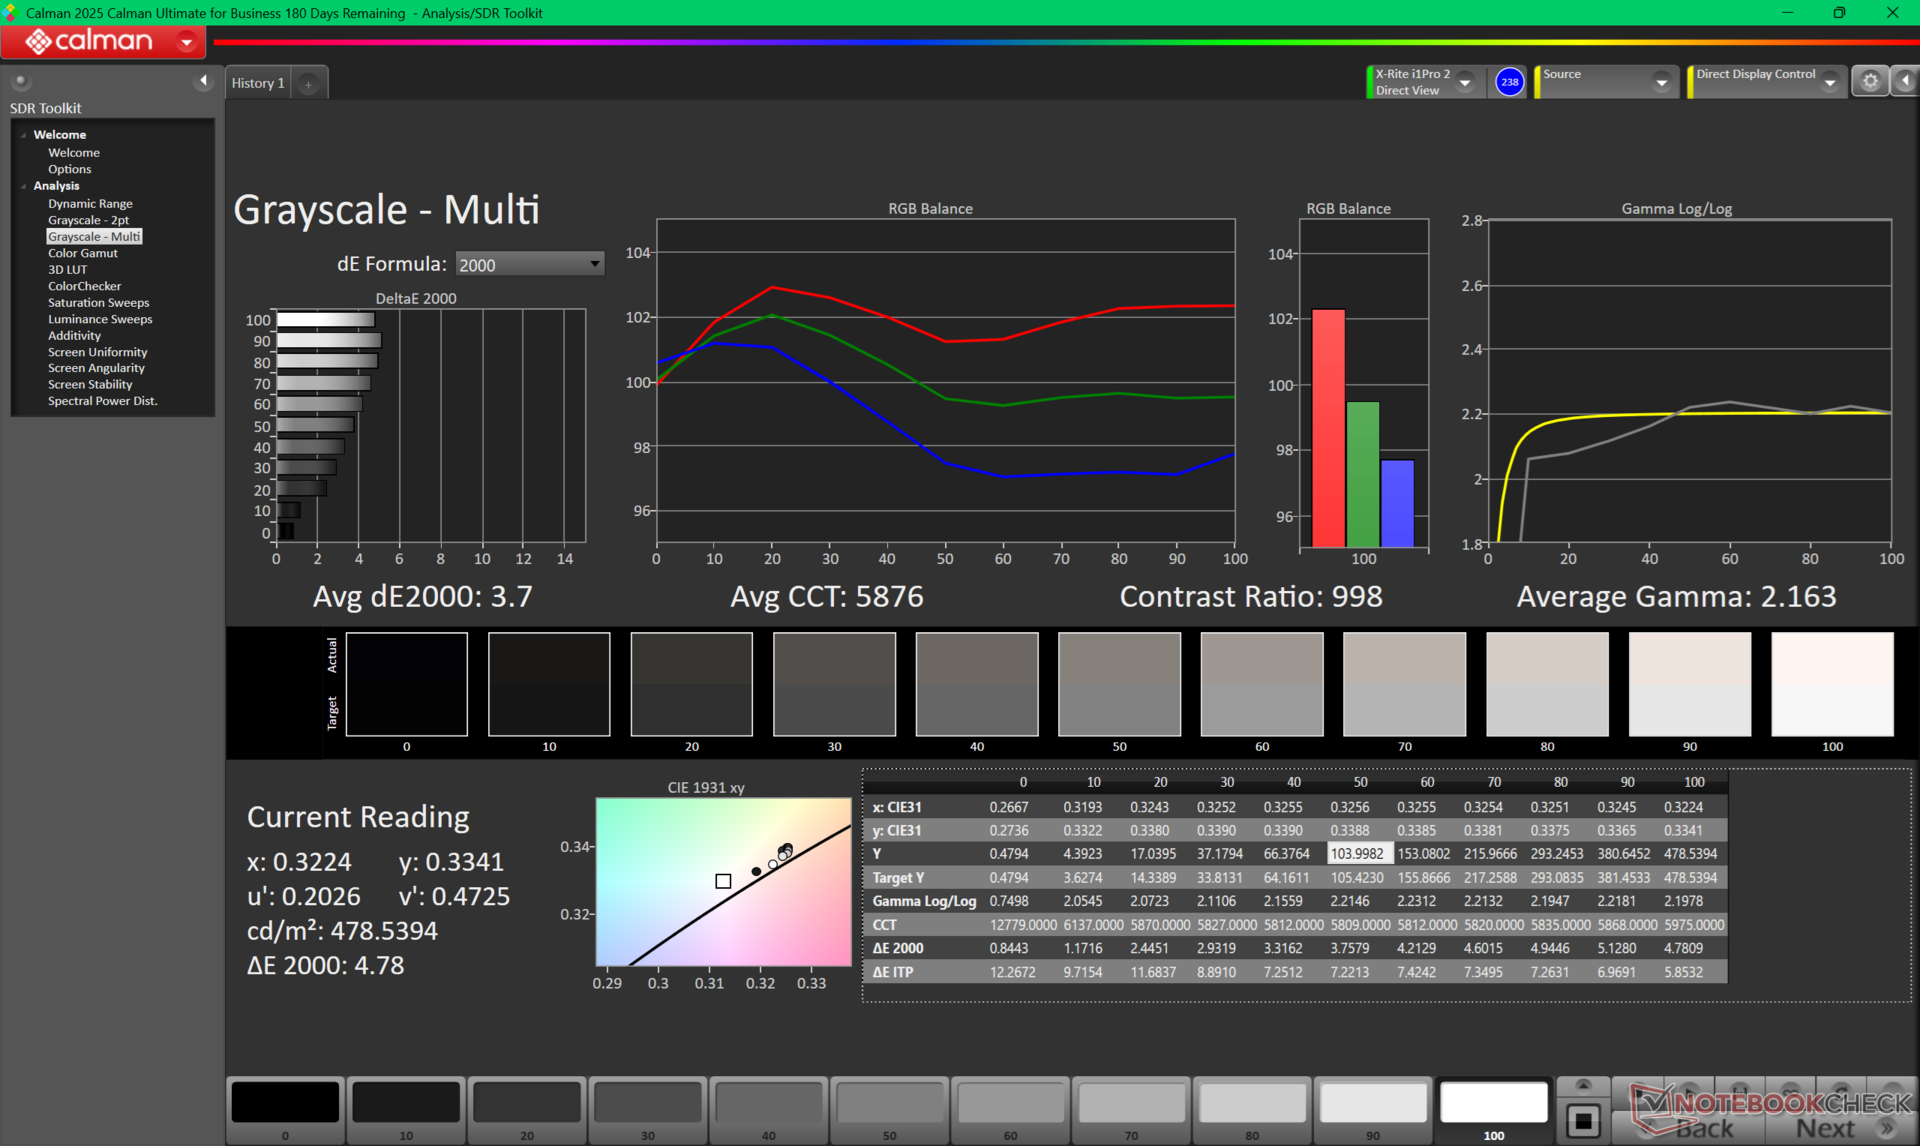
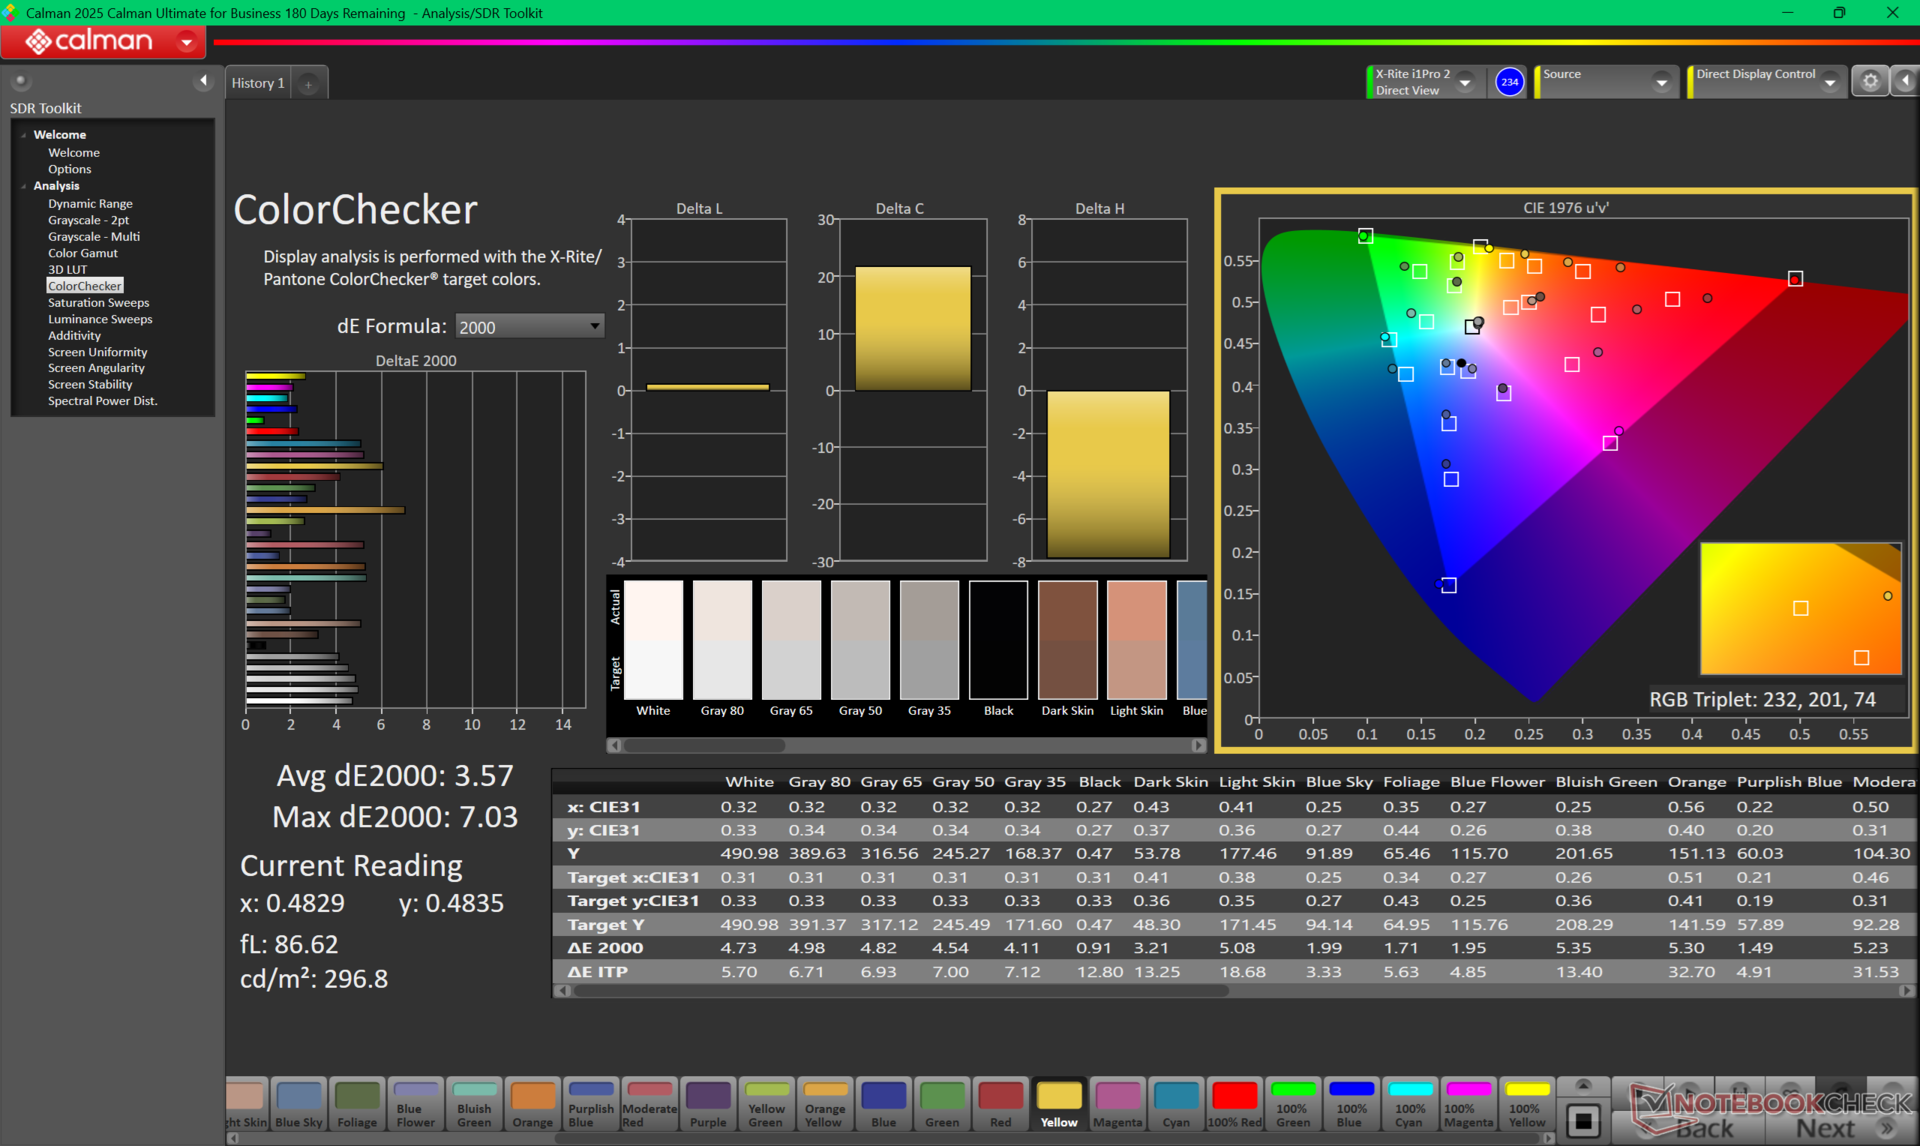
ΔE ColorChecker Calman: 3.57 | ∀{0.5-29.43 Ø4.73}
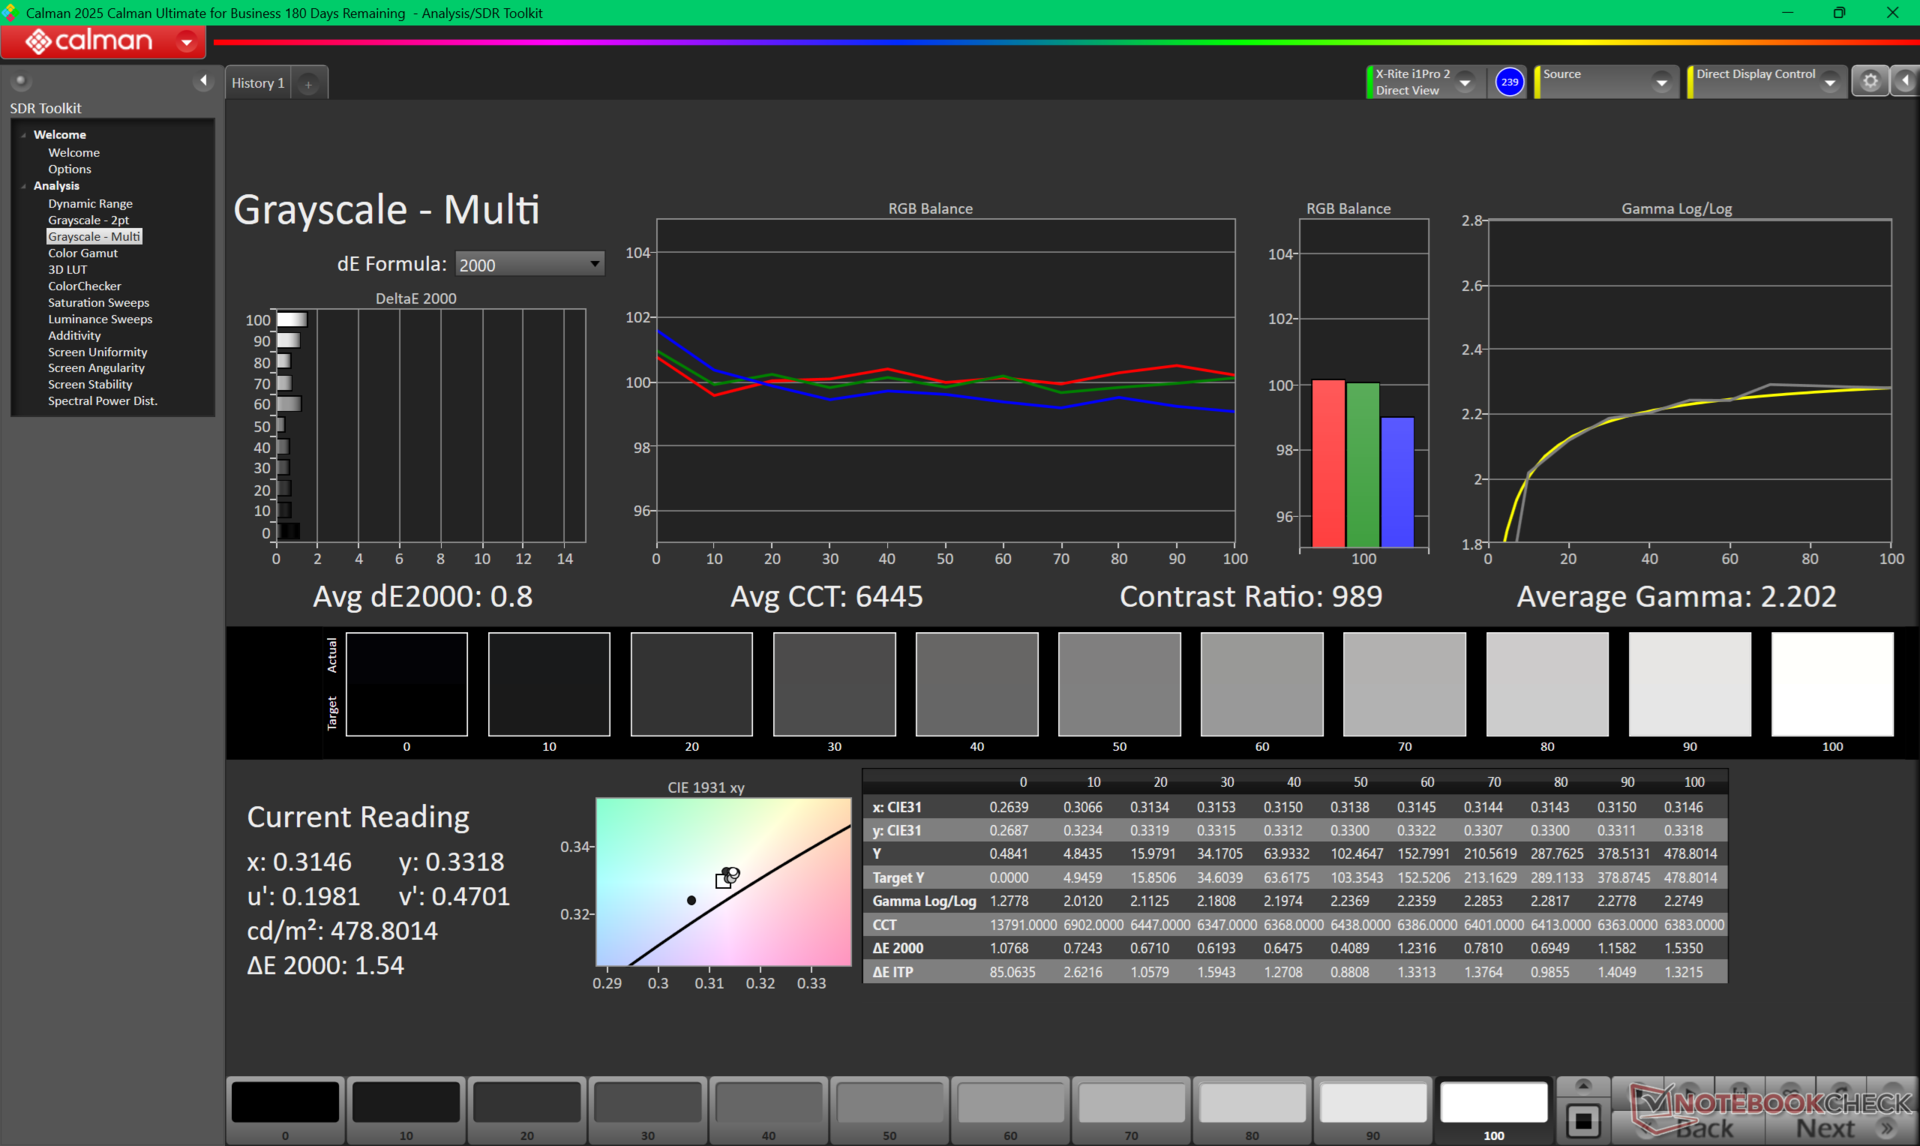
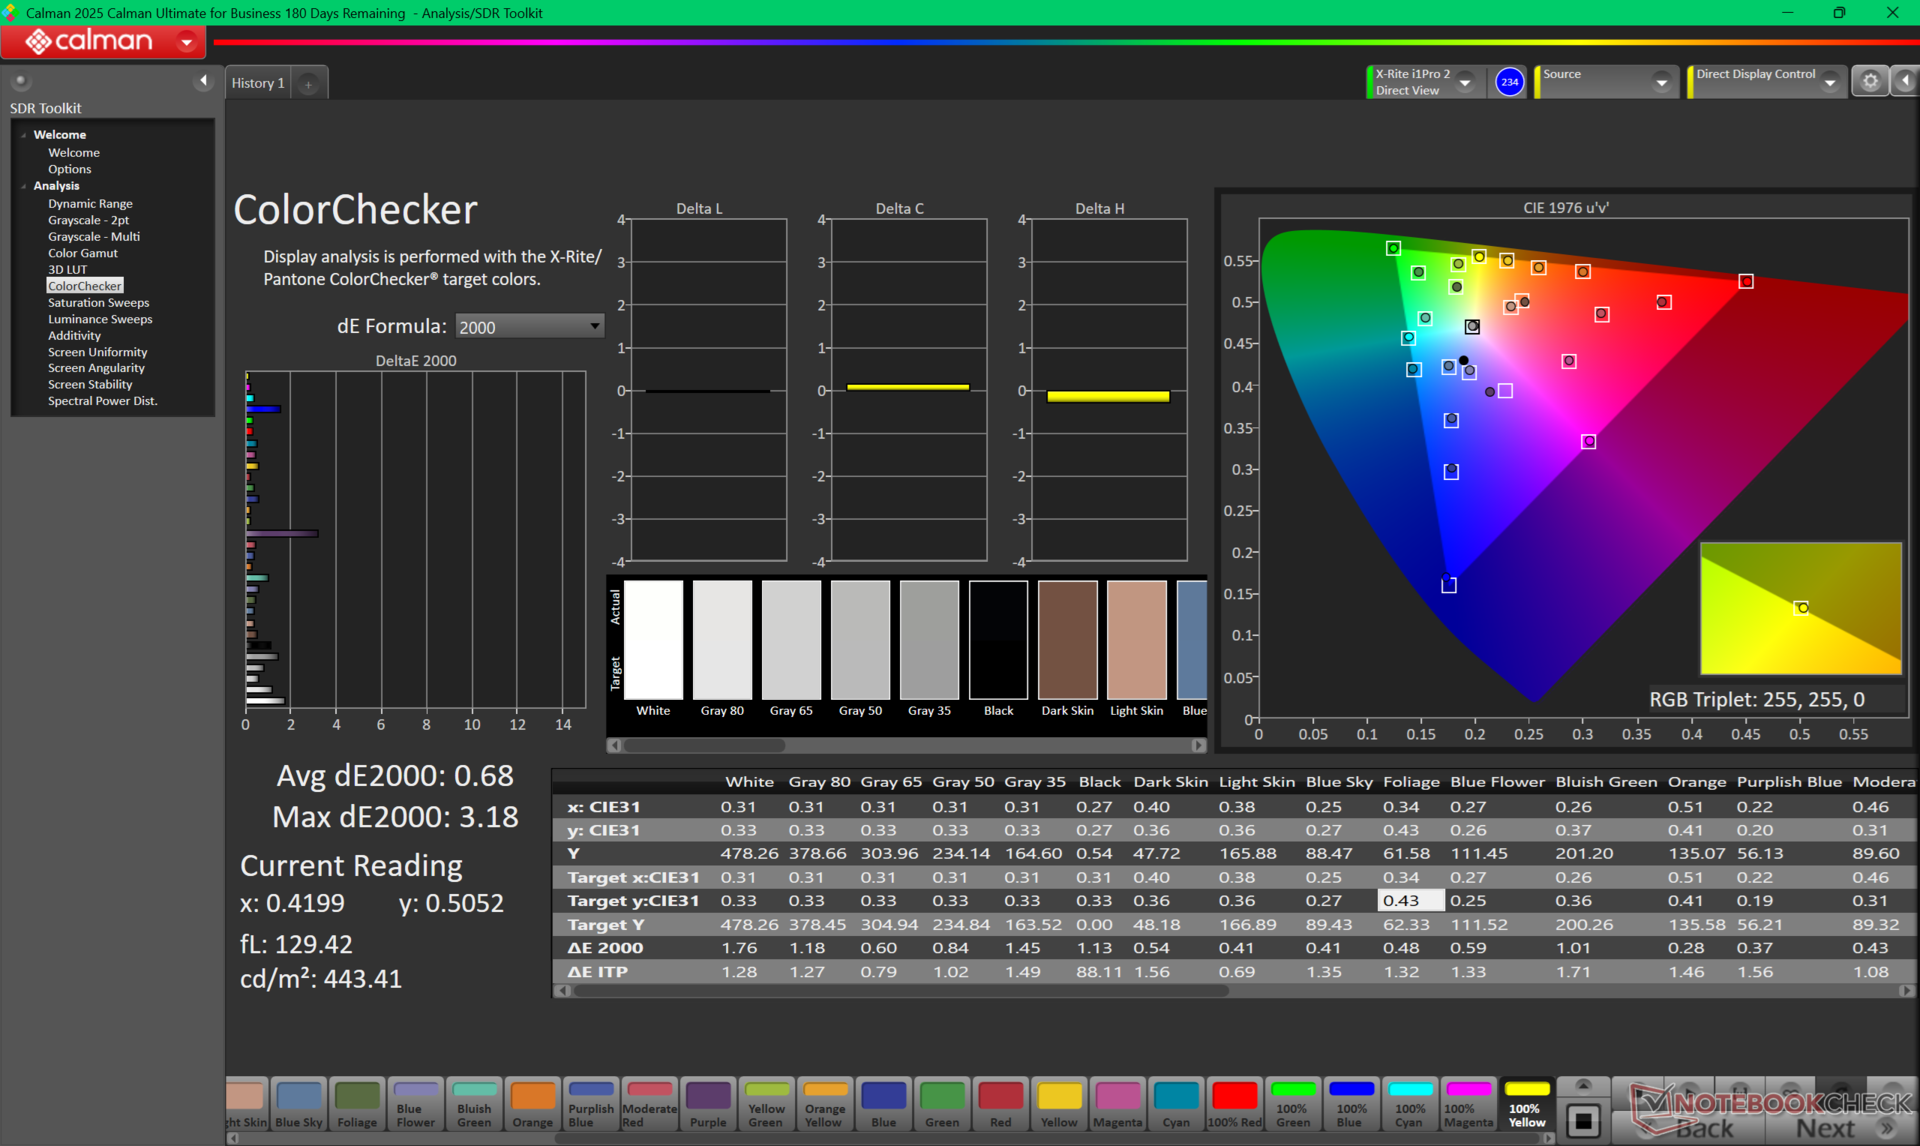
calibrated: 0.68
ΔE Greyscale Calman: 3.7 | ∀{0.09-98 Ø4.97}
89.7% AdobeRGB 1998 (Argyll 3D)
99.8% sRGB (Argyll 3D)
96.9% Display P3 (Argyll 3D)
Gamma: 2.16
CCT: 5876 K
| Alienware 16X Aurora, RTX 5070 LG Philips 160WQG, IPS, 2560x1600, 16", 240 Hz | Alienware 16 Area-51 AU Optronics B160QAN, IPS, 2560x1600, 16", 240 Hz | Gigabyte Gaming A16 GA6H NE160QDM-NYJ (BOE0C80), IPS, 2560x1600, 16", 165 Hz | MSI Vector 16 HX AI A2XWHG B160QAN02.3 (AUO7DB2), IPS, 2560x1600, 16", 240 Hz | Asus TUF Gaming A16 FA608WV B160UAN08.1 (AUO9BB0), IPS, 1920x1200, 16", 144 Hz | Lenovo Legion 5 Pro 16IAX10H ATNA60HS01-0 (Samsung SDC420A), OLED, 2560x1600, 16", 165 Hz | |
|---|---|---|---|---|---|---|
| Display | -1% | -16% | -2% | -51% | 3% | |
| Display P3 Coverage (%) | 96.9 | 96 -1% | 69.4 -28% | 96.6 0% | 39.8 -59% | 99.9 3% |
| sRGB Coverage (%) | 99.8 | 100 0% | 99.5 0% | 99.8 0% | 59.7 -40% | 100 0% |
| AdobeRGB 1998 Coverage (%) | 89.7 | 89.2 -1% | 71.6 -20% | 84.4 -6% | 41.1 -54% | 94.1 5% |
| Response Times | 3% | -107% | 16% | -107% | 69% | |
| Response Time Grey 50% / Grey 80% * (ms) | 4.3 ? | 4.8 ? -12% | 14.3 ? -233% | 4.3 ? -0% | 13.6 ? -216% | 2 ? 53% |
| Response Time Black / White * (ms) | 8.7 ? | 7.2 ? 17% | 7 ? 20% | 6 ? 31% | 8.4 ? 3% | 1.4 ? 84% |
| PWM Frequency (Hz) | 1300 | |||||
| PWM Amplitude * (%) | 16.7 | |||||
| Screen | 0% | -20% | -9% | -89% | -18% | |
| Brightness middle (cd/m²) | 493.2 | 554 12% | 432 -12% | 473 -4% | 347 -30% | 518 5% |
| Brightness (cd/m²) | 477 | 532 12% | 425 -11% | 426 -11% | 321 -33% | 522 9% |
| Brightness Distribution (%) | 93 | 88 -5% | 91 -2% | 85 -9% | 88 -5% | 97 4% |
| Black Level * (cd/m²) | 0.5 | 0.52 -4% | 0.37 26% | 0.42 16% | 0.3 40% | |
| Contrast (:1) | 986 | 1065 8% | 1168 18% | 1126 14% | 1157 17% | |
| Colorchecker dE 2000 * | 3.57 | 2.81 21% | 4.76 -33% | 3.47 3% | 5.89 -65% | 2.49 30% |
| Colorchecker dE 2000 max. * | 7.03 | 8.32 -18% | 8.59 -22% | 7.24 -3% | 19.26 -174% | 5.25 25% |
| Colorchecker dE 2000 calibrated * | 0.68 | 0.65 4% | 1.18 -74% | 1.36 -100% | 4.3 -532% | 2.15 -216% |
| Greyscale dE 2000 * | 3.7 | 4.7 -27% | 6.2 -68% | 3.1 16% | 4.27 -15% | 3.02 18% |
| Gamma | 2.16 102% | 2.3 96% | 2.079 106% | 2.486 88% | 2.47 89% | 2.37 93% |
| CCT | 5876 111% | 6476 100% | 6690 97% | 6832 95% | 7158 91% | 6426 101% |
| Total Average (Program / Settings) | 1% /
0% | -48% /
-31% | 2% /
-4% | -82% /
-83% | 18% /
2% |
* ... smaller is better
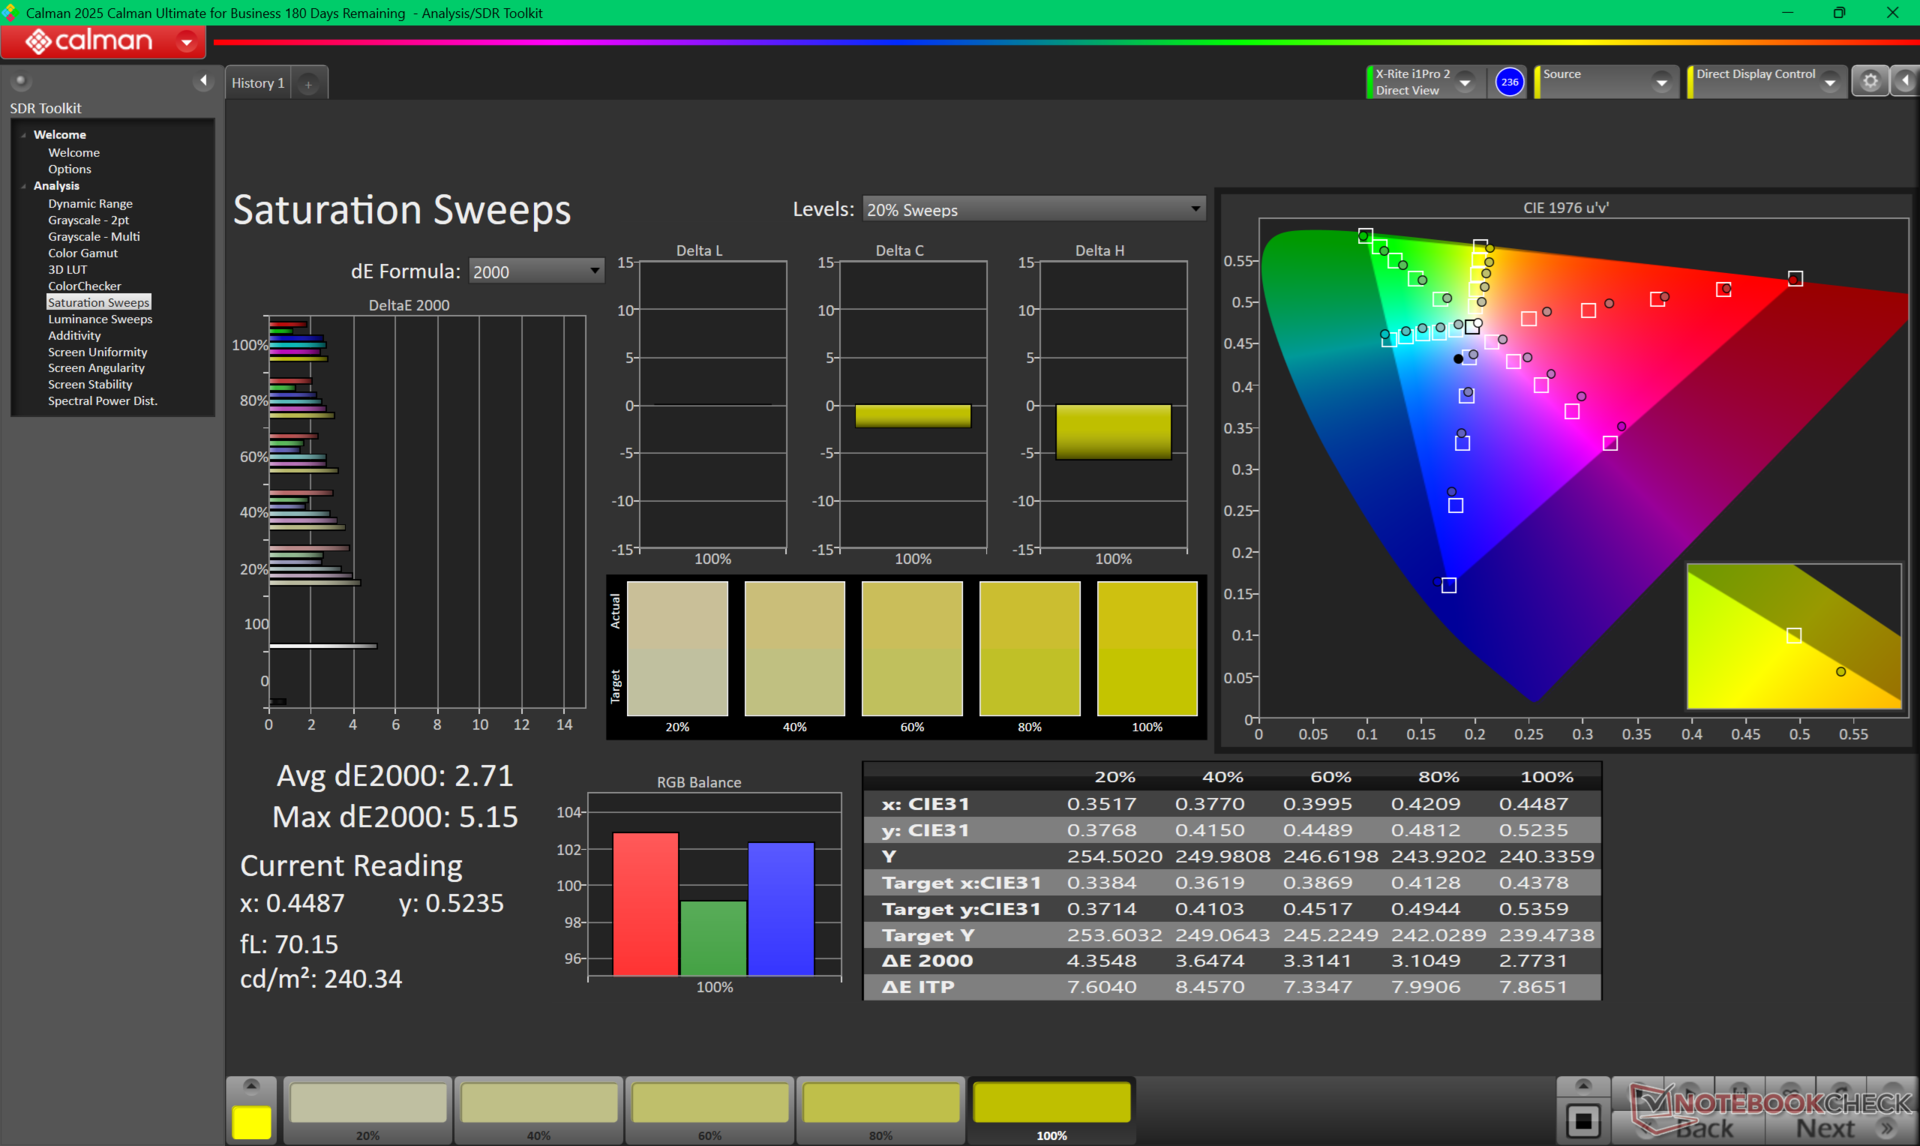
尽管戴尔没有宣传任何出厂校准服务,但显示器出厂时已根据 P3 色彩进行了适当校准。不过,色温比我们希望的稍高,约为 5900K。我们的校准 ICM 配置文件可在上面免费下载。
Display Response Times
| ↔ Response Time Black to White | ||
|---|---|---|
| 8.7 ms ... rise ↗ and fall ↘ combined | ↗ 4.6 ms rise | 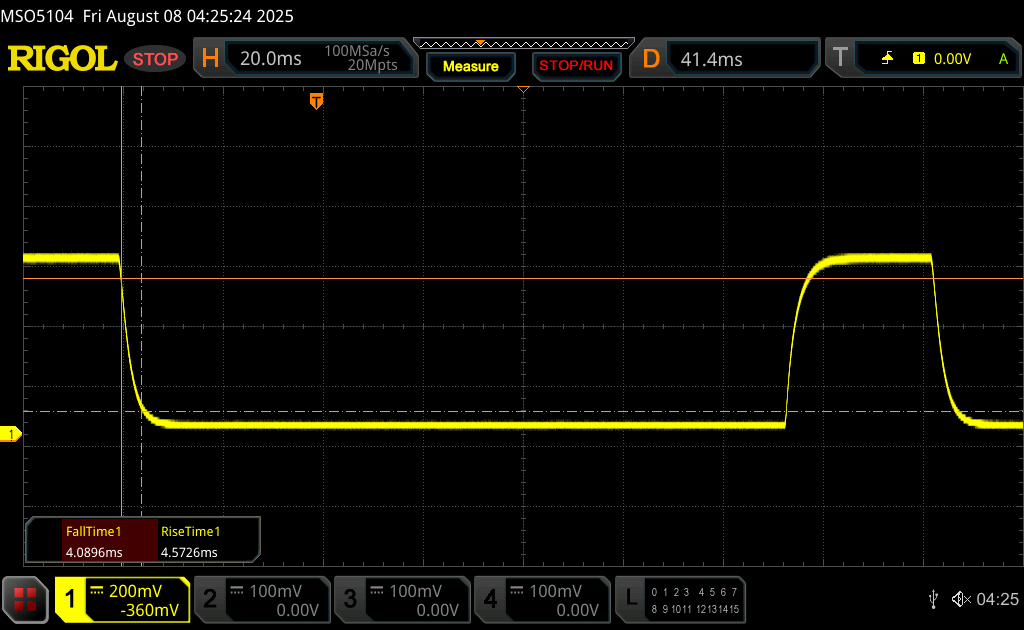 |
| ↘ 4.1 ms fall | ||
| The screen shows fast response rates in our tests and should be suited for gaming. In comparison, all tested devices range from 0.1 (minimum) to 240 (maximum) ms. » 24 % of all devices are better. This means that the measured response time is better than the average of all tested devices (19.9 ms). | ||
| ↔ Response Time 50% Grey to 80% Grey | ||
| 4.3 ms ... rise ↗ and fall ↘ combined | ↗ 1.9 ms rise | 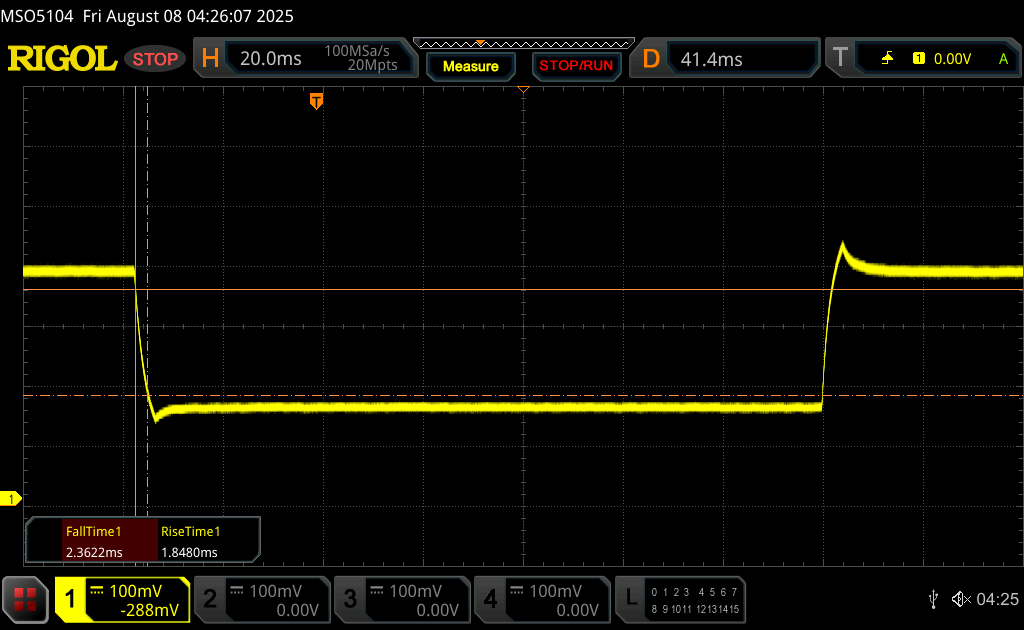 |
| ↘ 2.4 ms fall | ||
| The screen shows very fast response rates in our tests and should be very well suited for fast-paced gaming. In comparison, all tested devices range from 0.165 (minimum) to 636 (maximum) ms. » 16 % of all devices are better. This means that the measured response time is better than the average of all tested devices (31.1 ms). | ||
Screen Flickering / PWM (Pulse-Width Modulation)
| Screen flickering / PWM not detected | 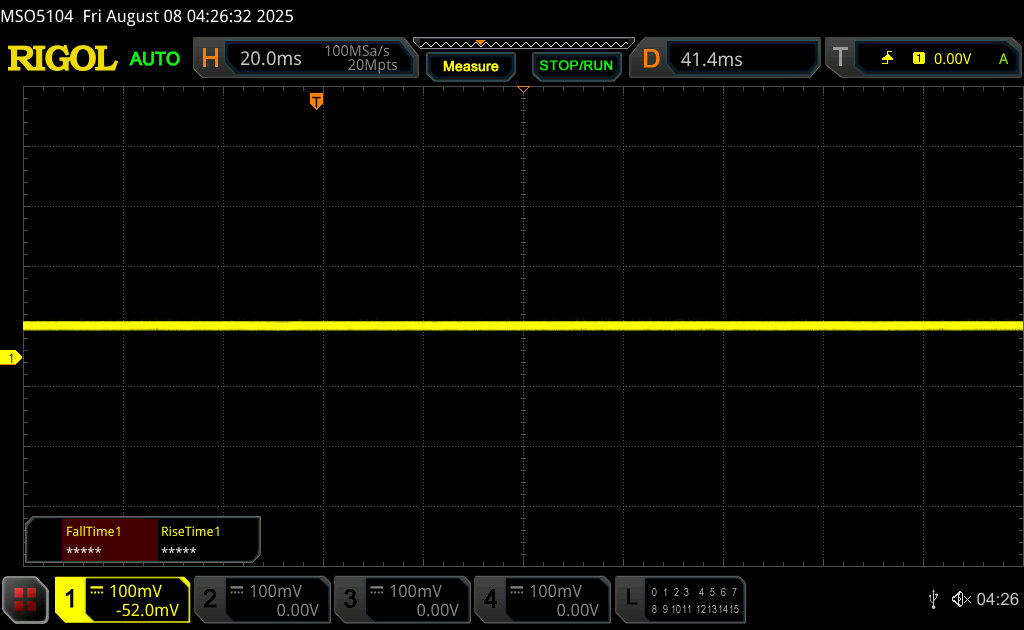 | ||
In comparison: 52 % of all tested devices do not use PWM to dim the display. If PWM was detected, an average of 7794 (minimum: 5 - maximum: 343500) Hz was measured. | |||
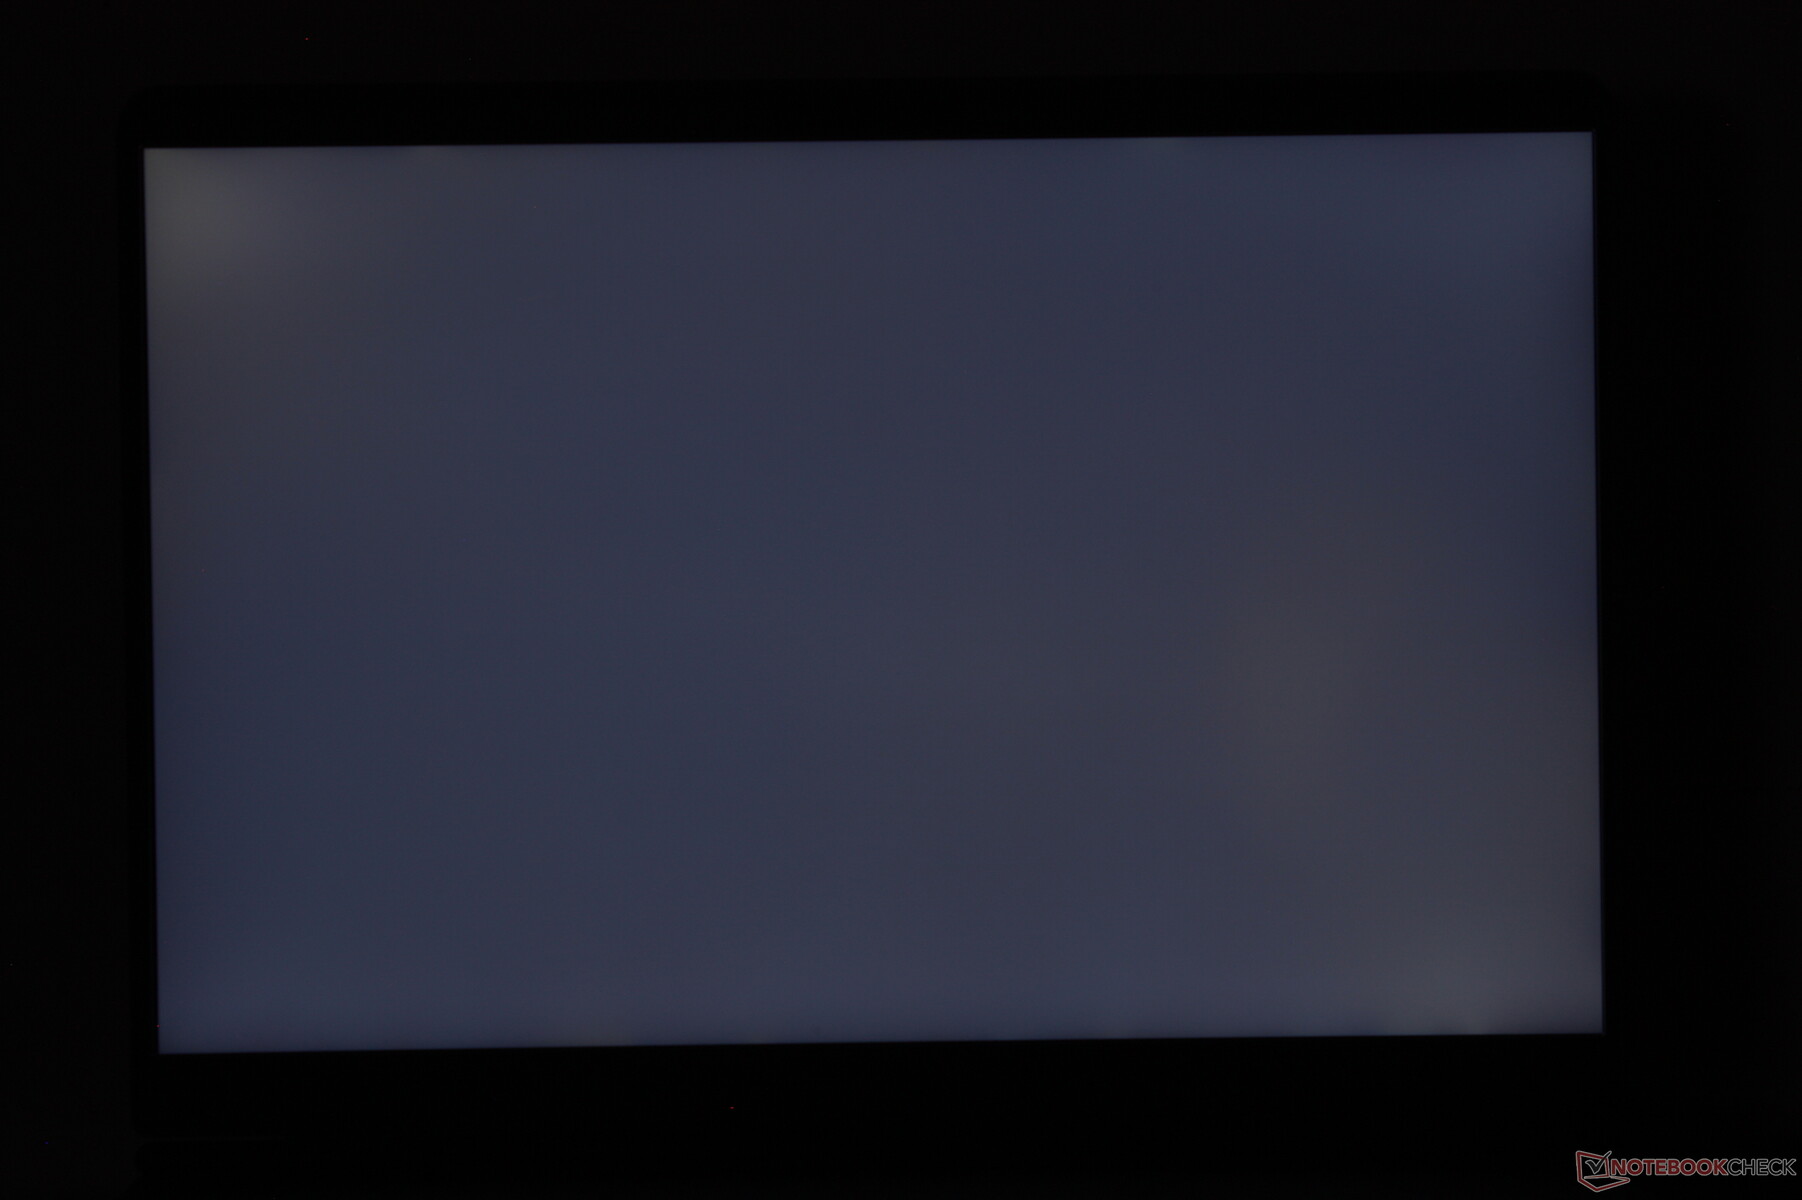
对于一款游戏笔记本电脑来说,显示屏的亮度相当高,接近 500 尼特,而华硕 TUF Gaming A16 的亮度仅为 350 尼特。如果在阴暗处工作,可视性还算不错,但如果在明亮的环境下工作,色彩就会变得暗淡。

性能
测试条件
在运行下面的基准测试之前,我们将 Windows 和 Alienware Command Center 都设置为性能模式。命令中心还提供了超速模式,可将风扇的上限调得更高,但正如我们下面的基准测试所示,该模式的性能优势微乎其微。
处理器
CPU 性能出色,但并不完美。例如,在循环运行 CineBench R15 xT 时,性能会在前几个循环后下降约 8%,这表明 Turbo Boost 的可持续性有限。此外,CPU 在满负荷运行时核心温度高达近 100 C 也是一个信号。尽管如此,整体多线程性能仍比酷睿 Ultra 7 255HX 配置快 25%,或比 Alienware m16 R2 中的旧酷睿 Ultra 7 155H 快近 2 倍。
Cinebench R15 多回路运行
Cinebench R23: Multi Core | Single Core
Cinebench R20: CPU (Multi Core) | CPU (Single Core)
Cinebench R15: CPU Multi 64Bit | CPU Single 64Bit
Blender: v2.79 BMW27 CPU
7-Zip 18.03: 7z b 4 | 7z b 4 -mmt1
Geekbench 6.7: Multi-Core | Single-Core
Geekbench 5.5: Multi-Core | Single-Core
HWBOT x265 Benchmark v2.2: 4k Preset
LibreOffice : 20 Documents To PDF
R Benchmark 2.5: Overall mean
* ... smaller is better
AIDA64: FP32 Ray-Trace | FPU Julia | CPU SHA3 | CPU Queen | FPU SinJulia | FPU Mandel | CPU AES | CPU ZLib | FP64 Ray-Trace | CPU PhotoWorxx
| Performance rating | |
| Lenovo Legion 5 Pro 16IAX10H | |
| Average Intel Core Ultra 9 275HX | |
| Alienware 16 Area-51 | |
| Alienware 16X Aurora, RTX 5070 | |
| Asus TUF Gaming A16 FA608WV | |
| MSI Vector 16 HX AI A2XWHG | |
| Gigabyte Gaming A16 GA6H | |
| AIDA64 / FP32 Ray-Trace | |
| Asus TUF Gaming A16 FA608WV | |
| Average Intel Core Ultra 9 275HX (28039 - 39895, n=30) | |
| Lenovo Legion 5 Pro 16IAX10H | |
| Alienware 16 Area-51 | |
| Alienware 16X Aurora, RTX 5070 | |
| MSI Vector 16 HX AI A2XWHG | |
| Gigabyte Gaming A16 GA6H | |
| AIDA64 / FPU Julia | |
| Lenovo Legion 5 Pro 16IAX10H | |
| Average Intel Core Ultra 9 275HX (140254 - 200744, n=30) | |
| Alienware 16 Area-51 | |
| Alienware 16X Aurora, RTX 5070 | |
| Asus TUF Gaming A16 FA608WV | |
| MSI Vector 16 HX AI A2XWHG | |
| Gigabyte Gaming A16 GA6H | |
| AIDA64 / CPU SHA3 | |
| Average Intel Core Ultra 9 275HX (6710 - 9817, n=30) | |
| Lenovo Legion 5 Pro 16IAX10H | |
| Alienware 16 Area-51 | |
| Alienware 16X Aurora, RTX 5070 | |
| MSI Vector 16 HX AI A2XWHG | |
| Asus TUF Gaming A16 FA608WV | |
| Gigabyte Gaming A16 GA6H | |
| AIDA64 / CPU Queen | |
| Lenovo Legion 5 Pro 16IAX10H | |
| Alienware 16X Aurora, RTX 5070 | |
| Average Intel Core Ultra 9 275HX (113887 - 140937, n=30) | |
| Alienware 16 Area-51 | |
| MSI Vector 16 HX AI A2XWHG | |
| Asus TUF Gaming A16 FA608WV | |
| Gigabyte Gaming A16 GA6H | |
| AIDA64 / FPU SinJulia | |
| Asus TUF Gaming A16 FA608WV | |
| Lenovo Legion 5 Pro 16IAX10H | |
| Alienware 16 Area-51 | |
| Alienware 16X Aurora, RTX 5070 | |
| Average Intel Core Ultra 9 275HX (11172 - 14425, n=30) | |
| MSI Vector 16 HX AI A2XWHG | |
| Gigabyte Gaming A16 GA6H | |
| AIDA64 / FPU Mandel | |
| Average Intel Core Ultra 9 275HX (72596 - 104508, n=30) | |
| Lenovo Legion 5 Pro 16IAX10H | |
| Alienware 16 Area-51 | |
| Alienware 16X Aurora, RTX 5070 | |
| Asus TUF Gaming A16 FA608WV | |
| MSI Vector 16 HX AI A2XWHG | |
| Gigabyte Gaming A16 GA6H | |
| AIDA64 / CPU AES | |
| Lenovo Legion 5 Pro 16IAX10H | |
| Average Intel Core Ultra 9 275HX (105608 - 247074, n=30) | |
| Alienware 16 Area-51 | |
| Alienware 16X Aurora, RTX 5070 | |
| MSI Vector 16 HX AI A2XWHG | |
| Asus TUF Gaming A16 FA608WV | |
| Gigabyte Gaming A16 GA6H | |
| AIDA64 / CPU ZLib | |
| Lenovo Legion 5 Pro 16IAX10H | |
| Average Intel Core Ultra 9 275HX (1582 - 2263, n=30) | |
| Alienware 16 Area-51 | |
| Alienware 16X Aurora, RTX 5070 | |
| Asus TUF Gaming A16 FA608WV | |
| MSI Vector 16 HX AI A2XWHG | |
| Gigabyte Gaming A16 GA6H | |
| AIDA64 / FP64 Ray-Trace | |
| Asus TUF Gaming A16 FA608WV | |
| Average Intel Core Ultra 9 275HX (14847 - 21854, n=30) | |
| Lenovo Legion 5 Pro 16IAX10H | |
| Alienware 16 Area-51 | |
| Alienware 16X Aurora, RTX 5070 | |
| MSI Vector 16 HX AI A2XWHG | |
| Gigabyte Gaming A16 GA6H | |
| AIDA64 / CPU PhotoWorxx | |
| Alienware 16 Area-51 | |
| Average Intel Core Ultra 9 275HX (37482 - 62916, n=30) | |
| Lenovo Legion 5 Pro 16IAX10H | |
| Alienware 16X Aurora, RTX 5070 | |
| MSI Vector 16 HX AI A2XWHG | |
| Asus TUF Gaming A16 FA608WV | |
| Gigabyte Gaming A16 GA6H | |
压力测试
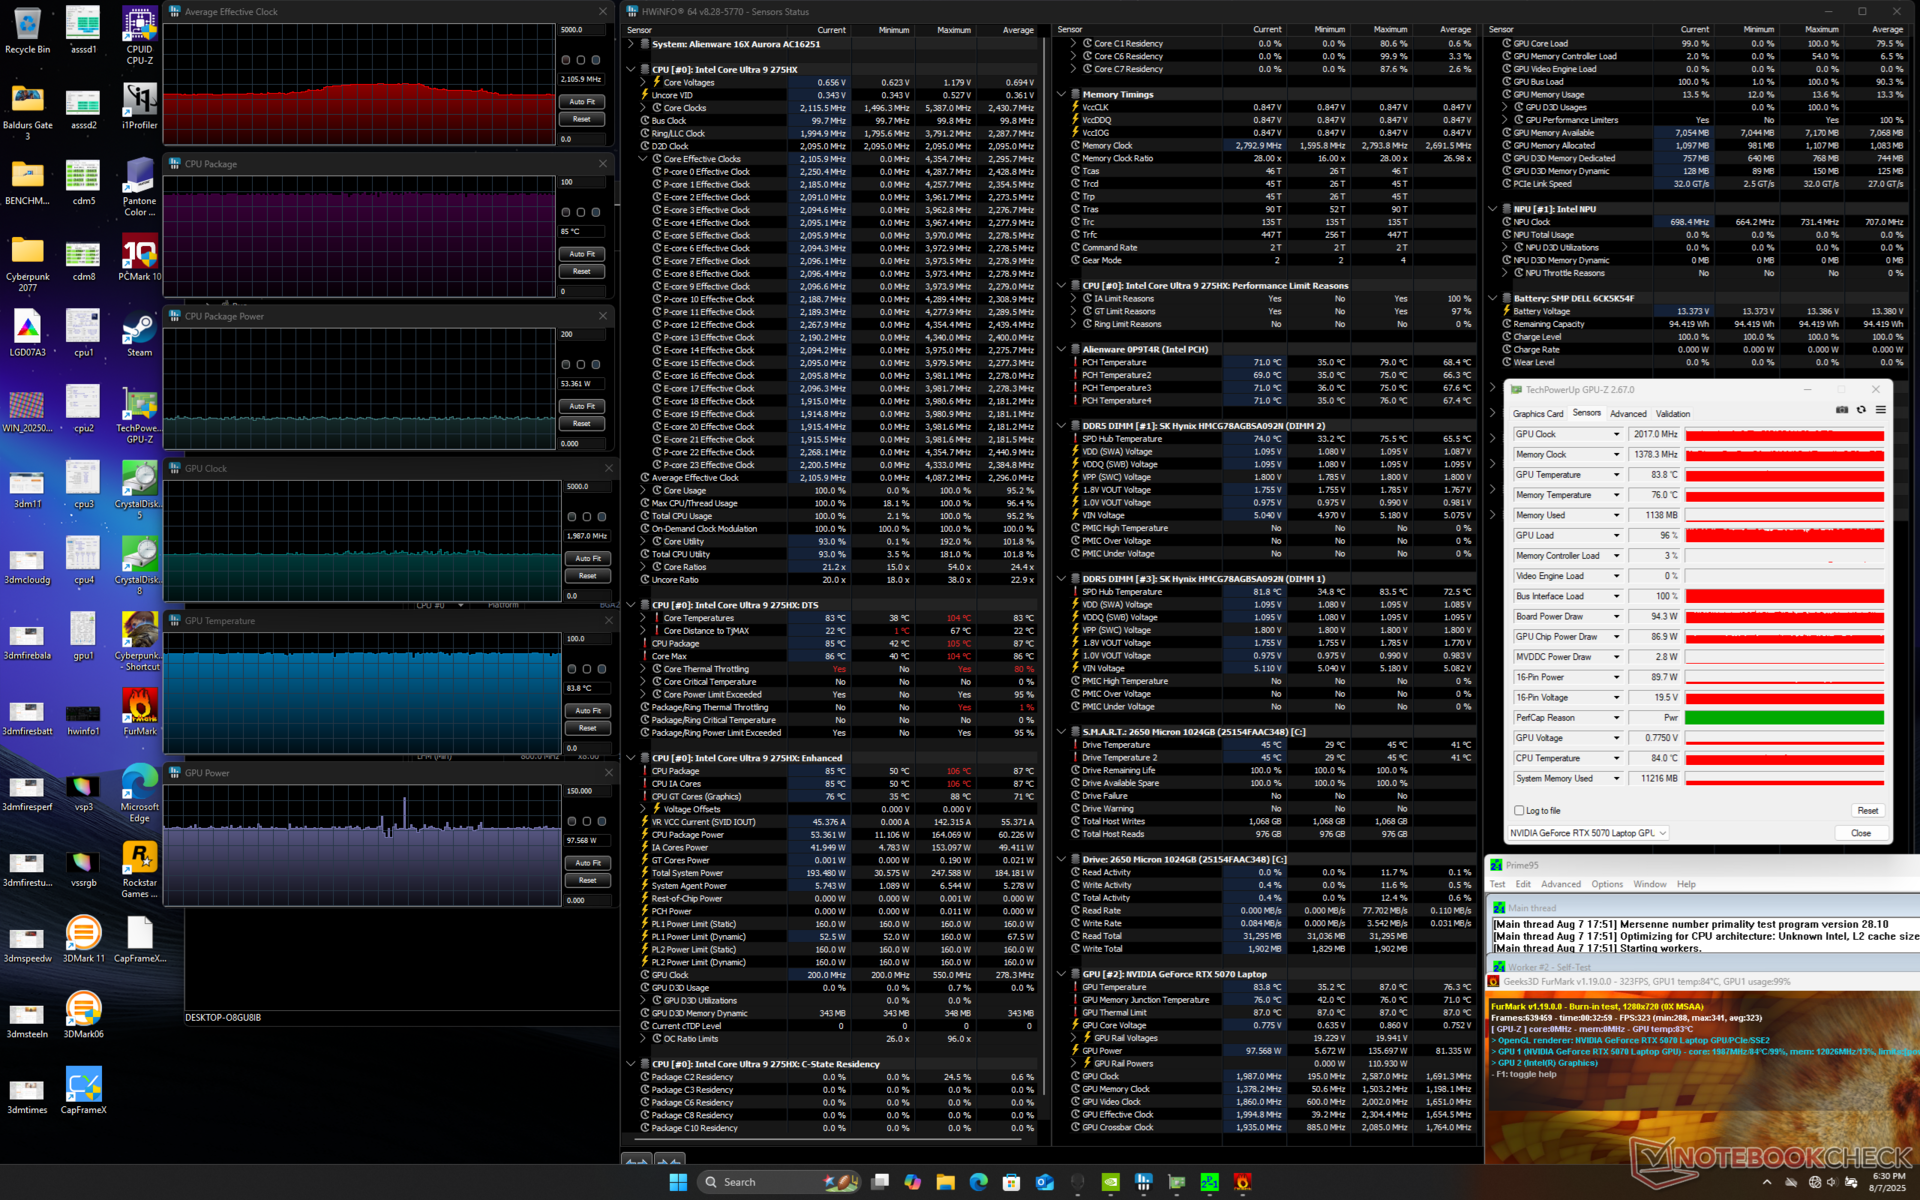
在运行 Prime95 压力模式时,CPU 的主频会升至 4.1 GHz、165 W 和 102 C,然后很快稳定在 3.4 GHz、102 W 和 99 C。即使在超频模式下运行,核心温度也会非常高,而与其他游戏笔记本电脑相比,如 Razer Blade 16,在类似条件下核心温度会稳定在较低的 80 C。Aurora 16X 显然尽可能优先考虑 CPU 性能,即使这意味着要在更高的核心温度下运行。
在平衡、性能和超频模式下运行《赛博朋克 2077》时,GPU 板功耗分别稳定在 94 W、111 W 和 114 W。如下面的表格和截图所示,GPU 时钟频率在每个性能设置之间会逐渐升高,但请注意,GPU 温度实际上变化不大,因为风扇噪音会变大,以补偿更快的时钟频率。游戏时,CPU 和 GPU 的温度会稳定在 80 摄氏度左右,这是大多数游戏笔记本电脑的典型温度。
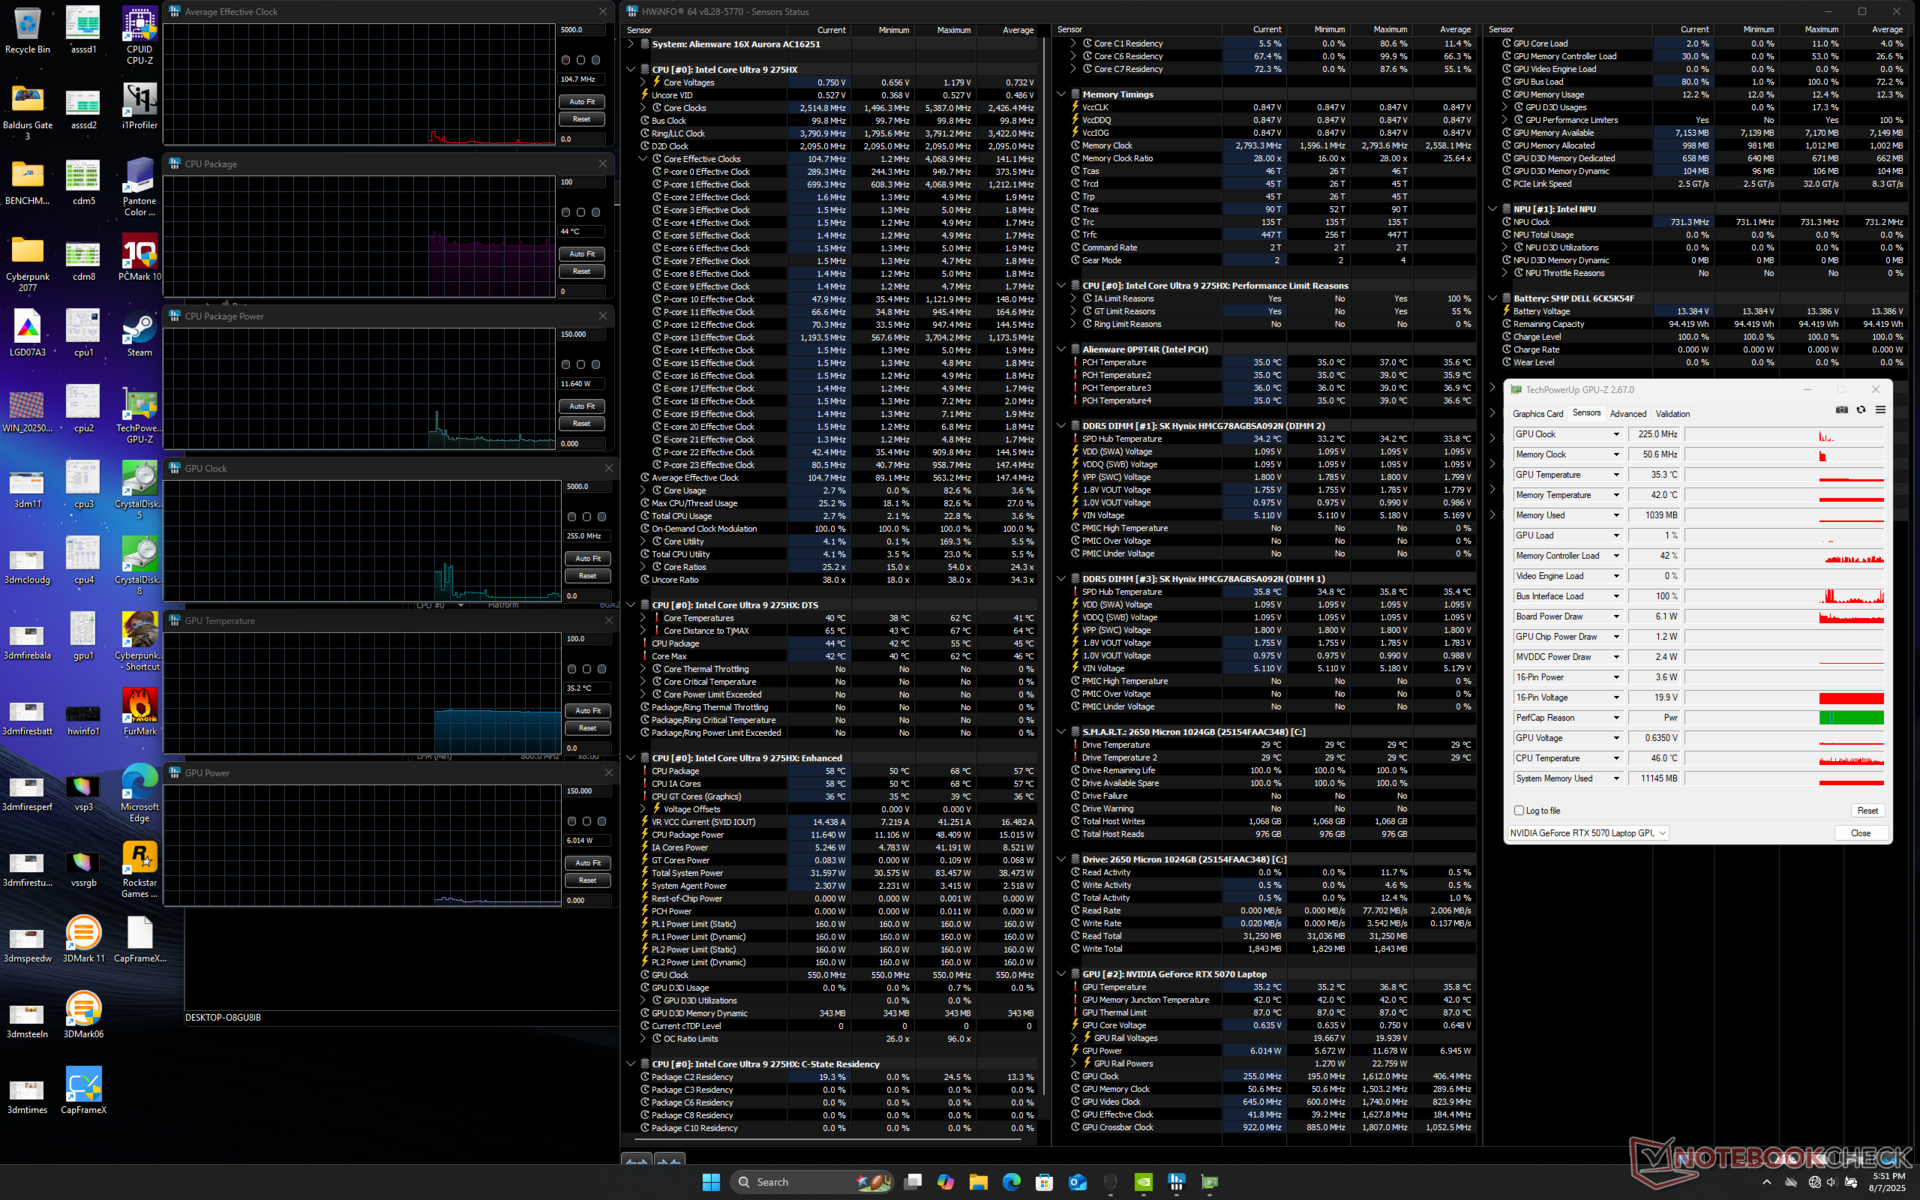
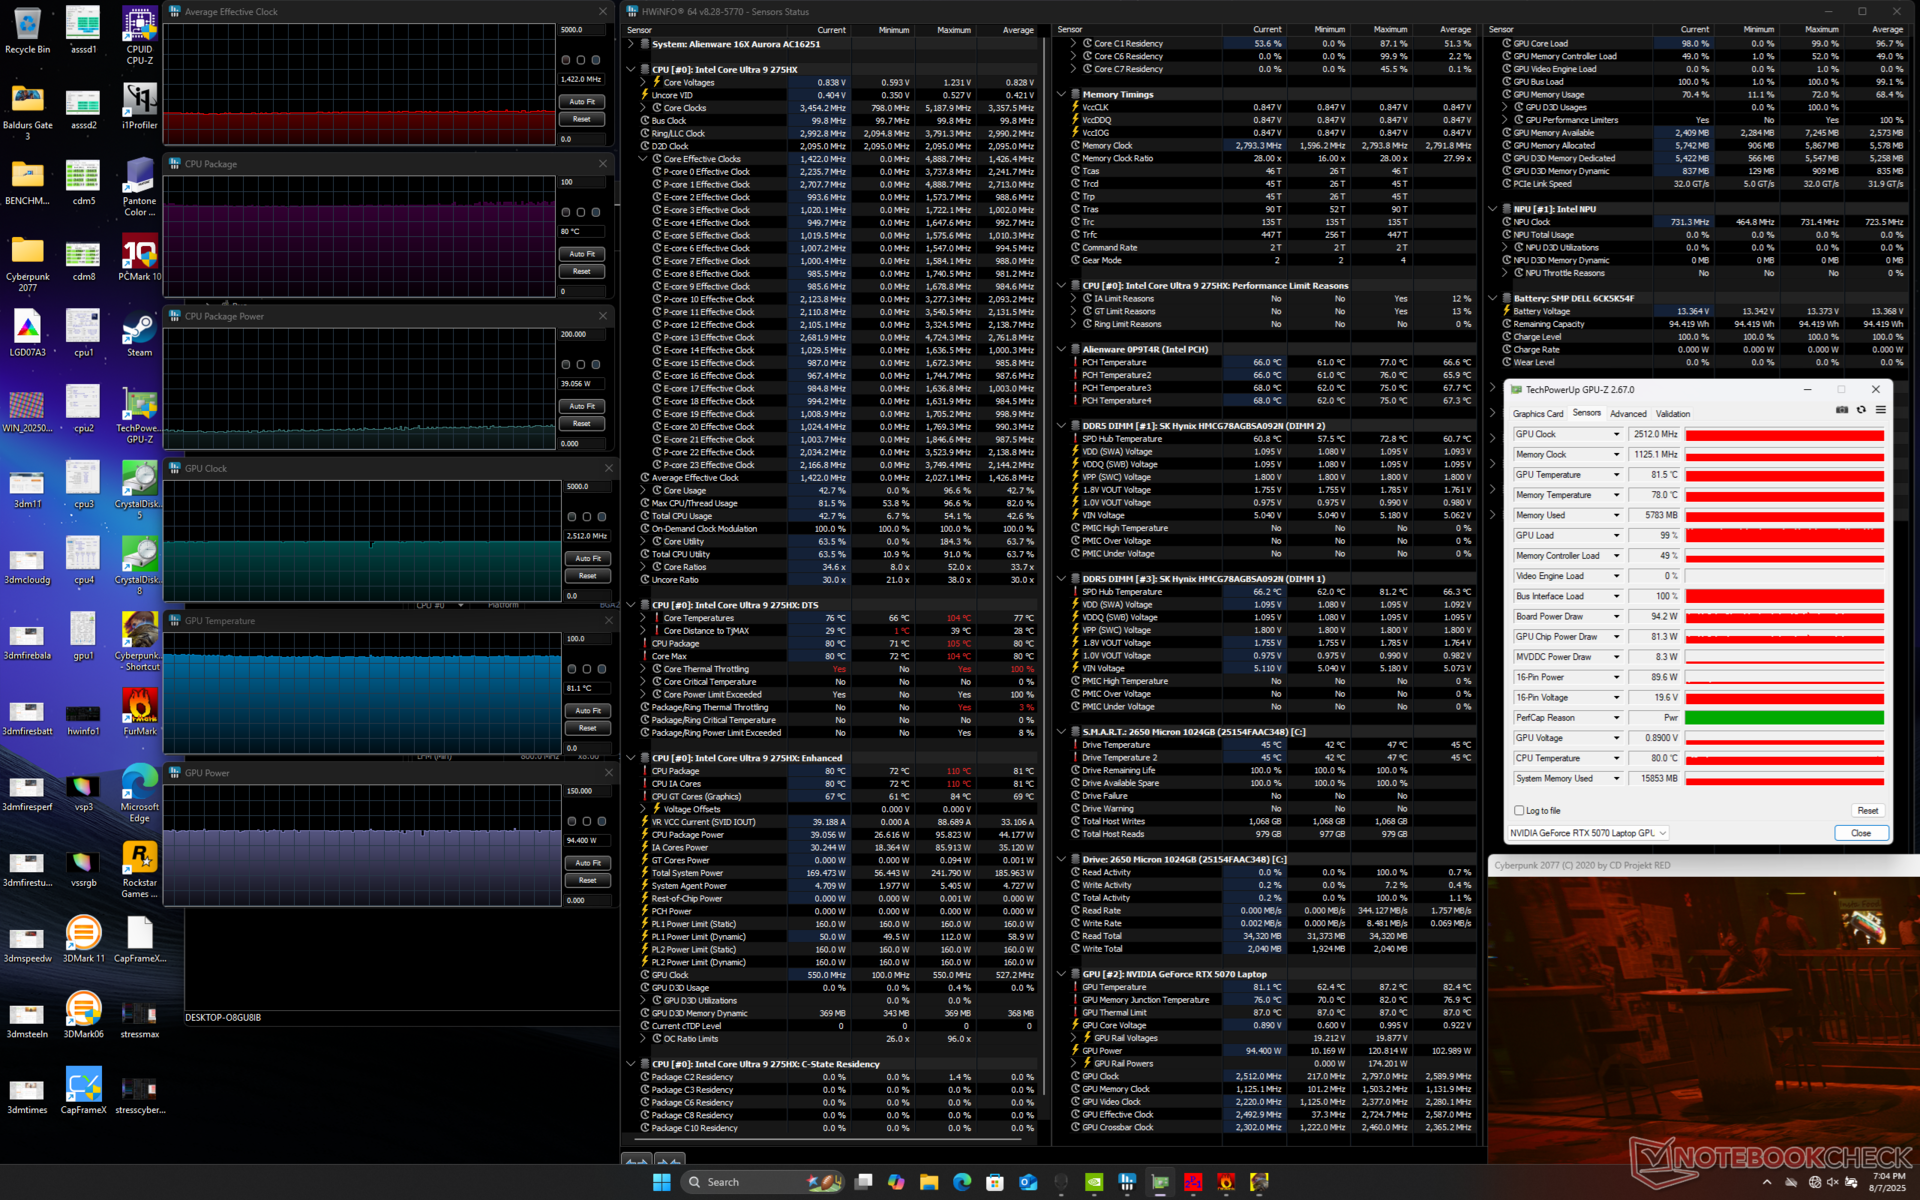

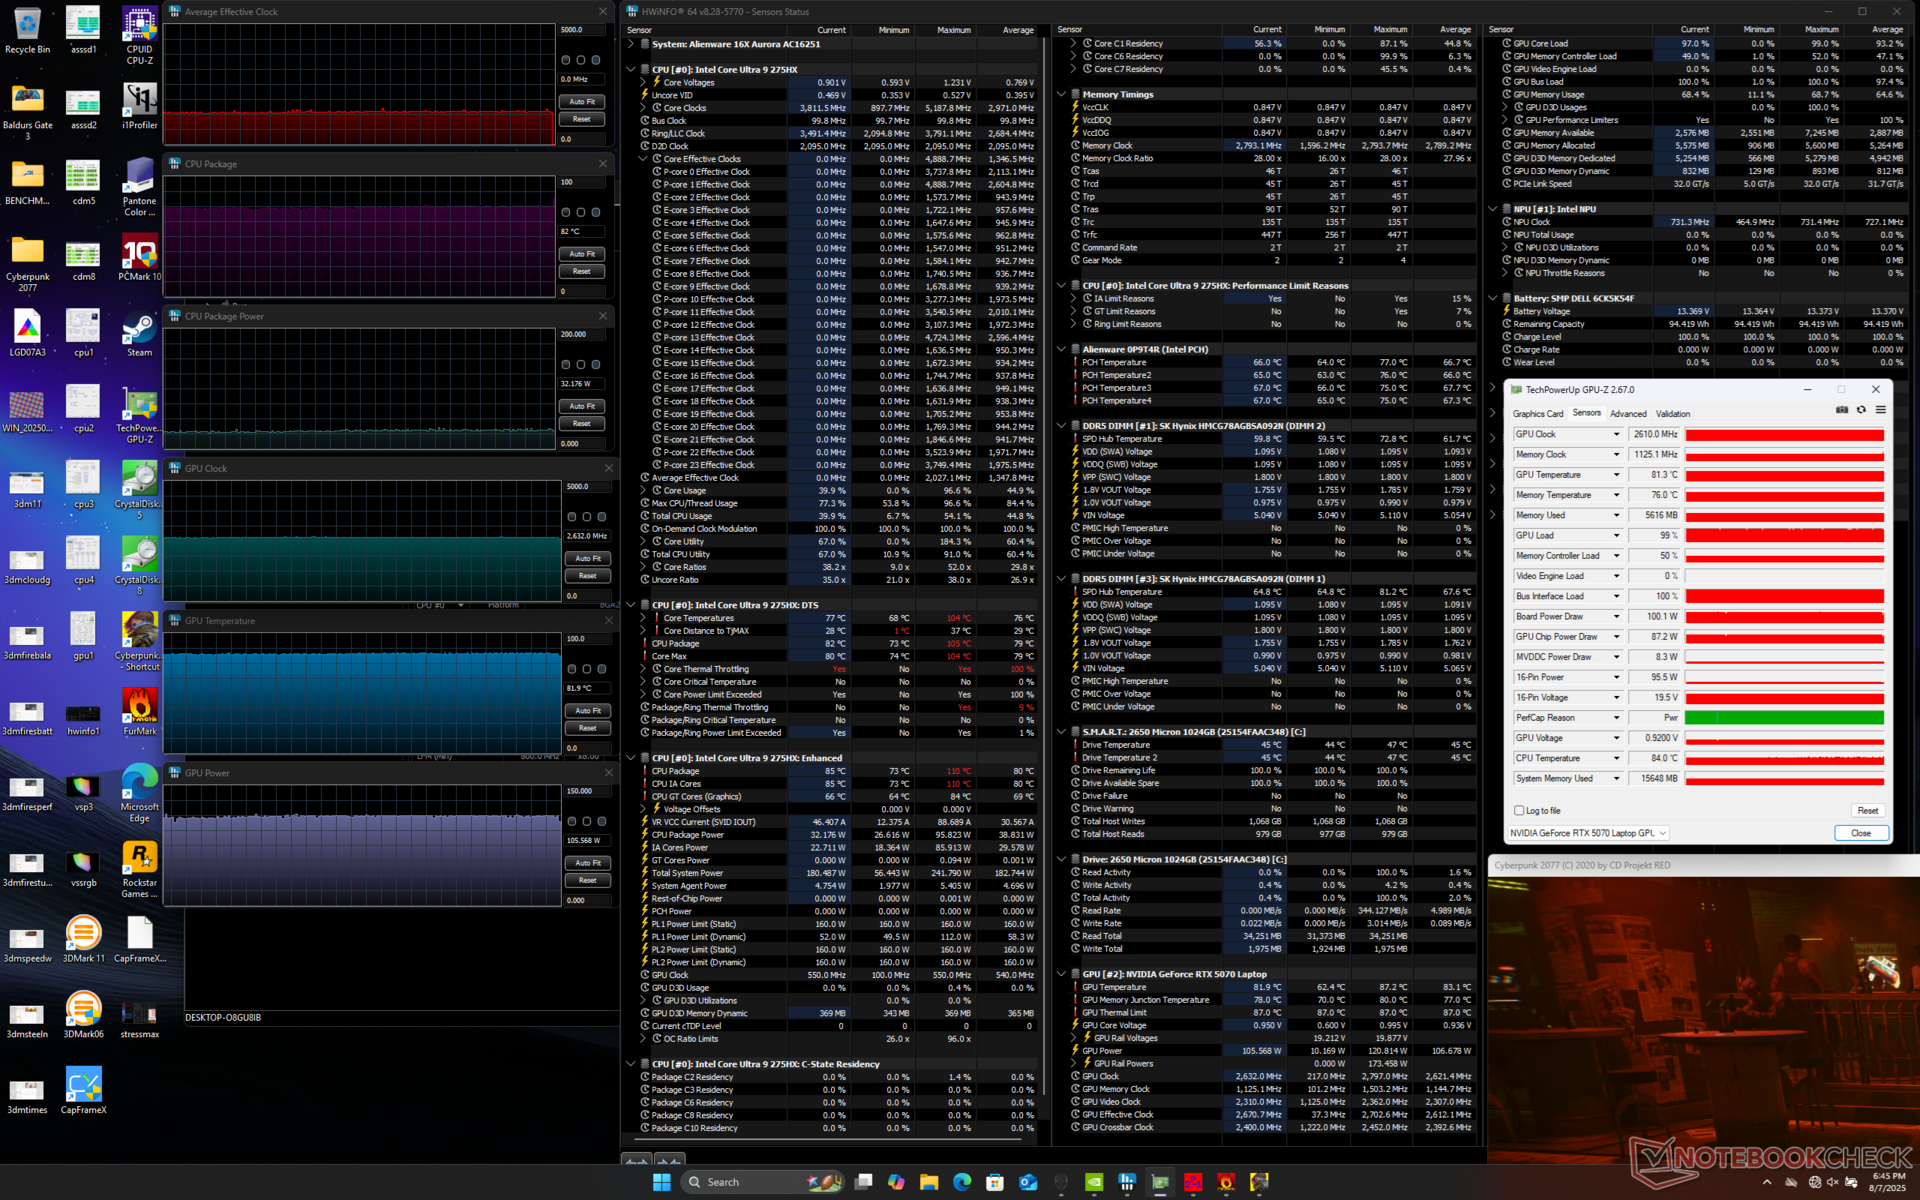
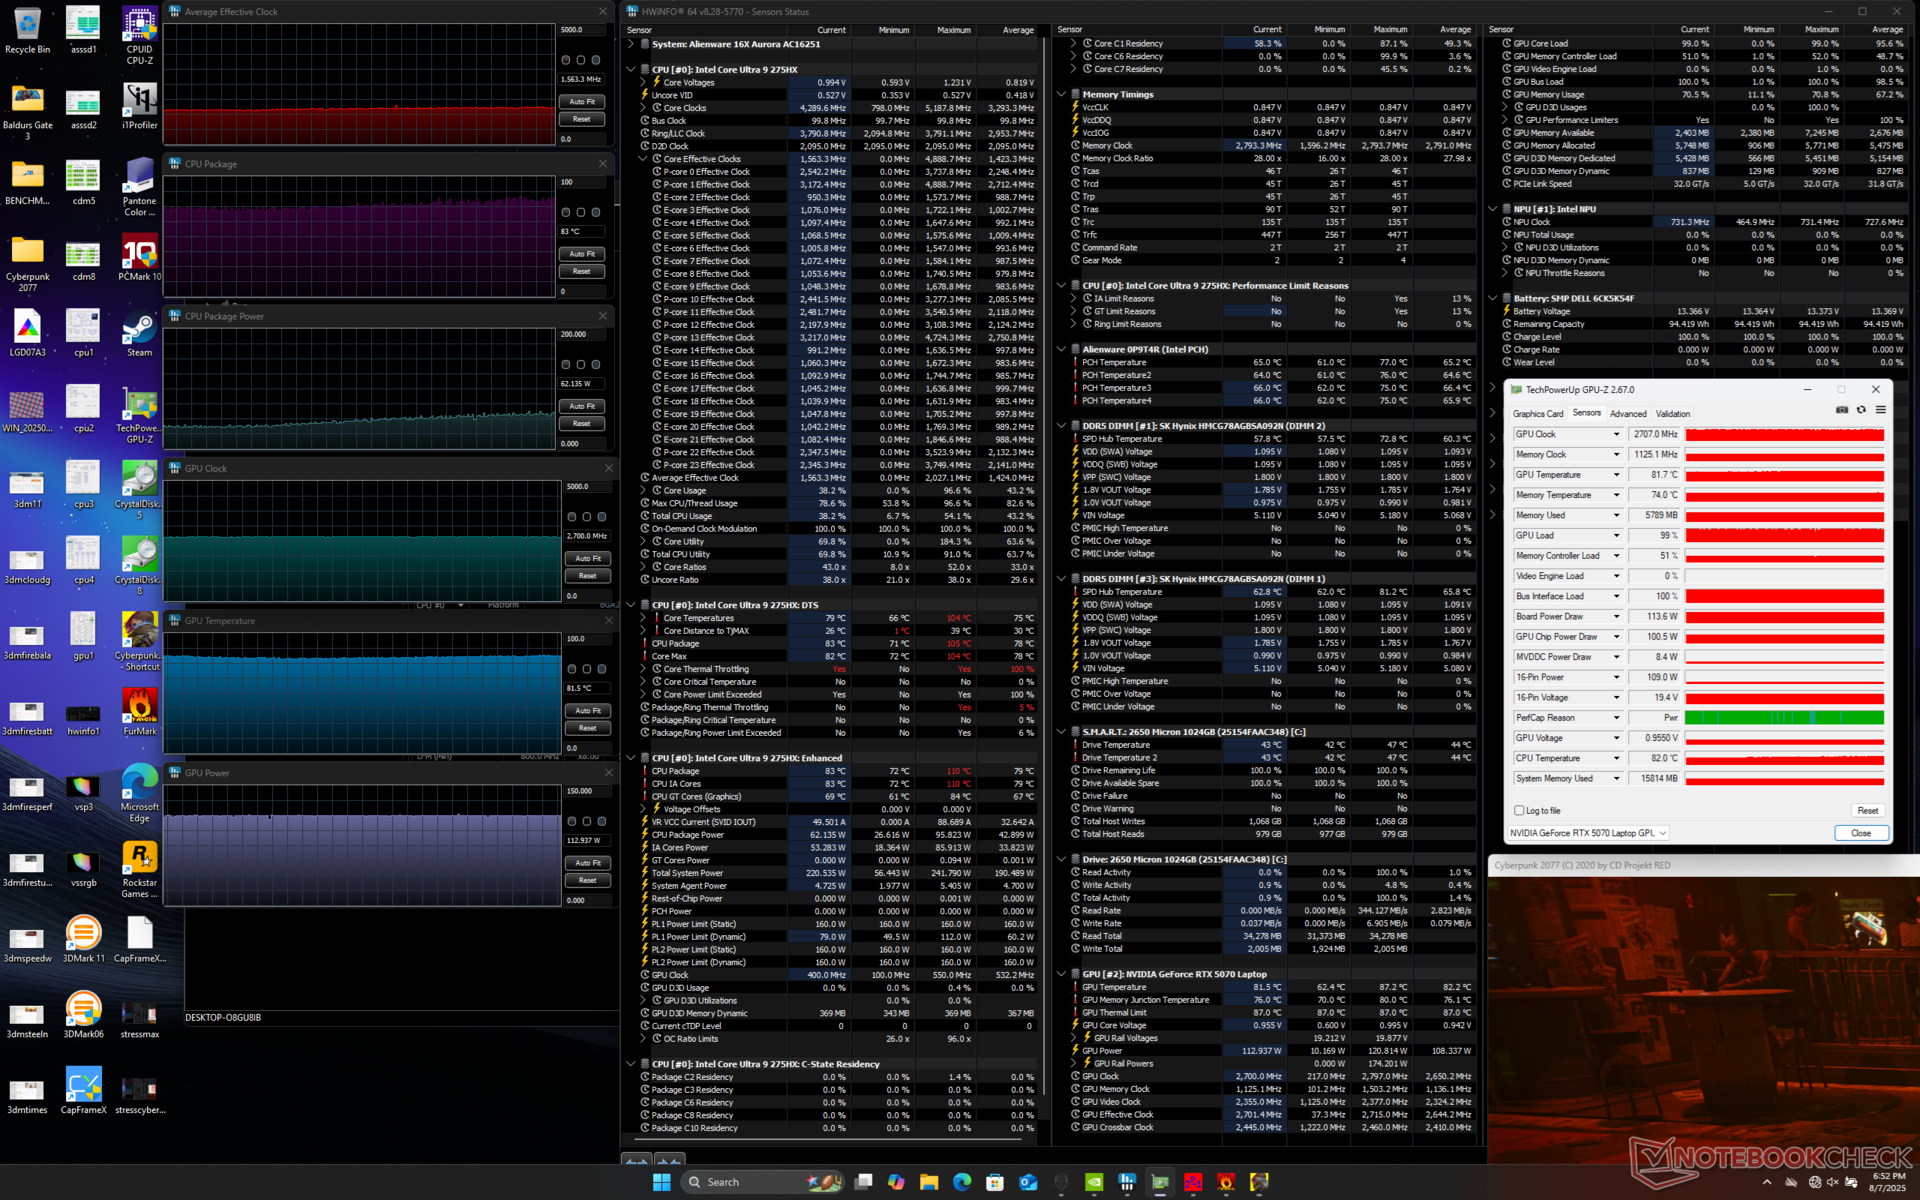
| 平均 CPU 时钟 (GHz) | GPU 时钟 (MHz) | 平均 CPU 温度 (°C) | 平均 GPU 温度 (°C) | |
| 系统闲置 | -- | -- | 44 | 35 |
| Prime95 压力 | 3.3 | -- | 99 | 52 |
| Prime95 + FurMark Stress | 2.1 | 2017 | 85 | 84 |
| 赛博朋克 2077》压力(平衡模式) | 1.4 | 2512 | 80 | 81 |
| 赛博朋克2077压力(性能模式) | 1.4 | 2610 | 82 | 82 |
| 赛博朋克2077压力(超速模式) | 1.6 | 2707 | 83 | 82 |
系统性能
即使重新安装并多次重试,PCMark 10 也会因 OpenCL 错误而不断崩溃。因此,这里不提供其结果。CrossMark 和 AIDA 的结果与我们的预期相符,与 Alienware 16 Area-51 非常接近。
| AIDA64 / Memory Copy | |
| Asus TUF Gaming A16 FA608WV | |
| Alienware 16 Area-51 | |
| Average Intel Core Ultra 9 275HX (56003 - 94460, n=30) | |
| Lenovo Legion 5 Pro 16IAX10H | |
| Alienware 16X Aurora, RTX 5070 | |
| MSI Vector 16 HX AI A2XWHG | |
| Gigabyte Gaming A16 GA6H | |
| AIDA64 / Memory Read | |
| Asus TUF Gaming A16 FA608WV | |
| Alienware 16 Area-51 | |
| Lenovo Legion 5 Pro 16IAX10H | |
| Alienware 16X Aurora, RTX 5070 | |
| Average Intel Core Ultra 9 275HX (55795 - 97151, n=30) | |
| MSI Vector 16 HX AI A2XWHG | |
| Gigabyte Gaming A16 GA6H | |
| AIDA64 / Memory Write | |
| Asus TUF Gaming A16 FA608WV | |
| Alienware 16 Area-51 | |
| Average Intel Core Ultra 9 275HX (55663 - 116129, n=30) | |
| Alienware 16X Aurora, RTX 5070 | |
| Lenovo Legion 5 Pro 16IAX10H | |
| MSI Vector 16 HX AI A2XWHG | |
| Gigabyte Gaming A16 GA6H | |
| AIDA64 / Memory Latency | |
| Alienware 16 Area-51 | |
| Average Intel Core Ultra 9 275HX (105.8 - 161.6, n=30) | |
| Alienware 16X Aurora, RTX 5070 | |
| Asus TUF Gaming A16 FA608WV | |
| Lenovo Legion 5 Pro 16IAX10H | |
| MSI Vector 16 HX AI A2XWHG | |
| Gigabyte Gaming A16 GA6H | |
* ... smaller is better
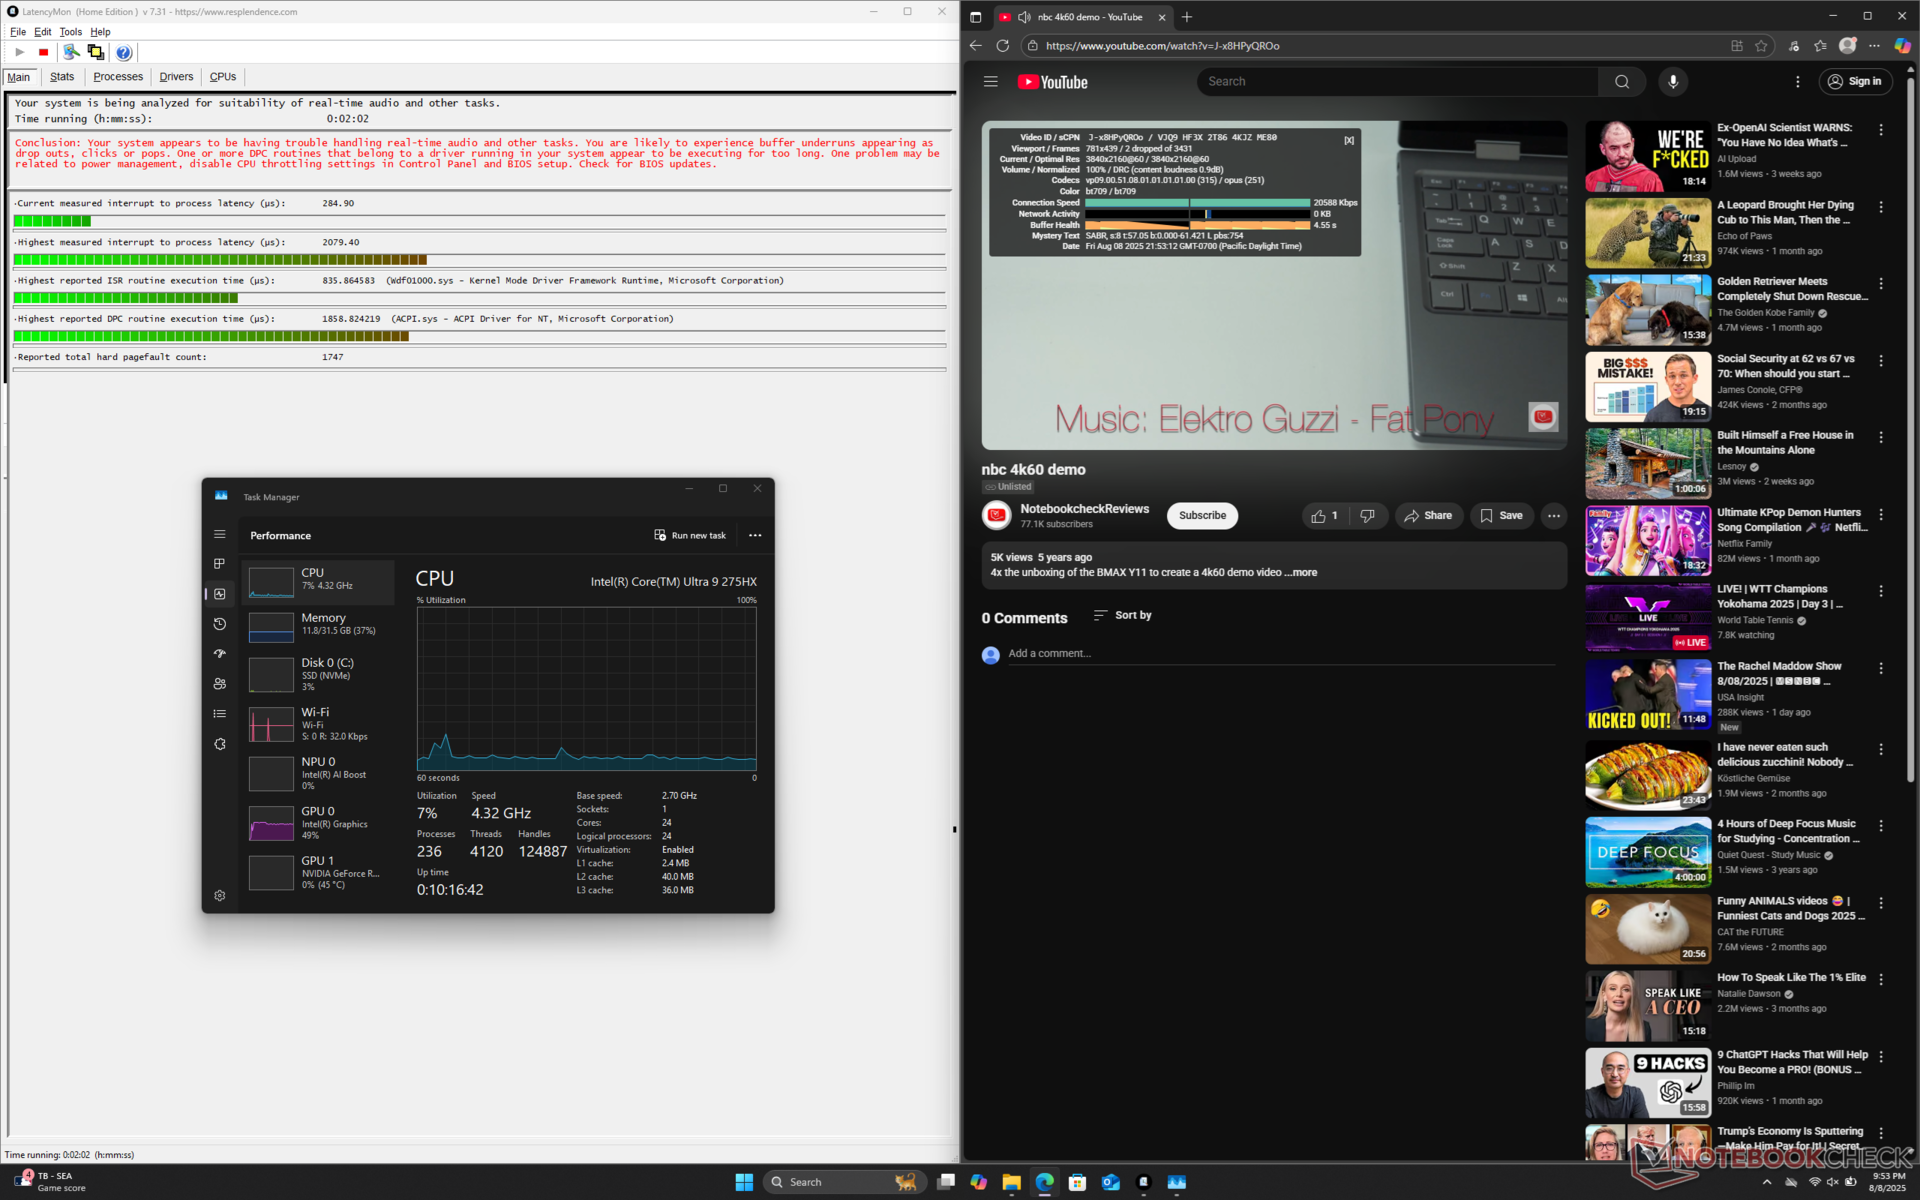
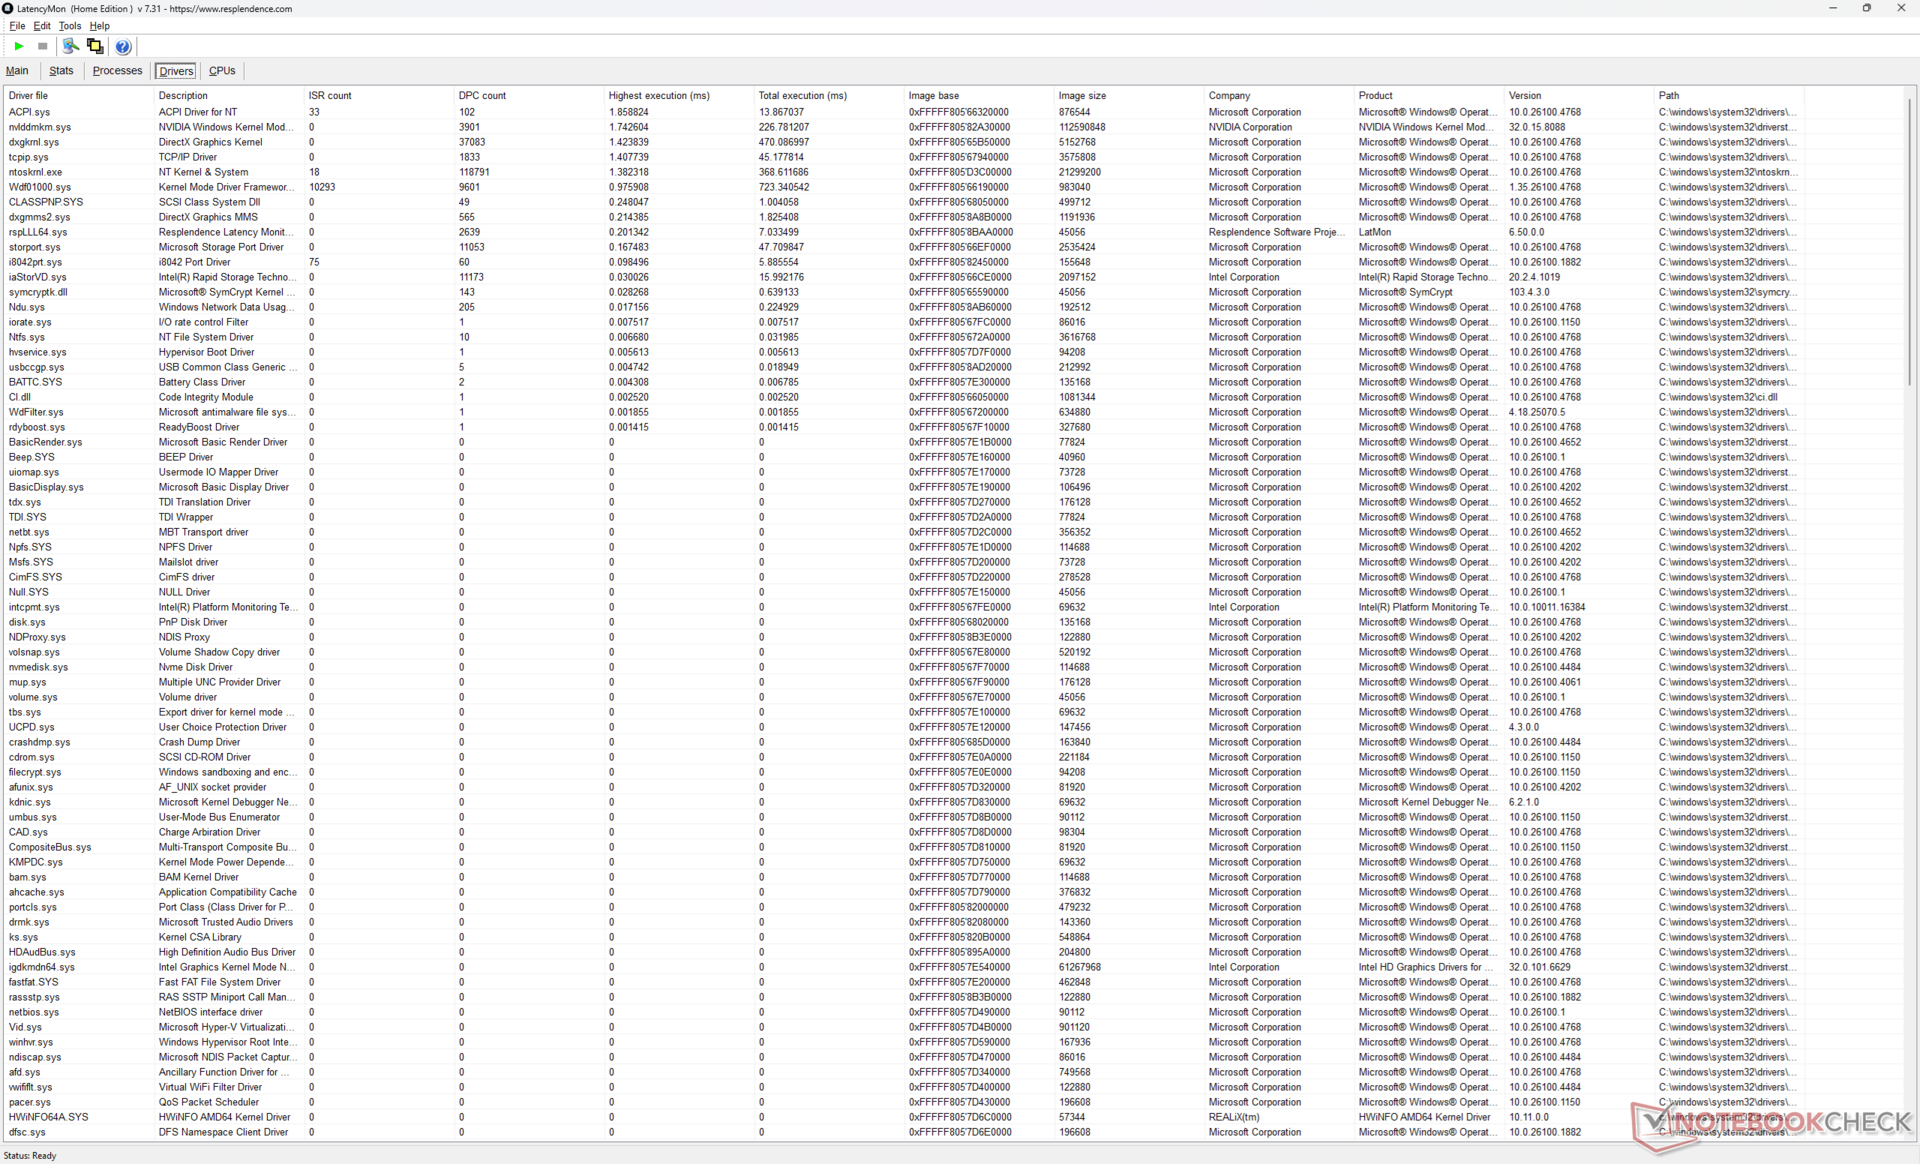
DPC 延迟
LatencyMon 仅在打开主页的多个标签页时显示了轻微的 DPC 问题,在播放 60 秒的 4K60 视频时显示了 2 次丢帧。
| DPC Latencies / LatencyMon - interrupt to process latency (max), Web, Youtube, Prime95 | |
| MSI Vector 16 HX AI A2XWHG | |
| Gigabyte Gaming A16 GA6H | |
| Alienware 16 Area-51 | |
| Alienware 16X Aurora, RTX 5070 | |
| Asus TUF Gaming A16 FA608WV | |
| Lenovo Legion 5 Pro 16IAX10H | |
* ... smaller is better
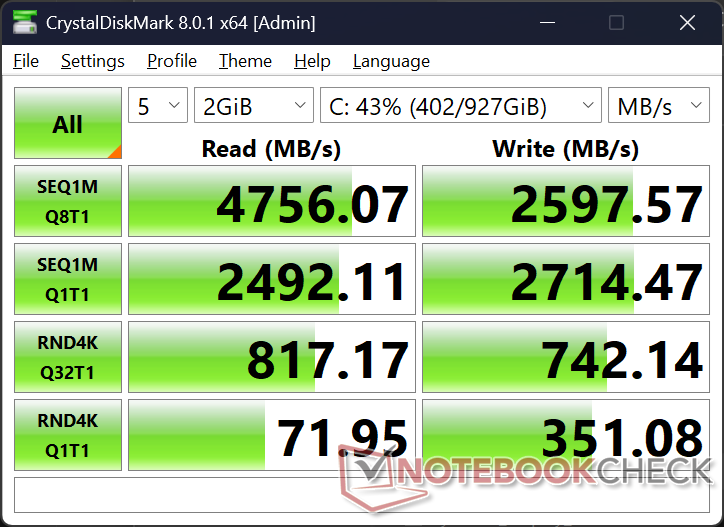
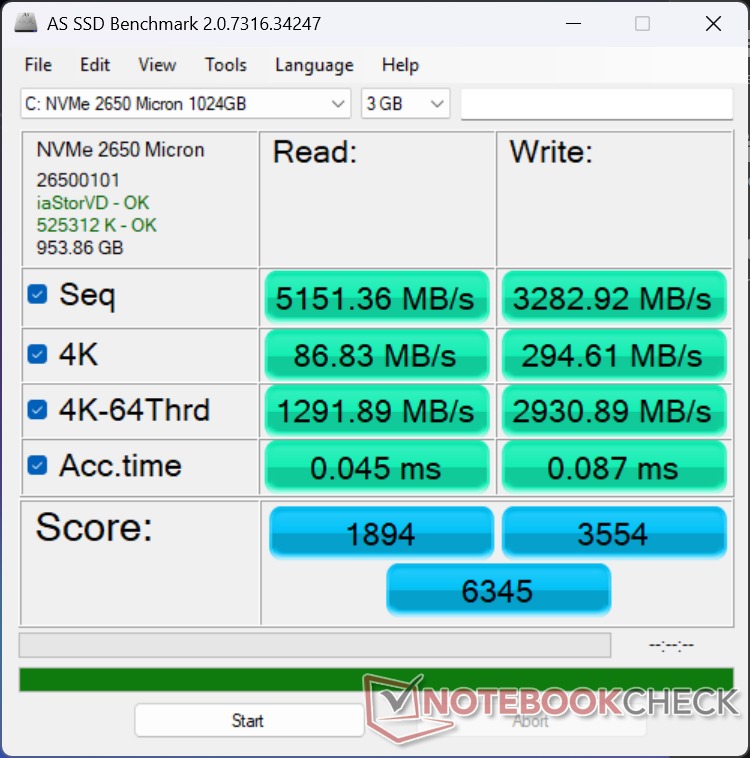
存储设备
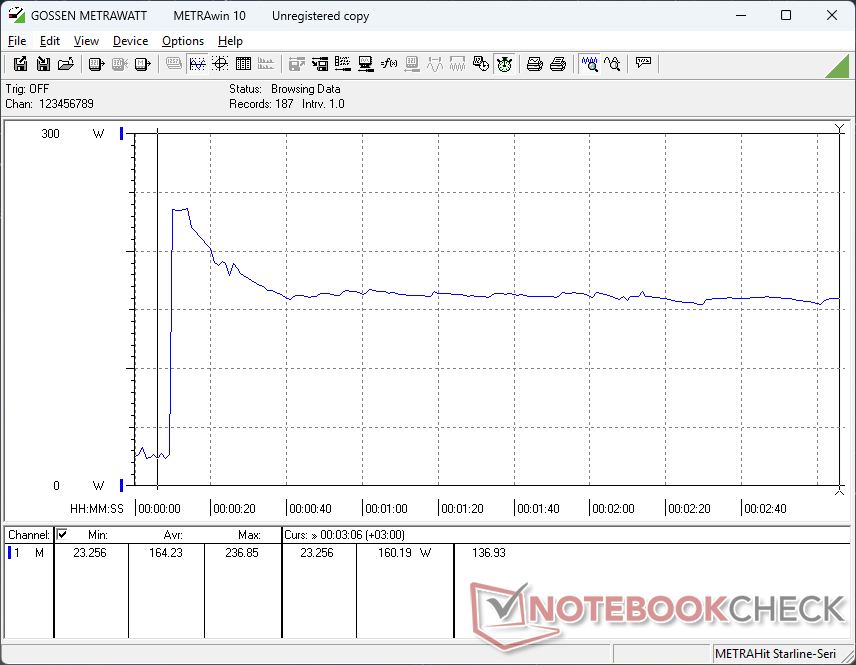
美光 美光 2650我们设备中的 PCIe4 x4 NVMe 固态硬盘的读取速率高达 7000 MB/s,在 DiskSpd 循环压力测试中,一分钟左右就会出现节流。如下图所示,传输速率最低降至 3000 MB/s,而 Alienware Area-51 中的三星 PM9C1a 在类似测试条件下的传输速率稳定在 6200 MB/s。不过,在游戏场景下,极光 16X 的固态硬盘延迟节流对用户体验的影响应该很小,甚至没有影响。

| Drive Performance rating - Percent | |
| Alienware 16 Area-51 | |
| Alienware 16X Aurora, RTX 5070 | |
| Lenovo Legion 5 Pro 16IAX10H | |
| Gigabyte Gaming A16 GA6H | |
| MSI Vector 16 HX AI A2XWHG | |
| Asus TUF Gaming A16 FA608WV | |
* ... smaller is better
磁盘节流DiskSpd 读取循环,队列深度 8
图形处理器性能
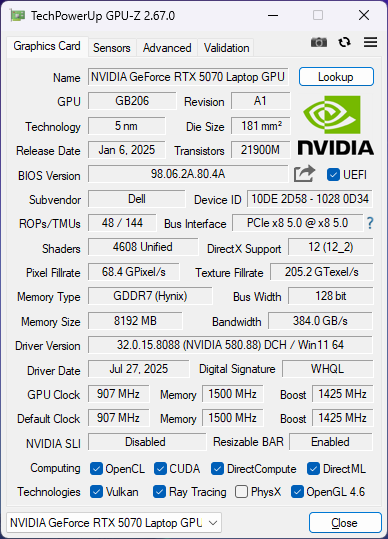
移动 移动 RTX 5070比 移动 RTX 4070快约 10%。除此之外,它还具有其他辅助优势,包括支持 MFG 和 4:2:2 色深编码/解码,这些都是以前无法实现的。
请记住,移动 RTX 5070 的速度明显慢于台式机的台式机 RTX 5070慢了约 35% 至 40%,VRAM 也少得多。降级到 移动 RTX 5060配置预计会影响约 10% 的性能。
| 电源配置文件 | 图形得分 | 物理得分 | 综合得分 |
| 超速模式 | 36334 | 51210 | 12767 |
| 性能模式 | 35646 (-2%) | 50983 (-0%) | 13658 (-0%) |
| 平衡模式 | 33459 (-8%) | 50799 (-1%) | 12594 (-1%) |
| 电池电量 | 26776 (-26%) | 29665 (-42%) | 9154 (-28%) |
如Fire Strike 上表所示,超频模式和性能模式之间没有明显的性能差异。同时,对于喜欢在更安静的 "平衡 "电源配置文件下进行游戏的用户来说,图形性能将下降约 8%。
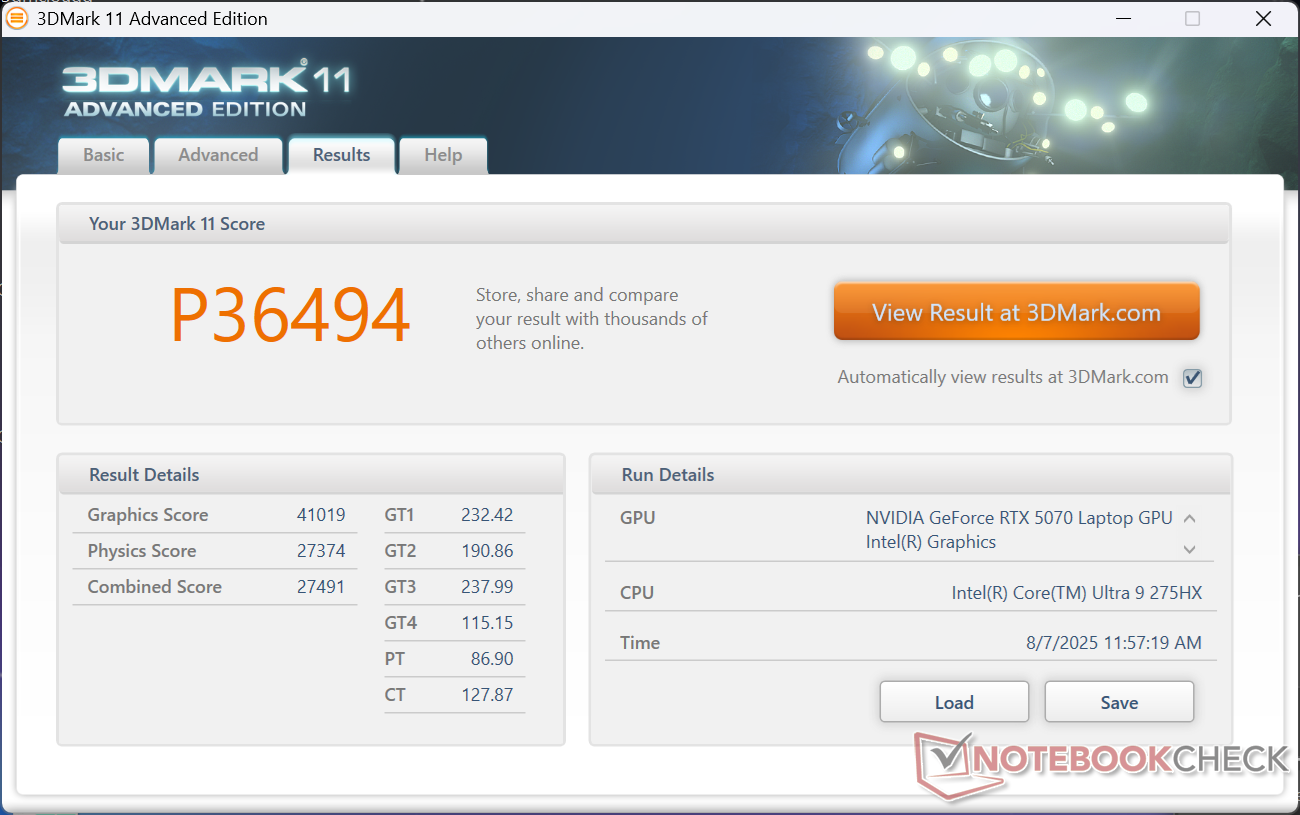
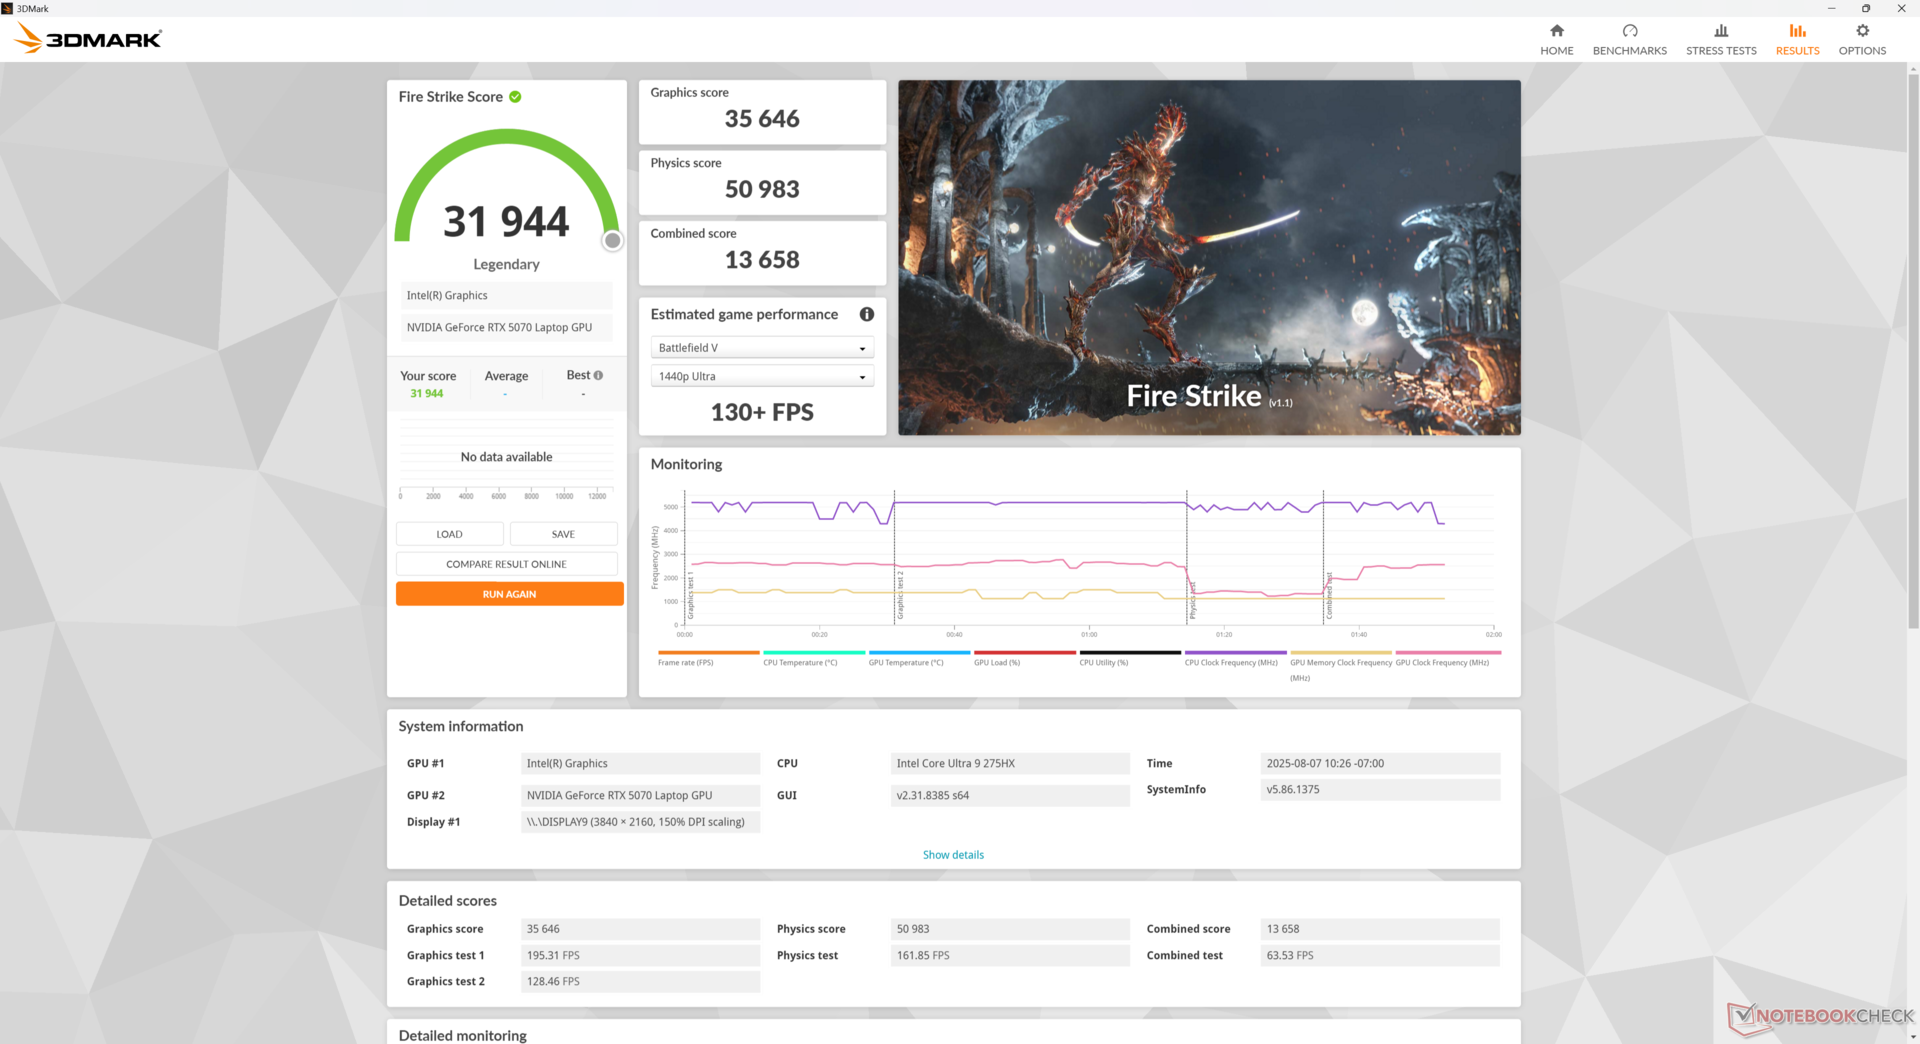
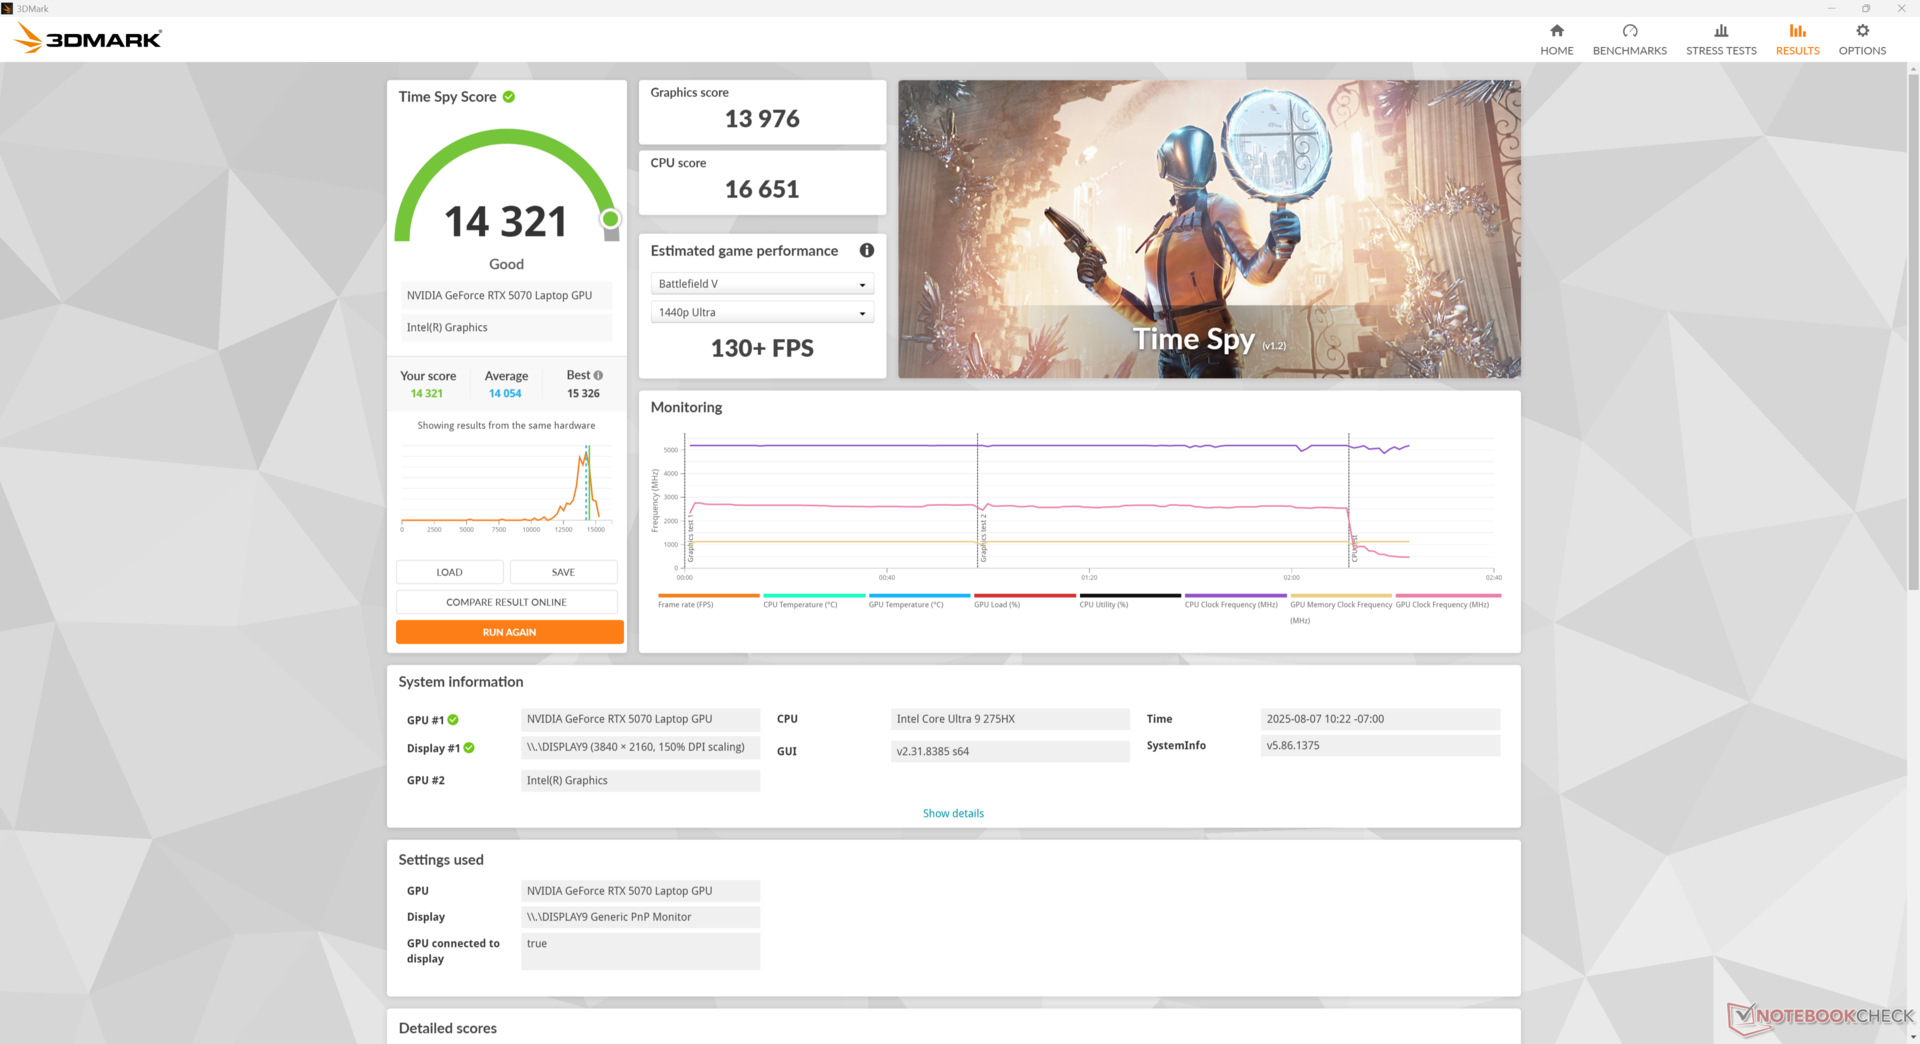
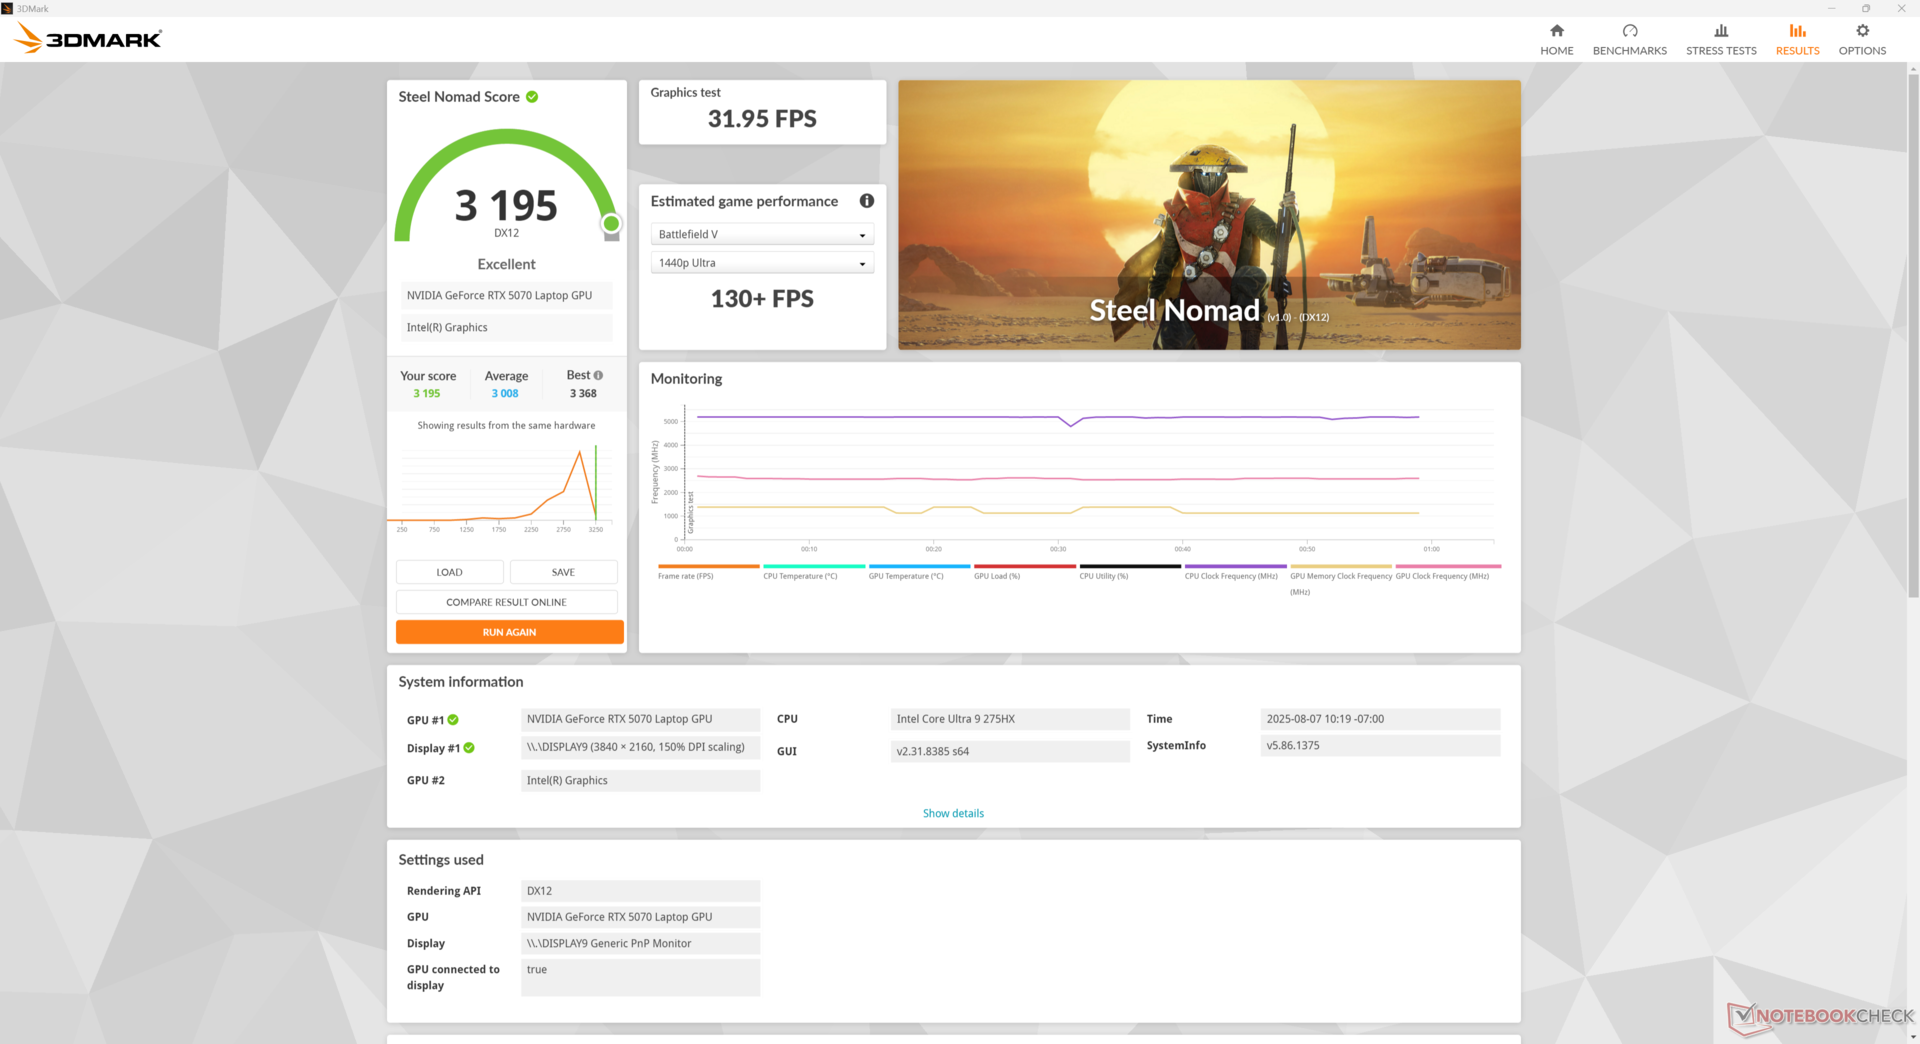
| 3DMark 11 Performance | 36494 points | |
| 3DMark Cloud Gate Standard Score | 71379 points | |
| 3DMark Fire Strike Score | 31944 points | |
| 3DMark Time Spy Score | 14321 points | |
| 3DMark Steel Nomad Score | 3195 points | |
Help | ||
* ... smaller is better
游戏性能
使用移动 RTX 5070 玩游戏可谓喜忧参半。台式机 RTX 5070 可以在 1440p 最高设置下舒适地运行大多数游戏,包括《夺宝奇兵》或《刺客信条:暗影》等要求苛刻的游戏,而移动 GPU 在这些游戏上却很吃力。例如,《艾伦-觉醒 2》在 1440p 超高设置下,我们的极光 16X 只能以 45 FPS 的速度运行,而我们的桌面 RTX 5070 参考版则能以 74 FPS 的速度运行。DLSS 当然可以帮助缩小这一差距,但建议将整体设置降至中等或中等偏上。当然,与速度更快的台式机相比,移动版 RTX 5070 更便于携带。
8GB VRAM 也是一个明显的限制。在测试《怪物猎人荒野行动》、《夺宝奇兵》、《艾伦觉醒 2》或《黑色神话悟空传》等游戏时,启用光线追踪等高级功能或更高的纹理会占用 VRAM,经常会降低帧率或导致崩溃。例如,在最高 1080p 设置下,《怪物猎人荒野》的运行速度要比配备 RTX 5070 Ti 显卡的笔记本电脑慢 40%以上。我们的《夺宝奇兵》即使在多次重试并更新到最新驱动程序后,运行速度也异常低。
| Performance rating - Percent | |
| Alienware 16 Area-51 -1! | |
| Lenovo Legion 5 Pro 16IAX10H | |
| MSI Vector 16 HX AI A2XWHG -1! | |
| Alienware 16X Aurora, RTX 5070 | |
| Gigabyte Gaming A16 GA6H | |
| Asus TUF Gaming A16 FA608WV | |
| Cyberpunk 2077 - 1920x1080 Ultra Preset (FSR off) | |
| Alienware 16 Area-51 | |
| Lenovo Legion 5 Pro 16IAX10H | |
| MSI Vector 16 HX AI A2XWHG | |
| Alienware 16X Aurora, RTX 5070 | |
| Gigabyte Gaming A16 GA6H | |
| Asus TUF Gaming A16 FA608WV | |
| Baldur's Gate 3 - 1920x1080 Ultra Preset AA:T | |
| Alienware 16 Area-51 | |
| MSI Vector 16 HX AI A2XWHG | |
| Alienware 16X Aurora, RTX 5070 | |
| Lenovo Legion 5 Pro 16IAX10H | |
| Gigabyte Gaming A16 GA6H | |
| Asus TUF Gaming A16 FA608WV | |
| GTA V - 1920x1080 Highest AA:4xMSAA + FX AF:16x | |
| Alienware 16X Aurora, RTX 5070 | |
| Lenovo Legion 5 Pro 16IAX10H | |
| MSI Vector 16 HX AI A2XWHG | |
| Asus TUF Gaming A16 FA608WV | |
| Gigabyte Gaming A16 GA6H | |
| Final Fantasy XV Benchmark - 1920x1080 High Quality | |
| Alienware 16 Area-51 | |
| Lenovo Legion 5 Pro 16IAX10H | |
| MSI Vector 16 HX AI A2XWHG | |
| Alienware 16X Aurora, RTX 5070 | |
| Asus TUF Gaming A16 FA608WV | |
| Gigabyte Gaming A16 GA6H | |
| Strange Brigade - 1920x1080 ultra AA:ultra AF:16 | |
| Alienware 16 Area-51 | |
| Lenovo Legion 5 Pro 16IAX10H | |
| Alienware 16X Aurora, RTX 5070 | |
| Gigabyte Gaming A16 GA6H | |
| Asus TUF Gaming A16 FA608WV | |
| Dota 2 Reborn - 1920x1080 ultra (3/3) best looking | |
| Alienware 16X Aurora, RTX 5070 | |
| Lenovo Legion 5 Pro 16IAX10H | |
| MSI Vector 16 HX AI A2XWHG | |
| Alienware 16 Area-51 | |
| Gigabyte Gaming A16 GA6H | |
| Asus TUF Gaming A16 FA608WV | |
| X-Plane 11.11 - 1920x1080 high (fps_test=3) | |
| Alienware 16X Aurora, RTX 5070 | |
| Lenovo Legion 5 Pro 16IAX10H | |
| Alienware 16 Area-51 | |
| MSI Vector 16 HX AI A2XWHG | |
| Gigabyte Gaming A16 GA6H | |
| Asus TUF Gaming A16 FA608WV | |
| Monster Hunter Wilds | |
| 1920x1080 medium, no upscaling | |
| Chuwi Gamebook, R9 9955HX | |
| Alienware 16X Aurora, RTX 5070 | |
| Average NVIDIA GeForce RTX 5070 Laptop (61.6 - 78.2, n=4) | |
| 1920x1080 ultra, RT: high, no upscaling | |
| Alienware 16 Area-51 | |
| Chuwi Gamebook, R9 9955HX | |
| Razer Blade 16 RTX 5080 | |
| Average NVIDIA GeForce RTX 5070 Laptop (39.1 - 44.5, n=3) | |
| Alienware 16X Aurora, RTX 5070 | |
| 2560x1440 ultra, RT: high, no upscaling | |
| Alienware 16 Area-51 | |
| Razer Blade 16 RTX 5080 | |
| Chuwi Gamebook, R9 9955HX | |
| Average NVIDIA GeForce RTX 5070 Laptop (21.1 - 31.7, n=3) | |
| Alienware 16X Aurora, RTX 5070 | |
赛博朋克 2077》超 FPS 图表
| low | med. | high | ultra | QHD DLSS | QHD | 4K DLSS | 4K | |
|---|---|---|---|---|---|---|---|---|
| GTA V (2015) | 156.4 | 129 | 125.6 | |||||
| Dota 2 Reborn (2015) | 239 | 210 | 201 | 184 | 148.8 | |||
| Final Fantasy XV Benchmark (2018) | 150.7 | 107.4 | 58.8 | |||||
| X-Plane 11.11 (2018) | 162.3 | 141.3 | 116.1 | 89.3 | ||||
| Strange Brigade (2018) | 259 | 177.9 | 96.1 | |||||
| Baldur's Gate 3 (2023) | 140.8 | 140 | 96.3 | 83.7 | 49.6 | |||
| Cyberpunk 2077 (2023) | 180.3 | 142.7 | 117.7 | 102.9 | 76.6 | 65.4 | 28.4 | |
| Alan Wake 2 (2023) | 62.6 | 45.1 | 23.8 | |||||
| F1 24 (2024) | 88.3 | 85.8 | 54.7 | 22.7 | 19 | |||
| Black Myth: Wukong (2024) | 66 | 37 | 41 | 27 | 7 | |||
| Indiana Jones and the Great Circle (2024) | 153.8 | 56.1 | 8.3 | 7.6 | ||||
| Monster Hunter Wilds (2025) | 78.2 | 39.1 | 21.1 | |||||
| Assassin's Creed Shadows (2025) | 61 | 38 | 37 | 37 | 29 | 22 |
排放量
系统噪音
虽然 Aurora 16X 没有采用 Area-51 的蒸汽腔散热器,而是采用了更传统的方法,但风扇噪音和行为却出奇地相似。在 3DMark 06的第一个基准测试场景中,双风扇始终保持安静,而在大多数其他游戏笔记本电脑上,风扇往往会在早期就出现脉冲。这意味着在运行浏览器或视频等要求较低的负载时,极光 16X 的风扇表现更稳定。
在平衡模式、性能模式和超频模式下进行游戏时,风扇噪音最高分别为 48.5 dB(A)、51.8 dB(A) 和 58 dB(A)。建议使用 "性能 "模式玩游戏,因为与噪音的剧增相比,"超频 "模式的性能优势微乎其微。
Noise level
| Idle |
| 23.9 / 23.9 / 26.1 dB(A) |
| Load |
| 26.8 / 58 dB(A) |
 | ||
30 dB silent 40 dB(A) audible 50 dB(A) loud |
||
min: | ||
| Alienware 16X Aurora, RTX 5070 GeForce RTX 5070 Laptop, Ultra 9 275HX | Alienware 16 Area-51 GeForce RTX 5080 Laptop, Ultra 9 275HX, Samsung PM9C1a MZ9L81T0HDLB | Gigabyte Gaming A16 GA6H GeForce RTX 5070 Laptop, i7-13620H, Kingston OM8PGP41024Q-A0 | MSI Vector 16 HX AI A2XWHG GeForce RTX 5070 Ti Laptop, Ultra 7 255HX, Micron 2400 MTFDKBA512QFM | Asus TUF Gaming A16 FA608WV GeForce RTX 4060 Laptop GPU, Ryzen AI 9 HX 370, Micron 2400 MTFDKBA1T0QFM | Lenovo Legion 5 Pro 16IAX10H GeForce RTX 5070 Ti Laptop, Ultra 9 275HX, Western Digital PC SN8000S SDEPNRK-1T00 | |
|---|---|---|---|---|---|---|
| Noise | -4% | -17% | -25% | 6% | -19% | |
| off / environment * (dB) | 23.7 | 23.6 -0% | 24 -1% | 25 -5% | 23 3% | 24 -1% |
| Idle Minimum * (dB) | 23.9 | 25.4 -6% | 25 -5% | 33 -38% | 23 4% | 24 -0% |
| Idle Average * (dB) | 23.9 | 27.8 -16% | 26 -9% | 34 -42% | 23 4% | 24 -0% |
| Idle Maximum * (dB) | 26.1 | 28.1 -8% | 27 -3% | 38 -46% | 29.11 -12% | 30.9 -18% |
| Load Average * (dB) | 26.8 | 28.8 -7% | 54 -101% | 46 -72% | 31 -16% | 55.9 -109% |
| Cyberpunk 2077 ultra * (dB) | 51.8 | 50.4 3% | 54 -4% | 47 9% | 36.23 30% | 56.72 -9% |
| Load Maximum * (dB) | 58 | 56.4 3% | 55 5% | 49 16% | 39.44 32% | 56.72 2% |
* ... smaller is better
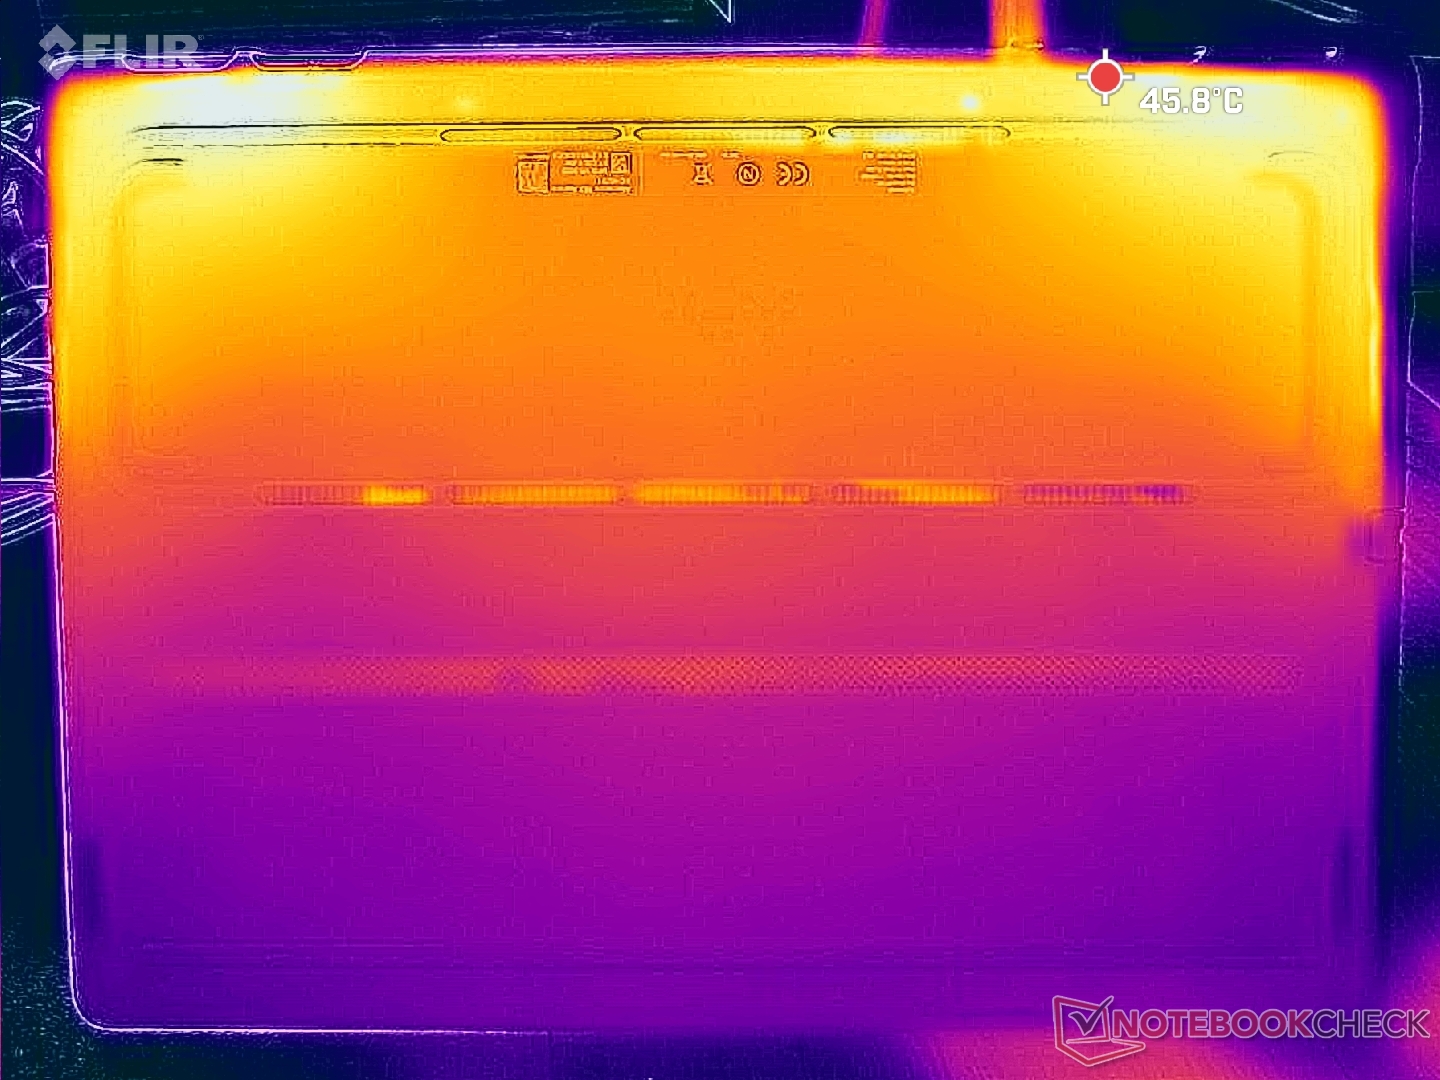
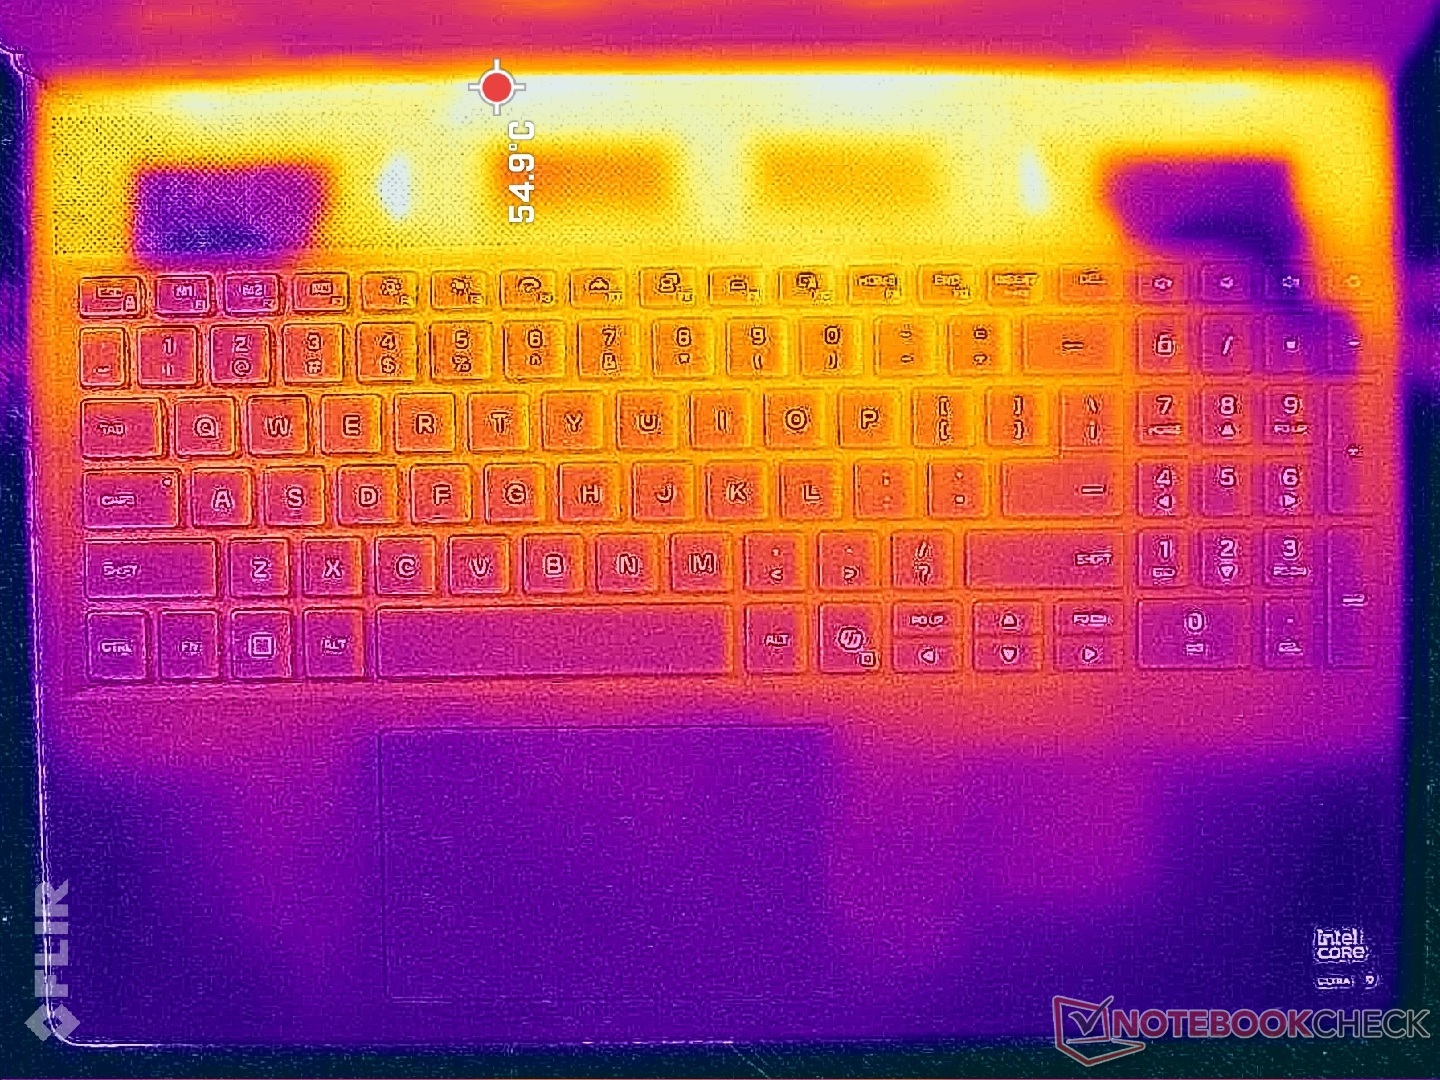
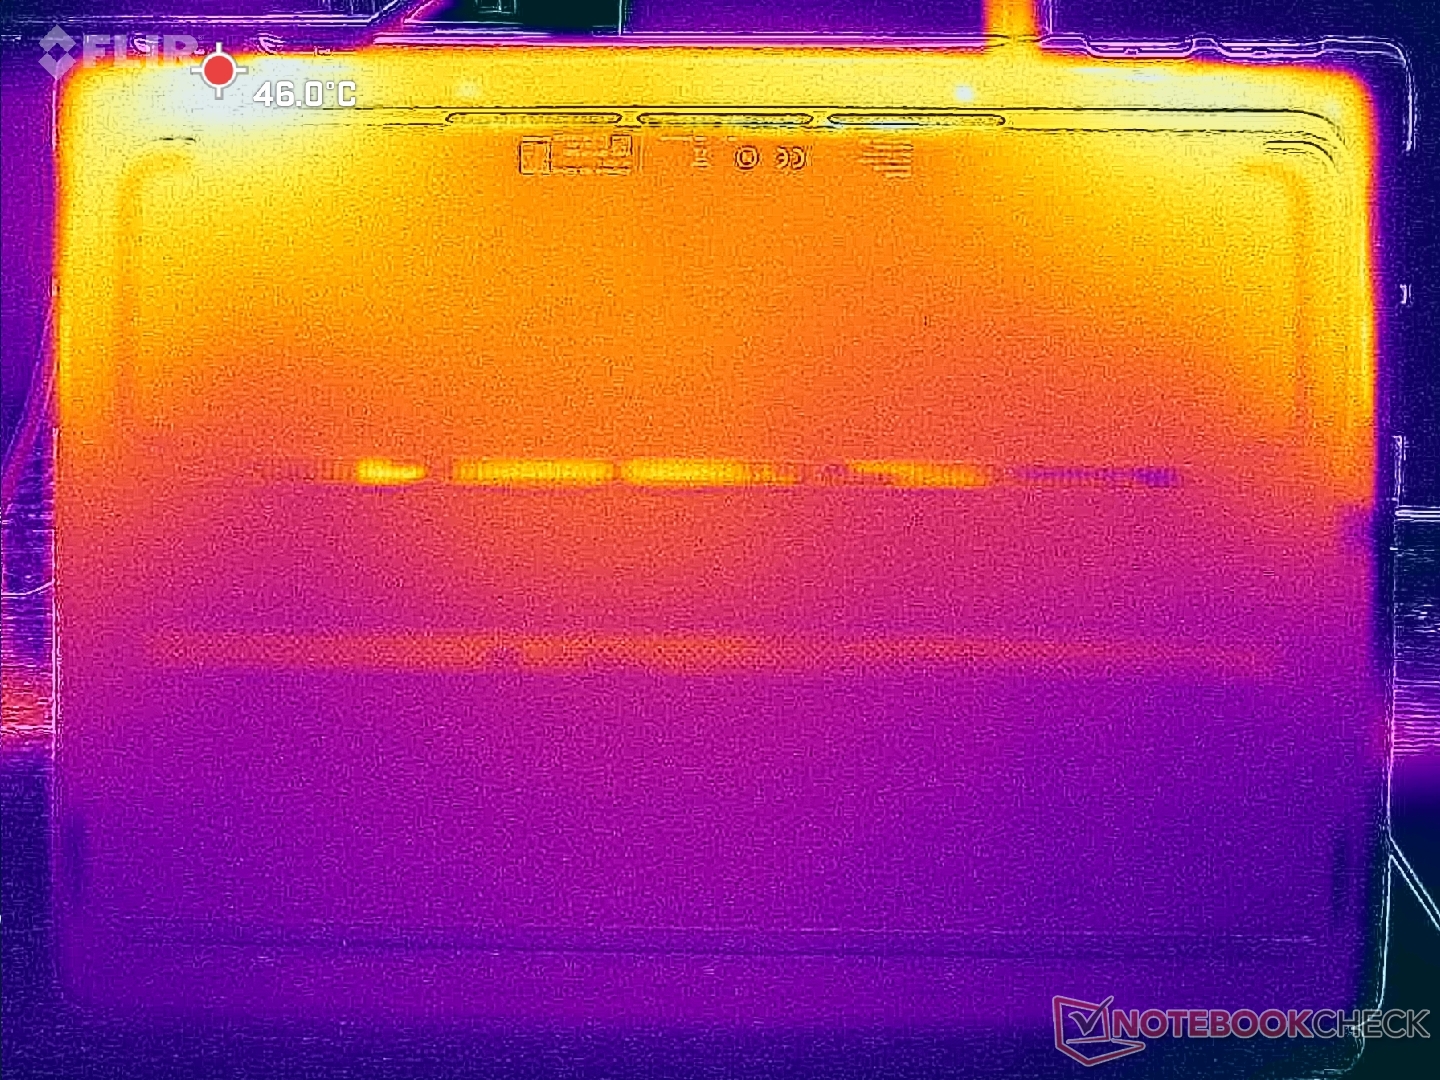
温度
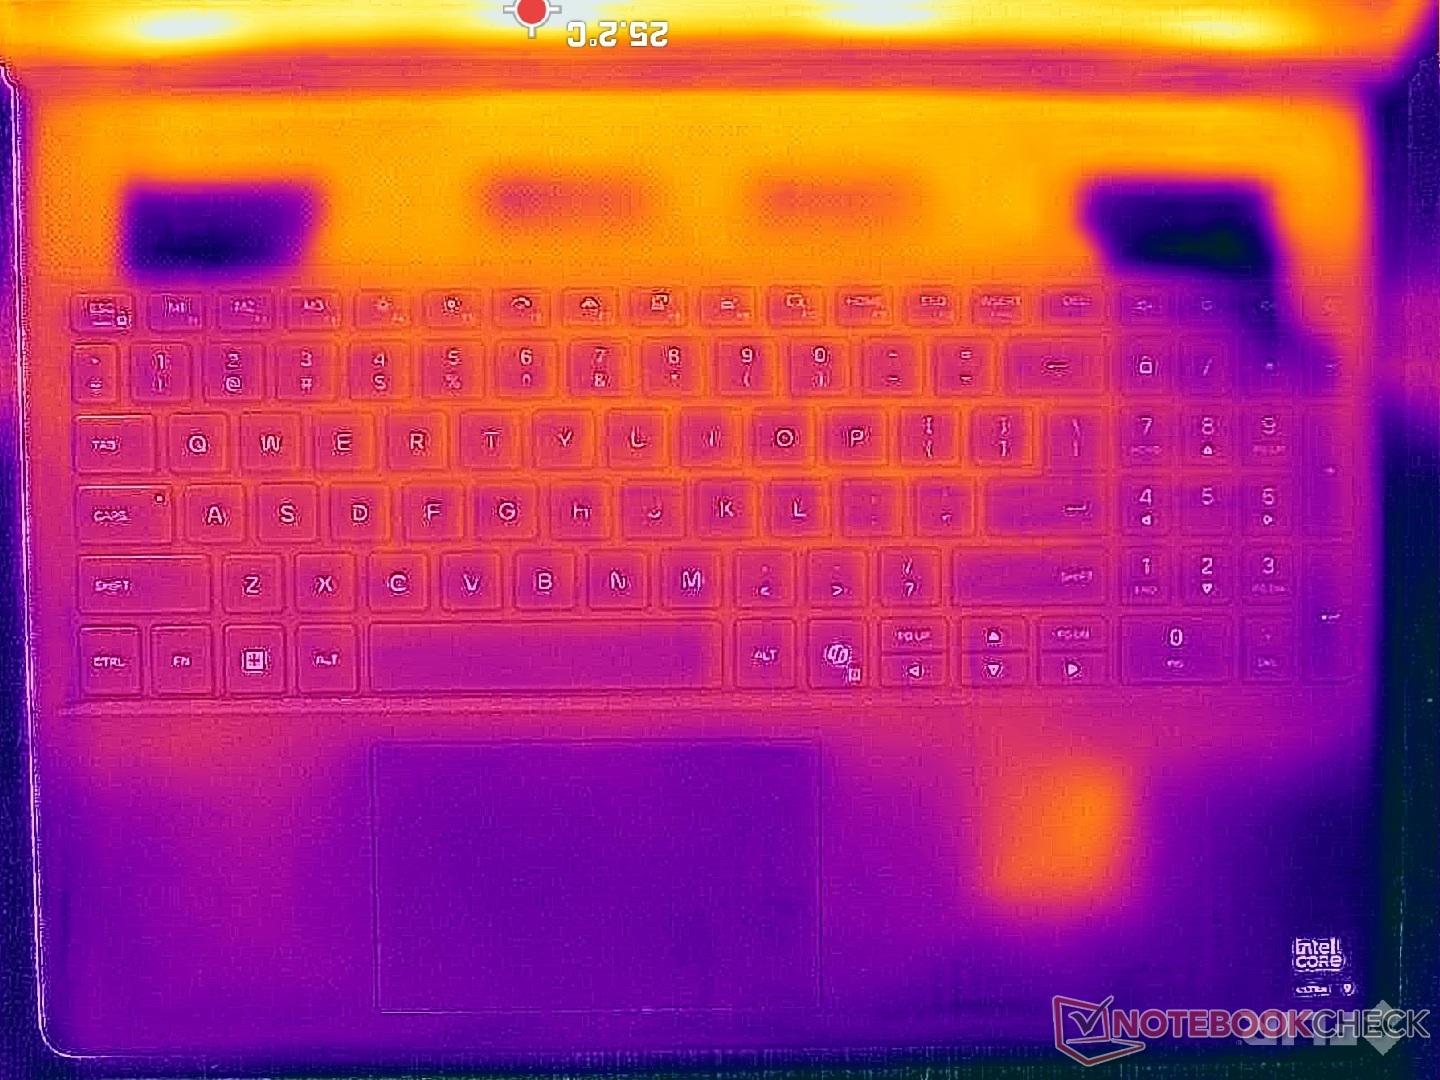
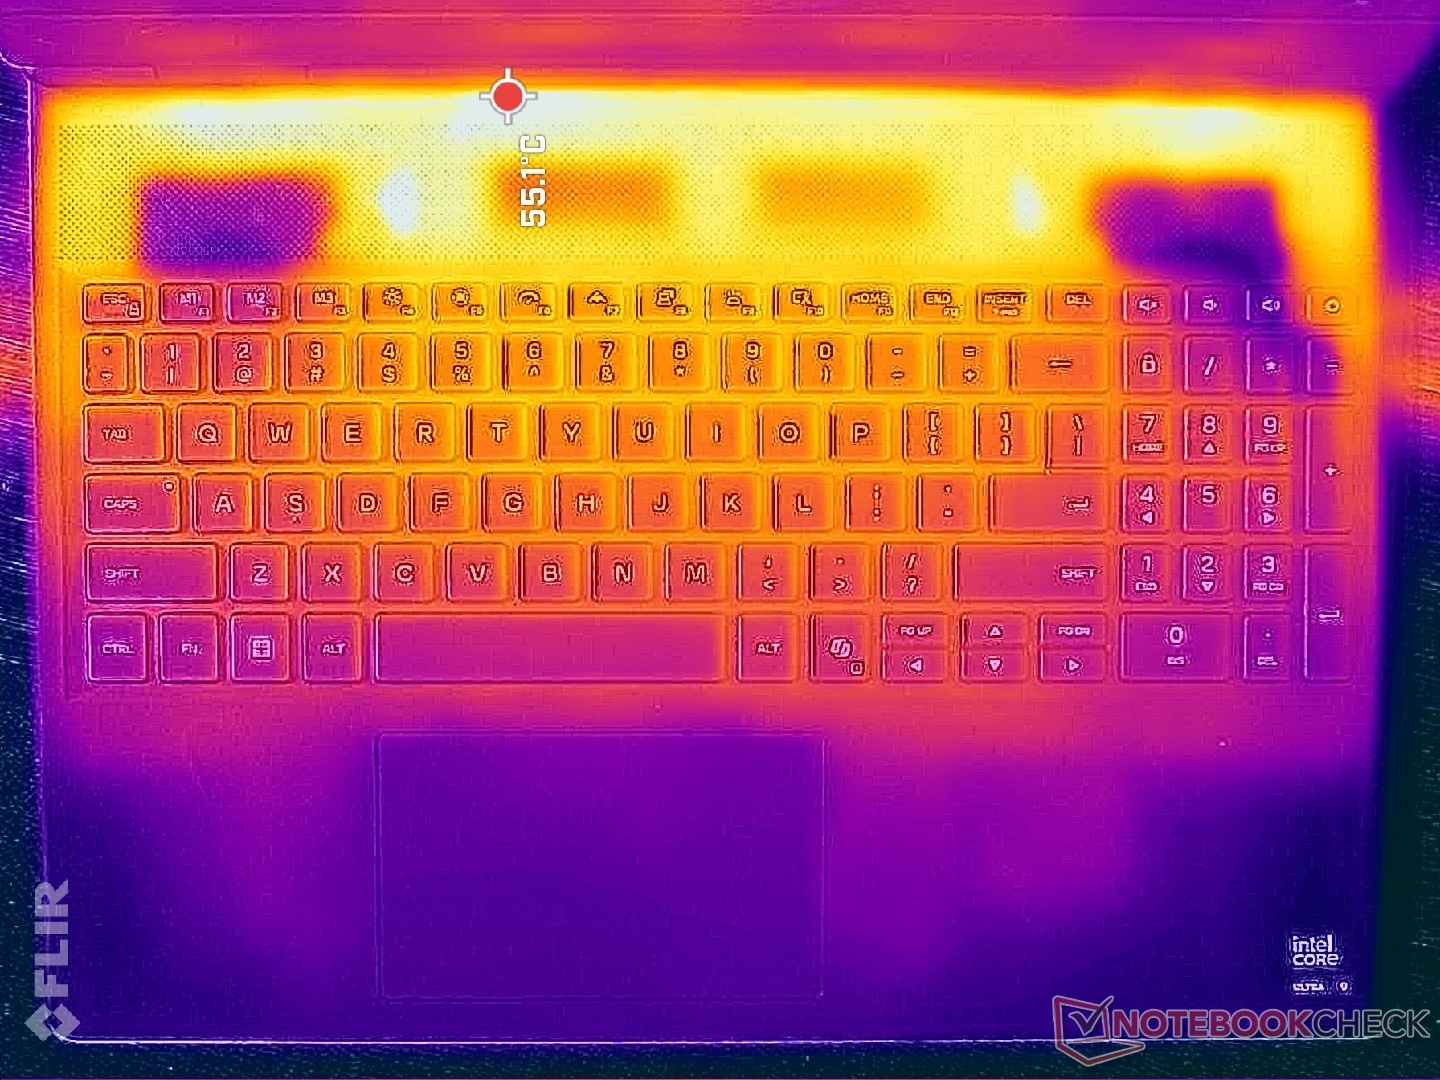
即使运行要求不高的负载,表面温度也会相当高。游戏时,掌托的温度可高达 30 摄氏度,而键盘大部分区域的温度可高达 42 摄氏度,手指和手掌会感到很热。虽然不一定会让人感到不舒服,但在长时间游戏过程中,温度较低的掌托和 WASD 键无疑是更好的选择。竞争对手微星 Vector 16 HX 在类似条件下的温度更高。
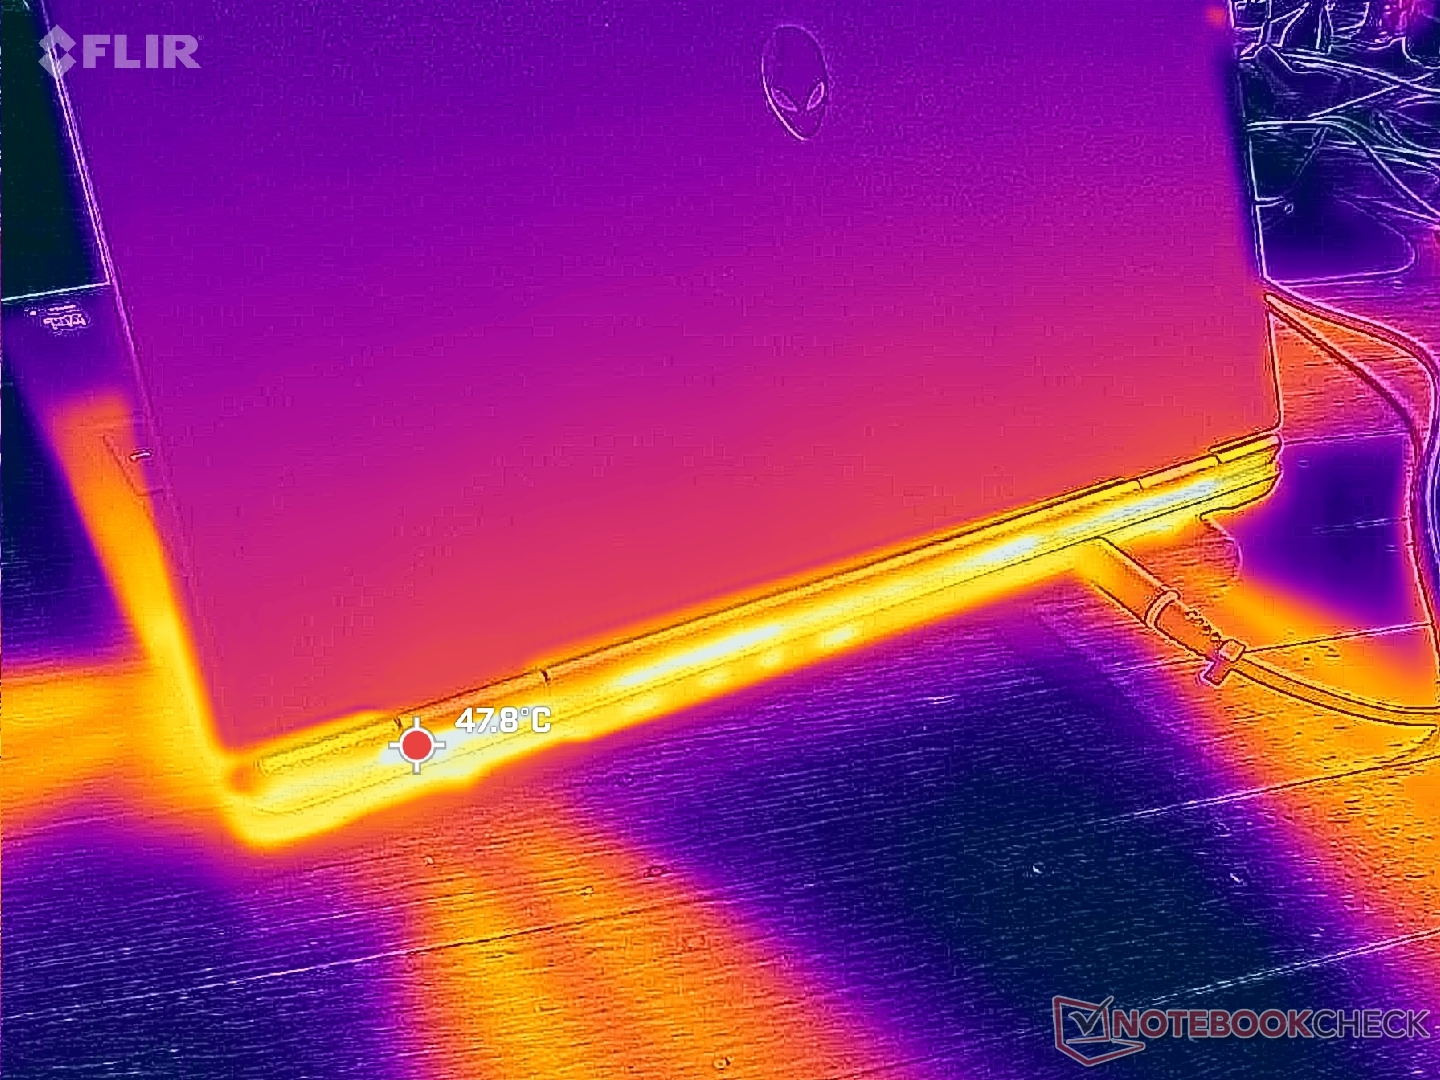
(-) The maximum temperature on the upper side is 51 °C / 124 F, compared to the average of 40.4 °C / 105 F, ranging from 21.2 to 68.8 °C for the class Gaming.
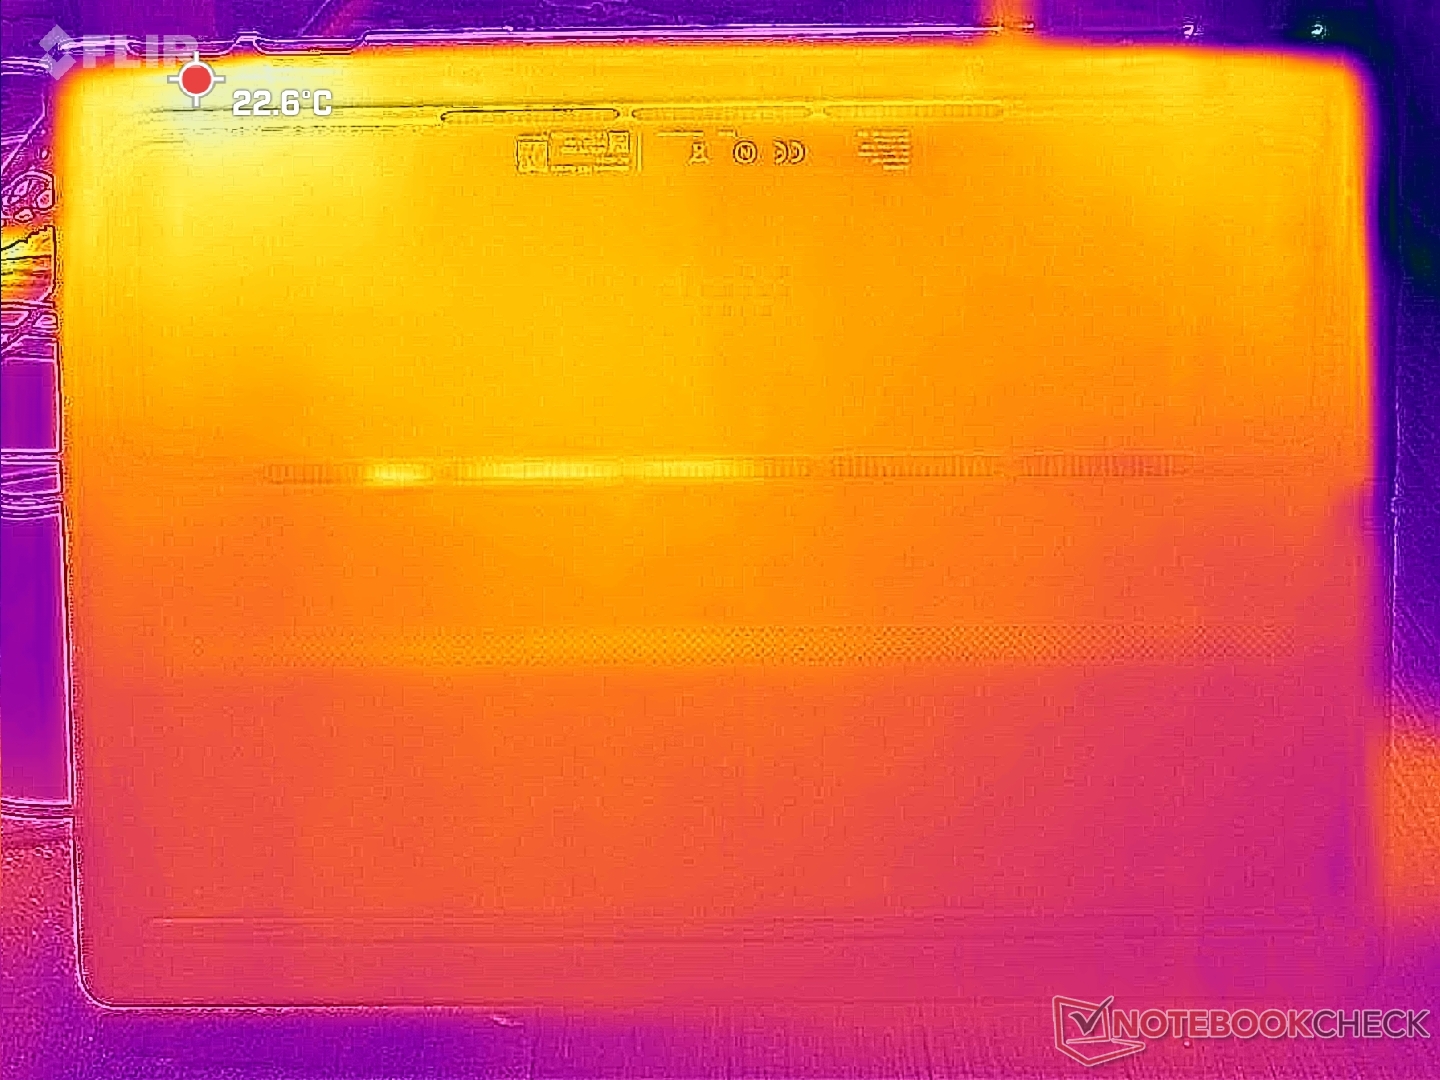
(-) The bottom heats up to a maximum of 45.6 °C / 114 F, compared to the average of 43.2 °C / 110 F
(+) In idle usage, the average temperature for the upper side is 27.7 °C / 82 F, compared to the device average of 33.9 °C / 93 F.
(-) 3: The average temperature for the upper side is 41.4 °C / 107 F, compared to the average of 33.9 °C / 93 F for the class Gaming.
(+) The palmrests and touchpad are reaching skin temperature as a maximum (33.4 °C / 92.1 F) and are therefore not hot.
(-) The average temperature of the palmrest area of similar devices was 28.8 °C / 83.8 F (-4.6 °C / -8.3 F).
| Alienware 16X Aurora, RTX 5070 Intel Core Ultra 9 275HX, NVIDIA GeForce RTX 5070 Laptop | Alienware 16 Area-51 Intel Core Ultra 9 275HX, NVIDIA GeForce RTX 5080 Laptop | Gigabyte Gaming A16 GA6H Intel Core i7-13620H, NVIDIA GeForce RTX 5070 Laptop | MSI Vector 16 HX AI A2XWHG Intel Core Ultra 7 255HX, NVIDIA GeForce RTX 5070 Ti Laptop | Asus TUF Gaming A16 FA608WV AMD Ryzen AI 9 HX 370, NVIDIA GeForce RTX 4060 Laptop GPU | Lenovo Legion 5 Pro 16IAX10H Intel Core Ultra 9 275HX, NVIDIA GeForce RTX 5070 Ti Laptop | |
|---|---|---|---|---|---|---|
| Heat | -6% | -12% | -9% | 10% | -21% | |
| Maximum Upper Side * (°C) | 51 | 43.8 14% | 50 2% | 53 -4% | 38 25% | 48 6% |
| Maximum Bottom * (°C) | 45.6 | 40 12% | 49 -7% | 52 -14% | 37 19% | 50 -10% |
| Idle Upper Side * (°C) | 29.8 | 35.8 -20% | 35 -17% | 33 -11% | 28 6% | 38 -28% |
| Idle Bottom * (°C) | 27.4 | 35.2 -28% | 34 -24% | 29 -6% | 30 -9% | 42 -53% |
* ... smaller is better
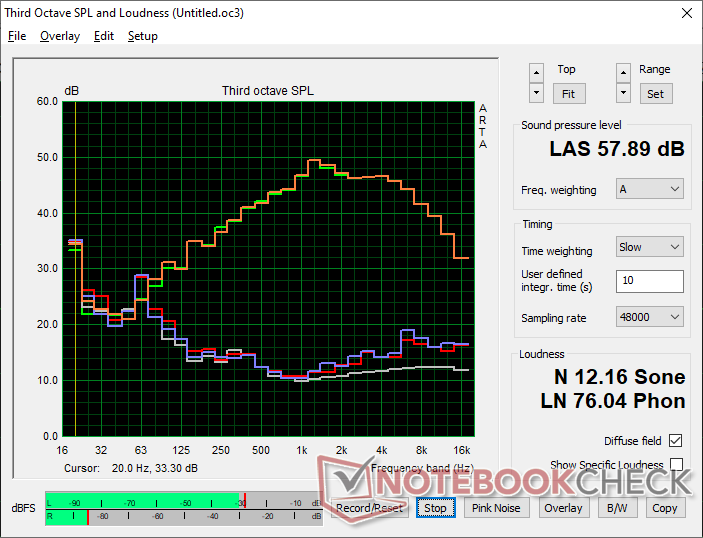
发言人
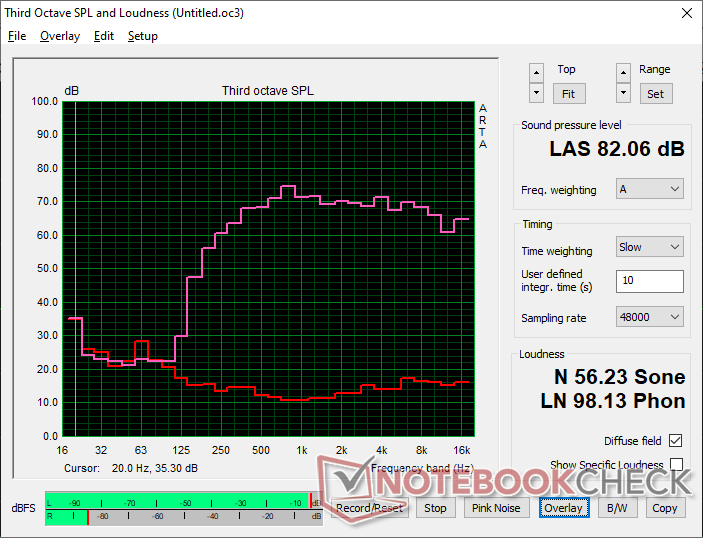
Alienware 16X Aurora, RTX 5070 audio analysis
(+) | speakers can play relatively loud (82.1 dB)
Bass 100 - 315 Hz
(-) | nearly no bass - on average 21.6% lower than median
(±) | linearity of bass is average (12.9% delta to prev. frequency)
Mids 400 - 2000 Hz
(+) | balanced mids - only 2.3% away from median
(+) | mids are linear (4% delta to prev. frequency)
Highs 2 - 16 kHz
(+) | balanced highs - only 1.3% away from median
(+) | highs are linear (3.7% delta to prev. frequency)
Overall 100 - 16.000 Hz
(+) | overall sound is linear (14.5% difference to median)
Compared to same class
» 27% of all tested devices in this class were better, 7% similar, 66% worse
» The best had a delta of 6%, average was 18%, worst was 132%
Compared to all devices tested
» 18% of all tested devices were better, 4% similar, 78% worse
» The best had a delta of 4%, average was 24%, worst was 134%
Apple MacBook Pro 16 2021 M1 Pro audio analysis
(+) | speakers can play relatively loud (84.7 dB)
Bass 100 - 315 Hz
(+) | good bass - only 3.8% away from median
(+) | bass is linear (5.2% delta to prev. frequency)
Mids 400 - 2000 Hz
(+) | balanced mids - only 1.3% away from median
(+) | mids are linear (2.1% delta to prev. frequency)
Highs 2 - 16 kHz
(+) | balanced highs - only 1.9% away from median
(+) | highs are linear (2.7% delta to prev. frequency)
Overall 100 - 16.000 Hz
(+) | overall sound is linear (4.6% difference to median)
Compared to same class
» 0% of all tested devices in this class were better, 0% similar, 100% worse
» The best had a delta of 5%, average was 17%, worst was 45%
Compared to all devices tested
» 0% of all tested devices were better, 0% similar, 100% worse
» The best had a delta of 4%, average was 24%, worst was 134%
能源管理
耗电量
根据亮度和电源配置文件设置的不同,在台式机上怠速运行需要 20 瓦到 32 瓦的功率。这些最低功耗高于许多同类游戏笔记本电脑,但仍与大多数其他 Alienware 型号一致。
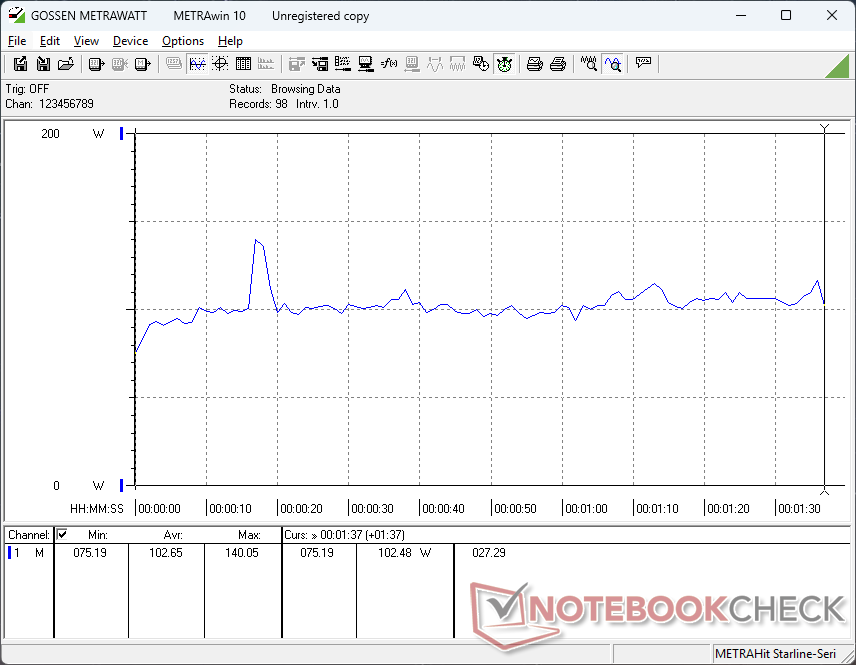
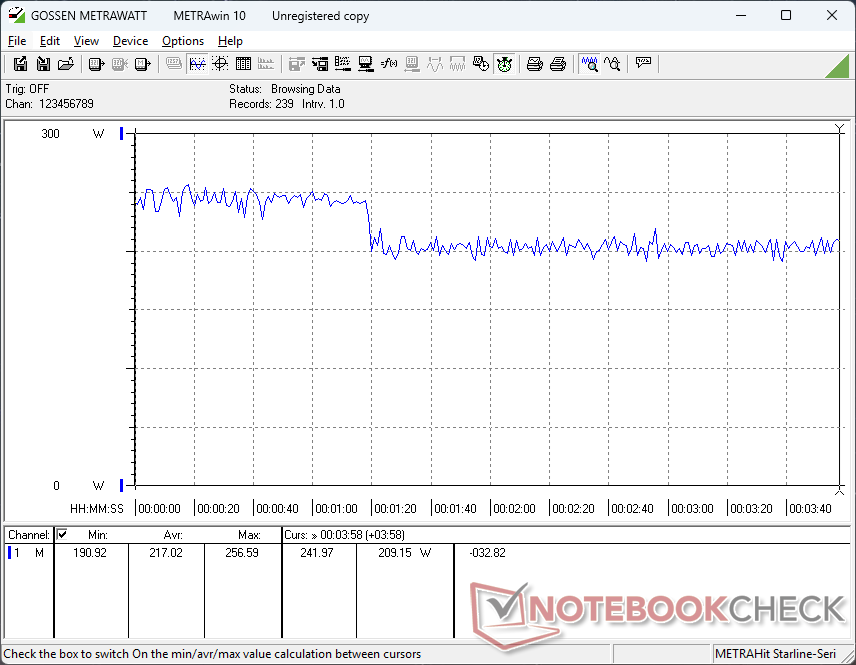
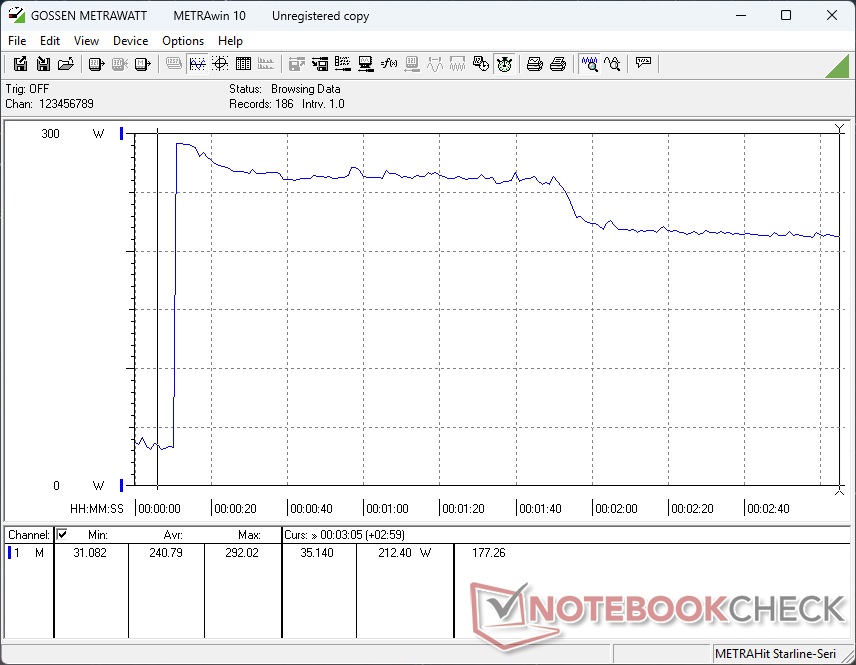
运行《赛博朋克 2077》需要 192 W,比配备 RTX 5070 Ti 显卡的微星 Vector 16 HX 少 11%。考虑到 RTX 5070 Ti 的速度比我们的 RTX 5070 快 25% 到 30%,我们的 Aurora 16X 配置的每瓦性能并没有我们预期的那么好。
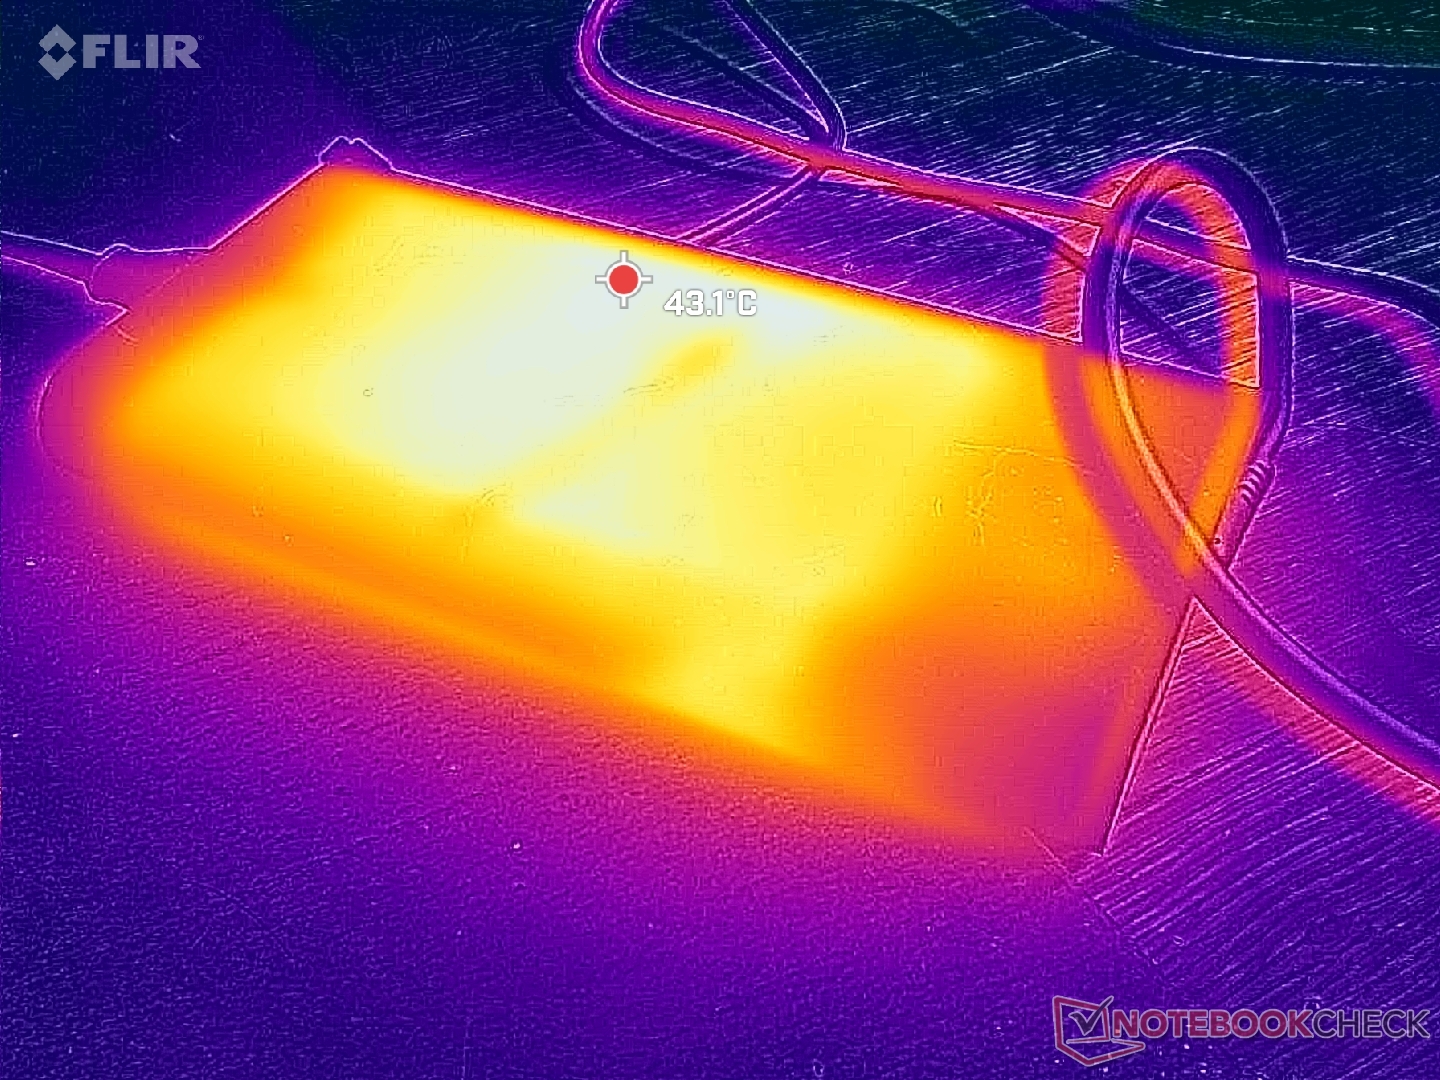
当 CPU 和 GPU 的使用率均为 100% 时,我们可以记录到相对较大(约 20.5 x 10.5 x 2.5 厘米)的 280 W AC 适配器的临时最大功耗为 292 W。
| Off / Standby | |
| Idle | |
| Load |
|
Key:
min: | |
| Alienware 16X Aurora, RTX 5070 Ultra 9 275HX, GeForce RTX 5070 Laptop, , IPS, 2560x1600, 16" | Alienware 16 Area-51 Ultra 9 275HX, GeForce RTX 5080 Laptop, Samsung PM9C1a MZ9L81T0HDLB, IPS, 2560x1600, 16" | Gigabyte Gaming A16 GA6H i7-13620H, GeForce RTX 5070 Laptop, Kingston OM8PGP41024Q-A0, IPS, 2560x1600, 16" | MSI Vector 16 HX AI A2XWHG Ultra 7 255HX, GeForce RTX 5070 Ti Laptop, Micron 2400 MTFDKBA512QFM, IPS, 2560x1600, 16" | Asus TUF Gaming A16 FA608WV Ryzen AI 9 HX 370, GeForce RTX 4060 Laptop GPU, Micron 2400 MTFDKBA1T0QFM, IPS, 1920x1200, 16" | Lenovo Legion 5 Pro 16IAX10H Ultra 9 275HX, GeForce RTX 5070 Ti Laptop, Western Digital PC SN8000S SDEPNRK-1T00, OLED, 2560x1600, 16" | |
|---|---|---|---|---|---|---|
| Power Consumption | -26% | 39% | 9% | 40% | -1% | |
| Idle Minimum * (Watt) | 20.1 | 27 -34% | 9 55% | 7.1 65% | 6.8 66% | 14 30% |
| Idle Average * (Watt) | 27.6 | 33.5 -21% | 11 60% | 15.9 42% | 12.7 54% | 14.3 48% |
| Idle Maximum * (Watt) | 31.8 | 41.4 -30% | 23 28% | 29.5 7% | 15.2 52% | 20.1 37% |
| Load Average * (Watt) | 102.7 | 124.7 -21% | 91 11% | 124 -21% | 85 17% | 177 -72% |
| Cyberpunk 2077 ultra external monitor * (Watt) | 192.3 | 249 -29% | 130 32% | 217 -13% | 143 26% | 255 -33% |
| Cyberpunk 2077 ultra * (Watt) | 217 | 256 -18% | 132.5 39% | 222 -2% | 145 33% | 255 -18% |
| Load Maximum * (Watt) | 292 | 367.2 -26% | 155 47% | 336 -15% | 199 32% | 294 -1% |
* ... smaller is better
功耗 赛博朋克/压力测试
外部显示器功耗
电池寿命
电池容量与 Alienware 15 Area-51 相同,尽管极光 16X 对钱包更有吸引力。尽管如此,运行时间仍然很差,充其量只能在平衡功率模式下进行 4 小时的 WLAN 实际浏览。
使用随附的交流适配器从空载充电到满载需要近 2.5 小时。
| Alienware 16X Aurora, RTX 5070 Ultra 9 275HX, GeForce RTX 5070 Laptop, 96 Wh | Alienware 16 Area-51 Ultra 9 275HX, GeForce RTX 5080 Laptop, 96 Wh | Gigabyte Gaming A16 GA6H i7-13620H, GeForce RTX 5070 Laptop, 76 Wh | MSI Vector 16 HX AI A2XWHG Ultra 7 255HX, GeForce RTX 5070 Ti Laptop, 90 Wh | Asus TUF Gaming A16 FA608WV Ryzen AI 9 HX 370, GeForce RTX 4060 Laptop GPU, 90 Wh | Lenovo Legion 5 Pro 16IAX10H Ultra 9 275HX, GeForce RTX 5070 Ti Laptop, 80 Wh | |
|---|---|---|---|---|---|---|
| Battery runtime | -35% | 79% | 63% | 230% | 14% | |
| WiFi v1.3 (h) | 4.3 | 2.8 -35% | 7.7 79% | 7 63% | 14.2 230% | 4.9 14% |
| Reader / Idle (h) | 3.1 | |||||
| H.264 (h) | 14.7 | 4.8 | ||||
| Load (h) | 2.1 | 1.7 |
笔记本检查评级
Alienware 16X Aurora, RTX 5070
- 08/13/2025 v8
Allen Ngo
 Total Sustainability Score:
 潜在竞争对手比较
Image | Model / Review | Price | Weight | Height | Display |
|---|---|---|---|---|---|
1. 84.9%  | Alienware 16X Aurora, RTX 5070 Intel Core Ultra 9 275HX ⎘ NVIDIA GeForce RTX 5070 Laptop ⎘ 32 GB Memory | Amazon: List Price: 1800 USD | 2.5 kg | 23.4 mm | 16.00" 2560x1600 189 PPI IPS |
2. 85.7%  | Alienware 16 Area-51 Intel Core Ultra 9 275HX ⎘ NVIDIA GeForce RTX 5080 Laptop ⎘ 32 GB Memory, 1024 GB SSD | Amazon: 1. $2,348.98 Alienware 16 Area-51 Gaming ... 2. $3,799.99 Alienware 16 Area-51 Gaming ... 3. $4,299.99 Alienware 16 Area-51 Gaming ... List Price: 3500 USD | 3.3 kg | 28.5 mm | 16.00" 2560x1600 189 PPI IPS |
3. 80.1%  | Gigabyte Gaming A16 GA6H Intel Core i7-13620H ⎘ NVIDIA GeForce RTX 5070 Laptop ⎘ 16 GB Memory, 1024 GB SSD | Amazon: 1. $1,341.81 GIGABYTE - Gaming A16 Gaming... 2. $1,227.67 GIGABYTE - Gaming A16 Gaming... 3. $176.96 Gigabyte GA-B650M Gaming Plu... List Price: 1700 EUR | 2.3 kg | 23 mm | 16.00" 2560x1600 189 PPI IPS |
4. 84%  | MSI Vector 16 HX AI A2XWHG Intel Core Ultra 7 255HX ⎘ NVIDIA GeForce RTX 5070 Ti Laptop ⎘ 16 GB Memory, 512 GB SSD | Amazon: List Price: 2000 EUR | 2.6 kg | 28.6 mm | 16.00" 2560x1600 189 PPI IPS |
5. 83%  | Asus TUF Gaming A16 FA608WV AMD Ryzen AI 9 HX 370 ⎘ NVIDIA GeForce RTX 4060 Laptop GPU ⎘ 16 GB Memory, 1024 GB SSD | Amazon: List Price: 1399 Euro | 2.2 kg | 25.7 mm | 16.00" 1920x1200 142 PPI IPS |
6. 84.5%  | Lenovo Legion 5 Pro 16IAX10H Intel Core Ultra 9 275HX ⎘ NVIDIA GeForce RTX 5070 Ti Laptop ⎘ 32 GB Memory, 1024 GB SSD | Amazon: 1. $1,749.99 Lenovo Legion Pro 5 AI Gamin... 2. $99.99 Lenovo Slim 245W AC Adapter ... 3. $2,259.99 Lenovo Legion Pro 7 16IAX10H... List Price: 2500 Euro | 2.4 kg | 25.95 mm | 16.00" 2560x1600 189 PPI OLED |
Transparency
The selection of devices to be reviewed is made by our editorial team. The test sample was provided to the author as a loan by the manufacturer or retailer for the purpose of this review. The lender had no influence on this review, nor did the manufacturer receive a copy of this review before publication. There was no obligation to publish this review. As an independent media company, Notebookcheck is not subjected to the authority of manufacturers, retailers or publishers.
This is how Notebookcheck is testing
Every year, Notebookcheck independently reviews hundreds of laptops and smartphones using standardized procedures to ensure that all results are comparable. We have continuously developed our test methods for around 20 years and set industry standards in the process. In our test labs, high-quality measuring equipment is utilized by experienced technicians and editors. These tests involve a multi-stage validation process. Our complex rating system is based on hundreds of well-founded measurements and benchmarks, which maintains objectivity. Further information on our test methods can be found here.

