评语:ThinkPad T1g Gen 8 是一款出色的多媒体笔记本电脑,但有一个小瑕疵
联想推出 ThinkPad T1g Gen 8 的目的是吸引广泛的用户群,包括专业用户、内容创作者、游戏玩家和职业消费者。因此,尽管价格昂贵,但它是一款非常出色的多媒体笔记本电脑。与竞争对手相比,它最大的弱点是串联式 OLED 显示屏。是的,它的亮度水平非常高,尤其是在 HDR 模式下,而且磨砂表面有助于减少反光,但与竞争对手相比,它的图像只是显得有些颗粒感。此外,大多数用户不太可能知道 "T1g "的实际含义。联想为什么不干脆恢复大家熟知的 ThinkPad X1 Extreme 名称,这仍然是个谜。
虽然显卡的速度还可以再快一些,但整体组件性能很强。在同类产品中,ThinkPad T1g Gen 8 因提供用户可更换的内存、两个快速 PCIe 5.0 M.2 插槽和 Thunderbolt 5 支持而脱颖而出。但缺点是缺少某些商务功能,如智能卡读卡器或 5G 调制解调器。
不过,真正的症结在于价格。如果你能说服你的老板花 4500 欧元左右购买一台公司笔记本电脑,那么 ThinkPad T1g Gen 8 的整体配置就非常有吸引力。但对于个人用户来说,它的意义有限。联想自己的 Yoga Pro 9i 16性能稍高,画质稍好,但价格却低了近 2000 欧元。如果你真的准备花这么多钱,还有其他选择,如 MacBook Pro 16配备速度更快的 M4 Max(或即将推出的 M5 Max)或 华硕 ProArt P16GeForce RTX 5090 和串联式 OLED 面板,这些都是更具吸引力的选择。
Pros
Cons
联想实际上已经停产了 ThinkPad X1 ExtremeGeForce GPU 的多媒体笔记本电脑,并只提供技术上完全相同的工作站产品 ThinkPad P1。然而,随着 ThinkPad T1g Gen 8 的推出,该制造商实际上正在扭转局面。实际上,T1g Gen 8 本质上是配备GeForce 图形处理器的 ThinkPad P1 Gen 8,再次被重新定位为以多媒体为重点的机型。
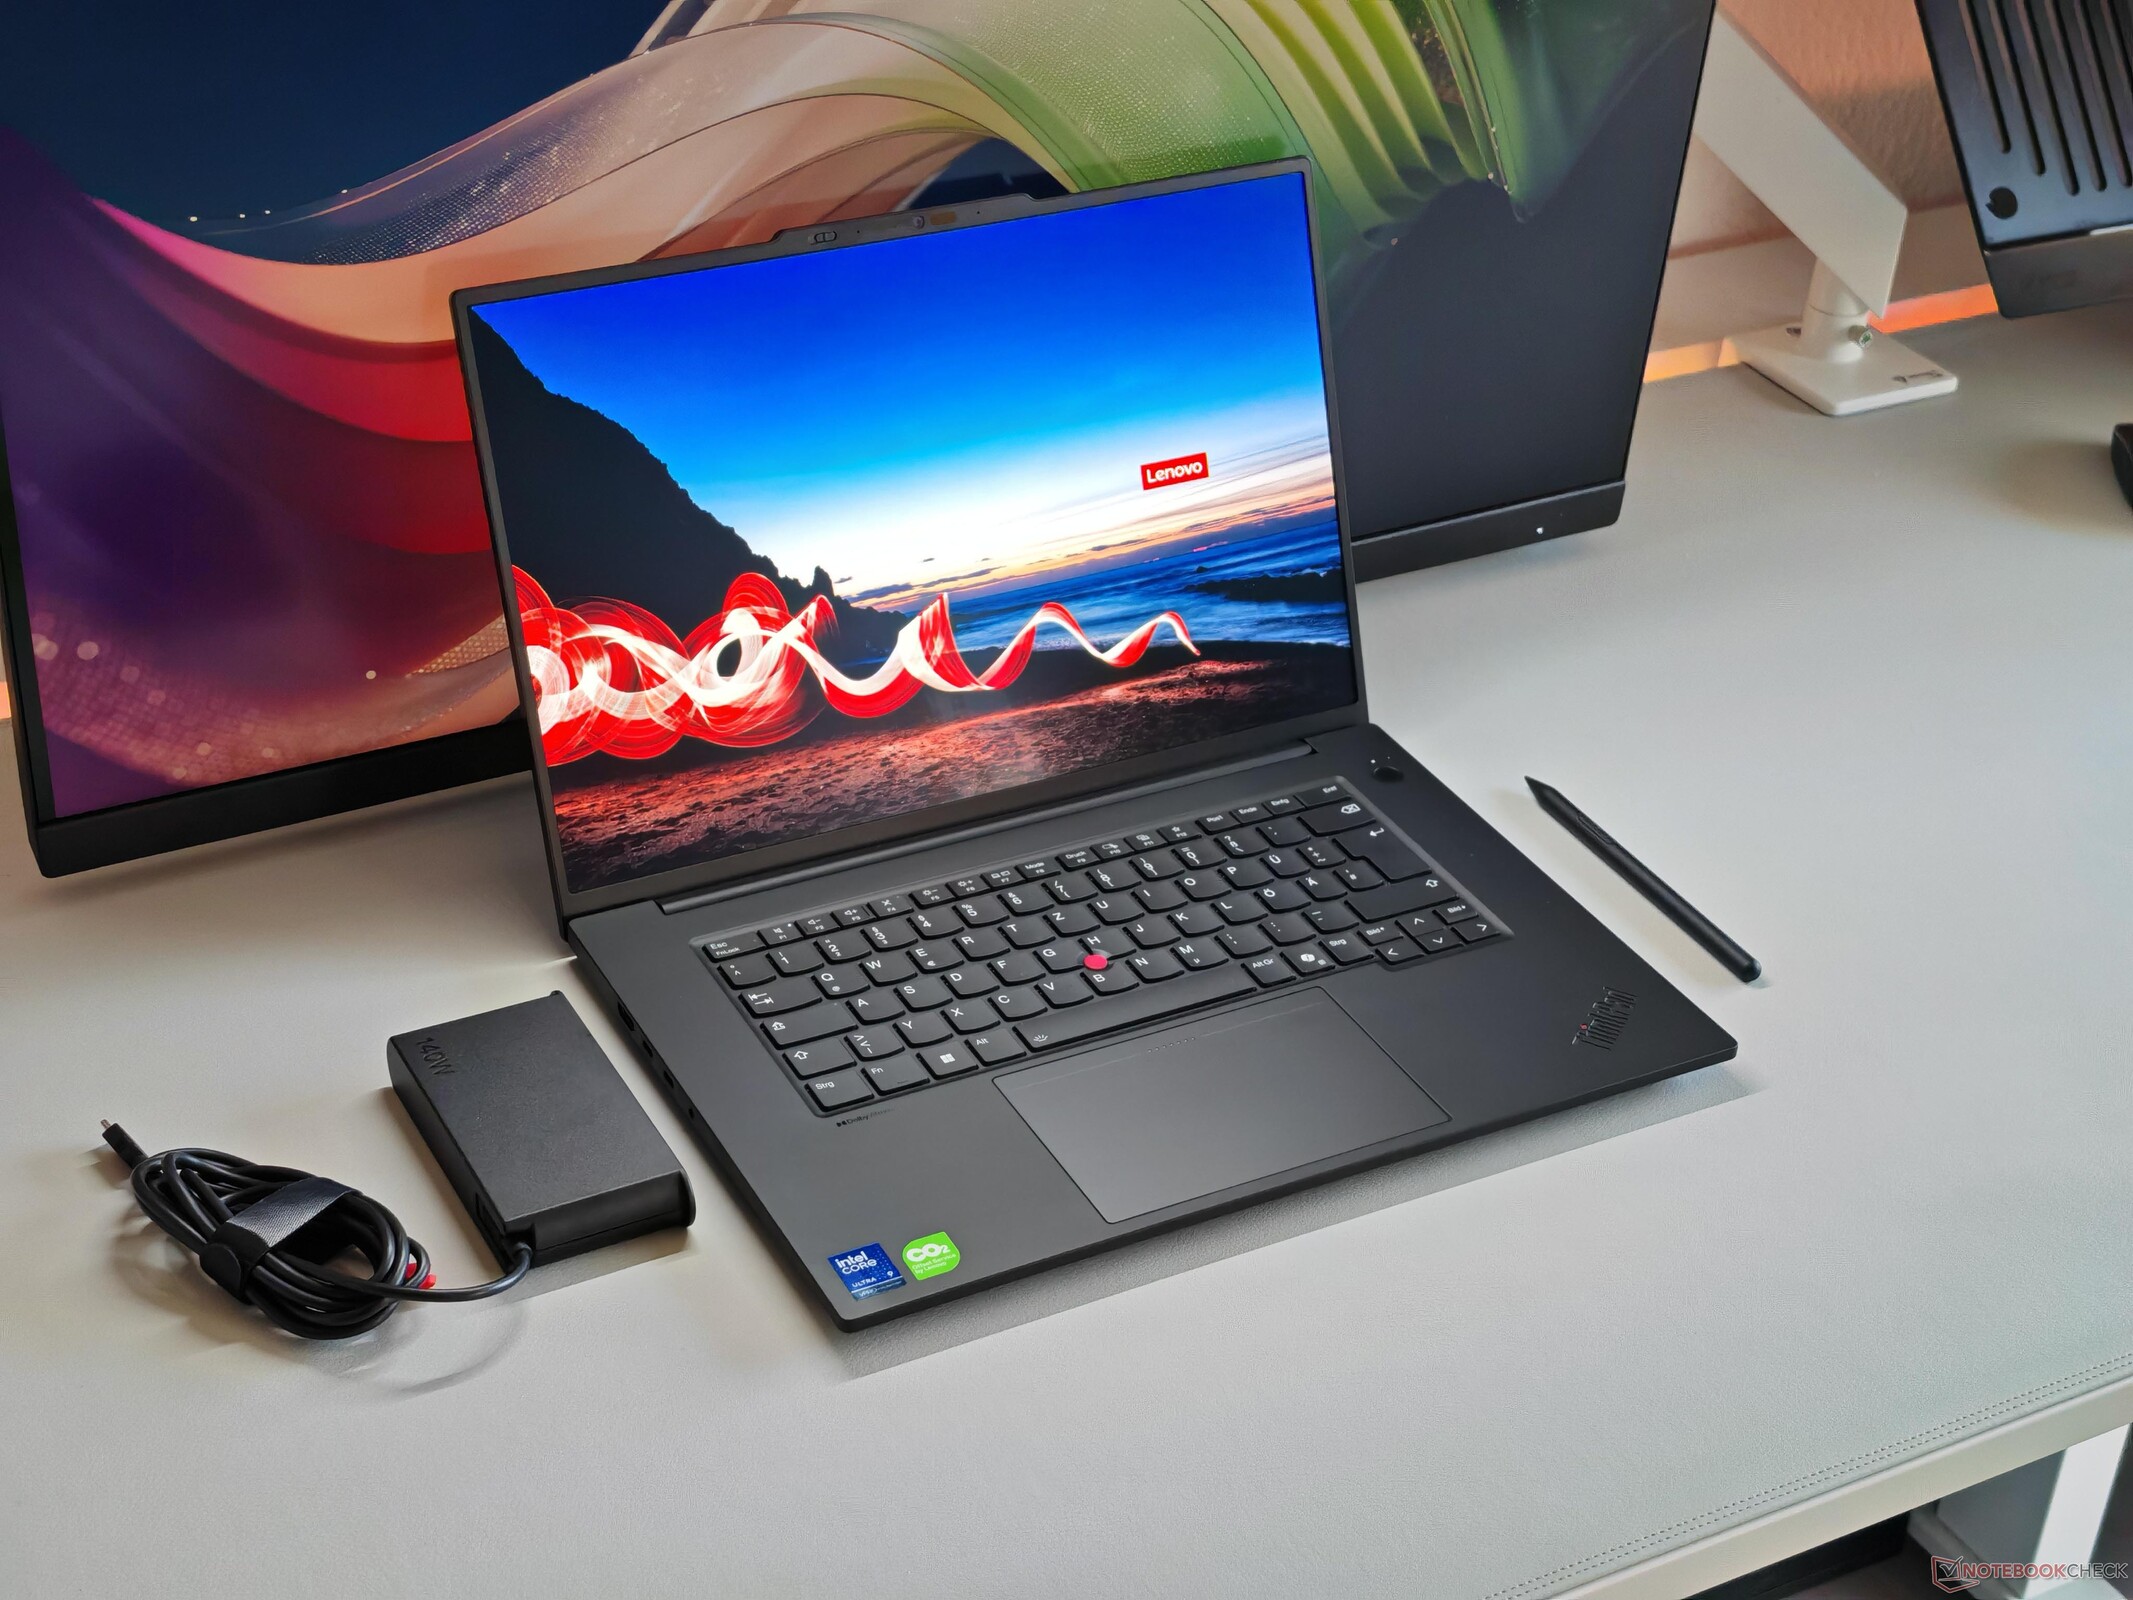
ThinkPad T1g Gen 8 的起价约为 2,900 欧元。我们的评测机是高端配置,配备了 英特尔酷睿9 285H, GeForce RTX 507064 GB 内存、2 TB 固态硬盘和哑光 120 赫兹串联 OLED 触摸屏,售价约为 4500 欧元。
规格
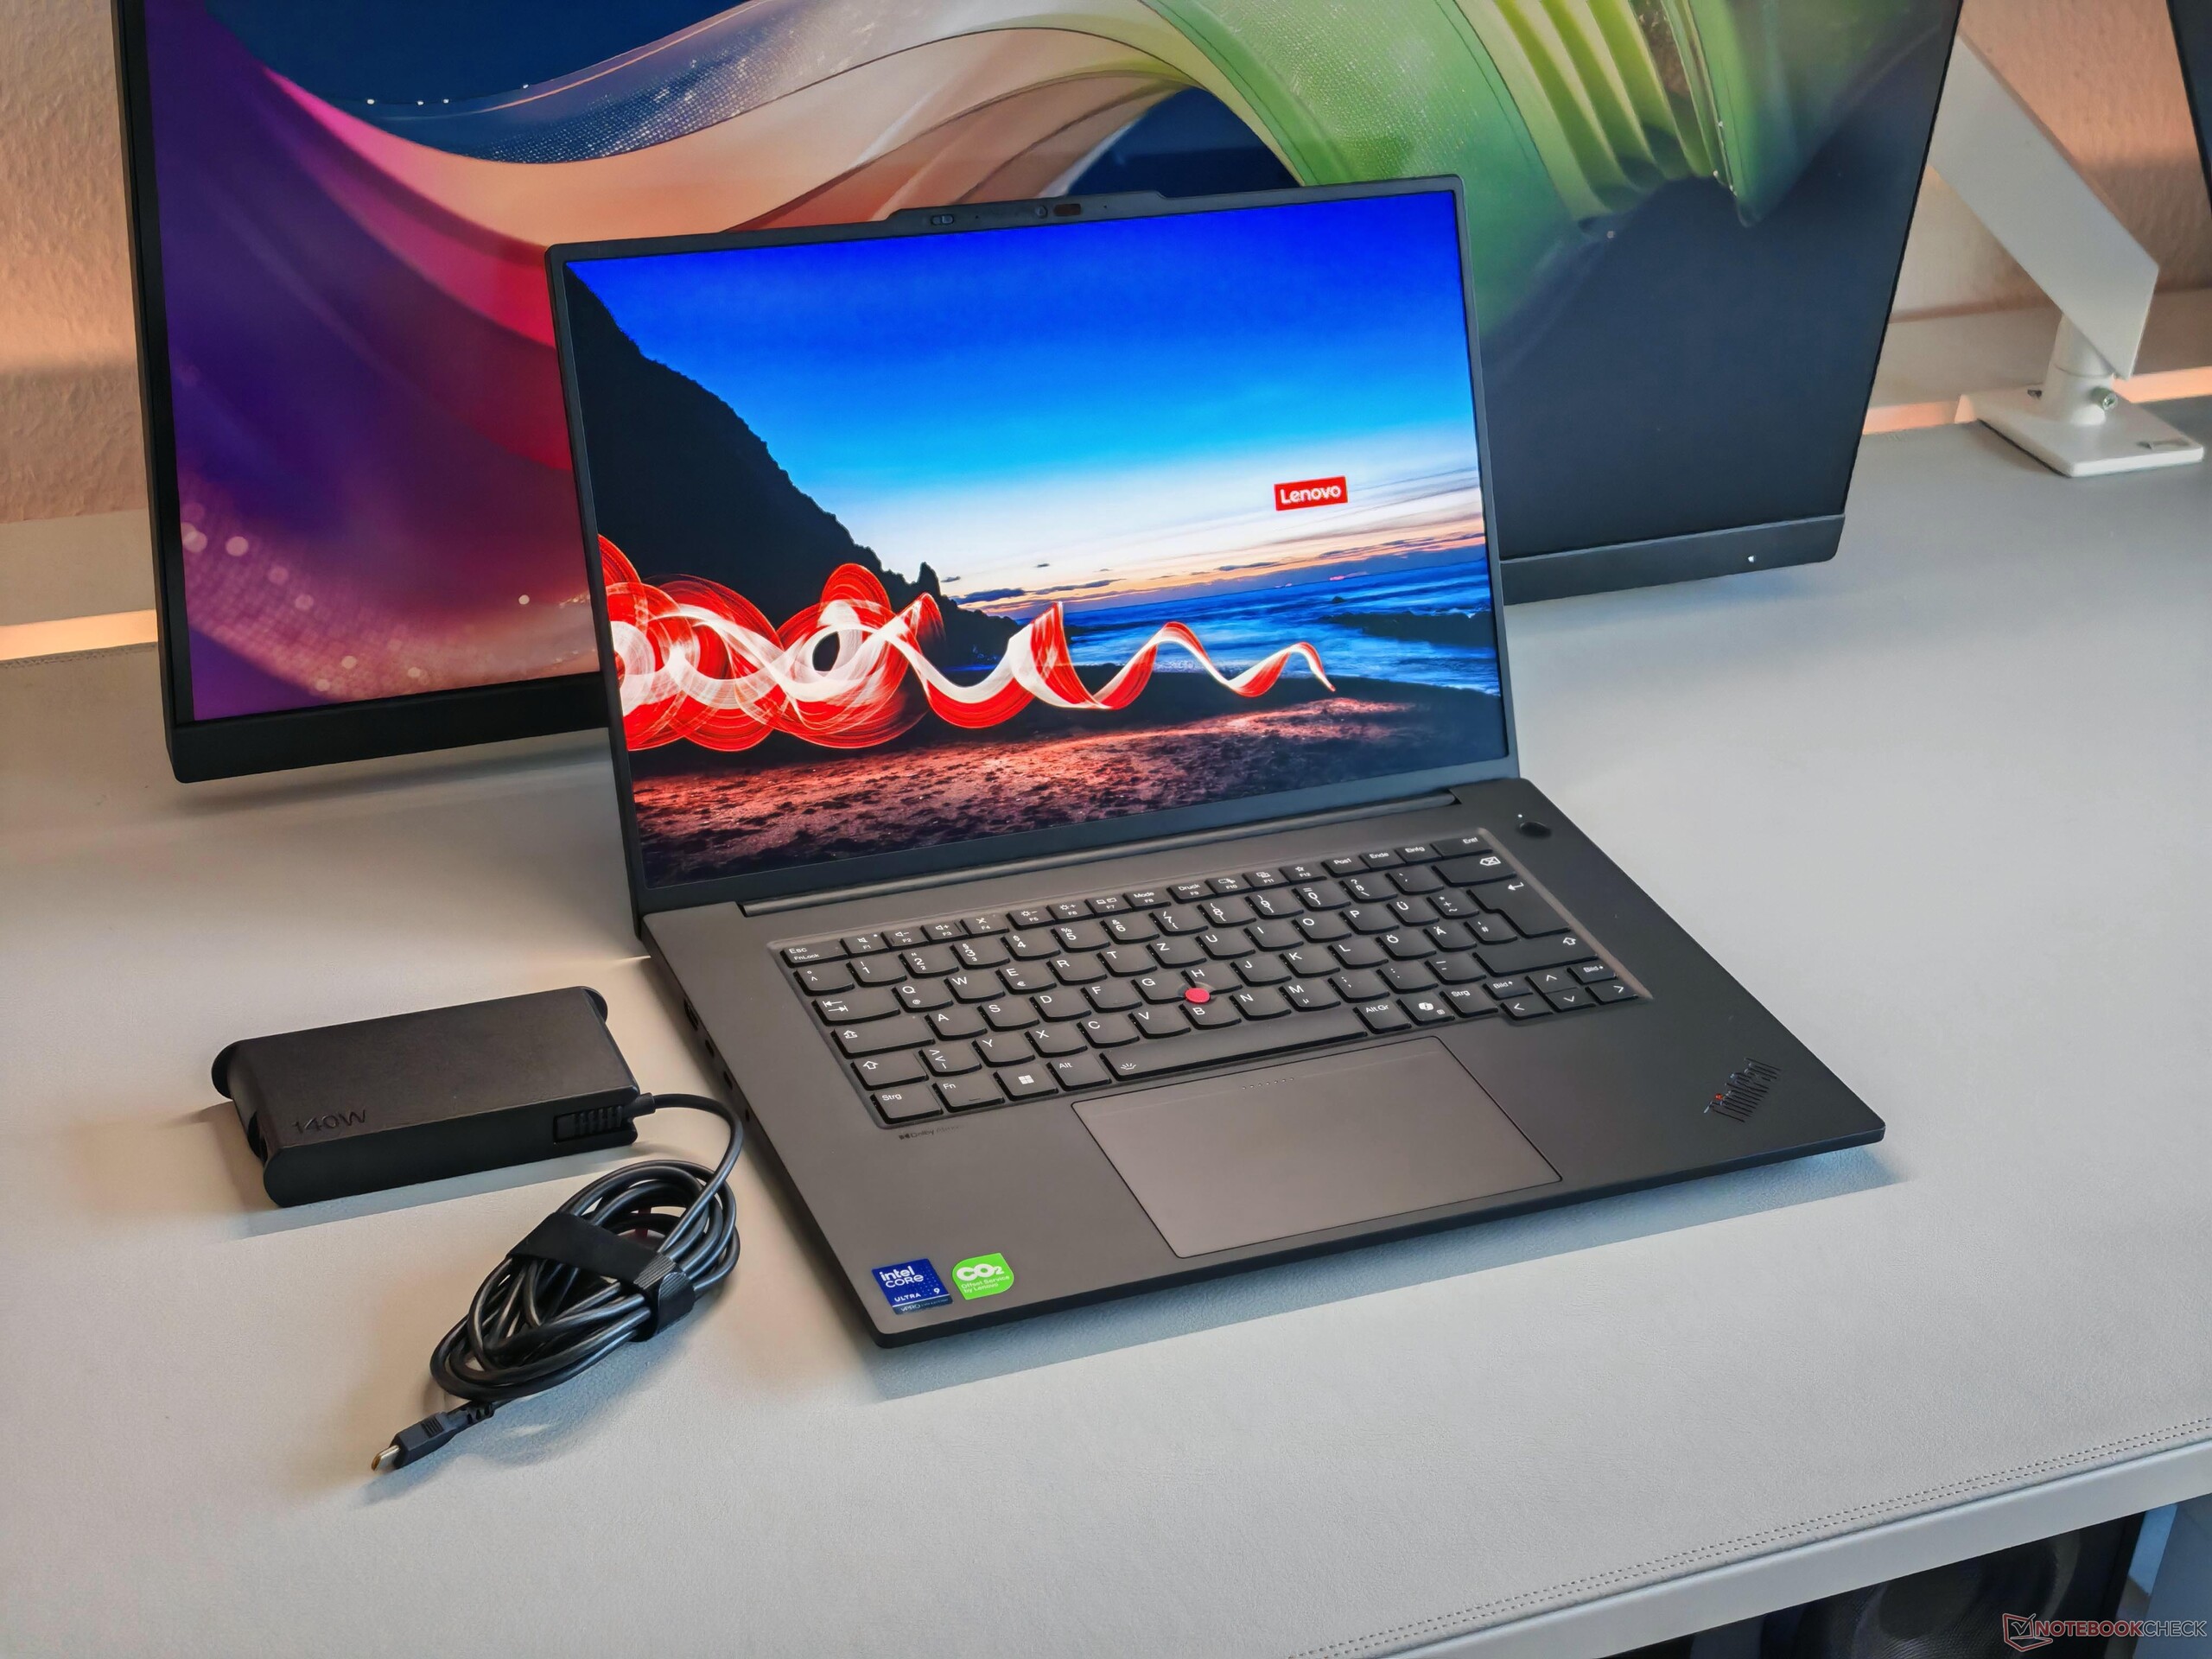
外壳和功能
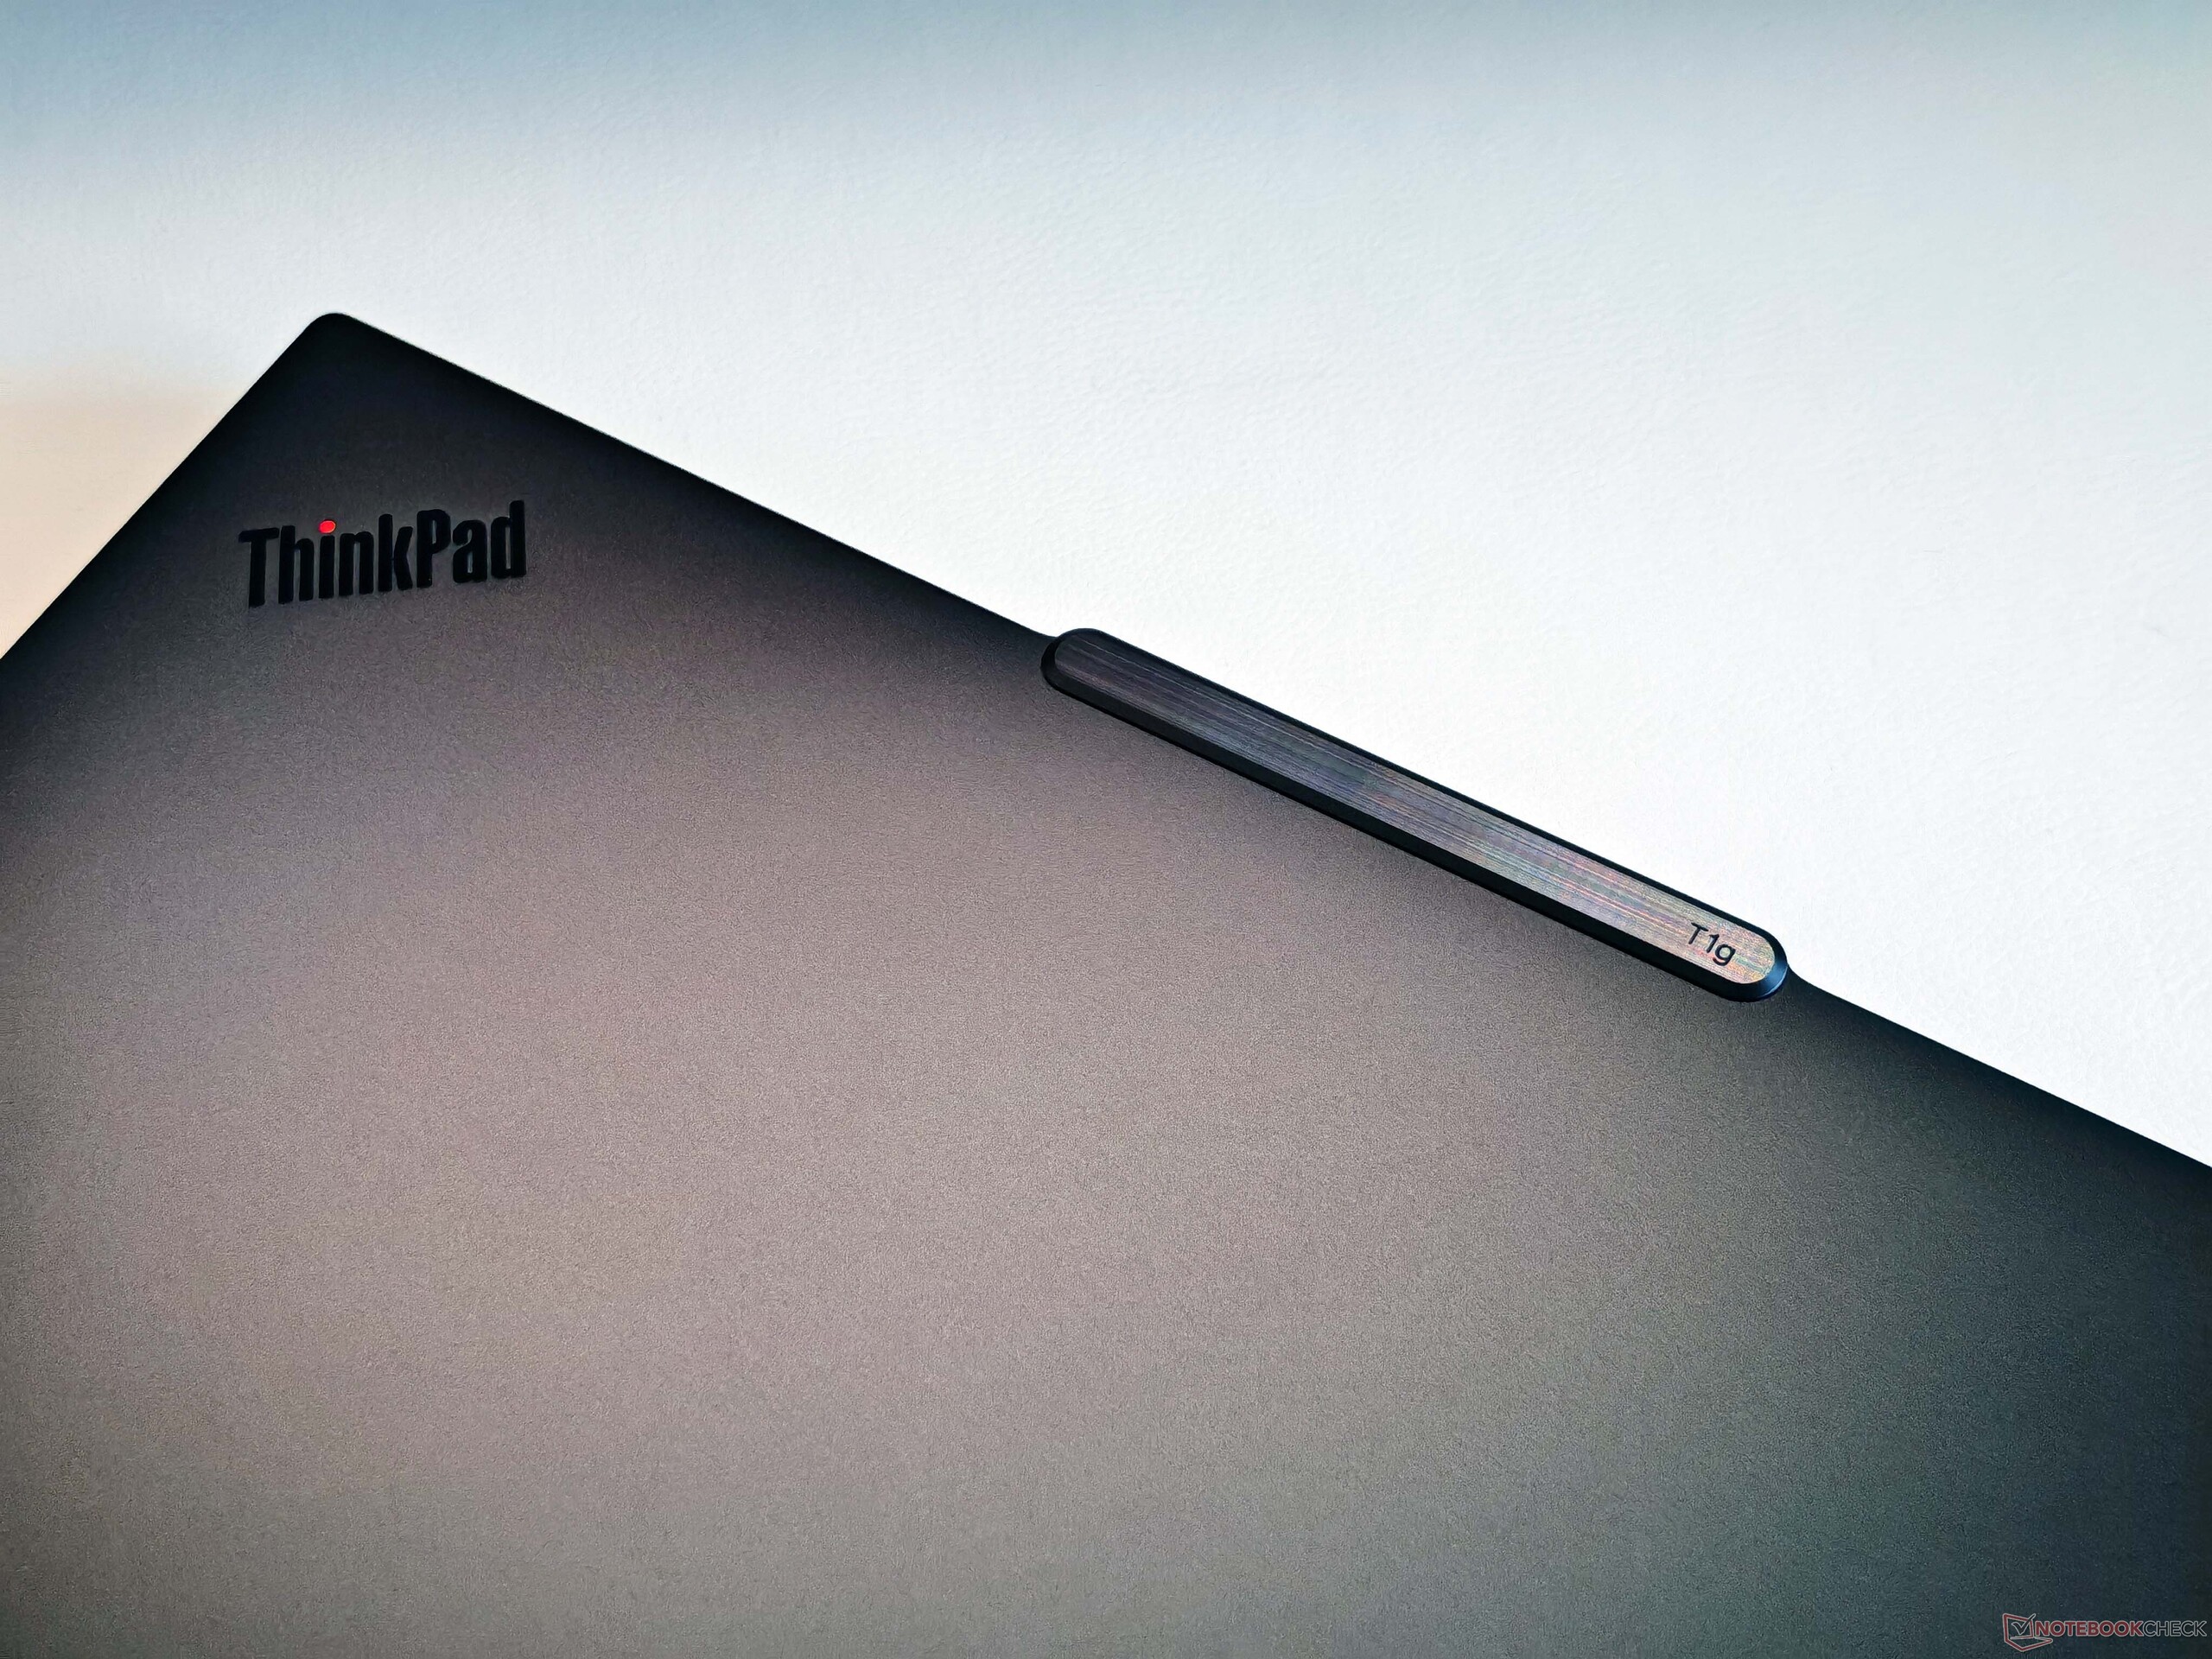
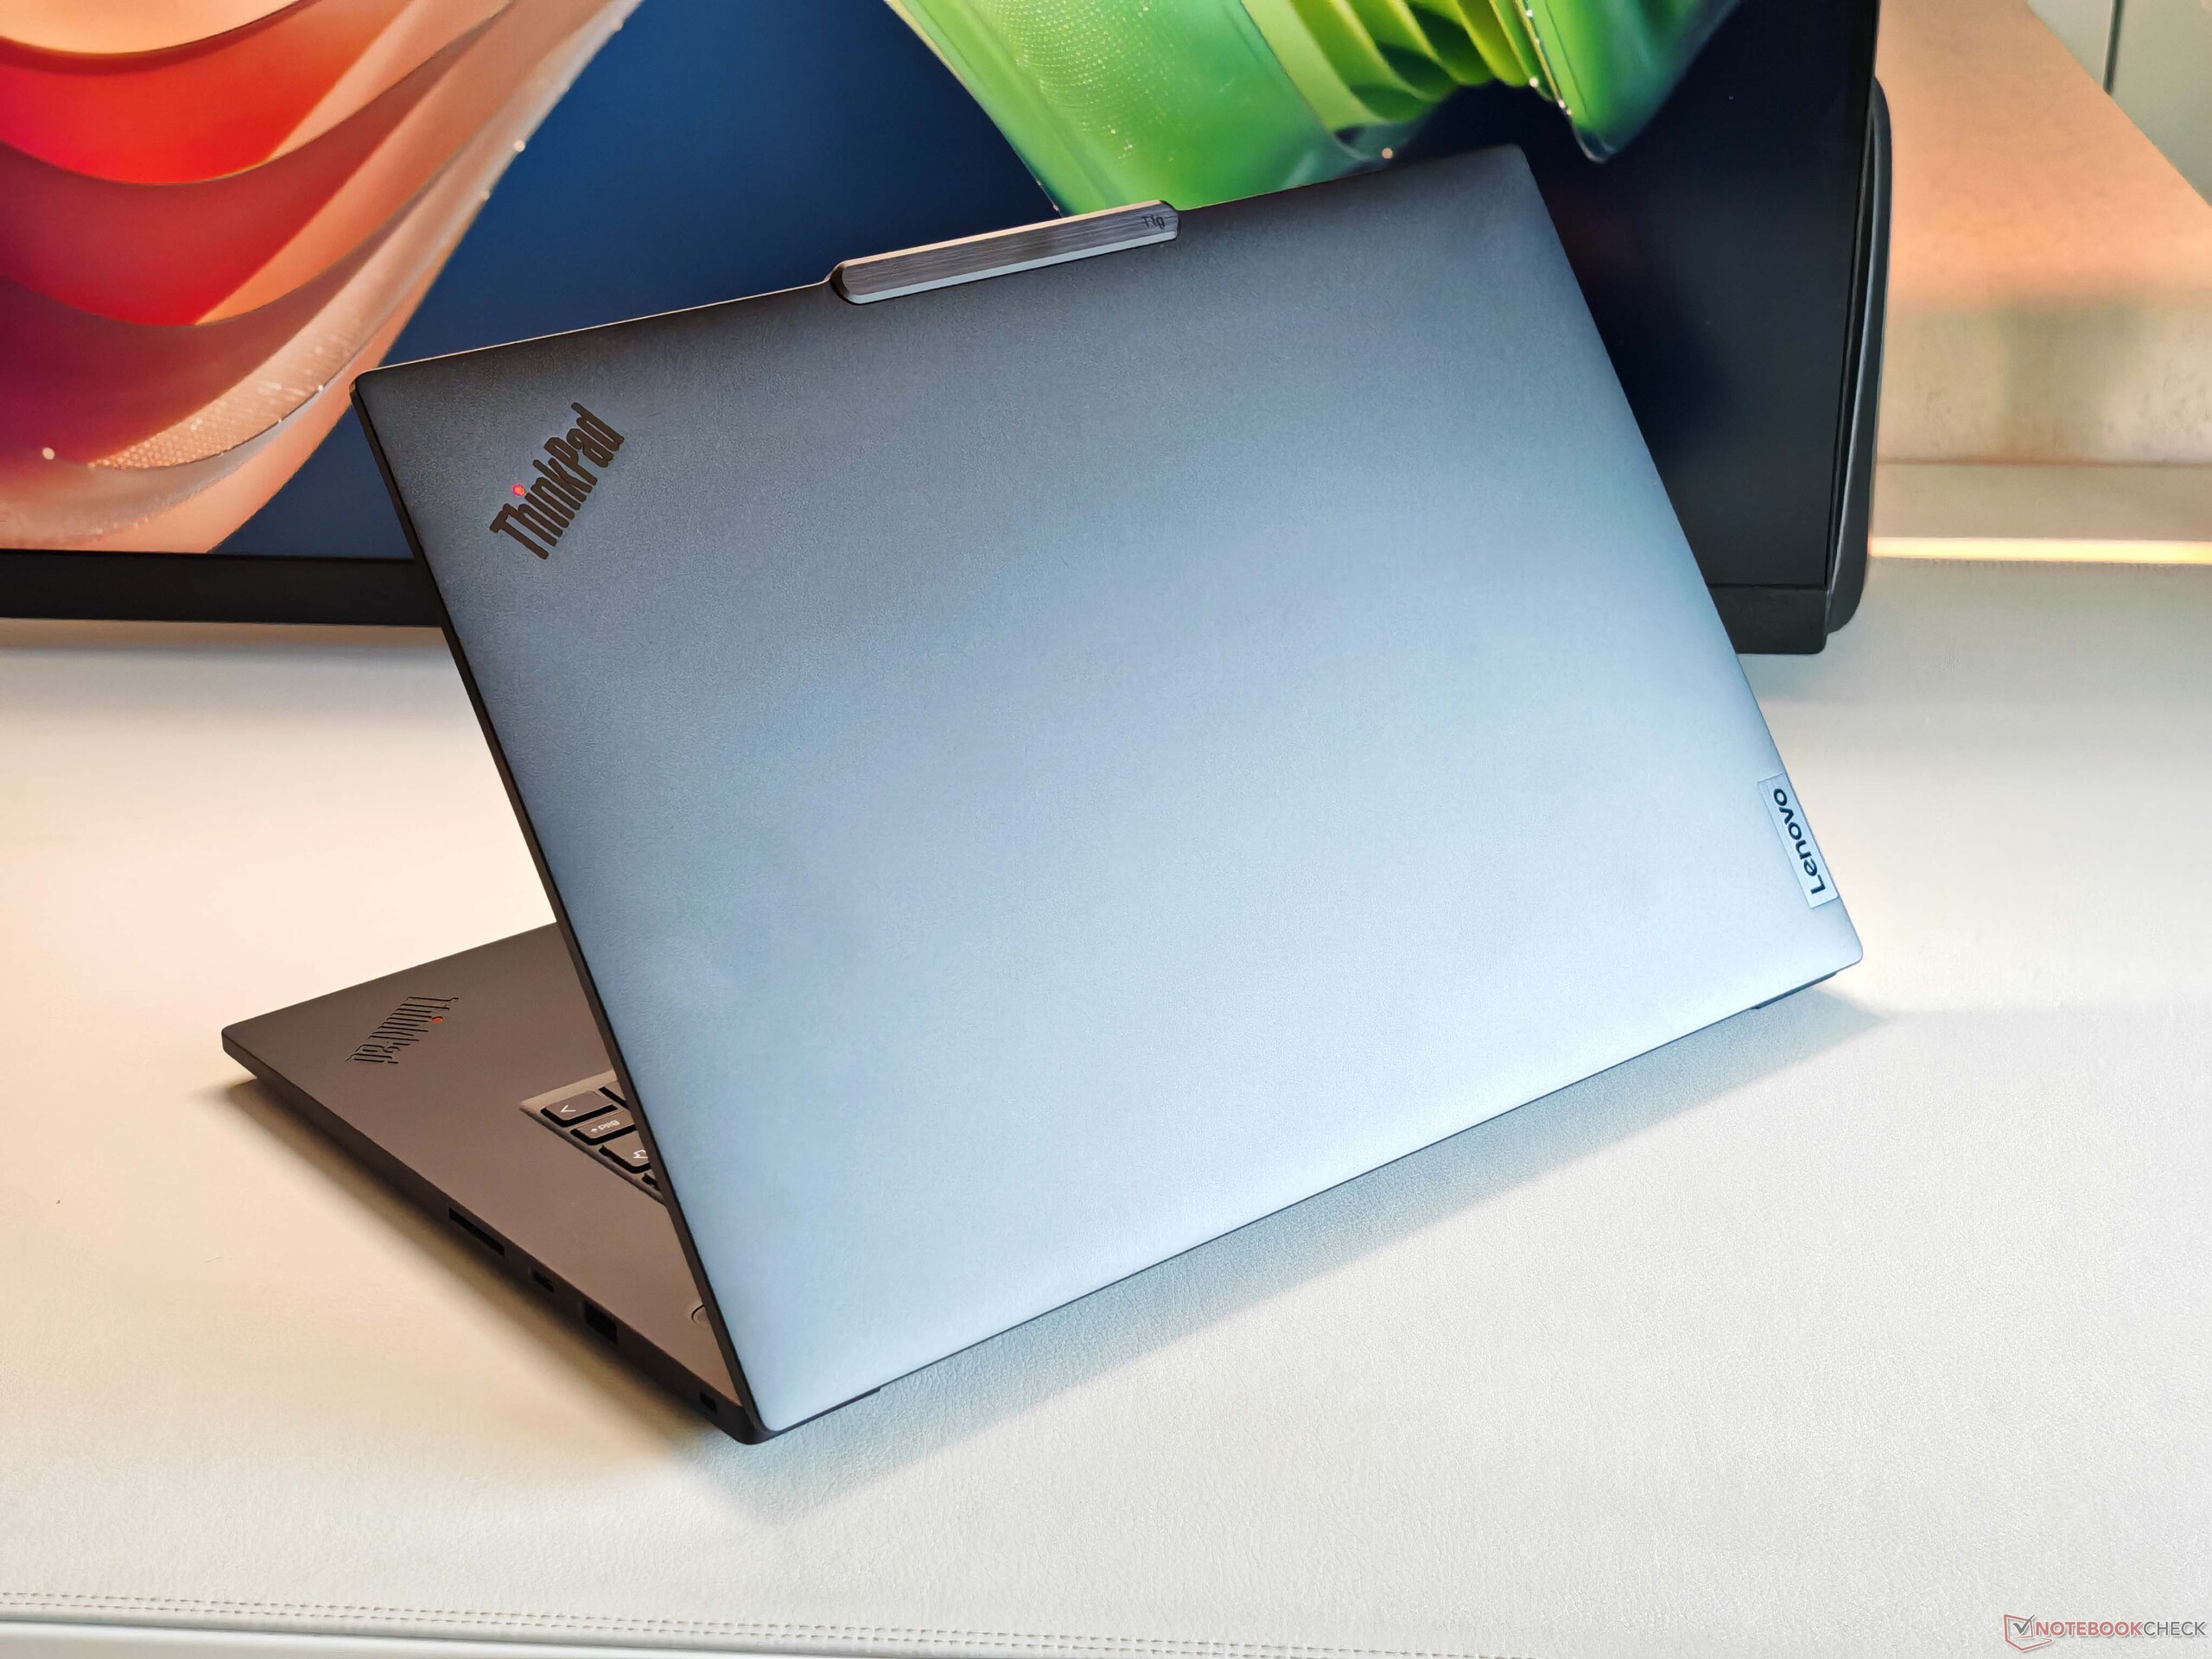
ThinkPad T1g Gen 8 的铝制机身已从 ThinkPad P1g Gen 8 中熟悉。 ThinkPad P1除了摄像头的凸起之外,ThinkPad T1g 没有什么值得批评的地方。在制造质量、手感和硬度方面,ThinkPad T1g 完全符合其高端产品的定位。光滑的显示屏盖子有点容易沾染指纹,但很容易清洁。
连接性非常稳定,USB 端口数量充足(3 个 USB-C、1 个 USB-A),左侧还提供了雷电 5 接口。SD 读卡器可完全容纳 SD 卡,但传输速率一般。Wi-Fi 模块支持 Wi-Fi 7 和蓝牙 5.4,在我们的测试中传输速度不错。不过,用户不得不放弃以太网端口和 5G 调制解调器。500 万像素网络摄像头(包括隐私快门和红外模块)可捕捉可观的图像。


| SD Card Reader | |
| average JPG Copy Test (av. of 3 runs) | |
| Lenovo ThinkPad T1g Gen 8 21TD003GE (ADATA SD8.0 Express 512 GBAV Pro V60) | |
| Lenovo ThinkPad T1g Gen 8 21TD003GE (Angelbird AV Pro V60) | |
| Asus ProArt P16 H7606WP (Angelbird AV Pro V60) | |
| Apple MacBook Pro 16 2024 M4 Pro (Angelbird AV Pro V60) | |
| Average of class Multimedia (23 - 531, n=40, last 2 years) | |
| Lenovo Yoga Pro 9i 16 RTX 5070 (Angelbird AV Pro V60) | |
| maximum AS SSD Seq Read Test (1GB) | |
| Lenovo ThinkPad T1g Gen 8 21TD003GE (ADATA SD8.0 Express 512 GB) | |
| Lenovo ThinkPad T1g Gen 8 21TD003GE (Angelbird AV Pro V60) | |
| Asus ProArt P16 H7606WP (Angelbird AV Pro V60) | |
| Apple MacBook Pro 16 2024 M4 Pro (Angelbird AV Pro V60) | |
| Average of class Multimedia (37.3 - 1455, n=39, last 2 years) | |
| Lenovo Yoga Pro 9i 16 RTX 5070 (Angelbird AV Pro V60) | |
| Networking | |
| Lenovo ThinkPad T1g Gen 8 21TD003GE | |
| iperf3 transmit AXE11000 | |
| iperf3 receive AXE11000 | |
| Lenovo Yoga Pro 9i 16 RTX 5070 | |
| iperf3 transmit AXE11000 | |
| iperf3 receive AXE11000 | |
| Asus ProArt P16 H7606WP | |
| iperf3 transmit AXE11000 | |
| iperf3 receive AXE11000 | |
| Dell 16 Premium DA16250 | |
| iperf3 transmit AXE11000 | |
| iperf3 receive AXE11000 | |
| iperf3 transmit AXE11000 6GHz | |
| iperf3 receive AXE11000 6GHz | |
| Apple MacBook Pro 16 2024 M4 Pro | |
| iperf3 transmit AXE11000 | |
| iperf3 receive AXE11000 | |


维护
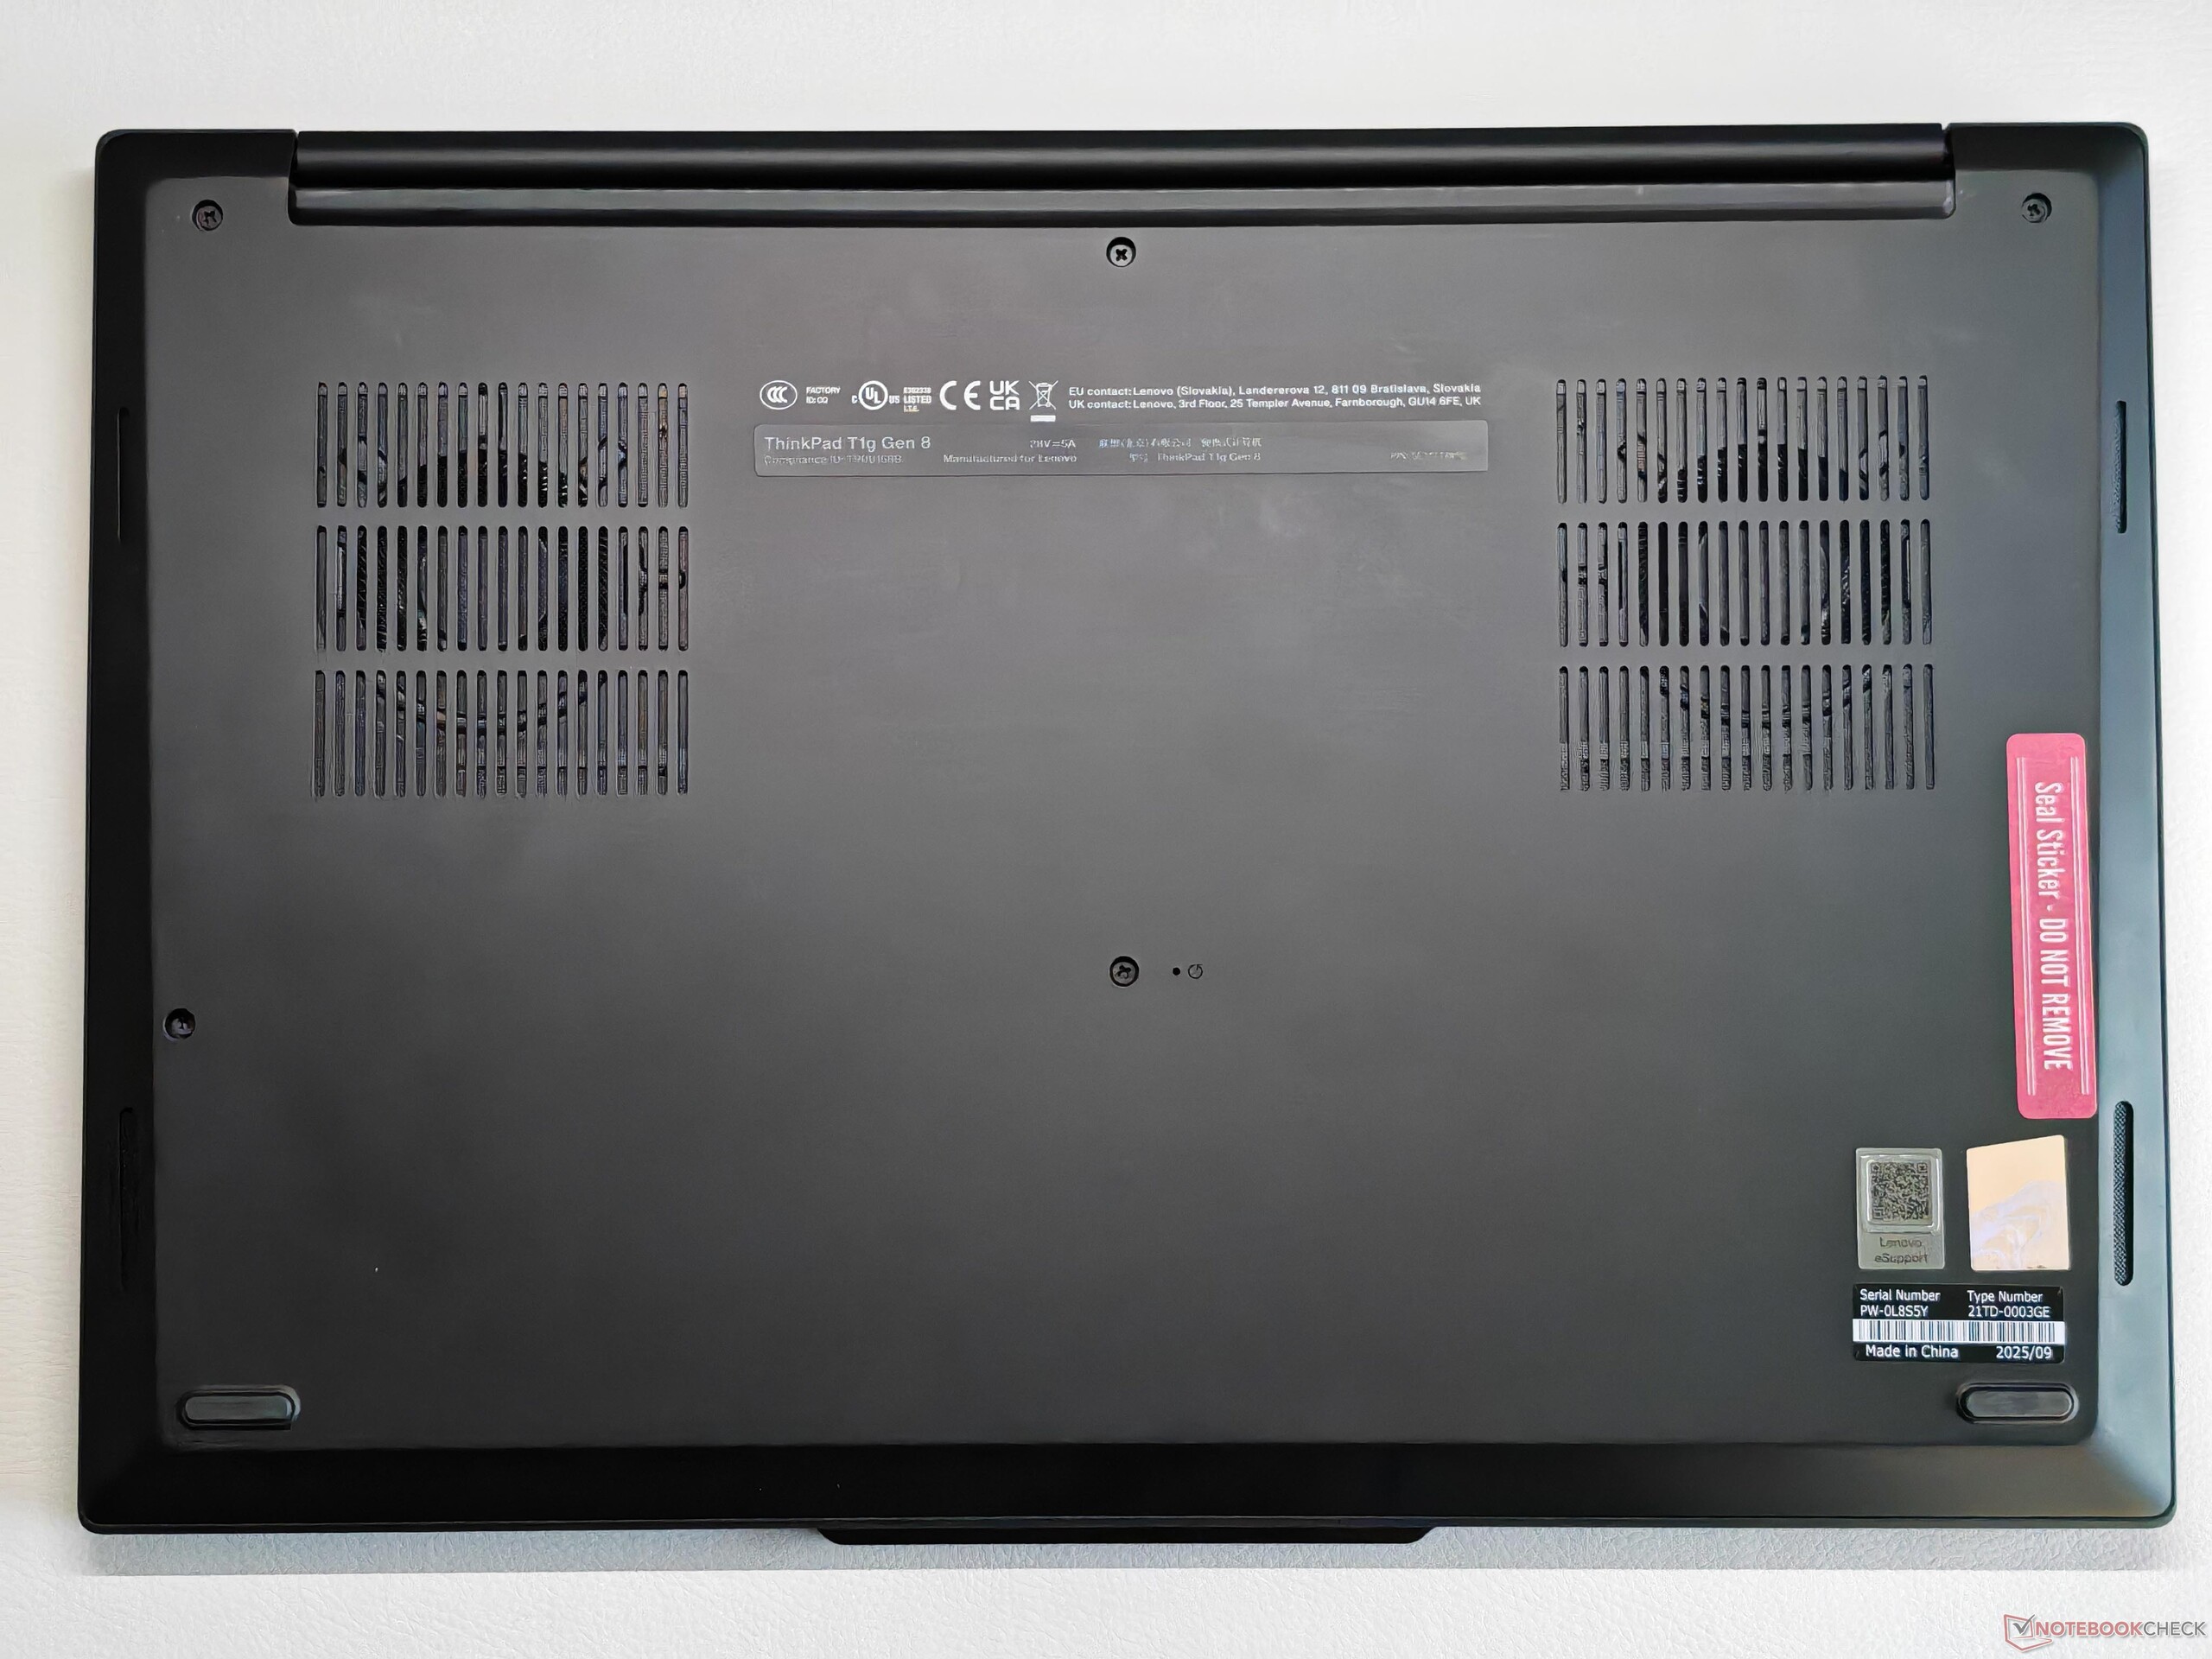
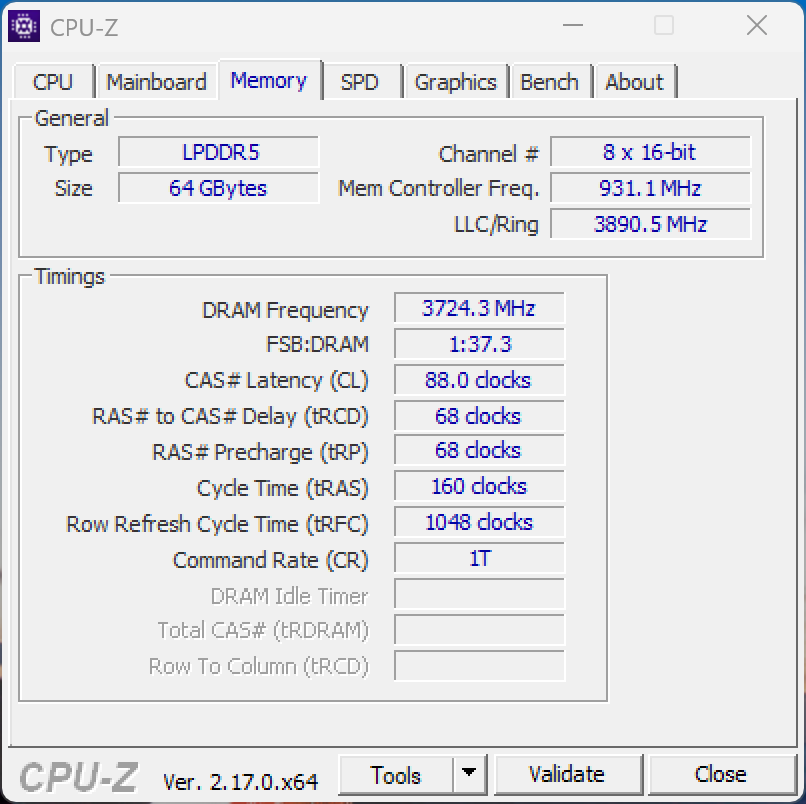
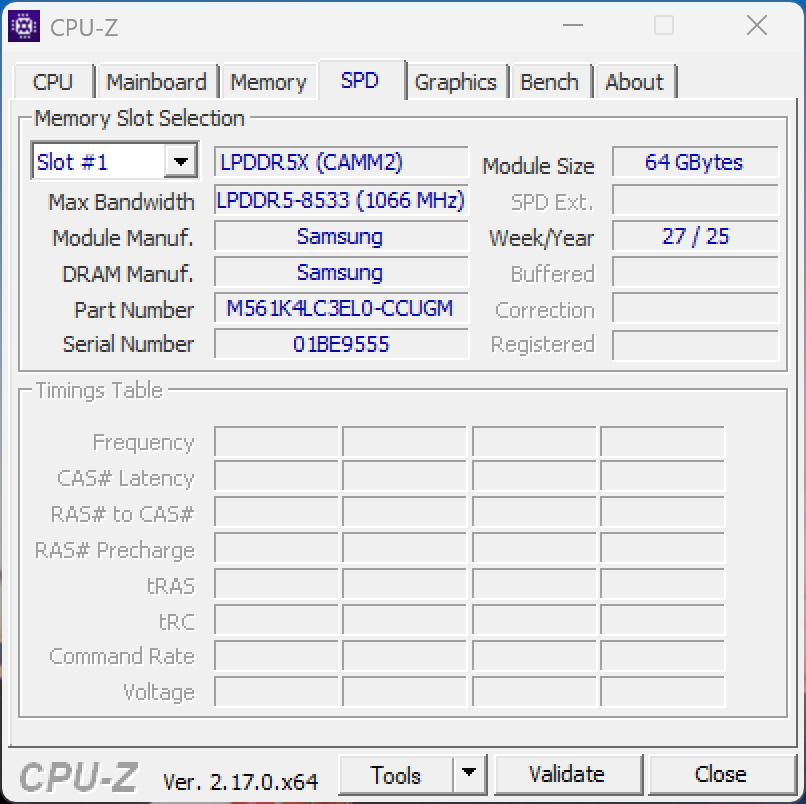
总体而言,维护选项不错,内存可通过 CAMM2 模块进行更换,但最大支持容量仅限于 64 GB。此外,还有两个 M.2-2280 SSD 插槽(PCIe 5.0),电池也可以更换。不过,Wi-Fi 模块是焊接到位的。


可持续性
联想在设备的二氧化碳排放量和可回收材料的使用方面提供了广泛的透明度。

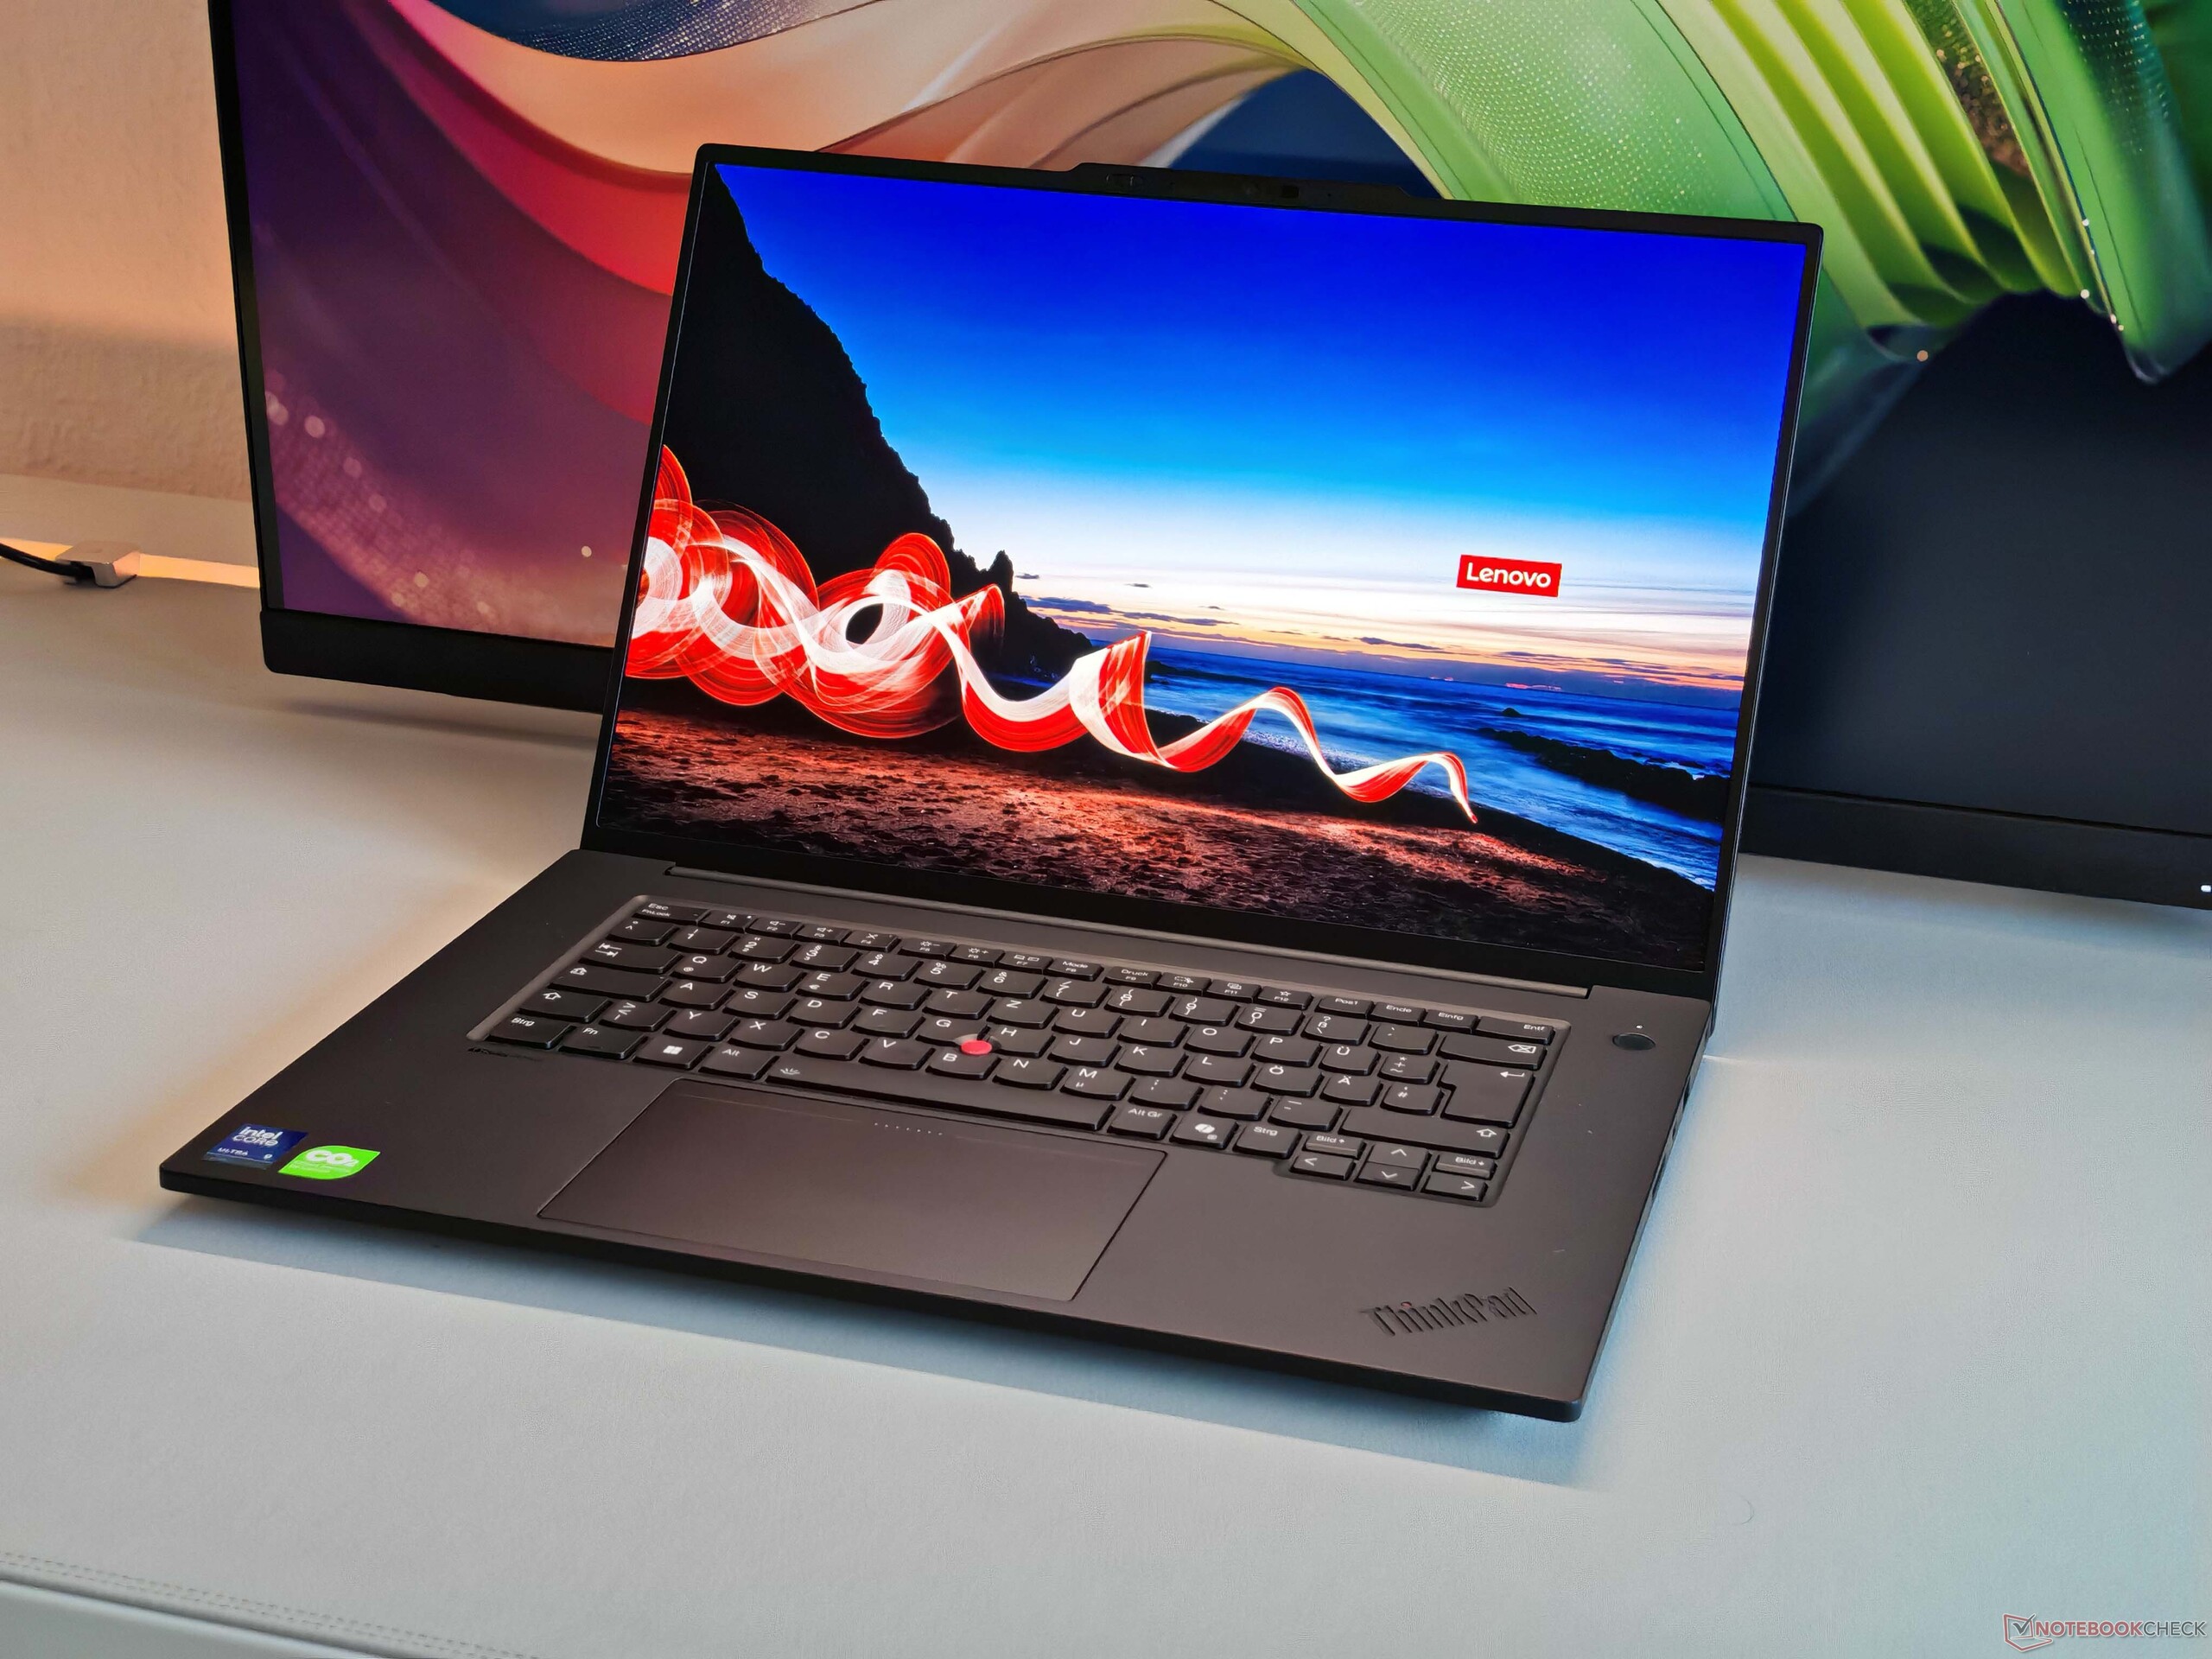
输入设备 - 出色的键盘
尽管背光键盘的布局在某些地方并不理想(例如,元音键较窄),但键入体验非常出色,无疑是联想目前提供的最好的移动键盘之一。主观感觉上,键程超过了 1.5 毫米,唤起了人们对旧款 ThinkPad 的回忆。
触觉触摸板也表现出色,尤其是与 TrackPoint 结合使用时。如需了解更多详细信息,请参阅我们对 ThinkPad P1 第 7 代.此外,OLED 面板还支持触控输入,而且运行稳定,包装盒中还附带了一支触控笔。


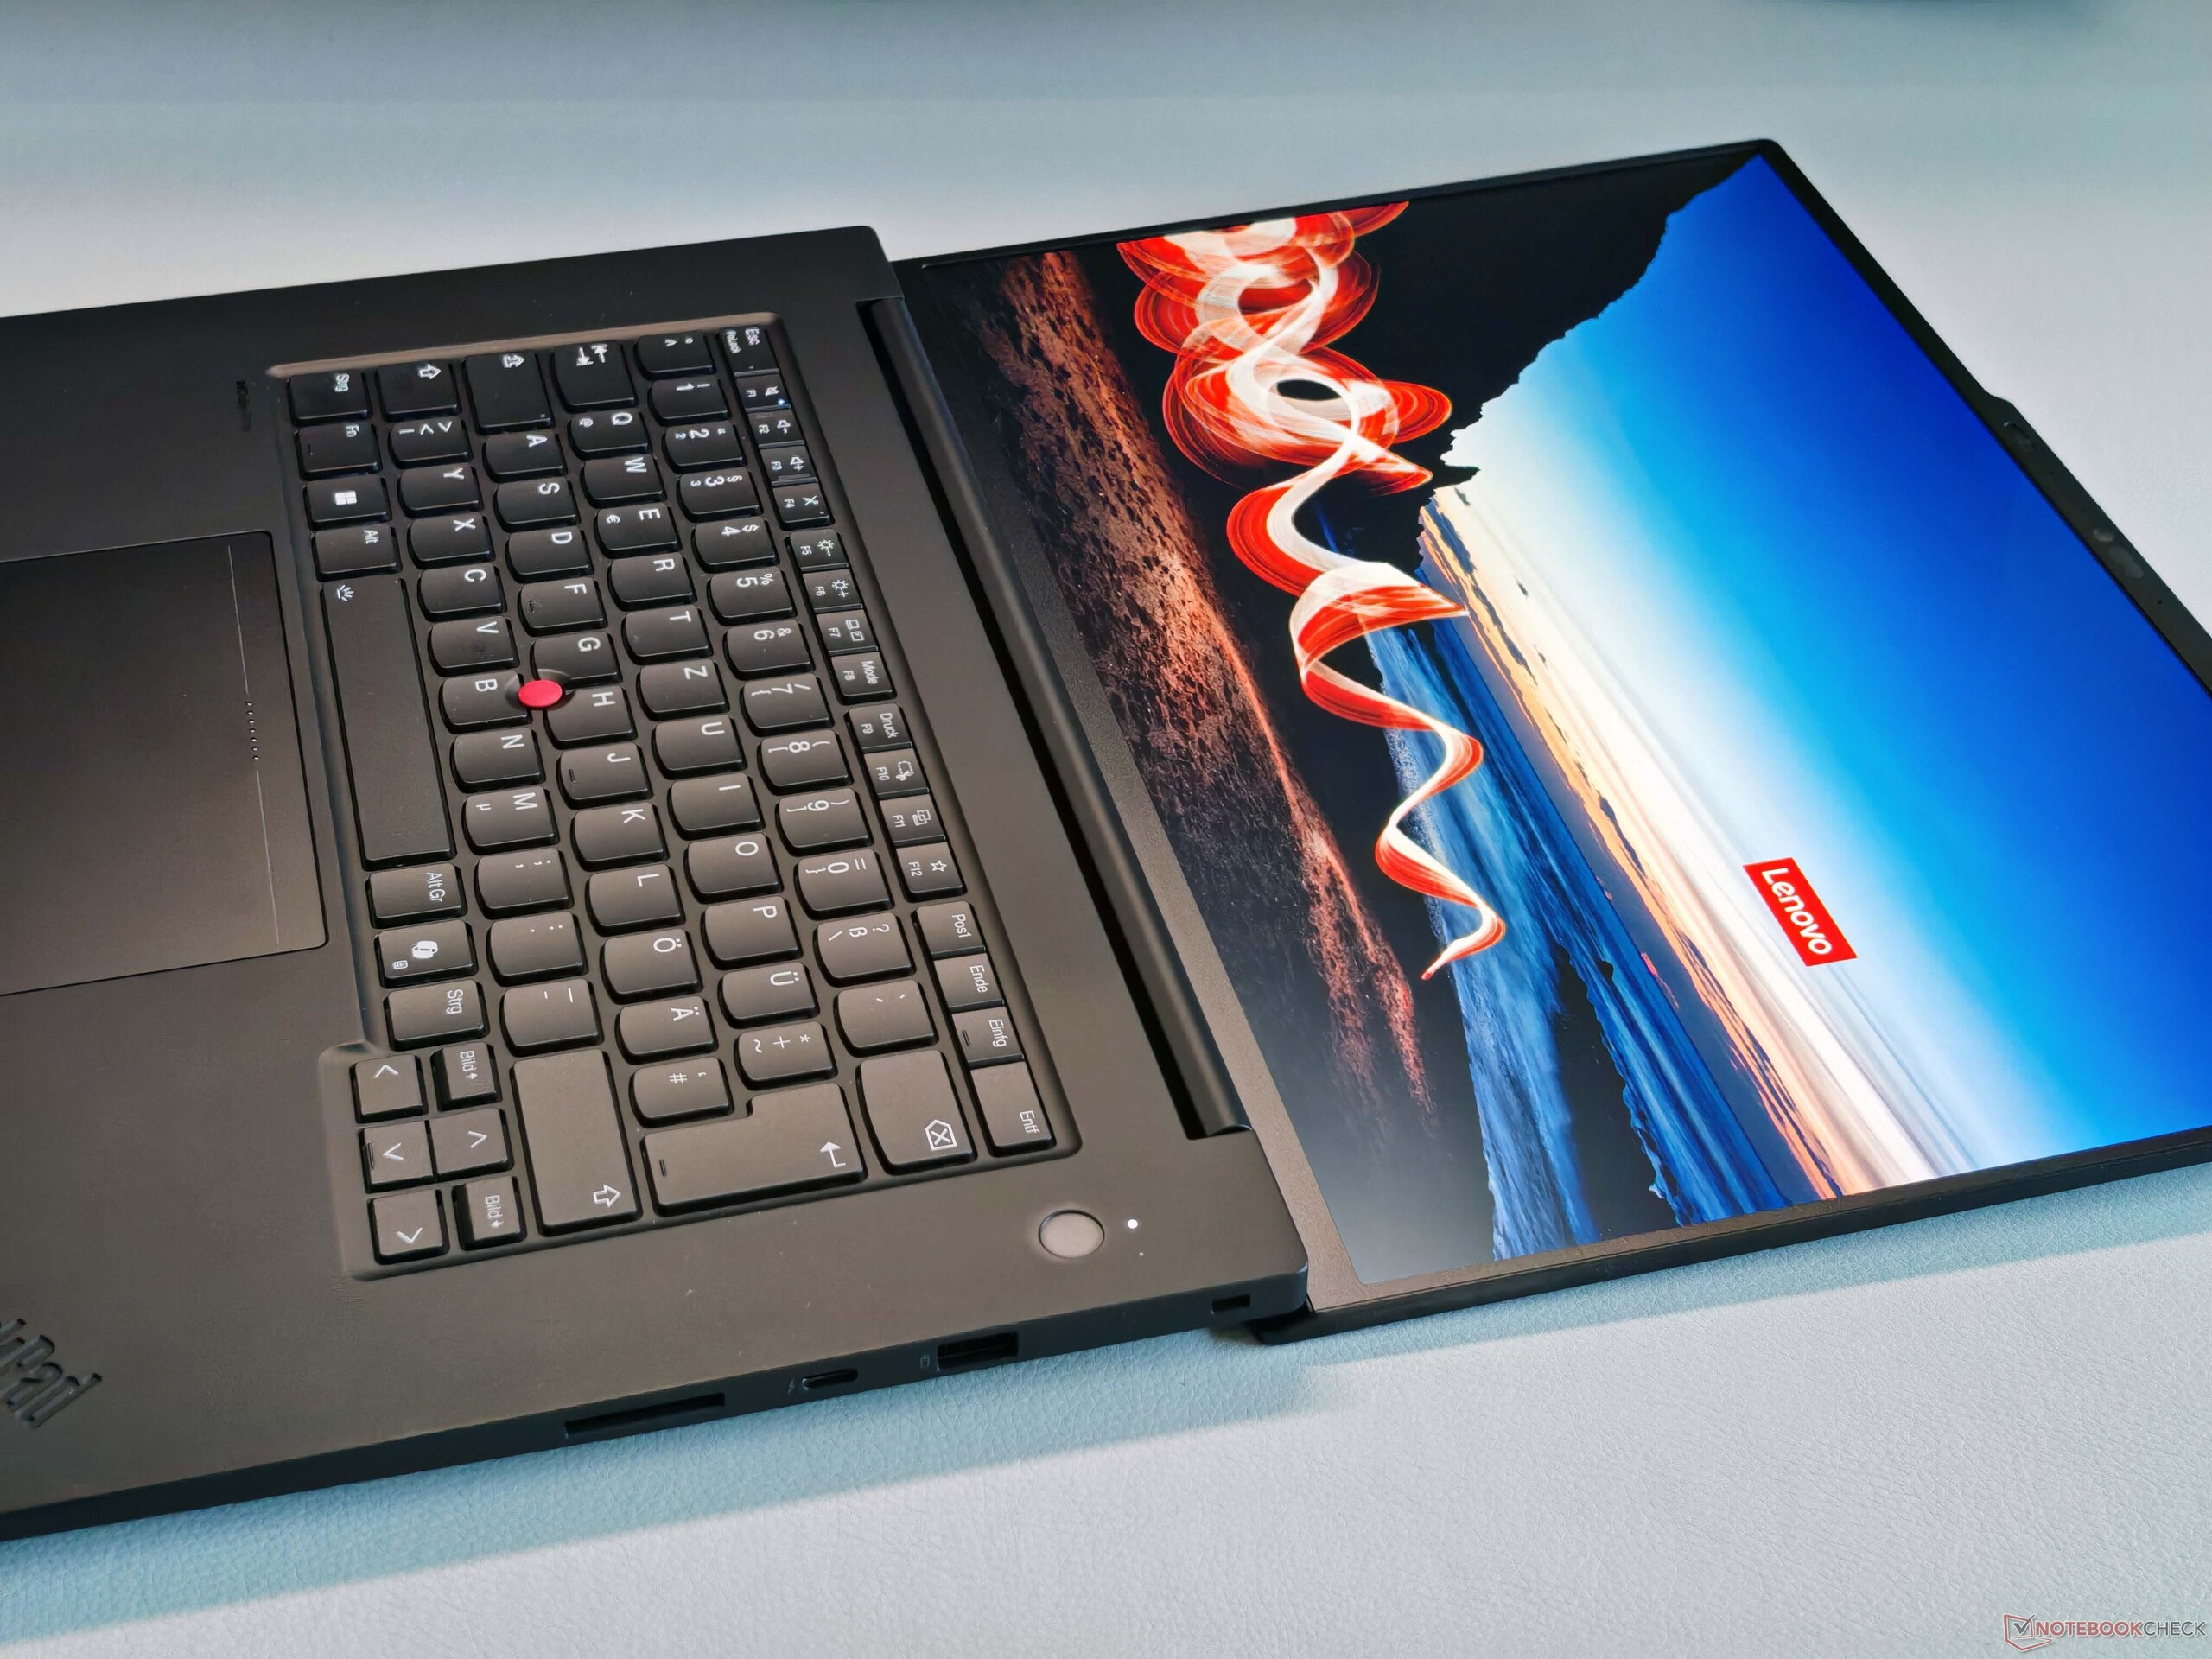
显示屏 - Matte Tandem OLED 触摸屏

除了两款 IPS 面板(全高清或 4K,均为 60 Hz)外,联想还提供了一款 120 Hz 的哑光 Tandem OLED 面板(VRR),我们的测试机就配备了这款面板。这种选择的主要缺点是,哑光表面加上触摸屏层,导致图像印象略有颗粒感,尤其是在亮度较高的内容上。因此,主观图像质量比竞争对手(如 Yoga Pro 9i 16等竞争对手相比,主观画质略显逊色。好的一面是,反光现象得到了有效消除。
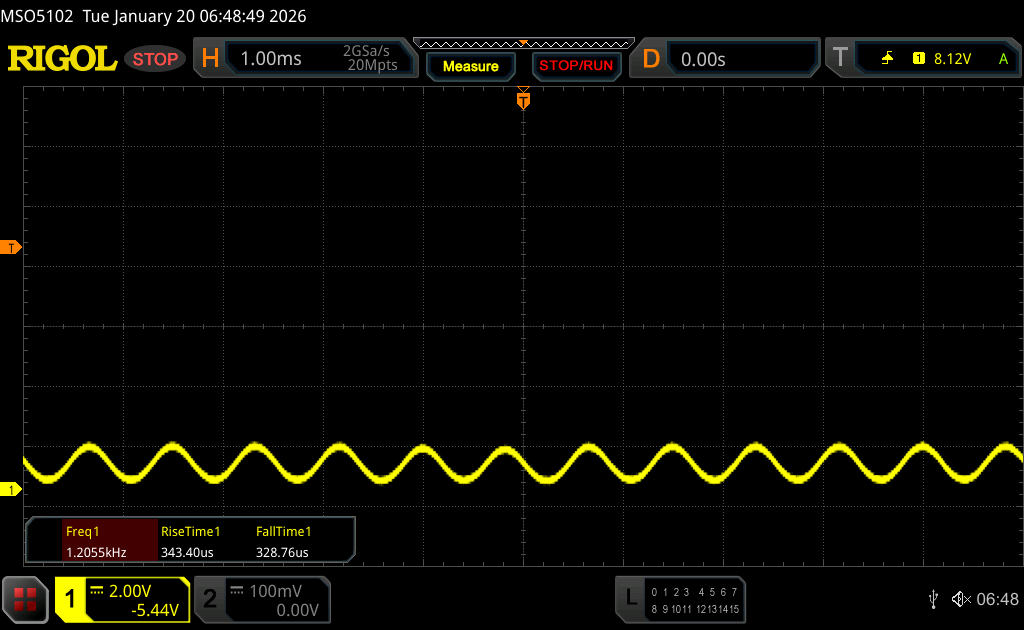
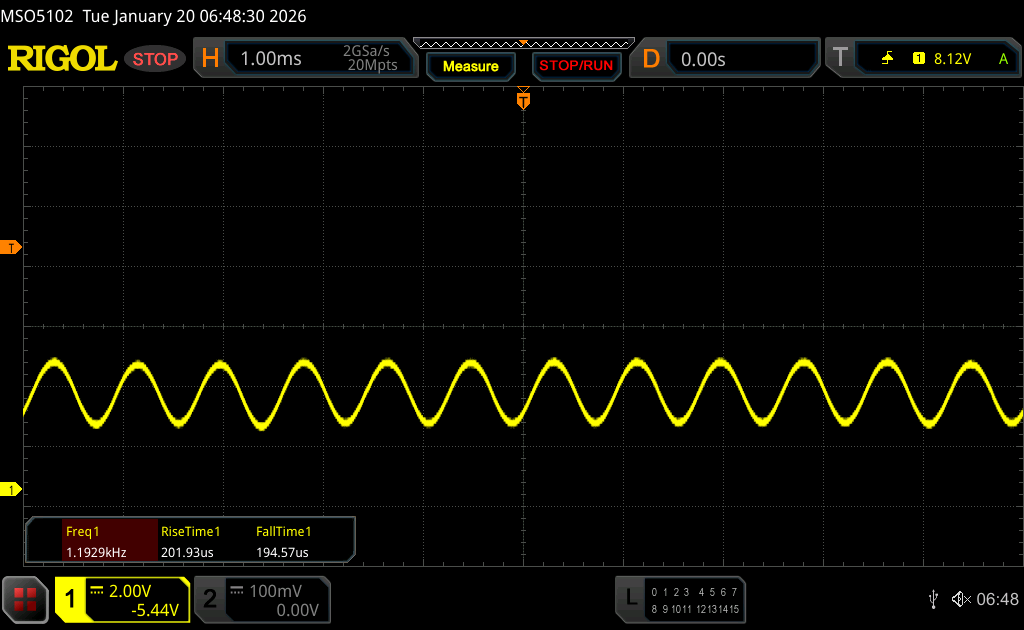
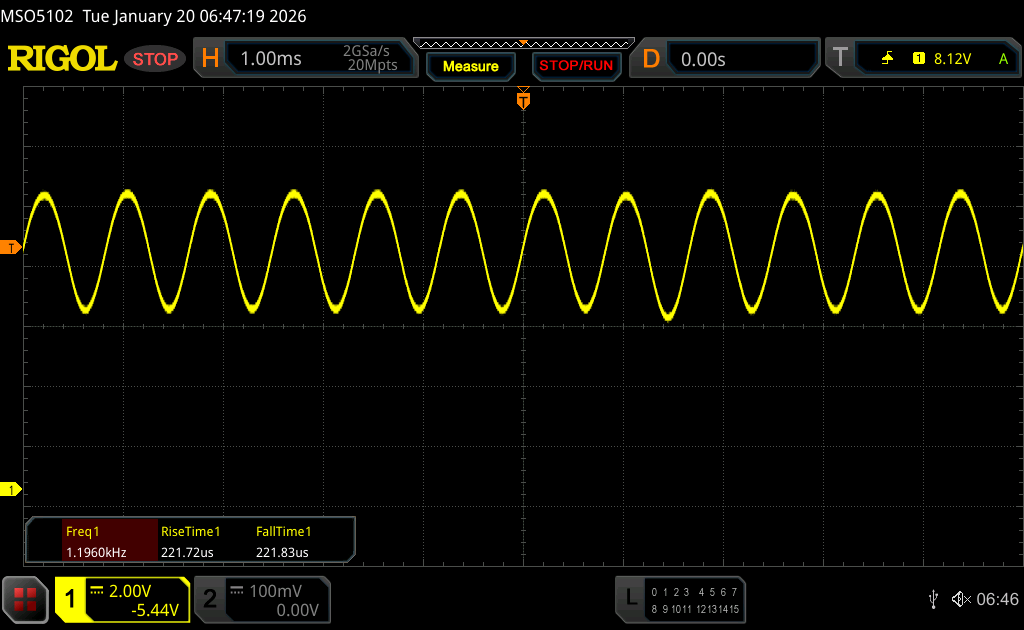
亮度在 70% 及以下时,会出现可测量的 PWM 闪烁。不过,由于频率较高,约为 1.2 kHz,振幅较低,因此在实际使用中不会造成任何重大问题。
SDR 亮度可达到约 600 cd/m²,而 HDR 内容的峰值可达 1,530 cd/m²(或 753 cd/m²,图像几乎全白)。开箱即可使用多种色彩配置文件,sRGB 和 P3(每种配置文件都完全覆盖)的色彩准确度都不错。不过,灰度还原还可以稍好一些,而我们自己的校准并没有带来进一步的改进。
| |||||||||||||||||||||||||
Brightness Distribution: 98 %
Center on Battery: 578 cd/m²
Contrast: ∞:1 (Black: 0 cd/m²)
ΔE ColorChecker Calman: 1.6 | ∀{0.5-29.43 Ø4.71}
ΔE Greyscale Calman: 2.6 | ∀{0.09-98 Ø4.96}
88.9% AdobeRGB 1998 (Argyll 3D)
100% sRGB (Argyll 3D)
98.8% Display P3 (Argyll 3D)
Gamma: 2.19
CCT: 6527 K
| Lenovo ThinkPad T1g Gen 8 21TD003GE ATNA60KA02-0, Tandem-OLED, 3200x2000, 16", 120 Hz | Lenovo Yoga Pro 9i 16 RTX 5070 ATNA60KA01-0, OLED, 3200x2000, 16", 120 Hz | Asus ProArt P16 RTX 5090 ATNA60HC03-0, OLED, 3840x2400, 16", 120 Hz | Dell 16 Premium DA16250 Samsung 163DU02, OLED, 3840x2400, 16.3", 120 Hz | Apple MacBook Pro 16 2024 M4 Pro Mini-LED, 3456x2234, 16.2", 120 Hz | |
|---|---|---|---|---|---|
| Display | 3% | 0% | 0% | 0% | |
| Display P3 Coverage (%) | 98.8 | 97.4 -1% | 98.9 0% | 99.7 1% | 99.7 1% |
| sRGB Coverage (%) | 100 | 100 0% | 100 0% | 100 0% | 100 0% |
| AdobeRGB 1998 Coverage (%) | 88.9 | 96.8 9% | 88.6 0% | 88.1 -1% | 88.8 0% |
| Response Times | 3% | -32% | -101% | -8819% | |
| Response Time Grey 50% / Grey 80% * (ms) | 0.26 ? | 0.27 ? -4% | 0.3 ? -15% | 0.61 ? -135% | 43 ? -16438% |
| Response Time Black / White * (ms) | 0.42 ? | 0.37 ? 12% | 0.45 ? -7% | 0.88 ? -110% | 41.2 ? -9710% |
| PWM Frequency (Hz) | 1200 ? | 1200 | 480 ? | 490.8 ? | 14880 |
| PWM Amplitude * (%) | 22 | 22 -0% | 38 -73% | 35 -59% | 90 -309% |
| Screen | 49% | 41% | 6% | 36% | |
| Brightness middle (cd/m²) | 578 | 974 69% | 661 14% | 385.7 -33% | 632 9% |
| Brightness (cd/m²) | 583 | 979 68% | 663 14% | 387 -34% | 616 6% |
| Brightness Distribution (%) | 98 | 98 0% | 99 1% | 98 0% | 95 -3% |
| Black Level * (cd/m²) | |||||
| Colorchecker dE 2000 * | 1.6 | 0.9 44% | 0.5 69% | 1.36 15% | 0.6 63% |
| Colorchecker dE 2000 max. * | 4.5 | 1.7 62% | 1.4 69% | 2.85 37% | 1.2 73% |
| Greyscale dE 2000 * | 2.6 | 1.3 50% | 0.6 77% | 1.3 50% | 0.8 69% |
| Gamma | 2.19 100% | 2.21 100% | 2.19 100% | 2.2 100% | 2.21 100% |
| CCT | 6527 100% | 6751 96% | 6565 99% | 6282 103% | 6450 101% |
| Colorchecker dE 2000 calibrated * | 0.65 | ||||
| Total Average (Program / Settings) | 18% /
26% | 3% /
12% | -32% /
-22% | -2928% /
-2187% |
* ... smaller is better


Display Response Times
| ↔ Response Time Black to White | ||
|---|---|---|
| 0.42 ms ... rise ↗ and fall ↘ combined | ↗ 0.23 ms rise | 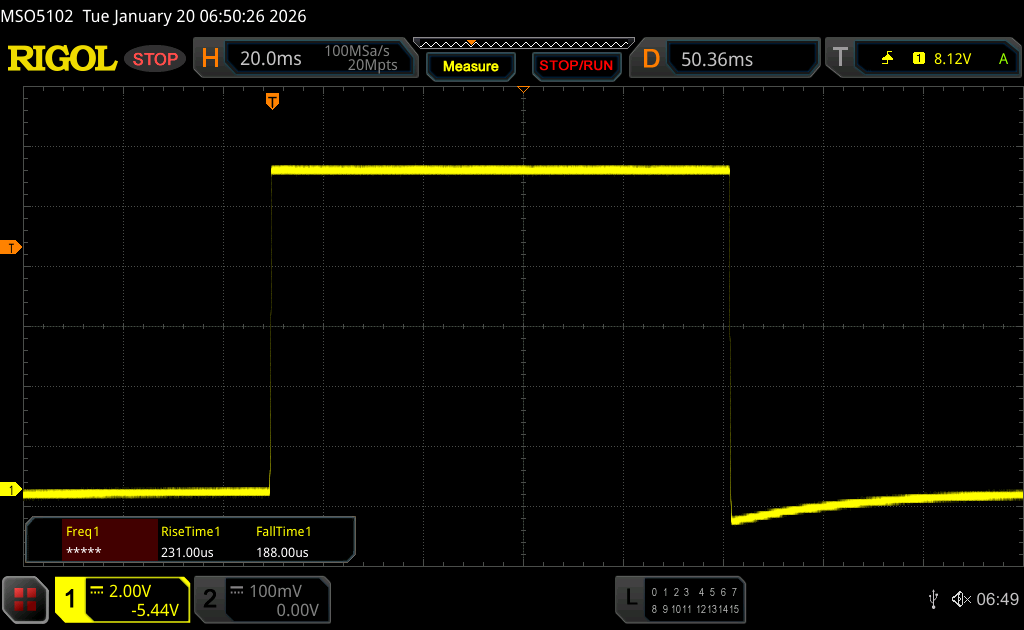 |
| ↘ 0.19 ms fall | ||
| The screen shows very fast response rates in our tests and should be very well suited for fast-paced gaming. In comparison, all tested devices range from 0.1 (minimum) to 240 (maximum) ms. » 1 % of all devices are better. This means that the measured response time is better than the average of all tested devices (19.8 ms). | ||
| ↔ Response Time 50% Grey to 80% Grey | ||
| 0.26 ms ... rise ↗ and fall ↘ combined | ↗ 0.12 ms rise | 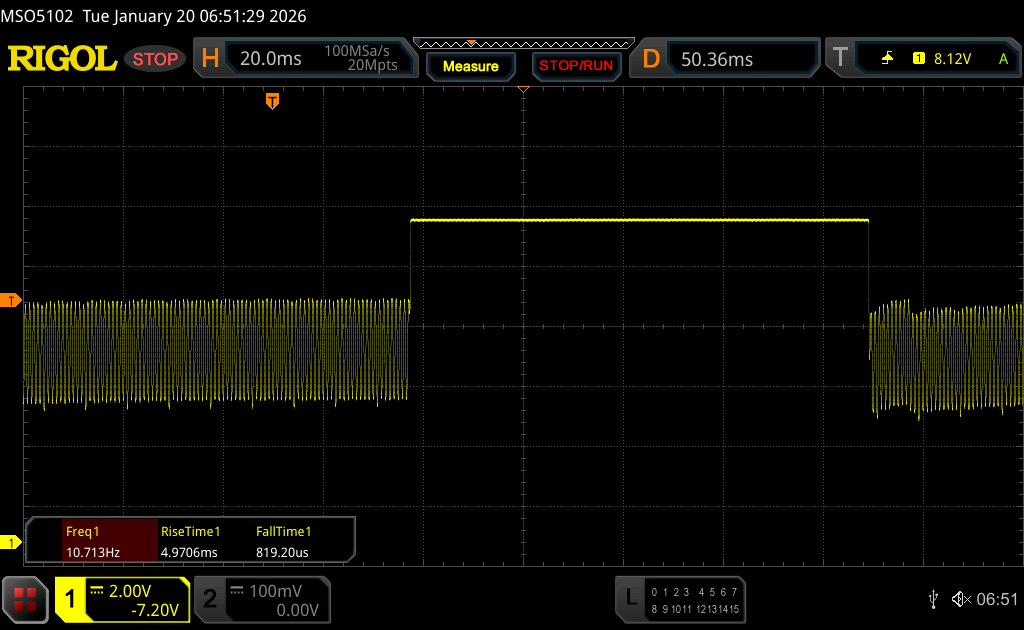 |
| ↘ 0.14 ms fall | ||
| The screen shows very fast response rates in our tests and should be very well suited for fast-paced gaming. In comparison, all tested devices range from 0.165 (minimum) to 636 (maximum) ms. » 0 % of all devices are better. This means that the measured response time is better than the average of all tested devices (31 ms). | ||
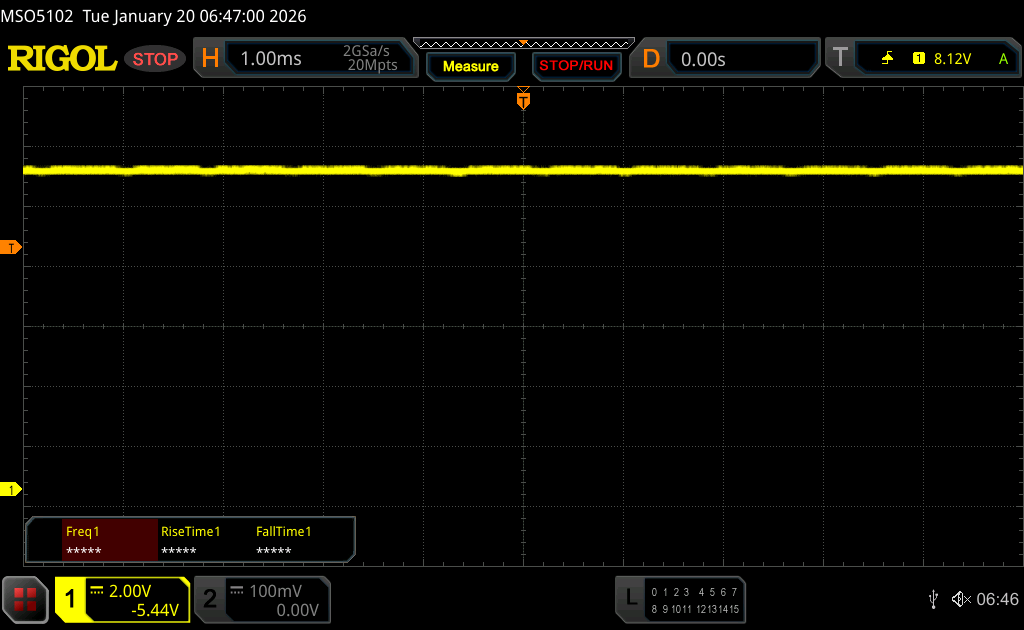
Screen Flickering / PWM (Pulse-Width Modulation)
| Screen flickering / PWM detected | 1200 Hz Amplitude: 22 % | ≤ 70 % brightness setting | 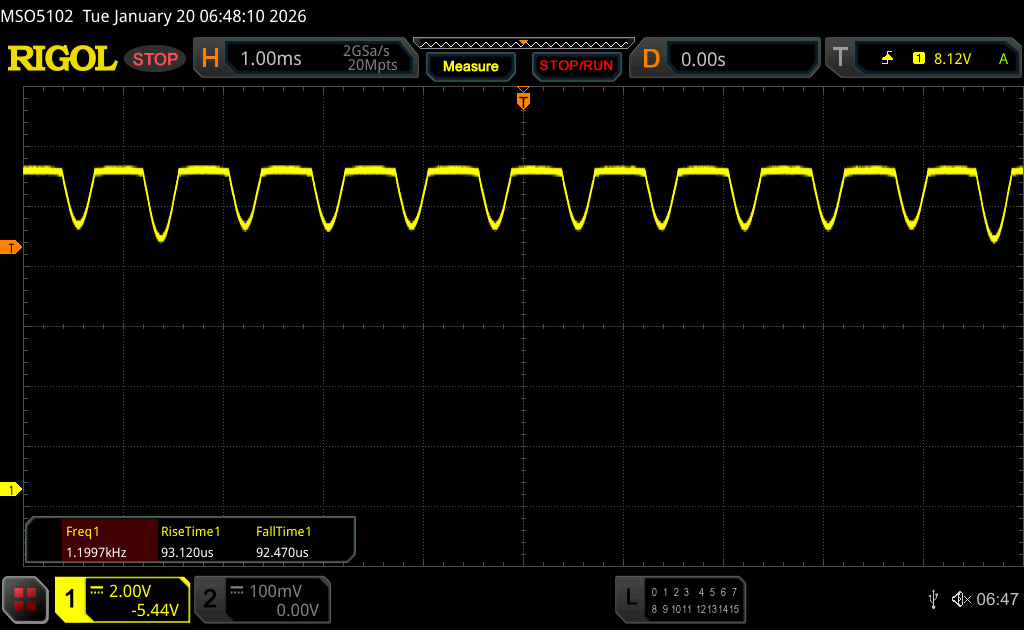 |
The display backlight flickers at 1200 Hz (worst case, e.g., utilizing PWM) Flickering detected at a brightness setting of 70 % and below. There should be no flickering or PWM above this brightness setting. The frequency of 1200 Hz is quite high, so most users sensitive to PWM should not notice any flickering. In comparison: 52 % of all tested devices do not use PWM to dim the display. If PWM was detected, an average of 7757 (minimum: 5 - maximum: 343500) Hz was measured. | |||


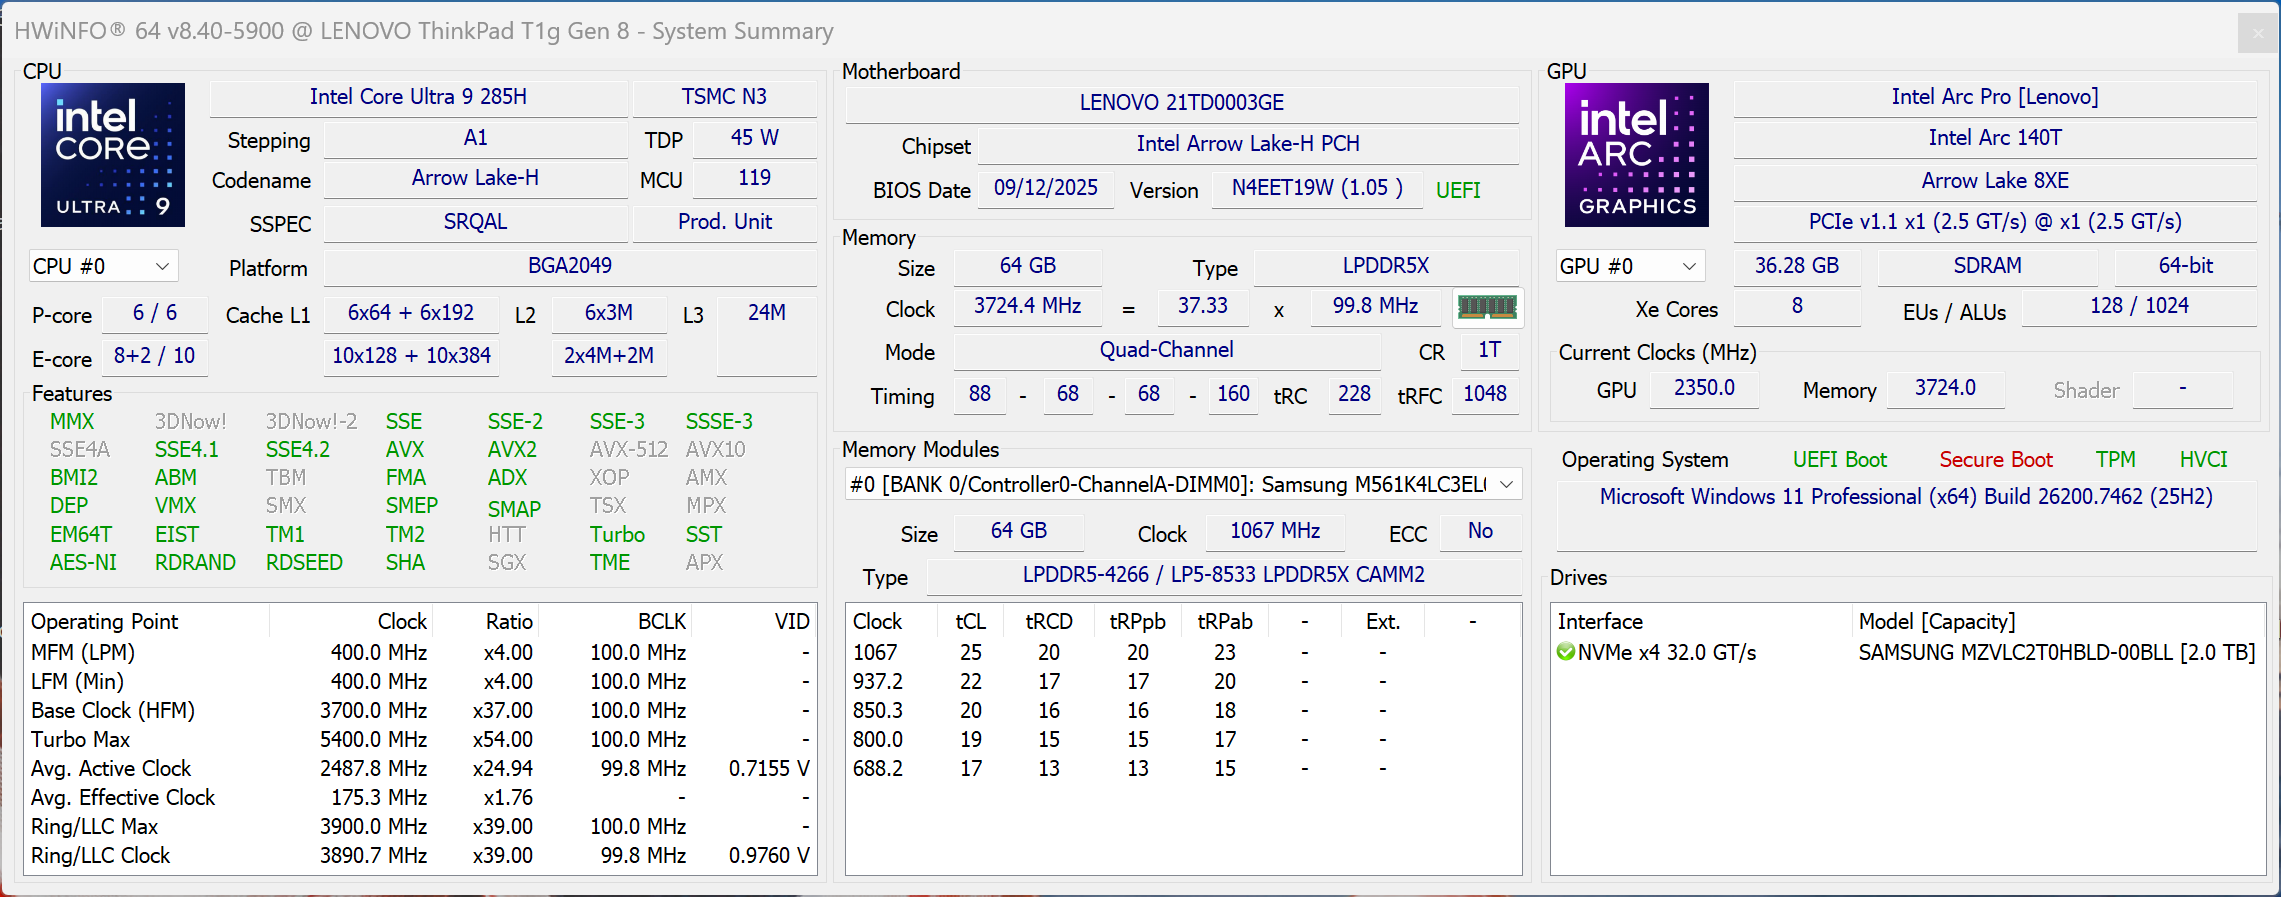
性能 - 箭湖和布莱克韦尔
测试条件
与 ThinkPad 的典型做法一样,联想的电源配置文件与 Windows 的电源设置直接相关。所有基准测试均使用最佳性能模式进行。
处理器
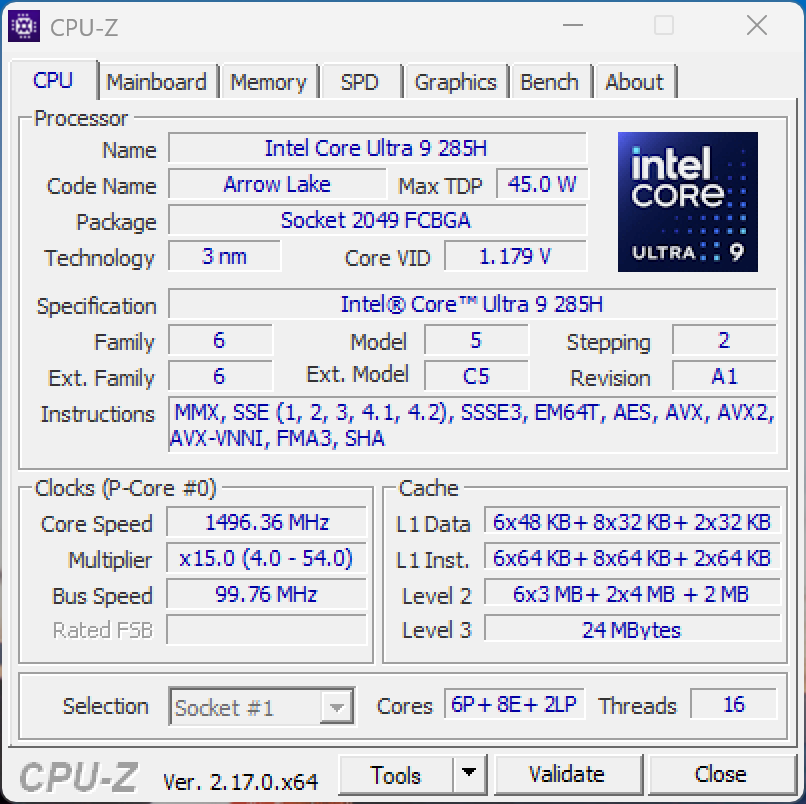
联想为 ThinkPad T1g Gen 8 配备了 英特尔酷睿9 285H(箭湖处理器),允许短时功耗高达 105 瓦,然后稳定在 74 瓦左右。CPU 性能整体表现强劲,与基于 Windows 的竞争对手基本处于同一水平,只有Apple的 M4 Max的性能明显不同。
使用电池供电时,处理器的最大功率限制为 45 瓦,多核性能仅略微降低约 11%。
Cinebench R15 多持续测试
Cinebench 2024: CPU Multi Core | CPU Single Core
Cinebench R23: Multi Core | Single Core
Cinebench R20: CPU (Multi Core) | CPU (Single Core)
Cinebench R15: CPU Multi 64Bit | CPU Single 64Bit
Blender: v2.79 BMW27 CPU
7-Zip 18.03: 7z b 4 | 7z b 4 -mmt1
Geekbench 6.7: Multi-Core | Single-Core
Geekbench 5.5: Multi-Core | Single-Core
HWBOT x265 Benchmark v2.2: 4k Preset
LibreOffice : 20 Documents To PDF
R Benchmark 2.5: Overall mean
| CPU Performance rating | |
| Apple MacBook Pro 16 M4 Max -8! | |
| Lenovo Yoga Pro 9i 16 RTX 5070 | |
| Lenovo ThinkPad T1g Gen 8 21TD003GE | |
| Asus ProArt P16 RTX 5090 | |
| Lenovo ThinkPad P1 Gen 8 | |
| Dell 16 Premium DA16250 | |
| Average Intel Core Ultra 9 285H | |
| Average of class Multimedia | |
| Cinebench 2024 / CPU Multi Core | |
| Apple MacBook Pro 16 M4 Max | |
| Apple MacBook Pro 16 M4 Max | |
| Asus ProArt P16 RTX 5090 | |
| Lenovo Yoga Pro 9i 16 RTX 5070 | |
| Lenovo ThinkPad P1 Gen 8 | |
| Lenovo ThinkPad T1g Gen 8 21TD003GE | |
| Dell 16 Premium DA16250 | |
| Average Intel Core Ultra 9 285H (740 - 1194, n=11) | |
| Average of class Multimedia (327 - 2437, n=75, last 2 years) | |
| Cinebench 2024 / CPU Single Core | |
| Apple MacBook Pro 16 M4 Max | |
| Average of class Multimedia (72.5 - 201, n=60, last 2 years) | |
| Lenovo Yoga Pro 9i 16 RTX 5070 | |
| Average Intel Core Ultra 9 285H (124.8 - 130, n=11) | |
| Lenovo ThinkPad T1g Gen 8 21TD003GE | |
| Lenovo ThinkPad P1 Gen 8 | |
| Dell 16 Premium DA16250 | |
| Asus ProArt P16 RTX 5090 | |
| Cinebench R23 / Multi Core | |
| Apple MacBook Pro 16 M4 Max | |
| Asus ProArt P16 RTX 5090 | |
| Lenovo Yoga Pro 9i 16 RTX 5070 | |
| Lenovo ThinkPad T1g Gen 8 21TD003GE | |
| Lenovo ThinkPad P1 Gen 8 | |
| Dell 16 Premium DA16250 | |
| Average Intel Core Ultra 9 285H (15070 - 23576, n=12) | |
| Average of class Multimedia (4861 - 33362, n=76, last 2 years) | |
| Cinebench R23 / Single Core | |
| Apple MacBook Pro 16 M4 Max | |
| Lenovo Yoga Pro 9i 16 RTX 5070 | |
| Lenovo ThinkPad T1g Gen 8 21TD003GE | |
| Average Intel Core Ultra 9 285H (1979 - 2166, n=12) | |
| Asus ProArt P16 RTX 5090 | |
| Lenovo ThinkPad P1 Gen 8 | |
| Average of class Multimedia (1128 - 2459, n=68, last 2 years) | |
| Dell 16 Premium DA16250 | |
| Cinebench R20 / CPU (Multi Core) | |
| Asus ProArt P16 RTX 5090 | |
| Lenovo Yoga Pro 9i 16 RTX 5070 | |
| Lenovo ThinkPad T1g Gen 8 21TD003GE | |
| Lenovo ThinkPad P1 Gen 8 | |
| Dell 16 Premium DA16250 | |
| Average Intel Core Ultra 9 285H (5861 - 9208, n=12) | |
| Apple MacBook Pro 16 M4 Max | |
| Average of class Multimedia (1887 - 12912, n=59, last 2 years) | |
| Cinebench R20 / CPU (Single Core) | |
| Lenovo Yoga Pro 9i 16 RTX 5070 | |
| Lenovo ThinkPad T1g Gen 8 21TD003GE | |
| Average Intel Core Ultra 9 285H (761 - 837, n=12) | |
| Asus ProArt P16 RTX 5090 | |
| Lenovo ThinkPad P1 Gen 8 | |
| Dell 16 Premium DA16250 | |
| Average of class Multimedia (425 - 853, n=59, last 2 years) | |
| Apple MacBook Pro 16 M4 Max | |
| Cinebench R15 / CPU Multi 64Bit | |
| Apple MacBook Pro 16 M4 Max | |
| Asus ProArt P16 RTX 5090 | |
| Lenovo Yoga Pro 9i 16 RTX 5070 | |
| Lenovo ThinkPad T1g Gen 8 21TD003GE | |
| Dell 16 Premium DA16250 | |
| Lenovo ThinkPad P1 Gen 8 | |
| Average Intel Core Ultra 9 285H (2280 - 3496, n=12) | |
| Average of class Multimedia (856 - 5224, n=63, last 2 years) | |
| Cinebench R15 / CPU Single 64Bit | |
| Lenovo Yoga Pro 9i 16 RTX 5070 | |
| Lenovo ThinkPad T1g Gen 8 21TD003GE | |
| Average Intel Core Ultra 9 285H (288 - 322, n=12) | |
| Apple MacBook Pro 16 M4 Max | |
| Lenovo ThinkPad P1 Gen 8 | |
| Dell 16 Premium DA16250 | |
| Average of class Multimedia (184.8 - 326, n=61, last 2 years) | |
| Asus ProArt P16 RTX 5090 | |
| Blender / v2.79 BMW27 CPU | |
| Average of class Multimedia (100 - 557, n=60, last 2 years) | |
| Average Intel Core Ultra 9 285H (151 - 235, n=12) | |
| Lenovo ThinkPad P1 Gen 8 | |
| Dell 16 Premium DA16250 | |
| Lenovo ThinkPad T1g Gen 8 21TD003GE | |
| Lenovo Yoga Pro 9i 16 RTX 5070 | |
| Asus ProArt P16 RTX 5090 | |
| 7-Zip 18.03 / 7z b 4 | |
| Asus ProArt P16 RTX 5090 | |
| Lenovo Yoga Pro 9i 16 RTX 5070 | |
| Lenovo ThinkPad T1g Gen 8 21TD003GE | |
| Dell 16 Premium DA16250 | |
| Lenovo ThinkPad P1 Gen 8 | |
| Average Intel Core Ultra 9 285H (50116 - 71959, n=12) | |
| Average of class Multimedia (26062 - 130368, n=57, last 2 years) | |
| 7-Zip 18.03 / 7z b 4 -mmt1 | |
| Lenovo Yoga Pro 9i 16 RTX 5070 | |
| Asus ProArt P16 RTX 5090 | |
| Average Intel Core Ultra 9 285H (5403 - 6419, n=12) | |
| Lenovo ThinkPad T1g Gen 8 21TD003GE | |
| Average of class Multimedia (3666 - 7545, n=58, last 2 years) | |
| Dell 16 Premium DA16250 | |
| Lenovo ThinkPad P1 Gen 8 | |
| Geekbench 6.7 / Multi-Core | |
| Apple MacBook Pro 16 M4 Max | |
| Lenovo Yoga Pro 9i 16 RTX 5070 | |
| Lenovo ThinkPad T1g Gen 8 21TD003GE | |
| Dell 16 Premium DA16250 | |
| Lenovo ThinkPad P1 Gen 8 | |
| Average Intel Core Ultra 9 285H (15284 - 17992, n=15) | |
| Asus ProArt P16 RTX 5090 | |
| Average of class Multimedia (4983 - 29415, n=71, last 2 years) | |
| Geekbench 6.7 / Single-Core | |
| Apple MacBook Pro 16 M4 Max | |
| Lenovo Yoga Pro 9i 16 RTX 5070 | |
| Lenovo ThinkPad T1g Gen 8 21TD003GE | |
| Asus ProArt P16 RTX 5090 | |
| Average of class Multimedia (1534 - 4335, n=70, last 2 years) | |
| Average Intel Core Ultra 9 285H (2665 - 3110, n=15) | |
| Lenovo ThinkPad P1 Gen 8 | |
| Dell 16 Premium DA16250 | |
| Geekbench 5.5 / Multi-Core | |
| Lenovo Yoga Pro 9i 16 RTX 5070 | |
| Lenovo ThinkPad T1g Gen 8 21TD003GE | |
| Dell 16 Premium DA16250 | |
| Lenovo ThinkPad P1 Gen 8 | |
| Average Intel Core Ultra 9 285H (13140 - 17487, n=13) | |
| Asus ProArt P16 RTX 5090 | |
| Average of class Multimedia (4652 - 20422, n=58, last 2 years) | |
| Geekbench 5.5 / Single-Core | |
| Asus ProArt P16 RTX 5090 | |
| Lenovo Yoga Pro 9i 16 RTX 5070 | |
| Lenovo ThinkPad T1g Gen 8 21TD003GE | |
| Average Intel Core Ultra 9 285H (1689 - 2256, n=13) | |
| Lenovo ThinkPad P1 Gen 8 | |
| Average of class Multimedia (805 - 2974, n=58, last 2 years) | |
| Dell 16 Premium DA16250 | |
| HWBOT x265 Benchmark v2.2 / 4k Preset | |
| Asus ProArt P16 RTX 5090 | |
| Lenovo Yoga Pro 9i 16 RTX 5070 | |
| Lenovo ThinkPad P1 Gen 8 | |
| Lenovo ThinkPad T1g Gen 8 21TD003GE | |
| Dell 16 Premium DA16250 | |
| Average Intel Core Ultra 9 285H (17.9 - 27.2, n=12) | |
| Average of class Multimedia (5.26 - 36.1, n=58, last 2 years) | |
| LibreOffice / 20 Documents To PDF | |
| Average of class Multimedia (23.9 - 146.7, n=59, last 2 years) | |
| Asus ProArt P16 RTX 5090 | |
| Average Intel Core Ultra 9 285H (39.4 - 56.1, n=12) | |
| Lenovo Yoga Pro 9i 16 RTX 5070 | |
| Dell 16 Premium DA16250 | |
| Lenovo ThinkPad T1g Gen 8 21TD003GE | |
| Lenovo ThinkPad P1 Gen 8 | |
| R Benchmark 2.5 / Overall mean | |
| Average of class Multimedia (0.3604 - 0.947, n=58, last 2 years) | |
| Dell 16 Premium DA16250 | |
| Lenovo ThinkPad P1 Gen 8 | |
| Average Intel Core Ultra 9 285H (0.4079 - 0.4794, n=12) | |
| Lenovo ThinkPad T1g Gen 8 21TD003GE | |
| Asus ProArt P16 RTX 5090 | |
| Lenovo Yoga Pro 9i 16 RTX 5070 | |
* ... smaller is better
AIDA64: FP32 Ray-Trace | FPU Julia | CPU SHA3 | CPU Queen | FPU SinJulia | FPU Mandel | CPU AES | CPU ZLib | FP64 Ray-Trace | CPU PhotoWorxx
| Performance rating | |
| Asus ProArt P16 RTX 5090 | |
| Lenovo Yoga Pro 9i 16 RTX 5070 | |
| Lenovo ThinkPad P1 Gen 8 | |
| Lenovo ThinkPad T1g Gen 8 21TD003GE | |
| Average Intel Core Ultra 9 285H | |
| Average of class Multimedia | |
| AIDA64 / FP32 Ray-Trace | |
| Asus ProArt P16 RTX 5090 | |
| Lenovo Yoga Pro 9i 16 RTX 5070 | |
| Lenovo ThinkPad T1g Gen 8 21TD003GE | |
| Lenovo ThinkPad P1 Gen 8 | |
| Average Intel Core Ultra 9 285H (13687 - 24612, n=14) | |
| Average of class Multimedia (2214 - 50388, n=55, last 2 years) | |
| AIDA64 / FPU Julia | |
| Asus ProArt P16 RTX 5090 | |
| Lenovo Yoga Pro 9i 16 RTX 5070 | |
| Lenovo ThinkPad P1 Gen 8 | |
| Lenovo ThinkPad T1g Gen 8 21TD003GE | |
| Average Intel Core Ultra 9 285H (54365 - 129641, n=14) | |
| Average of class Multimedia (12867 - 201874, n=56, last 2 years) | |
| AIDA64 / CPU SHA3 | |
| Lenovo Yoga Pro 9i 16 RTX 5070 | |
| Lenovo ThinkPad P1 Gen 8 | |
| Lenovo ThinkPad T1g Gen 8 21TD003GE | |
| Asus ProArt P16 RTX 5090 | |
| Average Intel Core Ultra 9 285H (3473 - 5879, n=14) | |
| Average of class Multimedia (626 - 8623, n=56, last 2 years) | |
| AIDA64 / CPU Queen | |
| Asus ProArt P16 RTX 5090 | |
| Average of class Multimedia (13483 - 181505, n=43, last 2 years) | |
| Lenovo ThinkPad P1 Gen 8 | |
| Lenovo ThinkPad T1g Gen 8 21TD003GE | |
| Lenovo Yoga Pro 9i 16 RTX 5070 | |
| Average Intel Core Ultra 9 285H (53557 - 67363, n=12) | |
| AIDA64 / FPU SinJulia | |
| Asus ProArt P16 RTX 5090 | |
| Lenovo Yoga Pro 9i 16 RTX 5070 | |
| Lenovo ThinkPad T1g Gen 8 21TD003GE | |
| Lenovo ThinkPad P1 Gen 8 | |
| Average of class Multimedia (886 - 28794, n=56, last 2 years) | |
| Average Intel Core Ultra 9 285H (6921 - 9378, n=14) | |
| AIDA64 / FPU Mandel | |
| Asus ProArt P16 RTX 5090 | |
| Lenovo Yoga Pro 9i 16 RTX 5070 | |
| Lenovo ThinkPad P1 Gen 8 | |
| Lenovo ThinkPad T1g Gen 8 21TD003GE | |
| Average Intel Core Ultra 9 285H (38174 - 64632, n=14) | |
| Average of class Multimedia (6395 - 105740, n=55, last 2 years) | |
| AIDA64 / CPU AES | |
| Asus ProArt P16 RTX 5090 | |
| Lenovo Yoga Pro 9i 16 RTX 5070 | |
| Lenovo ThinkPad P1 Gen 8 | |
| Lenovo ThinkPad T1g Gen 8 21TD003GE | |
| Average Intel Core Ultra 9 285H (58110 - 117613, n=14) | |
| Average of class Multimedia (8171 - 126790, n=56, last 2 years) | |
| AIDA64 / CPU ZLib | |
| Asus ProArt P16 RTX 5090 | |
| Lenovo Yoga Pro 9i 16 RTX 5070 | |
| Lenovo ThinkPad P1 Gen 8 | |
| Lenovo ThinkPad T1g Gen 8 21TD003GE | |
| Average Intel Core Ultra 9 285H (574 - 1366, n=14) | |
| Average of class Multimedia (143.8 - 2022, n=56, last 2 years) | |
| AIDA64 / FP64 Ray-Trace | |
| Asus ProArt P16 RTX 5090 | |
| Lenovo Yoga Pro 9i 16 RTX 5070 | |
| Lenovo ThinkPad P1 Gen 8 | |
| Lenovo ThinkPad T1g Gen 8 21TD003GE | |
| Average Intel Core Ultra 9 285H (5509 - 13527, n=14) | |
| Average of class Multimedia (1014 - 26875, n=56, last 2 years) | |
| AIDA64 / CPU PhotoWorxx | |
| Lenovo Yoga Pro 9i 16 RTX 5070 | |
| Lenovo ThinkPad P1 Gen 8 | |
| Lenovo ThinkPad T1g Gen 8 21TD003GE | |
| Average Intel Core Ultra 9 285H (49874 - 65392, n=14) | |
| Average of class Multimedia (8187 - 88154, n=56, last 2 years) | |
| Asus ProArt P16 RTX 5090 | |
系统性能
不出所料,系统的整体性能非常好,在测试过程中没有遇到任何稳定性问题。
PCMark 10: Score | Essentials | Productivity | Digital Content Creation
CrossMark: Overall | Productivity | Creativity | Responsiveness
WebXPRT 3: Overall
WebXPRT 4: Overall
Mozilla Kraken 1.1: Total
| Performance rating | |
| Apple MacBook Pro 16 M4 Max -4! | |
| Lenovo ThinkPad T1g Gen 8 21TD003GE | |
| Average Intel Core Ultra 9 285H, NVIDIA GeForce RTX 5070 Laptop | |
| Lenovo ThinkPad P1 Gen 8 | |
| Lenovo Yoga Pro 9i 16 RTX 5070 | |
| Average of class Multimedia | |
| Dell 16 Premium DA16250 -4! | |
| Asus ProArt P16 RTX 5090 -4! | |
| PCMark 10 / Score | |
| Lenovo ThinkPad T1g Gen 8 21TD003GE | |
| Lenovo ThinkPad P1 Gen 8 | |
| Average Intel Core Ultra 9 285H, NVIDIA GeForce RTX 5070 Laptop (8267 - 9691, n=2) | |
| Lenovo Yoga Pro 9i 16 RTX 5070 | |
| Average of class Multimedia (4325 - 10386, n=54, last 2 years) | |
| PCMark 10 / Essentials | |
| Lenovo ThinkPad P1 Gen 8 | |
| Lenovo Yoga Pro 9i 16 RTX 5070 | |
| Average of class Multimedia (8025 - 11664, n=53, last 2 years) | |
| Average Intel Core Ultra 9 285H, NVIDIA GeForce RTX 5070 Laptop (10345 - 10564, n=2) | |
| Lenovo ThinkPad T1g Gen 8 21TD003GE | |
| PCMark 10 / Productivity | |
| Lenovo ThinkPad P1 Gen 8 | |
| Lenovo ThinkPad T1g Gen 8 21TD003GE | |
| Average Intel Core Ultra 9 285H, NVIDIA GeForce RTX 5070 Laptop (9402 - 18233, n=2) | |
| Average of class Multimedia (7323 - 18233, n=53, last 2 years) | |
| Lenovo Yoga Pro 9i 16 RTX 5070 | |
| PCMark 10 / Digital Content Creation | |
| Lenovo Yoga Pro 9i 16 RTX 5070 | |
| Average Intel Core Ultra 9 285H, NVIDIA GeForce RTX 5070 Laptop (13096 - 15438, n=2) | |
| Lenovo ThinkPad T1g Gen 8 21TD003GE | |
| Lenovo ThinkPad P1 Gen 8 | |
| Average of class Multimedia (3651 - 16240, n=53, last 2 years) | |
| CrossMark / Overall | |
| Apple MacBook Pro 16 M4 Max | |
| Lenovo ThinkPad T1g Gen 8 21TD003GE | |
| Average Intel Core Ultra 9 285H, NVIDIA GeForce RTX 5070 Laptop (2077 - 2236, n=2) | |
| Lenovo Yoga Pro 9i 16 RTX 5070 | |
| Dell 16 Premium DA16250 | |
| Asus ProArt P16 RTX 5090 | |
| Lenovo ThinkPad P1 Gen 8 | |
| Average of class Multimedia (866 - 2728, n=62, last 2 years) | |
| CrossMark / Productivity | |
| Lenovo ThinkPad T1g Gen 8 21TD003GE | |
| Apple MacBook Pro 16 M4 Max | |
| Average Intel Core Ultra 9 285H, NVIDIA GeForce RTX 5070 Laptop (1920 - 2092, n=2) | |
| Lenovo Yoga Pro 9i 16 RTX 5070 | |
| Dell 16 Premium DA16250 | |
| Lenovo ThinkPad P1 Gen 8 | |
| Asus ProArt P16 RTX 5090 | |
| Average of class Multimedia (931 - 2489, n=62, last 2 years) | |
| CrossMark / Creativity | |
| Apple MacBook Pro 16 M4 Max | |
| Lenovo ThinkPad T1g Gen 8 21TD003GE | |
| Average Intel Core Ultra 9 285H, NVIDIA GeForce RTX 5070 Laptop (2438 - 2470, n=2) | |
| Lenovo Yoga Pro 9i 16 RTX 5070 | |
| Asus ProArt P16 RTX 5090 | |
| Dell 16 Premium DA16250 | |
| Lenovo ThinkPad P1 Gen 8 | |
| Average of class Multimedia (907 - 3465, n=62, last 2 years) | |
| CrossMark / Responsiveness | |
| Lenovo ThinkPad T1g Gen 8 21TD003GE | |
| Average Intel Core Ultra 9 285H, NVIDIA GeForce RTX 5070 Laptop (1629 - 2024, n=2) | |
| Dell 16 Premium DA16250 | |
| Lenovo Yoga Pro 9i 16 RTX 5070 | |
| Lenovo ThinkPad P1 Gen 8 | |
| Apple MacBook Pro 16 M4 Max | |
| Average of class Multimedia (605 - 2024, n=62, last 2 years) | |
| Asus ProArt P16 RTX 5090 | |
| WebXPRT 3 / Overall | |
| Apple MacBook Pro 16 M4 Max | |
| Lenovo Yoga Pro 9i 16 RTX 5070 | |
| Average of class Multimedia (136.4 - 596, n=65, last 2 years) | |
| Average Intel Core Ultra 9 285H, NVIDIA GeForce RTX 5070 Laptop (326 - 345, n=2) | |
| Dell 16 Premium DA16250 | |
| Lenovo ThinkPad P1 Gen 8 | |
| Lenovo ThinkPad T1g Gen 8 21TD003GE | |
| Asus ProArt P16 RTX 5090 | |
| WebXPRT 4 / Overall | |
| Apple MacBook Pro 16 M4 Max | |
| Lenovo Yoga Pro 9i 16 RTX 5070 | |
| Average Intel Core Ultra 9 285H, NVIDIA GeForce RTX 5070 Laptop (303 - 311, n=2) | |
| Lenovo ThinkPad T1g Gen 8 21TD003GE | |
| Dell 16 Premium DA16250 | |
| Lenovo ThinkPad P1 Gen 8 | |
| Average of class Multimedia (167.3 - 402, n=67, last 2 years) | |
| Asus ProArt P16 RTX 5090 | |
| Mozilla Kraken 1.1 / Total | |
| Dell 16 Premium DA16250 | |
| Lenovo ThinkPad P1 Gen 8 | |
| Average of class Multimedia (228 - 835, n=68, last 2 years) | |
| Lenovo ThinkPad T1g Gen 8 21TD003GE | |
| Average Intel Core Ultra 9 285H, NVIDIA GeForce RTX 5070 Laptop (433 - 444, n=2) | |
| Lenovo Yoga Pro 9i 16 RTX 5070 | |
| Asus ProArt P16 RTX 5090 | |
| Apple MacBook Pro 16 M4 Max | |
* ... smaller is better
| PCMark 10 Score | 9691 points | |
Help | ||
| AIDA64 / Memory Copy | |
| Lenovo Yoga Pro 9i 16 RTX 5070 | |
| Lenovo ThinkPad P1 Gen 8 | |
| Lenovo ThinkPad T1g Gen 8 21TD003GE | |
| Average Intel Core Ultra 9 285H (76179 - 109252, n=14) | |
| Asus ProArt P16 RTX 5090 | |
| Average of class Multimedia (11299 - 132135, n=56, last 2 years) | |
| AIDA64 / Memory Read | |
| Asus ProArt P16 RTX 5090 | |
| Lenovo Yoga Pro 9i 16 RTX 5070 | |
| Average of class Multimedia (11624 - 174586, n=56, last 2 years) | |
| Average Intel Core Ultra 9 285H (74572 - 89837, n=14) | |
| Lenovo ThinkPad T1g Gen 8 21TD003GE | |
| Lenovo ThinkPad P1 Gen 8 | |
| AIDA64 / Memory Write | |
| Asus ProArt P16 RTX 5090 | |
| Average of class Multimedia (11755 - 134998, n=56, last 2 years) | |
| Average Intel Core Ultra 9 285H (62446 - 107584, n=14) | |
| Lenovo ThinkPad T1g Gen 8 21TD003GE | |
| Lenovo Yoga Pro 9i 16 RTX 5070 | |
| Lenovo ThinkPad P1 Gen 8 | |
| AIDA64 / Memory Latency | |
| Lenovo ThinkPad P1 Gen 8 | |
| Lenovo ThinkPad T1g Gen 8 21TD003GE | |
| Average Intel Core Ultra 9 285H (106.2 - 136.7, n=14) | |
| Average of class Multimedia (7 - 535, n=55, last 2 years) | |
| Lenovo Yoga Pro 9i 16 RTX 5070 | |
| Asus ProArt P16 RTX 5090 | |
* ... smaller is better
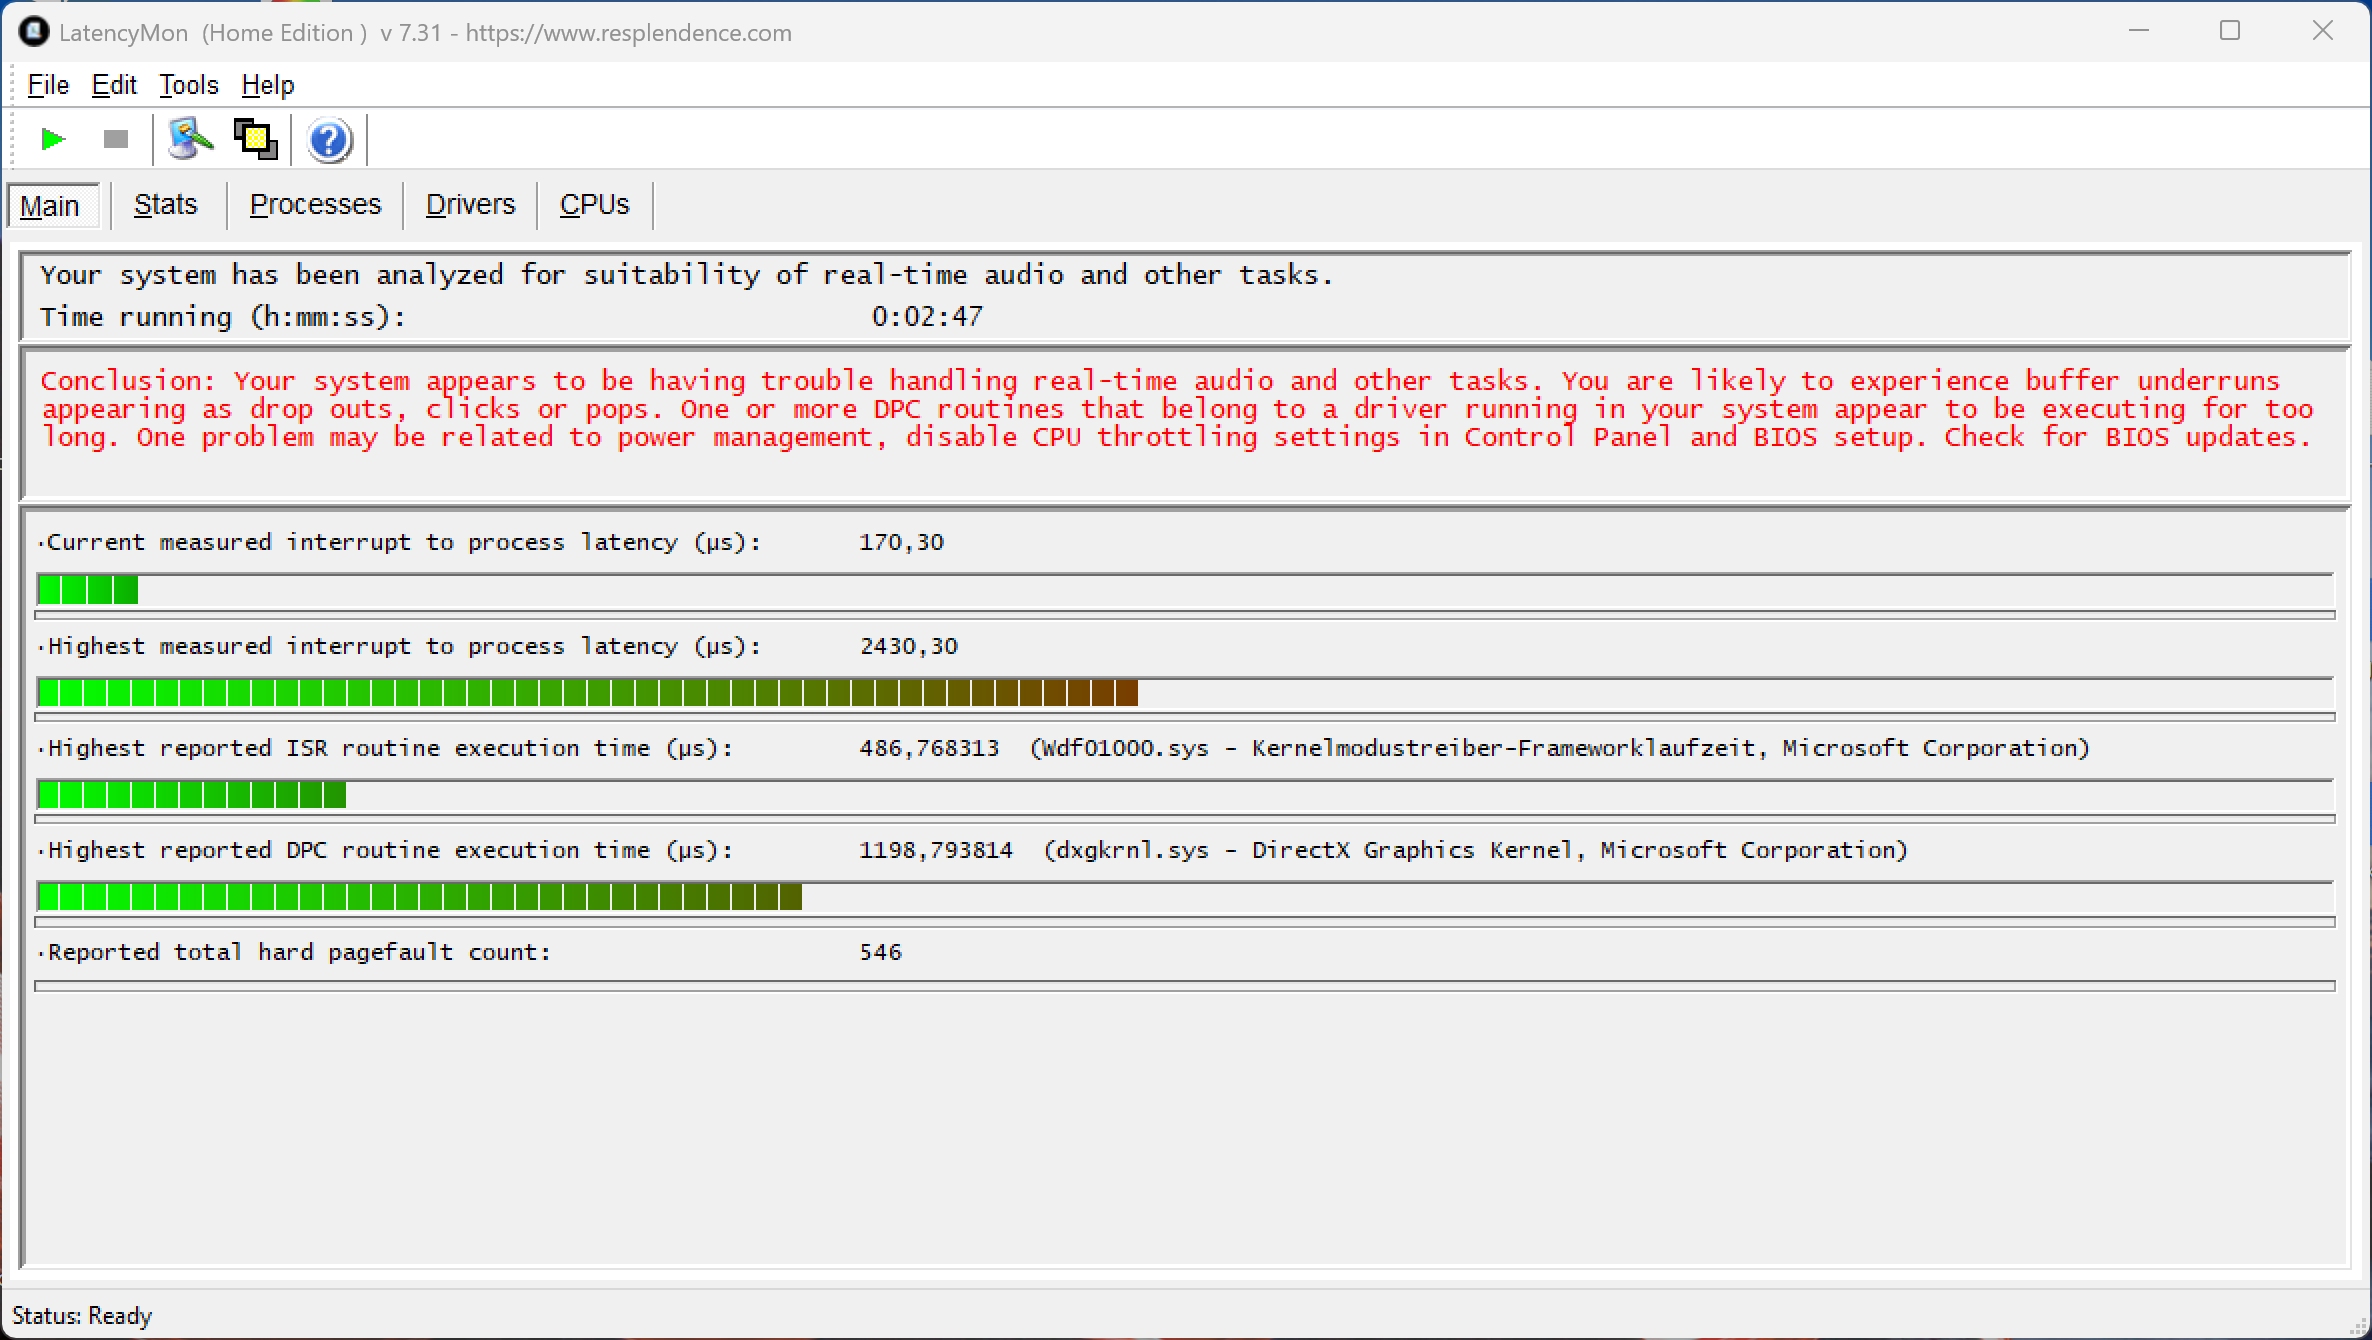
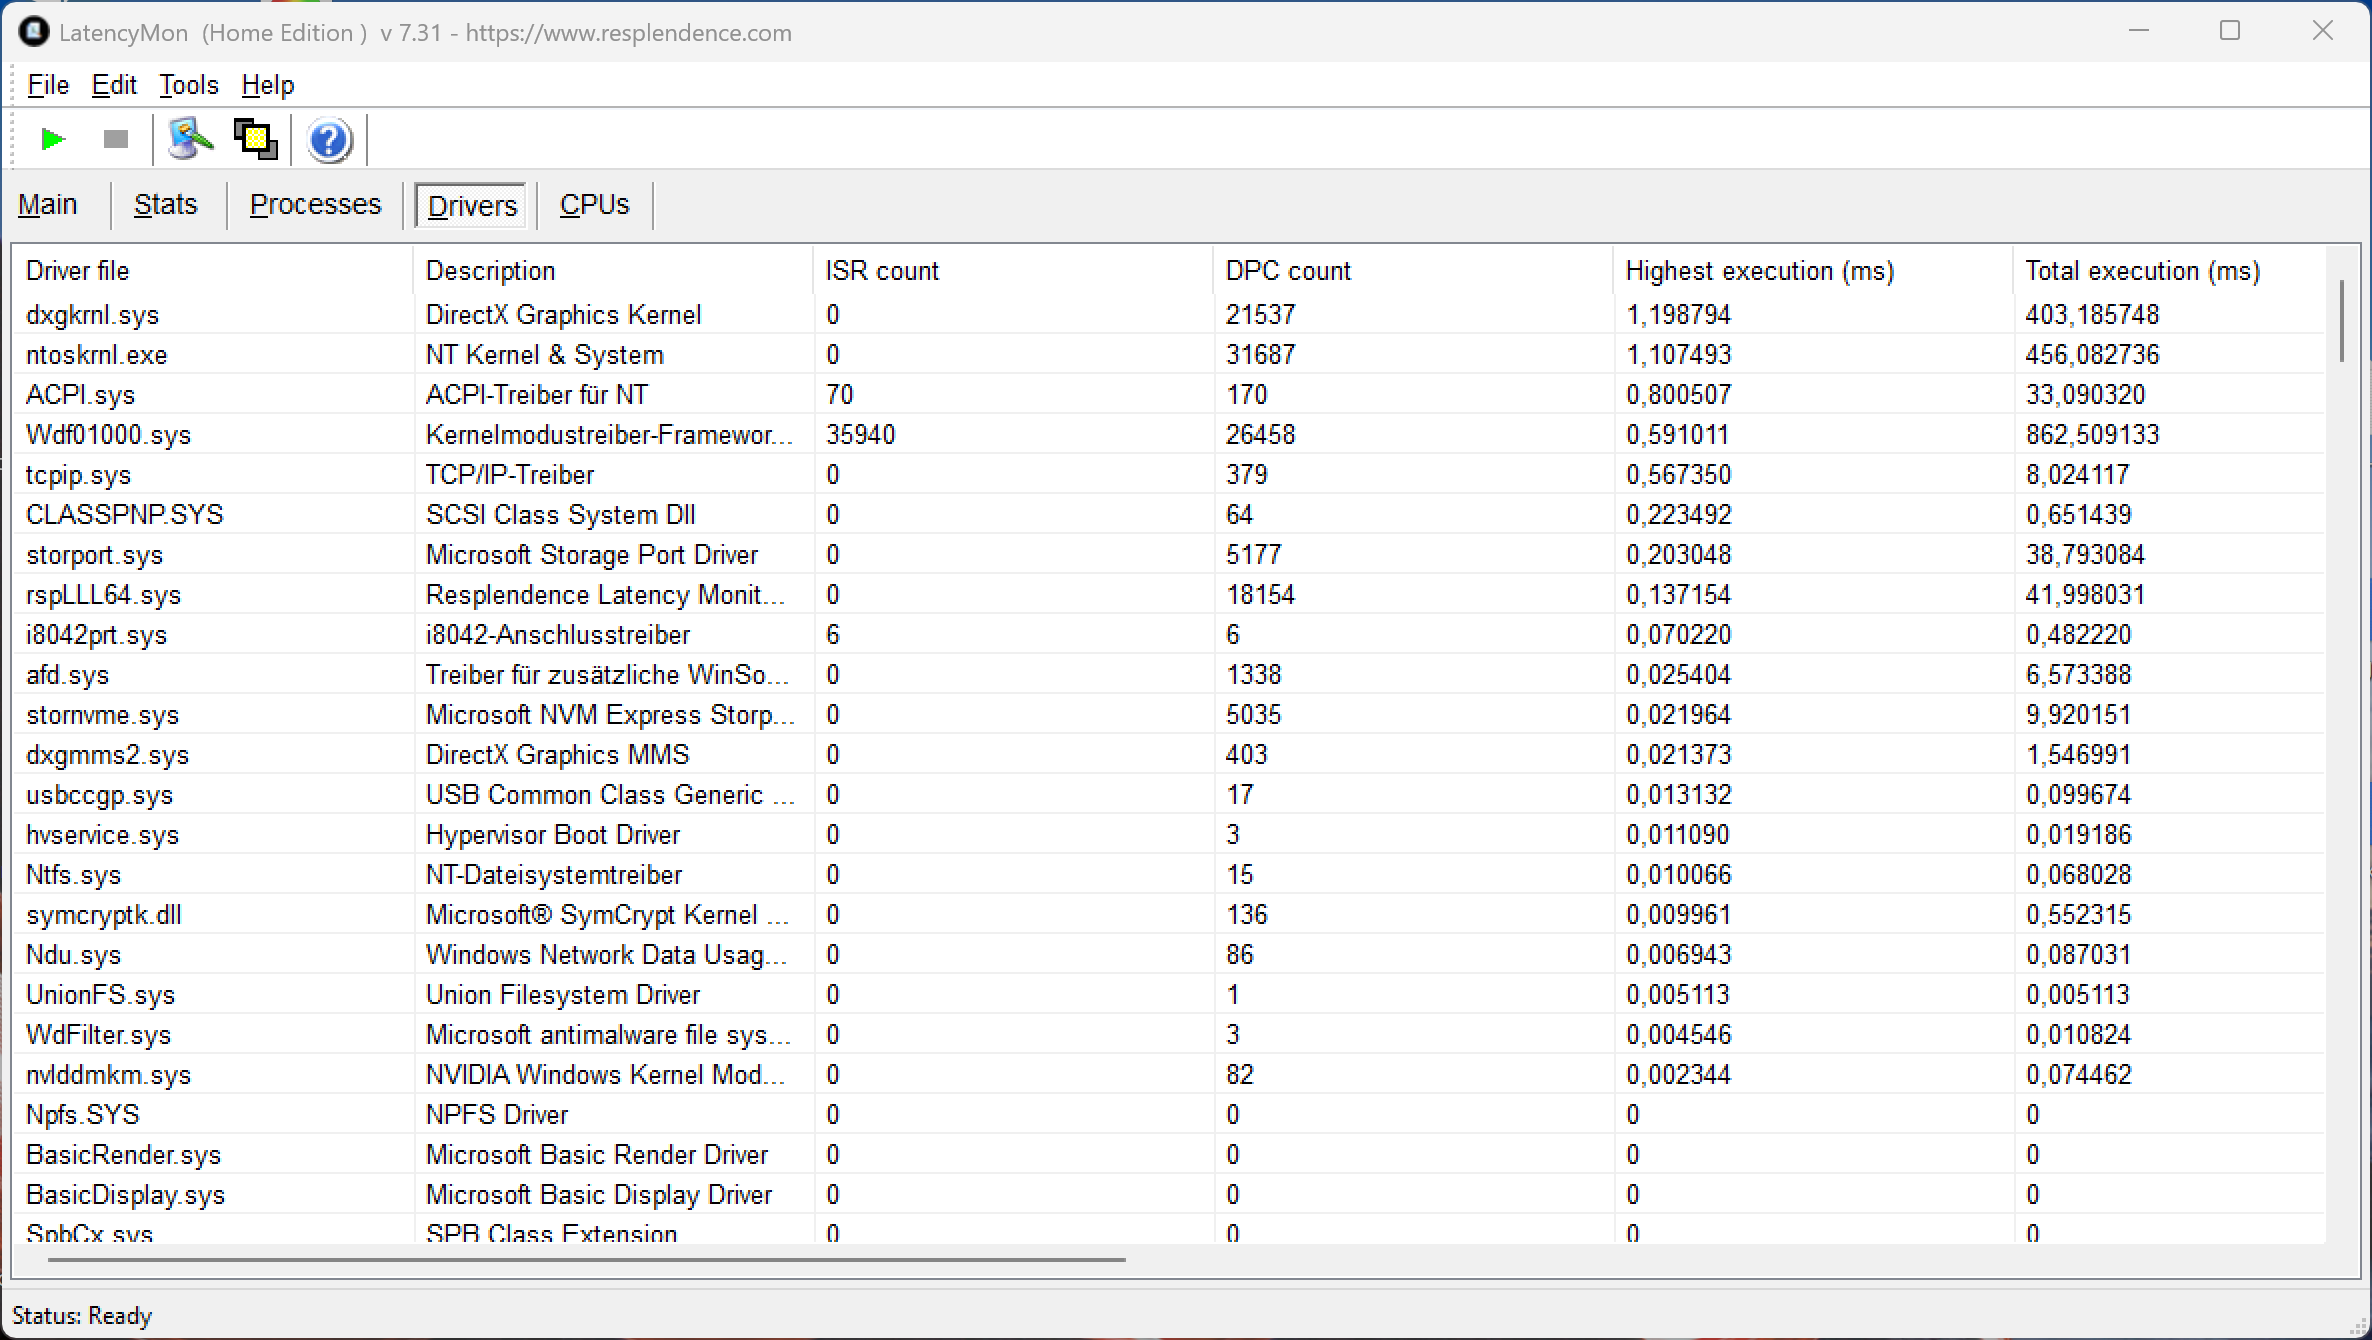
DPC 延迟
在我们的标准化延迟测试(网页浏览、4K YouTube 播放和 CPU 负载)中,该系统在使用实时音频应用时显示出了局限性。
| DPC Latencies / LatencyMon - interrupt to process latency (max), Web, Youtube, Prime95 | |
| Asus ProArt P16 RTX 5090 | |
| Lenovo ThinkPad P1 Gen 8 | |
| Lenovo ThinkPad T1g Gen 8 21TD003GE | |
| Lenovo Yoga Pro 9i 16 RTX 5070 | |
| Dell 16 Premium DA16250 | |
* ... smaller is better
存储设备
ThinkPad T1g 提供两个 M.2-2280 插槽,均通过 PCIe 5.0 连接。安装的三星 PM9E1(2 TB,1.76 TB 可用)提供了良好且非常稳定的传输速率,但没有充分利用可用的 PCIe 5.0 带宽。

* ... smaller is better
连续读取性能DiskSpd 读取循环,队列深度 8
图形处理器性能
联想使用 75 瓦版本的 移动版GeForce RTX 5070(60 瓦 + 15 瓦 Dynamic Boost)和 8GB VRAM。这大大低于 115 瓦的最大功率。因此,图形性能比竞争对手的 RTX 5070 实现的要弱,无法接近 RTX 5090中的 华硕 ProArt P16.只有 戴尔 16 Premium的 60 瓦 RTX 5070 性能更胜一筹。在持续负载情况下,GPU 性能保持完全稳定,而在电池供电情况下,最大功耗降至 60 瓦(-11%)。
当然也可以玩游戏,许多游戏在 QHD 分辨率下仍能流畅运行。我们在一篇专门的文章中分析了 8GB VRAM 带来的限制。
| 3DMark 11 Performance | 33372 points | |
| 3DMark Fire Strike Score | 27509 points | |
| 3DMark Time Spy Score | 11672 points | |
| 3DMark Steel Nomad Score | 2636 points | |
| 3DMark Steel Nomad Light Score | 11903 points | |
Help | ||
| Blender / v3.3 Classroom OPTIX/RTX | |
| Average of class Multimedia (12 - 105, n=23, last 2 years) | |
| Lenovo Yoga Pro 9i 16 RTX 5070 | |
| Lenovo ThinkPad T1g Gen 8 21TD003GE | |
| Dell 16 Premium DA16250 | |
| Lenovo ThinkPad P1 Gen 8 | |
| Average NVIDIA GeForce RTX 5070 Laptop (17 - 24, n=28) | |
| Asus ProArt P16 H7606WP | |
| Asus ProArt P16 RTX 5090 | |
| Blender / v3.3 Classroom CUDA | |
| Average of class Multimedia (20 - 186, n=23, last 2 years) | |
| Lenovo ThinkPad P1 Gen 8 | |
| Average NVIDIA GeForce RTX 5070 Laptop (29 - 228, n=29) | |
| Lenovo ThinkPad T1g Gen 8 21TD003GE | |
| Dell 16 Premium DA16250 | |
| Lenovo Yoga Pro 9i 16 RTX 5070 | |
| Asus ProArt P16 H7606WP | |
| Asus ProArt P16 RTX 5090 | |
| Blender / v3.3 Classroom METAL | |
| Average of class Multimedia (17.8 - 68, n=5, last 2 years) | |
| Apple MacBook Pro 16 M4 Max | |
| Blender / v3.3 Classroom CPU | |
| Average of class Multimedia (134.5 - 1042, n=63, last 2 years) | |
| Dell 16 Premium DA16250 | |
| Lenovo ThinkPad P1 Gen 8 | |
| Lenovo ThinkPad T1g Gen 8 21TD003GE | |
| Average NVIDIA GeForce RTX 5070 Laptop (137 - 507, n=26) | |
| Lenovo Yoga Pro 9i 16 RTX 5070 | |
| Asus ProArt P16 H7606WP | |
| Asus ProArt P16 RTX 5090 | |
| Apple MacBook Pro 16 M4 Max | |
* ... smaller is better
| Final Fantasy XV Benchmark - 1920x1080 High Quality | |
| Asus ProArt P16 RTX 5090 | |
| Lenovo Yoga Pro 9i 16 RTX 5070 | |
| Asus ProArt P16 H7606WP | |
| Lenovo ThinkPad T1g Gen 8 21TD003GE | |
| Dell 16 Premium DA16250 | |
| Lenovo ThinkPad P1 Gen 8 | |
| Average of class Multimedia (7.61 - 144.4, n=60, last 2 years) | |
| Dota 2 Reborn - 1920x1080 ultra (3/3) best looking | |
| Lenovo Yoga Pro 9i 16 RTX 5070 | |
| Dell 16 Premium DA16250 | |
| Lenovo ThinkPad T1g Gen 8 21TD003GE | |
| Asus ProArt P16 RTX 5090 | |
| Asus ProArt P16 H7606WP | |
| Lenovo ThinkPad P1 Gen 8 | |
| Average of class Multimedia (29 - 179.9, n=62, last 2 years) | |
赛博朋克 2077》超 FPS 图表
| low | med. | high | ultra | QHD DLSS | QHD | |
|---|---|---|---|---|---|---|
| GTA V (2015) | 128 | 104.1 | ||||
| Dota 2 Reborn (2015) | 165.1 | 152.4 | 144.8 | 134.7 | ||
| Final Fantasy XV Benchmark (2018) | 216 | 156.2 | 119.9 | 88.6 | ||
| X-Plane 11.11 (2018) | 104.2 | 97.9 | 79.9 | |||
| Strange Brigade (2018) | 502 | 300 | 248 | 217 | 146.7 | |
| Baldur's Gate 3 (2023) | 150.4 | 122.1 | 106.8 | 106 | 72.8 | |
| Cyberpunk 2077 (2023) | 137.5 | 112.8 | 98 | 87.3 | 64.4 | 56.1 |
| F1 24 (2024) | 247 | 245 | 197.5 | 66.4 | 67 | 42.1 |
排放与动力
噪音排放

双风扇散热系统整体性能良好。在轻度工作时,系统几乎听不到声音,只会产生约 27 dB(A) 的轻微背景噪音。在满负荷工作时,我们测得的噪音高达 47.8 dB(A),这仍然使 ThinkPad T1g 比其基于 Windows 的竞争对手更安静。只有 MacBook Pro 16MacBook Pro 16 和 M4 Max 仍然明显更安静。
使用其他性能配置文件可以进一步降低最大风扇噪音(最佳电源效率:38.9 dB(A);平衡:43.3 dB(A))。使用电池供电时,这些噪音水平保持不变。测试设备上未检测到其他电子噪音。
Noise level
| Idle |
| 25 / 25 / 27.3 dB(A) |
| Load |
| 37.3 / 47.8 dB(A) |
 | ||
30 dB silent 40 dB(A) audible 50 dB(A) loud |
||
min: | ||
| Lenovo ThinkPad T1g Gen 8 21TD003GE Ultra 9 285H, GeForce RTX 5070 Laptop | Lenovo Yoga Pro 9i 16 RTX 5070 Ultra 9 285H, GeForce RTX 5070 Laptop | Asus ProArt P16 RTX 5090 Ryzen AI 9 HX 370, GeForce RTX 5090 Laptop | Dell 16 Premium DA16250 Ultra 7 255H, GeForce RTX 5070 Laptop | Apple MacBook Pro 16 M4 Max M4 Max 16-Core, M4 Max 40-Core GPU | |
|---|---|---|---|---|---|
| Noise | -3% | -8% | 2% | 5% | |
| off / environment * (dB) | 25 | 24.1 4% | 24.2 3% | 23.2 7% | 24.1 4% |
| Idle Minimum * (dB) | 25 | 24.1 4% | 24.2 3% | 23.2 7% | 24.1 4% |
| Idle Average * (dB) | 25 | 24.1 4% | 27.6 -10% | 23.2 7% | 24.1 4% |
| Idle Maximum * (dB) | 27.3 | 25.1 8% | 32.6 -19% | 26.6 3% | 24.1 12% |
| Load Average * (dB) | 37.3 | 44.2 -18% | 42.6 -14% | 39.4 -6% | 42.2 -13% |
| Cyberpunk 2077 ultra * (dB) | 47.8 | 52.7 -10% | 51.2 -7% | 47.3 1% | 42.2 12% |
| Load Maximum * (dB) | 47.8 | 52.7 -10% | 53.2 -11% | 48.9 -2% | 42.2 12% |
* ... smaller is better
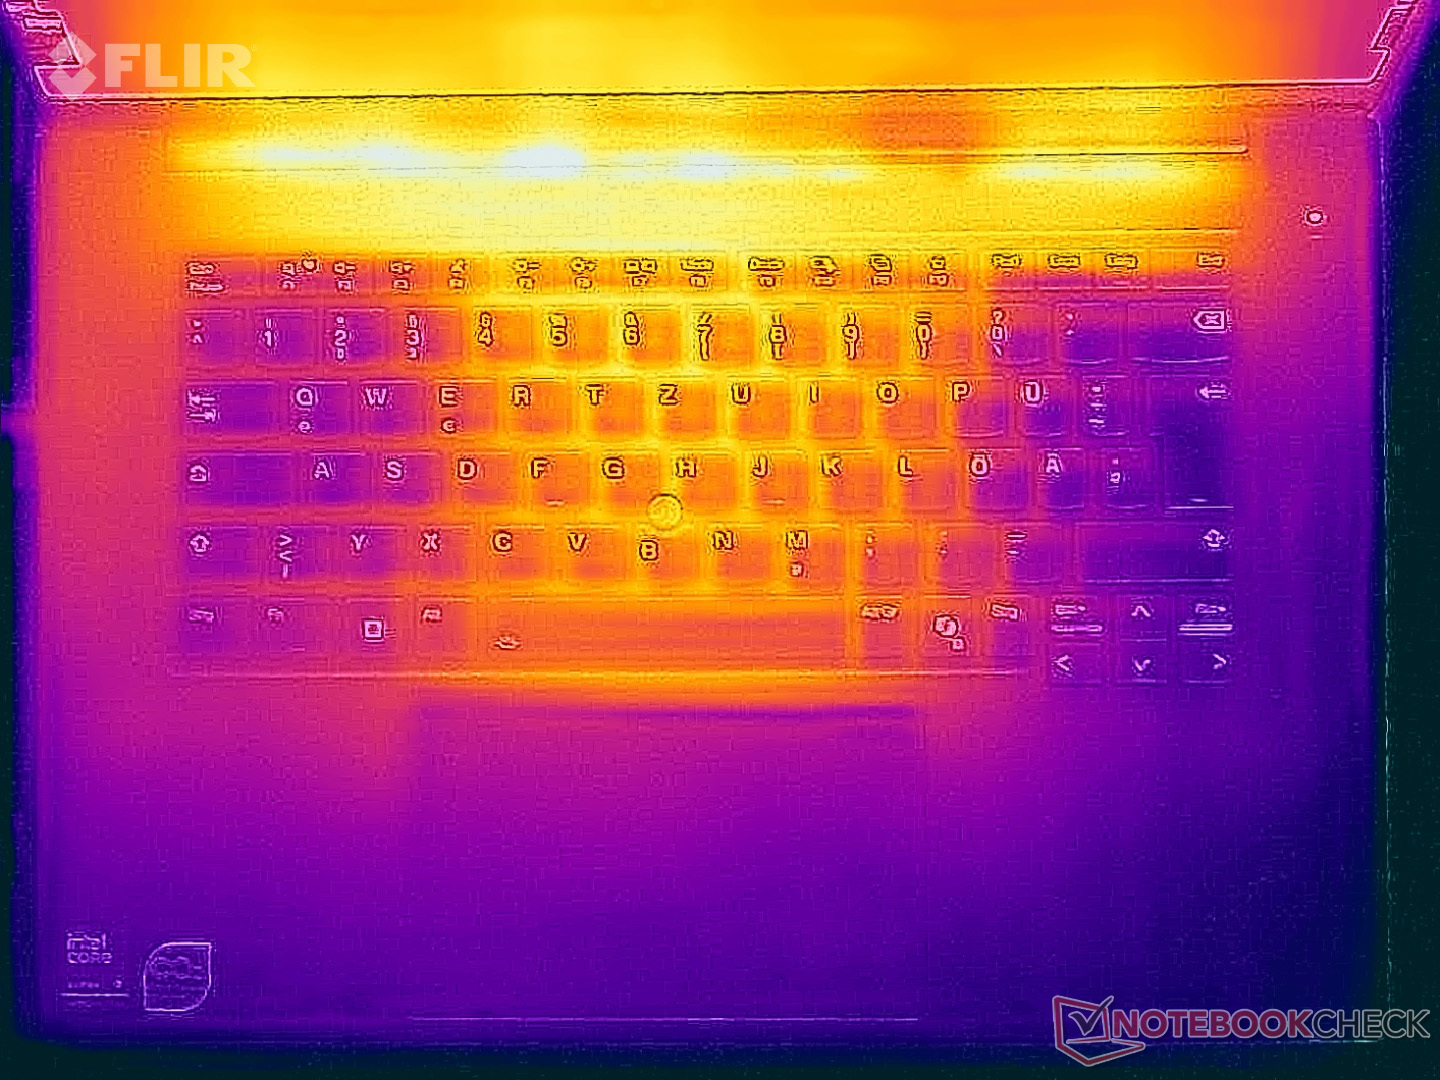
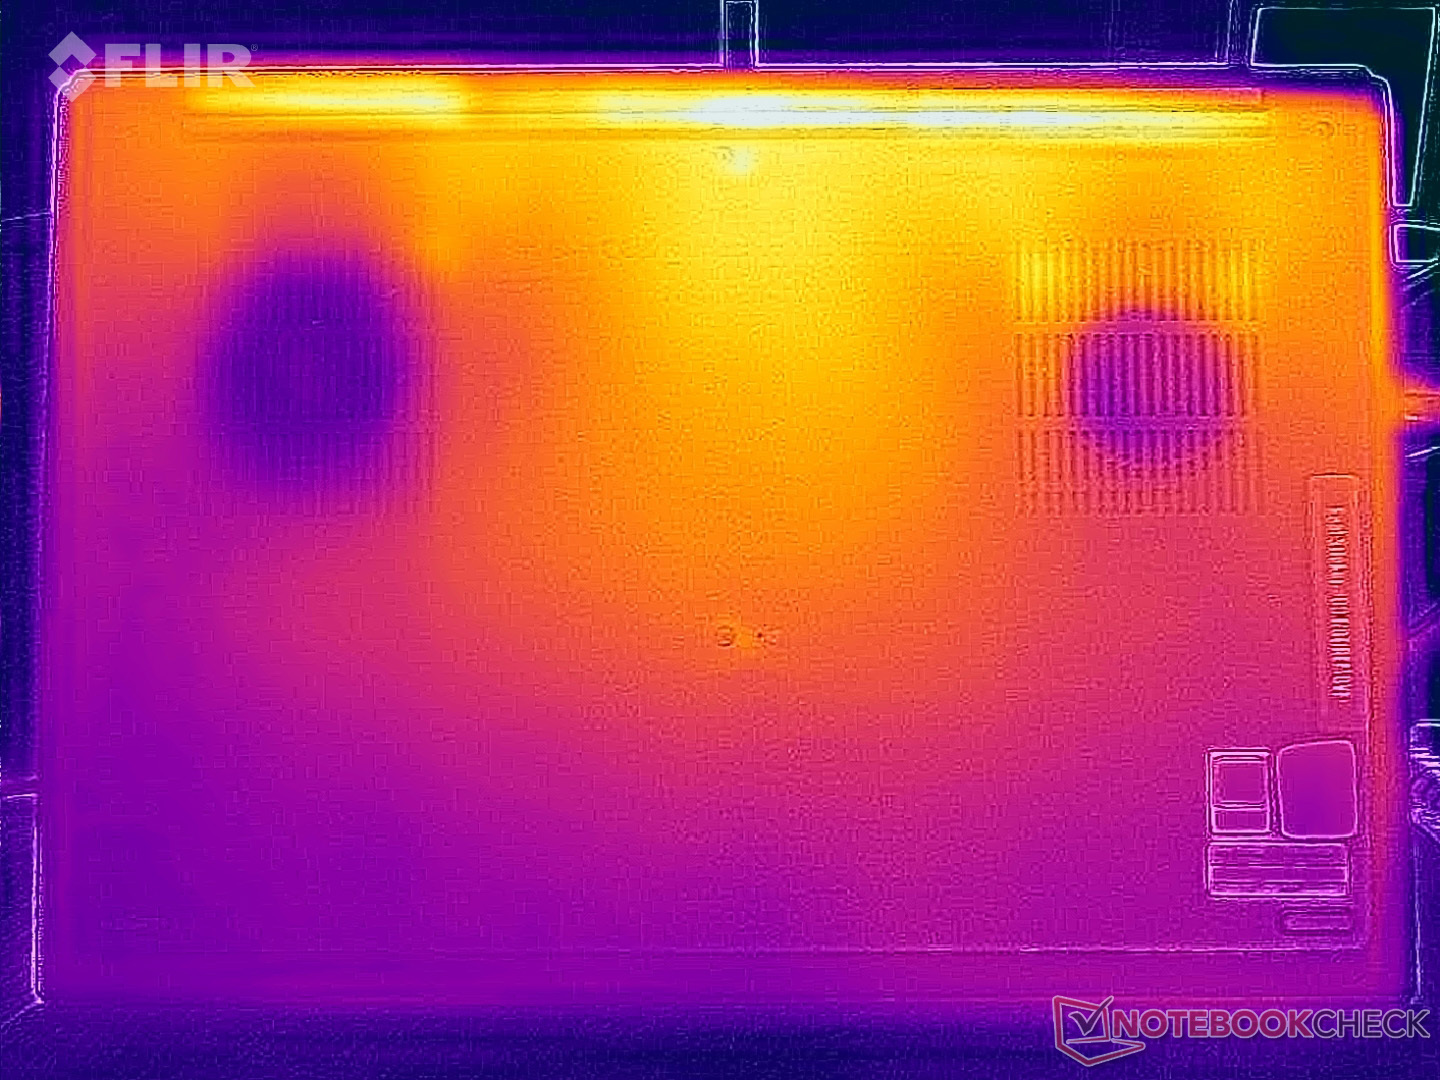
温度
ThinkPad T1g Gen 8 没有温度方面的问题。在轻度工作负载下,铝制机箱仍然非常凉爽,即使在压力测试中,我们也仅在少数区域测得温度超过 40 °C,最高温度为 44.7 °C。因此,没有任何使用限制。
在压力测试期间,CPU 的运行功耗为 35 瓦,温度约为 78 °C,而 GPU 的运行功耗为 60 瓦,温度约为 76 °C。

(±) The maximum temperature on the upper side is 44.7 °C / 112 F, compared to the average of 36.8 °C / 98 F, ranging from 21 to 71 °C for the class Multimedia.
(±) The bottom heats up to a maximum of 42.8 °C / 109 F, compared to the average of 39.1 °C / 102 F
(+) In idle usage, the average temperature for the upper side is 25.8 °C / 78 F, compared to the device average of 31.3 °C / 88 F.
(±) 3: The average temperature for the upper side is 37.2 °C / 99 F, compared to the average of 31.3 °C / 88 F for the class Multimedia.
(+) The palmrests and touchpad are reaching skin temperature as a maximum (32 °C / 89.6 F) and are therefore not hot.
(-) The average temperature of the palmrest area of similar devices was 28.7 °C / 83.7 F (-3.3 °C / -5.9 F).
| Lenovo ThinkPad T1g Gen 8 21TD003GE Ultra 9 285H, GeForce RTX 5070 Laptop | Lenovo Yoga Pro 9i 16 RTX 5070 Ultra 9 285H, GeForce RTX 5070 Laptop | Asus ProArt P16 RTX 5090 Ryzen AI 9 HX 370, GeForce RTX 5090 Laptop | Dell 16 Premium DA16250 Ultra 7 255H, GeForce RTX 5070 Laptop | Apple MacBook Pro 16 M4 Max M4 Max 16-Core, M4 Max 40-Core GPU | |
|---|---|---|---|---|---|
| Heat | -1% | -3% | 2% | 8% | |
| Maximum Upper Side * (°C) | 44.7 | 41.8 6% | 47 -5% | 36.8 18% | 42.8 4% |
| Maximum Bottom * (°C) | 42.8 | 47.9 -12% | 51.6 -21% | 34.8 19% | 42.3 1% |
| Idle Upper Side * (°C) | 26.9 | 26.3 2% | 24.9 7% | 31.2 -16% | 23.6 12% |
| Idle Bottom * (°C) | 27.3 | 27.6 -1% | 25.5 7% | 30.8 -13% | 23.5 14% |
* ... smaller is better
发言人
立体声扬声器的音质非常好,但所有对比设备的音质都差不多。
Lenovo ThinkPad T1g Gen 8 21TD003GE audio analysis
(+) | speakers can play relatively loud (85.6 dB)
Bass 100 - 315 Hz
(±) | reduced bass - on average 9.3% lower than median
(±) | linearity of bass is average (11.9% delta to prev. frequency)
Mids 400 - 2000 Hz
(+) | balanced mids - only 2.5% away from median
(+) | mids are linear (4% delta to prev. frequency)
Highs 2 - 16 kHz
(+) | balanced highs - only 3.4% away from median
(±) | linearity of highs is average (7.5% delta to prev. frequency)
Overall 100 - 16.000 Hz
(+) | overall sound is linear (8.7% difference to median)
Compared to same class
» 11% of all tested devices in this class were better, 2% similar, 87% worse
» The best had a delta of 5%, average was 17%, worst was 45%
Compared to all devices tested
» 3% of all tested devices were better, 1% similar, 97% worse
» The best had a delta of 4%, average was 23%, worst was 134%
Lenovo Yoga Pro 9i 16 RTX 5070 audio analysis
(±) | speaker loudness is average but good (81.4 dB)
Bass 100 - 315 Hz
(±) | reduced bass - on average 5.5% lower than median
(±) | linearity of bass is average (7.5% delta to prev. frequency)
Mids 400 - 2000 Hz
(+) | balanced mids - only 1.7% away from median
(+) | mids are linear (3.1% delta to prev. frequency)
Highs 2 - 16 kHz
(±) | reduced highs - on average 6.2% lower than median
(+) | highs are linear (3.9% delta to prev. frequency)
Overall 100 - 16.000 Hz
(+) | overall sound is linear (9.7% difference to median)
Compared to same class
» 13% of all tested devices in this class were better, 1% similar, 85% worse
» The best had a delta of 5%, average was 17%, worst was 45%
Compared to all devices tested
» 4% of all tested devices were better, 1% similar, 95% worse
» The best had a delta of 4%, average was 23%, worst was 134%
Asus ProArt P16 RTX 5090 audio analysis
(±) | speaker loudness is average but good (80.8 dB)
Bass 100 - 315 Hz
(+) | good bass - only 3.3% away from median
(±) | linearity of bass is average (7.7% delta to prev. frequency)
Mids 400 - 2000 Hz
(+) | balanced mids - only 2.9% away from median
(+) | mids are linear (1.9% delta to prev. frequency)
Highs 2 - 16 kHz
(+) | balanced highs - only 4.1% away from median
(+) | highs are linear (5.5% delta to prev. frequency)
Overall 100 - 16.000 Hz
(+) | overall sound is linear (8.3% difference to median)
Compared to same class
» 9% of all tested devices in this class were better, 2% similar, 89% worse
» The best had a delta of 5%, average was 17%, worst was 45%
Compared to all devices tested
» 2% of all tested devices were better, 1% similar, 97% worse
» The best had a delta of 4%, average was 23%, worst was 134%
Dell 16 Premium DA16250 audio analysis
(+) | speakers can play relatively loud (84.2 dB)
Bass 100 - 315 Hz
(±) | reduced bass - on average 6.1% lower than median
(+) | bass is linear (4.2% delta to prev. frequency)
Mids 400 - 2000 Hz
(+) | balanced mids - only 1.4% away from median
(+) | mids are linear (3.6% delta to prev. frequency)
Highs 2 - 16 kHz
(+) | balanced highs - only 1.5% away from median
(+) | highs are linear (2.2% delta to prev. frequency)
Overall 100 - 16.000 Hz
(+) | overall sound is linear (5.1% difference to median)
Compared to same class
» 1% of all tested devices in this class were better, 0% similar, 99% worse
» The best had a delta of 5%, average was 17%, worst was 45%
Compared to all devices tested
» 0% of all tested devices were better, 0% similar, 100% worse
» The best had a delta of 4%, average was 23%, worst was 134%
Apple MacBook Pro 16 2024 M4 Pro audio analysis
(+) | speakers can play relatively loud (84.6 dB)
Bass 100 - 315 Hz
(±) | reduced bass - on average 5.1% lower than median
(+) | bass is linear (5.6% delta to prev. frequency)
Mids 400 - 2000 Hz
(+) | balanced mids - only 1.4% away from median
(+) | mids are linear (2.4% delta to prev. frequency)
Highs 2 - 16 kHz
(+) | balanced highs - only 1.6% away from median
(+) | highs are linear (3% delta to prev. frequency)
Overall 100 - 16.000 Hz
(+) | overall sound is linear (4.8% difference to median)
Compared to same class
» 0% of all tested devices in this class were better, 0% similar, 99% worse
» The best had a delta of 5%, average was 17%, worst was 45%
Compared to all devices tested
» 0% of all tested devices were better, 0% similar, 100% worse
» The best had a delta of 4%, average was 23%, worst was 134%
耗电量

在功耗测量方面,没有什么大的惊喜。在闲置状态下,明亮的 OLED 面板非常明显,但这也在意料之中。在压力测试中,我们短暂测得的功耗约为 143 瓦,然后很快稳定在约 134 瓦。140 瓦的电源适配器能够处理这一负载,但可用余地很小,例如同时为电池充电。
| Off / Standby | |
| Idle | |
| Load |
|
Key:
min: | |
| Lenovo ThinkPad T1g Gen 8 21TD003GE Ultra 9 285H, GeForce RTX 5070 Laptop, Samsung PM9E1 MZVLC2T0HBLD, Tandem-OLED, 3200x2000, 16" | Lenovo Yoga Pro 9i 16 RTX 5070 Ultra 9 285H, GeForce RTX 5070 Laptop, WD PC SN7100S SDFPMSL-1T00-1101, OLED, 3200x2000, 16" | Asus ProArt P16 RTX 5090 Ryzen AI 9 HX 370, GeForce RTX 5090 Laptop, Micron 2500 2TB MTFDKBA2T0QGN-1BN1AABGA, OLED, 3840x2400, 16" | Dell 16 Premium DA16250 Ultra 7 255H, GeForce RTX 5070 Laptop, Kioxia BG6 KBG6AZNV1T02, OLED, 3840x2400, 16.3" | Apple MacBook Pro 16 M4 Max M4 Max 16-Core, M4 Max 40-Core GPU, Apple SSD AP1024Z, Mini-LED, 3456x2234, 16.2" | Average NVIDIA GeForce RTX 5070 Laptop | Average of class Multimedia | |
|---|---|---|---|---|---|---|---|
| Power Consumption | -19% | -31% | -8% | -2% | -32% | 22% | |
| Idle Minimum * (Watt) | 8.5 | 8.8 -4% | 10.9 -28% | 6.5 24% | 4.7 45% | 10.8 ? -27% | 5.72 ? 33% |
| Idle Average * (Watt) | 13.6 | 16.1 -18% | 12.1 11% | 8.1 40% | 15.5 -14% | 15.4 ? -13% | 10.2 ? 25% |
| Idle Maximum * (Watt) | 14.1 | 16.5 -17% | 12.5 11% | 33 -134% | 15.6 -11% | 21 ? -49% | 12.4 ? 12% |
| Load Average * (Watt) | 84.5 | 89.3 -6% | 129.3 -53% | 88.9 -5% | 125 -48% | 98.7 ? -17% | 65.5 ? 22% |
| Cyberpunk 2077 ultra external monitor * (Watt) | 118.1 | 157.9 -34% | 172.8 -46% | 108.9 8% | 107.2 9% | ||
| Cyberpunk 2077 ultra * (Watt) | 120.3 | 160.6 -33% | 176.6 -47% | 108.7 10% | 116.2 3% | ||
| Load Maximum * (Watt) | 143 | 177.4 -24% | 233.9 -64% | 138.3 3% | 143.7 -0% | 218 ? -52% | 114 ? 20% |
* ... smaller is better
功耗 - 赛博朋克/压力测试
带外部监视器时的耗电量
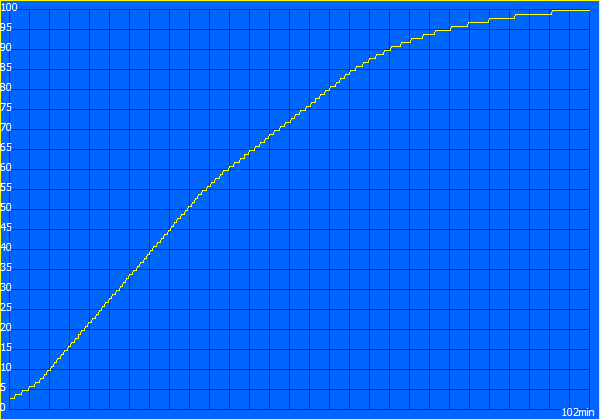
电池寿命
使用 90 Wh 电池,我们在 150 cd/m² 的条件下进行了 Wi-Fi 测试,结果显示运行时间略低于 11 小时,这在基于 Windows 的竞争对手中是非常有竞争力的。只有 MacBook Pro的续航时间更长,达到 18 小时左右。在最大亮度下,我们测得的运行时间略低于 6 小时,这使 ThinkPad 领先于其他 Windows 机型,而 MacBook Pro 仅多出约 1 小时。

Notebookcheck 总体评分
Lenovo ThinkPad T1g Gen 8 21TD003GE
- 01/21/2026 v8
Andreas Osthoff
 Total Sustainability Score:
 可能的替代品一览
Image | Model / Review | Price | Weight | Height | Display |
|---|---|---|---|---|---|
1. 92.4%  | Lenovo ThinkPad T1g Gen 8 21TD003GE Intel Core Ultra 9 285H ⎘ NVIDIA GeForce RTX 5070 Laptop ⎘ 64 GB Memory, 2048 GB SSD | Amazon: List Price: 4500€ | 1.9 kg | 15.8 mm | 16.00" 3200x2000 236 PPI Tandem-OLED |
2. 90.4%  | Lenovo Yoga Pro 9i 16 RTX 5070 Intel Core Ultra 9 285H ⎘ NVIDIA GeForce RTX 5070 Laptop ⎘ 64 GB Memory, 1024 GB SSD | Amazon: List Price: 2800€ | 1.9 kg | 17.9 mm | 16.00" 3200x2000 236 PPI OLED |
3. 89.7%  | Asus ProArt P16 RTX 5090 AMD Ryzen AI 9 HX 370 ⎘ NVIDIA GeForce RTX 5090 Laptop ⎘ 64 GB Memory, 2048 GB SSD | Amazon: List Price: 4799€ | 2 kg | 18.3 mm | 16.00" 3840x2400 283 PPI OLED |
4. 87.9%  | Dell 16 Premium DA16250 Intel Core Ultra 7 255H ⎘ NVIDIA GeForce RTX 5070 Laptop ⎘ 32 GB Memory, 1024 GB SSD | Amazon: List Price: 3300 USD | 2.3 kg | 18.7 mm | 16.30" 3840x2400 278 PPI OLED |
5. 91.7%  | Apple MacBook Pro 16 M4 Max Apple M4 Max 16-Core ⎘ Apple M4 Max 40-Core GPU ⎘ 48 GB Memory, 1024 GB SSD | Amazon: List Price: 4699€ | 2.1 kg | 16.8 mm | 16.20" 3456x2234 254 PPI Mini-LED |
Transparency
The selection of devices to be reviewed is made by our editorial team. The test sample was provided to the author as a loan by the manufacturer or retailer for the purpose of this review. The lender had no influence on this review, nor did the manufacturer receive a copy of this review before publication. There was no obligation to publish this review. As an independent media company, Notebookcheck is not subjected to the authority of manufacturers, retailers or publishers.
This is how Notebookcheck is testing
Every year, Notebookcheck independently reviews hundreds of laptops and smartphones using standardized procedures to ensure that all results are comparable. We have continuously developed our test methods for around 20 years and set industry standards in the process. In our test labs, high-quality measuring equipment is utilized by experienced technicians and editors. These tests involve a multi-stage validation process. Our complex rating system is based on hundreds of well-founded measurements and benchmarks, which maintains objectivity. Further information on our test methods can be found here.
