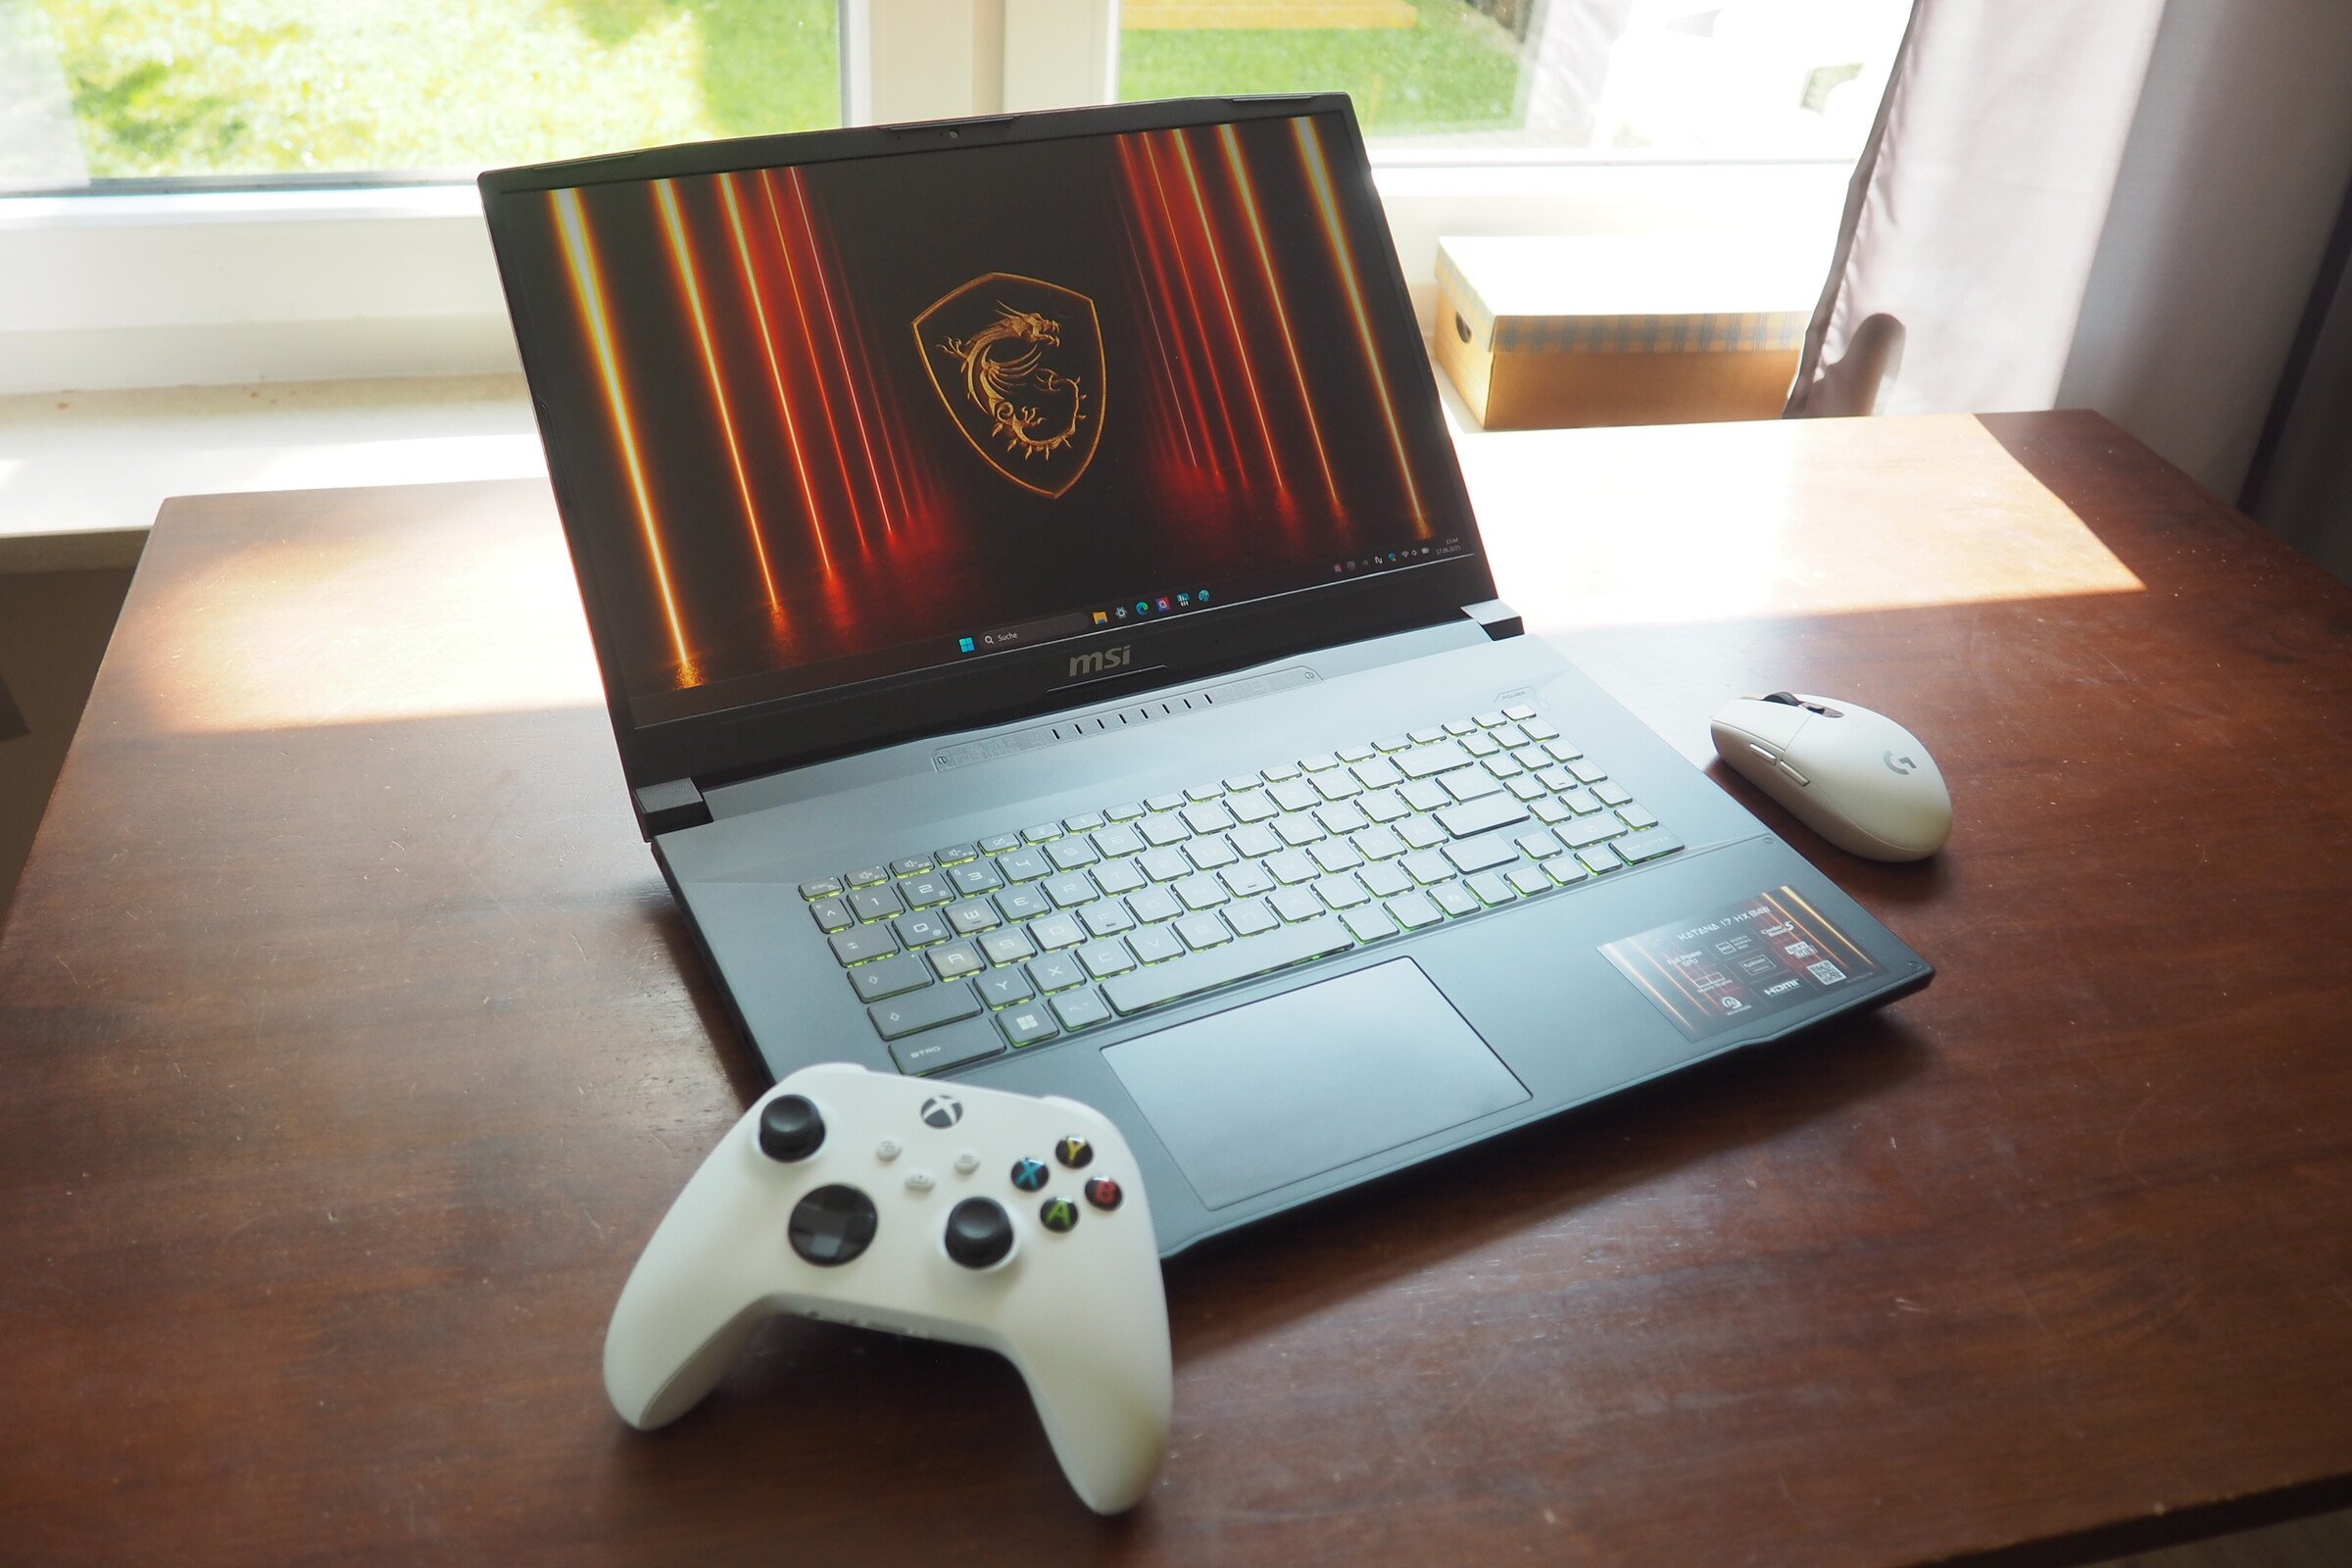
结论:剑可以更锋利
katana 17 HX B14WGK 不仅在微星产品组合中面临挑战,在与同类产品的比较中也是如此。虽然外壳做工精良,但容易发出响声,总体感觉质量不高。降低成本的措施还体现在接口上。Thunderbolt 或现代 USB 端口(关键词 USB 4)以及读卡器都没有了。此外,在负载情况下噪音非常大,实际上迫使你不得不使用耳机。微星还可以改进键盘、扬声器音效、网络摄像头质量和电池续航时间。
显示效果方面几乎没有什么可抱怨的:除了亮度不佳之外,240 Hz 的屏幕几乎在所有地方都达到了不错的数值。GeForce RTX 5070 给人褒贬不一的感觉,更多是 Nvidia 的产品决策造成的。此外,8 GB 的 VRAM 在 2025 年已经不够用了,特别是对于资源密集型应用,如 夺宝奇兵虽然 GDDR7 至少在一定程度上缓解了这一状况。除此以外,这款 17 英寸的笔记本电脑并不出众,也就是说,无论从正面还是负面来看,它都没有在众多产品中脱颖而出,因此最终只能获得 "良好 "的评价。
Pros
Cons
价格和供应情况
在德国,配备酷睿 i7-14650HX 和GeForce RTX 5070 的微星 Katana 17 HX B14WGK 在多家在线商店(如playox.de)的售价约为 1,800 欧元(约合 2,065 美元)。
- $57.95240W 12A Adapter for MSI Katana 15 17 HX B13V B13VGK B13VFK B13VEK B12V B12VGK B12VEK B12VFK B14W B14WGK Pulse 15 17 B13V B13VGK Delta 15 A5EFK Chicony A20-240P2A Gaming Laptop Charger 4.5 * 3.0 mm
- $59.99240W 200W AC Charger for MSI Katana 15 17 HX Pulse 15 17 B13V B13VF B13VGK B13VEK B13VGK-484US B13VEK-277US B14W B14WGK B14WFK B12V B12VFK B12VGK B12VEK GF66 GF76 12UE 12UGS 12UG Laptop
- $25.99Silent Wireless Mouse for MSI Katana 17 HX B14WGK,Bluetooth,2.4GHz with USB Receiver, Quiet & Lightweight
Katana 17 的竞争对手包括其他 RTX 5070(Ti)游戏笔记本电脑,如 技嘉 Aero X16、 华硕 ProArt P16、 申克 XMG Pro 16或内部生产的 Vector 16 HX AI.
规格
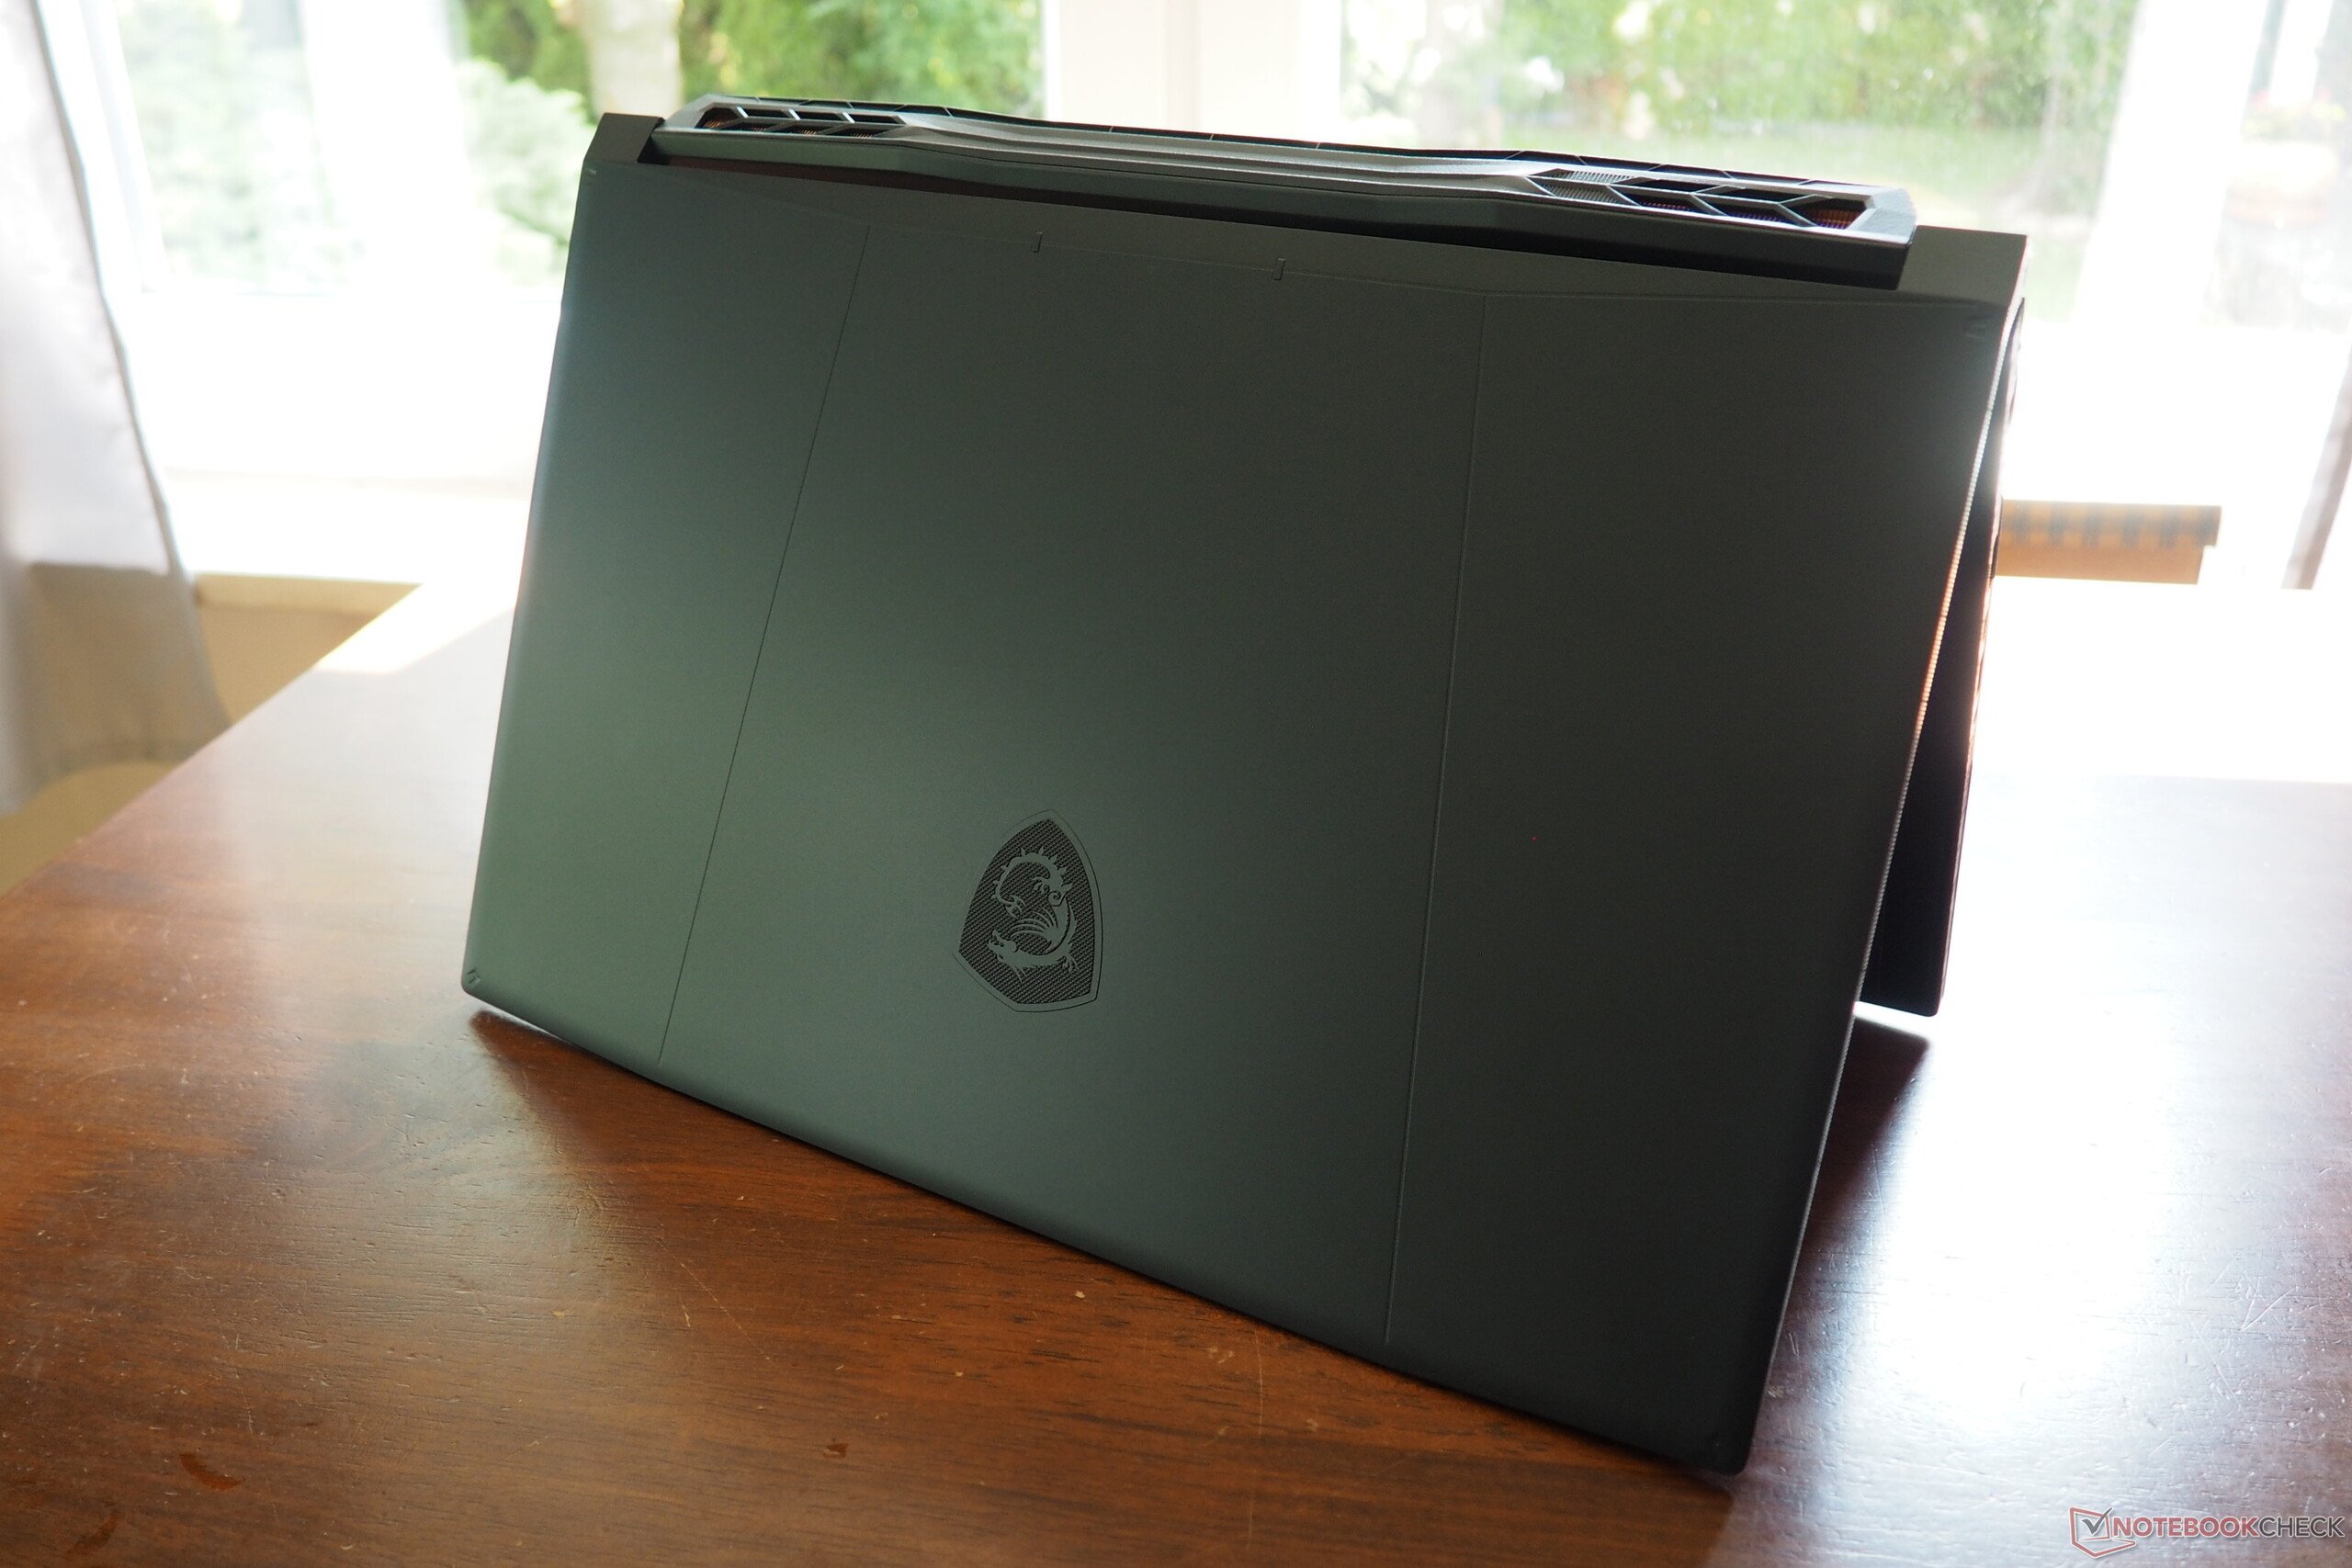
案例

端口和连接性
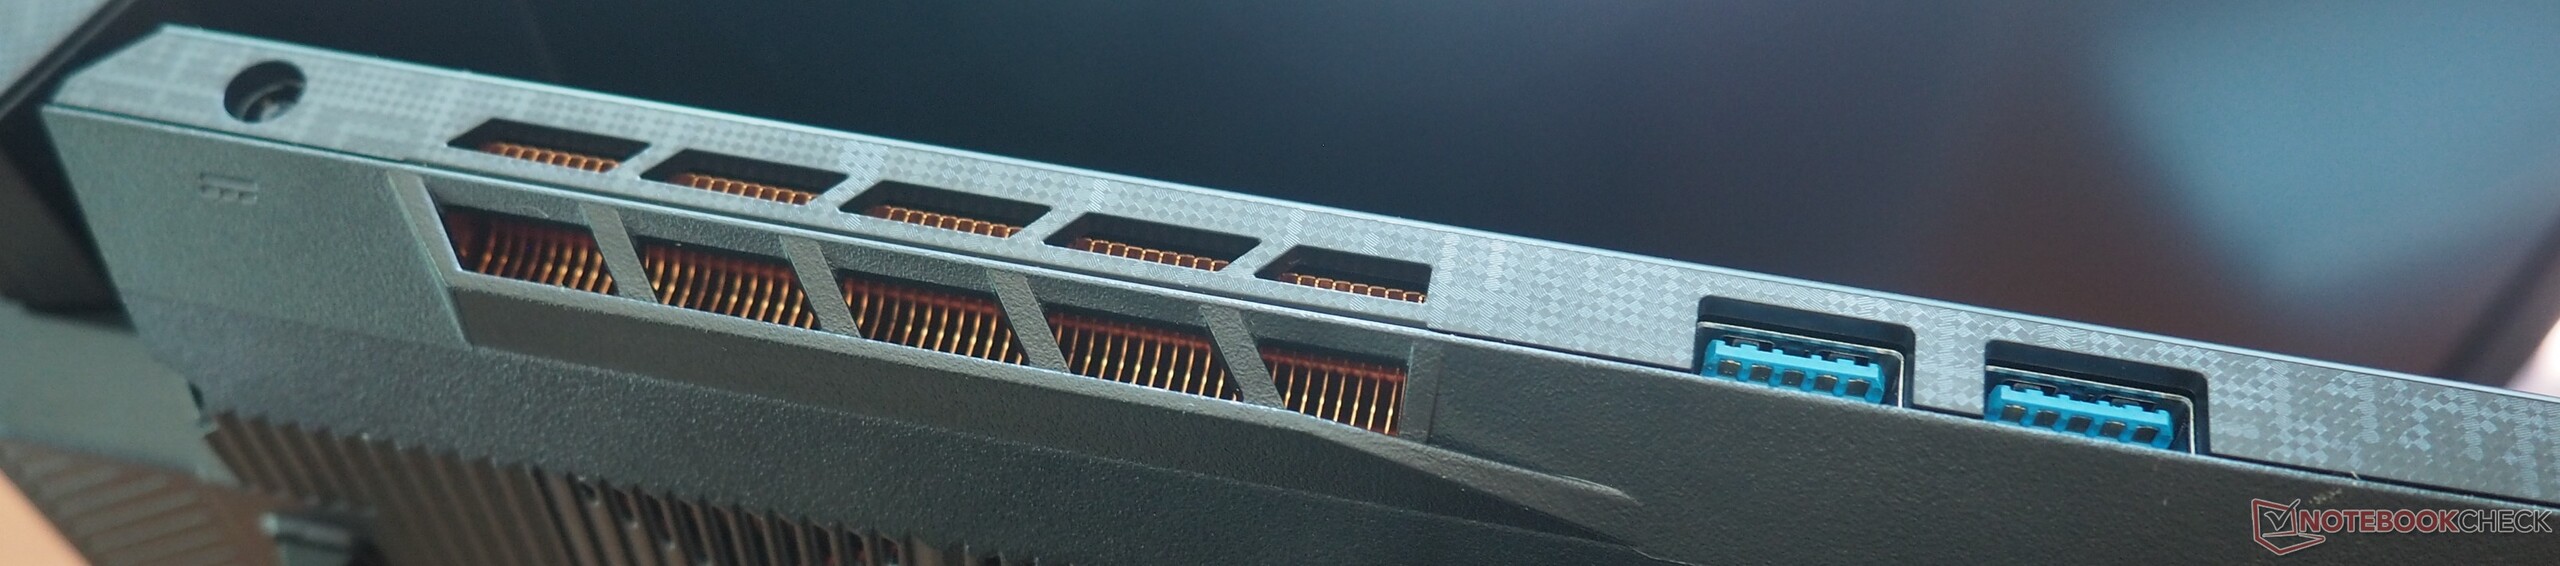
Katana 17 提供三个 USB-A 端口(3.0)和一个 USB-C 端口(3.1 Gen 2,包括 DisplayPort),以及一个音频插孔、一个千兆以太网端口和一个 HDMI 2.1 输出端口。内置 Wi-Fi 模块(英特尔 Wi-Fi 6E AX211)的速度从不错到很好,具体取决于测试。不过,高清网络摄像头的图像非常模糊。

交流
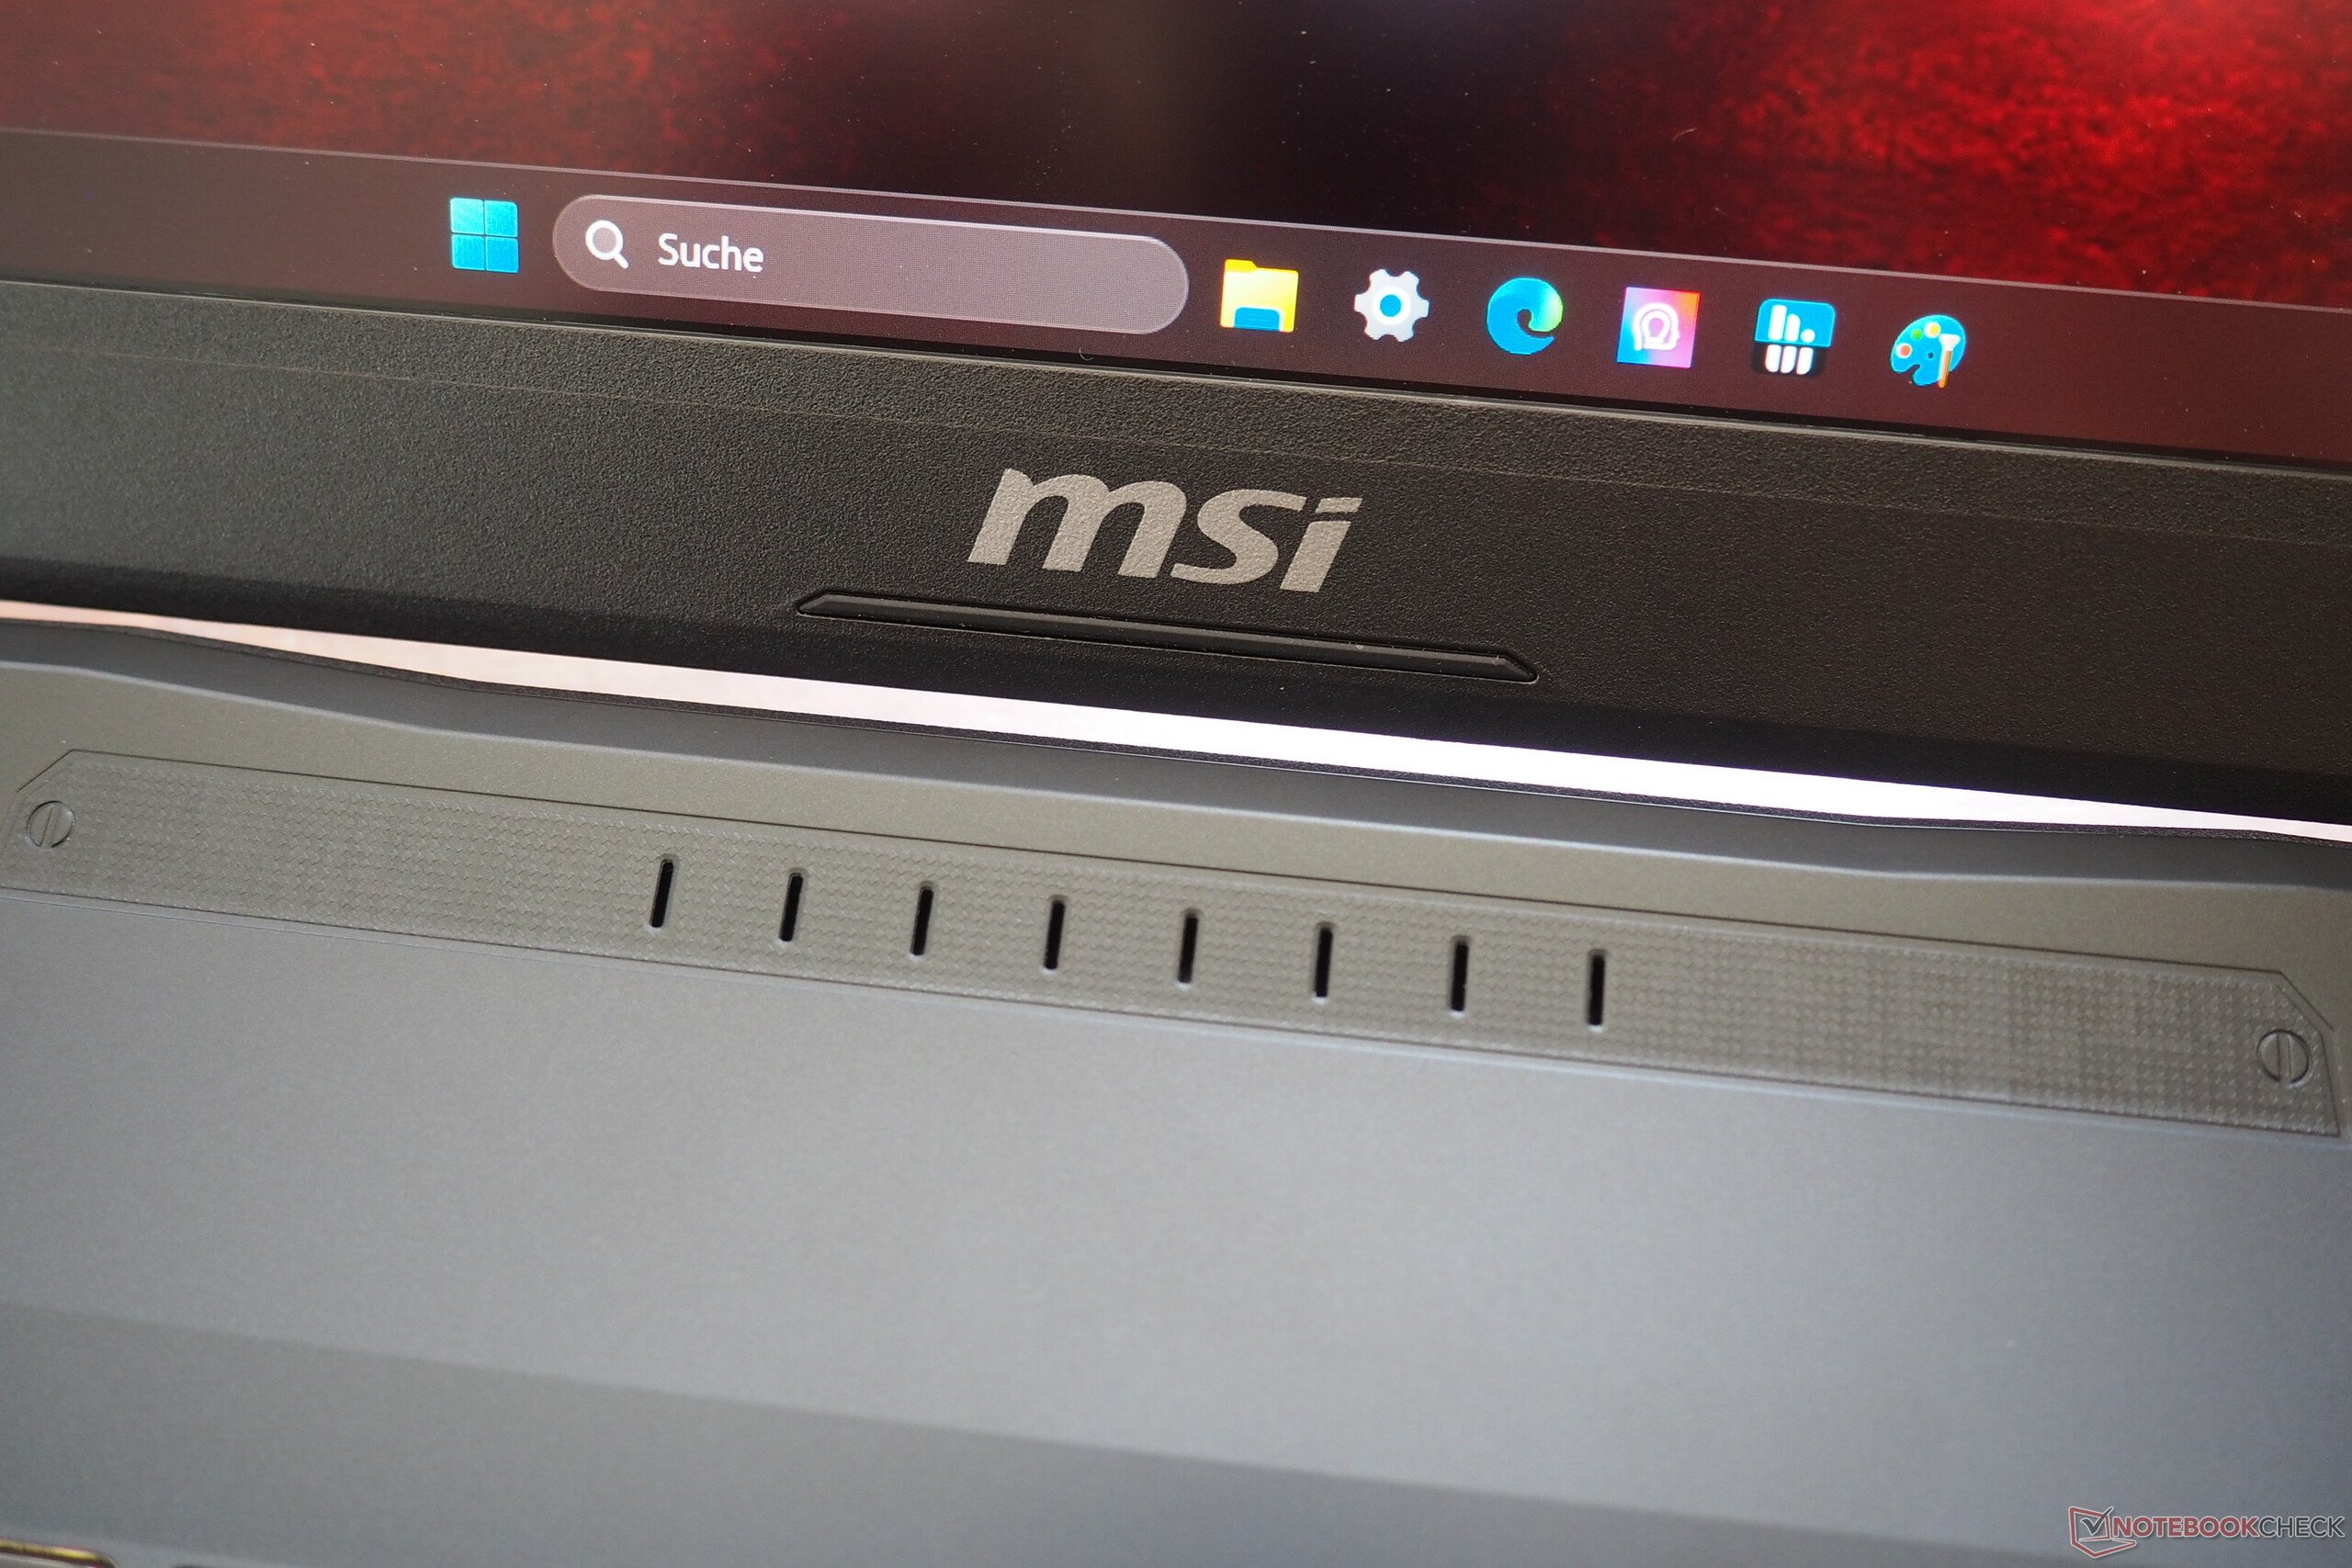
网络摄像头


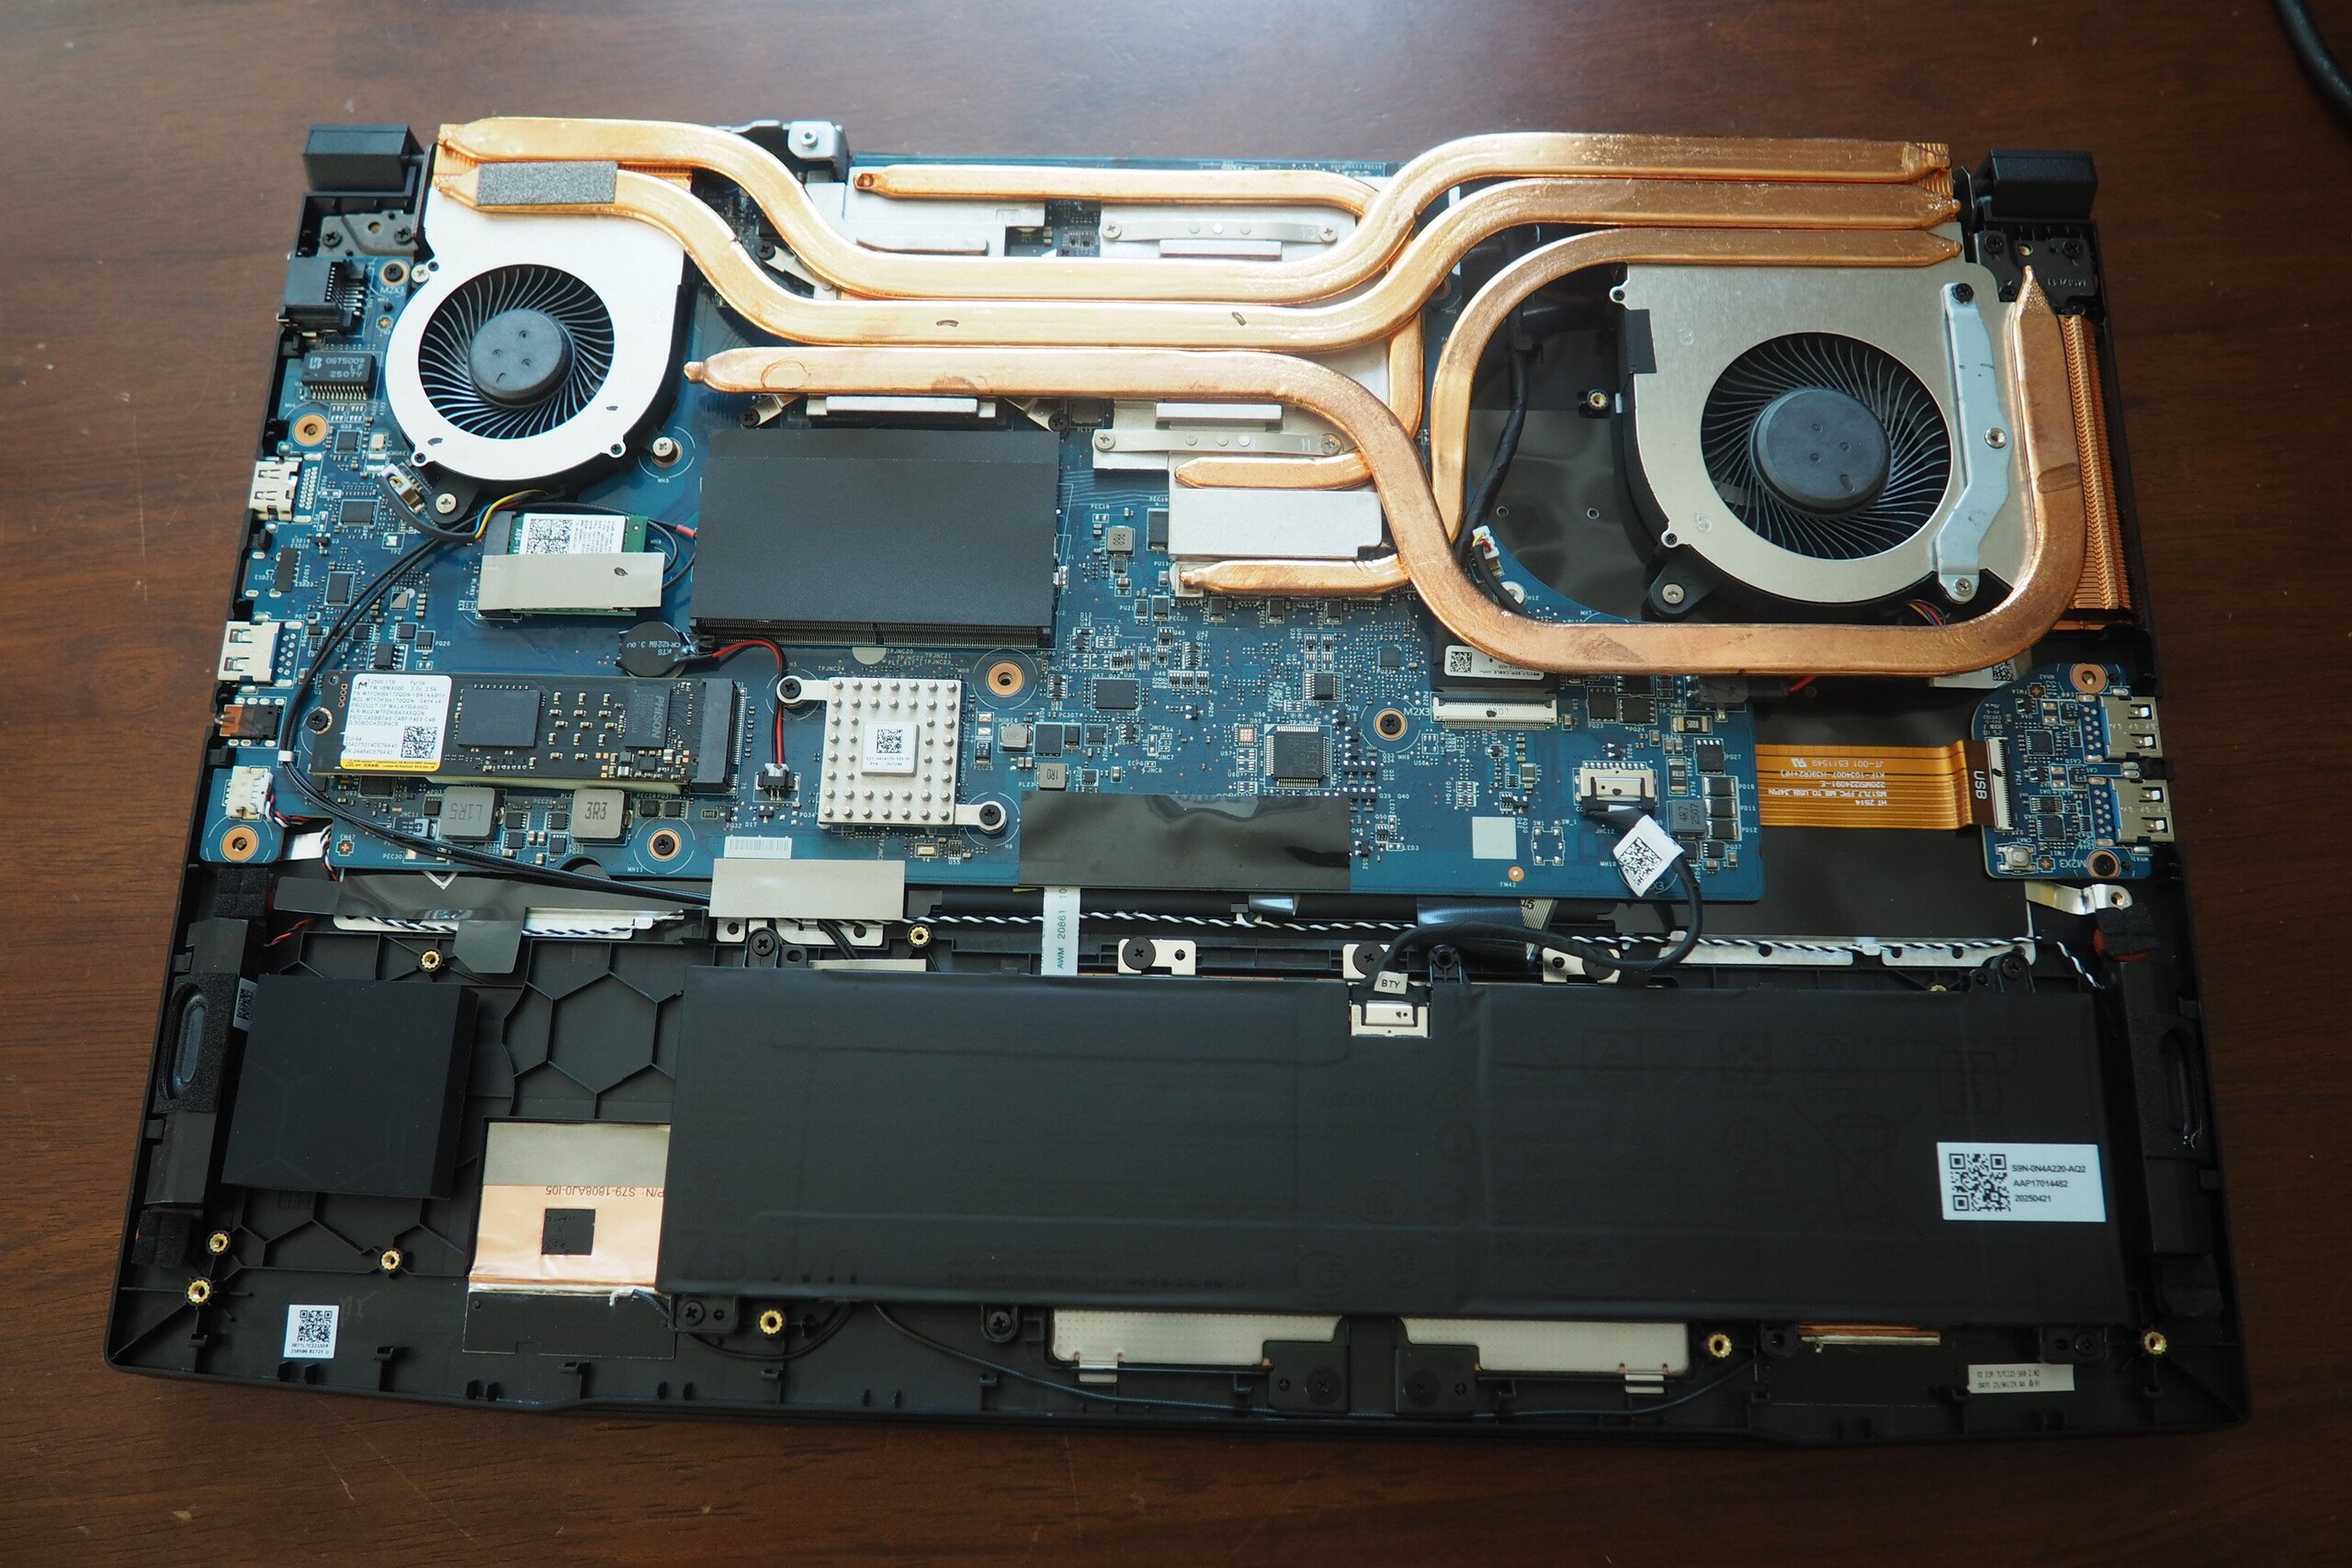
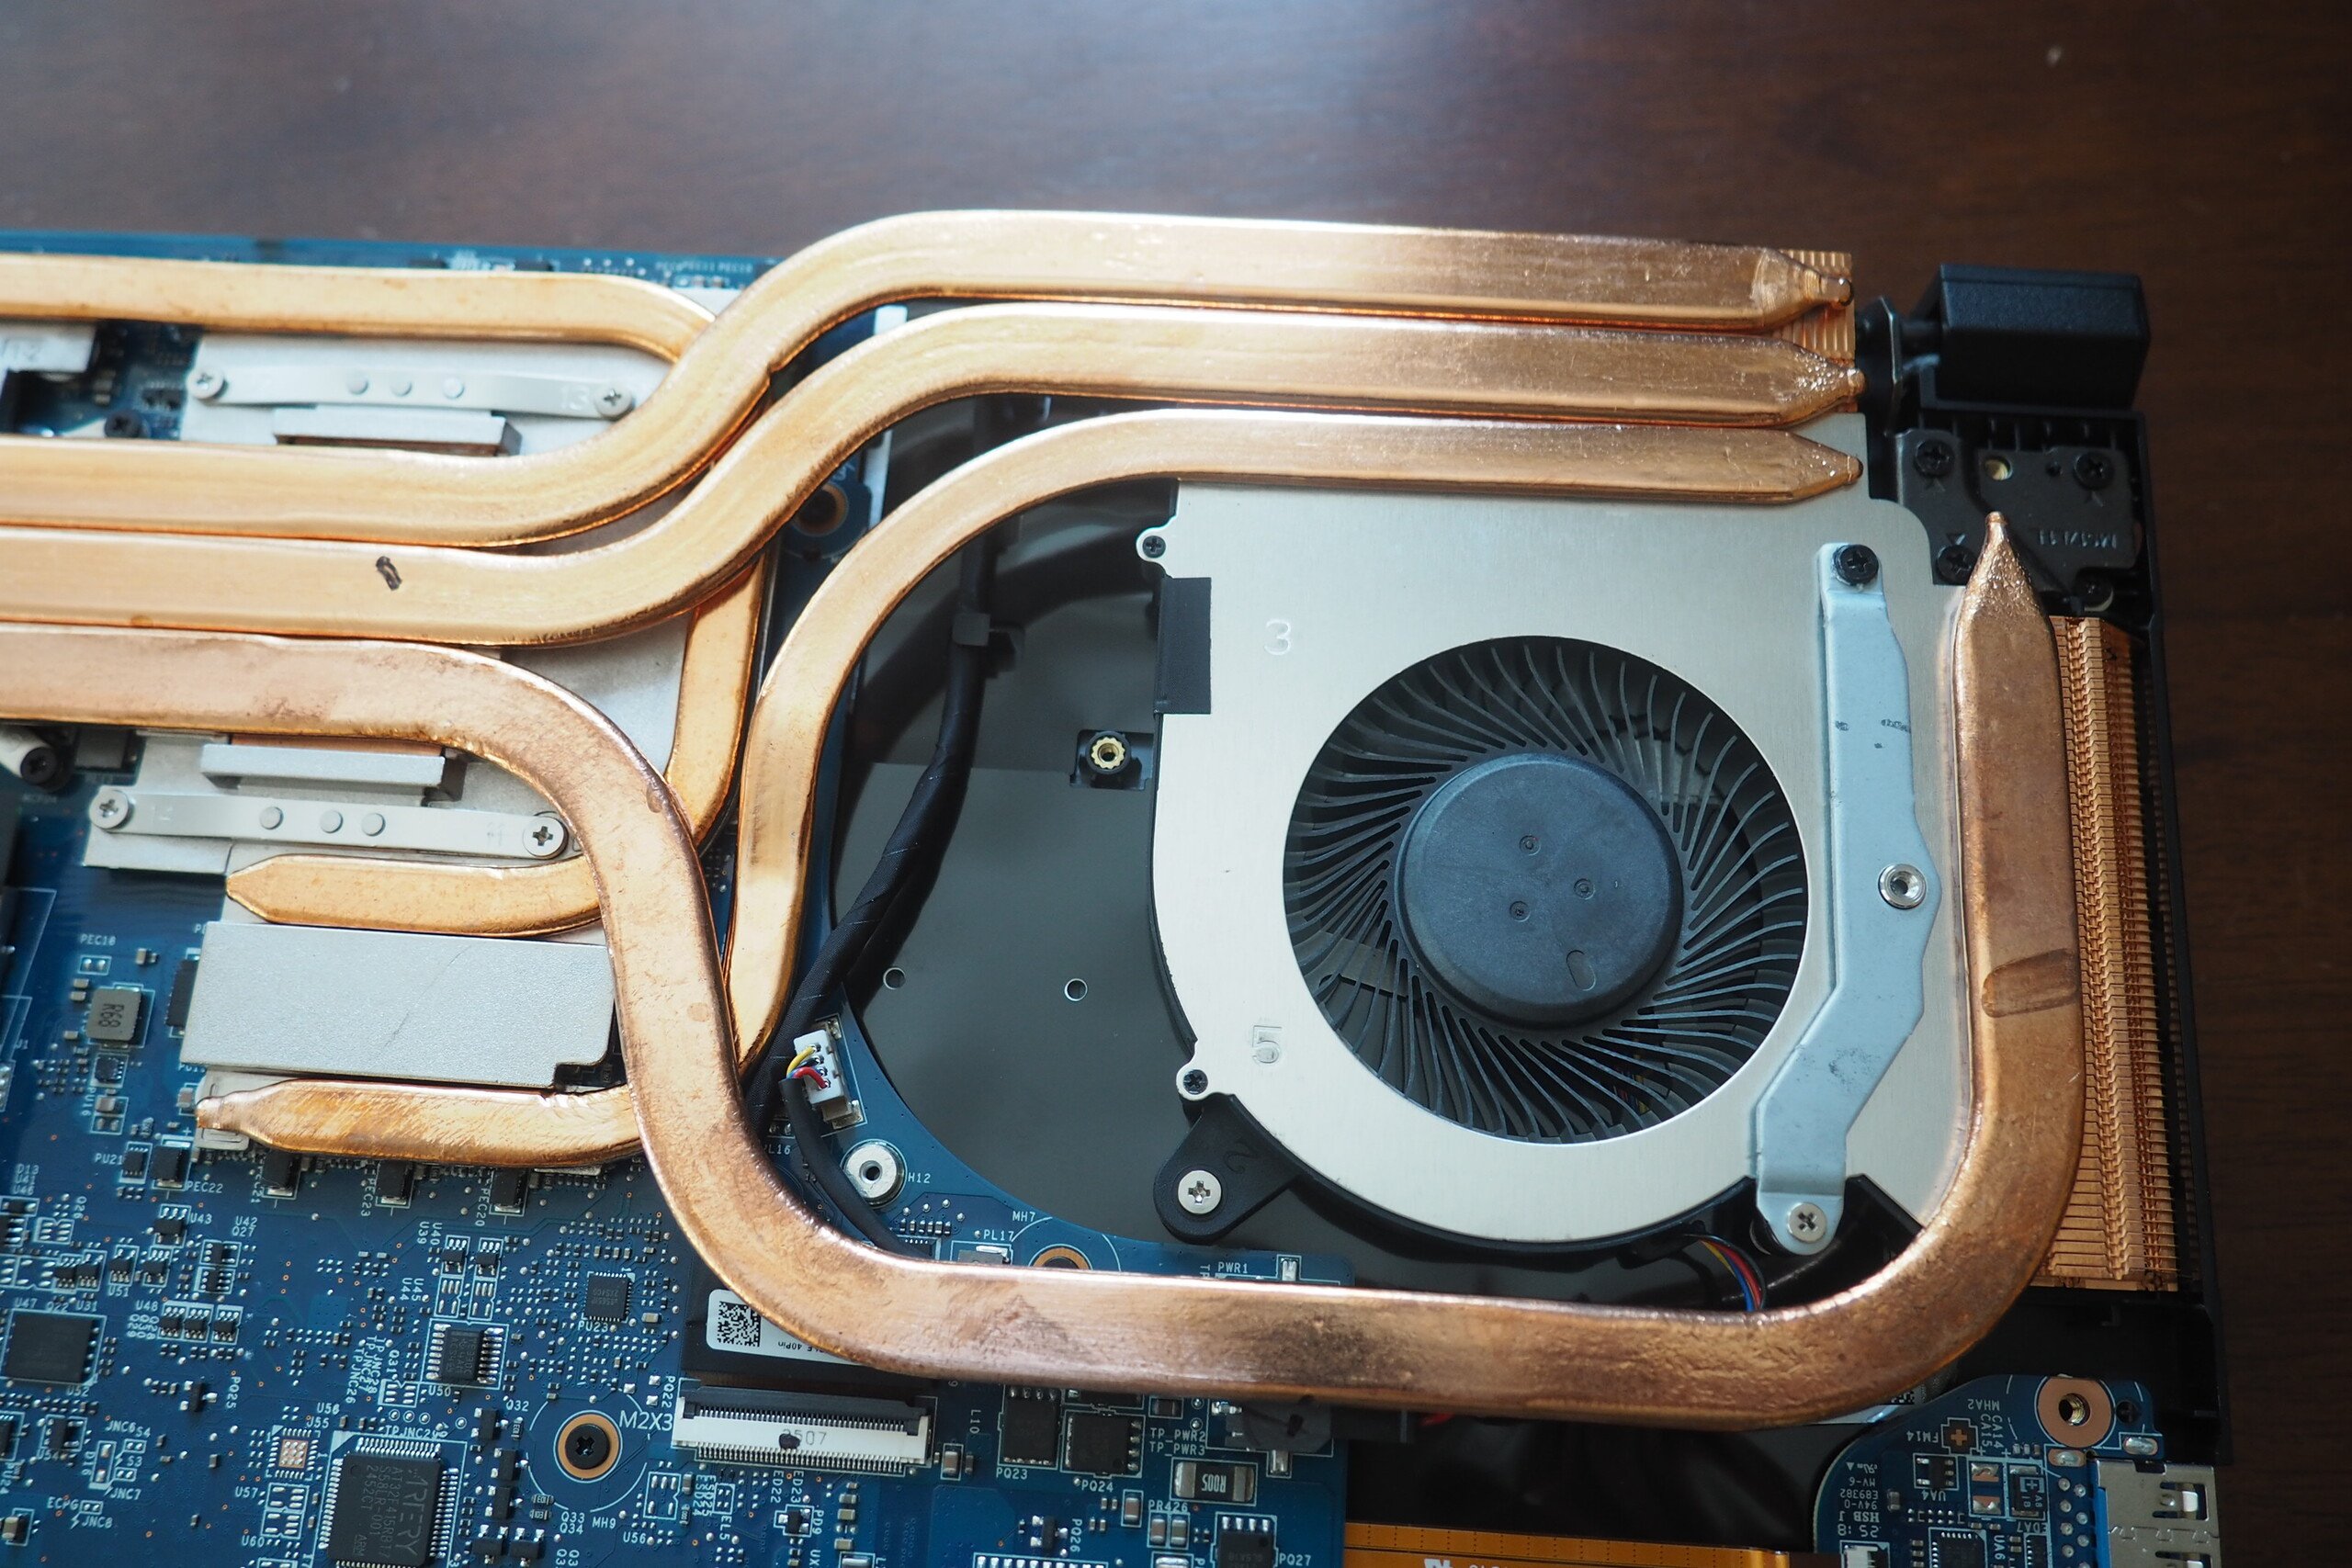
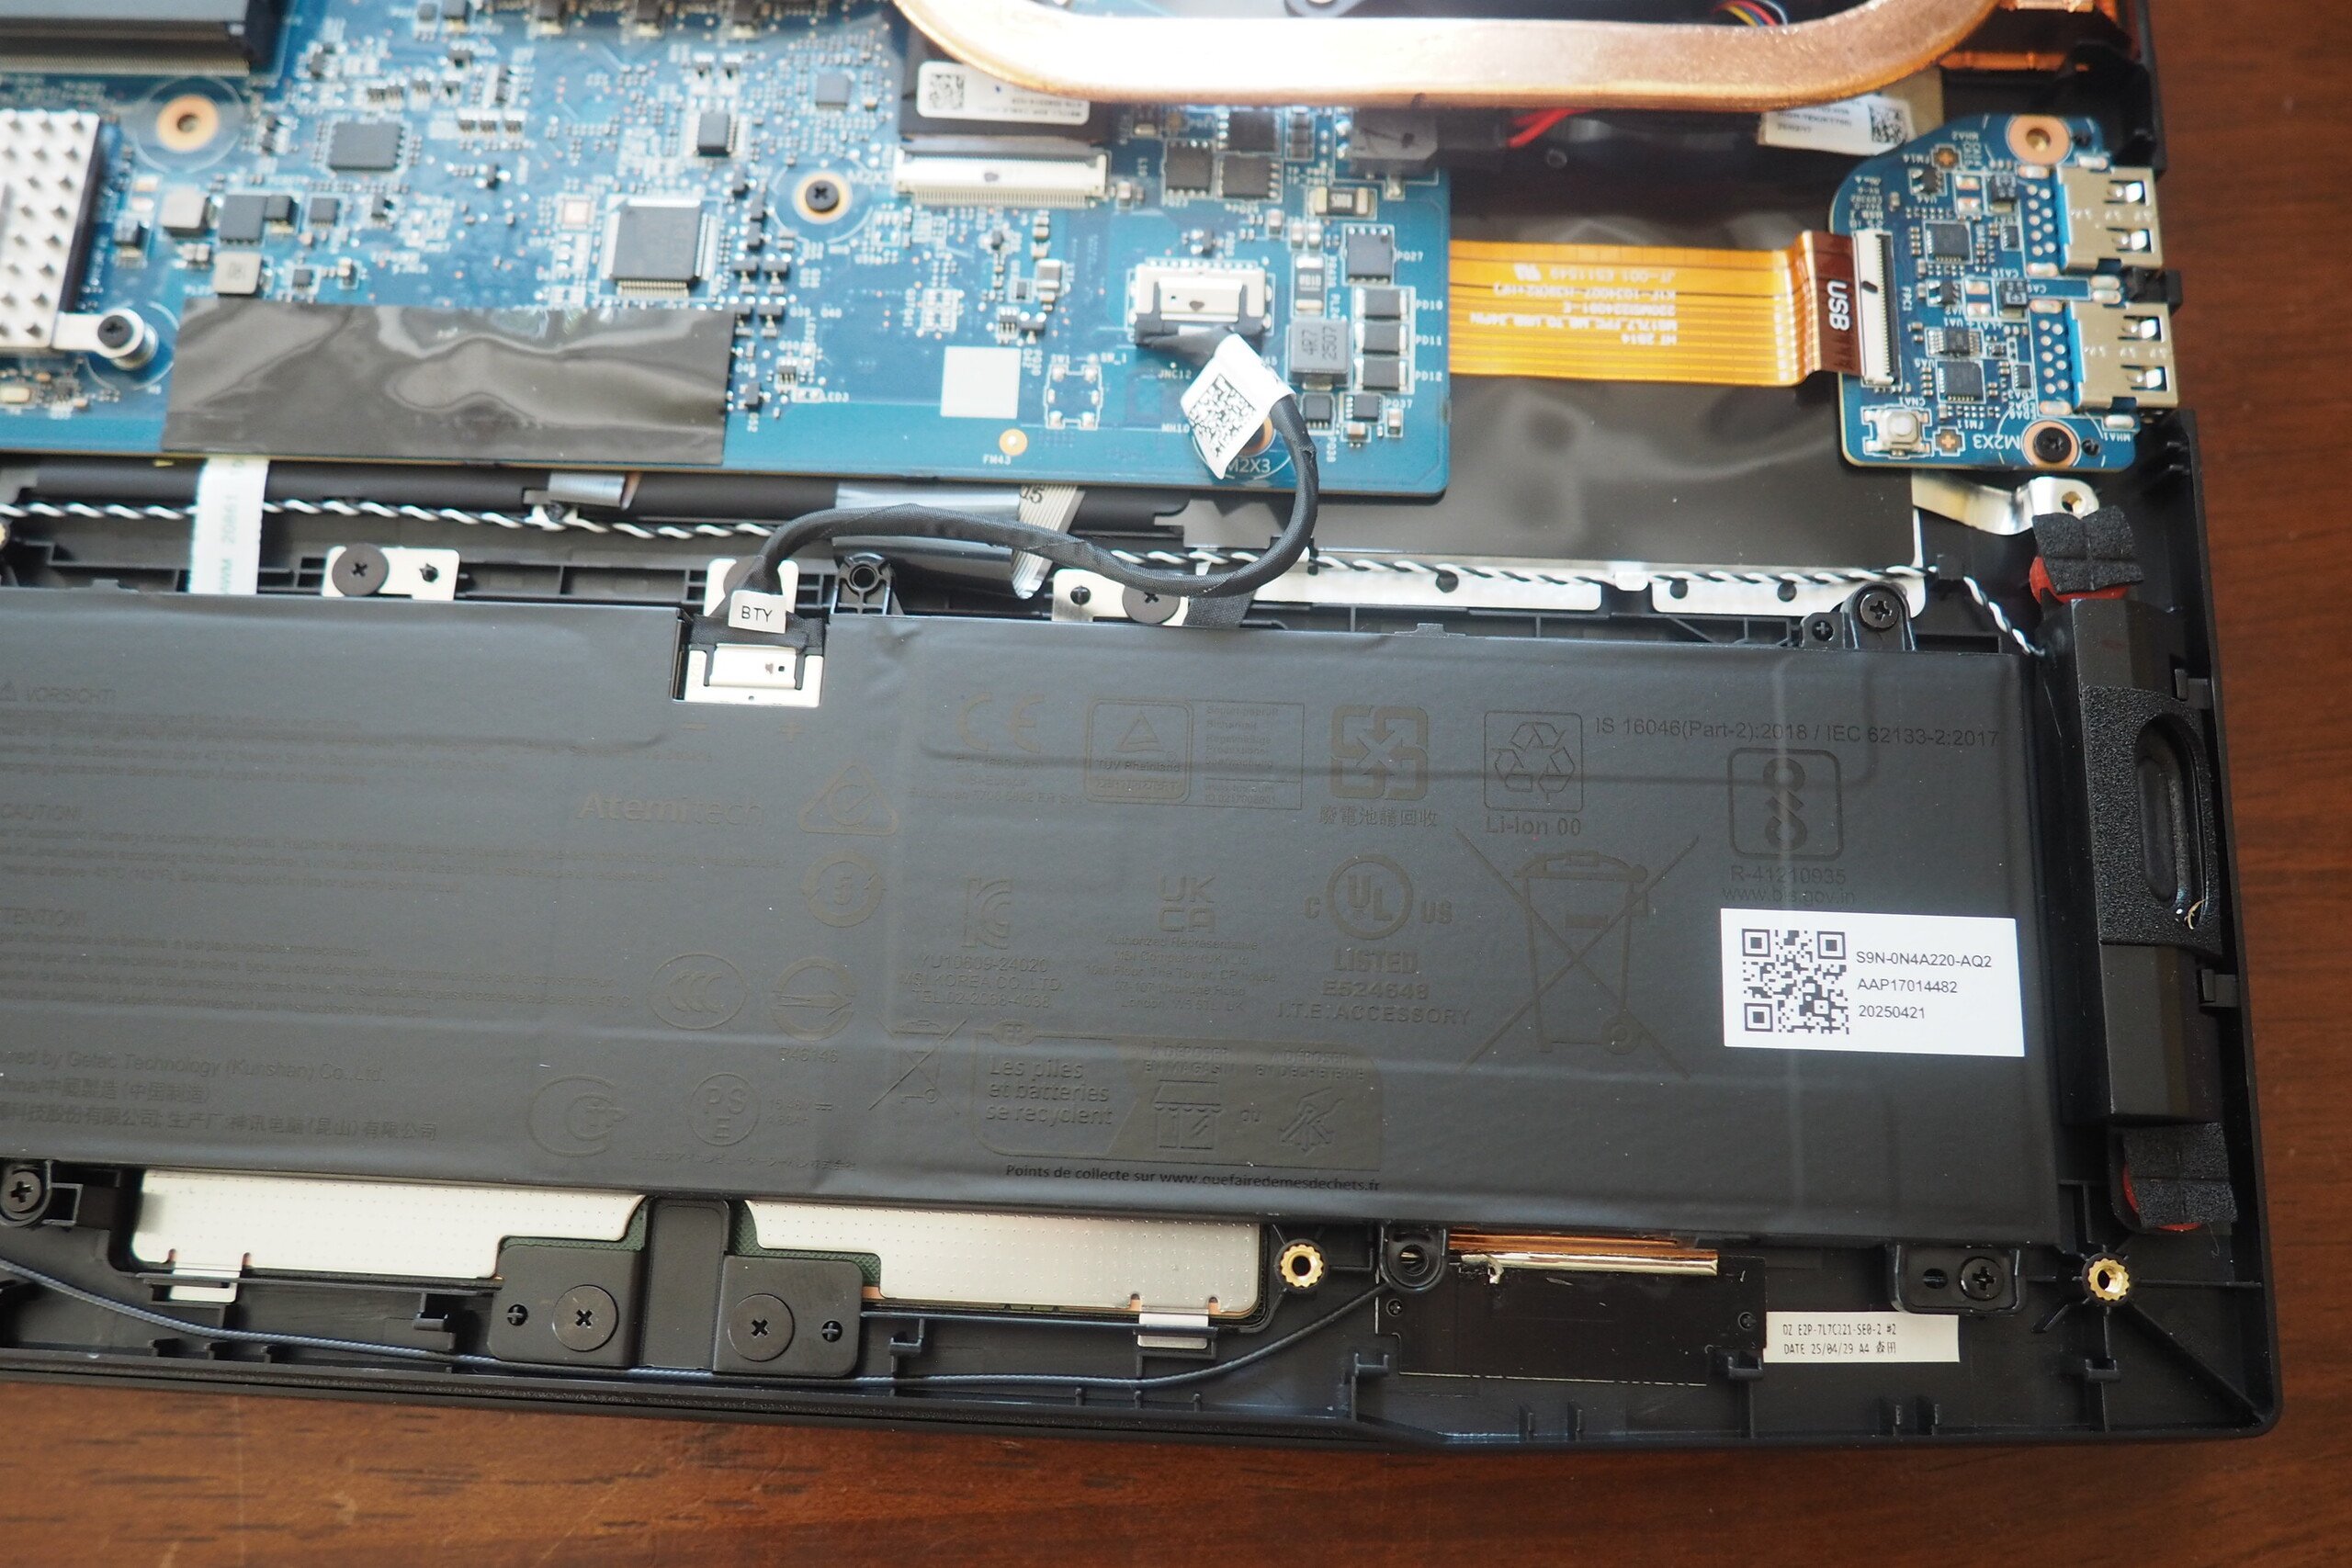
维护
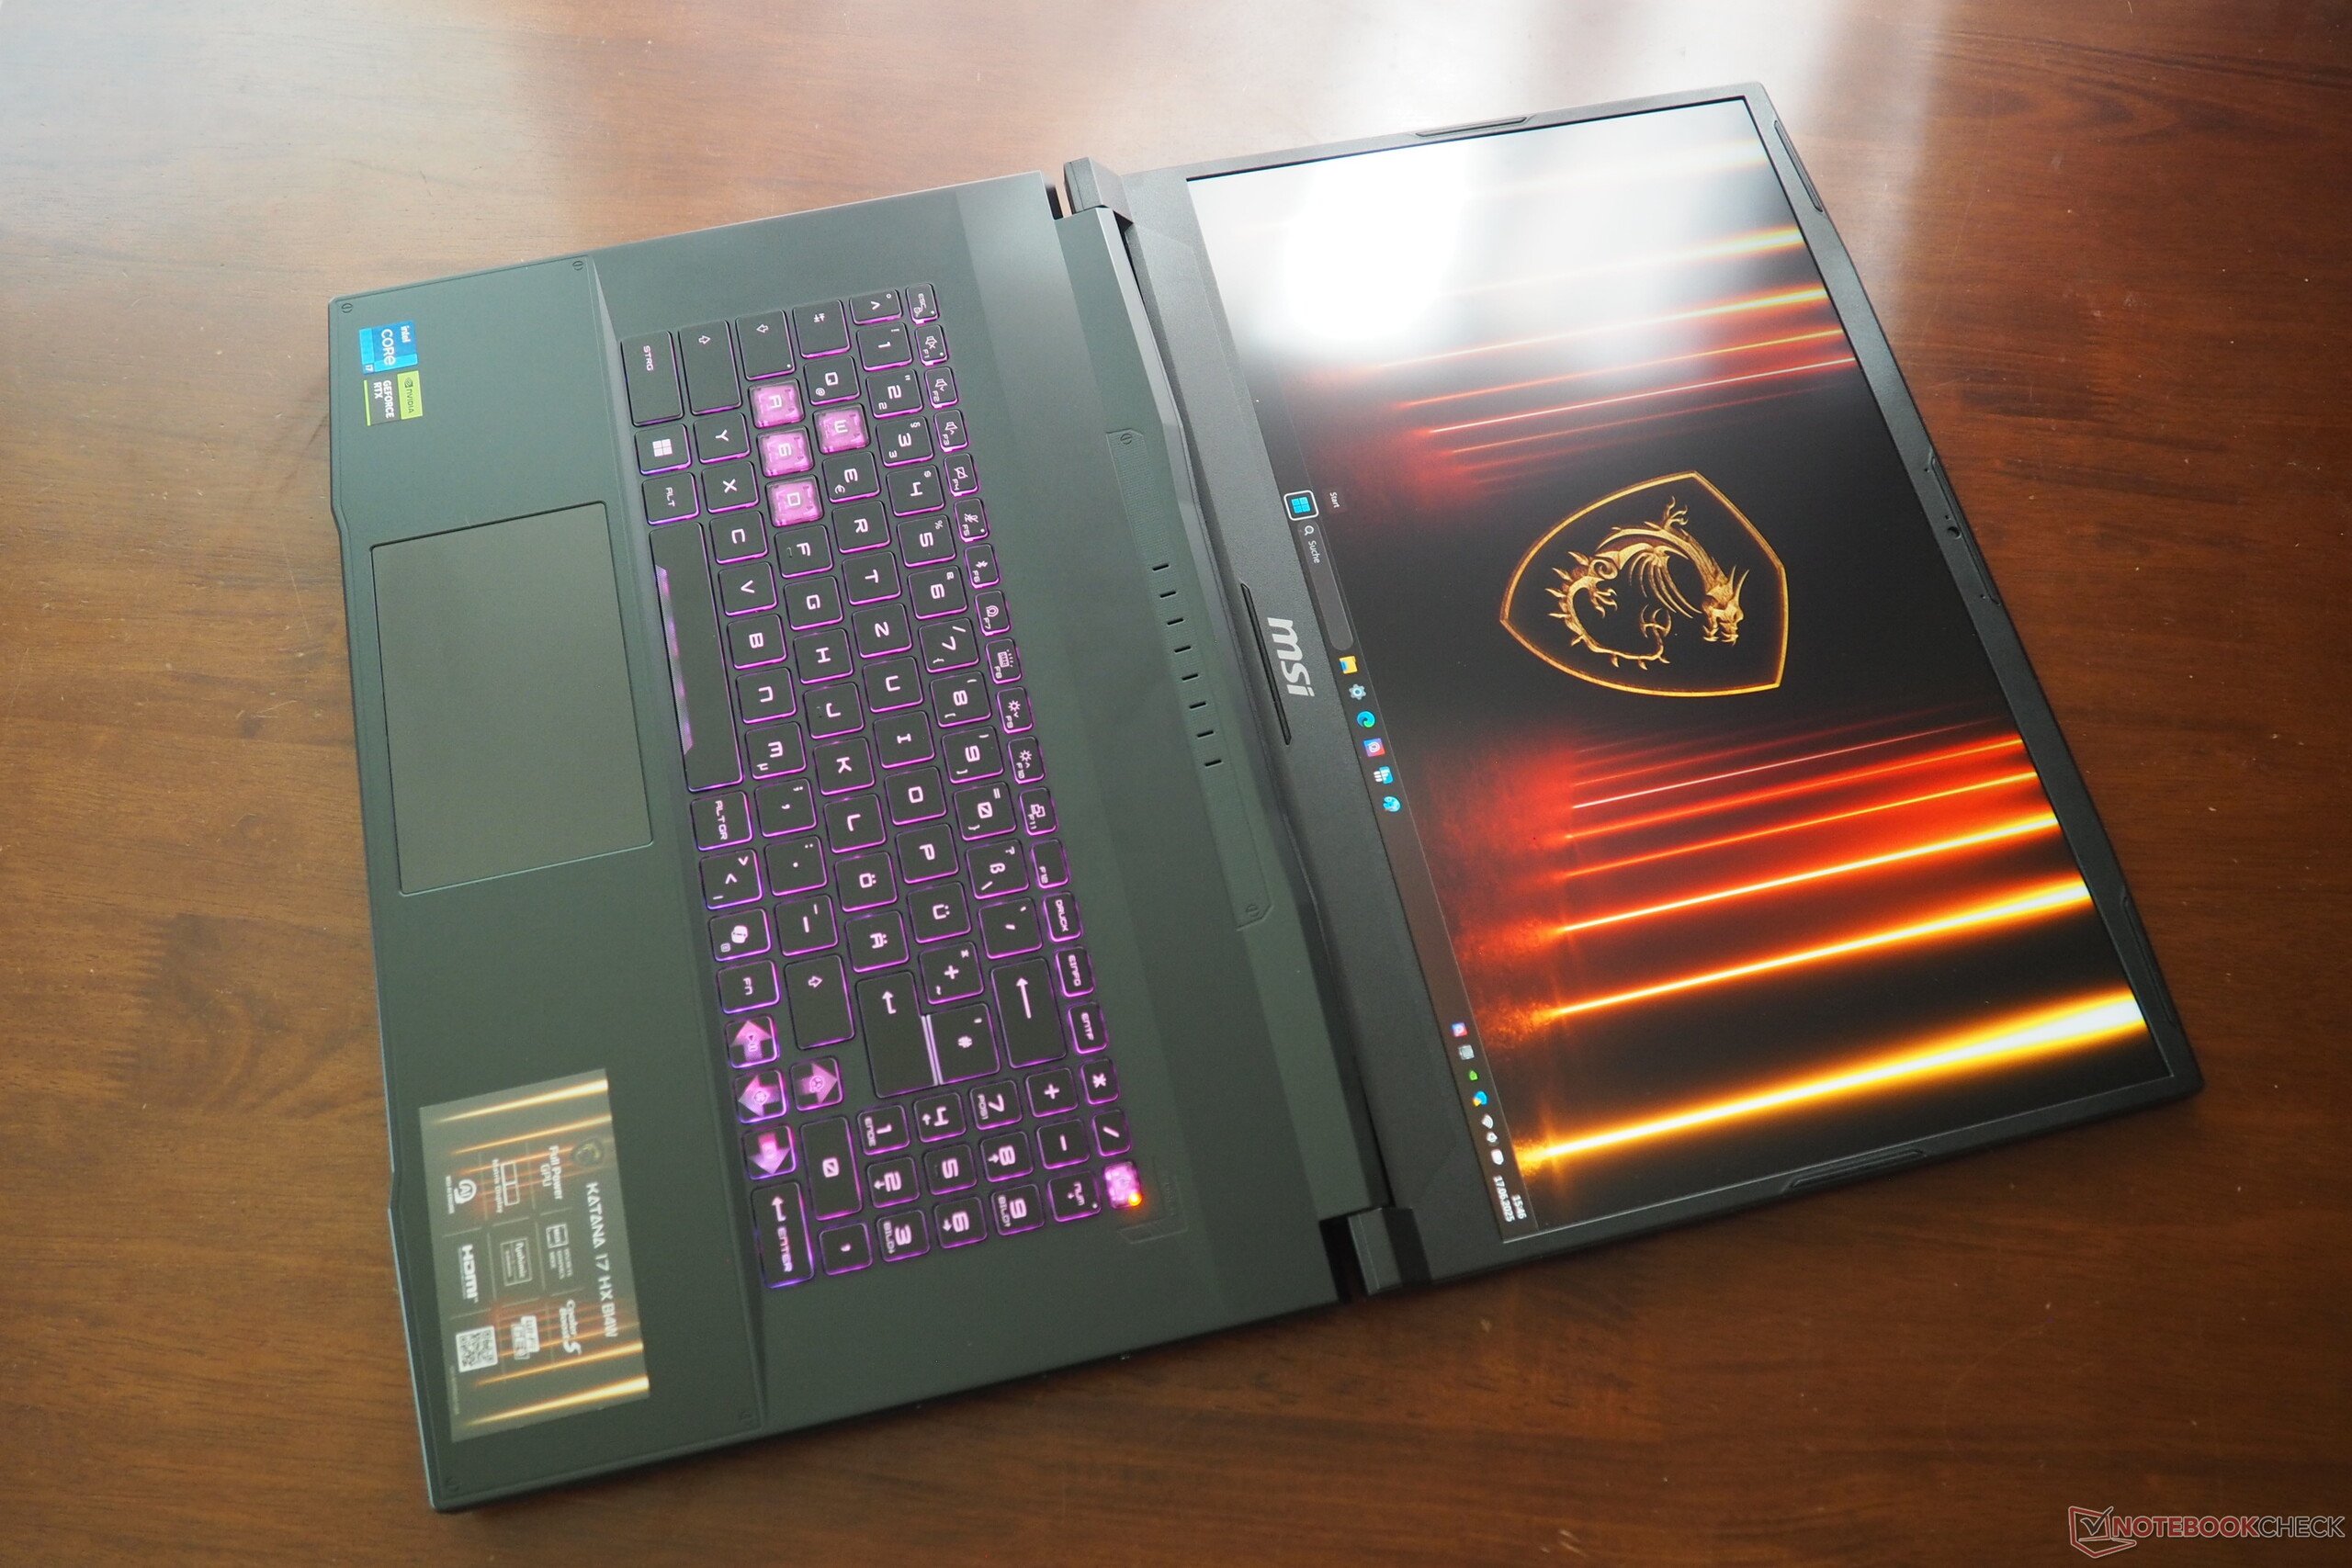
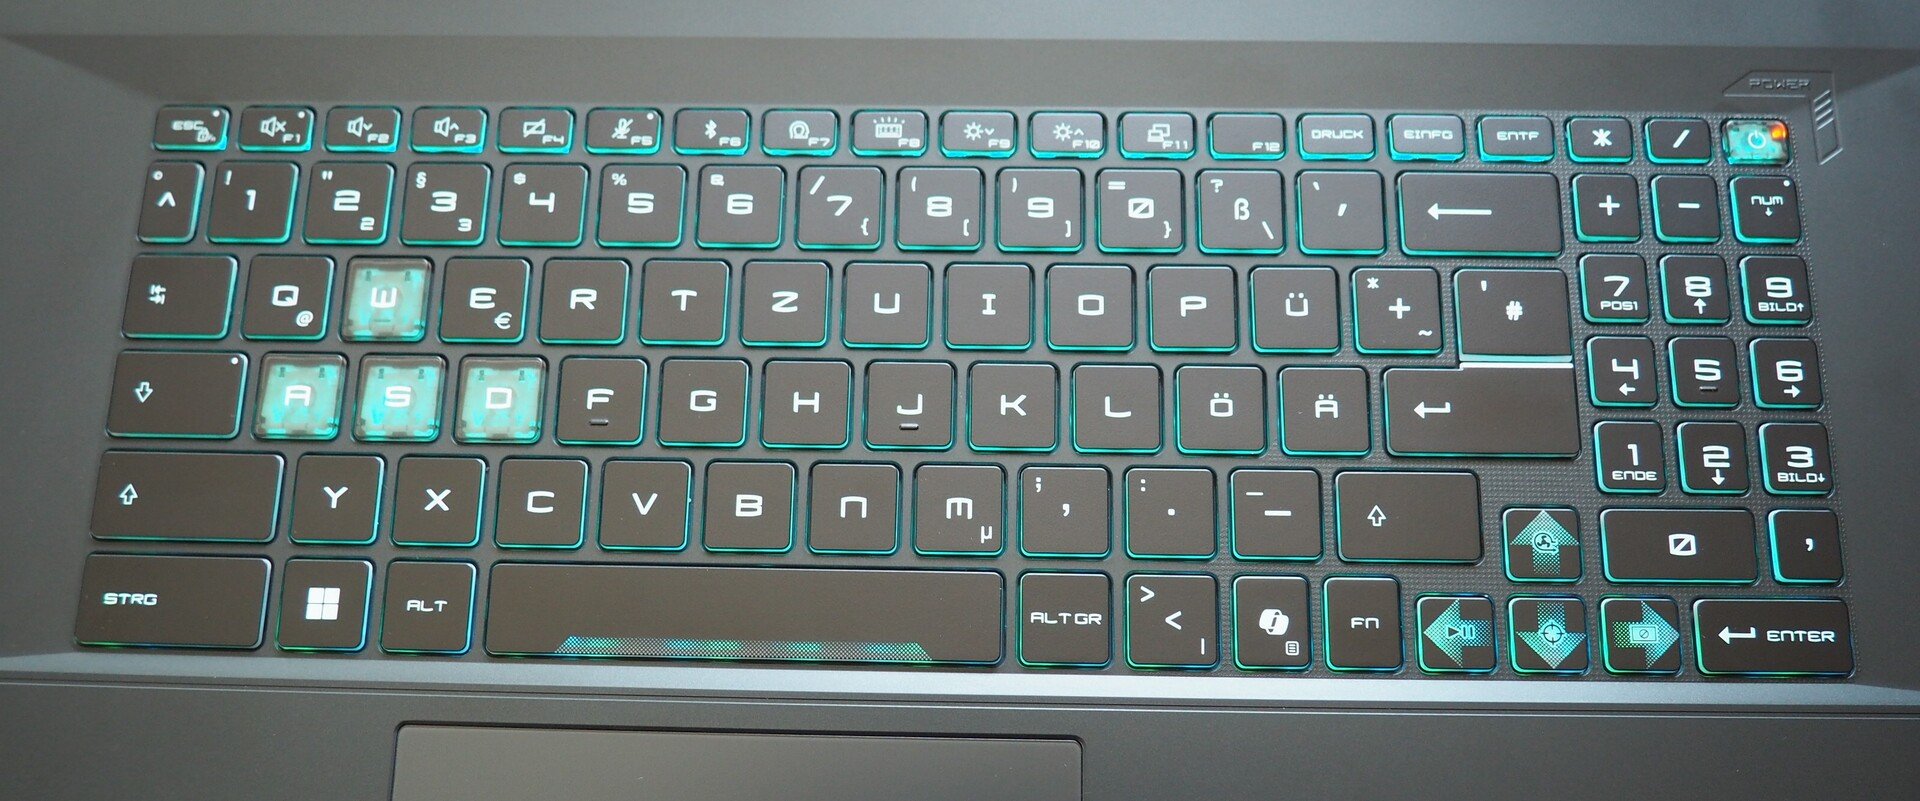
输入设备
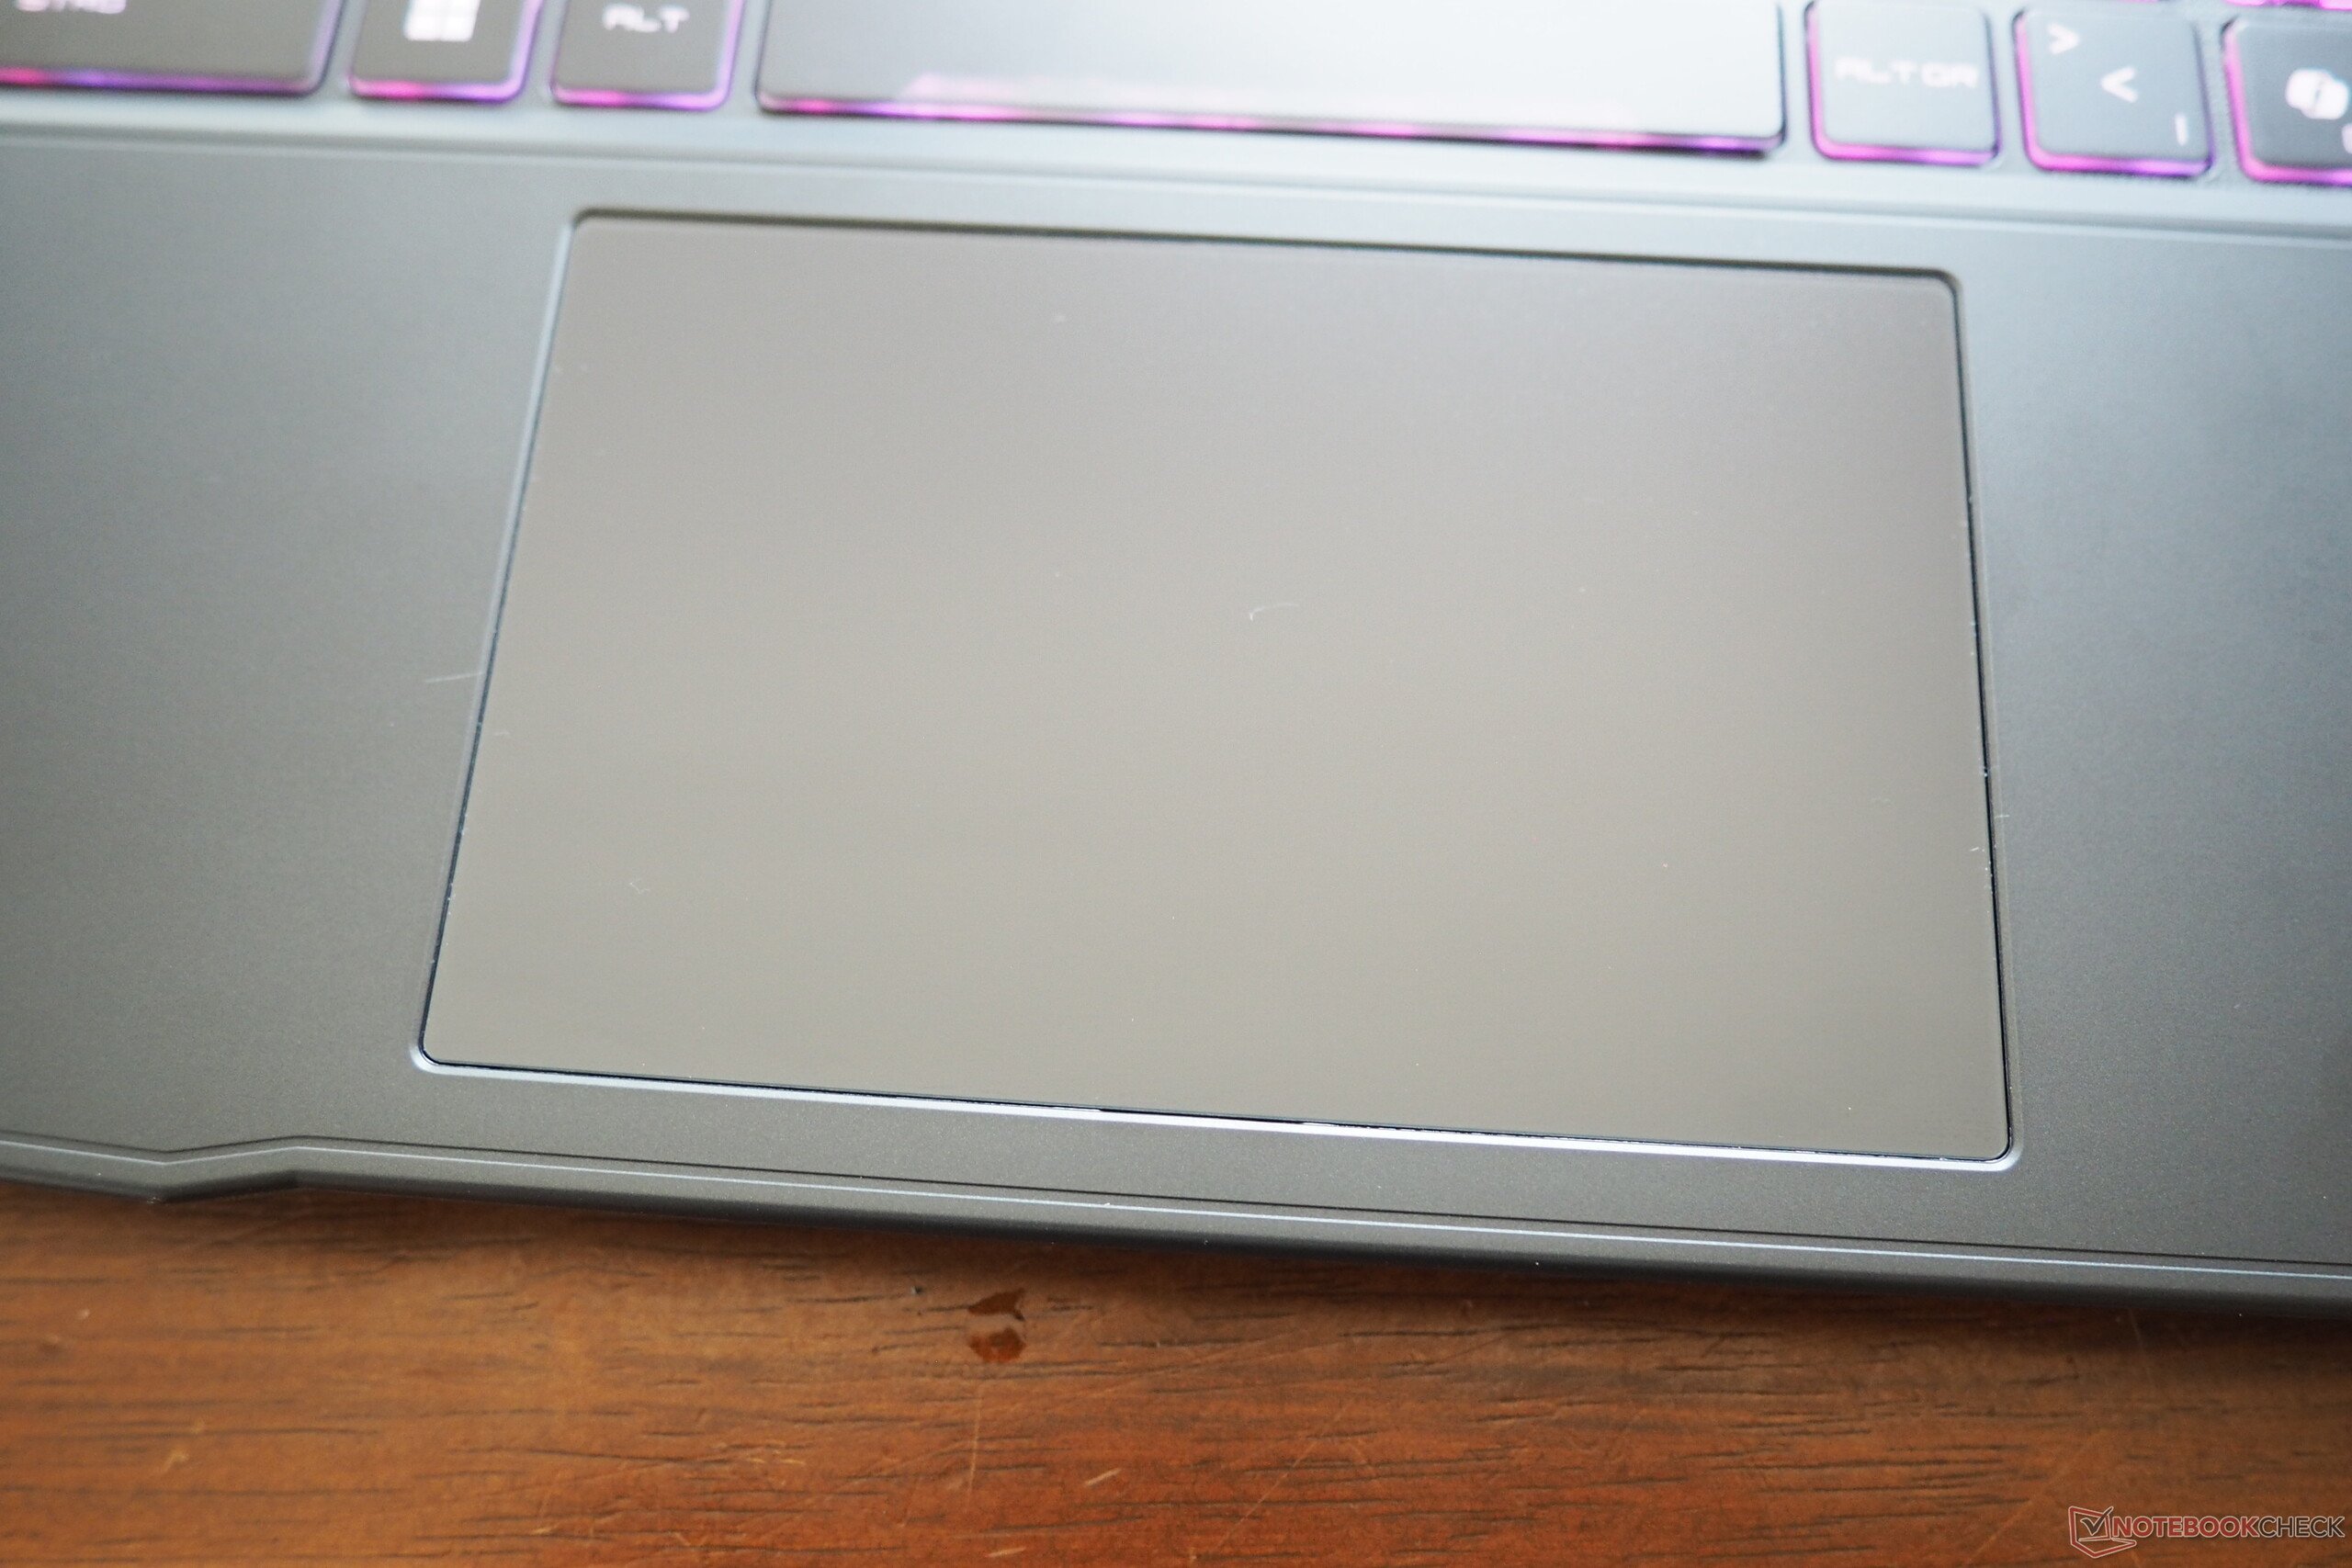
微星继续采用非传统的键盘布局。尽管有足够的空间,但数字键盘只有三列而不是四列。另一方面,玩家可以期待可调节的 RGB 灯光。键入手感还算不错,但并不能激发玩家的热情。鼠标替换件的尺寸为 12 x 7.5 厘米,还算合理,但还可以更稳定一些(尤其是点击时)。滑动特性和精准度尚可接受。
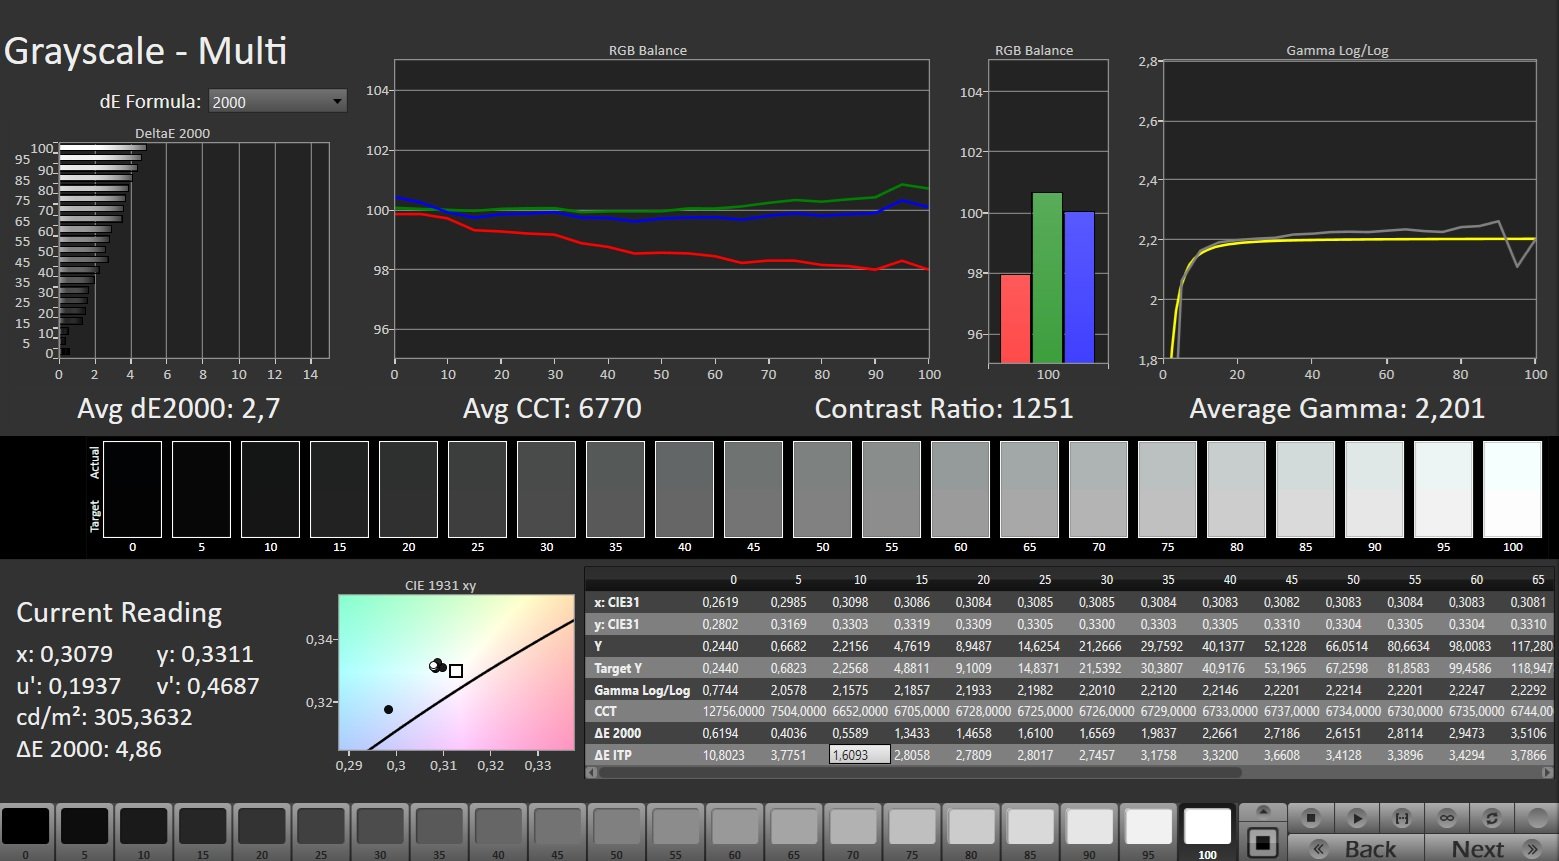
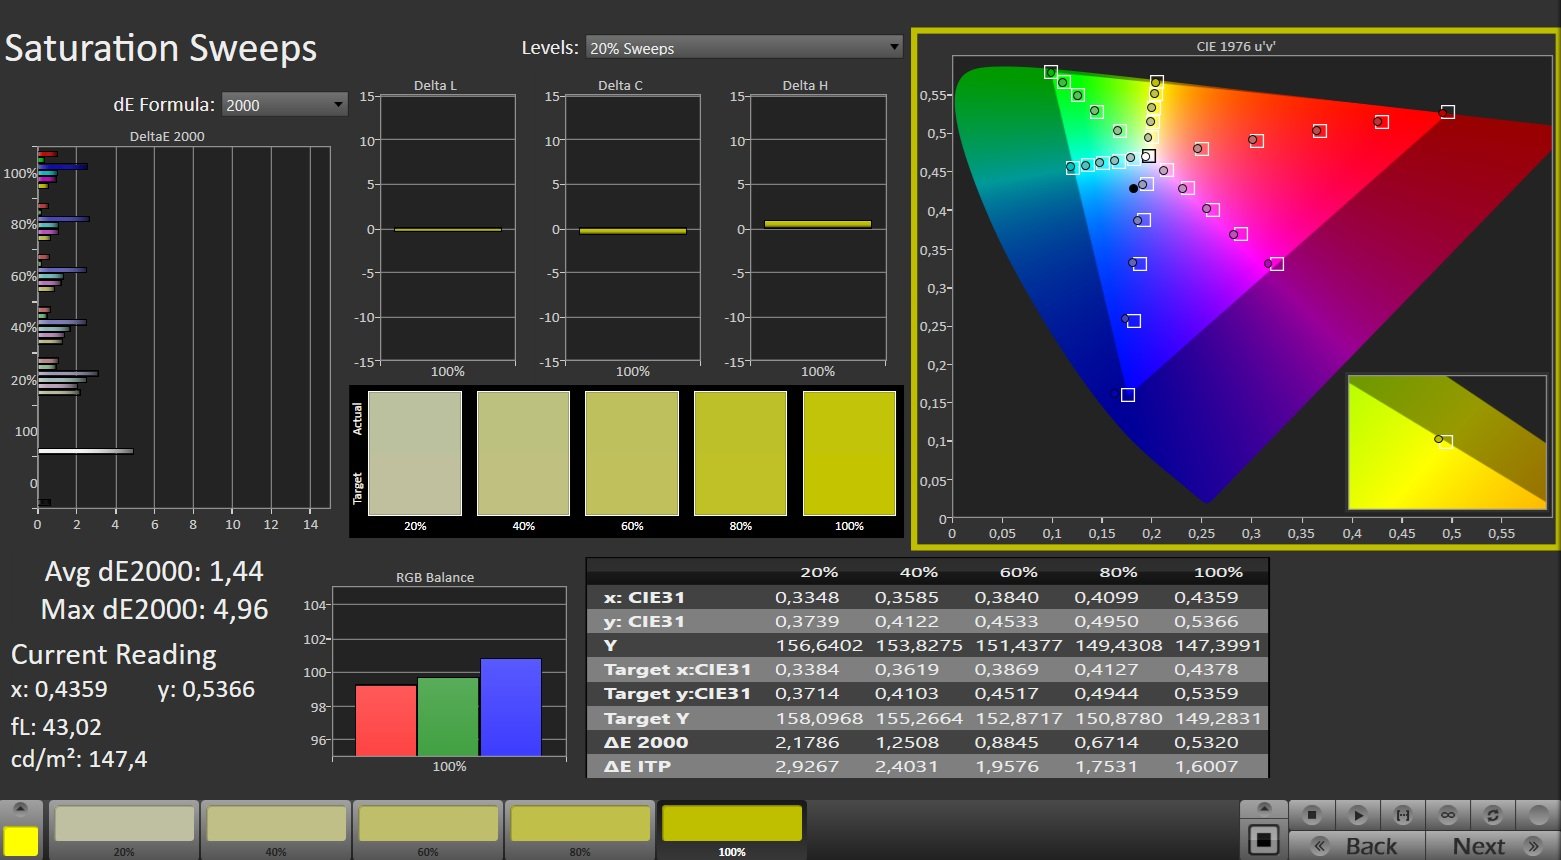
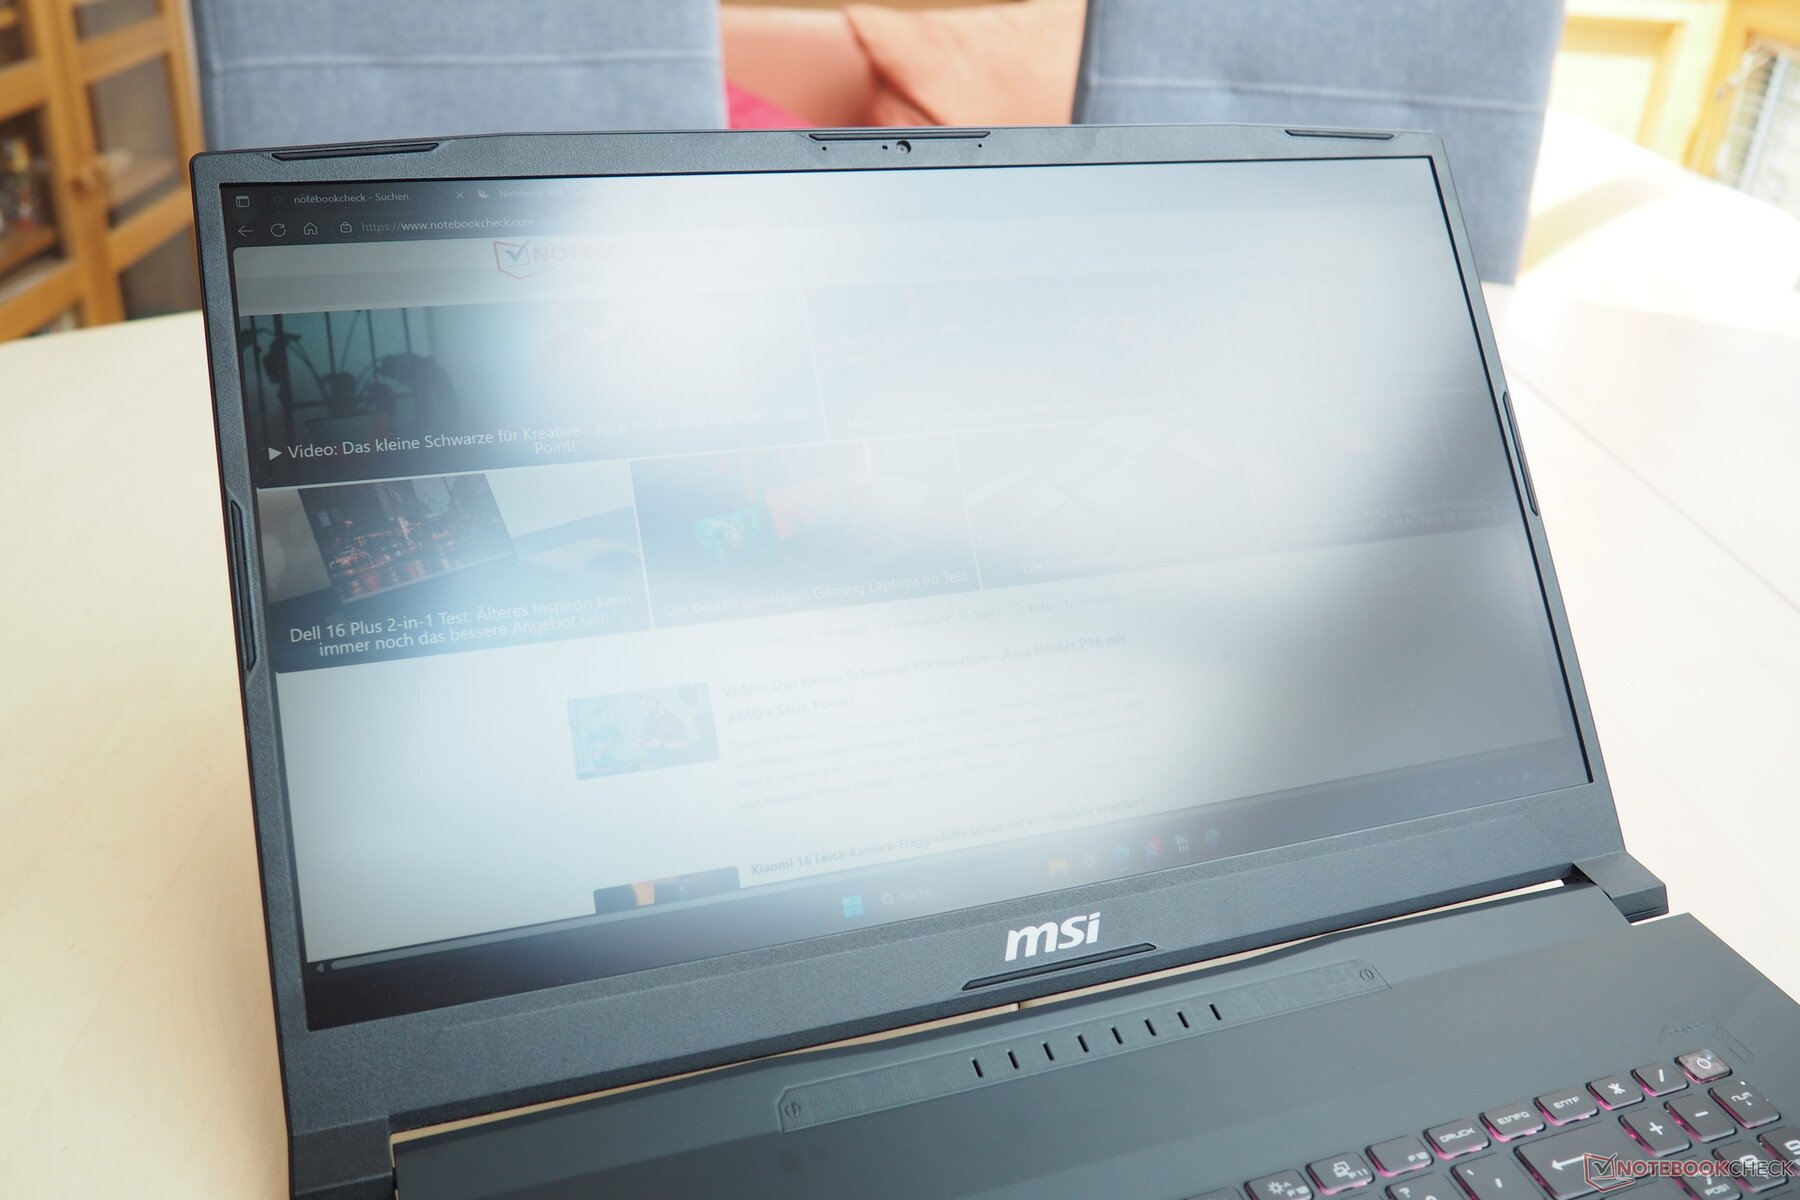
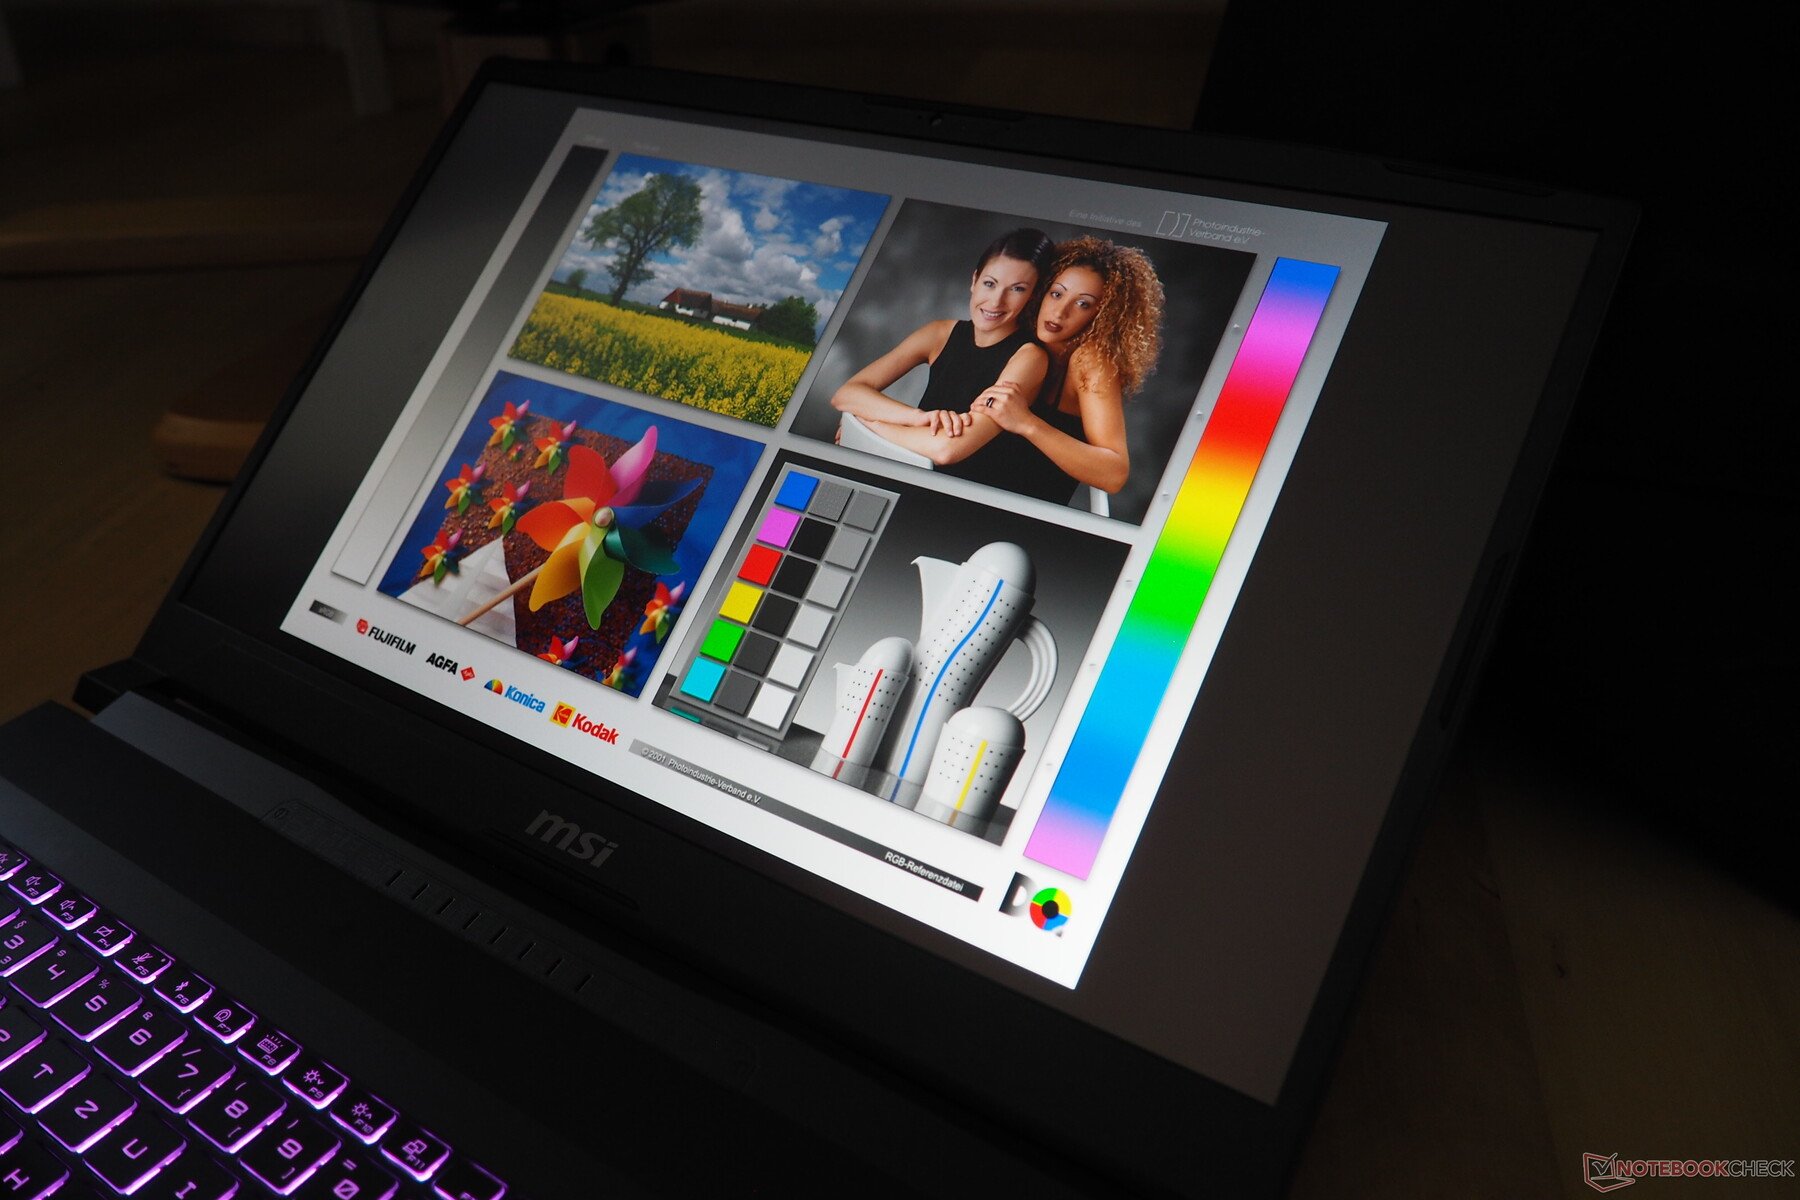
显示屏
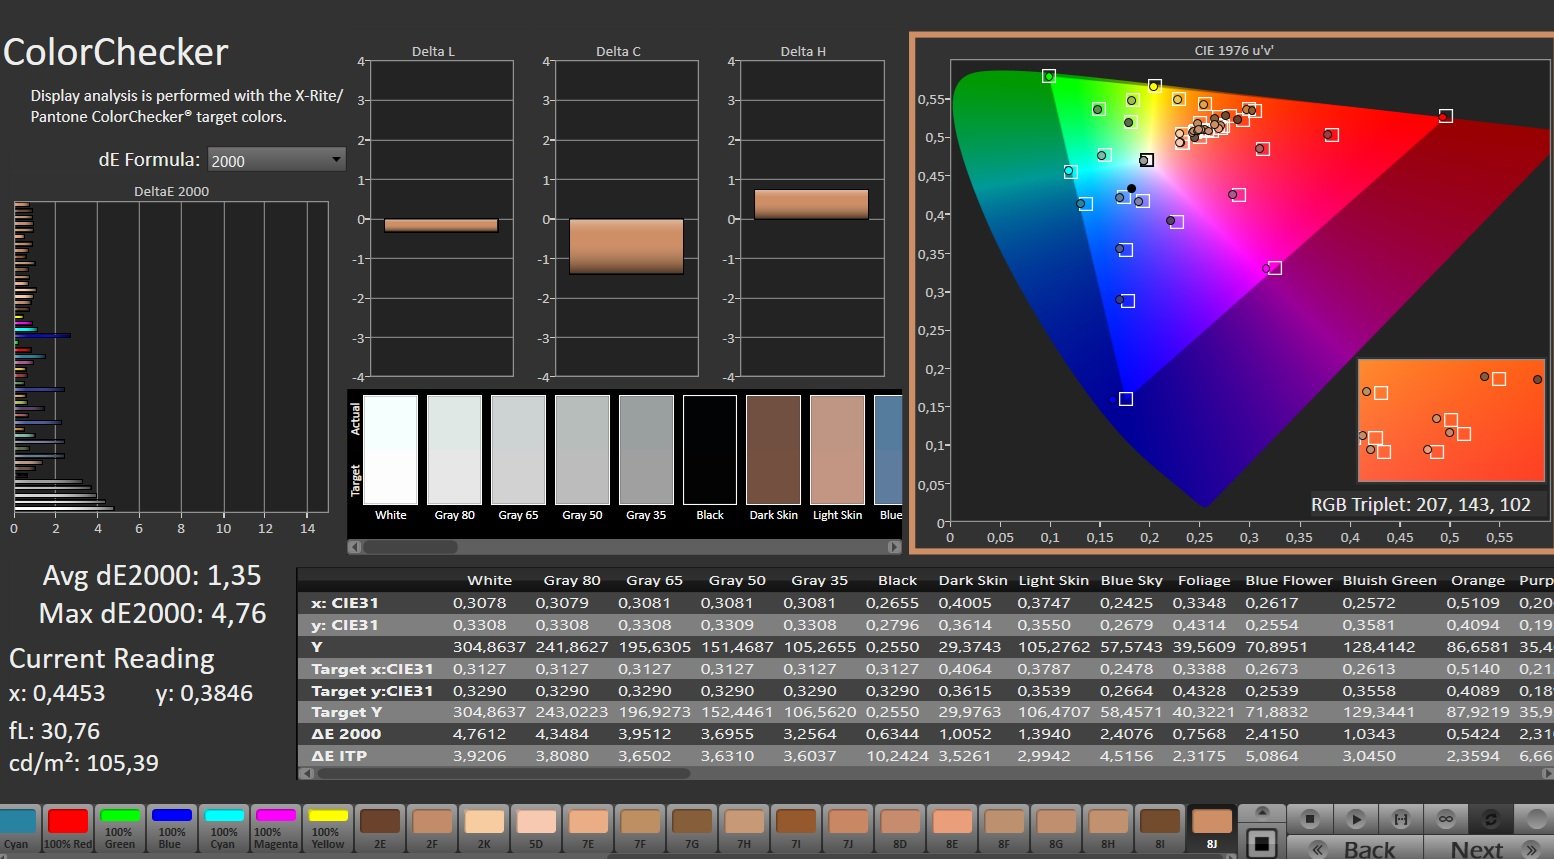
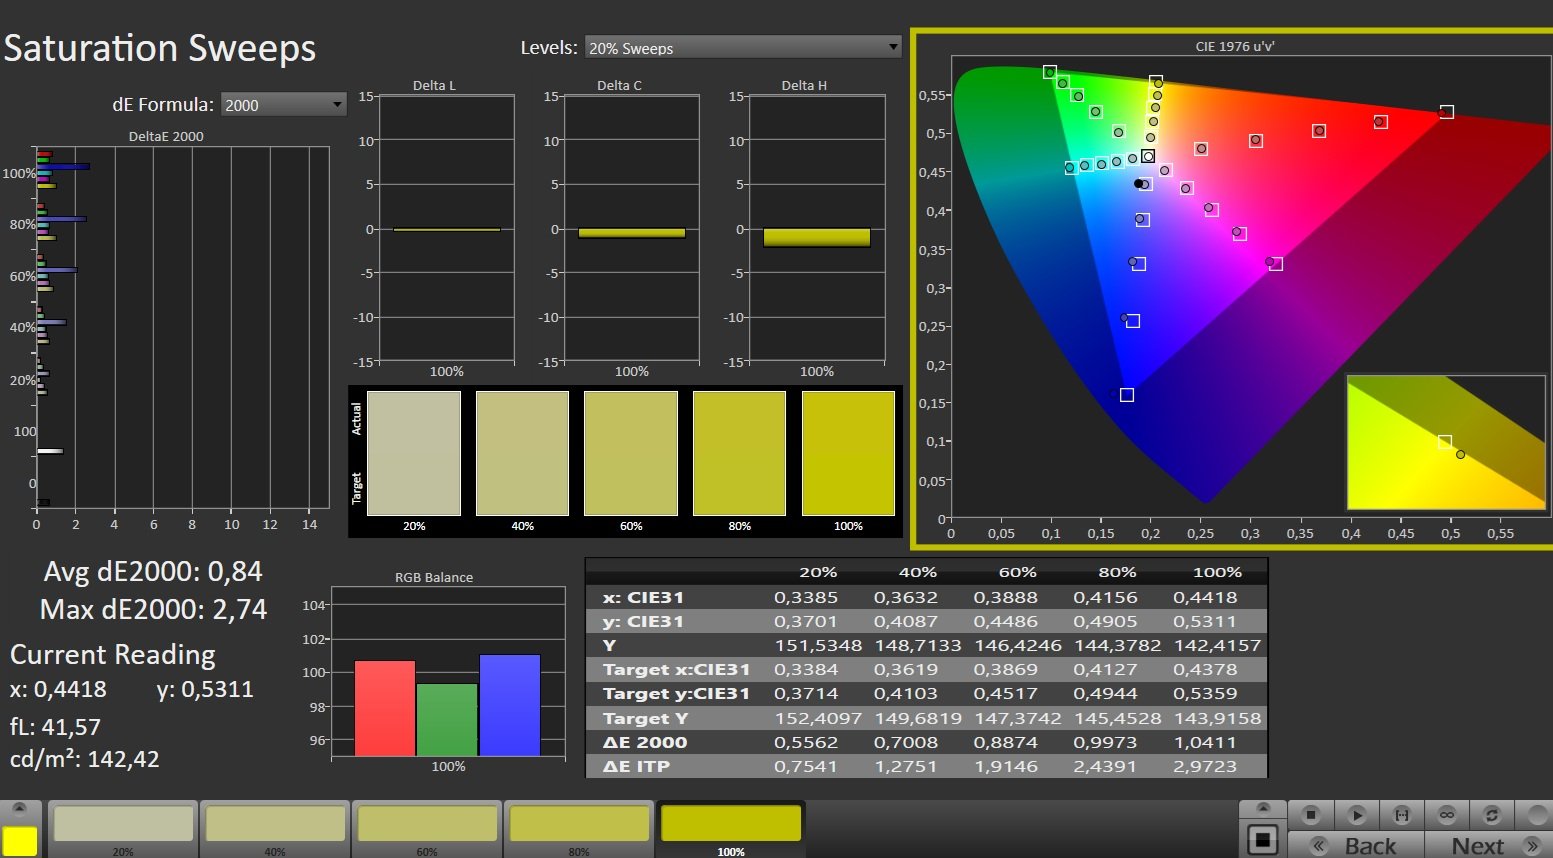
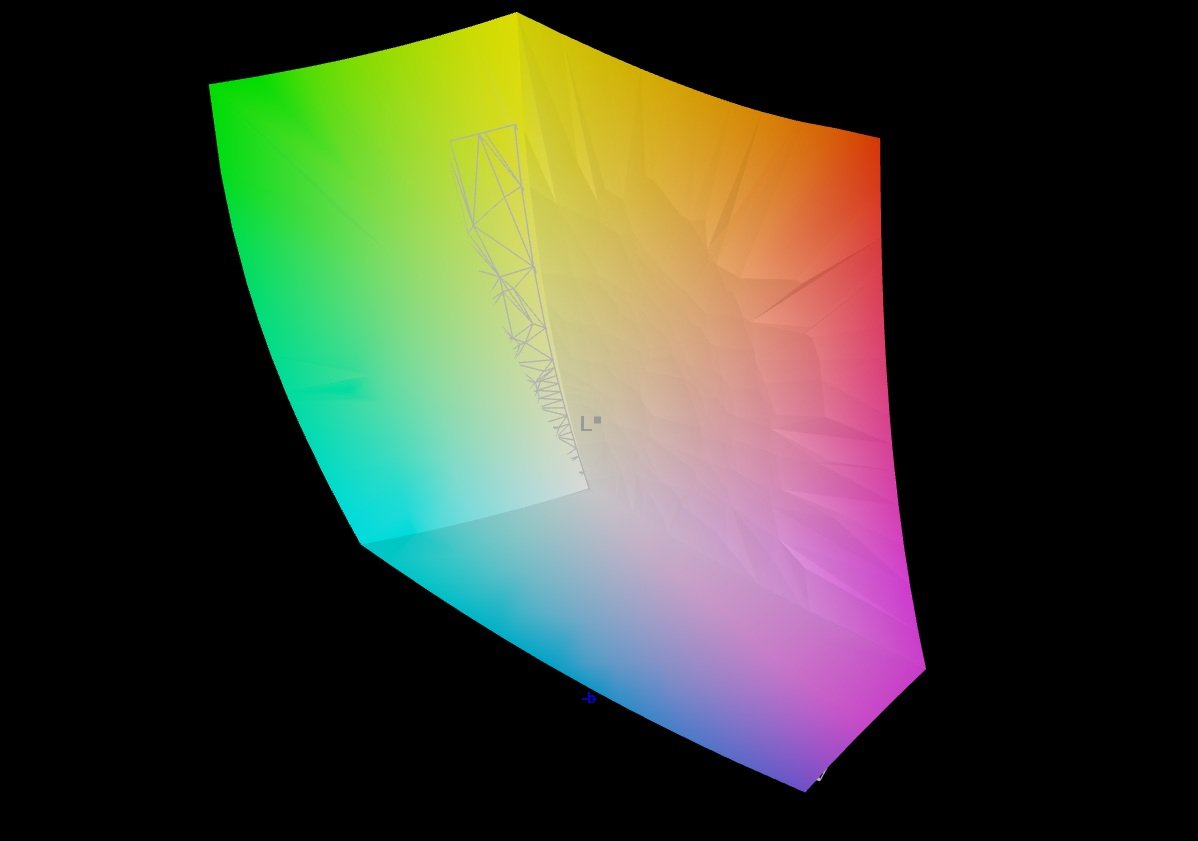
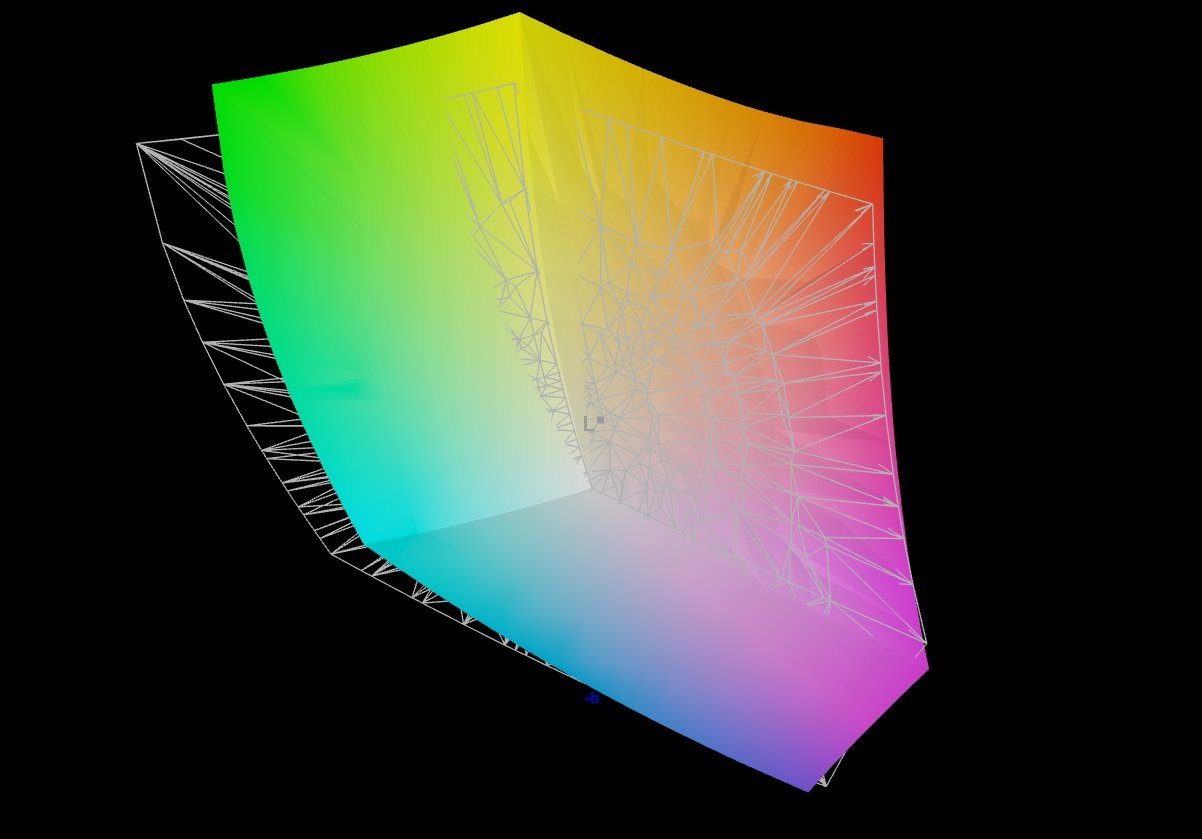
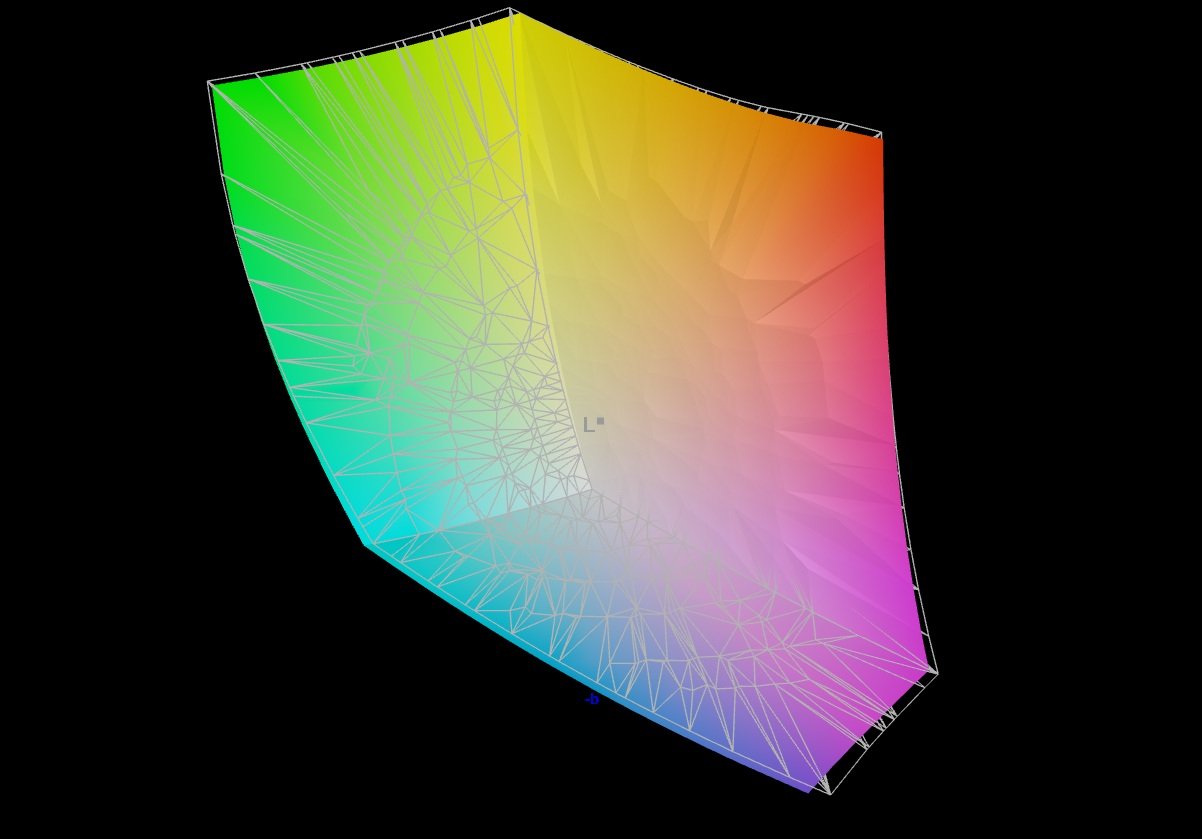
微星选择了一块 16:9 格式的哑光 IPS 屏幕,分辨率为 2,560 x 1,440 像素,由于其黑色值相对较低(0.27 cd/m²),因此对比度超过 1,000:1。不过,这也以亮度为代价,平均亮度为 272 cd/m²,只适合室内使用。另一方面,色域却出奇地高,略低于 100% sRGB 或 DCI-P3。响应时间和色彩保真度也几乎没有什么可抱怨的。
| |||||||||||||||||||||||||
Brightness Distribution: 87 %
Center on Battery: 296 cd/m²
Contrast: 1096:1 (Black: 0.27 cd/m²)
ΔE ColorChecker Calman: 1.35 | ∀{0.5-29.43 Ø4.73}
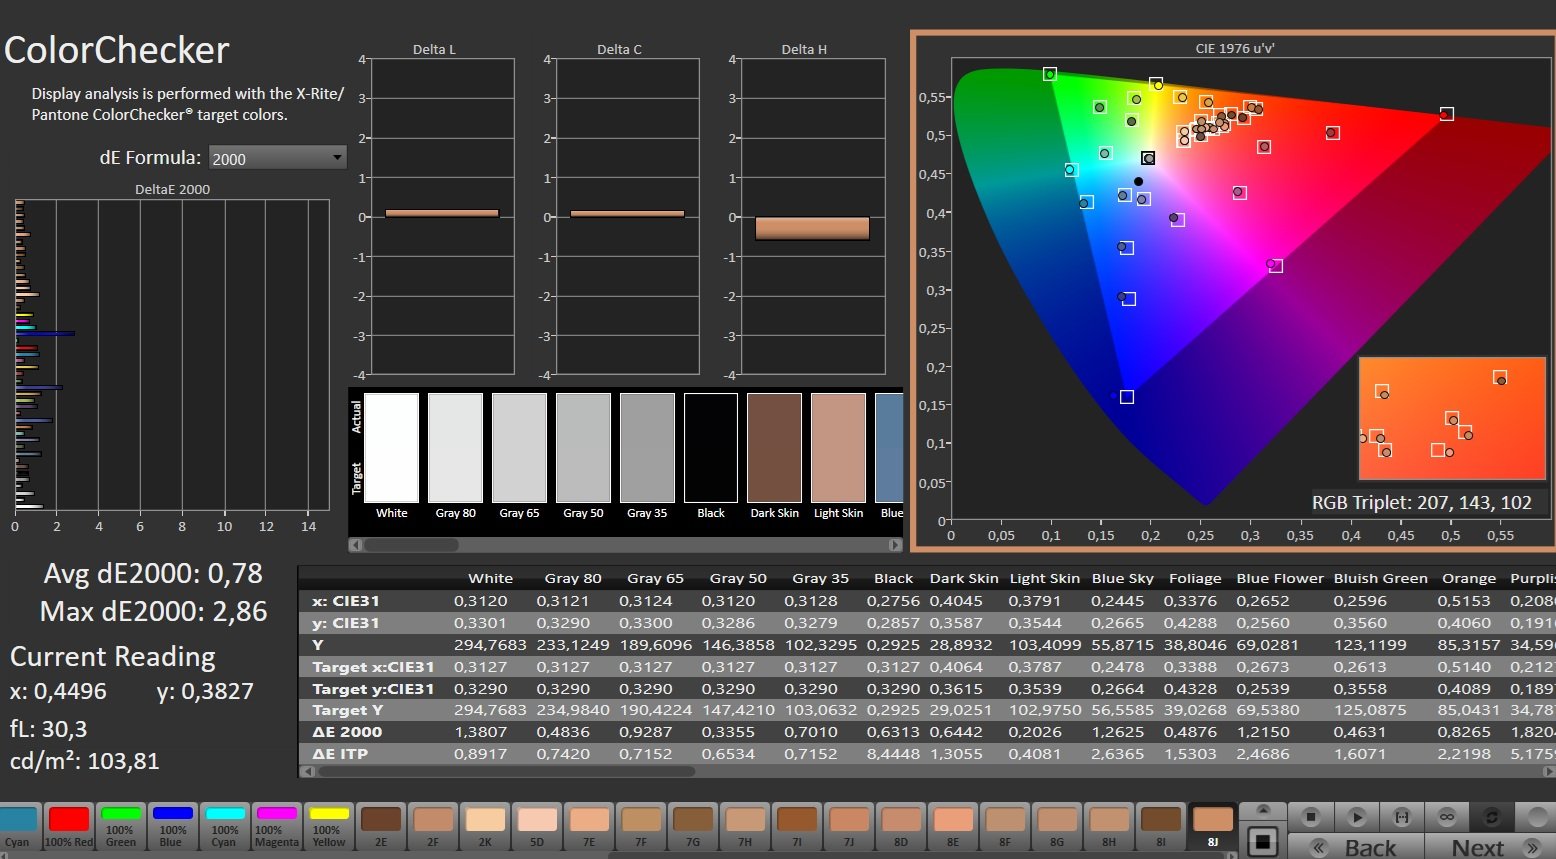
calibrated: 0.78
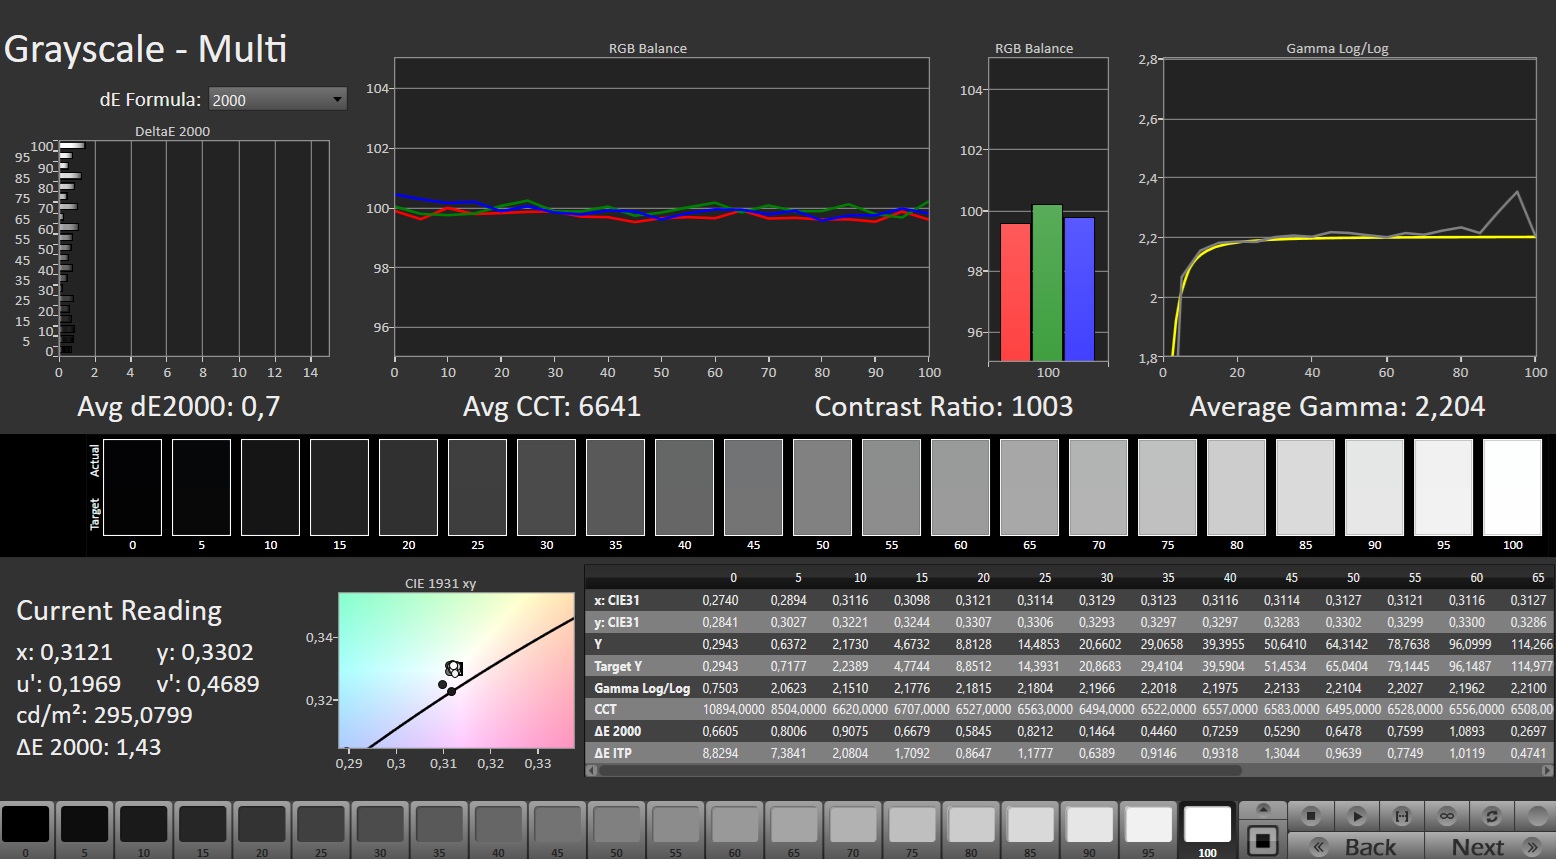
ΔE Greyscale Calman: 2.7 | ∀{0.09-98 Ø4.97}
89% AdobeRGB 1998 (Argyll 3D)
99.6% sRGB (Argyll 3D)
97.3% Display P3 (Argyll 3D)
Gamma: 2.201
CCT: 6770 K
| MSI Katana 17 HX B14WGK CSOT MNH301CA3-1, IPS, 2560x1440, 17.3", 240 Hz | Gigabyte Aero X16 1WH MNG007DA5-1, IPS, 2560x1600, 16", 165 Hz | Asus ProArt P16 H7606WP ATNA60CL10-0, OLED, 2880x1800, 16", 120 Hz | Schenker XMG Pro 16 (E25) NE160QDM-NZL, IPS, 2560x1600, 16", 300 Hz | MSI Vector 16 HX AI A2XWHG B160QAN02.3 (AUO7DB2), IPS, 2560x1600, 16", 240 Hz | |
|---|---|---|---|---|---|
| Display | -18% | 1% | -13% | -2% | |
| Display P3 Coverage (%) | 97.3 | 68.7 -29% | 99.5 2% | 74.7 -23% | 96.6 -1% |
| sRGB Coverage (%) | 99.6 | 96.1 -4% | 100 0% | 99.8 0% | 99.8 0% |
| AdobeRGB 1998 Coverage (%) | 89 | 71.2 -20% | 89.5 1% | 75.4 -15% | 84.4 -5% |
| Response Times | -46% | 91% | -31% | 26% | |
| Response Time Grey 50% / Grey 80% * (ms) | 5.2 ? | 12 ? -131% | 0.63 ? 88% | 10.5 ? -102% | 4.3 ? 17% |
| Response Time Black / White * (ms) | 9.2 ? | 5.6 ? 39% | 0.63 ? 93% | 5.4 ? 41% | 6 ? 35% |
| PWM Frequency (Hz) | 480 ? | ||||
| PWM Amplitude * (%) | 26 | ||||
| Screen | 9% | 37% | 9% | -26% | |
| Brightness middle (cd/m²) | 296 | 395 33% | 362 22% | 538 82% | 473 60% |
| Brightness (cd/m²) | 272 | 398 46% | 363 33% | 508 87% | 426 57% |
| Brightness Distribution (%) | 87 | 97 11% | 99 14% | 88 1% | 85 -2% |
| Black Level * (cd/m²) | 0.27 | 0.32 -19% | 0.47 -74% | 0.42 -56% | |
| Contrast (:1) | 1096 | 1234 13% | 1145 4% | 1126 3% | |
| Colorchecker dE 2000 * | 1.35 | 1.3 4% | 0.8 41% | 1.9 -41% | 3.47 -157% |
| Colorchecker dE 2000 max. * | 4.76 | 2.8 41% | 1.8 62% | 4 16% | 7.24 -52% |
| Colorchecker dE 2000 calibrated * | 0.78 | 1.4 -79% | 1.36 -74% | ||
| Greyscale dE 2000 * | 2.7 | 1.8 33% | 1.3 52% | 2.7 -0% | 3.1 -15% |
| Gamma | 2.201 100% | 2.2 100% | 2.2 100% | 2.24 98% | 2.486 88% |
| CCT | 6770 96% | 6842 95% | 6741 96% | 7027 93% | 6832 95% |
| Total Average (Program / Settings) | -18% /
-4% | 43% /
37% | -12% /
-2% | -1% /
-14% |
* ... smaller is better
Display Response Times
| ↔ Response Time Black to White | ||
|---|---|---|
| 9.2 ms ... rise ↗ and fall ↘ combined | ↗ 5.2 ms rise | 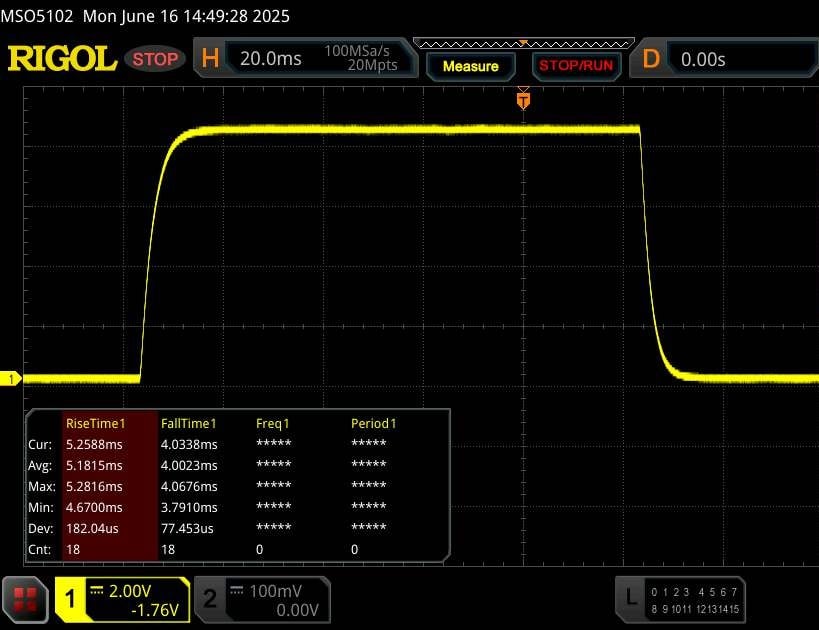 |
| ↘ 4 ms fall | ||
| The screen shows fast response rates in our tests and should be suited for gaming. In comparison, all tested devices range from 0.1 (minimum) to 240 (maximum) ms. » 25 % of all devices are better. This means that the measured response time is better than the average of all tested devices (19.9 ms). | ||
| ↔ Response Time 50% Grey to 80% Grey | ||
| 5.2 ms ... rise ↗ and fall ↘ combined | ↗ 2.4 ms rise | 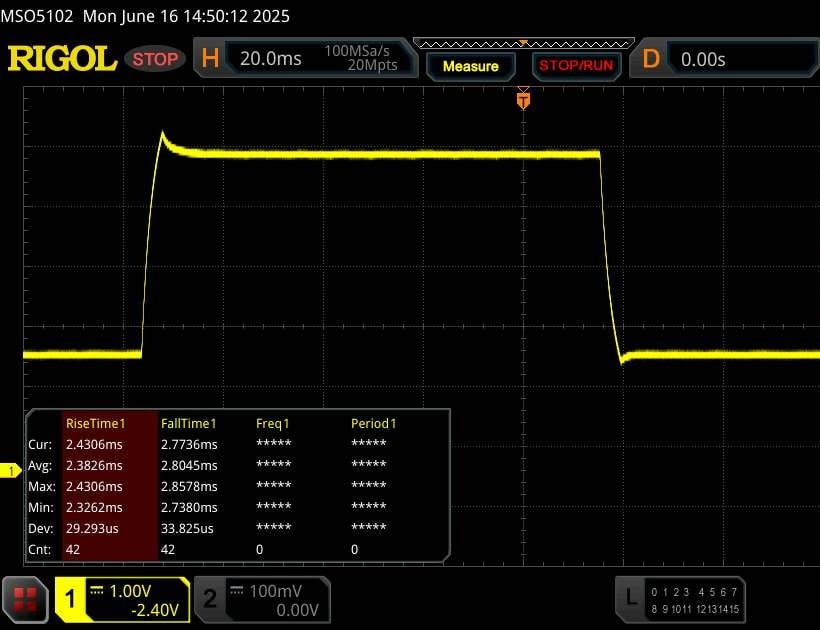 |
| ↘ 2.8 ms fall | ||
| The screen shows very fast response rates in our tests and should be very well suited for fast-paced gaming. In comparison, all tested devices range from 0.165 (minimum) to 636 (maximum) ms. » 17 % of all devices are better. This means that the measured response time is better than the average of all tested devices (31.1 ms). | ||
Screen Flickering / PWM (Pulse-Width Modulation)
| Screen flickering / PWM not detected | 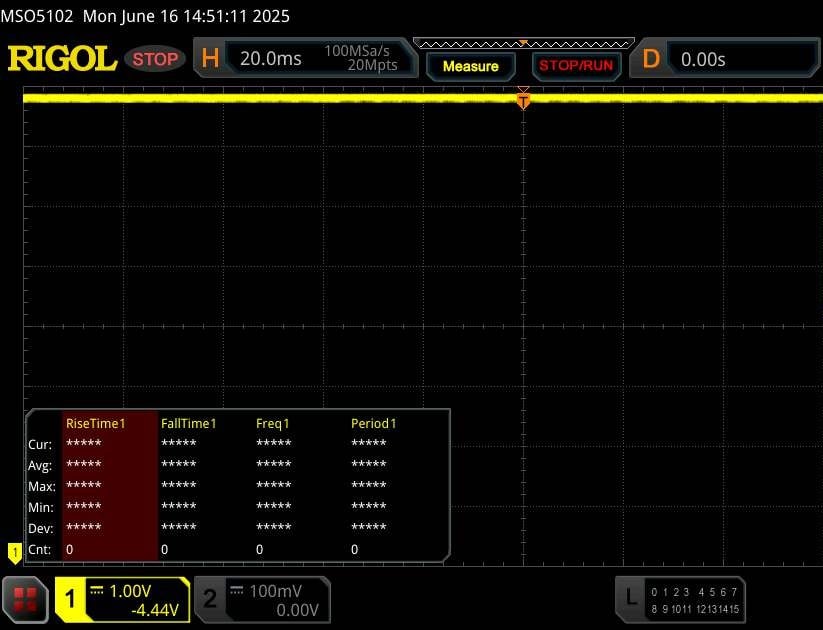 | ||
In comparison: 52 % of all tested devices do not use PWM to dim the display. If PWM was detected, an average of 7798 (minimum: 5 - maximum: 343500) Hz was measured. | |||
性能
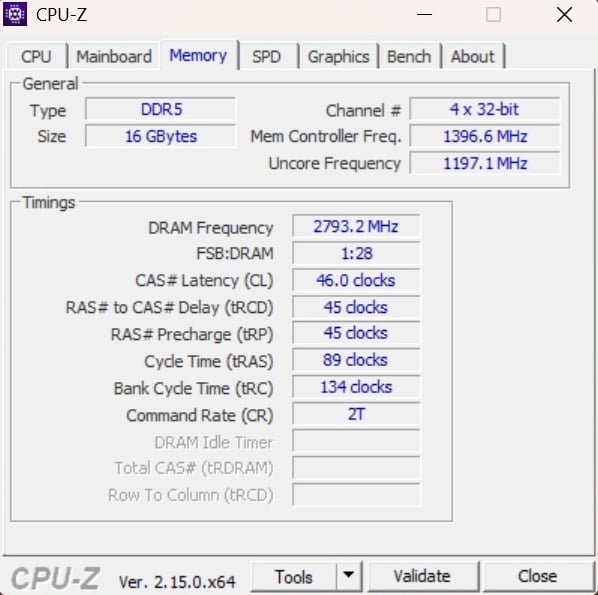
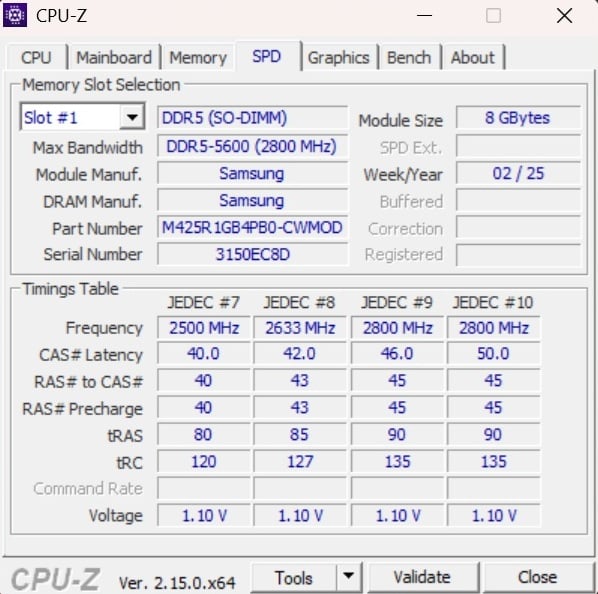
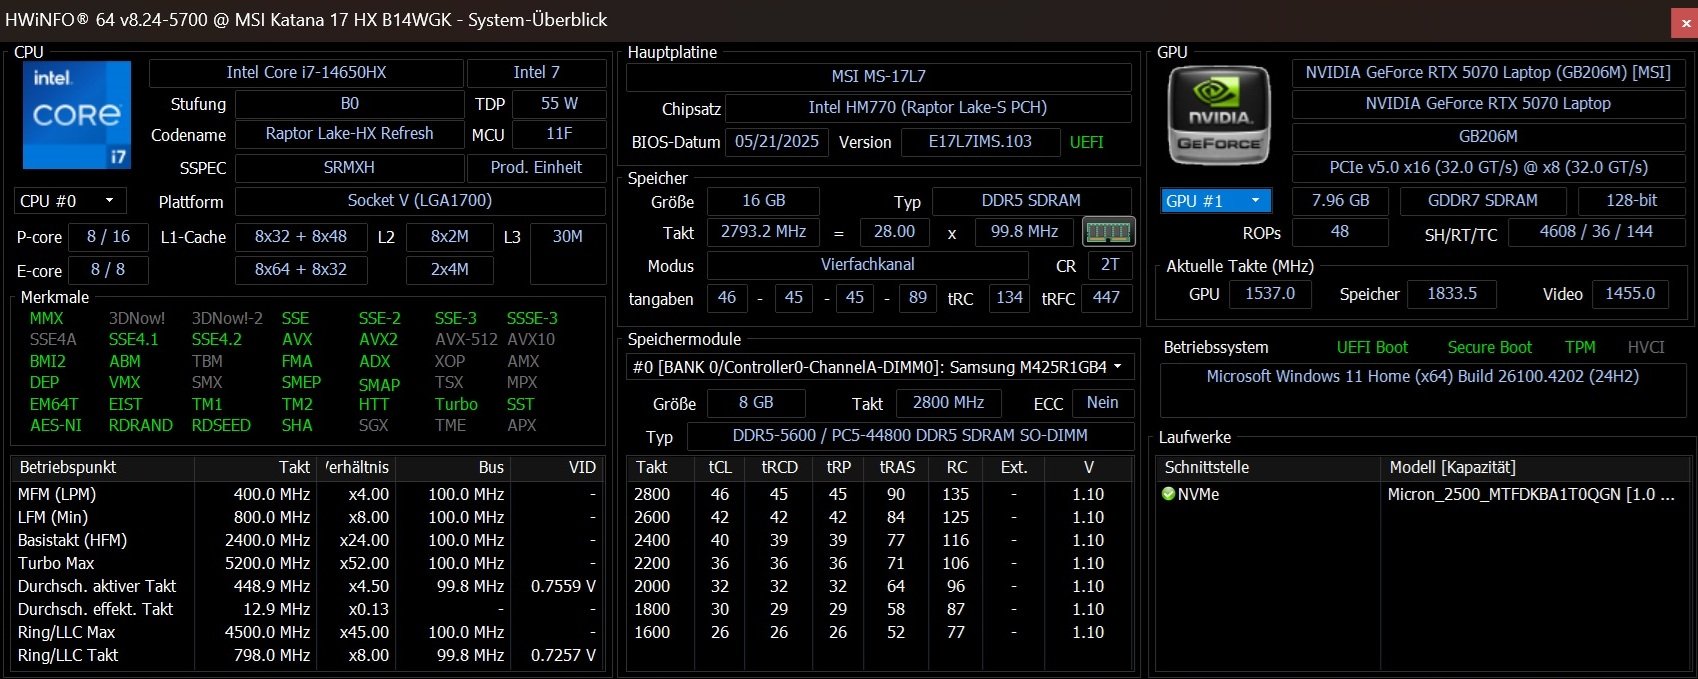
Katana 17 HX 只属于(中)高端产品,主要是因为它配备了 8 GB VRAM。顶部:得益于两个 SO-DIMM 组,16 GB 内存(2x 8 GB DDR5-5600)的升级没有任何障碍。不过,微星只集成了一个 M.2 插槽,这多少有些令人失望。
测试条件
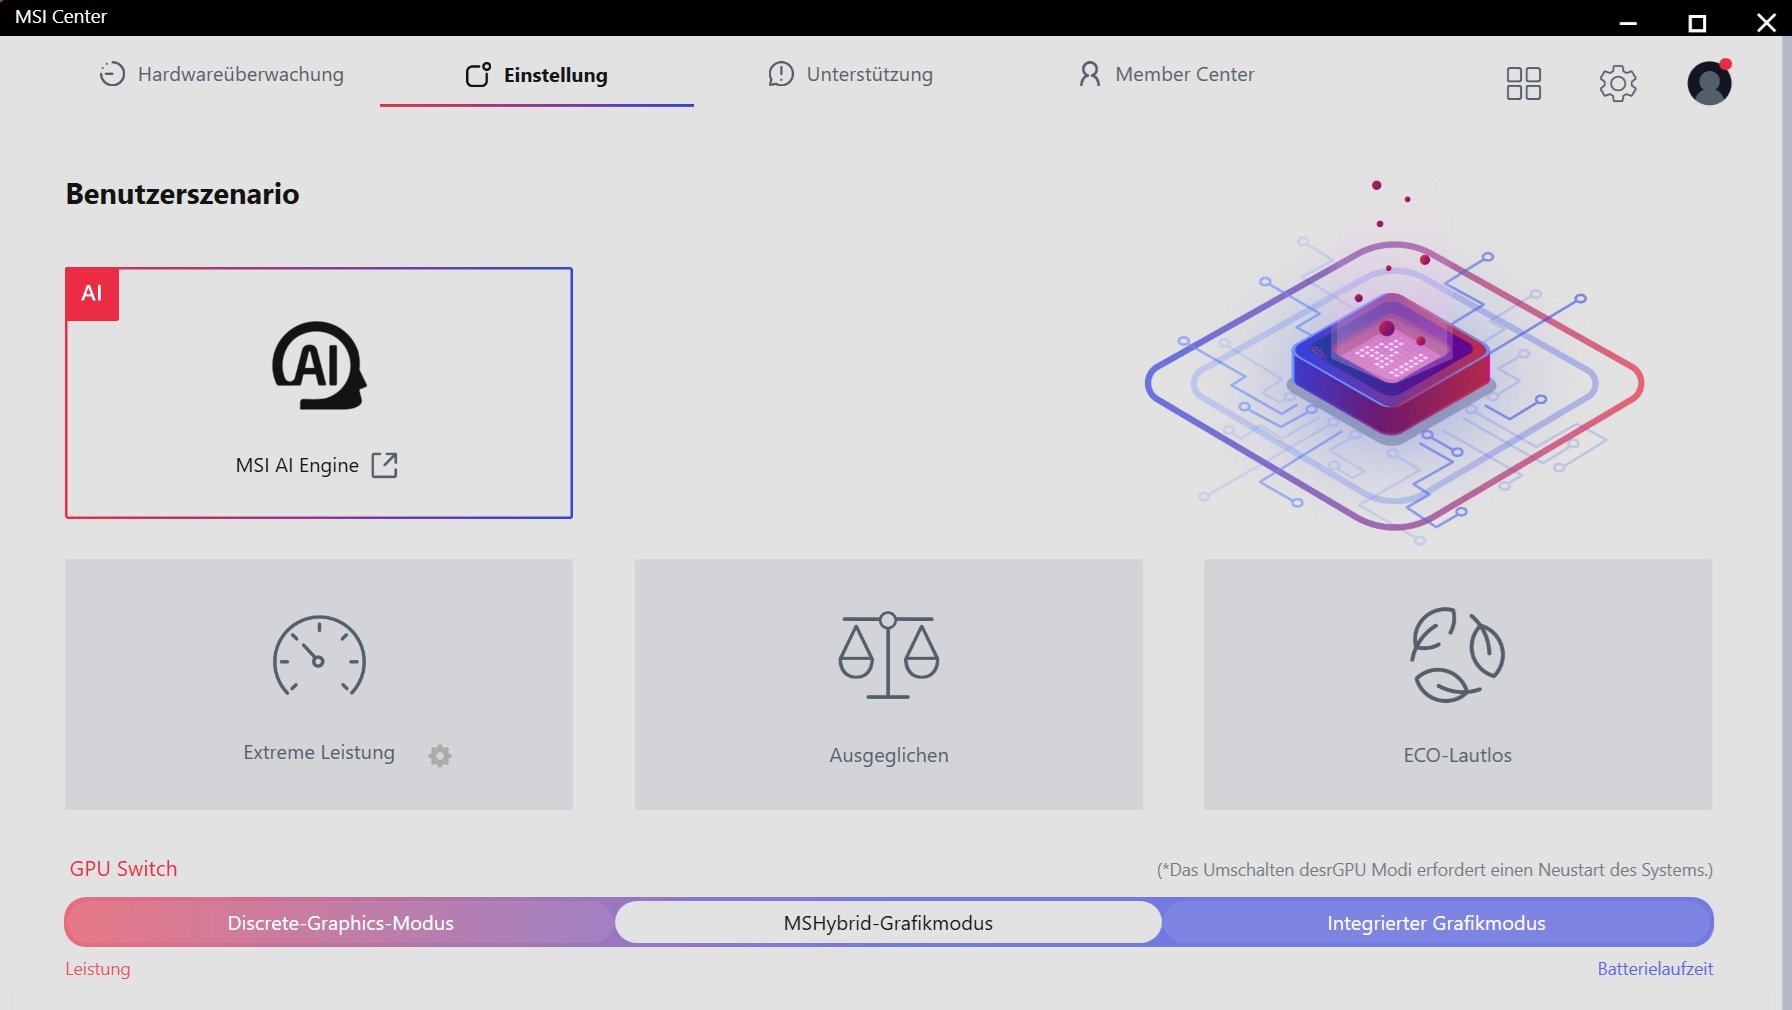
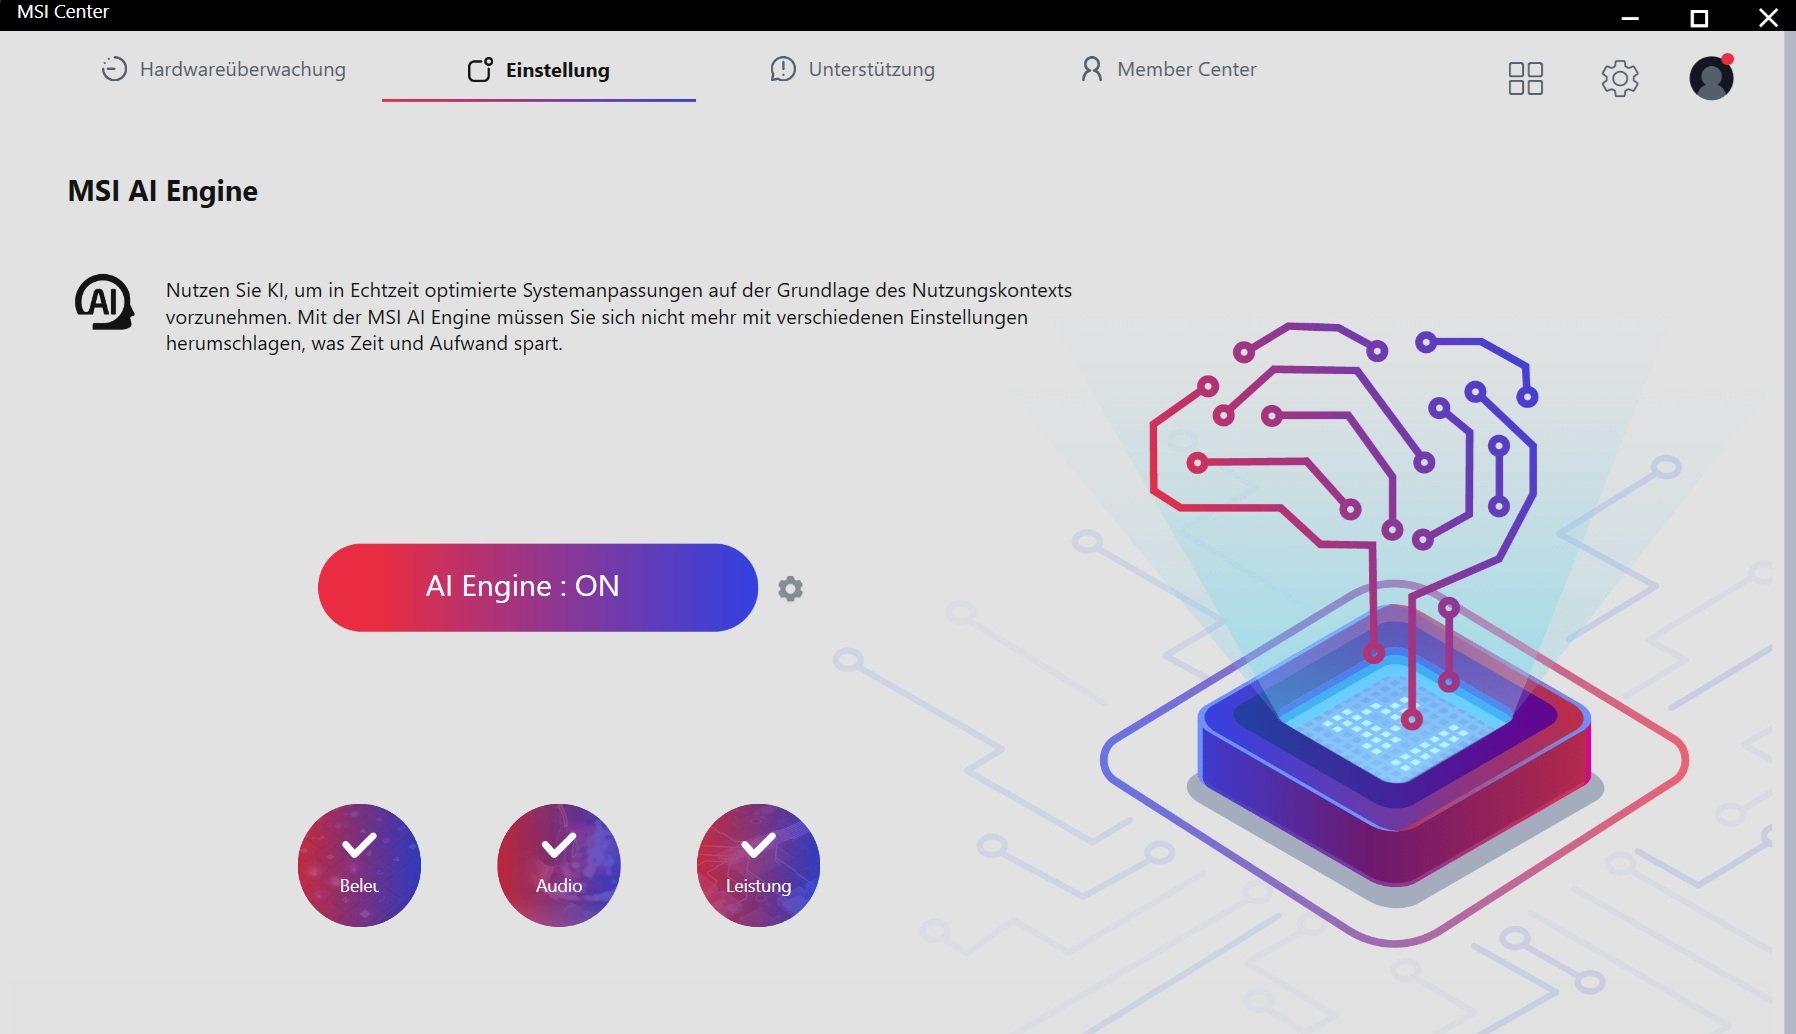
在预装的微星中心可以找到各种运行模式。我们的所有测量都是通过 AI 配置文件进行的,它会自动选择适合相应场景的设置。
处理器
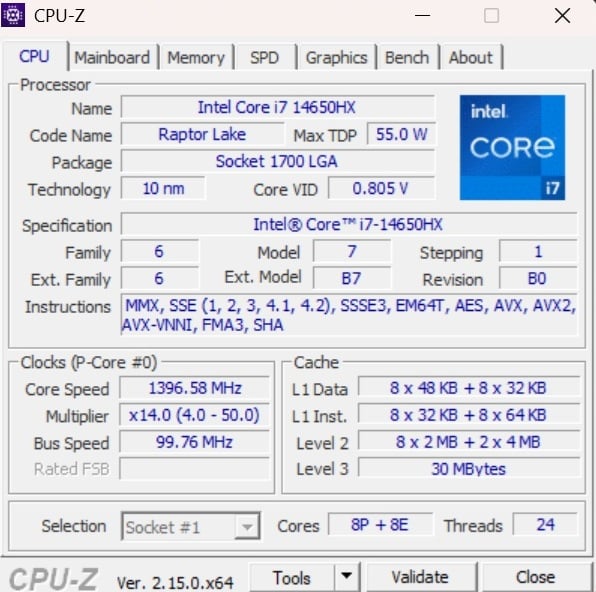
由于安装的 酷睿 i7-14650HX由于所安装的酷睿 i7-14650HX 是英特尔 Raptor Lake 系列产品,包含 8 个包含超线程技术的性能核心和 8 个不包含超线程技术的效率核心,因此已不再是最新产品,竞争对手有时会在 CPU 基准测试中明显领先 - 无论是 Ryzen AI 9 HX 370还是 酷睿至尊 7 255HX或 Ultra 9 275HX.正如我们的表格所示,其性能更接近于 Ryzen AI 7 350.
Cinebench R15 Multi loop
* ... smaller is better
AIDA64: FP32 Ray-Trace | FPU Julia | CPU SHA3 | CPU Queen | FPU SinJulia | FPU Mandel | CPU AES | CPU ZLib | FP64 Ray-Trace | CPU PhotoWorxx
| Performance rating | |
| Schenker XMG Pro 16 (E25) | |
| Asus ProArt P16 H7606WP | |
| Average of class Gaming | |
| MSI Vector 16 HX AI A2XWHG | |
| Gigabyte Aero X16 1WH | |
| Average Intel Core i7-14650HX | |
| MSI Katana 17 HX B14WGK | |
| AIDA64 / FP32 Ray-Trace | |
| Asus ProArt P16 H7606WP | |
| Schenker XMG Pro 16 (E25) | |
| Average of class Gaming (10227 - 85542, n=110, last 2 years) | |
| MSI Vector 16 HX AI A2XWHG | |
| Gigabyte Aero X16 1WH | |
| Average Intel Core i7-14650HX (13096 - 19044, n=2) | |
| MSI Katana 17 HX B14WGK | |
| AIDA64 / FPU Julia | |
| Schenker XMG Pro 16 (E25) | |
| Asus ProArt P16 H7606WP | |
| MSI Vector 16 HX AI A2XWHG | |
| Average of class Gaming (51376 - 238426, n=110, last 2 years) | |
| Gigabyte Aero X16 1WH | |
| Average Intel Core i7-14650HX (67335 - 95271, n=2) | |
| MSI Katana 17 HX B14WGK | |
| AIDA64 / CPU SHA3 | |
| Schenker XMG Pro 16 (E25) | |
| MSI Vector 16 HX AI A2XWHG | |
| Average of class Gaming (2180 - 9817, n=110, last 2 years) | |
| Asus ProArt P16 H7606WP | |
| Gigabyte Aero X16 1WH | |
| Average Intel Core i7-14650HX (3109 - 4214, n=2) | |
| MSI Katana 17 HX B14WGK | |
| AIDA64 / CPU Queen | |
| Schenker XMG Pro 16 (E25) | |
| Average of class Gaming (49785 - 173351, n=101, last 2 years) | |
| MSI Vector 16 HX AI A2XWHG | |
| Average Intel Core i7-14650HX (89907 - 101500, n=2) | |
| Asus ProArt P16 H7606WP | |
| MSI Katana 17 HX B14WGK | |
| Gigabyte Aero X16 1WH | |
| AIDA64 / FPU SinJulia | |
| Asus ProArt P16 H7606WP | |
| Average of class Gaming (4424 - 33636, n=110, last 2 years) | |
| Schenker XMG Pro 16 (E25) | |
| Gigabyte Aero X16 1WH | |
| MSI Vector 16 HX AI A2XWHG | |
| Average Intel Core i7-14650HX (9159 - 11913, n=2) | |
| MSI Katana 17 HX B14WGK | |
| AIDA64 / FPU Mandel | |
| Schenker XMG Pro 16 (E25) | |
| Asus ProArt P16 H7606WP | |
| MSI Vector 16 HX AI A2XWHG | |
| Average of class Gaming (25115 - 128721, n=110, last 2 years) | |
| Gigabyte Aero X16 1WH | |
| Average Intel Core i7-14650HX (32747 - 47097, n=2) | |
| MSI Katana 17 HX B14WGK | |
| AIDA64 / CPU AES | |
| Schenker XMG Pro 16 (E25) | |
| Asus ProArt P16 H7606WP | |
| Average of class Gaming (39258 - 247074, n=110, last 2 years) | |
| MSI Vector 16 HX AI A2XWHG | |
| Gigabyte Aero X16 1WH | |
| Average Intel Core i7-14650HX (63627 - 86485, n=2) | |
| MSI Katana 17 HX B14WGK | |
| AIDA64 / CPU ZLib | |
| Schenker XMG Pro 16 (E25) | |
| Average of class Gaming (574 - 2531, n=110, last 2 years) | |
| MSI Vector 16 HX AI A2XWHG | |
| Asus ProArt P16 H7606WP | |
| Gigabyte Aero X16 1WH | |
| Average Intel Core i7-14650HX (924 - 1289, n=2) | |
| MSI Katana 17 HX B14WGK | |
| AIDA64 / FP64 Ray-Trace | |
| Asus ProArt P16 H7606WP | |
| Schenker XMG Pro 16 (E25) | |
| Average of class Gaming (5509 - 45446, n=110, last 2 years) | |
| MSI Vector 16 HX AI A2XWHG | |
| Gigabyte Aero X16 1WH | |
| Average Intel Core i7-14650HX (7064 - 10316, n=2) | |
| MSI Katana 17 HX B14WGK | |
| AIDA64 / CPU PhotoWorxx | |
| Schenker XMG Pro 16 (E25) | |
| Asus ProArt P16 H7606WP | |
| Average of class Gaming (12271 - 89891, n=110, last 2 years) | |
| Gigabyte Aero X16 1WH | |
| MSI Vector 16 HX AI A2XWHG | |
| MSI Katana 17 HX B14WGK | |
| Average Intel Core i7-14650HX (33763 - 34470, n=2) | |
系统性能
就系统性能而言,Katana 17 在测试领域处于领先地位,尽管与竞争对手(XMG Pro 16 除外)的差距很小。
PCMark 10: Score | Essentials | Productivity | Digital Content Creation
CrossMark: Overall | Productivity | Creativity | Responsiveness
WebXPRT 3: Overall
WebXPRT 4: Overall
Mozilla Kraken 1.1: Total
| Performance rating | |
| Schenker XMG Pro 16 (E25) | |
| Average of class Gaming | |
| MSI Vector 16 HX AI A2XWHG | |
| Asus ProArt P16 H7606WP | |
| Gigabyte Aero X16 1WH | |
| MSI Katana 17 HX B14WGK | |
| Average Intel Core i7-14650HX, NVIDIA GeForce RTX 5070 Laptop | |
| PCMark 10 / Score | |
| Schenker XMG Pro 16 (E25) | |
| Average of class Gaming (5828 - 11574, n=96, last 2 years) | |
| Asus ProArt P16 H7606WP | |
| Gigabyte Aero X16 1WH | |
| MSI Vector 16 HX AI A2XWHG | |
| MSI Katana 17 HX B14WGK | |
| Average Intel Core i7-14650HX, NVIDIA GeForce RTX 5070 Laptop (n=1) | |
| PCMark 10 / Essentials | |
| Schenker XMG Pro 16 (E25) | |
| MSI Vector 16 HX AI A2XWHG | |
| Average of class Gaming (8810 - 12600, n=100, last 2 years) | |
| Asus ProArt P16 H7606WP | |
| Gigabyte Aero X16 1WH | |
| MSI Katana 17 HX B14WGK | |
| Average Intel Core i7-14650HX, NVIDIA GeForce RTX 5070 Laptop (n=1) | |
| PCMark 10 / Productivity | |
| Average of class Gaming (6845 - 18766, n=98, last 2 years) | |
| Gigabyte Aero X16 1WH | |
| Schenker XMG Pro 16 (E25) | |
| MSI Vector 16 HX AI A2XWHG | |
| Asus ProArt P16 H7606WP | |
| MSI Katana 17 HX B14WGK | |
| Average Intel Core i7-14650HX, NVIDIA GeForce RTX 5070 Laptop (n=1) | |
| PCMark 10 / Digital Content Creation | |
| Schenker XMG Pro 16 (E25) | |
| Asus ProArt P16 H7606WP | |
| Average of class Gaming (7602 - 19657, n=98, last 2 years) | |
| MSI Vector 16 HX AI A2XWHG | |
| Gigabyte Aero X16 1WH | |
| MSI Katana 17 HX B14WGK | |
| Average Intel Core i7-14650HX, NVIDIA GeForce RTX 5070 Laptop (n=1) | |
| CrossMark / Overall | |
| Schenker XMG Pro 16 (E25) | |
| Average of class Gaming (1366 - 2409, n=98, last 2 years) | |
| MSI Katana 17 HX B14WGK | |
| Average Intel Core i7-14650HX, NVIDIA GeForce RTX 5070 Laptop (n=1) | |
| MSI Vector 16 HX AI A2XWHG | |
| Asus ProArt P16 H7606WP | |
| Gigabyte Aero X16 1WH | |
| CrossMark / Productivity | |
| Schenker XMG Pro 16 (E25) | |
| MSI Katana 17 HX B14WGK | |
| Average Intel Core i7-14650HX, NVIDIA GeForce RTX 5070 Laptop (n=1) | |
| Average of class Gaming (1386 - 2254, n=98, last 2 years) | |
| MSI Vector 16 HX AI A2XWHG | |
| Asus ProArt P16 H7606WP | |
| Gigabyte Aero X16 1WH | |
| CrossMark / Creativity | |
| Schenker XMG Pro 16 (E25) | |
| Asus ProArt P16 H7606WP | |
| MSI Vector 16 HX AI A2XWHG | |
| Average of class Gaming (1343 - 2729, n=98, last 2 years) | |
| MSI Katana 17 HX B14WGK | |
| Average Intel Core i7-14650HX, NVIDIA GeForce RTX 5070 Laptop (n=1) | |
| Gigabyte Aero X16 1WH | |
| CrossMark / Responsiveness | |
| MSI Katana 17 HX B14WGK | |
| Average Intel Core i7-14650HX, NVIDIA GeForce RTX 5070 Laptop (n=1) | |
| Schenker XMG Pro 16 (E25) | |
| Average of class Gaming (1226 - 2334, n=98, last 2 years) | |
| Asus ProArt P16 H7606WP | |
| MSI Vector 16 HX AI A2XWHG | |
| Gigabyte Aero X16 1WH | |
| WebXPRT 3 / Overall | |
| Schenker XMG Pro 16 (E25) | |
| Gigabyte Aero X16 1WH | |
| Asus ProArt P16 H7606WP | |
| MSI Vector 16 HX AI A2XWHG | |
| Average of class Gaming (242 - 532, n=101, last 2 years) | |
| MSI Katana 17 HX B14WGK | |
| Average Intel Core i7-14650HX, NVIDIA GeForce RTX 5070 Laptop (n=1) | |
| WebXPRT 4 / Overall | |
| Schenker XMG Pro 16 (E25) | |
| MSI Vector 16 HX AI A2XWHG | |
| Average of class Gaming (176.4 - 354, n=101, last 2 years) | |
| Gigabyte Aero X16 1WH | |
| Asus ProArt P16 H7606WP | |
| MSI Katana 17 HX B14WGK | |
| Average Intel Core i7-14650HX, NVIDIA GeForce RTX 5070 Laptop (n=1) | |
| Mozilla Kraken 1.1 / Total | |
| MSI Katana 17 HX B14WGK | |
| Average Intel Core i7-14650HX, NVIDIA GeForce RTX 5070 Laptop (n=1) | |
| Average of class Gaming (391 - 590, n=106, last 2 years) | |
| Asus ProArt P16 H7606WP | |
| Gigabyte Aero X16 1WH | |
| MSI Vector 16 HX AI A2XWHG | |
| Schenker XMG Pro 16 (E25) | |
* ... smaller is better
| PCMark 10 Score | 6864 points | |
Help | ||
| AIDA64 / Memory Copy | |
| Asus ProArt P16 H7606WP | |
| Schenker XMG Pro 16 (E25) | |
| Gigabyte Aero X16 1WH | |
| Average of class Gaming (21750 - 129946, n=110, last 2 years) | |
| MSI Vector 16 HX AI A2XWHG | |
| Average Intel Core i7-14650HX (58978 - 59727, n=2) | |
| MSI Katana 17 HX B14WGK | |
| AIDA64 / Memory Read | |
| Asus ProArt P16 H7606WP | |
| Schenker XMG Pro 16 (E25) | |
| MSI Vector 16 HX AI A2XWHG | |
| Average of class Gaming (22956 - 118858, n=110, last 2 years) | |
| Average Intel Core i7-14650HX (70720 - 71455, n=2) | |
| MSI Katana 17 HX B14WGK | |
| Gigabyte Aero X16 1WH | |
| AIDA64 / Memory Write | |
| Asus ProArt P16 H7606WP | |
| Gigabyte Aero X16 1WH | |
| Schenker XMG Pro 16 (E25) | |
| Average of class Gaming (22297 - 135096, n=110, last 2 years) | |
| MSI Vector 16 HX AI A2XWHG | |
| MSI Katana 17 HX B14WGK | |
| Average Intel Core i7-14650HX (51138 - 56811, n=2) | |
| AIDA64 / Memory Latency | |
| Asus ProArt P16 H7606WP | |
| MSI Vector 16 HX AI A2XWHG | |
| Average of class Gaming (75.3 - 259, n=110, last 2 years) | |
| Schenker XMG Pro 16 (E25) | |
| Gigabyte Aero X16 1WH | |
| MSI Katana 17 HX B14WGK | |
| Average Intel Core i7-14650HX (89.8 - 95.2, n=2) | |
* ... smaller is better
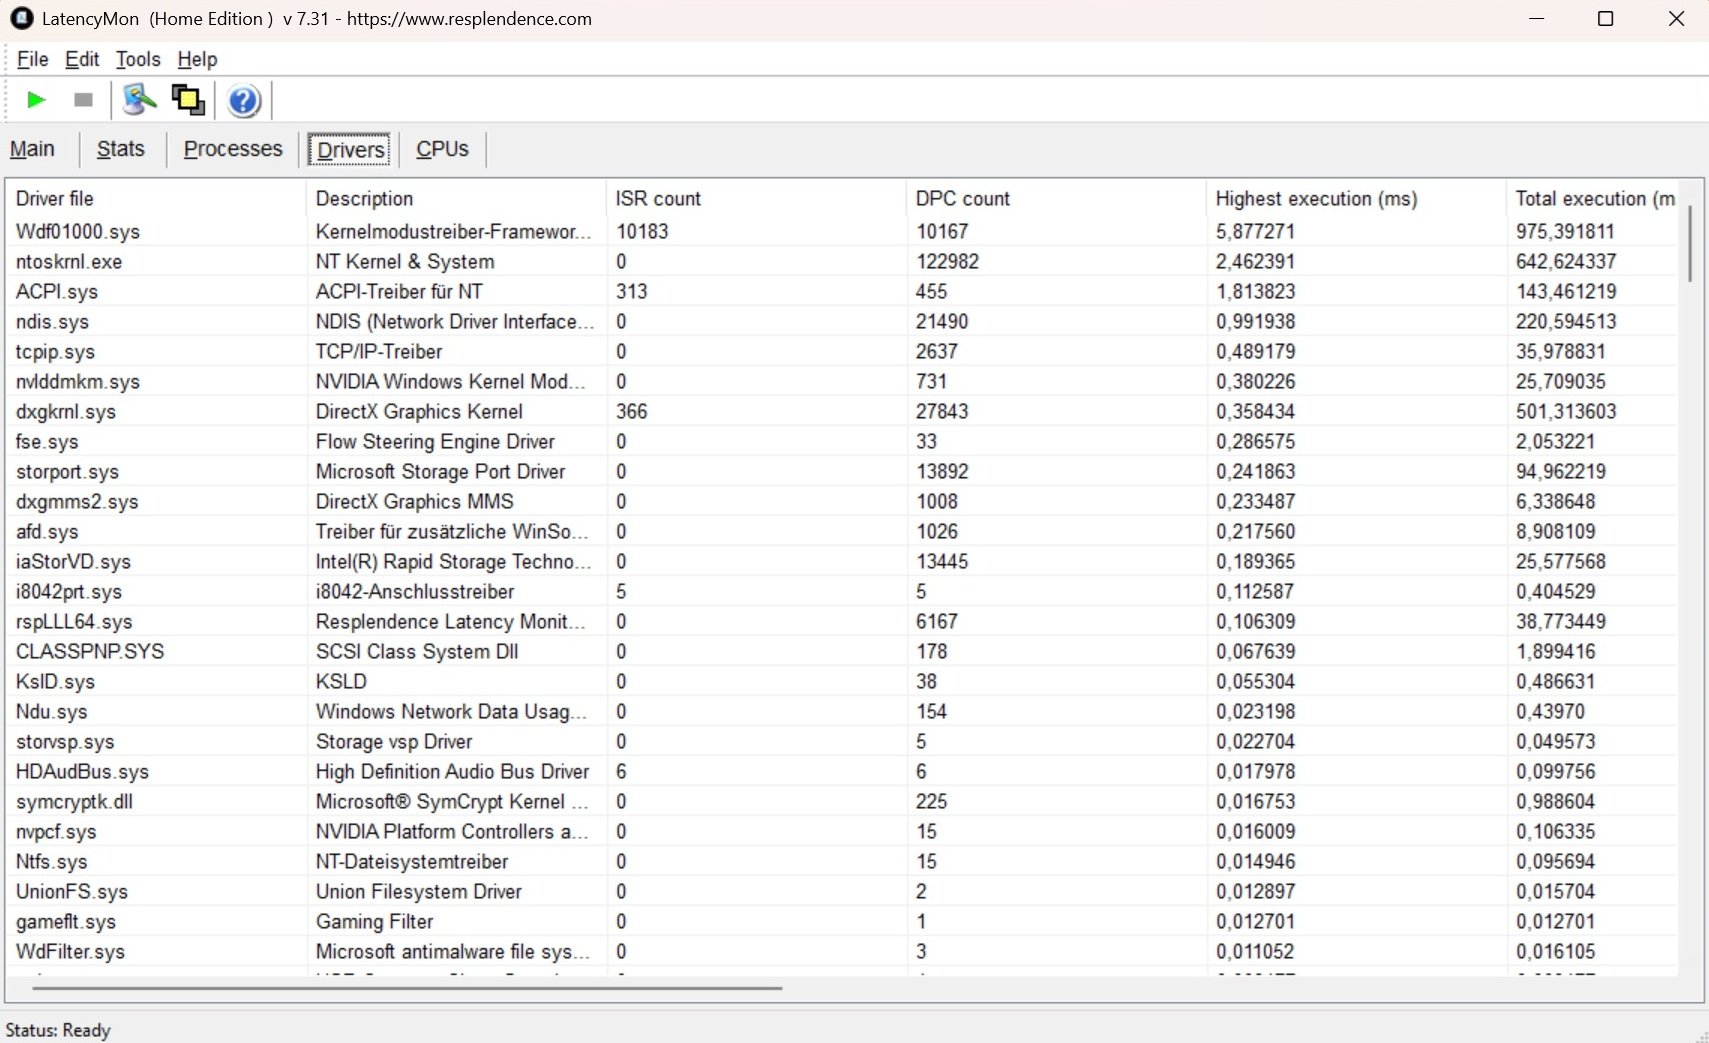
DPC 延迟
对于一些用户来说,一个问题可能是延迟非常高,这也会影响到 Vector 16。
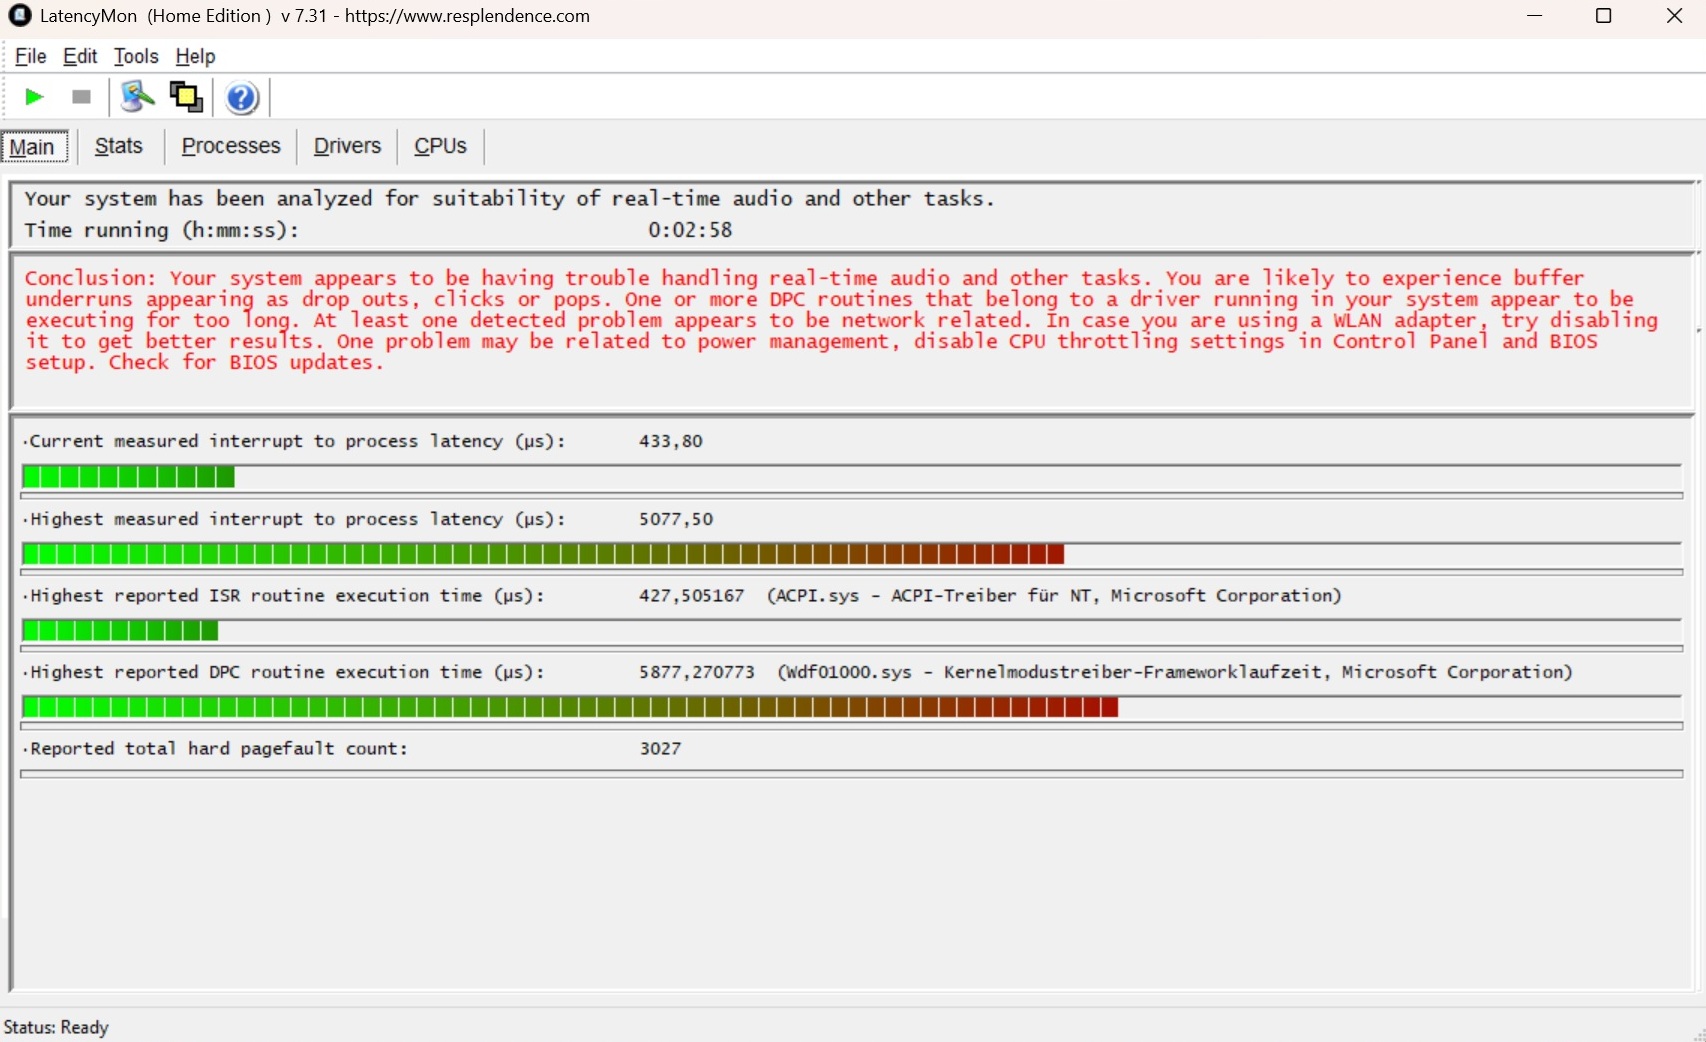
| DPC Latencies / LatencyMon - interrupt to process latency (max), Web, Youtube, Prime95 | |
| MSI Katana 17 HX B14WGK | |
| MSI Vector 16 HX AI A2XWHG | |
| Gigabyte Aero X16 1WH | |
| Schenker XMG Pro 16 (E25) | |
| Asus ProArt P16 H7606WP | |
* ... smaller is better
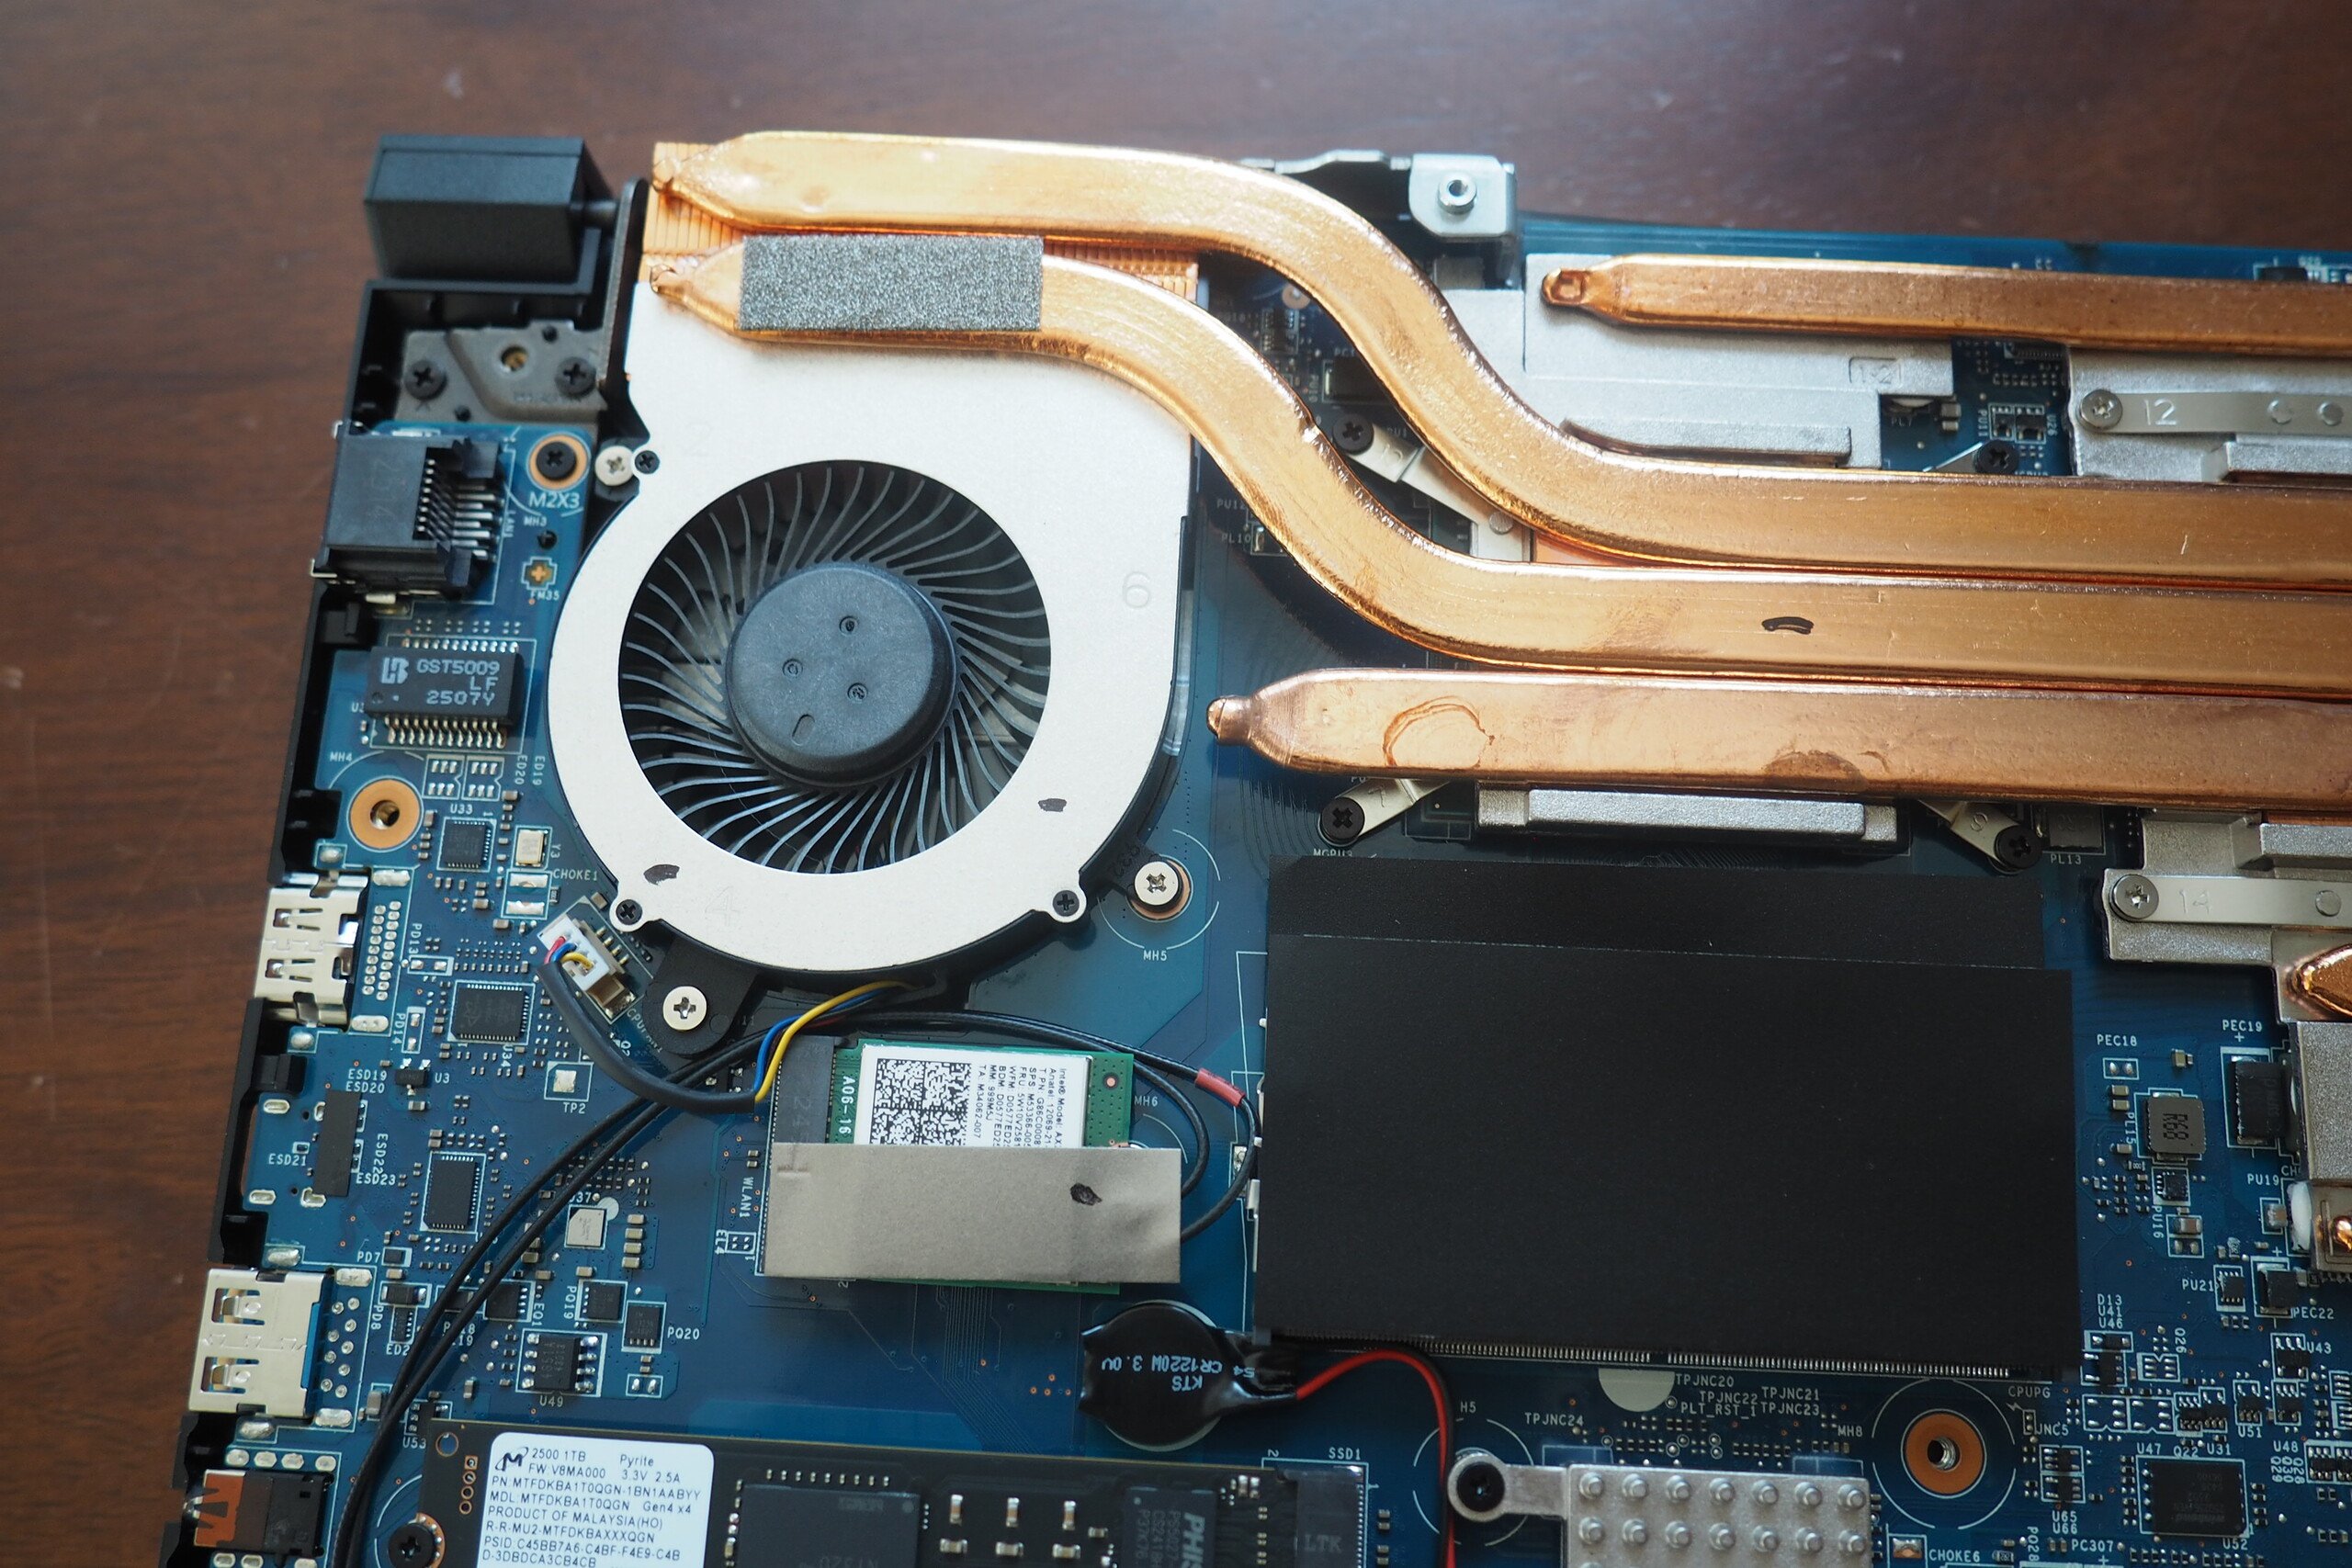
存储设备
微星的快速固态硬盘值得称赞。来自美光的 1 TB 硬盘(型号 2500)在读取和写入方面都能提供出色而稳定的数值。

* ... smaller is better
Continuous read: DiskSpd Read Loop, Queue Depth 8
图形处理器性能
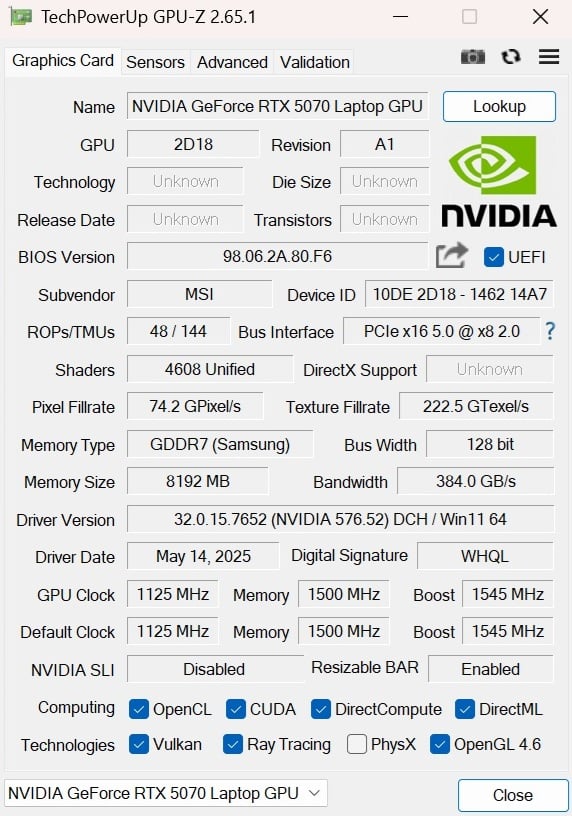
在我们看来,GeForce RTX 5070 笔记本电脑不应该以这种形式存在。这台 RTX 5070 Ti 笔记本电脑应该是真正的 "标准版"(当然,价格与 RTX 5070 笔记本电脑相同),其 GDDR7 显存为 12 GB,而不是 8 GB。然而,由于显存容量有限,这款游戏笔记本电脑的未来发展前景非常有限,而且在某些现代游戏中已经达到了极限--稍后再详述。在合成基准测试中,配备 115 瓦 TGP(包括动态提升)的 Katana 17 至少与之前确定的该 GPU 的平均水平相符。RTX 5070 Ti 笔记本电脑的平均性能要快 30%。
| 3DMark 11 Performance | 33622 points | |
| 3DMark Cloud Gate Standard Score | 56625 points | |
| 3DMark Fire Strike Score | 29564 points | |
| 3DMark Time Spy Score | 12583 points | |
Help | ||
* ... smaller is better
游戏性能
在游戏方面,这种差距仍在继续。在这方面,RTX 5070 Ti 笔记本电脑的平均性能也要快 30%。与此同时,RTX 5080 笔记本电脑在 QHD 下的运行速度要快 60%。在 VRAM 较高的游戏中,这种差异会非常明显。在 "Very Ultra "预设下,RTX 5070 Ti 笔记本电脑在《夺宝奇兵》中的每秒帧数提高了约 150%。 夺宝奇兵(32.4 vs 82.5 FPS@)。 微星 Vector A18 HX),RTX 5080 笔记本电脑甚至领先近 200%(99.5 FPS @ 微星 Raider A18 HX).
不过,RTX 5070 笔记本电脑目前仍有足够的能力在 2560 x 1440 像素的原生分辨率下运行几乎所有高至最高细节的游戏。对于要求极高或优化不佳的游戏,情况就会变得紧张,例如 地狱之刃 2, 星球大战外传, 直到黎明和 湮灭重制版 - 在这里,40 FPS 大关没有被攻破。与往常一样,DLSS(4)和可选的(多)帧生成(Multi Frame Generation)形式的升频提供了补救措施。例如,在《潜行者 2》中就能看到后者在帧率方面的能力。 潜行者 2(见表)。
| Performance rating - Percent | |
| Medion Erazer Beast 18 X1 MD62731 -1! | |
| MSI Vector 16 HX AI A2XWHG -1! | |
| Average of class Gaming | |
| Average NVIDIA GeForce RTX 5070 Laptop | |
| MSI Katana 17 HX B14WGK | |
| Doom: The Dark Ages | |
| 2560x1440 Ultra Nightmare AA:T | |
| Medion Erazer Beast 18 X1 MD62731 | |
| MSI Vector 16 HX AI A2XWHG | |
| Average of class Gaming (30.4 - 92.2, n=19, last 2 years) | |
| MSI Katana 17 HX B14WGK | |
| Average NVIDIA GeForce RTX 5070 Laptop (39.5 - 49.4, n=5) | |
| 2560x1440 Ultra Nightmare - DLSS Quality | |
| Medion Erazer Beast 18 X1 MD62731 | |
| MSI Vector 16 HX AI A2XWHG | |
| Average of class Gaming (48 - 107.3, n=18, last 2 years) | |
| Average NVIDIA GeForce RTX 5070 Laptop (54.6 - 70, n=5) | |
| MSI Katana 17 HX B14WGK | |
| The Elder Scrolls IV Oblivion Remastered | |
| 2560x1440 Ultra Preset AA:T | |
| Medion Erazer Beast 18 X1 MD62731 | |
| MSI Vector 16 HX AI A2XWHG | |
| Average of class Gaming (12.7 - 45.9, n=14, last 2 years) | |
| MSI Katana 17 HX B14WGK | |
| Average NVIDIA GeForce RTX 5070 Laptop (19.5 - 20.9, n=3) | |
| 2560x1440 Ultra Preset + Quality DLSS | |
| Medion Erazer Beast 18 X1 MD62731 | |
| MSI Vector 16 HX AI A2XWHG | |
| Average of class Gaming (25.3 - 59.7, n=12, last 2 years) | |
| Average NVIDIA GeForce RTX 5070 Laptop (30.3 - 34, n=3) | |
| MSI Katana 17 HX B14WGK | |
| Kingdom Come Deliverance 2 | |
| 2560x1440 Ultra Preset | |
| Medion Erazer Beast 18 X1 MD62731 | |
| Average of class Gaming (36.8 - 97.2, n=13, last 2 years) | |
| MSI Vector 16 HX AI A2XWHG | |
| Average NVIDIA GeForce RTX 5070 Laptop (42.6 - 52.1, n=3) | |
| MSI Katana 17 HX B14WGK | |
| 2560x1440 Ultra Preset + Quality DLSS | |
| Medion Erazer Beast 18 X1 MD62731 | |
| Average of class Gaming (50.3 - 115.5, n=13, last 2 years) | |
| MSI Vector 16 HX AI A2XWHG | |
| Average NVIDIA GeForce RTX 5070 Laptop (58.5 - 71.5, n=3) | |
| MSI Katana 17 HX B14WGK | |
| Until Dawn | |
| 2560x1440 Ultra Preset | |
| Medion Erazer Beast 18 X1 MD62731 | |
| Average of class Gaming (30.4 - 76.6, n=11, last 2 years) | |
| MSI Vector 16 HX AI A2XWHG | |
| Average NVIDIA GeForce RTX 5070 Laptop (35.4 - 44.4, n=2) | |
| MSI Katana 17 HX B14WGK | |
| 2560x1440 Ultra Preset + Quality DLSS + Ray Tracing | |
| Medion Erazer Beast 18 X1 MD62731 | |
| MSI Vector 16 HX AI A2XWHG | |
| Average of class Gaming (39.5 - 86.3, n=10, last 2 years) | |
| Average NVIDIA GeForce RTX 5070 Laptop (46.7 - 57.8, n=2) | |
| MSI Katana 17 HX B14WGK | |
| Ghost of Tsushima | |
| 2560x1440 Very High Preset AA:T | |
| Medion Erazer Beast 18 X1 MD62731 | |
| MSI Vector 16 HX AI A2XWHG | |
| Average of class Gaming (22.7 - 100.3, n=14, last 2 years) | |
| Average NVIDIA GeForce RTX 5070 Laptop (49.1 - 53.8, n=2) | |
| MSI Katana 17 HX B14WGK | |
| 2560x1440 Very High Preset + Quality DLSS | |
| Medion Erazer Beast 18 X1 MD62731 | |
| MSI Vector 16 HX AI A2XWHG | |
| Average of class Gaming (55.2 - 105.2, n=11, last 2 years) | |
| Average NVIDIA GeForce RTX 5070 Laptop (66.5 - 74.6, n=2) | |
| MSI Katana 17 HX B14WGK | |
| Horizon Forbidden West | |
| 2560x1440 Very High Preset AA:T | |
| Medion Erazer Beast 18 X1 MD62731 | |
| MSI Vector 16 HX AI A2XWHG | |
| Average of class Gaming (39.6 - 100.9, n=10, last 2 years) | |
| Average NVIDIA GeForce RTX 5070 Laptop (57.9 - 64, n=2) | |
| MSI Katana 17 HX B14WGK | |
| 2560x1440 Very High Preset + DLSS Quality | |
| Medion Erazer Beast 18 X1 MD62731 | |
| MSI Vector 16 HX AI A2XWHG | |
| Average of class Gaming (58.4 - 116.6, n=8, last 2 years) | |
| Average NVIDIA GeForce RTX 5070 Laptop (70.3 - 81.3, n=2) | |
| MSI Katana 17 HX B14WGK | |
| Indiana Jones and the Great Circle - 2560x1440 Very Ultra Preset | |
| Average of class Gaming (4.2 - 121.9, n=33, last 2 years) | |
| MSI Katana 17 HX B14WGK | |
| Average NVIDIA GeForce RTX 5070 Laptop (7.6 - 32.4, n=4) | |
| Final Fantasy XV Benchmark - 1920x1080 High Quality | |
| MSI Vector 16 HX AI A2XWHG | |
| Schenker XMG Pro 16 (E25) | |
| Average of class Gaming (41 - 215, n=104, last 2 years) | |
| Average NVIDIA GeForce RTX 5070 Laptop (96 - 150.7, n=25) | |
| Asus ProArt P16 H7606WP | |
| Gigabyte Aero X16 1WH | |
| Strange Brigade - 1920x1080 ultra AA:ultra AF:16 | |
| Average of class Gaming (76.3 - 456, n=94, last 2 years) | |
| Asus ProArt P16 H7606WP | |
| Average NVIDIA GeForce RTX 5070 Laptop (203 - 261, n=23) | |
| Gigabyte Aero X16 1WH | |
| Schenker XMG Pro 16 (E25) | |
| low | med. | high | ultra | QHD DLSS | QHD | |
|---|---|---|---|---|---|---|
| GTA V (2015) | 180.8 | 167.2 | 119 | 108.3 | ||
| Dota 2 Reborn (2015) | 199.1 | 170.8 | 161.7 | 149.3 | ||
| X-Plane 11.11 (2018) | 146.6 | 127.7 | 106.4 | |||
| Baldur's Gate 3 (2023) | 127.2 | 123.8 | 101.3 | 82.5 | ||
| Cyberpunk 2077 (2023) | 126.8 | 113.8 | 101.5 | 64.5 | ||
| Counter-Strike 2 (2023) | 222 | 170.4 | 156.5 | 115.4 | ||
| Prince of Persia The Lost Crown (2024) | 356 | 356 | 356 | 352 | ||
| Helldivers 2 (2024) | 102.1 | 101.2 | 97.4 | 81.3 | ||
| Dragon's Dogma 2 (2024) | 66 | 60.2 | ||||
| Horizon Forbidden West (2024) | 91.1 | 74.9 | 73.2 | 70.3 | 57.9 | |
| Ghost of Tsushima (2024) | 84.5 | 80.4 | 64.9 | 66.5 | 49.1 | |
| Senua's Saga Hellblade 2 (2024) | 64.1 | 46.3 | 49.4 | 31.7 | ||
| Star Wars Outlaws (2024) | 65.4 | 58.5 | 49.4 | 48.5 | 35.1 | |
| Space Marine 2 (2024) | 64.7 | 61.6 | 58.9 | 58.5 | 54.7 | |
| Until Dawn (2024) | 76.8 | 59.6 | 48.8 | 46.7 | 35.4 | |
| Stalker 2 (2024) | 64 | 54.1 | 47.1 | 74.1 | 36 | |
| Indiana Jones and the Great Circle (2024) | 60 | 42.3 | 32.4 | |||
| Kingdom Come Deliverance 2 (2025) | 111.5 | 91.4 | 67.6 | 61.5 | 45.5 | |
| Civilization 7 (2025) | 154.1 | 142.7 | 97.9 | |||
| The Elder Scrolls IV Oblivion Remastered (2025) | 72.8 | 62.3 | 30.7 | 32 | 20.9 | |
| Doom: The Dark Ages (2025) | 69.6 | 66 | 64.8 | 59.9 | 45.4 |
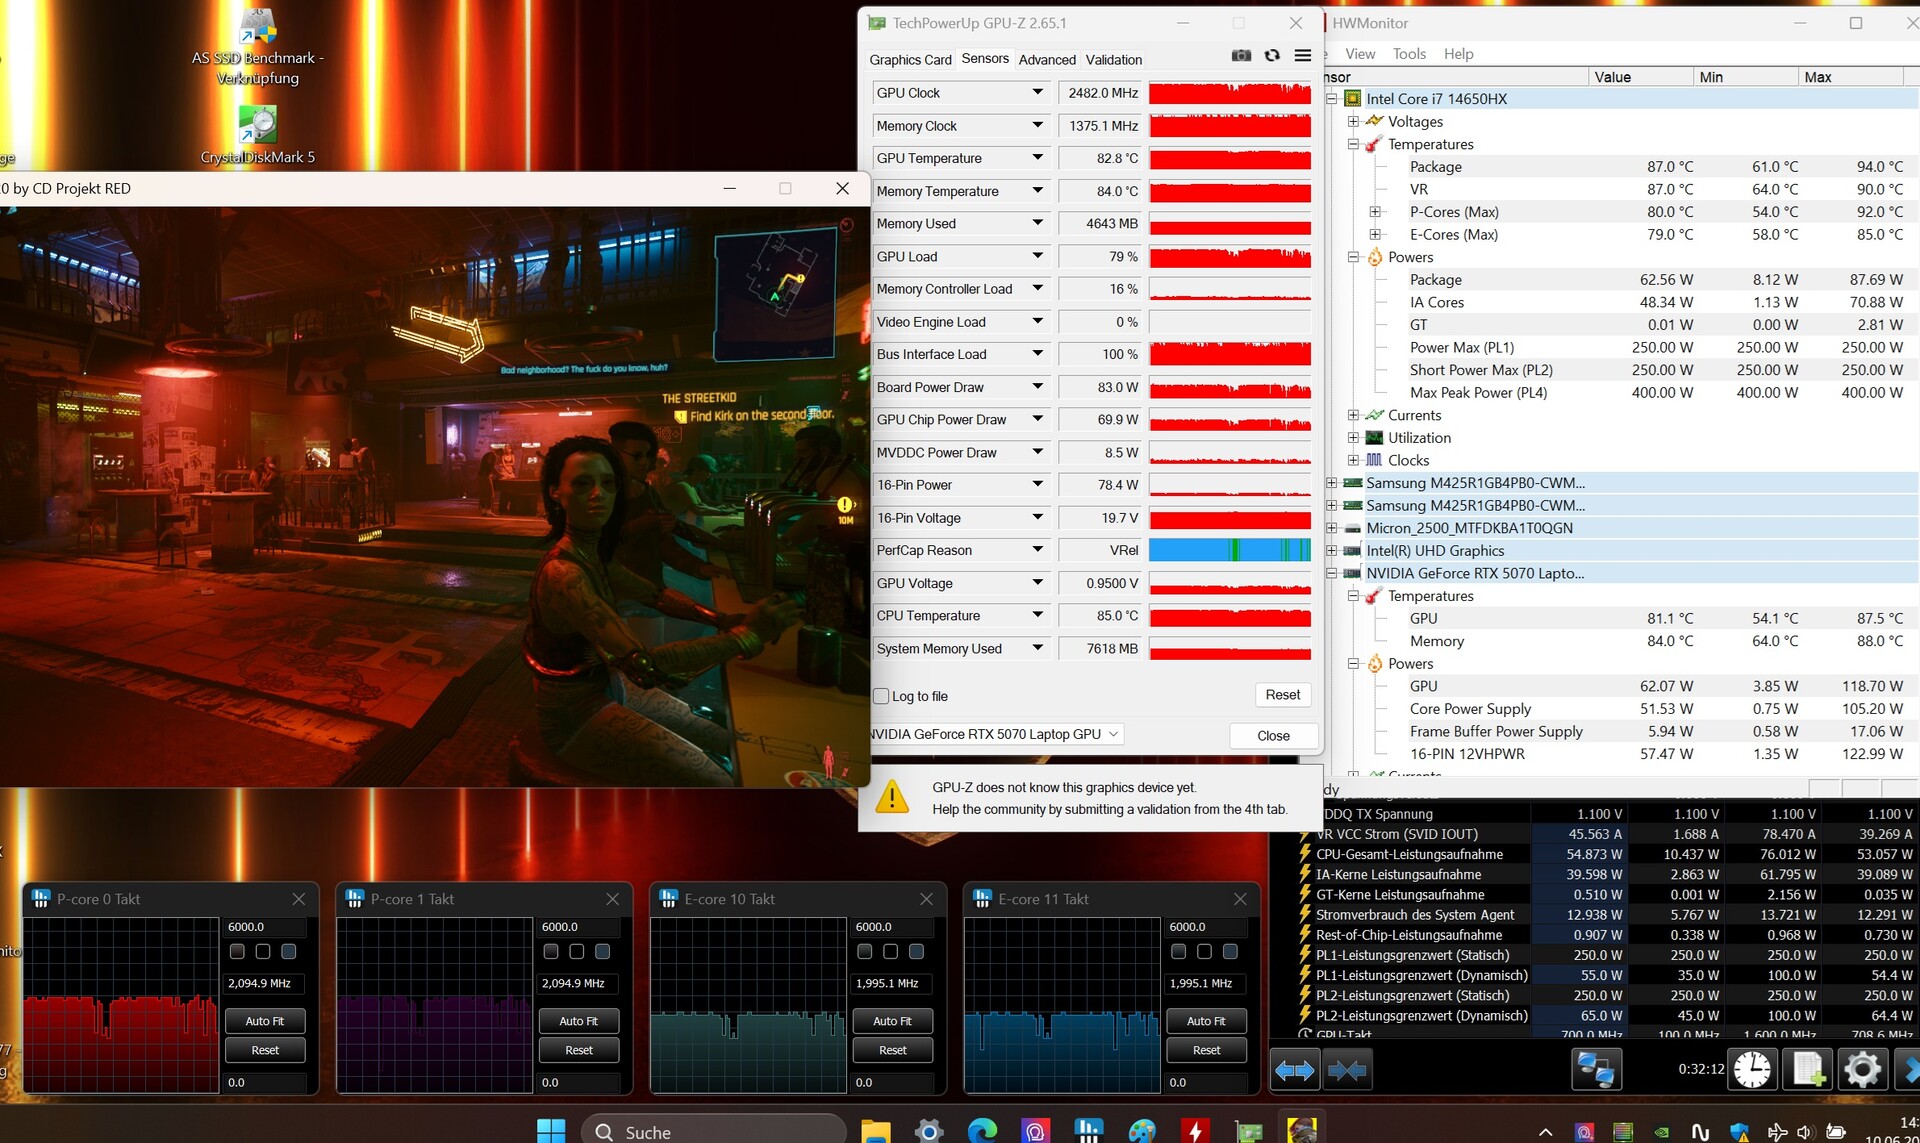
我们使用《赛博朋克 2077》测试了 GPU 性能是否在较长时间内保持稳定:卡塔纳 17 可以输出稳定的 FPS 而不会下降。
Cyberpunk 2077 Ultra settings FPS chart
排放量
噪音排放
虽然 17 英寸设备在空闲模式下仍保持相当安静的 31 至 34 dB(A),但在负载情况下,机箱风扇的声音会变得相当大,达到 50 至 59 dB(A)。所有竞争对手在 3D 模式下都更安静。
Noise level
| Idle |
| 31 / 32 / 34 dB(A) |
| Load |
| 50 / 59 dB(A) |
 | ||
30 dB silent 40 dB(A) audible 50 dB(A) loud |
||
min: | ||
| MSI Katana 17 HX B14WGK i7-14650HX, GeForce RTX 5070 Laptop | Gigabyte Aero X16 1WH Ryzen AI 7 350, GeForce RTX 5070 Laptop | Asus ProArt P16 H7606WP Ryzen AI 9 HX 370, GeForce RTX 5070 Laptop | Schenker XMG Pro 16 (E25) Ultra 9 275HX, GeForce RTX 5070 Ti Laptop | MSI Vector 16 HX AI A2XWHG Ultra 7 255HX, GeForce RTX 5070 Ti Laptop | |
|---|---|---|---|---|---|
| Noise | 21% | 10% | 14% | 3% | |
| off / environment * (dB) | 25 | 23.9 4% | 23.5 6% | 23.3 7% | 25 -0% |
| Idle Minimum * (dB) | 31 | 23.9 23% | 26.7 14% | 25 19% | 33 -6% |
| Idle Average * (dB) | 32 | 23.9 25% | 26.7 17% | 25 22% | 34 -6% |
| Idle Maximum * (dB) | 34 | 23.9 30% | 31.1 9% | 25 26% | 38 -12% |
| Load Average * (dB) | 50 | 33.2 34% | 44.8 10% | 45.5 9% | 46 8% |
| Cyberpunk 2077 ultra * (dB) | 58 | 50.2 13% | 53.7 7% | 53.3 8% | 47 19% |
| Load Maximum * (dB) | 59 | 50.2 15% | 53.7 9% | 53.3 10% | 49 17% |
* ... smaller is better
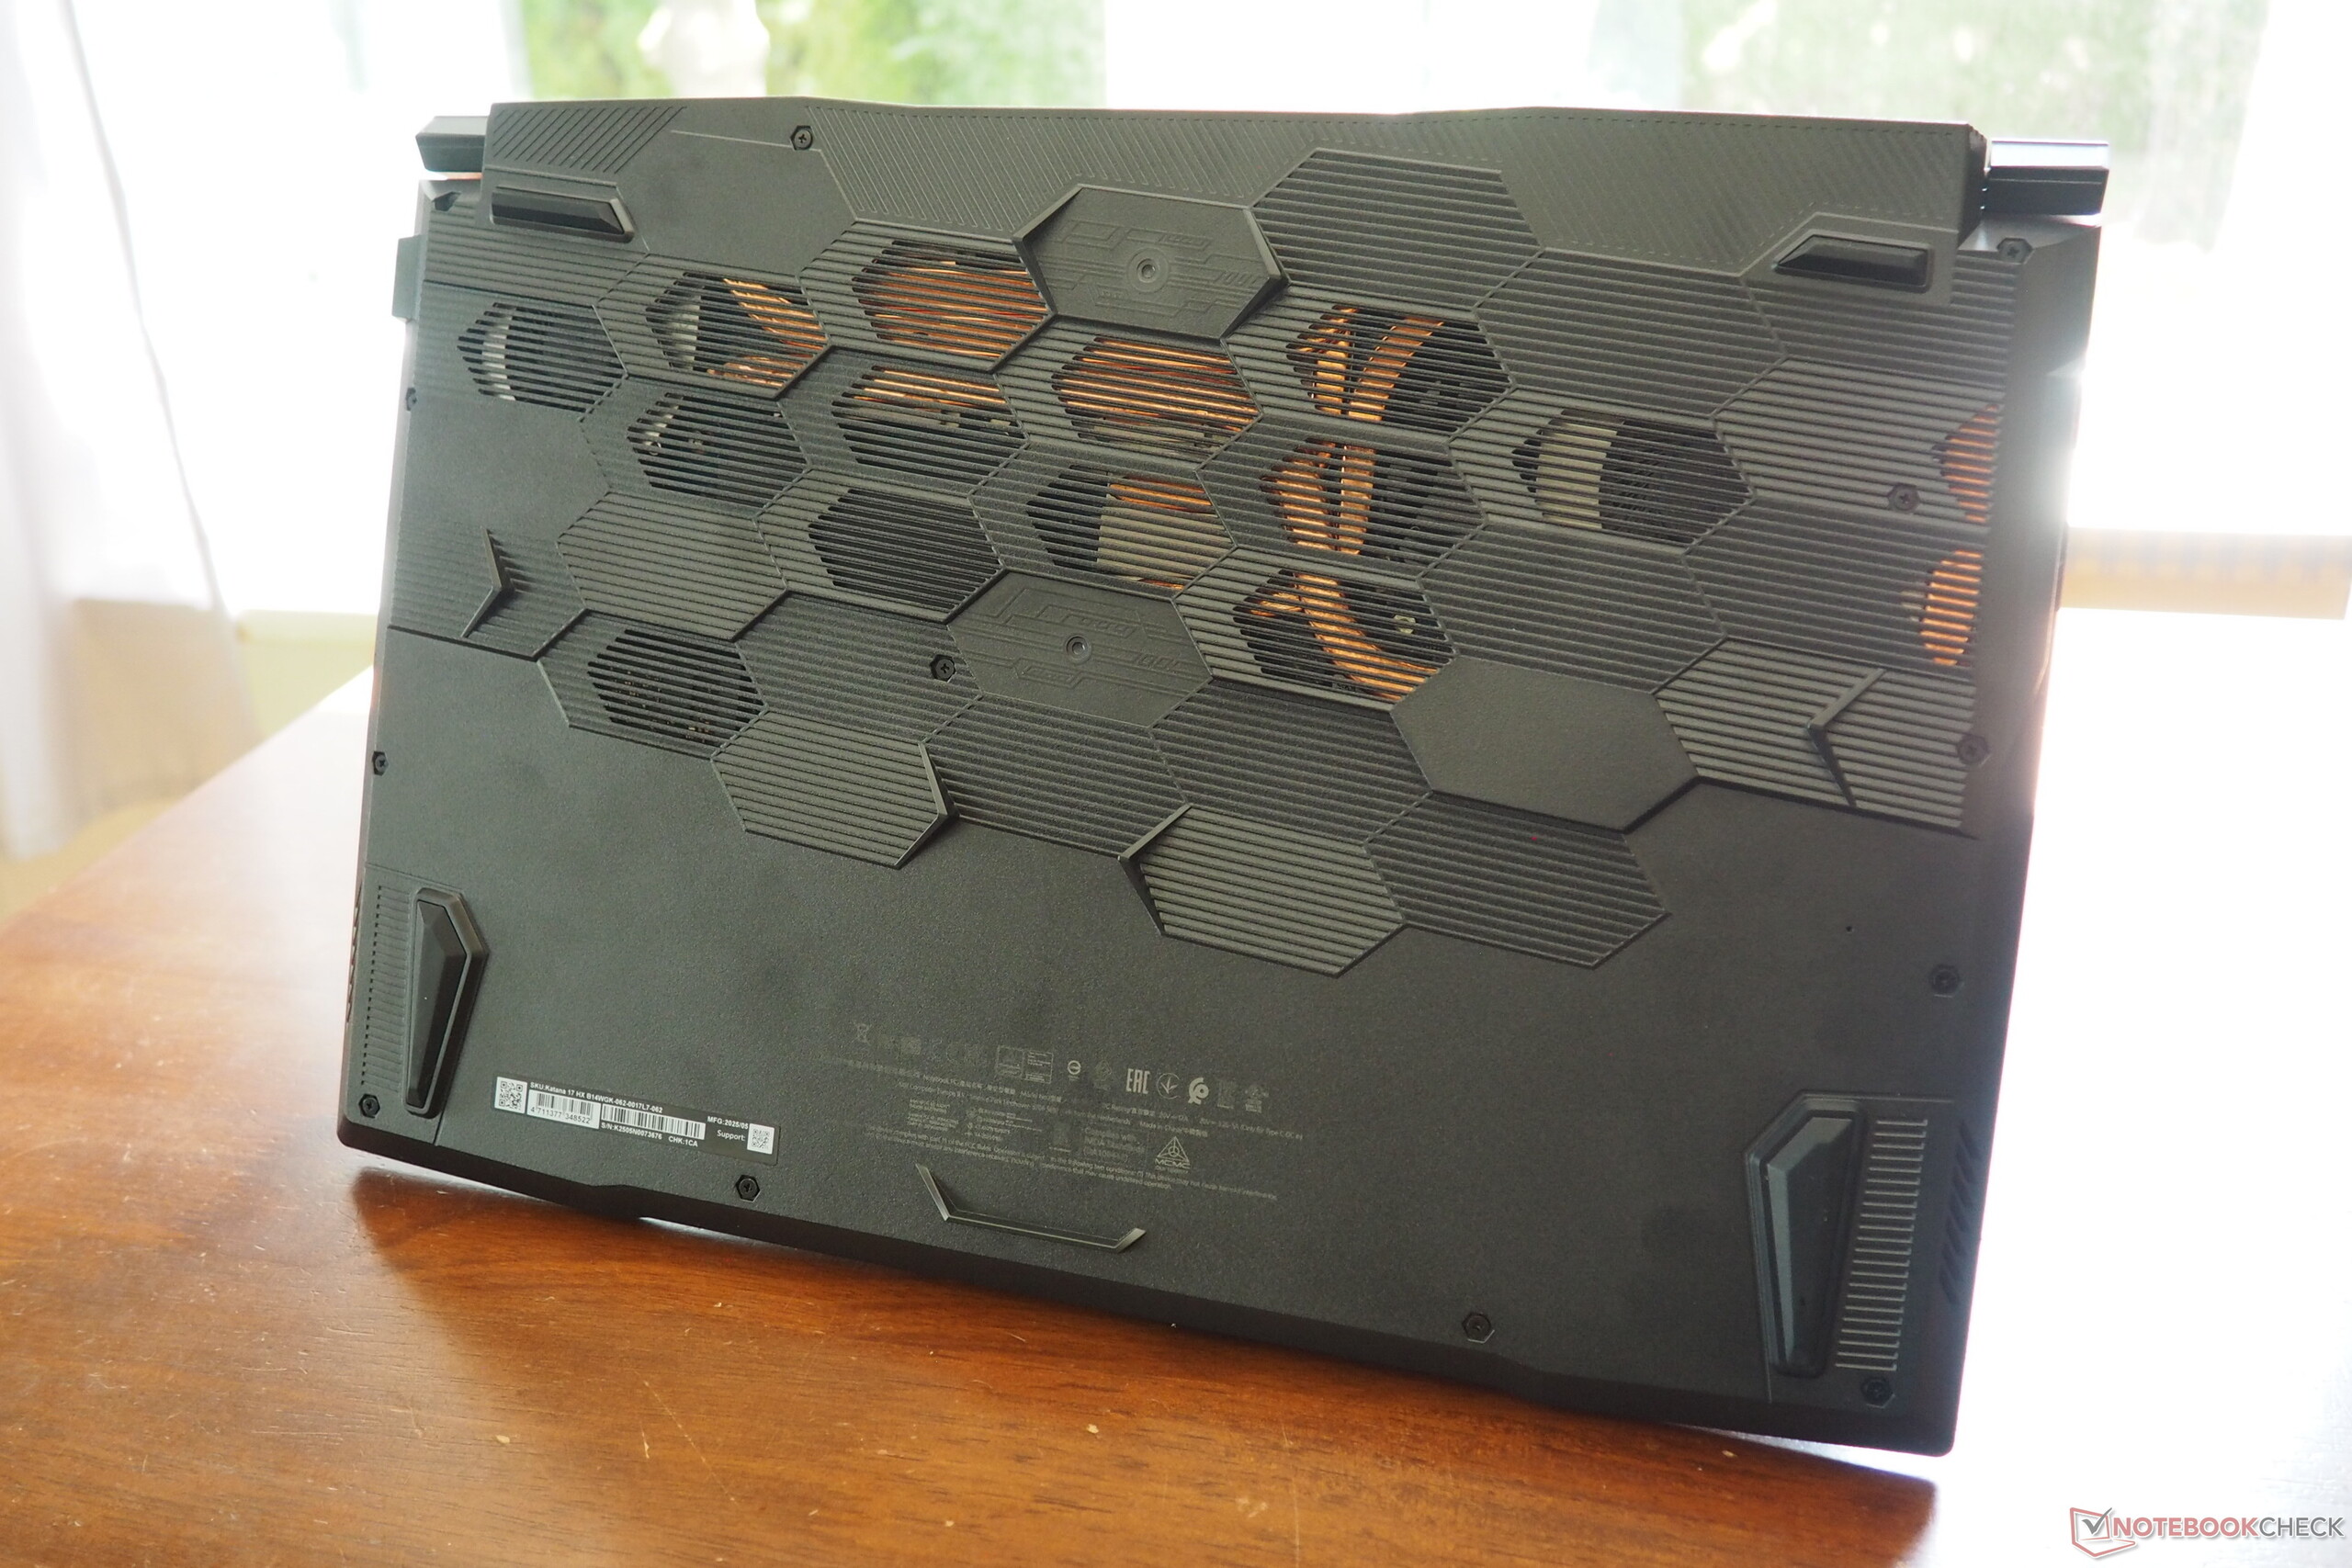
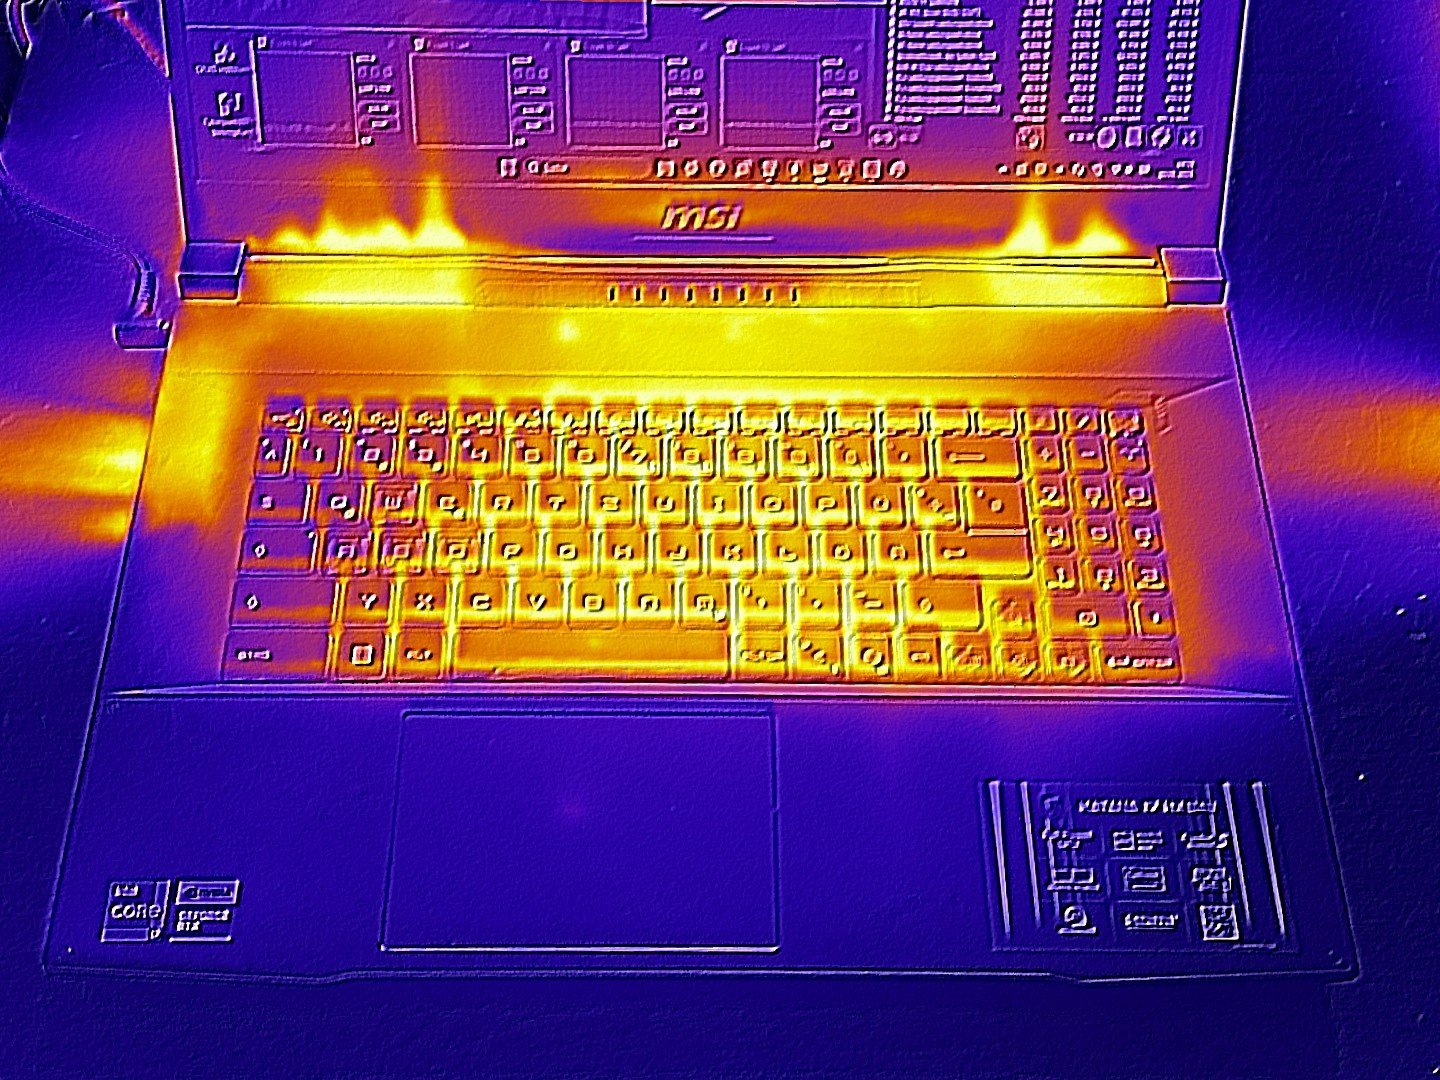
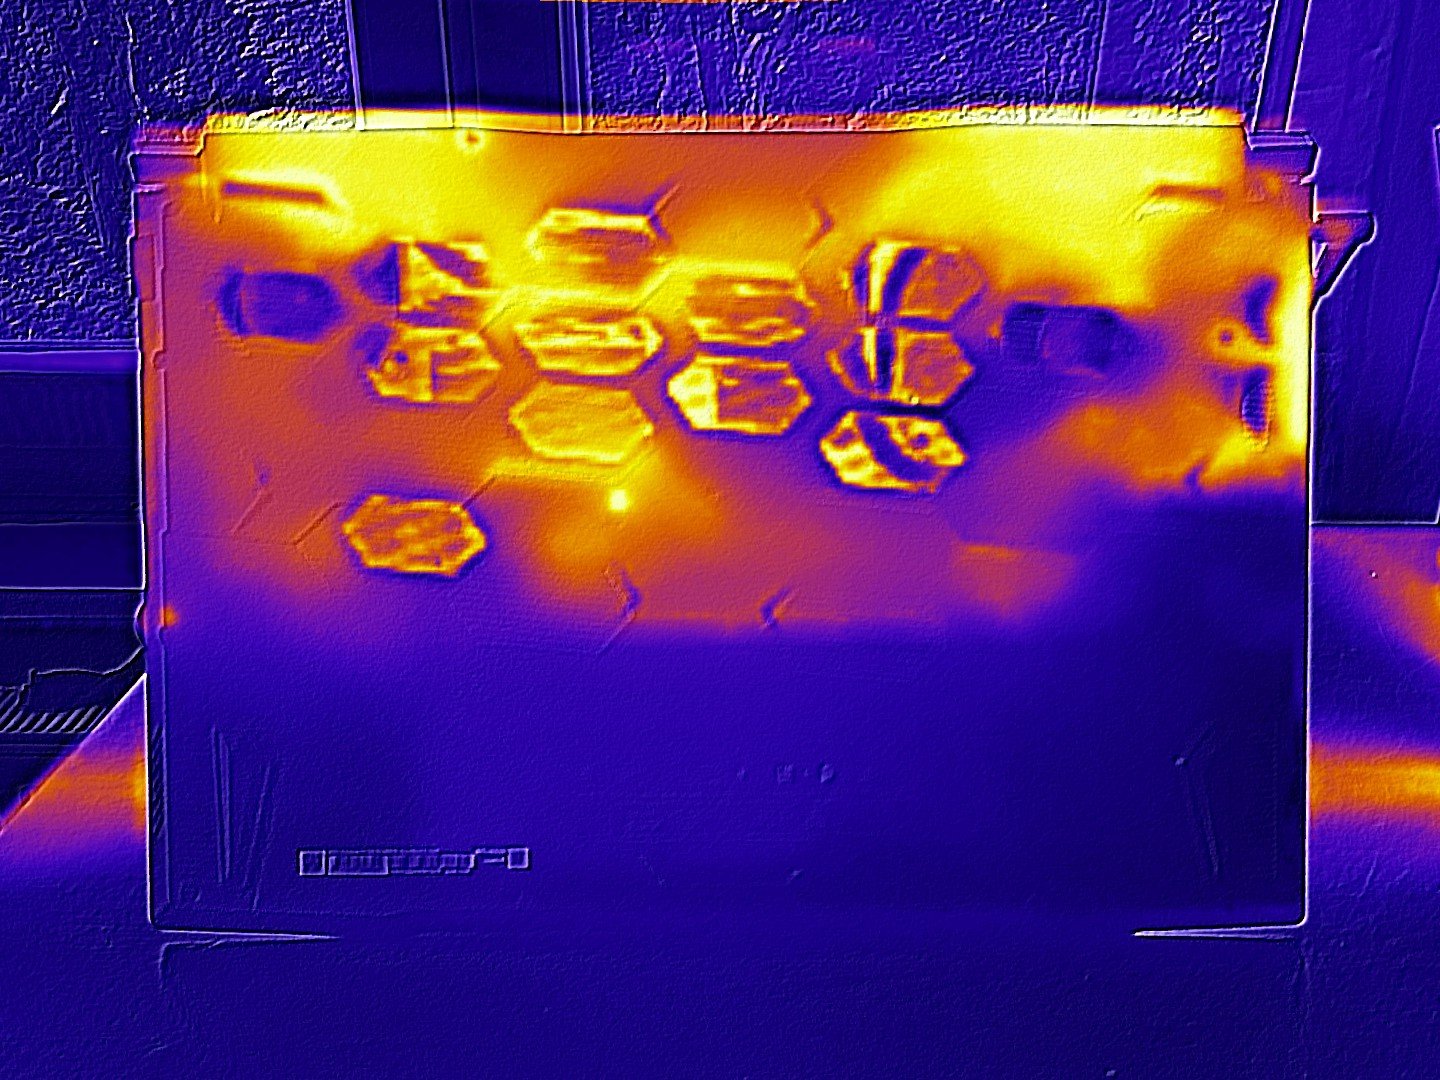
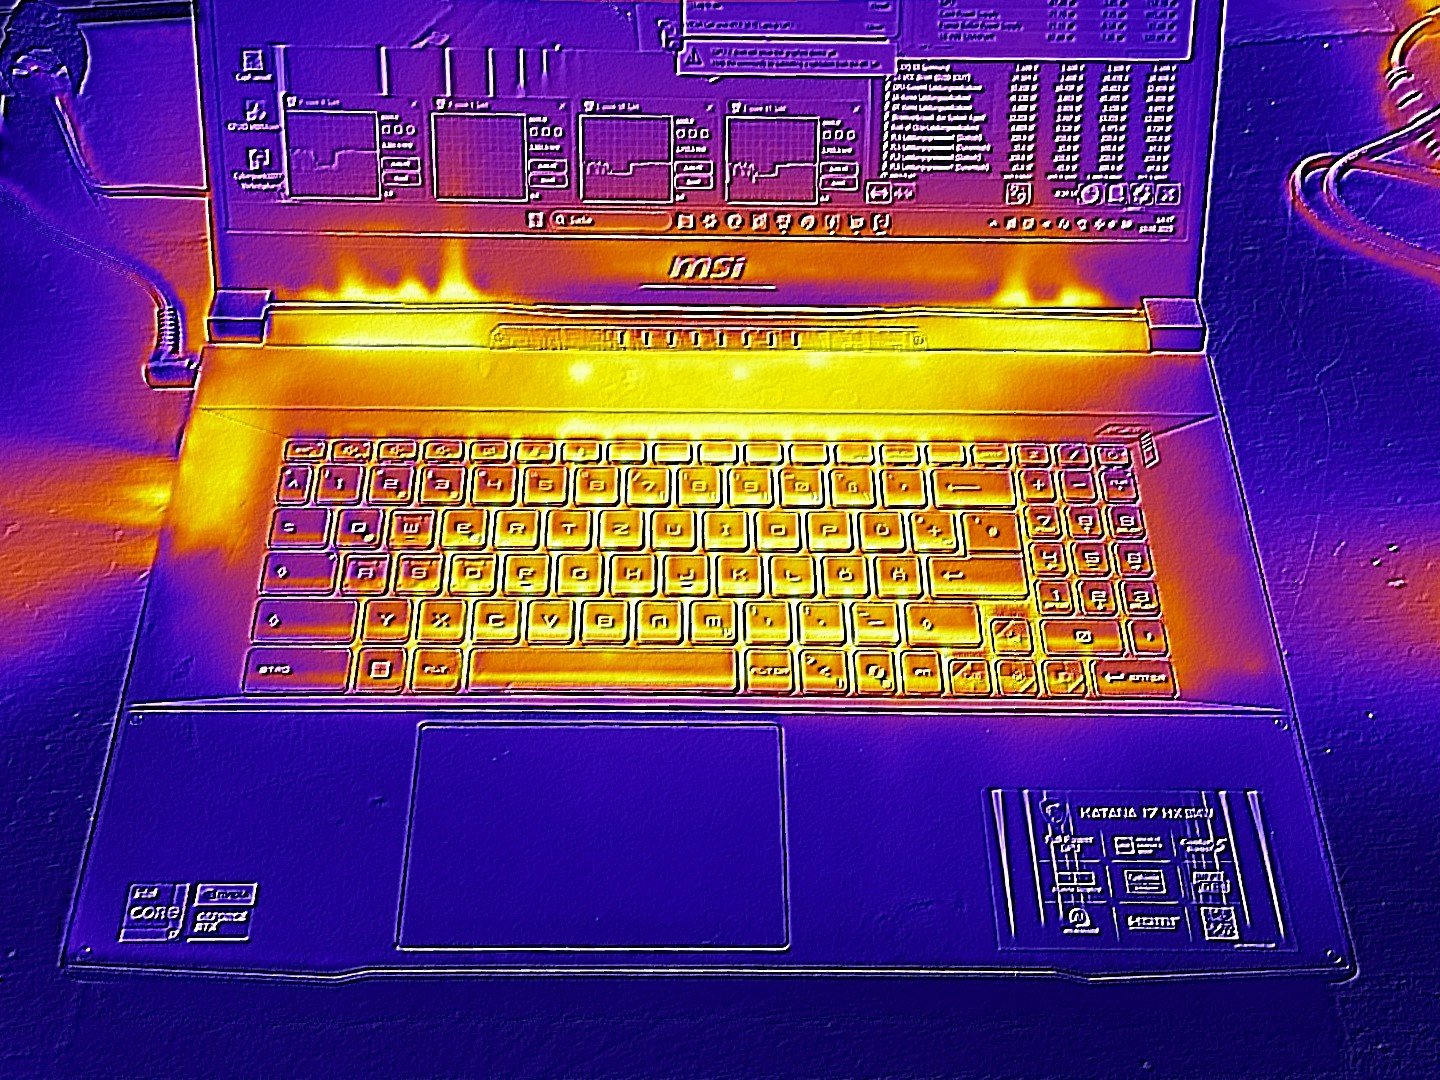
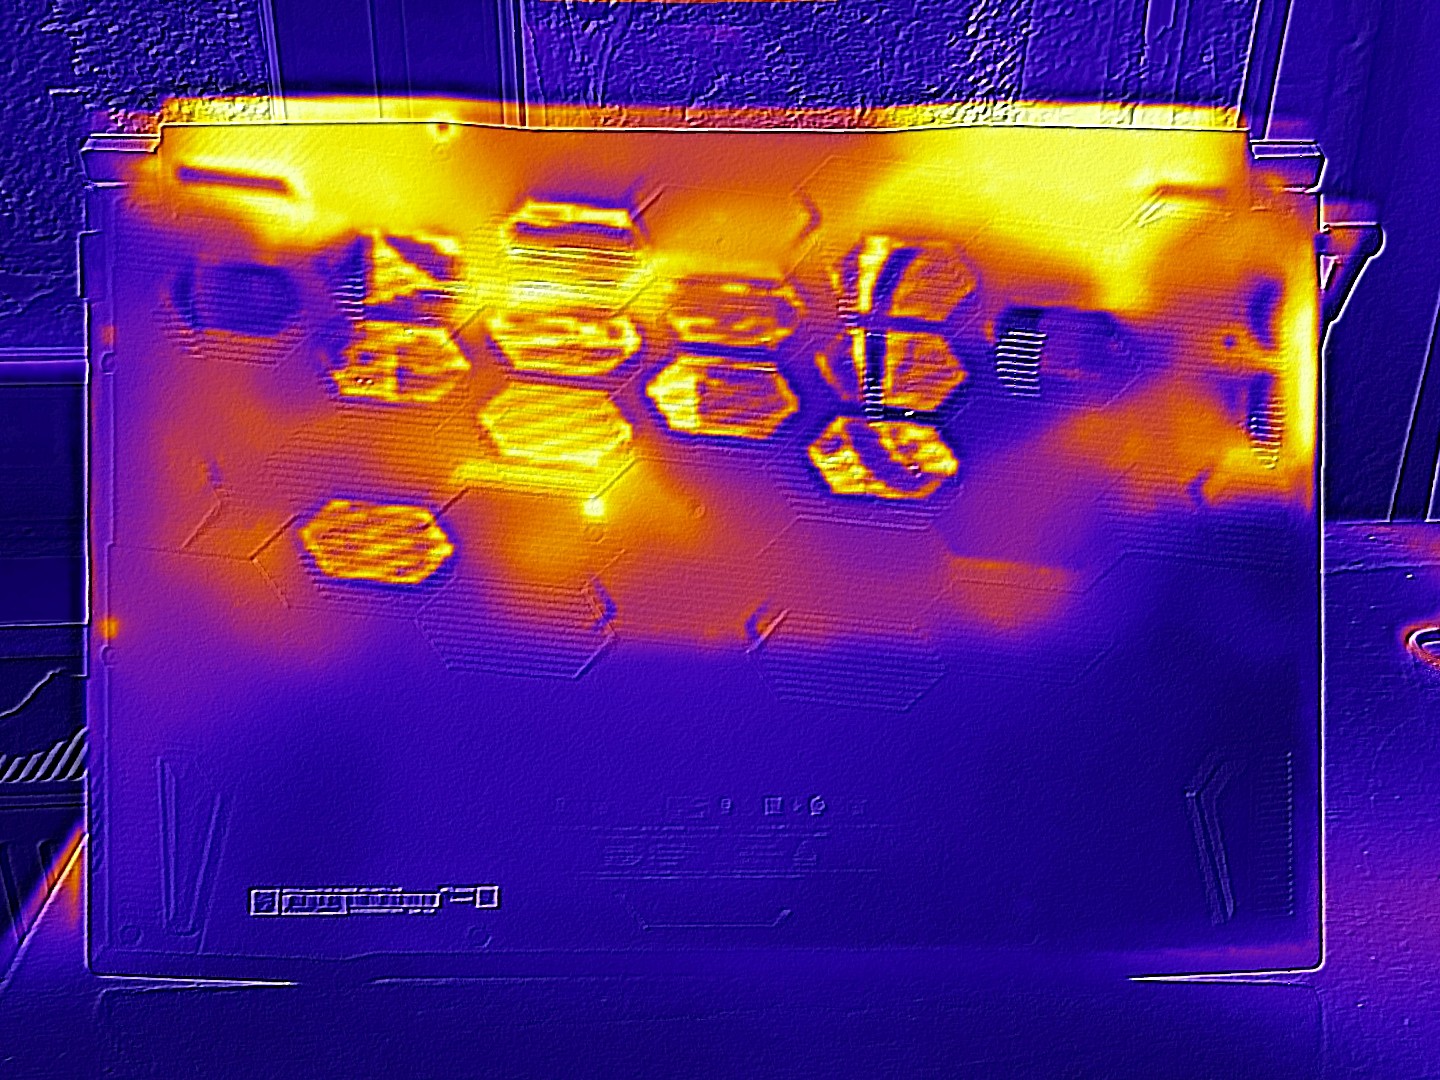
温度
在 3D 模式下,Katana 17 机箱顶部最高温度为 52 °C,底部最高温度为 56 °C,温度高于同类产品。在空闲模式下,温度明显降低,平均温度为 29 °C。
(-) The maximum temperature on the upper side is 52 °C / 126 F, compared to the average of 40.4 °C / 105 F, ranging from 21.2 to 68.8 °C for the class Gaming.
(-) The bottom heats up to a maximum of 56 °C / 133 F, compared to the average of 43.2 °C / 110 F
(+) In idle usage, the average temperature for the upper side is 29.2 °C / 85 F, compared to the device average of 33.9 °C / 93 F.
(-) 3: The average temperature for the upper side is 42.7 °C / 109 F, compared to the average of 33.9 °C / 93 F for the class Gaming.
(±) The palmrests and touchpad can get very hot to the touch with a maximum of 36 °C / 96.8 F.
(-) The average temperature of the palmrest area of similar devices was 28.8 °C / 83.8 F (-7.2 °C / -13 F).
| MSI Katana 17 HX B14WGK Intel Core i7-14650HX, NVIDIA GeForce RTX 5070 Laptop | Gigabyte Aero X16 1WH AMD Ryzen AI 7 350, NVIDIA GeForce RTX 5070 Laptop | Asus ProArt P16 H7606WP AMD Ryzen AI 9 HX 370, NVIDIA GeForce RTX 5070 Laptop | Schenker XMG Pro 16 (E25) Intel Core Ultra 9 275HX, NVIDIA GeForce RTX 5070 Ti Laptop | MSI Vector 16 HX AI A2XWHG Intel Core Ultra 7 255HX, NVIDIA GeForce RTX 5070 Ti Laptop | |
|---|---|---|---|---|---|
| Heat | 14% | 16% | -169% | 4% | |
| Maximum Upper Side * (°C) | 52 | 43.3 17% | 47 10% | 43.2 17% | 53 -2% |
| Maximum Bottom * (°C) | 56 | 50.3 10% | 47.4 15% | 46 18% | 52 7% |
| Idle Upper Side * (°C) | 33 | 27 18% | 26.1 21% | 27.7 16% | 33 -0% |
| Idle Bottom * (°C) | 32 | 28.3 12% | 26.4 17% | 264 -725% | 29 9% |
* ... smaller is better
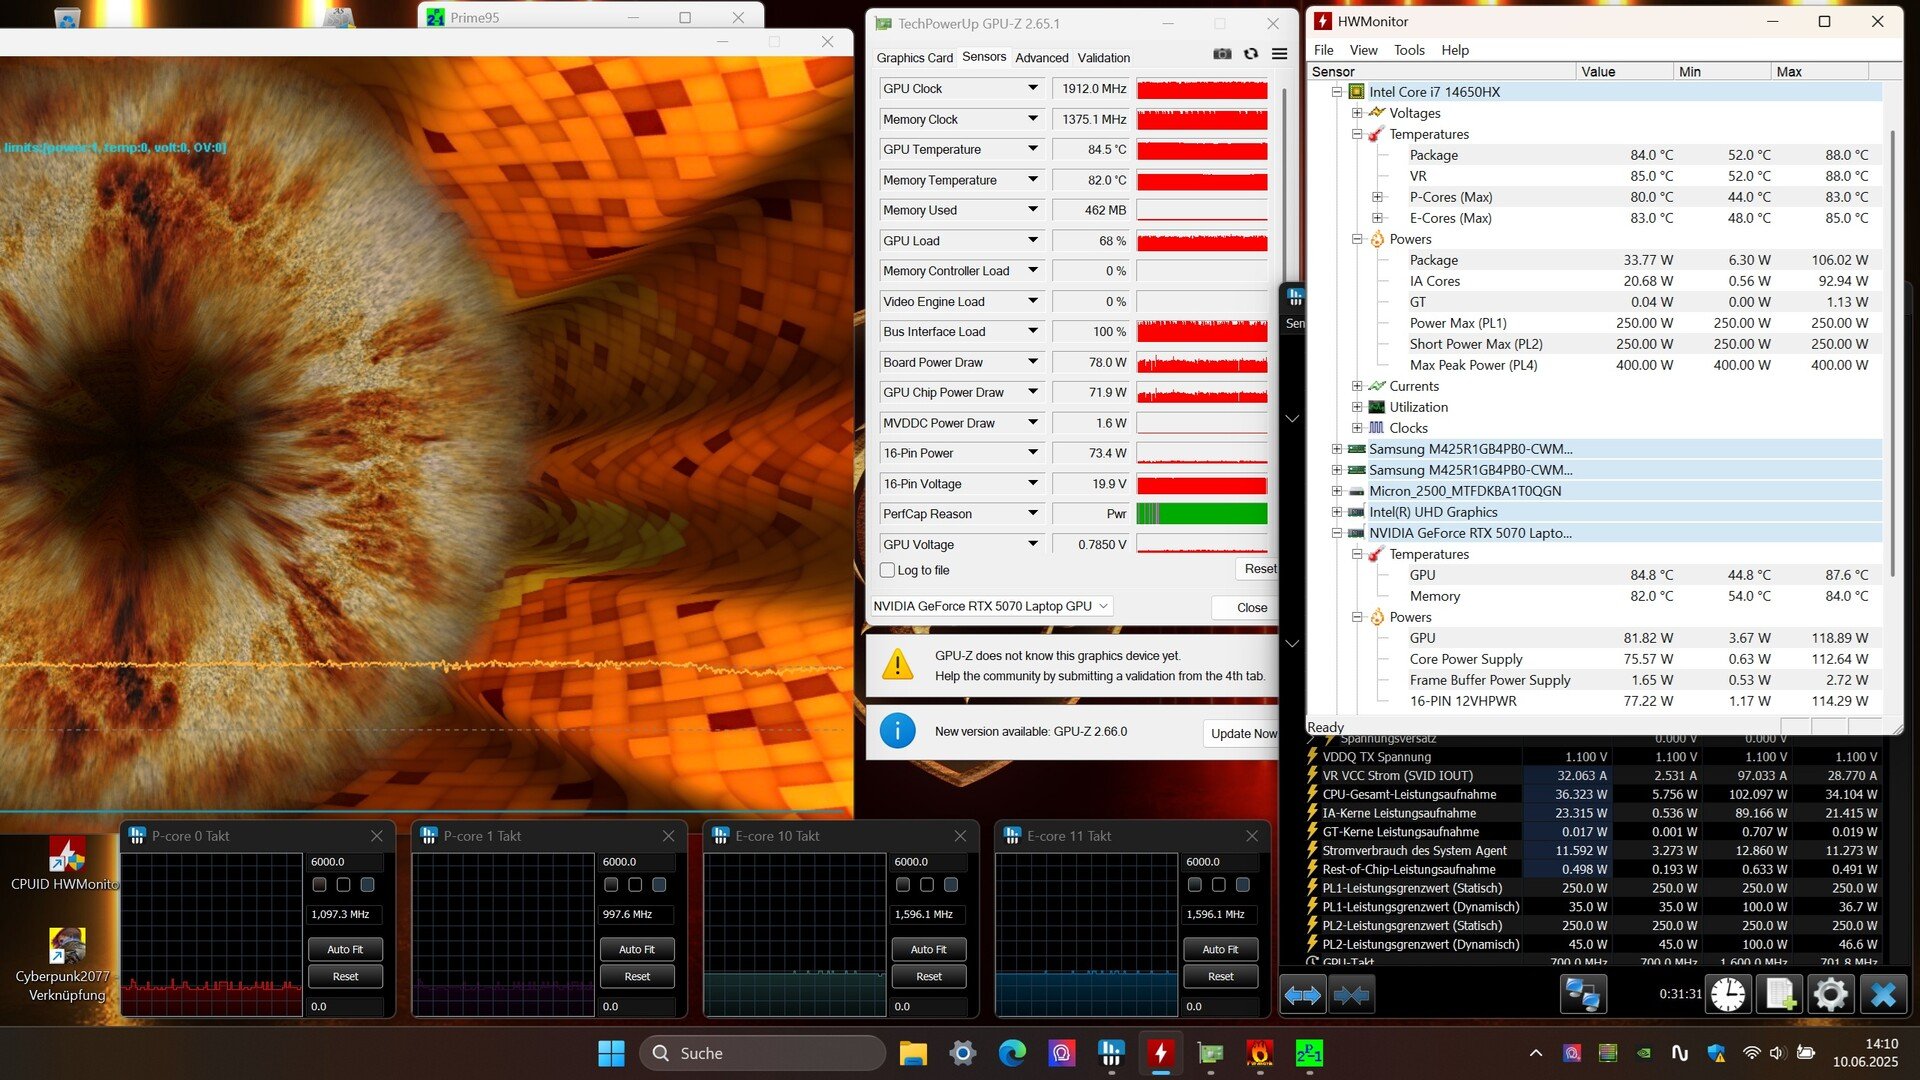
压力测试
在使用 Furmark 和 Prime95 工具进行的压力测试中,CPU 和 GPU 在一段时间后稳定在 84 °C 左右,这是一个合理的值。赛博朋克 2077》也产生了类似的温度。
发言人
遗憾的是,音质还有待提高。尤其是低音很弱。大多数竞争对手在音质方面都做得更好。
MSI Katana 17 HX B14WGK audio analysis
(+) | speakers can play relatively loud (84 dB)
Bass 100 - 315 Hz
(-) | nearly no bass - on average 19% lower than median
(±) | linearity of bass is average (10.6% delta to prev. frequency)
Mids 400 - 2000 Hz
(±) | higher mids - on average 8.7% higher than median
(±) | linearity of mids is average (7.5% delta to prev. frequency)
Highs 2 - 16 kHz
(+) | balanced highs - only 4.6% away from median
(±) | linearity of highs is average (9.7% delta to prev. frequency)
Overall 100 - 16.000 Hz
(±) | linearity of overall sound is average (20.6% difference to median)
Compared to same class
» 74% of all tested devices in this class were better, 5% similar, 21% worse
» The best had a delta of 6%, average was 18%, worst was 132%
Compared to all devices tested
» 55% of all tested devices were better, 8% similar, 37% worse
» The best had a delta of 4%, average was 24%, worst was 134%
MSI Vector 16 HX AI A2XWHG audio analysis
(+) | speakers can play relatively loud (86 dB)
Bass 100 - 315 Hz
(±) | reduced bass - on average 12.3% lower than median
(±) | linearity of bass is average (8.5% delta to prev. frequency)
Mids 400 - 2000 Hz
(±) | higher mids - on average 9.9% higher than median
(+) | mids are linear (6.8% delta to prev. frequency)
Highs 2 - 16 kHz
(+) | balanced highs - only 1.8% away from median
(+) | highs are linear (2.9% delta to prev. frequency)
Overall 100 - 16.000 Hz
(±) | linearity of overall sound is average (15.8% difference to median)
Compared to same class
» 37% of all tested devices in this class were better, 7% similar, 56% worse
» The best had a delta of 6%, average was 18%, worst was 132%
Compared to all devices tested
» 24% of all tested devices were better, 5% similar, 71% worse
» The best had a delta of 4%, average was 24%, worst was 134%
能源管理
耗电量
空闲模式下的功耗为 10 至 24 瓦,负载模式下的功耗为 126 至 227 瓦,是该性能级别游戏笔记本电脑的典型功耗,尽管配备 Ryzen AI 7 350 的 Aero 16X 的功耗更为经济。
| Off / Standby | |
| Idle | |
| Load |
|
Key:
min: | |
| MSI Katana 17 HX B14WGK i7-14650HX, GeForce RTX 5070 Laptop | Gigabyte Aero X16 1WH Ryzen AI 7 350, GeForce RTX 5070 Laptop | Asus ProArt P16 H7606WP Ryzen AI 9 HX 370, GeForce RTX 5070 Laptop | Schenker XMG Pro 16 (E25) Ultra 9 275HX, GeForce RTX 5070 Ti Laptop | MSI Vector 16 HX AI A2XWHG Ultra 7 255HX, GeForce RTX 5070 Ti Laptop | Average of class Gaming | |
|---|---|---|---|---|---|---|
| Power Consumption | 37% | 17% | -10% | -9% | -13% | |
| Idle Minimum * (Watt) | 9.7 | 5.8 40% | 9.9 -2% | 11.7 -21% | 7.1 27% | 13.3 ? -37% |
| Idle Average * (Watt) | 15 | 10.9 27% | 13.6 9% | 16.6 -11% | 15.9 -6% | 19 ? -27% |
| Idle Maximum * (Watt) | 23.7 | 11.2 53% | 14 41% | 17.1 28% | 29.5 -24% | 24.5 ? -3% |
| Load Average * (Watt) | 126 | 91.3 28% | 93.8 26% | 122.4 3% | 124 2% | 108.1 ? 14% |
| Cyberpunk 2077 ultra external monitor * (Watt) | 202 | 117.9 42% | 158.3 22% | 241 -19% | 217 -7% | |
| Cyberpunk 2077 ultra * (Watt) | 205 | 123.8 40% | 162.1 21% | 245 -20% | 222 -8% | |
| Load Maximum * (Watt) | 227 | 155.3 32% | 229 -1% | 291.5 -28% | 336 -48% | 254 ? -12% |
* ... smaller is better
Power consumption Cyberpunk / Stress test
Power consumption with the external monitor
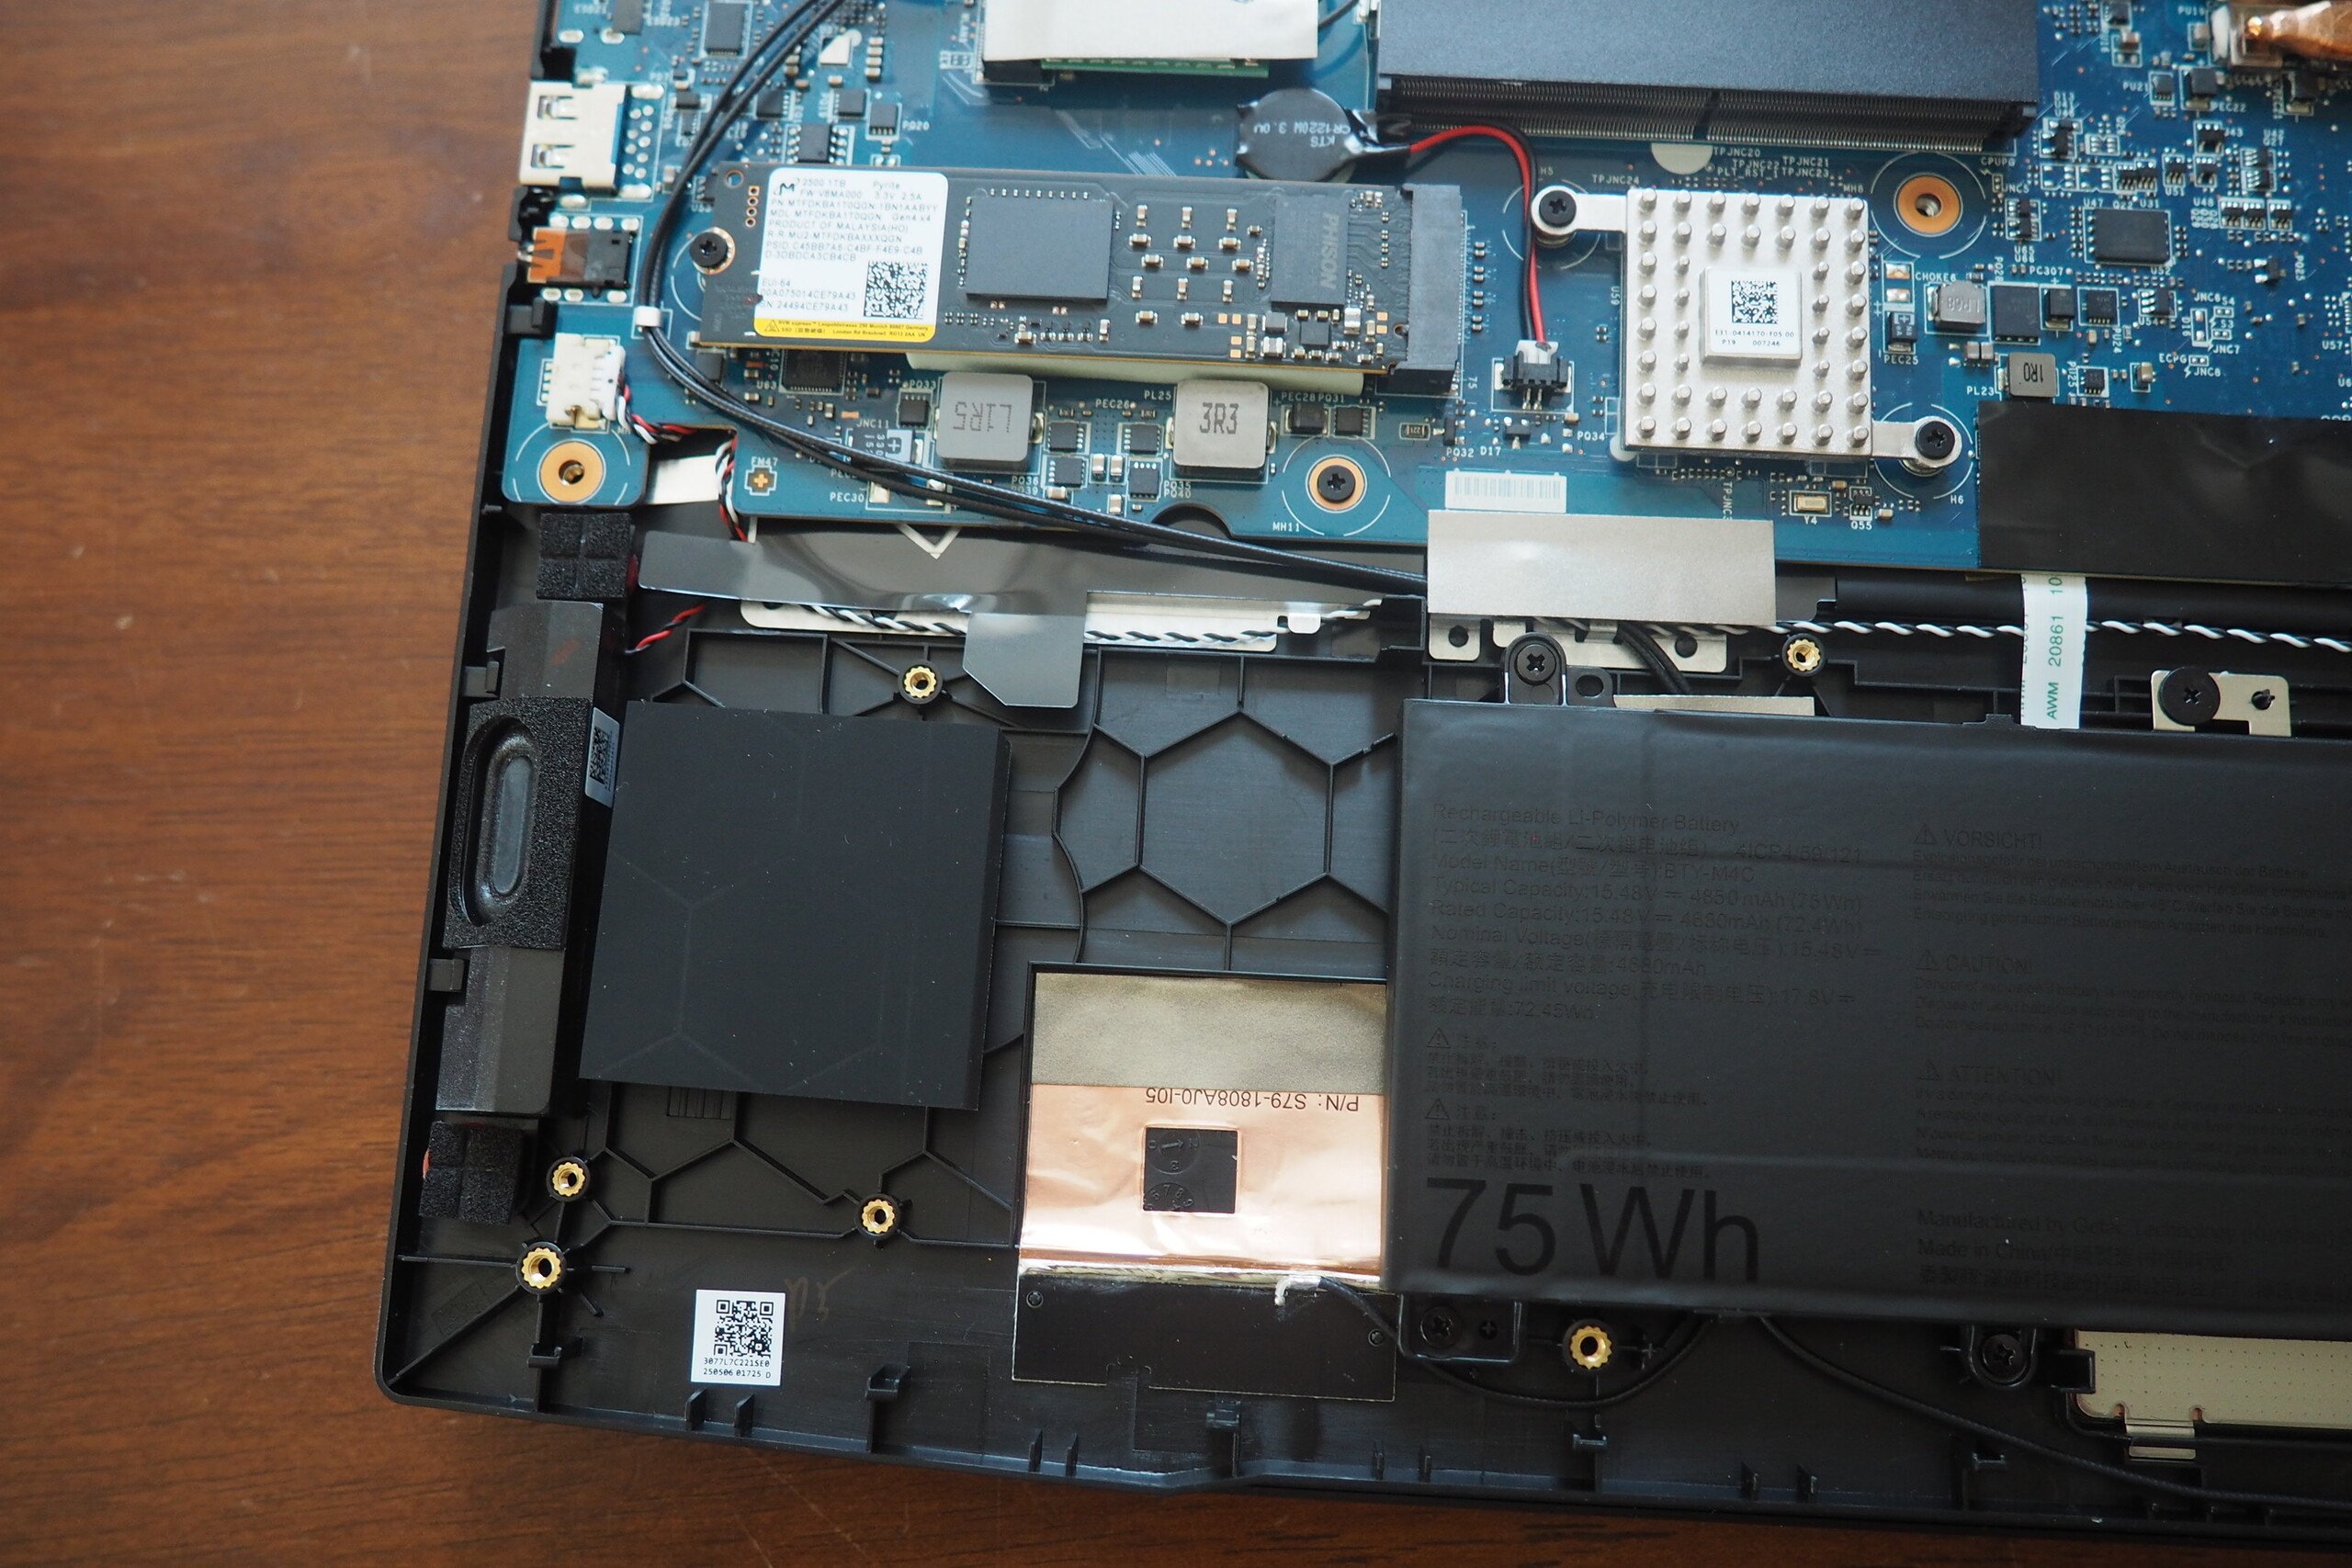
电池寿命
您不应该对电池寿命提出过高的要求。在我们的 WLAN 测试中(亮度降至 150 cd/m²),75 Wh 的电池仅能使用 5 小时左右。相比之下,同类产品能达到 7 至 9 小时。
| MSI Katana 17 HX B14WGK i7-14650HX, GeForce RTX 5070 Laptop, 75 Wh | Gigabyte Aero X16 1WH Ryzen AI 7 350, GeForce RTX 5070 Laptop, 76 Wh | Asus ProArt P16 H7606WP Ryzen AI 9 HX 370, GeForce RTX 5070 Laptop, 90 Wh | Schenker XMG Pro 16 (E25) Ultra 9 275HX, GeForce RTX 5070 Ti Laptop, 99.8 Wh | MSI Vector 16 HX AI A2XWHG Ultra 7 255HX, GeForce RTX 5070 Ti Laptop, 90 Wh | Average of class Gaming | |
|---|---|---|---|---|---|---|
| Battery runtime | ||||||
| WiFi v1.3 (h) | 5.1 | 8.6 69% | 9.2 80% | 9.1 78% | 7 37% | 7.01 ? 37% |
Notebookcheck 总体评分
在 Katana 17 HX B14WGK 上,微星在很多方面都做得太过了,使得这款 17 英寸的游戏机很难在竞争中立于不败之地。
MSI Katana 17 HX B14WGK
- 06/23/2025 v8
Florian Glaser
 Total Sustainability Score:
 Possible competitors comparison
Image | Model / Review | Price | Weight | Height | Display |
|---|---|---|---|---|---|
1. 77.3%  | MSI Katana 17 HX B14WGK Intel Core i7-14650HX ⎘ NVIDIA GeForce RTX 5070 Laptop ⎘ 16 GB Memory, 1024 GB SSD | Amazon: List Price: 1800 EUR | 2.7 kg | 28 mm | 17.30" 2560x1440 170 PPI IPS |
2. 83.7%  | Gigabyte Aero X16 1WH AMD Ryzen AI 7 350 ⎘ NVIDIA GeForce RTX 5070 Laptop ⎘ 32 GB Memory, 1024 GB SSD | Amazon: List Price: 1799€ | 2 kg | 19.9 mm | 16.00" 2560x1600 189 PPI IPS |
3. 89.1%  | Asus ProArt P16 H7606WP AMD Ryzen AI 9 HX 370 ⎘ NVIDIA GeForce RTX 5070 Laptop ⎘ 64 GB Memory, 2048 GB SSD | Amazon: 1. $2,979.99 ASUS ProArt P16 Creator Lapt... 2. $2,999.99 ASUS ProArt P16 Creator Lapt... 3. $4,924.00 HIDevolution [2025] ASUS Pro... List Price: 3399€ | 1.8 kg | 17.3 mm | 16.00" 2880x1800 212 PPI OLED |
4. 87.4%  | Schenker XMG Pro 16 (E25) Intel Core Ultra 9 275HX ⎘ NVIDIA GeForce RTX 5070 Ti Laptop ⎘ 32 GB Memory, 1024 GB SSD | Amazon: List Price: 2480€ | 2.5 kg | 26.5 mm | 16.00" 2560x1600 189 PPI IPS |
5. 84%  | MSI Vector 16 HX AI A2XWHG Intel Core Ultra 7 255HX ⎘ NVIDIA GeForce RTX 5070 Ti Laptop ⎘ 16 GB Memory, 512 GB SSD | Amazon: List Price: 2000 EUR | 2.6 kg | 28.6 mm | 16.00" 2560x1600 189 PPI IPS |
Transparency
The selection of devices to be reviewed is made by our editorial team. The test sample was provided to the author as a loan by the manufacturer or retailer for the purpose of this review. The lender had no influence on this review, nor did the manufacturer receive a copy of this review before publication. There was no obligation to publish this review. As an independent media company, Notebookcheck is not subjected to the authority of manufacturers, retailers or publishers.
This is how Notebookcheck is testing
Every year, Notebookcheck independently reviews hundreds of laptops and smartphones using standardized procedures to ensure that all results are comparable. We have continuously developed our test methods for around 20 years and set industry standards in the process. In our test labs, high-quality measuring equipment is utilized by experienced technicians and editors. These tests involve a multi-stage validation process. Our complex rating system is based on hundreds of well-founded measurements and benchmarks, which maintains objectivity. Further information on our test methods can be found here.
