结论 - 500 欧元的价格差距是否合理?
......(英文 RTX 5070 Ti 版本是搭载该 GPU 的笔记本电脑中速度最快的之一,标准 RTX 5070 型号也是如此--虽然领先对手的优势并不明显。 Alienware 的 16X Aurora甚至还略胜一筹。
两个Legion 版本之间大约相差 500-700 欧元,但 GPU 性能最多可提升 25%。这在纸面上听起来很重要,但实际影响却因游戏而异。此外,Ti 型号还能获得额外的显存,这有助于未来的发展。另一方面,"更小 "的版本运行起来更安静、更凉爽、耗电更少。
即使没有更强大的 GPU,这仍然是一款性能出众的高品质游戏笔记本电脑,而且价格相对适中。
Pros
Cons
- $1,849.00Lenovo Legion Pro 5 16IAX10 Gaming Laptop 2025 16” WQXGA 2560 x 1600 Display IPS Intel Core Ultra 7 255HX NVIDIA GeForce RTX 5070 8GB GDDR7 16GB DDR5 1TB SSD Backlit KB Wi-Fi 7 Windows 11 Home
- $2,129.00Lenovo 2025 Gaming Laptop | Legion Pro 5 | Intel 20-Core Ultra 7 255HX | NVIDIA GeForce RTX 5070 | 32GB DDR5 | 1TB SSD | 16" 2560x1600 165Hz | Win11 Pro - Wi-Fi 7 - BT 5.4 - RGB Backlit KB - Grey
- $1,899.00Lenovo Legion Pro 5 16IAX10 Gaming Laptop 2025 16” WQXGA 2560 x 1600 Display IPS Intel Core Ultra 7 255HX NVIDIA GeForce RTX 5070 8GB GDDR7 16GB DDR5 1TB SSD Backlit KB Wi-Fi 7 Windows 11 Pro
与 RTX 5070 Ti 型号,联想还为Legion Pro 5 16 提供了标准的 RTX 5070.但是,除了在钱包里,用户还能真正感受到它们的区别吗?RTX 5070 Ti 和 RTX 5070 版本的实际性能有多接近?由于系统的其他部分几乎完全相同,我们将重点关注性能、噪音和散热,并参考我们的 原始评测机箱、输入设备和类似部分。
规格
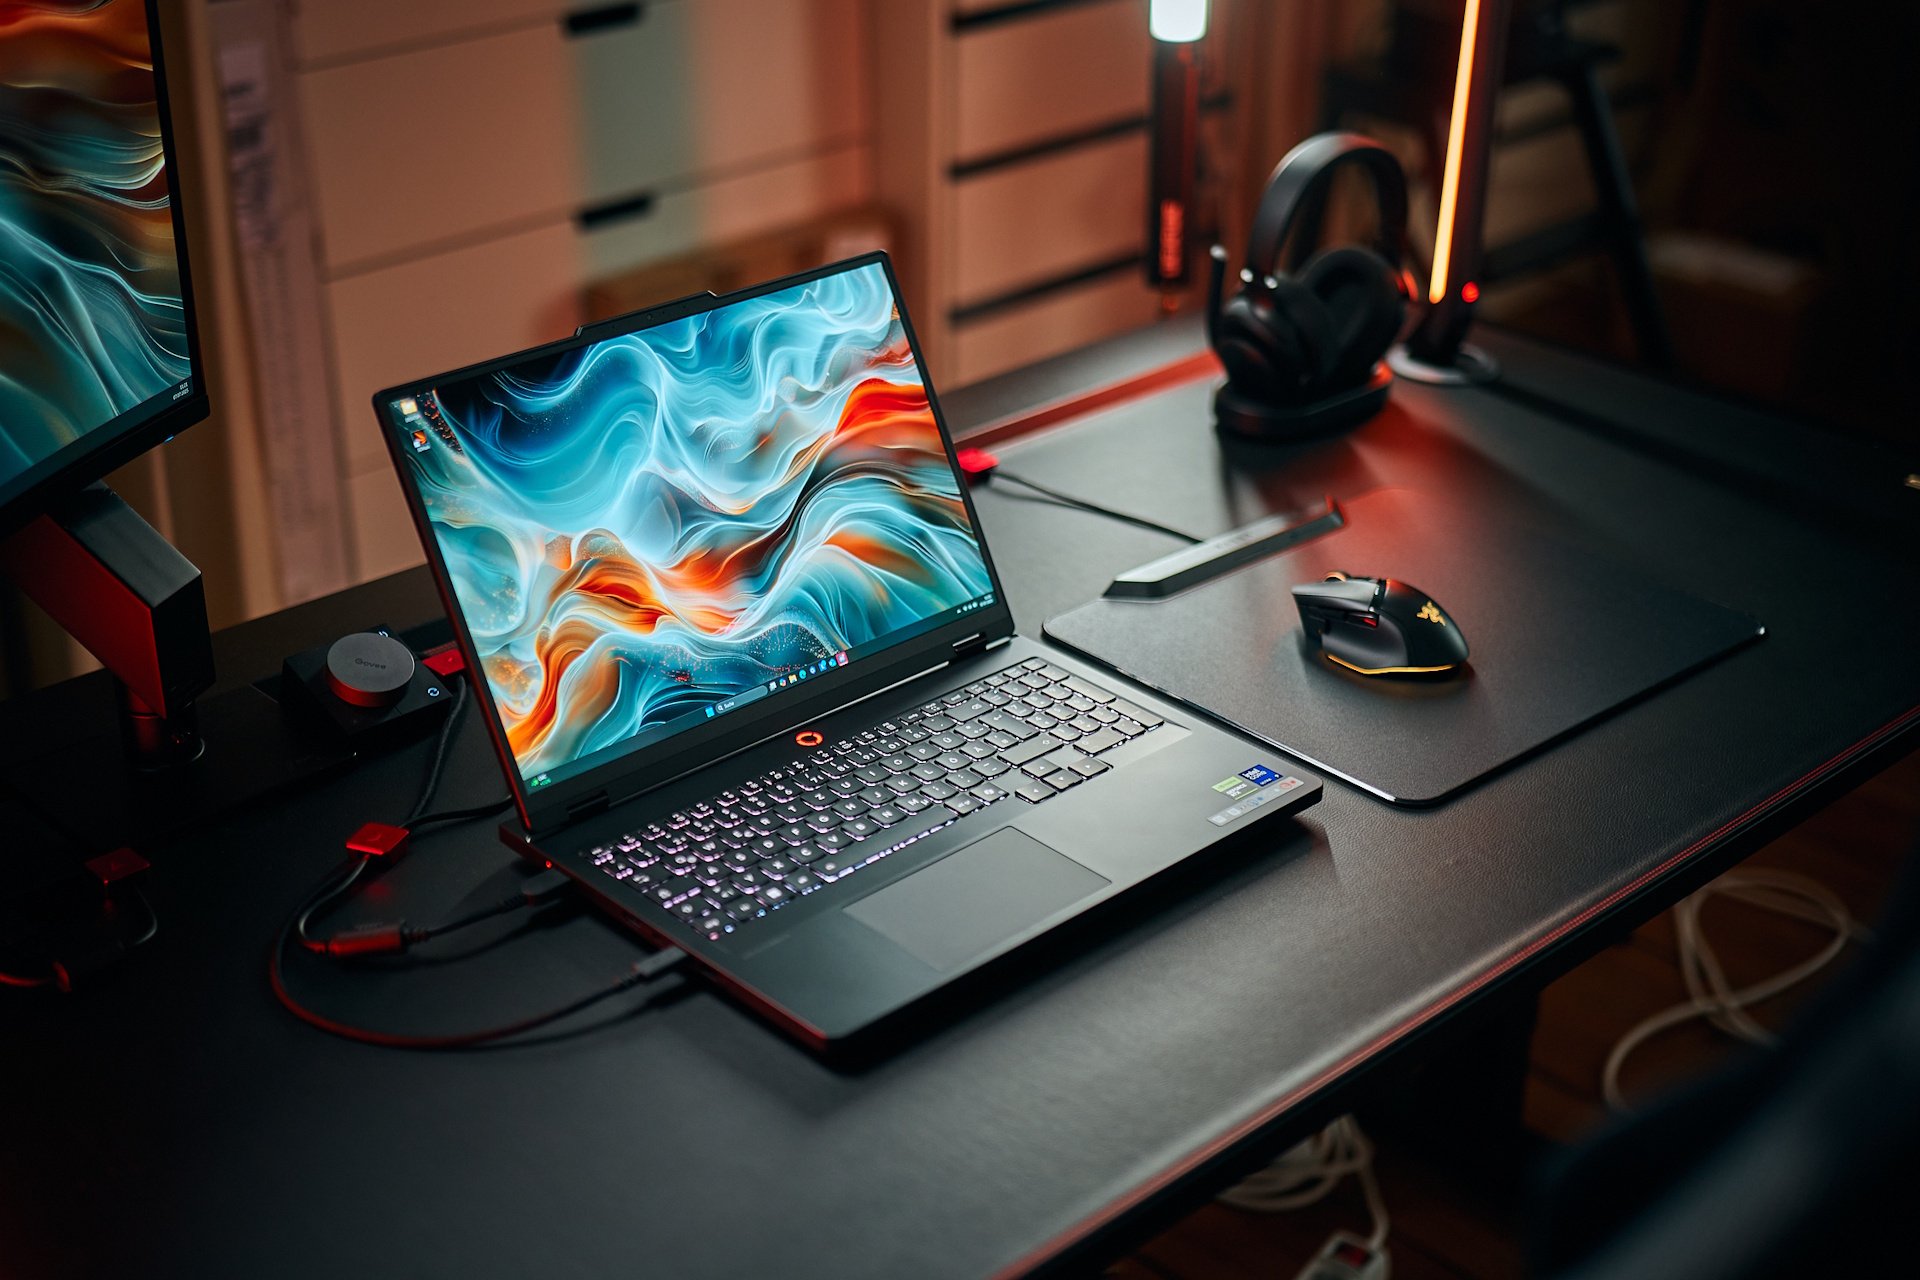
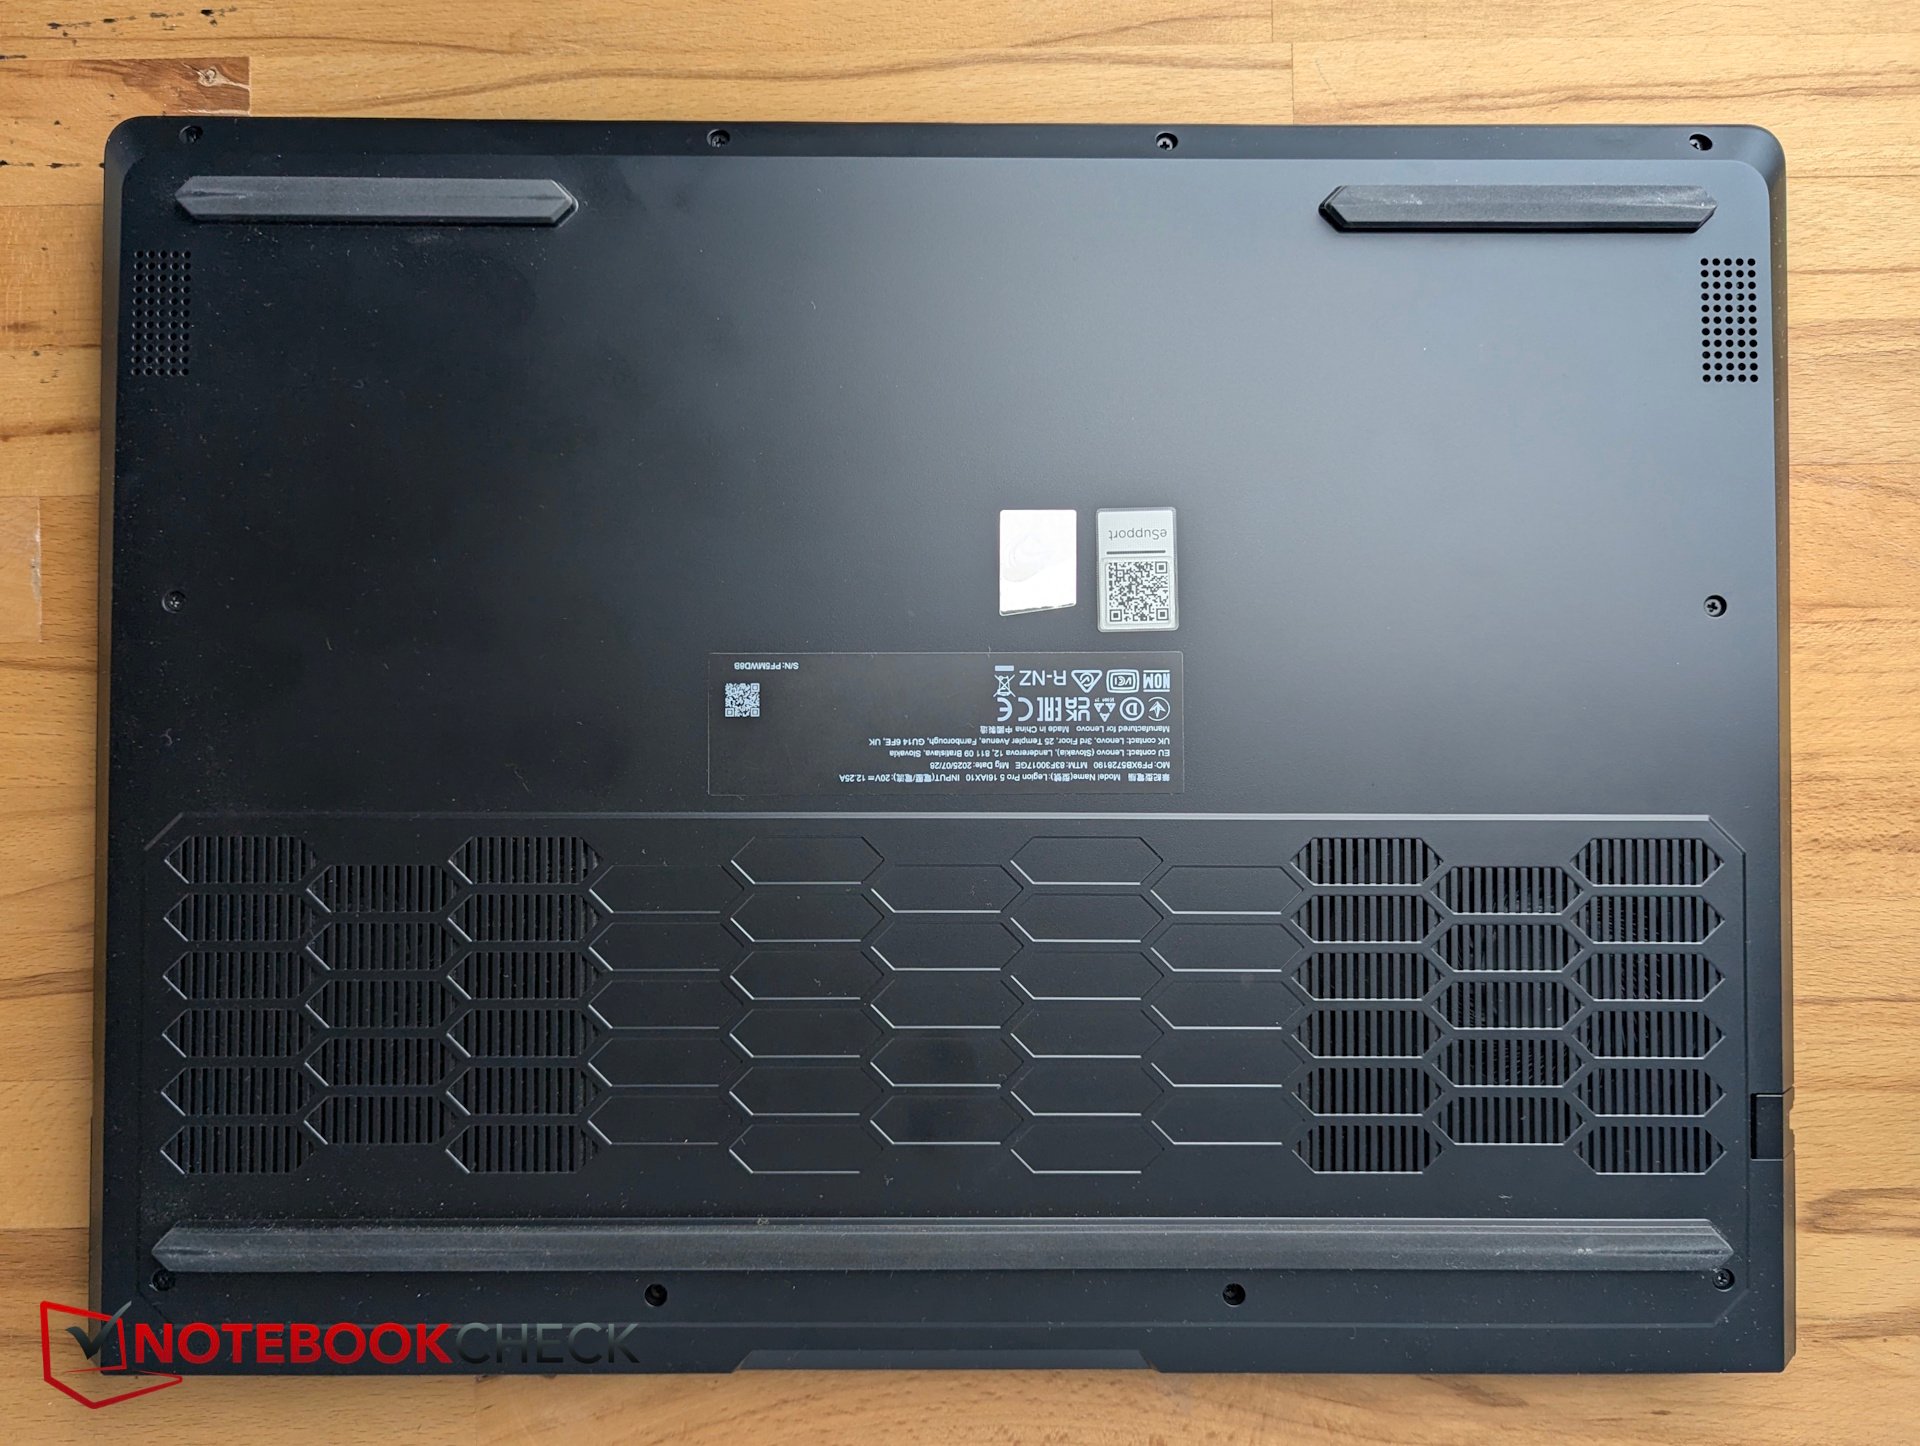
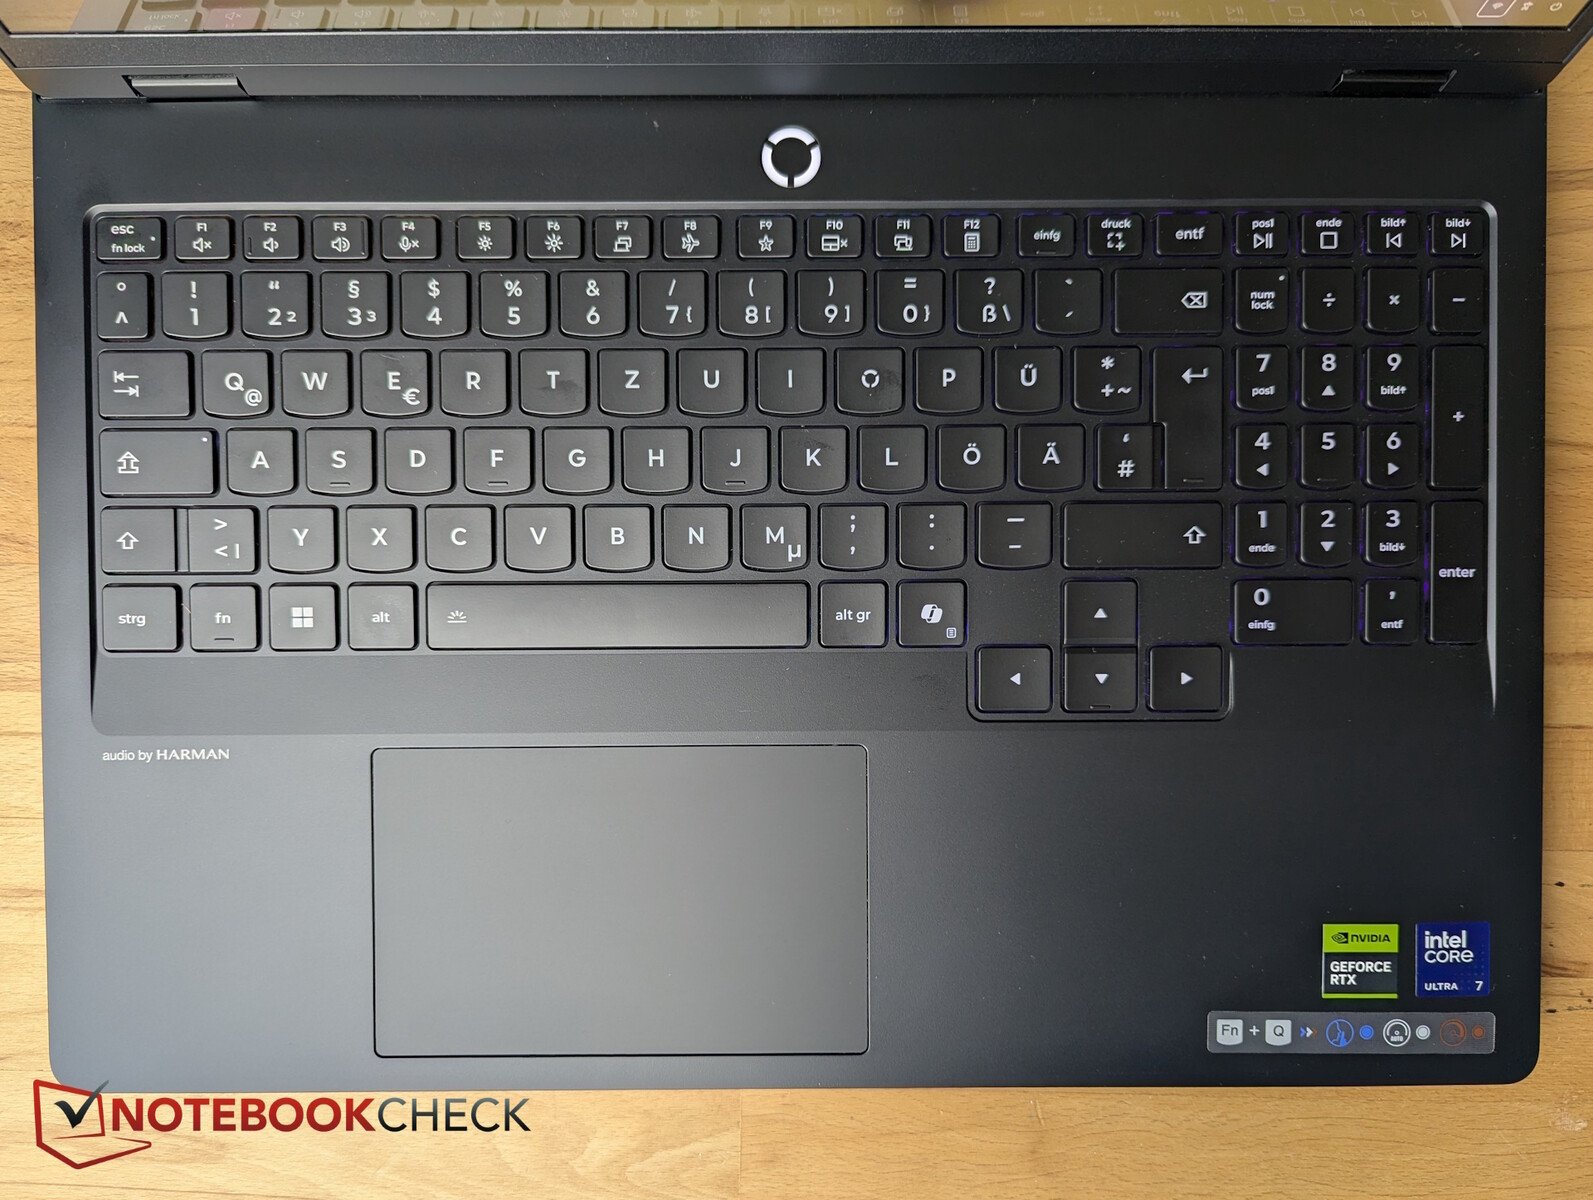
机身和功能 - 时尚,但容易沾染指纹


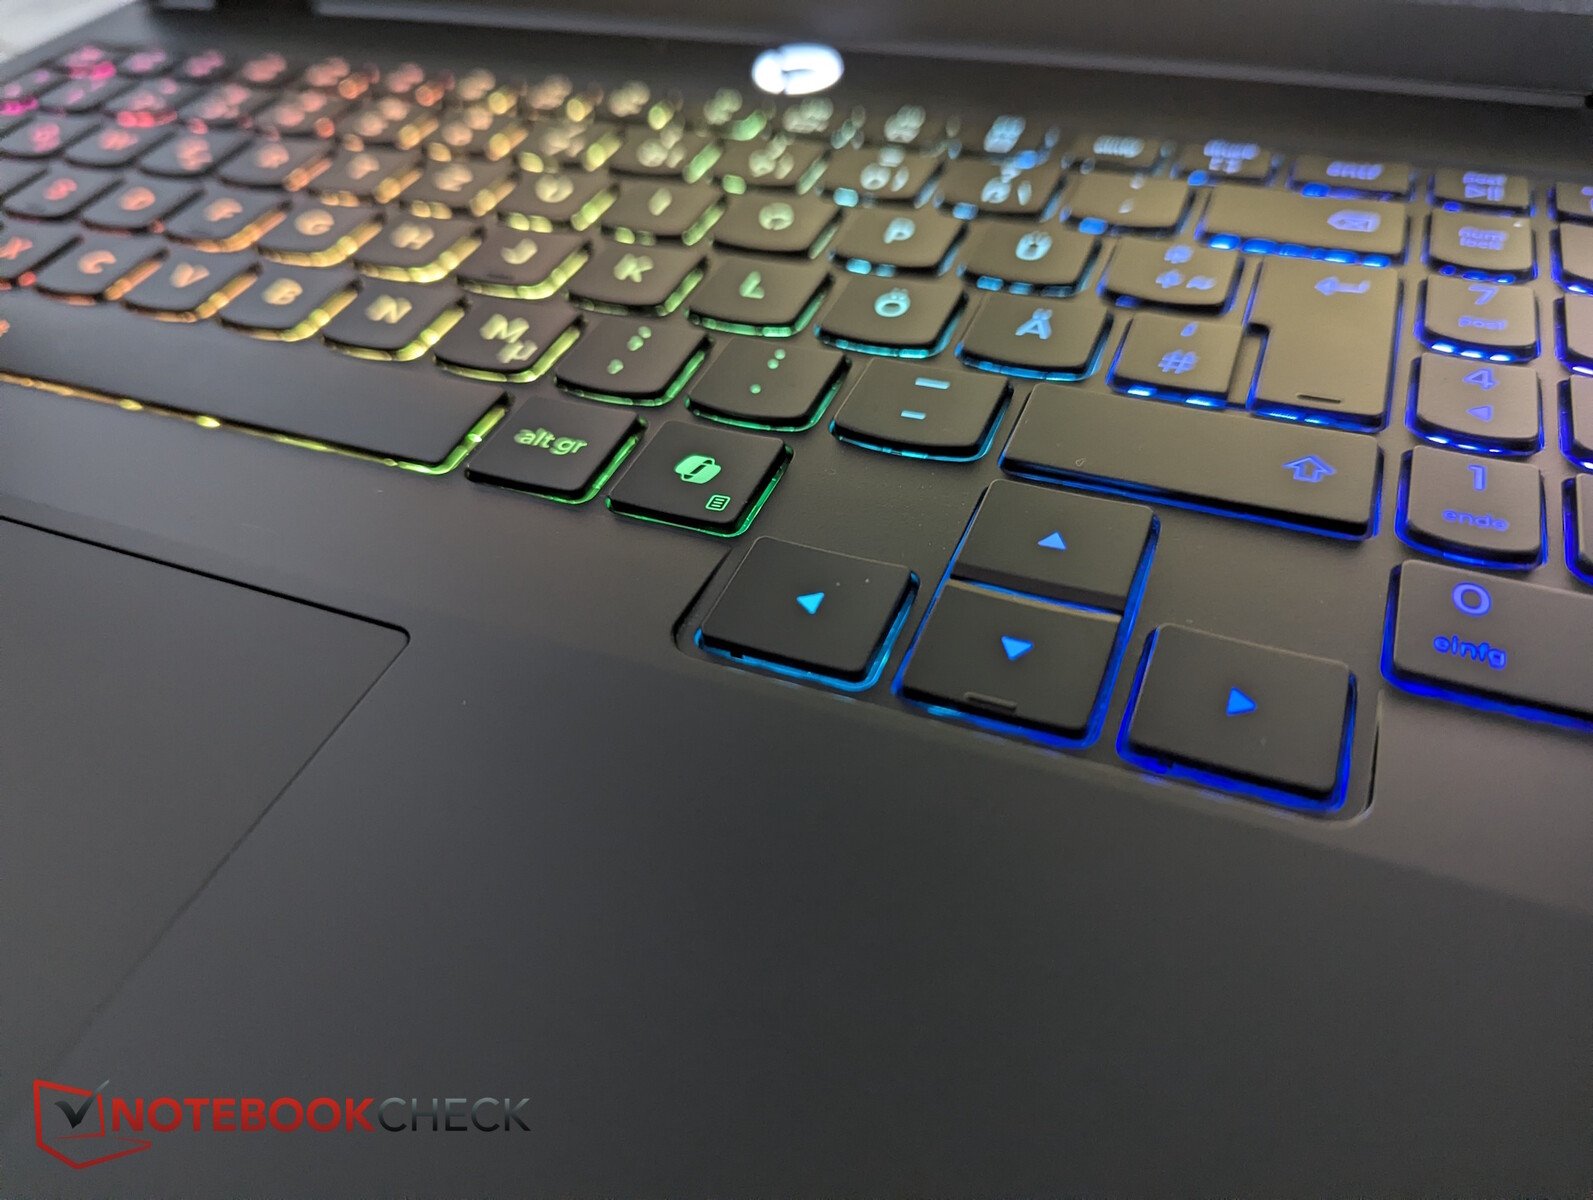
输入设备 - 作为一款游戏笔记本电脑,性能稳定
显示屏--亮丽的 OLED

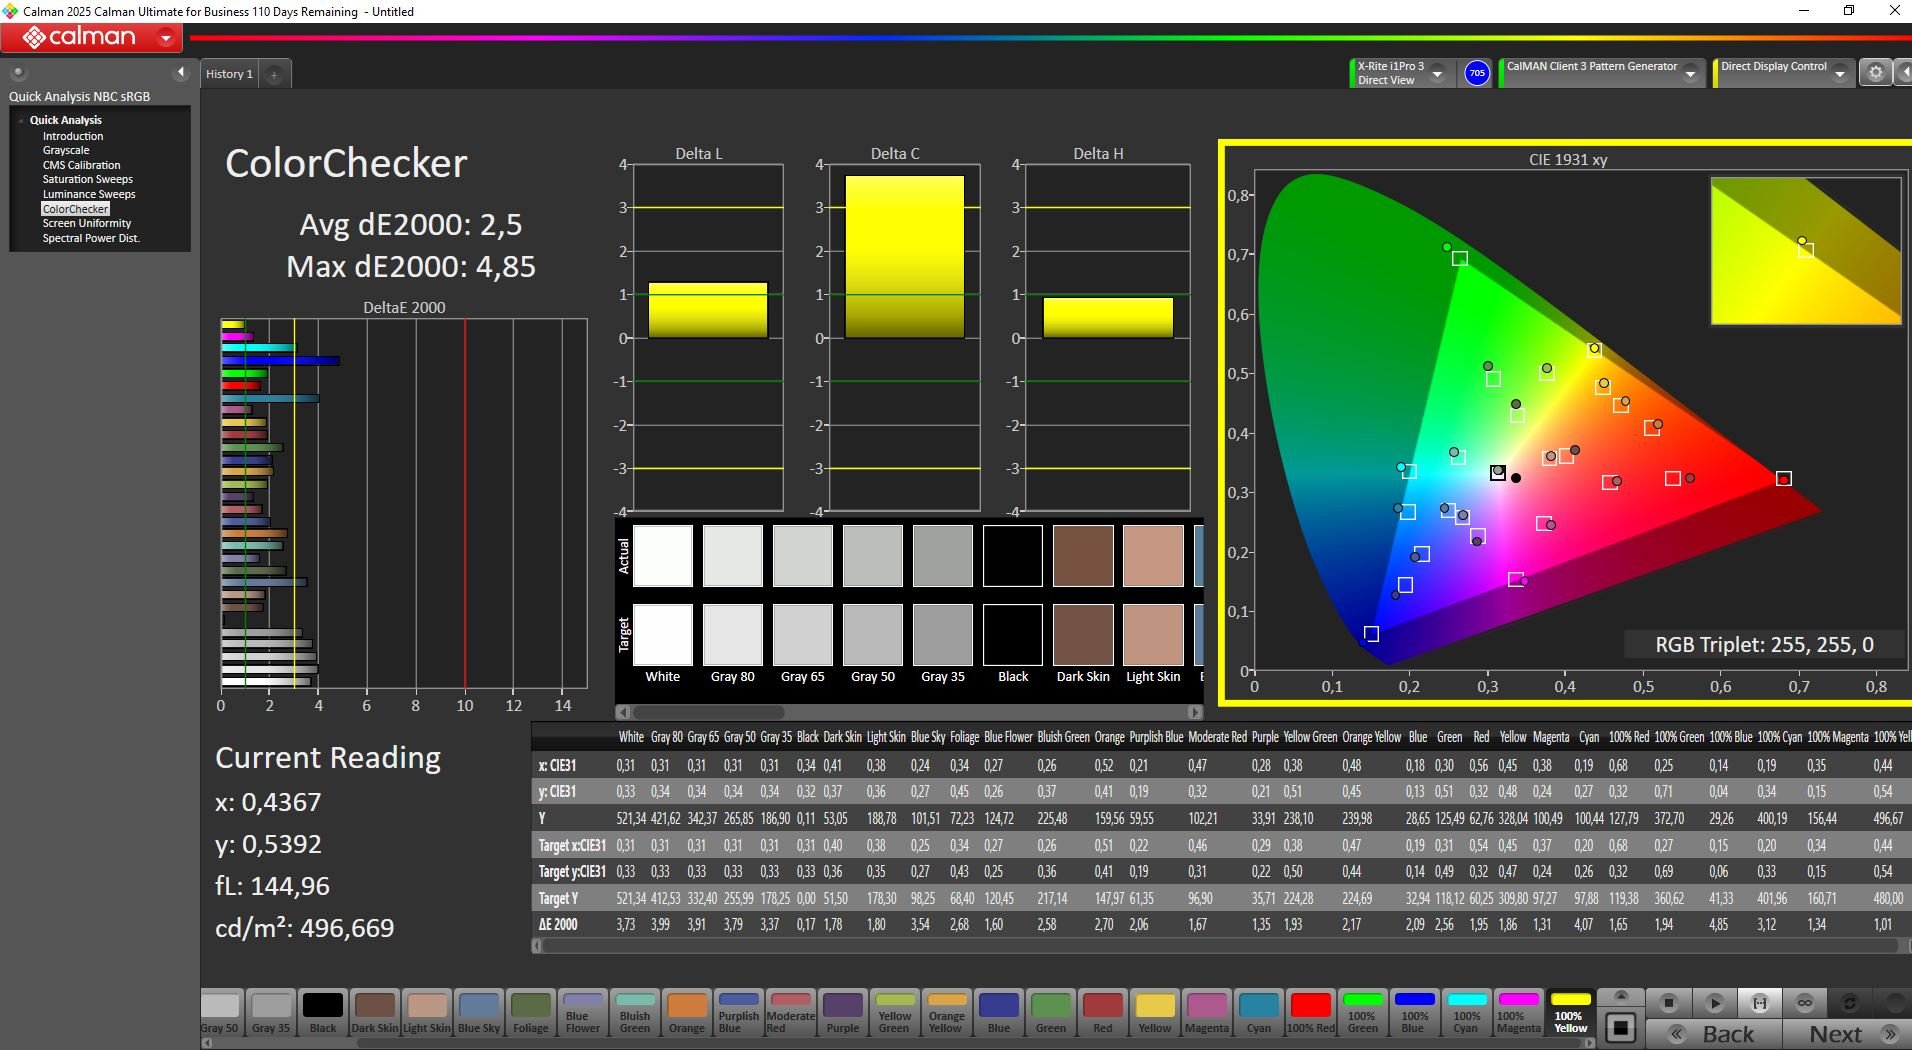
16 英寸 OLED 面板(2560 × 1600 px、DisplayHDR True Black 1000、杜比视界、G-SYNC)是Legion Pro 5 的突出特点之一。
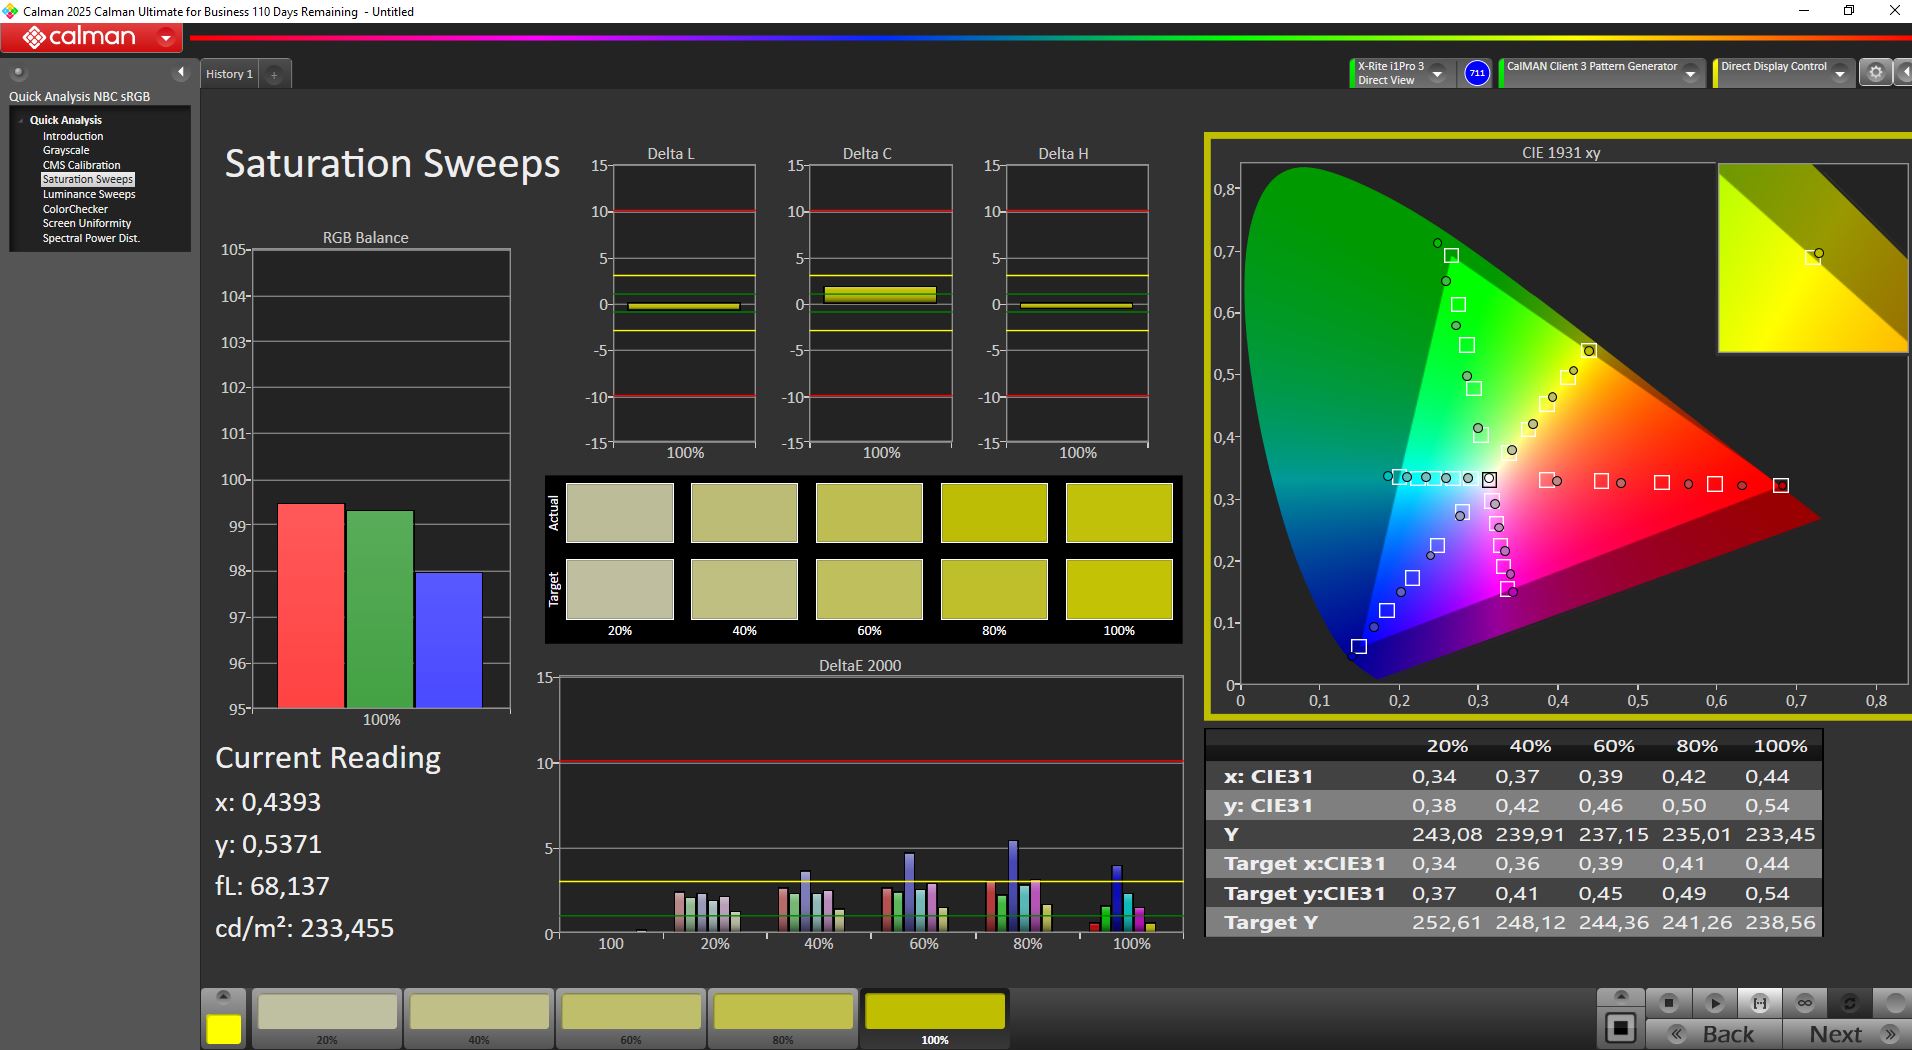
在同类竞争产品中,OLEDLegion 的显示效果是最好的:亮度超过 500 尼特,响应时间快,色彩覆盖面广,对比度深,在这个价位的游戏笔记本电脑中很少有这样的产品。
| |||||||||||||||||||||||||
Brightness Distribution: 98 %
Center on Battery: 521 cd/m²
Contrast: 6947:1 (Black: 0.075 cd/m²)
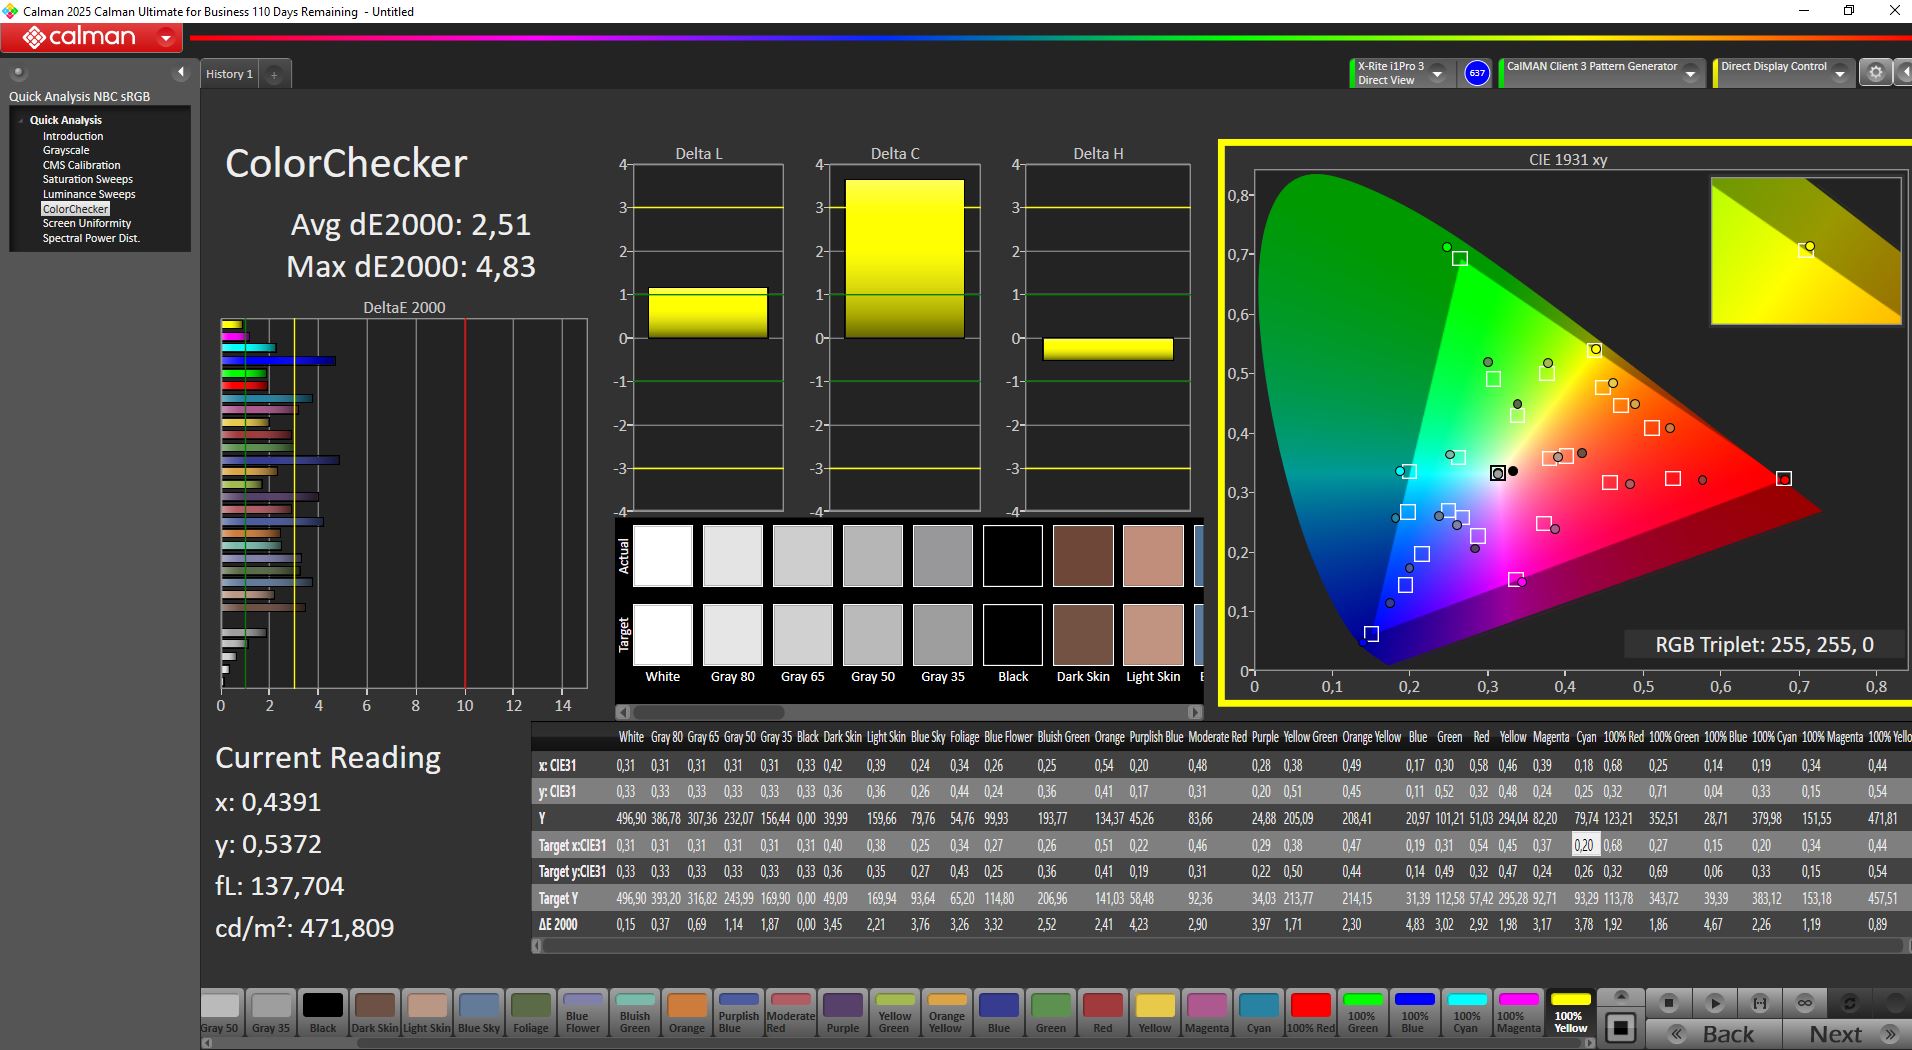
ΔE ColorChecker Calman: 2.5 | ∀{0.5-29.43 Ø4.71}
calibrated: 2.5
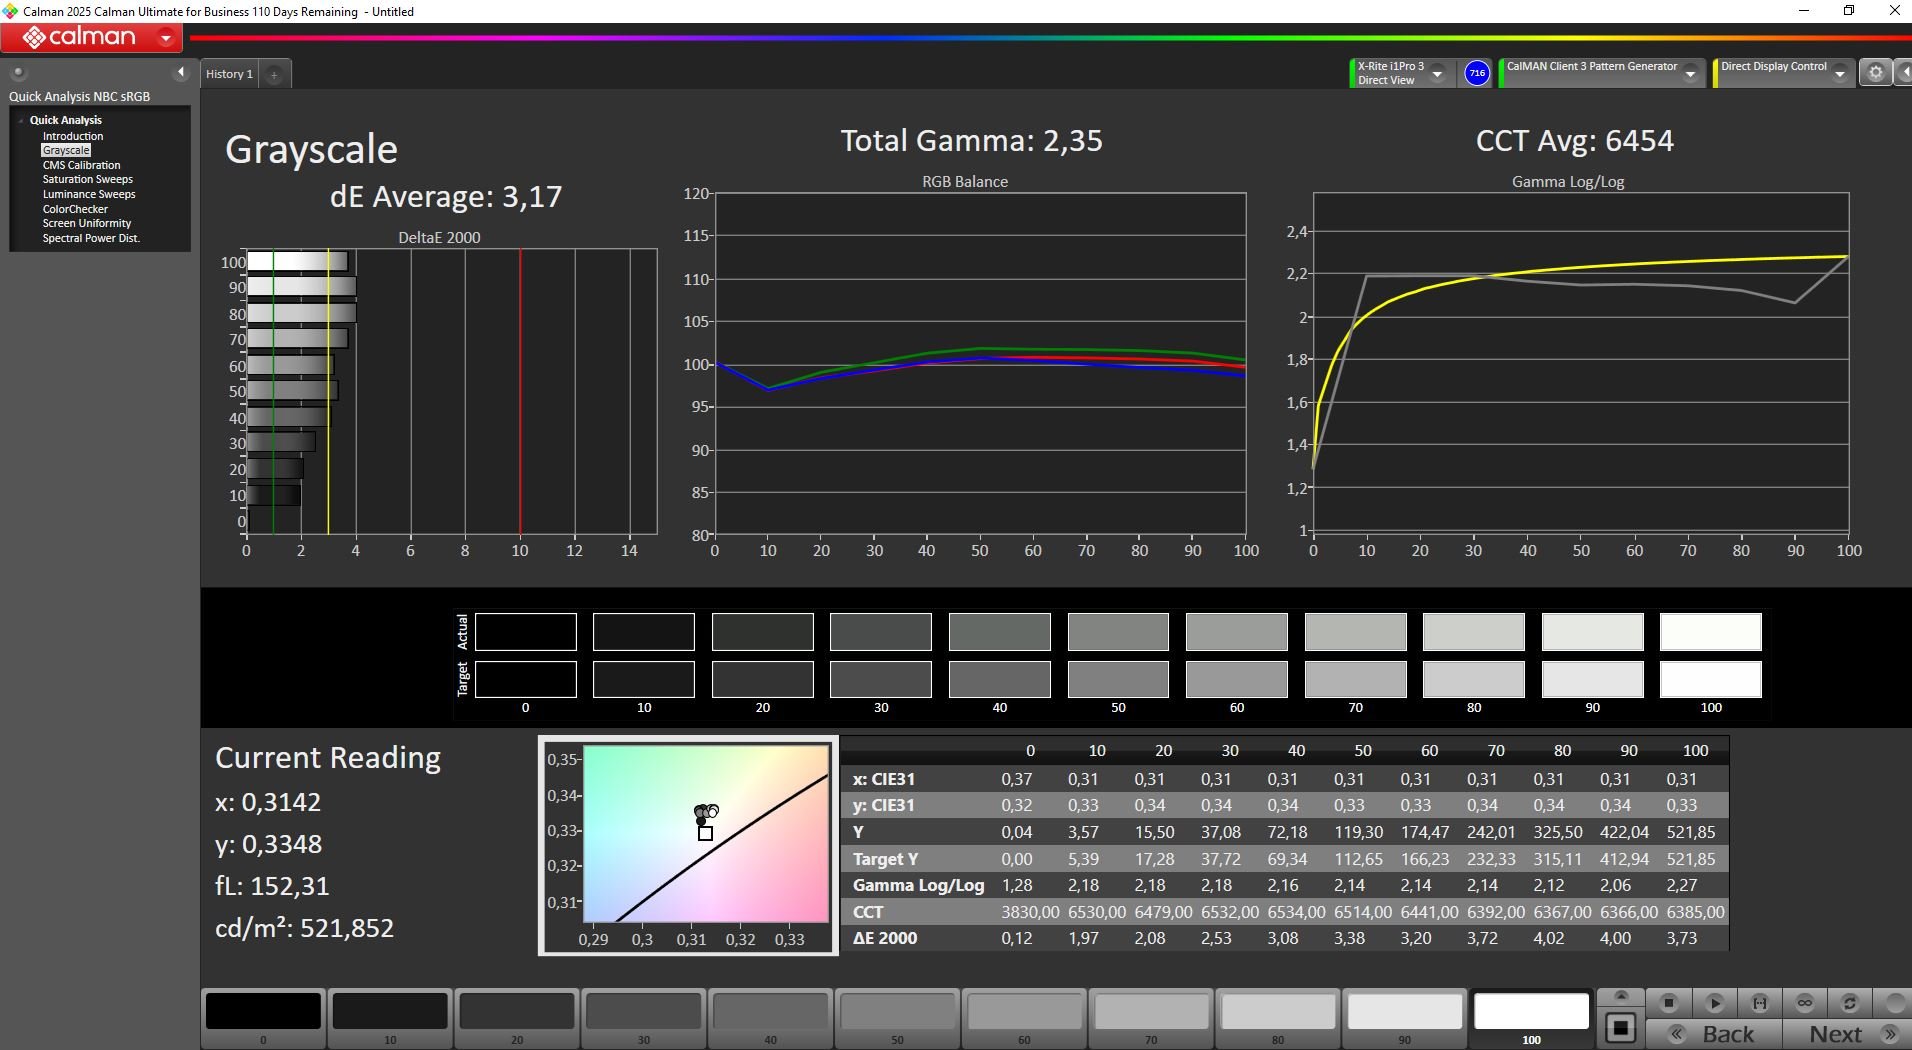
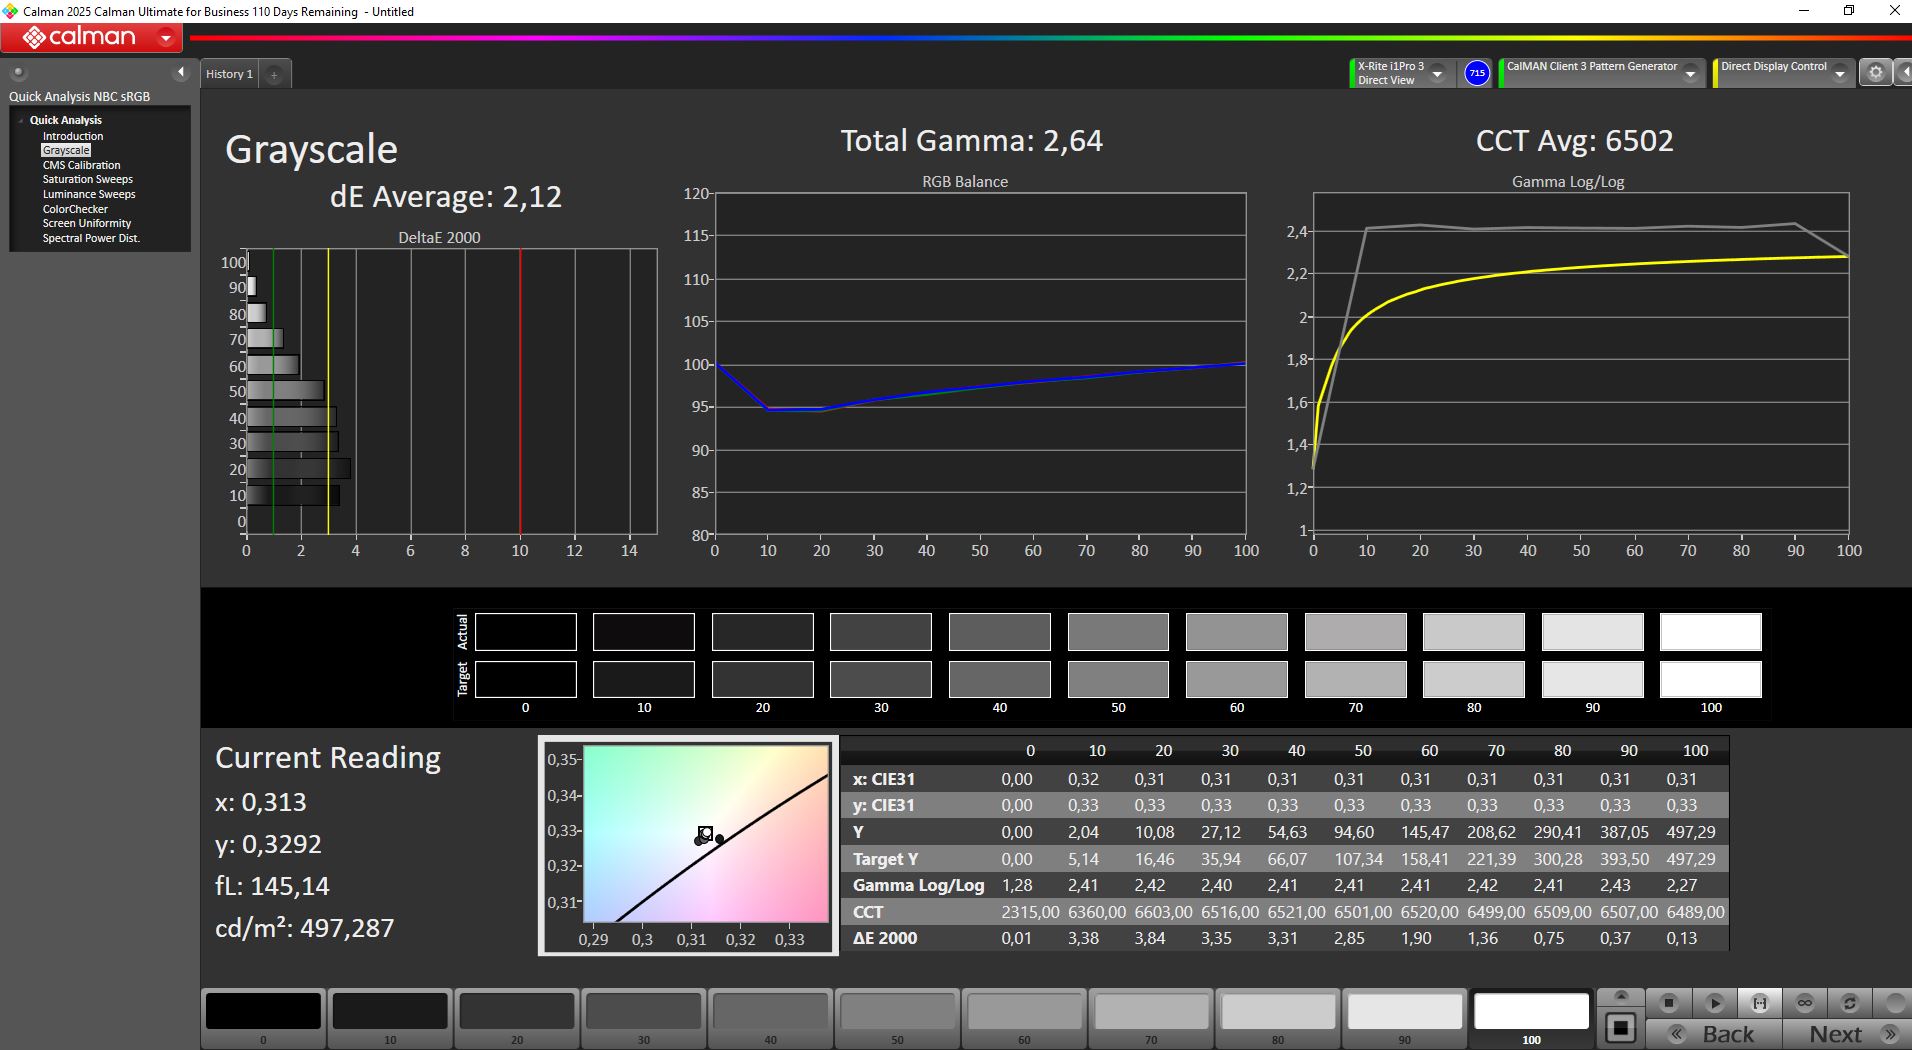
ΔE Greyscale Calman: 3.17 | ∀{0.09-98 Ø4.96}
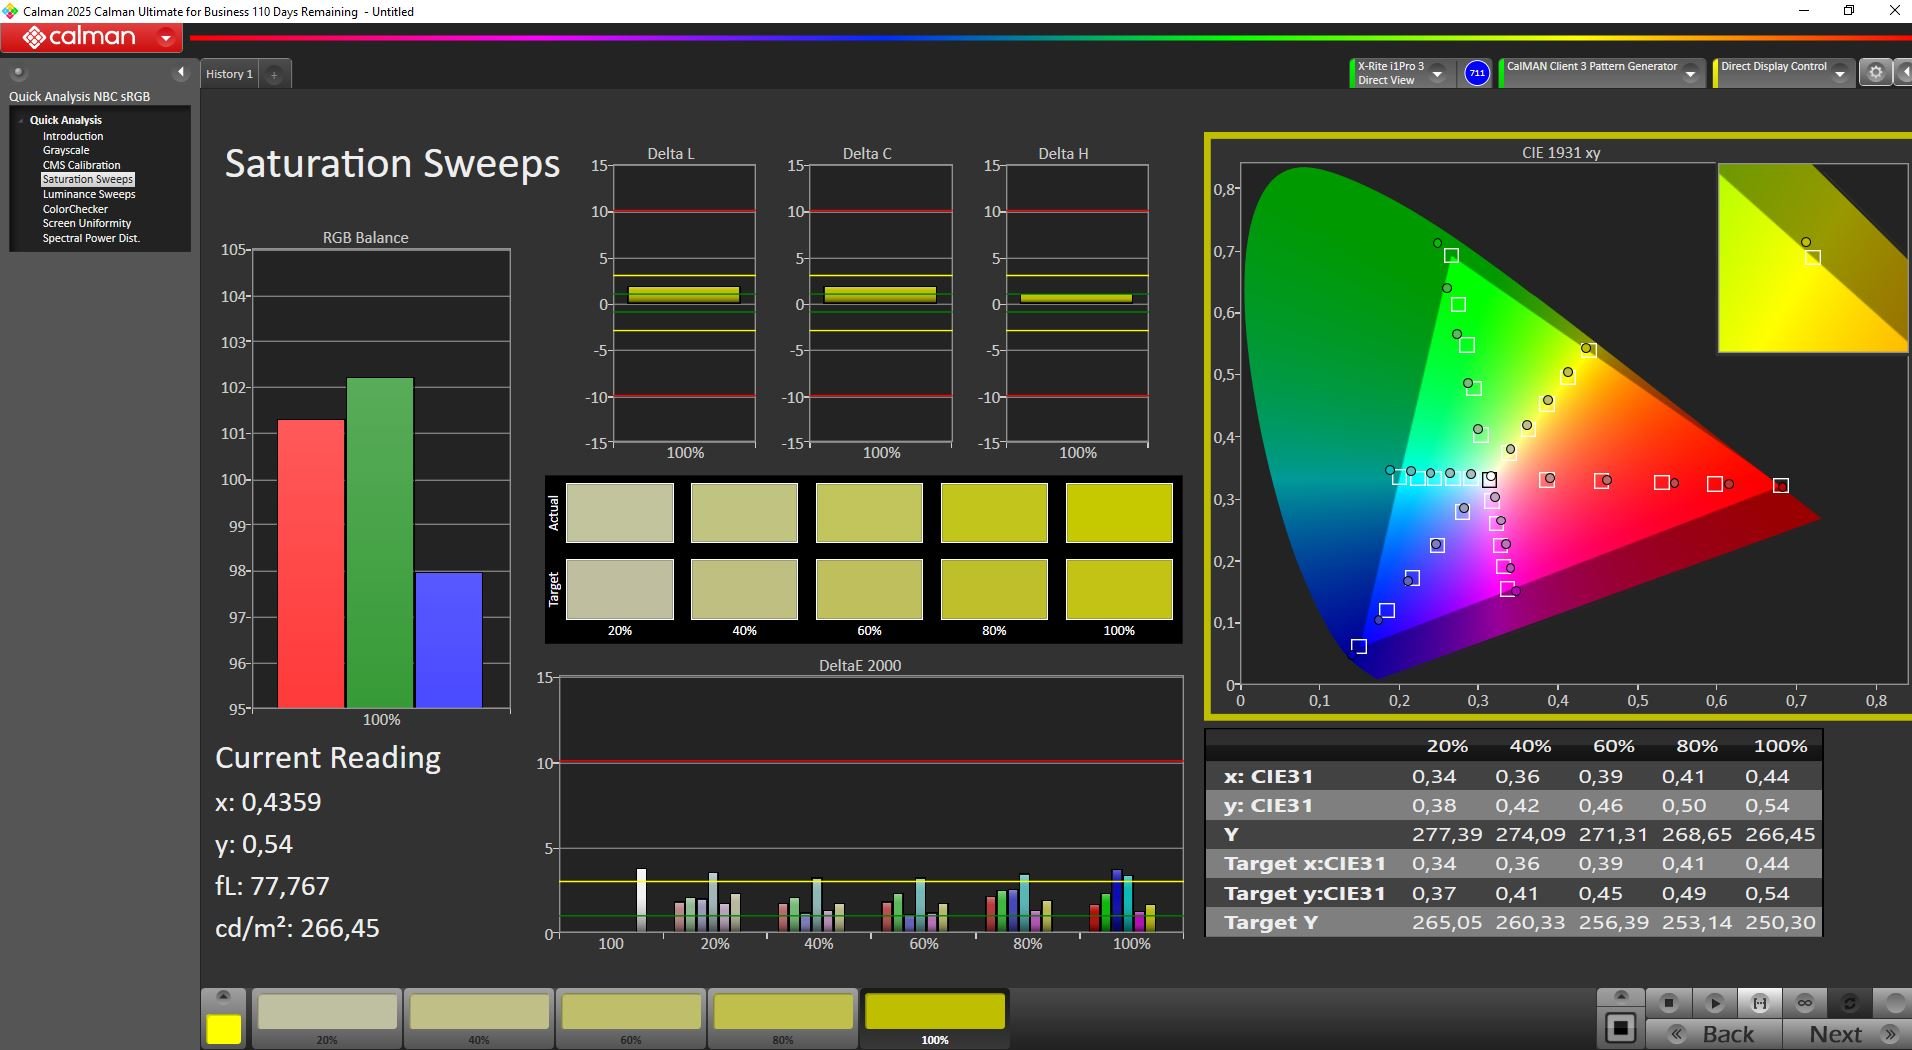
93.9% AdobeRGB 1998 (Argyll 3D)
100% sRGB (Argyll 3D)
99.3% Display P3 (Argyll 3D)
Gamma: 2.35
CCT: 6454 K
| Lenovo Legion Pro 5 16IAX10, RTX 5070 ATNA60HS01-0 (Samsung SDC420A), OLED, 2650x1600, 16", 165 Hz | Lenovo Legion 5 Pro 16IAX10H ATNA60HS01-0 (Samsung SDC420A), OLED, 2560x1600, 16", 165 Hz | Alienware 16X Aurora, RTX 5070 LG Philips 160WQG, IPS, 2560x1600, 16", 240 Hz | Gigabyte Aero X16 1WH MNG007DA5-1, IPS, 2560x1600, 16", 165 Hz | Asus TUF Gaming A16 FA608UP MNG007DA5-3, IPS, 2560x1600, 16", 165 Hz | Schenker XMG Core 16 M25 MNG007DA6-4, IPS, 2560x1600, 16", 300 Hz | Gigabyte Gaming A16 GA6H NE160QDM-NYJ (BOE0C80), IPS, 2560x1600, 16", 165 Hz | |
|---|---|---|---|---|---|---|---|
| Display | 0% | -2% | -20% | -19% | -2% | -18% | |
| Display P3 Coverage (%) | 99.3 | 99.9 1% | 96.9 -2% | 68.7 -31% | 69.4 -30% | 98.8 -1% | 69.4 -30% |
| sRGB Coverage (%) | 100 | 100 0% | 99.8 0% | 96.1 -4% | 97.2 -3% | 100 0% | 99.5 0% |
| AdobeRGB 1998 Coverage (%) | 93.9 | 94.1 0% | 89.7 -4% | 71.2 -24% | 71.9 -23% | 88.4 -6% | 71.6 -24% |
| Response Times | 0% | -318% | -400% | -229% | -343% | -508% | |
| Response Time Grey 50% / Grey 80% * (ms) | 2 ? | 2 ? -0% | 4.3 ? -115% | 12 ? -500% | 6.3 ? -215% | 10.7 ? -435% | 14.3 ? -615% |
| Response Time Black / White * (ms) | 1.4 ? | 1.4 ? -0% | 8.7 ? -521% | 5.6 ? -300% | 4.8 ? -243% | 4.9 ? -250% | 7 ? -400% |
| PWM Frequency (Hz) | 1300 | 1300 | |||||
| PWM Amplitude * (%) | 16.7 | 16.7 -0% | |||||
| Screen | 1% | -78% | -31% | -26% | -53% | -81% | |
| Brightness middle (cd/m²) | 521 | 518 -1% | 493.2 -5% | 395 -24% | 480 -8% | 512 -2% | 432 -17% |
| Brightness (cd/m²) | 519 | 522 1% | 477 -8% | 398 -23% | 456 -12% | 483 -7% | 425 -18% |
| Brightness Distribution (%) | 98 | 97 -1% | 93 -5% | 97 -1% | 91 -7% | 91 -7% | 91 -7% |
| Black Level * (cd/m²) | 0.075 | 0.5 -567% | 0.32 -327% | 0.32 -327% | 0.43 -473% | 0.37 -393% | |
| Contrast (:1) | 6947 | 986 -86% | 1234 -82% | 1500 -78% | 1191 -83% | 1168 -83% | |
| Colorchecker dE 2000 * | 2.5 | 2.49 -0% | 3.57 -43% | 1.3 48% | 1.4 44% | 2.4 4% | 4.76 -90% |
| Colorchecker dE 2000 max. * | 4.85 | 5.25 -8% | 7.03 -45% | 2.8 42% | 2.5 48% | 3.8 22% | 8.59 -77% |
| Colorchecker dE 2000 calibrated * | 2.5 | 2.15 14% | 0.68 73% | 1.4 44% | 1.3 48% | 0.9 64% | 1.18 53% |
| Greyscale dE 2000 * | 3.17 | 3.02 5% | 3.7 -17% | 1.8 43% | 1.2 62% | 3.1 2% | 6.2 -96% |
| Gamma | 2.35 94% | 2.37 93% | 2.16 102% | 2.2 100% | 2.16 102% | 2.41 91% | 2.079 106% |
| CCT | 6454 101% | 6426 101% | 5876 111% | 6842 95% | 6620 98% | 6534 99% | 6690 97% |
| Total Average (Program / Settings) | 0% /
1% | -133% /
-96% | -150% /
-81% | -91% /
-53% | -133% /
-84% | -202% /
-128% |
* ... smaller is better
出厂校准已经非常出色;我们的手动微调略微改善了灰度,色彩偏差仍保持在中低水平。
Display Response Times
| ↔ Response Time Black to White | ||
|---|---|---|
| 1.4 ms ... rise ↗ and fall ↘ combined | ↗ 0.8 ms rise |  |
| ↘ 0.6 ms fall | ||
| The screen shows very fast response rates in our tests and should be very well suited for fast-paced gaming. In comparison, all tested devices range from 0.1 (minimum) to 240 (maximum) ms. » 8 % of all devices are better. This means that the measured response time is better than the average of all tested devices (19.8 ms). | ||
| ↔ Response Time 50% Grey to 80% Grey | ||
| 2 ms ... rise ↗ and fall ↘ combined | ↗ 1 ms rise |  |
| ↘ 1 ms fall | ||
| The screen shows very fast response rates in our tests and should be very well suited for fast-paced gaming. In comparison, all tested devices range from 0.165 (minimum) to 636 (maximum) ms. » 10 % of all devices are better. This means that the measured response time is better than the average of all tested devices (31 ms). | ||
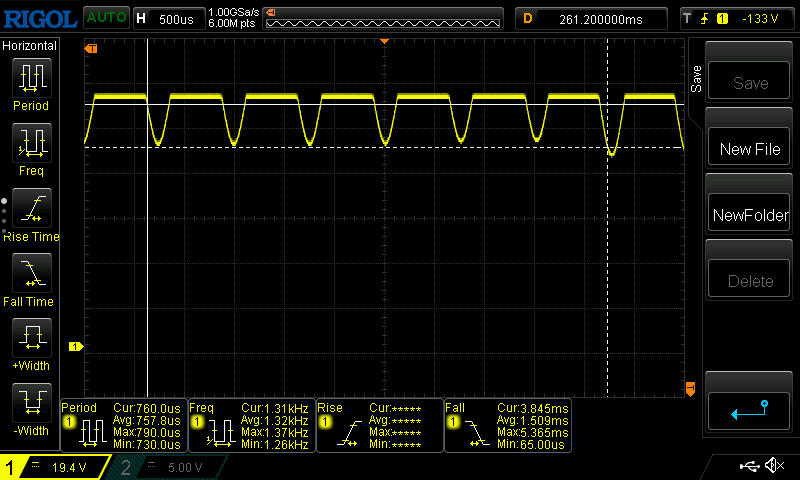
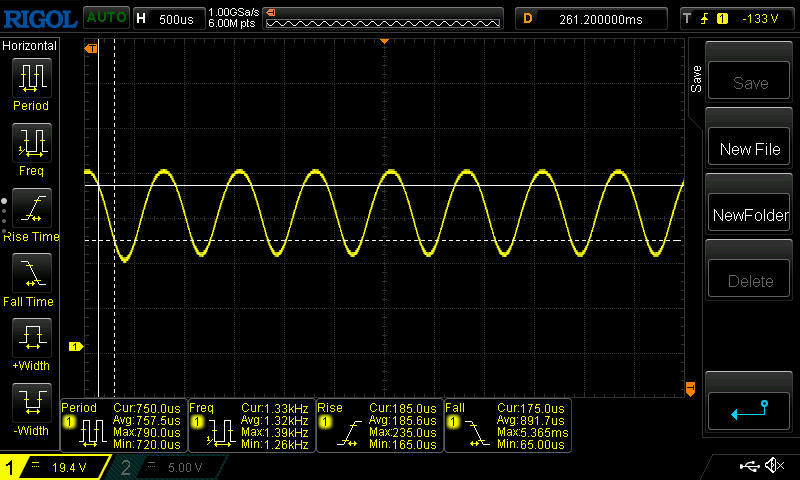
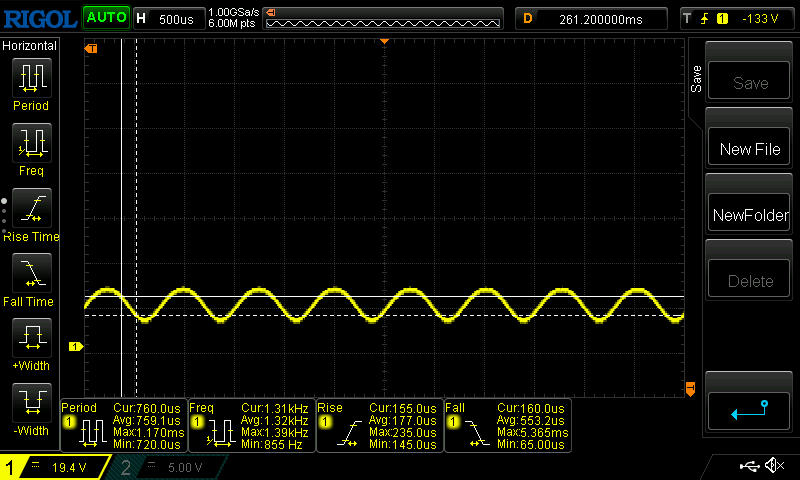
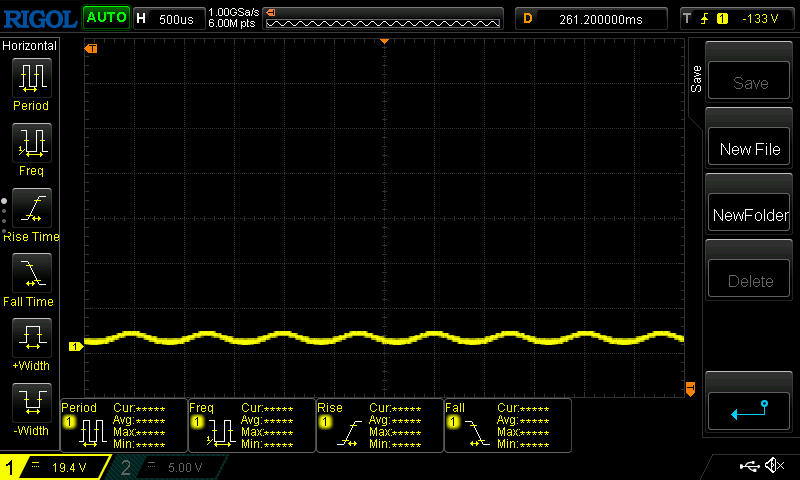
Screen Flickering / PWM (Pulse-Width Modulation)
| Screen flickering / PWM detected | 1300 Hz Amplitude: 16.7 % |  | |
The display backlight flickers at 1300 Hz (worst case, e.g., utilizing PWM) . The frequency of 1300 Hz is quite high, so most users sensitive to PWM should not notice any flickering. In comparison: 52 % of all tested devices do not use PWM to dim the display. If PWM was detected, an average of 7747 (minimum: 5 - maximum: 343500) Hz was measured. | |||
500 尼特的亮度有助于户外使用,但光亮的表面则不然。在阴凉处使用,并尽量减少直接反射,户外使用效果也不错。


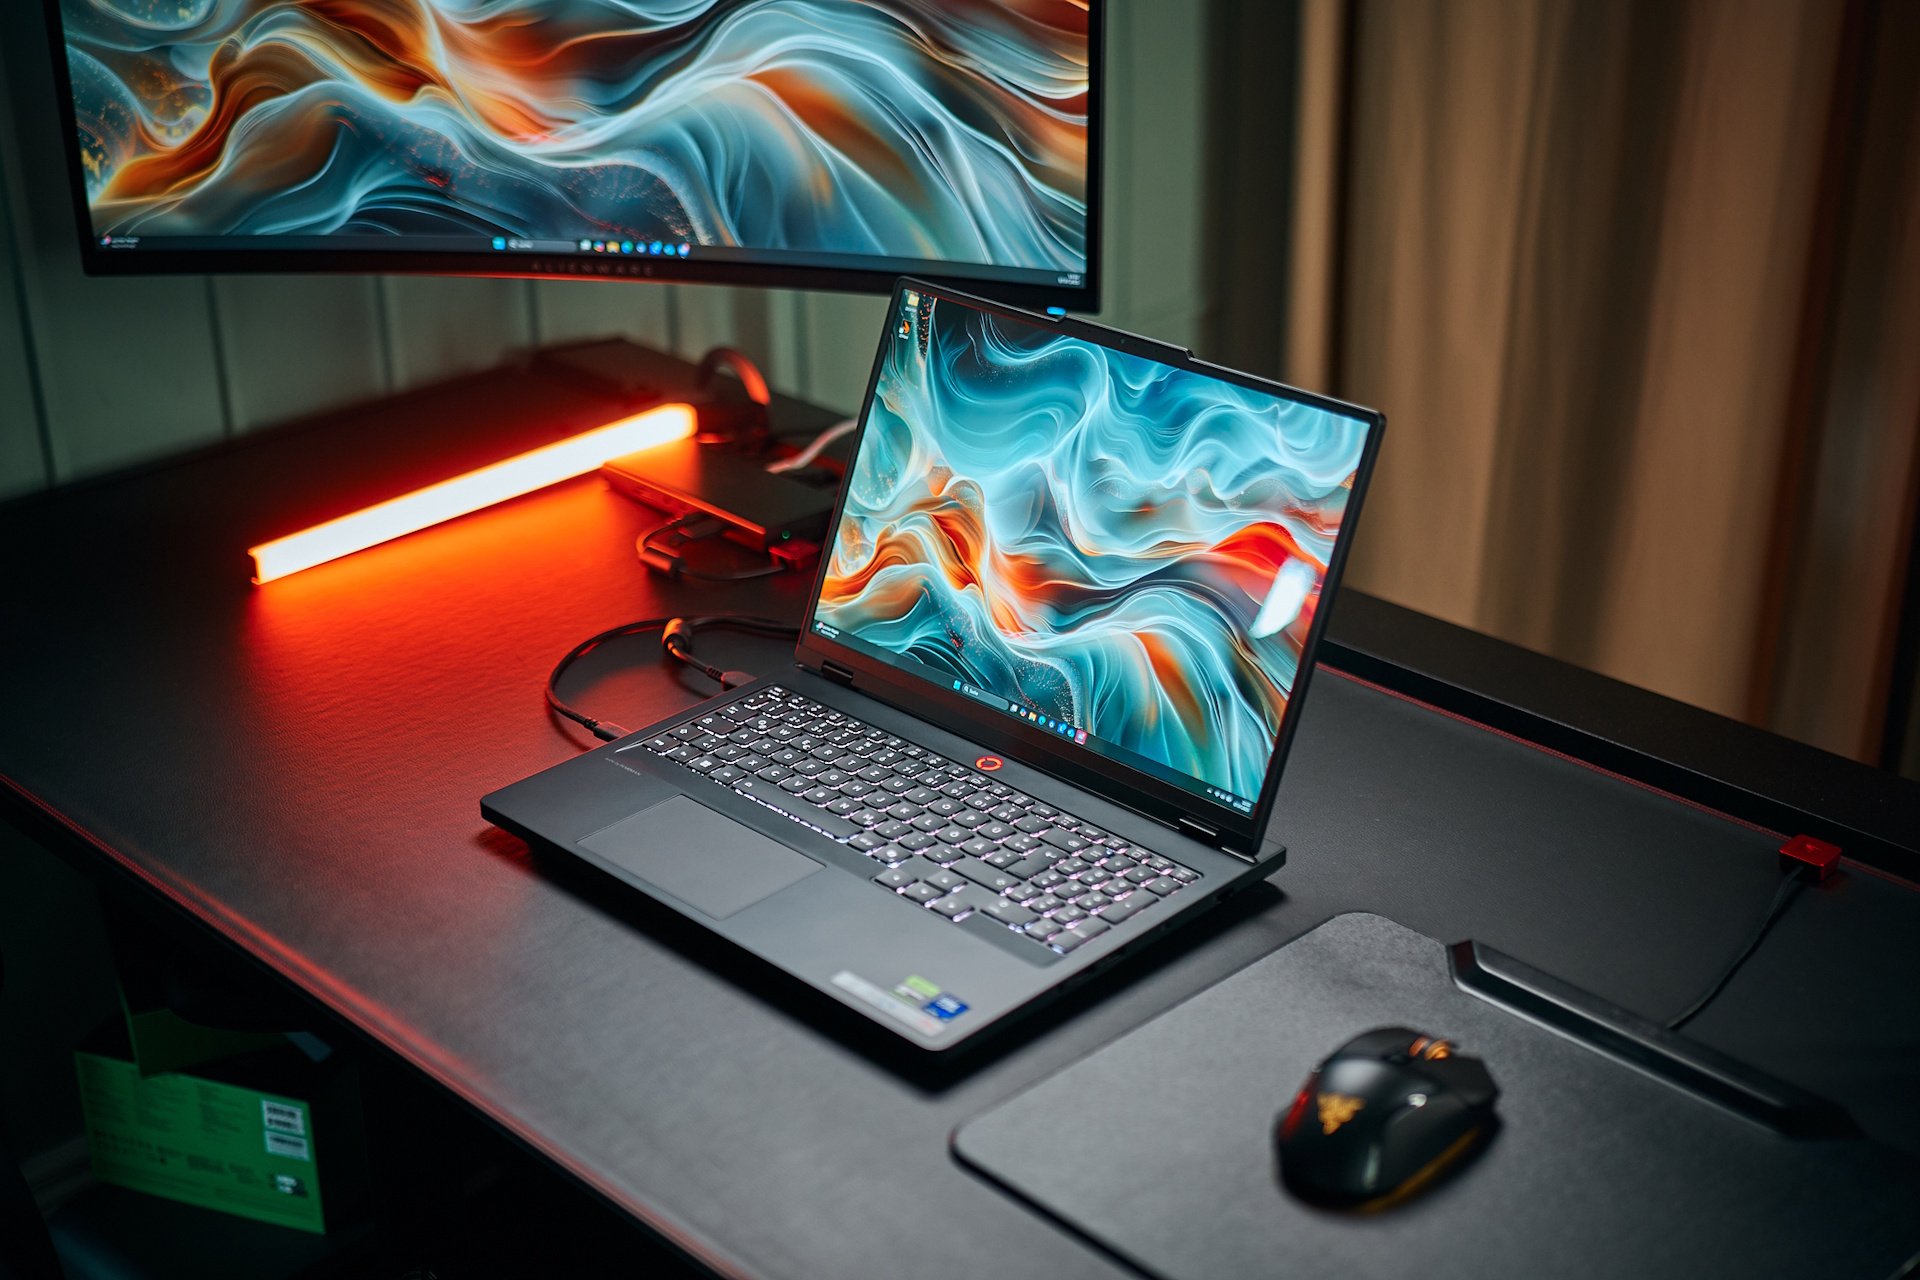
性能--RTX 5070 保持快速Legion
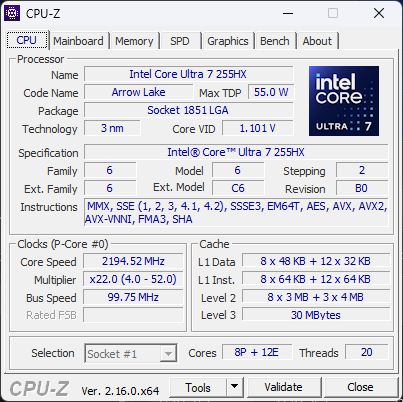
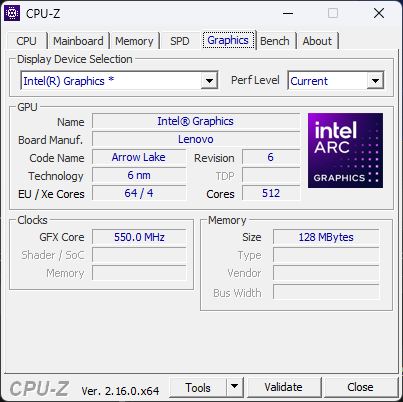
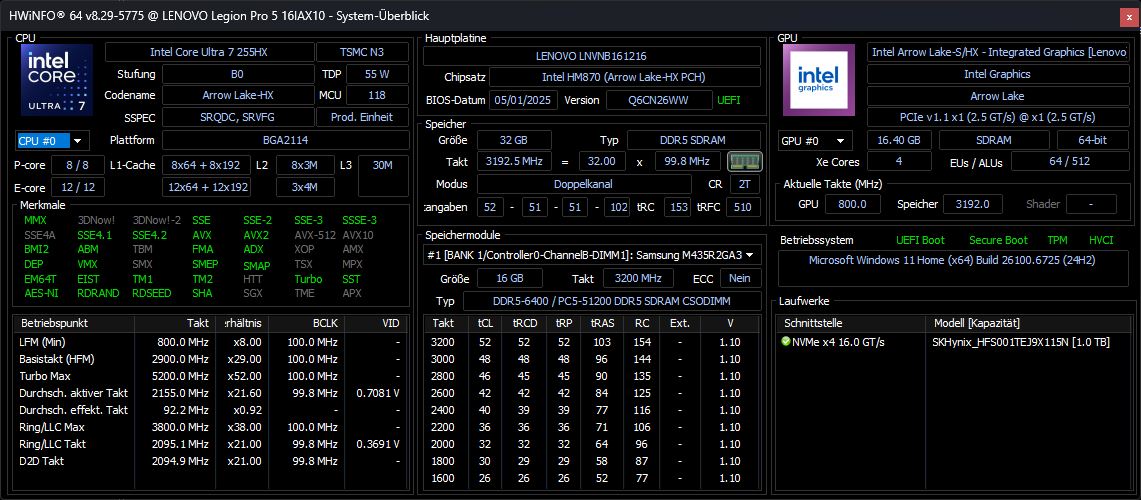
配备 RTX 5070, Core Ultra 7 255HXLegion Pro 5 16 拥有 RTX 5070、酷睿 7 255HX 和 32GB 内存,是一款性能强劲的中端游戏机,其出色的显示屏、性能和低调的设计也能吸引内容创作者。
测试条件
联想预装了两个关键实用程序:Vantage 用于系统管理、硬件扫描和常规设置,Legion Space 是游戏中心,具有性能模式和 MUX 控制功能。这两个应用程序都包含广告,Vantage 会频繁弹出广告,具有一定的干扰性。
所有基准测试均在性能模式下运行。

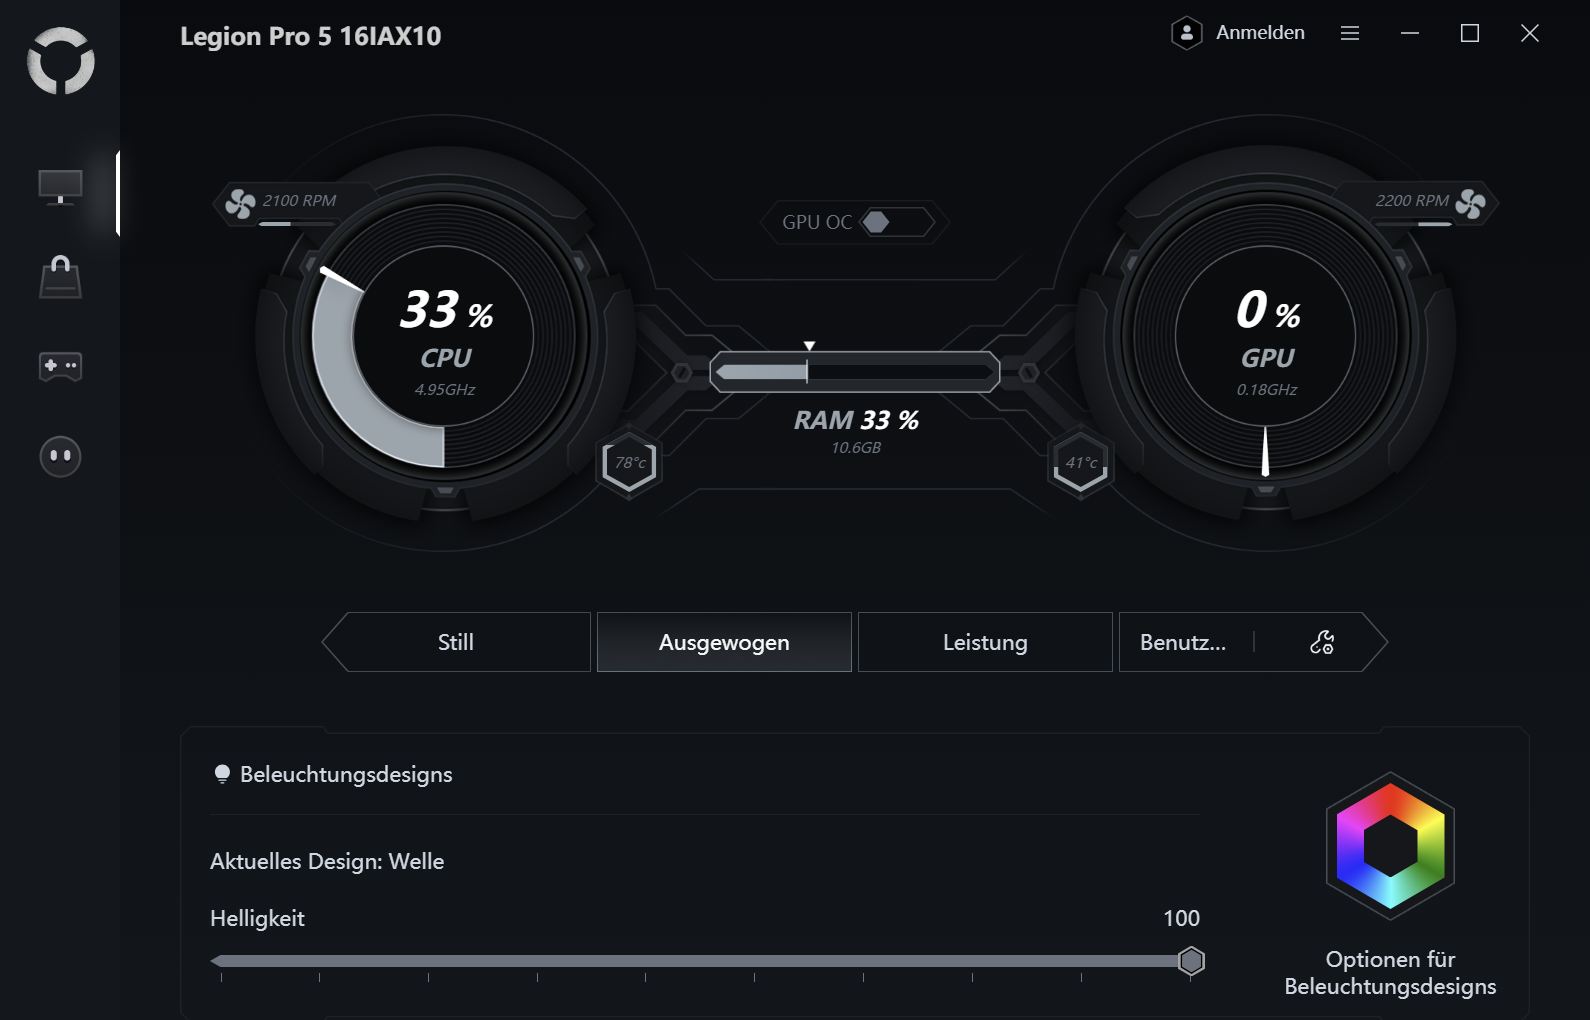
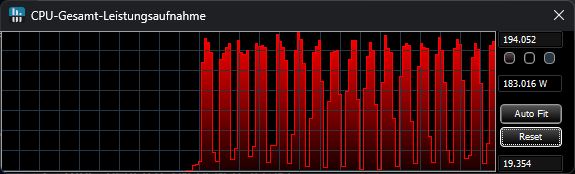
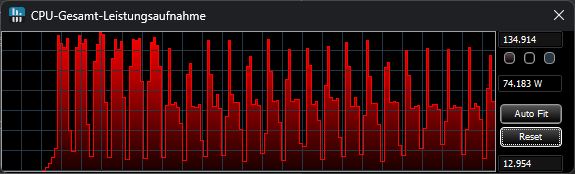
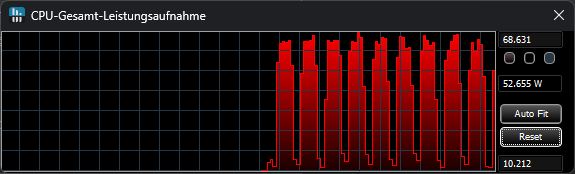
| 模式 | Cinebench R15 | CPU 功耗 | 赛博朋克 2077 Ultra | GPU 功耗 | 噪音水平 (Cyberpunk) |
|---|---|---|---|---|---|
| 性能 | 5190 | 194 → 183 W | 107 fps | 103 W | 50.27 dB |
| 平衡 | 4463 | 135 → 75 W | 94.2 fps | 93 W | 47.34 dB |
| 生态 | 3731 | 65 W | 72 fps | 55 W | 38.44 dB |
处理器
英特尔 英特尔酷睿至尊 7 255HX的 E 核数量比 超 9 275HX时钟速度略低。
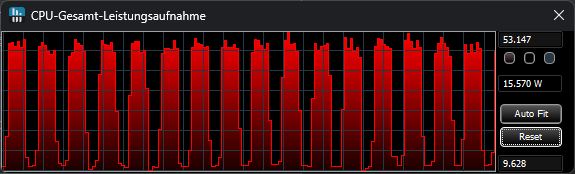
在我们的 CPU 基准测试中,其性能高于平均水平,仅比 Ultra 9 275HX 低几个百分点。在 Cinebench 循环中,它能保持稳定的输出,只是随着时间的推移略有下降(约 7%)。
使用电池运行时,CPU 性能降低了约 43%。
Cinebench R15 多压力测试
Cinebench R23: Multi Core | Single Core
Cinebench R20: CPU (Multi Core) | CPU (Single Core)
Cinebench R15: CPU Multi 64Bit | CPU Single 64Bit
Blender: v2.79 BMW27 CPU
7-Zip 18.03: 7z b 4 | 7z b 4 -mmt1
Geekbench 6.7: Multi-Core | Single-Core
Geekbench 5.5: Multi-Core | Single-Core
HWBOT x265 Benchmark v2.2: 4k Preset
LibreOffice : 20 Documents To PDF
R Benchmark 2.5: Overall mean
| CPU Performance rating | |
| Lenovo Legion 5 Pro 16IAX10H | |
| Alienware 16X Aurora, RTX 5070 | |
| Lenovo Legion Pro 5 16IAX10, RTX 5070 | |
| Average Intel Core Ultra 7 255HX | |
| Average of class Gaming | |
| Schenker XMG Core 16 M25 | |
| Gigabyte Aero X16 1WH | |
| Asus TUF Gaming A16 FA608UP | |
| Gigabyte Gaming A16 GA6H | |
| Cinebench R23 / Multi Core | |
| Lenovo Legion 5 Pro 16IAX10H | |
| Alienware 16X Aurora, RTX 5070 | |
| Lenovo Legion Pro 5 16IAX10, RTX 5070 | |
| Average Intel Core Ultra 7 255HX (27129 - 34005, n=5) | |
| Average of class Gaming (10488 - 40970, n=106, last 2 years) | |
| Schenker XMG Core 16 M25 | |
| Gigabyte Aero X16 1WH | |
| Asus TUF Gaming A16 FA608UP | |
| Gigabyte Gaming A16 GA6H | |
| Cinebench R23 / Single Core | |
| Lenovo Legion 5 Pro 16IAX10H | |
| Alienware 16X Aurora, RTX 5070 | |
| Lenovo Legion Pro 5 16IAX10, RTX 5070 | |
| Average Intel Core Ultra 7 255HX (2111 - 2171, n=5) | |
| Schenker XMG Core 16 M25 | |
| Average of class Gaming (1166 - 2387, n=106, last 2 years) | |
| Gigabyte Aero X16 1WH | |
| Gigabyte Gaming A16 GA6H | |
| Asus TUF Gaming A16 FA608UP | |
| Cinebench R20 / CPU (Multi Core) | |
| Lenovo Legion 5 Pro 16IAX10H | |
| Alienware 16X Aurora, RTX 5070 | |
| Lenovo Legion Pro 5 16IAX10, RTX 5070 | |
| Average Intel Core Ultra 7 255HX (10626 - 13056, n=5) | |
| Average of class Gaming (4029 - 16108, n=105, last 2 years) | |
| Schenker XMG Core 16 M25 | |
| Asus TUF Gaming A16 FA608UP | |
| Gigabyte Aero X16 1WH | |
| Gigabyte Gaming A16 GA6H | |
| Cinebench R20 / CPU (Single Core) | |
| Lenovo Legion 5 Pro 16IAX10H | |
| Alienware 16X Aurora, RTX 5070 | |
| Lenovo Legion Pro 5 16IAX10, RTX 5070 | |
| Average Intel Core Ultra 7 255HX (822 - 835, n=5) | |
| Schenker XMG Core 16 M25 | |
| Average of class Gaming (442 - 904, n=105, last 2 years) | |
| Gigabyte Aero X16 1WH | |
| Gigabyte Gaming A16 GA6H | |
| Asus TUF Gaming A16 FA608UP | |
| Cinebench R15 / CPU Multi 64Bit | |
| Lenovo Legion 5 Pro 16IAX10H | |
| Alienware 16X Aurora, RTX 5070 | |
| Lenovo Legion Pro 5 16IAX10, RTX 5070 | |
| Average Intel Core Ultra 7 255HX (4114 - 5190, n=5) | |
| Average of class Gaming (1578 - 6271, n=104, last 2 years) | |
| Schenker XMG Core 16 M25 | |
| Asus TUF Gaming A16 FA608UP | |
| Gigabyte Aero X16 1WH | |
| Gigabyte Gaming A16 GA6H | |
| Cinebench R15 / CPU Single 64Bit | |
| Lenovo Legion 5 Pro 16IAX10H | |
| Alienware 16X Aurora, RTX 5070 | |
| Lenovo Legion Pro 5 16IAX10, RTX 5070 | |
| Average Intel Core Ultra 7 255HX (322 - 328, n=5) | |
| Average of class Gaming (188.8 - 344, n=105, last 2 years) | |
| Asus TUF Gaming A16 FA608UP | |
| Gigabyte Gaming A16 GA6H | |
| Gigabyte Aero X16 1WH | |
| Schenker XMG Core 16 M25 | |
| Blender / v2.79 BMW27 CPU | |
| Gigabyte Gaming A16 GA6H | |
| Gigabyte Aero X16 1WH | |
| Asus TUF Gaming A16 FA608UP | |
| Average of class Gaming (80 - 330, n=103, last 2 years) | |
| Schenker XMG Core 16 M25 | |
| Average Intel Core Ultra 7 255HX (104 - 122, n=5) | |
| Lenovo Legion Pro 5 16IAX10, RTX 5070 | |
| Alienware 16X Aurora, RTX 5070 | |
| Lenovo Legion 5 Pro 16IAX10H | |
| 7-Zip 18.03 / 7z b 4 | |
| Lenovo Legion 5 Pro 16IAX10H | |
| Alienware 16X Aurora, RTX 5070 | |
| Lenovo Legion Pro 5 16IAX10, RTX 5070 | |
| Average Intel Core Ultra 7 255HX (87806 - 104055, n=5) | |
| Average of class Gaming (33491 - 148086, n=104, last 2 years) | |
| Schenker XMG Core 16 M25 | |
| Asus TUF Gaming A16 FA608UP | |
| Gigabyte Aero X16 1WH | |
| Gigabyte Gaming A16 GA6H | |
| 7-Zip 18.03 / 7z b 4 -mmt1 | |
| Lenovo Legion 5 Pro 16IAX10H | |
| Alienware 16X Aurora, RTX 5070 | |
| Lenovo Legion Pro 5 16IAX10, RTX 5070 | |
| Average Intel Core Ultra 7 255HX (6407 - 6576, n=5) | |
| Schenker XMG Core 16 M25 | |
| Average of class Gaming (4199 - 7436, n=104, last 2 years) | |
| Asus TUF Gaming A16 FA608UP | |
| Gigabyte Aero X16 1WH | |
| Gigabyte Gaming A16 GA6H | |
| Geekbench 6.7 / Multi-Core | |
| Lenovo Legion 5 Pro 16IAX10H | |
| Lenovo Legion Pro 5 16IAX10, RTX 5070 | |
| Alienware 16X Aurora, RTX 5070 | |
| Average Intel Core Ultra 7 255HX (16396 - 19623, n=6) | |
| Schenker XMG Core 16 M25 | |
| Average of class Gaming (6625 - 22104, n=105, last 2 years) | |
| Gigabyte Aero X16 1WH | |
| Asus TUF Gaming A16 FA608UP | |
| Gigabyte Gaming A16 GA6H | |
| Geekbench 6.7 / Single-Core | |
| Lenovo Legion 5 Pro 16IAX10H | |
| Alienware 16X Aurora, RTX 5070 | |
| Lenovo Legion Pro 5 16IAX10, RTX 5070 | |
| Average Intel Core Ultra 7 255HX (2917 - 3028, n=6) | |
| Schenker XMG Core 16 M25 | |
| Gigabyte Aero X16 1WH | |
| Average of class Gaming (1490 - 3259, n=105, last 2 years) | |
| Asus TUF Gaming A16 FA608UP | |
| Gigabyte Gaming A16 GA6H | |
| Geekbench 5.5 / Multi-Core | |
| Lenovo Legion 5 Pro 16IAX10H | |
| Alienware 16X Aurora, RTX 5070 | |
| Lenovo Legion Pro 5 16IAX10, RTX 5070 | |
| Average Intel Core Ultra 7 255HX (18263 - 21014, n=5) | |
| Average of class Gaming (6460 - 27010, n=104, last 2 years) | |
| Schenker XMG Core 16 M25 | |
| Gigabyte Aero X16 1WH | |
| Asus TUF Gaming A16 FA608UP | |
| Gigabyte Gaming A16 GA6H | |
| Geekbench 5.5 / Single-Core | |
| Lenovo Legion 5 Pro 16IAX10H | |
| Alienware 16X Aurora, RTX 5070 | |
| Lenovo Legion Pro 5 16IAX10, RTX 5070 | |
| Average Intel Core Ultra 7 255HX (2112 - 2211, n=5) | |
| Gigabyte Aero X16 1WH | |
| Schenker XMG Core 16 M25 | |
| Average of class Gaming (986 - 2474, n=104, last 2 years) | |
| Asus TUF Gaming A16 FA608UP | |
| Gigabyte Gaming A16 GA6H | |
| HWBOT x265 Benchmark v2.2 / 4k Preset | |
| Lenovo Legion 5 Pro 16IAX10H | |
| Alienware 16X Aurora, RTX 5070 | |
| Lenovo Legion Pro 5 16IAX10, RTX 5070 | |
| Average Intel Core Ultra 7 255HX (30.4 - 36.9, n=5) | |
| Average of class Gaming (11.5 - 44.3, n=104, last 2 years) | |
| Schenker XMG Core 16 M25 | |
| Gigabyte Aero X16 1WH | |
| Asus TUF Gaming A16 FA608UP | |
| Gigabyte Gaming A16 GA6H | |
| LibreOffice / 20 Documents To PDF | |
| Asus TUF Gaming A16 FA608UP | |
| Gigabyte Gaming A16 GA6H | |
| Gigabyte Aero X16 1WH | |
| Schenker XMG Core 16 M25 | |
| Average of class Gaming (33.2 - 88.8, n=104, last 2 years) | |
| Lenovo Legion Pro 5 16IAX10, RTX 5070 | |
| Average Intel Core Ultra 7 255HX (35.4 - 45.9, n=5) | |
| Alienware 16X Aurora, RTX 5070 | |
| Lenovo Legion 5 Pro 16IAX10H | |
| R Benchmark 2.5 / Overall mean | |
| Gigabyte Gaming A16 GA6H | |
| Asus TUF Gaming A16 FA608UP | |
| Average of class Gaming (0.3439 - 0.759, n=105, last 2 years) | |
| Lenovo Legion Pro 5 16IAX10, RTX 5070 | |
| Average Intel Core Ultra 7 255HX (0.4209 - 0.4287, n=5) | |
| Alienware 16X Aurora, RTX 5070 | |
| Lenovo Legion 5 Pro 16IAX10H | |
| Gigabyte Aero X16 1WH | |
| Schenker XMG Core 16 M25 | |
* ... smaller is better
AIDA64: FP32 Ray-Trace | FPU Julia | CPU SHA3 | CPU Queen | FPU SinJulia | FPU Mandel | CPU AES | CPU ZLib | FP64 Ray-Trace | CPU PhotoWorxx
| Performance rating | |
| Lenovo Legion 5 Pro 16IAX10H | |
| Lenovo Legion Pro 5 16IAX10, RTX 5070 | |
| Alienware 16X Aurora, RTX 5070 | |
| Schenker XMG Core 16 M25 | |
| Average Intel Core Ultra 7 255HX | |
| Average of class Gaming | |
| Asus TUF Gaming A16 FA608UP | |
| Gigabyte Aero X16 1WH | |
| Gigabyte Gaming A16 GA6H | |
| AIDA64 / FP32 Ray-Trace | |
| Schenker XMG Core 16 M25 | |
| Lenovo Legion 5 Pro 16IAX10H | |
| Lenovo Legion Pro 5 16IAX10, RTX 5070 | |
| Alienware 16X Aurora, RTX 5070 | |
| Average of class Gaming (10227 - 85542, n=103, last 2 years) | |
| Average Intel Core Ultra 7 255HX (27732 - 34250, n=5) | |
| Asus TUF Gaming A16 FA608UP | |
| Gigabyte Aero X16 1WH | |
| Gigabyte Gaming A16 GA6H | |
| AIDA64 / FPU Julia | |
| Lenovo Legion 5 Pro 16IAX10H | |
| Lenovo Legion Pro 5 16IAX10, RTX 5070 | |
| Alienware 16X Aurora, RTX 5070 | |
| Average Intel Core Ultra 7 255HX (140290 - 167758, n=5) | |
| Schenker XMG Core 16 M25 | |
| Average of class Gaming (51376 - 238426, n=103, last 2 years) | |
| Asus TUF Gaming A16 FA608UP | |
| Gigabyte Aero X16 1WH | |
| Gigabyte Gaming A16 GA6H | |
| AIDA64 / CPU SHA3 | |
| Lenovo Legion 5 Pro 16IAX10H | |
| Alienware 16X Aurora, RTX 5070 | |
| Lenovo Legion Pro 5 16IAX10, RTX 5070 | |
| Average Intel Core Ultra 7 255HX (6445 - 7694, n=5) | |
| Average of class Gaming (2180 - 9817, n=103, last 2 years) | |
| Schenker XMG Core 16 M25 | |
| Asus TUF Gaming A16 FA608UP | |
| Gigabyte Aero X16 1WH | |
| Gigabyte Gaming A16 GA6H | |
| AIDA64 / CPU Queen | |
| Lenovo Legion 5 Pro 16IAX10H | |
| Lenovo Legion Pro 5 16IAX10, RTX 5070 | |
| Alienware 16X Aurora, RTX 5070 | |
| Average Intel Core Ultra 7 255HX (115802 - 135237, n=5) | |
| Asus TUF Gaming A16 FA608UP | |
| Average of class Gaming (49785 - 173351, n=89, last 2 years) | |
| Schenker XMG Core 16 M25 | |
| Gigabyte Aero X16 1WH | |
| Gigabyte Gaming A16 GA6H | |
| AIDA64 / FPU SinJulia | |
| Schenker XMG Core 16 M25 | |
| Asus TUF Gaming A16 FA608UP | |
| Average of class Gaming (4424 - 33636, n=103, last 2 years) | |
| Lenovo Legion 5 Pro 16IAX10H | |
| Gigabyte Aero X16 1WH | |
| Alienware 16X Aurora, RTX 5070 | |
| Lenovo Legion Pro 5 16IAX10, RTX 5070 | |
| Average Intel Core Ultra 7 255HX (11066 - 12286, n=5) | |
| Gigabyte Gaming A16 GA6H | |
| AIDA64 / FPU Mandel | |
| Lenovo Legion 5 Pro 16IAX10H | |
| Lenovo Legion Pro 5 16IAX10, RTX 5070 | |
| Alienware 16X Aurora, RTX 5070 | |
| Average Intel Core Ultra 7 255HX (72938 - 87947, n=5) | |
| Schenker XMG Core 16 M25 | |
| Average of class Gaming (25115 - 128721, n=103, last 2 years) | |
| Asus TUF Gaming A16 FA608UP | |
| Gigabyte Aero X16 1WH | |
| Gigabyte Gaming A16 GA6H | |
| AIDA64 / CPU AES | |
| Lenovo Legion 5 Pro 16IAX10H | |
| Alienware 16X Aurora, RTX 5070 | |
| Schenker XMG Core 16 M25 | |
| Lenovo Legion Pro 5 16IAX10, RTX 5070 | |
| Average Intel Core Ultra 7 255HX (96832 - 116158, n=5) | |
| Average of class Gaming (39258 - 247074, n=103, last 2 years) | |
| Asus TUF Gaming A16 FA608UP | |
| Gigabyte Aero X16 1WH | |
| Gigabyte Gaming A16 GA6H | |
| AIDA64 / CPU ZLib | |
| Lenovo Legion 5 Pro 16IAX10H | |
| Alienware 16X Aurora, RTX 5070 | |
| Lenovo Legion Pro 5 16IAX10, RTX 5070 | |
| Average Intel Core Ultra 7 255HX (1510 - 1850, n=5) | |
| Average of class Gaming (574 - 2531, n=103, last 2 years) | |
| Schenker XMG Core 16 M25 | |
| Gigabyte Aero X16 1WH | |
| Asus TUF Gaming A16 FA608UP | |
| Gigabyte Gaming A16 GA6H | |
| AIDA64 / FP64 Ray-Trace | |
| Schenker XMG Core 16 M25 | |
| Lenovo Legion 5 Pro 16IAX10H | |
| Lenovo Legion Pro 5 16IAX10, RTX 5070 | |
| Alienware 16X Aurora, RTX 5070 | |
| Average of class Gaming (5509 - 45446, n=103, last 2 years) | |
| Average Intel Core Ultra 7 255HX (15137 - 18315, n=5) | |
| Asus TUF Gaming A16 FA608UP | |
| Gigabyte Aero X16 1WH | |
| Gigabyte Gaming A16 GA6H | |
| AIDA64 / CPU PhotoWorxx | |
| Lenovo Legion Pro 5 16IAX10, RTX 5070 | |
| Schenker XMG Core 16 M25 | |
| Lenovo Legion 5 Pro 16IAX10H | |
| Alienware 16X Aurora, RTX 5070 | |
| Average Intel Core Ultra 7 255HX (39697 - 54070, n=5) | |
| Average of class Gaming (12271 - 89891, n=103, last 2 years) | |
| Gigabyte Aero X16 1WH | |
| Asus TUF Gaming A16 FA608UP | |
| Gigabyte Gaming A16 GA6H | |
系统性能
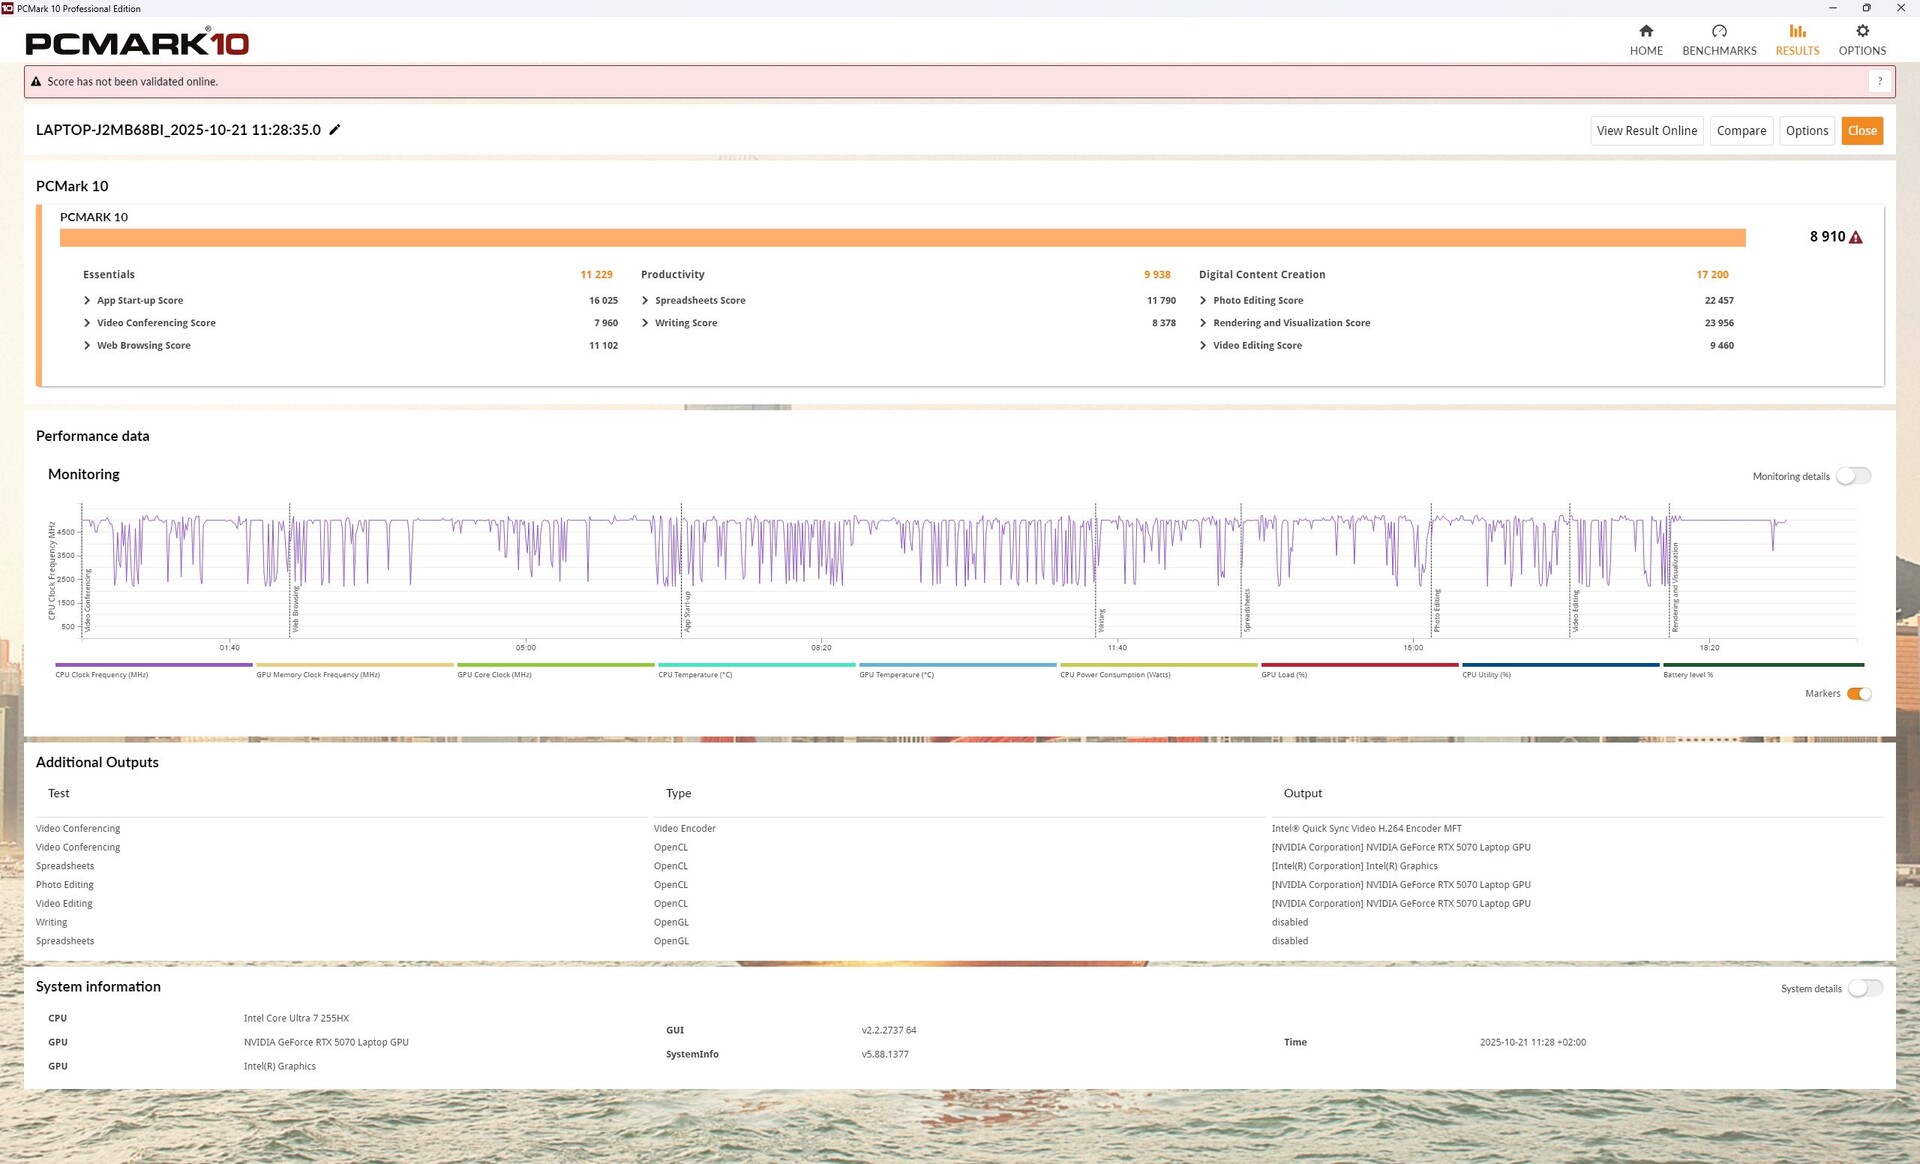
Legion Pro 5 16 具有出色的整体系统性能,领先于大多数竞争对手,仅以微弱优势落后于同类 Ti 机型。
PCMark 10: Score | Essentials | Productivity | Digital Content Creation
CrossMark: Overall | Productivity | Creativity | Responsiveness
WebXPRT 3: Overall
WebXPRT 4: Overall
Mozilla Kraken 1.1: Total
| Performance rating | |
| Lenovo Legion 5 Pro 16IAX10H | |
| Lenovo Legion Pro 5 16IAX10, RTX 5070 | |
| Alienware 16X Aurora, RTX 5070 -4! | |
| Average Intel Core Ultra 7 255HX, NVIDIA GeForce RTX 5070 Laptop | |
| Average of class Gaming | |
| Schenker XMG Core 16 M25 -4! | |
| Gigabyte Aero X16 1WH | |
| Gigabyte Gaming A16 GA6H | |
| Asus TUF Gaming A16 FA608UP -4! | |
| PCMark 10 / Score | |
| Lenovo Legion Pro 5 16IAX10, RTX 5070 | |
| Average Intel Core Ultra 7 255HX, NVIDIA GeForce RTX 5070 Laptop (n=1) | |
| Average of class Gaming (5828 - 11730, n=92, last 2 years) | |
| Lenovo Legion 5 Pro 16IAX10H | |
| Gigabyte Aero X16 1WH | |
| Gigabyte Gaming A16 GA6H | |
| PCMark 10 / Essentials | |
| Lenovo Legion Pro 5 16IAX10, RTX 5070 | |
| Average Intel Core Ultra 7 255HX, NVIDIA GeForce RTX 5070 Laptop (n=1) | |
| Lenovo Legion 5 Pro 16IAX10H | |
| Average of class Gaming (8810 - 11935, n=96, last 2 years) | |
| Gigabyte Aero X16 1WH | |
| Gigabyte Gaming A16 GA6H | |
| PCMark 10 / Productivity | |
| Average of class Gaming (6845 - 21327, n=94, last 2 years) | |
| Gigabyte Aero X16 1WH | |
| Lenovo Legion Pro 5 16IAX10, RTX 5070 | |
| Average Intel Core Ultra 7 255HX, NVIDIA GeForce RTX 5070 Laptop (n=1) | |
| Lenovo Legion 5 Pro 16IAX10H | |
| Gigabyte Gaming A16 GA6H | |
| PCMark 10 / Digital Content Creation | |
| Lenovo Legion Pro 5 16IAX10, RTX 5070 | |
| Average Intel Core Ultra 7 255HX, NVIDIA GeForce RTX 5070 Laptop (n=1) | |
| Lenovo Legion 5 Pro 16IAX10H | |
| Average of class Gaming (7602 - 19954, n=94, last 2 years) | |
| Gigabyte Aero X16 1WH | |
| Gigabyte Gaming A16 GA6H | |
| CrossMark / Overall | |
| Alienware 16X Aurora, RTX 5070 | |
| Lenovo Legion 5 Pro 16IAX10H | |
| Lenovo Legion Pro 5 16IAX10, RTX 5070 | |
| Average Intel Core Ultra 7 255HX, NVIDIA GeForce RTX 5070 Laptop (n=1) | |
| Schenker XMG Core 16 M25 | |
| Average of class Gaming (1366 - 2409, n=93, last 2 years) | |
| Gigabyte Gaming A16 GA6H | |
| Gigabyte Aero X16 1WH | |
| Asus TUF Gaming A16 FA608UP | |
| CrossMark / Productivity | |
| Alienware 16X Aurora, RTX 5070 | |
| Lenovo Legion 5 Pro 16IAX10H | |
| Lenovo Legion Pro 5 16IAX10, RTX 5070 | |
| Average Intel Core Ultra 7 255HX, NVIDIA GeForce RTX 5070 Laptop (n=1) | |
| Average of class Gaming (1386 - 2254, n=93, last 2 years) | |
| Schenker XMG Core 16 M25 | |
| Gigabyte Gaming A16 GA6H | |
| Gigabyte Aero X16 1WH | |
| Asus TUF Gaming A16 FA608UP | |
| CrossMark / Creativity | |
| Lenovo Legion 5 Pro 16IAX10H | |
| Schenker XMG Core 16 M25 | |
| Alienware 16X Aurora, RTX 5070 | |
| Lenovo Legion Pro 5 16IAX10, RTX 5070 | |
| Average Intel Core Ultra 7 255HX, NVIDIA GeForce RTX 5070 Laptop (n=1) | |
| Average of class Gaming (1343 - 2729, n=93, last 2 years) | |
| Gigabyte Aero X16 1WH | |
| Asus TUF Gaming A16 FA608UP | |
| Gigabyte Gaming A16 GA6H | |
| CrossMark / Responsiveness | |
| Alienware 16X Aurora, RTX 5070 | |
| Lenovo Legion 5 Pro 16IAX10H | |
| Gigabyte Gaming A16 GA6H | |
| Lenovo Legion Pro 5 16IAX10, RTX 5070 | |
| Average Intel Core Ultra 7 255HX, NVIDIA GeForce RTX 5070 Laptop (n=1) | |
| Average of class Gaming (1226 - 2334, n=93, last 2 years) | |
| Schenker XMG Core 16 M25 | |
| Gigabyte Aero X16 1WH | |
| Asus TUF Gaming A16 FA608UP | |
| WebXPRT 3 / Overall | |
| Lenovo Legion 5 Pro 16IAX10H | |
| Alienware 16X Aurora, RTX 5070 | |
| Schenker XMG Core 16 M25 | |
| Gigabyte Aero X16 1WH | |
| Lenovo Legion Pro 5 16IAX10, RTX 5070 | |
| Average Intel Core Ultra 7 255HX, NVIDIA GeForce RTX 5070 Laptop (n=1) | |
| Average of class Gaming (220 - 532, n=97, last 2 years) | |
| Asus TUF Gaming A16 FA608UP | |
| Gigabyte Gaming A16 GA6H | |
| WebXPRT 4 / Overall | |
| Schenker XMG Core 16 M25 | |
| Alienware 16X Aurora, RTX 5070 | |
| Lenovo Legion Pro 5 16IAX10, RTX 5070 | |
| Average Intel Core Ultra 7 255HX, NVIDIA GeForce RTX 5070 Laptop (n=1) | |
| Lenovo Legion 5 Pro 16IAX10H | |
| Average of class Gaming (165 - 354, n=97, last 2 years) | |
| Gigabyte Aero X16 1WH | |
| Gigabyte Gaming A16 GA6H | |
| Asus TUF Gaming A16 FA608UP | |
| Mozilla Kraken 1.1 / Total | |
| Asus TUF Gaming A16 FA608UP | |
| Gigabyte Gaming A16 GA6H | |
| Average of class Gaming (391 - 590, n=99, last 2 years) | |
| Gigabyte Aero X16 1WH | |
| Lenovo Legion Pro 5 16IAX10, RTX 5070 | |
| Average Intel Core Ultra 7 255HX, NVIDIA GeForce RTX 5070 Laptop (n=1) | |
| Schenker XMG Core 16 M25 | |
| Lenovo Legion 5 Pro 16IAX10H | |
| Alienware 16X Aurora, RTX 5070 | |
* ... smaller is better
| PCMark 10 Score | 8910 points | |
Help | ||
| AIDA64 / Memory Copy | |
| Lenovo Legion Pro 5 16IAX10, RTX 5070 | |
| Average Intel Core Ultra 7 255HX (68939 - 104987, n=5) | |
| Lenovo Legion 5 Pro 16IAX10H | |
| Alienware 16X Aurora, RTX 5070 | |
| Schenker XMG Core 16 M25 | |
| Gigabyte Aero X16 1WH | |
| Average of class Gaming (21750 - 129946, n=103, last 2 years) | |
| Asus TUF Gaming A16 FA608UP | |
| Gigabyte Gaming A16 GA6H | |
| AIDA64 / Memory Read | |
| Lenovo Legion Pro 5 16IAX10, RTX 5070 | |
| Average Intel Core Ultra 7 255HX (82336 - 95821, n=5) | |
| Lenovo Legion 5 Pro 16IAX10H | |
| Alienware 16X Aurora, RTX 5070 | |
| Schenker XMG Core 16 M25 | |
| Average of class Gaming (22956 - 118858, n=103, last 2 years) | |
| Gigabyte Aero X16 1WH | |
| Asus TUF Gaming A16 FA608UP | |
| Gigabyte Gaming A16 GA6H | |
| AIDA64 / Memory Write | |
| Average Intel Core Ultra 7 255HX (66479 - 133486, n=5) | |
| Asus TUF Gaming A16 FA608UP | |
| Gigabyte Aero X16 1WH | |
| Lenovo Legion Pro 5 16IAX10, RTX 5070 | |
| Schenker XMG Core 16 M25 | |
| Alienware 16X Aurora, RTX 5070 | |
| Lenovo Legion 5 Pro 16IAX10H | |
| Average of class Gaming (22297 - 135096, n=103, last 2 years) | |
| Gigabyte Gaming A16 GA6H | |
| AIDA64 / Memory Latency | |
| Alienware 16X Aurora, RTX 5070 | |
| Lenovo Legion 5 Pro 16IAX10H | |
| Average of class Gaming (75.3 - 259, n=103, last 2 years) | |
| Average Intel Core Ultra 7 255HX (104.2 - 110, n=5) | |
| Lenovo Legion Pro 5 16IAX10, RTX 5070 | |
| Gigabyte Gaming A16 GA6H | |
| Gigabyte Aero X16 1WH | |
| Asus TUF Gaming A16 FA608UP | |
| Schenker XMG Core 16 M25 | |
* ... smaller is better
DPC 延迟
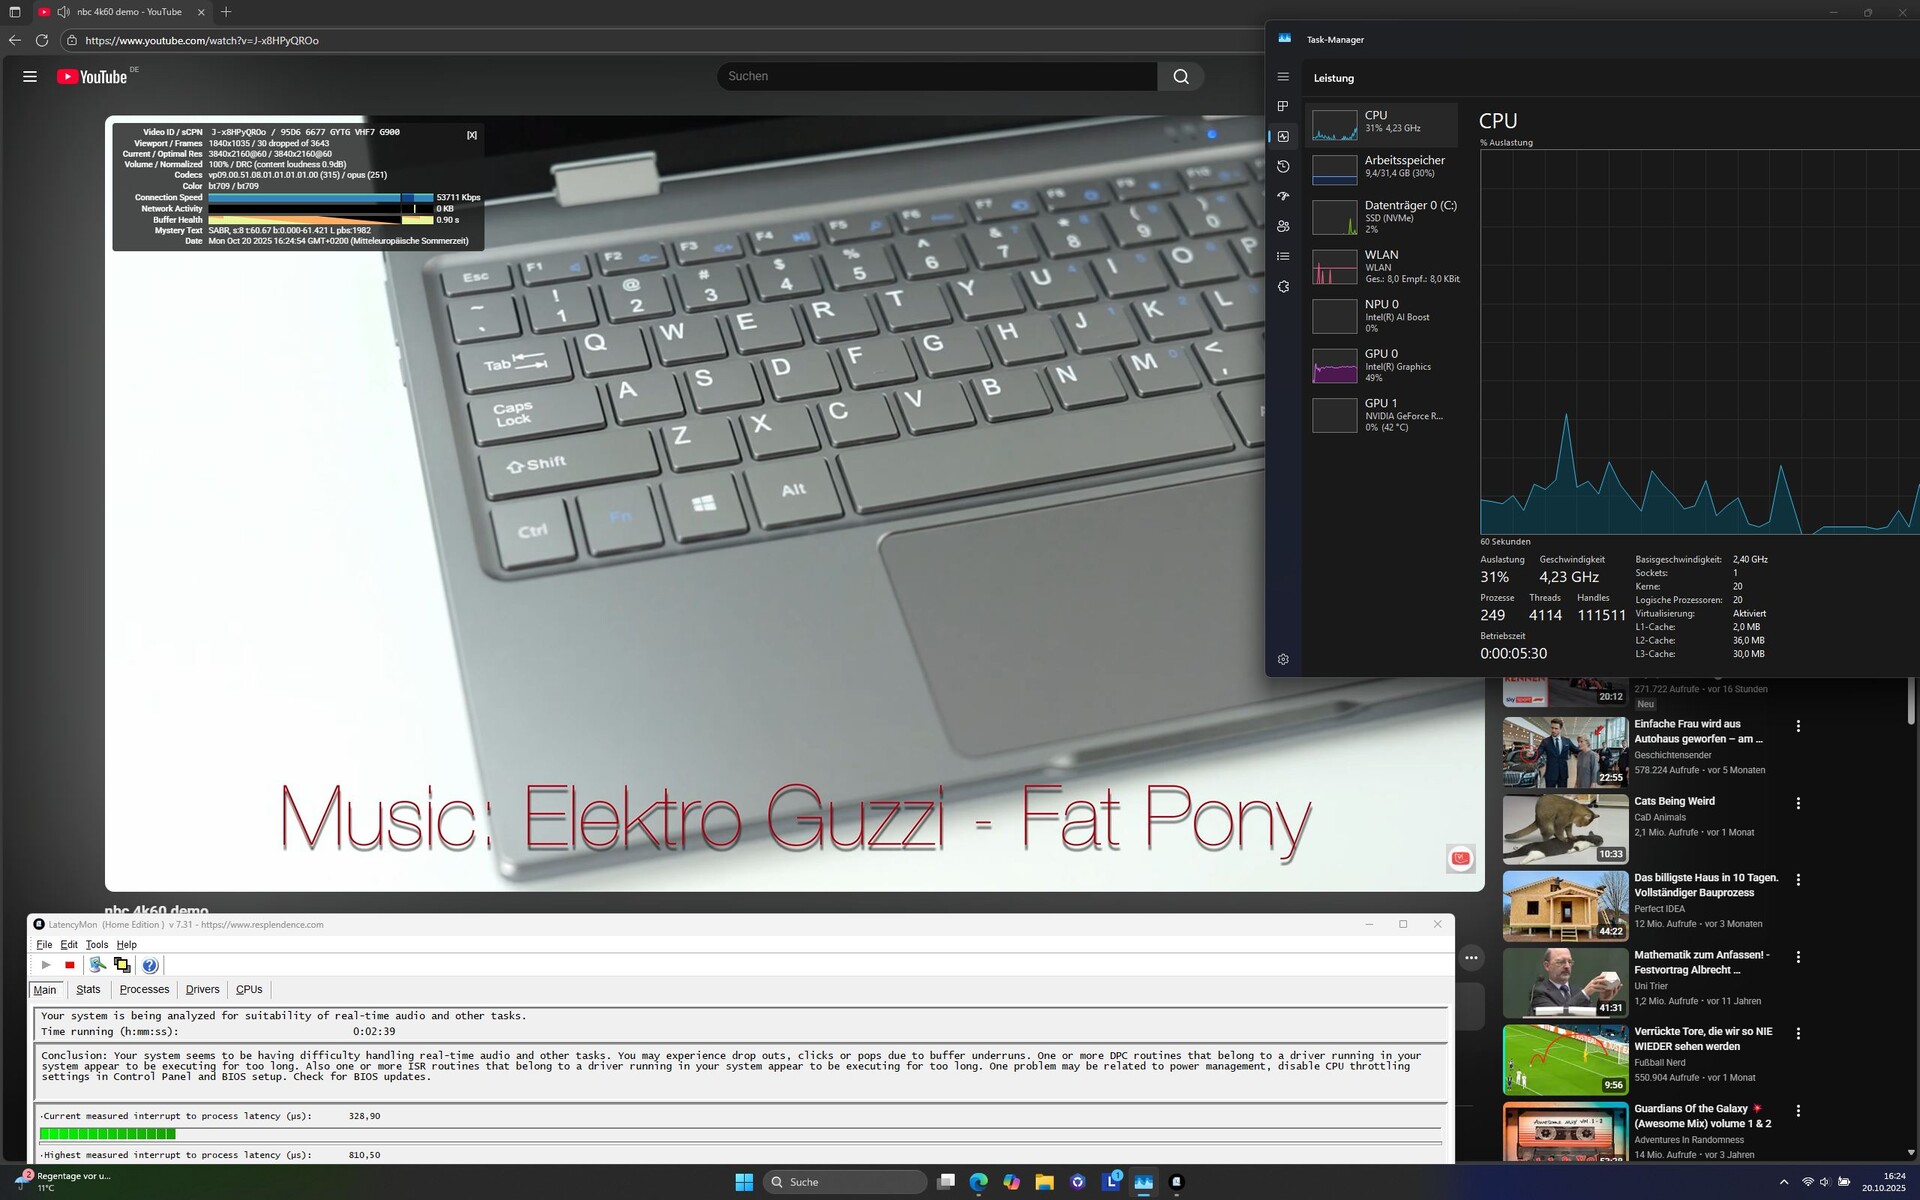
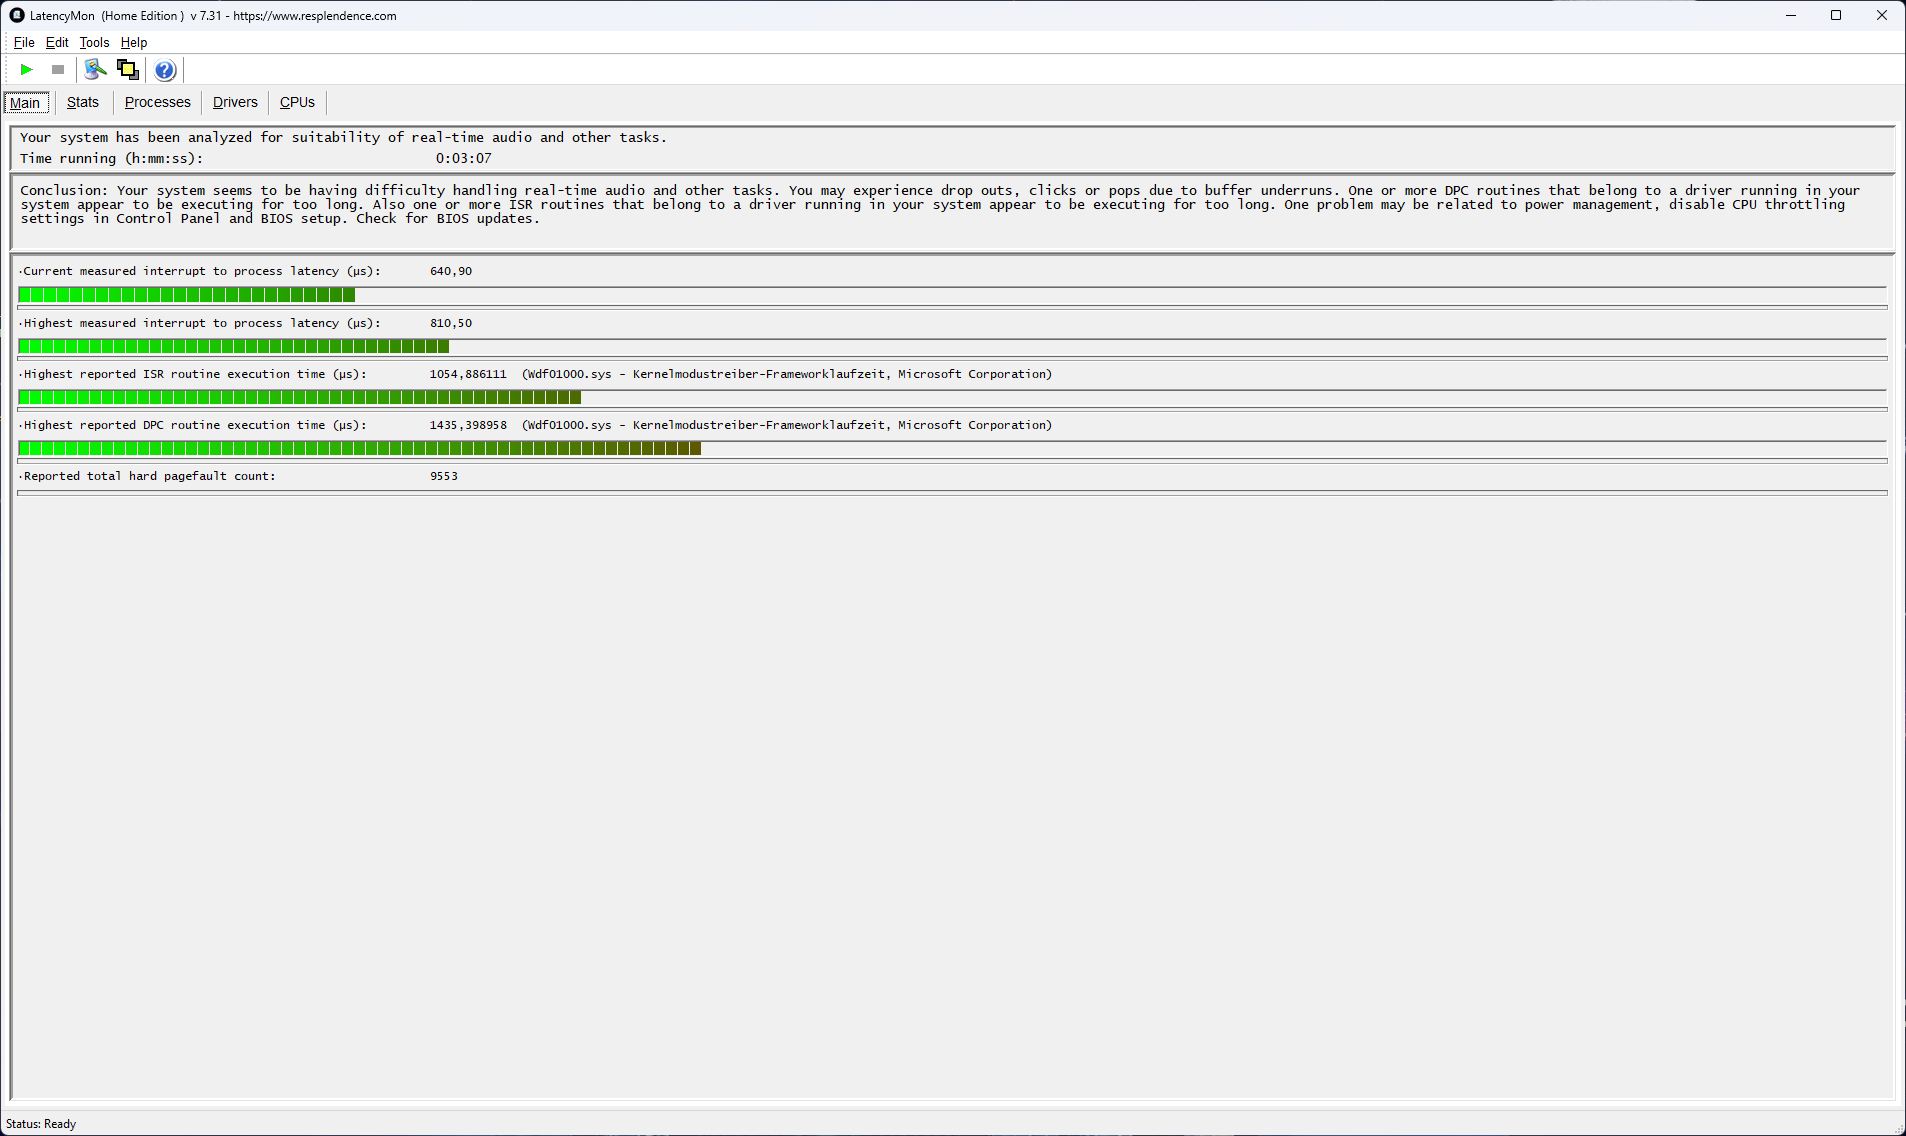
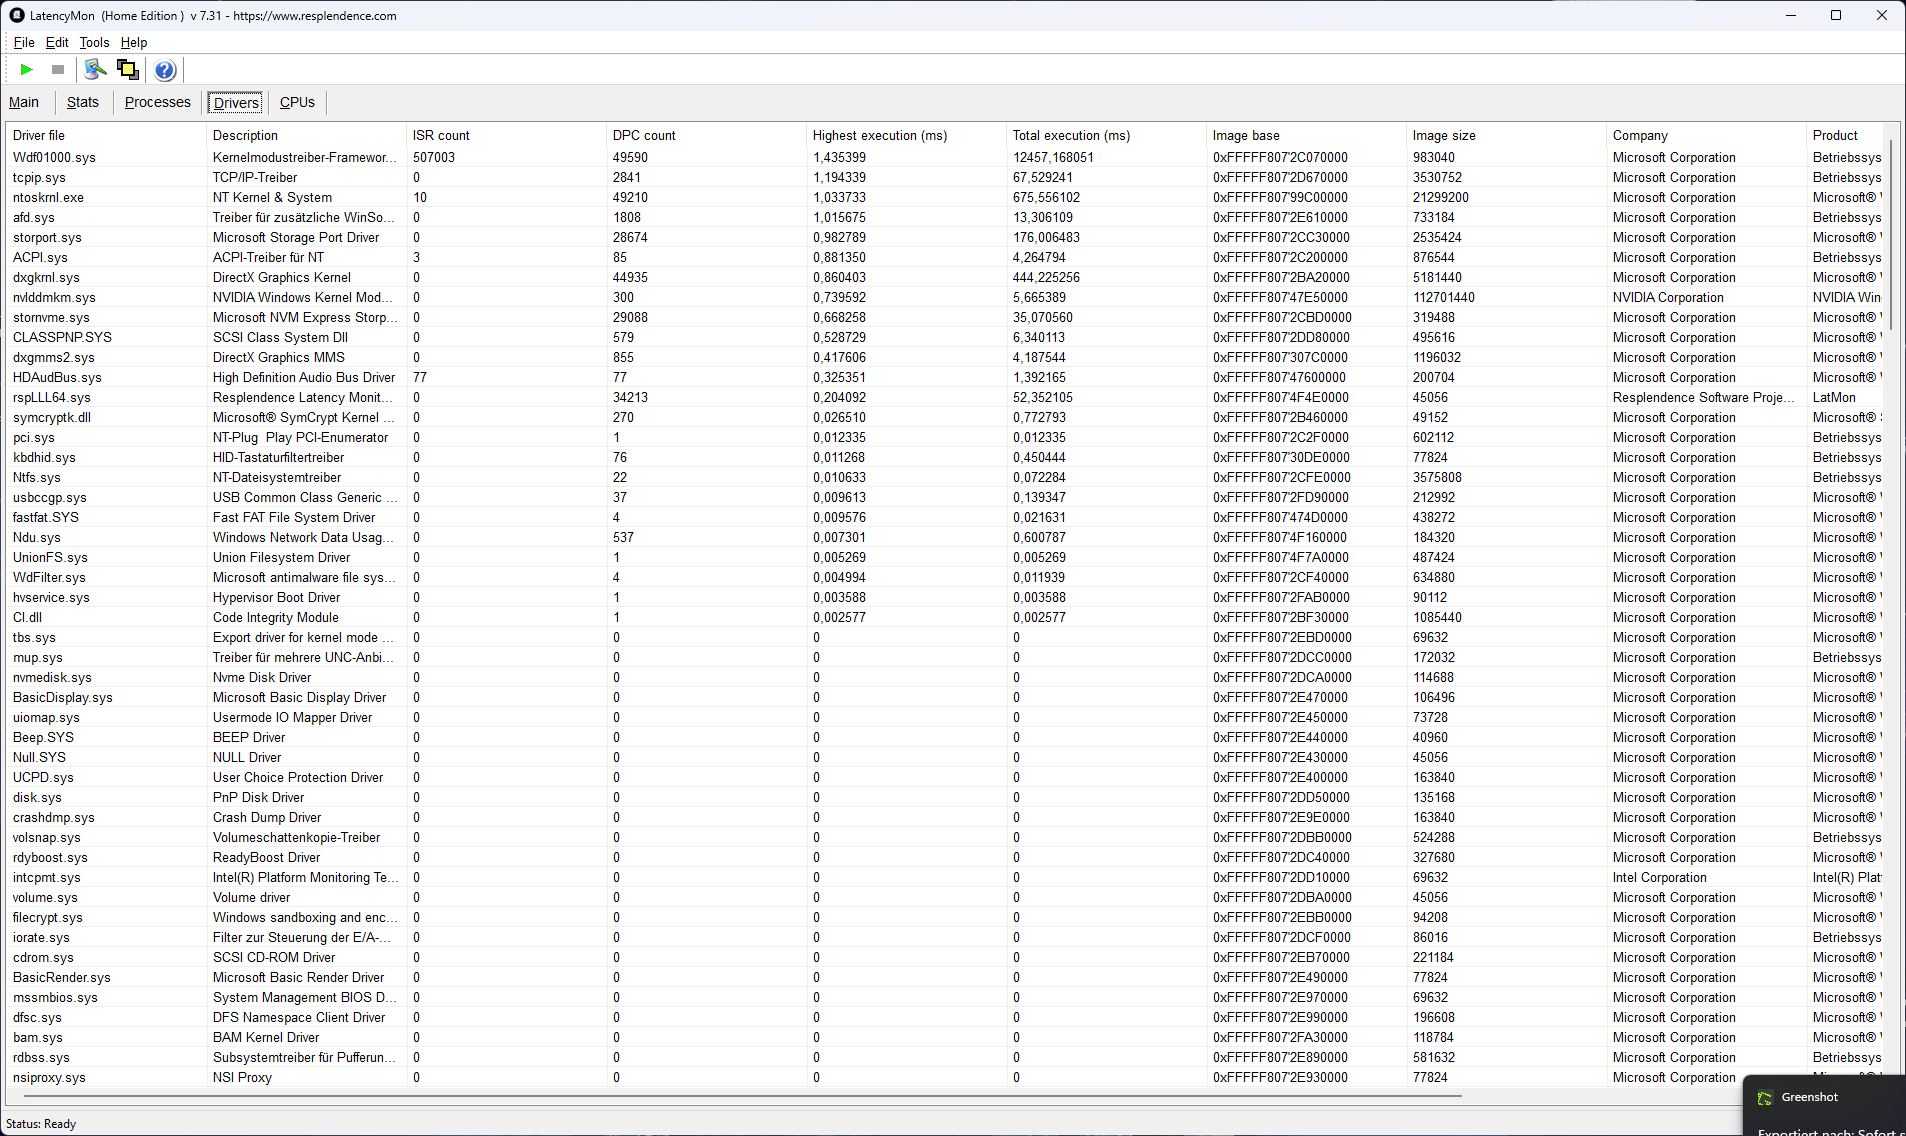
启动浏览器时会出现轻微的延迟峰值,但打开多个标签页不会使延迟峰值恶化。播放 YouTube 测试视频时会出现约 30 帧的掉帧现象,但与其他系统相比,整体延迟仍然较低。
| DPC Latencies / LatencyMon - interrupt to process latency (max), Web, Youtube, Prime95 | |
| Gigabyte Gaming A16 GA6H | |
| Gigabyte Aero X16 1WH | |
| Alienware 16X Aurora, RTX 5070 | |
| Lenovo Legion 5 Pro 16IAX10H | |
| Lenovo Legion Pro 5 16IAX10, RTX 5070 | |
| Schenker XMG Core 16 M25 | |
| Asus TUF Gaming A16 FA608UP | |
* ... smaller is better
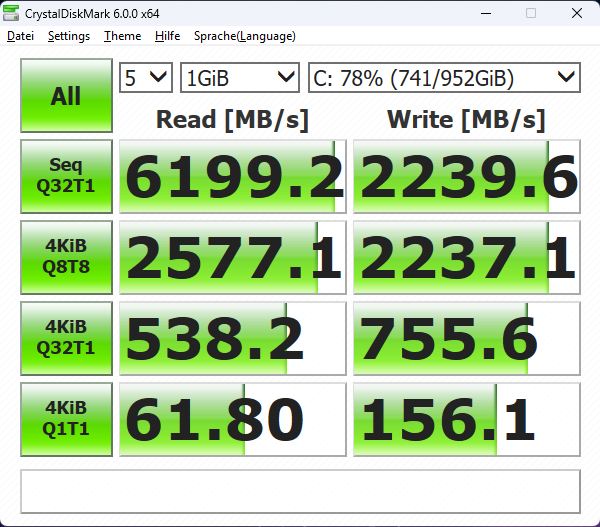
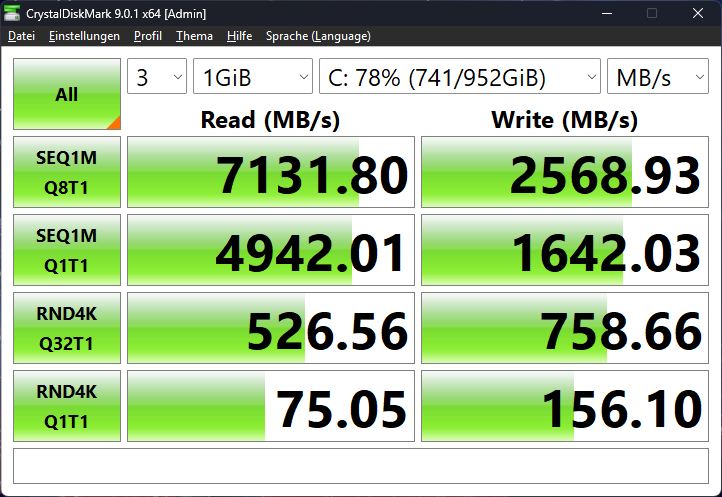
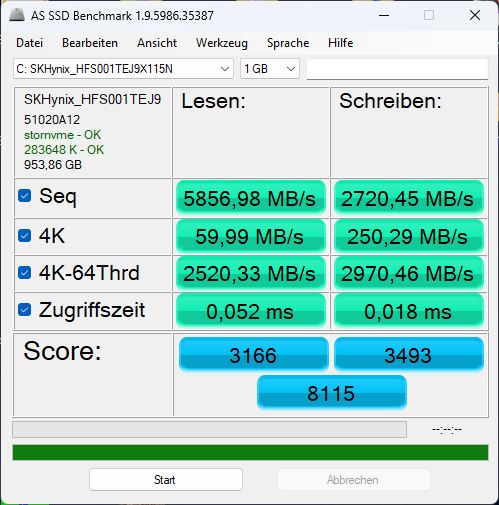
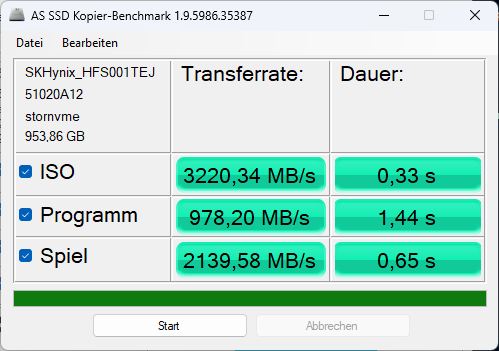
大容量存储器
我们的设备使用的是 SK Hynix PCIe 4.0 固态硬盘;其 Ti 机型使用的是西部数据硬盘。海力士的整体速度稍快,但在长时间压力测试的最后阶段开始出现热衰减。

* ... smaller is better
连续读取性能DiskSpd 读取循环,队列深度 8
图形处理器性能
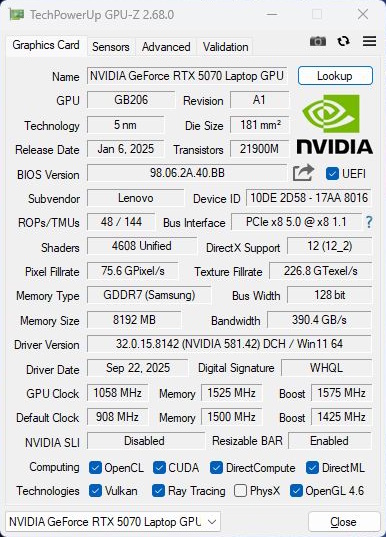
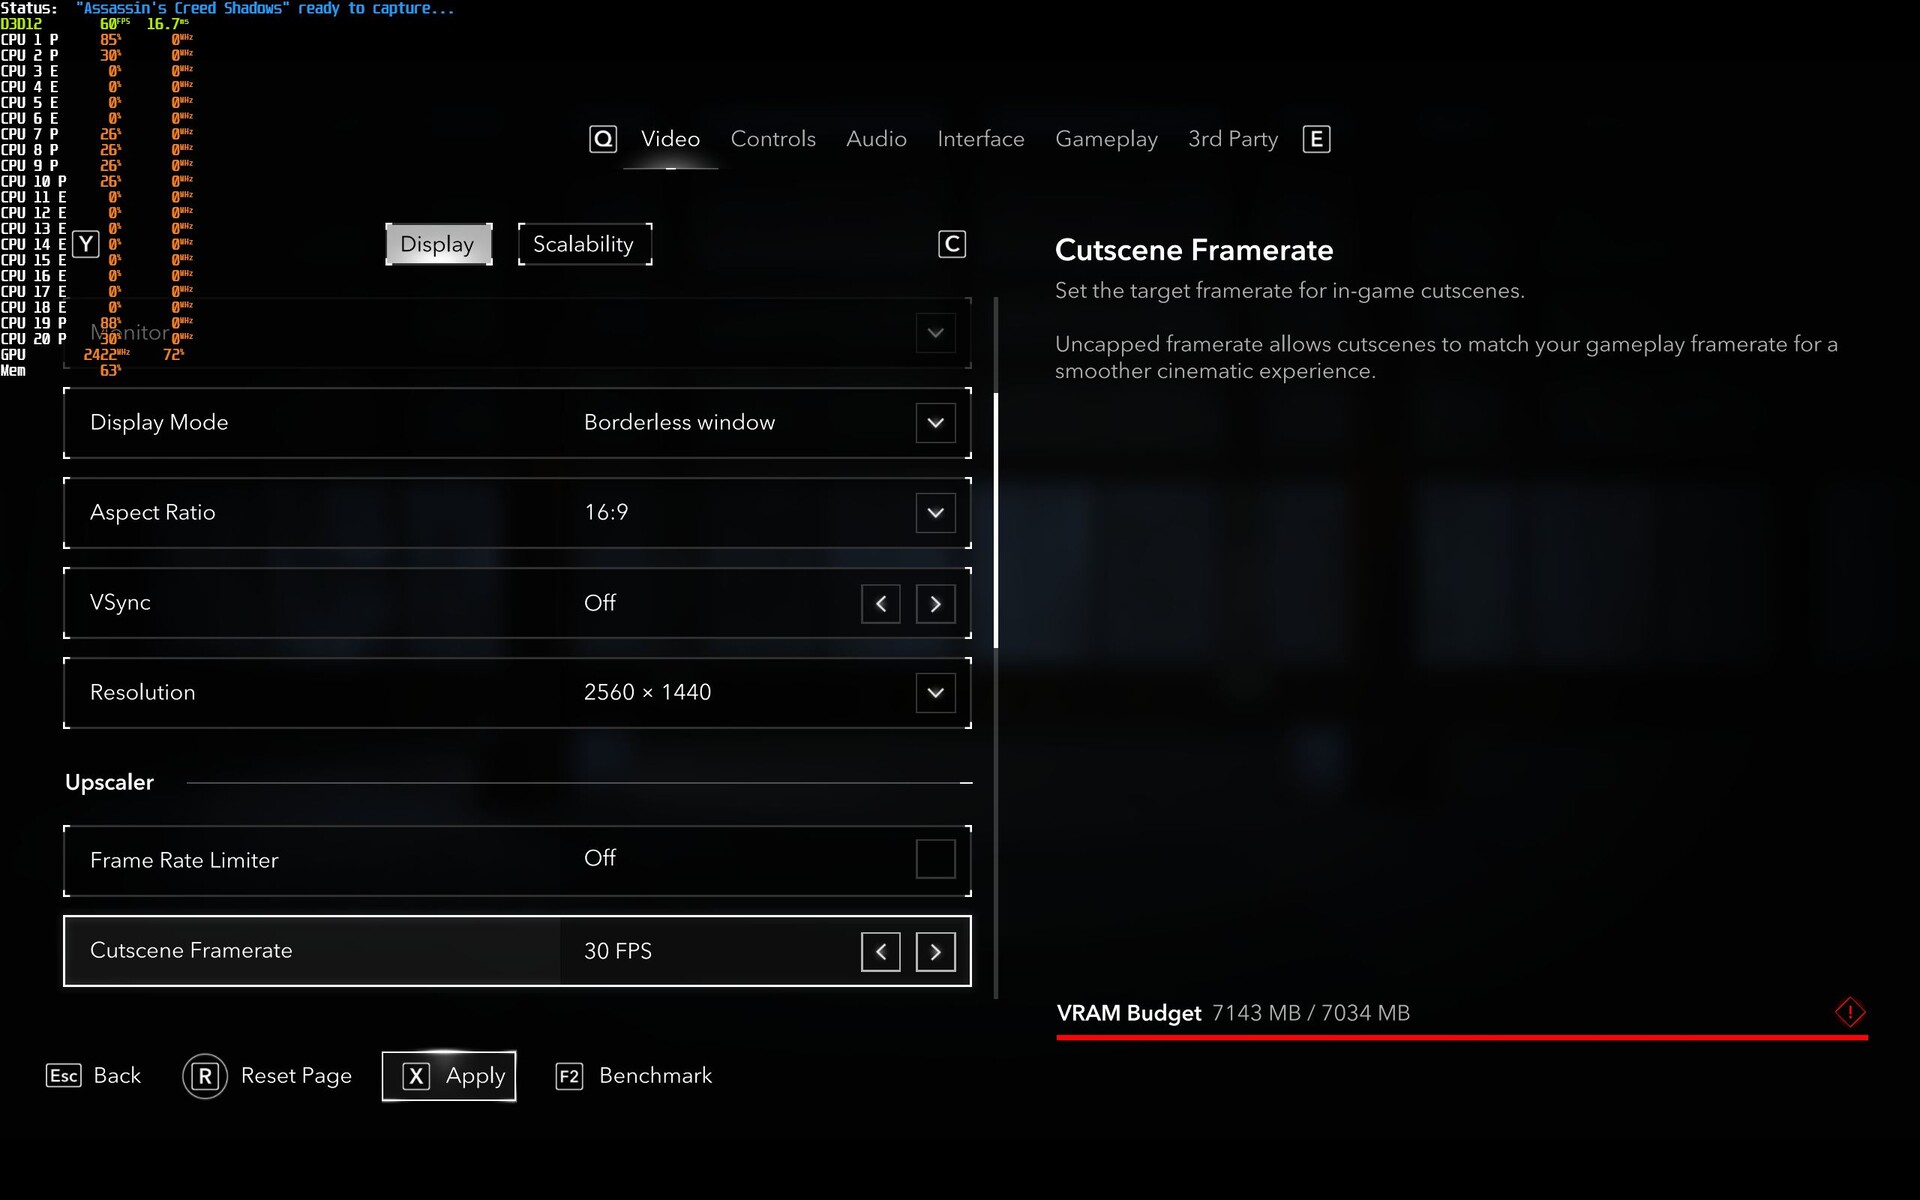
......(英文 RTX 5070配备 8GB VRAM,而 RTX 5070 Ti.在某些分辨率或设置较高的游戏中,这可能会成为一个限制(见下面的截图),不过在我们的测试中,它没有造成卡顿,帧时间基本保持一致。
在《夺宝奇兵:大本营》中,低设置下的全高清游戏已经出现了 VRAM 溢出;游戏在中等细节下依然流畅,但在高设置或超设置下,游戏在启动时会反复崩溃。
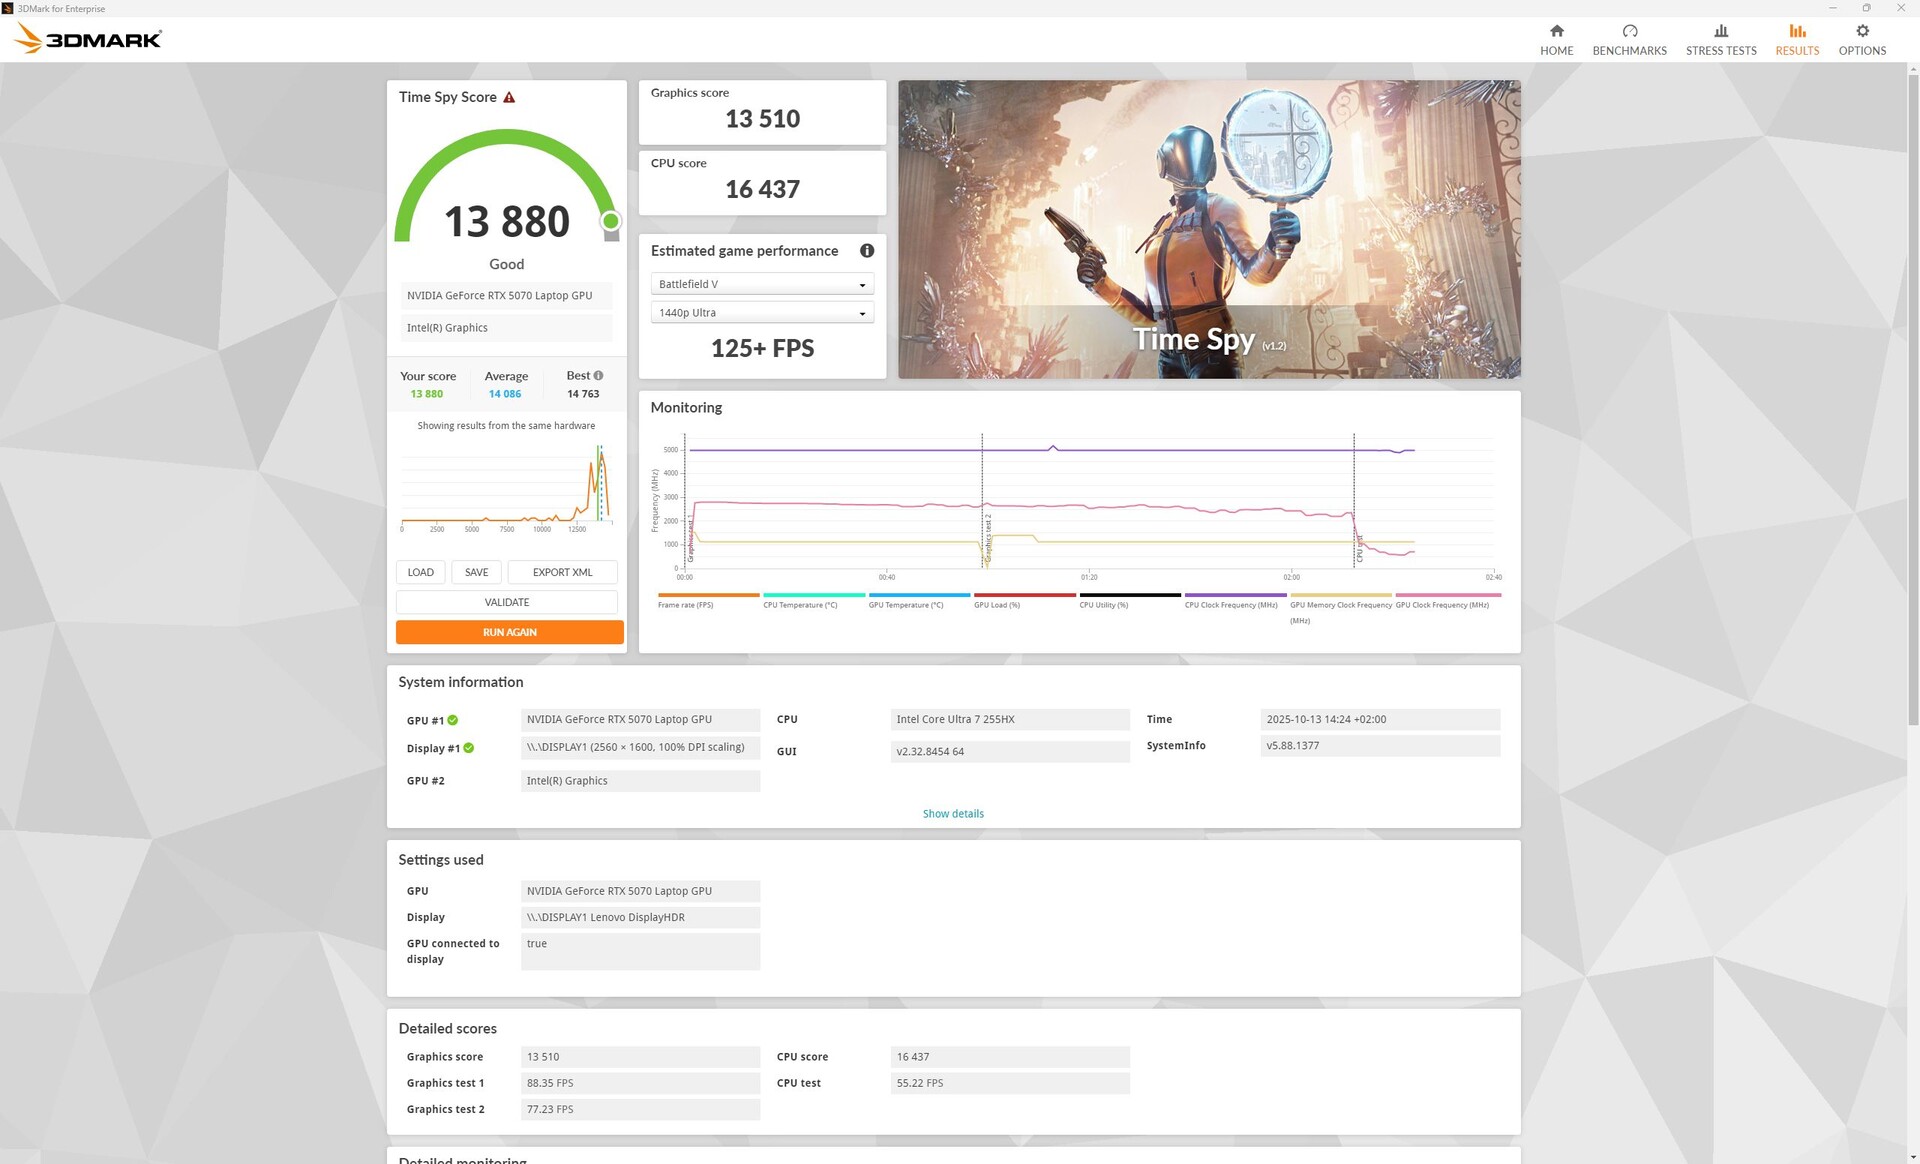
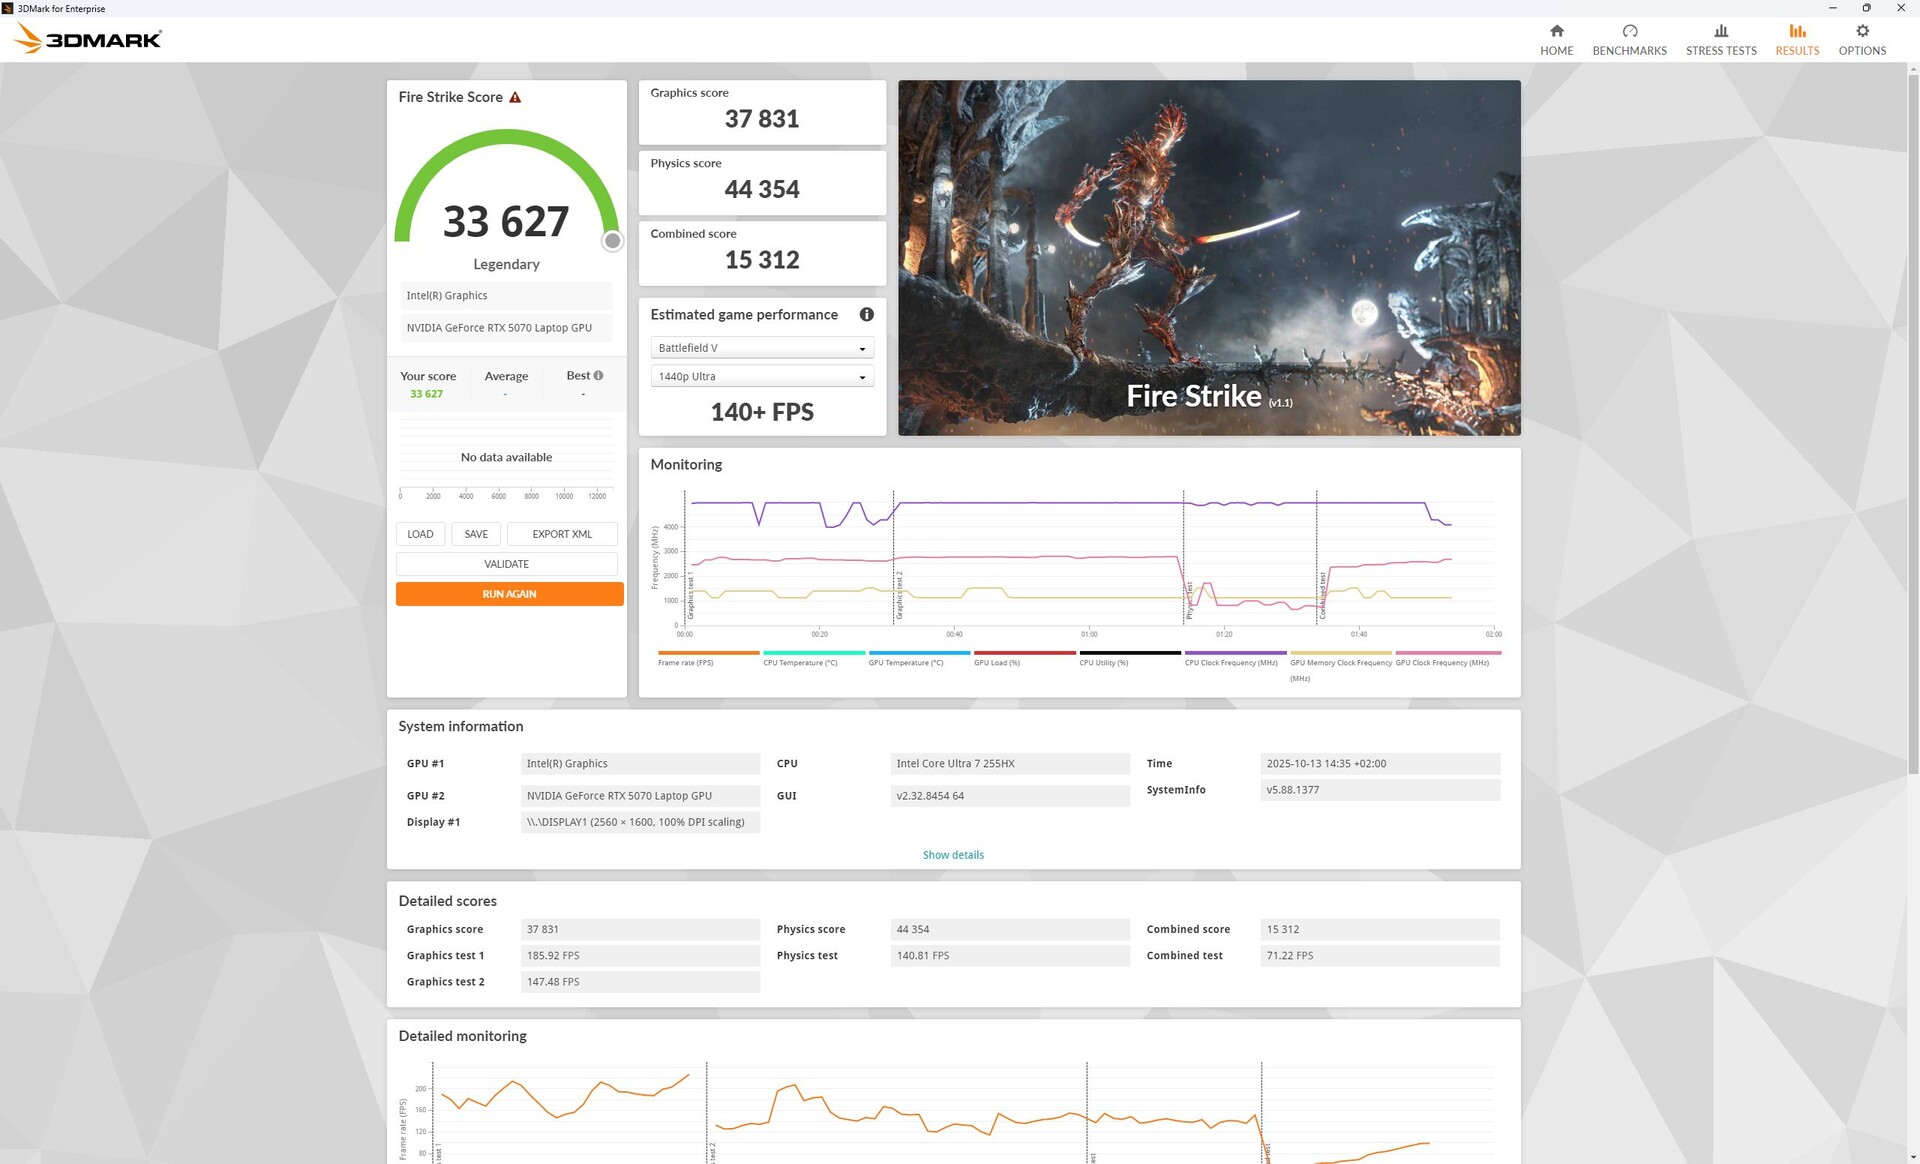
合成 3DMark 测试显示,Ti 版本的分数高出约 25%。
游戏间的比较结果各不相同:像《Dota 2 Reborn》这样依赖 CPU 的游戏几乎没有优势,而像《赛博朋克 2077》或《奇异旅社》这样依赖 GPU 的游戏则在 3DMark 中充分体现了 Ti 的优势。
即便如此,RTX 5070 仍能在高设置下流畅运行大多数现代游戏--QHD 几乎不成问题,在许多情况下甚至可以运行 4K。Ti 版只是在超高要求的游戏(《赛博朋克 2077》(无 DLSS)、《F1 25》)中多挤出几帧。低于 30 帧时,我们没有进一步测量,例如,QHD 下的 F1 25 已经无法流畅播放。
在不插电的情况下,3D 性能急剧下降了 82% (Fire Strike)。
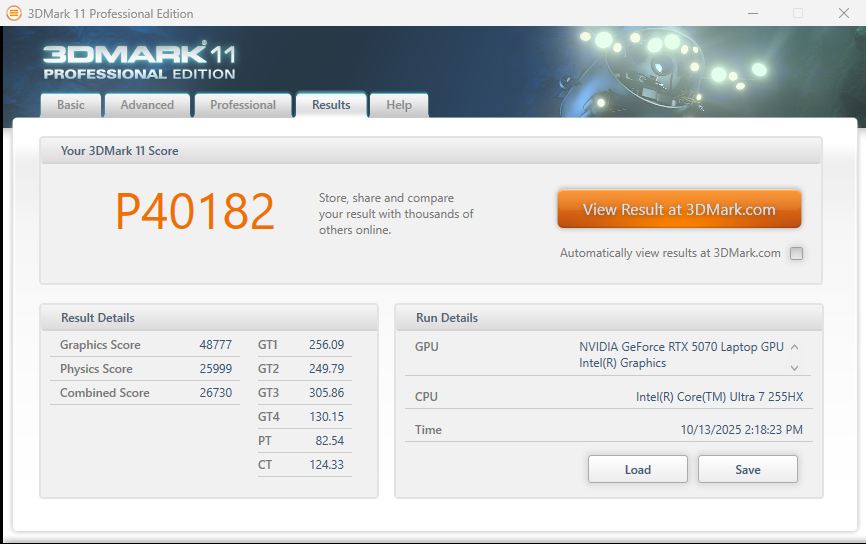
| 3DMark 11 Performance | 40182 points | |
| 3DMark Fire Strike Score | 33627 points | |
| 3DMark Time Spy Score | 13880 points | |
Help | ||
* ... smaller is better
| F1 25 | |
| 1920x1080 Ultra High Preset AA:T AF:16x | |
| Average of class Gaming (46.3 - 120.6, n=26, last 2 years) | |
| Lenovo Legion Pro 5 16IAX10, RTX 5070 | |
| Lenovo Legion 5 Pro 16IAX10H | |
| Average NVIDIA GeForce RTX 5070 Laptop (48.5 - 64.5, n=10) | |
| 1920x1080 Ultra Max Preset AA:T AF:16x | |
| Lenovo Legion 5 Pro 16IAX10H | |
| Average of class Gaming (12.5 - 62.3, n=33, last 2 years) | |
| Lenovo Legion Pro 5 16IAX10, RTX 5070 | |
| Average NVIDIA GeForce RTX 5070 Laptop (25.8 - 31.6, n=11) | |
赛博朋克 2077》超帧频图
| low | med. | high | ultra | QHD DLSS | QHD | 4K DLSS | 4K | |
|---|---|---|---|---|---|---|---|---|
| GTA V (2015) | 187.6 | 186.4 | 184.1 | 153.2 | 126 | 119 | ||
| Dota 2 Reborn (2015) | 203 | 184.2 | 178.1 | 162.4 | 131 | |||
| Final Fantasy XV Benchmark (2018) | 232 | 191.3 | 144.5 | 106.8 | 59.1 | |||
| X-Plane 11.11 (2018) | 135.5 | 117.6 | 101.6 | 80 | ||||
| Strange Brigade (2018) | 560 | 349 | 295 | 246 | 177.4 | 95.8 | ||
| Baldur's Gate 3 (2023) | 192.4 | 153.1 | 134.6 | 130.6 | 135.8 | 90 | 77.6 | 46 |
| Cyberpunk 2077 (2023) | 171.8 | 146.4 | 122 | 107 | 80.7 | 68.3 | 30.2 | |
| Indiana Jones and the Great Circle (2024) | 131.6 | |||||||
| Assassin's Creed Shadows (2025) | 75 | 70 | 60 | 46 | 45 | 38 | ||
| Doom: The Dark Ages (2025) | 96.2 | 88.4 | 74.2 | 72.2 | 70 | 49.4 | 33.2 | |
| F1 25 (2025) | 242 | 227 | 191.9 | 31.6 |
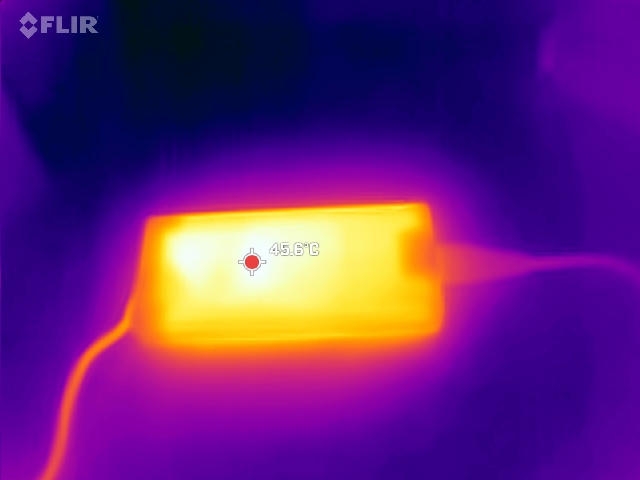
排放和能源--更安静、更冷却、更高效
噪音
在空闲状态下,风扇通常处于关闭状态,但即使在浏览网页等轻负载情况下,风扇也会安静地转动。
在持续负载情况下,风扇比 Ti 型号而竞争对手则显示出类似的数字。在平衡模式下,GPU 功耗大约降低了 12%,而《赛博朋克 2077》中的风扇噪音却只有它的一半(记住:+3 dB ≈ 感觉噪音的两倍)。
Noise level
| Idle |
| 23 / 23 / 23 dB(A) |
| Load |
| 43.85 / 52.9 dB(A) |
 | ||
30 dB silent 40 dB(A) audible 50 dB(A) loud |
||
min: | ||
| Lenovo Legion Pro 5 16IAX10, RTX 5070 Ultra 7 255HX, GeForce RTX 5070 Laptop | Lenovo Legion 5 Pro 16IAX10H Ultra 9 275HX, GeForce RTX 5070 Ti Laptop | Alienware 16X Aurora, RTX 5070 Ultra 9 275HX, GeForce RTX 5070 Laptop | Gigabyte Aero X16 1WH Ryzen AI 7 350, GeForce RTX 5070 Laptop | Asus TUF Gaming A16 FA608UP R7 260, GeForce RTX 5070 Laptop | Schenker XMG Core 16 M25 Ryzen AI 9 HX 370, GeForce RTX 5070 Laptop | Gigabyte Gaming A16 GA6H i7-13620H, GeForce RTX 5070 Laptop | |
|---|---|---|---|---|---|---|---|
| Noise | -13% | 0% | 2% | -19% | -4% | -11% | |
| off / environment * (dB) | 23 | 24 -4% | 23.7 -3% | 23.9 -4% | 25.1 -9% | 24.8 -8% | 24 -4% |
| Idle Minimum * (dB) | 23 | 24 -4% | 23.9 -4% | 23.9 -4% | 32.2 -40% | 24.8 -8% | 25 -9% |
| Idle Average * (dB) | 23 | 24 -4% | 23.9 -4% | 23.9 -4% | 32.2 -40% | 24.8 -8% | 26 -13% |
| Idle Maximum * (dB) | 23 | 30.9 -34% | 26.1 -13% | 23.9 -4% | 32.2 -40% | 27.1 -18% | 27 -17% |
| Load Average * (dB) | 43.85 | 55.9 -27% | 26.8 39% | 33.2 24% | 38.1 13% | 40.2 8% | 54 -23% |
| Cyberpunk 2077 ultra * (dB) | 50.27 | 56.72 -13% | 51.8 -3% | 50.2 -0% | 53.9 -7% | 49.2 2% | 54 -7% |
| Load Maximum * (dB) | 52.9 | 56.72 -7% | 58 -10% | 50.2 5% | 57.1 -8% | 49.2 7% | 55 -4% |
* ... smaller is better
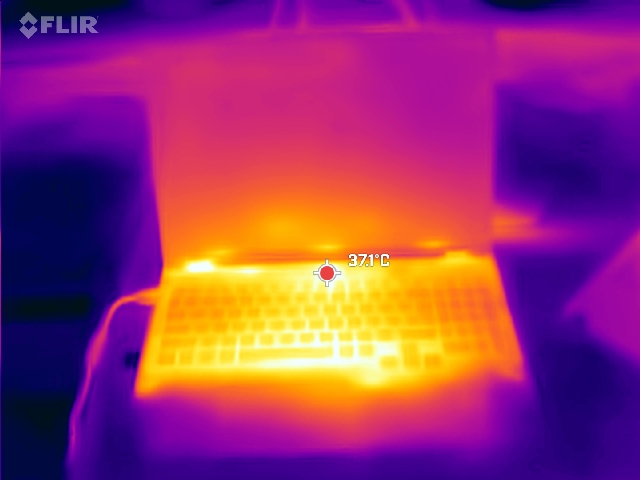
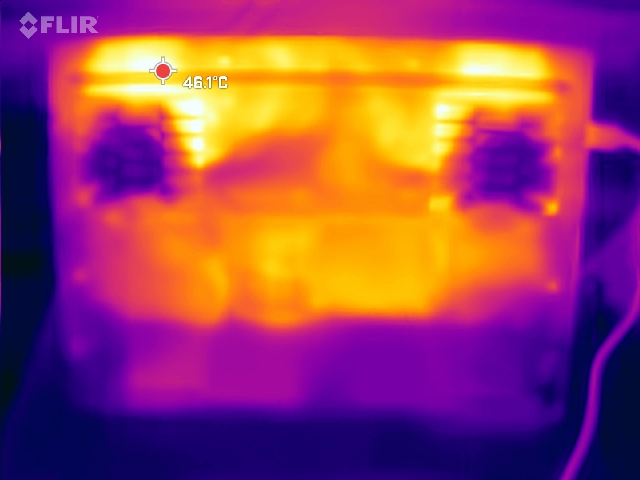
温度
在负载情况下,该机型的运行温度比 Ti 变体.我们在后部底部测得的热点温度为 44 °C(Ti 为 50 °C)。WASD 键的温度保持在 37 °C,掌托保持舒适。
(±) The maximum temperature on the upper side is 42 °C / 108 F, compared to the average of 40.4 °C / 105 F, ranging from 21.2 to 68.8 °C for the class Gaming.
(±) The bottom heats up to a maximum of 44 °C / 111 F, compared to the average of 43.2 °C / 110 F
(+) In idle usage, the average temperature for the upper side is 29.8 °C / 86 F, compared to the device average of 33.9 °C / 93 F.
(±) 3: The average temperature for the upper side is 34.3 °C / 94 F, compared to the average of 33.9 °C / 93 F for the class Gaming.
(+) The palmrests and touchpad are cooler than skin temperature with a maximum of 31 °C / 87.8 F and are therefore cool to the touch.
(-) The average temperature of the palmrest area of similar devices was 28.8 °C / 83.8 F (-2.2 °C / -4 F).
| Lenovo Legion Pro 5 16IAX10, RTX 5070 Ultra 7 255HX, GeForce RTX 5070 Laptop | Lenovo Legion 5 Pro 16IAX10H Ultra 9 275HX, GeForce RTX 5070 Ti Laptop | Alienware 16X Aurora, RTX 5070 Ultra 9 275HX, GeForce RTX 5070 Laptop | Gigabyte Aero X16 1WH Ryzen AI 7 350, GeForce RTX 5070 Laptop | Asus TUF Gaming A16 FA608UP R7 260, GeForce RTX 5070 Laptop | Schenker XMG Core 16 M25 Ryzen AI 9 HX 370, GeForce RTX 5070 Laptop | Gigabyte Gaming A16 GA6H i7-13620H, GeForce RTX 5070 Laptop | |
|---|---|---|---|---|---|---|---|
| Heat | -17% | 1% | 5% | 13% | -5% | -9% | |
| Maximum Upper Side * (°C) | 42 | 48 -14% | 51 -21% | 43.3 -3% | 39.5 6% | 46.7 -11% | 50 -19% |
| Maximum Bottom * (°C) | 44 | 50 -14% | 45.6 -4% | 50.3 -14% | 45.1 -3% | 58.5 -33% | 49 -11% |
| Idle Upper Side * (°C) | 33 | 38 -15% | 29.8 10% | 27 18% | 25.7 22% | 28.3 14% | 35 -6% |
| Idle Bottom * (°C) | 34 | 42 -24% | 27.4 19% | 28.3 17% | 25.5 25% | 29.9 12% | 34 -0% |
* ... smaller is better
发言人
正如我们在 原始评论扬声器有些安静,低音不足,但高音均衡。有一个用于外接音频设备的 3.5 毫米插孔。
Lenovo Legion Pro 5 16IAX10, RTX 5070 audio analysis
(±) | speaker loudness is average but good (75.73 dB)
Bass 100 - 315 Hz
(-) | nearly no bass - on average 20% lower than median
(±) | linearity of bass is average (9.3% delta to prev. frequency)
Mids 400 - 2000 Hz
(±) | higher mids - on average 6.1% higher than median
(±) | linearity of mids is average (7.9% delta to prev. frequency)
Highs 2 - 16 kHz
(+) | balanced highs - only 2.2% away from median
(+) | highs are linear (6.3% delta to prev. frequency)
Overall 100 - 16.000 Hz
(±) | linearity of overall sound is average (19.4% difference to median)
Compared to same class
» 67% of all tested devices in this class were better, 7% similar, 26% worse
» The best had a delta of 6%, average was 18%, worst was 132%
Compared to all devices tested
» 48% of all tested devices were better, 7% similar, 45% worse
» The best had a delta of 4%, average was 23%, worst was 134%
Apple MacBook Pro 16 2021 M1 Pro audio analysis
(+) | speakers can play relatively loud (84.7 dB)
Bass 100 - 315 Hz
(+) | good bass - only 3.8% away from median
(+) | bass is linear (5.2% delta to prev. frequency)
Mids 400 - 2000 Hz
(+) | balanced mids - only 1.3% away from median
(+) | mids are linear (2.1% delta to prev. frequency)
Highs 2 - 16 kHz
(+) | balanced highs - only 1.9% away from median
(+) | highs are linear (2.7% delta to prev. frequency)
Overall 100 - 16.000 Hz
(+) | overall sound is linear (4.6% difference to median)
Compared to same class
» 0% of all tested devices in this class were better, 0% similar, 100% worse
» The best had a delta of 5%, average was 17%, worst was 45%
Compared to all devices tested
» 0% of all tested devices were better, 0% similar, 100% worse
» The best had a delta of 4%, average was 23%, worst was 134%
耗电量
| Off / Standby | |
| Idle | |
| Load |
|
Key:
min: | |
| Lenovo Legion Pro 5 16IAX10, RTX 5070 Ultra 7 255HX, GeForce RTX 5070 Laptop, SK Hynix HFS001TEJ9X115N, OLED, 2650x1600, 16" | Lenovo Legion 5 Pro 16IAX10H Ultra 9 275HX, GeForce RTX 5070 Ti Laptop, Western Digital PC SN8000S SDEPNRK-1T00, OLED, 2560x1600, 16" | Alienware 16X Aurora, RTX 5070 Ultra 9 275HX, GeForce RTX 5070 Laptop, , IPS, 2560x1600, 16" | Gigabyte Aero X16 1WH Ryzen AI 7 350, GeForce RTX 5070 Laptop, Kingston OM8PGP41024Q-A0, IPS, 2560x1600, 16" | Asus TUF Gaming A16 FA608UP R7 260, GeForce RTX 5070 Laptop, Western Digital PC SN5000S SDEQNSJ-1T00, IPS, 2560x1600, 16" | Schenker XMG Core 16 M25 Ryzen AI 9 HX 370, GeForce RTX 5070 Laptop, Samsung 990 Pro 2 TB MZVL72T0HDLB, IPS, 2560x1600, 16" | Gigabyte Gaming A16 GA6H i7-13620H, GeForce RTX 5070 Laptop, Kingston OM8PGP41024Q-A0, IPS, 2560x1600, 16" | Average NVIDIA GeForce RTX 5070 Laptop | Average of class Gaming | |
|---|---|---|---|---|---|---|---|---|---|
| Power Consumption | -24% | -40% | 34% | 26% | 10% | 20% | -5% | -23% | |
| Idle Minimum * (Watt) | 10.6 | 14 -32% | 20.1 -90% | 5.8 45% | 4.6 57% | 7.4 30% | 9 15% | 10.8 ? -2% | 13 ? -23% |
| Idle Average * (Watt) | 12.3 | 14.3 -16% | 27.6 -124% | 10.9 11% | 9.8 20% | 14.9 -21% | 11 11% | 15.4 ? -25% | 18.7 ? -52% |
| Idle Maximum * (Watt) | 18.6 | 20.1 -8% | 31.8 -71% | 11.2 40% | 10.2 45% | 15.2 18% | 23 -24% | 21 ? -13% | 24.3 ? -31% |
| Load Average * (Watt) | 104 | 177 -70% | 102.7 1% | 91.3 12% | 76.1 27% | 100.8 3% | 91 12% | 98.7 ? 5% | 110.2 ? -6% |
| Cyberpunk 2077 ultra * (Watt) | 231 | 255 -10% | 217 6% | 123.8 46% | 198.9 14% | 184.8 20% | 132.5 43% | ||
| Cyberpunk 2077 ultra external monitor * (Watt) | 227 | 255 -12% | 192.3 15% | 117.9 48% | 198.1 13% | 181.4 20% | 130 43% | ||
| Load Maximum * (Watt) | 248 | 294 -19% | 292 -18% | 155.3 37% | 235.2 5% | 251.1 -1% | 155 37% | 218 ? 12% | 258 ? -4% |
* ... smaller is better
功耗 赛博朋克/压力测试
带外部监视器时的耗电量
电池寿命
80 Wh 电池保持不变。在我们的 WLAN 和视频播放测试中,这款笔记本电脑的续航时间约为 6 小时,比 Ti 机型多出约 1 小时。 Ti 机型.
| Lenovo Legion Pro 5 16IAX10, RTX 5070 Ultra 7 255HX, GeForce RTX 5070 Laptop, 80 Wh | Lenovo Legion 5 Pro 16IAX10H Ultra 9 275HX, GeForce RTX 5070 Ti Laptop, 80 Wh | Alienware 16X Aurora, RTX 5070 Ultra 9 275HX, GeForce RTX 5070 Laptop, 96 Wh | Gigabyte Aero X16 1WH Ryzen AI 7 350, GeForce RTX 5070 Laptop, 76 Wh | Asus TUF Gaming A16 FA608UP R7 260, GeForce RTX 5070 Laptop, 90 Wh | Schenker XMG Core 16 M25 Ryzen AI 9 HX 370, GeForce RTX 5070 Laptop, 99.8 Wh | Gigabyte Gaming A16 GA6H i7-13620H, GeForce RTX 5070 Laptop, 76 Wh | Average of class Gaming | |
|---|---|---|---|---|---|---|---|---|
| Battery runtime | -16% | -31% | 39% | 110% | 76% | 24% | 13% | |
| H.264 (h) | 6.1 | 4.8 -21% | 8.64 ? 42% | |||||
| WiFi v1.3 (h) | 6.2 | 4.9 -21% | 4.3 -31% | 8.6 39% | 13 110% | 10.9 76% | 7.7 24% | 7.15 ? 15% |
| Load (h) | 1.8 | 1.7 -6% | 1.502 ? -17% |
Notebookcheck 的总体印象
即使是非 Ti RTX 5070,联想Legion Pro 5 16 也是一款功能强大的游戏笔记本电脑,而且比 Ti 版本便宜 500-700 欧元,非常划算。
Lenovo Legion Pro 5 16IAX10, RTX 5070
- 10/22/2025 v8
Christian Hintze
 Total Sustainability Score:
 潜在替代品比较
Image | Model / Review | Price | Weight | Height | Display |
|---|---|---|---|---|---|
1. 86.2%  | Lenovo Legion Pro 5 16IAX10, RTX 5070 Intel Core Ultra 7 255HX ⎘ NVIDIA GeForce RTX 5070 Laptop ⎘ 32 GB Memory, 1024 GB SSD | Amazon: List Price: 1800 Euro | 2.3 kg | 25.95 mm | 16.00" 2650x1600 189 PPI OLED |
2. 84.5% 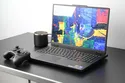 | Lenovo Legion 5 Pro 16IAX10H Intel Core Ultra 9 275HX ⎘ NVIDIA GeForce RTX 5070 Ti Laptop ⎘ 32 GB Memory, 1024 GB SSD | Amazon: 1. $2,999.00 Lenovo Legion Pro 5i Gen 10 ... 2. $3,369.00 Lenovo Legion Pro 7 16IAX10H... 3. $3,489.99 Lenovo Legion Pro 7 16IAX10H... List Price: 2500 Euro | 2.4 kg | 25.95 mm | 16.00" 2560x1600 189 PPI OLED |
3. 84.9%  | Alienware 16X Aurora, RTX 5070 Intel Core Ultra 9 275HX ⎘ NVIDIA GeForce RTX 5070 Laptop ⎘ 32 GB Memory | Amazon: List Price: 1800 USD | 2.5 kg | 23.4 mm | 16.00" 2560x1600 189 PPI IPS |
4. 83.7%  | Gigabyte Aero X16 1WH AMD Ryzen AI 7 350 ⎘ NVIDIA GeForce RTX 5070 Laptop ⎘ 32 GB Memory, 1024 GB SSD | Amazon: List Price: 1799€ | 2 kg | 19.9 mm | 16.00" 2560x1600 189 PPI IPS |
5. 83.8%  | Asus TUF Gaming A16 FA608UP AMD Ryzen 7 260 ⎘ NVIDIA GeForce RTX 5070 Laptop ⎘ 32 GB Memory, 1024 GB SSD | Amazon: List Price: 2199€ | 2.2 kg | 25.7 mm | 16.00" 2560x1600 189 PPI IPS |
6. 86.2%  | Schenker XMG Core 16 M25 AMD Ryzen AI 9 HX 370 ⎘ NVIDIA GeForce RTX 5070 Laptop ⎘ 64 GB Memory, 2048 GB SSD | Amazon: List Price: 2100€ | 2.1 kg | 23 mm | 16.00" 2560x1600 189 PPI IPS |
7. 80.1%  | Gigabyte Gaming A16 GA6H Intel Core i7-13620H ⎘ NVIDIA GeForce RTX 5070 Laptop ⎘ 16 GB Memory, 1024 GB SSD | Amazon: 1. $1,091.55 GIGABYTE - Gaming A16 Gaming... 2. $1,227.99 GIGABYTE - Gaming A16 Gaming... 3. $1,067.59 GIGABYTE - Gaming A16 Gaming... List Price: 1700 EUR | 2.3 kg | 23 mm | 16.00" 2560x1600 189 PPI IPS |
Transparency
The selection of devices to be reviewed is made by our editorial team. The test sample was provided to the author as a loan by the manufacturer or retailer for the purpose of this review. The lender had no influence on this review, nor did the manufacturer receive a copy of this review before publication. There was no obligation to publish this review. As an independent media company, Notebookcheck is not subjected to the authority of manufacturers, retailers or publishers.
This is how Notebookcheck is testing
Every year, Notebookcheck independently reviews hundreds of laptops and smartphones using standardized procedures to ensure that all results are comparable. We have continuously developed our test methods for around 20 years and set industry standards in the process. In our test labs, high-quality measuring equipment is utilized by experienced technicians and editors. These tests involve a multi-stage validation process. Our complex rating system is based on hundreds of well-founded measurements and benchmarks, which maintains objectivity. Further information on our test methods can be found here.

