结论华硕 TUF Gaming A16 现在拥有更好的显示屏和更快的图形处理器
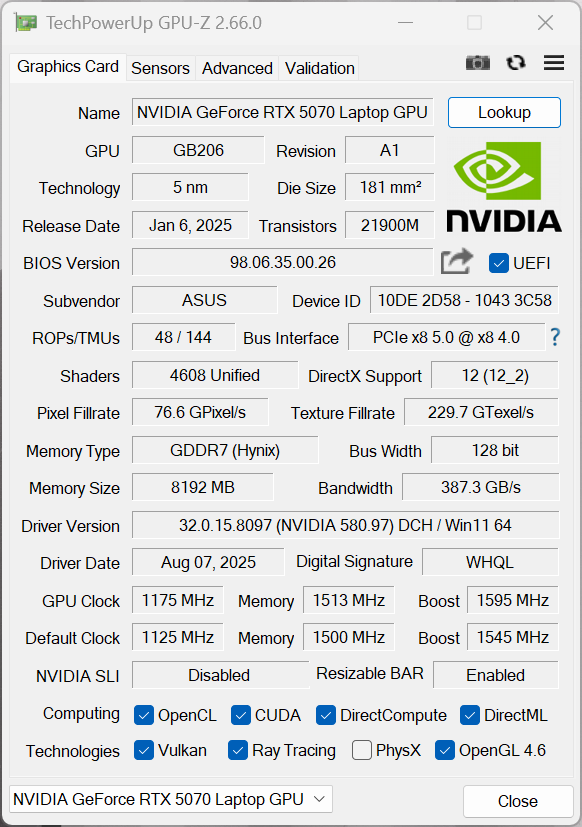
华硕为其 16 英寸 TUF Gaming A16 游戏笔记本带来了多项改进,尤其是显示屏,现在还可以轻松升级内存。GPU 采用了全新的 Nvidia Blackwell 代处理器,以及 GeForce RTX 5070 笔记本电脑即使在 QHD 分辨率下也能播放当前大多数游戏,不过由于 8GB VRAM 较低,可能会有一些限制。
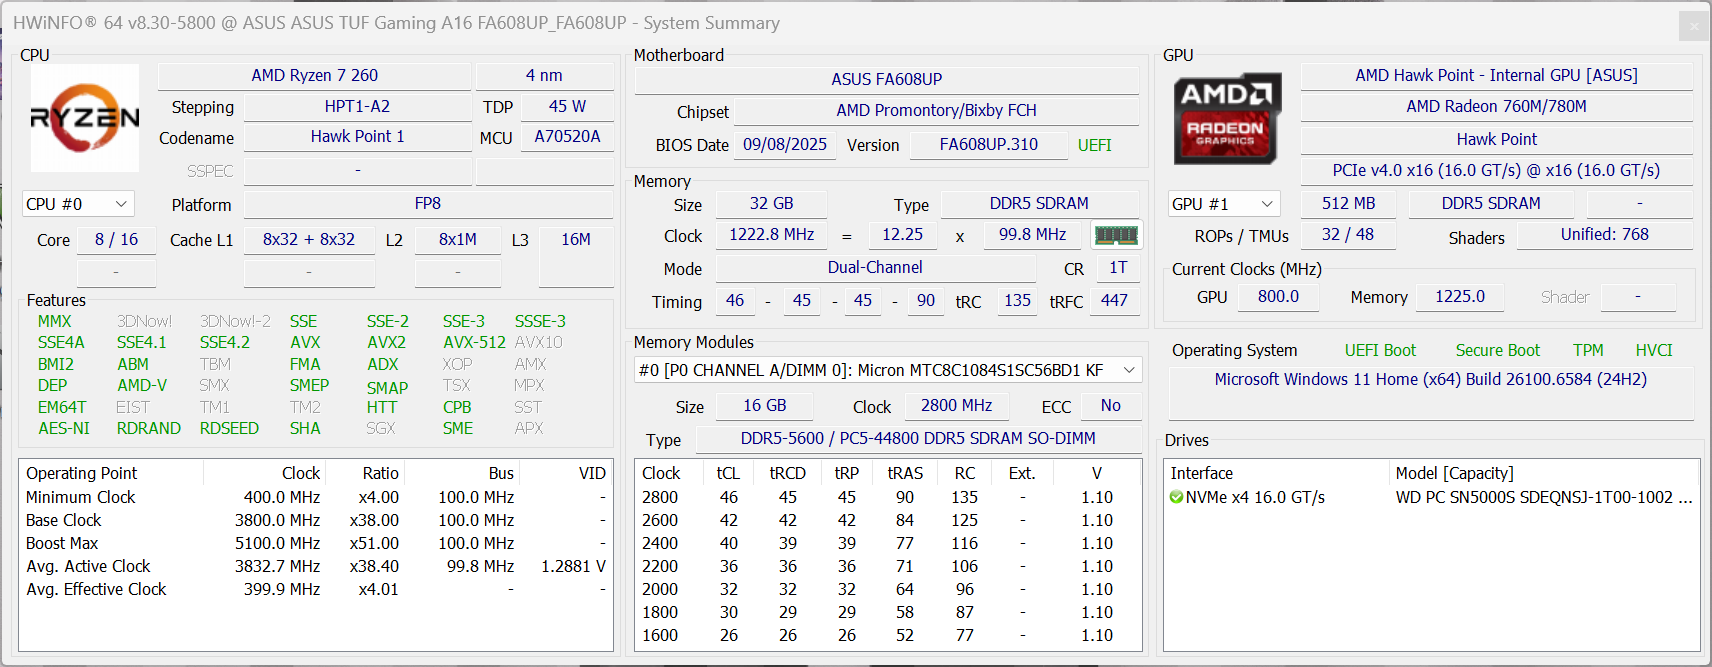
不过,处理器的选择对我们来说并没有直接意义。AMD Ryzen 7 260 基于 Zen 4 架构,并不算新,这也会对某些游戏的性能产生负面影响。在这一点上,TUF Gaming A16 似乎有些不平衡。
这幅图也是功能方面的延续。如前所述,它有良好的维护选项和其他有用的功能,如 G-Sync 和高级 Optimus 图形切换,但你不得不放弃 USB 4 或 Wi-Fi 7。尽管如此,输入设备还是很舒适的,电池续航时间也非常不错。
总而言之,新款 TUF Gaming A16 是一款不错的游戏笔记本电脑,但售价也相当高,达到了 2200 欧元。目前,我们的竞争对手 XMG Core 16 的价格要便宜 300 欧元左右,配备了更先进的 Zen 5 处理器和 RTX 5070 笔记本电脑,内存规格也与之相当。
Pros
Cons
价格和供应情况
华硕 TUF Gaming A16 的评测配置可直接从华硕商店订购,价格为 2,199 欧元。.
在美国亚马逊上,配备 Ryzen 9 290、RTX 5070 笔记本电脑和 FHD+ 165 Hz 显示屏的华硕 TUF Gaming A16售价为 1,779 美元。
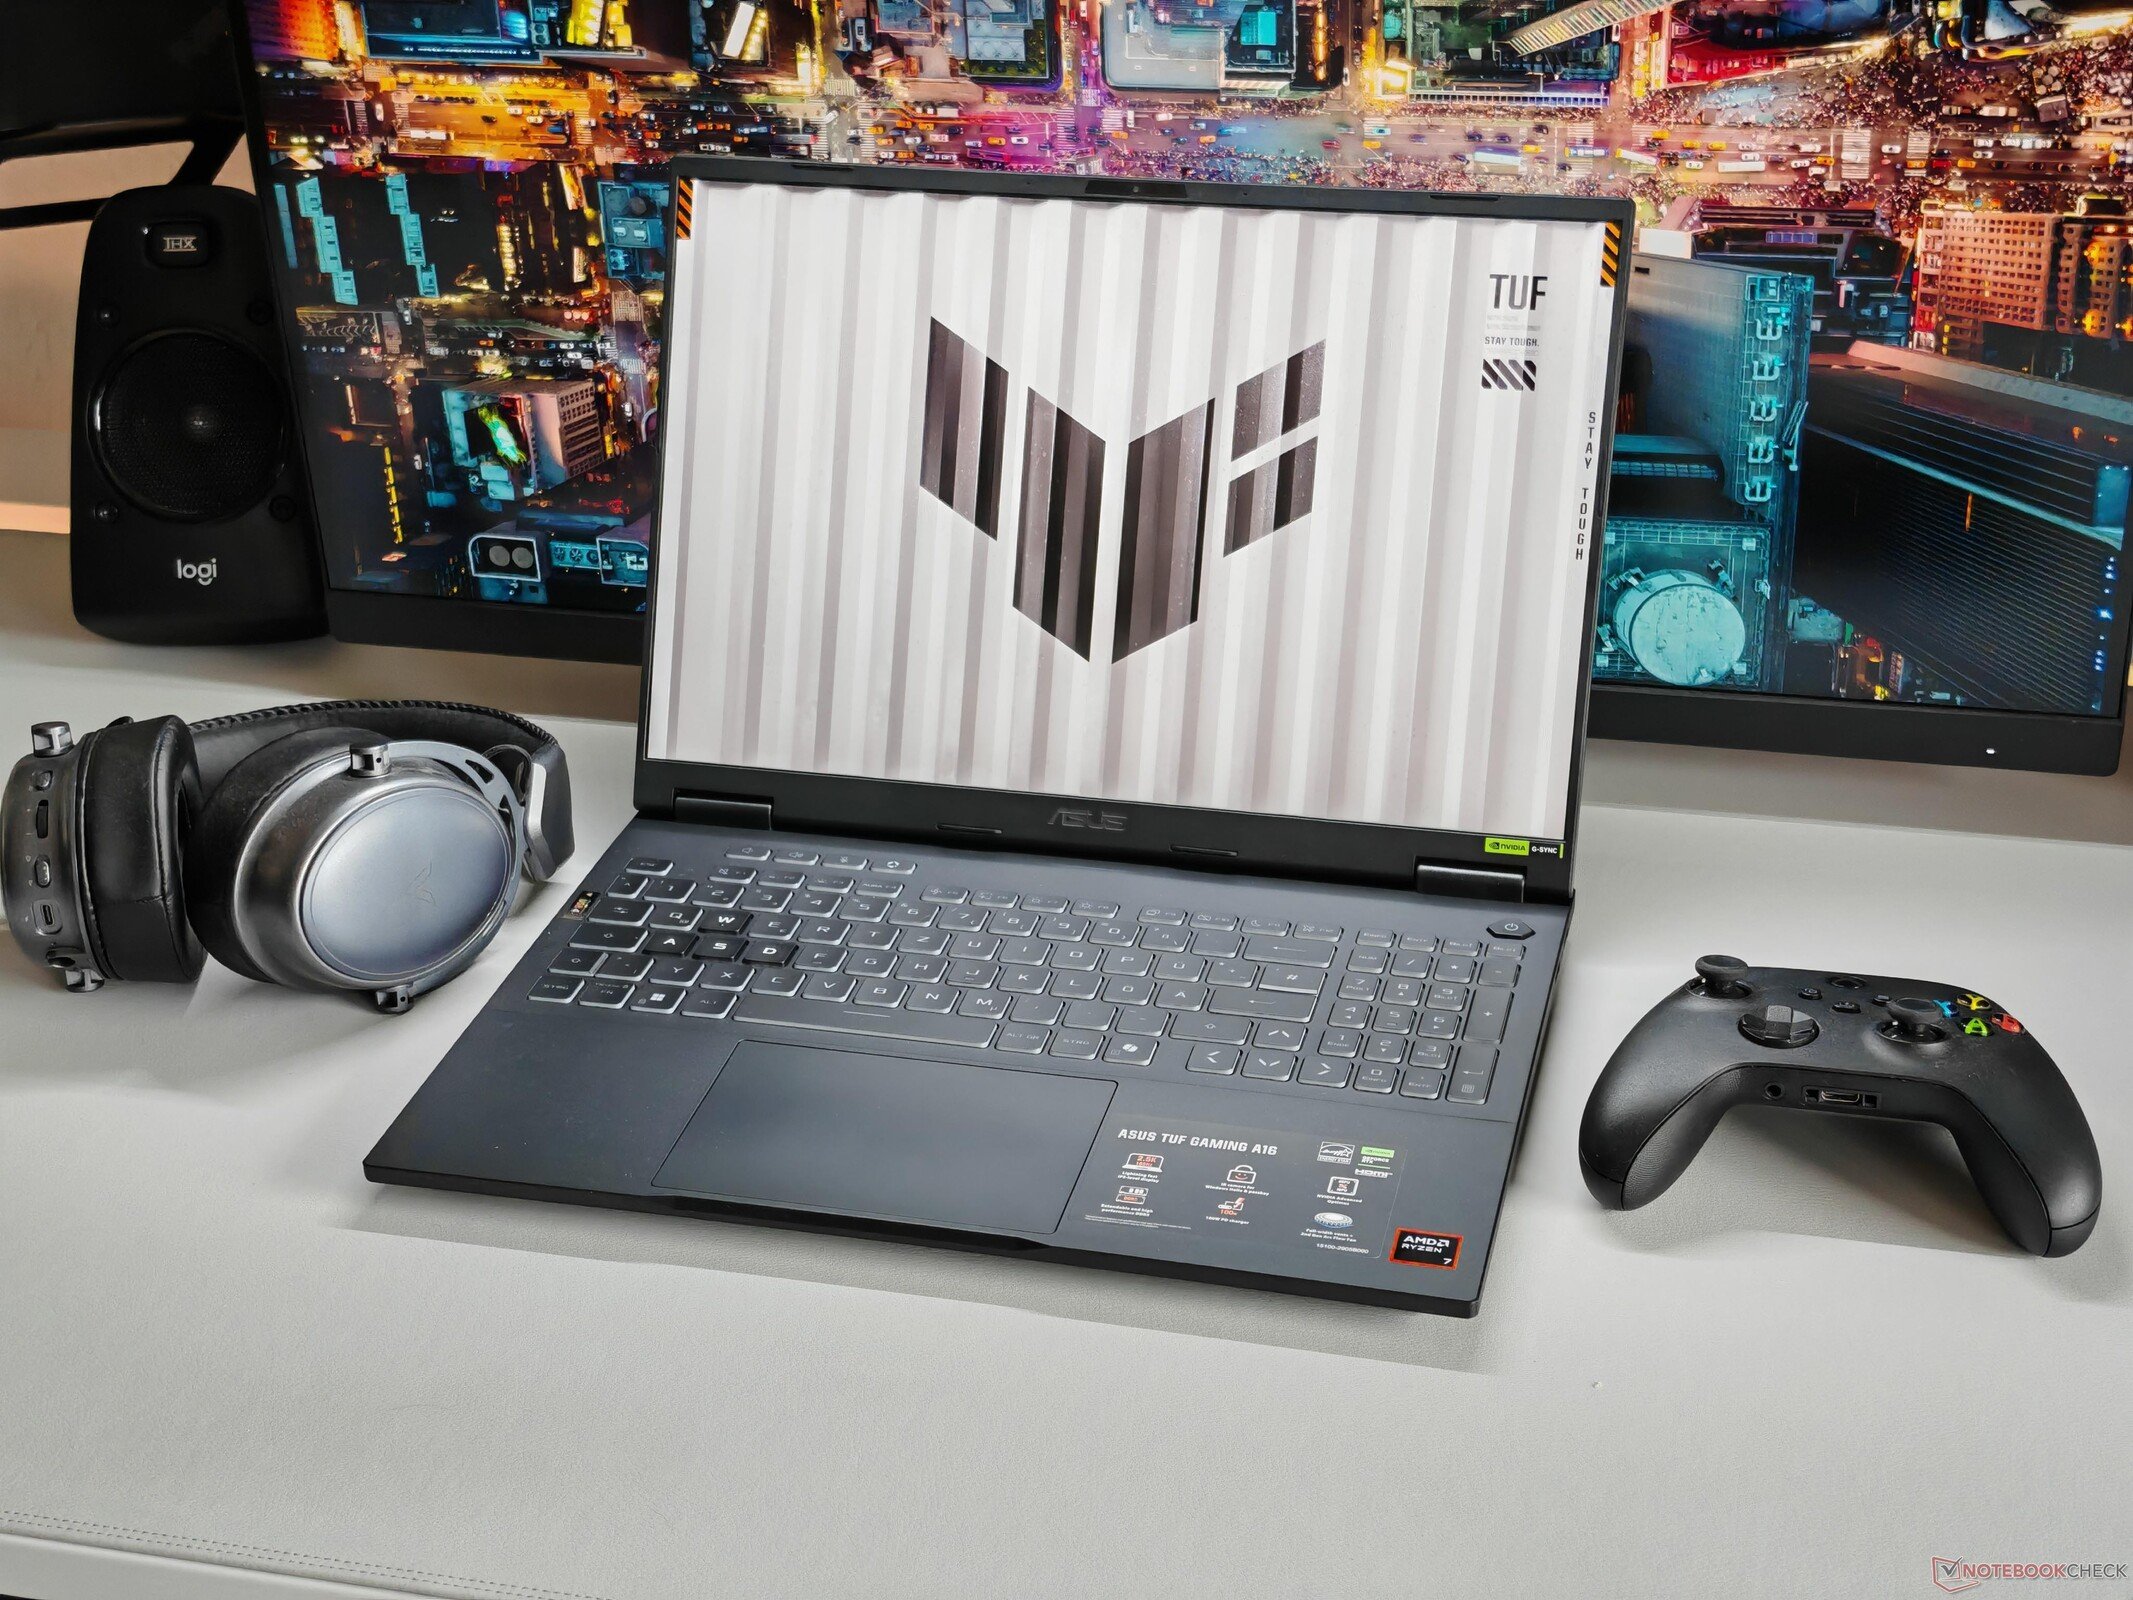
华硕推出的 TUF Gaming A16 是一款 16 英寸游戏笔记本,配备了新的 GeForce RTX 5070 笔记本电脑与快速的 165 Hz 显示屏配合使用。
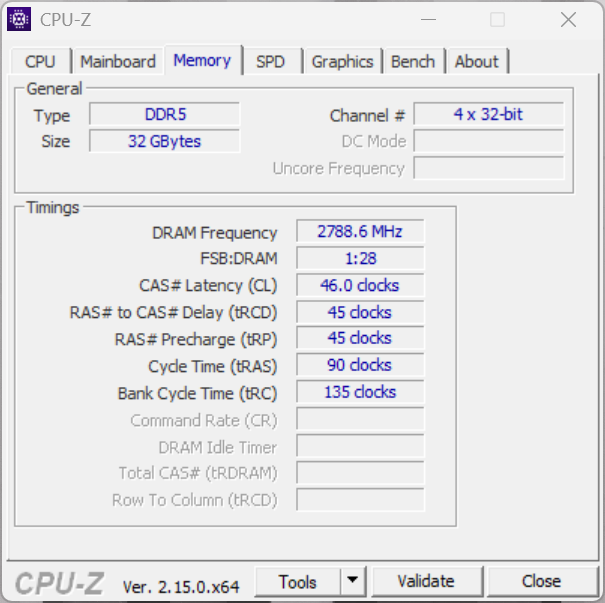
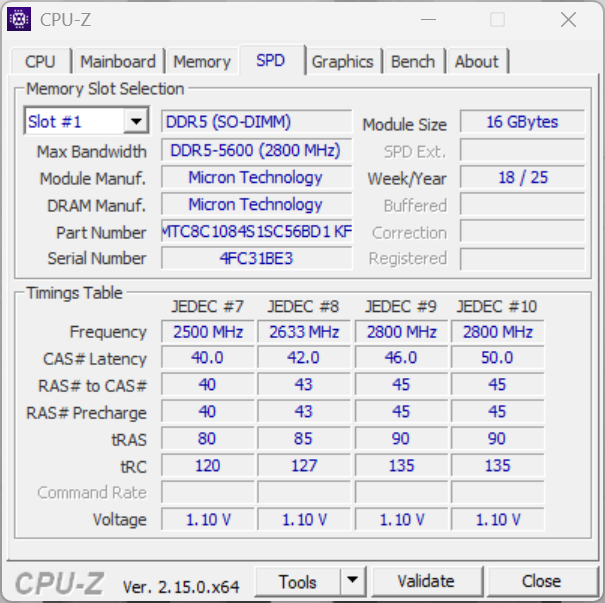
不过,为了降低成本,华硕使用了 AMD 较旧的 Zen 4 处理器。我们测试设备的零售价为 2199 欧元,可获得 Ryzen 7 260APU 、32 GB 内存、1 TB 固态硬盘、RTX 5070 笔记本 GPU 和 165 Hz WQHD 面板。
这是一个正确的选择,还是放弃某些功能而选择当前的处理器会更好?
规格
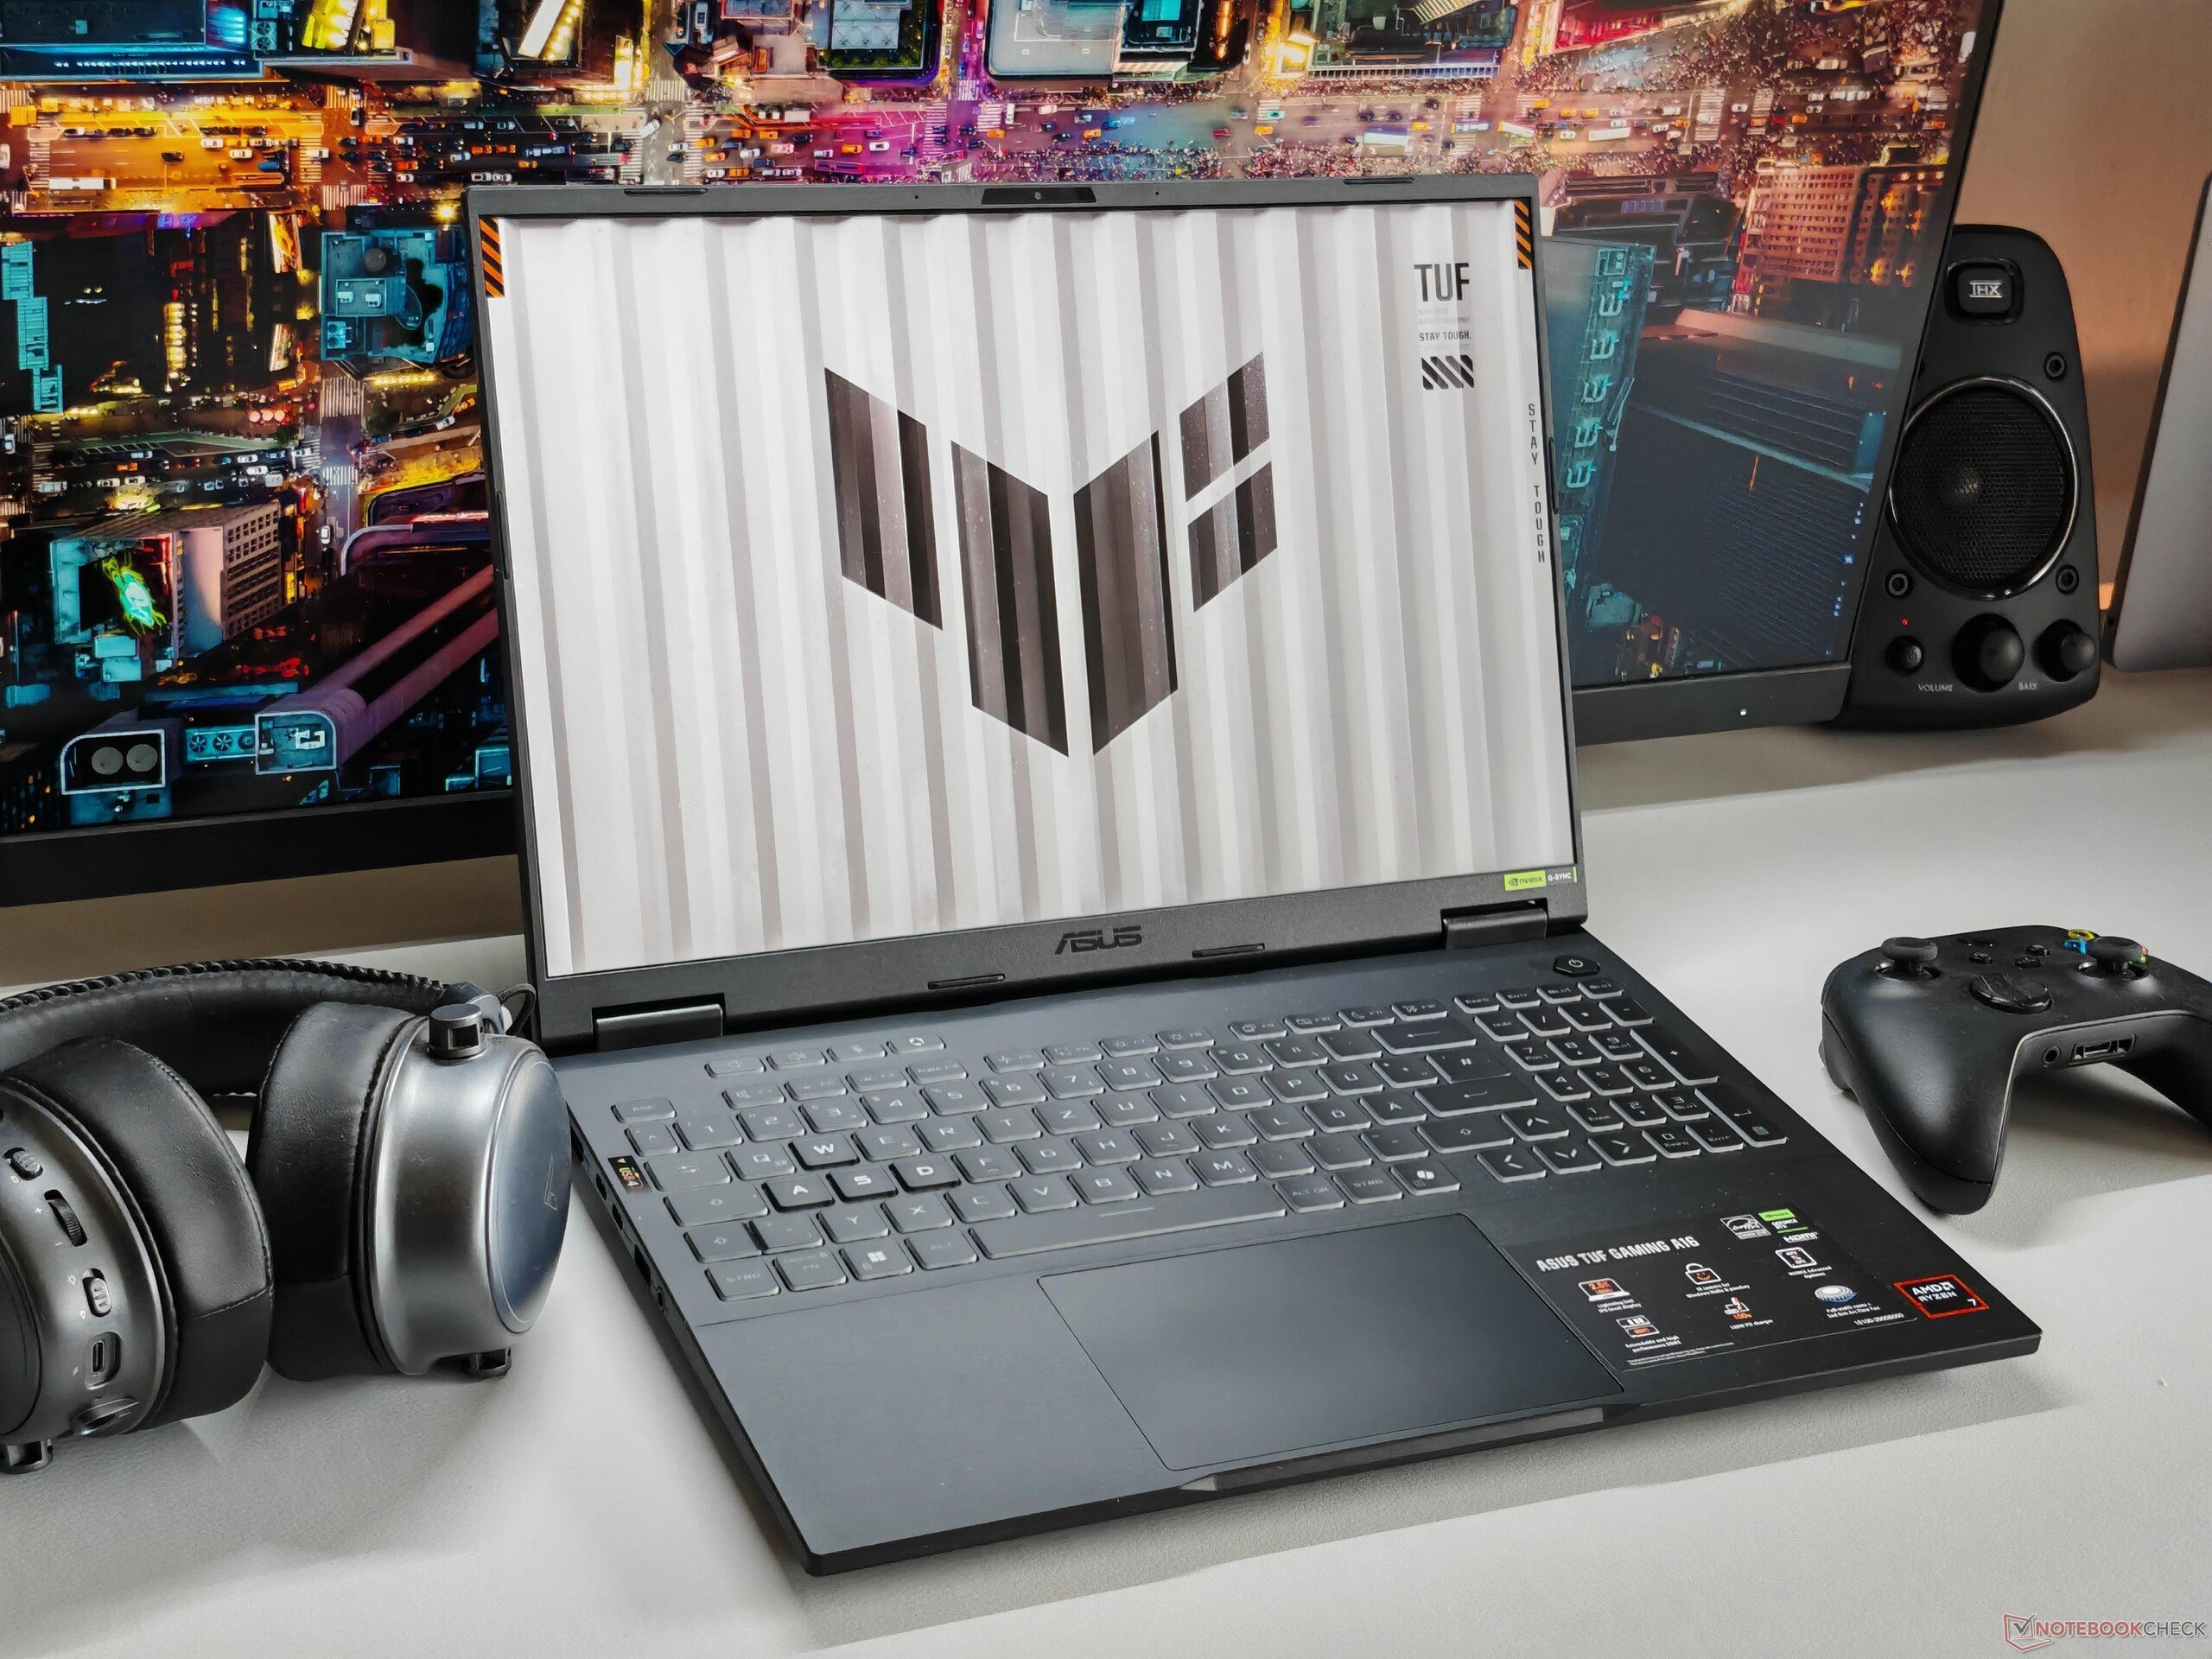
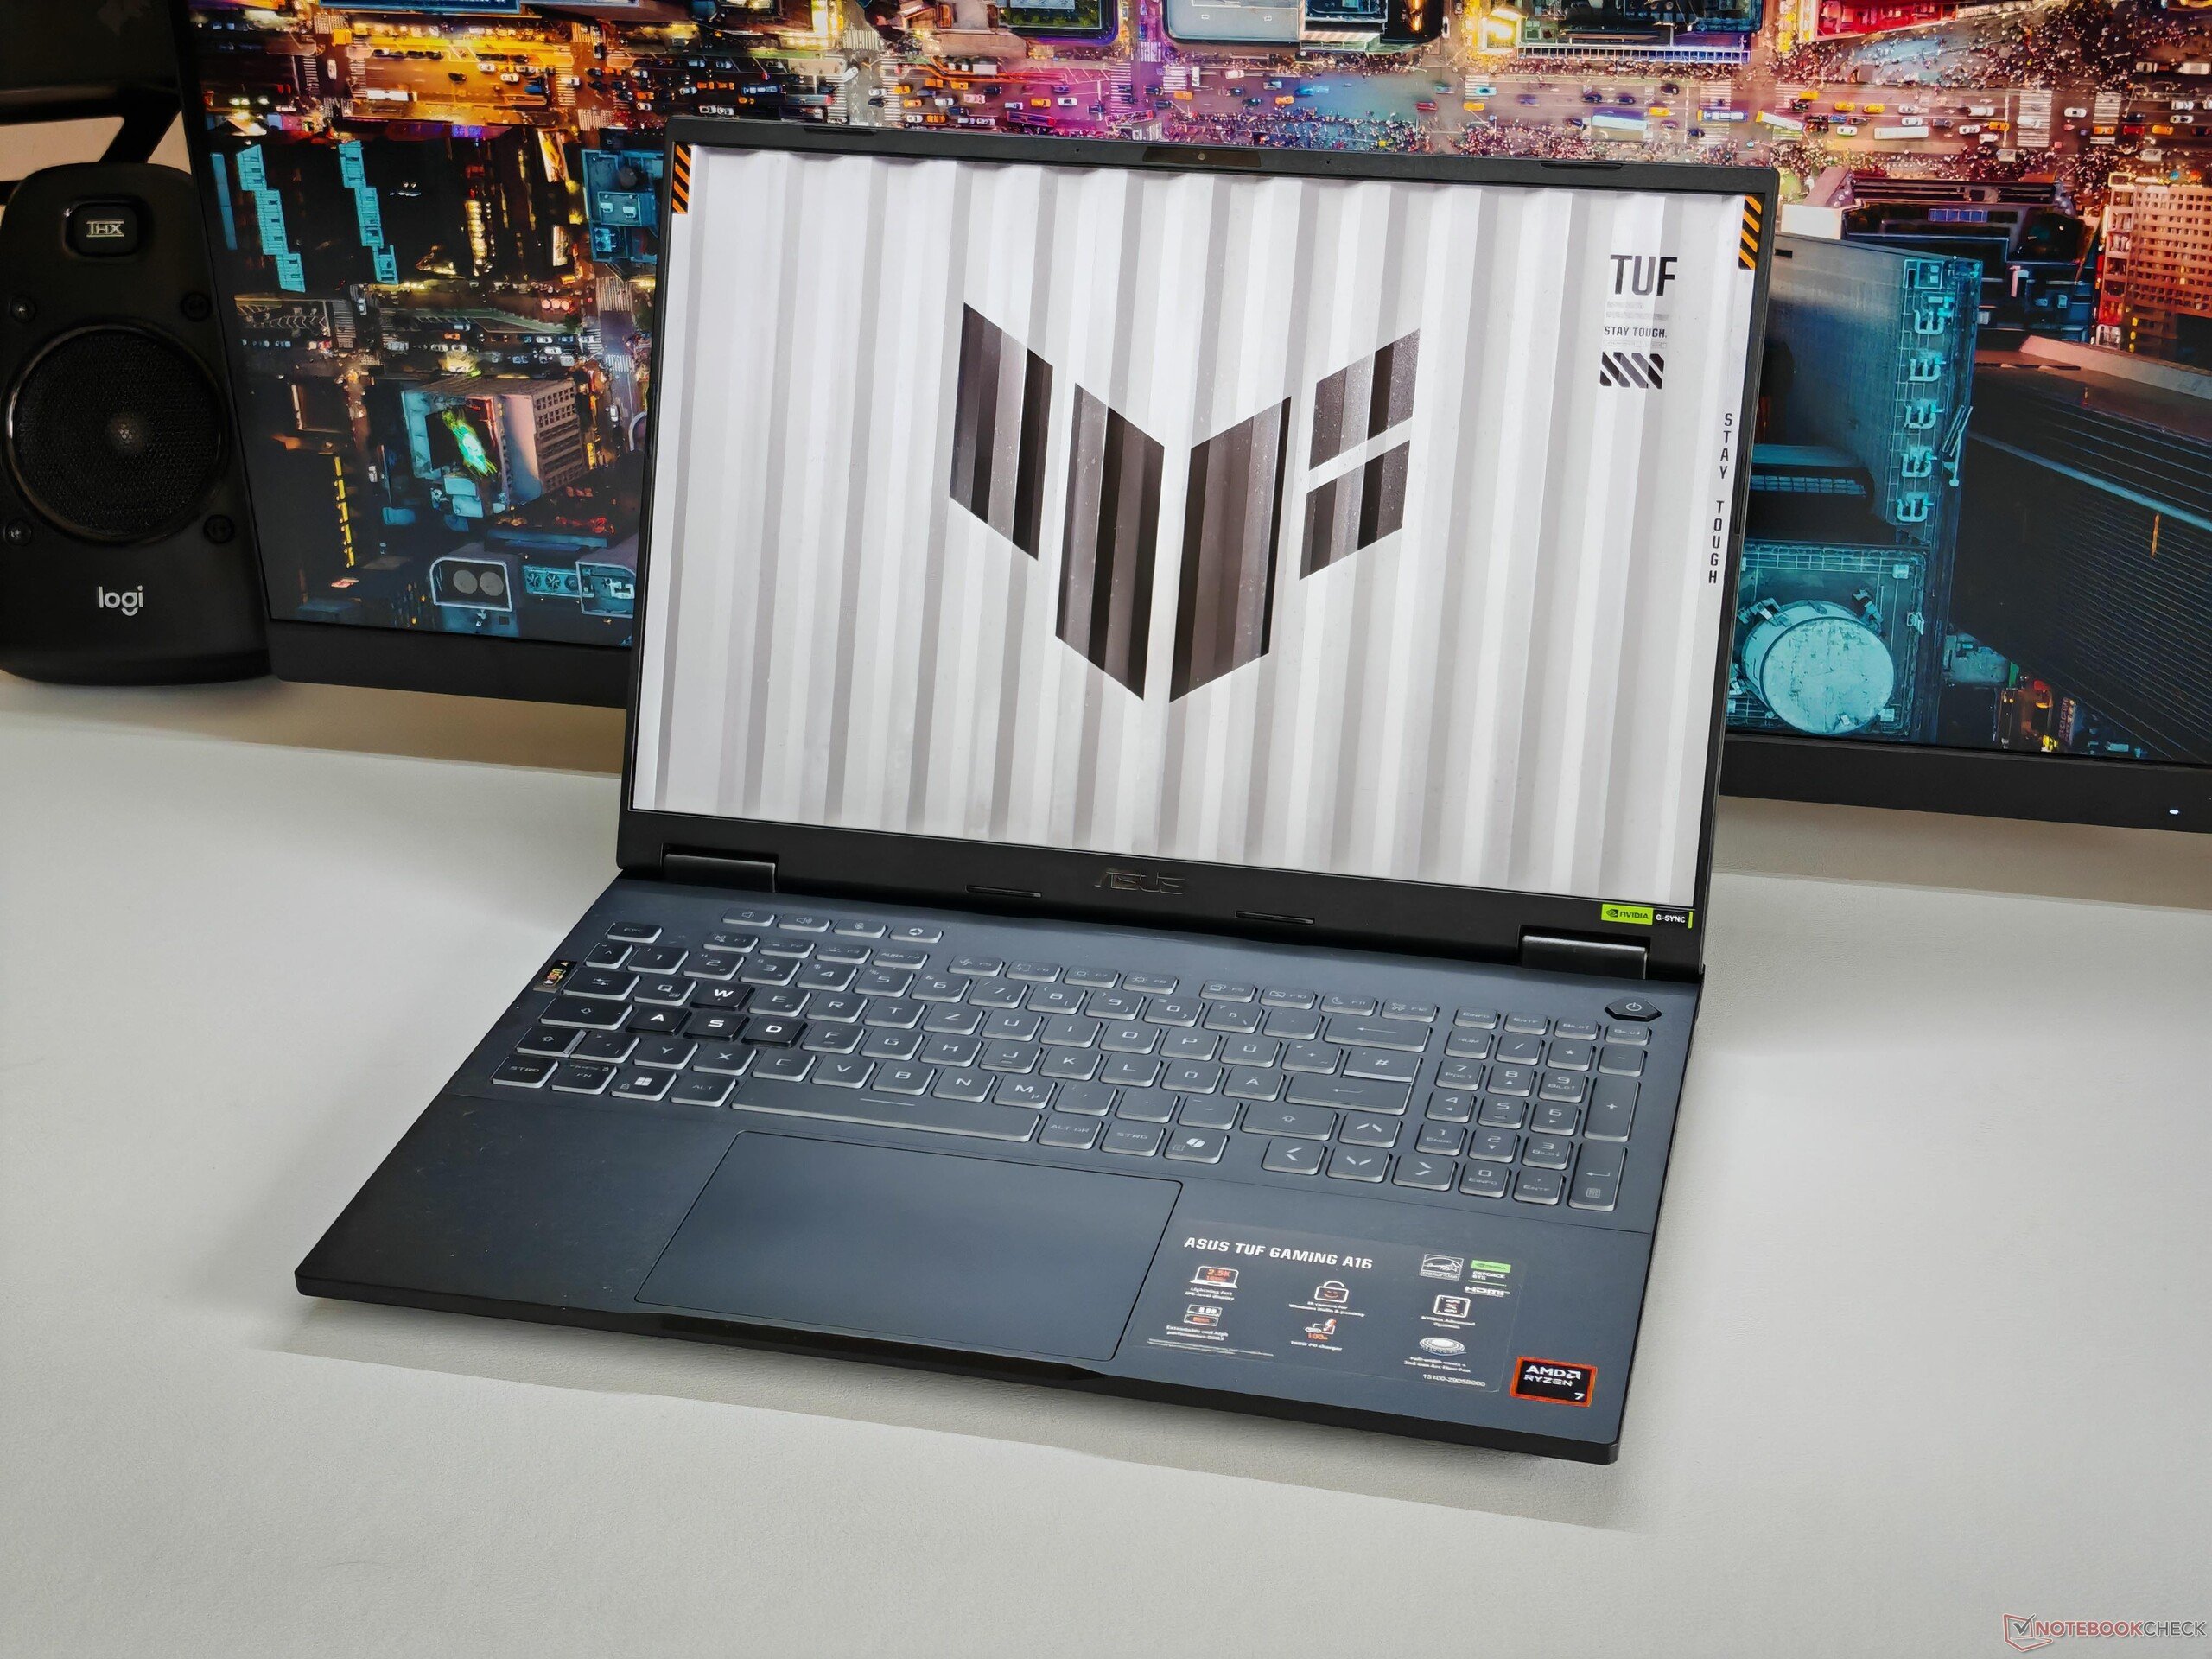
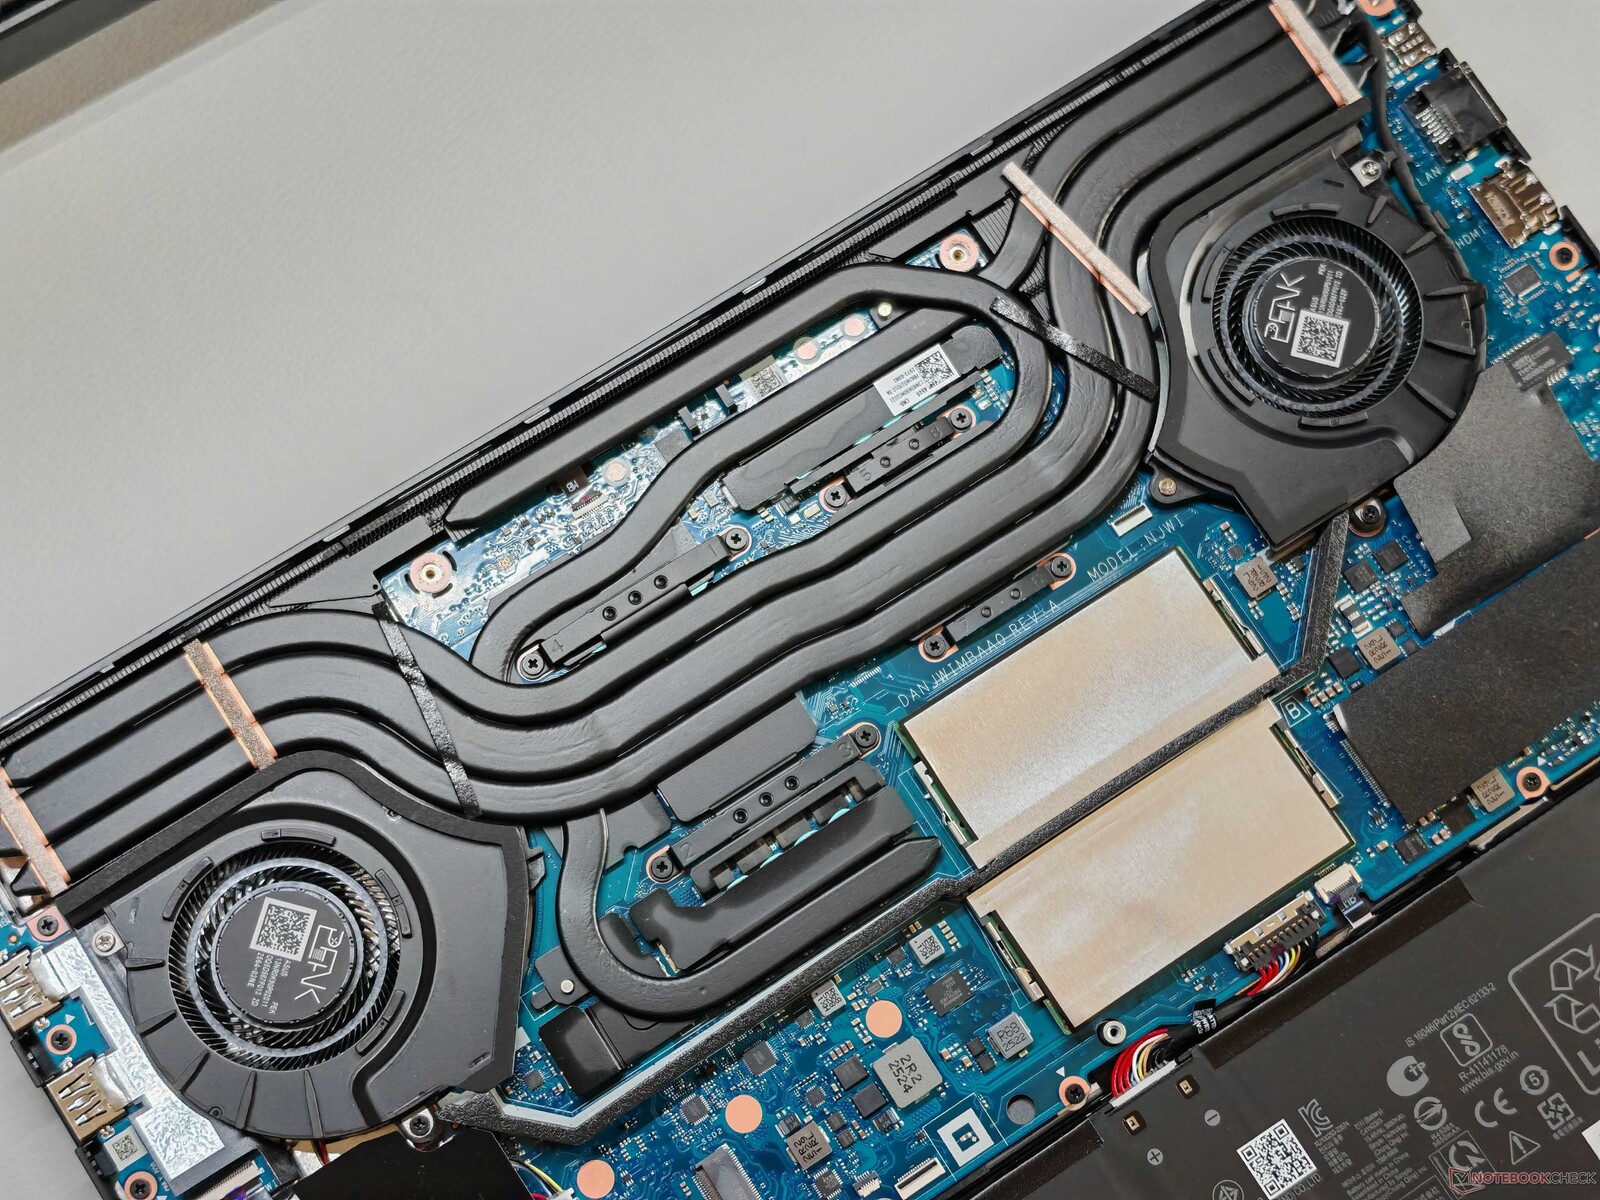
底盘和设备:制造质量良好,有足够的维护选项
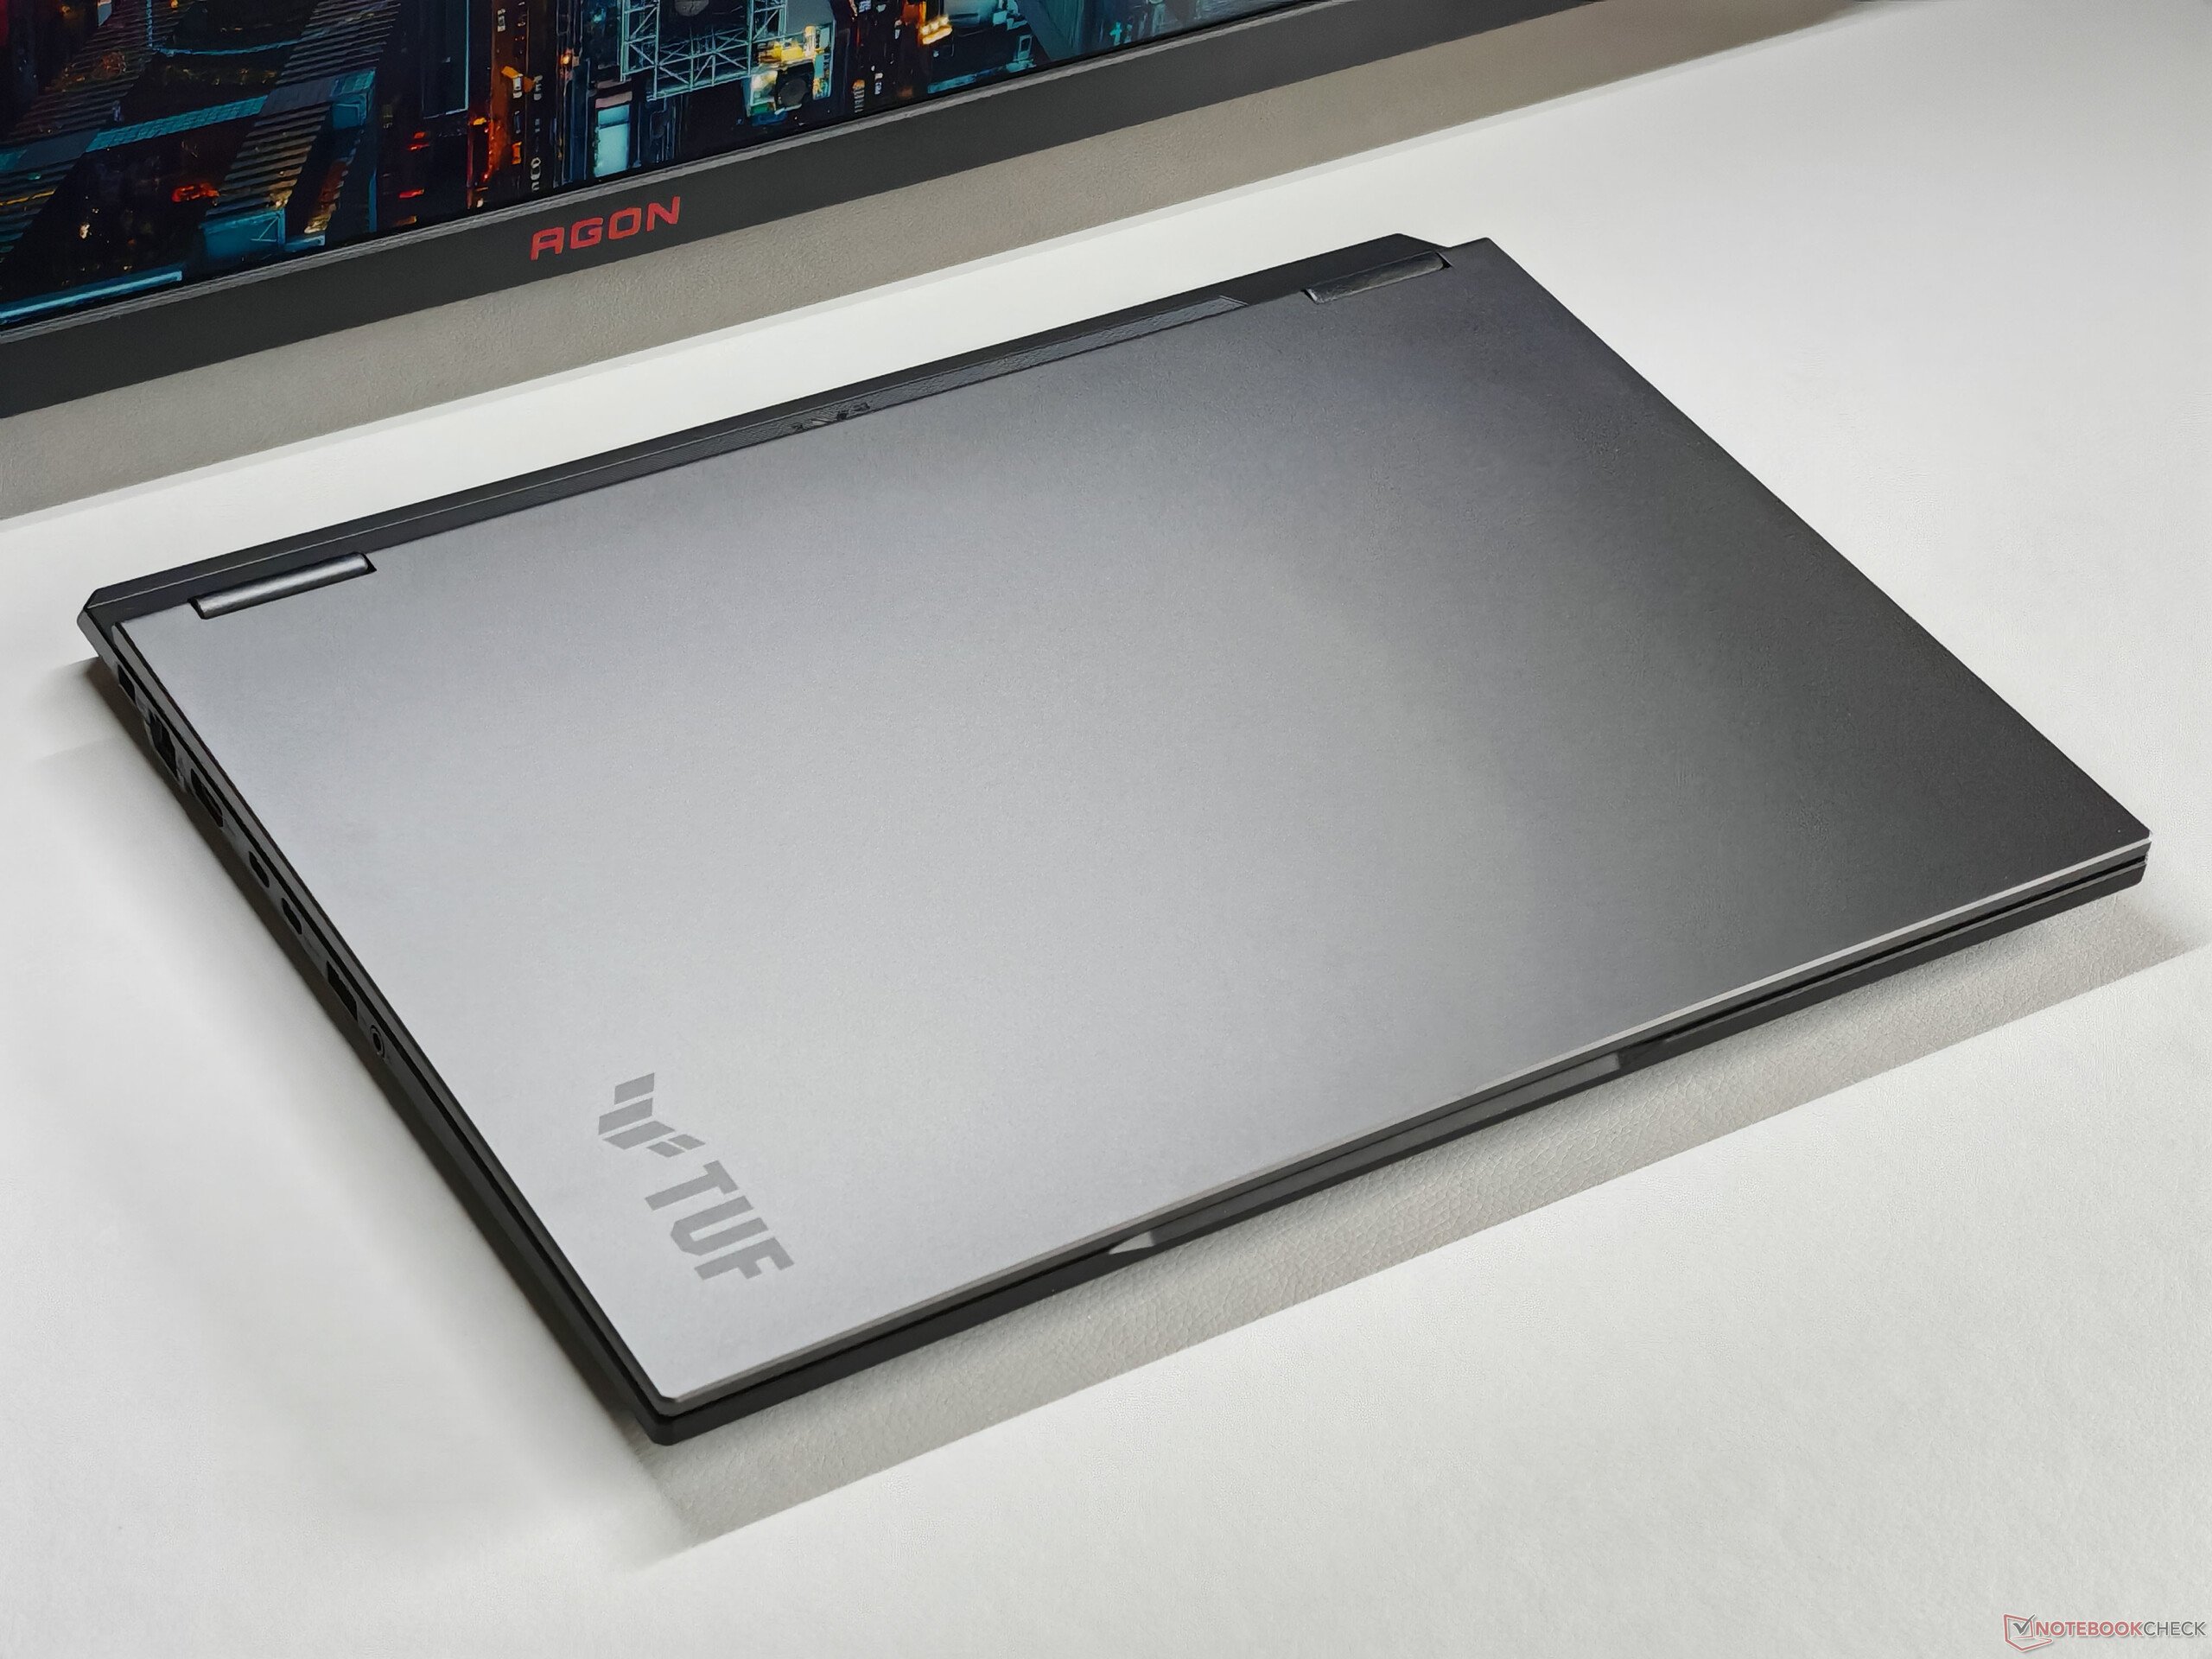
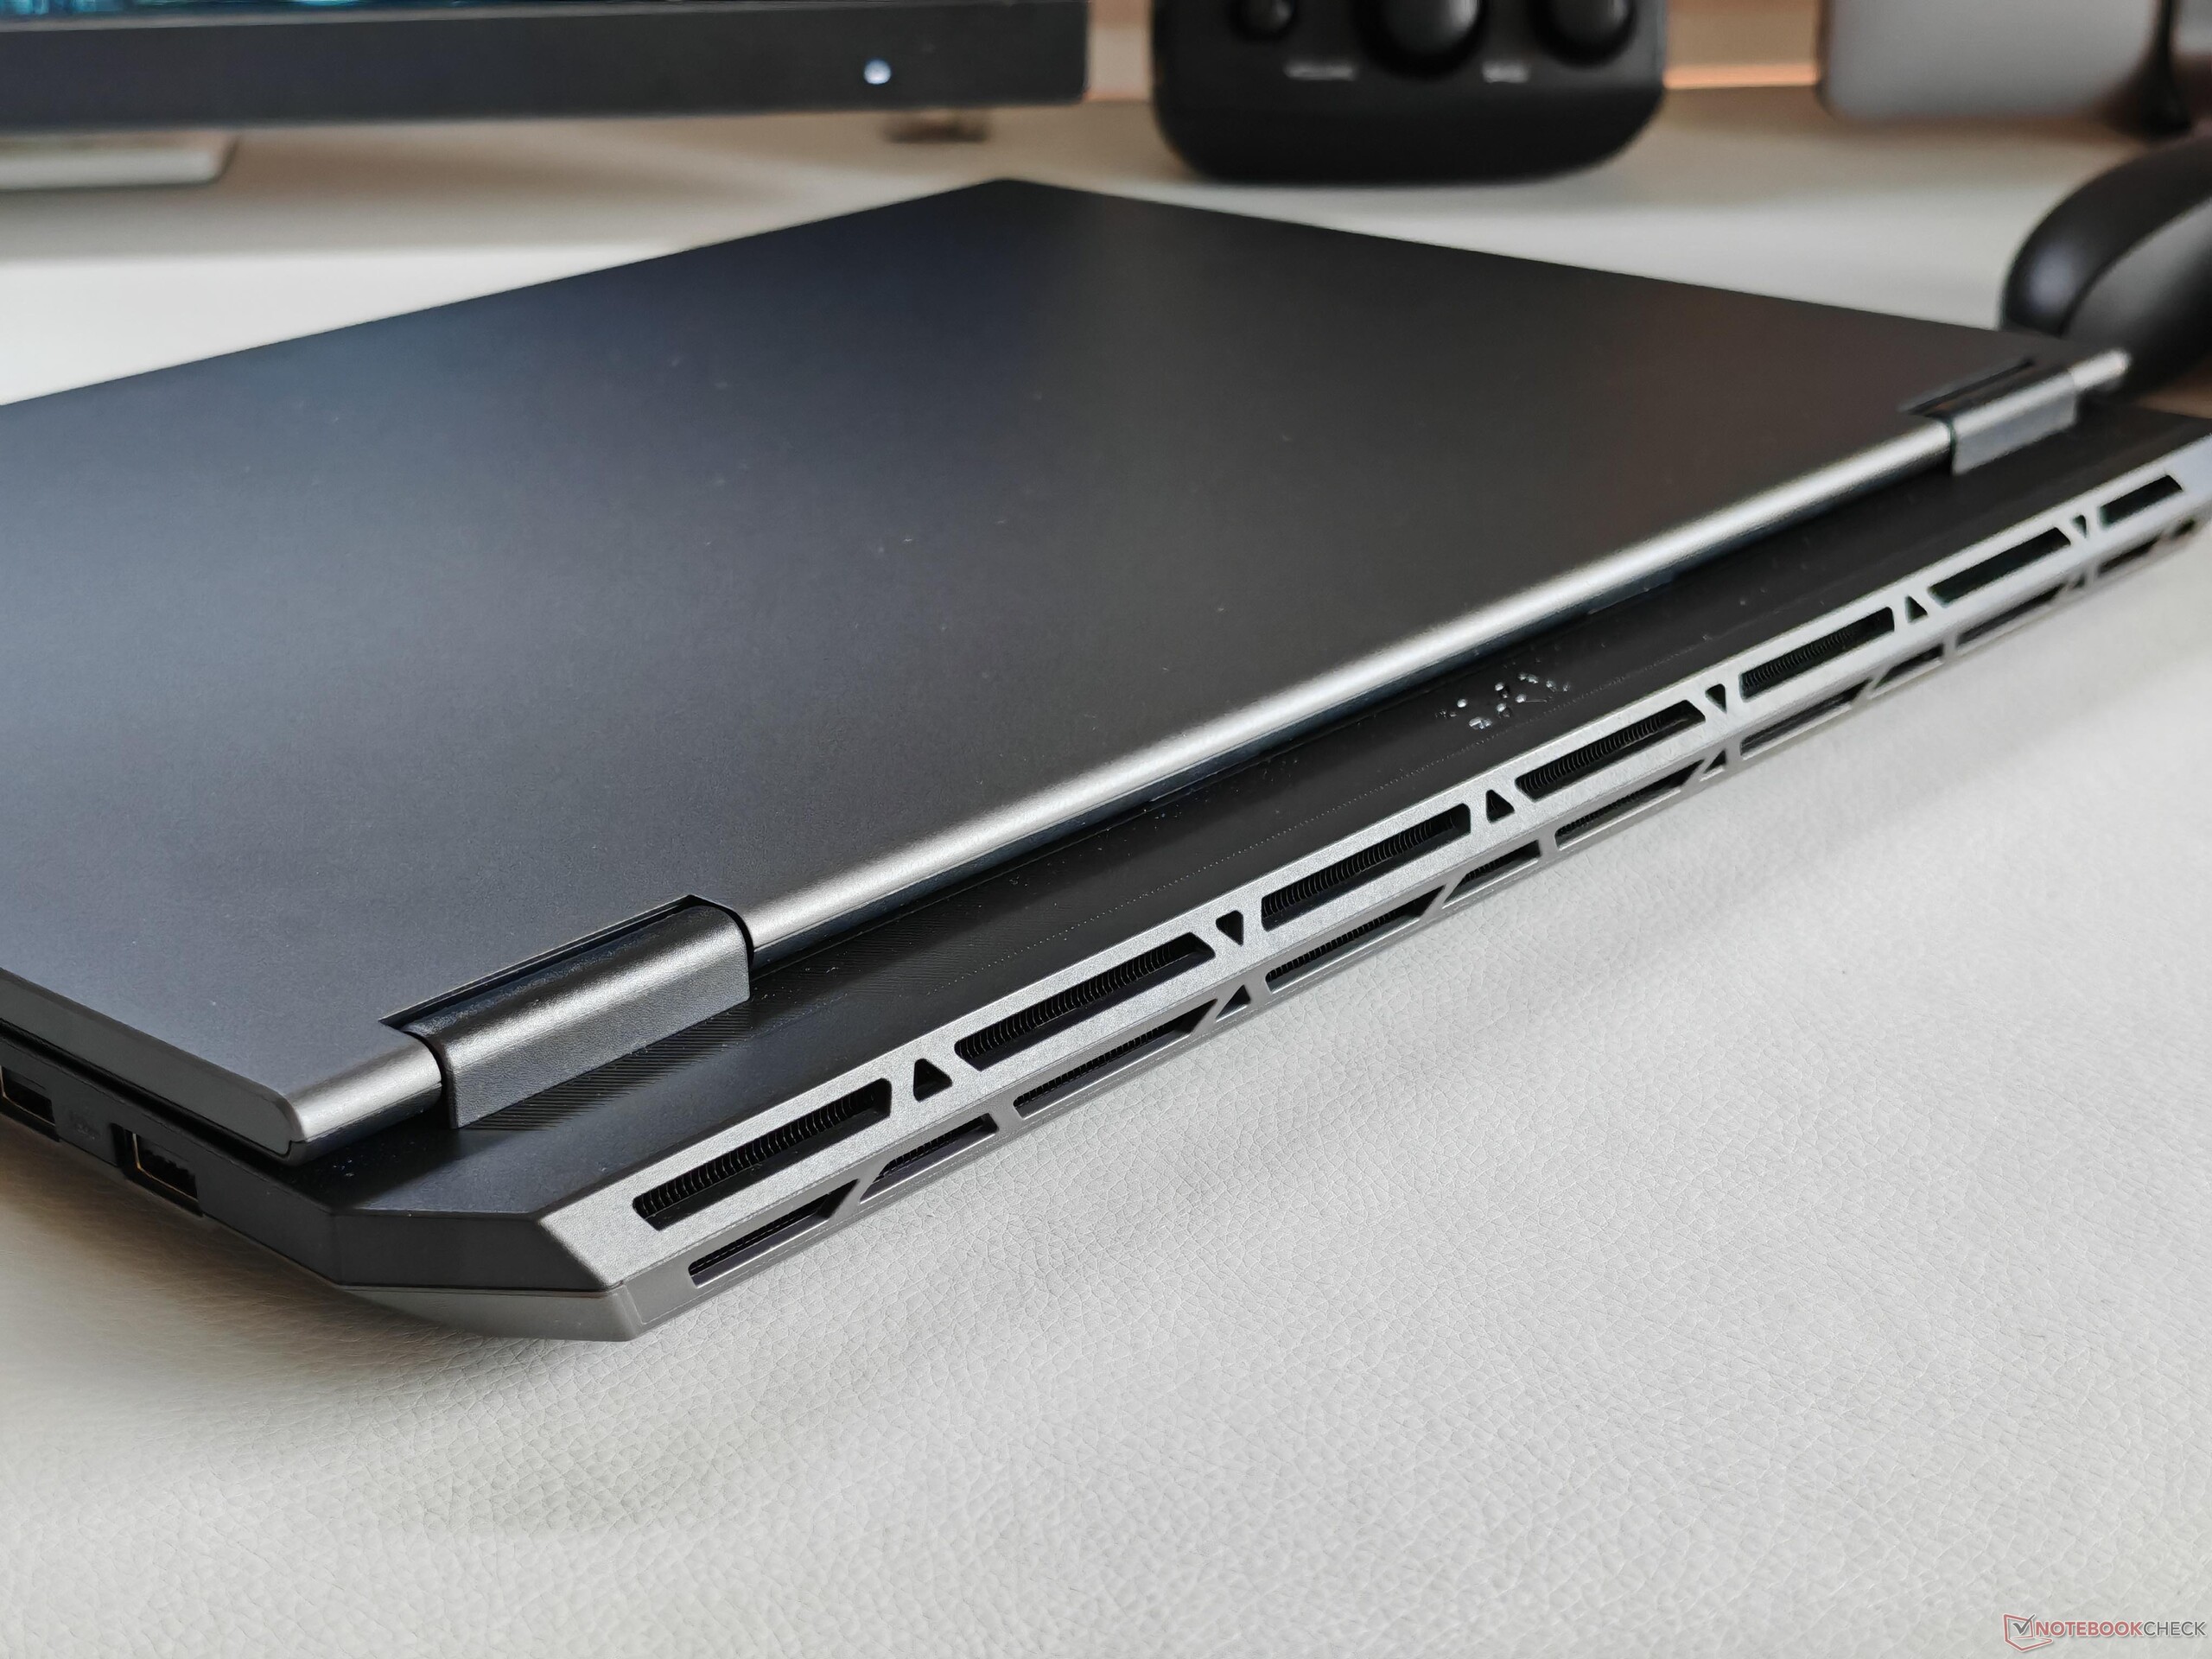
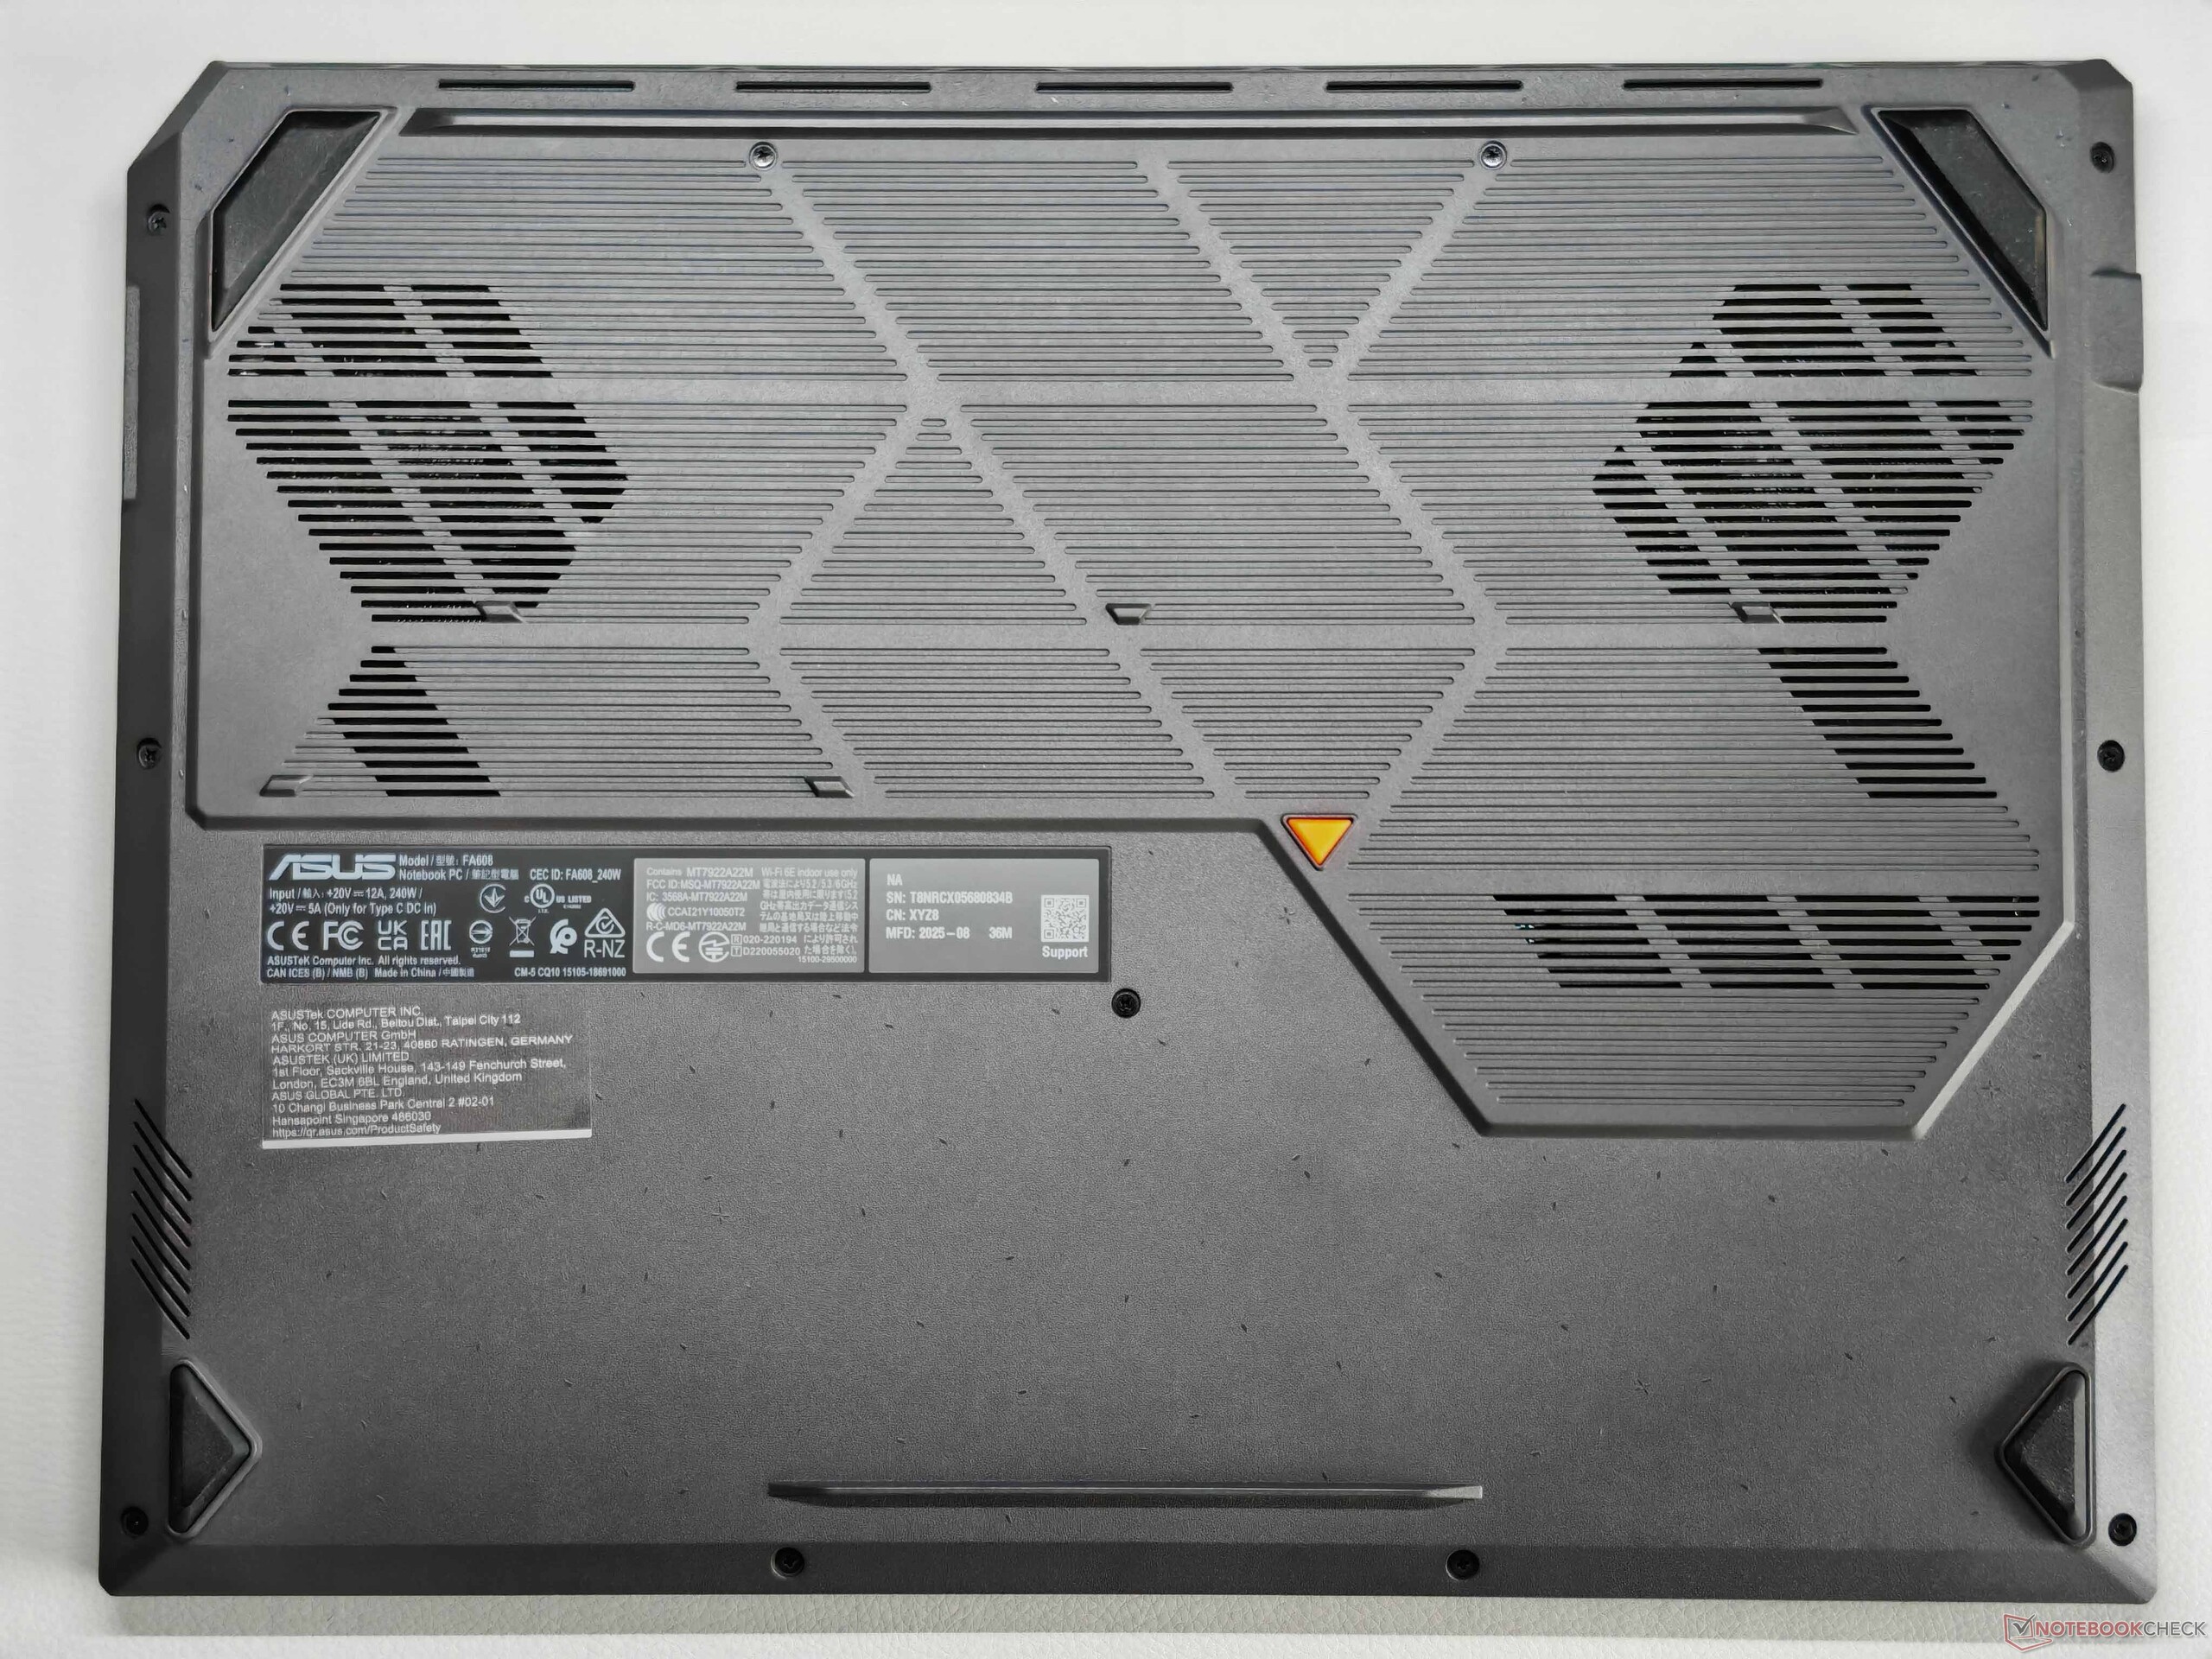
TUF Gaming A16 的机箱设计非常低调,由于采用了黑灰色外观,它甚至可以毫无问题地融入专业环境。这也是 基于 AMD Strix Point-HX 的 TUF GAMING A16的 TUF Gaming A16 也是如此。
没有 RGB 灯光元素或大型徽标。与更昂贵的 Zephyrus 型号相比,TUF Gaming A16 几乎全部由塑料制成,只有盖子是铝制的。
不过,制造质量完全可以接受,表面对指纹也不是特别敏感。在稳定性方面也没有太多值得批评的地方,我们无法听到任何嘎吱嘎吱的声音。
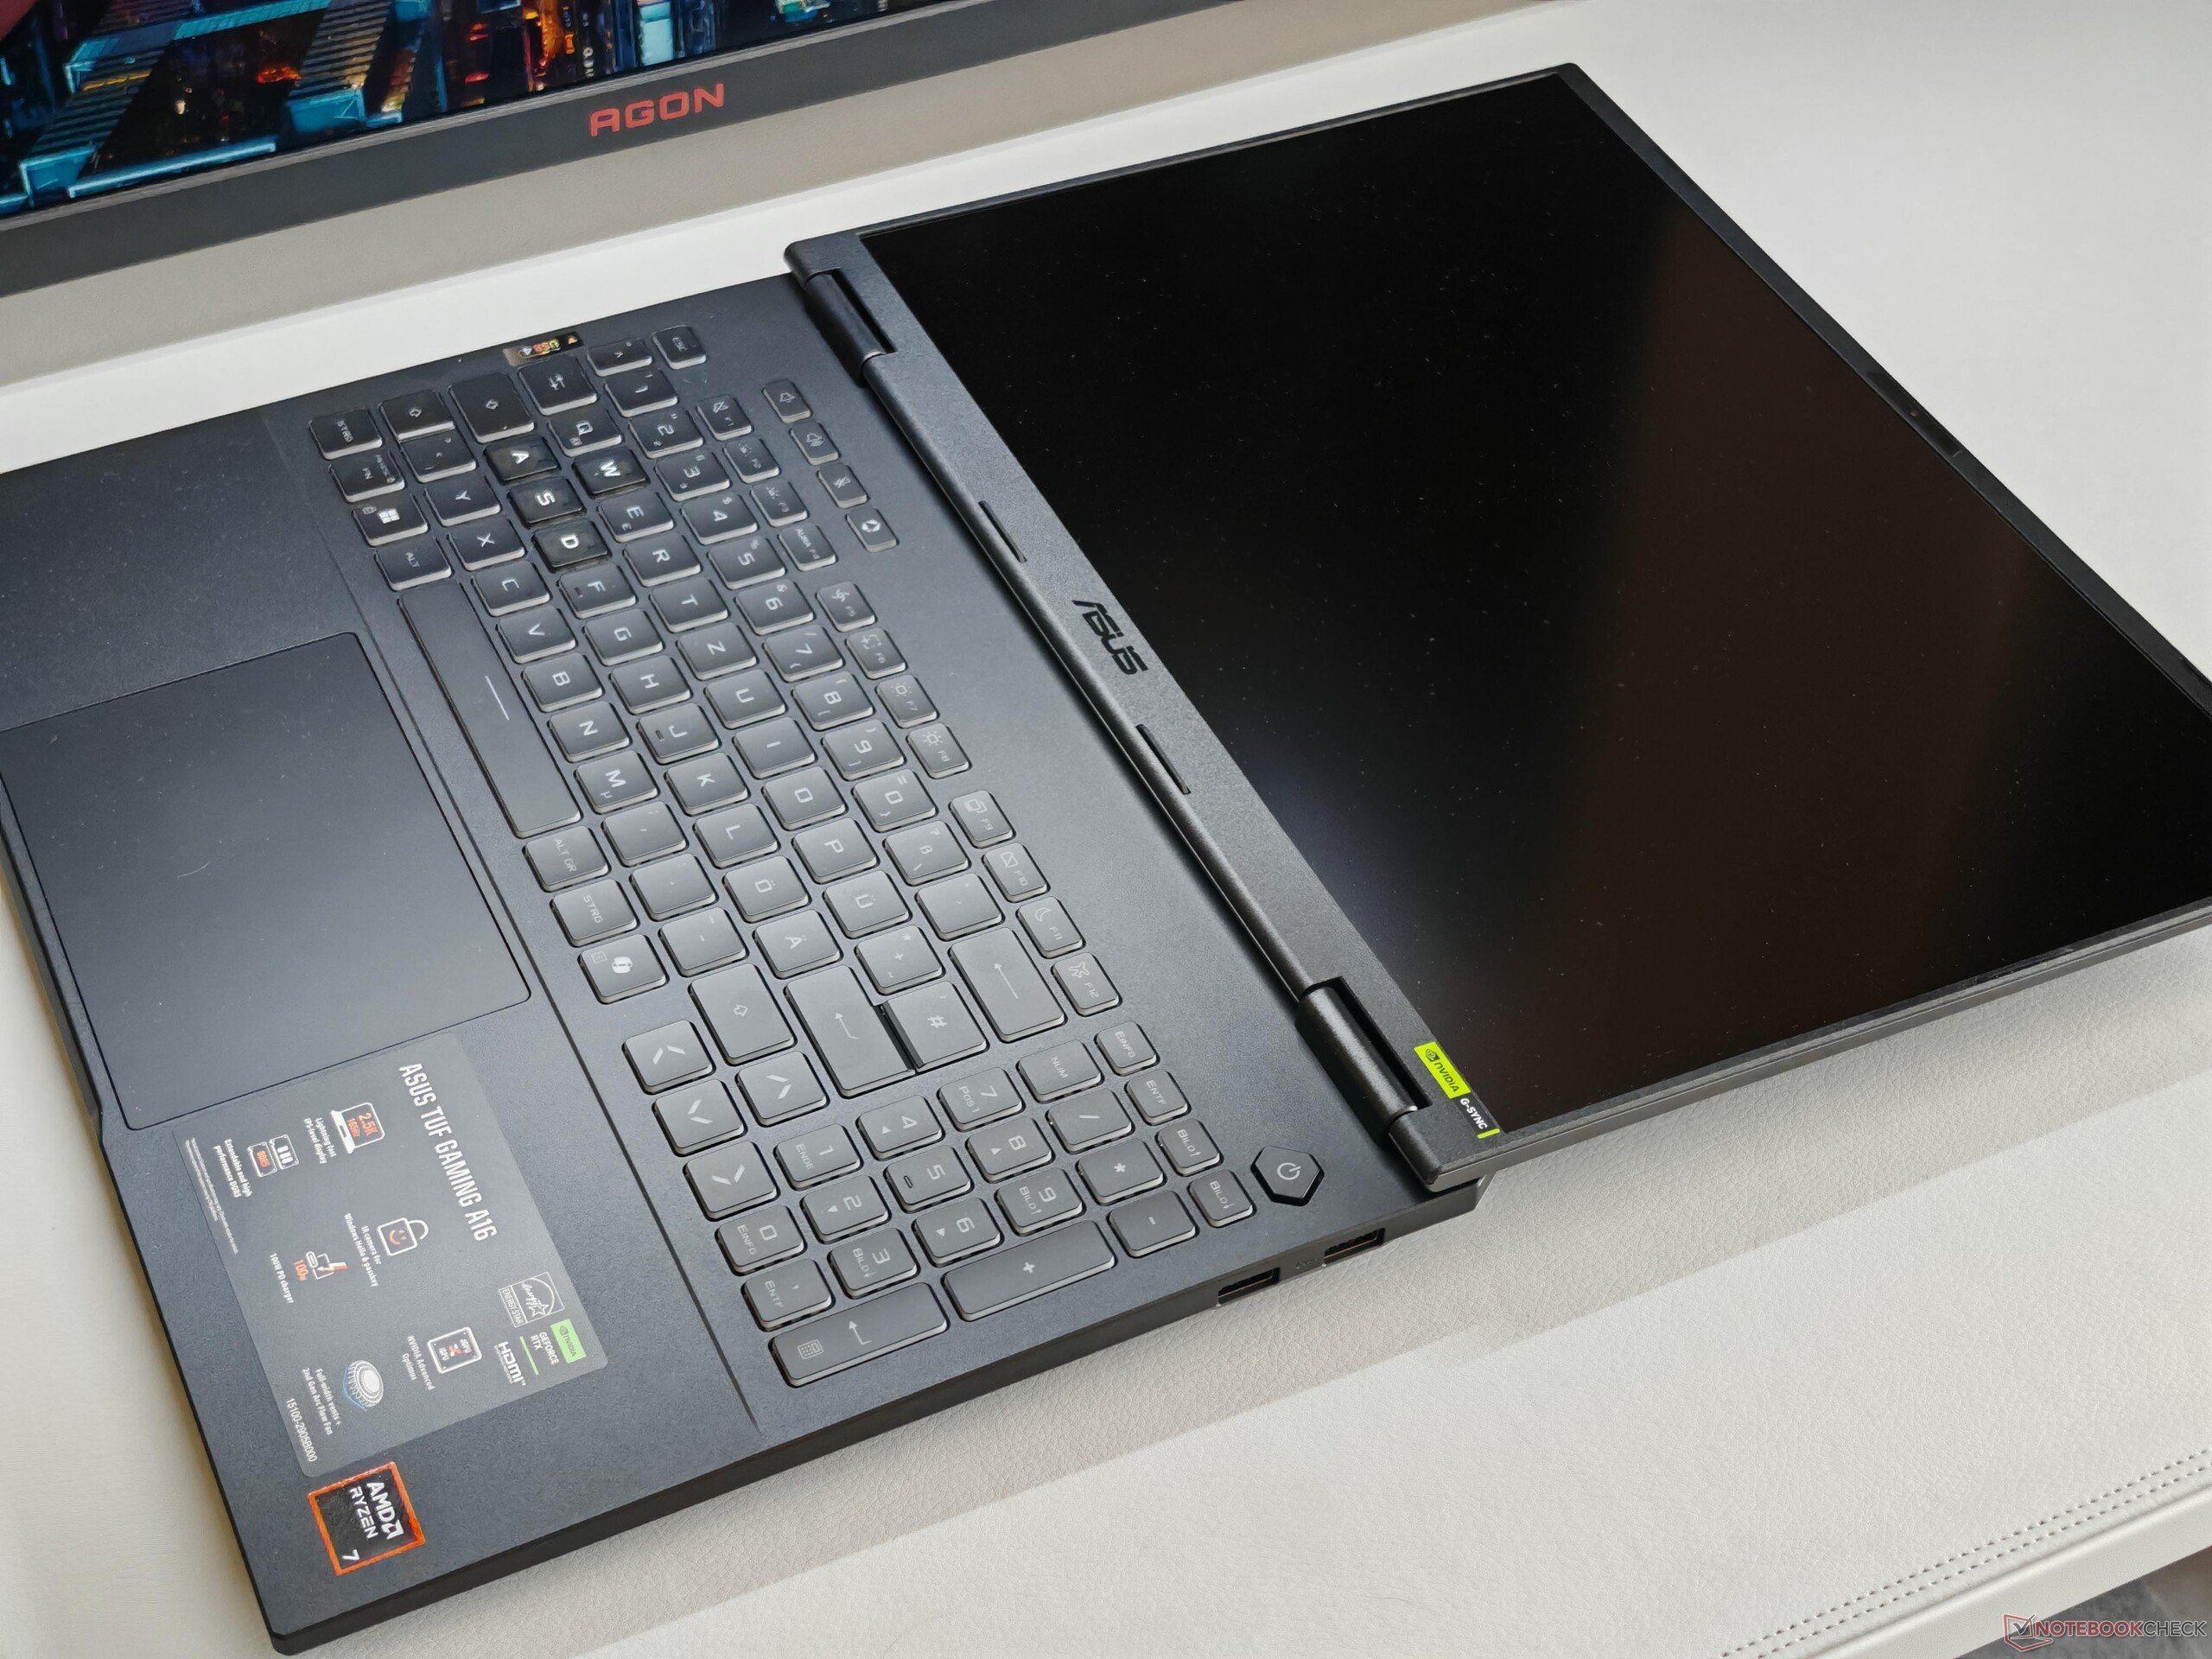
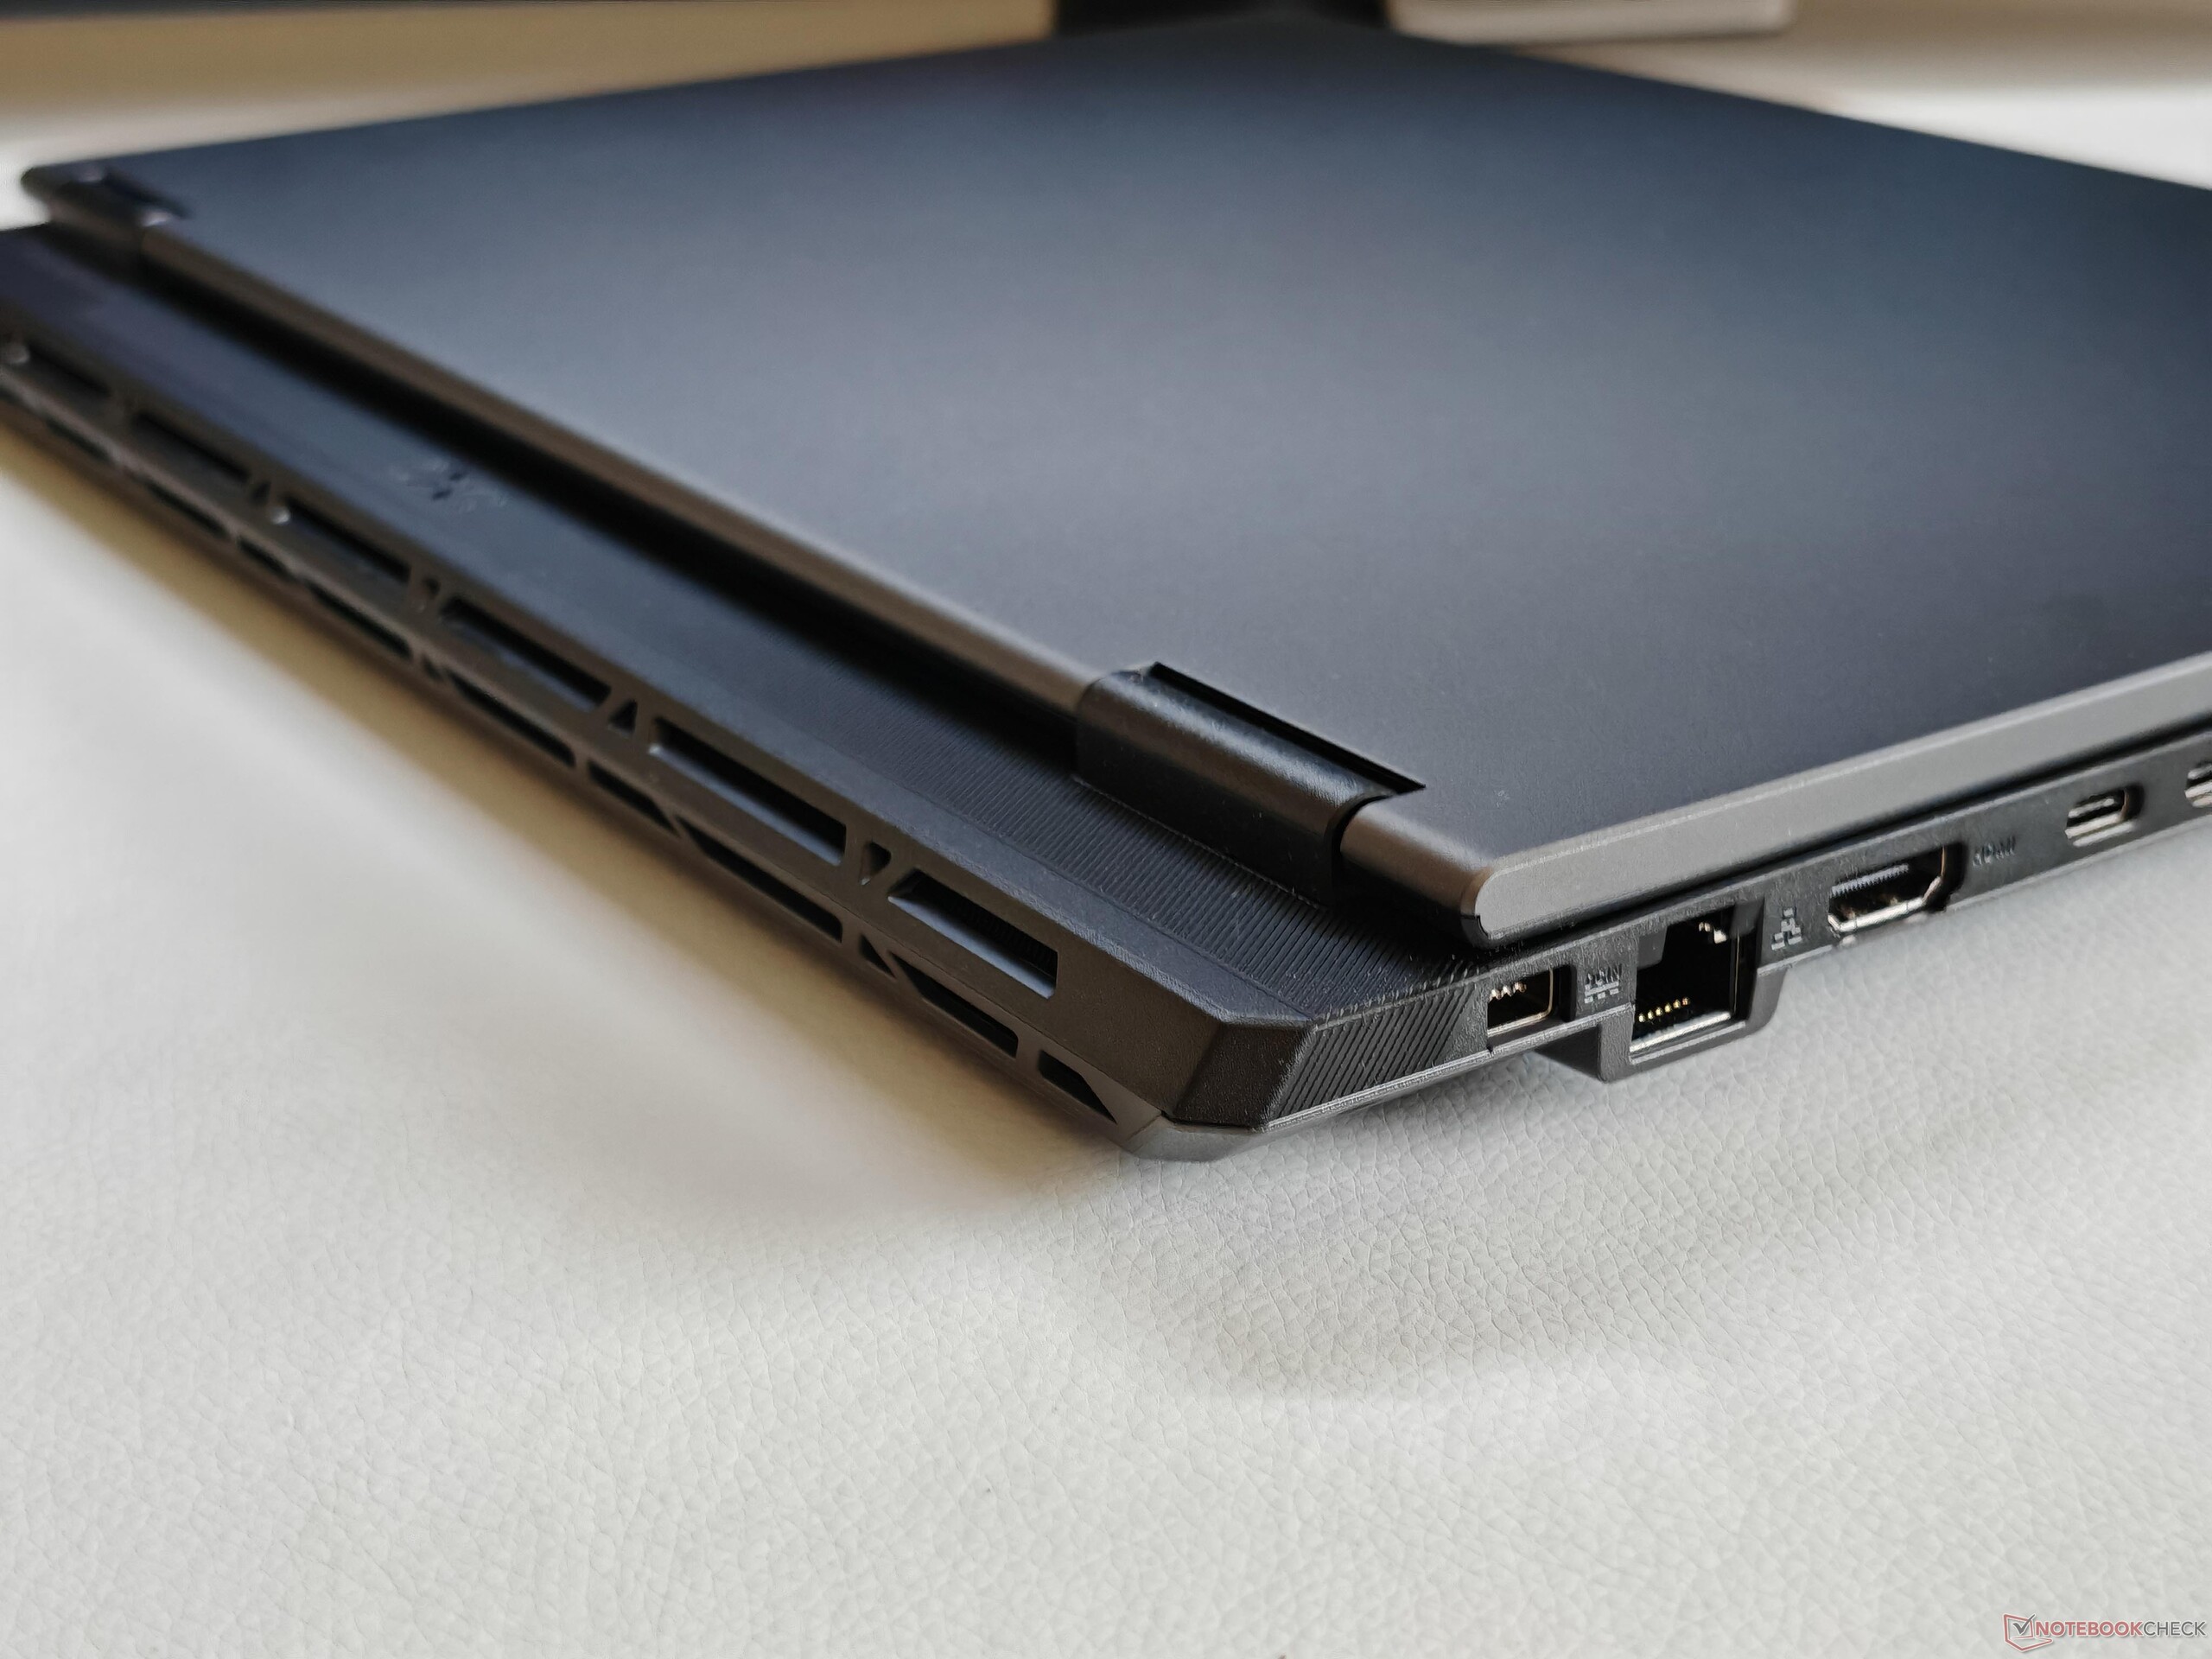
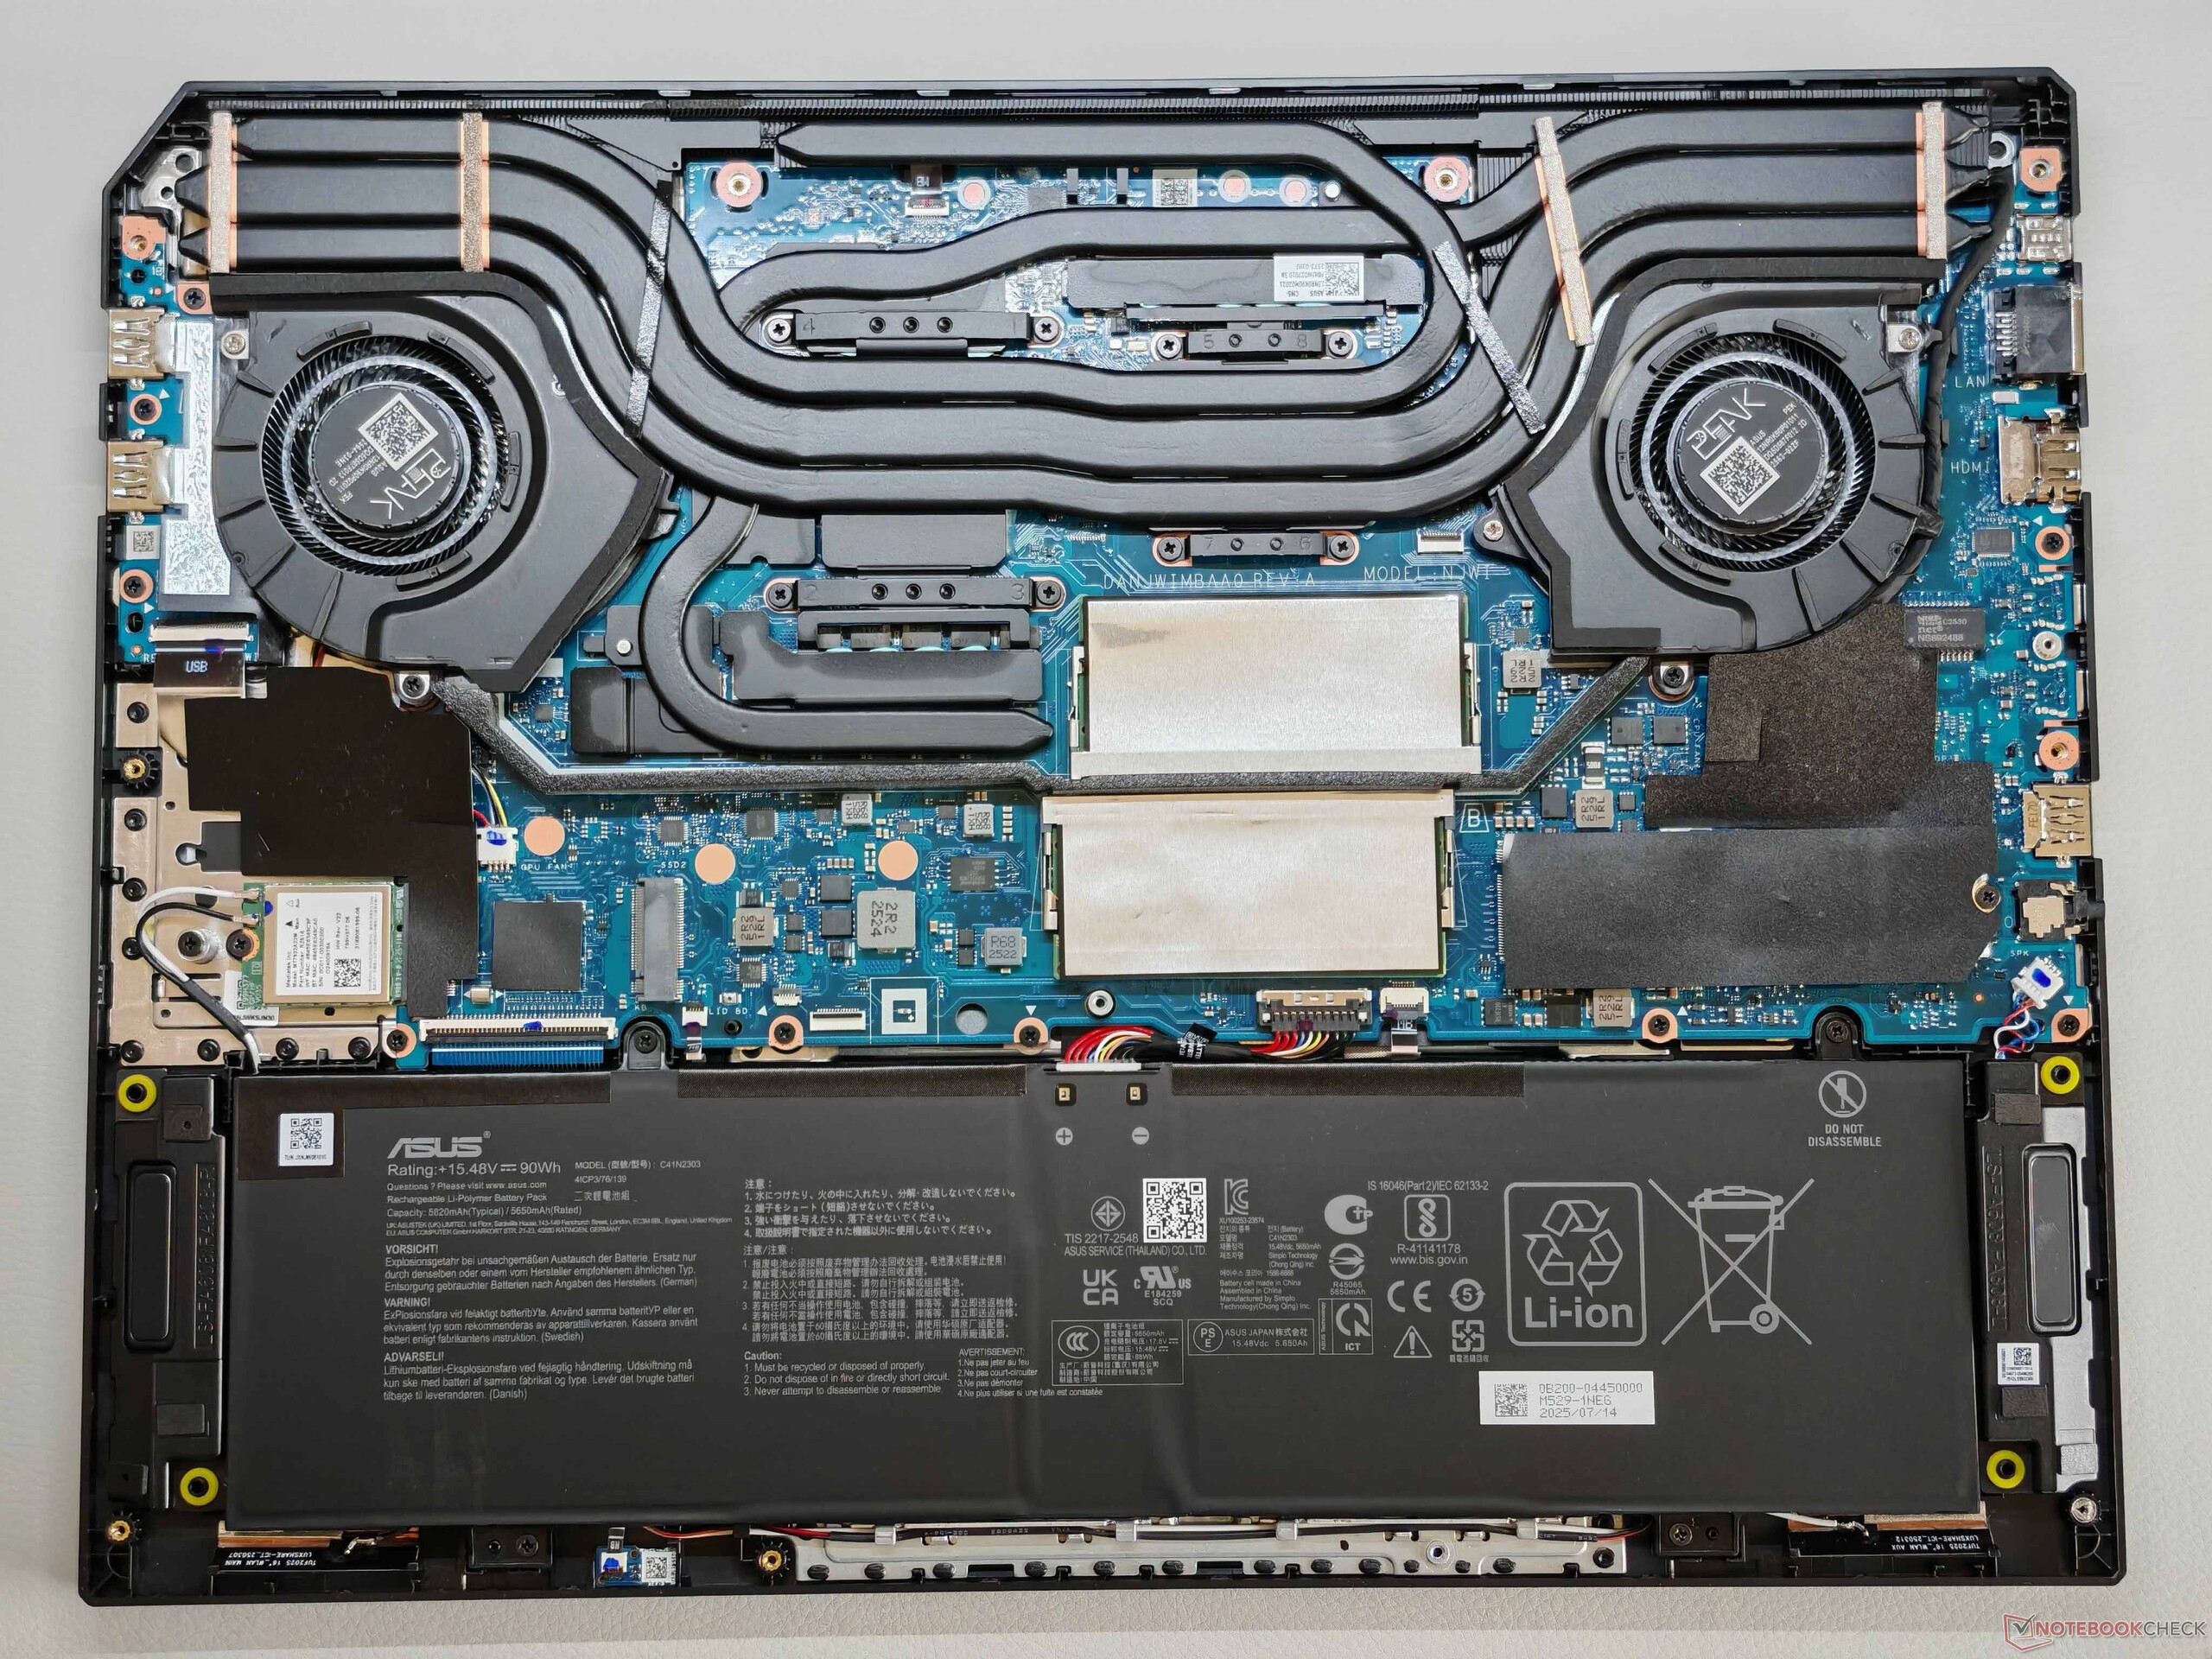
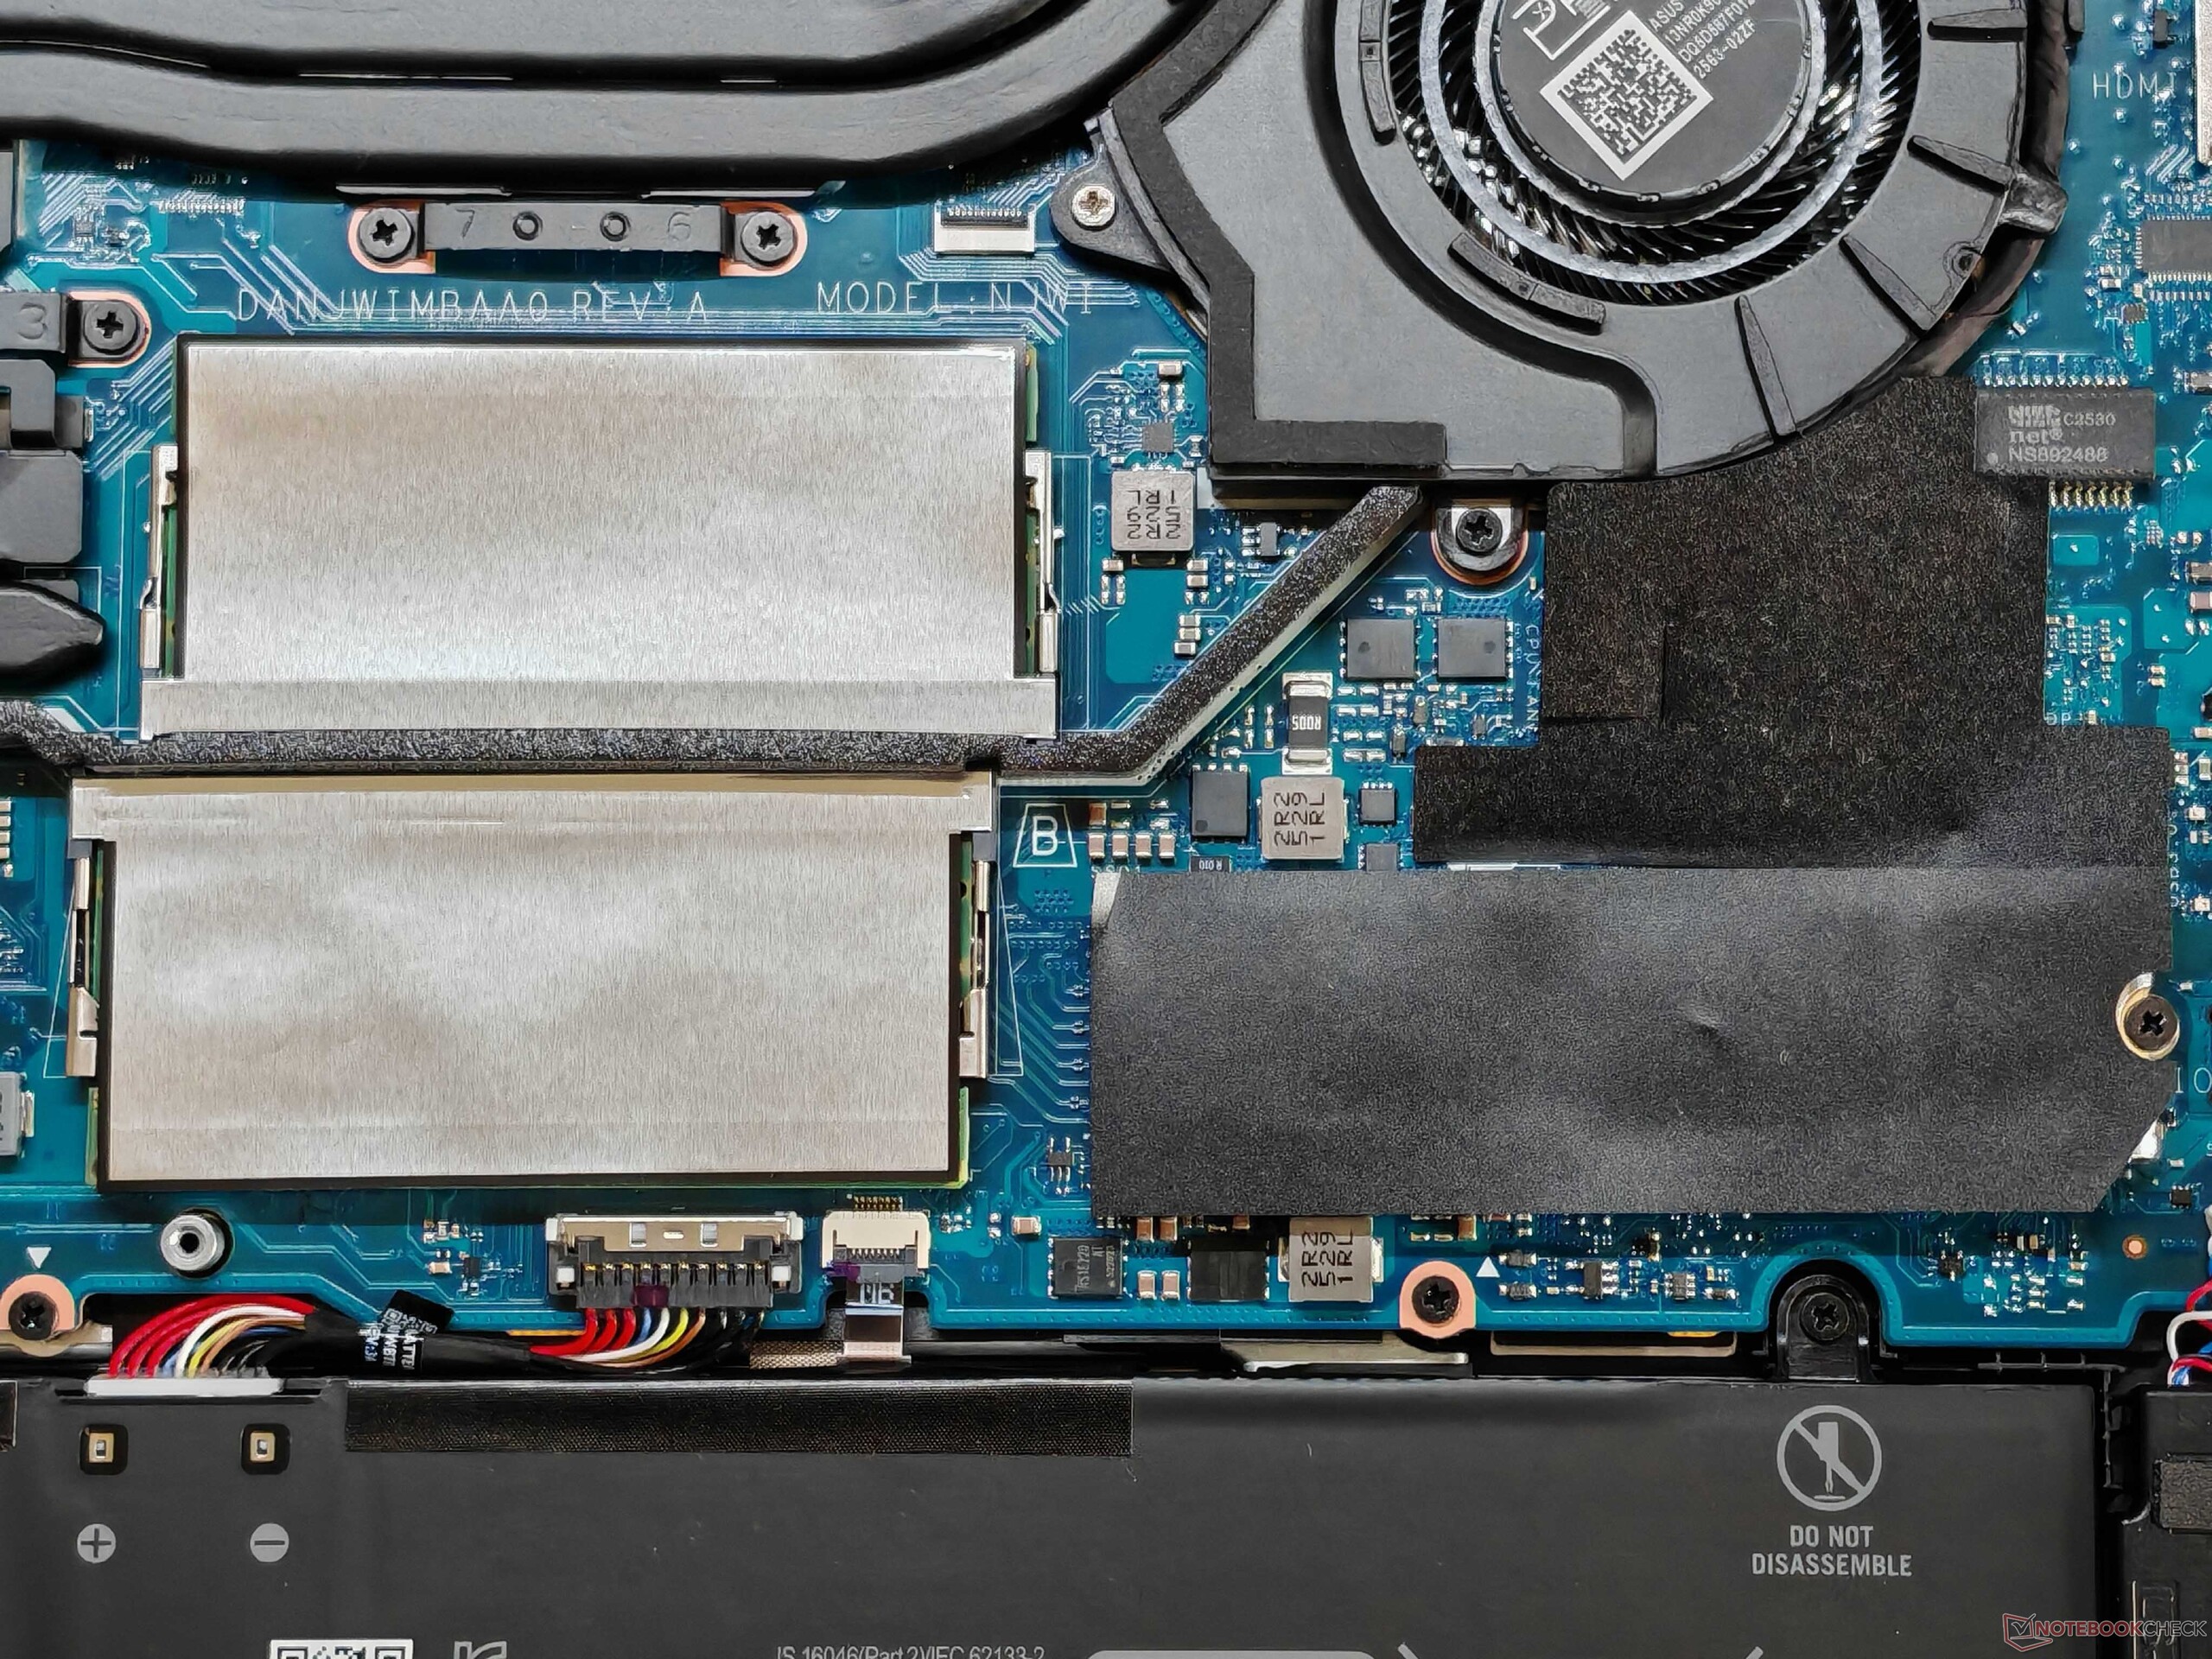
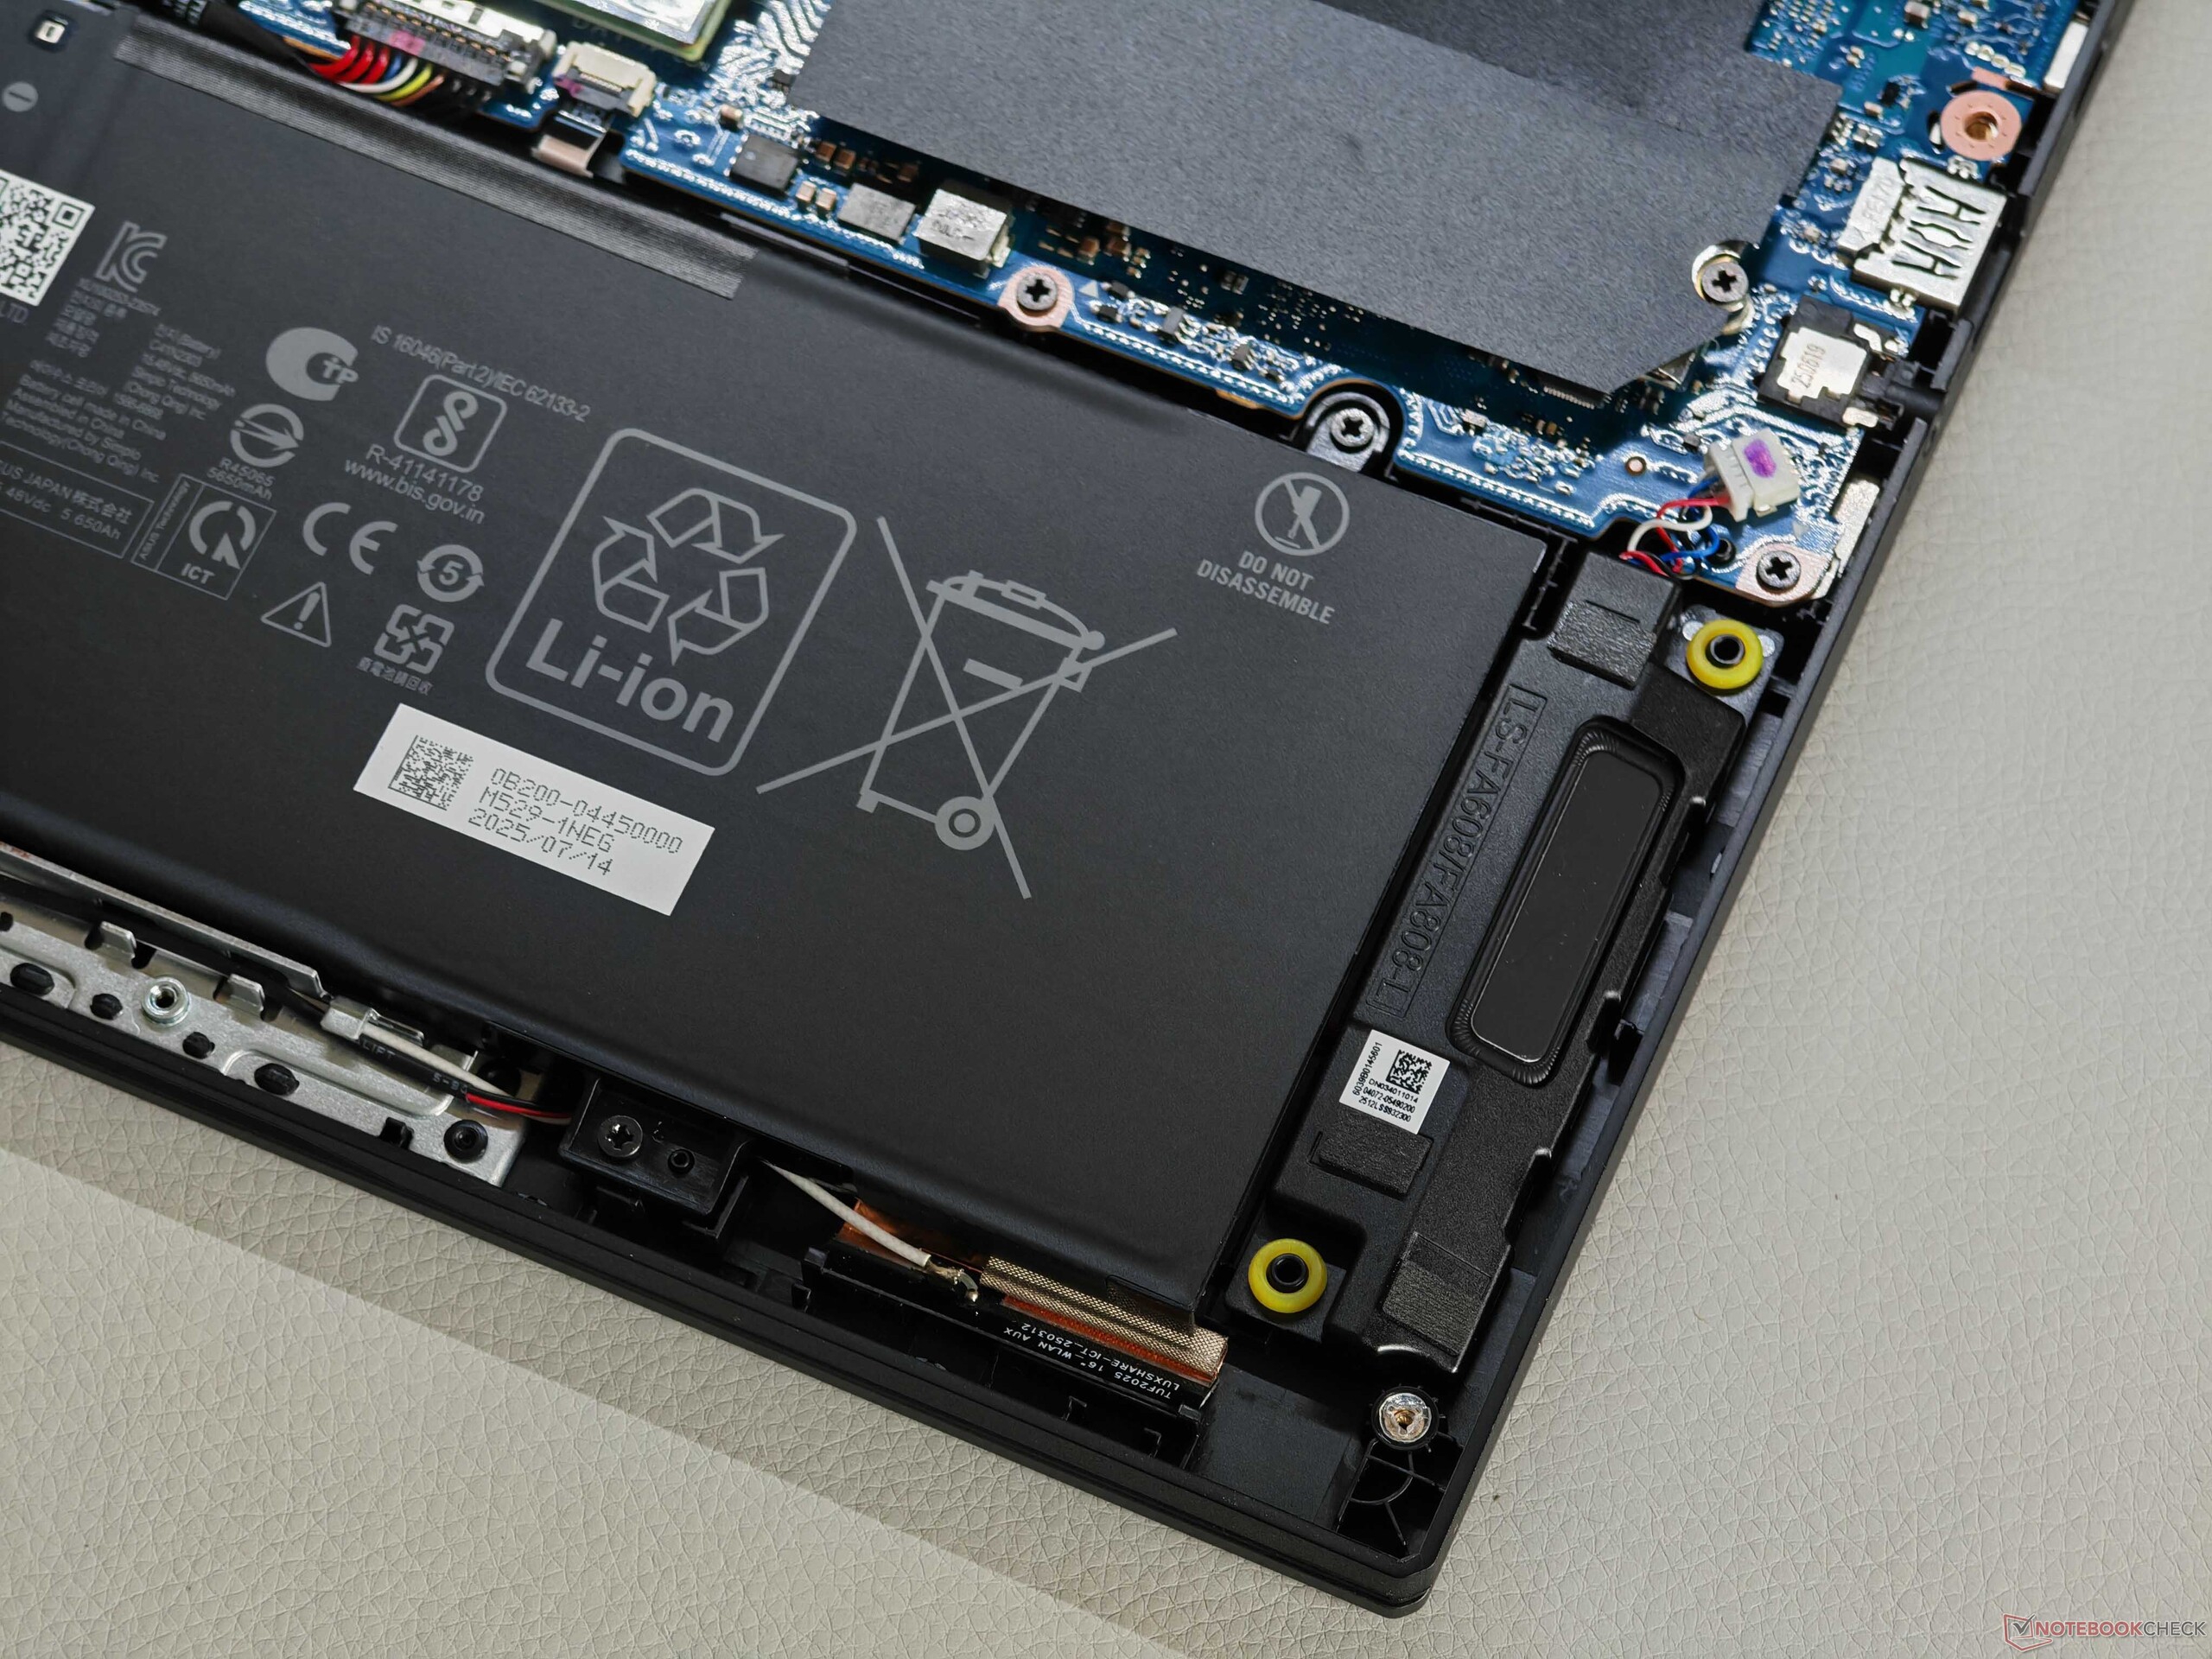
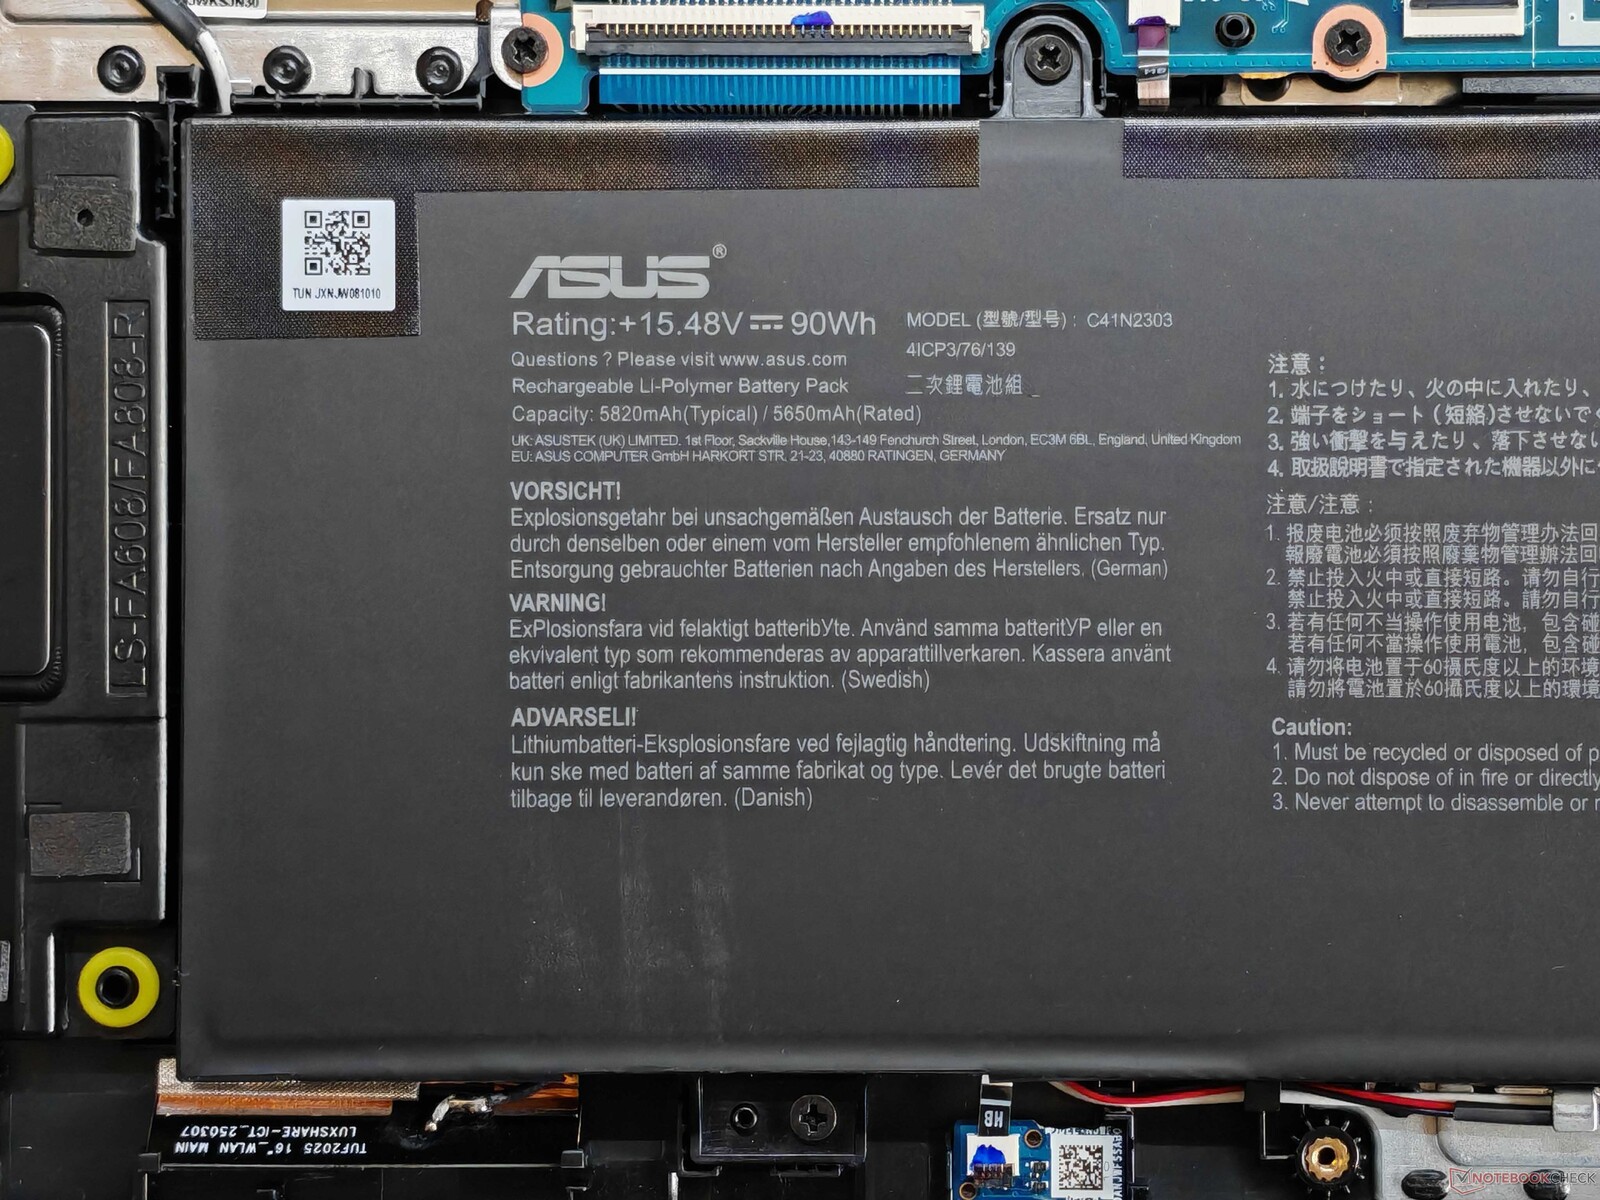
显示屏铰链调整得非常好,允许 180° 的打开角度。维护选项非常丰富,包括 2 倍内存、2 倍固态硬盘、无线局域网模块和可拆卸电池。这纠正了前代机型采用焊接内存的一大诟病。
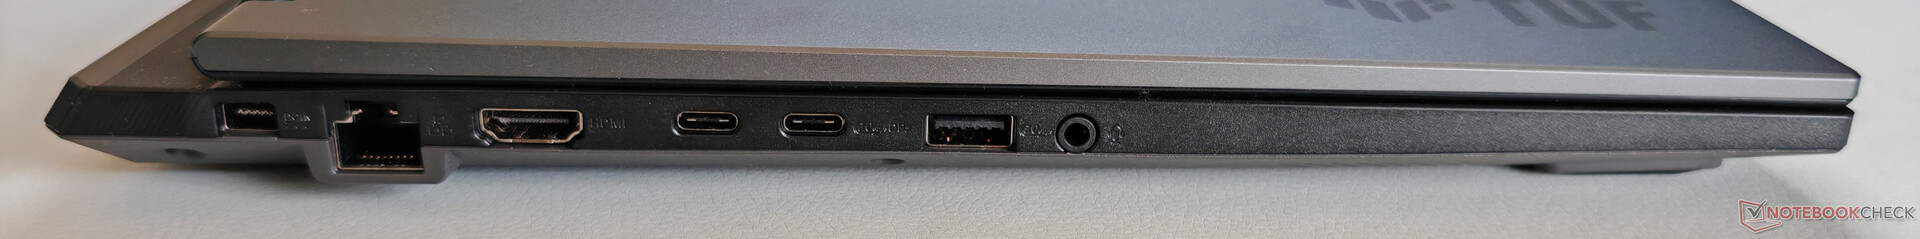
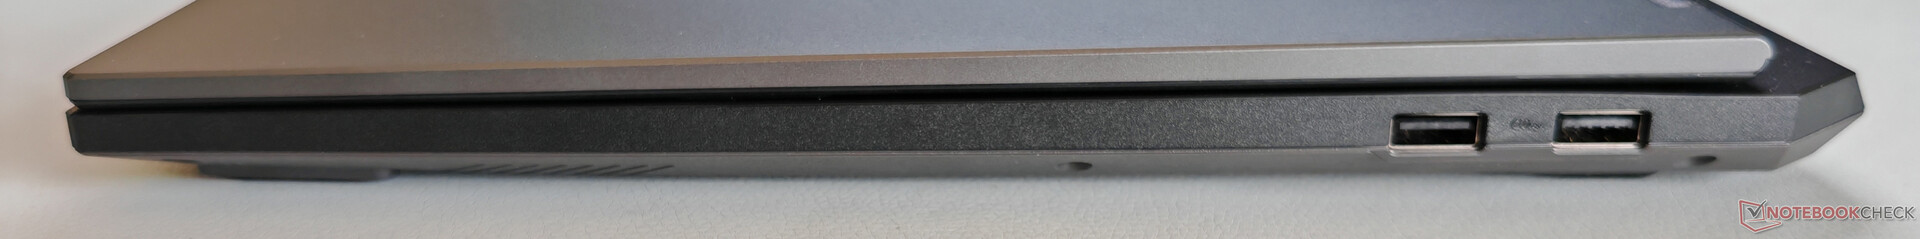
接口丰富,但没有 USB 4.0。1080p 网络摄像头(包括用于人脸识别的红外传感器)可拍摄出不错的照片,Wi-Fi 6E 模块可实现较高的传输速率,但没有 Wi-Fi 7。

| Networking | |
| Asus TUF Gaming A16 FA608UP | |
| iperf3 transmit AXE11000 | |
| iperf3 receive AXE11000 | |
| Alienware 16X Aurora, RTX 5070 | |
| iperf3 transmit AXE11000 | |
| iperf3 receive AXE11000 | |
| iperf3 transmit AXE11000 6GHz | |
| iperf3 receive AXE11000 6GHz | |
| Gigabyte Gaming A16 GA6H | |
| iperf3 transmit AXE11000 | |
| iperf3 receive AXE11000 | |
| Asus TUF Gaming A16 FA608WV | |
| iperf3 transmit AXE11000 | |
| iperf3 receive AXE11000 | |
| iperf3 transmit AXE11000 6GHz | |
| iperf3 receive AXE11000 6GHz | |
| Gigabyte Aero X16 1WH | |
| iperf3 transmit AXE11000 | |
| iperf3 receive AXE11000 | |
| Schenker XMG Pro 16 (E25) | |
| iperf3 transmit AXE11000 | |
| iperf3 receive AXE11000 | |


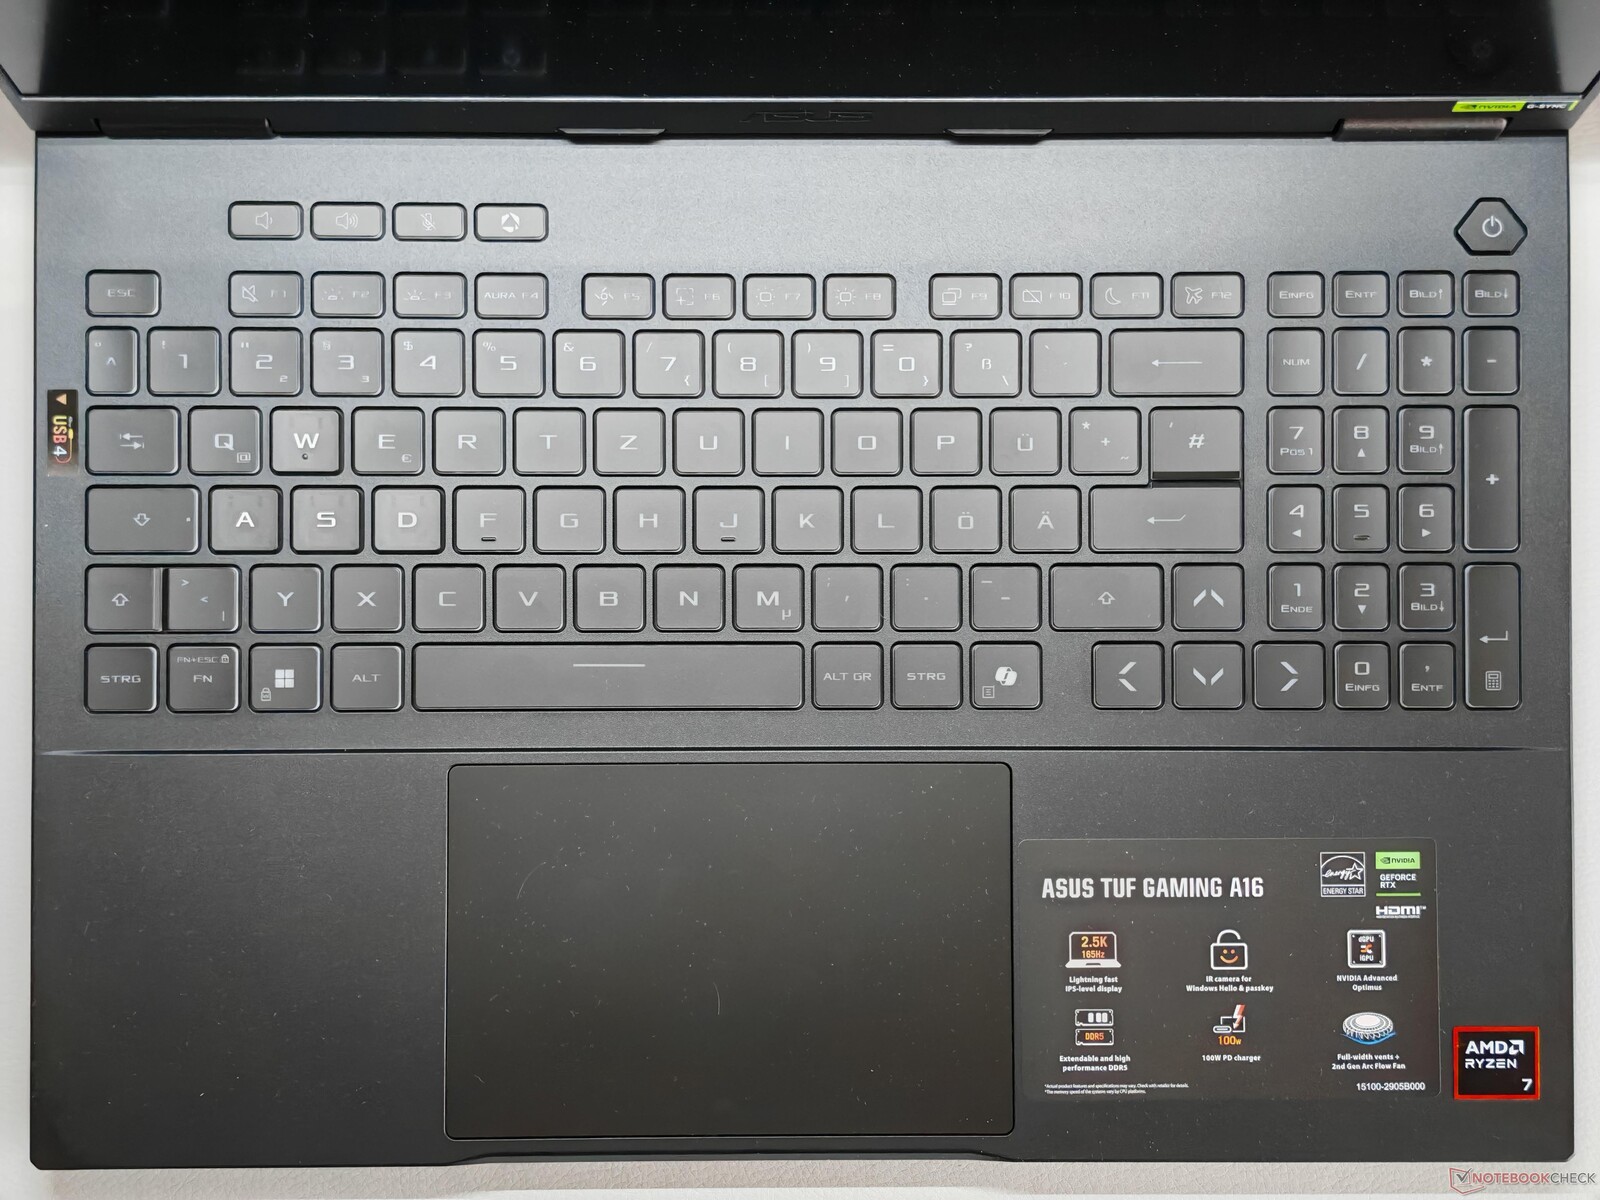
输入设备舒适的键盘
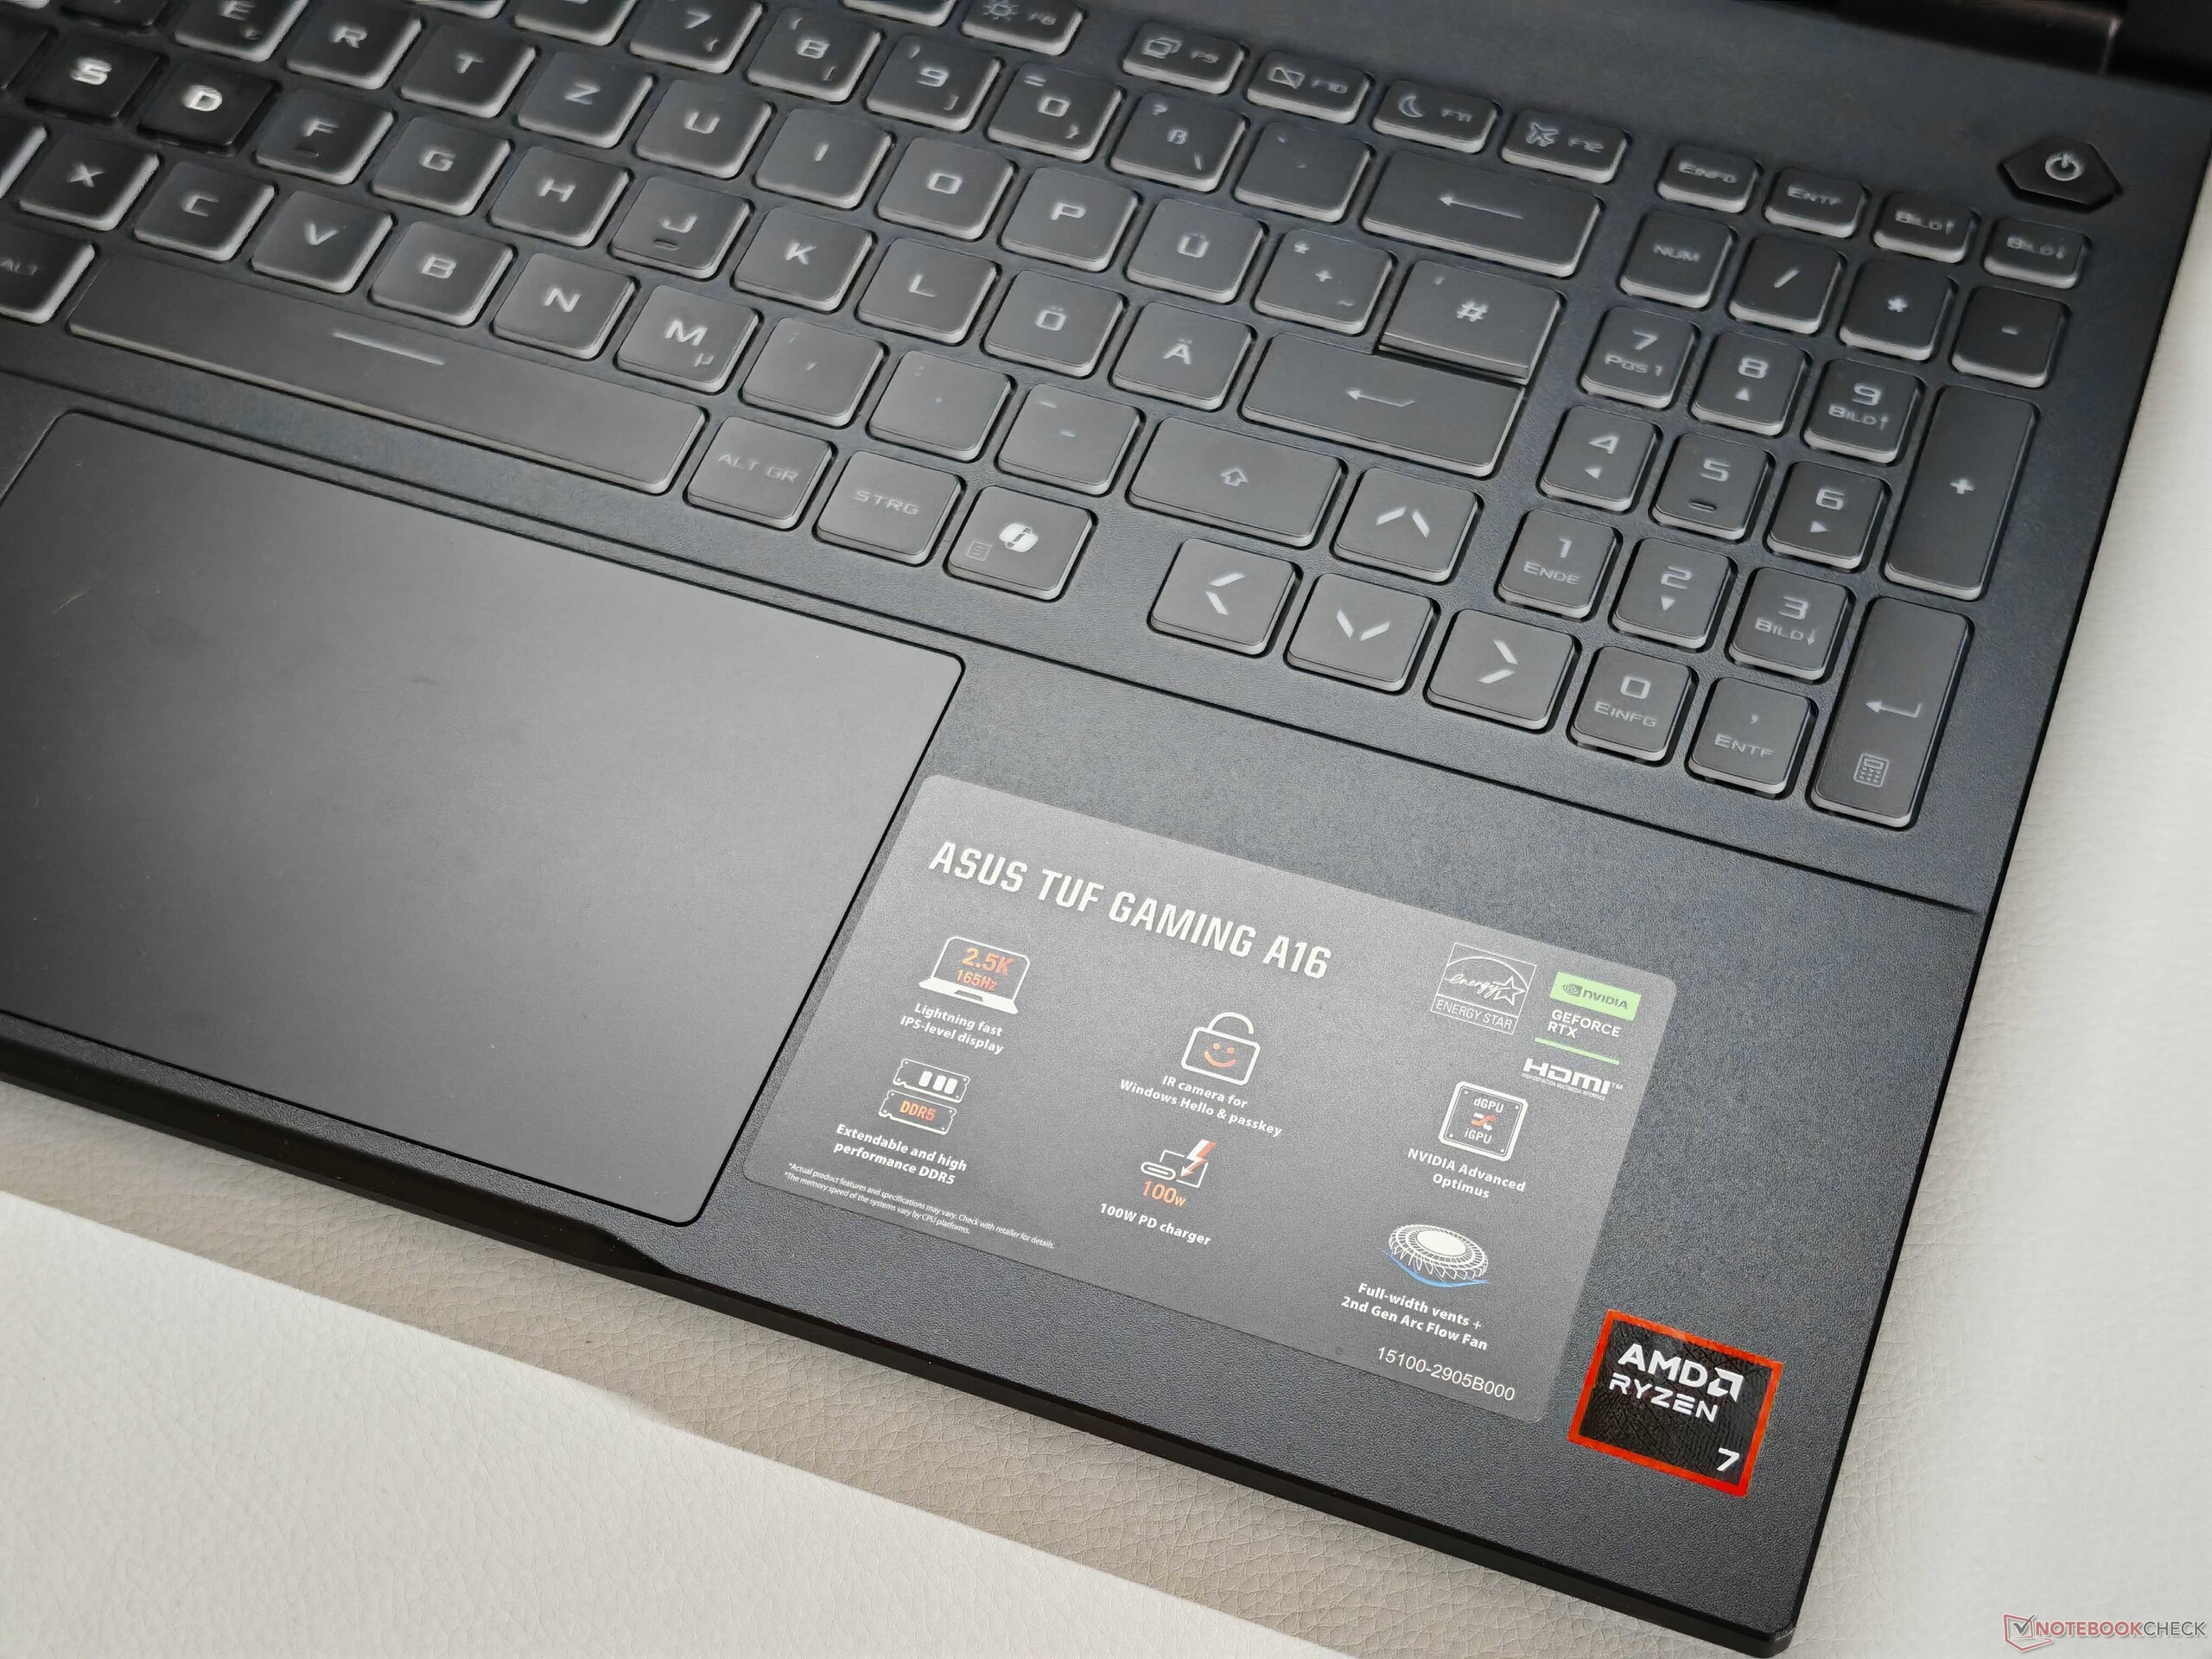
键盘上有一个专用数字键盘和几个额外的按键。总体而言,键盘布局没有任何问题,1.7 毫米的超长键程让输入体验非常舒适。
WASD 键的设计略有偏移,在激活单区 RGB 灯光时也能清晰辨认。
13 x 8.5 厘米的大触摸板具有非常好的滑动性能,下部区域的机械咔哒声也不大。不过,触摸板略微偏左,可能需要一些时间来适应。
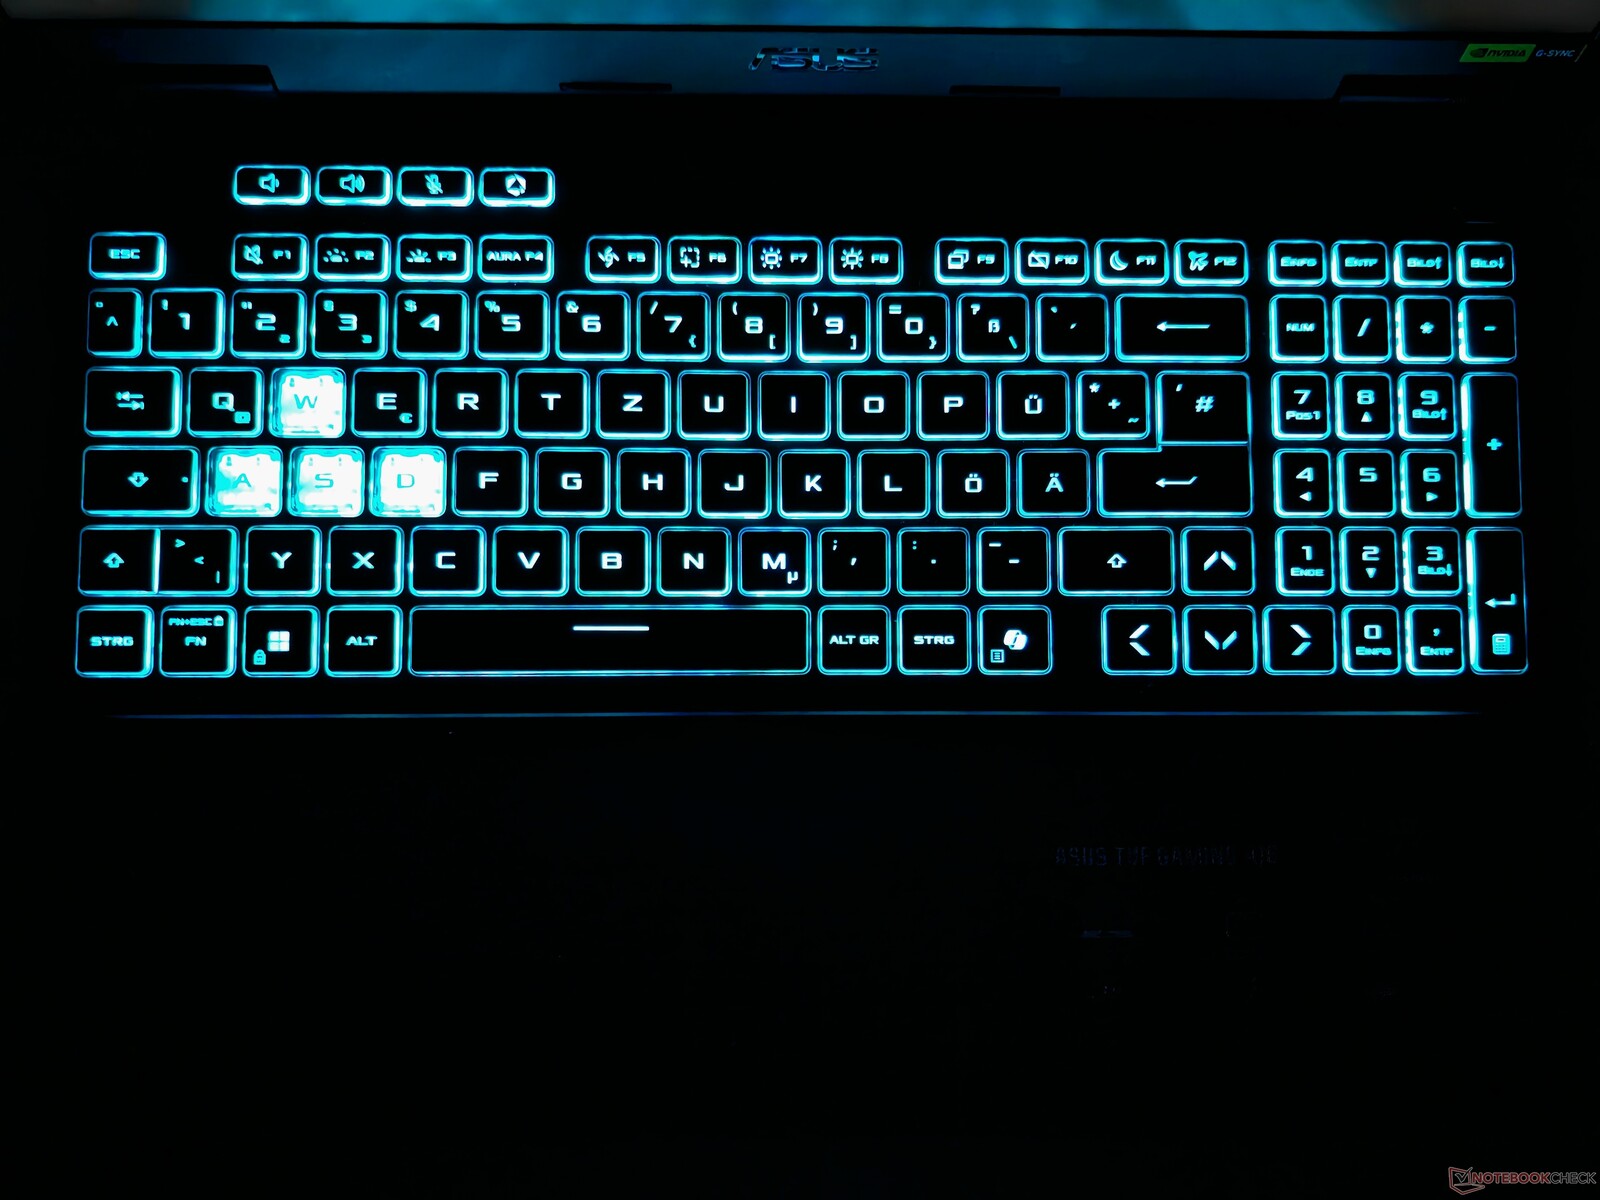
显示屏165 Hz QHD,G-Sync,无 PWM
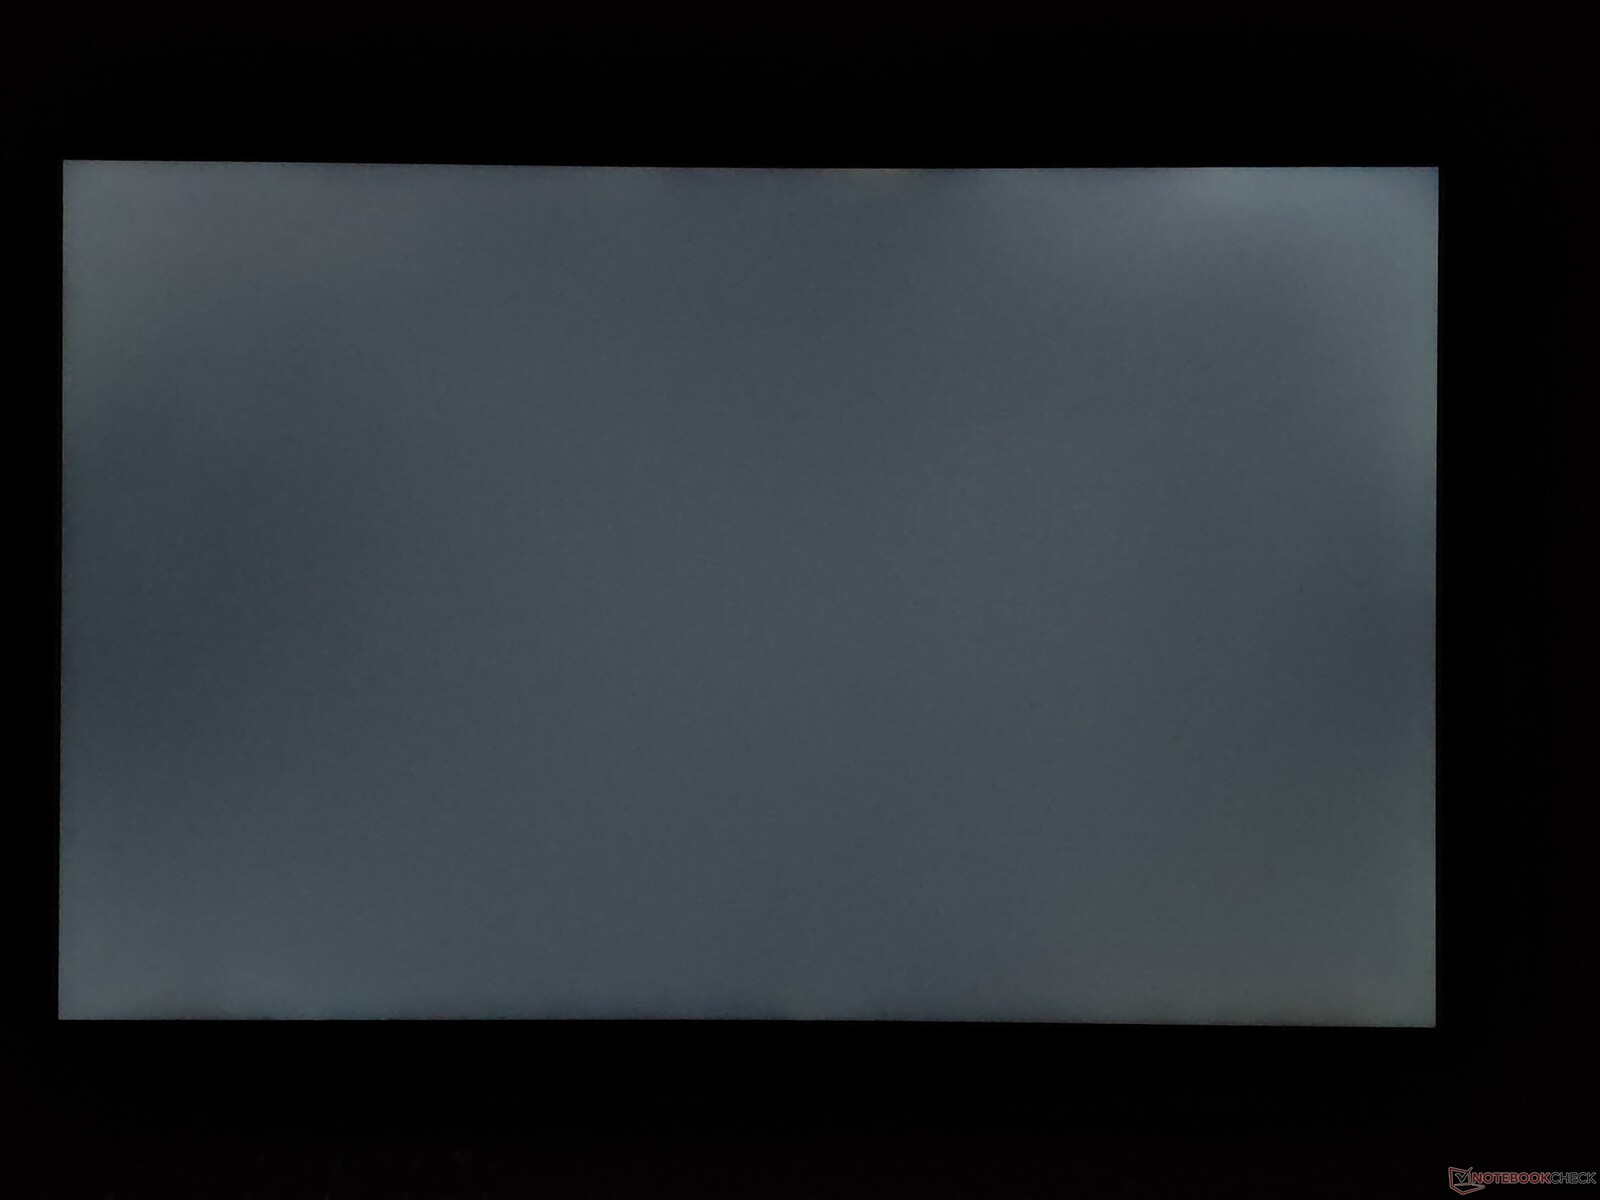
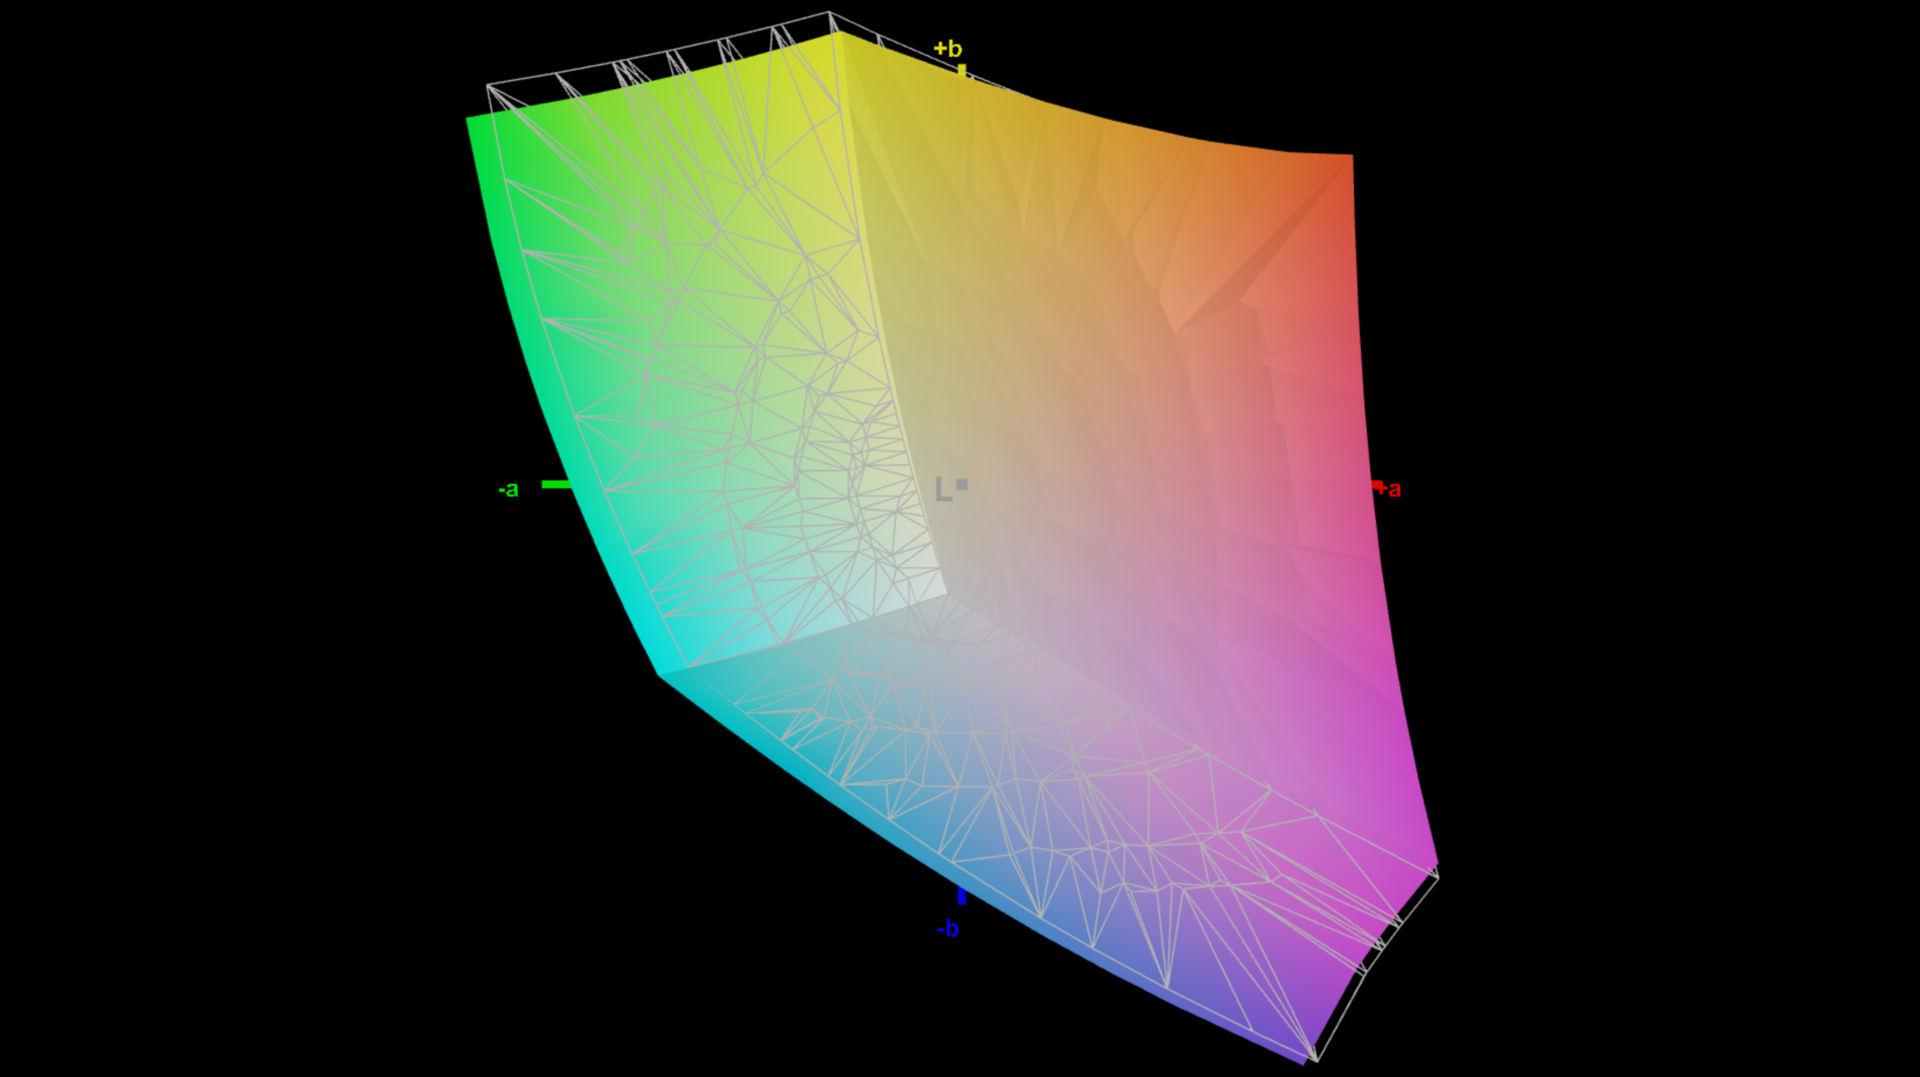
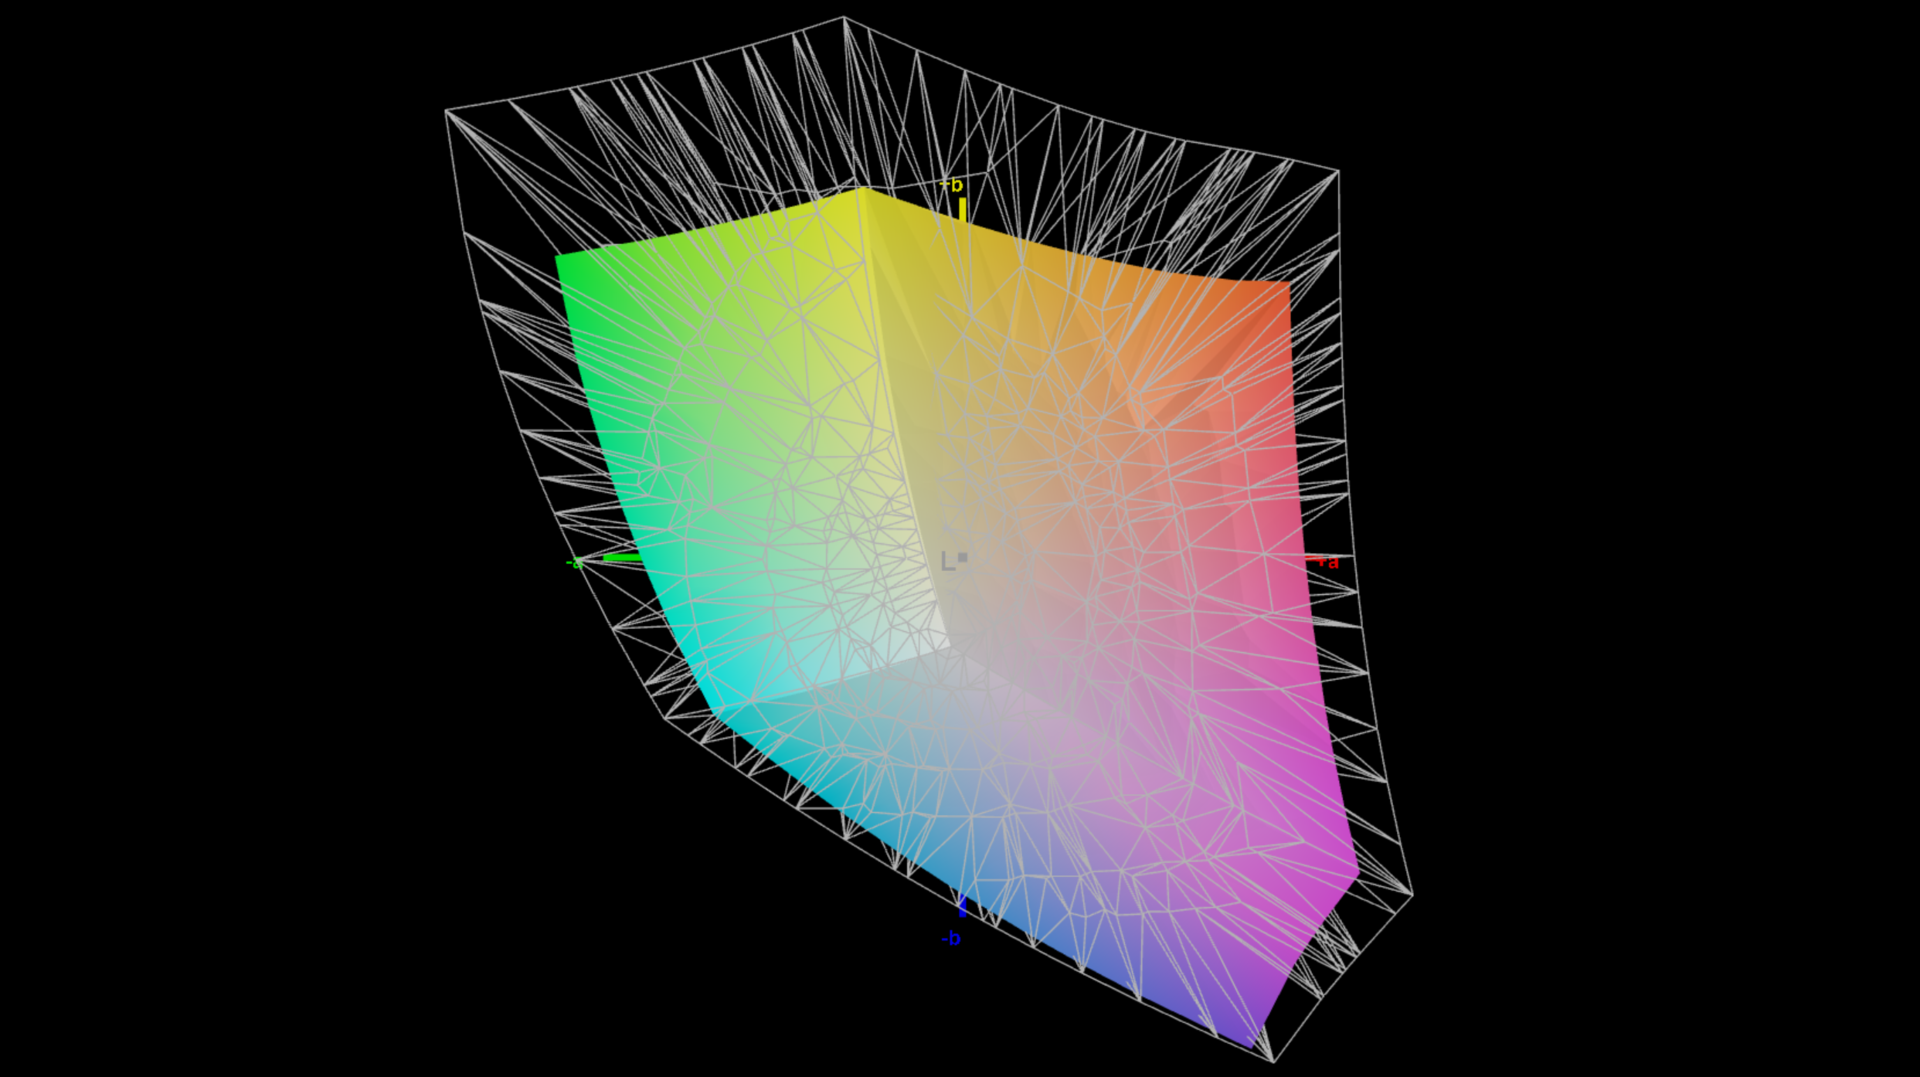
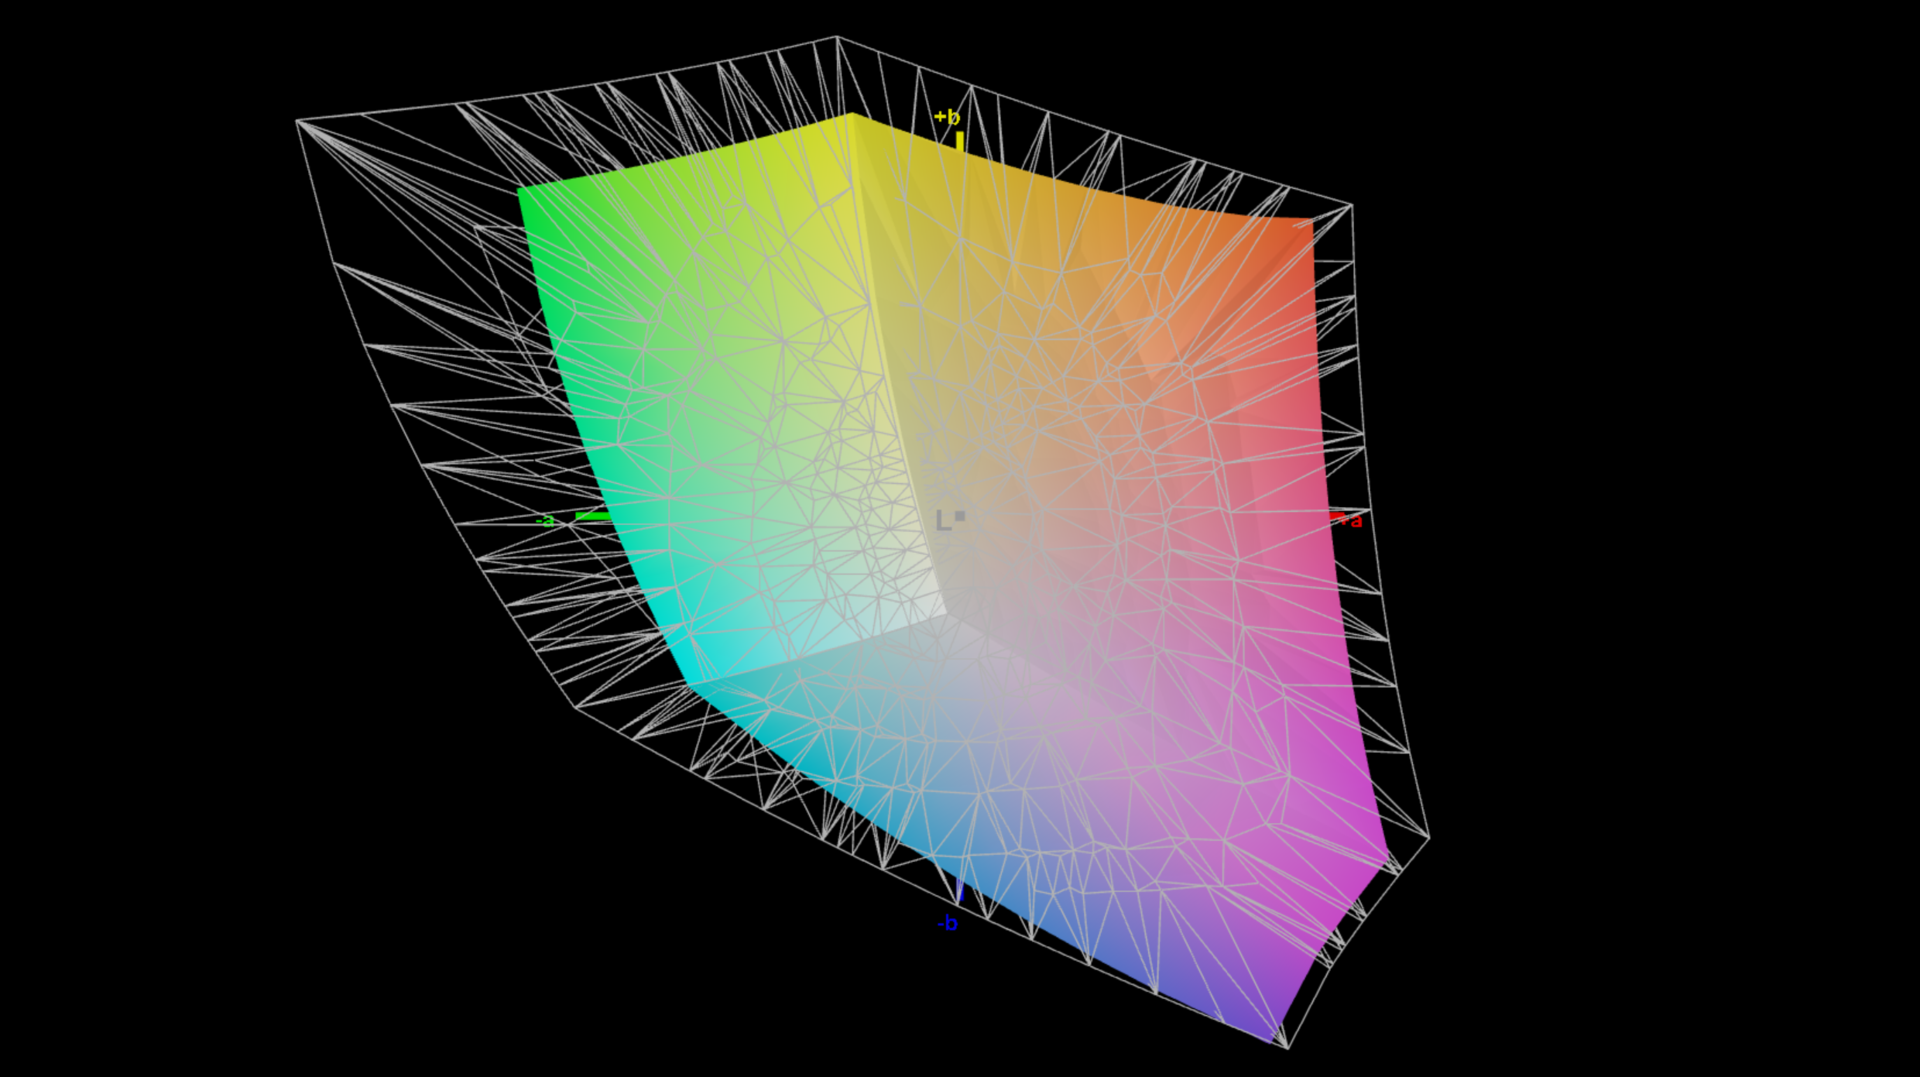
分辨率为 2,560 x 1,600 像素的雾面 IPS 面板提供了良好的主观画质,即使是明亮的内容也不会出现颗粒感。165 Hz 的高刷新率以及快速的响应时间和 G-Sync 技术都能让移动设备受益匪浅。此外,也不会出现 PWM 闪烁。
我们确定平均亮度为 450 cd/m²,黑色值为 0.32 cd/m²,因此对比度测量值为 1,500:1。
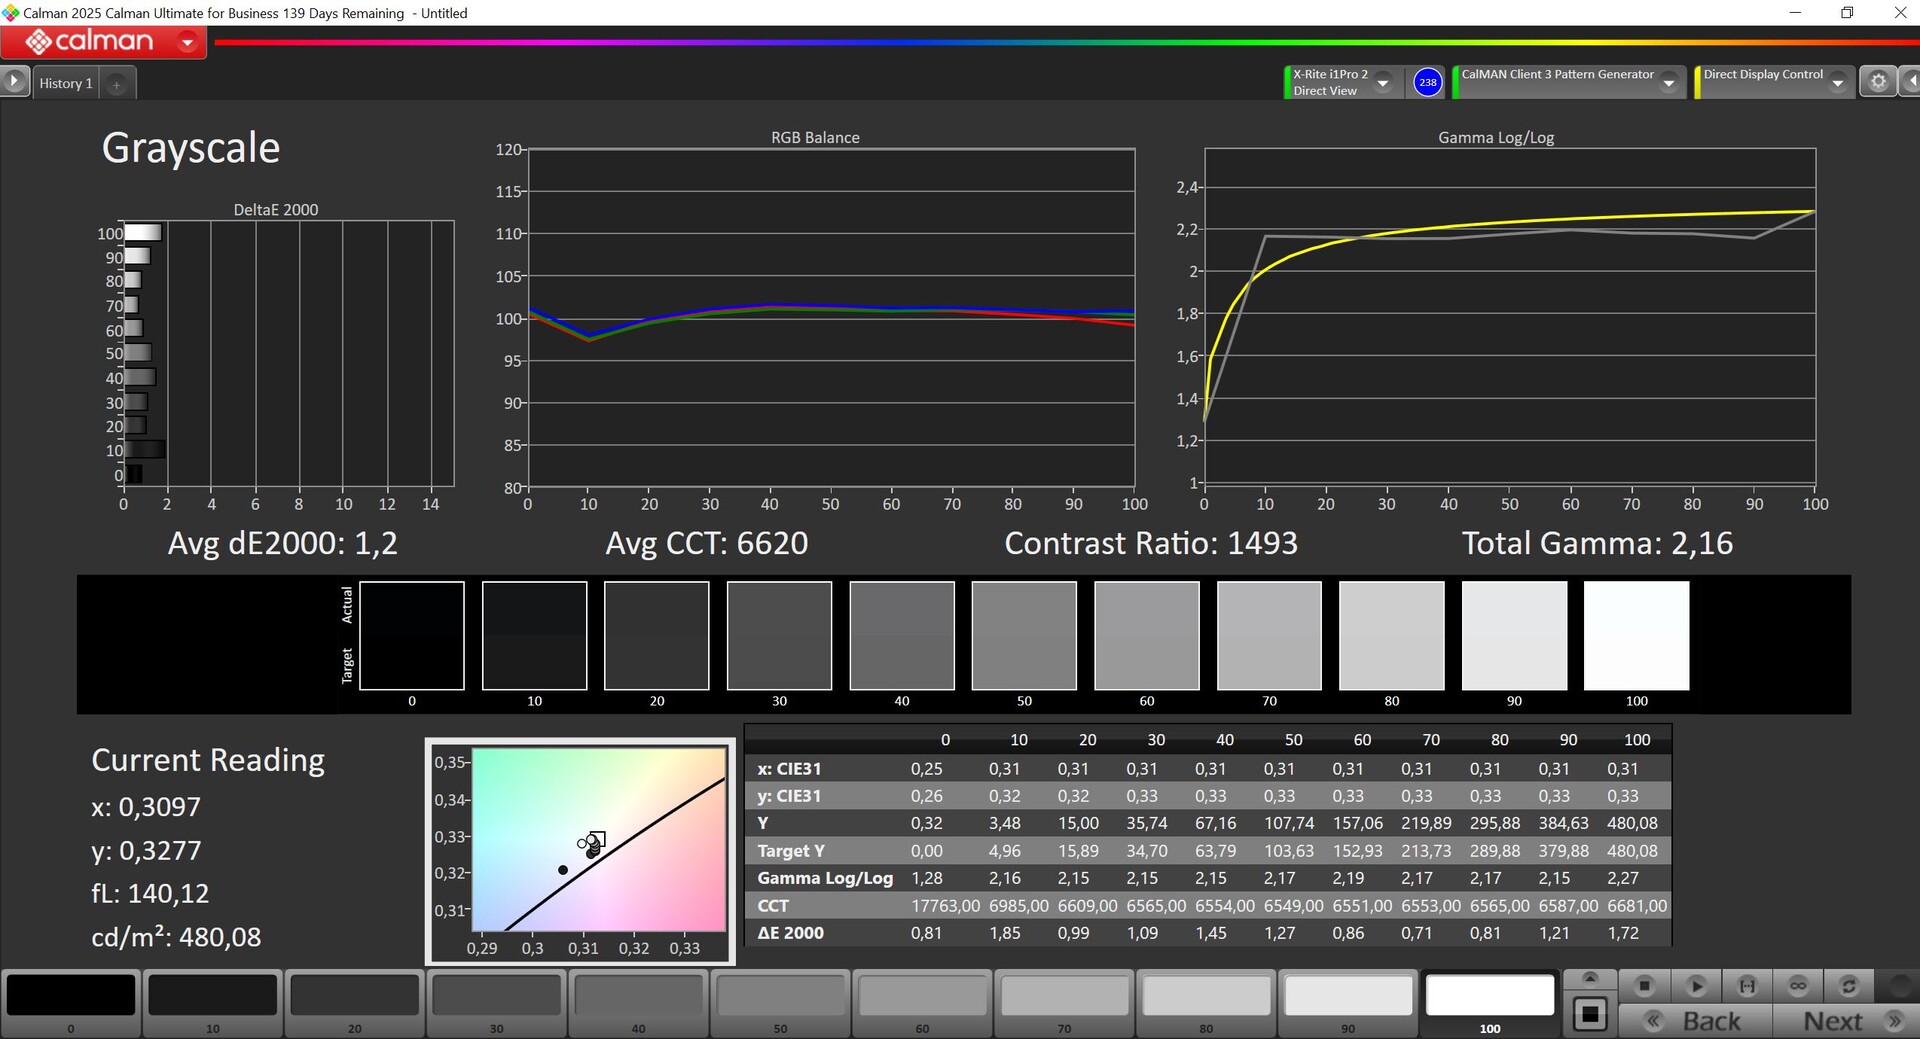
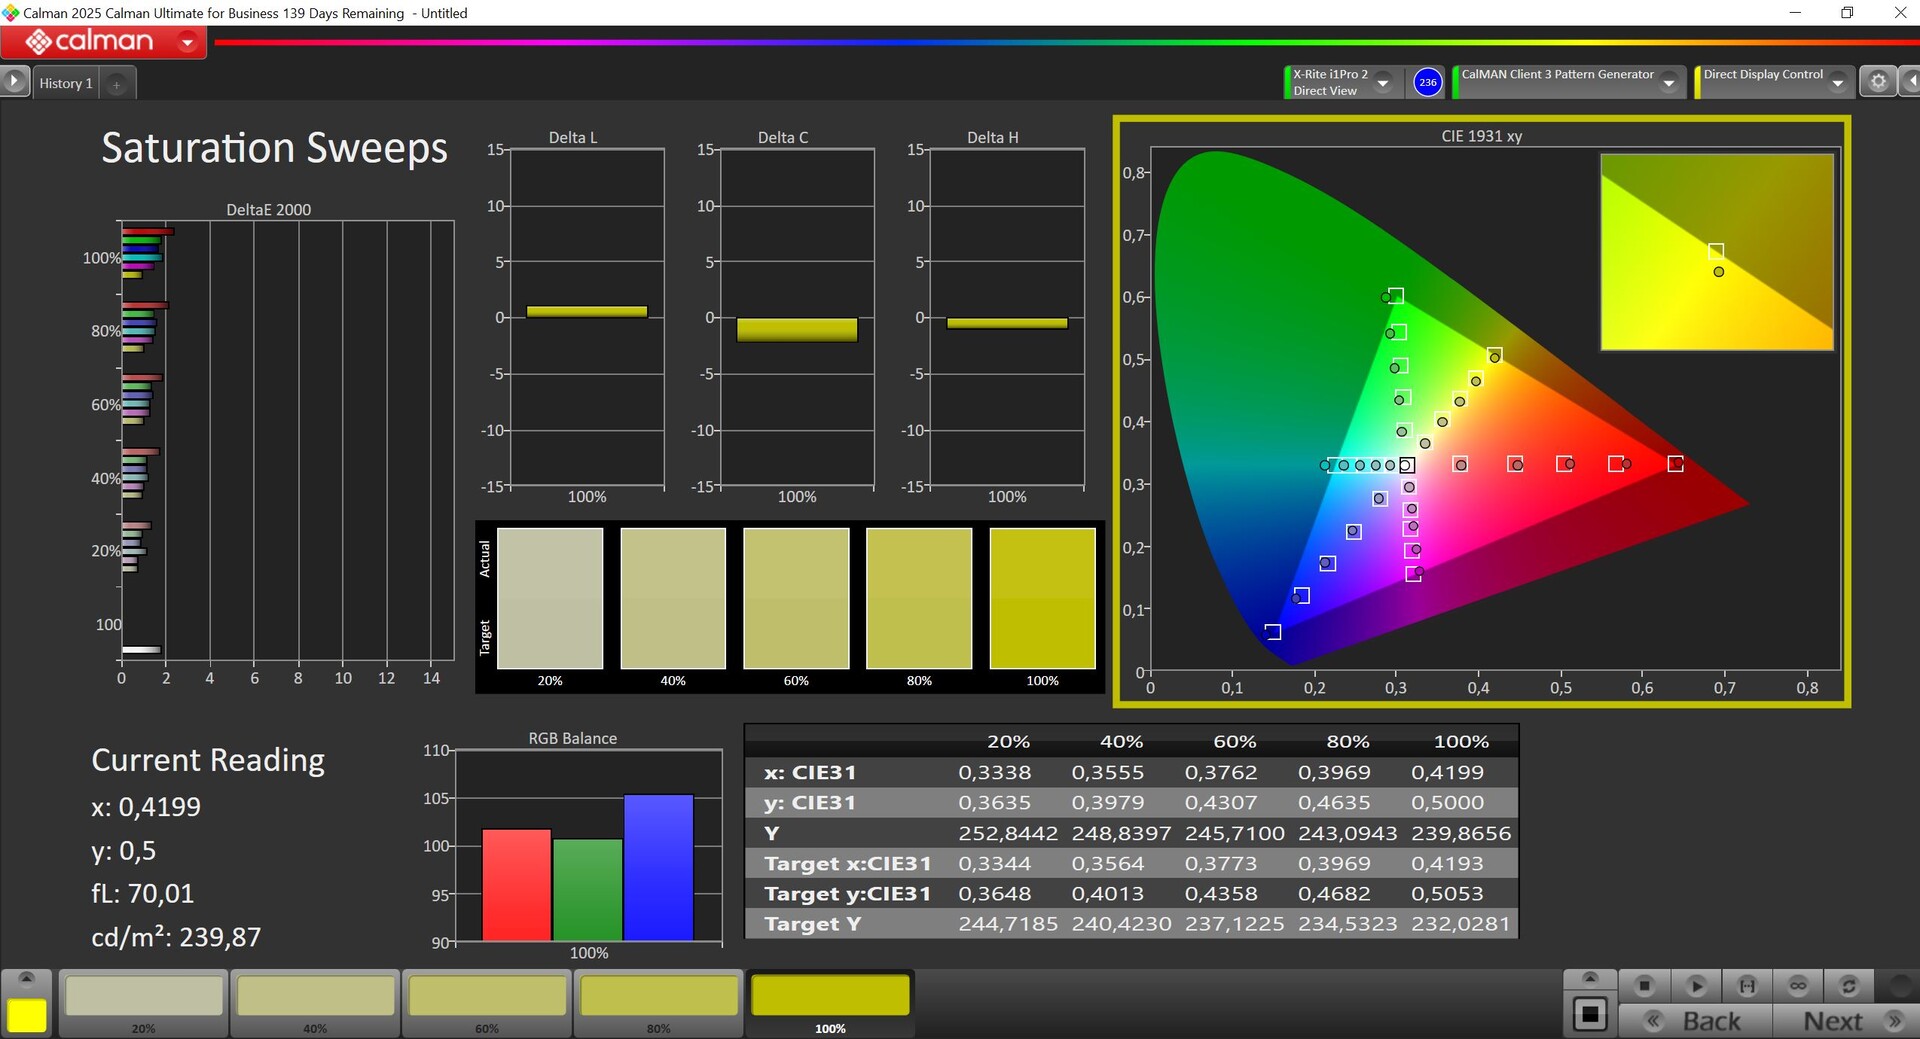
与更昂贵的 Zephyrus 型号相比,该面板只覆盖了 sRGB 色彩空间,而且只有一个单一的色彩配置文件,但这已经是很好的出厂设置了。
我们使用 Portrait Displays 的专业 Calman Ultimate 软件进行分析,结果显示色彩偏差很小,灰阶也没有偏色。我们可以通过自己的校准稍稍改善显示效果,但其实没有必要。
| |||||||||||||||||||||||||
Brightness Distribution: 91 %
Contrast: 1500:1 (Black: 0.32 cd/m²)
ΔE ColorChecker Calman: 1.4 | ∀{0.5-29.43 Ø4.73}
calibrated: 1.3
ΔE Greyscale Calman: 1.2 | ∀{0.09-98 Ø4.97}
71.9% AdobeRGB 1998 (Argyll 3D)
97.2% sRGB (Argyll 3D)
69.4% Display P3 (Argyll 3D)
Gamma: 2.16
CCT: 6620 K
| Asus TUF Gaming A16 FA608UP MNG007DA5-3, IPS, 2560x1600, 16", 165 Hz | Alienware 16X Aurora, RTX 5070 LG Philips 160WQG, IPS, 2560x1600, 16", 240 Hz | Gigabyte Gaming A16 GA6H NE160QDM-NYJ (BOE0C80), IPS, 2560x1600, 16", 165 Hz | Asus TUF Gaming A16 FA608WV B160UAN08.1 (AUO9BB0), IPS, 1920x1200, 16", 144 Hz | Gigabyte Aero X16 1WH MNG007DA5-1, IPS, 2560x1600, 16", 165 Hz | Schenker XMG Pro 16 (E25) NE160QDM-NZL, IPS, 2560x1600, 16", 300 Hz | |
|---|---|---|---|---|---|---|
| Display | 23% | 1% | -42% | -1% | 5% | |
| Display P3 Coverage (%) | 69.4 | 96.9 40% | 69.4 0% | 39.8 -43% | 68.7 -1% | 74.7 8% |
| sRGB Coverage (%) | 97.2 | 99.8 3% | 99.5 2% | 59.7 -39% | 96.1 -1% | 99.8 3% |
| AdobeRGB 1998 Coverage (%) | 71.9 | 89.7 25% | 71.6 0% | 41.1 -43% | 71.2 -1% | 75.4 5% |
| Response Times | -25% | -87% | -96% | -54% | -40% | |
| Response Time Grey 50% / Grey 80% * (ms) | 6.3 ? | 4.3 ? 32% | 14.3 ? -127% | 13.6 ? -116% | 12 ? -90% | 10.5 ? -67% |
| Response Time Black / White * (ms) | 4.8 ? | 8.7 ? -81% | 7 ? -46% | 8.4 ? -75% | 5.6 ? -17% | 5.4 ? -13% |
| PWM Frequency (Hz) | ||||||
| Screen | -64% | -105% | -173% | -12% | -34% | |
| Brightness middle (cd/m²) | 480 | 493.2 3% | 432 -10% | 347 -28% | 395 -18% | 538 12% |
| Brightness (cd/m²) | 456 | 477 5% | 425 -7% | 321 -30% | 398 -13% | 508 11% |
| Brightness Distribution (%) | 91 | 93 2% | 91 0% | 88 -3% | 97 7% | 88 -3% |
| Black Level * (cd/m²) | 0.32 | 0.5 -56% | 0.37 -16% | 0.3 6% | 0.32 -0% | 0.47 -47% |
| Contrast (:1) | 1500 | 986 -34% | 1168 -22% | 1157 -23% | 1234 -18% | 1145 -24% |
| Colorchecker dE 2000 * | 1.4 | 3.57 -155% | 4.76 -240% | 5.89 -321% | 1.3 7% | 1.9 -36% |
| Colorchecker dE 2000 max. * | 2.5 | 7.03 -181% | 8.59 -244% | 19.26 -670% | 2.8 -12% | 4 -60% |
| Colorchecker dE 2000 calibrated * | 1.3 | 0.68 48% | 1.18 9% | 4.3 -231% | 1.4 -8% | |
| Greyscale dE 2000 * | 1.2 | 3.7 -208% | 6.2 -417% | 4.27 -256% | 1.8 -50% | 2.7 -125% |
| Gamma | 2.16 102% | 2.16 102% | 2.079 106% | 2.47 89% | 2.2 100% | 2.24 98% |
| CCT | 6620 98% | 5876 111% | 6690 97% | 7158 91% | 6842 95% | 7027 93% |
| Total Average (Program / Settings) | -22% /
-40% | -64% /
-80% | -104% /
-134% | -22% /
-15% | -23% /
-26% |
* ... smaller is better


Display Response Times
| ↔ Response Time Black to White | ||
|---|---|---|
| 4.8 ms ... rise ↗ and fall ↘ combined | ↗ 1.7 ms rise | 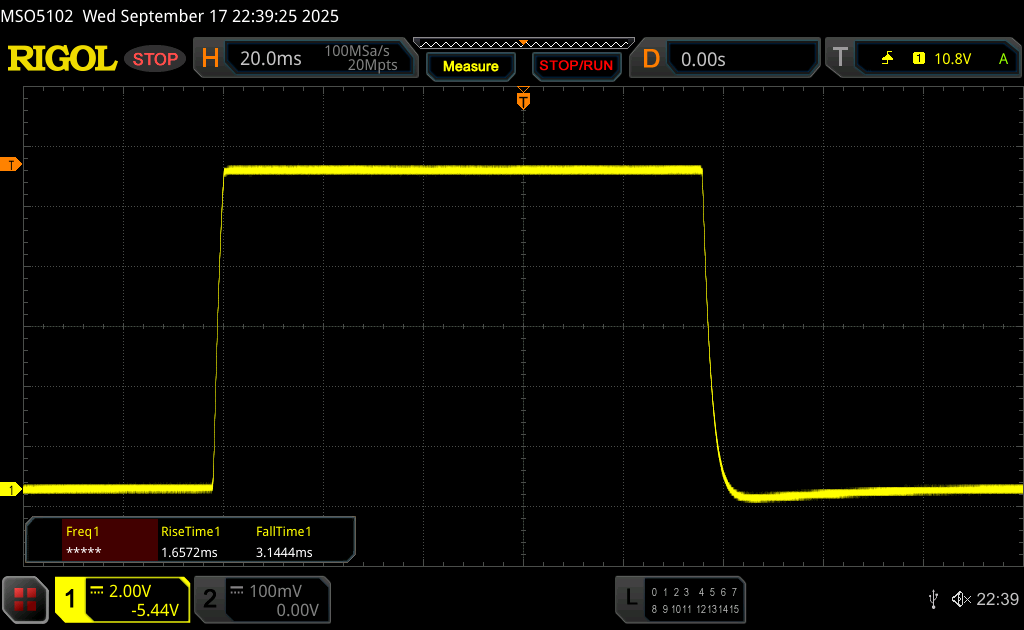 |
| ↘ 3.1 ms fall | ||
| The screen shows very fast response rates in our tests and should be very well suited for fast-paced gaming. In comparison, all tested devices range from 0.1 (minimum) to 240 (maximum) ms. » 17 % of all devices are better. This means that the measured response time is better than the average of all tested devices (19.9 ms). | ||
| ↔ Response Time 50% Grey to 80% Grey | ||
| 6.3 ms ... rise ↗ and fall ↘ combined | ↗ 2.8 ms rise | 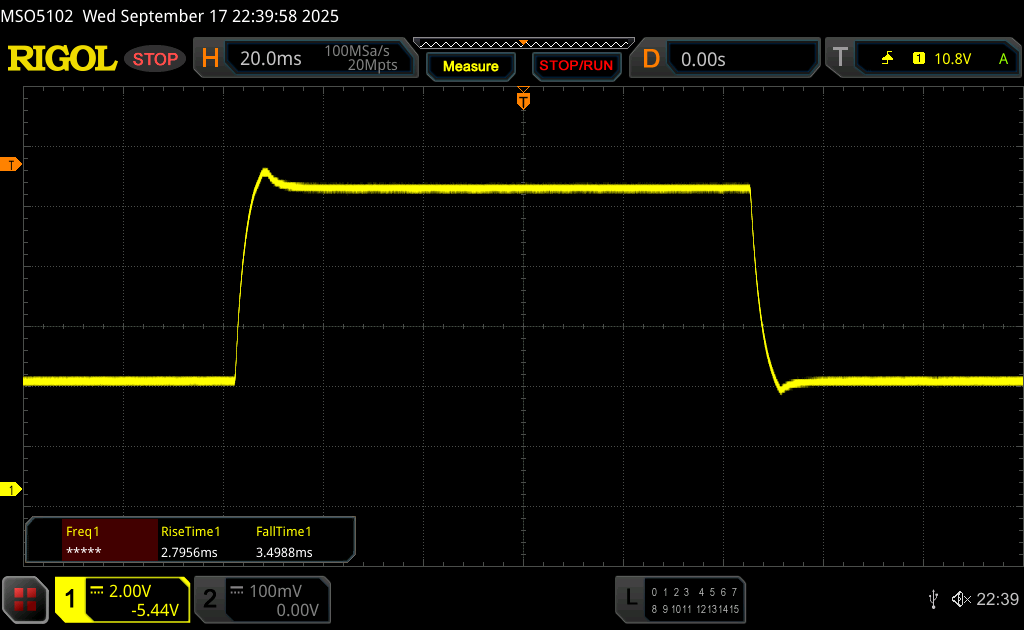 |
| ↘ 3.5 ms fall | ||
| The screen shows very fast response rates in our tests and should be very well suited for fast-paced gaming. In comparison, all tested devices range from 0.165 (minimum) to 636 (maximum) ms. » 19 % of all devices are better. This means that the measured response time is better than the average of all tested devices (31.1 ms). | ||
Screen Flickering / PWM (Pulse-Width Modulation)
| Screen flickering / PWM not detected | 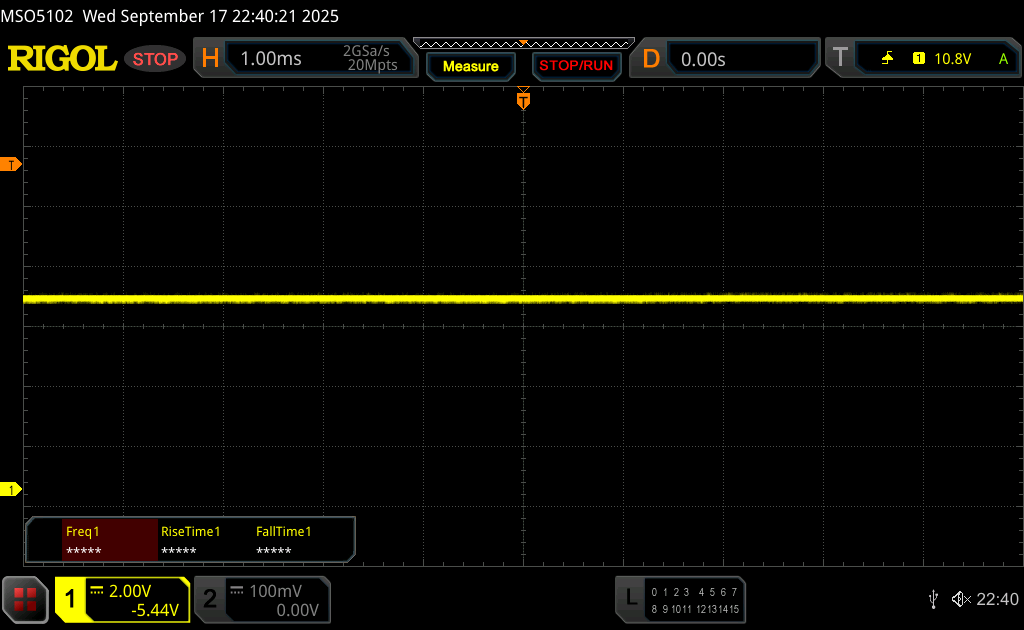 | ||
In comparison: 52 % of all tested devices do not use PWM to dim the display. If PWM was detected, an average of 7791 (minimum: 5 - maximum: 343500) Hz was measured. | |||


性能:鹰点禅 4 遇上布莱克威尔
测试条件
像往常一样,华硕在 Armoury Crate 软件中提供了各种能耗曲线,我们在下表列出了这些曲线。我们在Turbo 模式下进行了基准测试和测量,以显示最高性能。
| 能源概况 | CPU TDP | CB 2024 Multi | GPU TGP | Time Spy 图形 | 赛博朋克 2077 QHD | 最大风扇容量 |
|---|---|---|---|---|---|---|
| 静音 | 65 / 54 W | 912 点 | 65 W | 10,722 点 | 47.8 fps | 39.3 dB(A) |
| 性能 | 80 / 70 W | 967 分 | 95 W | 13,842 分 | 65 fps | 46.7 dB(A) |
| 涡轮 | 80 W | 990 分 | 115 W | 14,771 分 | 69.1 fps | 57.1 dB(A) |
| 电池(性能) | 75 / 55 W | 963 分 | 42 W | 8,895 分 | 42.9 fps | 39.3 dB(A) |
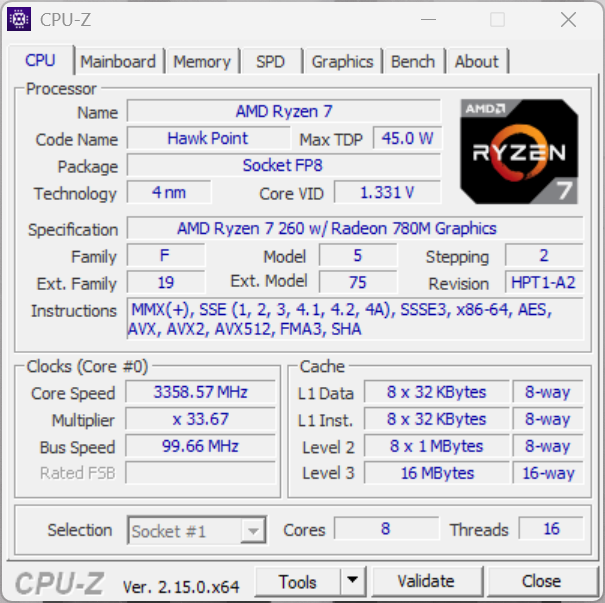
处理器AMD Ryzen 7 260
我们的测试设备配备了 AMD Ryzen 7 260(鹰点),它提供 8 个 Zen 4 内核,最高主频可达 5.1 GHz。归根结底,这是一款 Ryzen 7 8845HS的多核性能尚可,尤其是测试设备的 80 W TDP。
不过,与竞争对手相比,单核性能无疑是一个软肋。TUF A16 还可选配 Ryzen 9 8940HX(Zen 4,但有 16 个核心)。
Cinebench R15 多核循环
Cinebench R23: Multi Core | Single Core
Cinebench R20: CPU (Multi Core) | CPU (Single Core)
Cinebench R15: CPU Multi 64Bit | CPU Single 64Bit
Blender: v2.79 BMW27 CPU
7-Zip 18.03: 7z b 4 | 7z b 4 -mmt1
Geekbench 6.7: Multi-Core | Single-Core
Geekbench 5.5: Multi-Core | Single-Core
HWBOT x265 Benchmark v2.2: 4k Preset
LibreOffice : 20 Documents To PDF
R Benchmark 2.5: Overall mean
| CPU Performance rating | |
| Schenker XMG Pro 16 (E25) | |
| Alienware 16X Aurora, RTX 5070 | |
| Average of class Gaming | |
| Asus TUF Gaming A16 FA608WV | |
| Gigabyte Aero X16 1WH | |
| Asus TUF Gaming A16 FA608UP | |
| Average AMD Ryzen 7 260 | |
| Gigabyte Gaming A16 GA6H | |
| Cinebench R23 / Multi Core | |
| Schenker XMG Pro 16 (E25) | |
| Alienware 16X Aurora, RTX 5070 | |
| Average of class Gaming (10488 - 40970, n=110, last 2 years) | |
| Asus TUF Gaming A16 FA608WV | |
| Gigabyte Aero X16 1WH | |
| Asus TUF Gaming A16 FA608UP | |
| Average AMD Ryzen 7 260 (15864 - 17712, n=5) | |
| Gigabyte Gaming A16 GA6H | |
| Cinebench R23 / Single Core | |
| Schenker XMG Pro 16 (E25) | |
| Alienware 16X Aurora, RTX 5070 | |
| Asus TUF Gaming A16 FA608WV | |
| Average of class Gaming (1166 - 2356, n=110, last 2 years) | |
| Gigabyte Aero X16 1WH | |
| Gigabyte Gaming A16 GA6H | |
| Average AMD Ryzen 7 260 (1760 - 1801, n=5) | |
| Asus TUF Gaming A16 FA608UP | |
| Cinebench R20 / CPU (Multi Core) | |
| Schenker XMG Pro 16 (E25) | |
| Alienware 16X Aurora, RTX 5070 | |
| Average of class Gaming (4029 - 16108, n=109, last 2 years) | |
| Asus TUF Gaming A16 FA608WV | |
| Asus TUF Gaming A16 FA608UP | |
| Gigabyte Aero X16 1WH | |
| Average AMD Ryzen 7 260 (6161 - 6969, n=5) | |
| Gigabyte Gaming A16 GA6H | |
| Cinebench R20 / CPU (Single Core) | |
| Schenker XMG Pro 16 (E25) | |
| Alienware 16X Aurora, RTX 5070 | |
| Asus TUF Gaming A16 FA608WV | |
| Average of class Gaming (442 - 895, n=109, last 2 years) | |
| Gigabyte Aero X16 1WH | |
| Gigabyte Gaming A16 GA6H | |
| Average AMD Ryzen 7 260 (679 - 697, n=5) | |
| Asus TUF Gaming A16 FA608UP | |
| Cinebench R15 / CPU Multi 64Bit | |
| Alienware 16X Aurora, RTX 5070 | |
| Schenker XMG Pro 16 (E25) | |
| Average of class Gaming (1578 - 6271, n=109, last 2 years) | |
| Asus TUF Gaming A16 FA608WV | |
| Asus TUF Gaming A16 FA608UP | |
| Average AMD Ryzen 7 260 (2543 - 2831, n=5) | |
| Gigabyte Aero X16 1WH | |
| Gigabyte Gaming A16 GA6H | |
| Cinebench R15 / CPU Single 64Bit | |
| Schenker XMG Pro 16 (E25) | |
| Alienware 16X Aurora, RTX 5070 | |
| Asus TUF Gaming A16 FA608WV | |
| Average of class Gaming (188.8 - 343, n=109, last 2 years) | |
| Average AMD Ryzen 7 260 (275 - 283, n=5) | |
| Asus TUF Gaming A16 FA608UP | |
| Gigabyte Gaming A16 GA6H | |
| Gigabyte Aero X16 1WH | |
| Blender / v2.79 BMW27 CPU | |
| Gigabyte Gaming A16 GA6H | |
| Average AMD Ryzen 7 260 (182 - 204, n=5) | |
| Gigabyte Aero X16 1WH | |
| Asus TUF Gaming A16 FA608UP | |
| Average of class Gaming (80 - 330, n=107, last 2 years) | |
| Asus TUF Gaming A16 FA608WV | |
| Alienware 16X Aurora, RTX 5070 | |
| Schenker XMG Pro 16 (E25) | |
| 7-Zip 18.03 / 7z b 4 | |
| Schenker XMG Pro 16 (E25) | |
| Alienware 16X Aurora, RTX 5070 | |
| Average of class Gaming (33491 - 148086, n=108, last 2 years) | |
| Asus TUF Gaming A16 FA608WV | |
| Asus TUF Gaming A16 FA608UP | |
| Average AMD Ryzen 7 260 (63076 - 73490, n=5) | |
| Gigabyte Aero X16 1WH | |
| Gigabyte Gaming A16 GA6H | |
| 7-Zip 18.03 / 7z b 4 -mmt1 | |
| Schenker XMG Pro 16 (E25) | |
| Alienware 16X Aurora, RTX 5070 | |
| Average AMD Ryzen 7 260 (6101 - 6566, n=5) | |
| Average of class Gaming (4199 - 7436, n=108, last 2 years) | |
| Asus TUF Gaming A16 FA608UP | |
| Asus TUF Gaming A16 FA608WV | |
| Gigabyte Aero X16 1WH | |
| Gigabyte Gaming A16 GA6H | |
| Geekbench 6.7 / Multi-Core | |
| Schenker XMG Pro 16 (E25) | |
| Alienware 16X Aurora, RTX 5070 | |
| Average of class Gaming (6625 - 22104, n=109, last 2 years) | |
| Gigabyte Aero X16 1WH | |
| Asus TUF Gaming A16 FA608WV | |
| Asus TUF Gaming A16 FA608UP | |
| Average AMD Ryzen 7 260 (9977 - 13349, n=5) | |
| Gigabyte Gaming A16 GA6H | |
| Geekbench 6.7 / Single-Core | |
| Schenker XMG Pro 16 (E25) | |
| Alienware 16X Aurora, RTX 5070 | |
| Asus TUF Gaming A16 FA608WV | |
| Gigabyte Aero X16 1WH | |
| Average of class Gaming (1490 - 3259, n=109, last 2 years) | |
| Asus TUF Gaming A16 FA608UP | |
| Average AMD Ryzen 7 260 (2622 - 2686, n=5) | |
| Gigabyte Gaming A16 GA6H | |
| Geekbench 5.5 / Multi-Core | |
| Schenker XMG Pro 16 (E25) | |
| Alienware 16X Aurora, RTX 5070 | |
| Average of class Gaming (6460 - 27010, n=108, last 2 years) | |
| Asus TUF Gaming A16 FA608WV | |
| Gigabyte Aero X16 1WH | |
| Asus TUF Gaming A16 FA608UP | |
| Average AMD Ryzen 7 260 (9837 - 12597, n=5) | |
| Gigabyte Gaming A16 GA6H | |
| Geekbench 5.5 / Single-Core | |
| Schenker XMG Pro 16 (E25) | |
| Alienware 16X Aurora, RTX 5070 | |
| Asus TUF Gaming A16 FA608WV | |
| Gigabyte Aero X16 1WH | |
| Average of class Gaming (986 - 2474, n=108, last 2 years) | |
| Asus TUF Gaming A16 FA608UP | |
| Average AMD Ryzen 7 260 (1836 - 1986, n=5) | |
| Gigabyte Gaming A16 GA6H | |
| HWBOT x265 Benchmark v2.2 / 4k Preset | |
| Schenker XMG Pro 16 (E25) | |
| Alienware 16X Aurora, RTX 5070 | |
| Average of class Gaming (11.5 - 44.3, n=108, last 2 years) | |
| Asus TUF Gaming A16 FA608WV | |
| Gigabyte Aero X16 1WH | |
| Asus TUF Gaming A16 FA608UP | |
| Average AMD Ryzen 7 260 (17.6 - 22.4, n=5) | |
| Gigabyte Gaming A16 GA6H | |
| LibreOffice / 20 Documents To PDF | |
| Asus TUF Gaming A16 FA608UP | |
| Average AMD Ryzen 7 260 (49.6 - 63.5, n=5) | |
| Gigabyte Gaming A16 GA6H | |
| Gigabyte Aero X16 1WH | |
| Average of class Gaming (19 - 88.8, n=108, last 2 years) | |
| Asus TUF Gaming A16 FA608WV | |
| Schenker XMG Pro 16 (E25) | |
| Alienware 16X Aurora, RTX 5070 | |
| R Benchmark 2.5 / Overall mean | |
| Gigabyte Gaming A16 GA6H | |
| Asus TUF Gaming A16 FA608UP | |
| Average AMD Ryzen 7 260 (0.4432 - 0.4479, n=5) | |
| Average of class Gaming (0.3439 - 0.759, n=109, last 2 years) | |
| Alienware 16X Aurora, RTX 5070 | |
| Asus TUF Gaming A16 FA608WV | |
| Gigabyte Aero X16 1WH | |
| Schenker XMG Pro 16 (E25) | |
* ... smaller is better
AIDA64: FP32 Ray-Trace | FPU Julia | CPU SHA3 | CPU Queen | FPU SinJulia | FPU Mandel | CPU AES | CPU ZLib | FP64 Ray-Trace | CPU PhotoWorxx
| Performance rating | |
| Schenker XMG Pro 16 (E25) | |
| Alienware 16X Aurora, RTX 5070 | |
| Asus TUF Gaming A16 FA608WV | |
| Average of class Gaming | |
| Asus TUF Gaming A16 FA608UP | |
| Average AMD Ryzen 7 260 | |
| Gigabyte Aero X16 1WH | |
| Gigabyte Gaming A16 GA6H | |
| AIDA64 / FP32 Ray-Trace | |
| Asus TUF Gaming A16 FA608WV | |
| Schenker XMG Pro 16 (E25) | |
| Alienware 16X Aurora, RTX 5070 | |
| Average of class Gaming (10227 - 85542, n=107, last 2 years) | |
| Asus TUF Gaming A16 FA608UP | |
| Gigabyte Aero X16 1WH | |
| Average AMD Ryzen 7 260 (25995 - 29330, n=5) | |
| Gigabyte Gaming A16 GA6H | |
| AIDA64 / FPU Julia | |
| Schenker XMG Pro 16 (E25) | |
| Alienware 16X Aurora, RTX 5070 | |
| Asus TUF Gaming A16 FA608WV | |
| Average of class Gaming (51376 - 238426, n=107, last 2 years) | |
| Asus TUF Gaming A16 FA608UP | |
| Average AMD Ryzen 7 260 (106250 - 121427, n=5) | |
| Gigabyte Aero X16 1WH | |
| Gigabyte Gaming A16 GA6H | |
| AIDA64 / CPU SHA3 | |
| Schenker XMG Pro 16 (E25) | |
| Alienware 16X Aurora, RTX 5070 | |
| Average of class Gaming (2180 - 9817, n=107, last 2 years) | |
| Asus TUF Gaming A16 FA608WV | |
| Asus TUF Gaming A16 FA608UP | |
| Average AMD Ryzen 7 260 (4636 - 5026, n=5) | |
| Gigabyte Aero X16 1WH | |
| Gigabyte Gaming A16 GA6H | |
| AIDA64 / CPU Queen | |
| Alienware 16X Aurora, RTX 5070 | |
| Schenker XMG Pro 16 (E25) | |
| Average AMD Ryzen 7 260 (115108 - 123832, n=5) | |
| Asus TUF Gaming A16 FA608UP | |
| Average of class Gaming (49785 - 173351, n=98, last 2 years) | |
| Asus TUF Gaming A16 FA608WV | |
| Gigabyte Aero X16 1WH | |
| Gigabyte Gaming A16 GA6H | |
| AIDA64 / FPU SinJulia | |
| Asus TUF Gaming A16 FA608WV | |
| Asus TUF Gaming A16 FA608UP | |
| Average AMD Ryzen 7 260 (14810 - 15497, n=5) | |
| Average of class Gaming (4424 - 33636, n=107, last 2 years) | |
| Schenker XMG Pro 16 (E25) | |
| Gigabyte Aero X16 1WH | |
| Alienware 16X Aurora, RTX 5070 | |
| Gigabyte Gaming A16 GA6H | |
| AIDA64 / FPU Mandel | |
| Schenker XMG Pro 16 (E25) | |
| Alienware 16X Aurora, RTX 5070 | |
| Asus TUF Gaming A16 FA608WV | |
| Average of class Gaming (25115 - 128721, n=107, last 2 years) | |
| Asus TUF Gaming A16 FA608UP | |
| Average AMD Ryzen 7 260 (56974 - 65308, n=5) | |
| Gigabyte Aero X16 1WH | |
| Gigabyte Gaming A16 GA6H | |
| AIDA64 / CPU AES | |
| Schenker XMG Pro 16 (E25) | |
| Alienware 16X Aurora, RTX 5070 | |
| Average of class Gaming (39258 - 247074, n=107, last 2 years) | |
| Asus TUF Gaming A16 FA608UP | |
| Gigabyte Aero X16 1WH | |
| Asus TUF Gaming A16 FA608WV | |
| Average AMD Ryzen 7 260 (66825 - 91093, n=5) | |
| Gigabyte Gaming A16 GA6H | |
| AIDA64 / CPU ZLib | |
| Schenker XMG Pro 16 (E25) | |
| Alienware 16X Aurora, RTX 5070 | |
| Asus TUF Gaming A16 FA608WV | |
| Average of class Gaming (574 - 2531, n=107, last 2 years) | |
| Gigabyte Aero X16 1WH | |
| Average AMD Ryzen 7 260 (1039 - 1133, n=5) | |
| Asus TUF Gaming A16 FA608UP | |
| Gigabyte Gaming A16 GA6H | |
| AIDA64 / FP64 Ray-Trace | |
| Asus TUF Gaming A16 FA608WV | |
| Schenker XMG Pro 16 (E25) | |
| Alienware 16X Aurora, RTX 5070 | |
| Average of class Gaming (5509 - 45446, n=107, last 2 years) | |
| Asus TUF Gaming A16 FA608UP | |
| Gigabyte Aero X16 1WH | |
| Average AMD Ryzen 7 260 (13944 - 15751, n=5) | |
| Gigabyte Gaming A16 GA6H | |
| AIDA64 / CPU PhotoWorxx | |
| Schenker XMG Pro 16 (E25) | |
| Alienware 16X Aurora, RTX 5070 | |
| Average of class Gaming (12271 - 89891, n=107, last 2 years) | |
| Gigabyte Aero X16 1WH | |
| Asus TUF Gaming A16 FA608UP | |
| Asus TUF Gaming A16 FA608WV | |
| Average AMD Ryzen 7 260 (23097 - 40796, n=5) | |
| Gigabyte Gaming A16 GA6H | |
系统性能
TUF A16 的主观系统性能非常出色,但 Zen 4 处理器的局限性在基准测试中显而易见。
此外,我们无法在测试设备上运行 PCMark 10 测试,因为它反复中止。这可能是由于当前的 Nvidia 驱动程序造成的,但在测试过程中没有出现其他问题。
CrossMark: Overall | Productivity | Creativity | Responsiveness
WebXPRT 3: Overall
WebXPRT 4: Overall
Mozilla Kraken 1.1: Total
| Performance rating | |
| Alienware 16X Aurora, RTX 5070 | |
| Schenker XMG Pro 16 (E25) | |
| Average of class Gaming | |
| Gigabyte Aero X16 1WH | |
| Gigabyte Gaming A16 GA6H | |
| Asus TUF Gaming A16 FA608WV | |
| Average AMD Ryzen 7 260, NVIDIA GeForce RTX 5070 Laptop | |
| Asus TUF Gaming A16 FA608UP | |
| CrossMark / Overall | |
| Alienware 16X Aurora, RTX 5070 | |
| Schenker XMG Pro 16 (E25) | |
| Average of class Gaming (1366 - 2409, n=96, last 2 years) | |
| Gigabyte Gaming A16 GA6H | |
| Asus TUF Gaming A16 FA608WV | |
| Gigabyte Aero X16 1WH | |
| Average AMD Ryzen 7 260, NVIDIA GeForce RTX 5070 Laptop (1712 - 1758, n=3) | |
| Asus TUF Gaming A16 FA608UP | |
| CrossMark / Productivity | |
| Alienware 16X Aurora, RTX 5070 | |
| Schenker XMG Pro 16 (E25) | |
| Average of class Gaming (1386 - 2254, n=96, last 2 years) | |
| Gigabyte Gaming A16 GA6H | |
| Average AMD Ryzen 7 260, NVIDIA GeForce RTX 5070 Laptop (1648 - 1725, n=3) | |
| Gigabyte Aero X16 1WH | |
| Asus TUF Gaming A16 FA608UP | |
| Asus TUF Gaming A16 FA608WV | |
| CrossMark / Creativity | |
| Schenker XMG Pro 16 (E25) | |
| Alienware 16X Aurora, RTX 5070 | |
| Average of class Gaming (1343 - 2729, n=96, last 2 years) | |
| Asus TUF Gaming A16 FA608WV | |
| Gigabyte Aero X16 1WH | |
| Average AMD Ryzen 7 260, NVIDIA GeForce RTX 5070 Laptop (1782 - 1986, n=3) | |
| Asus TUF Gaming A16 FA608UP | |
| Gigabyte Gaming A16 GA6H | |
| CrossMark / Responsiveness | |
| Alienware 16X Aurora, RTX 5070 | |
| Gigabyte Gaming A16 GA6H | |
| Schenker XMG Pro 16 (E25) | |
| Average of class Gaming (1226 - 2334, n=96, last 2 years) | |
| Average AMD Ryzen 7 260, NVIDIA GeForce RTX 5070 Laptop (1441 - 1578, n=3) | |
| Gigabyte Aero X16 1WH | |
| Asus TUF Gaming A16 FA608UP | |
| Asus TUF Gaming A16 FA608WV | |
| WebXPRT 3 / Overall | |
| Alienware 16X Aurora, RTX 5070 | |
| Schenker XMG Pro 16 (E25) | |
| Gigabyte Aero X16 1WH | |
| Average of class Gaming (242 - 532, n=99, last 2 years) | |
| Asus TUF Gaming A16 FA608UP | |
| Average AMD Ryzen 7 260, NVIDIA GeForce RTX 5070 Laptop (288 - 297, n=3) | |
| Asus TUF Gaming A16 FA608WV | |
| Gigabyte Gaming A16 GA6H | |
| WebXPRT 4 / Overall | |
| Schenker XMG Pro 16 (E25) | |
| Alienware 16X Aurora, RTX 5070 | |
| Average of class Gaming (176.4 - 354, n=99, last 2 years) | |
| Gigabyte Aero X16 1WH | |
| Asus TUF Gaming A16 FA608WV | |
| Gigabyte Gaming A16 GA6H | |
| Asus TUF Gaming A16 FA608UP | |
| Average AMD Ryzen 7 260, NVIDIA GeForce RTX 5070 Laptop (237 - 239, n=3) | |
| Mozilla Kraken 1.1 / Total | |
| Asus TUF Gaming A16 FA608UP | |
| Average AMD Ryzen 7 260, NVIDIA GeForce RTX 5070 Laptop (522 - 565, n=3) | |
| Gigabyte Gaming A16 GA6H | |
| Average of class Gaming (391 - 590, n=104, last 2 years) | |
| Gigabyte Aero X16 1WH | |
| Asus TUF Gaming A16 FA608WV | |
| Alienware 16X Aurora, RTX 5070 | |
| Schenker XMG Pro 16 (E25) | |
* ... smaller is better
| AIDA64 / Memory Copy | |
| Asus TUF Gaming A16 FA608WV | |
| Schenker XMG Pro 16 (E25) | |
| Alienware 16X Aurora, RTX 5070 | |
| Gigabyte Aero X16 1WH | |
| Average of class Gaming (21750 - 129946, n=107, last 2 years) | |
| Asus TUF Gaming A16 FA608UP | |
| Average AMD Ryzen 7 260 (35762 - 69413, n=5) | |
| Gigabyte Gaming A16 GA6H | |
| AIDA64 / Memory Read | |
| Asus TUF Gaming A16 FA608WV | |
| Schenker XMG Pro 16 (E25) | |
| Alienware 16X Aurora, RTX 5070 | |
| Average of class Gaming (22956 - 118858, n=107, last 2 years) | |
| Gigabyte Aero X16 1WH | |
| Asus TUF Gaming A16 FA608UP | |
| Average AMD Ryzen 7 260 (30070 - 61170, n=5) | |
| Gigabyte Gaming A16 GA6H | |
| AIDA64 / Memory Write | |
| Asus TUF Gaming A16 FA608WV | |
| Asus TUF Gaming A16 FA608UP | |
| Gigabyte Aero X16 1WH | |
| Schenker XMG Pro 16 (E25) | |
| Alienware 16X Aurora, RTX 5070 | |
| Average of class Gaming (22297 - 135096, n=107, last 2 years) | |
| Average AMD Ryzen 7 260 (42757 - 87114, n=5) | |
| Gigabyte Gaming A16 GA6H | |
| AIDA64 / Memory Latency | |
| Alienware 16X Aurora, RTX 5070 | |
| Asus TUF Gaming A16 FA608WV | |
| Average of class Gaming (75.3 - 259, n=107, last 2 years) | |
| Schenker XMG Pro 16 (E25) | |
| Gigabyte Gaming A16 GA6H | |
| Gigabyte Aero X16 1WH | |
| Asus TUF Gaming A16 FA608UP | |
| Average AMD Ryzen 7 260 (91.5 - 94.1, n=5) | |
* ... smaller is better
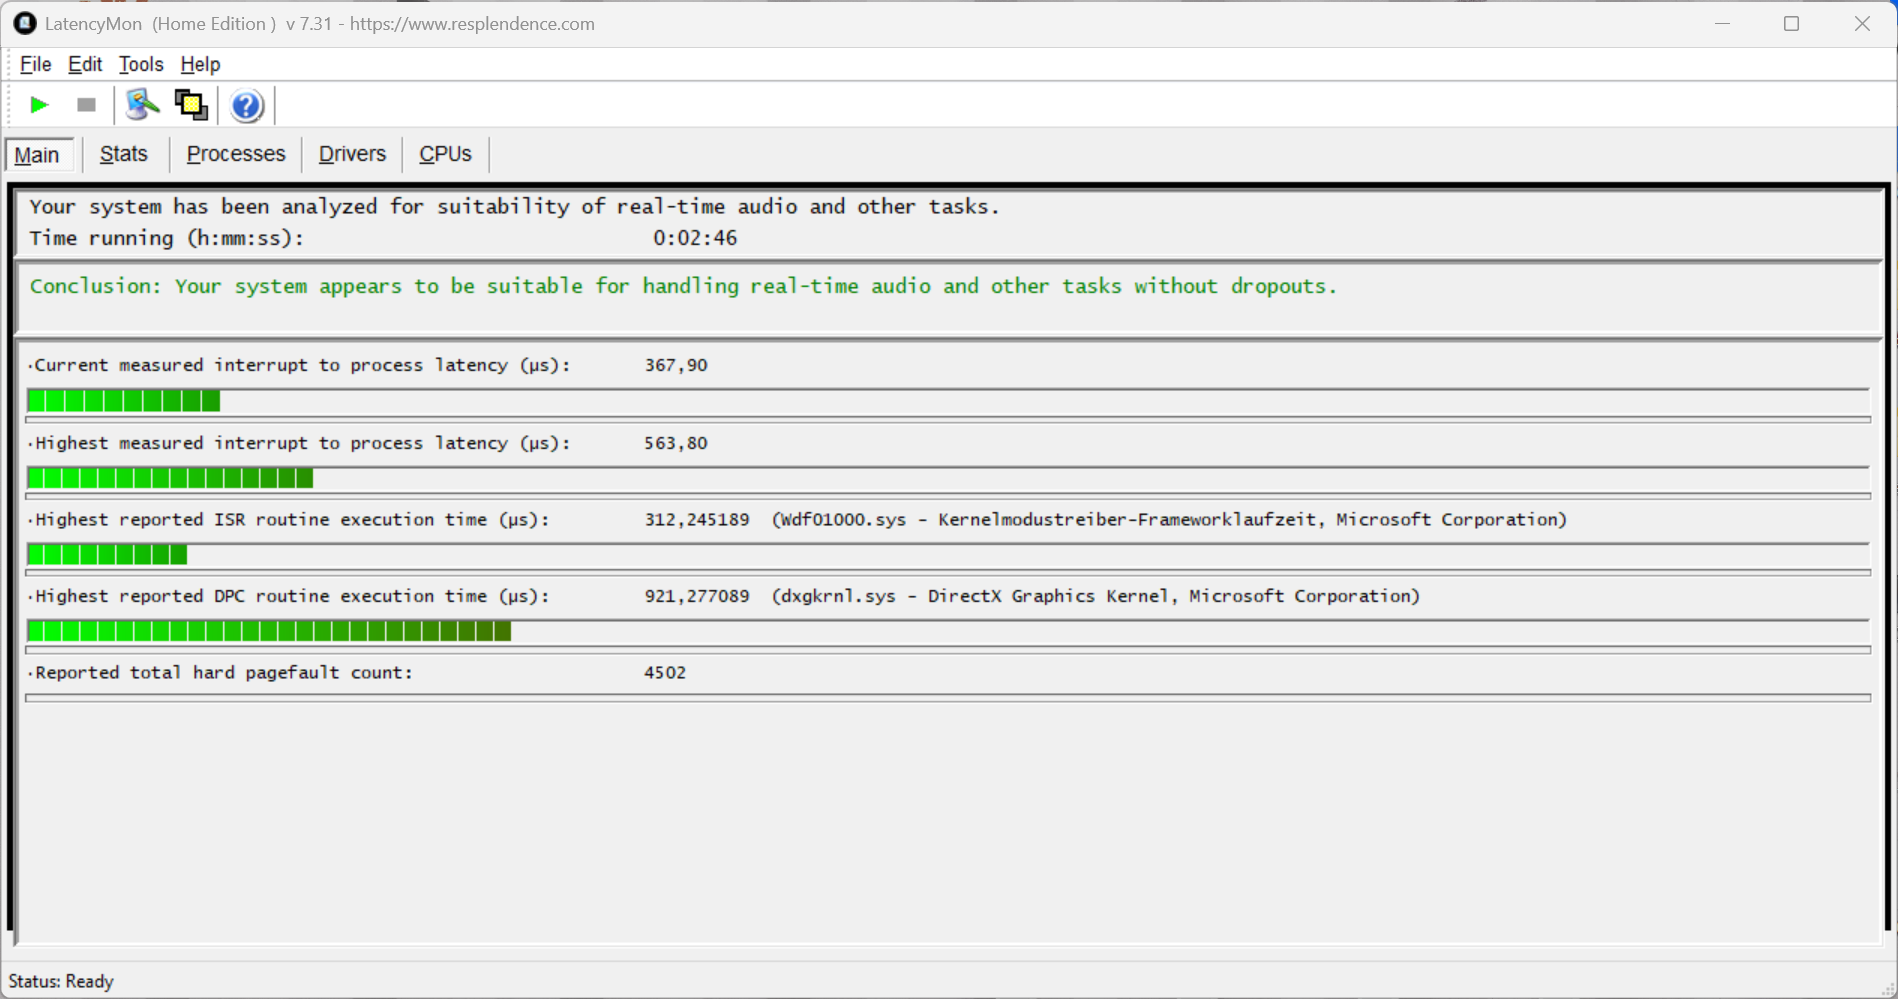
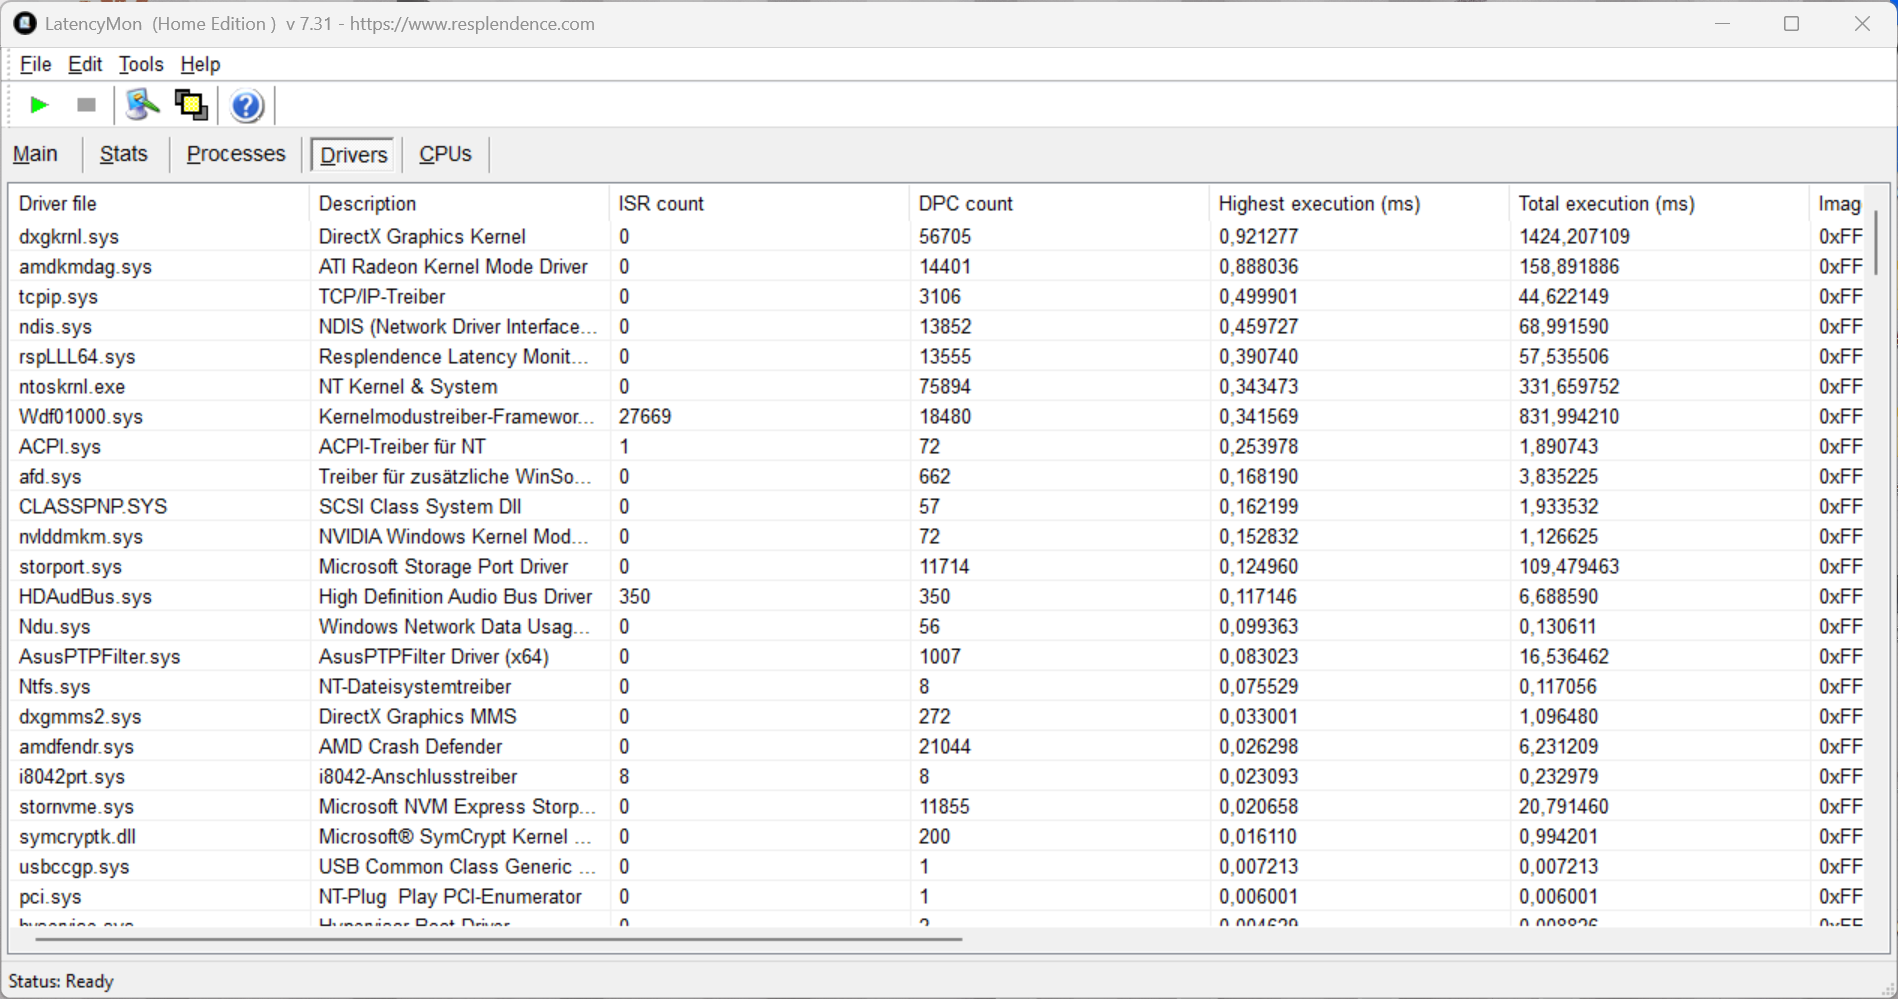
DPC 延迟
在我们的标准延迟测试(包括上网、4K YouTube 播放和 CPU 负载)中,使用当前 BIOS 版本的 TUF Gaming A16 在使用实时音频应用程序时没有出现重大延迟问题。
| DPC Latencies / LatencyMon - interrupt to process latency (max), Web, Youtube, Prime95 | |
| Gigabyte Gaming A16 GA6H | |
| Gigabyte Aero X16 1WH | |
| Alienware 16X Aurora, RTX 5070 | |
| Schenker XMG Pro 16 (E25) | |
| Asus TUF Gaming A16 FA608WV | |
| Asus TUF Gaming A16 FA608UP | |
* ... smaller is better
存储设备
TUF A16 为固态硬盘提供了两个 M.2-2280 插槽(PCIe 4.0),我们的测试设备配备了 1 TB 版本的 WD PC SN5000S,可用容量为 859 GB。
性能还算不错,但在持续负载的情况下,硬盘并不能保持完全稳定。尽管如此,顺序值仍然超过 4 GB/s,因此对日常游戏的影响可以忽略不计。
更多固态硬盘基准测试 这里.

* ... smaller is better
磁盘节流:DiskSpd 读取循环,队列深度 8
图形处理器性能
华硕使用 GeForce RTX 5070 笔记本电脑TUF Gaming A16 中使用了高级 Optimus,最大 TGP 为 115 W,即最快的变体。该 GPU 在合成测试中的表现非常出色,是我们目前测试过的速度最快的 RTX 5070 GPU 之一。
不过,相对较弱的 Zen 4 处理器在某些游戏中表现明显,特别是与快速的 HX 系列 CPU 相比。此外,有限的 8 GB VRAM 仍是一个弱点,尤其是当你想以 QHD 分辨率玩游戏时。
不过,原则上,RTX 5070 笔记本电脑的性能也足以满足高细节的需求,当然,根据游戏的不同,还可以进行升频和帧生成。
| 3DMark 11 Performance | 37035 points | |
| 3DMark Fire Strike Score | 31388 points | |
| 3DMark Time Spy Score | 13950 points | |
| 3DMark Steel Nomad Score | 2952 points | |
| 3DMark Steel Nomad Light Score | 14954 points | |
Help | ||
| Blender / v3.3 Classroom OPTIX/RTX | |
| Asus TUF Gaming A16 FA608WV | |
| Gigabyte Gaming A16 GA6H | |
| Gigabyte Aero X16 1WH | |
| Asus TUF Gaming A16 FA608UP | |
| Average NVIDIA GeForce RTX 5070 Laptop (17 - 24, n=27) | |
| Average of class Gaming (9 - 32, n=109, last 2 years) | |
| Alienware 16X Aurora, RTX 5070 | |
| Schenker XMG Pro 16 (E25) | |
| Blender / v3.3 Classroom CUDA | |
| Asus TUF Gaming A16 FA608WV | |
| Average NVIDIA GeForce RTX 5070 Laptop (29 - 228, n=28) | |
| Gigabyte Aero X16 1WH | |
| Gigabyte Gaming A16 GA6H | |
| Asus TUF Gaming A16 FA608UP | |
| Average of class Gaming (15 - 228, n=109, last 2 years) | |
| Alienware 16X Aurora, RTX 5070 | |
| Schenker XMG Pro 16 (E25) | |
| Blender / v3.3 Classroom CPU | |
| Gigabyte Gaming A16 GA6H | |
| Gigabyte Aero X16 1WH | |
| Asus TUF Gaming A16 FA608UP | |
| Average NVIDIA GeForce RTX 5070 Laptop (137 - 507, n=25) | |
| Average of class Gaming (122 - 565, n=105, last 2 years) | |
| Asus TUF Gaming A16 FA608WV | |
| Alienware 16X Aurora, RTX 5070 | |
| Schenker XMG Pro 16 (E25) | |
* ... smaller is better
| Cyberpunk 2077 - 1920x1080 Ultra Preset (FSR off) | |
| Schenker XMG Pro 16 (E25) | |
| Asus TUF Gaming A16 FA608UP | |
| Average of class Gaming (17.7 - 169.9, n=118, last 2 years) | |
| Alienware 16X Aurora, RTX 5070 | |
| Gigabyte Aero X16 1WH | |
| Gigabyte Gaming A16 GA6H | |
| Asus TUF Gaming A16 FA608WV | |
| Final Fantasy XV Benchmark - 1920x1080 High Quality | |
| Alienware 16X Aurora, RTX 5070 | |
| Schenker XMG Pro 16 (E25) | |
| Average of class Gaming (41 - 215, n=101, last 2 years) | |
| Asus TUF Gaming A16 FA608UP | |
| Gigabyte Aero X16 1WH | |
| Asus TUF Gaming A16 FA608WV | |
| Gigabyte Gaming A16 GA6H | |
| Strange Brigade - 1920x1080 ultra AA:ultra AF:16 | |
| Average of class Gaming (76.3 - 456, n=91, last 2 years) | |
| Alienware 16X Aurora, RTX 5070 | |
| Gigabyte Aero X16 1WH | |
| Asus TUF Gaming A16 FA608UP | |
| Gigabyte Gaming A16 GA6H | |
| Asus TUF Gaming A16 FA608WV | |
| Schenker XMG Pro 16 (E25) | |
| Dota 2 Reborn - 1920x1080 ultra (3/3) best looking | |
| Alienware 16X Aurora, RTX 5070 | |
| Schenker XMG Pro 16 (E25) | |
| Average of class Gaming (84.8 - 248, n=110, last 2 years) | |
| Gigabyte Gaming A16 GA6H | |
| Asus TUF Gaming A16 FA608WV | |
| Gigabyte Aero X16 1WH | |
| Asus TUF Gaming A16 FA608UP | |
赛博朋克 2077》1080p 超高帧频图
| low | med. | high | ultra | QHD DLSS | QHD | |
|---|---|---|---|---|---|---|
| GTA V (2015) | 124.8 | 113.9 | ||||
| Dota 2 Reborn (2015) | 148.8 | 140.9 | 129.3 | 123.2 | ||
| Final Fantasy XV Benchmark (2018) | 216 | 187.8 | 142.3 | 107.4 | ||
| X-Plane 11.11 (2018) | 108.2 | 97.9 | 80.7 | |||
| Strange Brigade (2018) | 260 | 253 | 241 | 219 | 175.3 | |
| Baldur's Gate 3 (2023) | 181.7 | 152.9 | 134.5 | 127.5 | 89 | |
| Cyberpunk 2077 (2023) | 148.7 | 142.6 | 121.2 | 109.4 | 81 | 68.2 |
| F1 24 (2024) | 234 | 88.8 | 85.4 | 56.9 |
排放与能源:表面温度低,电池寿命长
噪音排放
两个风扇的音量在很大程度上取决于所选择的能量曲线。在 "涡轮增压 "模式下,即使在空转时,双风扇的转速也始终保持在 32 dB(A) 左右。
如果你不需要全部性能,就一定要使用其中一个较弱的配置文件。涡轮模式的噪音也非常大,游戏时约为 54 dB(A),压力测试时为 57 dB(A)。
总体而言,性能模式的最大声压级(SPL)为 46.7 dB(A),似乎更令人愉悦。测试设备上没有其他电子噪音。
Noise level
| Idle |
| 32.2 / 32.2 / 32.2 dB(A) |
| Load |
| 38.1 / 57.1 dB(A) |
 | ||
30 dB silent 40 dB(A) audible 50 dB(A) loud |
||
min: | ||
| Asus TUF Gaming A16 FA608UP R7 260, GeForce RTX 5070 Laptop | Alienware 16X Aurora, RTX 5070 Ultra 9 275HX, GeForce RTX 5070 Laptop | Gigabyte Gaming A16 GA6H i7-13620H, GeForce RTX 5070 Laptop | Asus TUF Gaming A16 FA608WV Ryzen AI 9 HX 370, GeForce RTX 4060 Laptop GPU | Gigabyte Aero X16 1WH Ryzen AI 7 350, GeForce RTX 5070 Laptop | Schenker XMG Pro 16 (E25) Ultra 9 275HX, GeForce RTX 5070 Ti Laptop | |
|---|---|---|---|---|---|---|
| Noise | 16% | 3% | 23% | 16% | 9% | |
| off / environment * (dB) | 25.1 | 23.7 6% | 24 4% | 23 8% | 23.9 5% | 23.3 7% |
| Idle Minimum * (dB) | 32.2 | 23.9 26% | 25 22% | 23 29% | 23.9 26% | 25 22% |
| Idle Average * (dB) | 32.2 | 23.9 26% | 26 19% | 23 29% | 23.9 26% | 25 22% |
| Idle Maximum * (dB) | 32.2 | 26.1 19% | 27 16% | 29.11 10% | 23.9 26% | 25 22% |
| Load Average * (dB) | 38.1 | 26.8 30% | 54 -42% | 31 19% | 33.2 13% | 45.5 -19% |
| Cyberpunk 2077 ultra * (dB) | 53.9 | 51.8 4% | 54 -0% | 36.23 33% | 50.2 7% | 53.3 1% |
| Load Maximum * (dB) | 57.1 | 58 -2% | 55 4% | 39.44 31% | 50.2 12% | 53.3 7% |
* ... smaller is better
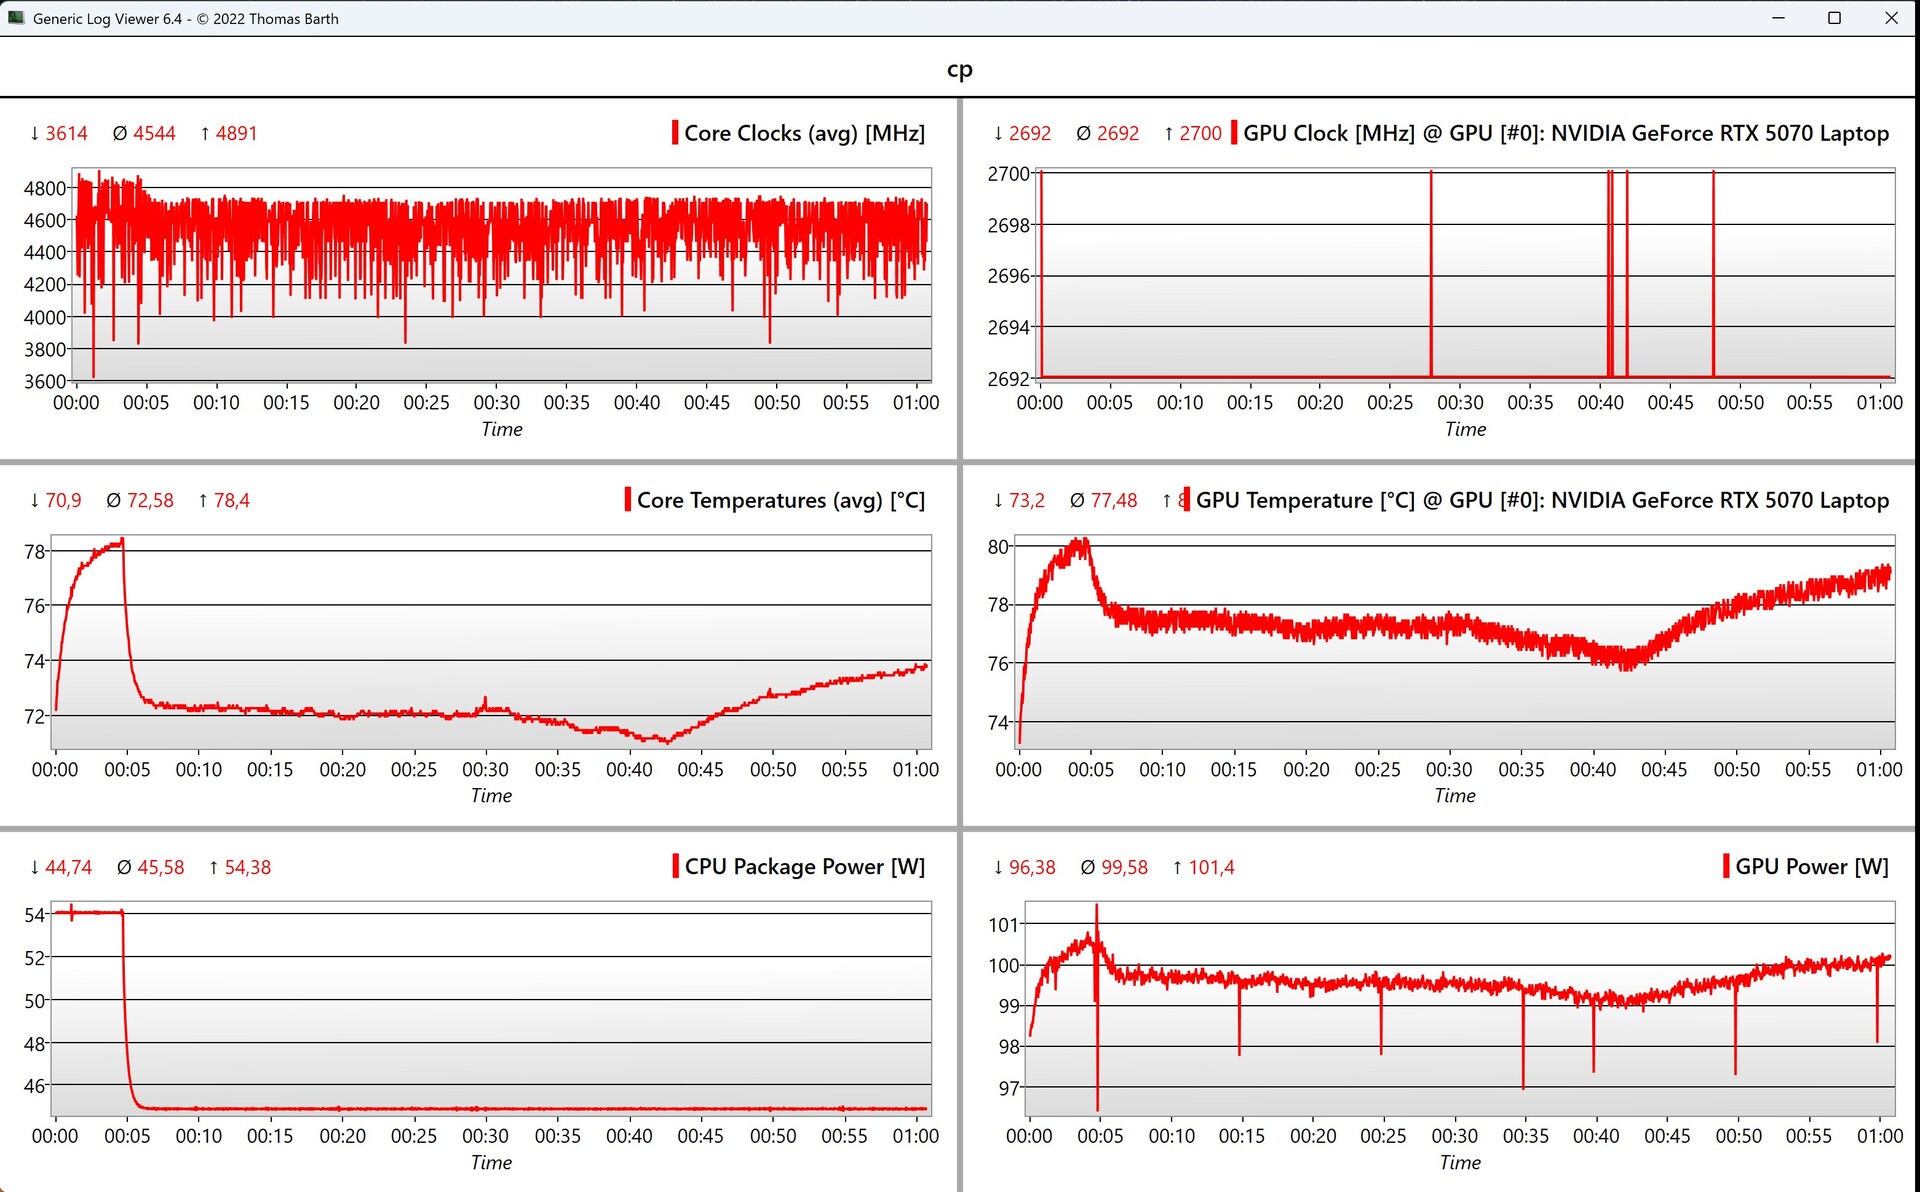
表面温度
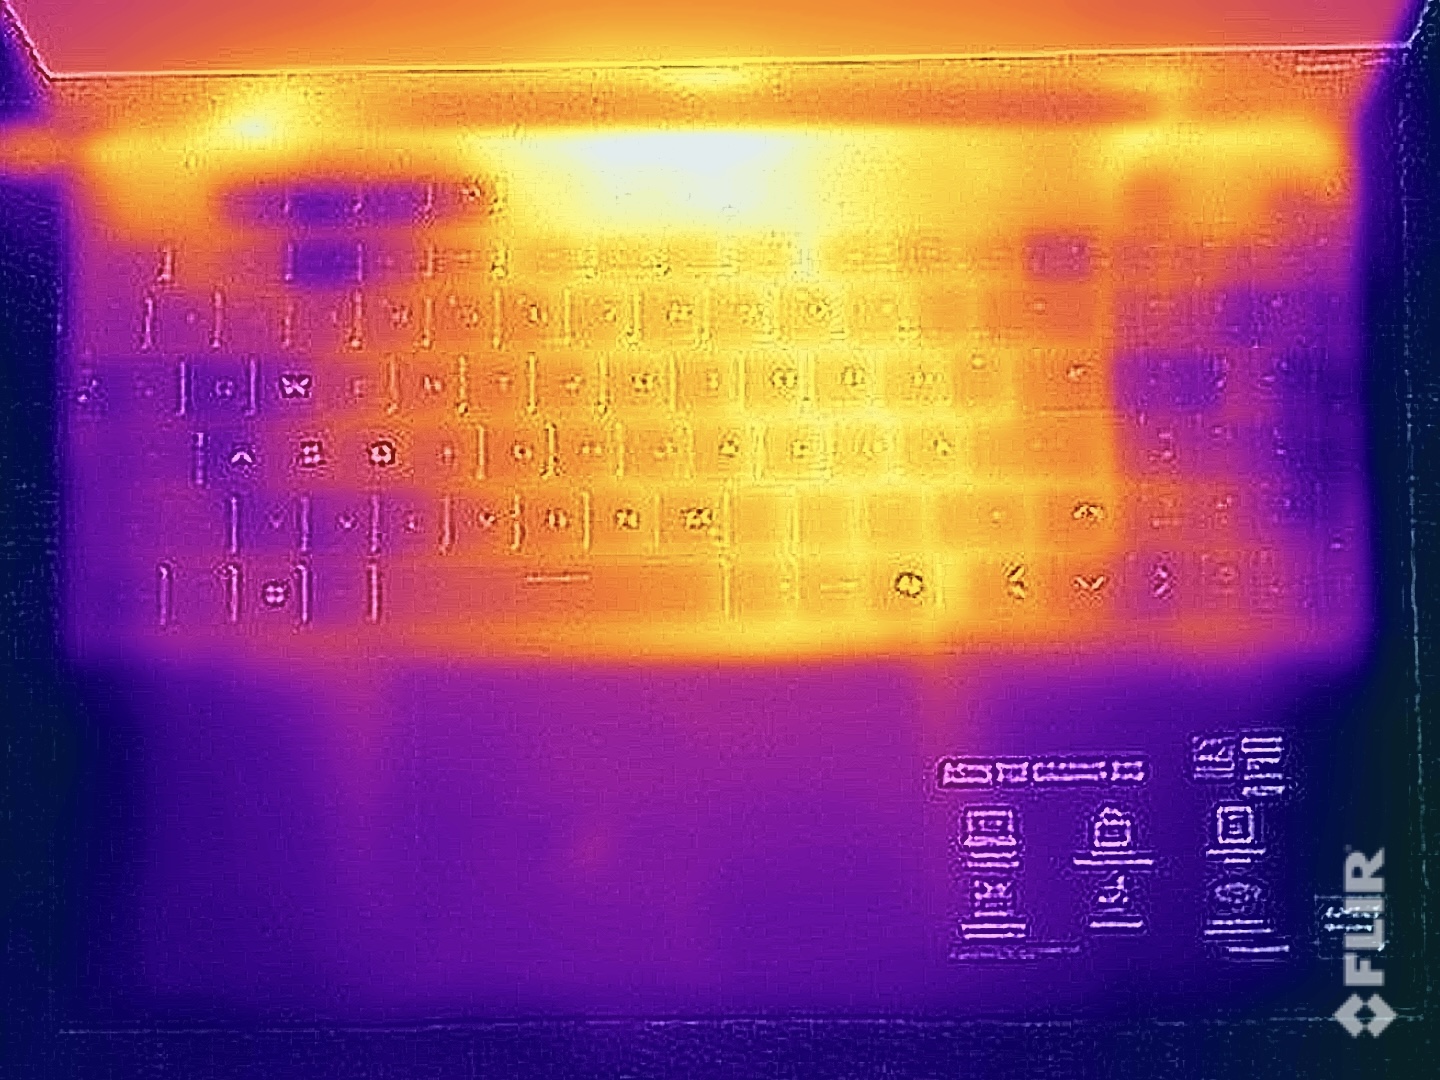
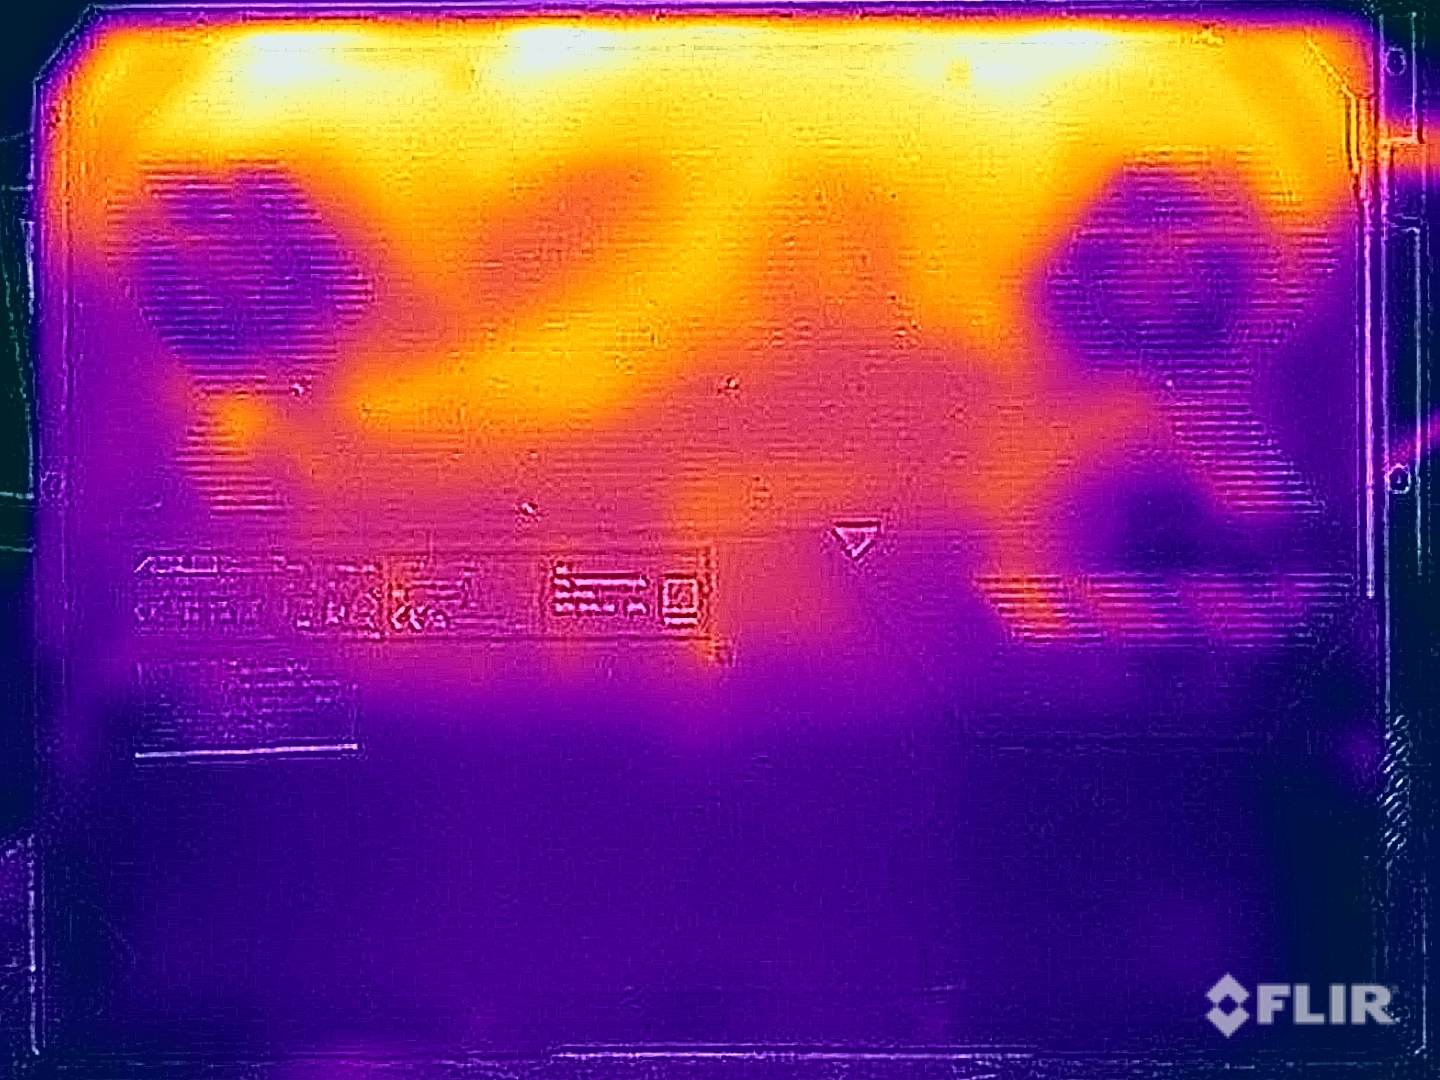
风扇声音大,表面温度低。即使在压力测试期间,也只有少数地方的温度略高于 40 °C,因此在使用过程中没有任何限制。
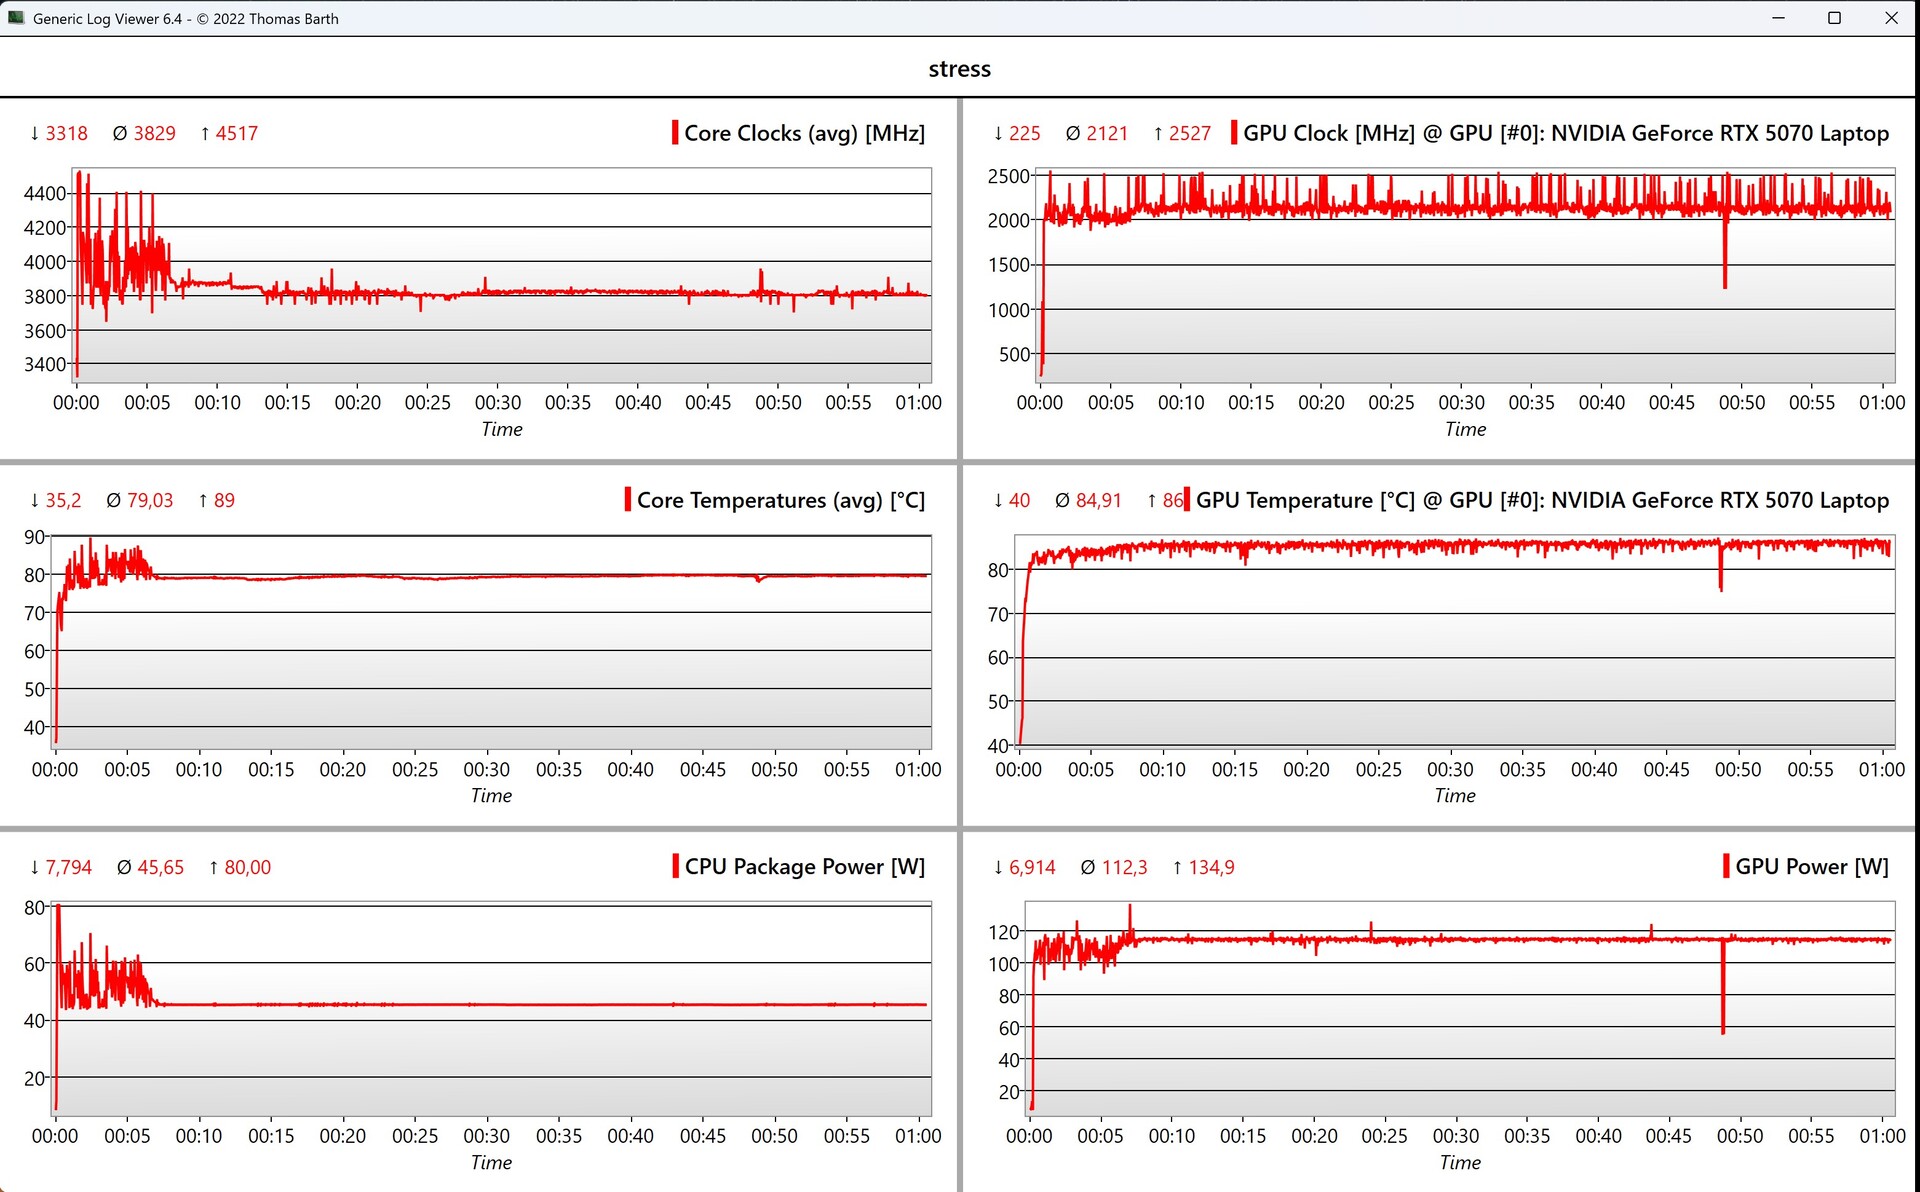
在压力测试期间,CPU 的功率稳定在 45 W(80 °C),GPU 的功率略低于 115 W(85 °C)。
(+) The maximum temperature on the upper side is 39.5 °C / 103 F, compared to the average of 40.4 °C / 105 F, ranging from 21.2 to 68.8 °C for the class Gaming.
(-) The bottom heats up to a maximum of 45.1 °C / 113 F, compared to the average of 43.2 °C / 110 F
(+) In idle usage, the average temperature for the upper side is 25 °C / 77 F, compared to the device average of 33.9 °C / 93 F.
(±) 3: The average temperature for the upper side is 32.7 °C / 91 F, compared to the average of 33.9 °C / 93 F for the class Gaming.
(+) The palmrests and touchpad are cooler than skin temperature with a maximum of 27.2 °C / 81 F and are therefore cool to the touch.
(±) The average temperature of the palmrest area of similar devices was 28.8 °C / 83.8 F (+1.6 °C / 2.8 F).
| Asus TUF Gaming A16 FA608UP AMD Ryzen 7 260, NVIDIA GeForce RTX 5070 Laptop | Alienware 16X Aurora, RTX 5070 Intel Core Ultra 9 275HX, NVIDIA GeForce RTX 5070 Laptop | Gigabyte Gaming A16 GA6H Intel Core i7-13620H, NVIDIA GeForce RTX 5070 Laptop | Asus TUF Gaming A16 FA608WV AMD Ryzen AI 9 HX 370, NVIDIA GeForce RTX 4060 Laptop GPU | Gigabyte Aero X16 1WH AMD Ryzen AI 7 350, NVIDIA GeForce RTX 5070 Laptop | Schenker XMG Pro 16 (E25) Intel Core Ultra 9 275HX, NVIDIA GeForce RTX 5070 Ti Laptop | |
|---|---|---|---|---|---|---|
| Heat | -13% | -26% | -1% | -10% | -239% | |
| Maximum Upper Side * (°C) | 39.5 | 51 -29% | 50 -27% | 38 4% | 43.3 -10% | 43.2 -9% |
| Maximum Bottom * (°C) | 45.1 | 45.6 -1% | 49 -9% | 37 18% | 50.3 -12% | 46 -2% |
| Idle Upper Side * (°C) | 25.7 | 29.8 -16% | 35 -36% | 28 -9% | 27 -5% | 27.7 -8% |
| Idle Bottom * (°C) | 25.5 | 27.4 -7% | 34 -33% | 30 -18% | 28.3 -11% | 264 -935% |
* ... smaller is better
扬声器
两个立体声扬声器整体表现不错,但在游戏时无法盖过响亮的风扇。
Asus TUF Gaming A16 FA608UP audio analysis
(±) | speaker loudness is average but good (80.2 dB)
Bass 100 - 315 Hz
(±) | reduced bass - on average 11.8% lower than median
(±) | linearity of bass is average (8.7% delta to prev. frequency)
Mids 400 - 2000 Hz
(+) | balanced mids - only 3% away from median
(+) | mids are linear (3% delta to prev. frequency)
Highs 2 - 16 kHz
(+) | balanced highs - only 4.4% away from median
(±) | linearity of highs is average (7.4% delta to prev. frequency)
Overall 100 - 16.000 Hz
(+) | overall sound is linear (12.6% difference to median)
Compared to same class
» 16% of all tested devices in this class were better, 3% similar, 81% worse
» The best had a delta of 6%, average was 18%, worst was 132%
Compared to all devices tested
» 11% of all tested devices were better, 2% similar, 86% worse
» The best had a delta of 4%, average was 24%, worst was 134%
Alienware 16X Aurora, RTX 5070 audio analysis
(+) | speakers can play relatively loud (82.1 dB)
Bass 100 - 315 Hz
(-) | nearly no bass - on average 21.6% lower than median
(±) | linearity of bass is average (12.9% delta to prev. frequency)
Mids 400 - 2000 Hz
(+) | balanced mids - only 2.3% away from median
(+) | mids are linear (4% delta to prev. frequency)
Highs 2 - 16 kHz
(+) | balanced highs - only 1.3% away from median
(+) | highs are linear (3.7% delta to prev. frequency)
Overall 100 - 16.000 Hz
(+) | overall sound is linear (14.5% difference to median)
Compared to same class
» 27% of all tested devices in this class were better, 7% similar, 66% worse
» The best had a delta of 6%, average was 18%, worst was 132%
Compared to all devices tested
» 18% of all tested devices were better, 4% similar, 78% worse
» The best had a delta of 4%, average was 24%, worst was 134%
Gigabyte Gaming A16 GA6H audio analysis
(±) | speaker loudness is average but good (81 dB)
Bass 100 - 315 Hz
(±) | reduced bass - on average 13.3% lower than median
(±) | linearity of bass is average (12.1% delta to prev. frequency)
Mids 400 - 2000 Hz
(+) | balanced mids - only 4.9% away from median
(+) | mids are linear (5.2% delta to prev. frequency)
Highs 2 - 16 kHz
(+) | balanced highs - only 2.2% away from median
(+) | highs are linear (6.4% delta to prev. frequency)
Overall 100 - 16.000 Hz
(+) | overall sound is linear (13.3% difference to median)
Compared to same class
» 19% of all tested devices in this class were better, 5% similar, 76% worse
» The best had a delta of 6%, average was 18%, worst was 132%
Compared to all devices tested
» 14% of all tested devices were better, 3% similar, 83% worse
» The best had a delta of 4%, average was 24%, worst was 134%
Gigabyte Aero X16 1WH audio analysis
(±) | speaker loudness is average but good (76 dB)
Bass 100 - 315 Hz
(-) | nearly no bass - on average 15.4% lower than median
(±) | linearity of bass is average (13.1% delta to prev. frequency)
Mids 400 - 2000 Hz
(+) | balanced mids - only 3.3% away from median
(+) | mids are linear (5.5% delta to prev. frequency)
Highs 2 - 16 kHz
(+) | balanced highs - only 2.8% away from median
(+) | highs are linear (5.7% delta to prev. frequency)
Overall 100 - 16.000 Hz
(±) | linearity of overall sound is average (15.5% difference to median)
Compared to same class
» 35% of all tested devices in this class were better, 7% similar, 58% worse
» The best had a delta of 6%, average was 18%, worst was 132%
Compared to all devices tested
» 23% of all tested devices were better, 4% similar, 73% worse
» The best had a delta of 4%, average was 24%, worst was 134%
Schenker XMG Pro 16 (E25) audio analysis
(±) | speaker loudness is average but good (79.2 dB)
Bass 100 - 315 Hz
(±) | reduced bass - on average 14.2% lower than median
(±) | linearity of bass is average (10.6% delta to prev. frequency)
Mids 400 - 2000 Hz
(±) | higher mids - on average 8.2% higher than median
(±) | linearity of mids is average (9.9% delta to prev. frequency)
Highs 2 - 16 kHz
(+) | balanced highs - only 3.8% away from median
(+) | highs are linear (5.9% delta to prev. frequency)
Overall 100 - 16.000 Hz
(±) | linearity of overall sound is average (18.5% difference to median)
Compared to same class
» 60% of all tested devices in this class were better, 8% similar, 32% worse
» The best had a delta of 6%, average was 18%, worst was 132%
Compared to all devices tested
» 41% of all tested devices were better, 8% similar, 51% worse
» The best had a delta of 4%, average was 24%, worst was 134%
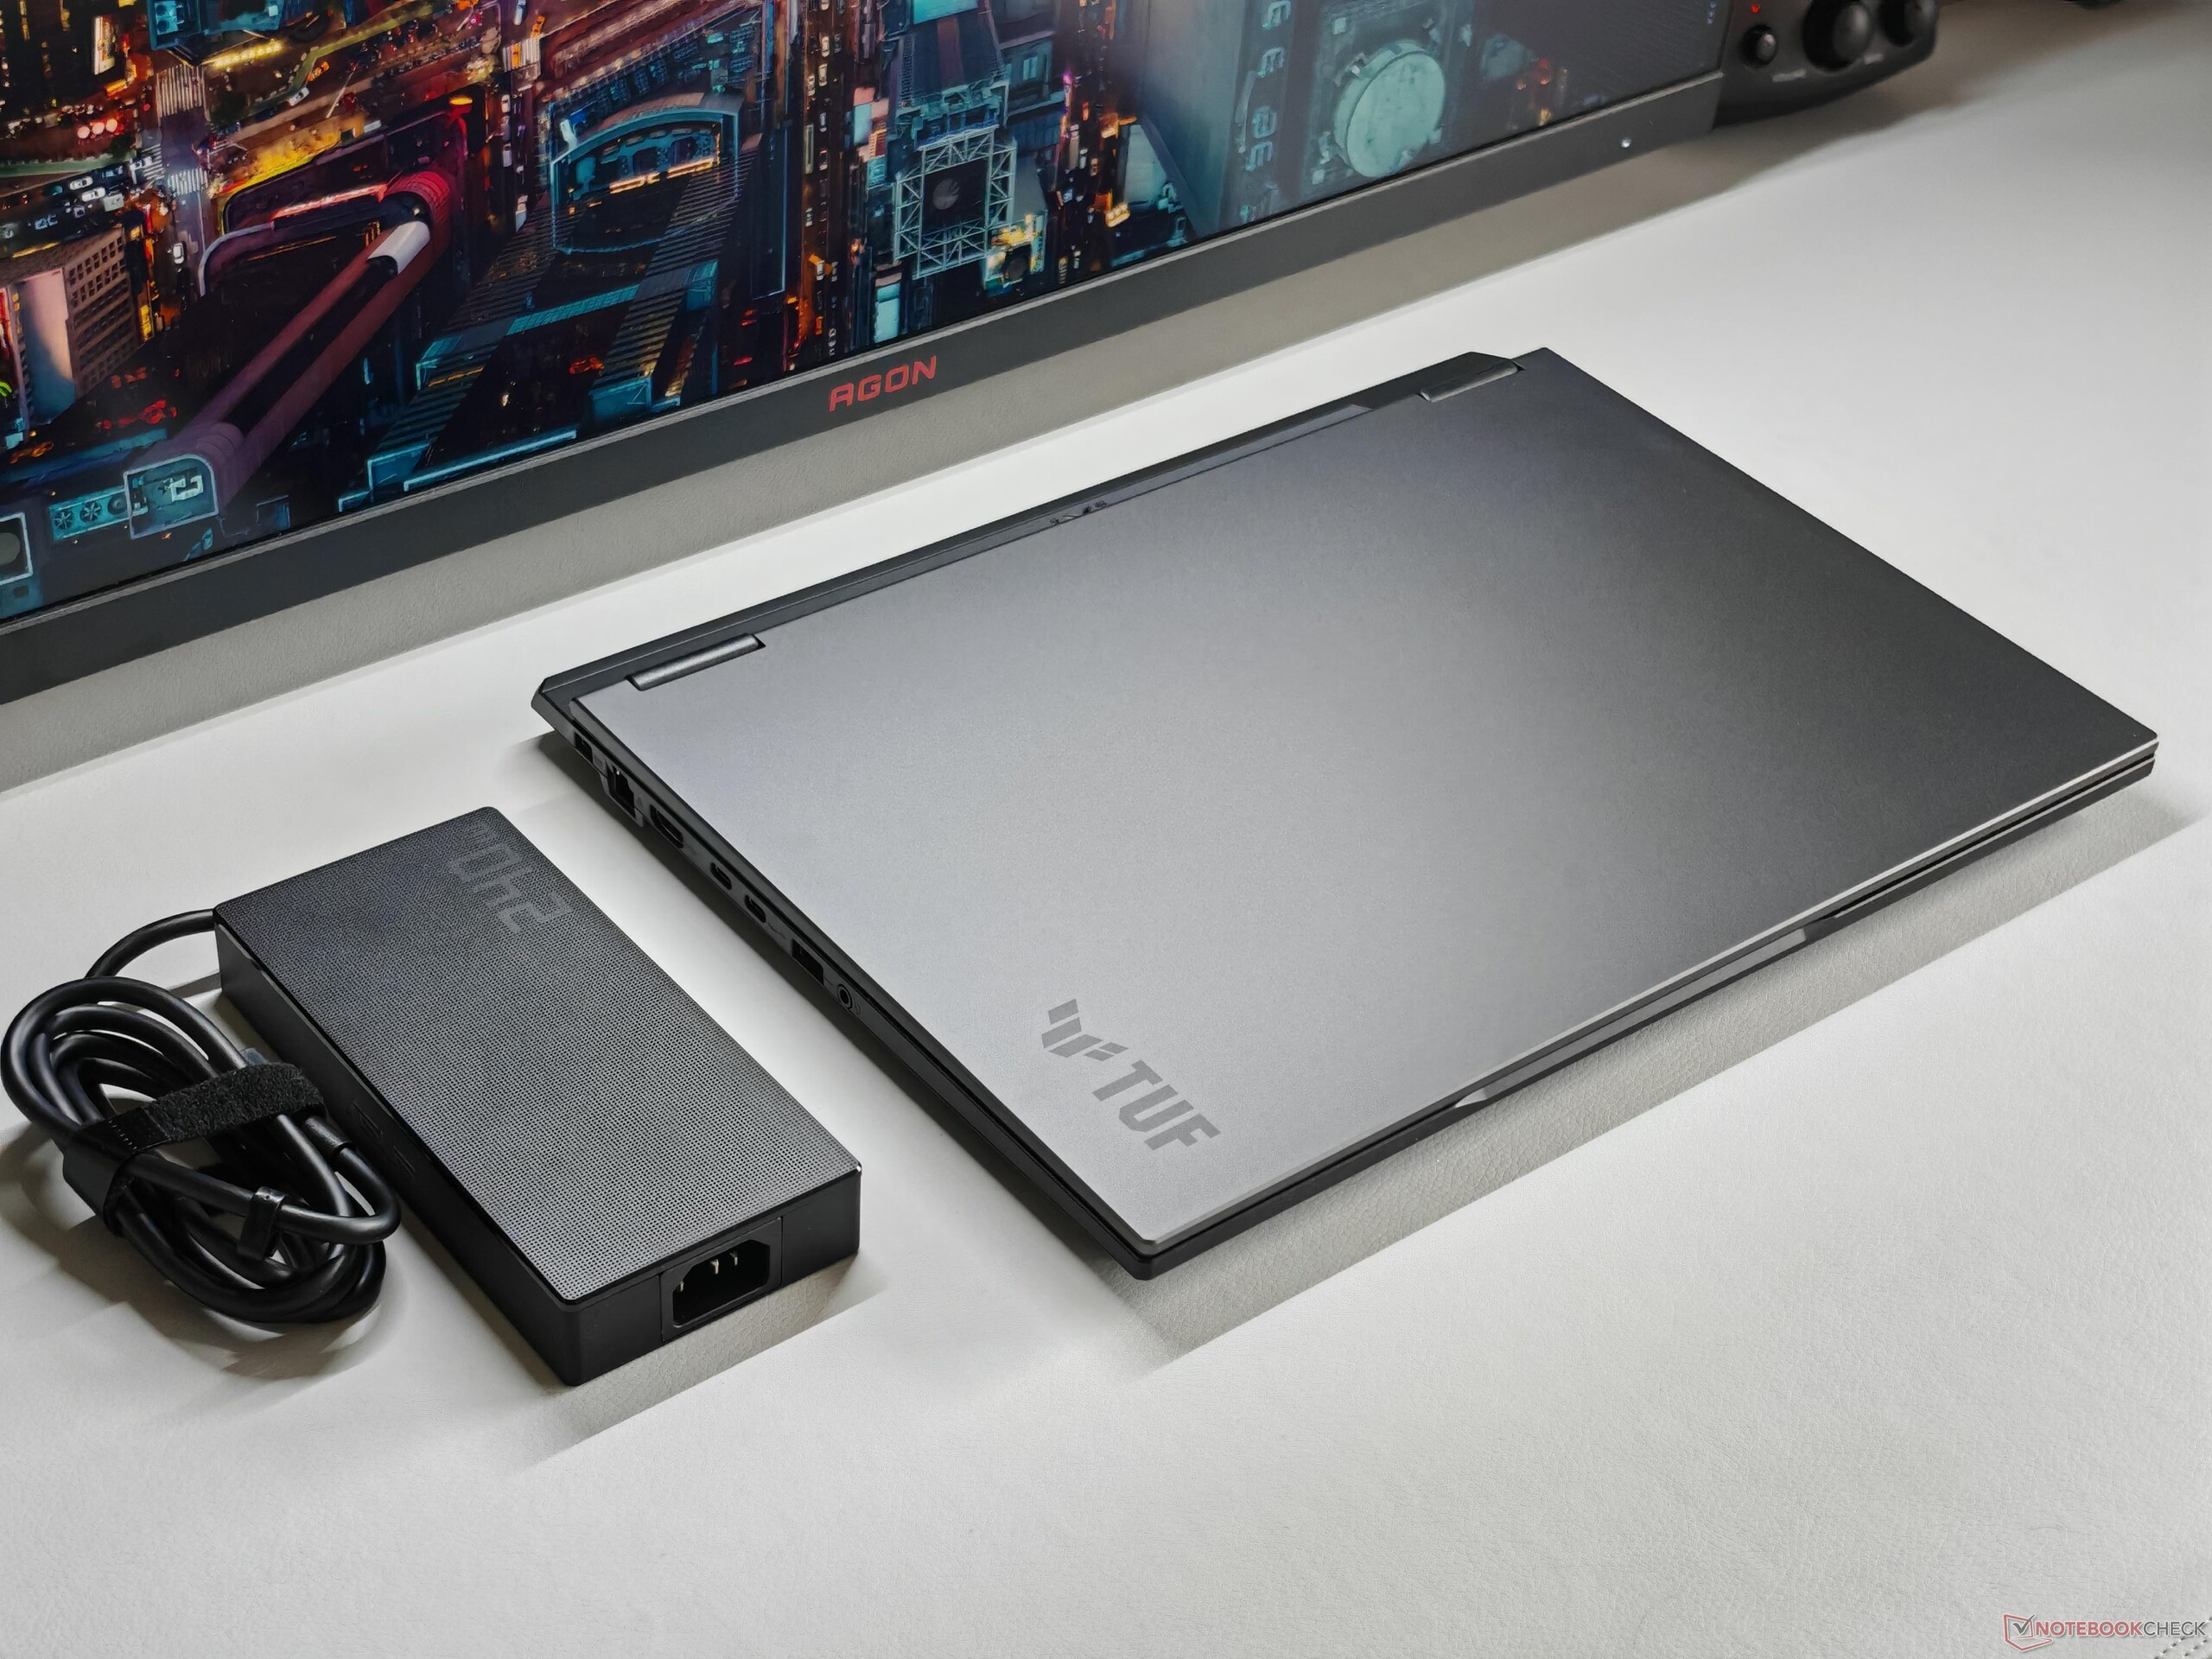
能源消耗
TUF Gaming A16 闲置时的功耗为 10 W,相当经济;游戏时的功耗预计在 200 W 左右。
在压力测试中,我们一开始测得的功耗高达 235 W,但很快就降到了 210 W 左右。
因此,附带的 240 W 电源足以在压力下为笔记本供电。
| Off / Standby | |
| Idle | |
| Load |
|
Key:
min: | |
| Asus TUF Gaming A16 FA608UP GeForce RTX 5070 Laptop, R7 260, Western Digital PC SN5000S SDEQNSJ-1T00 | Alienware 16X Aurora, RTX 5070 GeForce RTX 5070 Laptop, Ultra 9 275HX | Gigabyte Gaming A16 GA6H GeForce RTX 5070 Laptop, i7-13620H, Kingston OM8PGP41024Q-A0 | Asus TUF Gaming A16 FA608WV GeForce RTX 4060 Laptop GPU, Ryzen AI 9 HX 370, Micron 2400 MTFDKBA1T0QFM | Gigabyte Aero X16 1WH GeForce RTX 5070 Laptop, Ryzen AI 7 350, Kingston OM8PGP41024Q-A0 | Schenker XMG Pro 16 (E25) GeForce RTX 5070 Ti Laptop, Ultra 9 275HX, Samsung 9100 Pro 1 TB | |
|---|---|---|---|---|---|---|
| Power Consumption | -114% | -22% | -10% | 6% | -60% | |
| Idle Minimum * (Watt) | 4.6 | 20.1 -337% | 9 -96% | 6.8 -48% | 5.8 -26% | 11.7 -154% |
| Idle Average * (Watt) | 9.8 | 27.6 -182% | 11 -12% | 12.7 -30% | 10.9 -11% | 16.6 -69% |
| Idle Maximum * (Watt) | 10.2 | 31.8 -212% | 23 -125% | 15.2 -49% | 11.2 -10% | 17.1 -68% |
| Load Average * (Watt) | 76.1 | 102.7 -35% | 91 -20% | 85 -12% | 91.3 -20% | 122.4 -61% |
| Cyberpunk 2077 ultra external monitor * (Watt) | 198.1 | 192.3 3% | 130 34% | 143 28% | 117.9 40% | 241 -22% |
| Cyberpunk 2077 ultra * (Watt) | 198.9 | 217 -9% | 132.5 33% | 145 27% | 123.8 38% | 245 -23% |
| Load Maximum * (Watt) | 235.2 | 292 -24% | 155 34% | 199 15% | 155.3 34% | 291.5 -24% |
* ... smaller is better
耗电量:赛博朋克 2077 / 压力测试
耗电量:外部显示器
电池寿命
低功耗和 90 瓦时大容量电池的组合使电池的运行时间更长。
在亮度为 150 cd/m²(Windows 滑盖为 55%)和 60 Hz 刷新率的条件下,我们测得的运行时间略低于 13 小时,在全亮度条件下接近 9 小时。
| Asus TUF Gaming A16 FA608UP R7 260, GeForce RTX 5070 Laptop, 90 Wh | Alienware 16X Aurora, RTX 5070 Ultra 9 275HX, GeForce RTX 5070 Laptop, 96 Wh | Gigabyte Gaming A16 GA6H i7-13620H, GeForce RTX 5070 Laptop, 76 Wh | Asus TUF Gaming A16 FA608WV Ryzen AI 9 HX 370, GeForce RTX 4060 Laptop GPU, 90 Wh | Gigabyte Aero X16 1WH Ryzen AI 7 350, GeForce RTX 5070 Laptop, 76 Wh | Schenker XMG Pro 16 (E25) Ultra 9 275HX, GeForce RTX 5070 Ti Laptop, 99.8 Wh | Average of class Gaming | |
|---|---|---|---|---|---|---|---|
| Battery Runtime | -67% | -41% | 9% | -31% | -30% | -43% | |
| WiFi Websurfing (h) | 13 | 4.3 -67% | 7.7 -41% | 14.2 9% | 8.6 -34% | 9.1 -30% | 7.04 ? -46% |
| WiFi Websurfing max. Brightness (h) | 8.9 | 6.5 -27% | 6.2 -30% | 5.45 ? -39% |
Notebookcheck 对华硕 TUF Gaming A16 的总体印象
华硕 TUF Gaming A16 配备了 115 瓦 RTX 5070 笔记本图形处理器,可实现快速 QHD 超高清游戏,并提供良好的电池运行时间。不过,考虑到高昂的售价,这款笔记本电脑肯定会采用更先进的 AMD APU。
Asus TUF Gaming A16 FA608UP
- 09/23/2025 v8
Andreas Osthoff
 Total Sustainability Score:
 潜在竞争对手比较
Image | Model / Review | Price | Weight | Height | Display |
|---|---|---|---|---|---|
1. 83.8% 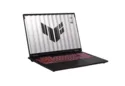 | Asus TUF Gaming A16 FA608UP AMD Ryzen 7 260 ⎘ NVIDIA GeForce RTX 5070 Laptop ⎘ 32 GB Memory, 1024 GB SSD | Amazon: List Price: 2199€ | 2.2 kg | 25.7 mm | 16.00" 2560x1600 189 PPI IPS |
2. 84.9%  | Alienware 16X Aurora, RTX 5070 Intel Core Ultra 9 275HX ⎘ NVIDIA GeForce RTX 5070 Laptop ⎘ 32 GB Memory | Amazon: List Price: 1800 USD | 2.5 kg | 23.4 mm | 16.00" 2560x1600 189 PPI IPS |
3. 80.1%  | Gigabyte Gaming A16 GA6H Intel Core i7-13620H ⎘ NVIDIA GeForce RTX 5070 Laptop ⎘ 16 GB Memory, 1024 GB SSD | Amazon: 1. $1,341.81 GIGABYTE - Gaming A16 Gaming... 2. $1,069.00 GIGABYTE - Gaming A16 Gaming... 3. $1,232.21 GIGABYTE - Gaming A16 Gaming... List Price: 1700 EUR | 2.3 kg | 23 mm | 16.00" 2560x1600 189 PPI IPS |
4. 83% 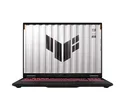 | Asus TUF Gaming A16 FA608WV AMD Ryzen AI 9 HX 370 ⎘ NVIDIA GeForce RTX 4060 Laptop GPU ⎘ 16 GB Memory, 1024 GB SSD | Amazon: List Price: 1399 Euro | 2.2 kg | 25.7 mm | 16.00" 1920x1200 142 PPI IPS |
5. 83.7%  | Gigabyte Aero X16 1WH AMD Ryzen AI 7 350 ⎘ NVIDIA GeForce RTX 5070 Laptop ⎘ 32 GB Memory, 1024 GB SSD | Amazon: List Price: 1799€ | 2 kg | 19.9 mm | 16.00" 2560x1600 189 PPI IPS |
6. 87.4%  | Schenker XMG Pro 16 (E25) Intel Core Ultra 9 275HX ⎘ NVIDIA GeForce RTX 5070 Ti Laptop ⎘ 32 GB Memory, 1024 GB SSD | Amazon: List Price: 2480€ | 2.5 kg | 26.5 mm | 16.00" 2560x1600 189 PPI IPS |
Transparency
The selection of devices to be reviewed is made by our editorial team. The test sample was provided to the author as a loan by the manufacturer or retailer for the purpose of this review. The lender had no influence on this review, nor did the manufacturer receive a copy of this review before publication. There was no obligation to publish this review. As an independent media company, Notebookcheck is not subjected to the authority of manufacturers, retailers or publishers.
This is how Notebookcheck is testing
Every year, Notebookcheck independently reviews hundreds of laptops and smartphones using standardized procedures to ensure that all results are comparable. We have continuously developed our test methods for around 20 years and set industry standards in the process. In our test labs, high-quality measuring equipment is utilized by experienced technicians and editors. These tests involve a multi-stage validation process. Our complex rating system is based on hundreds of well-founded measurements and benchmarks, which maintains objectivity. Further information on our test methods can be found here.
