判决
目前,Crosshair A17 HX 的售价约为 2000 欧元(约合人民币 2332 元),既不是一款便宜的 RTX 5070 笔记本,也不是一款特别昂贵的 RTX 5070 笔记本。虽然配备 8GB VRAM 的显卡只是部分令人信服,但这款 17 英寸机型在处理器方面的表现才是真正的王牌。Ryzen 9 8940HX 拥有高核心数,可以轻松与英特尔的 Arrow Lake 处理器相媲美。因此,尽管功耗和噪音并非没有缺点,但所选 CPU 几乎是 Crosshair A17 的亮点。微星尤其需要在风扇控制方面下功夫,因为即使在空闲模式下,风扇有时也会大幅转动。
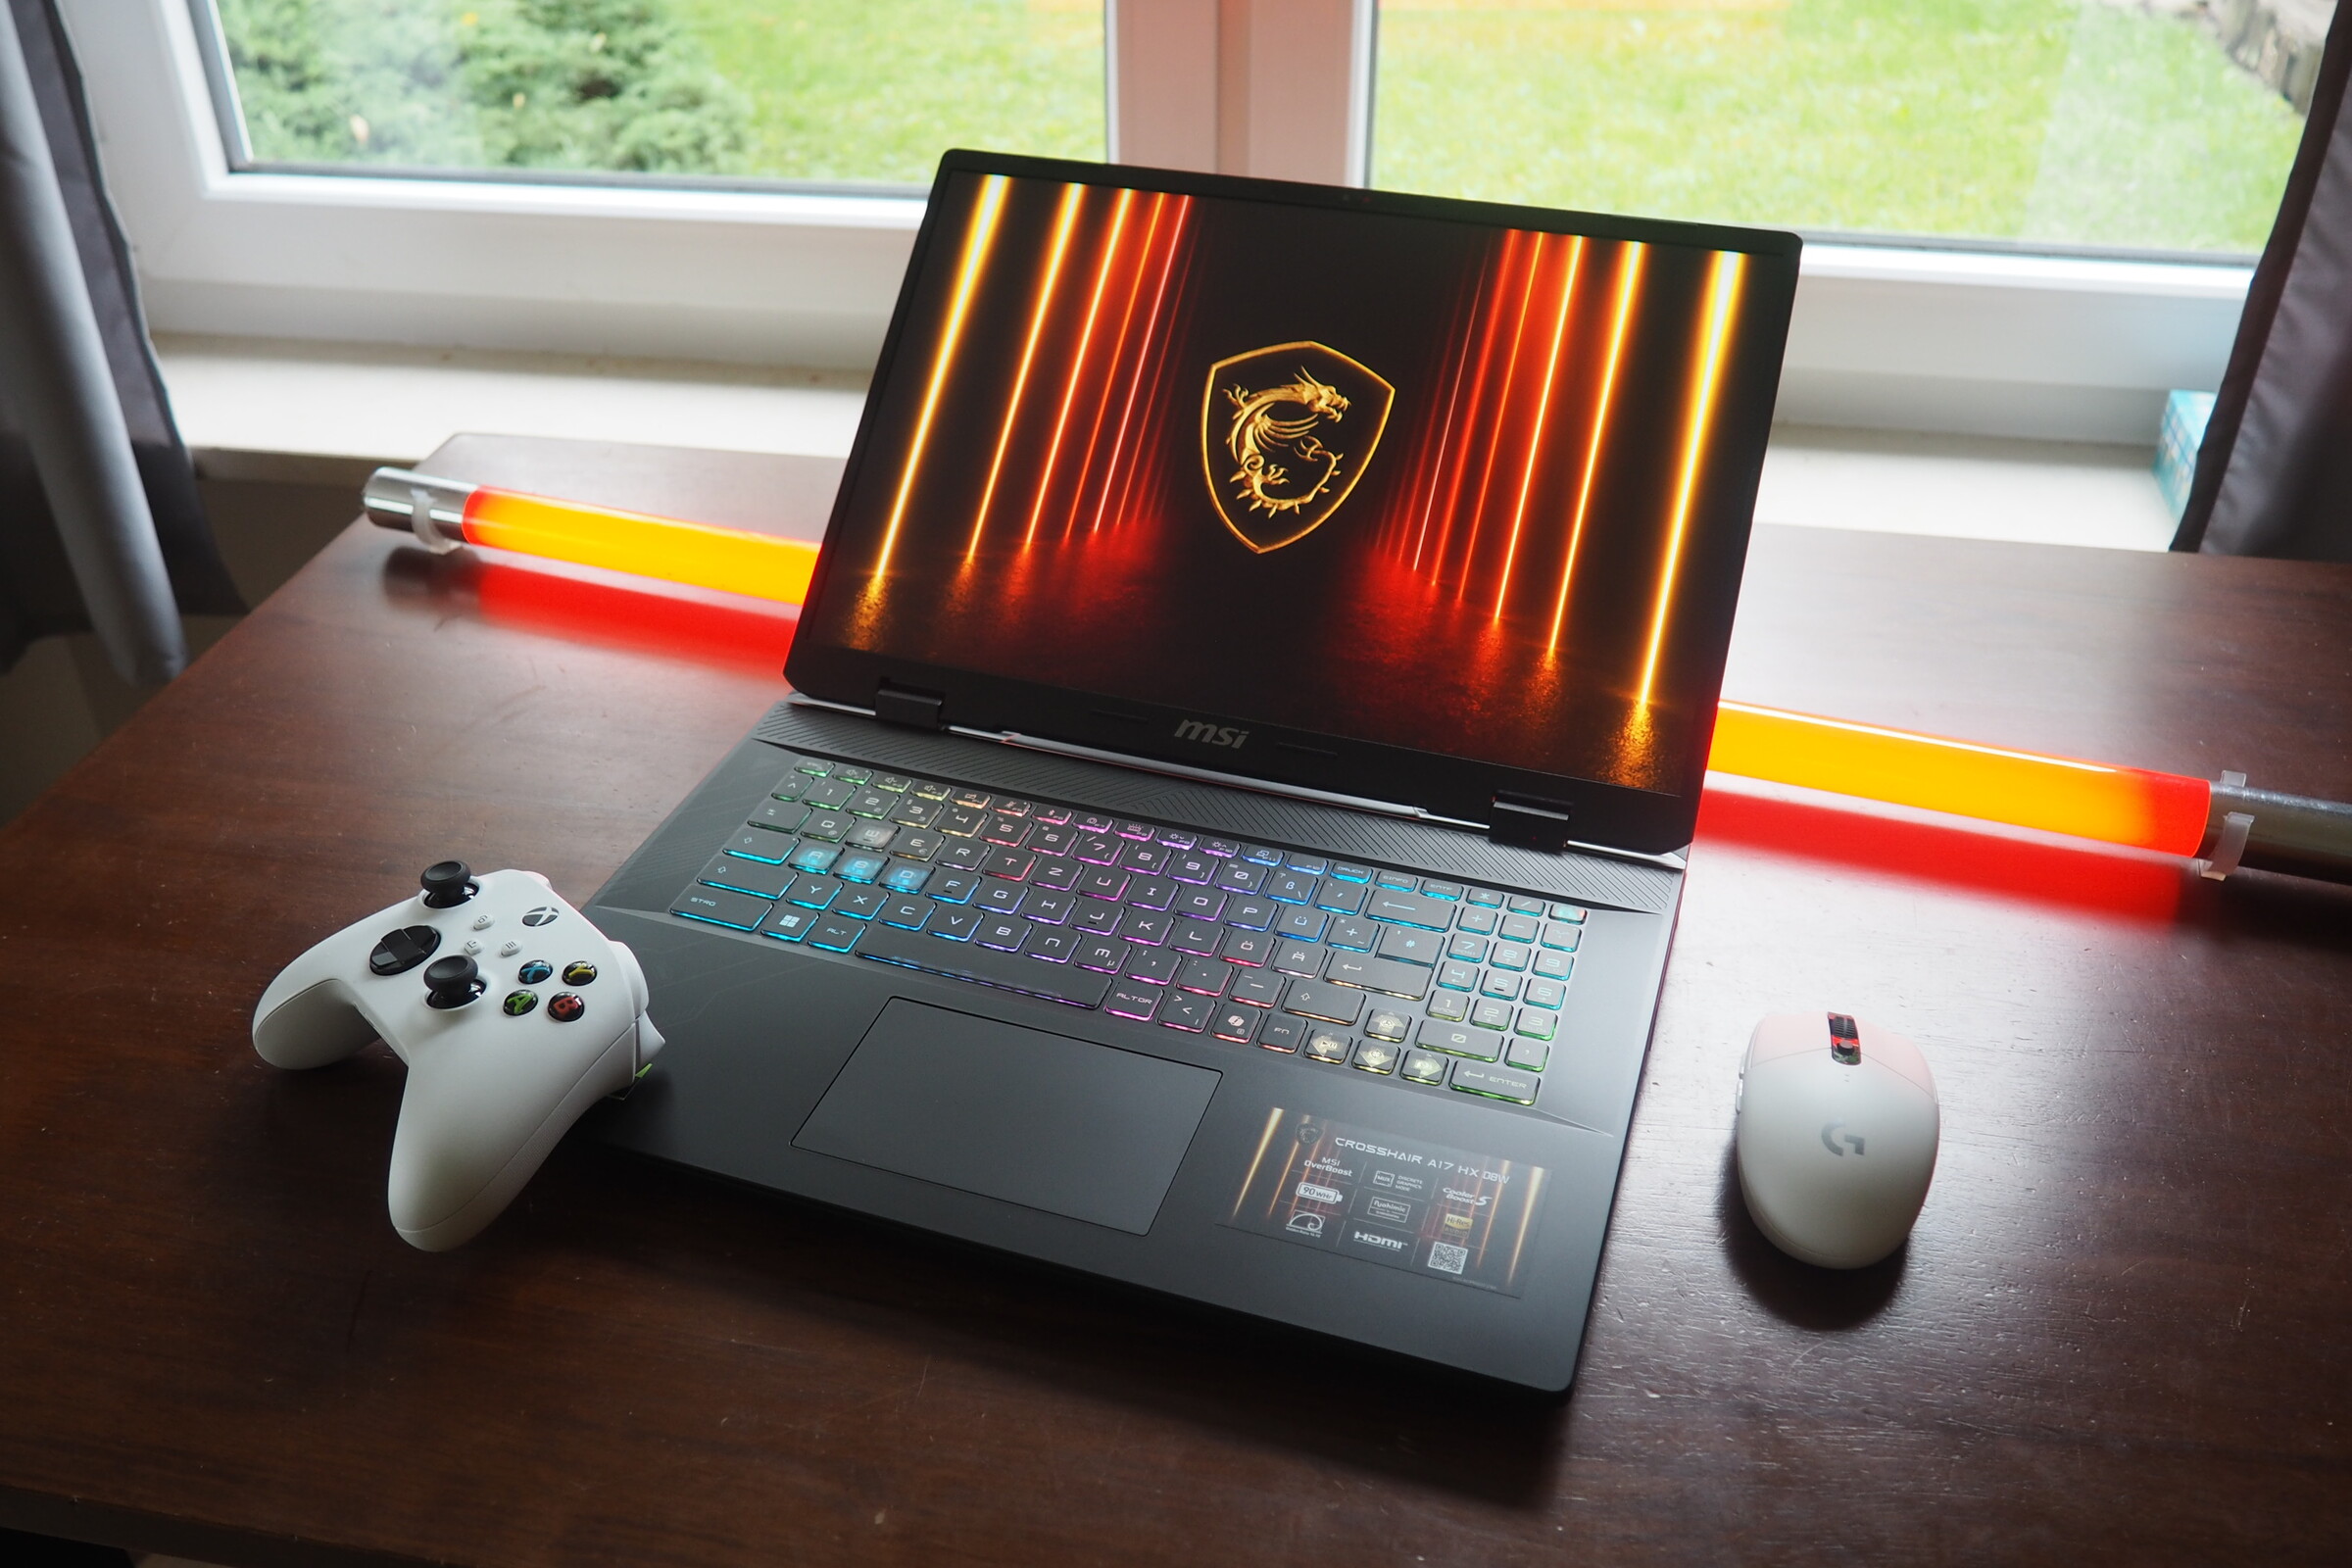
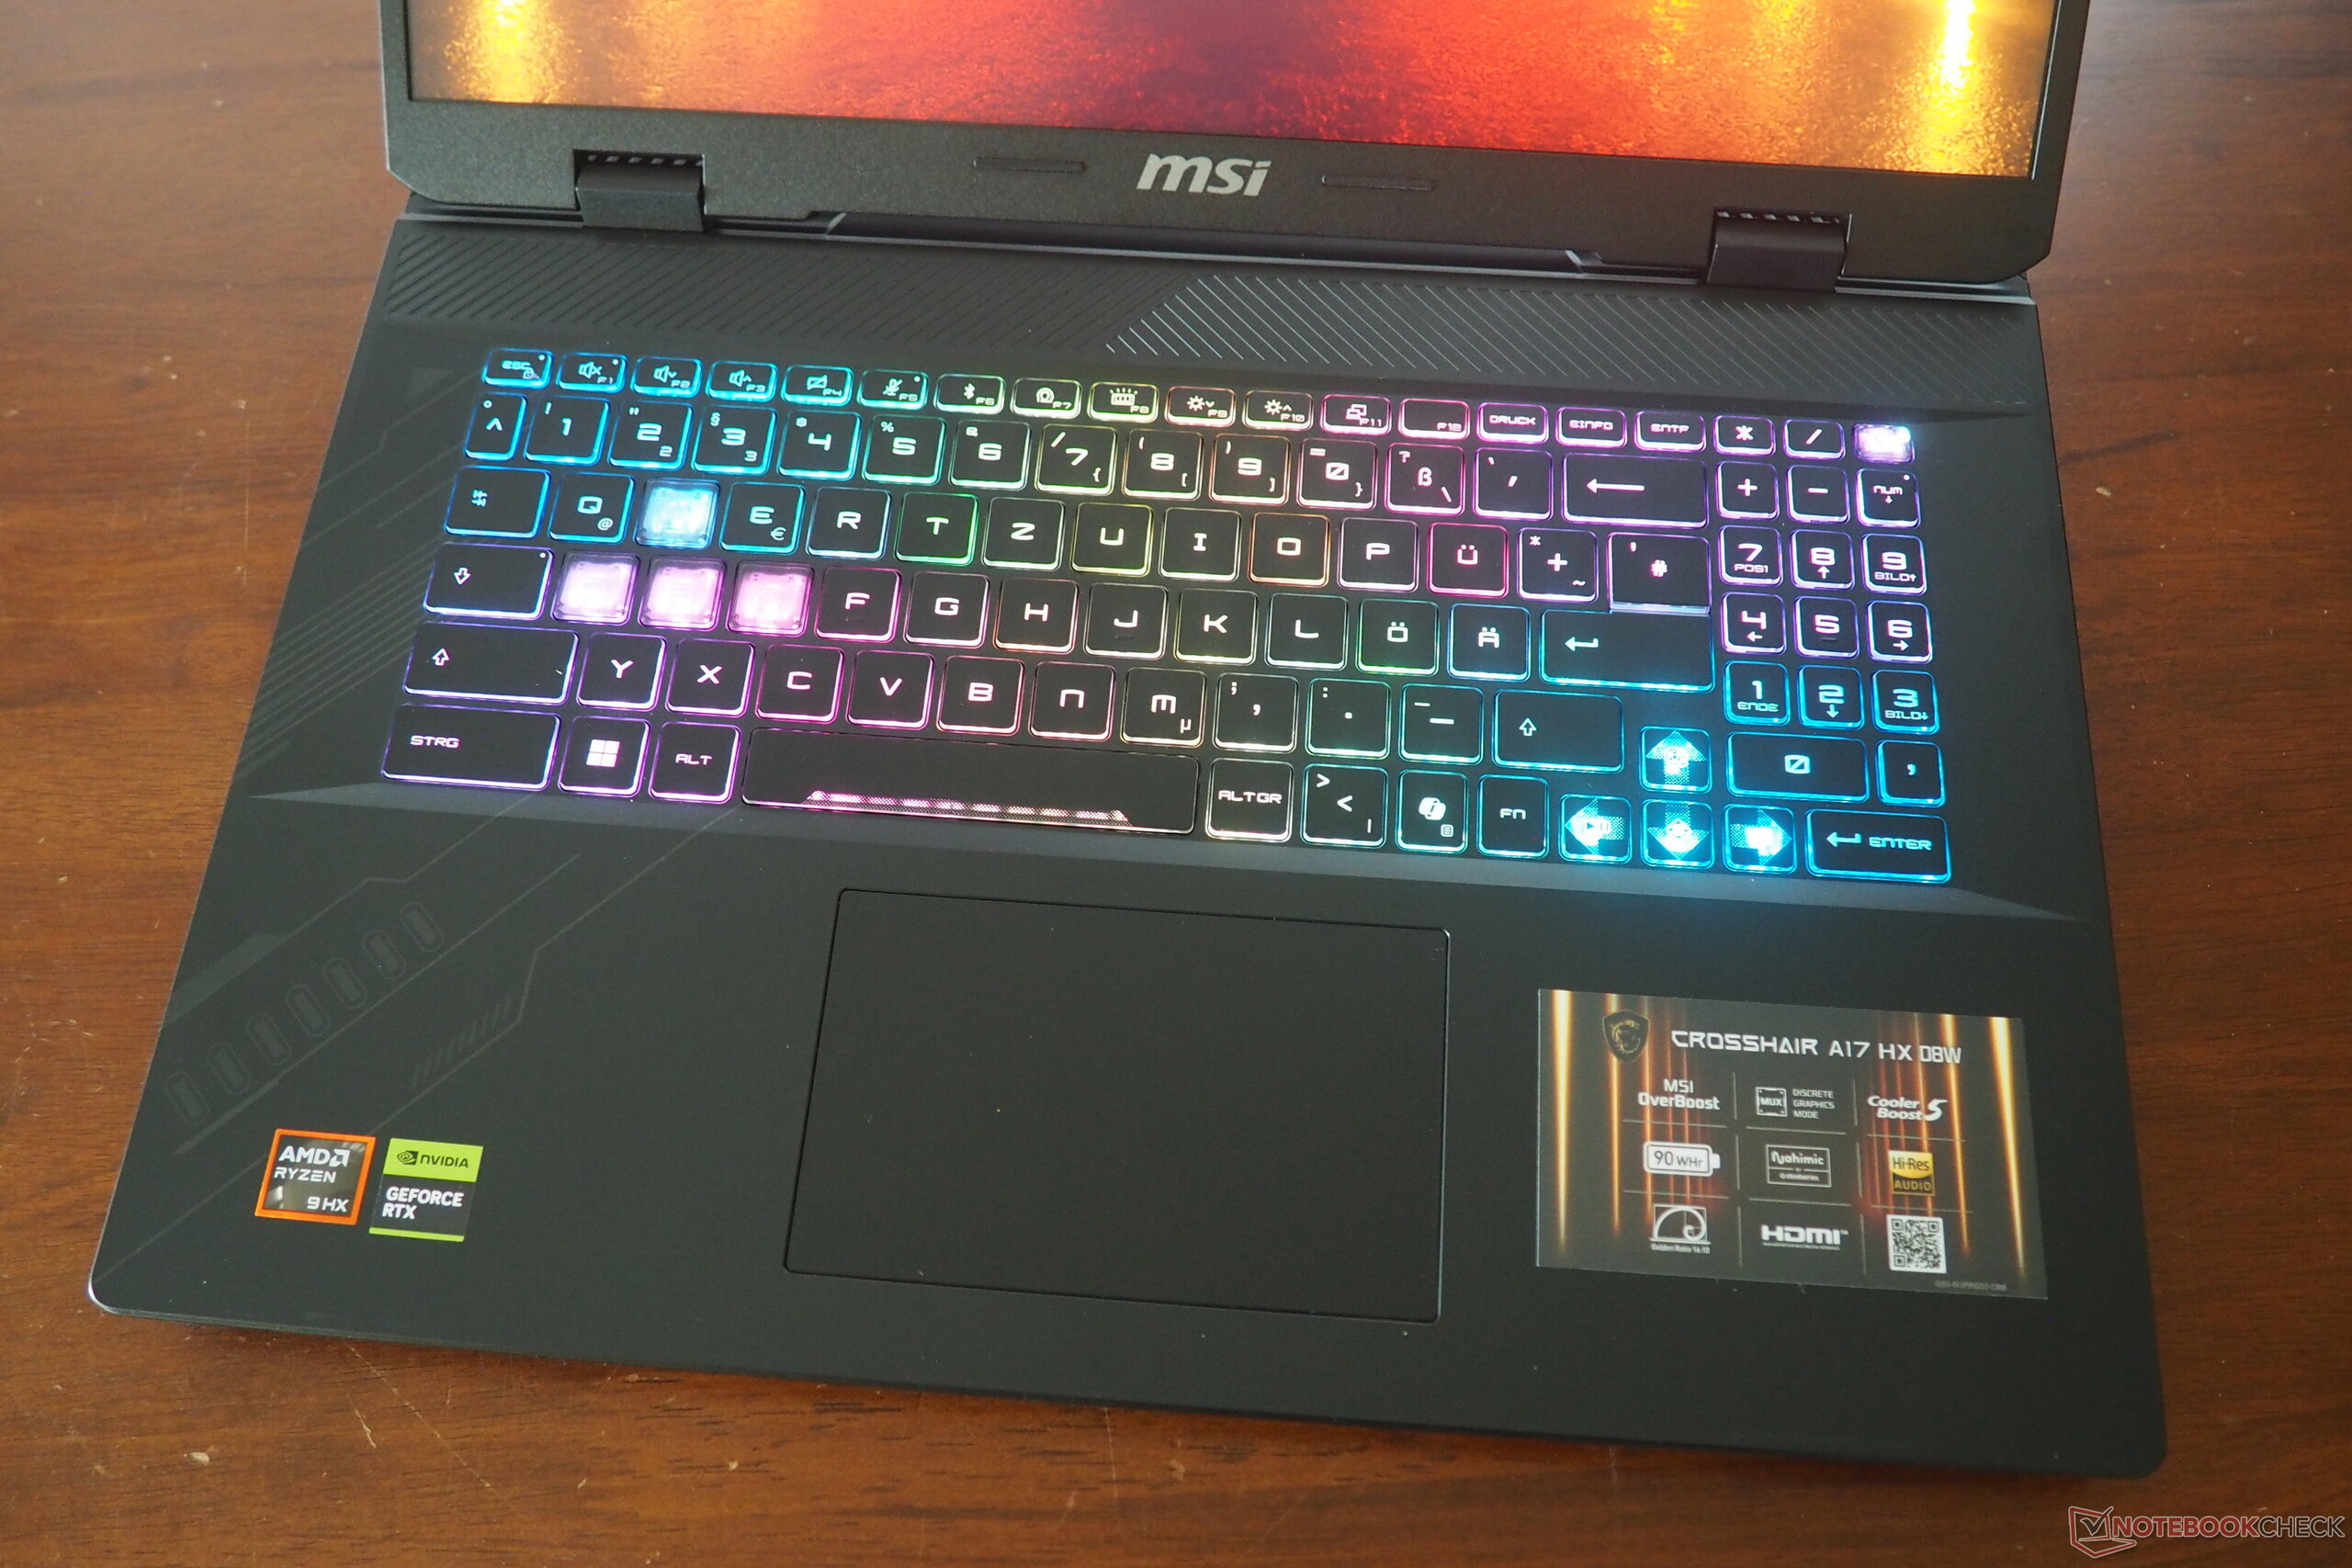
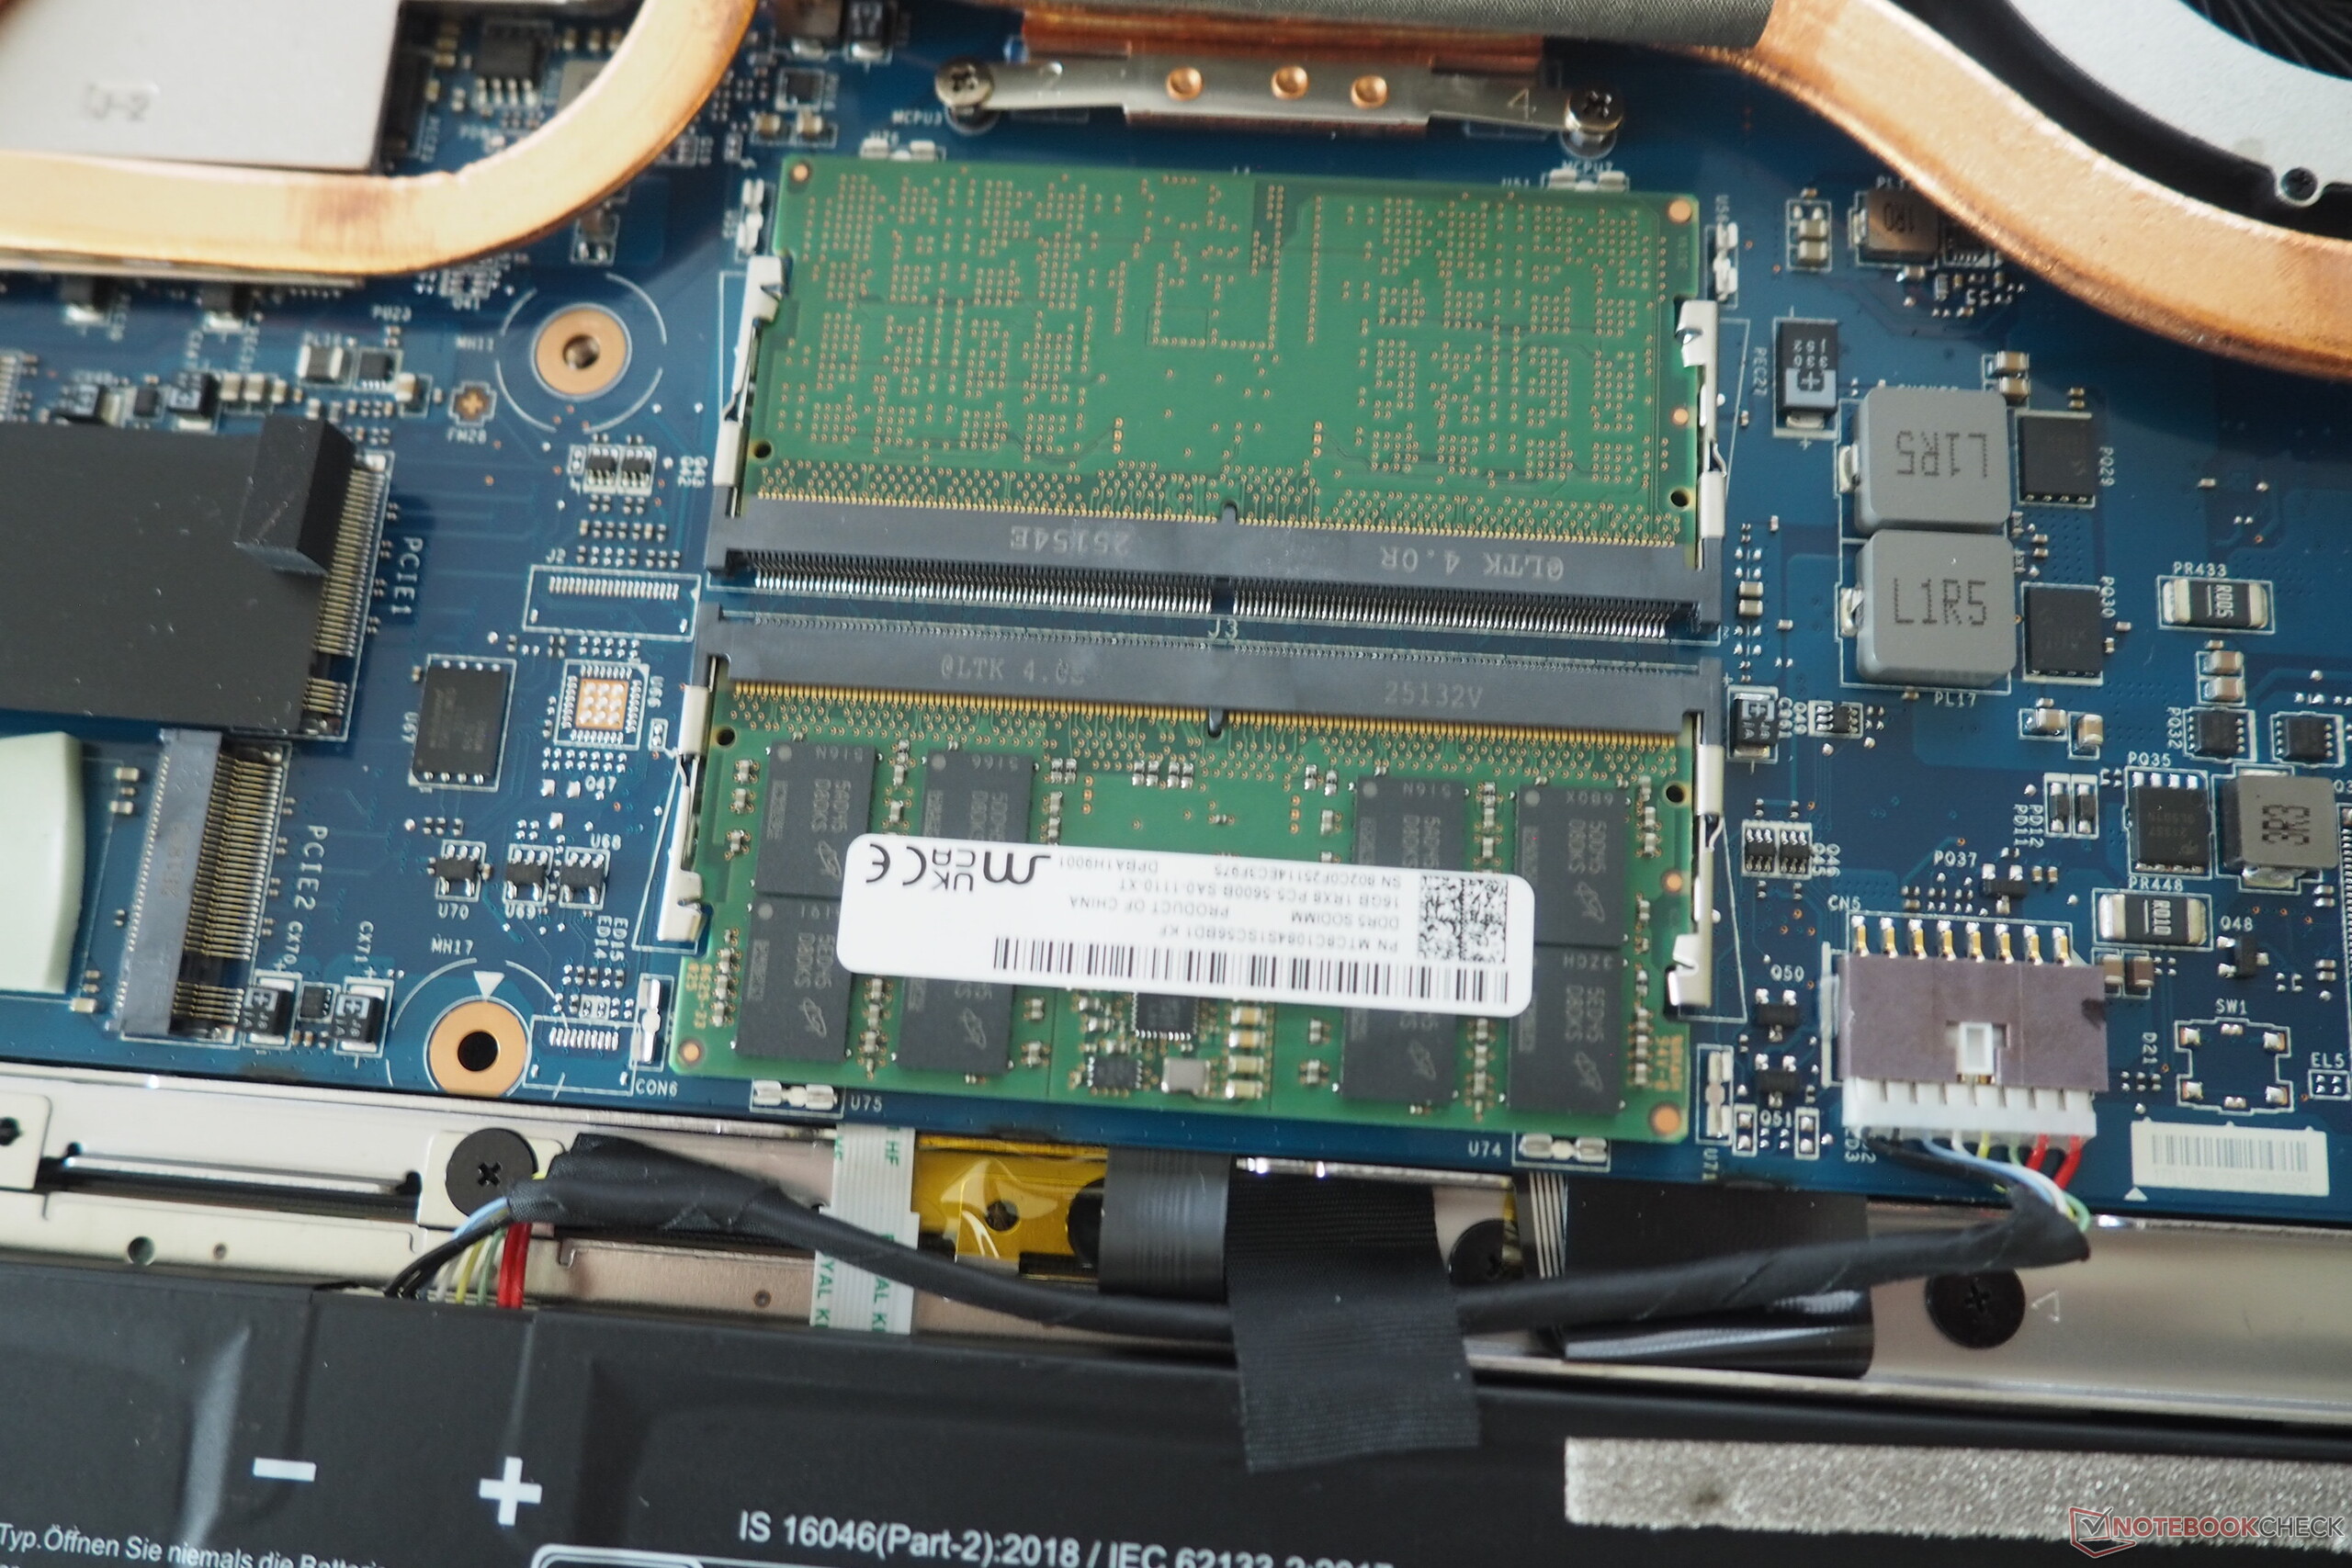
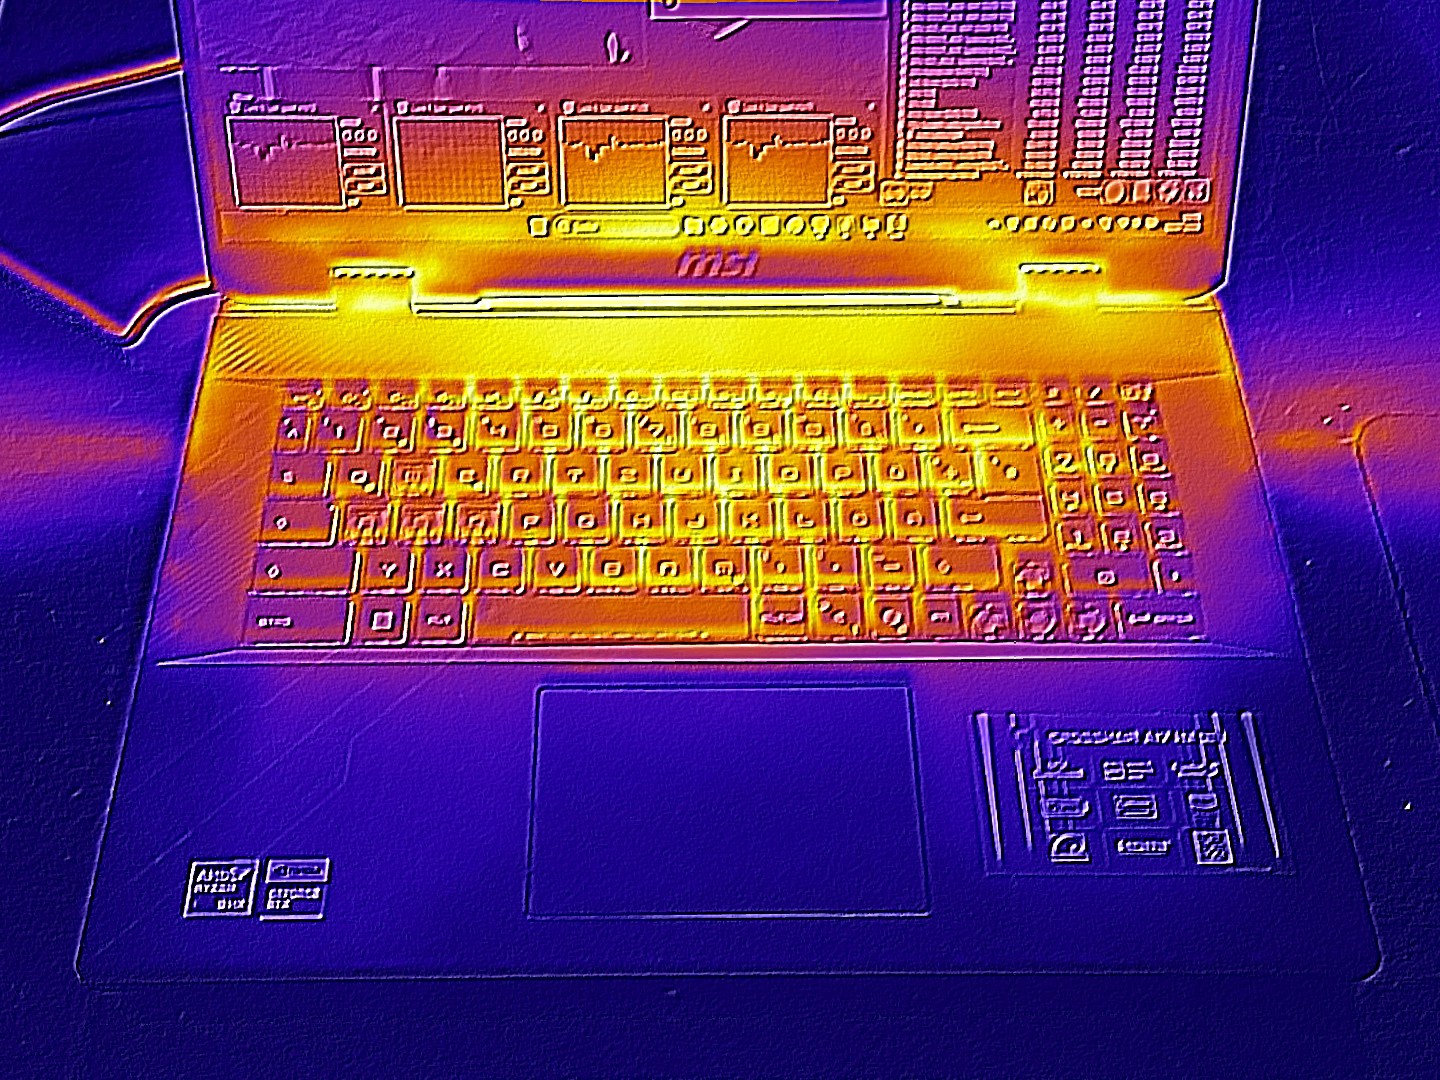
同时,无论是外观(质量、稳定性等)还是内在(两个内存和两个固态硬盘插槽),该机箱都给人留下了良好的印象。输入设备也是如此,不过买家首先要适应非传统的键盘布局。另一方面,24 个 RGB 区域让灯光爱好者物有所值。不足之处包括网络摄像头、扬声器和电池续航时间较短。
Pros
Cons
价格和供应情况
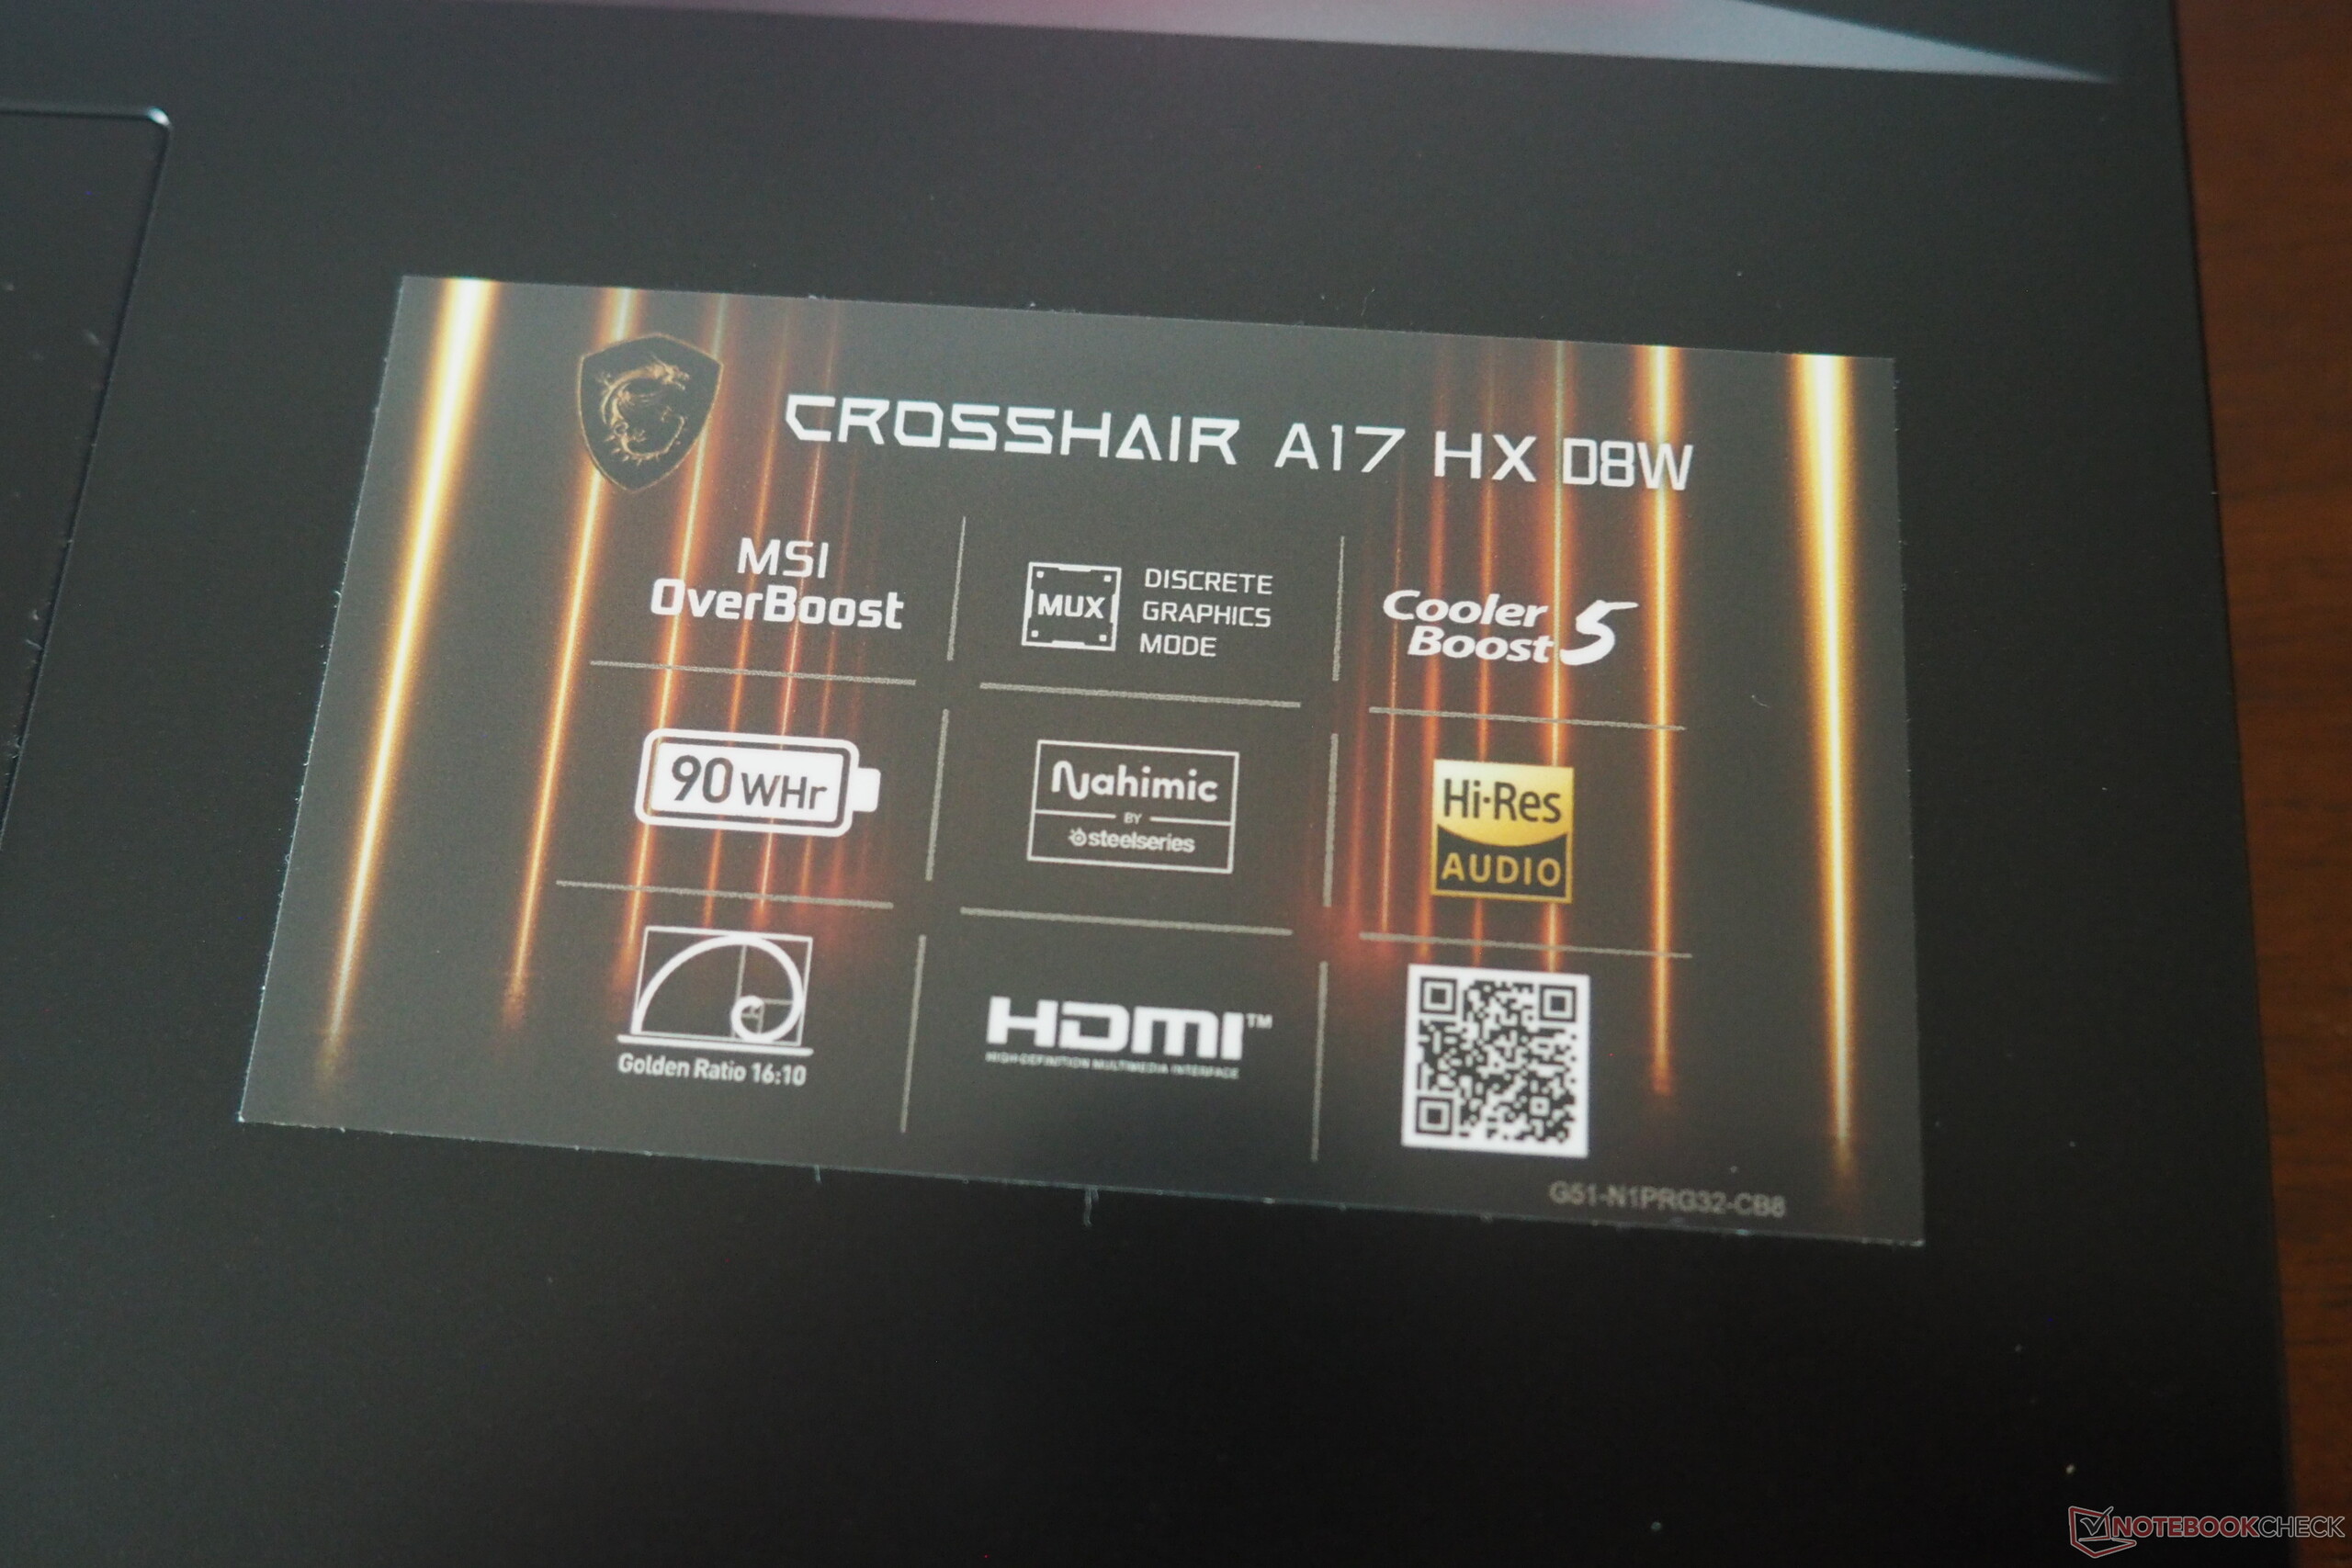
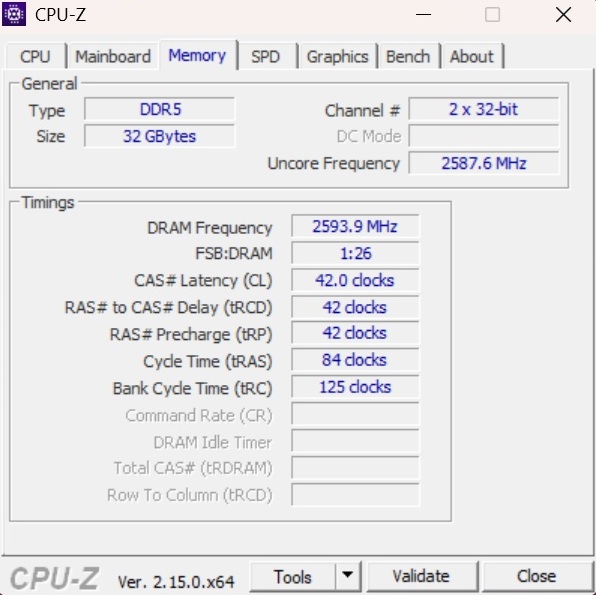
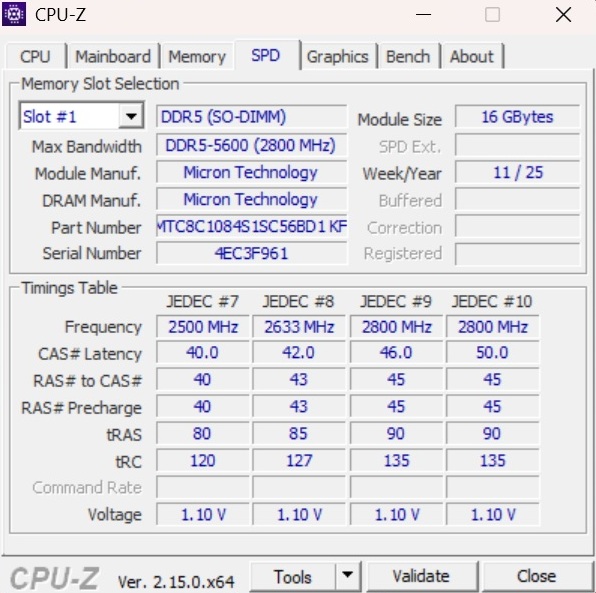
经过测试的微星 Crosshair A17 HX D8WGKG 配有 Ryzen 9 8940HX 和GeForce RTX 5070,售价约为 2000 欧元(亚马逊报价约为 2332 美元)。
- $39.99SLRIOYS 240W 200W Charger Compatible with MSI Katana GF76 GF66 17 15 A17 A15 Crosshair A18 A17 A16 15 18 17 16 Pulse 15 16 17 AI GL76 Stealth 15M 17M 14 15 Sword 16 15 Bravo, Creator Laptop
- $1,279.99msi Crosshair A16 HX 16” QHD+ 240Hz Gaming Laptop – AMD Ryzen 9 8940HX, NVIDIA GeForce RTX 5060, 16GB DDR5, 1TB NVMe SSD, Wi-Fi 6E, USB-C, Windows 11 D8WFKG-090US
- $25.99Silent Wireless Mouse for MSI Crosshair A17 HX D8WGKG,Bluetooth,2.4GHz with USB Receiver, Quiet & Lightweight
Crosshair A17 HX 的竞争对手包括其他配备了 RTX 5070或 RTX 5070 Ti如 微星卡塔娜 17 HX和 Aorus Elite 16、联想 联想Legion 5 Pro 16和 微星 Vector 16 HX AI都被列为对比设备。
规格
案例
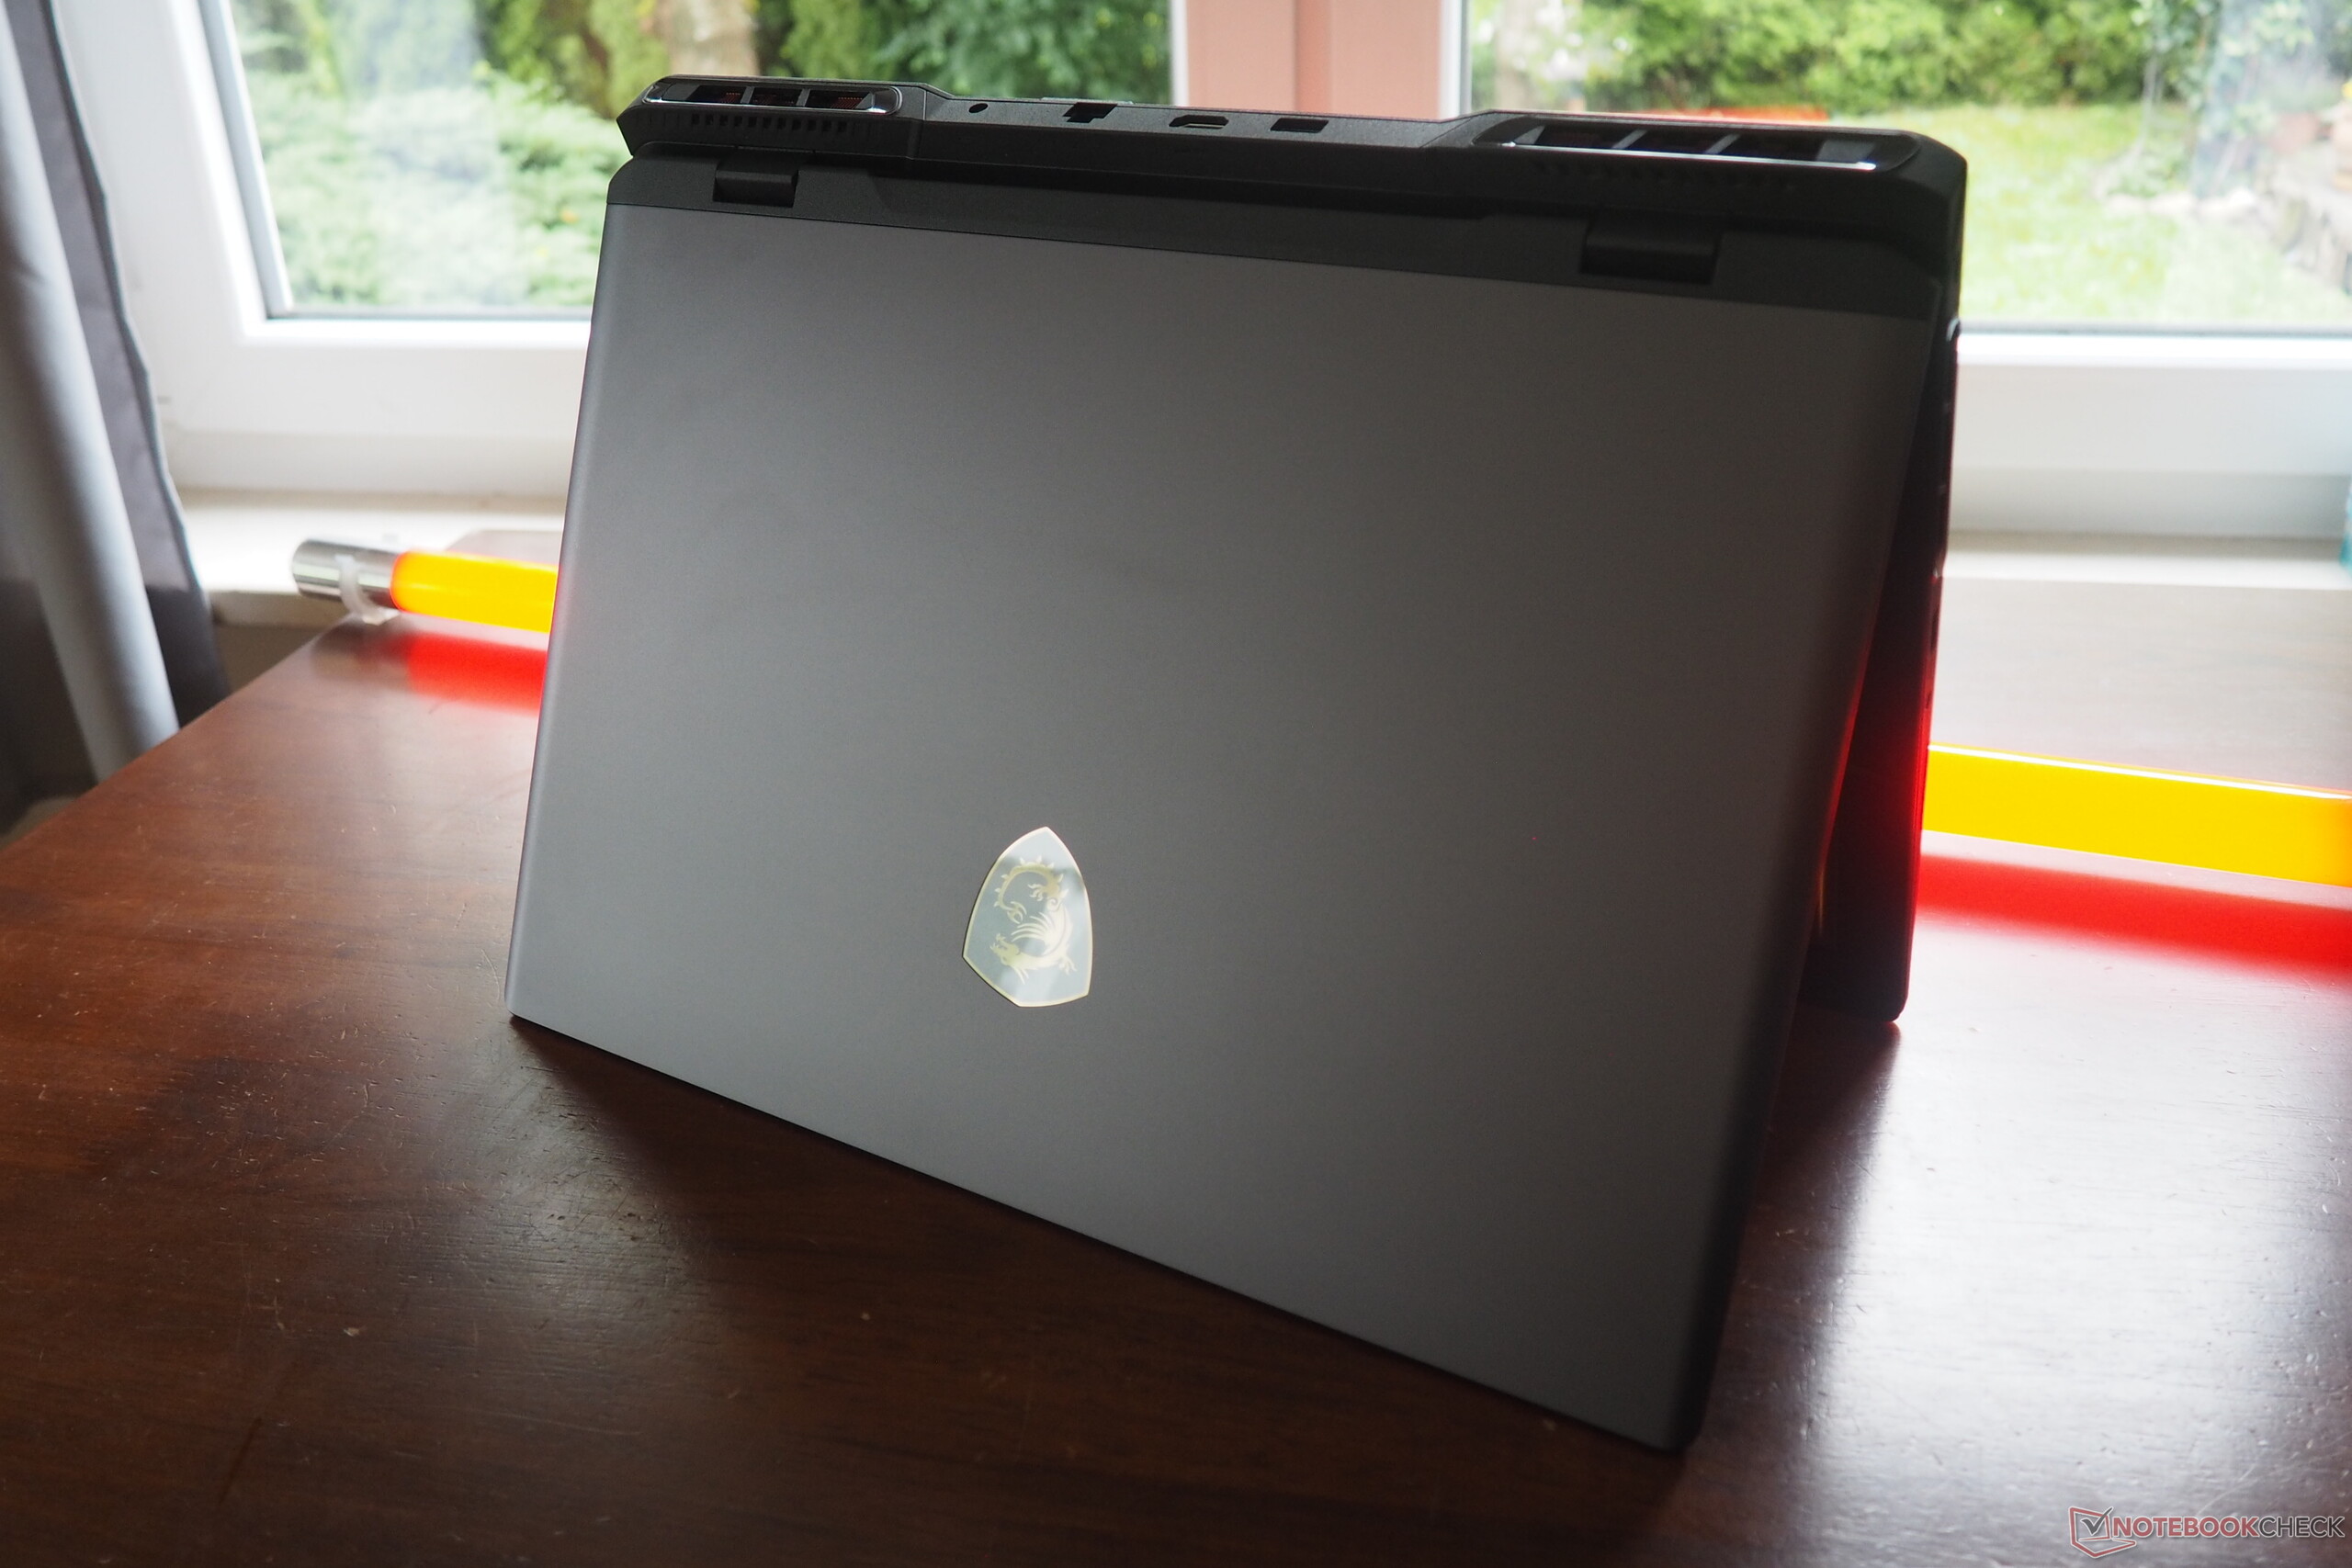
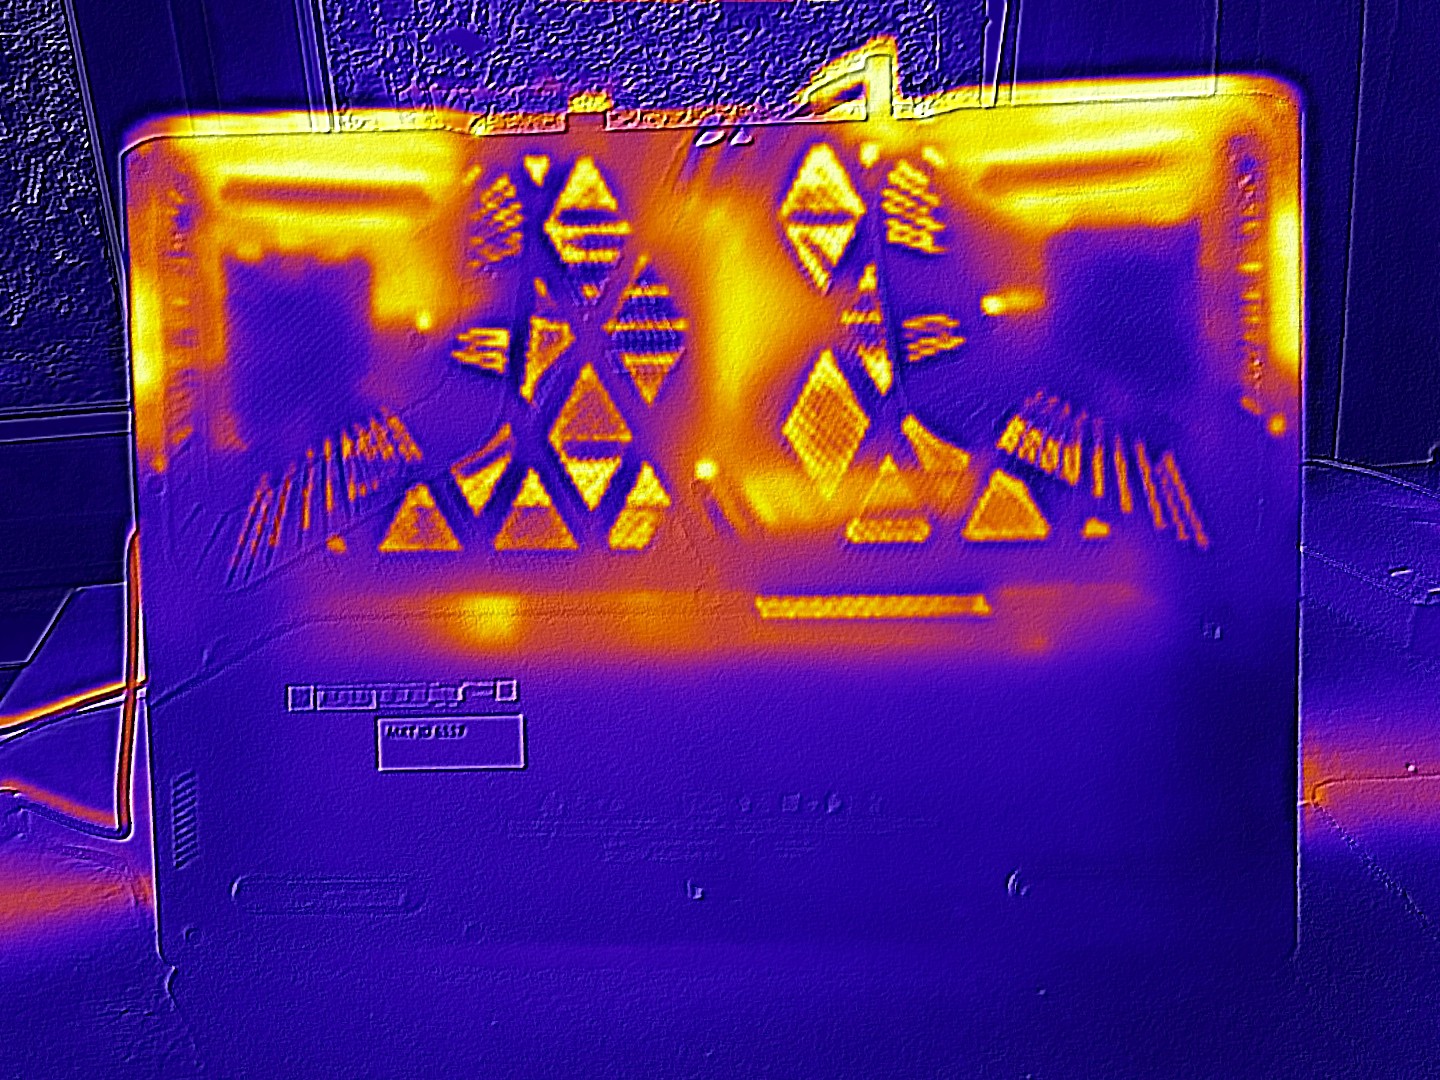
微星在外壳上使用了多种材料。盖子由金属制成,底座则由相当坚固的塑料制成。最大的亮点是 180° 的开合角度,这可不是每个玩家都能做到的。在设计方面,制造商主要对机箱底座进行了狂野的设计(见照片),而机箱的其他部分仍然相当低调和坚固。Crosshair A17 重量为 2.9 千克(约 6.4 磅),比选定的竞争对手要重,尽管后者大多只有 16 英寸而非 17 英寸。在高度方面,Crosshair A17 也是同类产品中的佼佼者(不含脚垫,高度略低于 3 厘米/~1.2 英寸)。
设备
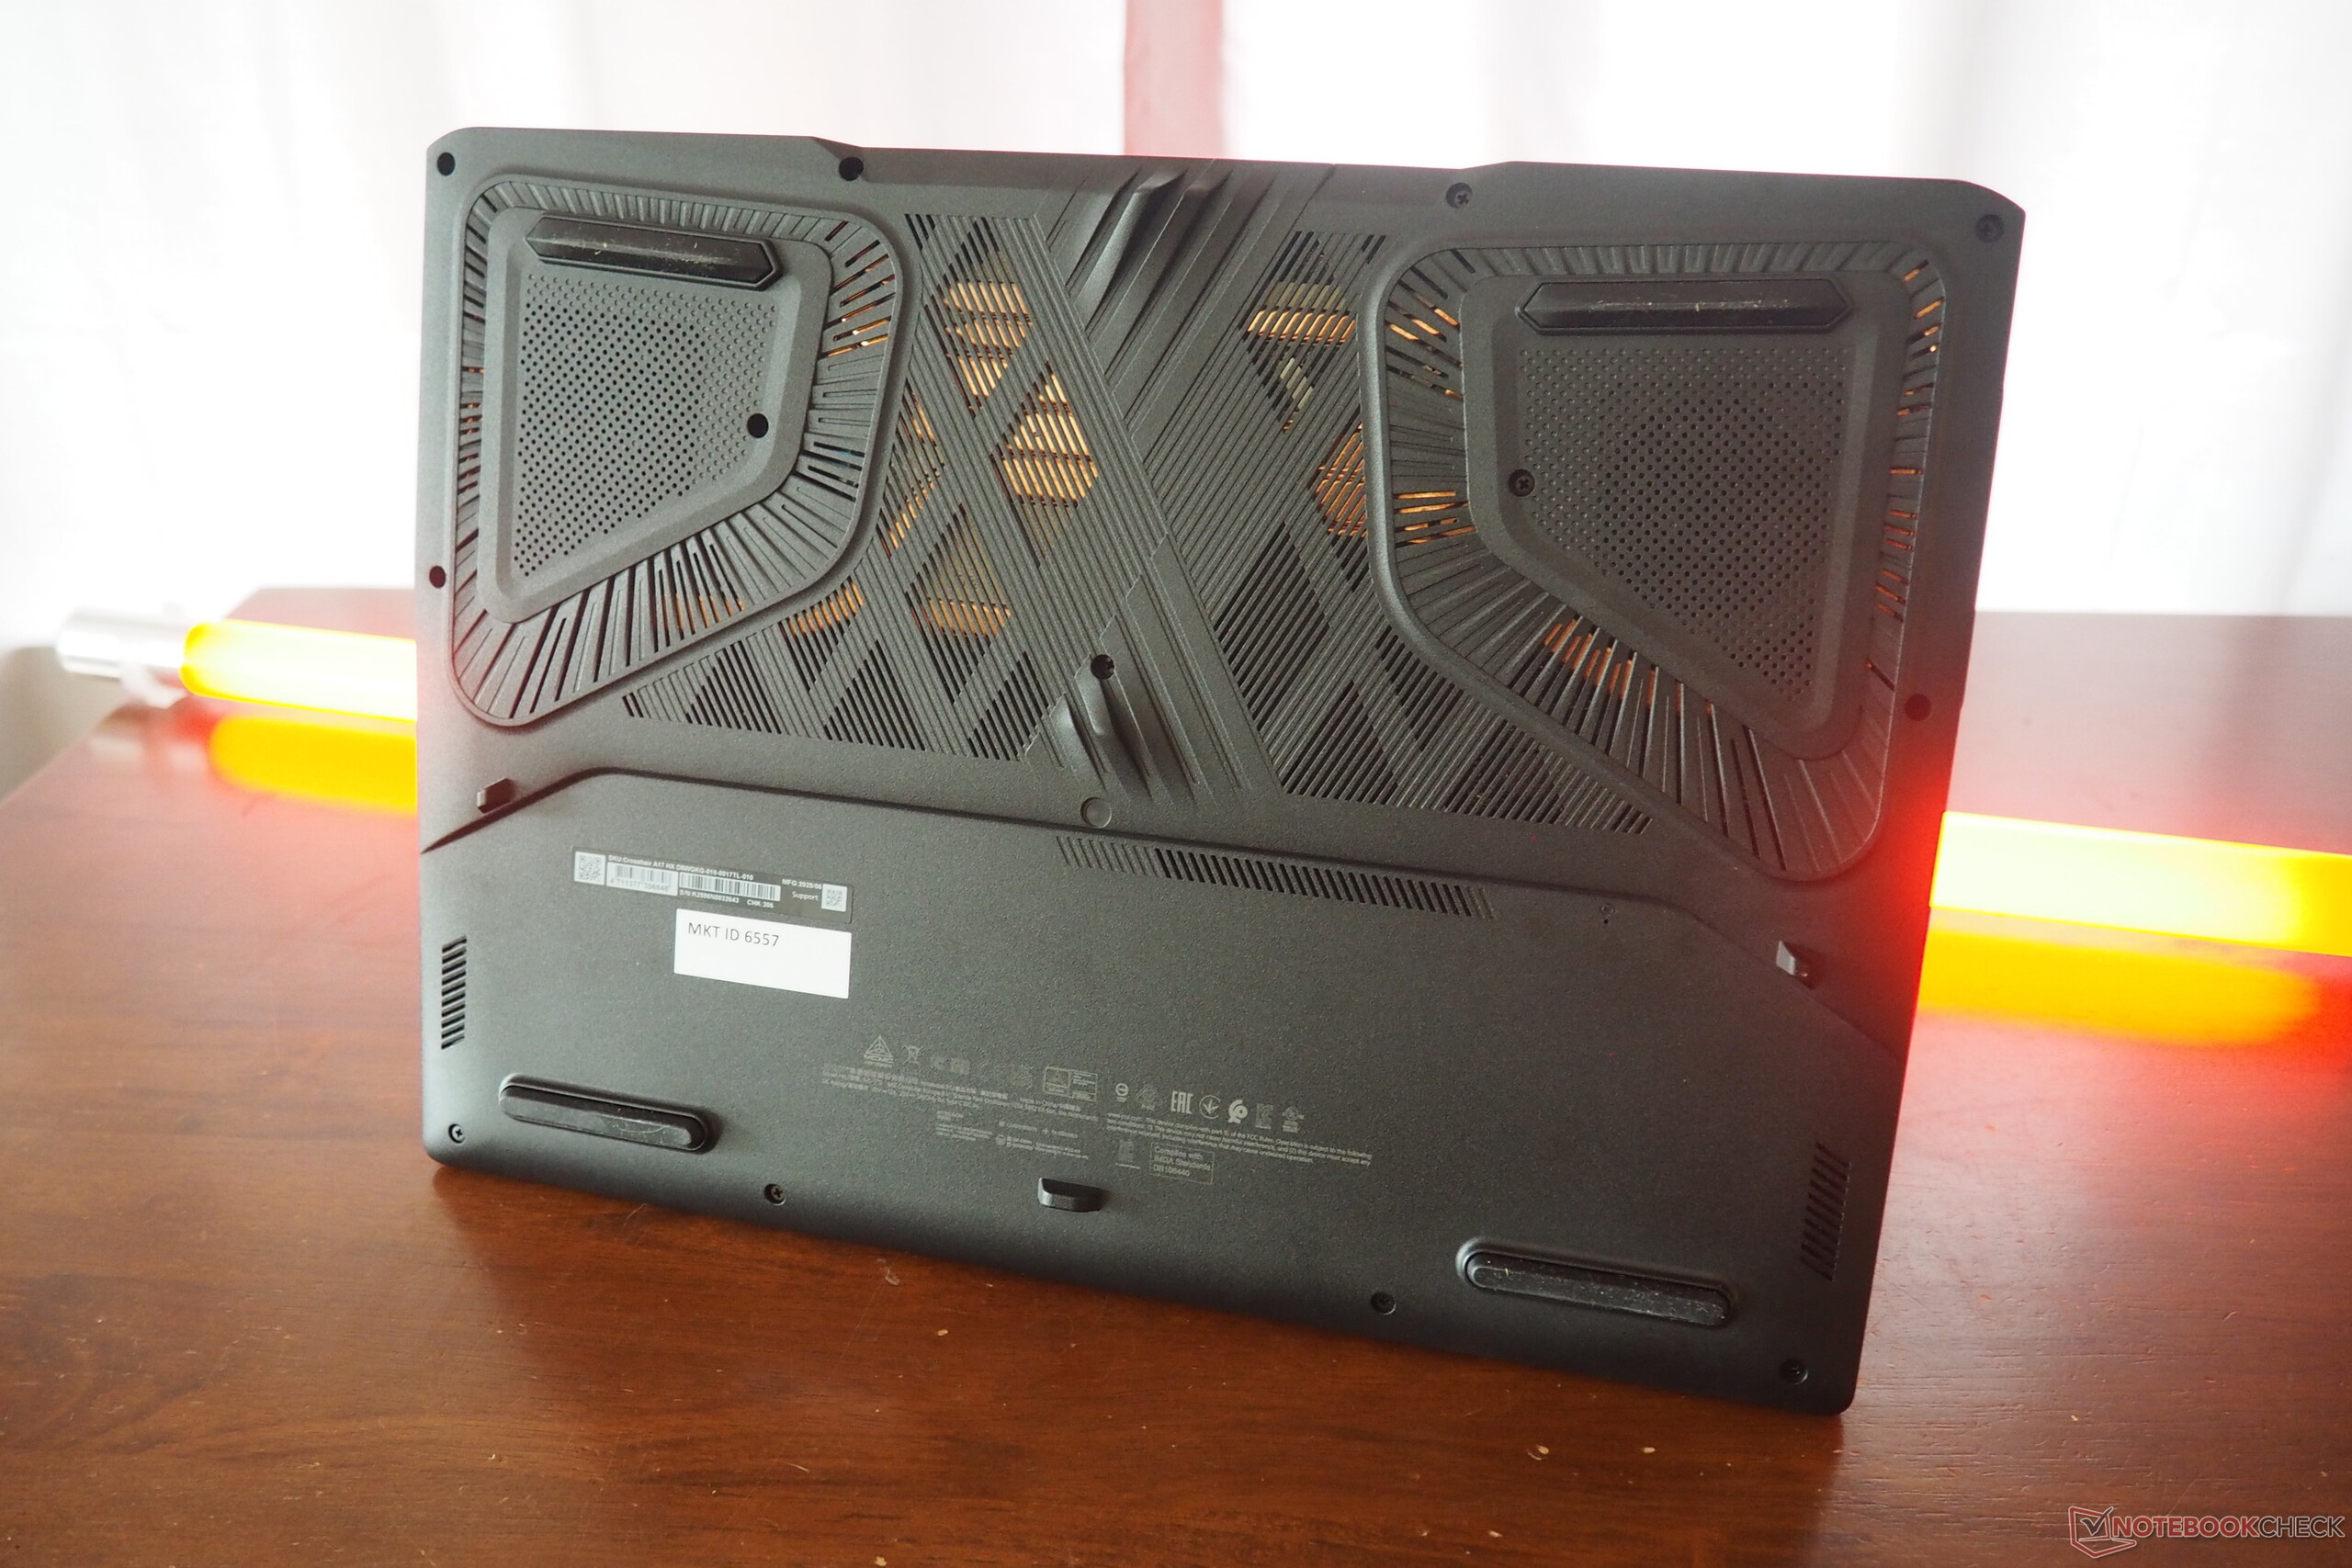
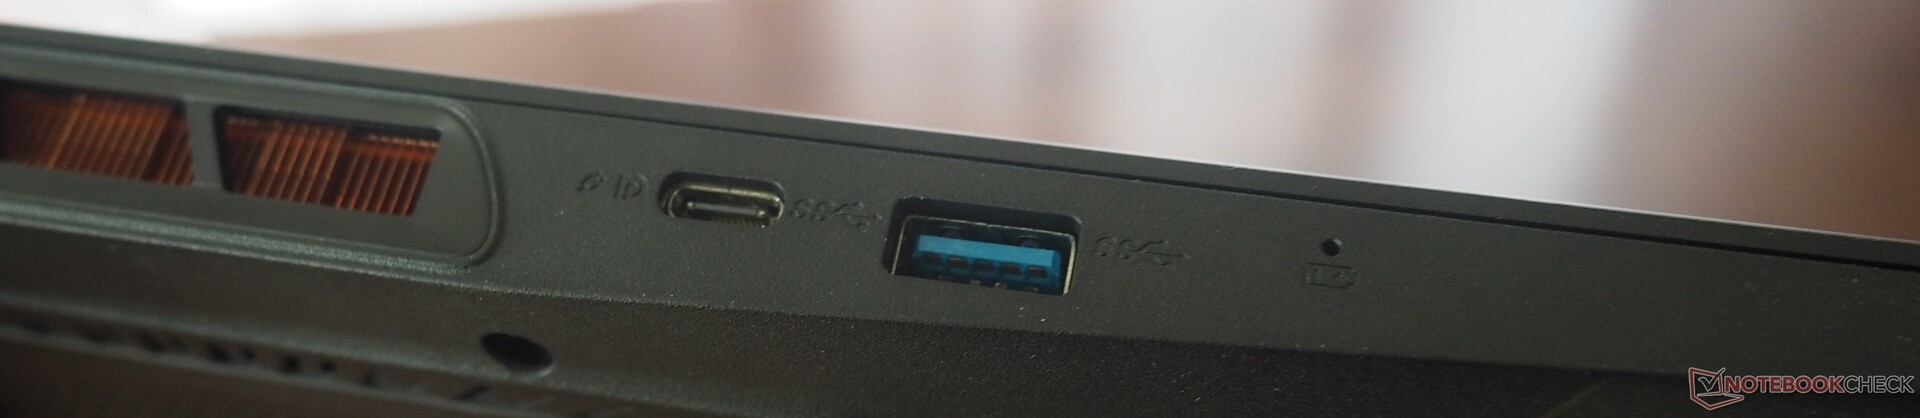
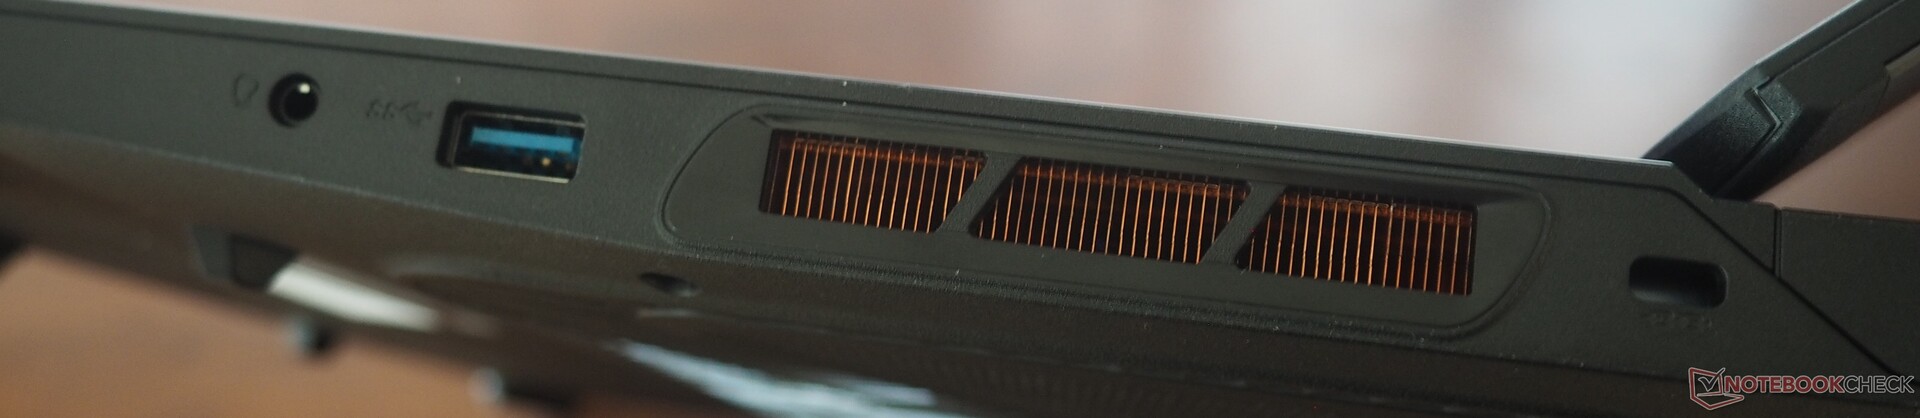
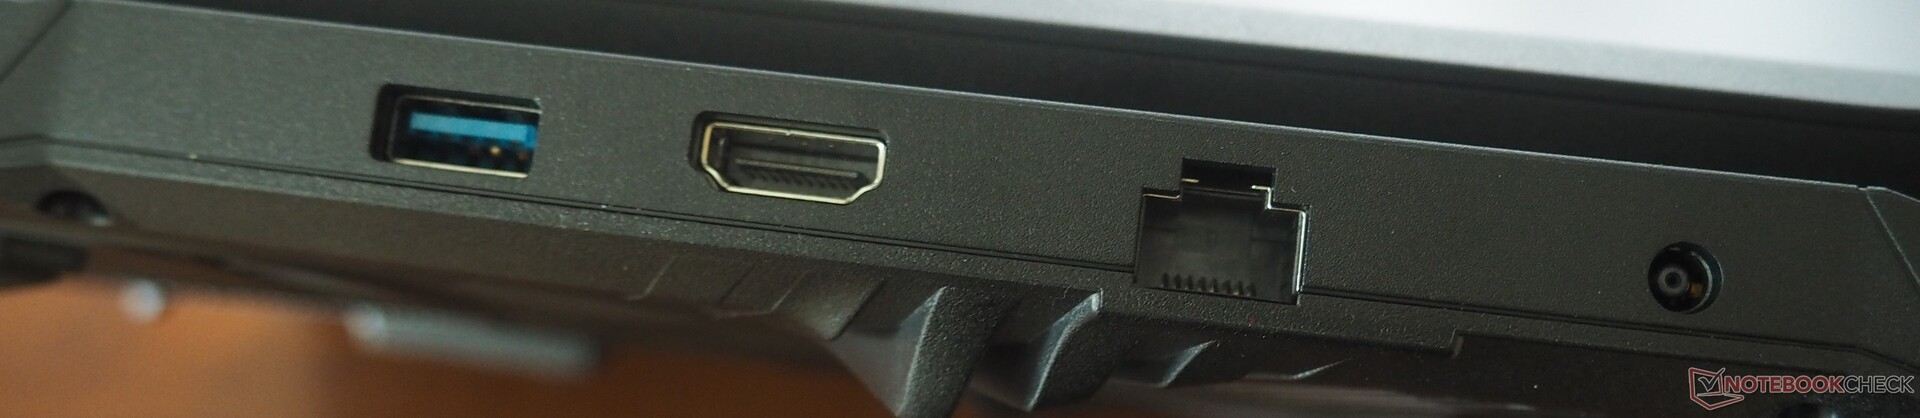
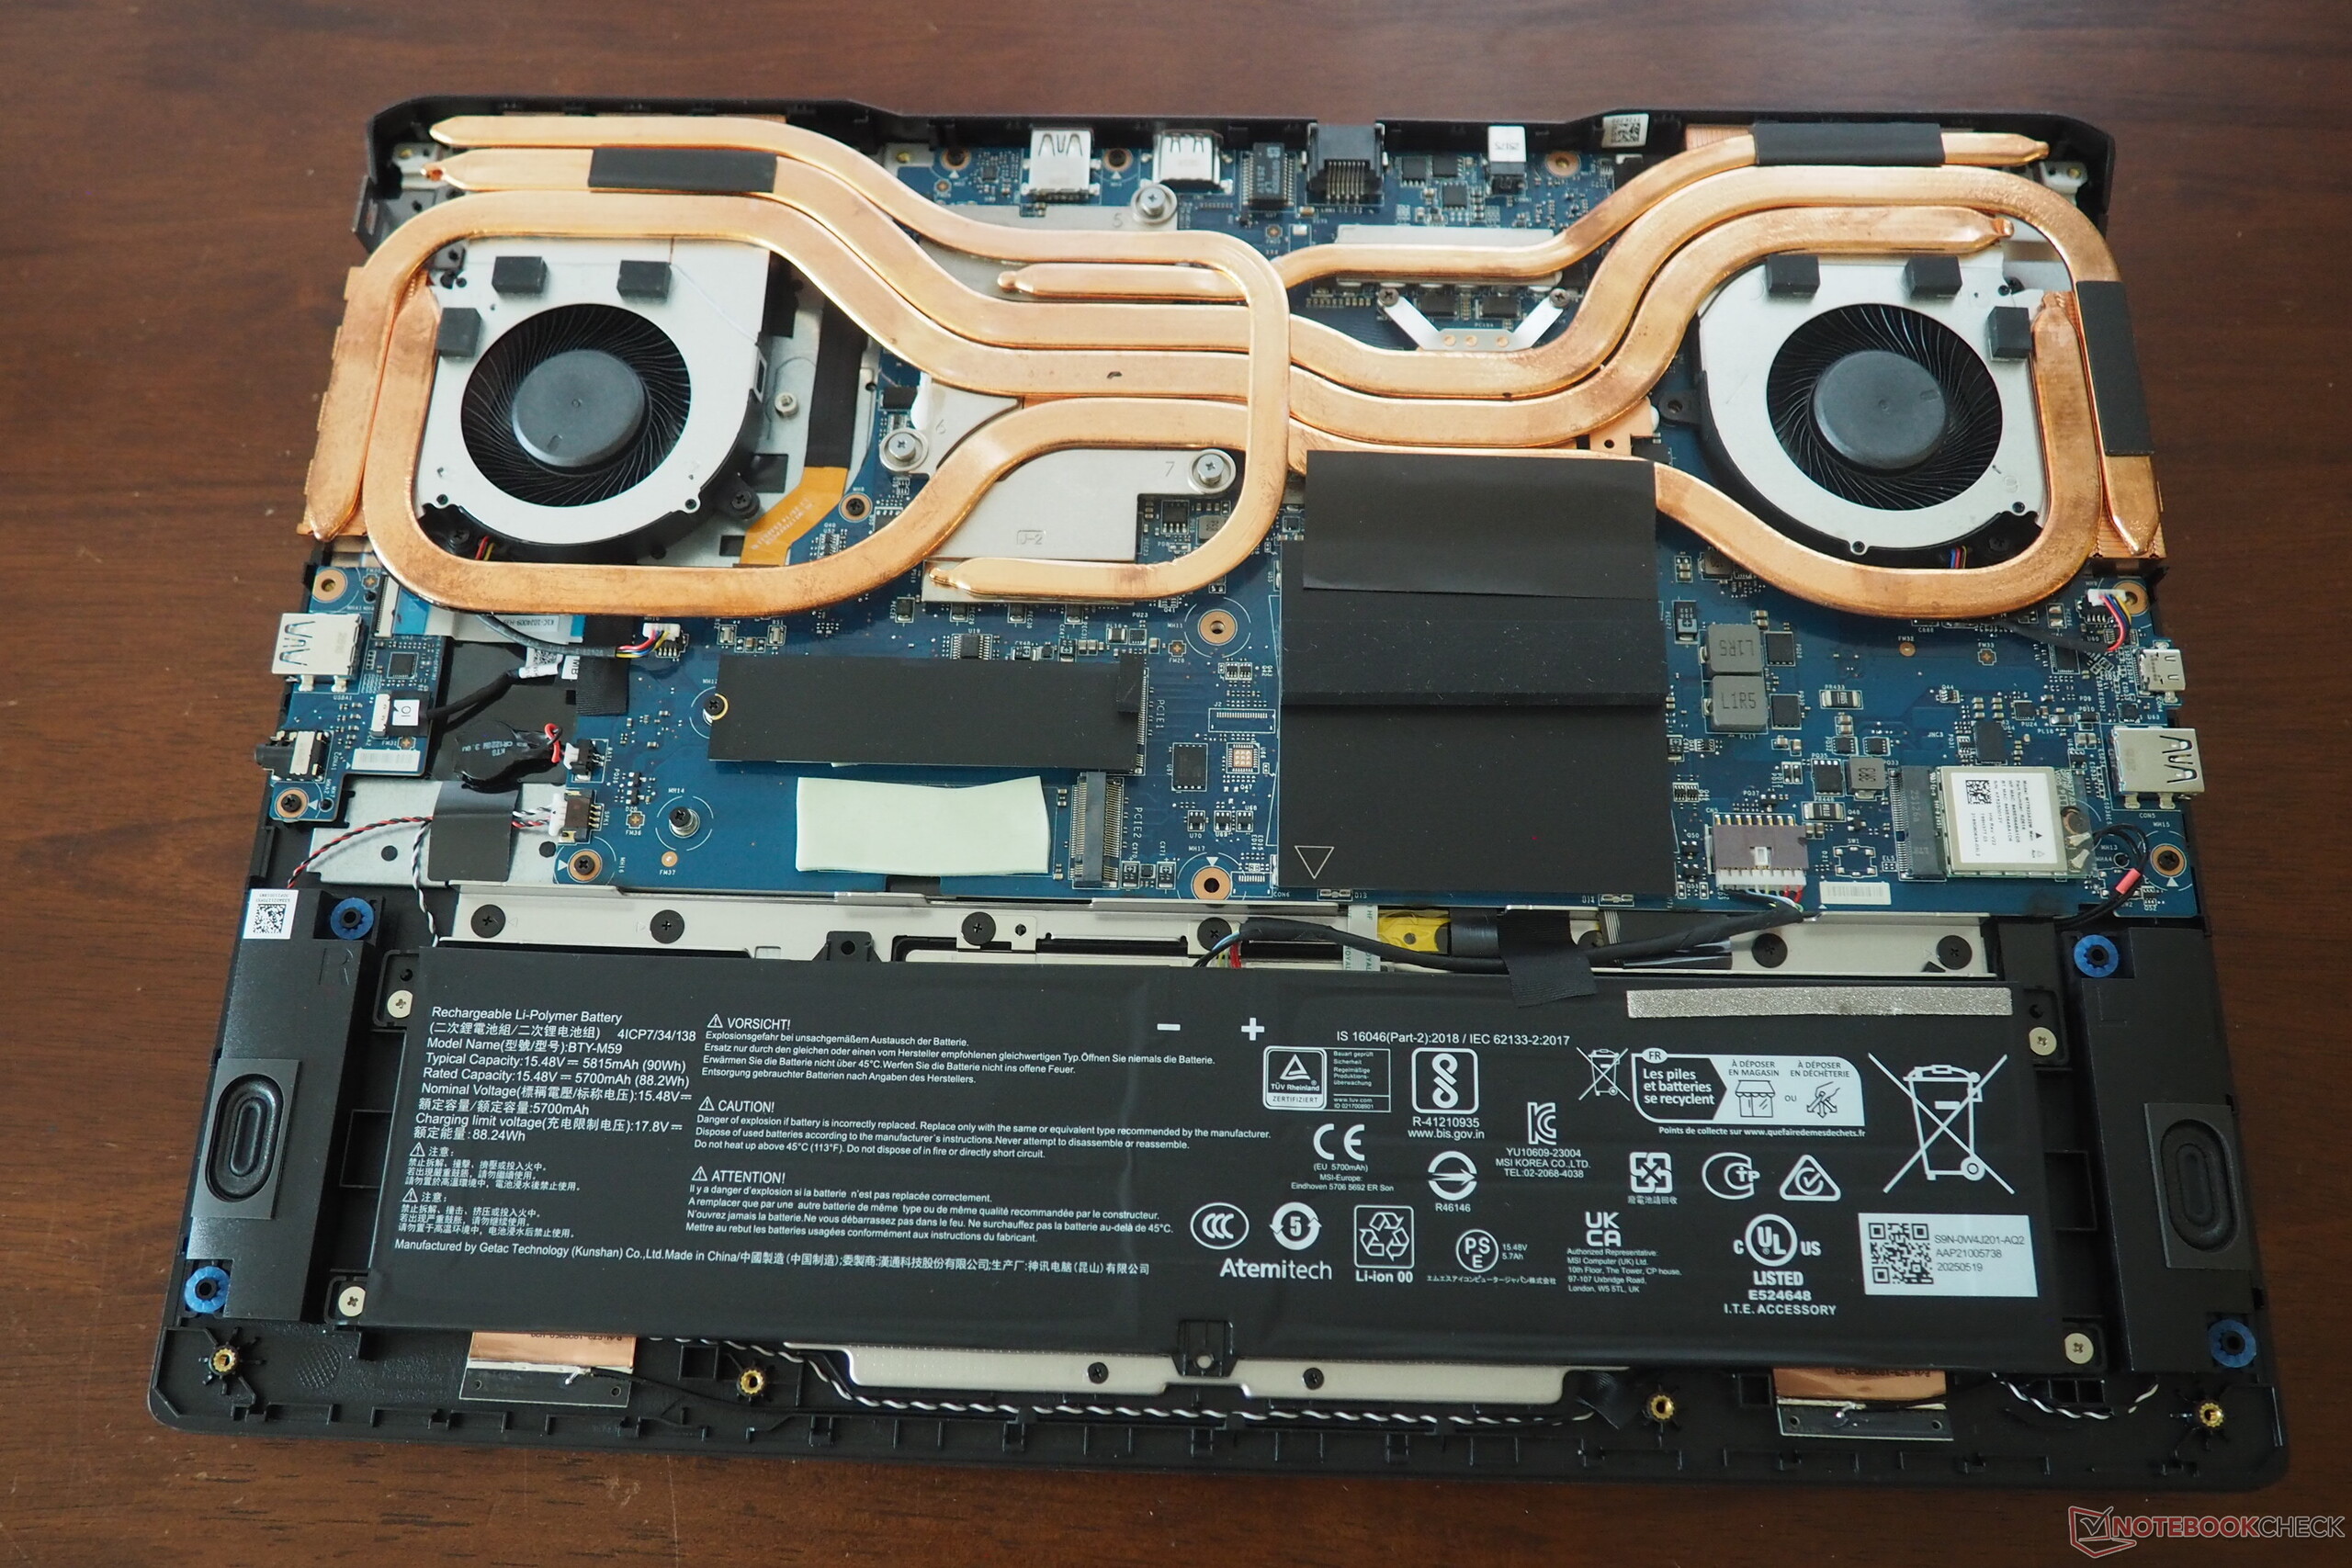
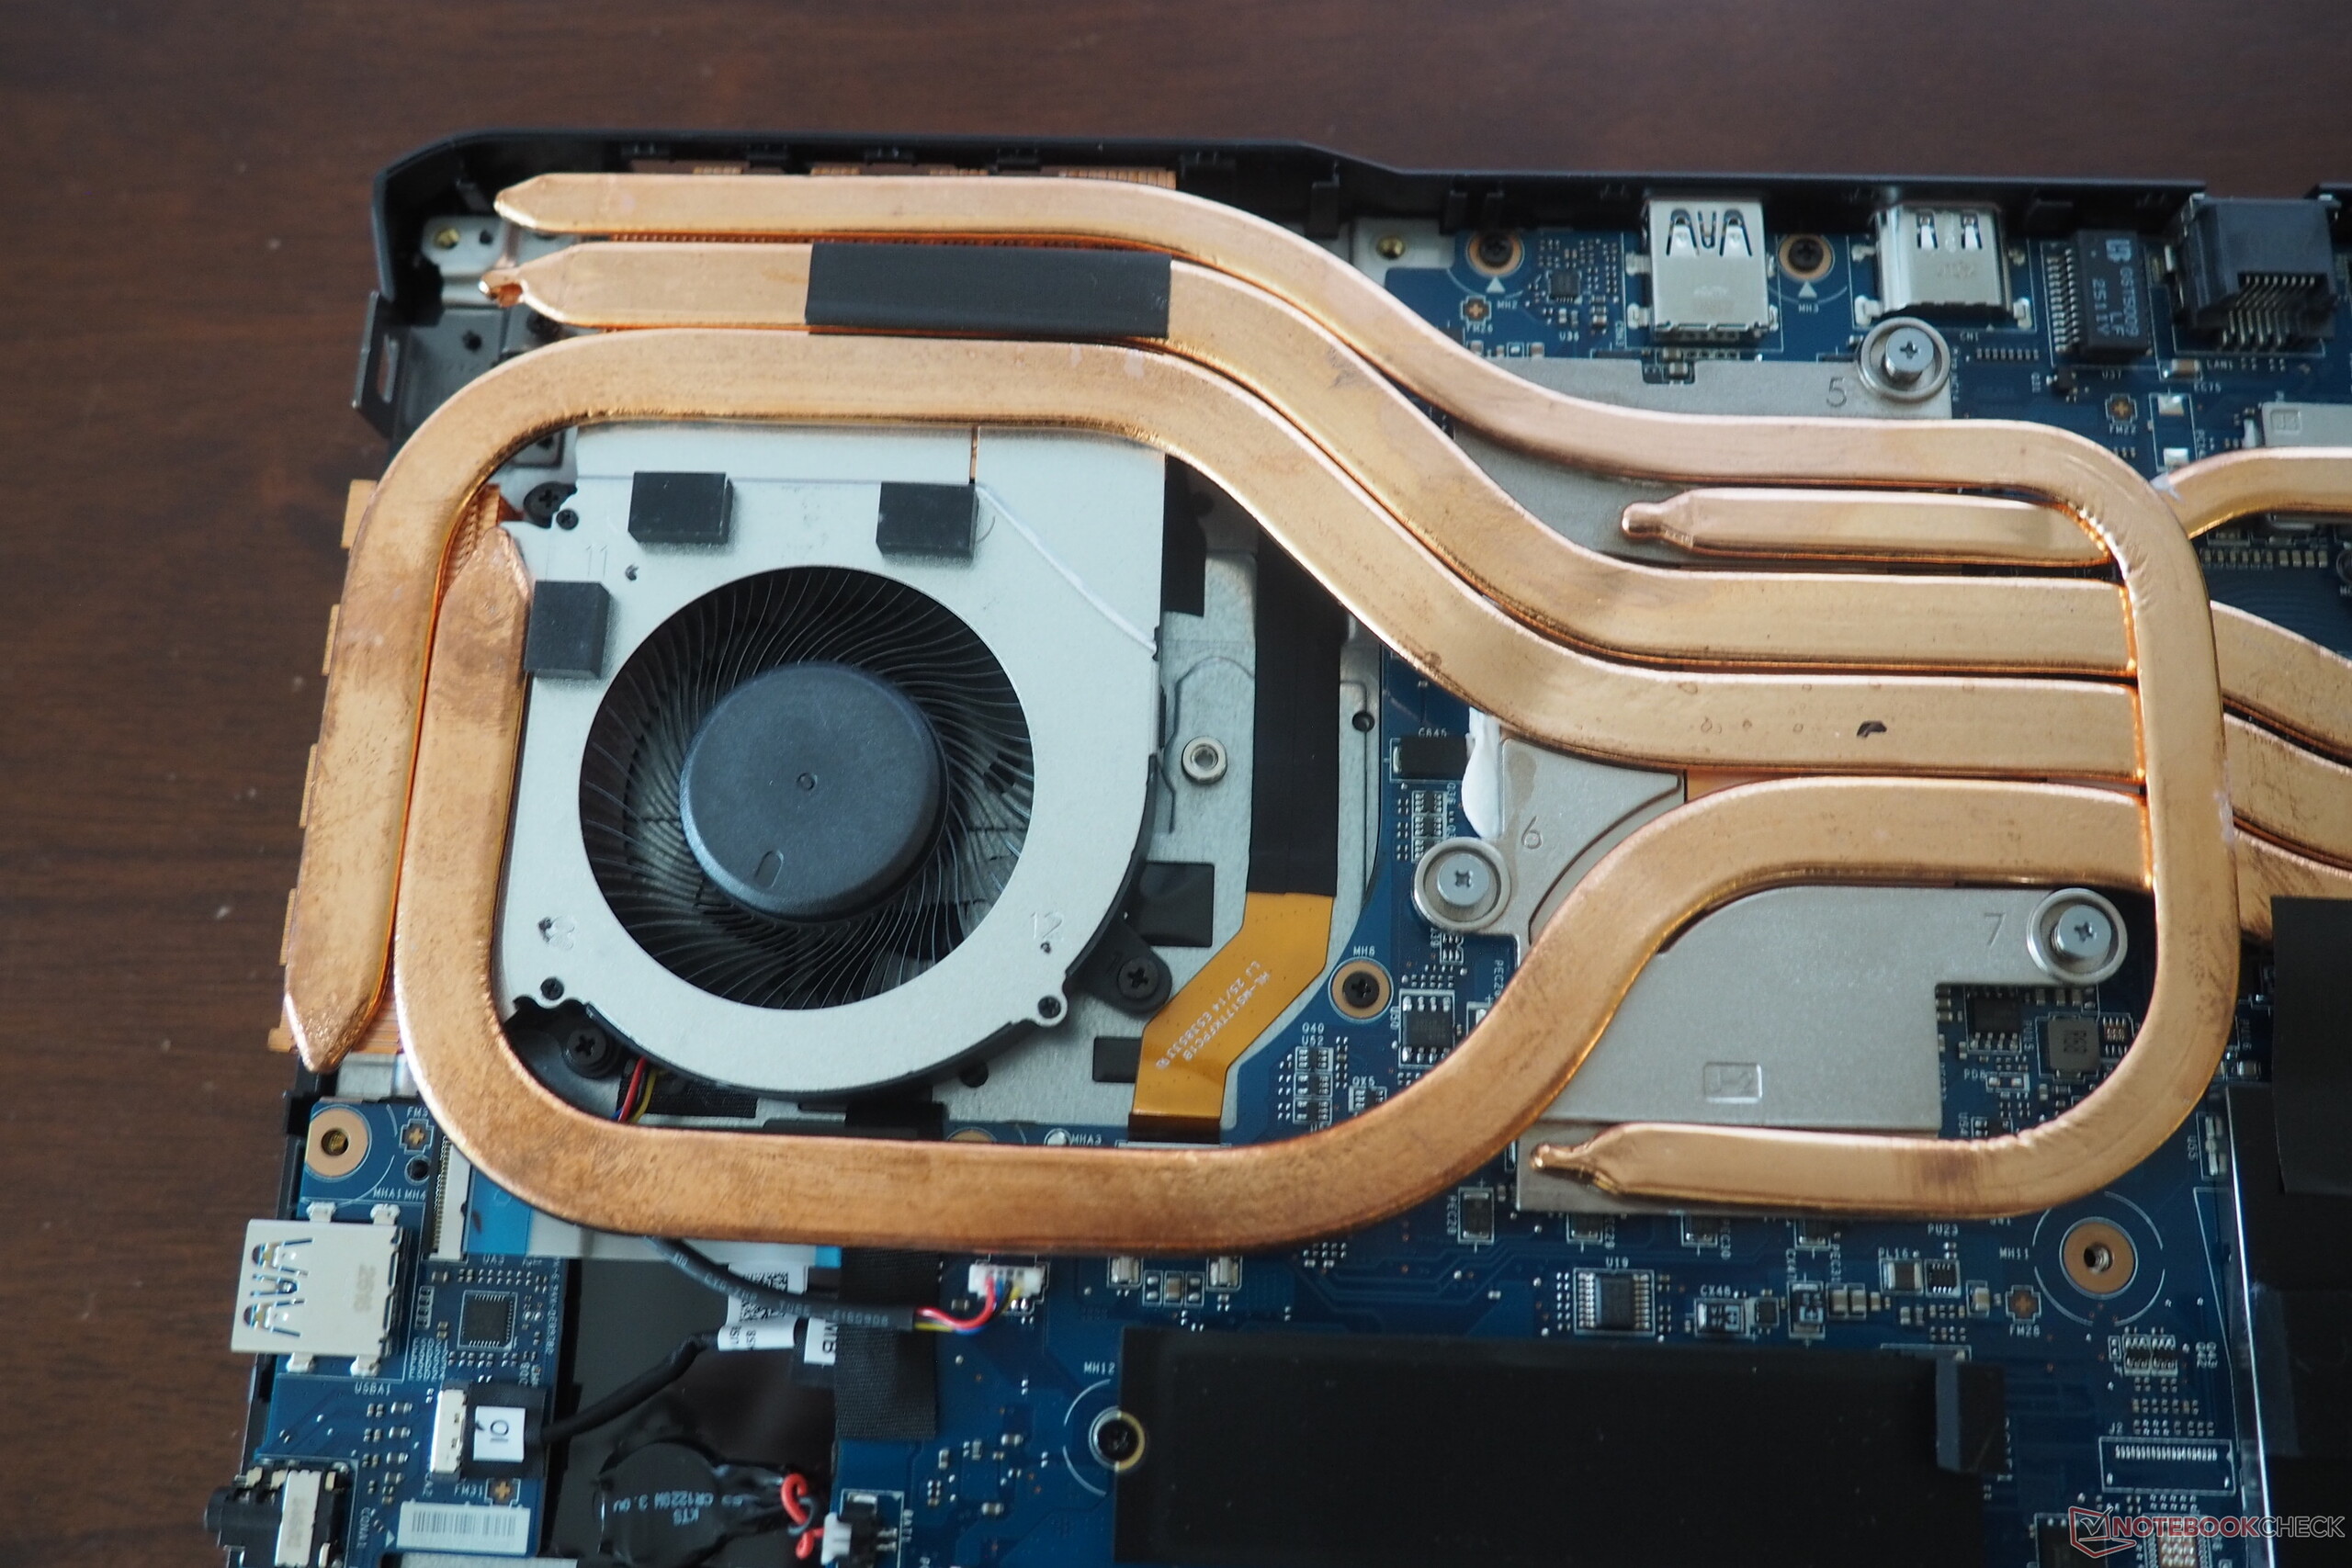
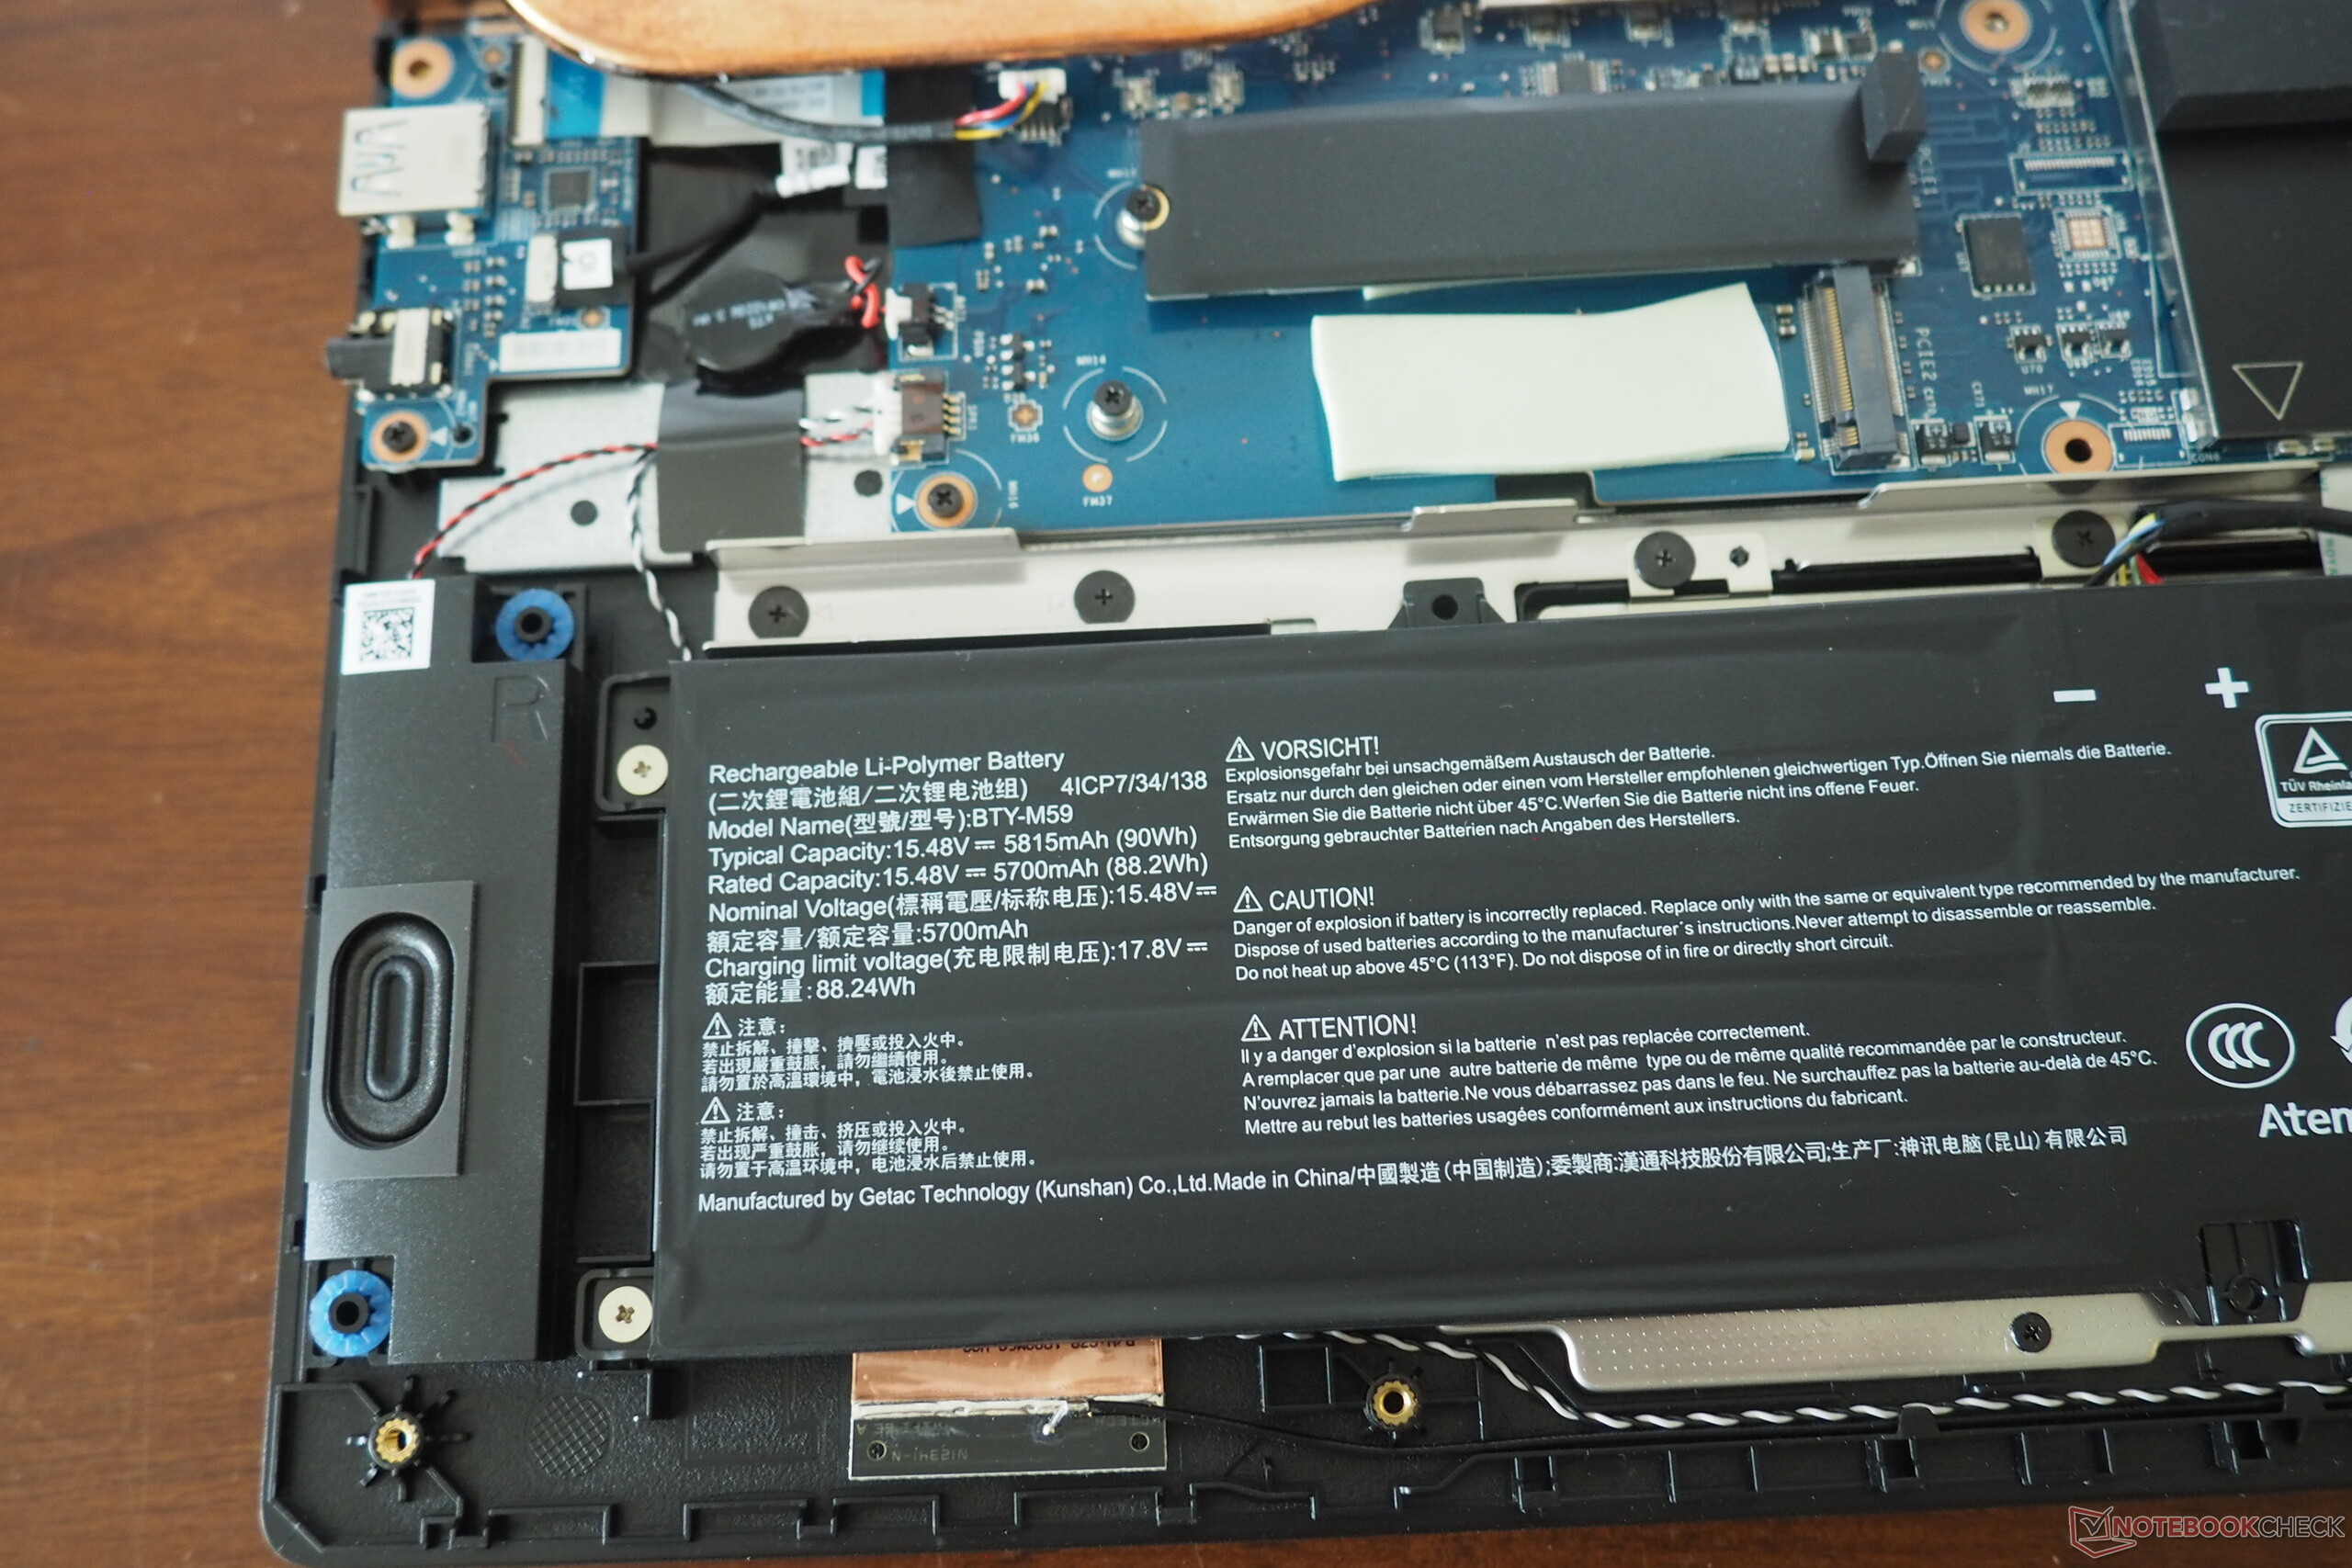
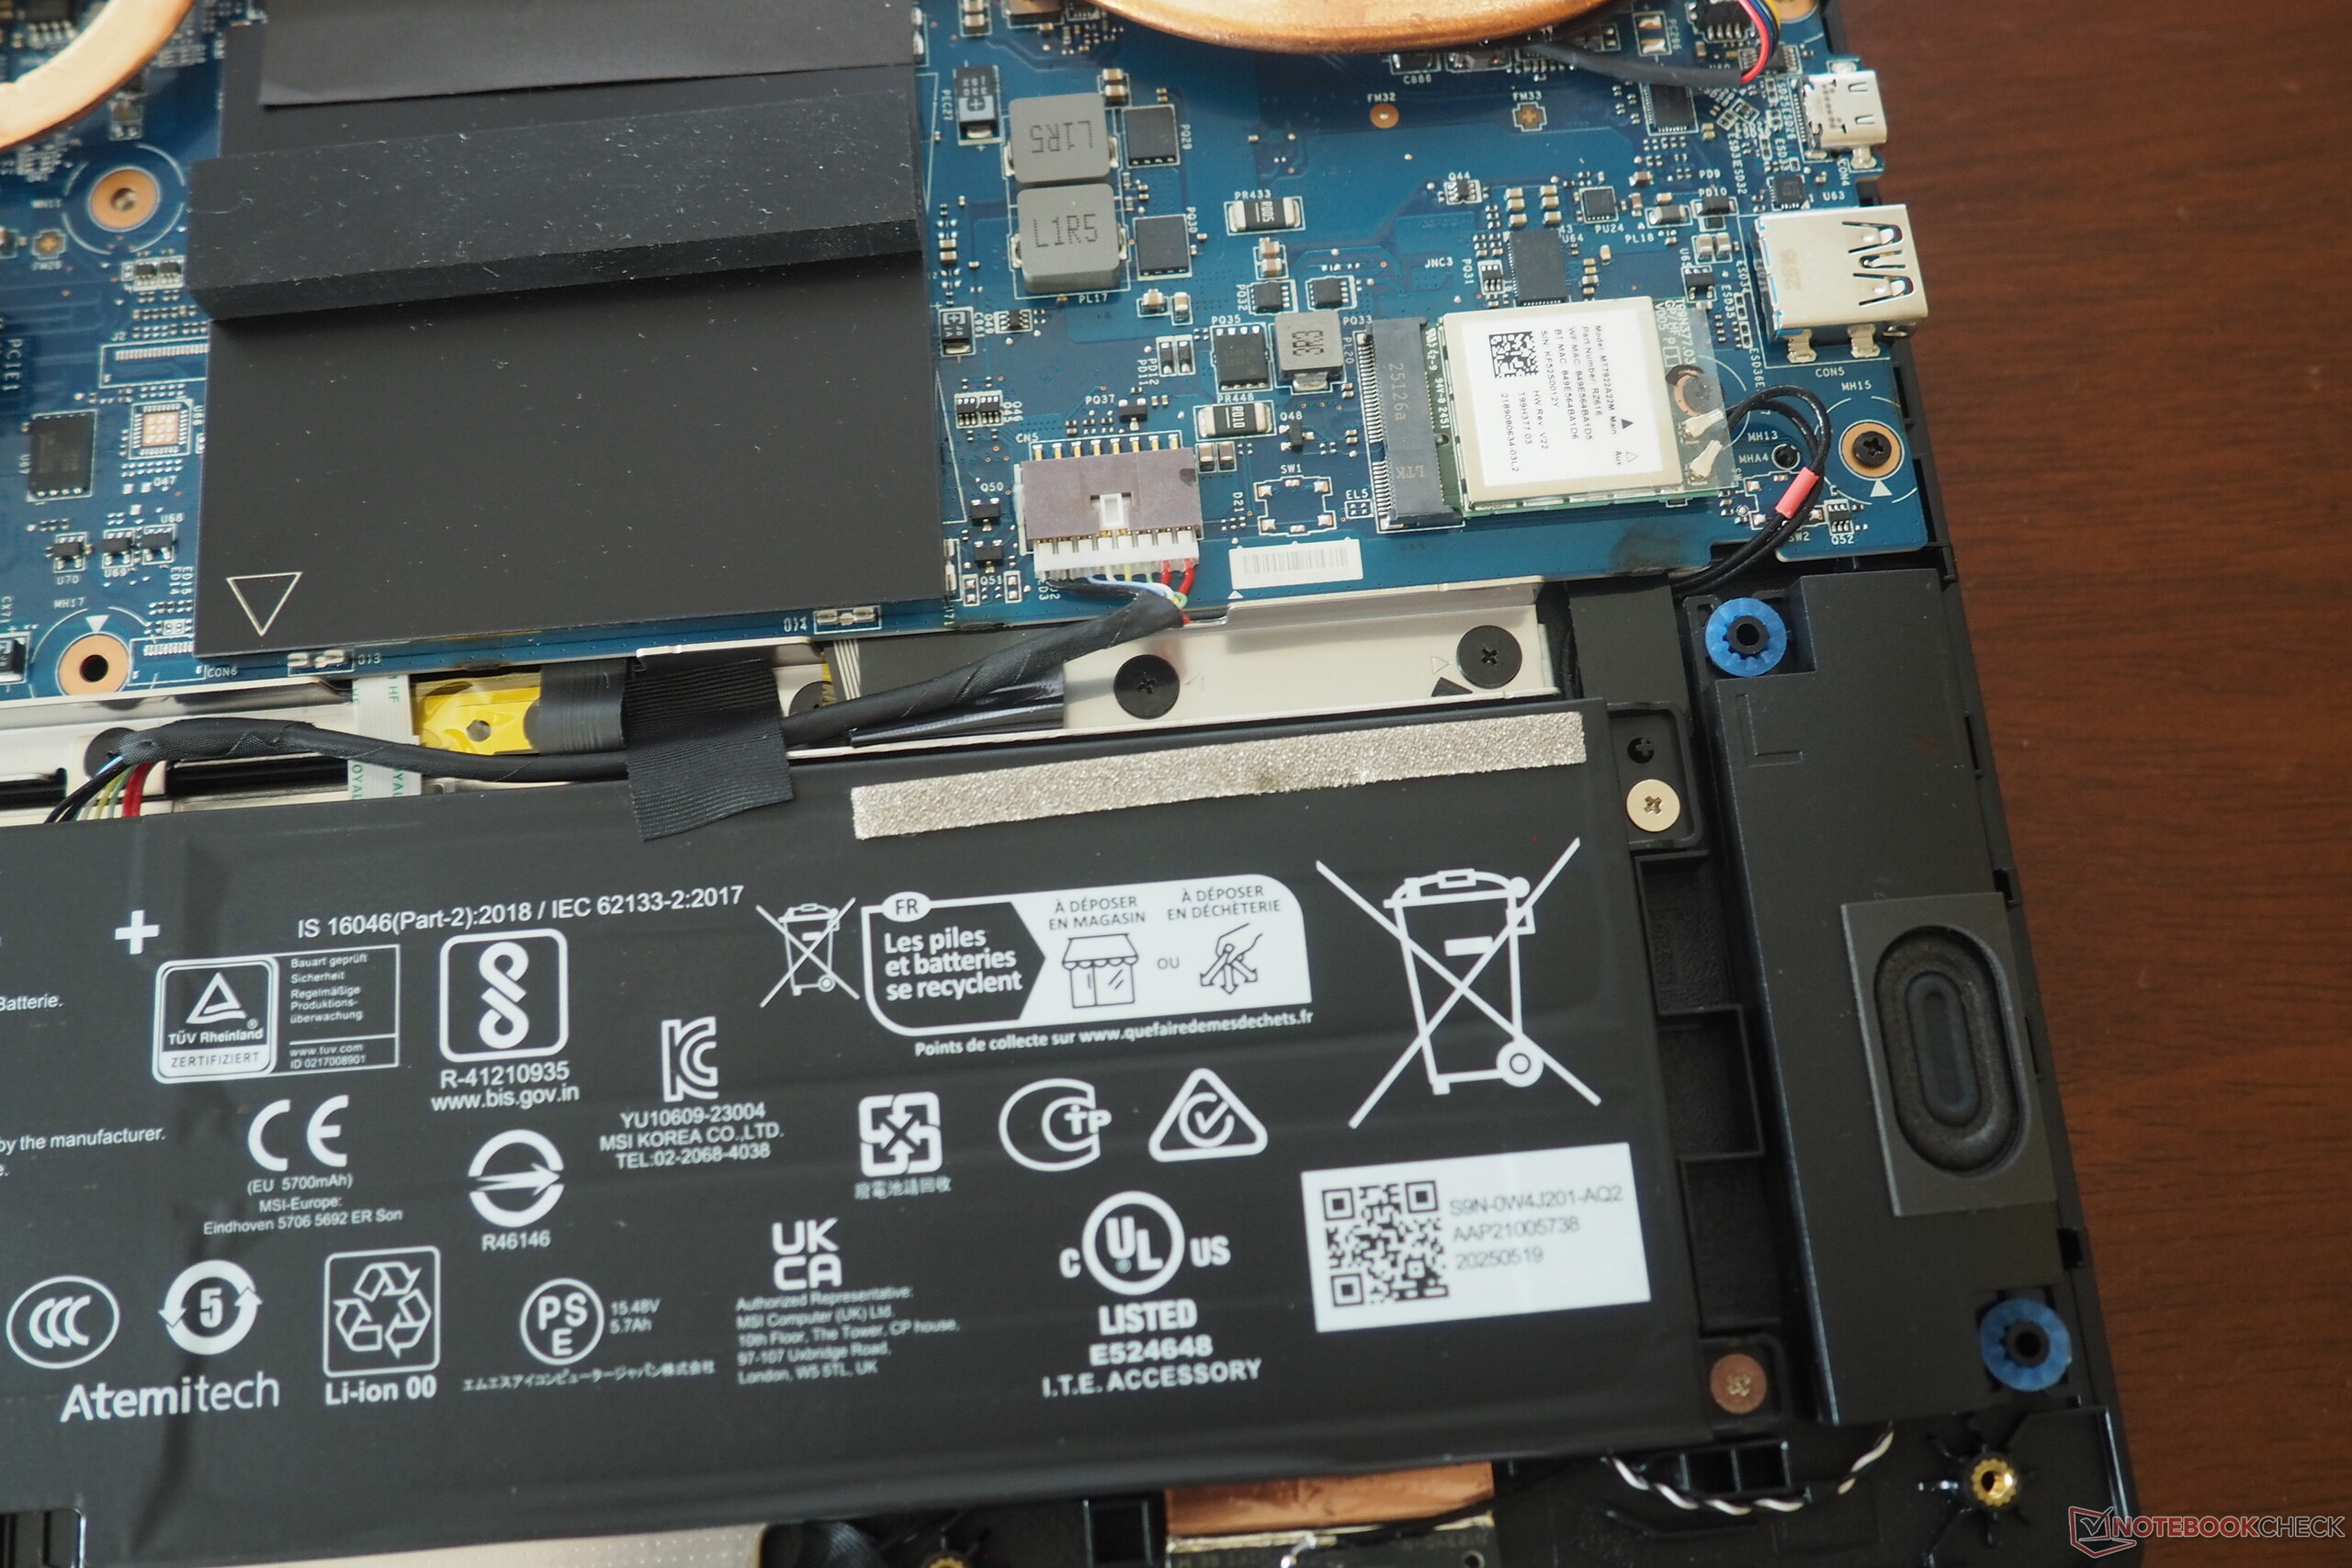
这款游戏笔记本电脑没有现代的 USB 4 或 Thunderbolt 接口。微星的四个可用 USB 端口依赖于过时的 3.2 Gen2 标准,不过 Type-C 端口至少支持 DisplayPort 和 PowerDelivery 3.0。连接外部显示器的最简单方法是通过 HDMI 2.1。此外,还有一个音频插座、一个千兆 LAN 端口和一个用于安装 Kensington 锁的开口。制造商省略了读卡器。无线通信通过联发科的 Wi-Fi 6E 芯片(型号 RZ616)进行,该芯片性能良好,尤其是在接收数据时。同时,高清网络摄像头的质量有限;除了色彩保真度外,图像清晰度也有待提高。维修 Crosshair A17 需要一点耐心,因为必须先卸下 13 颗十字螺丝,然后才能松开底板。下面是内部结构的照片。
交流
网络摄像头


维护

输入设备
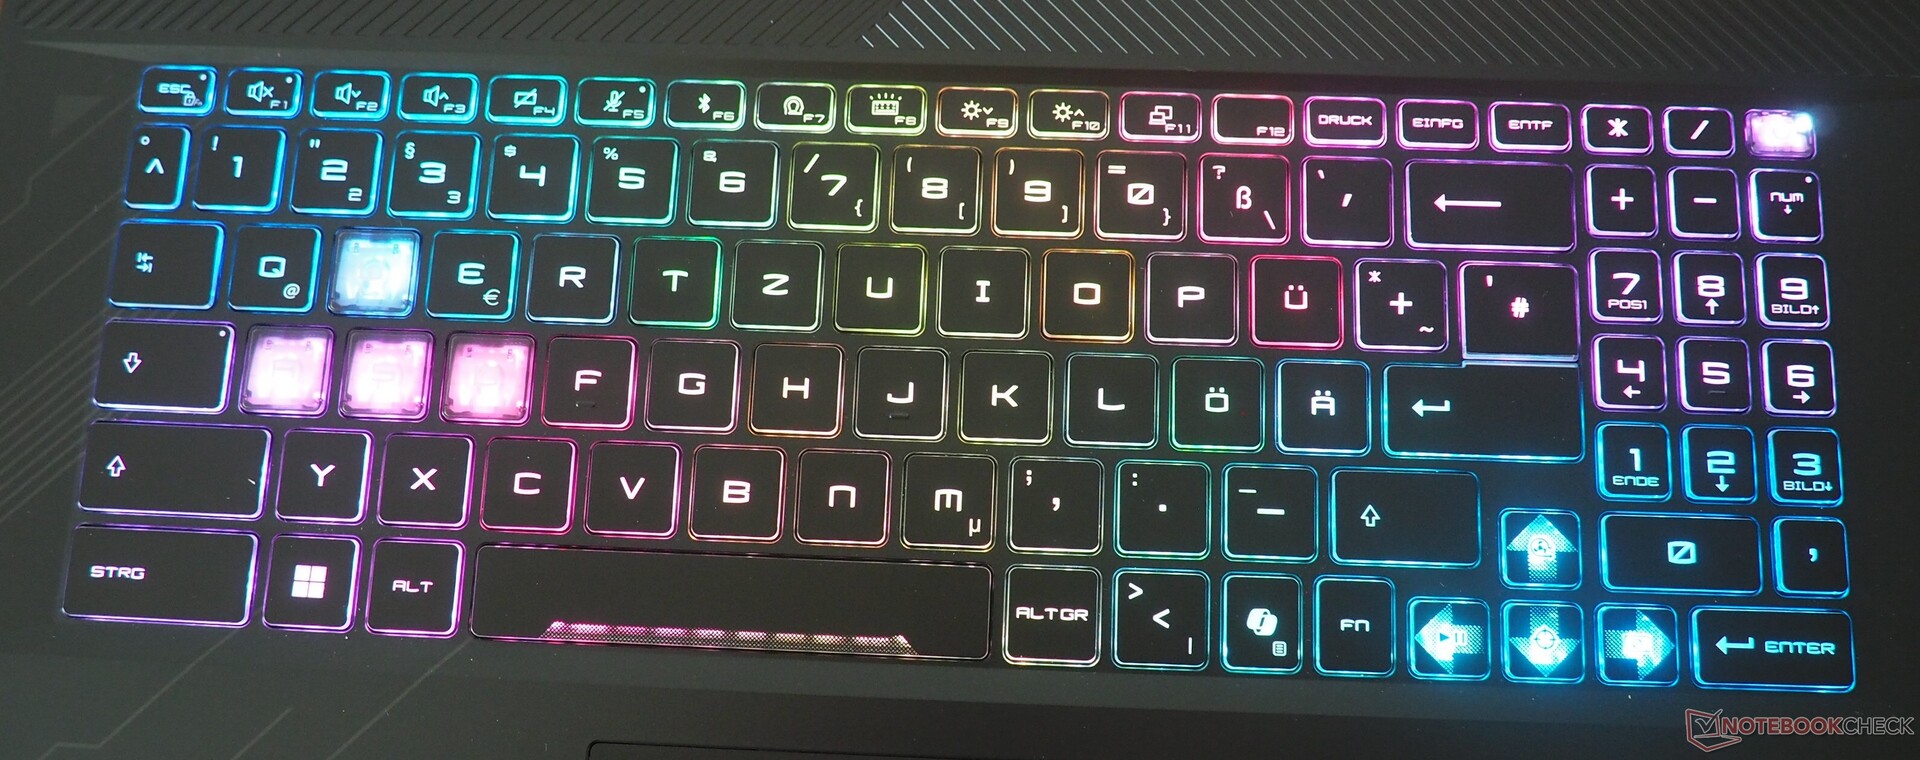
正如开头提到的,微星采用了典型的游戏布局,乍一看还需要适应一下,因为有些按键的位置并不符合通常的标准。三列数字键盘而非四列数字键盘也不一定能让情况变得更容易。不过,这款 17 英寸设备的方向箭头布局合理,给人留下了深刻印象。作为一款橡胶圆顶机型,打字手感尚可。触摸板尺寸约为 12 x 7.5 厘米(约 4.7 x 3 英寸),具有良好的滑动性能和简洁的精确度。不过,点击表面容易发出嘎吱嘎吱的响声,这有点令人遗憾,也有损该设备的品质感。
显示屏
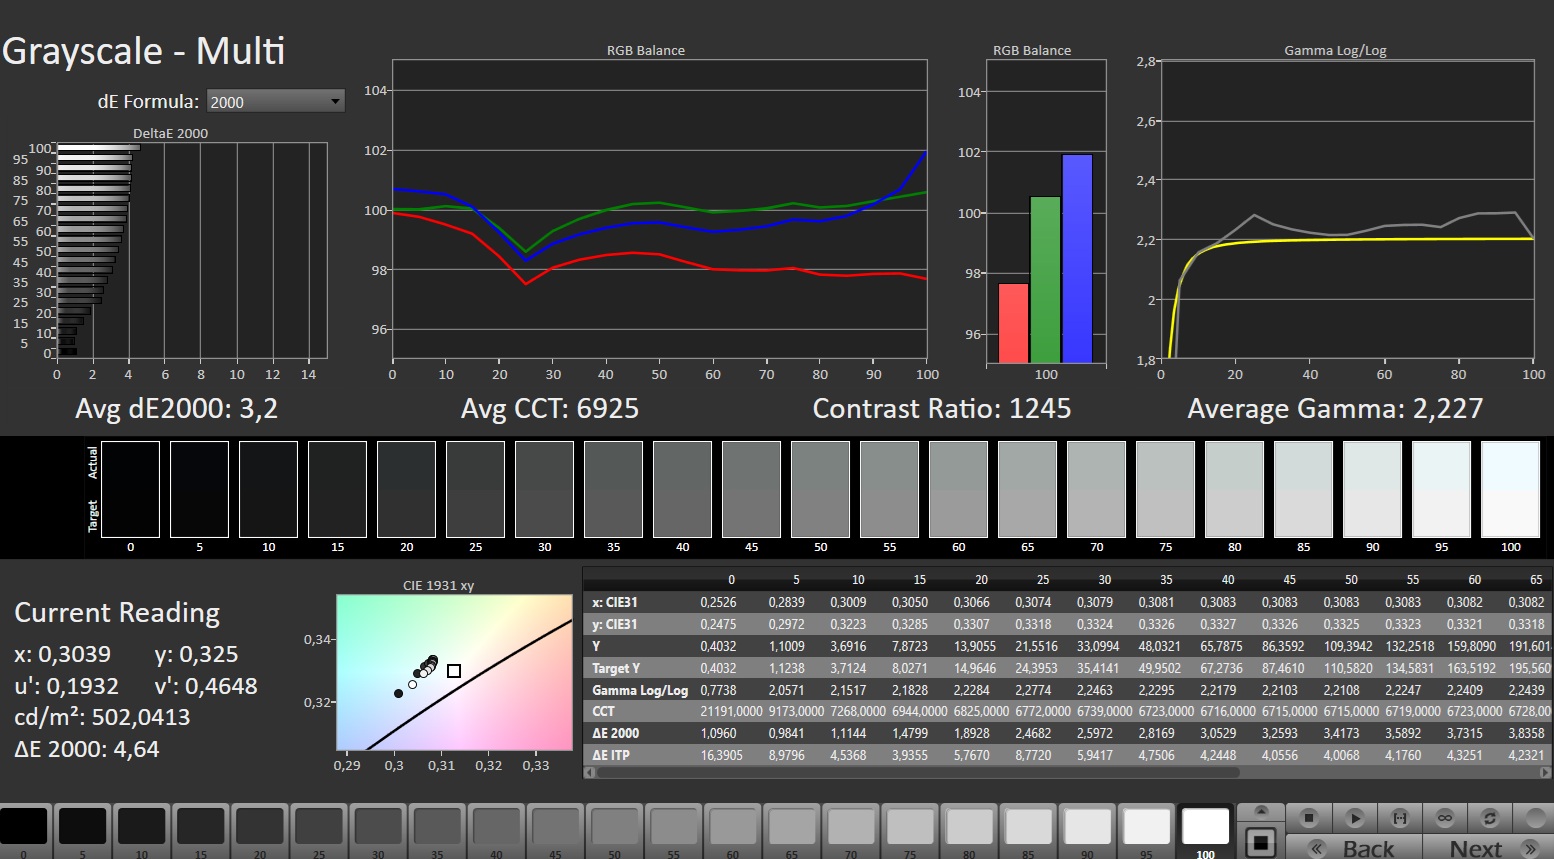
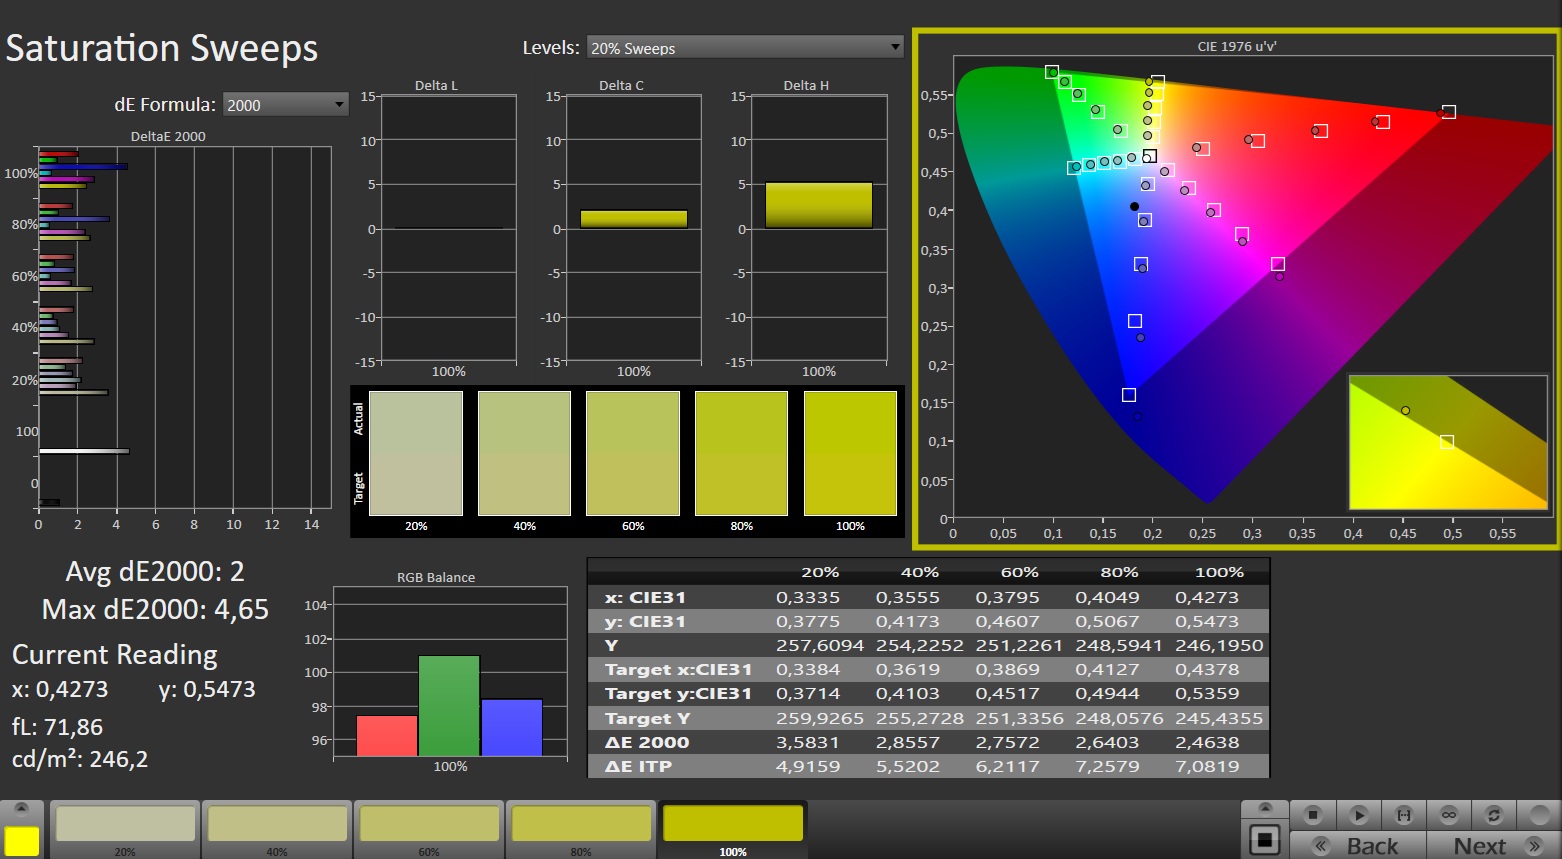
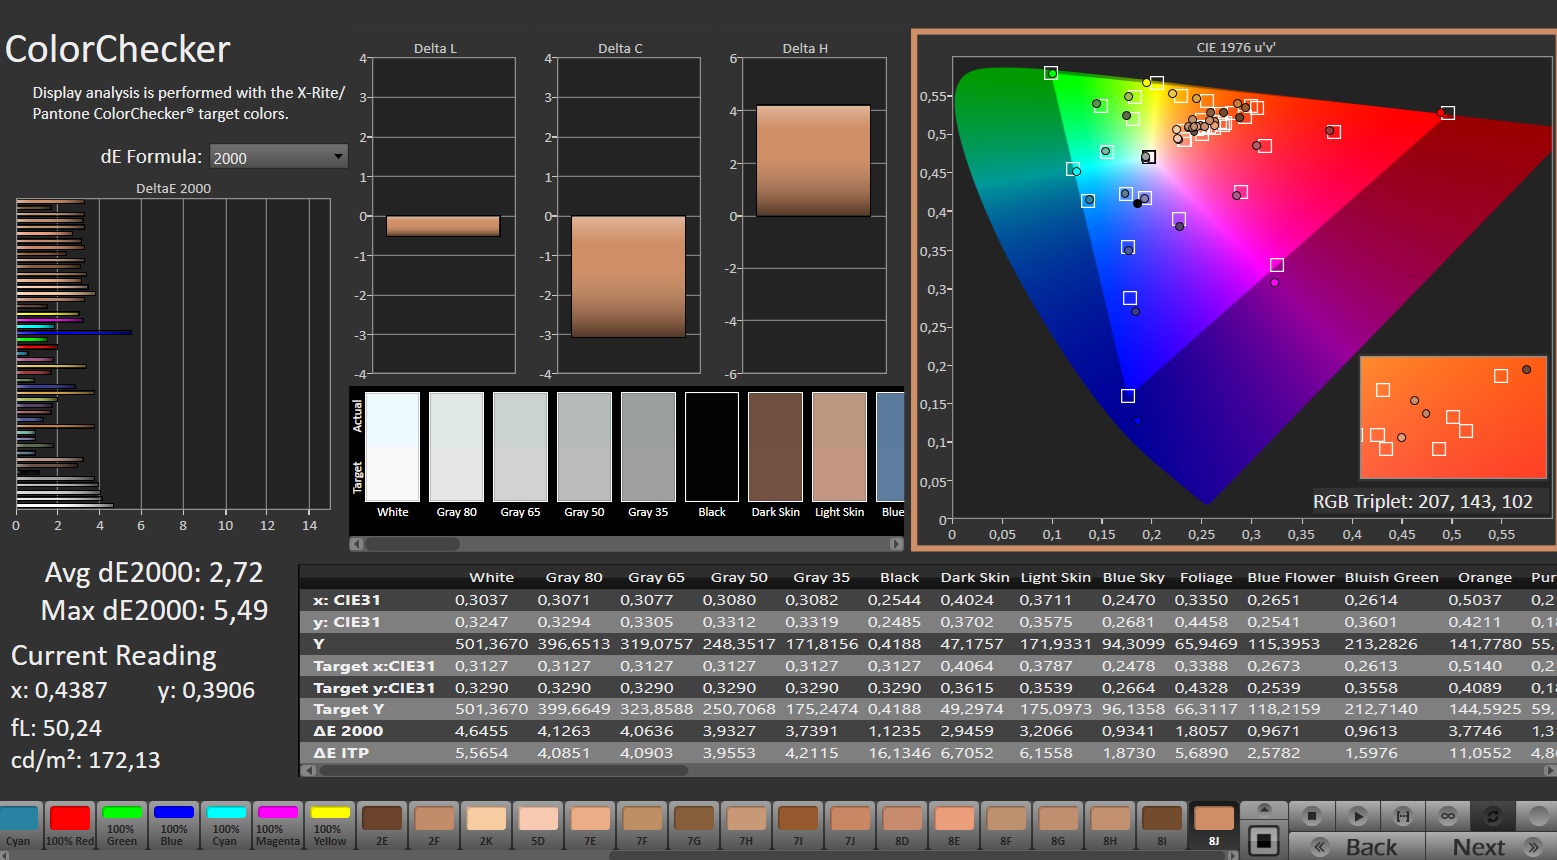
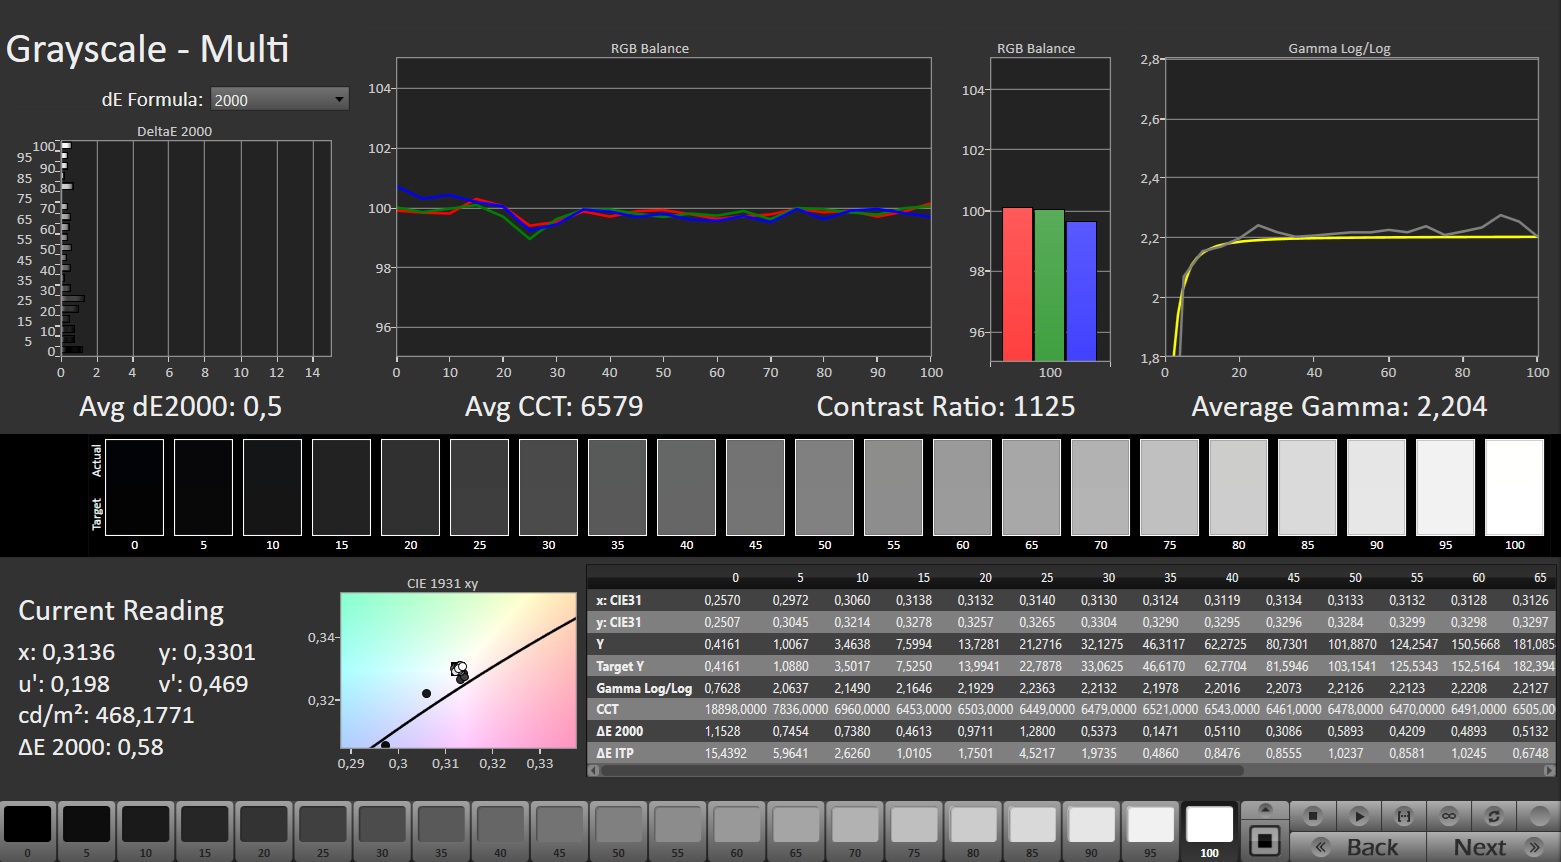
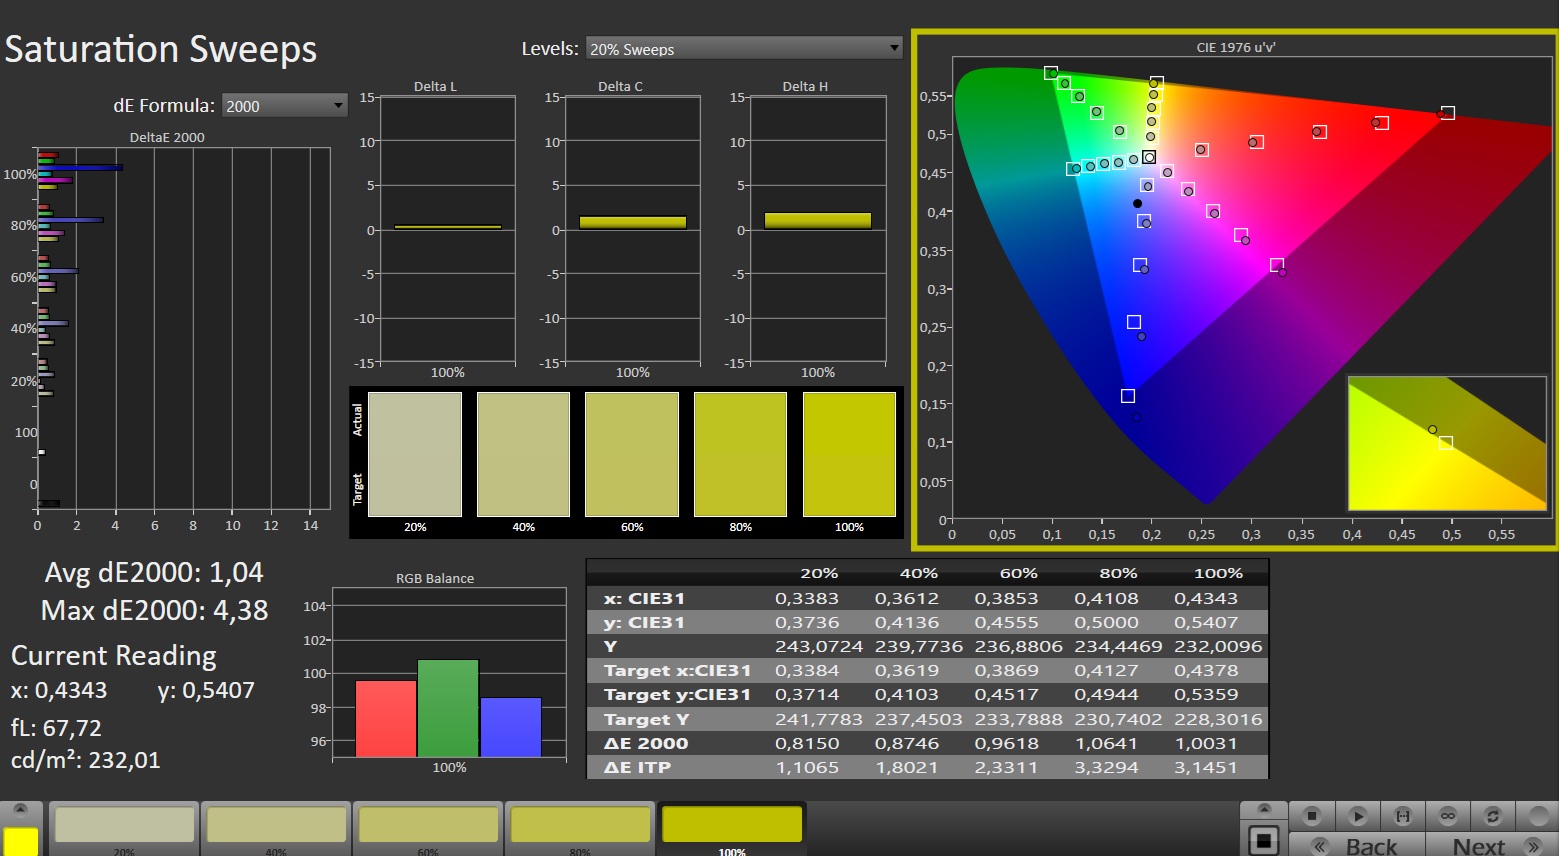
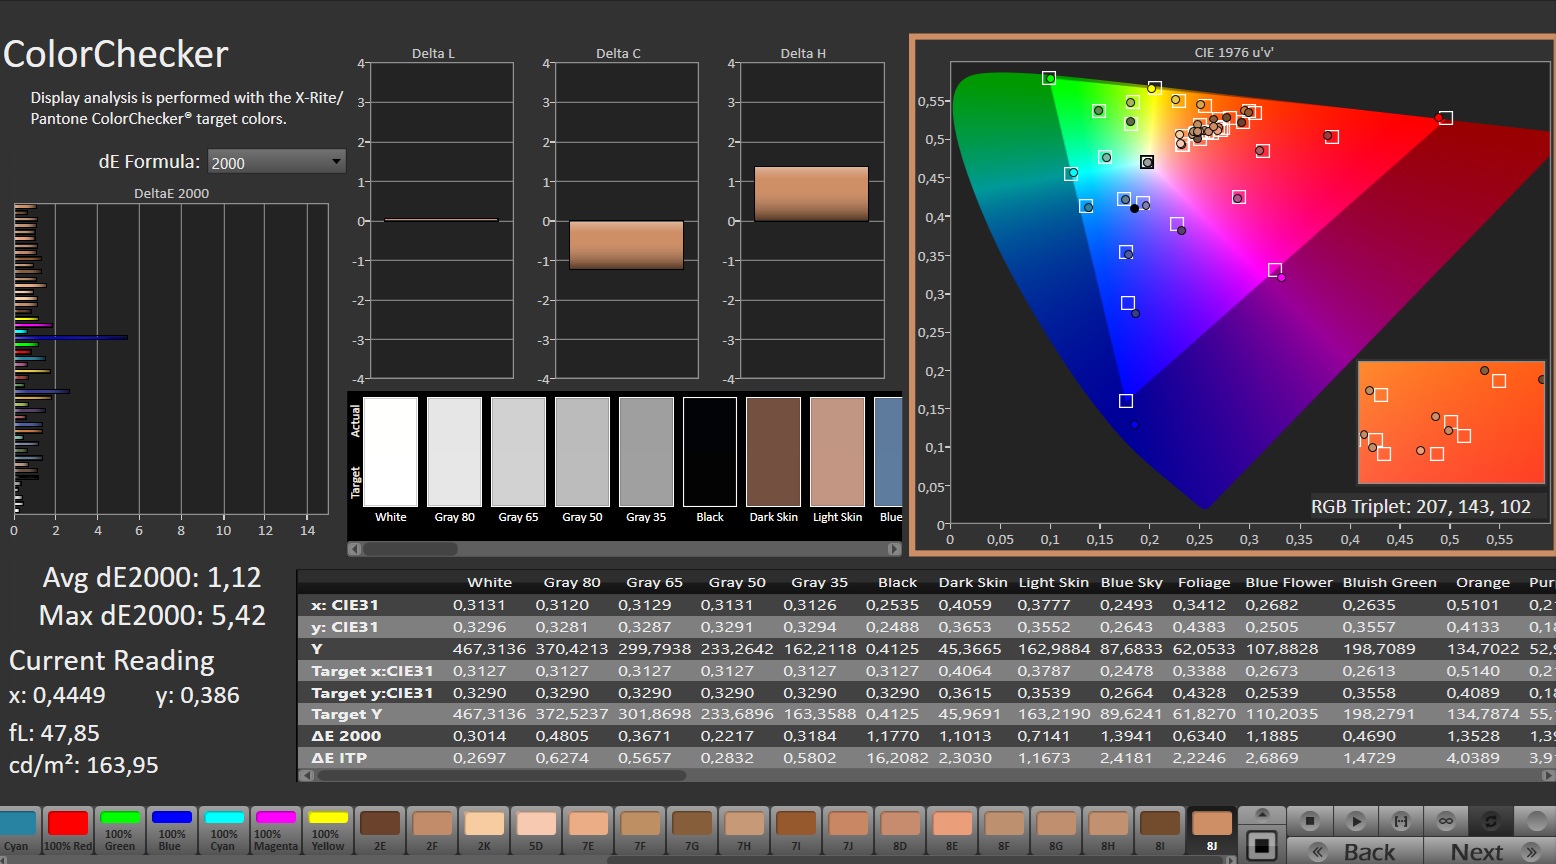
按照 IPS 标准,240 Hz 显示屏的分辨率为 2,560 x 1,600 像素(16:10),显示效果相当不错。首先是色彩空间,几乎 100% 的 DCI-P3 色彩空间不仅能满足游戏玩家的需求。虽然响应时间没有达到 OLED 的水平,但也足够了。我们测试样本的对比度达到了 1178:1,而黑阶(0.4 cd/m²)可能会稍好一些。Crosshair A17 HX 的亮度为 468 cd/m²,高于游戏的平均水平;只有Legion 5 Pro 领先于竞争对手。得益于可用亮度,这款 17 英寸显示器也适用于较明亮的房间,甚至偶尔在室外使用,只要阳光不是太强或直接照射到屏幕上即可。接下来说说色彩保真度,开箱即用的色彩保真度已经相当不错了。相对较好的可视角度使整套配置更加完美,符合通常的 IPS 水平。
| |||||||||||||||||||||||||
Brightness Distribution: 96 %
Center on Battery: 471 cd/m²
Contrast: 1178:1 (Black: 0.4 cd/m²)
ΔE ColorChecker Calman: 2.72 | ∀{0.5-29.43 Ø4.73}
calibrated: 1.12
ΔE Greyscale Calman: 3.2 | ∀{0.09-98 Ø4.97}
84.9% AdobeRGB 1998 (Argyll 3D)
99.9% sRGB (Argyll 3D)
97.1% Display P3 (Argyll 3D)
Gamma: 2.227
CCT: 6925 K
| MSI Crosshair A17 HX D8WGKG B170QAN01.2, IPS, 2560x1600, 17", 240 Hz | MSI Katana 17 HX B14WGK CSOT MNH301CA3-1, IPS, 2560x1440, 17.3", 240 Hz | Aorus Elite 16 AE6H NE160QDM-NYJ, IPS, 2560x1600, 16", 165 Hz | Lenovo Legion 5 Pro 16IAX10H ATNA60HS01-0 (Samsung SDC420A), OLED, 2560x1600, 16", 165 Hz | MSI Vector 16 HX AI A2XWHG B160QAN02.3 (AUO7DB2), IPS, 2560x1600, 16", 240 Hz | |
|---|---|---|---|---|---|
| Display | 2% | -14% | 5% | -1% | |
| Display P3 Coverage (%) | 97.1 | 97.3 0% | 70.8 -27% | 99.9 3% | 96.6 -1% |
| sRGB Coverage (%) | 99.9 | 99.6 0% | 99.8 0% | 100 0% | 99.8 0% |
| AdobeRGB 1998 Coverage (%) | 84.9 | 89 5% | 72.6 -14% | 94.1 11% | 84.4 -1% |
| Response Times | 0% | -33% | 80% | 32% | |
| Response Time Grey 50% / Grey 80% * (ms) | 13.3 ? | 5.2 ? 61% | 16.8 ? -26% | 2 ? 85% | 4.3 ? 68% |
| Response Time Black / White * (ms) | 5.7 ? | 9.2 ? -61% | 7.9 ? -39% | 1.4 ? 75% | 6 ? -5% |
| PWM Frequency (Hz) | 1300 | ||||
| PWM Amplitude * (%) | 16.7 | ||||
| Screen | 5% | -23% | -7% | -12% | |
| Brightness middle (cd/m²) | 471 | 296 -37% | 443 -6% | 518 10% | 473 0% |
| Brightness (cd/m²) | 468 | 272 -42% | 433 -7% | 522 12% | 426 -9% |
| Brightness Distribution (%) | 96 | 87 -9% | 90 -6% | 97 1% | 85 -11% |
| Black Level * (cd/m²) | 0.4 | 0.27 32% | 0.42 -5% | 0.42 -5% | |
| Contrast (:1) | 1178 | 1096 -7% | 1055 -10% | 1126 -4% | |
| Colorchecker dE 2000 * | 2.72 | 1.35 50% | 3.82 -40% | 2.49 8% | 3.47 -28% |
| Colorchecker dE 2000 max. * | 5.49 | 4.76 13% | 7.61 -39% | 5.25 4% | 7.24 -32% |
| Colorchecker dE 2000 calibrated * | 1.12 | 0.78 30% | 1.33 -19% | 2.15 -92% | 1.36 -21% |
| Greyscale dE 2000 * | 3.2 | 2.7 16% | 5.5 -72% | 3.02 6% | 3.1 3% |
| Gamma | 2.227 99% | 2.201 100% | 2.249 98% | 2.37 93% | 2.486 88% |
| CCT | 6925 94% | 6770 96% | 6549 99% | 6426 101% | 6832 95% |
| Total Average (Program / Settings) | 2% /
4% | -23% /
-22% | 26% /
10% | 6% /
-3% |
* ... smaller is better


Display Response Times
| ↔ Response Time Black to White | ||
|---|---|---|
| 5.7 ms ... rise ↗ and fall ↘ combined | ↗ 1.7 ms rise | 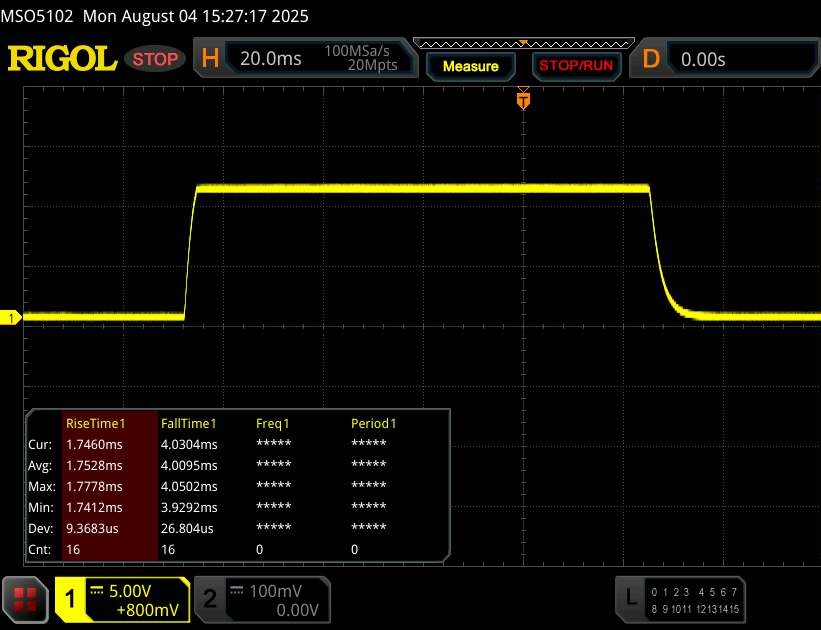 |
| ↘ 4 ms fall | ||
| The screen shows very fast response rates in our tests and should be very well suited for fast-paced gaming. In comparison, all tested devices range from 0.1 (minimum) to 240 (maximum) ms. » 18 % of all devices are better. This means that the measured response time is better than the average of all tested devices (19.9 ms). | ||
| ↔ Response Time 50% Grey to 80% Grey | ||
| 13.3 ms ... rise ↗ and fall ↘ combined | ↗ 6.3 ms rise | 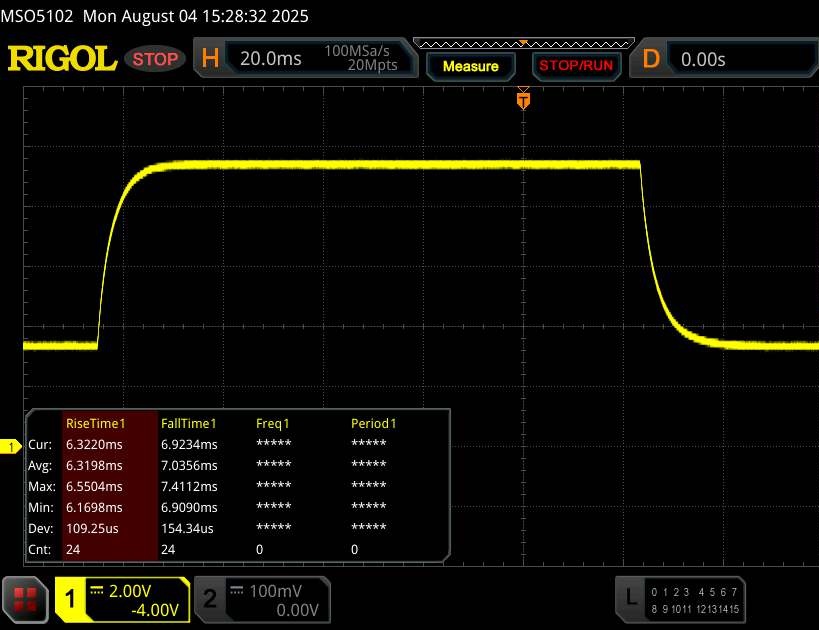 |
| ↘ 7 ms fall | ||
| The screen shows good response rates in our tests, but may be too slow for competitive gamers. In comparison, all tested devices range from 0.165 (minimum) to 636 (maximum) ms. » 27 % of all devices are better. This means that the measured response time is better than the average of all tested devices (31.1 ms). | ||
Screen Flickering / PWM (Pulse-Width Modulation)
| Screen flickering / PWM not detected |  | ||
In comparison: 52 % of all tested devices do not use PWM to dim the display. If PWM was detected, an average of 7794 (minimum: 5 - maximum: 343500) Hz was measured. | |||

性能
性能篇以一系列系统截图开始。
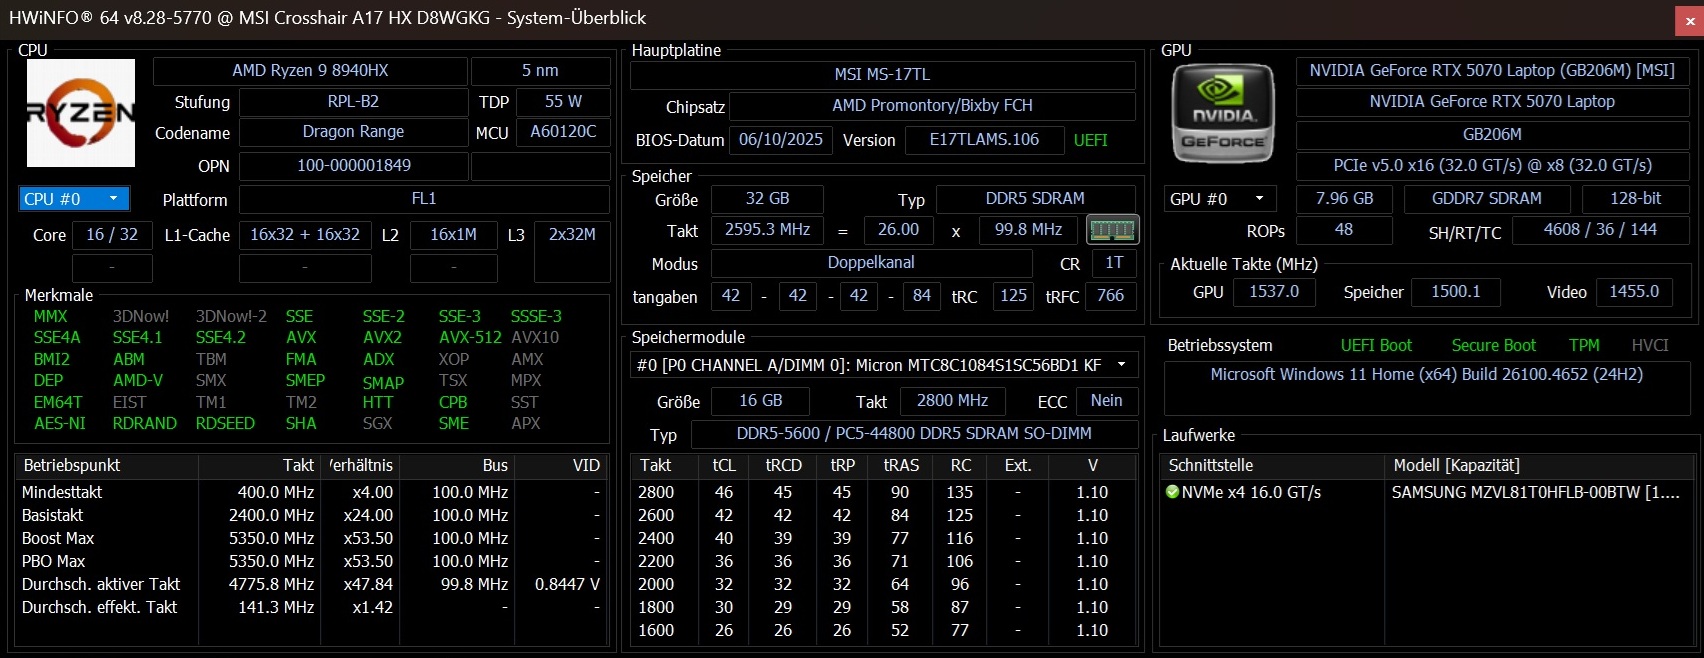
测试条件
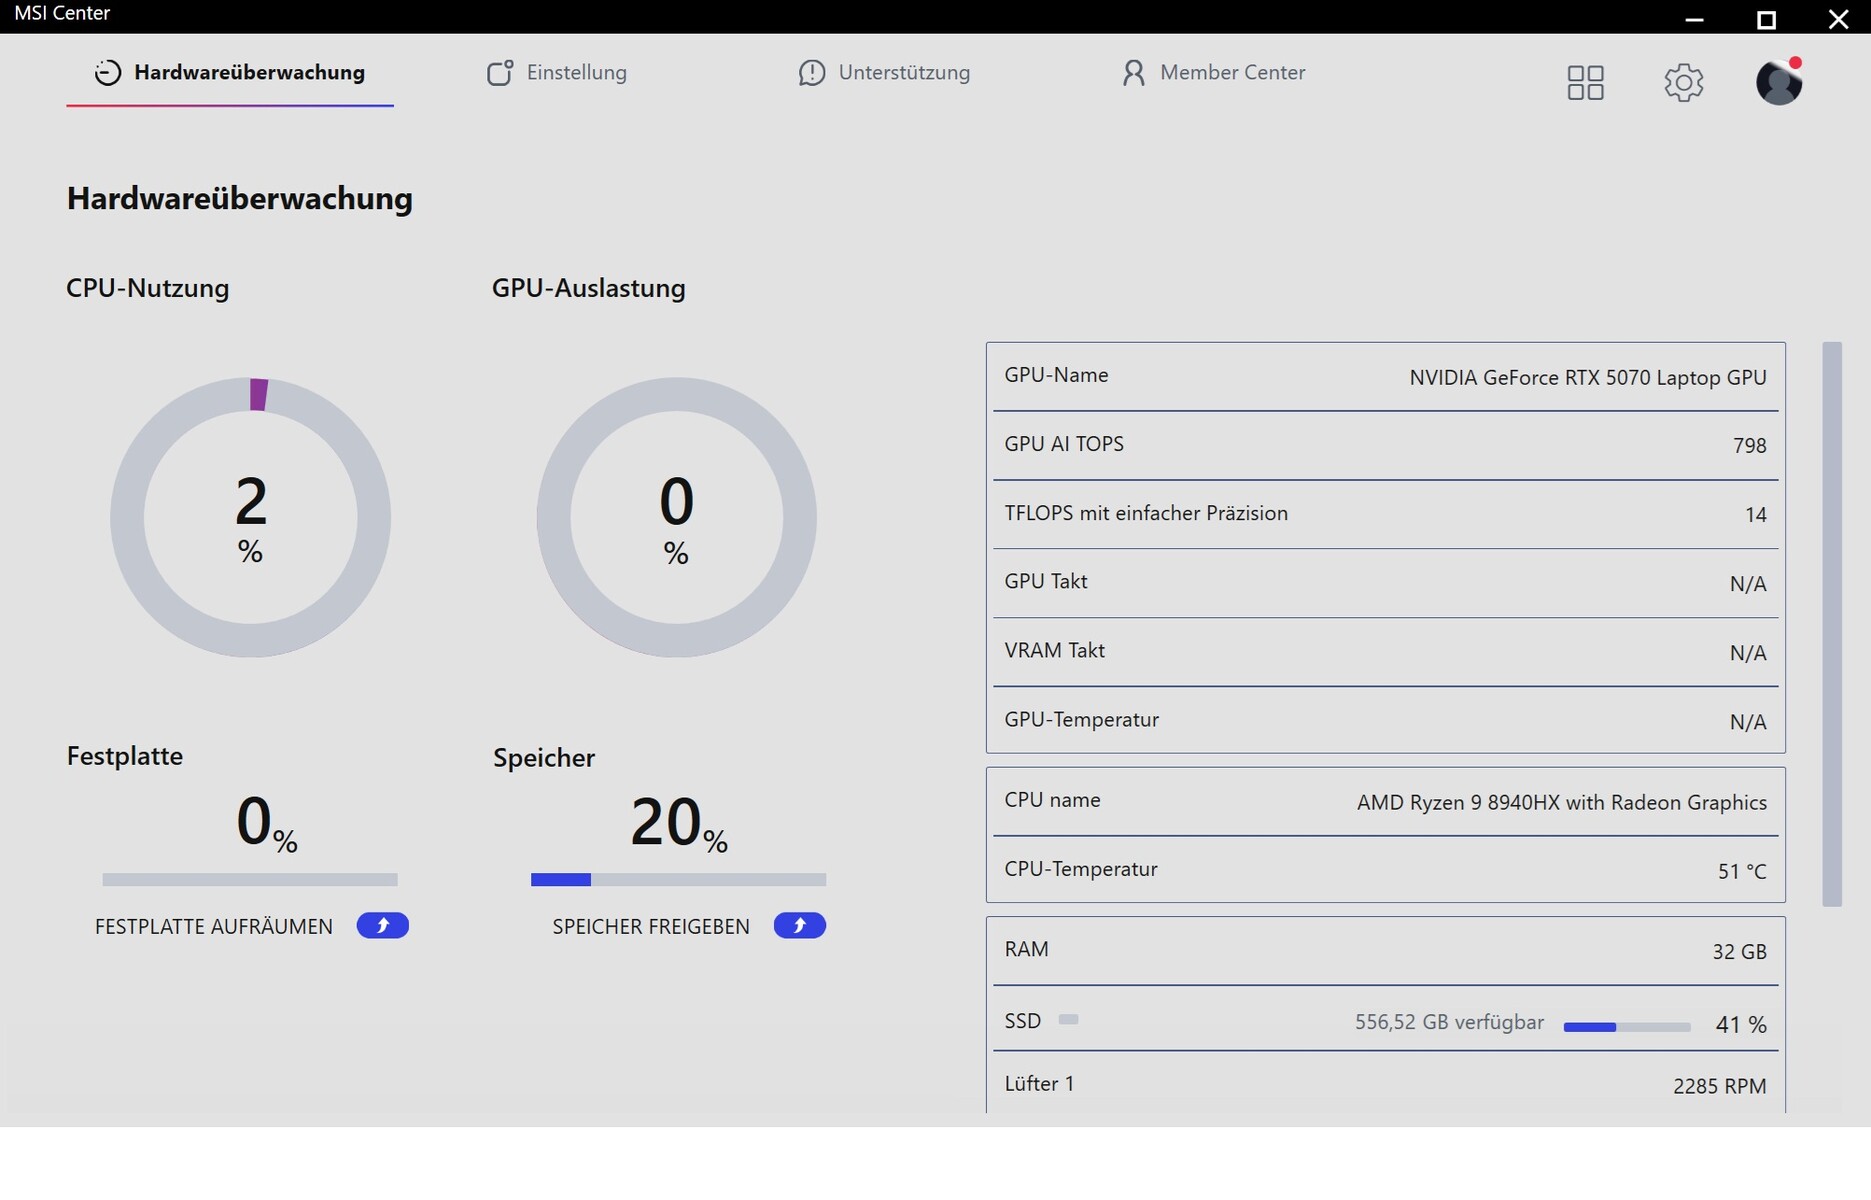
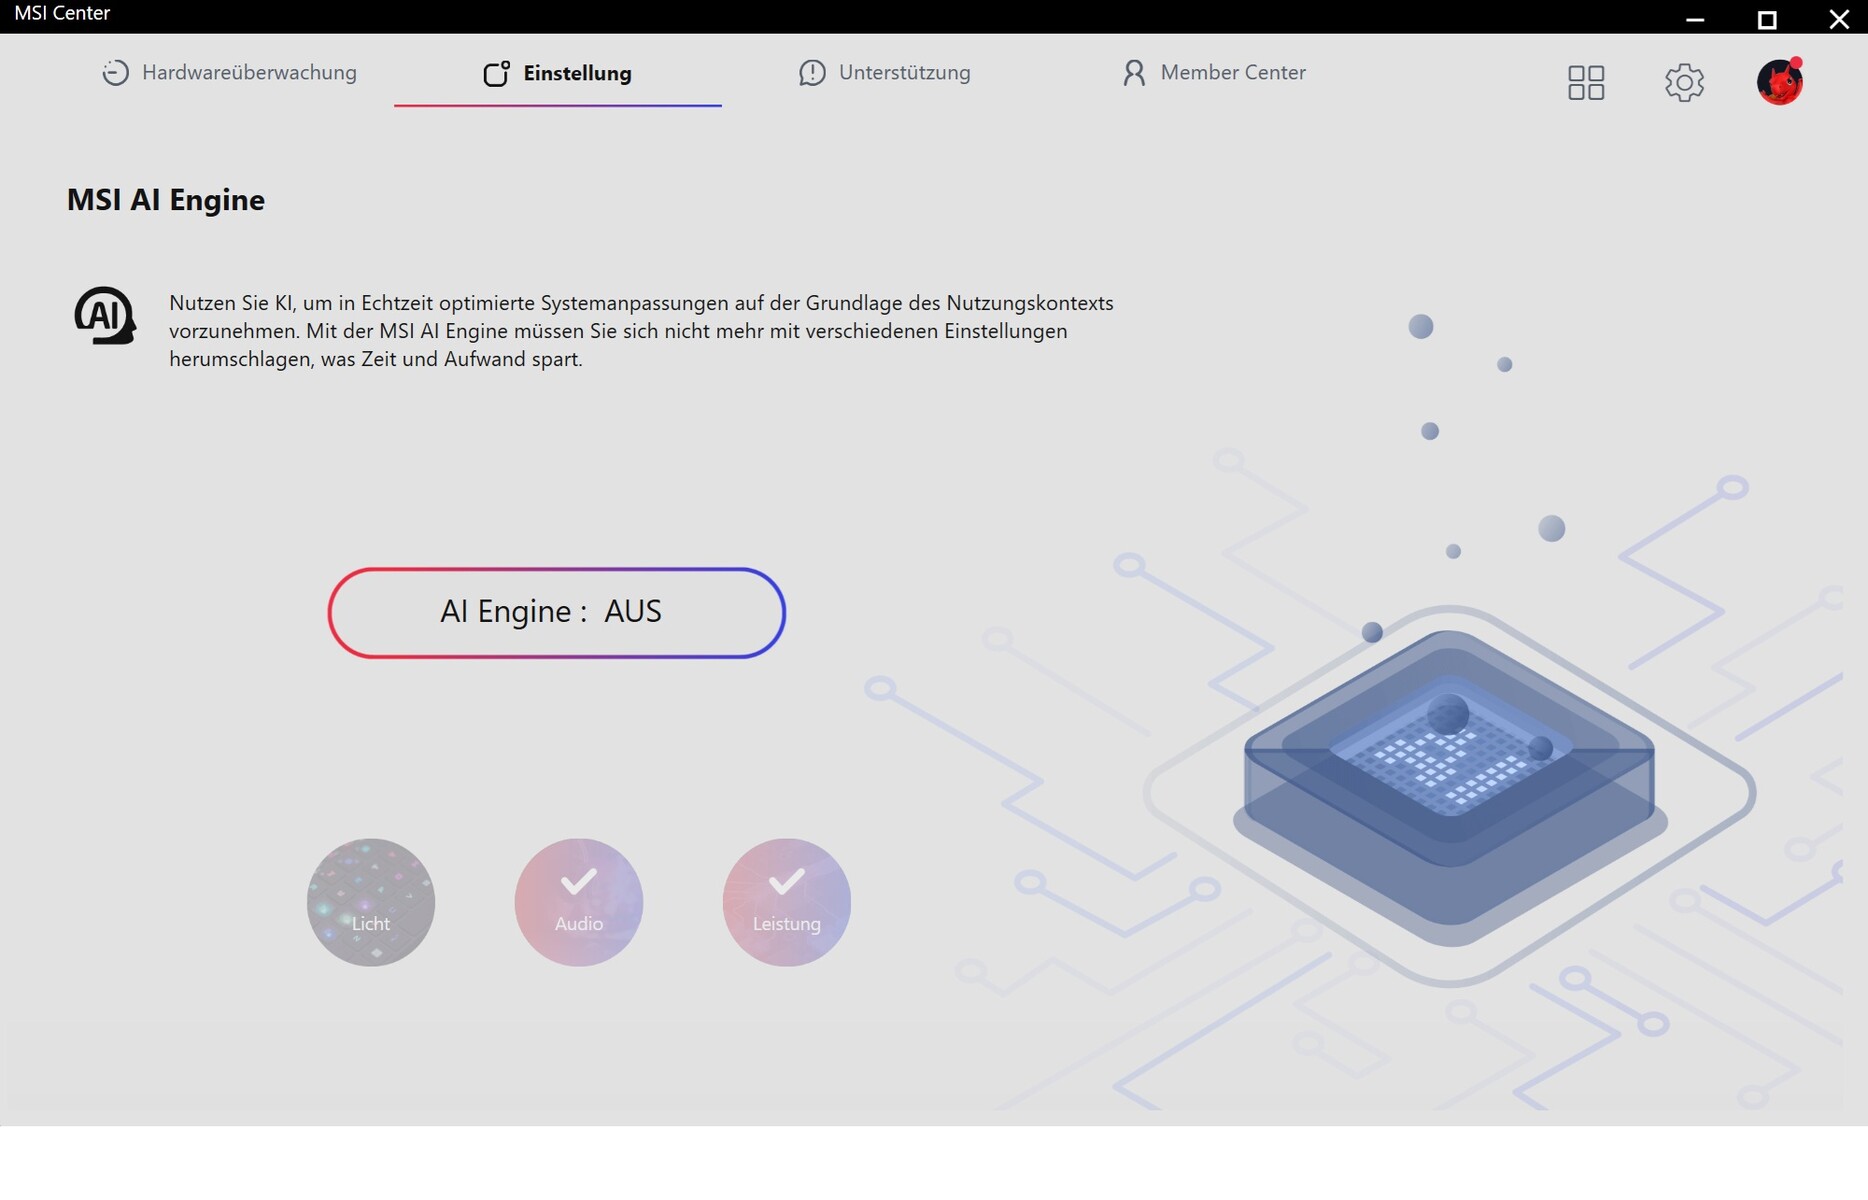
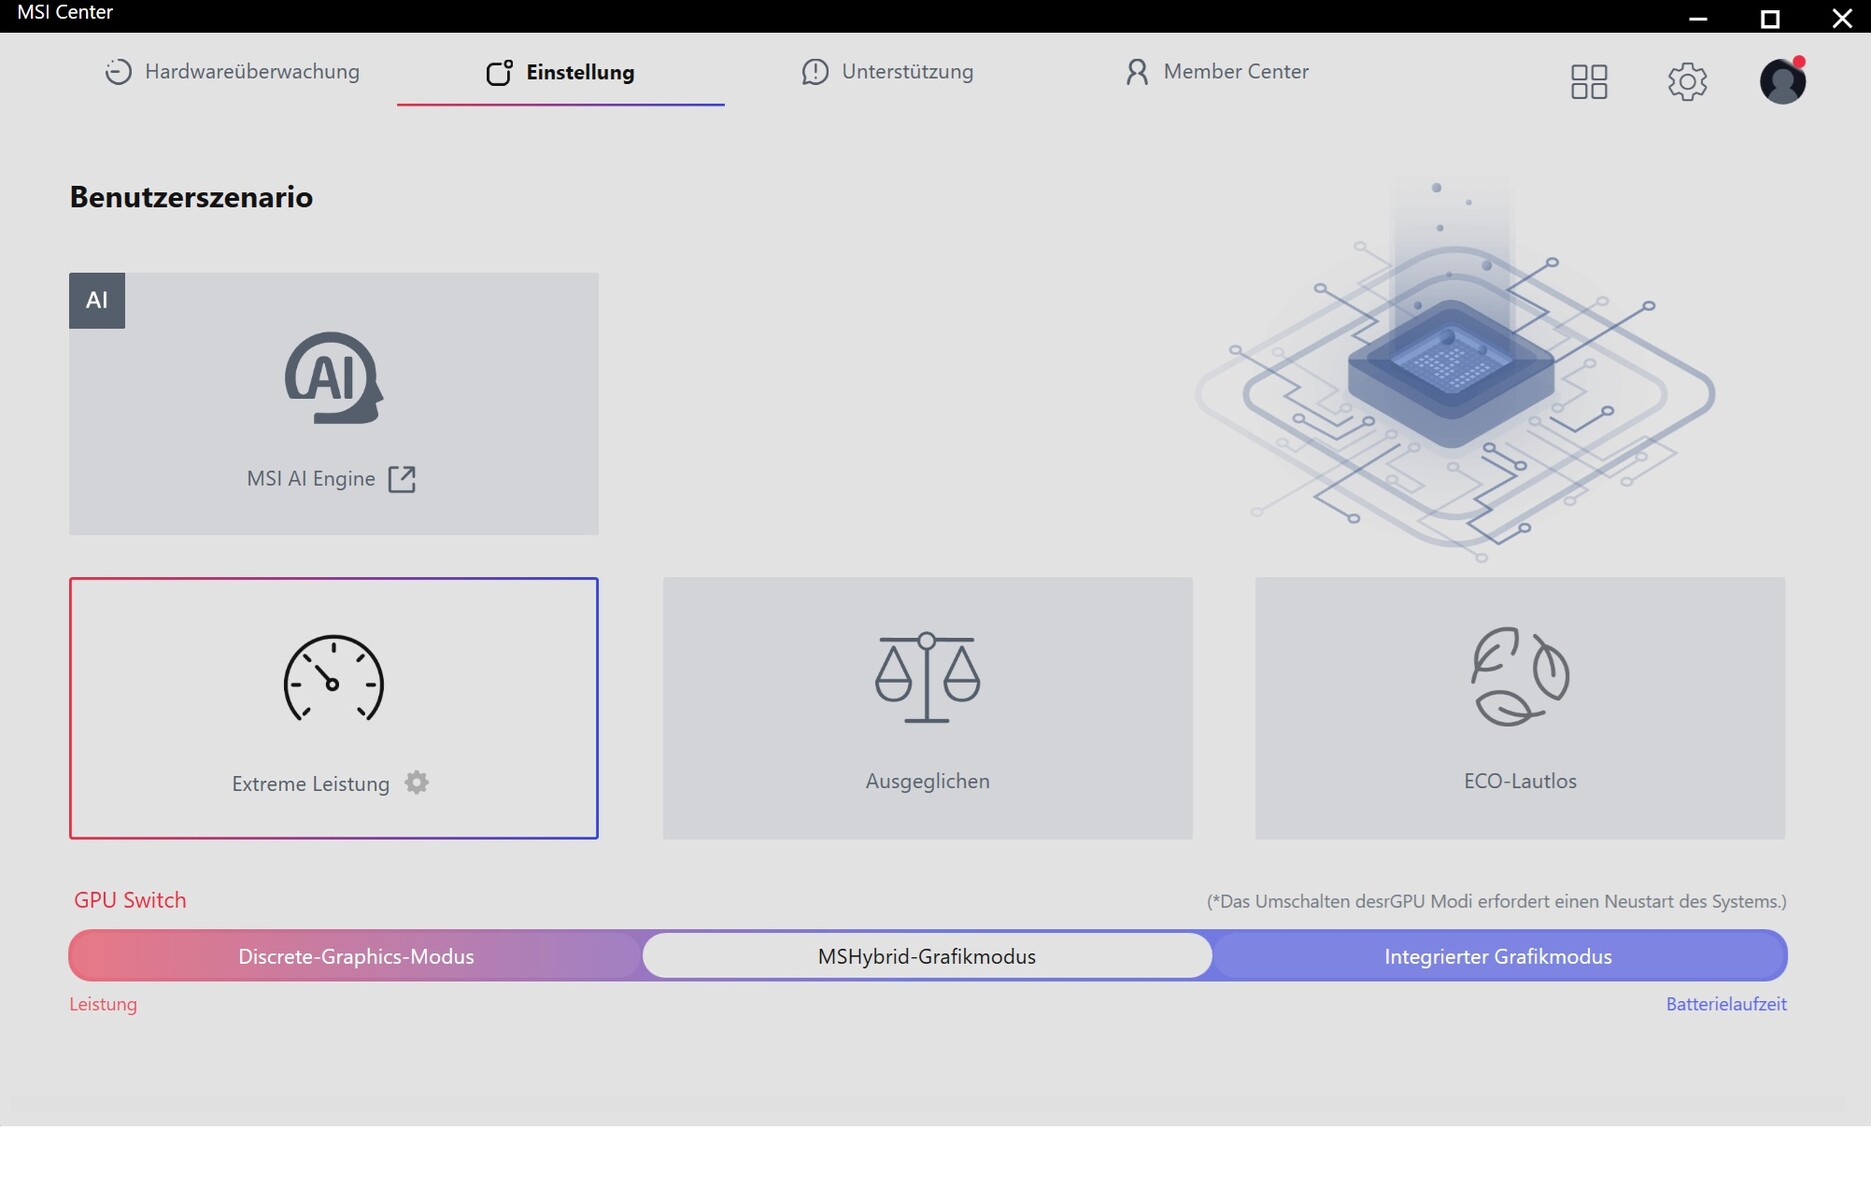
在预装的微星中心中有四种用户场景,从 ECO 静音到 AI 模式不等。我们本想使用后者进行测量,但由于 AI 配置文件不成熟(例如,结果波动和奇怪的风扇行为),因此我们采用了 "极致性能 "场景进行测试,它比 "平衡 "模式提供了明显更多的 CPU 功耗和稍多的 GPU 功耗(见表)。
| 模式 | 极致性能 | 平衡 | 环保静音 |
| 赛博朋克 2077 噪音 | 57 dB(A) | 49 dB(A) | 36 dB(A) |
| 赛博朋克 2077》性能(FHD/超高清) | 107 fps | 89 fps | 锁定 30 fps |
| Cinebench R15 多重得分 | 5288 分 | 3431 分 | 1452 分 |
| CPU PL1 | 90 瓦 | 50 瓦 | 35 瓦 |
| CPU PL2 | 108 瓦 | 55 瓦 | 35 瓦 |
处理器
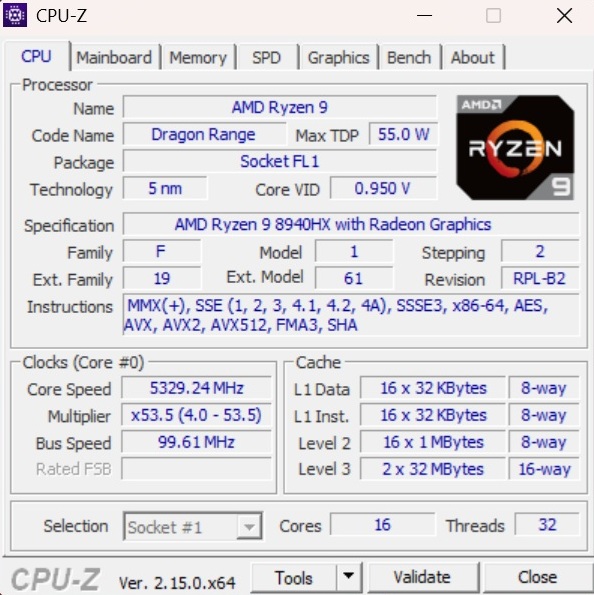
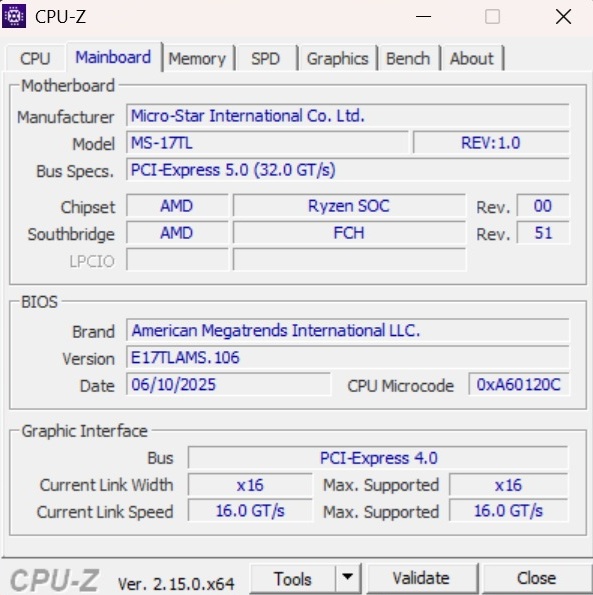
性能 Ryzen 9 8940HX在 Crosshair A17 HX 上首次亮相。这款 Zen 4 芯片提供完整的 16 个内核,可通过 SMT 同时处理多达 32 个线程,这在笔记本电脑领域是相当不错的。根据我们的 CPU 基准测试,AMD 型号的性能甚至超过了强大的英特尔 酷睿至尊 9 275HX而且在 Cinebench 循环中的性能也相当稳定。A Ryzen AI 9 HX 370平均落后不到 20%,而 Ryzen AI 7 350 Ryzen AI 7 350甚至落后约 40%。因此,Crosshair A17 尤其值得重视或依赖高 CPU 性能的用户购买。
Cinebench R15 多耐久性测试
* ... smaller is better
AIDA64: FP32 Ray-Trace | FPU Julia | CPU SHA3 | CPU Queen | FPU SinJulia | FPU Mandel | CPU AES | CPU ZLib | FP64 Ray-Trace | CPU PhotoWorxx
| Performance rating | |
| MSI Crosshair A17 HX D8WGKG | |
| Average AMD Ryzen 9 8940HX | |
| Lenovo Legion 5 Pro 16IAX10H | |
| Aorus Elite 16 AE6H | |
| Average of class Gaming | |
| MSI Vector 16 HX AI A2XWHG | |
| MSI Katana 17 HX B14WGK | |
| AIDA64 / FP32 Ray-Trace | |
| MSI Crosshair A17 HX D8WGKG | |
| Average AMD Ryzen 9 8940HX (43311 - 52718, n=2) | |
| Lenovo Legion 5 Pro 16IAX10H | |
| Aorus Elite 16 AE6H | |
| Average of class Gaming (10227 - 85542, n=109, last 2 years) | |
| MSI Vector 16 HX AI A2XWHG | |
| MSI Katana 17 HX B14WGK | |
| AIDA64 / FPU Julia | |
| MSI Crosshair A17 HX D8WGKG | |
| Average AMD Ryzen 9 8940HX (171374 - 212581, n=2) | |
| Lenovo Legion 5 Pro 16IAX10H | |
| Aorus Elite 16 AE6H | |
| MSI Vector 16 HX AI A2XWHG | |
| Average of class Gaming (51376 - 238426, n=109, last 2 years) | |
| MSI Katana 17 HX B14WGK | |
| AIDA64 / CPU SHA3 | |
| MSI Crosshair A17 HX D8WGKG | |
| Average AMD Ryzen 9 8940HX (7988 - 9259, n=2) | |
| Lenovo Legion 5 Pro 16IAX10H | |
| Aorus Elite 16 AE6H | |
| MSI Vector 16 HX AI A2XWHG | |
| Average of class Gaming (2180 - 9817, n=109, last 2 years) | |
| MSI Katana 17 HX B14WGK | |
| AIDA64 / CPU Queen | |
| MSI Crosshair A17 HX D8WGKG | |
| Average AMD Ryzen 9 8940HX (169334 - 172010, n=2) | |
| Lenovo Legion 5 Pro 16IAX10H | |
| Aorus Elite 16 AE6H | |
| MSI Vector 16 HX AI A2XWHG | |
| Average of class Gaming (49785 - 173351, n=100, last 2 years) | |
| MSI Katana 17 HX B14WGK | |
| AIDA64 / FPU SinJulia | |
| MSI Crosshair A17 HX D8WGKG | |
| Average AMD Ryzen 9 8940HX (26855 - 29514, n=2) | |
| Average of class Gaming (4424 - 33636, n=109, last 2 years) | |
| Lenovo Legion 5 Pro 16IAX10H | |
| Aorus Elite 16 AE6H | |
| MSI Vector 16 HX AI A2XWHG | |
| MSI Katana 17 HX B14WGK | |
| AIDA64 / FPU Mandel | |
| MSI Crosshair A17 HX D8WGKG | |
| Average AMD Ryzen 9 8940HX (90684 - 113321, n=2) | |
| Lenovo Legion 5 Pro 16IAX10H | |
| Aorus Elite 16 AE6H | |
| MSI Vector 16 HX AI A2XWHG | |
| Average of class Gaming (25115 - 128721, n=109, last 2 years) | |
| MSI Katana 17 HX B14WGK | |
| AIDA64 / CPU AES | |
| MSI Crosshair A17 HX D8WGKG | |
| Average AMD Ryzen 9 8940HX (150768 - 168749, n=2) | |
| Lenovo Legion 5 Pro 16IAX10H | |
| Aorus Elite 16 AE6H | |
| Average of class Gaming (39258 - 247074, n=109, last 2 years) | |
| MSI Vector 16 HX AI A2XWHG | |
| MSI Katana 17 HX B14WGK | |
| AIDA64 / CPU ZLib | |
| Lenovo Legion 5 Pro 16IAX10H | |
| MSI Crosshair A17 HX D8WGKG | |
| Average AMD Ryzen 9 8940HX (1784 - 2092, n=2) | |
| Aorus Elite 16 AE6H | |
| Average of class Gaming (574 - 2531, n=109, last 2 years) | |
| MSI Vector 16 HX AI A2XWHG | |
| MSI Katana 17 HX B14WGK | |
| AIDA64 / FP64 Ray-Trace | |
| MSI Crosshair A17 HX D8WGKG | |
| Average AMD Ryzen 9 8940HX (23193 - 28180, n=2) | |
| Lenovo Legion 5 Pro 16IAX10H | |
| Aorus Elite 16 AE6H | |
| Average of class Gaming (5509 - 45446, n=109, last 2 years) | |
| MSI Vector 16 HX AI A2XWHG | |
| MSI Katana 17 HX B14WGK | |
| AIDA64 / CPU PhotoWorxx | |
| Lenovo Legion 5 Pro 16IAX10H | |
| Aorus Elite 16 AE6H | |
| Average of class Gaming (12271 - 89891, n=109, last 2 years) | |
| MSI Vector 16 HX AI A2XWHG | |
| MSI Crosshair A17 HX D8WGKG | |
| MSI Katana 17 HX B14WGK | |
| Average AMD Ryzen 9 8940HX (18283 - 34819, n=2) | |
系统性能
系统性能不尽如人意。如果把所有基准测试加在一起,17 英寸机型仅略高于 Katana 17。
PCMark 10: Score | Essentials | Productivity | Digital Content Creation
CrossMark: Overall | Productivity | Creativity | Responsiveness
WebXPRT 3: Overall
WebXPRT 4: Overall
Mozilla Kraken 1.1: Total
| Performance rating | |
| Lenovo Legion 5 Pro 16IAX10H | |
| Aorus Elite 16 AE6H | |
| Average of class Gaming | |
| MSI Vector 16 HX AI A2XWHG | |
| MSI Crosshair A17 HX D8WGKG | |
| Average AMD Ryzen 9 8940HX, NVIDIA GeForce RTX 5070 Laptop | |
| MSI Katana 17 HX B14WGK | |
| PCMark 10 / Score | |
| Average of class Gaming (5828 - 11574, n=95, last 2 years) | |
| Lenovo Legion 5 Pro 16IAX10H | |
| MSI Crosshair A17 HX D8WGKG | |
| Average AMD Ryzen 9 8940HX, NVIDIA GeForce RTX 5070 Laptop (n=1) | |
| Aorus Elite 16 AE6H | |
| MSI Vector 16 HX AI A2XWHG | |
| MSI Katana 17 HX B14WGK | |
| PCMark 10 / Essentials | |
| MSI Crosshair A17 HX D8WGKG | |
| Average AMD Ryzen 9 8940HX, NVIDIA GeForce RTX 5070 Laptop (n=1) | |
| Aorus Elite 16 AE6H | |
| Lenovo Legion 5 Pro 16IAX10H | |
| MSI Vector 16 HX AI A2XWHG | |
| Average of class Gaming (8810 - 12600, n=99, last 2 years) | |
| MSI Katana 17 HX B14WGK | |
| PCMark 10 / Productivity | |
| Average of class Gaming (6845 - 18766, n=97, last 2 years) | |
| Lenovo Legion 5 Pro 16IAX10H | |
| MSI Vector 16 HX AI A2XWHG | |
| MSI Crosshair A17 HX D8WGKG | |
| Average AMD Ryzen 9 8940HX, NVIDIA GeForce RTX 5070 Laptop (n=1) | |
| Aorus Elite 16 AE6H | |
| MSI Katana 17 HX B14WGK | |
| PCMark 10 / Digital Content Creation | |
| Lenovo Legion 5 Pro 16IAX10H | |
| Aorus Elite 16 AE6H | |
| Average of class Gaming (7602 - 19657, n=97, last 2 years) | |
| MSI Crosshair A17 HX D8WGKG | |
| Average AMD Ryzen 9 8940HX, NVIDIA GeForce RTX 5070 Laptop (n=1) | |
| MSI Vector 16 HX AI A2XWHG | |
| MSI Katana 17 HX B14WGK | |
| CrossMark / Overall | |
| Lenovo Legion 5 Pro 16IAX10H | |
| Aorus Elite 16 AE6H | |
| Average of class Gaming (1366 - 2409, n=97, last 2 years) | |
| MSI Crosshair A17 HX D8WGKG | |
| Average AMD Ryzen 9 8940HX, NVIDIA GeForce RTX 5070 Laptop (n=1) | |
| MSI Katana 17 HX B14WGK | |
| MSI Vector 16 HX AI A2XWHG | |
| CrossMark / Productivity | |
| Lenovo Legion 5 Pro 16IAX10H | |
| Aorus Elite 16 AE6H | |
| MSI Katana 17 HX B14WGK | |
| Average of class Gaming (1386 - 2254, n=97, last 2 years) | |
| MSI Vector 16 HX AI A2XWHG | |
| MSI Crosshair A17 HX D8WGKG | |
| Average AMD Ryzen 9 8940HX, NVIDIA GeForce RTX 5070 Laptop (n=1) | |
| CrossMark / Creativity | |
| Lenovo Legion 5 Pro 16IAX10H | |
| Aorus Elite 16 AE6H | |
| MSI Vector 16 HX AI A2XWHG | |
| Average of class Gaming (1343 - 2729, n=97, last 2 years) | |
| MSI Crosshair A17 HX D8WGKG | |
| Average AMD Ryzen 9 8940HX, NVIDIA GeForce RTX 5070 Laptop (n=1) | |
| MSI Katana 17 HX B14WGK | |
| CrossMark / Responsiveness | |
| Aorus Elite 16 AE6H | |
| MSI Katana 17 HX B14WGK | |
| Lenovo Legion 5 Pro 16IAX10H | |
| MSI Crosshair A17 HX D8WGKG | |
| Average AMD Ryzen 9 8940HX, NVIDIA GeForce RTX 5070 Laptop (n=1) | |
| Average of class Gaming (1226 - 2334, n=97, last 2 years) | |
| MSI Vector 16 HX AI A2XWHG | |
| WebXPRT 3 / Overall | |
| Lenovo Legion 5 Pro 16IAX10H | |
| MSI Vector 16 HX AI A2XWHG | |
| Average of class Gaming (242 - 532, n=100, last 2 years) | |
| Aorus Elite 16 AE6H | |
| MSI Katana 17 HX B14WGK | |
| MSI Crosshair A17 HX D8WGKG | |
| Average AMD Ryzen 9 8940HX, NVIDIA GeForce RTX 5070 Laptop (n=1) | |
| WebXPRT 4 / Overall | |
| Aorus Elite 16 AE6H | |
| Lenovo Legion 5 Pro 16IAX10H | |
| MSI Vector 16 HX AI A2XWHG | |
| Average of class Gaming (176.4 - 354, n=100, last 2 years) | |
| MSI Katana 17 HX B14WGK | |
| MSI Crosshair A17 HX D8WGKG | |
| Average AMD Ryzen 9 8940HX, NVIDIA GeForce RTX 5070 Laptop (n=1) | |
| Mozilla Kraken 1.1 / Total | |
| MSI Crosshair A17 HX D8WGKG | |
| Average AMD Ryzen 9 8940HX, NVIDIA GeForce RTX 5070 Laptop (n=1) | |
| MSI Katana 17 HX B14WGK | |
| Average of class Gaming (391 - 590, n=105, last 2 years) | |
| MSI Vector 16 HX AI A2XWHG | |
| Aorus Elite 16 AE6H | |
| Lenovo Legion 5 Pro 16IAX10H | |
* ... smaller is better
| PCMark 10 Score | 8106 points | |
Help | ||
| AIDA64 / Memory Copy | |
| Aorus Elite 16 AE6H | |
| Lenovo Legion 5 Pro 16IAX10H | |
| Average of class Gaming (21750 - 129946, n=109, last 2 years) | |
| MSI Vector 16 HX AI A2XWHG | |
| MSI Katana 17 HX B14WGK | |
| MSI Crosshair A17 HX D8WGKG | |
| Average AMD Ryzen 9 8940HX (29102 - 51173, n=2) | |
| AIDA64 / Memory Read | |
| Lenovo Legion 5 Pro 16IAX10H | |
| Aorus Elite 16 AE6H | |
| MSI Vector 16 HX AI A2XWHG | |
| Average of class Gaming (22956 - 118858, n=109, last 2 years) | |
| MSI Katana 17 HX B14WGK | |
| MSI Crosshair A17 HX D8WGKG | |
| Average AMD Ryzen 9 8940HX (35634 - 62219, n=2) | |
| AIDA64 / Memory Write | |
| Aorus Elite 16 AE6H | |
| Lenovo Legion 5 Pro 16IAX10H | |
| Average of class Gaming (22297 - 135096, n=109, last 2 years) | |
| MSI Vector 16 HX AI A2XWHG | |
| MSI Crosshair A17 HX D8WGKG | |
| MSI Katana 17 HX B14WGK | |
| Average AMD Ryzen 9 8940HX (32239 - 61929, n=2) | |
| AIDA64 / Memory Latency | |
| Lenovo Legion 5 Pro 16IAX10H | |
| Aorus Elite 16 AE6H | |
| MSI Vector 16 HX AI A2XWHG | |
| Average of class Gaming (75.3 - 259, n=109, last 2 years) | |
| MSI Katana 17 HX B14WGK | |
| MSI Crosshair A17 HX D8WGKG | |
| Average AMD Ryzen 9 8940HX (83.5 - 83.9, n=2) | |
* ... smaller is better
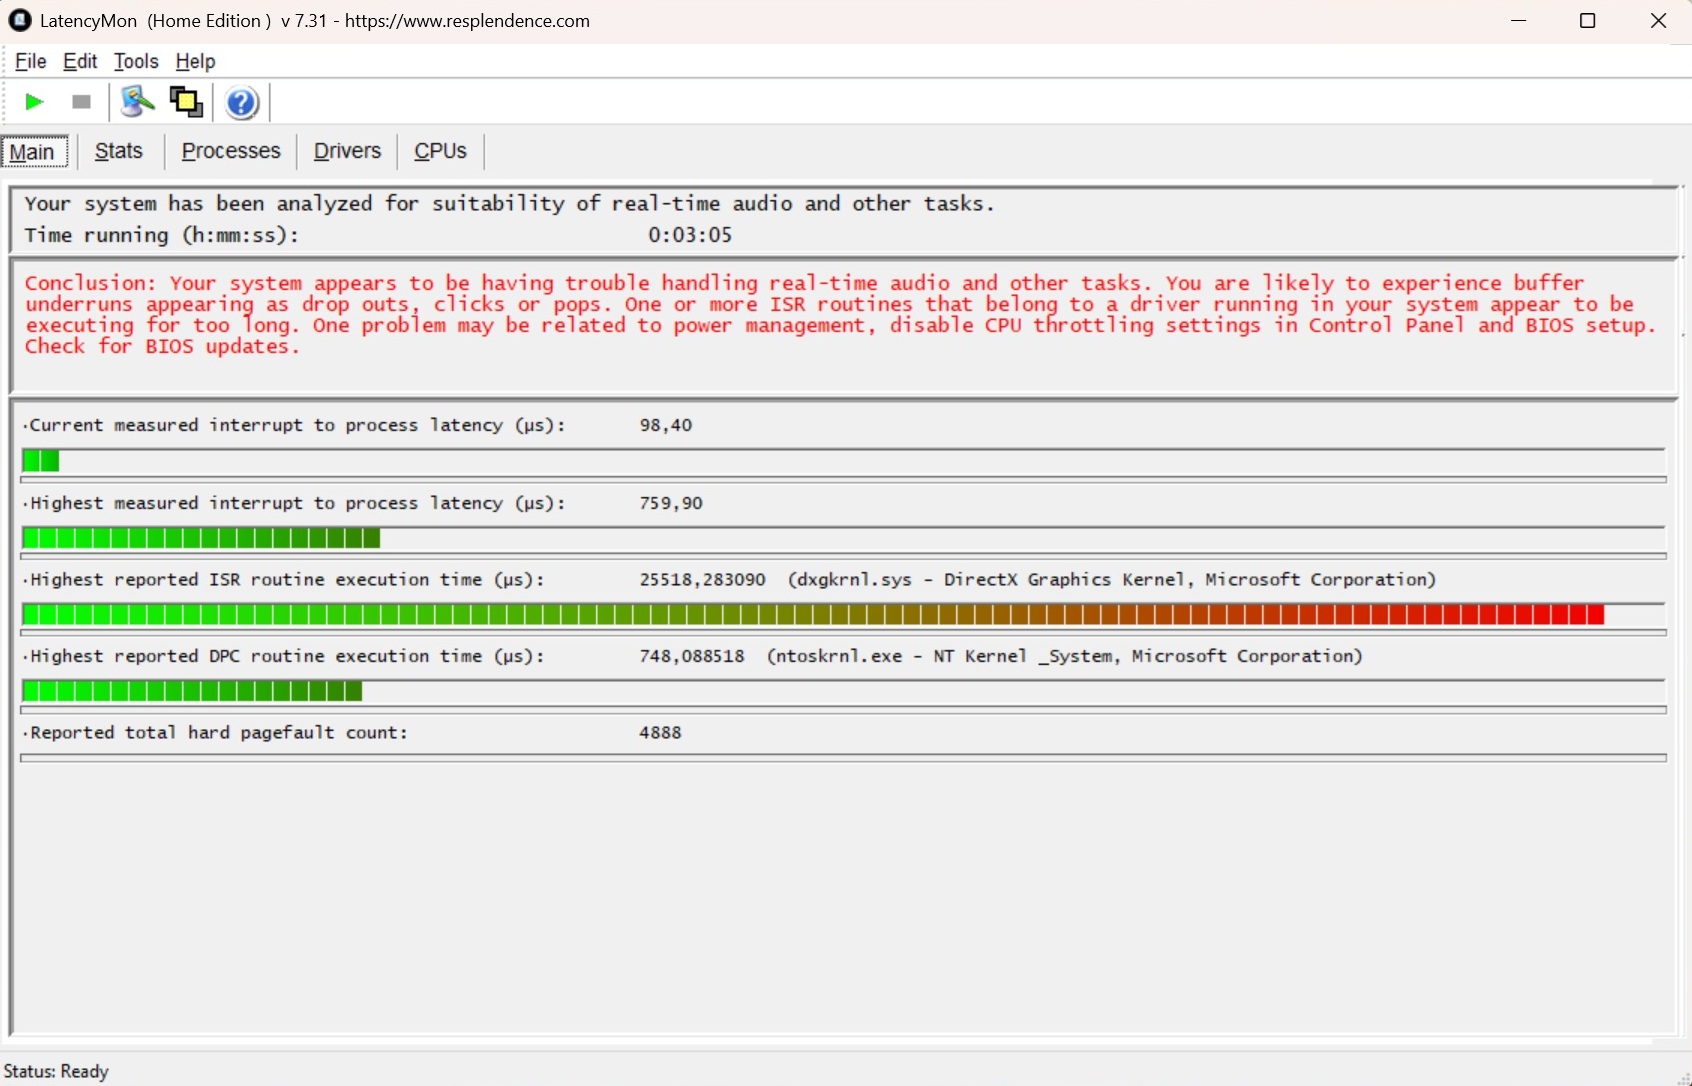
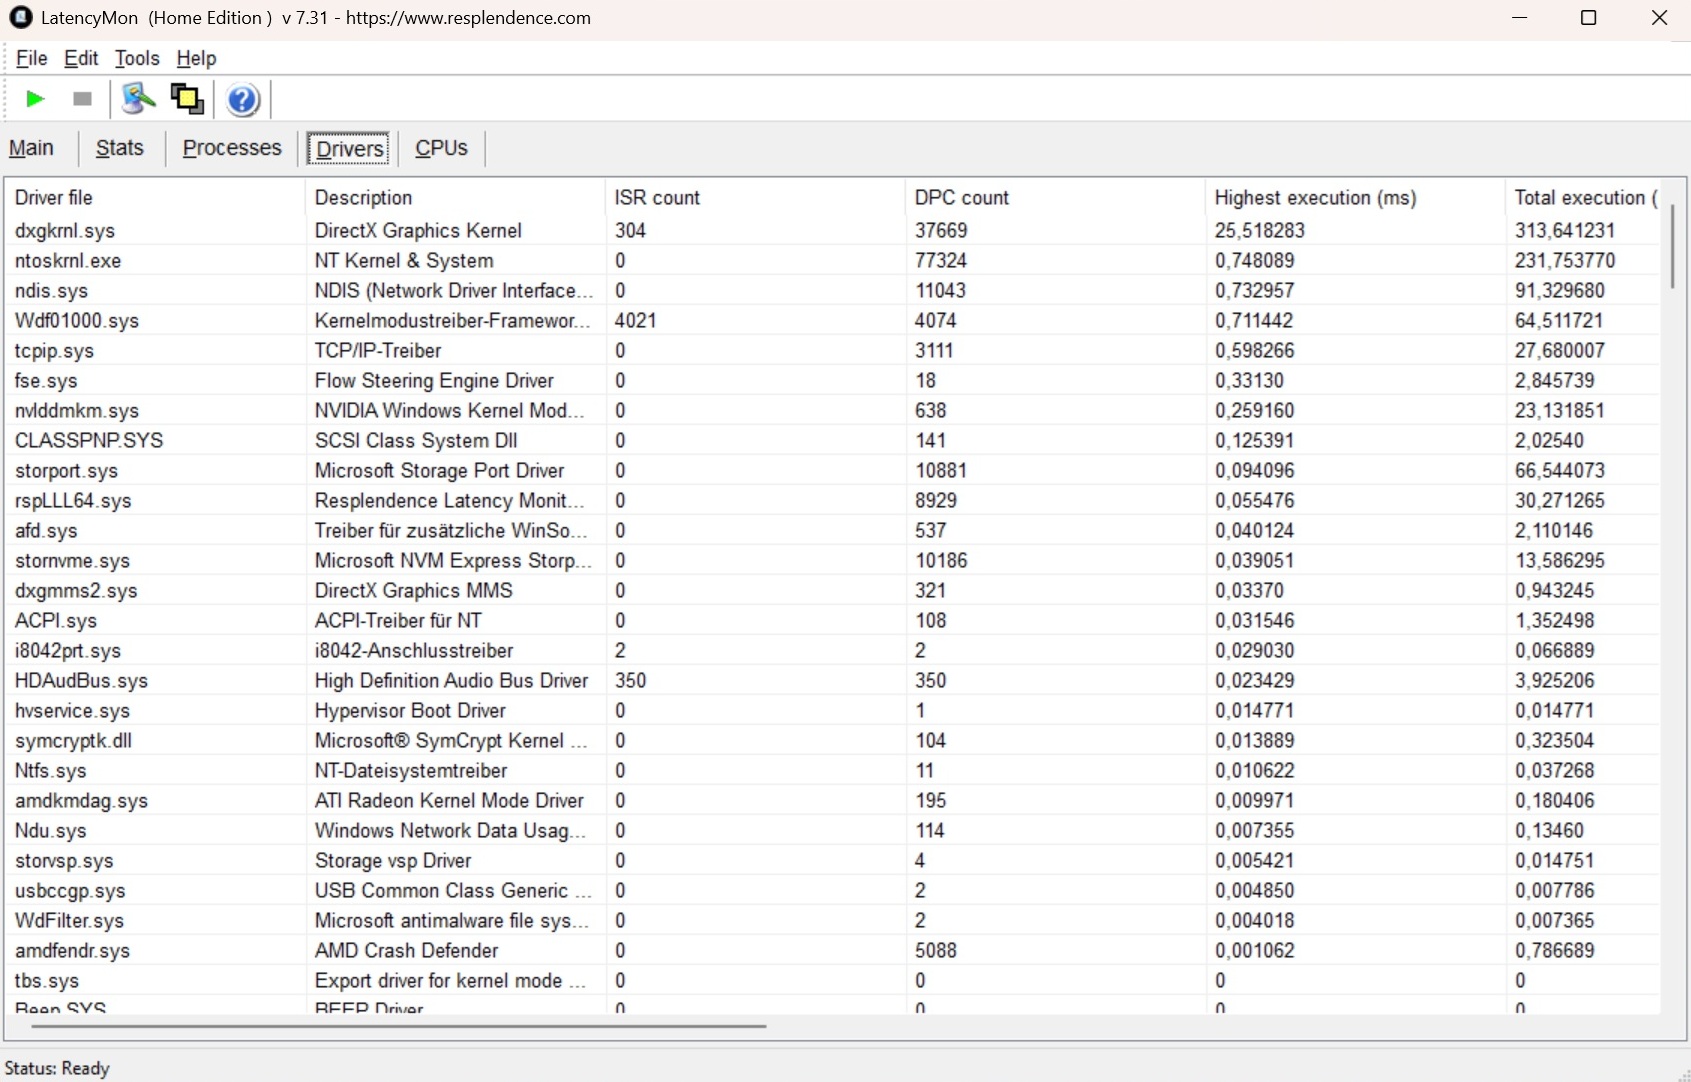
DPC 延迟
虽然延迟没有其他一些设备那么高,但 LatencyMon 工具仍然提到了某些应用中的潜在问题。
| DPC Latencies / LatencyMon - interrupt to process latency (max), Web, Youtube, Prime95 | |
| MSI Katana 17 HX B14WGK | |
| MSI Vector 16 HX AI A2XWHG | |
| Lenovo Legion 5 Pro 16IAX10H | |
| Aorus Elite 16 AE6H | |
| MSI Crosshair A17 HX D8WGKG | |
* ... smaller is better
大容量存储器
快速大容量存储备受赞誉。三星内置的 1 TB SSD 在对比中名列第三,并且在 DiskSpd 循环中速度丝毫未降。上图:M.2 插槽仍可用于后期升级。

* ... smaller is better
连续读取性能DiskSpd 读取循环,队列深度 8
图形处理器性能
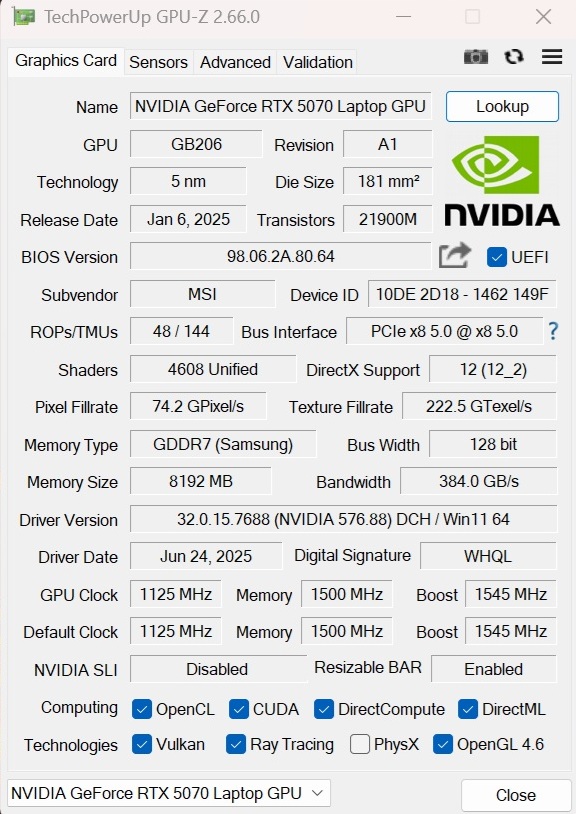
GeForce RTX 5070 尽管 VRAM 配置不高(2025 年只在有限范围内推荐使用 8 GB),但目前许多游戏笔记本电脑都在使用它。微星为 Crosshair A17 选择了 115 瓦的最大 TGP(包括动态升压)。我们的 3DMark 课程证实,17 英寸型号的性能达到了预期水平,偶尔还略高于之前确定的该显卡的平均水平。
| 3DMark 11 Performance | 36864 points | |
| 3DMark Cloud Gate Standard Score | 65538 points | |
| 3DMark Fire Strike Score | 33730 points | |
| 3DMark Time Spy Score | 13400 points | |
Help | ||
* ... smaller is better
游戏性能
在游戏过程中,与 RTX 5070 平均水平的差距会越来越大,因此 17 英寸笔记本电脑甚至会对某些 RTX 5070 Ti 笔记本电脑构成威胁。除了要求极高、VRAM 较高或中度优化的游戏,如 湮灭重制版大多数游戏都能以 QHD 分辨率和最高设置运行,帧率(40+ FPS)还算不错。如果 RTX 5070 无法正常运行,降低细节级别和/或以 DLSS(包括受支持游戏的帧生成)的形式进行升级会有所帮助。
| Performance rating - Percent | |
| Lenovo Legion 5 Pro 16IAX10H | |
| MSI Vector 16 HX AI A2XWHG -1! | |
| MSI Crosshair A17 HX D8WGKG -1! | |
| Aorus Elite 16 AE6H -1! | |
| Average of class Gaming | |
| MSI Katana 17 HX B14WGK -2! | |
| Average NVIDIA GeForce RTX 5070 Laptop | |
| Final Fantasy XV Benchmark - 1920x1080 High Quality | |
| Lenovo Legion 5 Pro 16IAX10H | |
| MSI Vector 16 HX AI A2XWHG | |
| Aorus Elite 16 AE6H | |
| Average of class Gaming (41 - 215, n=103, last 2 years) | |
| MSI Crosshair A17 HX D8WGKG | |
| Average NVIDIA GeForce RTX 5070 Laptop (96 - 150.7, n=25) | |
| Strange Brigade - 1920x1080 ultra AA:ultra AF:16 | |
| Lenovo Legion 5 Pro 16IAX10H | |
| Average of class Gaming (76.3 - 456, n=93, last 2 years) | |
| Average NVIDIA GeForce RTX 5070 Laptop (203 - 261, n=23) | |
| low | med. | high | ultra | QHD DLSS | QHD | |
|---|---|---|---|---|---|---|
| GTA V (2015) | 186.7 | 185.2 | 160.2 | 122.5 | ||
| Dota 2 Reborn (2015) | 246 | 213 | 203 | 184.2 | ||
| Final Fantasy XV Benchmark (2018) | 185 | 141.5 | 103.7 | |||
| X-Plane 11.11 (2018) | 156 | 134.4 | 107.4 | |||
| Baldur's Gate 3 (2023) | 154.5 | 128.2 | 124.9 | 84.9 | ||
| Cyberpunk 2077 (2023) | 144.1 | 121.3 | 106.7 | 66.8 | ||
| Horizon Forbidden West (2024) | 108.1 | 82.6 | 77.9 | 81.3 | 64 | |
| Ghost of Tsushima (2024) | 100 | 92.1 | 71 | 74.6 | 53.8 | |
| Senua's Saga Hellblade 2 (2024) | 71 | 51.4 | 56.2 | 36.7 | ||
| The Elder Scrolls IV Oblivion Remastered (2025) | 74.2 | 65.4 | 32.1 | 34 | 19.5 | |
| Doom: The Dark Ages (2025) | 75.2 | 68.1 | 66.6 | 66.1 | 44.8 | |
| F1 25 (2025) | 239 | 199 | 31 | 29 | 17 |
| F1 25 | |
| 2560x1440 Ultra Max Preset AA:T AF:16x | |
| Average of class Gaming (5 - 37.5, n=24, last 2 years) | |
| Lenovo Legion 5 Pro 16IAX10H | |
| MSI Crosshair A17 HX D8WGKG | |
| Average NVIDIA GeForce RTX 5070 Laptop (7.69 - 17, n=8) | |
| 2560x1440 Ultra Max Preset + DLSS Quality AA:DLSS AF:16x | |
| Average of class Gaming (9 - 67.5, n=22, last 2 years) | |
| Lenovo Legion 5 Pro 16IAX10H | |
| Average NVIDIA GeForce RTX 5070 Laptop (27.1 - 33.4, n=6) | |
| MSI Crosshair A17 HX D8WGKG | |
| The Elder Scrolls IV Oblivion Remastered | |
| 2560x1440 Ultra Preset AA:T | |
| MSI Vector 16 HX AI A2XWHG | |
| Average of class Gaming (12.7 - 45.9, n=14, last 2 years) | |
| MSI Katana 17 HX B14WGK | |
| Average NVIDIA GeForce RTX 5070 Laptop (19.5 - 20.9, n=3) | |
| MSI Crosshair A17 HX D8WGKG | |
| 2560x1440 Ultra Preset + Quality DLSS | |
| MSI Vector 16 HX AI A2XWHG | |
| Average of class Gaming (25.3 - 59.7, n=12, last 2 years) | |
| MSI Crosshair A17 HX D8WGKG | |
| Average NVIDIA GeForce RTX 5070 Laptop (30.3 - 34, n=3) | |
| MSI Katana 17 HX B14WGK | |
| Horizon Forbidden West | |
| 2560x1440 Very High Preset AA:T | |
| MSI Vector 16 HX AI A2XWHG | |
| Average of class Gaming (39.6 - 100.9, n=10, last 2 years) | |
| MSI Crosshair A17 HX D8WGKG | |
| Average NVIDIA GeForce RTX 5070 Laptop (57.9 - 64, n=2) | |
| MSI Katana 17 HX B14WGK | |
| 2560x1440 Very High Preset + DLSS Quality | |
| MSI Vector 16 HX AI A2XWHG | |
| Average of class Gaming (58.4 - 116.6, n=8, last 2 years) | |
| MSI Crosshair A17 HX D8WGKG | |
| Average NVIDIA GeForce RTX 5070 Laptop (70.3 - 81.3, n=2) | |
| MSI Katana 17 HX B14WGK | |
| Ghost of Tsushima | |
| 2560x1440 Very High Preset AA:T | |
| MSI Vector 16 HX AI A2XWHG | |
| Average of class Gaming (22.7 - 100.3, n=13, last 2 years) | |
| MSI Crosshair A17 HX D8WGKG | |
| Average NVIDIA GeForce RTX 5070 Laptop (49.1 - 53.8, n=2) | |
| MSI Katana 17 HX B14WGK | |
| 2560x1440 Very High Preset + Quality DLSS | |
| MSI Vector 16 HX AI A2XWHG | |
| MSI Crosshair A17 HX D8WGKG | |
| Average of class Gaming (55.2 - 105.2, n=10, last 2 years) | |
| Average NVIDIA GeForce RTX 5070 Laptop (66.5 - 74.6, n=2) | |
| MSI Katana 17 HX B14WGK | |
| Senua's Saga Hellblade 2 | |
| 2560x1440 High Preset | |
| MSI Vector 16 HX AI A2XWHG | |
| Average of class Gaming (24.2 - 63.1, n=11, last 2 years) | |
| MSI Crosshair A17 HX D8WGKG | |
| Average NVIDIA GeForce RTX 5070 Laptop (31.7 - 36.7, n=2) | |
| MSI Katana 17 HX B14WGK | |
| 2560x1440 High Preset + Quality DLSS | |
| MSI Vector 16 HX AI A2XWHG | |
| MSI Crosshair A17 HX D8WGKG | |
| Average of class Gaming (39.6 - 81.9, n=9, last 2 years) | |
| Average NVIDIA GeForce RTX 5070 Laptop (49.4 - 56.2, n=2) | |
| MSI Katana 17 HX B14WGK | |
作为我们的 赛博朋克测试表明,GPU 性能与 CPU 和 SSD 性能类似,即使长时间运行也能保持令人满意的稳定。
赛博朋克 2077》超 FPS 图表
排放量
噪音排放
不出所料,"极致性能 "模式会产生很大的背景噪音。在 3D 模式下,57 至 58 分贝(A)的噪音在不戴耳机的情况下非常恼人(在平衡模式下,性能在某些情况下会明显下降,但设备仍然明显更安静)。我们发现风扇在空闲模式下的表现也同样令人讨厌,因为冷却系统有时会无缘无故地转速超过 40 分贝(A)。所有竞争对手在这方面都做得比较好。
Noise level
| Idle |
| 25 / 30 / 47 dB(A) |
| Load |
| 57 / 58 dB(A) |
 | ||
30 dB silent 40 dB(A) audible 50 dB(A) loud |
||
min: | ||
| MSI Crosshair A17 HX D8WGKG R9 8940HX, GeForce RTX 5070 Laptop | MSI Katana 17 HX B14WGK i7-14650HX, GeForce RTX 5070 Laptop | Aorus Elite 16 AE6H Ultra 9 275HX, GeForce RTX 5070 Laptop | Lenovo Legion 5 Pro 16IAX10H Ultra 9 275HX, GeForce RTX 5070 Ti Laptop | MSI Vector 16 HX AI A2XWHG Ultra 7 255HX, GeForce RTX 5070 Ti Laptop | |
|---|---|---|---|---|---|
| Noise | 0% | 3% | 9% | 3% | |
| off / environment * (dB) | 24 | 25 -4% | 24 -0% | 24 -0% | 25 -4% |
| Idle Minimum * (dB) | 25 | 31 -24% | 25 -0% | 24 4% | 33 -32% |
| Idle Average * (dB) | 30 | 32 -7% | 29 3% | 24 20% | 34 -13% |
| Idle Maximum * (dB) | 47 | 34 28% | 32 32% | 30.9 34% | 38 19% |
| Load Average * (dB) | 57 | 50 12% | 60 -5% | 55.9 2% | 46 19% |
| Cyberpunk 2077 ultra * (dB) | 57 | 58 -2% | 59 -4% | 56.72 -0% | 47 18% |
| Load Maximum * (dB) | 58 | 59 -2% | 61 -5% | 56.72 2% | 49 16% |
* ... smaller is better
温度
在负载情况下,温度与同类产品一致;在怠速状态下,底盘温度比同类产品要高。
(-) The maximum temperature on the upper side is 51 °C / 124 F, compared to the average of 40.4 °C / 105 F, ranging from 21.2 to 68.8 °C for the class Gaming.
(-) The bottom heats up to a maximum of 49 °C / 120 F, compared to the average of 43.2 °C / 110 F
(±) In idle usage, the average temperature for the upper side is 33.7 °C / 93 F, compared to the device average of 33.9 °C / 93 F.
(-) 3: The average temperature for the upper side is 39.6 °C / 103 F, compared to the average of 33.9 °C / 93 F for the class Gaming.
(+) The palmrests and touchpad are cooler than skin temperature with a maximum of 30 °C / 86 F and are therefore cool to the touch.
(±) The average temperature of the palmrest area of similar devices was 28.8 °C / 83.8 F (-1.2 °C / -2.2 F).
| MSI Crosshair A17 HX D8WGKG R9 8940HX, GeForce RTX 5070 Laptop | MSI Katana 17 HX B14WGK i7-14650HX, GeForce RTX 5070 Laptop | Aorus Elite 16 AE6H Ultra 9 275HX, GeForce RTX 5070 Laptop | Lenovo Legion 5 Pro 16IAX10H Ultra 9 275HX, GeForce RTX 5070 Ti Laptop | MSI Vector 16 HX AI A2XWHG Ultra 7 255HX, GeForce RTX 5070 Ti Laptop | |
|---|---|---|---|---|---|
| Heat | 3% | 10% | -2% | 7% | |
| Maximum Upper Side * (°C) | 51 | 52 -2% | 41 20% | 48 6% | 53 -4% |
| Maximum Bottom * (°C) | 49 | 56 -14% | 45 8% | 50 -2% | 52 -6% |
| Idle Upper Side * (°C) | 40 | 33 17% | 35 12% | 38 5% | 33 17% |
| Idle Bottom * (°C) | 36 | 32 11% | 36 -0% | 42 -17% | 29 19% |
* ... smaller is better
压力测试
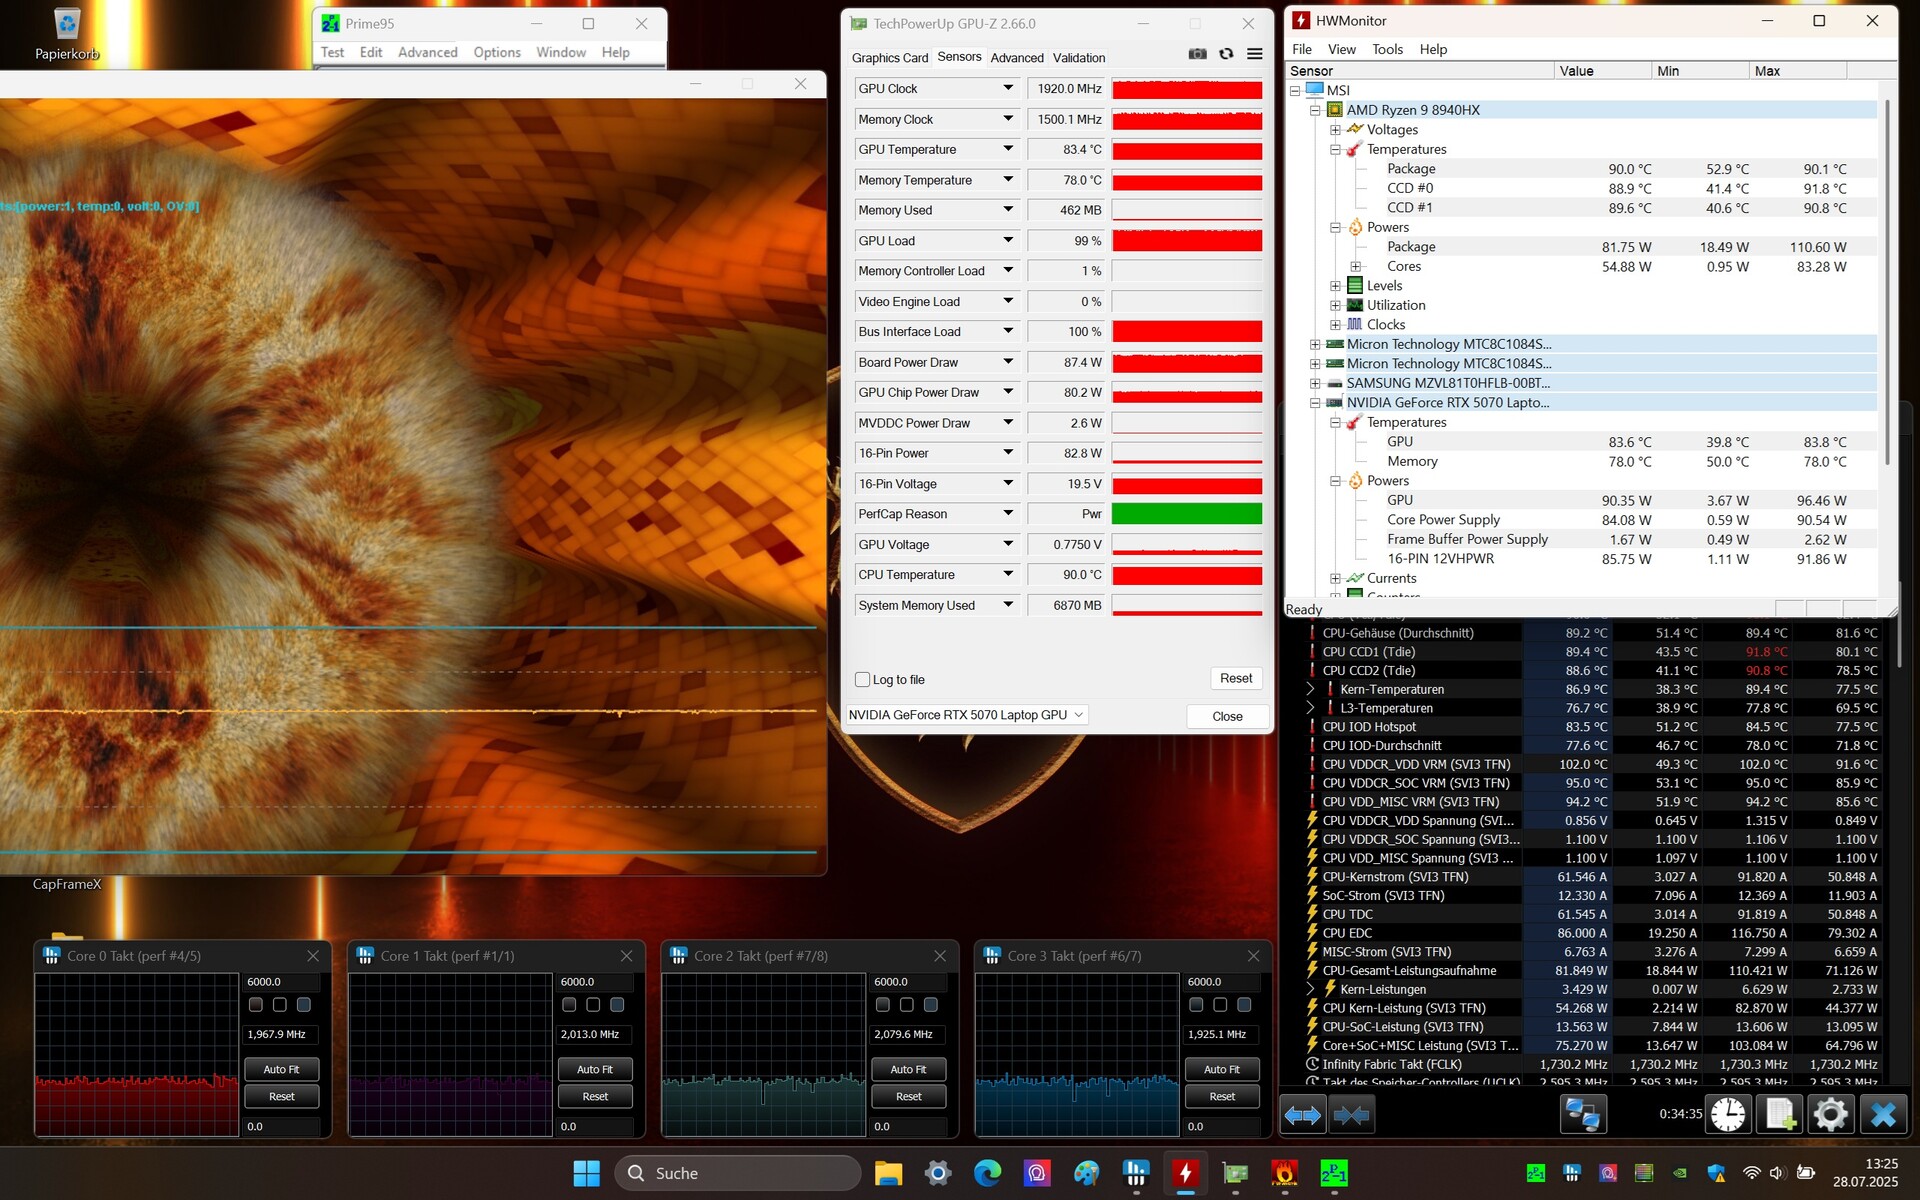
在使用 FurMark 和 Prime95 工具进行的压力测试中,R9 8940HX 在一段时间后稳定在 90 °C(194 °F),而 RTX 5070 则达到了略微适中的 83 °C(181.4 °F)。

发言人
Crosshair A17 HX 的音质属于中档。内部 Vector 16 不仅提供了更大的最大音量,而且低音也更加强劲有力。
MSI Crosshair A17 HX D8WGKG audio analysis
(±) | speaker loudness is average but good (81 dB)
Bass 100 - 315 Hz
(-) | nearly no bass - on average 18% lower than median
(±) | linearity of bass is average (12.4% delta to prev. frequency)
Mids 400 - 2000 Hz
(±) | higher mids - on average 6.6% higher than median
(±) | linearity of mids is average (7% delta to prev. frequency)
Highs 2 - 16 kHz
(+) | balanced highs - only 3% away from median
(+) | highs are linear (5.1% delta to prev. frequency)
Overall 100 - 16.000 Hz
(±) | linearity of overall sound is average (17.8% difference to median)
Compared to same class
» 53% of all tested devices in this class were better, 10% similar, 37% worse
» The best had a delta of 6%, average was 18%, worst was 132%
Compared to all devices tested
» 36% of all tested devices were better, 8% similar, 56% worse
» The best had a delta of 4%, average was 24%, worst was 134%
MSI Vector 16 HX AI A2XWHG audio analysis
(+) | speakers can play relatively loud (86 dB)
Bass 100 - 315 Hz
(±) | reduced bass - on average 12.3% lower than median
(±) | linearity of bass is average (8.5% delta to prev. frequency)
Mids 400 - 2000 Hz
(±) | higher mids - on average 9.9% higher than median
(+) | mids are linear (6.8% delta to prev. frequency)
Highs 2 - 16 kHz
(+) | balanced highs - only 1.8% away from median
(+) | highs are linear (2.9% delta to prev. frequency)
Overall 100 - 16.000 Hz
(±) | linearity of overall sound is average (15.8% difference to median)
Compared to same class
» 37% of all tested devices in this class were better, 7% similar, 56% worse
» The best had a delta of 6%, average was 18%, worst was 132%
Compared to all devices tested
» 24% of all tested devices were better, 5% similar, 71% worse
» The best had a delta of 4%, average was 24%, worst was 134%
能源管理
能源消耗
对于 RTX 5070 笔记本电脑而言,17 英寸机型的能耗高于平均水平。特别是,32 至 47 瓦的空闲功耗令人怀疑过高。目前这可能还只是一个 bug。在连接外接显示器时,能耗明显降低。
| Off / Standby | |
| Idle | |
| Load |
|
Key:
min: | |
| MSI Crosshair A17 HX D8WGKG R9 8940HX, GeForce RTX 5070 Laptop | MSI Katana 17 HX B14WGK i7-14650HX, GeForce RTX 5070 Laptop | Aorus Elite 16 AE6H Ultra 9 275HX, GeForce RTX 5070 Laptop | Lenovo Legion 5 Pro 16IAX10H Ultra 9 275HX, GeForce RTX 5070 Ti Laptop | MSI Vector 16 HX AI A2XWHG Ultra 7 255HX, GeForce RTX 5070 Ti Laptop | Average of class Gaming | |
|---|---|---|---|---|---|---|
| Power Consumption | 30% | 29% | 13% | 21% | 35% | |
| Idle Minimum * (Watt) | 32 | 9.7 70% | 8.5 73% | 14 56% | 7.1 78% | 13.2 ? 59% |
| Idle Average * (Watt) | 36 | 15 58% | 13.6 62% | 14.3 60% | 15.9 56% | 18.9 ? 48% |
| Idle Maximum * (Watt) | 47 | 23.7 50% | 22 53% | 20.1 57% | 29.5 37% | 24.3 ? 48% |
| Load Average * (Watt) | 132 | 126 5% | 113 14% | 177 -34% | 124 6% | 108 ? 18% |
| Cyberpunk 2077 ultra * (Watt) | 222 | 205 8% | 223 -0% | 255 -15% | 222 -0% | |
| Cyberpunk 2077 ultra external monitor * (Watt) | 216 | 202 6% | 219 -1% | 255 -18% | 217 -0% | |
| Load Maximum * (Watt) | 261 | 227 13% | 257 2% | 294 -13% | 336 -29% | 254 ? 3% |
* ... smaller is better
能耗 赛博朋克/压力测试
带外部监控器的能耗
电池寿命
由于能耗较高,电池续航时间较短。在我们的 WLAN 测试中,亮度降低到 150 cd/m²,使用 "平衡 "模式时,90 Wh 的大容量电池在大约 4.5 小时后就耗尽了。相比之下,竞争对手的电池使用时间为 5 至 8.5 小时。
| MSI Crosshair A17 HX D8WGKG R9 8940HX, GeForce RTX 5070 Laptop, 90 Wh | MSI Katana 17 HX B14WGK i7-14650HX, GeForce RTX 5070 Laptop, 75 Wh | Aorus Elite 16 AE6H Ultra 9 275HX, GeForce RTX 5070 Laptop, 99 Wh | Lenovo Legion 5 Pro 16IAX10H Ultra 9 275HX, GeForce RTX 5070 Ti Laptop, 80 Wh | MSI Vector 16 HX AI A2XWHG Ultra 7 255HX, GeForce RTX 5070 Ti Laptop, 90 Wh | Average of class Gaming | |
|---|---|---|---|---|---|---|
| Battery runtime | 16% | 93% | 11% | 59% | 60% | |
| WiFi v1.3 (h) | 4.4 | 5.1 16% | 8.5 93% | 4.9 11% | 7 59% | 7.02 ? 60% |
| H.264 (h) | 4.8 | 8.26 ? | ||||
| Load (h) | 1.7 | 1.47 ? |
Notebookcheck 总体评分
得益于 AMD 16 核的强大性能,Crosshair A17 HX 拥有极高的多核性能,但在能耗和风扇控制方面存在缺陷。
MSI Crosshair A17 HX D8WGKG
- 08/06/2025 v8
Florian Glaser
 Total Sustainability Score:
 可比较的替代品
Image | Model / Review | Price | Weight | Height | Display |
|---|---|---|---|---|---|
1. 79.6%  | MSI Crosshair A17 HX D8WGKG AMD Ryzen 9 8940HX ⎘ NVIDIA GeForce RTX 5070 Laptop ⎘ 32 GB Memory, 1024 GB SSD | Amazon: List Price: 2000 EUR | 2.9 kg | 29.7 mm | 17.00" 2560x1600 178 PPI IPS |
2. 77.3%  | MSI Katana 17 HX B14WGK Intel Core i7-14650HX ⎘ NVIDIA GeForce RTX 5070 Laptop ⎘ 16 GB Memory, 1024 GB SSD | Amazon: List Price: 1800 EUR | 2.7 kg | 28 mm | 17.30" 2560x1440 170 PPI IPS |
3. 84.4%  | Aorus Elite 16 AE6H Intel Core Ultra 9 275HX ⎘ NVIDIA GeForce RTX 5070 Laptop ⎘ 32 GB Memory, 1024 GB SSD | List Price: 2300 EUR | 2.4 kg | 26 mm | 16.00" 2560x1600 189 PPI IPS |
4. 84.5%  | Lenovo Legion 5 Pro 16IAX10H Intel Core Ultra 9 275HX ⎘ NVIDIA GeForce RTX 5070 Ti Laptop ⎘ 32 GB Memory, 1024 GB SSD | Amazon: 1. $2,259.99 Lenovo Legion Pro 7 16IAX10H... 2. $1,749.99 Lenovo Legion Pro 5 AI Gamin... 3. $2,474.00 Lenovo Legion Pro 5i Gen 10 ... List Price: 2500 Euro | 2.4 kg | 25.95 mm | 16.00" 2560x1600 189 PPI OLED |
5. 84%  | MSI Vector 16 HX AI A2XWHG Intel Core Ultra 7 255HX ⎘ NVIDIA GeForce RTX 5070 Ti Laptop ⎘ 16 GB Memory, 512 GB SSD | Amazon: List Price: 2000 EUR | 2.6 kg | 28.6 mm | 16.00" 2560x1600 189 PPI IPS |
Transparency
The selection of devices to be reviewed is made by our editorial team. The test sample was provided to the author as a loan by the manufacturer or retailer for the purpose of this review. The lender had no influence on this review, nor did the manufacturer receive a copy of this review before publication. There was no obligation to publish this review. As an independent media company, Notebookcheck is not subjected to the authority of manufacturers, retailers or publishers.
This is how Notebookcheck is testing
Every year, Notebookcheck independently reviews hundreds of laptops and smartphones using standardized procedures to ensure that all results are comparable. We have continuously developed our test methods for around 20 years and set industry standards in the process. In our test labs, high-quality measuring equipment is utilized by experienced technicians and editors. These tests involve a multi-stage validation process. Our complex rating system is based on hundreds of well-founded measurements and benchmarks, which maintains objectivity. Further information on our test methods can be found here.
