
结论 - 显示效果出色的 Yoga Pro 9i 16
尽管 2.8K OLED 显示屏已经非常出色,但凭借全新的 3.2K tandem OLED 显示屏,联想再次提高了多媒体笔记本电脑的标准。它的最大亮度为 1,600 cd/m²,可与 MacBook Pro 16 16 的迷你 LED 面板媲美。 Apple MacBook Pro 16在响应时间和色彩空间覆盖方面也有优势。串联式 OLED 面板还可选配触摸屏。
与 Core Ultra 7 255H 相比,可选的 Core Ultra 9 285H 实际上并不值得购买,因为在单核场景下只有非常微弱的优势。移动版GeForce RTX 5070 比 RTX 5060 快约 10-15%,如果你想要最高的 GPU 性能,它可以为你带来回报。不过,我们也发现这里错失了安装更快 GPU 的机会。华硕即将推出 ProArt P16的更快版本(最高 RTX 5090 笔记本电脑,也是串联 OLED),届时可能会轻松摘得多媒体笔记本电脑领域的性能桂冠。
总而言之,Yoga Pro 9i 16 仍然是一款出色的多媒体笔记本电脑,由于采用了全新的 OLED 屏幕,它的性能变得更加出色。
Pros
Cons
Yoga Pro 9i 16 是联想的高端多媒体笔记本电脑。 G10 机型进行了广泛的测试,它配备了 2.8K OLED 和 NvidiaGeForce RTX 5060 笔记本电脑。.现在,新的顶级型号也已推出,它将英特尔酷睿超 9 285H 与GeForce RTX 5070 笔记本电脑和 64 GB 内存结合在一起。此外,还采用了分辨率更高的 3.2K 新 Tandem OLED 面板,亮度值更高。我们的测试设备配备 2 TB SSD 存储,零售价为 2799 欧元(约合人民币 3253 元)。
在外壳、功能、输入设备和扬声器方面,与之前测试的配备 RTX 5060 的 Yoga Pro 9i 16 笔记本电脑没有任何区别。在本次评测中,我们将重点关注新的显示屏以及性能、排放和电池续航时间。
规格


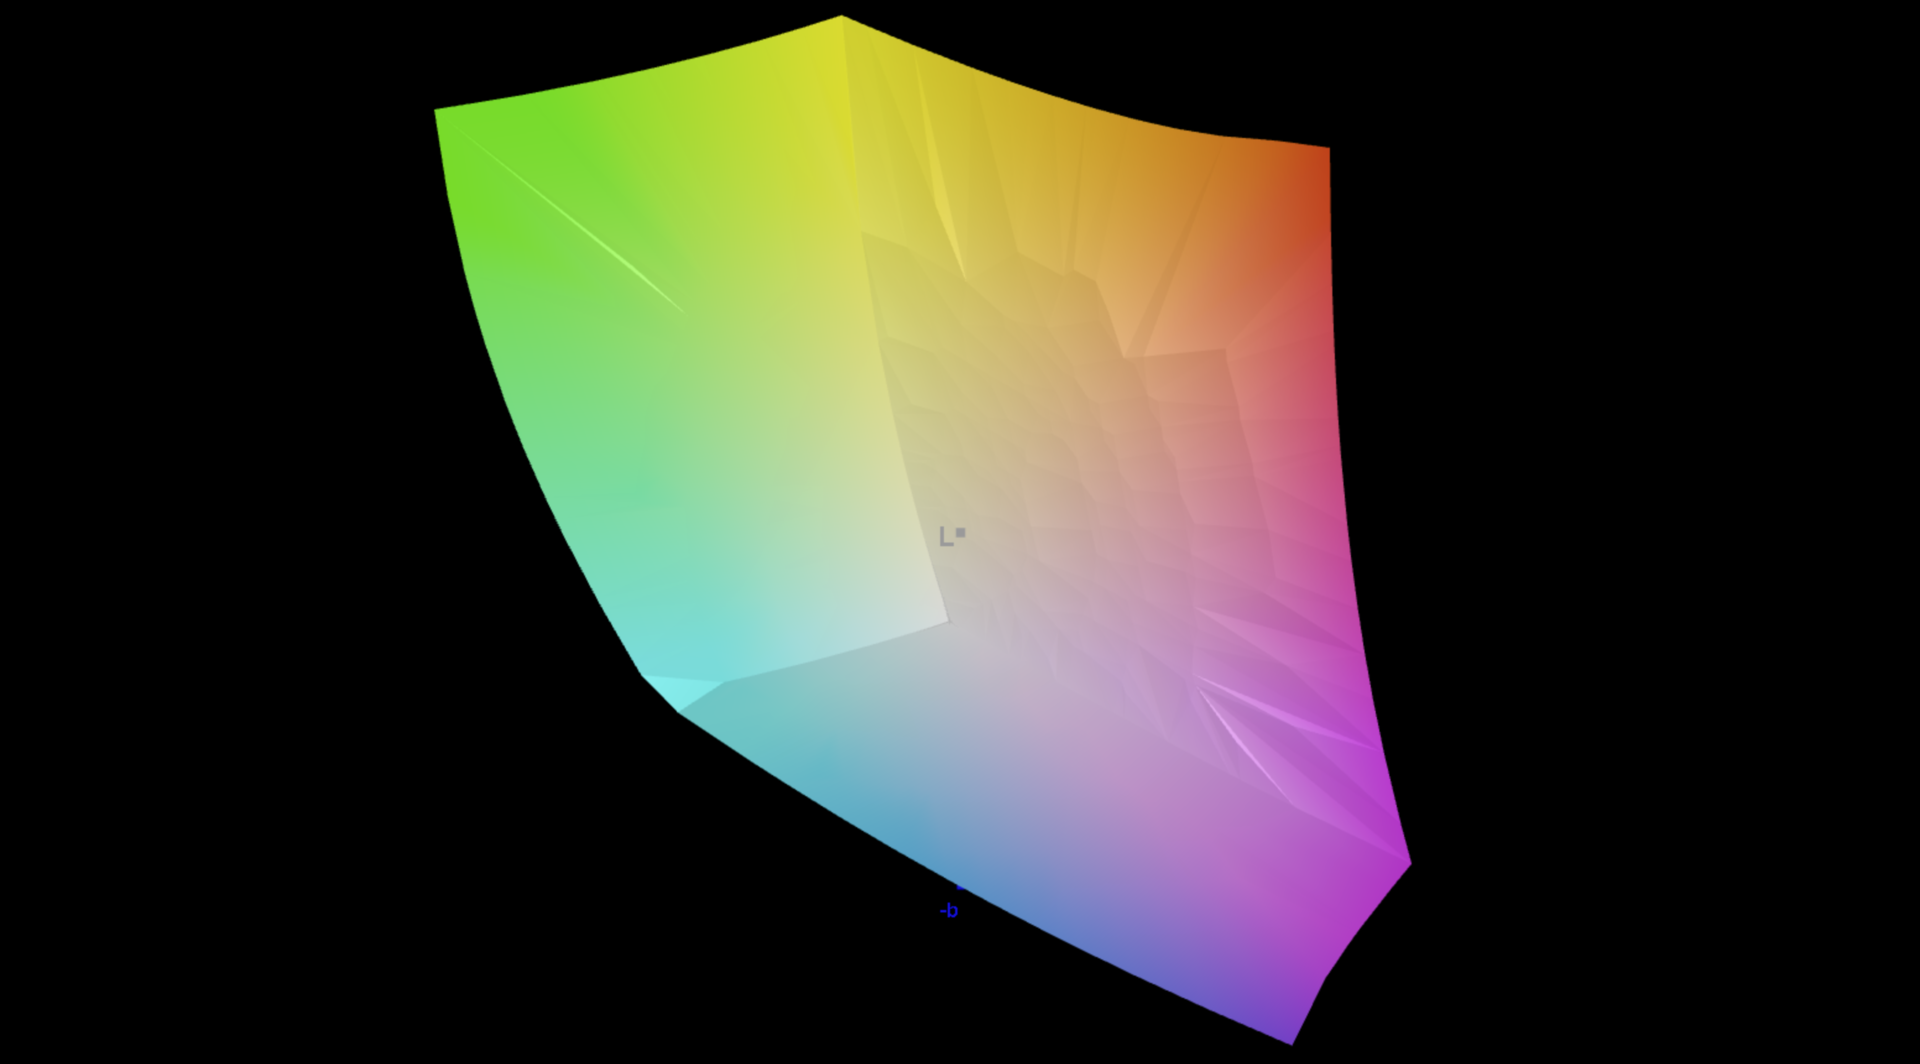
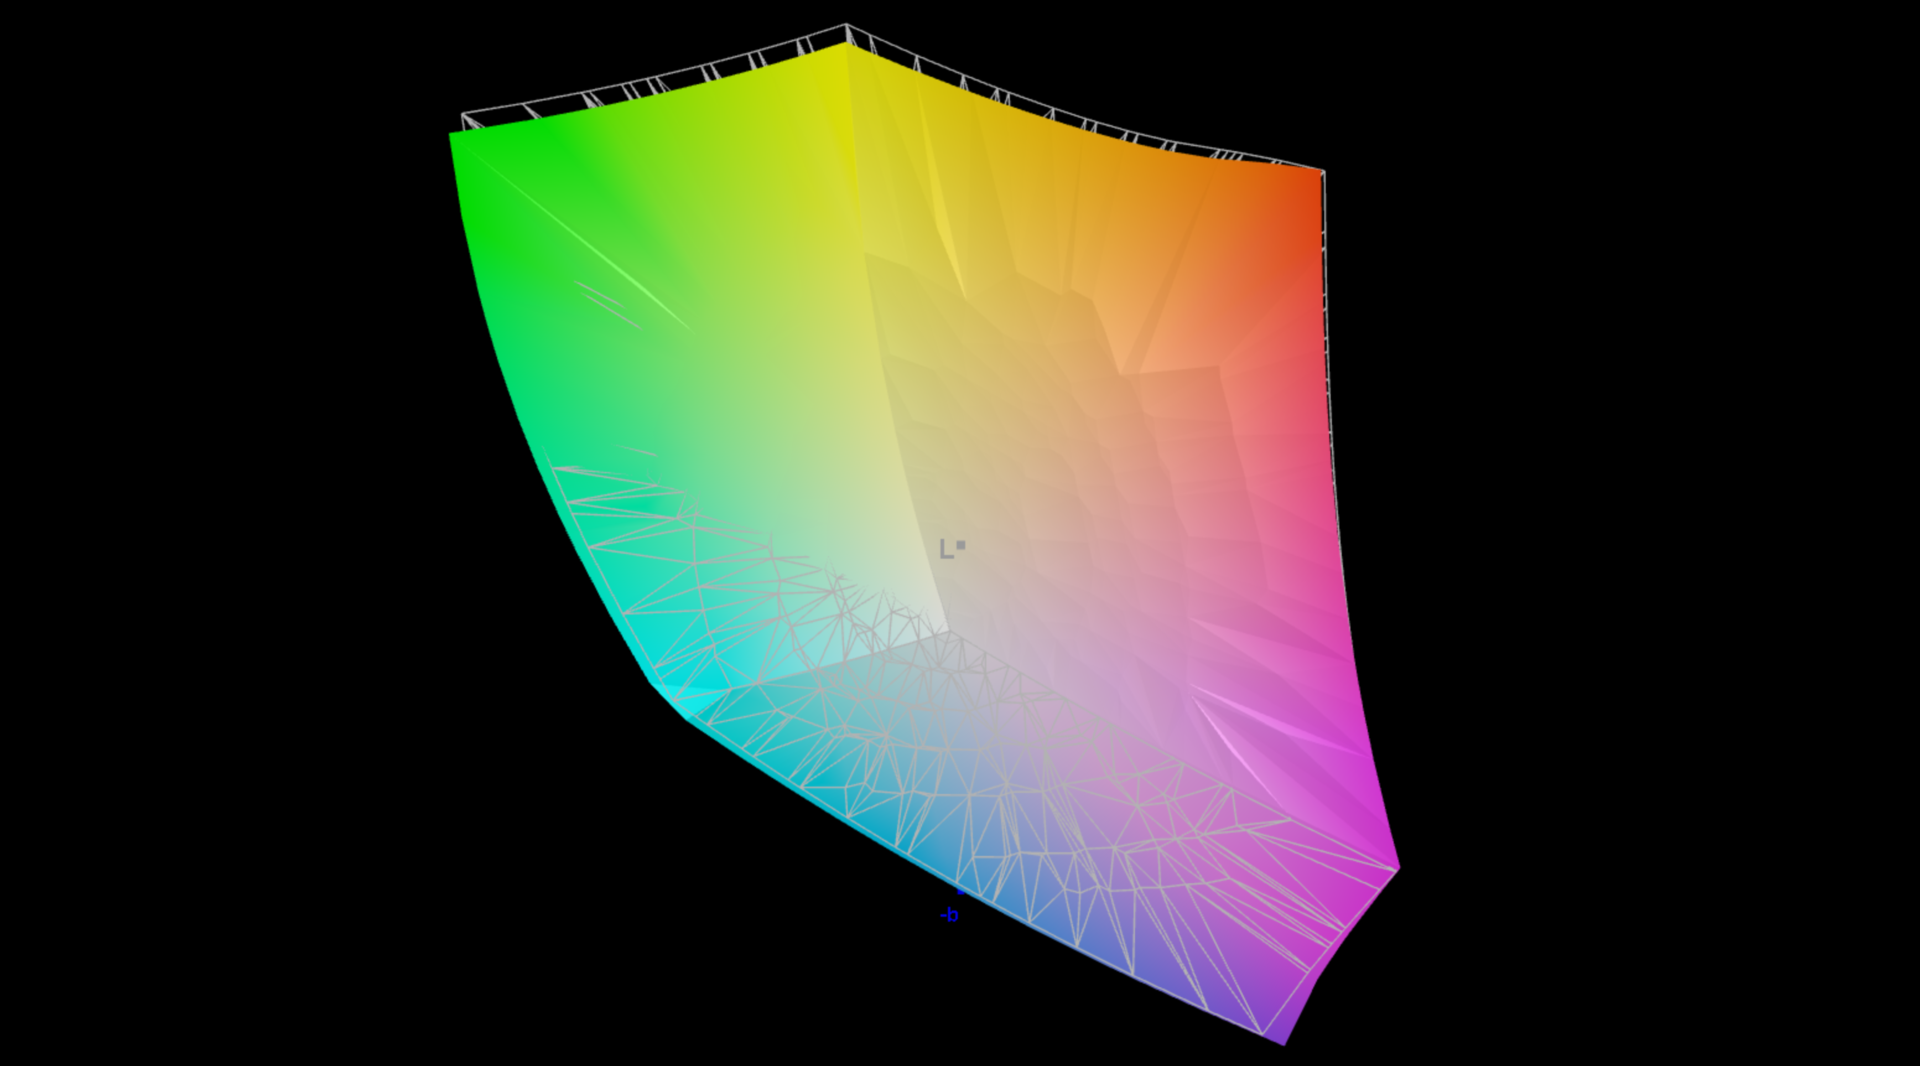
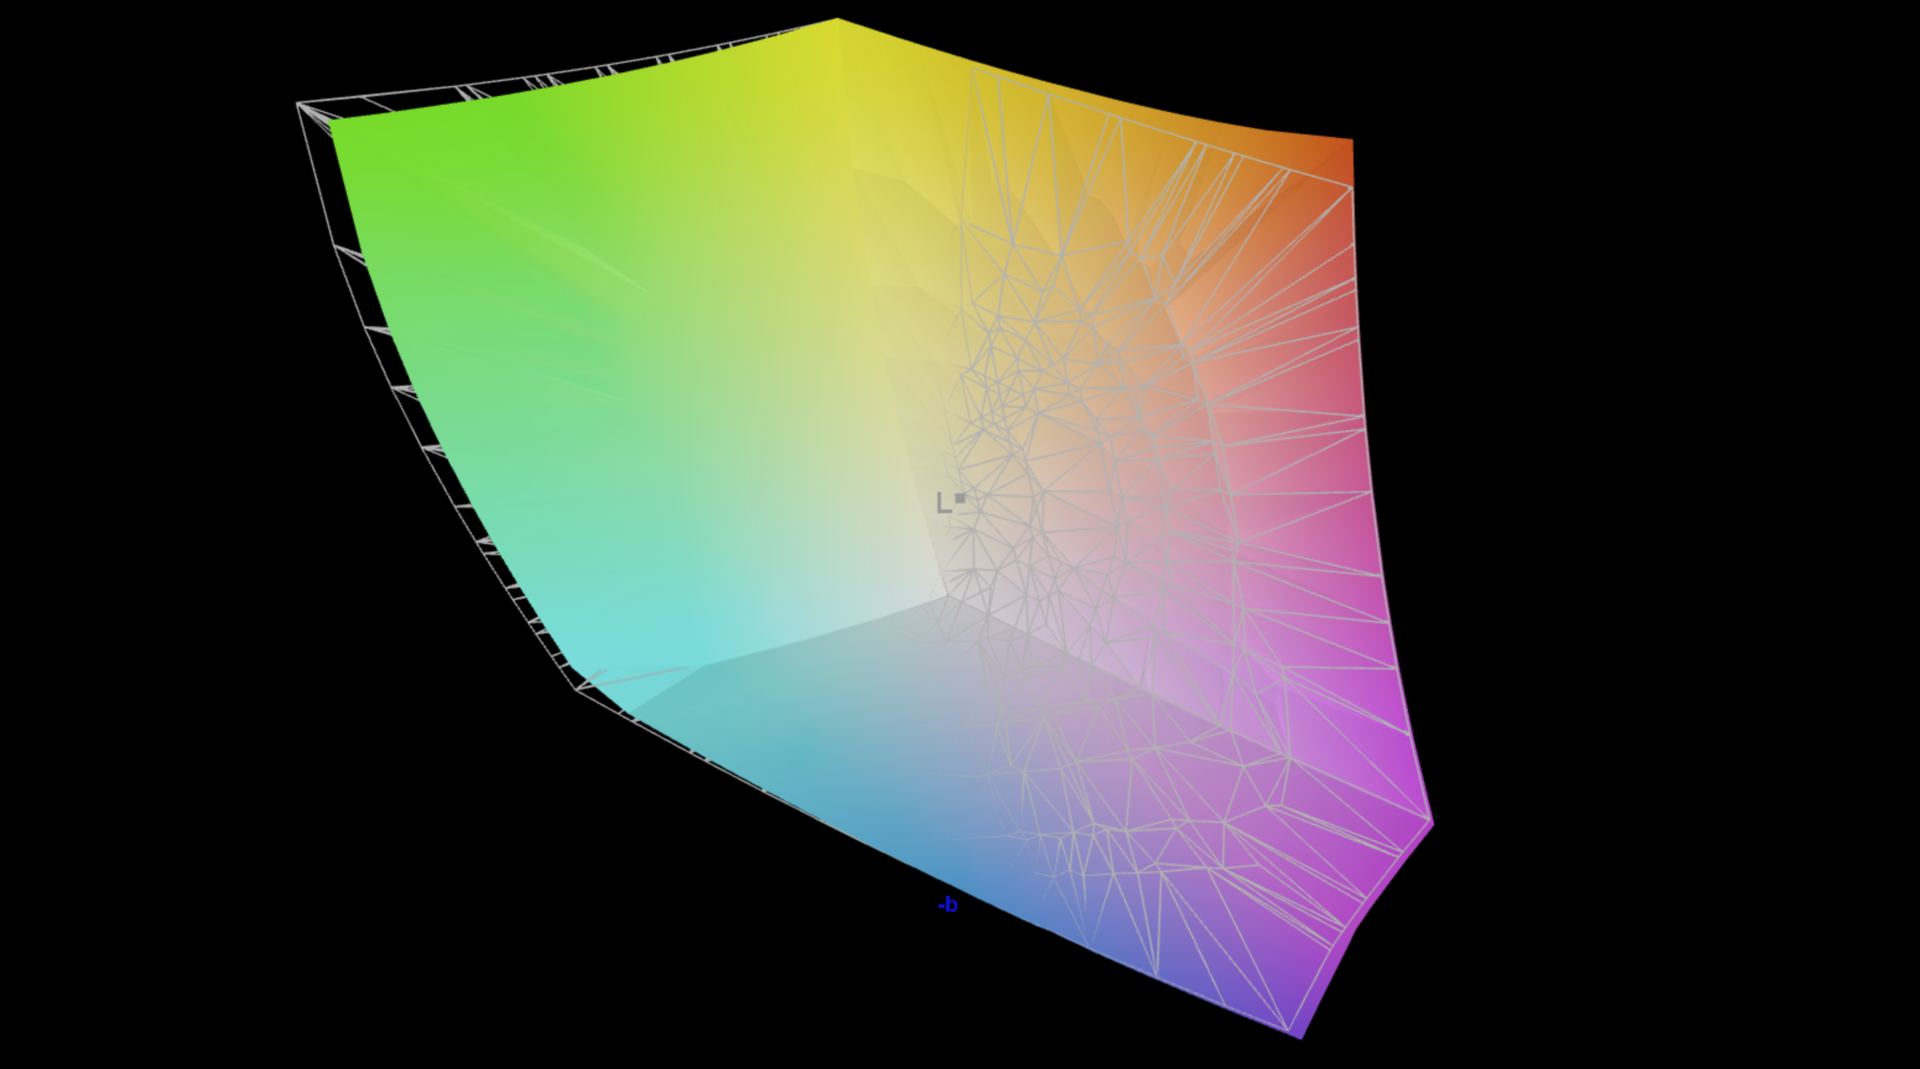
显示屏 - 1,600 cd/m² 的串联 OLED 显示屏

新型串联式 OLED 面板的分辨率为 3,200 x 2,000(16:10),频率为 120 Hz,并可选配触摸功能。主观画质非常出色,即使是明亮的表面也不会出现颗粒感。响应时间极快,只有在亮度为 60% 或更低时才会出现可测量的 PWM 闪烁,频率高达 1.2 kHz,振幅仅为 22%。因此,不会有任何问题。
与已经非常出色的 2.8K OLED的最大区别在于亮度,因为在 SDR 模式下亮度接近 1,000 尼特,而在 HDR 模式下亮度可达 1,600 尼特,图像部分较小(几乎全白的图像仍为 ~1,180 cd/m²)。因此,亮度值与 MacBook Pro 16 的微型 LED 面板相当。 MacBook Pro 16但联想在响应时间和色彩空间覆盖方面更具优势。另一方面,MacBook 还可选配哑光面板。
| |||||||||||||||||||||||||
Brightness Distribution: 98 %
Center on Battery: 984 cd/m²
Contrast: ∞:1 (Black: 0 cd/m²)
ΔE ColorChecker Calman: 0.9 | ∀{0.5-29.43 Ø4.72}
ΔE Greyscale Calman: 1.3 | ∀{0.09-98 Ø4.97}
96.8% AdobeRGB 1998 (Argyll 3D)
100% sRGB (Argyll 3D)
97.4% Display P3 (Argyll 3D)
Gamma: 2.21
CCT: 6751 K
| Lenovo Yoga Pro 9i 16 RTX 5070 ATNA60KA01-0, OLED, 3200x2000, 16", 120 Hz | Asus ProArt P16 H7606WP ATNA60CL10-0, OLED, 2880x1800, 16", 120 Hz | Lenovo Yoga Pro 9 16IAH G10 RTX 5060 ATNA60HR04-0, OLED, 2880x1800, 16", 120 Hz | Apple MacBook Pro 16 2024 M4 Pro Mini-LED, 3456x2234, 16.2", 120 Hz | Schenker XMG Core 16 M25 MNG007DA6-4, IPS, 2560x1600, 16", 300 Hz | |
|---|---|---|---|---|---|
| Display | -2% | -2% | -2% | -3% | |
| Display P3 Coverage (%) | 97.4 | 99.5 2% | 99 2% | 99.7 2% | 98.8 1% |
| sRGB Coverage (%) | 100 | 100 0% | 100 0% | 100 0% | 100 0% |
| AdobeRGB 1998 Coverage (%) | 96.8 | 89.5 -8% | 89.6 -7% | 88.8 -8% | 88.4 -9% |
| Response Times | -74% | -175% | -9057% | -2544% | |
| Response Time Grey 50% / Grey 80% * (ms) | 0.27 ? | 0.63 ? -133% | 1.47 ? -444% | 43 ? -15826% | 10.7 ? -3863% |
| Response Time Black / White * (ms) | 0.37 ? | 0.63 ? -70% | 0.42 ? -14% | 41.2 ? -11035% | 4.9 ? -1224% |
| PWM Frequency (Hz) | 1200 | 480 ? | 1200 ? | 14880 | |
| PWM Amplitude * (%) | 22 | 26 -18% | 37 -68% | 90 -309% | |
| Screen | -20% | -22% | 4% | -89% | |
| Brightness middle (cd/m²) | 974 | 362 -63% | 475 -51% | 632 -35% | 512 -47% |
| Brightness (cd/m²) | 979 | 363 -63% | 474 -52% | 616 -37% | 483 -51% |
| Brightness Distribution (%) | 98 | 99 1% | 97 -1% | 95 -3% | 91 -7% |
| Black Level * (cd/m²) | 0.43 | ||||
| Colorchecker dE 2000 * | 0.9 | 0.8 11% | 1 -11% | 0.6 33% | 2.4 -167% |
| Colorchecker dE 2000 max. * | 1.7 | 1.8 -6% | 2 -18% | 1.2 29% | 3.8 -124% |
| Greyscale dE 2000 * | 1.3 | 1.3 -0% | 1.3 -0% | 0.8 38% | 3.1 -138% |
| Gamma | 2.21 100% | 2.2 100% | 2.24 98% | 2.21 100% | 2.41 91% |
| CCT | 6751 96% | 6741 96% | 6672 97% | 6450 101% | 6534 99% |
| Contrast (:1) | 1191 | ||||
| Colorchecker dE 2000 calibrated * | 0.9 | ||||
| Total Average (Program / Settings) | -32% /
-29% | -66% /
-55% | -3018% /
-2263% | -879% /
-512% |
* ... smaller is better
在使用专业的 CalMAN 软件进行分析时,我们检查了各种色彩配置文件,在相应的配置文件中,色彩已经非常准确。唯一的例外是 AdobeRGB 中的 100% 红色,除此之外没有其他问题,我们也无法通过自己的校准进一步改善显示效果。


Display Response Times
| ↔ Response Time Black to White | ||
|---|---|---|
| 0.37 ms ... rise ↗ and fall ↘ combined | ↗ 0.2 ms rise |  |
| ↘ 0.17 ms fall | ||
| The screen shows very fast response rates in our tests and should be very well suited for fast-paced gaming. In comparison, all tested devices range from 0.1 (minimum) to 240 (maximum) ms. » 0 % of all devices are better. This means that the measured response time is better than the average of all tested devices (19.8 ms). | ||
| ↔ Response Time 50% Grey to 80% Grey | ||
| 0.27 ms ... rise ↗ and fall ↘ combined | ↗ 0.13 ms rise |  |
| ↘ 0.14 ms fall | ||
| The screen shows very fast response rates in our tests and should be very well suited for fast-paced gaming. In comparison, all tested devices range from 0.165 (minimum) to 636 (maximum) ms. » 0 % of all devices are better. This means that the measured response time is better than the average of all tested devices (31 ms). | ||
Screen Flickering / PWM (Pulse-Width Modulation)
| Screen flickering / PWM detected | 1200 Hz Amplitude: 22 % |  | |
The display backlight flickers at 1200 Hz (worst case, e.g., utilizing PWM) . The frequency of 1200 Hz is quite high, so most users sensitive to PWM should not notice any flickering. In comparison: 52 % of all tested devices do not use PWM to dim the display. If PWM was detected, an average of 7763 (minimum: 5 - maximum: 343500) Hz was measured. | |||


性能 - Core Ultra 9 和 RTX 5070


测试条件
我们在测试中使用了性能模式,但由于风扇音量较小,在游戏时也应尝试自动模式。
| 能耗曲线 | CPU TDP | CB24 Multi | GPU TGP | Time Spy Graphics | CP2077 QHD Ultra | max.风扇容量 |
|---|---|---|---|---|---|---|
| 省电模式 | 40 瓦 | 838 分 | 28 瓦 | 3,079 分 | 14.2 FPS | 30.6 dB(A) |
| 自动 | 80/65 瓦 | 1,114 分 | 75 瓦 | 12,025 分 | 62.1 FPS | 44.2 dB(A) |
| 功率 | 115/80 瓦 | 1,189 分 | 100 瓦 | 13,187 分 | 62.8 FPS | 52.7 dB(A) |
| 电池 | 80 瓦 | 1,185 分 | 65 瓦 | 10,912 分 | 53.1 FPS | 44.2 dB(A) |
处理器 - Core Ultra 9 285H
功率限制与之前测试的 Yoga Pro 完全相同,总体而言 Core Ultra 9 285H在单核测试中仅比 酷睿至尊 7 255H.因此,CPU 升级并不值得。MacBook Pro 16 的两颗 M4 芯片 MacBook Pro 16在单核心和多核心测试中,CPU 性能都有明显提升。
Cinebench R15 多耐久性测试
Cinebench 2024: CPU Multi Core | CPU Single Core
Cinebench R23: Multi Core | Single Core
Cinebench R20: CPU (Multi Core) | CPU (Single Core)
Cinebench R15: CPU Multi 64Bit | CPU Single 64Bit
Blender: v2.79 BMW27 CPU
7-Zip 18.03: 7z b 4 | 7z b 4 -mmt1
Geekbench 6.7: Multi-Core | Single-Core
Geekbench 5.5: Multi-Core | Single-Core
HWBOT x265 Benchmark v2.2: 4k Preset
LibreOffice : 20 Documents To PDF
R Benchmark 2.5: Overall mean
| CPU Performance rating | |
| Apple MacBook Pro 16 M4 Max -8! | |
| Apple MacBook Pro 16 2024 M4 Pro -12! | |
| Lenovo Yoga Pro 9i 16 RTX 5070 | |
| Lenovo Yoga Pro 9 16IAH G10 RTX 5060 | |
| Asus ProArt P16 H7606WP | |
| Average Intel Core Ultra 9 285H | |
| Dell XPS 16 9640 | |
| Average of class Multimedia | |
| Cinebench 2024 / CPU Multi Core | |
| Apple MacBook Pro 16 M4 Max | |
| Apple MacBook Pro 16 M4 Max | |
| Apple MacBook Pro 16 2024 M4 Pro | |
| Asus ProArt P16 H7606WP | |
| Lenovo Yoga Pro 9 16IAH G10 RTX 5060 | |
| Lenovo Yoga Pro 9i 16 RTX 5070 | |
| Average Intel Core Ultra 9 285H (740 - 1194, n=11) | |
| Average of class Multimedia (327 - 2437, n=78, last 2 years) | |
| Dell XPS 16 9640 | |
| Cinebench 2024 / CPU Single Core | |
| Apple MacBook Pro 16 2024 M4 Pro | |
| Apple MacBook Pro 16 M4 Max | |
| Lenovo Yoga Pro 9i 16 RTX 5070 | |
| Average Intel Core Ultra 9 285H (124.8 - 130, n=11) | |
| Average of class Multimedia (72.5 - 201, n=62, last 2 years) | |
| Lenovo Yoga Pro 9 16IAH G10 RTX 5060 | |
| Asus ProArt P16 H7606WP | |
| Dell XPS 16 9640 | |
| Cinebench R23 / Multi Core | |
| Apple MacBook Pro 16 M4 Max | |
| Asus ProArt P16 H7606WP | |
| Lenovo Yoga Pro 9i 16 RTX 5070 | |
| Apple MacBook Pro 16 2024 M4 Pro | |
| Lenovo Yoga Pro 9 16IAH G10 RTX 5060 | |
| Average Intel Core Ultra 9 285H (15070 - 23576, n=12) | |
| Dell XPS 16 9640 | |
| Average of class Multimedia (4861 - 33362, n=80, last 2 years) | |
| Cinebench R23 / Single Core | |
| Apple MacBook Pro 16 2024 M4 Pro | |
| Apple MacBook Pro 16 M4 Max | |
| Lenovo Yoga Pro 9i 16 RTX 5070 | |
| Average Intel Core Ultra 9 285H (1979 - 2166, n=12) | |
| Lenovo Yoga Pro 9 16IAH G10 RTX 5060 | |
| Asus ProArt P16 H7606WP | |
| Average of class Multimedia (1128 - 2459, n=72, last 2 years) | |
| Dell XPS 16 9640 | |
| Cinebench R20 / CPU (Multi Core) | |
| Asus ProArt P16 H7606WP | |
| Lenovo Yoga Pro 9i 16 RTX 5070 | |
| Lenovo Yoga Pro 9 16IAH G10 RTX 5060 | |
| Average Intel Core Ultra 9 285H (5861 - 9208, n=12) | |
| Dell XPS 16 9640 | |
| Apple MacBook Pro 16 M4 Max | |
| Average of class Multimedia (1887 - 12912, n=63, last 2 years) | |
| Cinebench R20 / CPU (Single Core) | |
| Lenovo Yoga Pro 9i 16 RTX 5070 | |
| Average Intel Core Ultra 9 285H (761 - 837, n=12) | |
| Asus ProArt P16 H7606WP | |
| Lenovo Yoga Pro 9 16IAH G10 RTX 5060 | |
| Average of class Multimedia (425 - 853, n=63, last 2 years) | |
| Dell XPS 16 9640 | |
| Apple MacBook Pro 16 M4 Max | |
| Cinebench R15 / CPU Multi 64Bit | |
| Apple MacBook Pro 16 M4 Max | |
| Lenovo Yoga Pro 9i 16 RTX 5070 | |
| Asus ProArt P16 H7606WP | |
| Lenovo Yoga Pro 9 16IAH G10 RTX 5060 | |
| Average Intel Core Ultra 9 285H (2280 - 3496, n=12) | |
| Dell XPS 16 9640 | |
| Average of class Multimedia (856 - 5224, n=67, last 2 years) | |
| Cinebench R15 / CPU Single 64Bit | |
| Lenovo Yoga Pro 9i 16 RTX 5070 | |
| Average Intel Core Ultra 9 285H (288 - 322, n=12) | |
| Lenovo Yoga Pro 9 16IAH G10 RTX 5060 | |
| Apple MacBook Pro 16 M4 Max | |
| Average of class Multimedia (184.8 - 326, n=65, last 2 years) | |
| Dell XPS 16 9640 | |
| Asus ProArt P16 H7606WP | |
| Blender / v2.79 BMW27 CPU | |
| Average of class Multimedia (100 - 557, n=64, last 2 years) | |
| Average Intel Core Ultra 9 285H (151 - 235, n=12) | |
| Dell XPS 16 9640 | |
| Lenovo Yoga Pro 9 16IAH G10 RTX 5060 | |
| Lenovo Yoga Pro 9i 16 RTX 5070 | |
| Asus ProArt P16 H7606WP | |
| 7-Zip 18.03 / 7z b 4 | |
| Asus ProArt P16 H7606WP | |
| Lenovo Yoga Pro 9i 16 RTX 5070 | |
| Dell XPS 16 9640 | |
| Lenovo Yoga Pro 9 16IAH G10 RTX 5060 | |
| Average Intel Core Ultra 9 285H (50116 - 71959, n=12) | |
| Average of class Multimedia (26062 - 130368, n=61, last 2 years) | |
| 7-Zip 18.03 / 7z b 4 -mmt1 | |
| Lenovo Yoga Pro 9i 16 RTX 5070 | |
| Average Intel Core Ultra 9 285H (5403 - 6419, n=12) | |
| Asus ProArt P16 H7606WP | |
| Lenovo Yoga Pro 9 16IAH G10 RTX 5060 | |
| Average of class Multimedia (3666 - 7545, n=62, last 2 years) | |
| Dell XPS 16 9640 | |
| Geekbench 6.7 / Multi-Core | |
| Apple MacBook Pro 16 M4 Max | |
| Apple MacBook Pro 16 2024 M4 Pro | |
| Lenovo Yoga Pro 9i 16 RTX 5070 | |
| Lenovo Yoga Pro 9 16IAH G10 RTX 5060 | |
| Average Intel Core Ultra 9 285H (15284 - 17992, n=15) | |
| Asus ProArt P16 H7606WP | |
| Average of class Multimedia (4983 - 29415, n=75, last 2 years) | |
| Dell XPS 16 9640 | |
| Geekbench 6.7 / Single-Core | |
| Apple MacBook Pro 16 M4 Max | |
| Apple MacBook Pro 16 2024 M4 Pro | |
| Lenovo Yoga Pro 9i 16 RTX 5070 | |
| Asus ProArt P16 H7606WP | |
| Average of class Multimedia (1534 - 4335, n=74, last 2 years) | |
| Average Intel Core Ultra 9 285H (2665 - 3110, n=15) | |
| Lenovo Yoga Pro 9 16IAH G10 RTX 5060 | |
| Dell XPS 16 9640 | |
| Geekbench 5.5 / Multi-Core | |
| Lenovo Yoga Pro 9i 16 RTX 5070 | |
| Lenovo Yoga Pro 9 16IAH G10 RTX 5060 | |
| Average Intel Core Ultra 9 285H (13140 - 17487, n=13) | |
| Asus ProArt P16 H7606WP | |
| Dell XPS 16 9640 | |
| Average of class Multimedia (4652 - 20422, n=61, last 2 years) | |
| Geekbench 5.5 / Single-Core | |
| Asus ProArt P16 H7606WP | |
| Lenovo Yoga Pro 9i 16 RTX 5070 | |
| Average Intel Core Ultra 9 285H (1689 - 2256, n=13) | |
| Lenovo Yoga Pro 9 16IAH G10 RTX 5060 | |
| Average of class Multimedia (805 - 2974, n=61, last 2 years) | |
| Dell XPS 16 9640 | |
| HWBOT x265 Benchmark v2.2 / 4k Preset | |
| Asus ProArt P16 H7606WP | |
| Lenovo Yoga Pro 9i 16 RTX 5070 | |
| Lenovo Yoga Pro 9 16IAH G10 RTX 5060 | |
| Average Intel Core Ultra 9 285H (17.9 - 27.2, n=12) | |
| Dell XPS 16 9640 | |
| Average of class Multimedia (5.26 - 36.1, n=62, last 2 years) | |
| LibreOffice / 20 Documents To PDF | |
| Asus ProArt P16 H7606WP | |
| Average of class Multimedia (23.9 - 146.7, n=63, last 2 years) | |
| Average Intel Core Ultra 9 285H (39.4 - 56.1, n=12) | |
| Dell XPS 16 9640 | |
| Lenovo Yoga Pro 9i 16 RTX 5070 | |
| Lenovo Yoga Pro 9 16IAH G10 RTX 5060 | |
| R Benchmark 2.5 / Overall mean | |
| Dell XPS 16 9640 | |
| Average of class Multimedia (0.3604 - 0.947, n=62, last 2 years) | |
| Lenovo Yoga Pro 9 16IAH G10 RTX 5060 | |
| Average Intel Core Ultra 9 285H (0.4079 - 0.4794, n=12) | |
| Lenovo Yoga Pro 9i 16 RTX 5070 | |
| Asus ProArt P16 H7606WP | |
* ... smaller is better
AIDA64: FP32 Ray-Trace | FPU Julia | CPU SHA3 | CPU Queen | FPU SinJulia | FPU Mandel | CPU AES | CPU ZLib | FP64 Ray-Trace | CPU PhotoWorxx
| Performance rating | |
| Schenker XMG Core 16 M25 | |
| Asus ProArt P16 H7606WP | |
| Lenovo Yoga Pro 9i 16 RTX 5070 | |
| Lenovo Yoga Pro 9 16IAH G10 RTX 5060 | |
| Average Intel Core Ultra 9 285H | |
| Average of class Multimedia | |
| AIDA64 / FP32 Ray-Trace | |
| Asus ProArt P16 H7606WP | |
| Schenker XMG Core 16 M25 | |
| Lenovo Yoga Pro 9 16IAH G10 RTX 5060 | |
| Lenovo Yoga Pro 9i 16 RTX 5070 | |
| Average Intel Core Ultra 9 285H (13687 - 24612, n=14) | |
| Average of class Multimedia (2214 - 50388, n=59, last 2 years) | |
| AIDA64 / FPU Julia | |
| Asus ProArt P16 H7606WP | |
| Schenker XMG Core 16 M25 | |
| Lenovo Yoga Pro 9i 16 RTX 5070 | |
| Lenovo Yoga Pro 9 16IAH G10 RTX 5060 | |
| Average Intel Core Ultra 9 285H (54365 - 129641, n=14) | |
| Average of class Multimedia (12867 - 201874, n=60, last 2 years) | |
| AIDA64 / CPU SHA3 | |
| Schenker XMG Core 16 M25 | |
| Asus ProArt P16 H7606WP | |
| Lenovo Yoga Pro 9i 16 RTX 5070 | |
| Lenovo Yoga Pro 9 16IAH G10 RTX 5060 | |
| Average Intel Core Ultra 9 285H (3473 - 5879, n=14) | |
| Average of class Multimedia (626 - 8623, n=60, last 2 years) | |
| AIDA64 / CPU Queen | |
| Asus ProArt P16 H7606WP | |
| Schenker XMG Core 16 M25 | |
| Average of class Multimedia (13483 - 181505, n=47, last 2 years) | |
| Lenovo Yoga Pro 9i 16 RTX 5070 | |
| Lenovo Yoga Pro 9 16IAH G10 RTX 5060 | |
| Average Intel Core Ultra 9 285H (53557 - 67363, n=12) | |
| AIDA64 / FPU SinJulia | |
| Schenker XMG Core 16 M25 | |
| Asus ProArt P16 H7606WP | |
| Lenovo Yoga Pro 9i 16 RTX 5070 | |
| Lenovo Yoga Pro 9 16IAH G10 RTX 5060 | |
| Average of class Multimedia (886 - 28794, n=60, last 2 years) | |
| Average Intel Core Ultra 9 285H (6921 - 9378, n=14) | |
| AIDA64 / FPU Mandel | |
| Asus ProArt P16 H7606WP | |
| Schenker XMG Core 16 M25 | |
| Lenovo Yoga Pro 9i 16 RTX 5070 | |
| Lenovo Yoga Pro 9 16IAH G10 RTX 5060 | |
| Average Intel Core Ultra 9 285H (38174 - 64632, n=14) | |
| Average of class Multimedia (6395 - 105740, n=59, last 2 years) | |
| AIDA64 / CPU AES | |
| Schenker XMG Core 16 M25 | |
| Asus ProArt P16 H7606WP | |
| Lenovo Yoga Pro 9i 16 RTX 5070 | |
| Lenovo Yoga Pro 9 16IAH G10 RTX 5060 | |
| Average Intel Core Ultra 9 285H (58110 - 117613, n=14) | |
| Average of class Multimedia (8171 - 126790, n=60, last 2 years) | |
| AIDA64 / CPU ZLib | |
| Schenker XMG Core 16 M25 | |
| Asus ProArt P16 H7606WP | |
| Lenovo Yoga Pro 9i 16 RTX 5070 | |
| Lenovo Yoga Pro 9 16IAH G10 RTX 5060 | |
| Average Intel Core Ultra 9 285H (574 - 1366, n=14) | |
| Average of class Multimedia (143.8 - 2022, n=60, last 2 years) | |
| AIDA64 / FP64 Ray-Trace | |
| Asus ProArt P16 H7606WP | |
| Schenker XMG Core 16 M25 | |
| Lenovo Yoga Pro 9i 16 RTX 5070 | |
| Lenovo Yoga Pro 9 16IAH G10 RTX 5060 | |
| Average Intel Core Ultra 9 285H (5509 - 13527, n=14) | |
| Average of class Multimedia (1014 - 26875, n=60, last 2 years) | |
| AIDA64 / CPU PhotoWorxx | |
| Lenovo Yoga Pro 9 16IAH G10 RTX 5060 | |
| Lenovo Yoga Pro 9i 16 RTX 5070 | |
| Average Intel Core Ultra 9 285H (49874 - 65392, n=14) | |
| Schenker XMG Core 16 M25 | |
| Average of class Multimedia (8187 - 88154, n=60, last 2 years) | |
| Asus ProArt P16 H7606WP | |
系统性能
系统性能非常好,测试过程中没有出现稳定性问题。由于采用了 Advanced Optimus 图形切换技术,在激活 Nvidia GPU 时(例如启动游戏时)会出现短暂的卡顿,但这属于正常现象。
PCMark 10: Score | Essentials | Productivity | Digital Content Creation
CrossMark: Overall | Productivity | Creativity | Responsiveness
WebXPRT 3: Overall
WebXPRT 4: Overall
Mozilla Kraken 1.1: Total
| Performance rating | |
| Apple MacBook Pro 16 M4 Max -4! | |
| Apple MacBook Pro 16 2024 M4 Pro -4! | |
| Average Intel Core Ultra 9 285H, NVIDIA GeForce RTX 5070 Laptop | |
| Lenovo Yoga Pro 9i 16 RTX 5070 | |
| Dell XPS 16 9640 -1! | |
| Lenovo Yoga Pro 9 16IAH G10 RTX 5060 | |
| Asus ProArt P16 H7606WP | |
| Average of class Multimedia | |
| PCMark 10 / Score | |
| Average Intel Core Ultra 9 285H, NVIDIA GeForce RTX 5070 Laptop (8267 - 9691, n=2) | |
| Lenovo Yoga Pro 9i 16 RTX 5070 | |
| Asus ProArt P16 H7606WP | |
| Lenovo Yoga Pro 9 16IAH G10 RTX 5060 | |
| Average of class Multimedia (4325 - 10386, n=57, last 2 years) | |
| Dell XPS 16 9640 | |
| PCMark 10 / Essentials | |
| Asus ProArt P16 H7606WP | |
| Lenovo Yoga Pro 9i 16 RTX 5070 | |
| Lenovo Yoga Pro 9 16IAH G10 RTX 5060 | |
| Average of class Multimedia (8025 - 11664, n=56, last 2 years) | |
| Average Intel Core Ultra 9 285H, NVIDIA GeForce RTX 5070 Laptop (10345 - 10564, n=2) | |
| Dell XPS 16 9640 | |
| PCMark 10 / Productivity | |
| Average Intel Core Ultra 9 285H, NVIDIA GeForce RTX 5070 Laptop (9402 - 18233, n=2) | |
| Average of class Multimedia (7323 - 18233, n=56, last 2 years) | |
| Lenovo Yoga Pro 9i 16 RTX 5070 | |
| Lenovo Yoga Pro 9 16IAH G10 RTX 5060 | |
| Dell XPS 16 9640 | |
| Asus ProArt P16 H7606WP | |
| PCMark 10 / Digital Content Creation | |
| Lenovo Yoga Pro 9i 16 RTX 5070 | |
| Asus ProArt P16 H7606WP | |
| Average Intel Core Ultra 9 285H, NVIDIA GeForce RTX 5070 Laptop (13096 - 15438, n=2) | |
| Lenovo Yoga Pro 9 16IAH G10 RTX 5060 | |
| Average of class Multimedia (3651 - 16240, n=56, last 2 years) | |
| Dell XPS 16 9640 | |
| CrossMark / Overall | |
| Apple MacBook Pro 16 M4 Max | |
| Average Intel Core Ultra 9 285H, NVIDIA GeForce RTX 5070 Laptop (2077 - 2236, n=2) | |
| Apple MacBook Pro 16 2024 M4 Pro | |
| Lenovo Yoga Pro 9i 16 RTX 5070 | |
| Lenovo Yoga Pro 9 16IAH G10 RTX 5060 | |
| Asus ProArt P16 H7606WP | |
| Average of class Multimedia (866 - 2728, n=66, last 2 years) | |
| Dell XPS 16 9640 | |
| CrossMark / Productivity | |
| Apple MacBook Pro 16 M4 Max | |
| Average Intel Core Ultra 9 285H, NVIDIA GeForce RTX 5070 Laptop (1920 - 2092, n=2) | |
| Apple MacBook Pro 16 2024 M4 Pro | |
| Lenovo Yoga Pro 9i 16 RTX 5070 | |
| Lenovo Yoga Pro 9 16IAH G10 RTX 5060 | |
| Dell XPS 16 9640 | |
| Average of class Multimedia (931 - 2489, n=66, last 2 years) | |
| Asus ProArt P16 H7606WP | |
| CrossMark / Creativity | |
| Apple MacBook Pro 16 M4 Max | |
| Apple MacBook Pro 16 2024 M4 Pro | |
| Average Intel Core Ultra 9 285H, NVIDIA GeForce RTX 5070 Laptop (2438 - 2470, n=2) | |
| Lenovo Yoga Pro 9i 16 RTX 5070 | |
| Lenovo Yoga Pro 9 16IAH G10 RTX 5060 | |
| Asus ProArt P16 H7606WP | |
| Average of class Multimedia (907 - 3465, n=66, last 2 years) | |
| Dell XPS 16 9640 | |
| CrossMark / Responsiveness | |
| Average Intel Core Ultra 9 285H, NVIDIA GeForce RTX 5070 Laptop (1629 - 2024, n=2) | |
| Dell XPS 16 9640 | |
| Lenovo Yoga Pro 9i 16 RTX 5070 | |
| Lenovo Yoga Pro 9 16IAH G10 RTX 5060 | |
| Apple MacBook Pro 16 M4 Max | |
| Apple MacBook Pro 16 2024 M4 Pro | |
| Asus ProArt P16 H7606WP | |
| Average of class Multimedia (605 - 2024, n=66, last 2 years) | |
| WebXPRT 3 / Overall | |
| Apple MacBook Pro 16 M4 Max | |
| Apple MacBook Pro 16 2024 M4 Pro | |
| Lenovo Yoga Pro 9i 16 RTX 5070 | |
| Average of class Multimedia (136.4 - 596, n=69, last 2 years) | |
| Average Intel Core Ultra 9 285H, NVIDIA GeForce RTX 5070 Laptop (326 - 345, n=2) | |
| Asus ProArt P16 H7606WP | |
| Lenovo Yoga Pro 9 16IAH G10 RTX 5060 | |
| Dell XPS 16 9640 | |
| WebXPRT 4 / Overall | |
| Apple MacBook Pro 16 M4 Max | |
| Apple MacBook Pro 16 2024 M4 Pro | |
| Lenovo Yoga Pro 9i 16 RTX 5070 | |
| Average Intel Core Ultra 9 285H, NVIDIA GeForce RTX 5070 Laptop (303 - 311, n=2) | |
| Lenovo Yoga Pro 9 16IAH G10 RTX 5060 | |
| Average of class Multimedia (167.3 - 402, n=70, last 2 years) | |
| Asus ProArt P16 H7606WP | |
| Dell XPS 16 9640 | |
| Mozilla Kraken 1.1 / Total | |
| Average of class Multimedia (228 - 835, n=72, last 2 years) | |
| Lenovo Yoga Pro 9 16IAH G10 RTX 5060 | |
| Asus ProArt P16 H7606WP | |
| Average Intel Core Ultra 9 285H, NVIDIA GeForce RTX 5070 Laptop (433 - 444, n=2) | |
| Lenovo Yoga Pro 9i 16 RTX 5070 | |
| Apple MacBook Pro 16 M4 Max | |
| Apple MacBook Pro 16 2024 M4 Pro | |
* ... smaller is better
| PCMark 10 Score | 8267 points | |
Help | ||
| AIDA64 / Memory Copy | |
| Lenovo Yoga Pro 9i 16 RTX 5070 | |
| Lenovo Yoga Pro 9 16IAH G10 RTX 5060 | |
| Dell XPS 16 9640 | |
| Average Intel Core Ultra 9 285H (76179 - 109252, n=14) | |
| Asus ProArt P16 H7606WP | |
| Average of class Multimedia (11299 - 132135, n=60, last 2 years) | |
| AIDA64 / Memory Read | |
| Asus ProArt P16 H7606WP | |
| Lenovo Yoga Pro 9 16IAH G10 RTX 5060 | |
| Lenovo Yoga Pro 9i 16 RTX 5070 | |
| Dell XPS 16 9640 | |
| Average of class Multimedia (11624 - 174586, n=60, last 2 years) | |
| Average Intel Core Ultra 9 285H (74572 - 89837, n=14) | |
| AIDA64 / Memory Write | |
| Asus ProArt P16 H7606WP | |
| Lenovo Yoga Pro 9 16IAH G10 RTX 5060 | |
| Average of class Multimedia (11755 - 134998, n=60, last 2 years) | |
| Average Intel Core Ultra 9 285H (62446 - 107584, n=14) | |
| Dell XPS 16 9640 | |
| Lenovo Yoga Pro 9i 16 RTX 5070 | |
| AIDA64 / Memory Latency | |
| Dell XPS 16 9640 | |
| Lenovo Yoga Pro 9 16IAH G10 RTX 5060 | |
| Average Intel Core Ultra 9 285H (106.2 - 136.7, n=14) | |
| Lenovo Yoga Pro 9i 16 RTX 5070 | |
| Average of class Multimedia (7 - 535, n=59, last 2 years) | |
| Asus ProArt P16 H7606WP | |
* ... smaller is better
DPC 延迟


| DPC Latencies / LatencyMon - interrupt to process latency (max), Web, Youtube, Prime95 | |
| Lenovo Yoga Pro 9i 16 RTX 5070 | |
| Dell XPS 16 9640 | |
| Asus ProArt P16 H7606WP | |
| Lenovo Yoga Pro 9 16IAH G10 RTX 5060 | |
* ... smaller is better
大容量存储器
我们的测试设备配备了两块来自西部数据的 1 TB SSD(864 + 949 GB 可用容量)。PCIe 4.0 SSD 的性能非常出色,即使在长时间负载的情况下也能保持稳定。

* ... smaller is better
连续读取性能DiskSpd 读取循环,队列深度 8
图形处理器性能
Yoga 配备了移动 英伟达GeForce RTX 5070(高级擎天柱),联想没有提供更快的 GPU。100 瓦变体的性能符合预期,我们在基准测试中看到它比移动 RTX 5060 有大约 10-15% 的优势。在玩游戏时,最好将分辨率限制在 1080p,因为 5070 在这里感觉最舒适。在更高分辨率下,相当低的 VRAM(8 GB)在当前的一些游戏中也会成为问题。
| 3DMark 11 Performance | 36611 points | |
| 3DMark Fire Strike Score | 30655 points | |
| 3DMark Time Spy Score | 13315 points | |
| 3DMark Steel Nomad Score | 2906 points | |
| 3DMark Steel Nomad Light Score | 13721 points | |
Help | ||
| Blender / v3.3 Classroom OPTIX/RTX | |
| Average of class Multimedia (12 - 105, n=24, last 2 years) | |
| Lenovo Yoga Pro 9i 16 RTX 5070 | |
| Lenovo Yoga Pro 9 16IAH G10 RTX 5060 | |
| Dell XPS 16 9640 | |
| Average NVIDIA GeForce RTX 5070 Laptop (17 - 24, n=28) | |
| Asus ProArt P16 H7606WP | |
| Blender / v3.3 Classroom CUDA | |
| Average of class Multimedia (20 - 186, n=24, last 2 years) | |
| Lenovo Yoga Pro 9 16IAH G10 RTX 5060 | |
| Average NVIDIA GeForce RTX 5070 Laptop (29 - 228, n=29) | |
| Dell XPS 16 9640 | |
| Lenovo Yoga Pro 9i 16 RTX 5070 | |
| Asus ProArt P16 H7606WP | |
| Blender / v3.3 Classroom METAL | |
| Average of class Multimedia (17.8 - 68, n=5, last 2 years) | |
| Apple MacBook Pro 16 M4 Max | |
| Blender / v3.3 Classroom CPU | |
| Average of class Multimedia (134.5 - 1042, n=66, last 2 years) | |
| Dell XPS 16 9640 | |
| Lenovo Yoga Pro 9 16IAH G10 RTX 5060 | |
| Average NVIDIA GeForce RTX 5070 Laptop (137 - 507, n=26) | |
| Lenovo Yoga Pro 9i 16 RTX 5070 | |
| Asus ProArt P16 H7606WP | |
| Apple MacBook Pro 16 M4 Max | |
* ... smaller is better
| GTA V - 1920x1080 Highest AA:4xMSAA + FX AF:16x | |
| Lenovo Yoga Pro 9i 16 RTX 5070 | |
| Lenovo Yoga Pro 9 16IAH G10 RTX 5060 | |
| Asus ProArt P16 H7606WP | |
| Dell XPS 16 9640 | |
| Average of class Multimedia (7.92 - 141.6, n=61, last 2 years) | |
| Final Fantasy XV Benchmark - 1920x1080 High Quality | |
| Lenovo Yoga Pro 9i 16 RTX 5070 | |
| Asus ProArt P16 H7606WP | |
| Lenovo Yoga Pro 9 16IAH G10 RTX 5060 | |
| Dell XPS 16 9640 | |
| Average of class Multimedia (7.61 - 144.4, n=64, last 2 years) | |
| Strange Brigade - 1920x1080 ultra AA:ultra AF:16 | |
| Asus ProArt P16 H7606WP | |
| Lenovo Yoga Pro 9i 16 RTX 5070 | |
| Lenovo Yoga Pro 9 16IAH G10 RTX 5060 | |
| Dell XPS 16 9640 | |
| Average of class Multimedia (13.3 - 303, n=64, last 2 years) | |
| Dota 2 Reborn - 1920x1080 ultra (3/3) best looking | |
| Lenovo Yoga Pro 9i 16 RTX 5070 | |
| Lenovo Yoga Pro 9 16IAH G10 RTX 5060 | |
| Asus ProArt P16 H7606WP | |
| Average of class Multimedia (29 - 179.9, n=66, last 2 years) | |
| Dell XPS 16 9640 | |
| X-Plane 11.11 - 1920x1080 high (fps_test=3) | |
| Lenovo Yoga Pro 9i 16 RTX 5070 | |
| Lenovo Yoga Pro 9 16IAH G10 RTX 5060 | |
| Dell XPS 16 9640 | |
| Dell XPS 16 9640 | |
| Asus ProArt P16 H7606WP | |
| Average of class Multimedia (16.9 - 141.1, n=60, last 2 years) | |
赛博朋克 2077》超 FPS 图表
| low | med. | high | ultra | QHD DLSS | QHD | |
|---|---|---|---|---|---|---|
| GTA V (2015) | 138.9 | 118.7 | ||||
| Dota 2 Reborn (2015) | 172.5 | 163.3 | 153.1 | 143.6 | ||
| Final Fantasy XV Benchmark (2018) | 222 | 181.1 | 140.3 | 101.2 | ||
| X-Plane 11.11 (2018) | 125.1 | 113.5 | 95.2 | |||
| Strange Brigade (2018) | 520 | 346 | 285 | 246 | 165.8 | |
| Baldur's Gate 3 (2023) | 173.6 | 139.4 | 87.5 | 87.3 | 63.1 | |
| Cyberpunk 2077 (2023) | 149.5 | 129 | 109.4 | 98.3 | 73.4 | 62.8 |
| F1 24 (2024) | 271 | 241 | 83.3 | 82.4 | 51.9 | |
| Assassin's Creed Shadows (2025) | 73 | 68 | 59 | 44 | 33 | |
| F1 25 (2025) | 214 | 204 | 177.8 | 27.1 | 27.1 | 11.2 |
排放与能源
噪音排放
噪音排放与已测试过的配备 测试过的配备 RTX 5060 笔记本电脑GPU 的机型完全相同,考虑到相同的功耗限制,这也不足为奇。省电模式 可轻松满足日常使用需求,在游戏时应尝试自动模式,其噪音明显低于性能模式。测试设备上没有其他电子噪音。
Noise level
| Idle |
| 24.1 / 24.1 / 25.1 dB(A) |
| Load |
| 44.2 / 52.7 dB(A) |
 | ||
30 dB silent 40 dB(A) audible 50 dB(A) loud |
||
min: | ||
| Lenovo Yoga Pro 9i 16 RTX 5070 GeForce RTX 5070 Laptop, Ultra 9 285H, WD PC SN7100S SDFPMSL-1T00-1101 | Asus ProArt P16 H7606WP GeForce RTX 5070 Laptop, Ryzen AI 9 HX 370, WD PC SN740 SDDPNQE-2T00 | Lenovo Yoga Pro 9 16IAH G10 RTX 5060 GeForce RTX 5060 Laptop, Ultra 7 255H, WD PC SN7100S SDFPMSL-1T00-1101 | Apple MacBook Pro 16 2024 M4 Pro M4 Pro 20-Core GPU, M4 Pro 14-Core, Apple SSD AP2048Z | Dell XPS 16 9640 GeForce RTX 4070 Laptop GPU, Ultra 7 155H, Kioxia XG8 KXG80ZNV1T02 | Apple MacBook Pro 16 M4 Max M4 Max 40-Core GPU, M4 Max 16-Core, Apple SSD AP1024Z | |
|---|---|---|---|---|---|---|
| Noise | -7% | -3% | 15% | 0% | 7% | |
| off / environment * (dB) | 24.1 | 23.5 2% | 25.2 -5% | 24 -0% | 24.5 -2% | 24.1 -0% |
| Idle Minimum * (dB) | 24.1 | 26.7 -11% | 25.2 -5% | 24 -0% | 24.5 -2% | 24.1 -0% |
| Idle Average * (dB) | 24.1 | 26.7 -11% | 25.2 -5% | 24 -0% | 24.5 -2% | 24.1 -0% |
| Idle Maximum * (dB) | 25.1 | 31.1 -24% | 26.9 -7% | 24 4% | 27.5 -10% | 24.1 4% |
| Load Average * (dB) | 44.2 | 44.8 -1% | 44.5 -1% | 25.3 43% | 39.6 10% | 42.2 5% |
| Cyberpunk 2077 ultra * (dB) | 52.7 | 53.7 -2% | 50.2 5% | 33.9 36% | 42.2 20% | |
| Load Maximum * (dB) | 52.7 | 53.7 -2% | 52.7 -0% | 42.3 20% | 49.7 6% | 42.2 20% |
| Witcher 3 ultra * (dB) | 49.7 |
* ... smaller is better
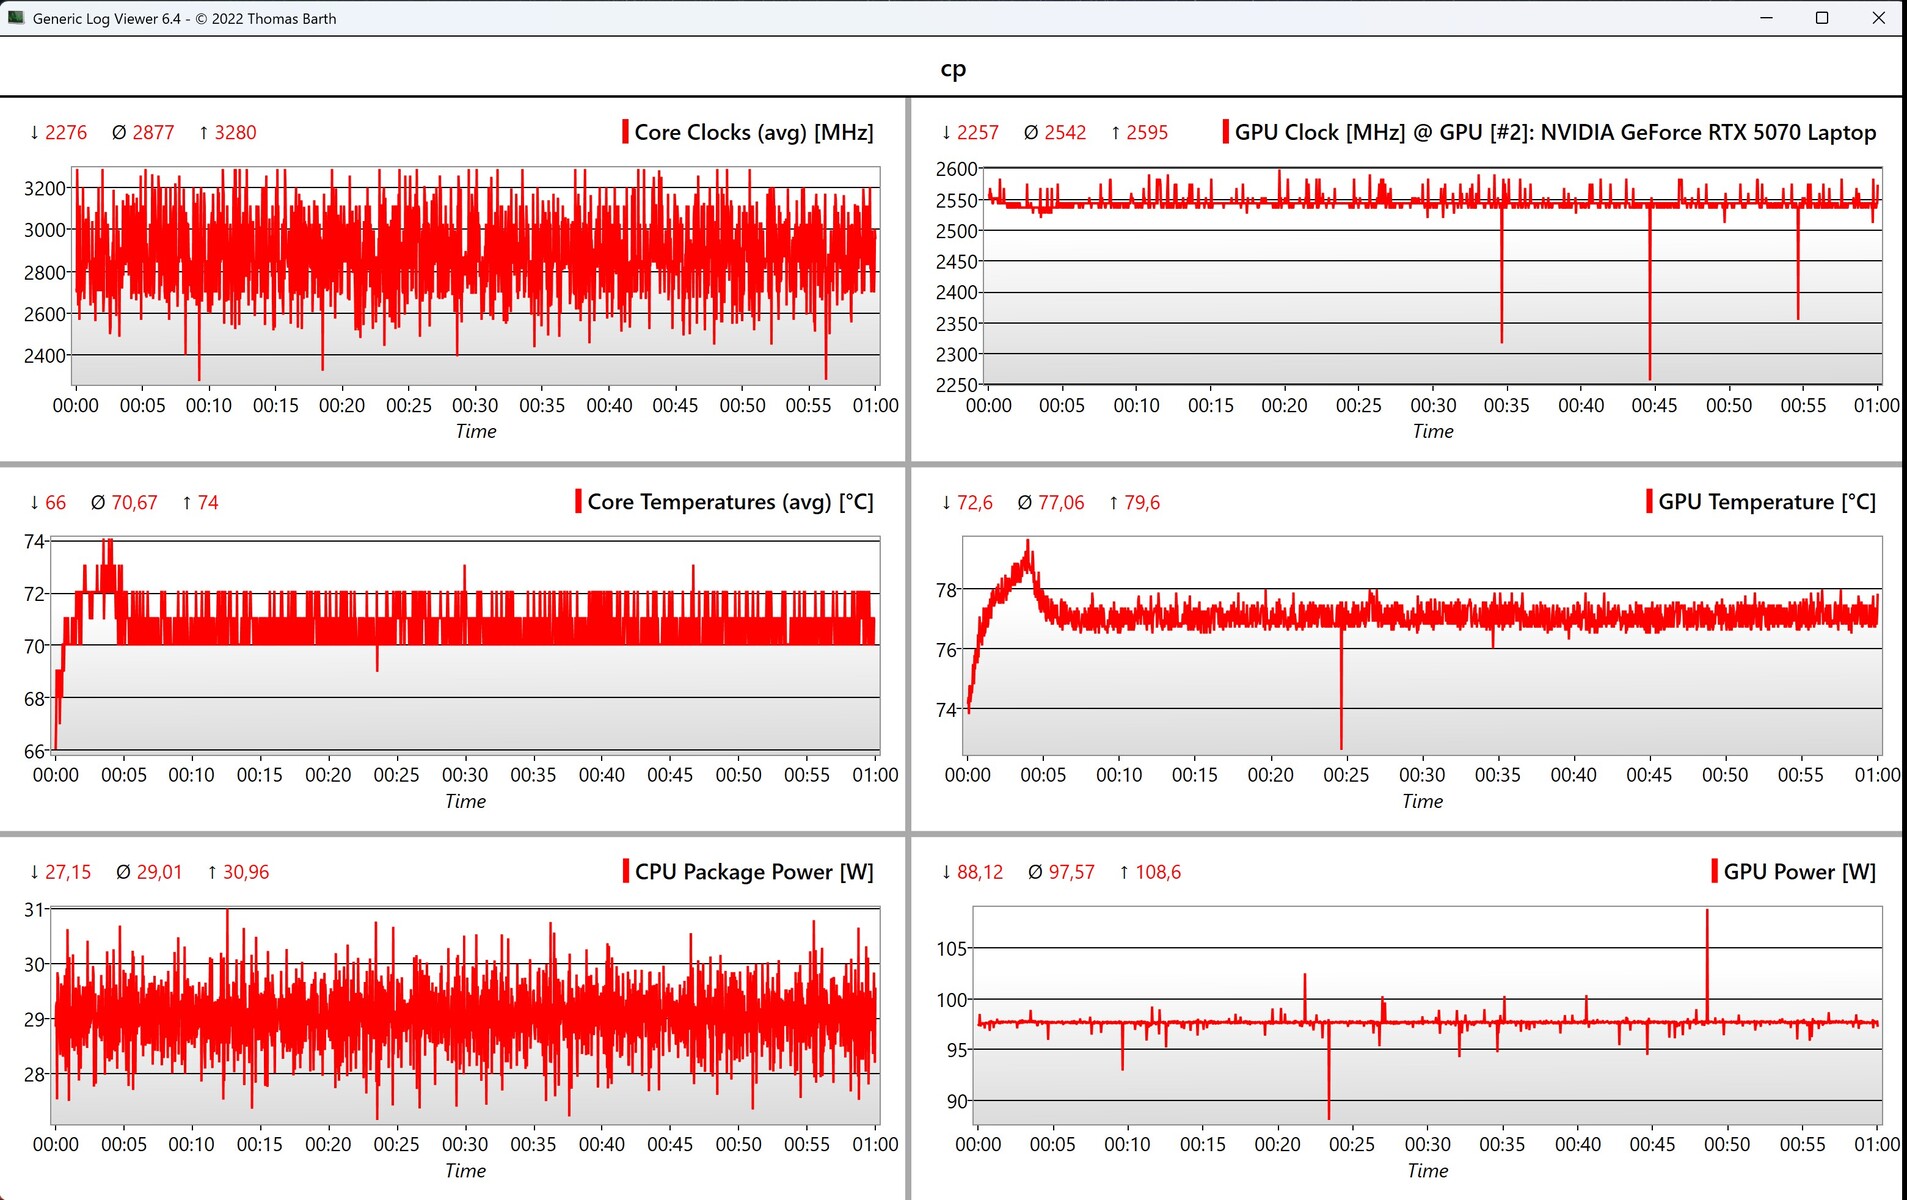
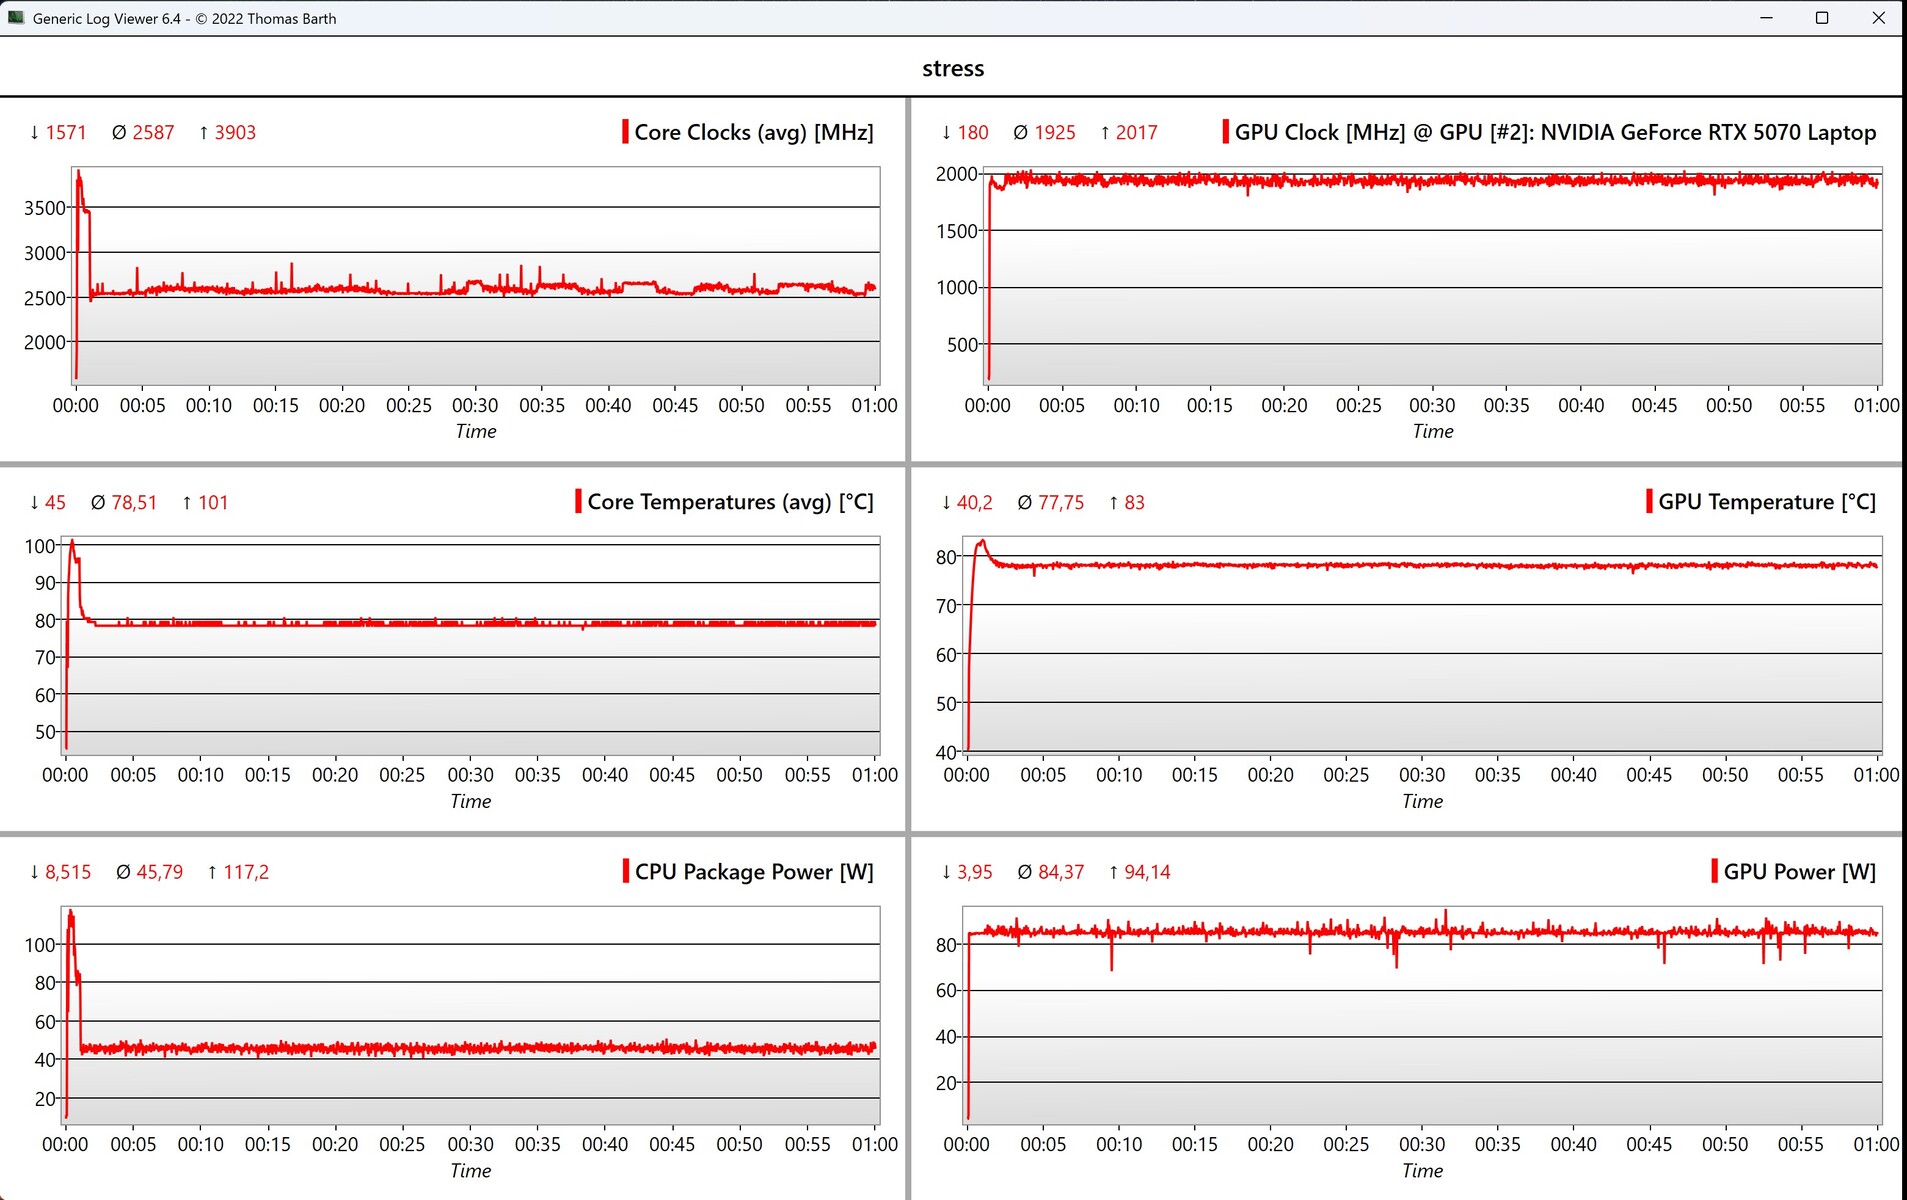
温度
与之前测试的版本相比,表面温度也没有明显差异,也没有出现临界热点。在压力测试中,处理器的工作温度为 45 瓦(约 78 °C/172.4 °F),显卡的工作温度为 85 瓦(约 78 °C/172.4 °F)。
(±) The maximum temperature on the upper side is 41.8 °C / 107 F, compared to the average of 36.8 °C / 98 F, ranging from 21 to 71 °C for the class Multimedia.
(-) The bottom heats up to a maximum of 47.9 °C / 118 F, compared to the average of 39.1 °C / 102 F
(+) In idle usage, the average temperature for the upper side is 25.9 °C / 79 F, compared to the device average of 31.3 °C / 88 F.
(±) 3: The average temperature for the upper side is 36.6 °C / 98 F, compared to the average of 31.3 °C / 88 F for the class Multimedia.
(+) The palmrests and touchpad are reaching skin temperature as a maximum (33.2 °C / 91.8 F) and are therefore not hot.
(-) The average temperature of the palmrest area of similar devices was 28.7 °C / 83.7 F (-4.5 °C / -8.1 F).


| Lenovo Yoga Pro 9i 16 RTX 5070 Intel Core Ultra 9 285H, NVIDIA GeForce RTX 5070 Laptop | Asus ProArt P16 H7606WP AMD Ryzen AI 9 HX 370, NVIDIA GeForce RTX 5070 Laptop | Lenovo Yoga Pro 9 16IAH G10 RTX 5060 Intel Core Ultra 7 255H, NVIDIA GeForce RTX 5060 Laptop | Apple MacBook Pro 16 2024 M4 Pro Apple M4 Pro 14-Core, Apple M4 Pro 20-Core GPU | Dell XPS 16 9640 Intel Core Ultra 7 155H, NVIDIA GeForce RTX 4070 Laptop GPU | Apple MacBook Pro 16 M4 Max Apple M4 Max 16-Core, Apple M4 Max 40-Core GPU | |
|---|---|---|---|---|---|---|
| Heat | -2% | -3% | 12% | 6% | 9% | |
| Maximum Upper Side * (°C) | 41.8 | 47 -12% | 42.9 -3% | 42.7 -2% | 39.4 6% | 42.8 -2% |
| Maximum Bottom * (°C) | 47.9 | 47.4 1% | 47.4 1% | 43.1 10% | 36.9 23% | 42.3 12% |
| Idle Upper Side * (°C) | 26.3 | 26.1 1% | 27.6 -5% | 21.5 18% | 28.2 -7% | 23.6 10% |
| Idle Bottom * (°C) | 27.6 | 26.4 4% | 29 -5% | 21.5 22% | 27.4 1% | 23.5 15% |
* ... smaller is better
发言人
Lenovo Yoga Pro 9i 16 RTX 5070 audio analysis
(±) | speaker loudness is average but good (81.4 dB)
Bass 100 - 315 Hz
(±) | reduced bass - on average 5.5% lower than median
(±) | linearity of bass is average (7.5% delta to prev. frequency)
Mids 400 - 2000 Hz
(+) | balanced mids - only 1.7% away from median
(+) | mids are linear (3.1% delta to prev. frequency)
Highs 2 - 16 kHz
(±) | reduced highs - on average 6.2% lower than median
(+) | highs are linear (3.9% delta to prev. frequency)
Overall 100 - 16.000 Hz
(+) | overall sound is linear (9.7% difference to median)
Compared to same class
» 13% of all tested devices in this class were better, 1% similar, 85% worse
» The best had a delta of 5%, average was 17%, worst was 45%
Compared to all devices tested
» 4% of all tested devices were better, 1% similar, 95% worse
» The best had a delta of 4%, average was 24%, worst was 134%
Asus ProArt P16 H7606WP audio analysis
(+) | speakers can play relatively loud (82 dB)
Bass 100 - 315 Hz
(+) | good bass - only 4.2% away from median
(±) | linearity of bass is average (8.8% delta to prev. frequency)
Mids 400 - 2000 Hz
(+) | balanced mids - only 4.4% away from median
(+) | mids are linear (3.2% delta to prev. frequency)
Highs 2 - 16 kHz
(+) | balanced highs - only 1.3% away from median
(+) | highs are linear (3.3% delta to prev. frequency)
Overall 100 - 16.000 Hz
(+) | overall sound is linear (7.8% difference to median)
Compared to same class
» 6% of all tested devices in this class were better, 3% similar, 91% worse
» The best had a delta of 5%, average was 17%, worst was 45%
Compared to all devices tested
» 1% of all tested devices were better, 0% similar, 98% worse
» The best had a delta of 4%, average was 24%, worst was 134%
Apple MacBook Pro 16 2024 M4 Pro audio analysis
(+) | speakers can play relatively loud (84.6 dB)
Bass 100 - 315 Hz
(±) | reduced bass - on average 5.1% lower than median
(+) | bass is linear (5.6% delta to prev. frequency)
Mids 400 - 2000 Hz
(+) | balanced mids - only 1.4% away from median
(+) | mids are linear (2.4% delta to prev. frequency)
Highs 2 - 16 kHz
(+) | balanced highs - only 1.6% away from median
(+) | highs are linear (3% delta to prev. frequency)
Overall 100 - 16.000 Hz
(+) | overall sound is linear (4.8% difference to median)
Compared to same class
» 0% of all tested devices in this class were better, 0% similar, 99% worse
» The best had a delta of 5%, average was 17%, worst was 45%
Compared to all devices tested
» 0% of all tested devices were better, 0% similar, 100% worse
» The best had a delta of 4%, average was 24%, worst was 134%
能源消耗
| Off / Standby | |
| Idle | |
| Load |
|
Key:
min: | |
| Lenovo Yoga Pro 9i 16 RTX 5070 Ultra 9 285H, GeForce RTX 5070 Laptop, WD PC SN7100S SDFPMSL-1T00-1101, OLED, 3200x2000, 16" | Asus ProArt P16 H7606WP Ryzen AI 9 HX 370, GeForce RTX 5070 Laptop, WD PC SN740 SDDPNQE-2T00, OLED, 2880x1800, 16" | Lenovo Yoga Pro 9 16IAH G10 RTX 5060 Ultra 7 255H, GeForce RTX 5060 Laptop, WD PC SN7100S SDFPMSL-1T00-1101, OLED, 2880x1800, 16" | Apple MacBook Pro 16 2024 M4 Pro M4 Pro 14-Core, M4 Pro 20-Core GPU, Apple SSD AP2048Z, Mini-LED, 3456x2234, 16.2" | Dell XPS 16 9640 Ultra 7 155H, GeForce RTX 4070 Laptop GPU, Kioxia XG8 KXG80ZNV1T02, OLED, 3840x2400, 16.3" | Apple MacBook Pro 16 M4 Max M4 Max 16-Core, M4 Max 40-Core GPU, Apple SSD AP1024Z, Mini-LED, 3456x2234, 16.2" | Average NVIDIA GeForce RTX 5070 Laptop | Average of class Multimedia | |
|---|---|---|---|---|---|---|---|---|
| Power Consumption | -2% | 16% | 25% | 24% | 14% | -16% | 33% | |
| Idle Minimum * (Watt) | 8.8 | 9.9 -13% | 4.9 44% | 4.6 48% | 7.7 12% | 4.7 47% | 10.8 ? -23% | 5.65 ? 36% |
| Idle Average * (Watt) | 16.1 | 13.6 16% | 10.9 32% | 16.8 -4% | 10.3 36% | 15.5 4% | 15.4 ? 4% | 10 ? 38% |
| Idle Maximum * (Watt) | 16.5 | 14 15% | 11.3 32% | 17.1 -4% | 10.6 36% | 15.6 5% | 21 ? -27% | 12.3 ? 25% |
| Load Average * (Watt) | 89.3 | 93.8 -5% | 88.7 1% | 76.4 14% | 76.5 14% | 125 -40% | 98.7 ? -11% | 65.1 ? 27% |
| Cyberpunk 2077 ultra external monitor * (Watt) | 157.9 | 158.3 -0% | 155.7 1% | 79.3 50% | 107.2 32% | |||
| Cyberpunk 2077 ultra * (Watt) | 160.6 | 162.1 -1% | 157.1 2% | 83.4 48% | 116.2 28% | |||
| Load Maximum * (Watt) | 177.4 | 229 -29% | 175.5 1% | 138.1 22% | 138.5 22% | 143.7 19% | 218 ? -23% | 112.5 ? 37% |
| Witcher 3 ultra * (Watt) | 126.4 |
* ... smaller is better
能耗 赛博朋克/压力测试
带外部监控器的能耗
电池寿命
在亮度为 150 cd/m²(46%)、频率为 60 Hz 的情况下,11 小时的电池续航时间甚至略好于配备 RTX 5060 的 Yoga。然而,在 SDR 全亮度条件下,4.5 小时后就已经结束了。以 150 cd/m² 的亮度播放视频甚至可以持续近 14.5 小时。
| Lenovo Yoga Pro 9i 16 RTX 5070 Ultra 9 285H, GeForce RTX 5070 Laptop, 84 Wh | Asus ProArt P16 H7606WP Ryzen AI 9 HX 370, GeForce RTX 5070 Laptop, 90 Wh | Lenovo Yoga Pro 9 16IAH G10 RTX 5060 Ultra 7 255H, GeForce RTX 5060 Laptop, 84 Wh | Apple MacBook Pro 16 2024 M4 Pro M4 Pro 14-Core, M4 Pro 20-Core GPU, 99.6 Wh | Dell XPS 16 9640 Ultra 7 155H, GeForce RTX 4070 Laptop GPU, 99.5 Wh | Apple MacBook Pro 16 M4 Max M4 Max 16-Core, M4 Max 40-Core GPU, 99.6 Wh | Average of class Multimedia | |
|---|---|---|---|---|---|---|---|
| Battery runtime | -17% | -11% | 74% | 5% | 57% | 11% | |
| H.264 (h) | 14.4 | 24.6 71% | 16.5 15% | 21.8 51% | 16.2 ? 13% | ||
| WiFi v1.3 (h) | 11.1 | 9.2 -17% | 9.9 -11% | 19.6 77% | 10.5 -5% | 18 62% | 12 ? 8% |
| Load (h) | 1.5 | 1.1 | 1.669 ? |
Notebookcheck 总体评分
Lenovo Yoga Pro 9i 16 RTX 5070
- 10/09/2025 v8
Andreas Osthoff
 Total Sustainability Score:
 可比较的替代品
Image | Model / Review | Price | Weight | Height | Display |
|---|---|---|---|---|---|
1. 90.4%  | Lenovo Yoga Pro 9i 16 RTX 5070 Intel Core Ultra 9 285H ⎘ NVIDIA GeForce RTX 5070 Laptop ⎘ 64 GB Memory, 1024 GB SSD | Amazon: List Price: 2800€ | 1.9 kg | 17.9 mm | 16.00" 3200x2000 236 PPI OLED |
2. 89.1%  | Asus ProArt P16 H7606WP AMD Ryzen AI 9 HX 370 ⎘ NVIDIA GeForce RTX 5070 Laptop ⎘ 64 GB Memory, 2048 GB SSD | Amazon: 1. $4,599.00 HIDevolution [2025] ASUS Pro... 2. $4,924.00 HIDevolution [2025] ASUS Pro... 3. $5,649.00 HIDevolution [2025] ASUS Pro... List Price: 3399€ | 1.8 kg | 17.3 mm | 16.00" 2880x1800 212 PPI OLED |
3. 89.1%  | Lenovo Yoga Pro 9 16IAH G10 RTX 5060 Intel Core Ultra 7 255H ⎘ NVIDIA GeForce RTX 5060 Laptop ⎘ 32 GB Memory, 1024 GB SSD | Amazon: List Price: 2199€ | 1.9 kg | 17.9 mm | 16.00" 2880x1800 212 PPI OLED |
4. 93%  | Apple MacBook Pro 16 2024 M4 Pro Apple M4 Pro 14-Core ⎘ Apple M4 Pro 20-Core GPU ⎘ 48 GB Memory, 2048 GB SSD | Amazon: List Price: 4219€ | 2.1 kg | 16.8 mm | 16.20" 3456x2234 254 PPI Mini-LED |
5. 88.6% v7 (old)  | Dell XPS 16 9640 Intel Core Ultra 7 155H ⎘ NVIDIA GeForce RTX 4070 Laptop GPU ⎘ 32 GB Memory, 1024 GB SSD | Amazon: 1. $2,499.00 Dell XPS 16 9640 16.3" Touch... 2. $2,199.00 New XPS 16 9640 Business Lap... 3. $2,799.99 Dell XPS 16 9640 Laptop | In... | 2.3 kg | 18.7 mm | 16.30" 3840x2400 139 PPI OLED |
Transparency
The selection of devices to be reviewed is made by our editorial team. The test sample was provided to the author as a loan by the manufacturer or retailer for the purpose of this review. The lender had no influence on this review, nor did the manufacturer receive a copy of this review before publication. There was no obligation to publish this review. As an independent media company, Notebookcheck is not subjected to the authority of manufacturers, retailers or publishers.
This is how Notebookcheck is testing
Every year, Notebookcheck independently reviews hundreds of laptops and smartphones using standardized procedures to ensure that all results are comparable. We have continuously developed our test methods for around 20 years and set industry standards in the process. In our test labs, high-quality measuring equipment is utilized by experienced technicians and editors. These tests involve a multi-stage validation process. Our complex rating system is based on hundreds of well-founded measurements and benchmarks, which maintains objectivity. Further information on our test methods can be found here.
