结论:Aero X16 整体性能出色,但 RTX 5070 笔记本电脑令人失望
技嘉推出的 Aero X16 是市场上首批配备全新 RTX 5070 的游戏笔记本电脑之一。它与 AMD Ryzen 处理器一起构成了一个高效的软件包,许多游戏也能在 QHD 分辨率下流畅运行。
但问题是,与上一代 RTX 4070 笔记本电脑 GPU 相比,其速度优势非常小,而且不变的 8 GB 显存在运行要求较高的游戏时变得越来越成问题。当然,技嘉对此也无可指责,因为所有即将推出的 RTX 5070 笔记本电脑都会遇到这个问题。
165 Hz 刷新率的雾面 IPS 显示屏无法与 OLED 的亮度相提并论,但主观上整体画质还是不错的,实测值也相当不错。该显示屏也适合在 sRGB 色彩空间中进行图像编辑,不会出现任何问题。
塑料机身给人的整体印象不错,尤其是键盘非常舒适。不过,由于不支持 PCIe Gen5 和 Wi-Fi 7,一些设备被削减了。对于大多数用户来说,这当然是合格的,但如何在一台售价高达 1800 欧元的笔记本电脑上安装一个蹩脚的 USB 2.0 端口,这对我们来说是个谜。
正面两个区域的连接分布也不是很理想。另一方面,可扩展内存和两个固态硬盘插槽的升级选项非常不错。
尽管如此,RTX 5070 笔记本电脑的性能依然令人失望。购买配备旧版 RTX 4070 GPU 的笔记本电脑更有意义,因为你可以用更低的价格获得几乎相同的游戏性能。
Pros
Cons
- $1,198.00GIGABYTE AERO X16; Copilot+ PC - 165Hz 2560x1600 WQXGA - NVIDIA GeForce RTX 5060 - AMD Ryzen AI 7 350-1TB SSD with 16GB DDR5 RAM - Windows 11 Home - Space Gray
- $1,572.00GIGABYTE AERO X16, Copilot+ PC - 165Hz 2560x1600 WQXGA - Manufactured by NVIDIA GeForce RTX 5070 - AMD Ryzen AI 9 HX 370-1TB SSD with 32GB DDR5 RAM - Windows 11 Home - Lunar White - 2WHA3USC64DH
- $1,699.00GIGABYTE AERO X16, Copilot+ PC - 165Hz 2560x1600 WQXGA - Manufactured by NVIDIA GeForce RTX 5070 - AMD Ryzen AI 9 HX 370-1TB SSD with 32GB DDR5 RAM - Windows 11 Home - Space Gray - 2WHA3USC64AH
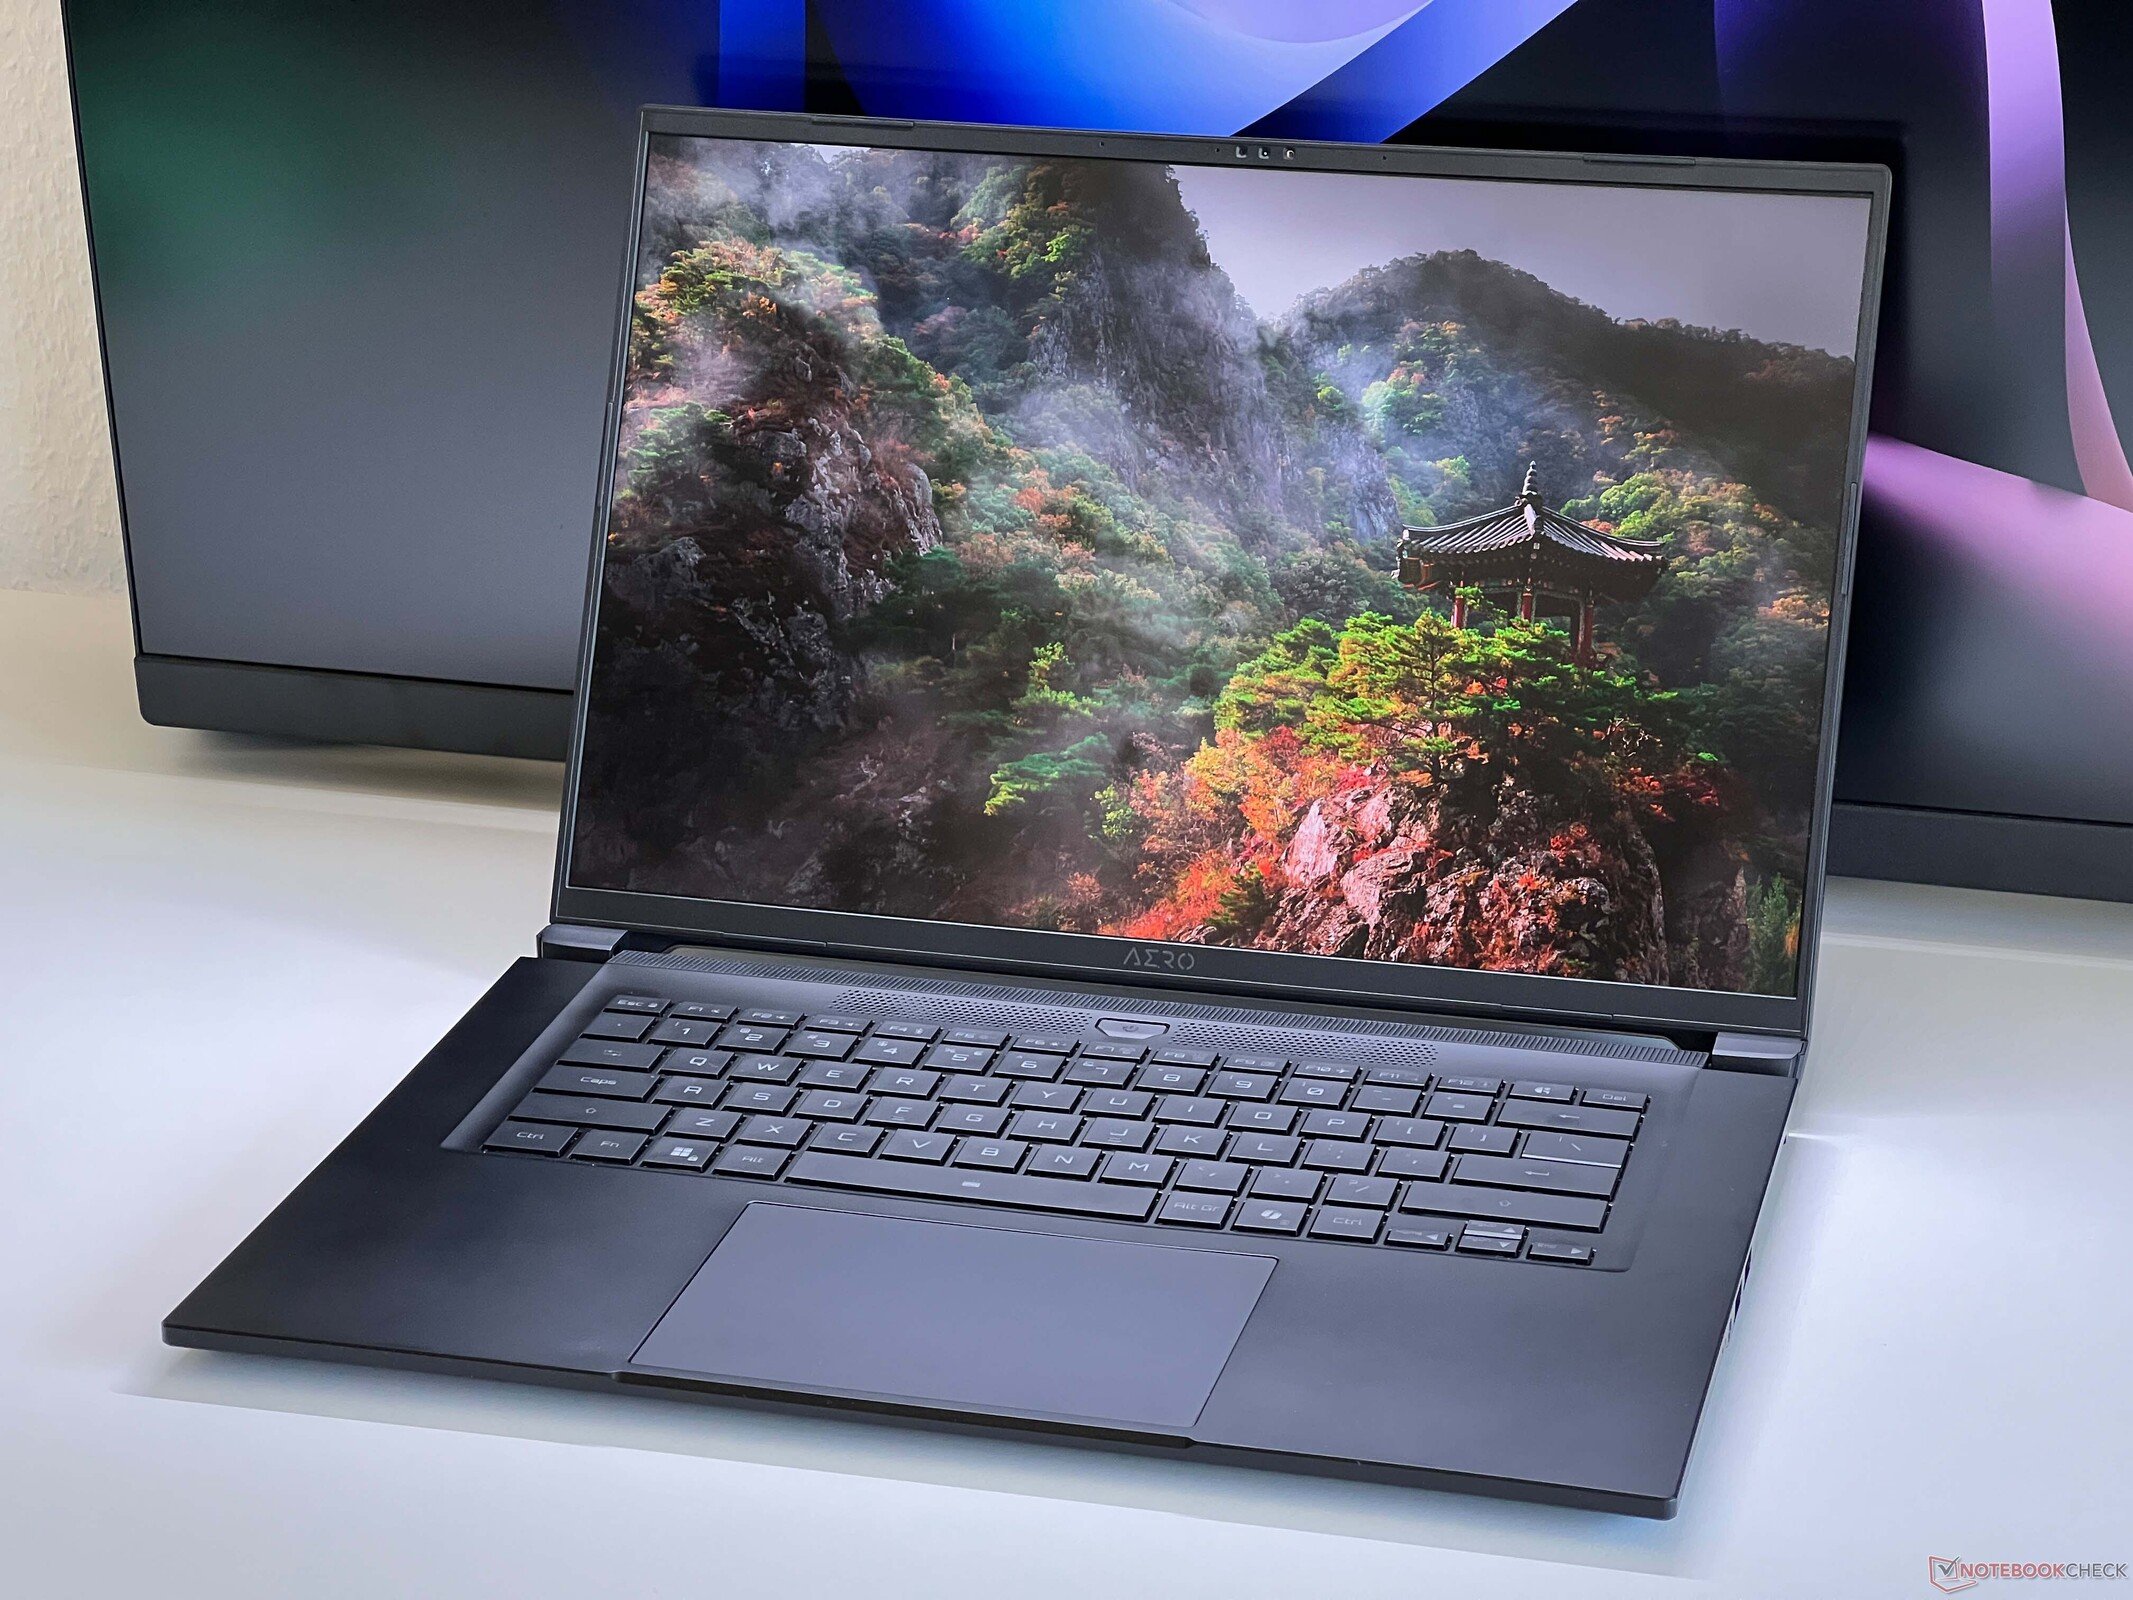
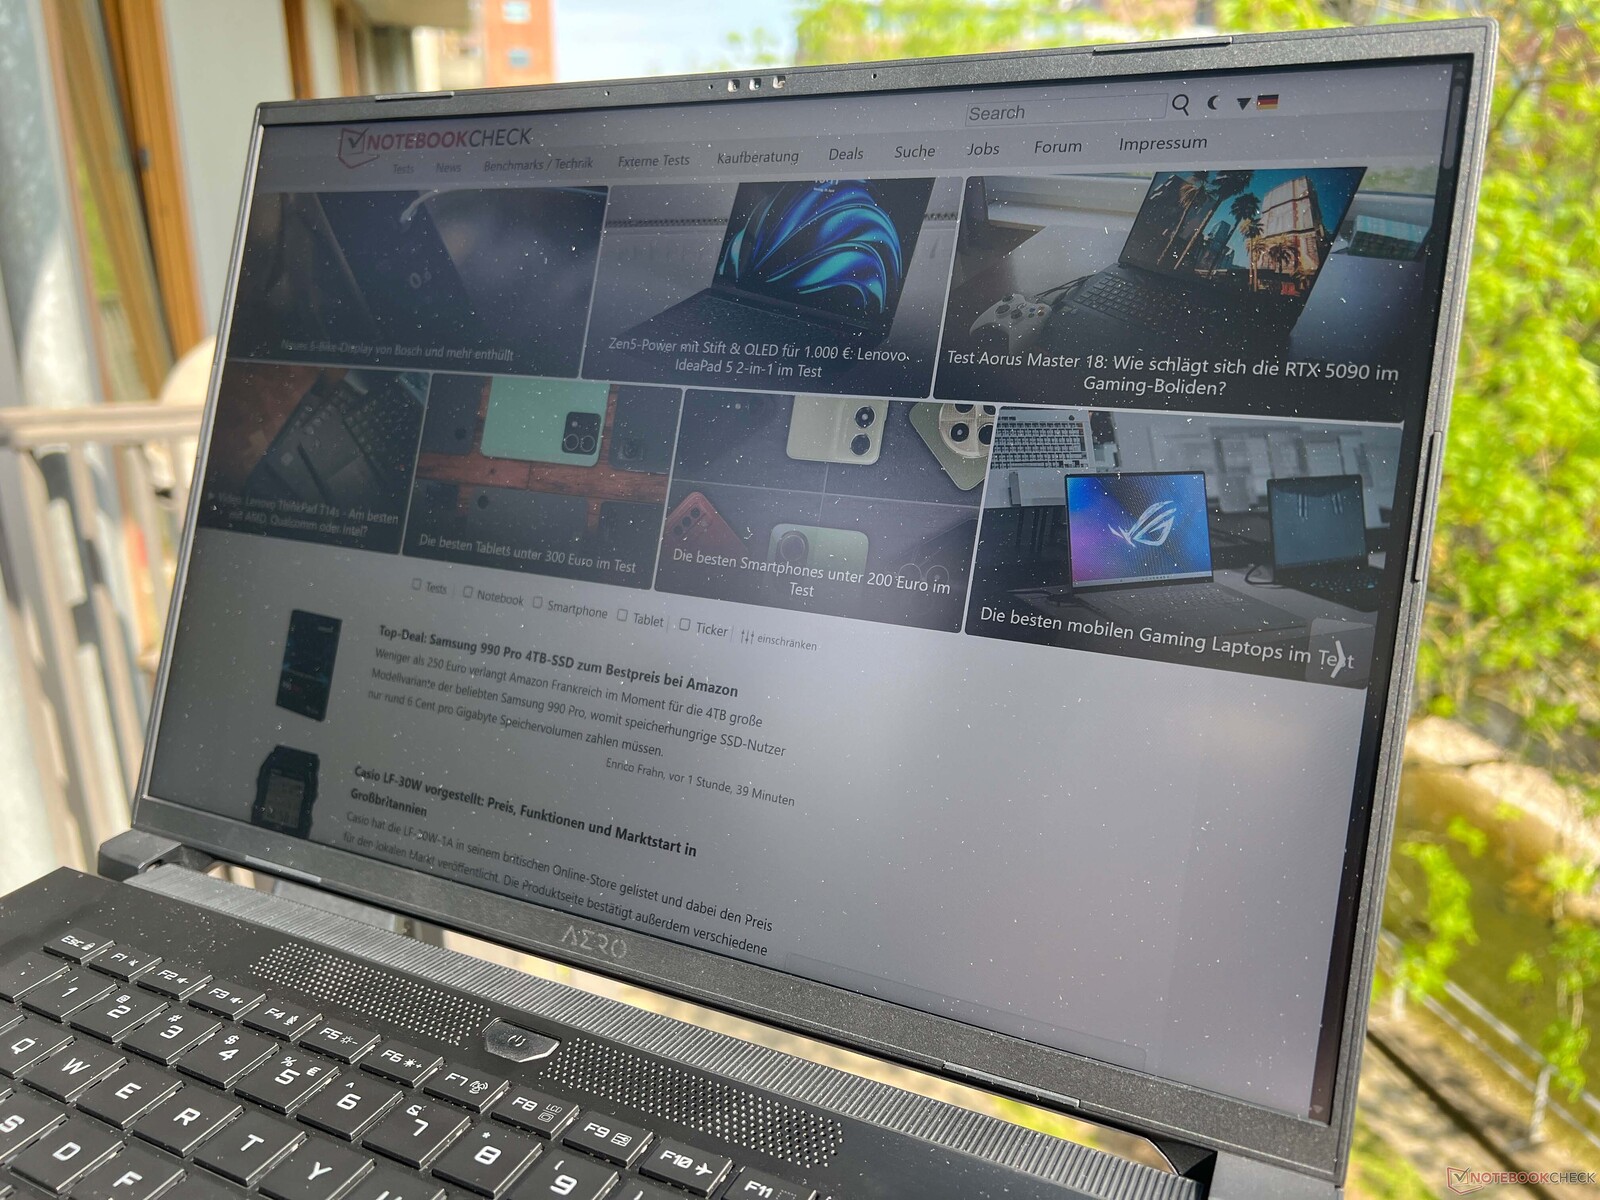
技嘉推出的 Aero X16 是一款轻薄的 16 英寸游戏/多媒体笔记本电脑,结合了最新的 AMD Ryzen AI 移动处理器和全新的 Nvidia RTX 5070 处理器。 NvidiaGeForce RTX 5070 笔记本电脑最大 TGP 为 85 W。
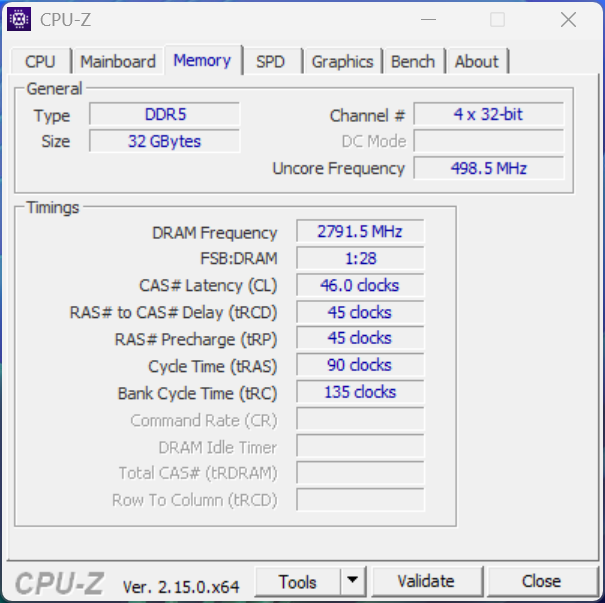
我们测试的是入门级版本的 Aero X16,配备了 Ryzen AI 7 350RTX 5070 笔记本电脑、32 GB 内存、1 TB SSD 和 165 Hz 刷新率的哑光 IPS 显示屏(2,560x1,600)。
该配置的零售价为 1799 欧元。还有一款配备 Ryzen AI 9 HX 370和 2 TB SSD 的型号,售价为 1,999 欧元。
规格
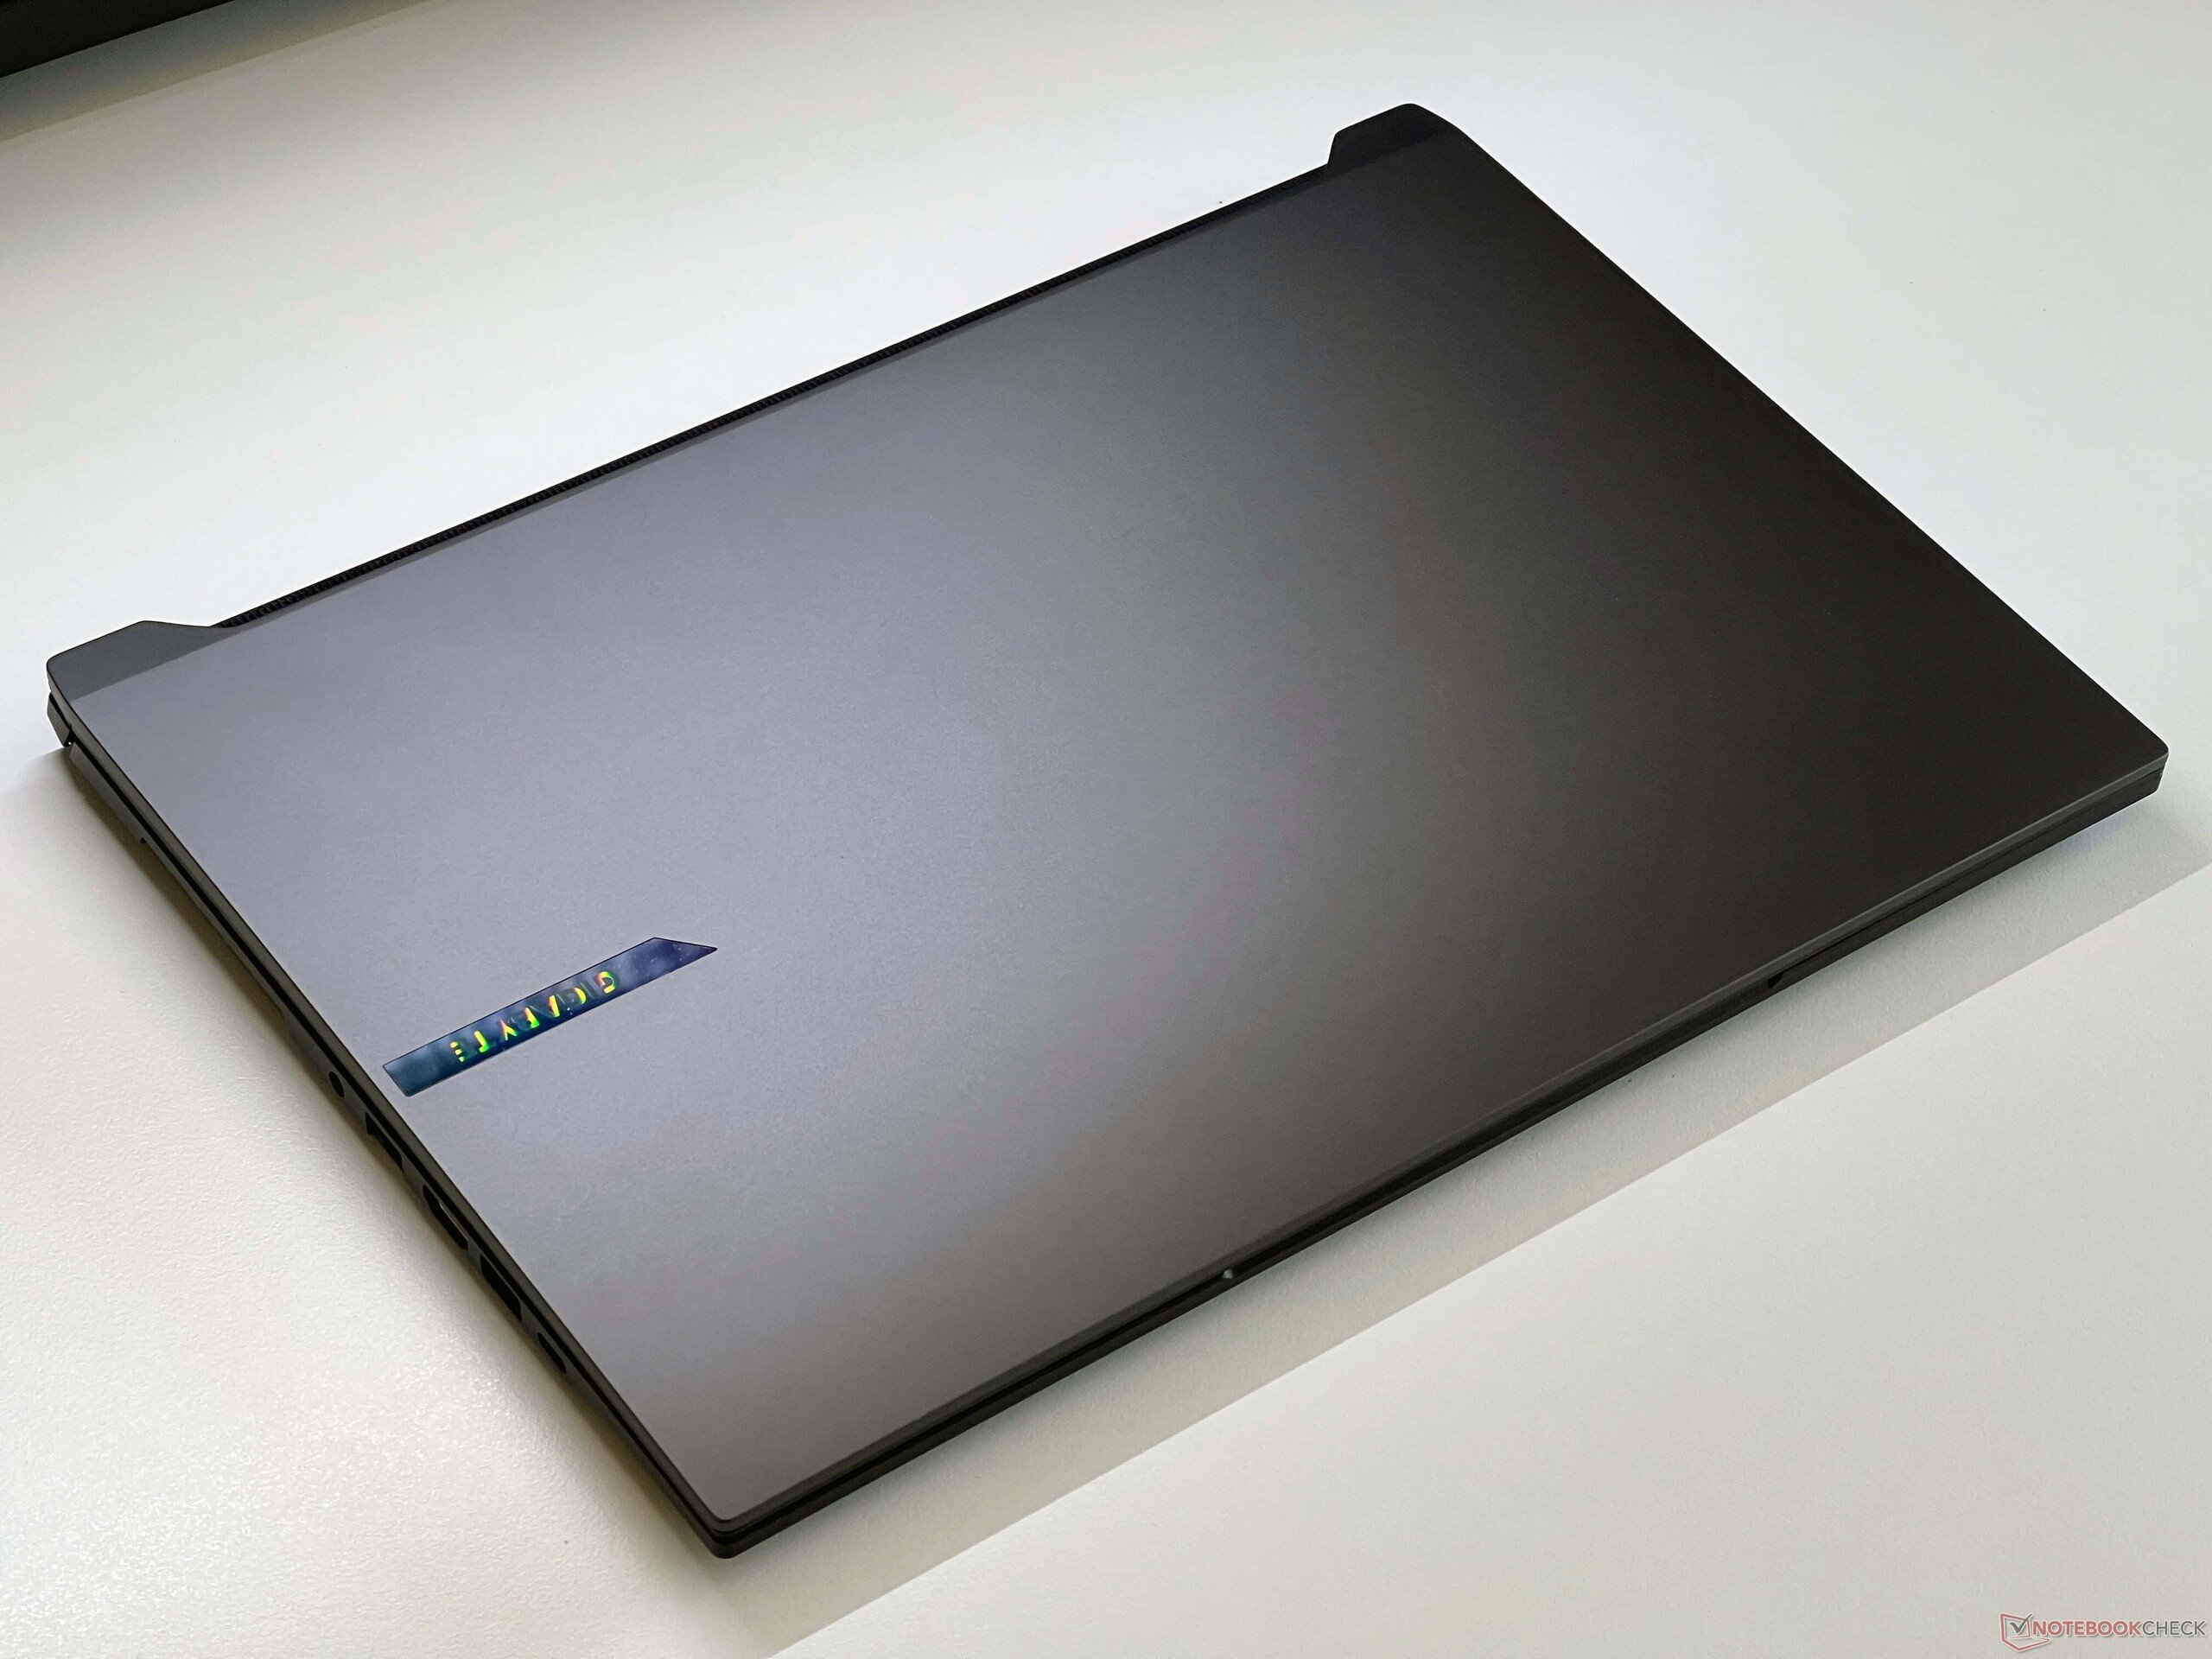
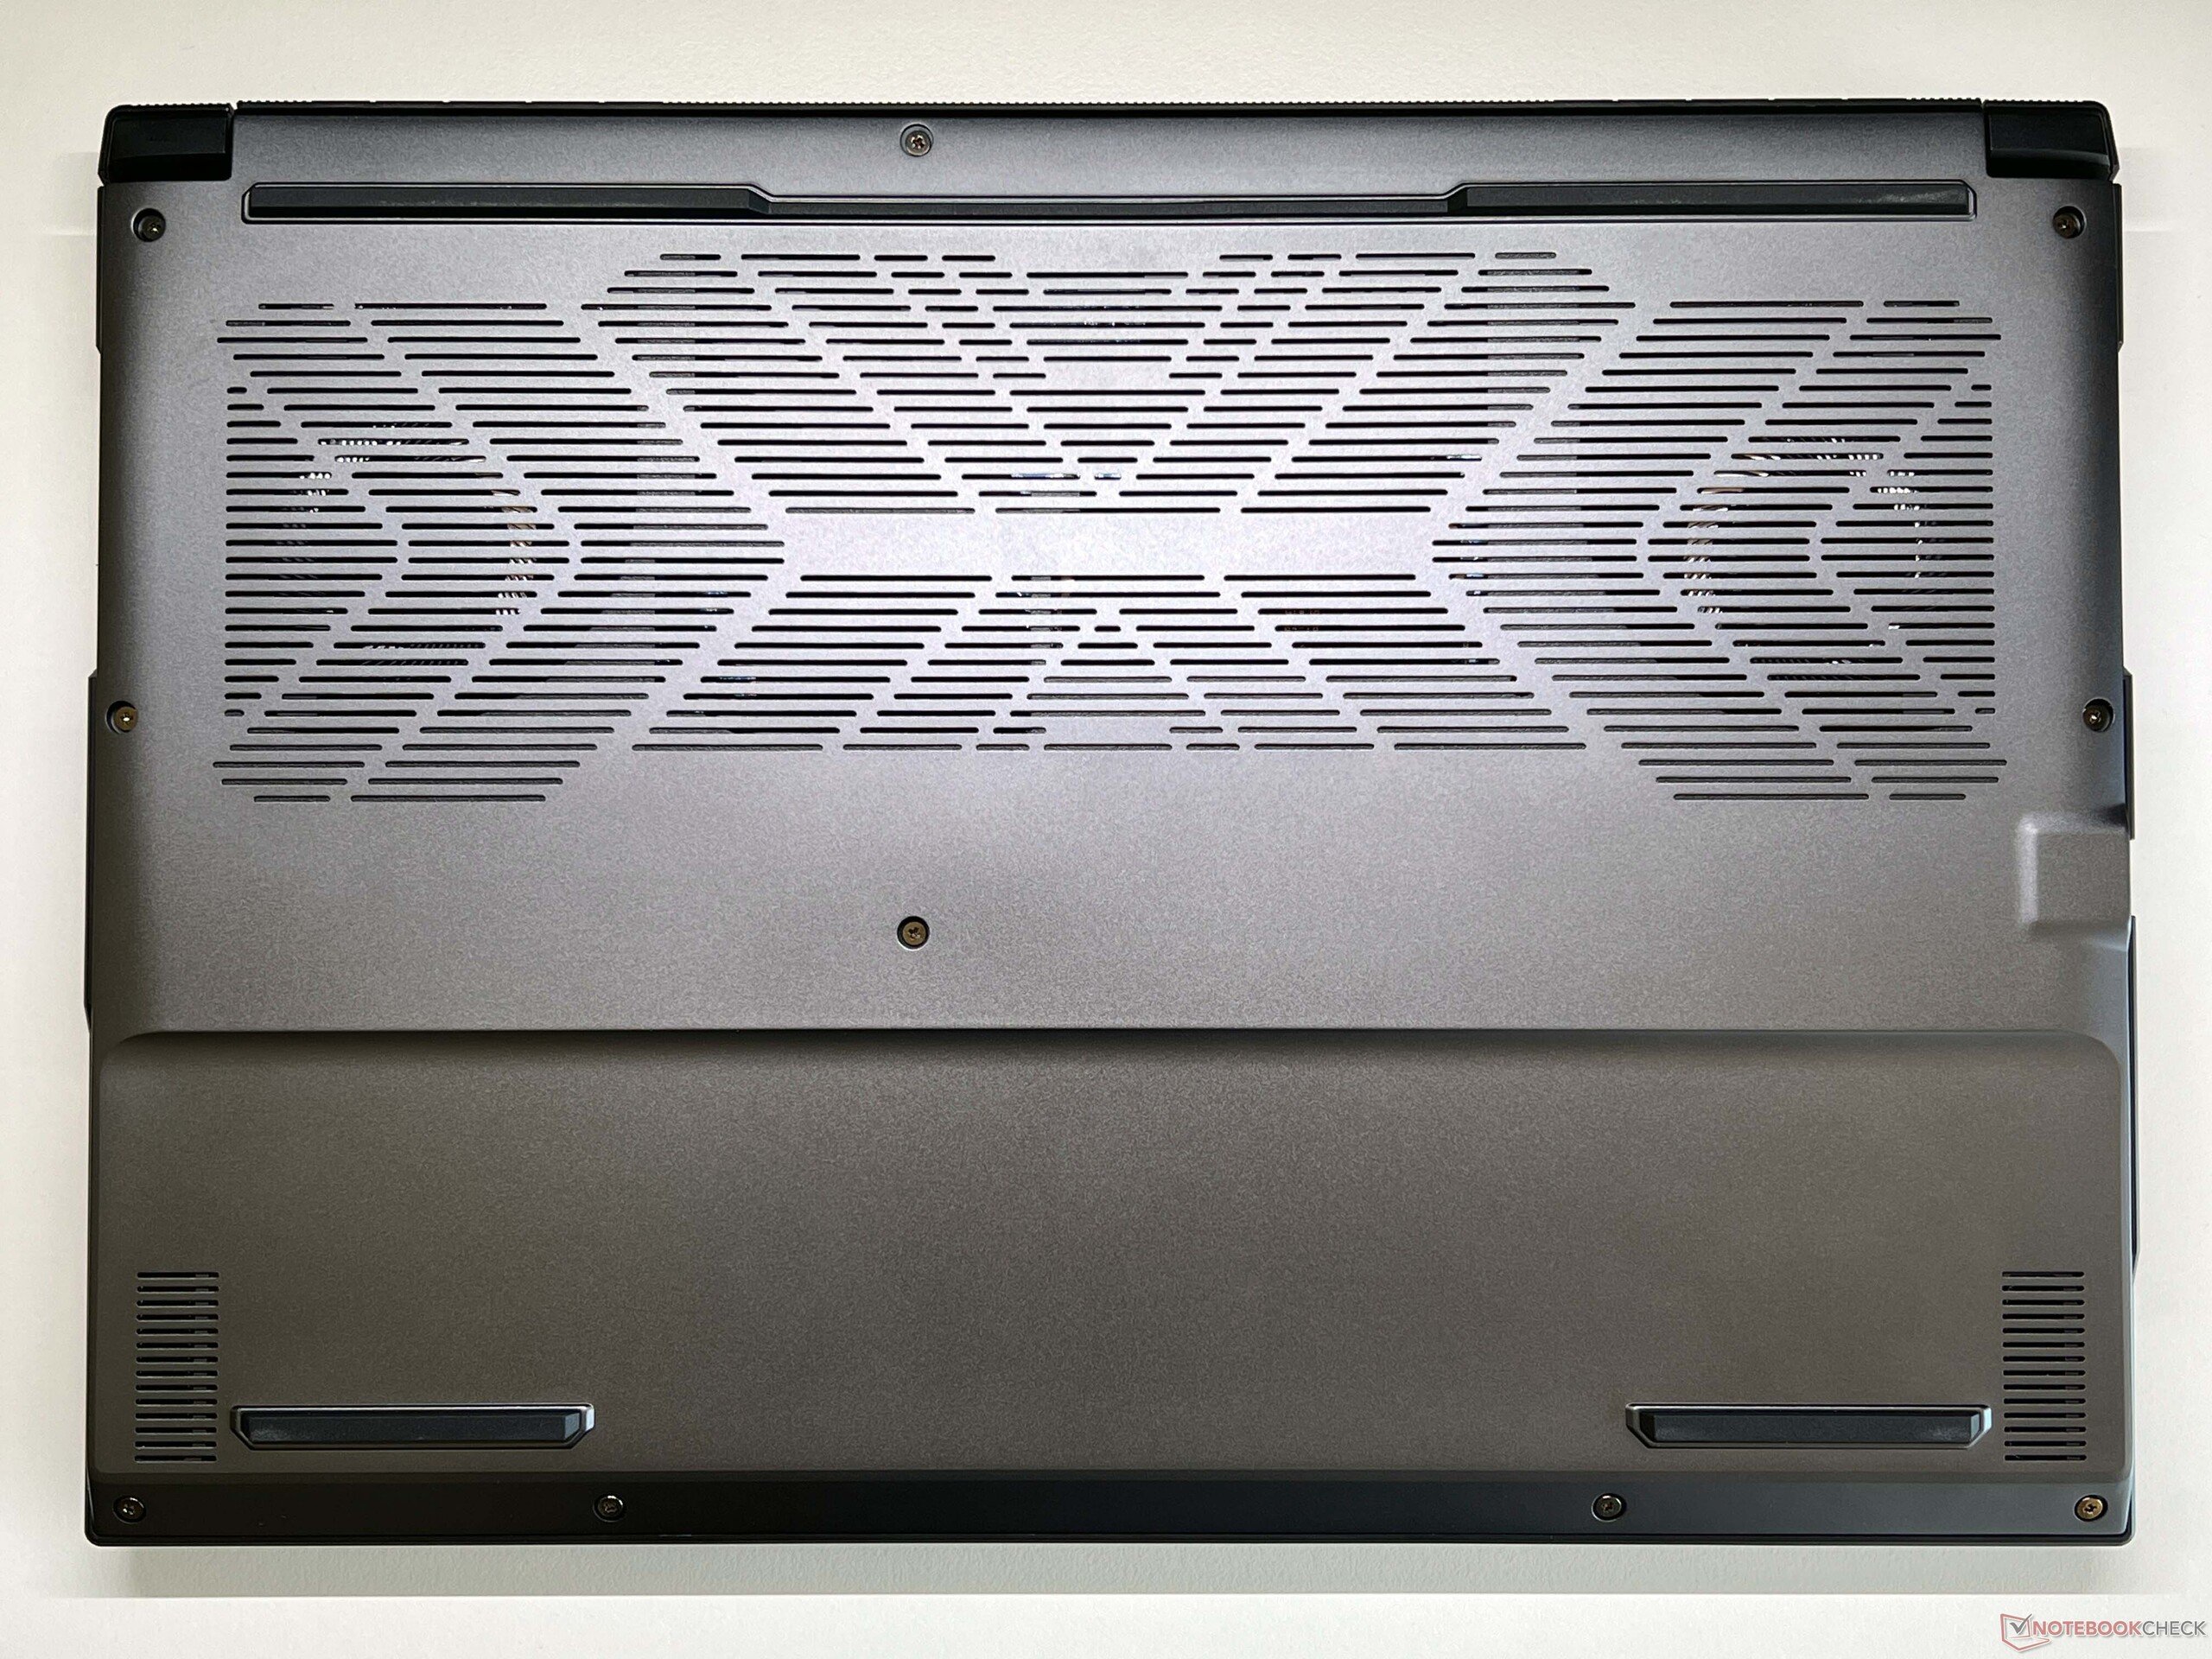
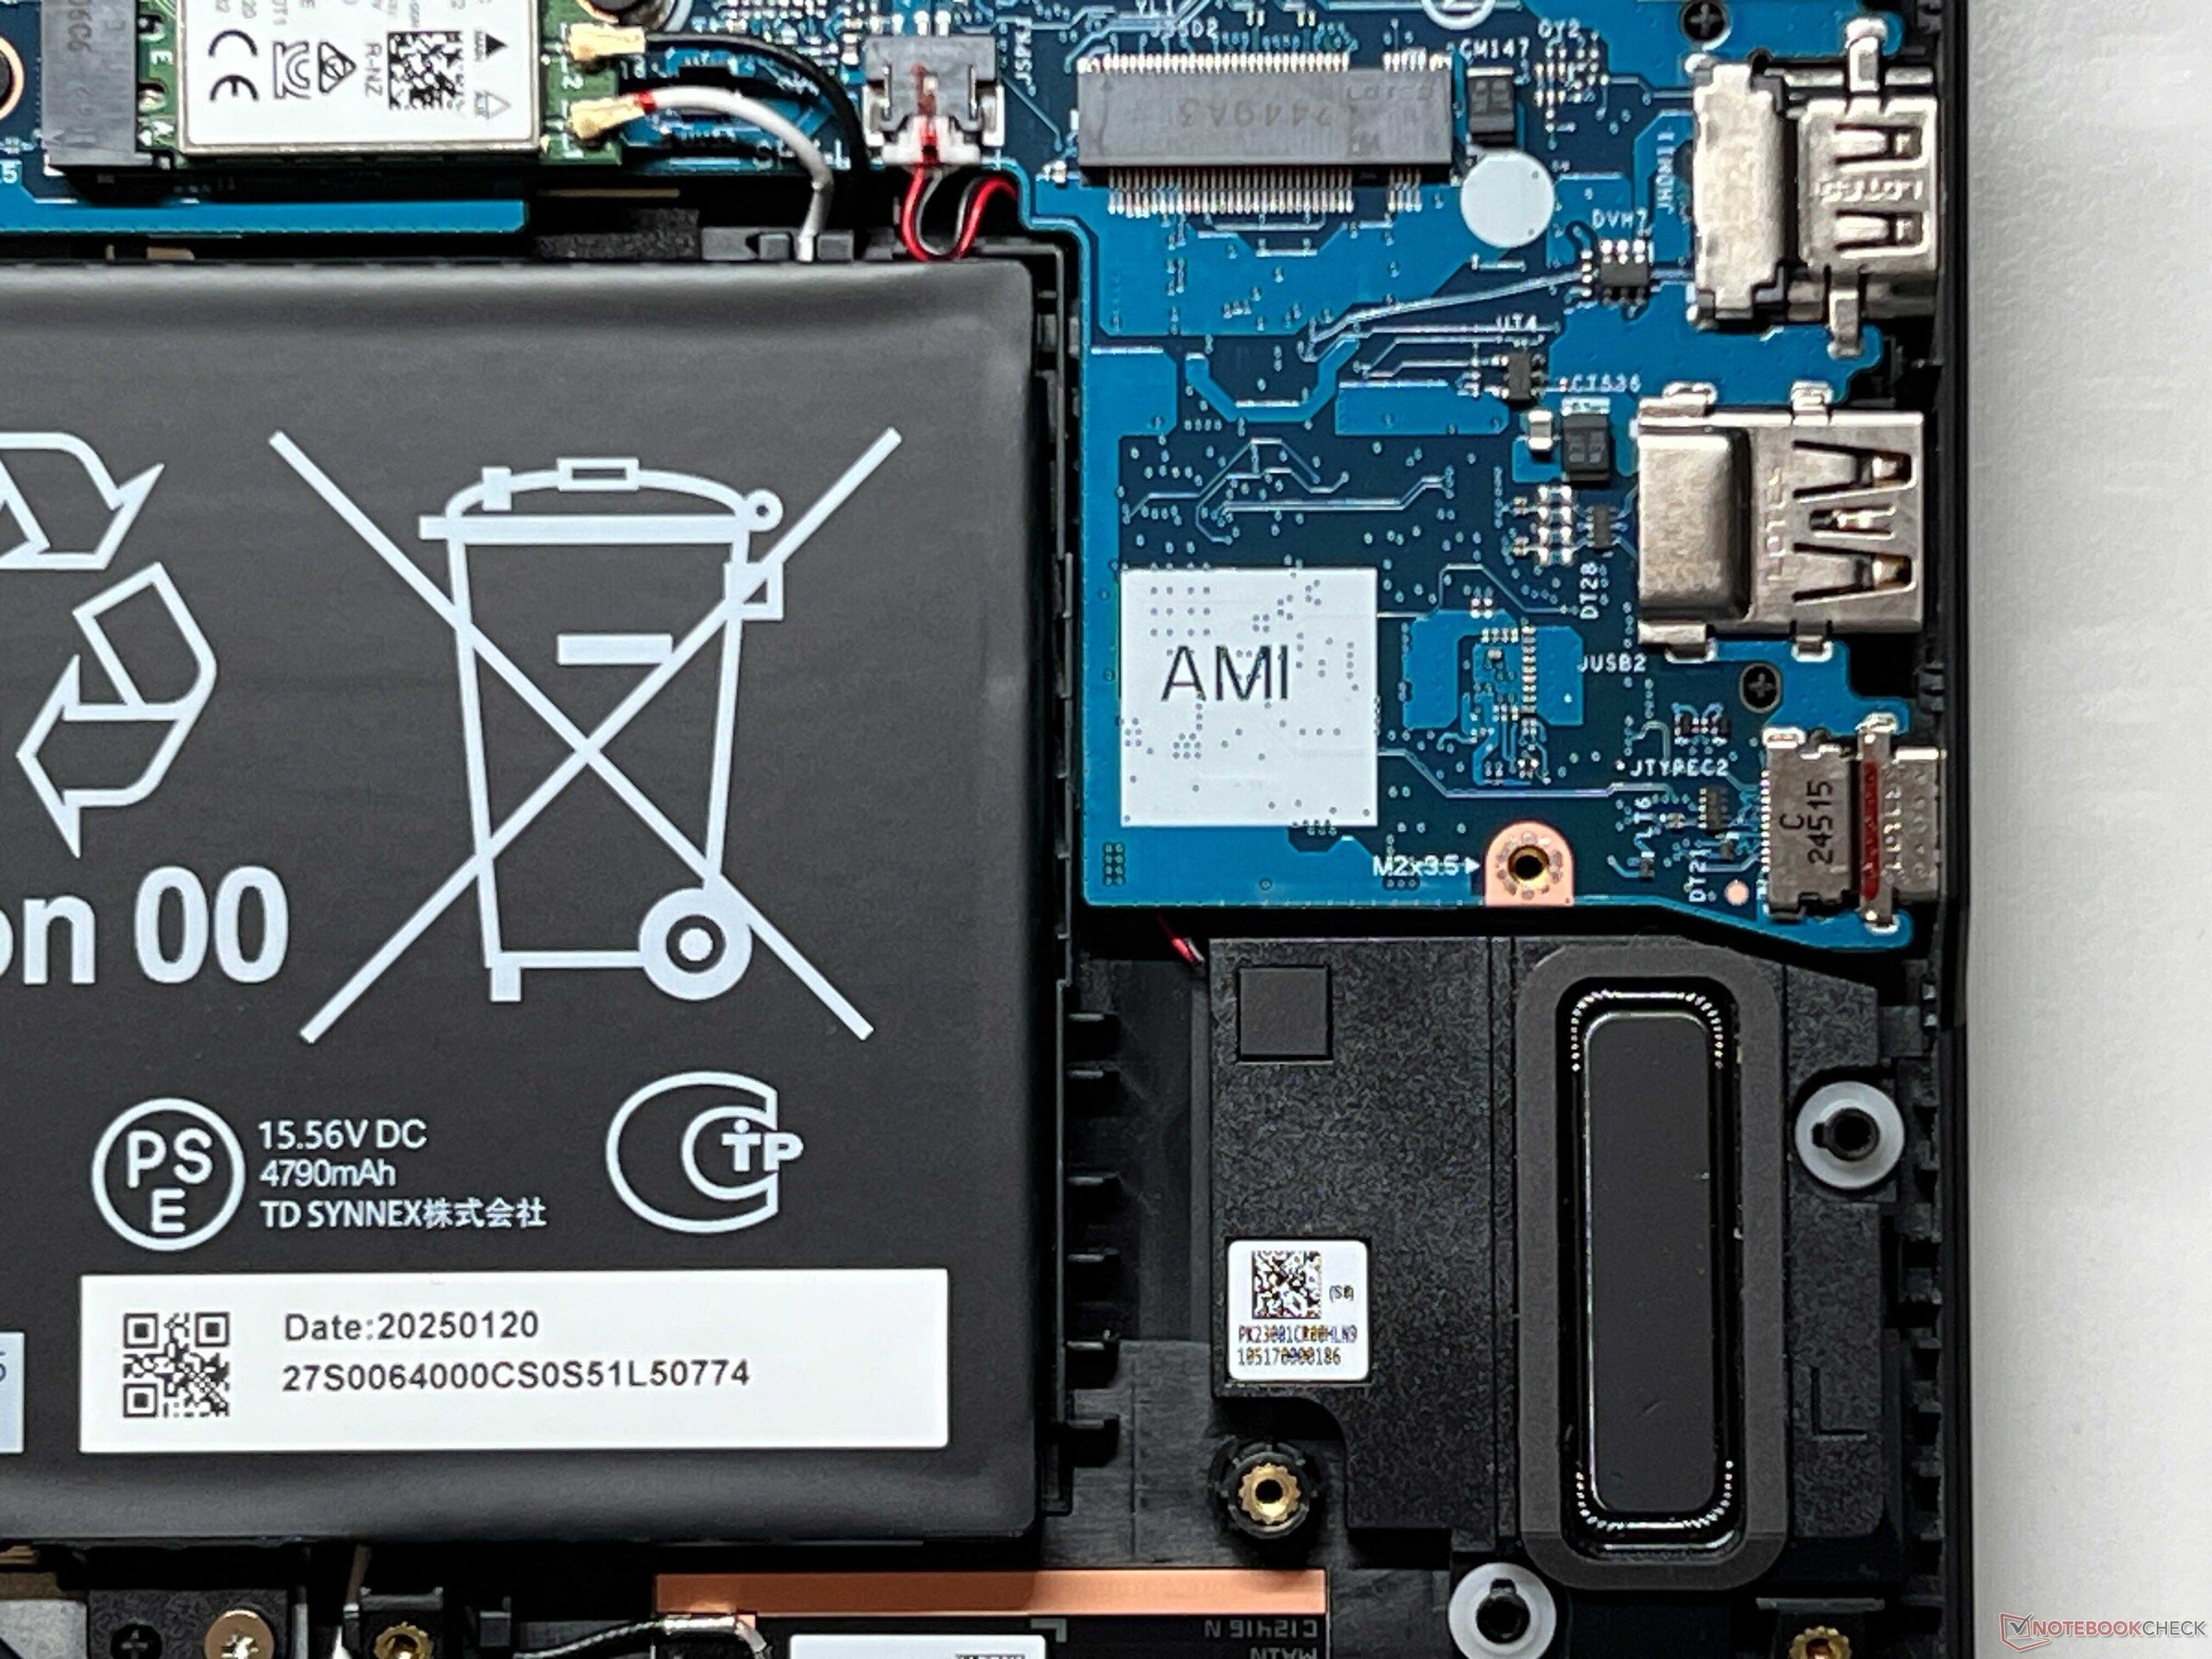
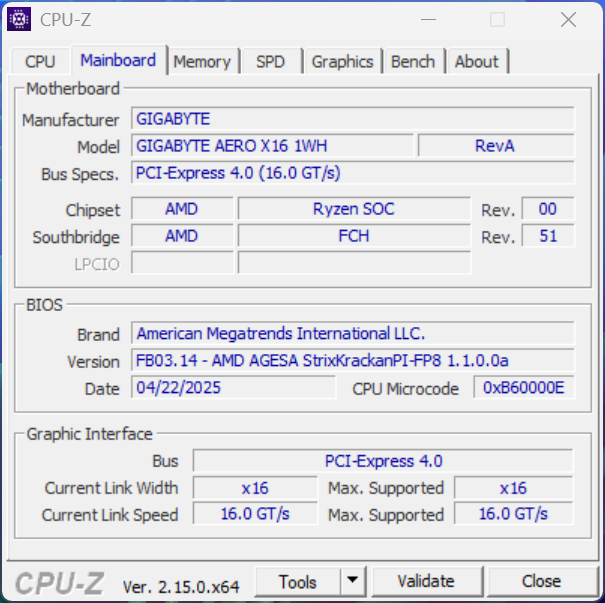
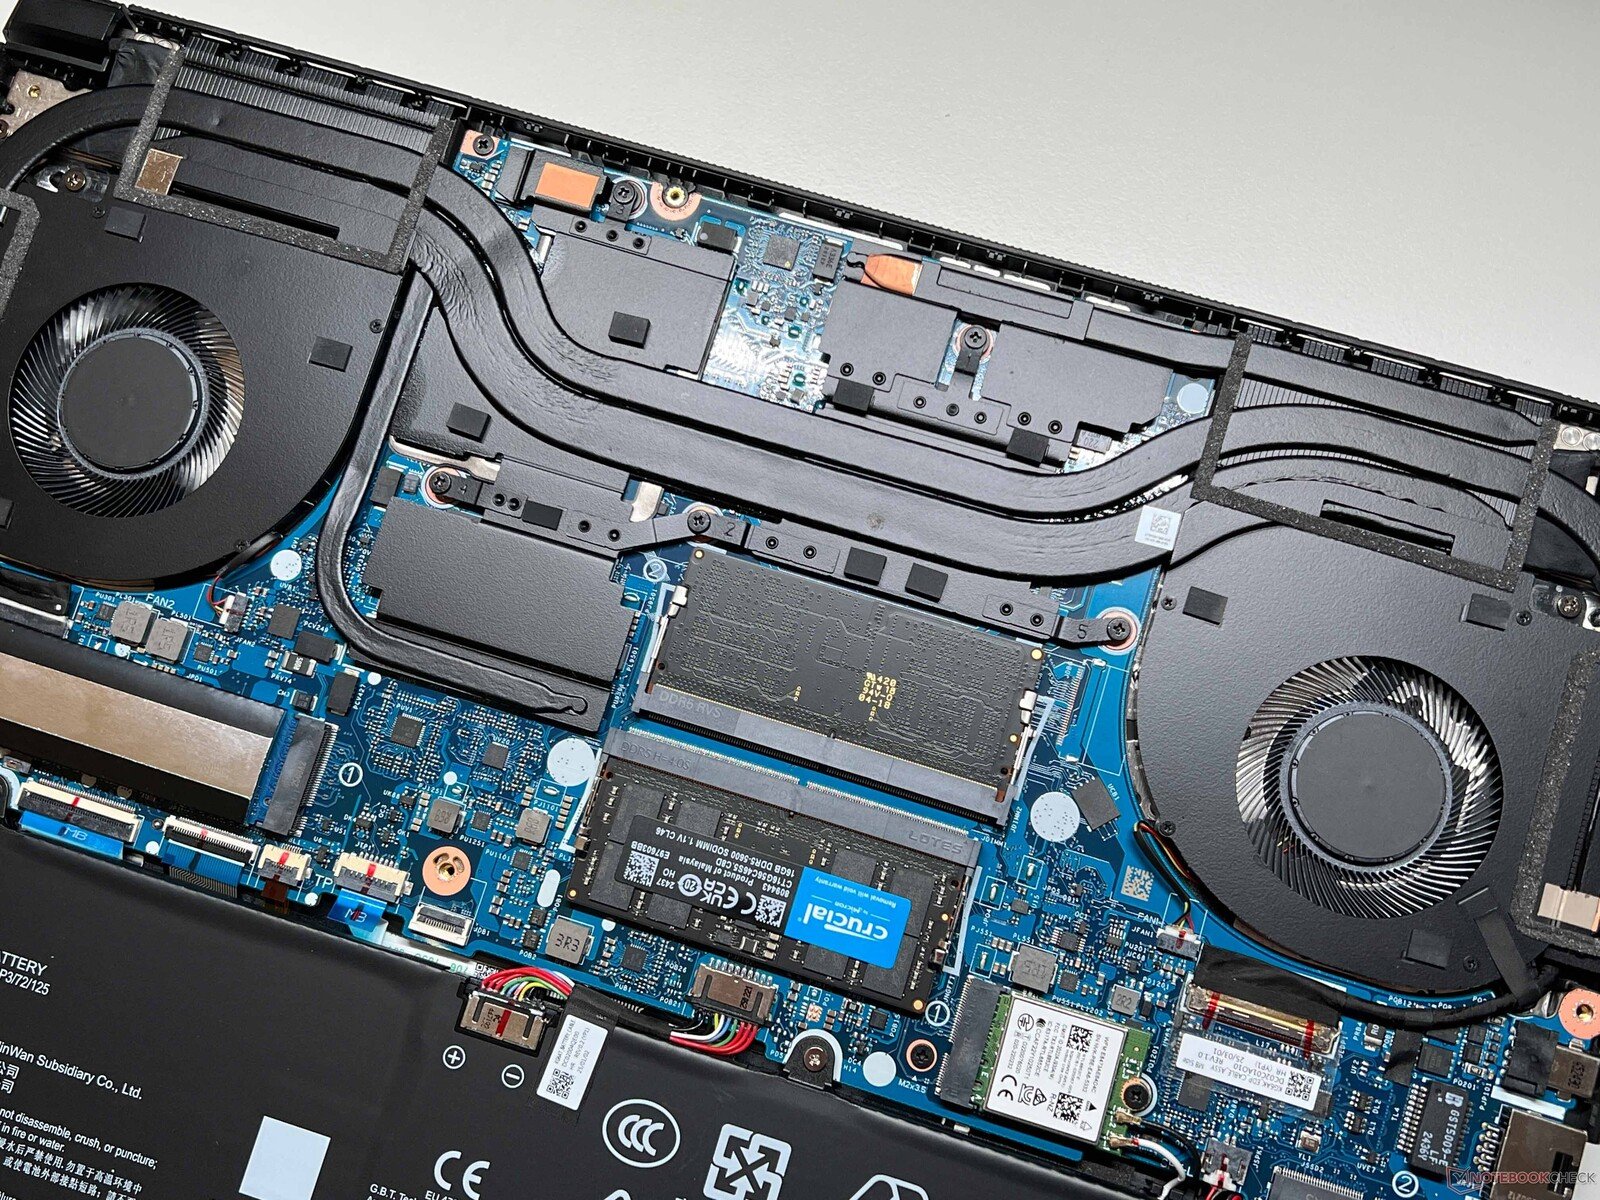
外壳和功能坚固耐用、不易沾染指纹的塑料外壳
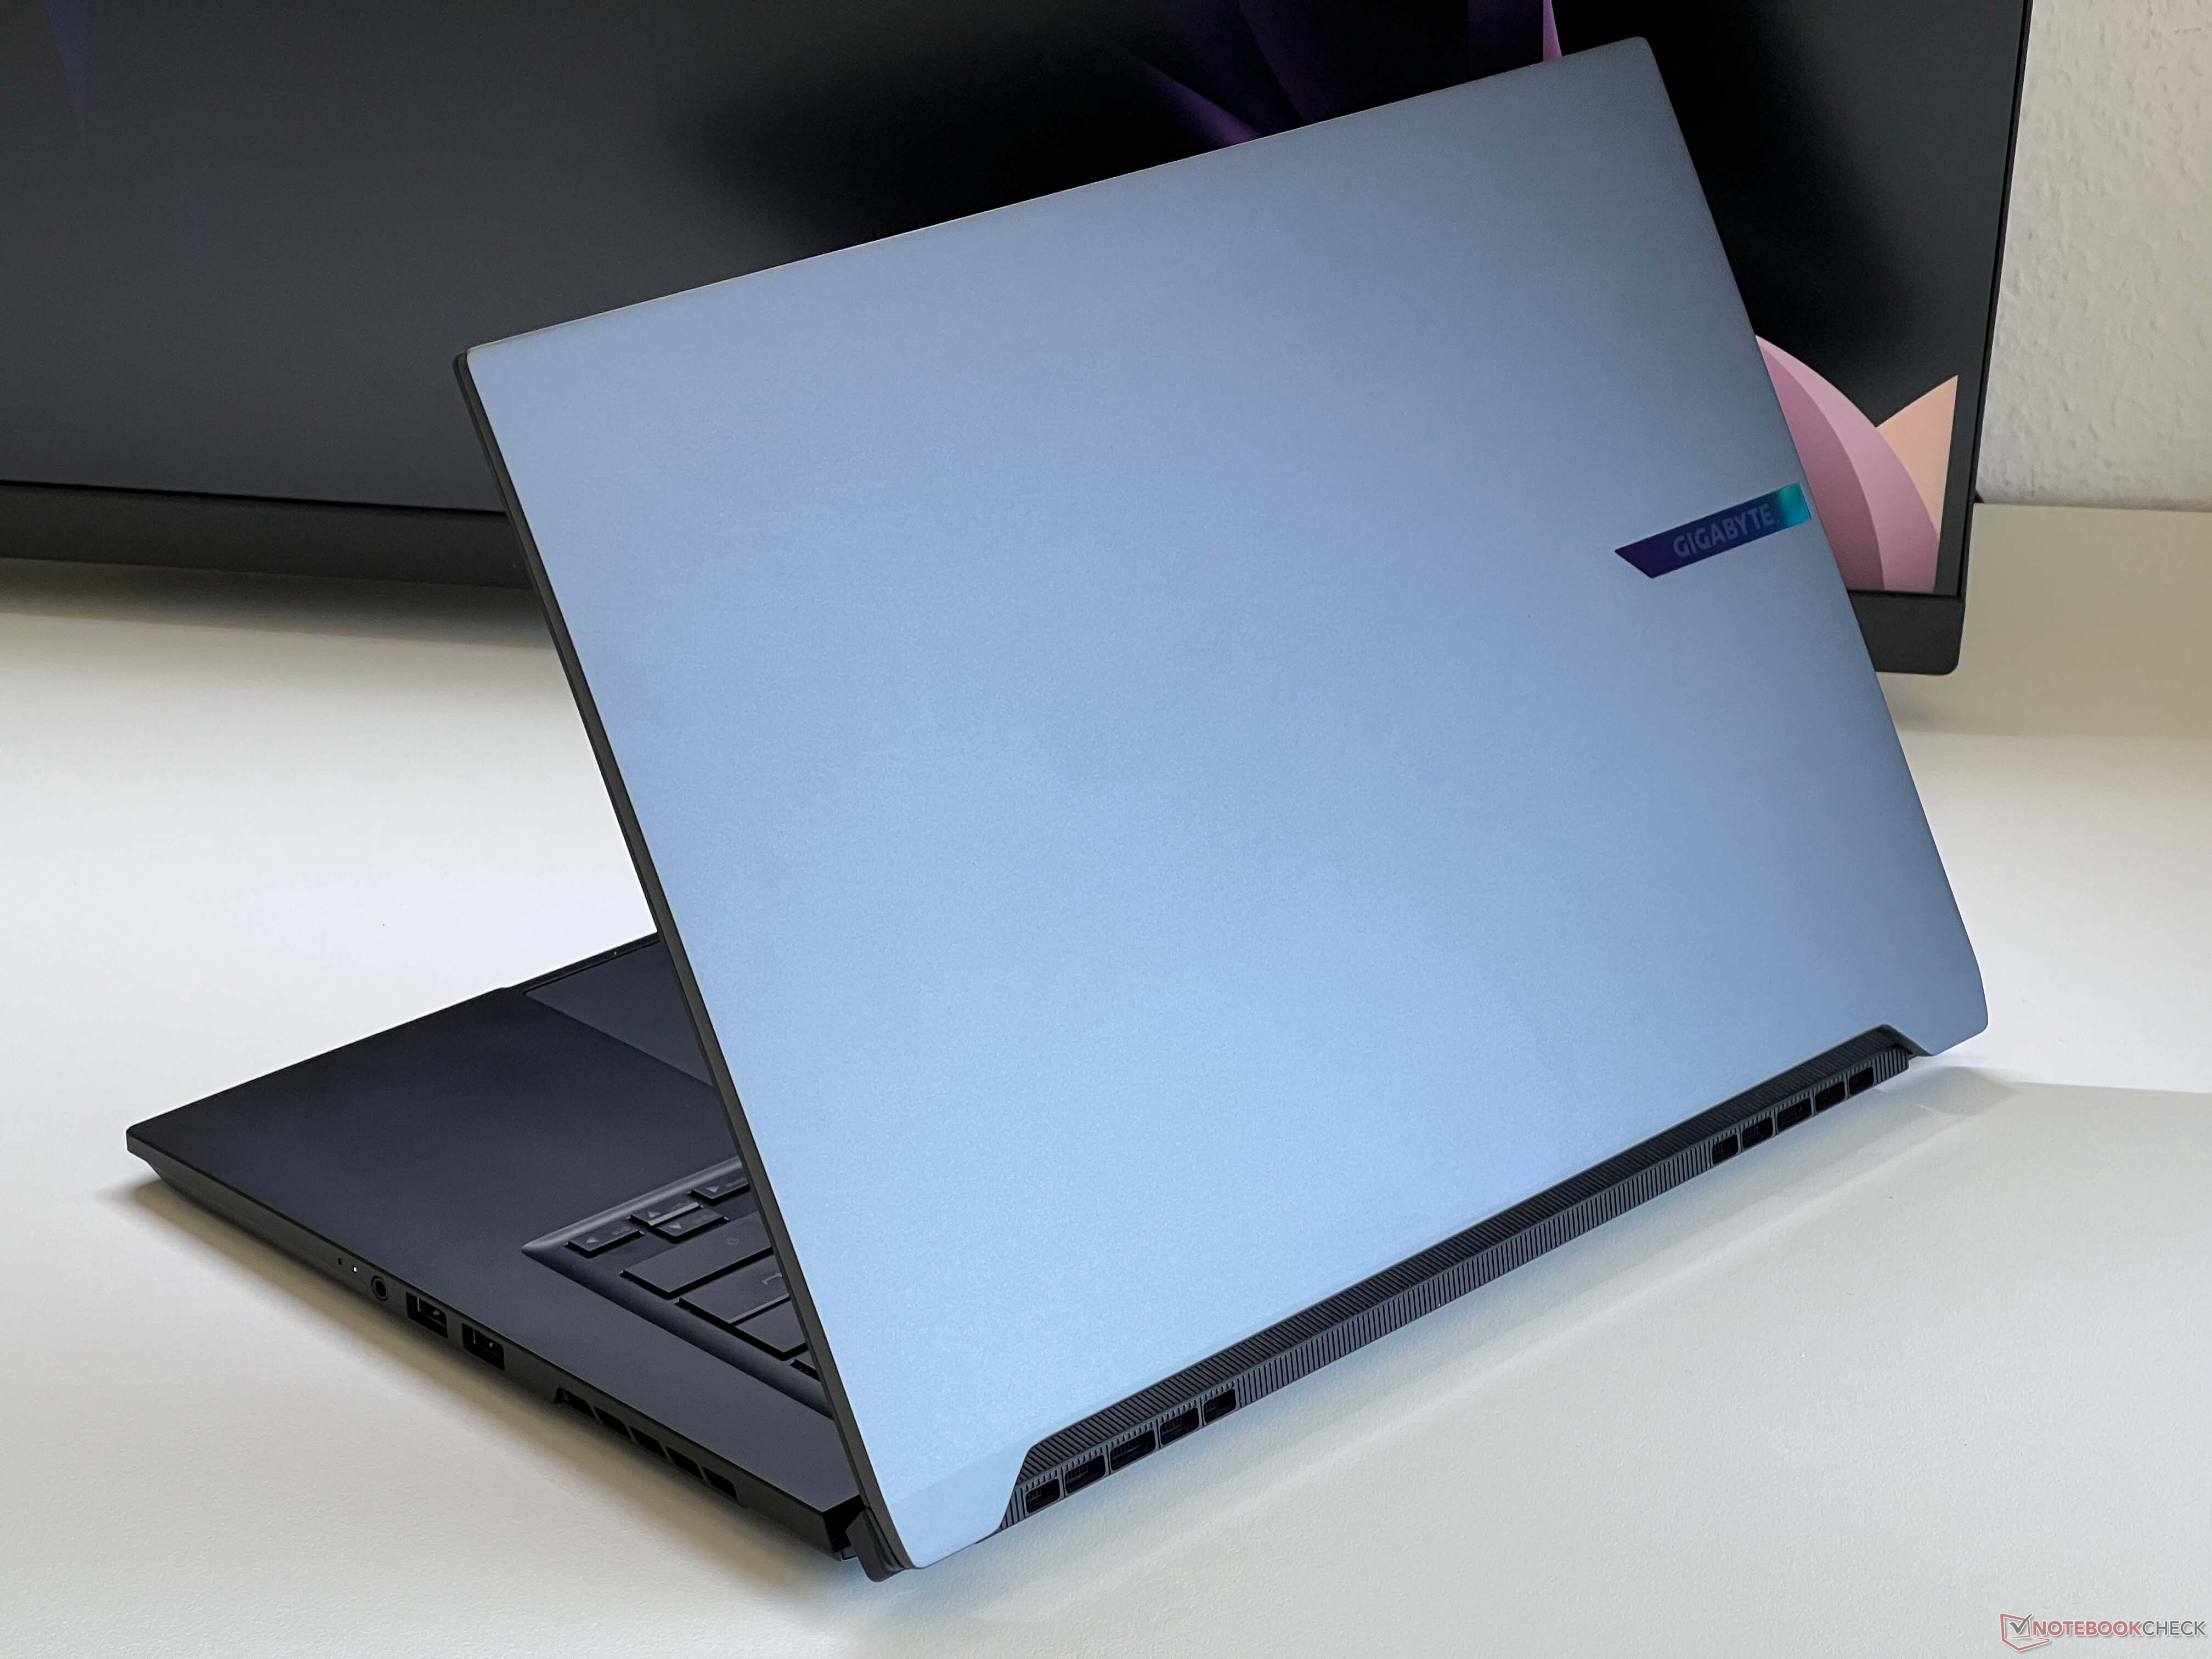
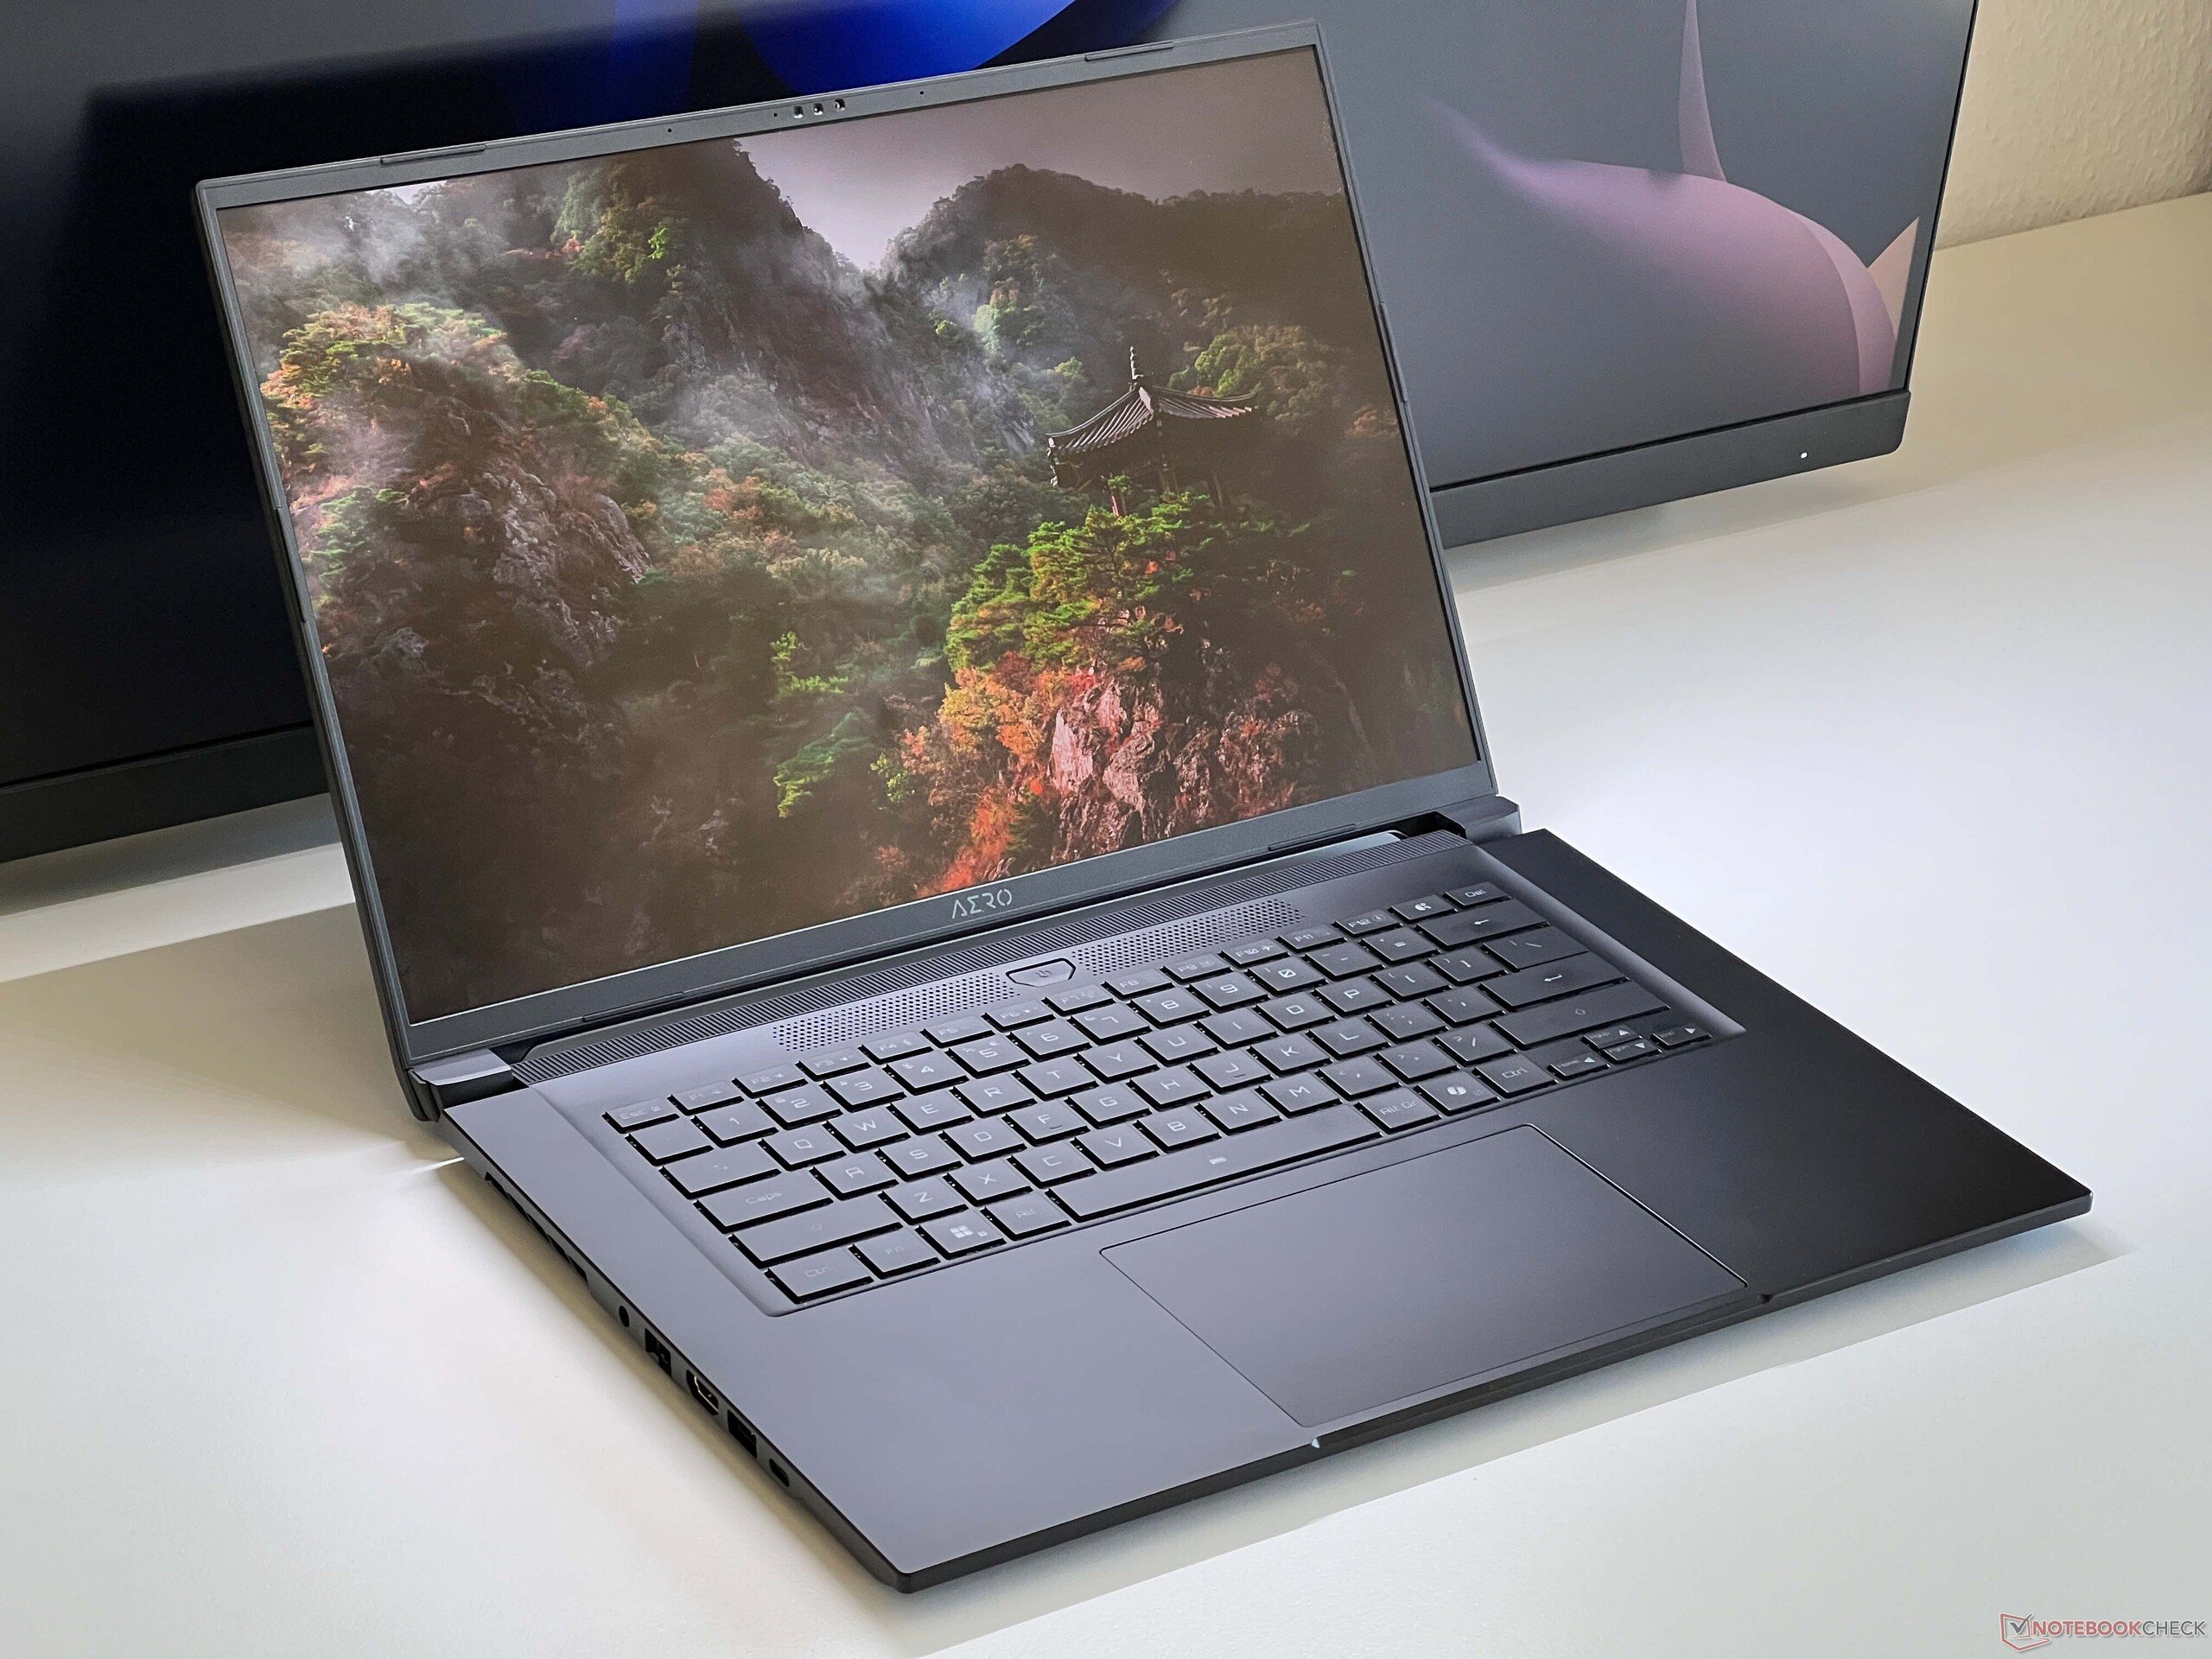
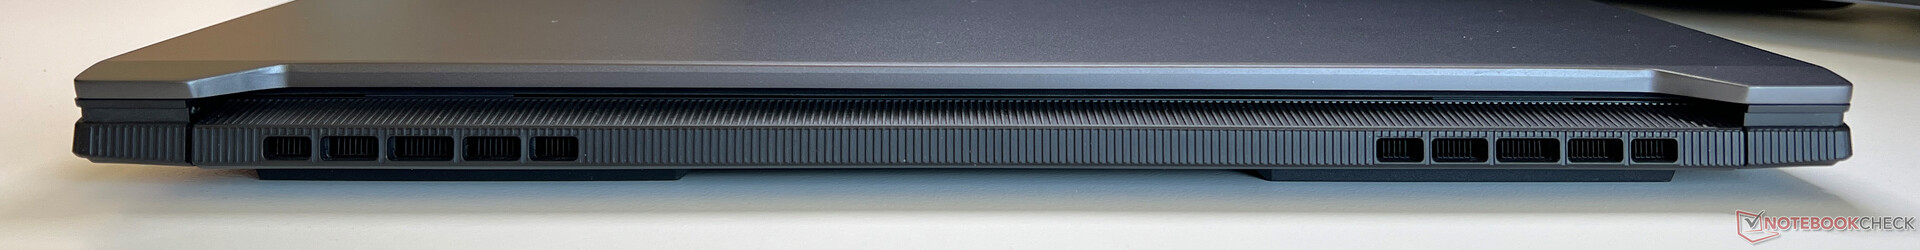
技嘉为新款 Aero X16 采用了塑料结构。对于 16 英寸设备来说,机身相当紧凑,高度为 16.7-19.9 毫米,重量为 1.97 千克。除了极易沾染指纹的深灰色版本外,还有白色版本可供选择。整体而言,稳定性和做工都非常出色。
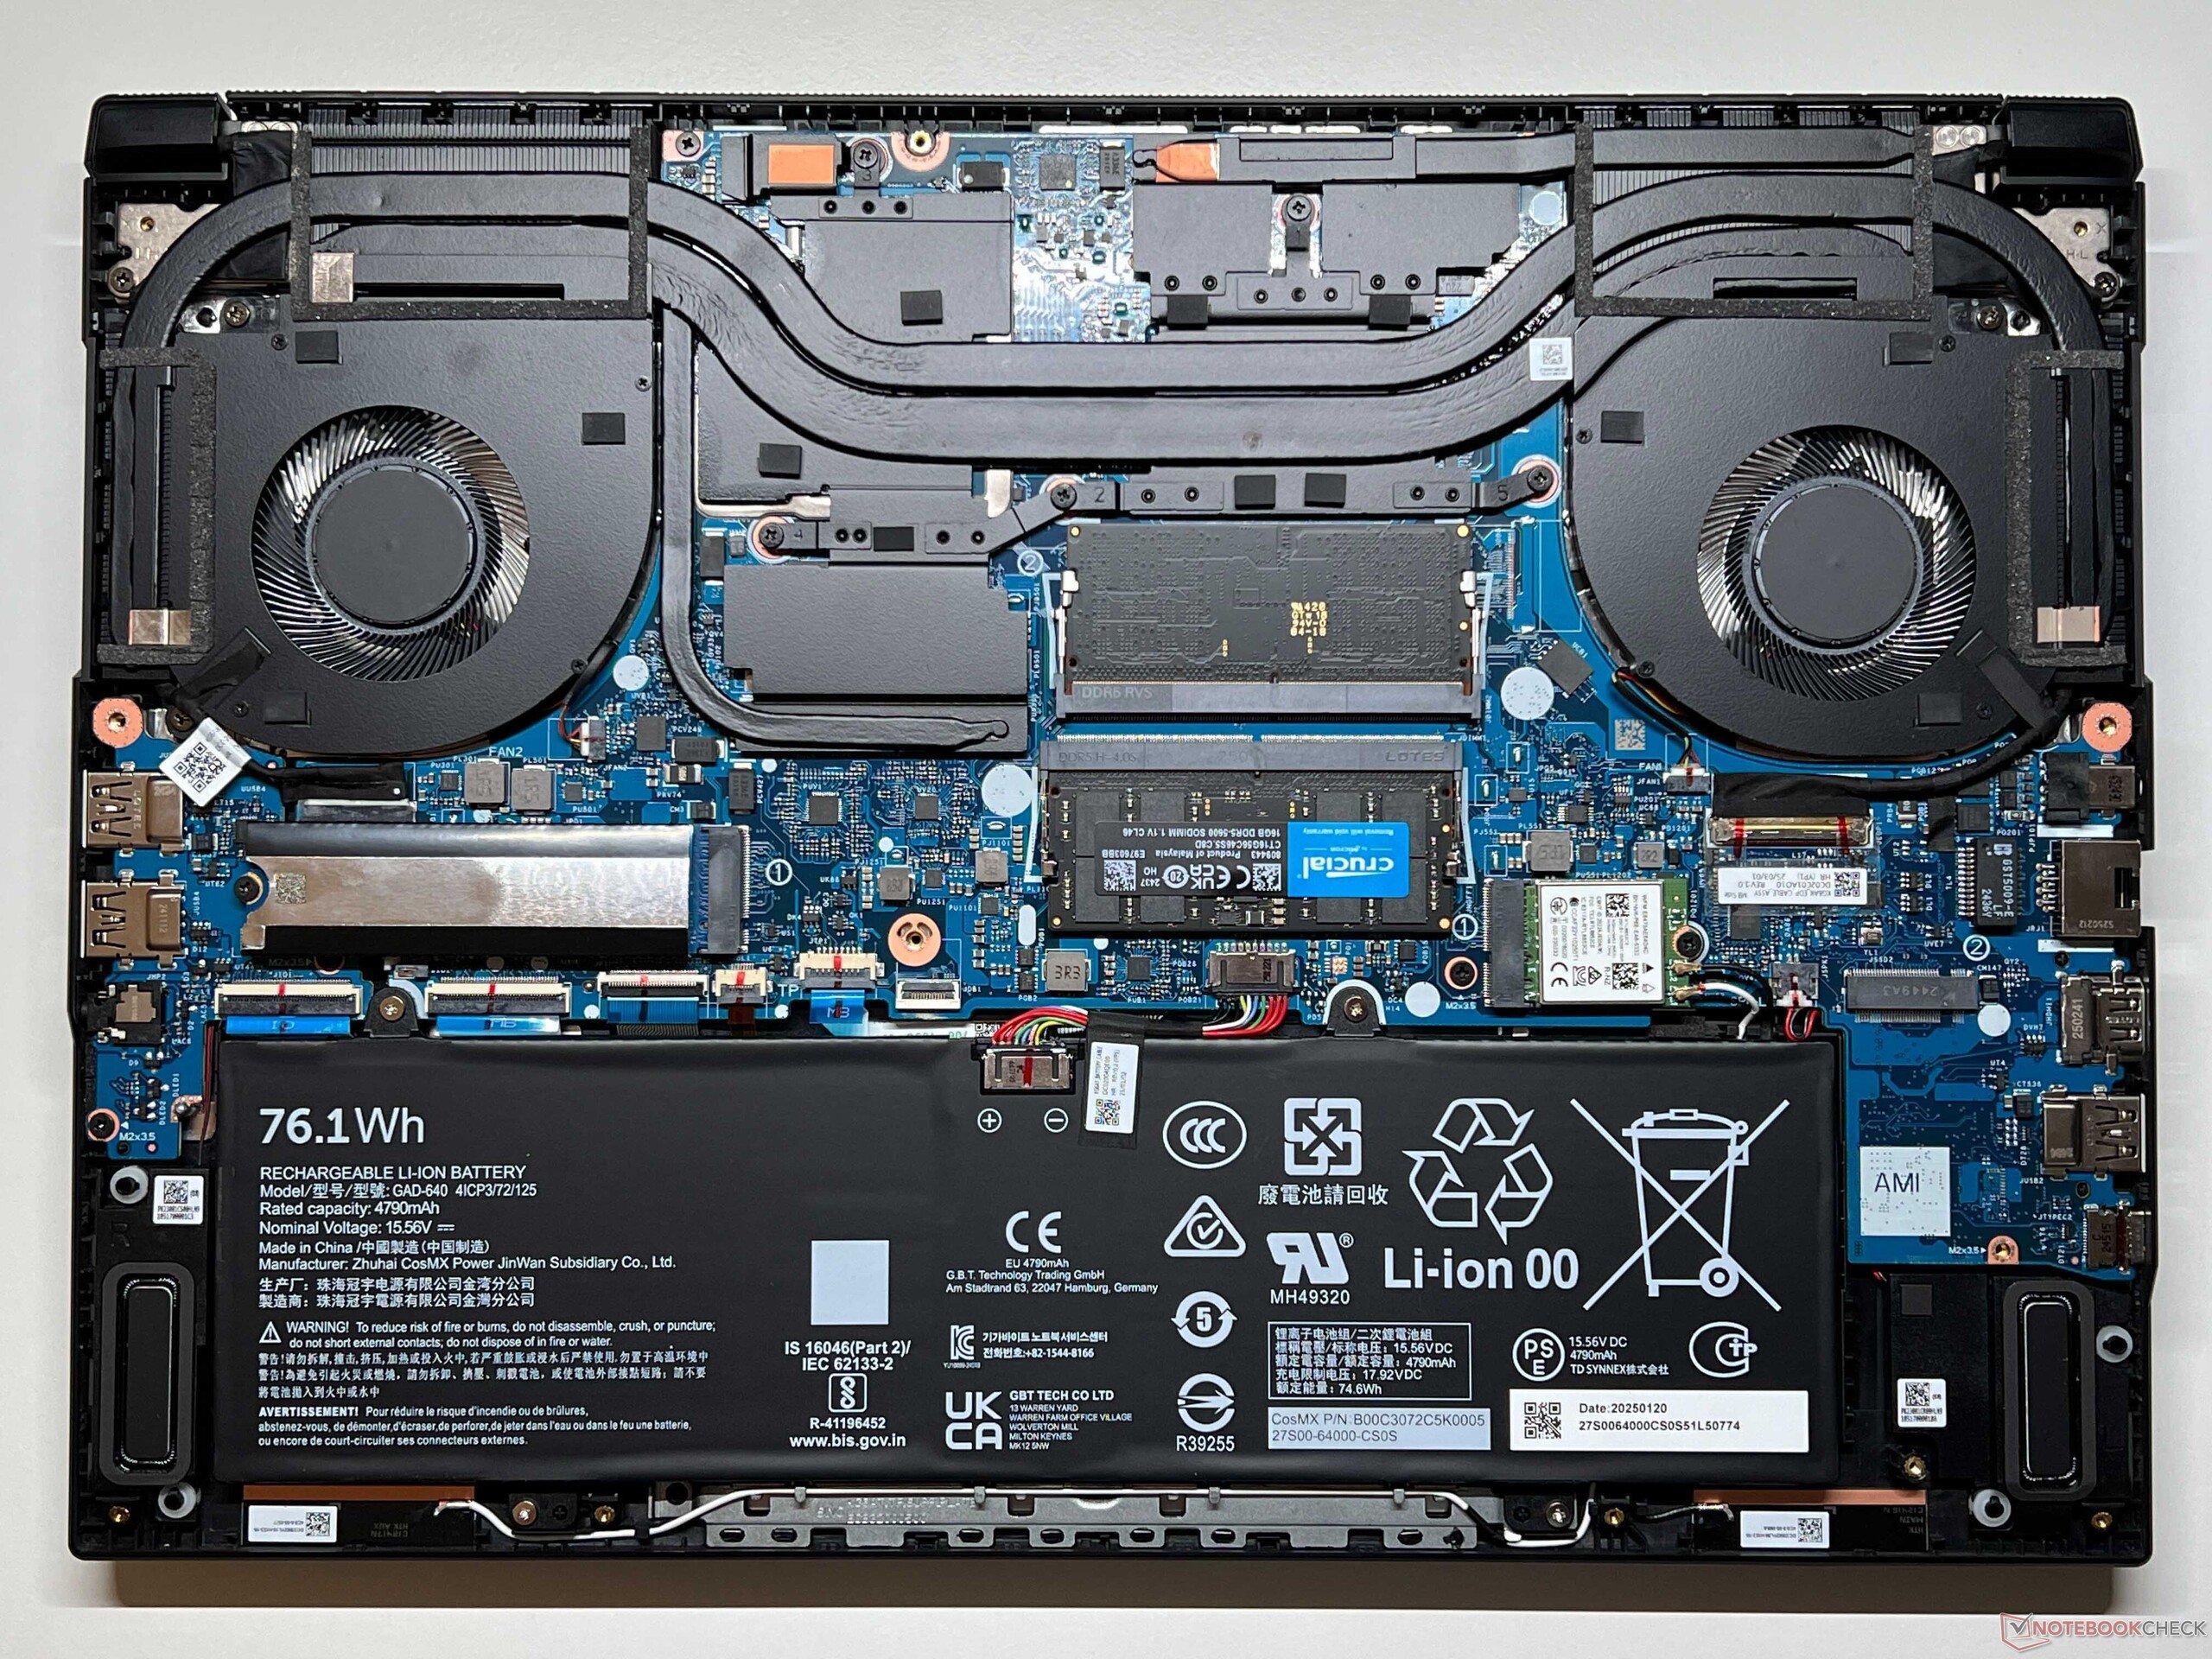
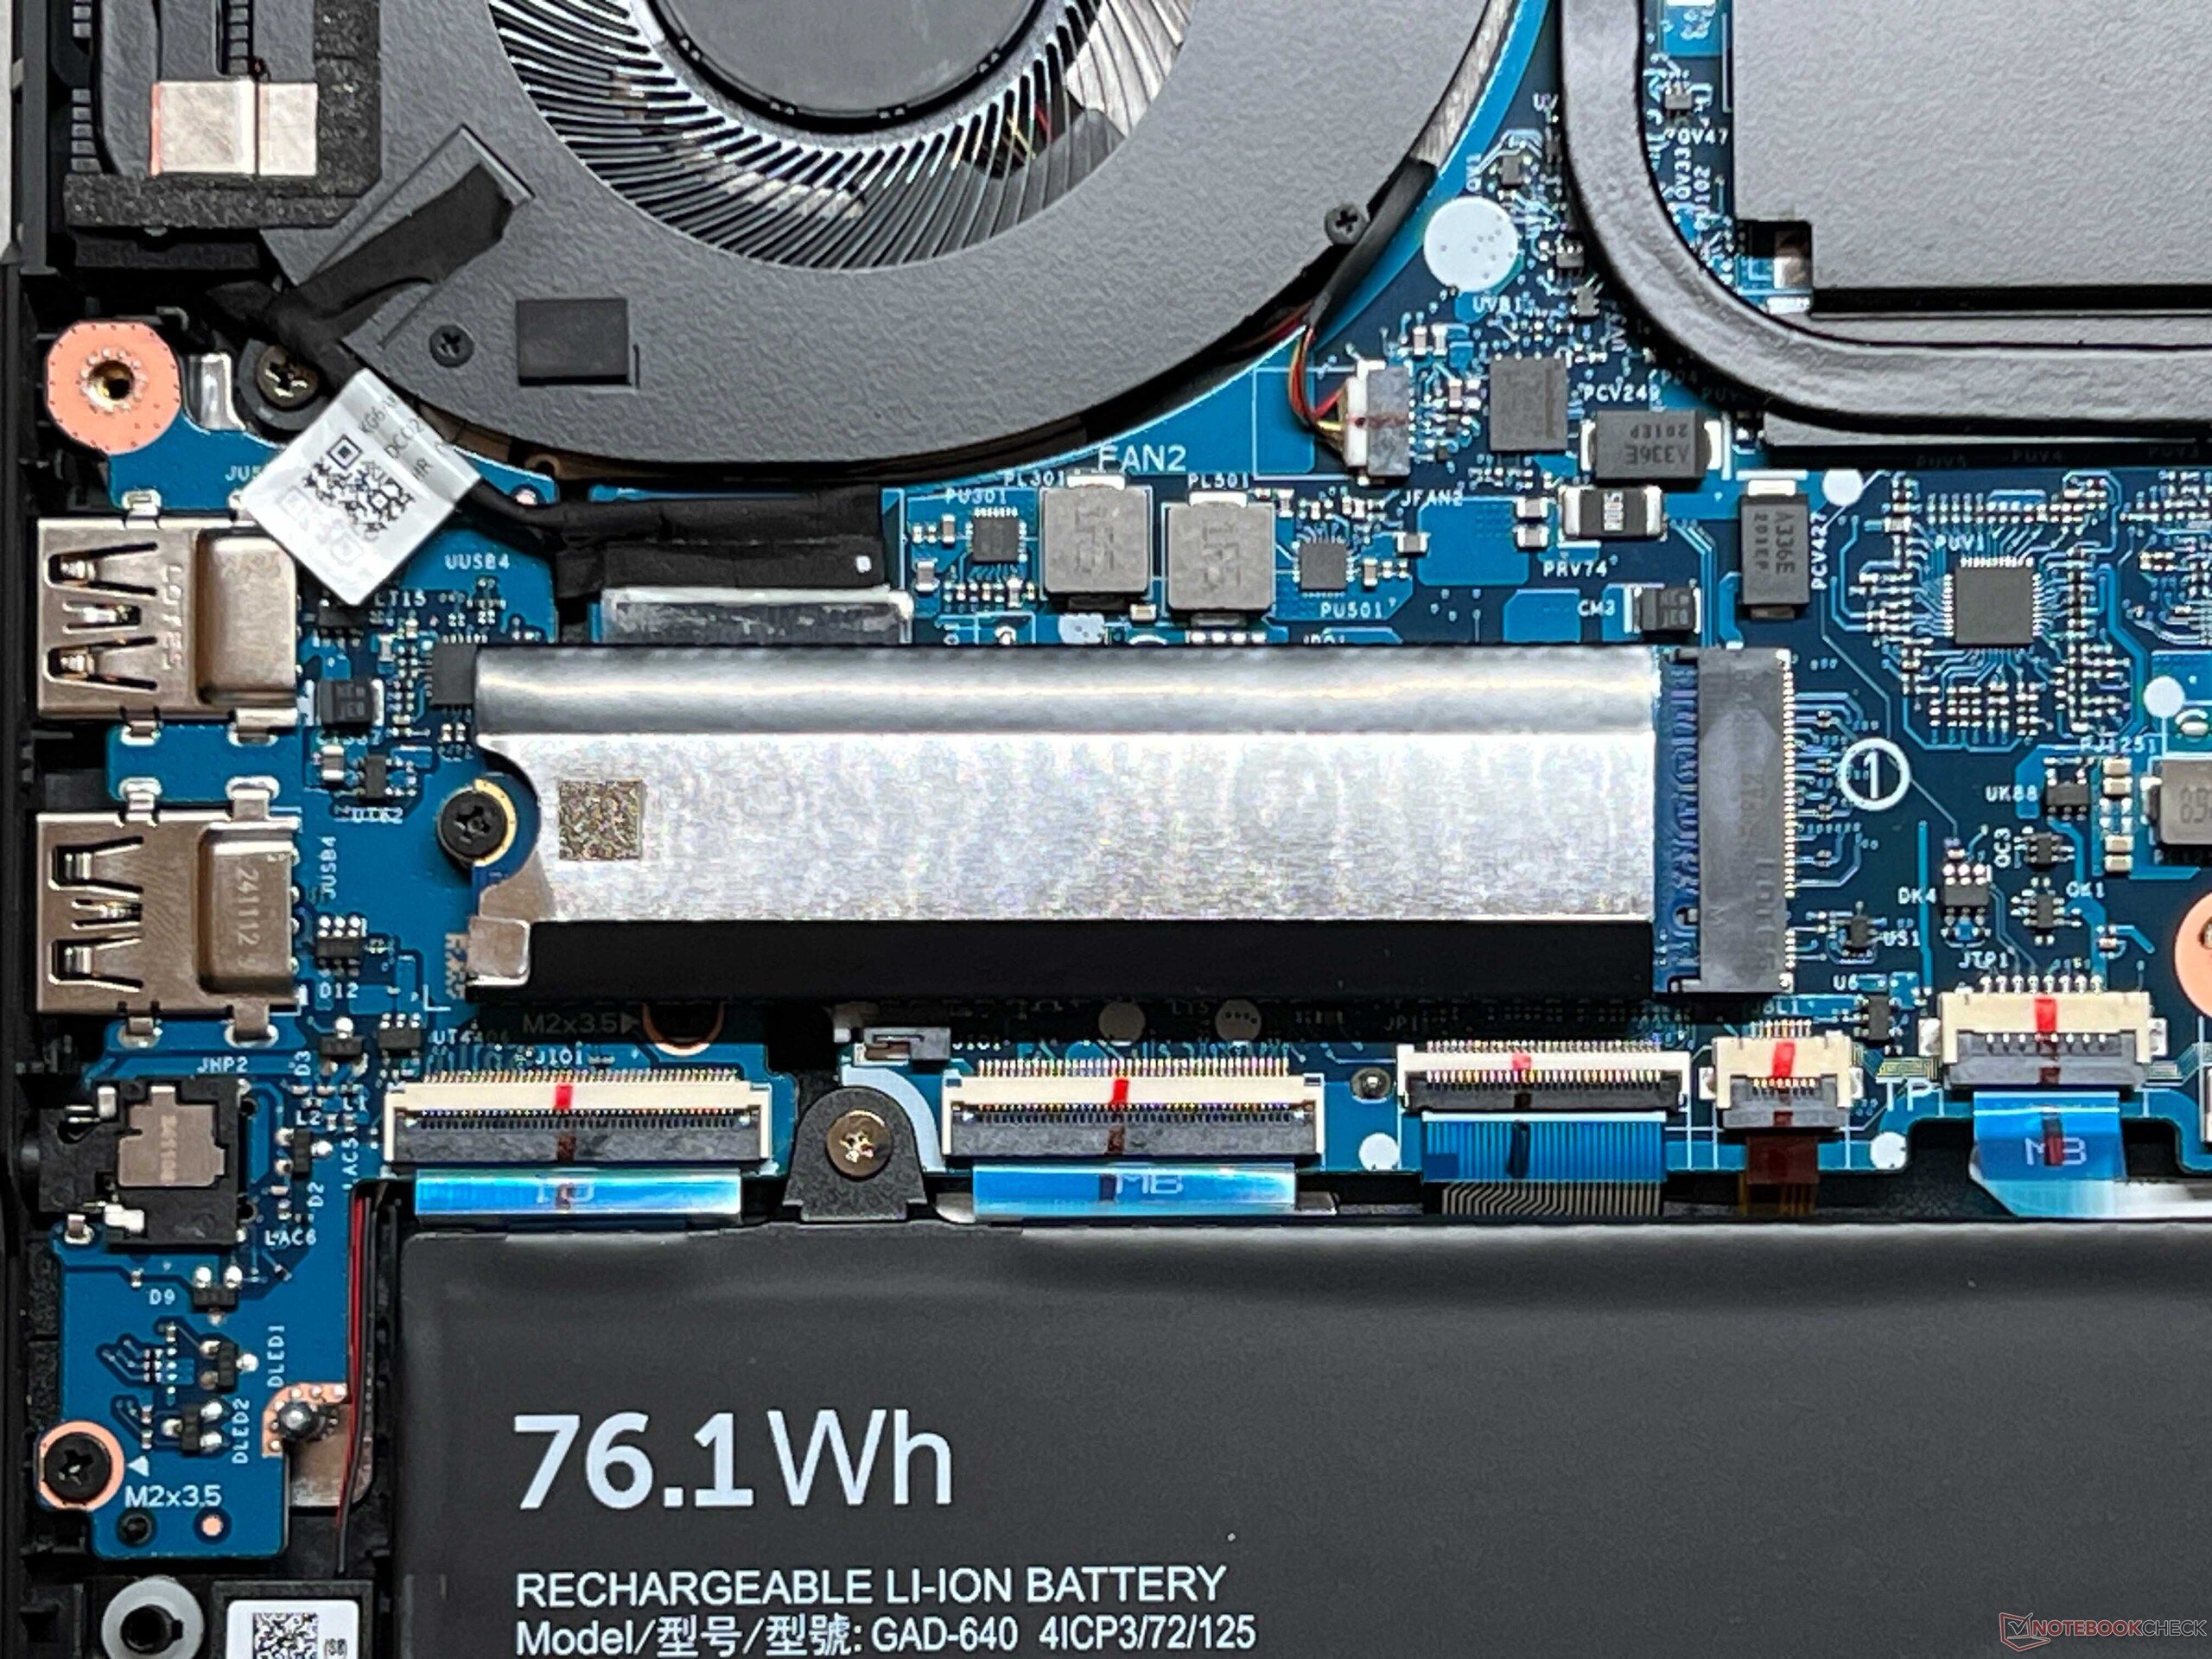
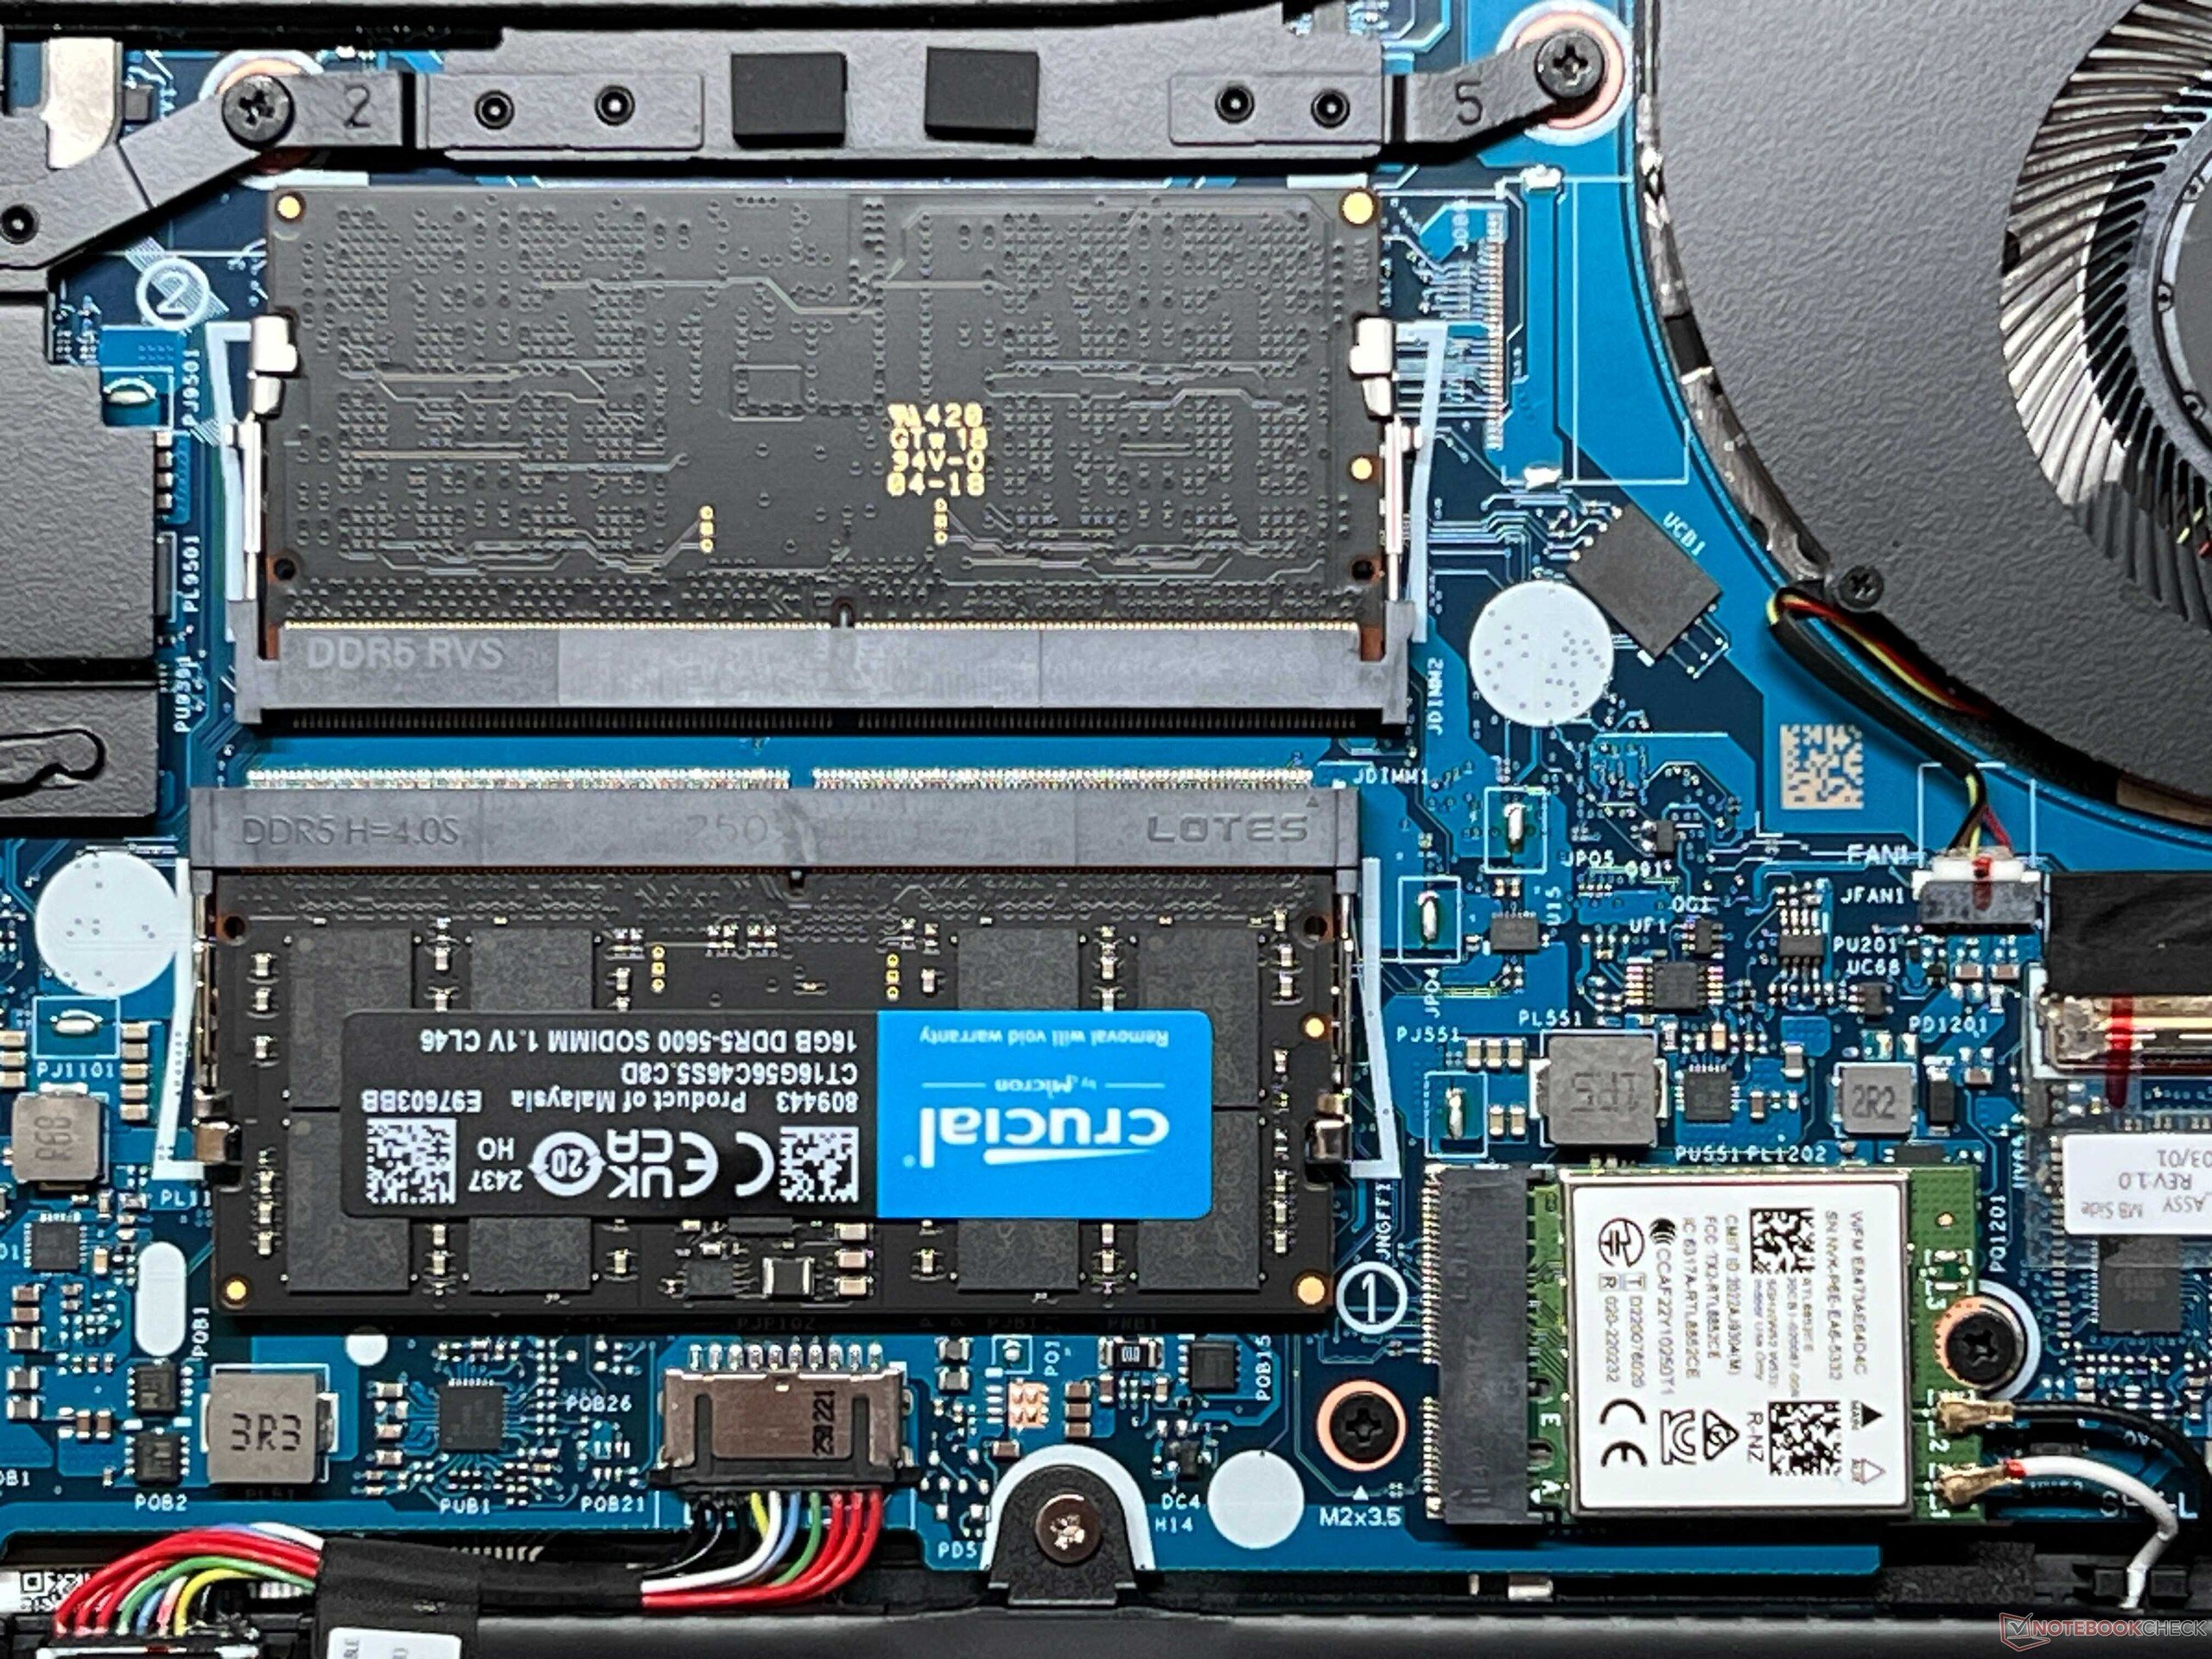
两个铰链足够坚固(最大开启角度 135°),只允许极小的摇晃。由于 Aero X16 是首批将 Zen 5 处理器与可扩展内存相结合的设备之一,因此升级选项非常不错。此外,还有两个用于固态硬盘的 M.2-2280 插槽。
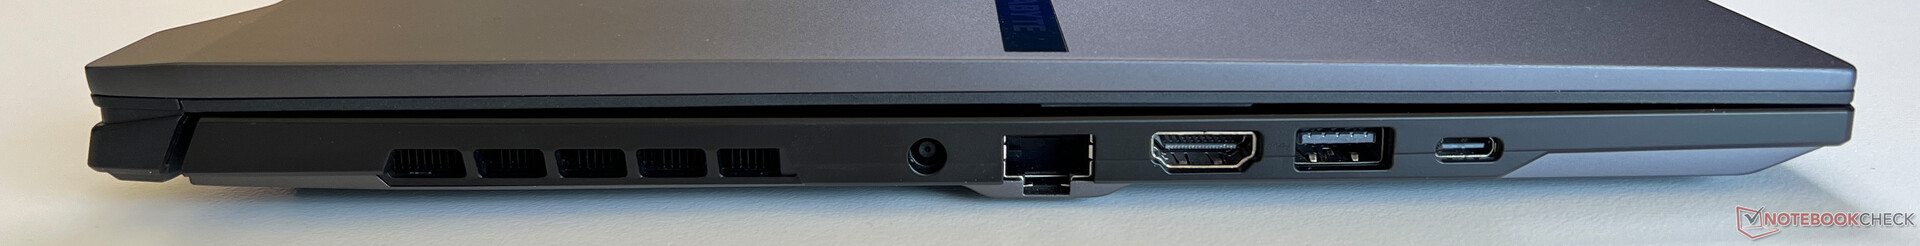
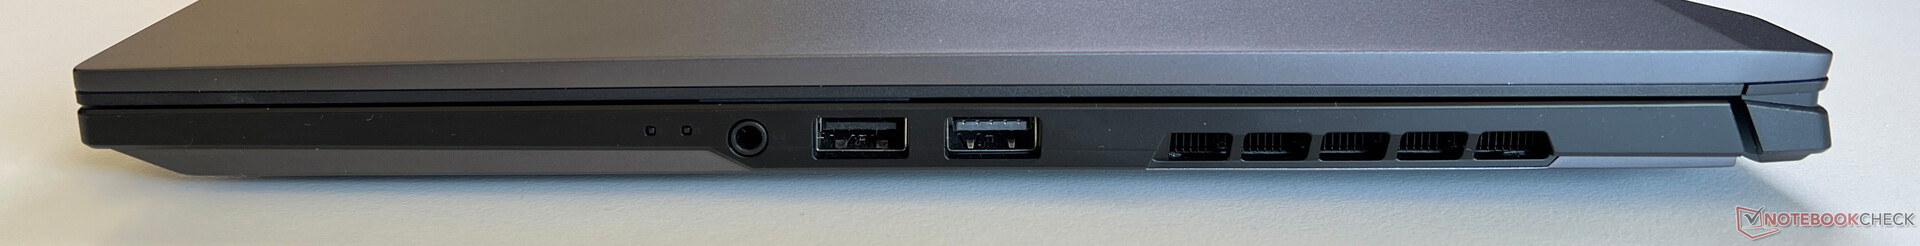
不过,你需要面对一些功能上的妥协。首先,只有一个 Wi-Fi 6E 模块和一个速度较慢的 USB 2.0 端口,这对于 2025 年的高端笔记本电脑来说是无法解释的。
这些端口位于非常靠近正面的两侧。得益于 AMD 处理器,技嘉 Aero X16 是一款 Copilot+ 笔记本电脑,具有先进的 AI 功能,包括实时字幕和网络摄像头的演播室特效。
网络摄像头可拍摄 1080p 格式的照片,但画质不是特别好。提供用于人脸识别的红外模块。
| Networking | |
| Gigabyte Aero X16 1WH | |
| iperf3 transmit AXE11000 | |
| iperf3 receive AXE11000 | |
| Asus TUF Gaming A16 FA608WV | |
| iperf3 transmit AXE11000 | |
| iperf3 receive AXE11000 | |
| iperf3 transmit AXE11000 6GHz | |
| iperf3 receive AXE11000 6GHz | |
| Lenovo Yoga Pro 9 16IMH9 | |
| iperf3 transmit AXE11000 | |
| iperf3 receive AXE11000 | |
| Dell XPS 16 9640 | |
| iperf3 transmit AXE11000 | |
| iperf3 receive AXE11000 | |
| Asus ROG Zephyrus G16 2024 GU605M | |
| iperf3 transmit AXE11000 | |
| iperf3 receive AXE11000 | |
| Schenker XMG CORE 16 (L23) | |
| iperf3 transmit AXE11000 | |
| iperf3 receive AXE11000 | |


可持续性
技嘉没有提供任何有关环保标准、二氧化碳排放量或使用可回收材料的信息。包装几乎完全由纸板组成。
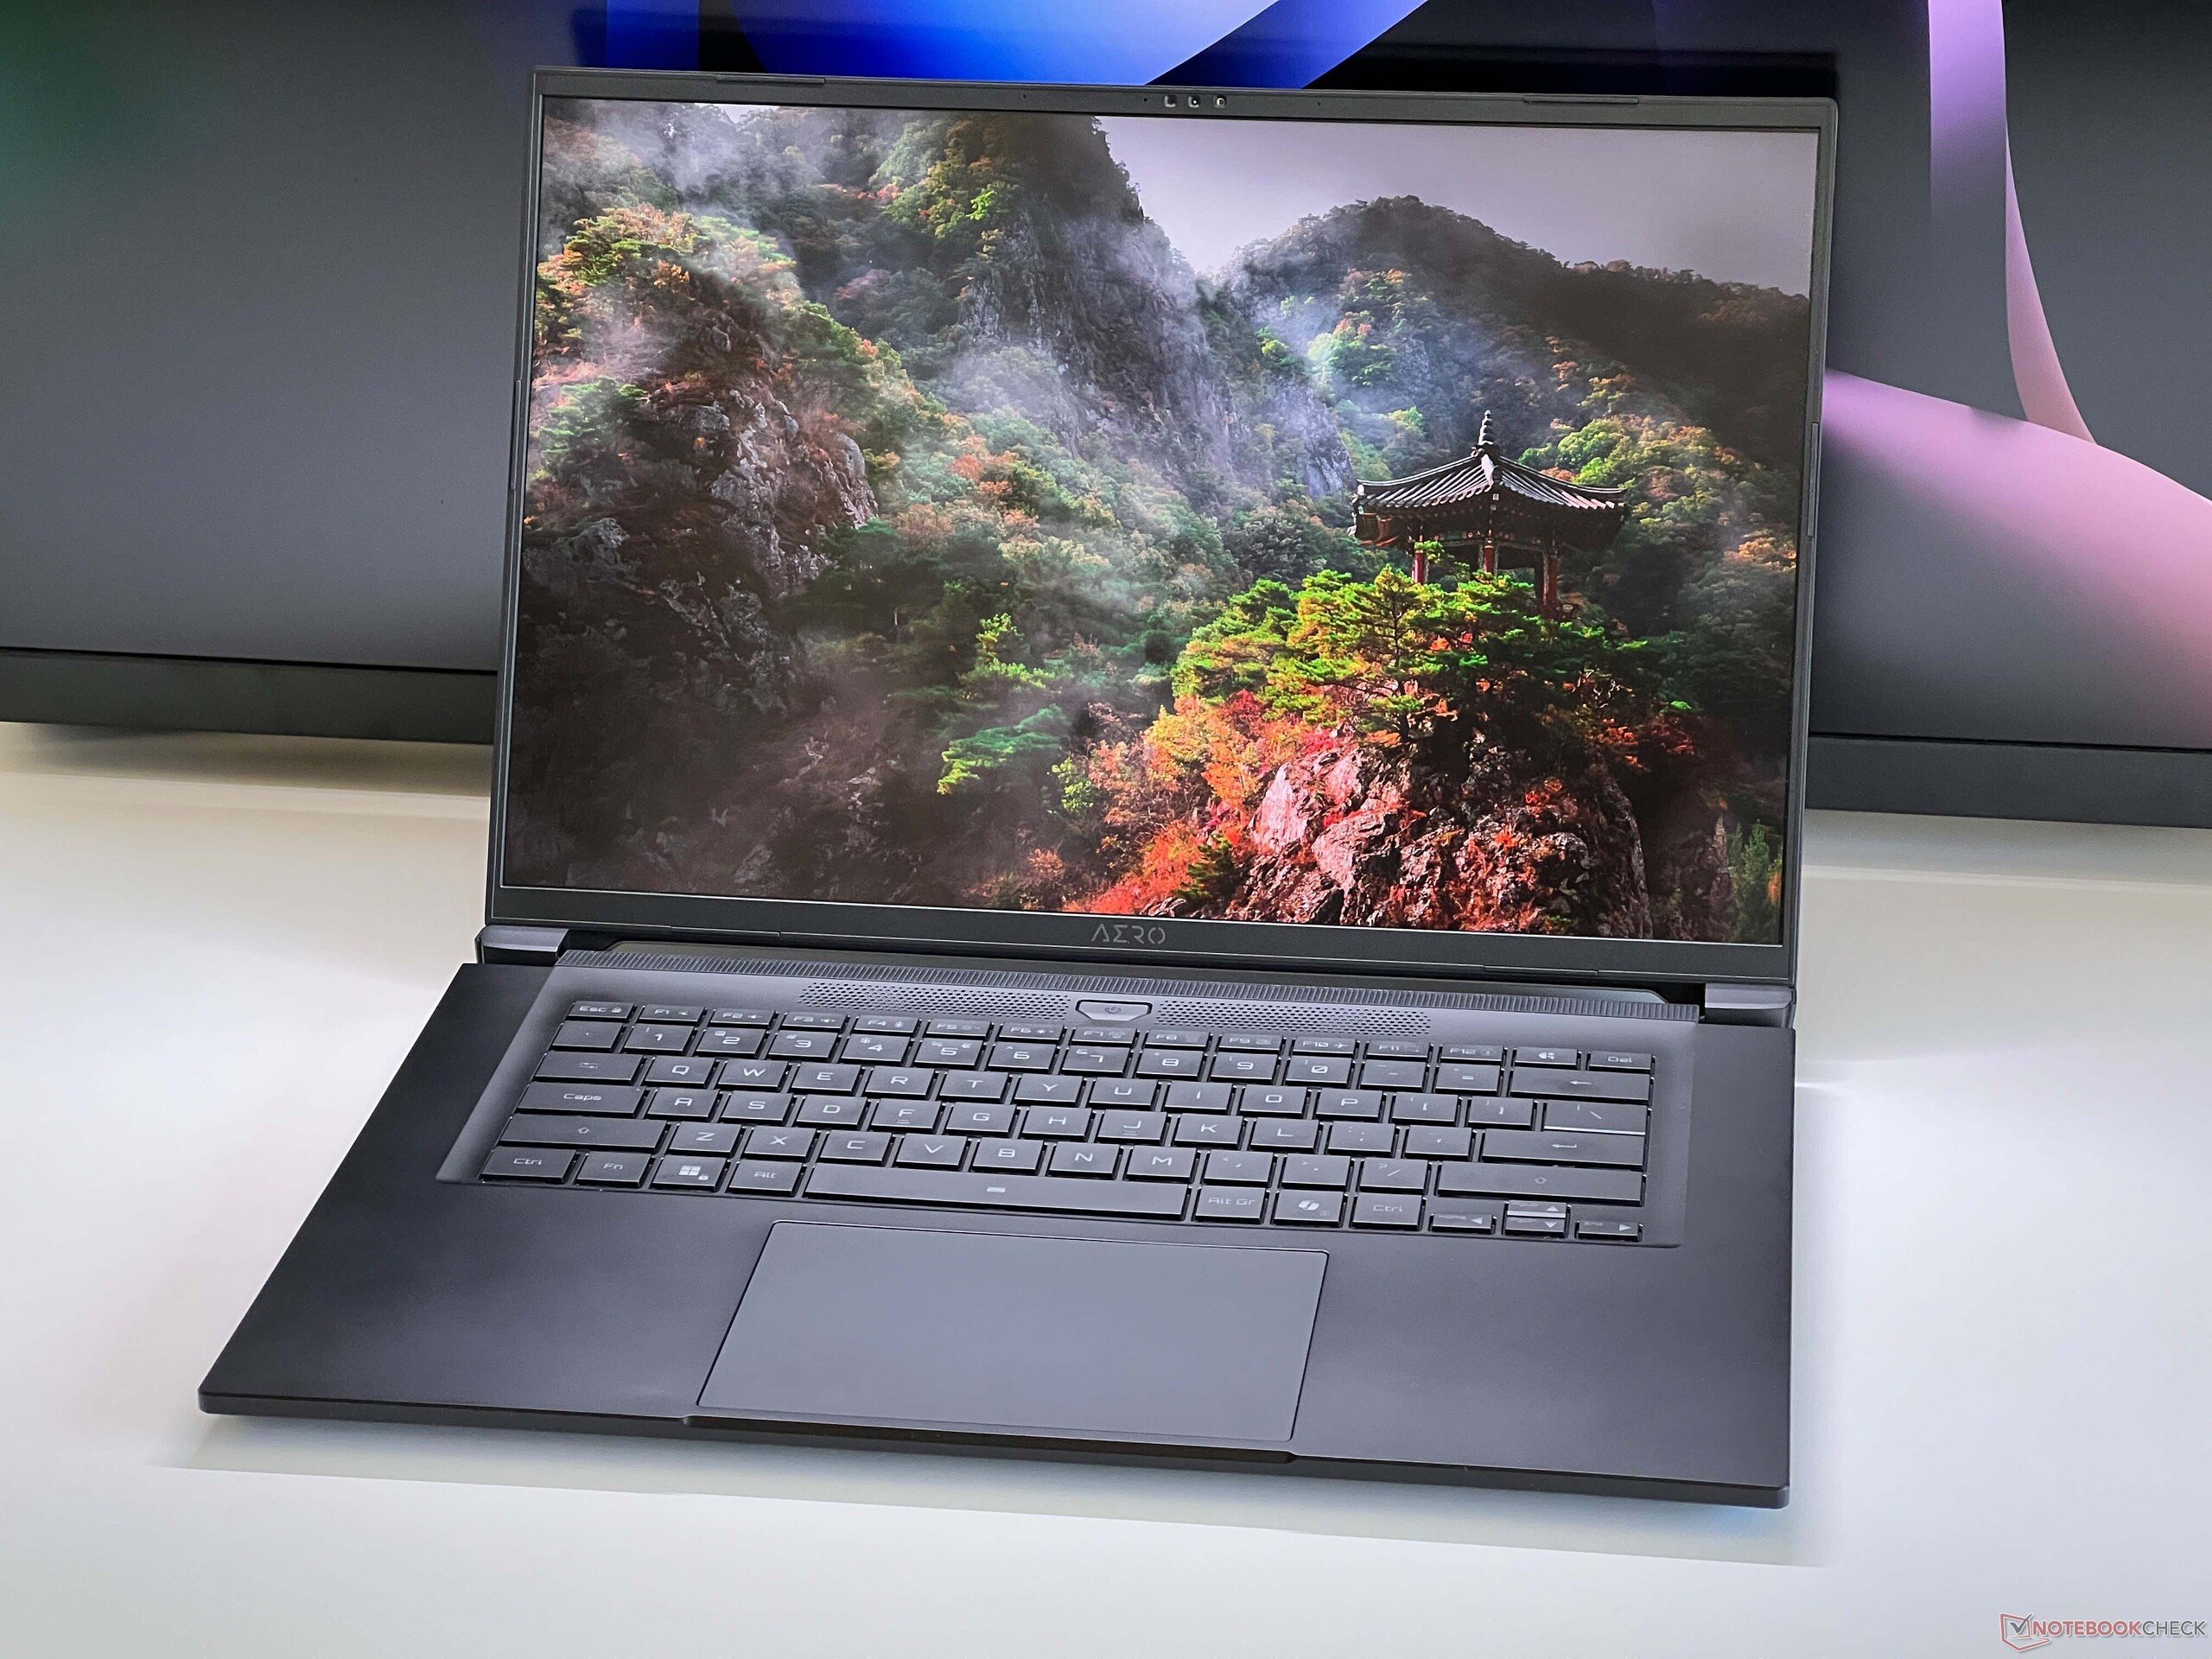
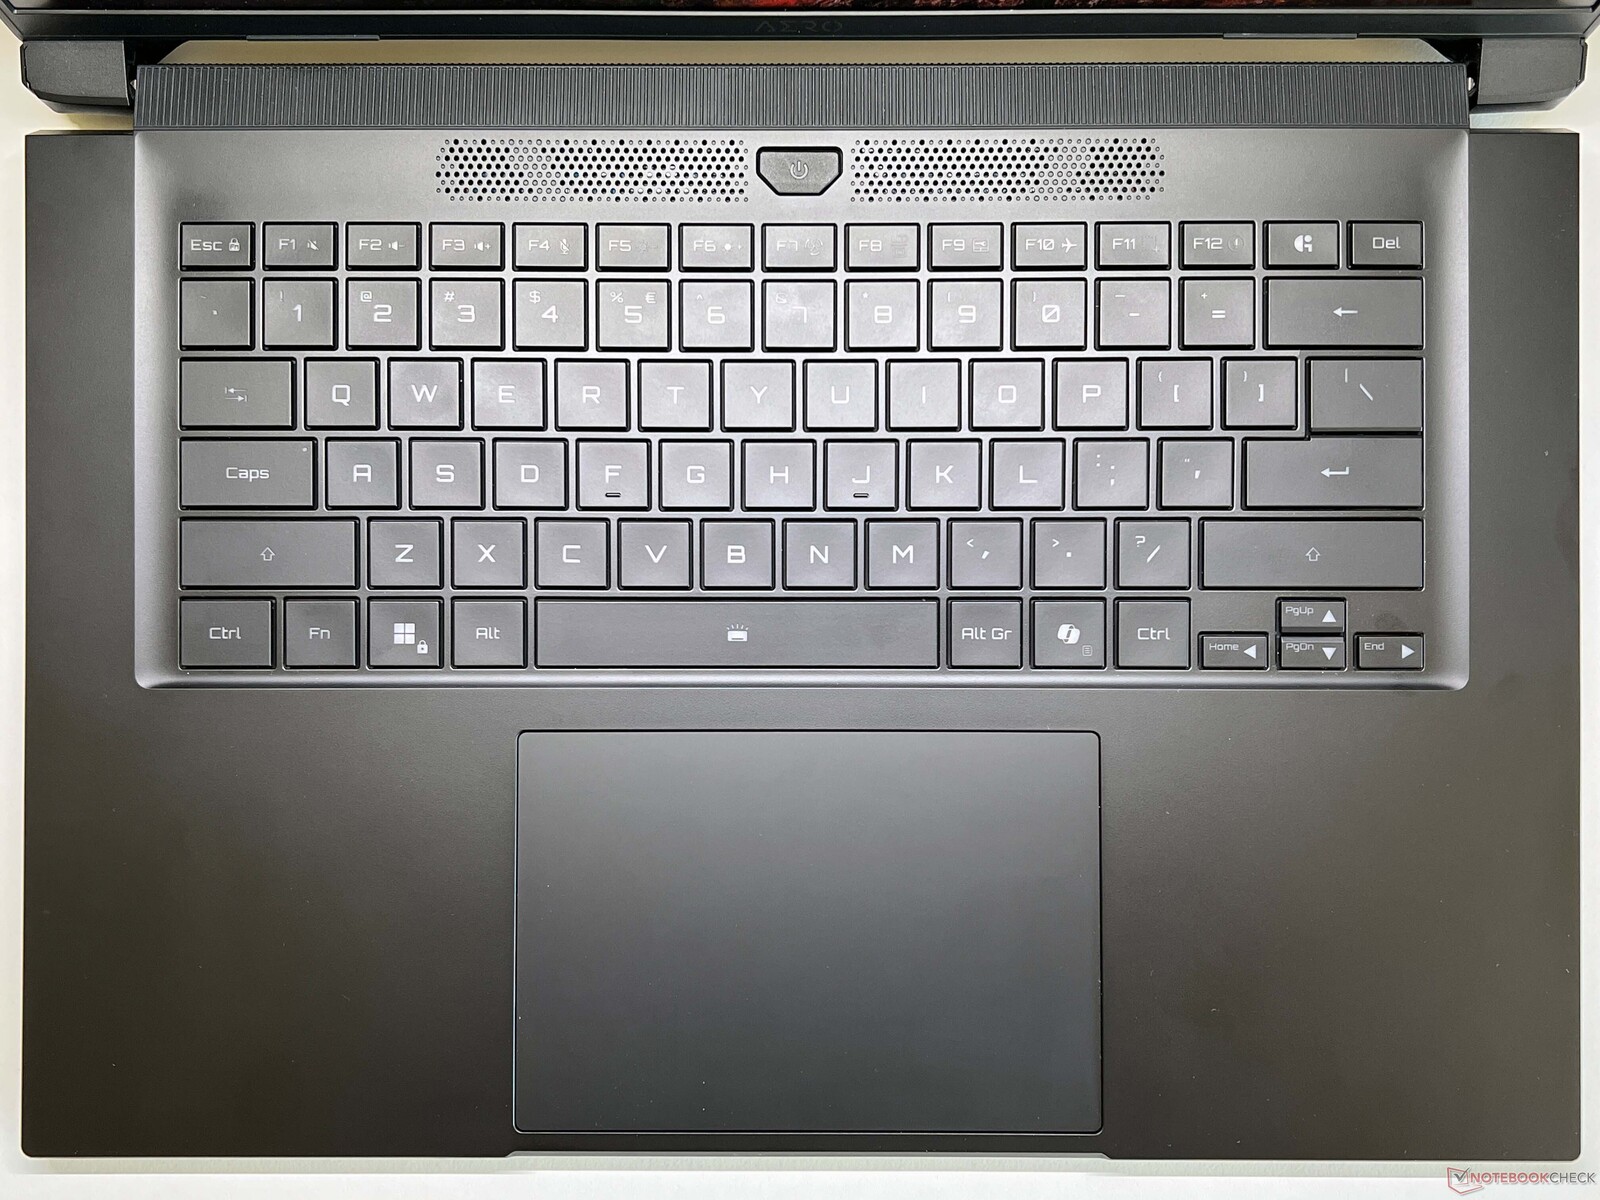
输入设备舒适的键盘
Aero X16 没有数字键盘,但它的键盘非常舒适,键程长达 1.7 毫米,按压点精确。在布局方面,只有小方向键非常恼人。键盘采用 1 区 RGB 背光,有三个强度级别。
触摸板足够大(13.3 x 9 厘米),滑动性能非常好,但机械咔哒声有点响。

显示屏哑光 165 Hz IPS,无 PWM
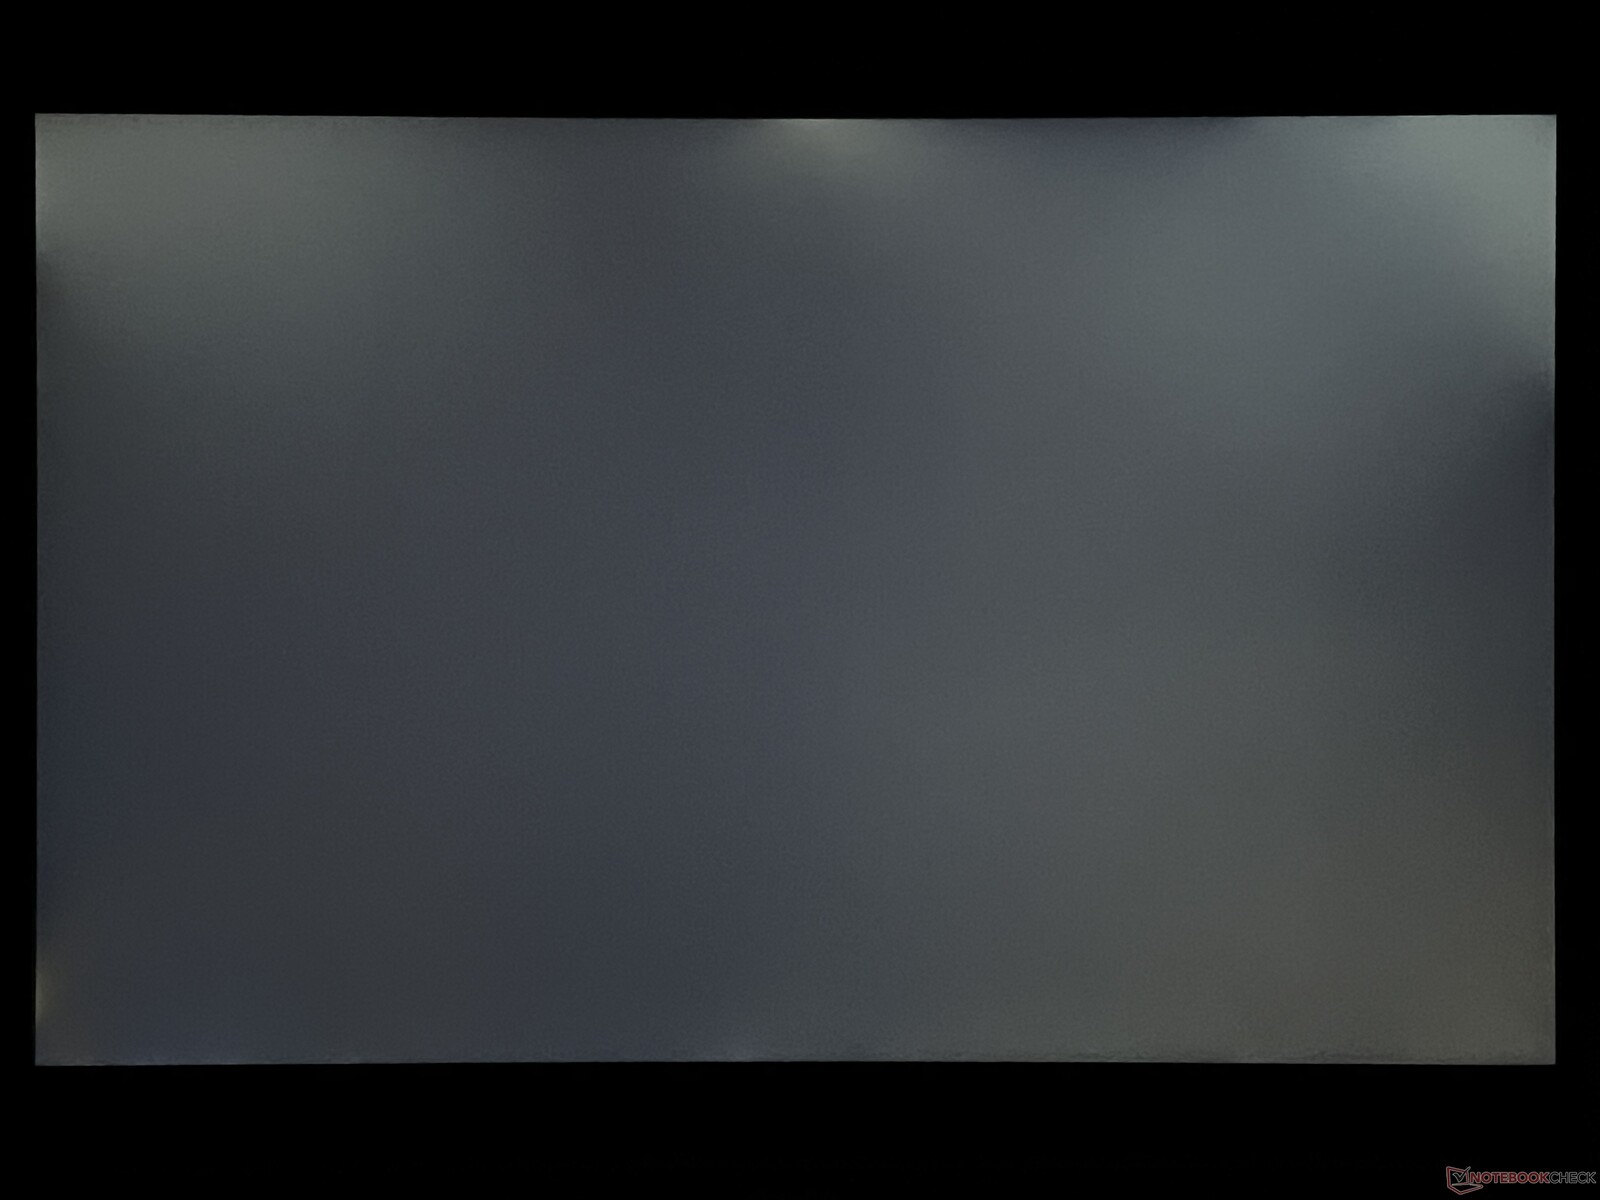
Aero X16 采用哑光 IPS 屏幕,分辨率为 2,560x1,600 和 165 Hz 刷新率。主观感觉画质不错,内容清晰,色彩丰富,即使是明亮的内容,仔细观察也只会出现轻微的颗粒感。
不过,IPS 面板无法赶上 OLED 面板或迷你 LED 面板。尽管如此,面板没有 PWM 闪烁,响应时间也很快。
我们测得的峰值亮度为 403 cd/m²,加上 0.32 cd/m² 略高的黑阶,测得的对比度仅为 1,234:1。
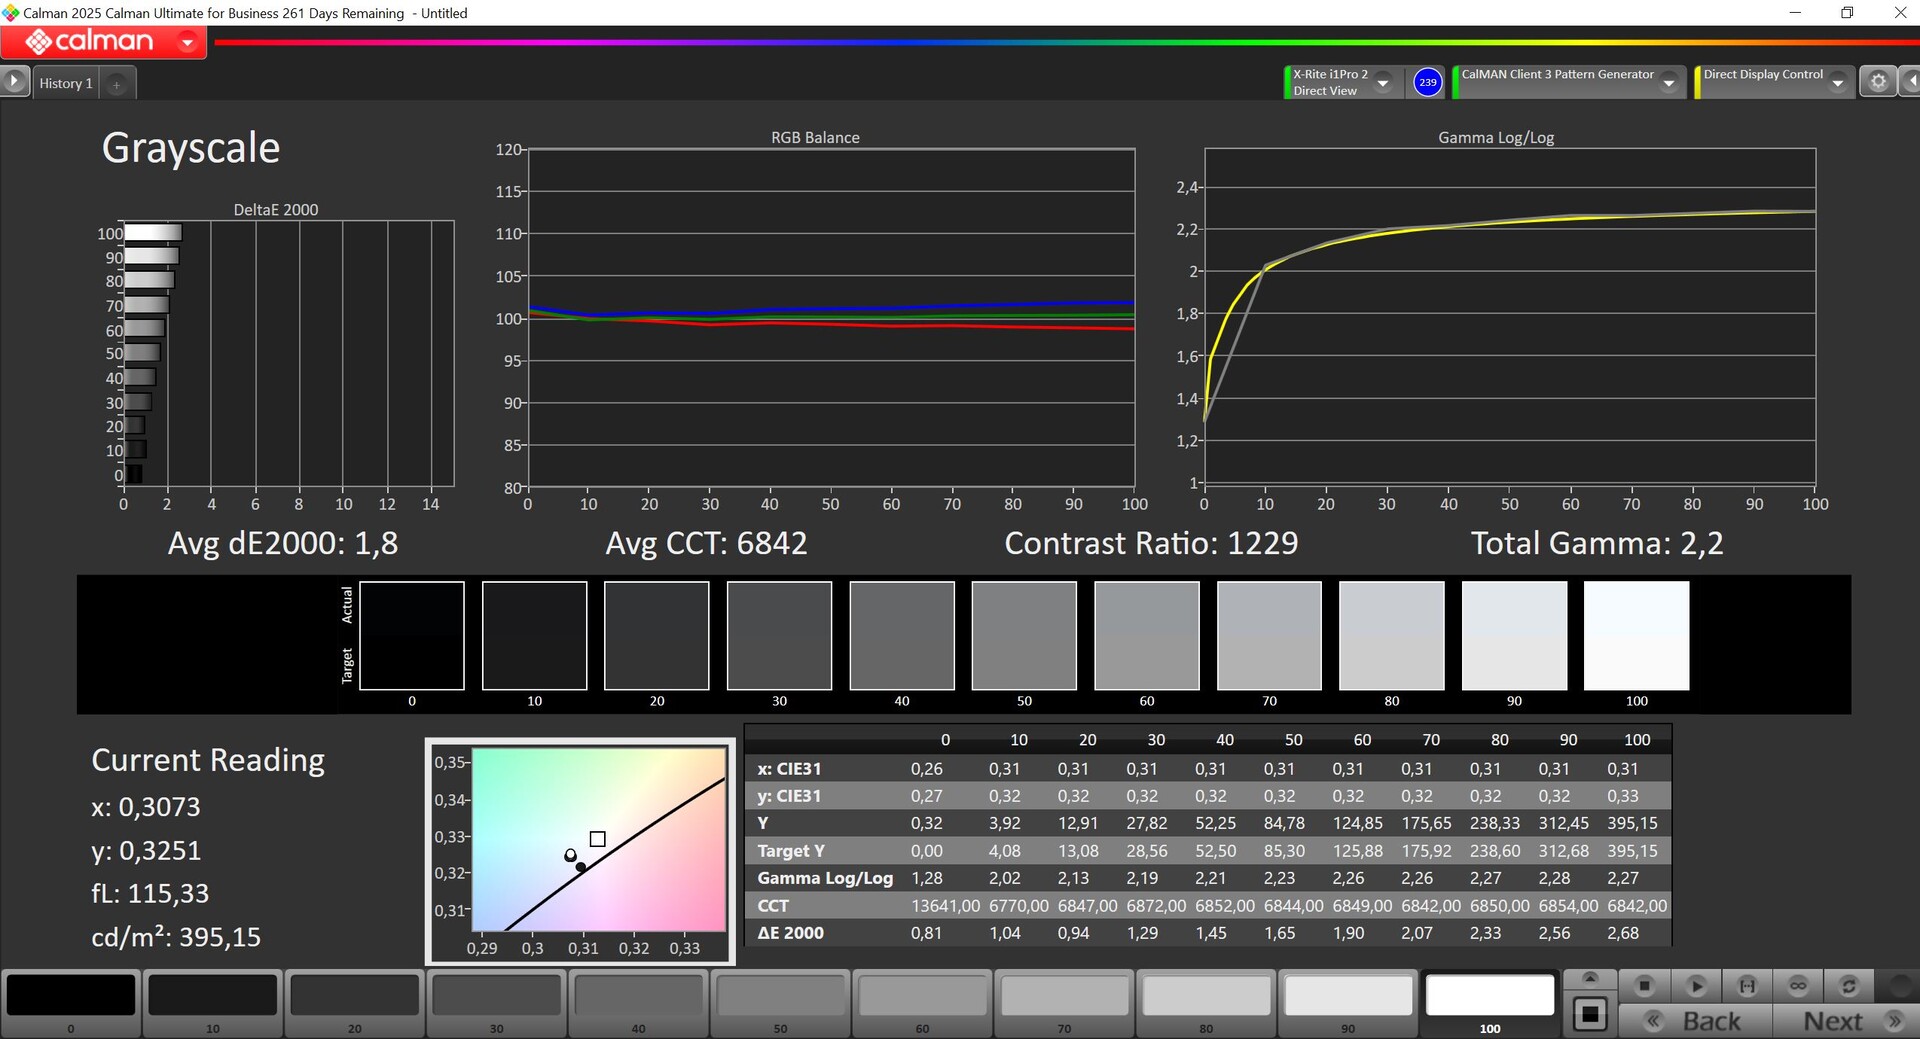
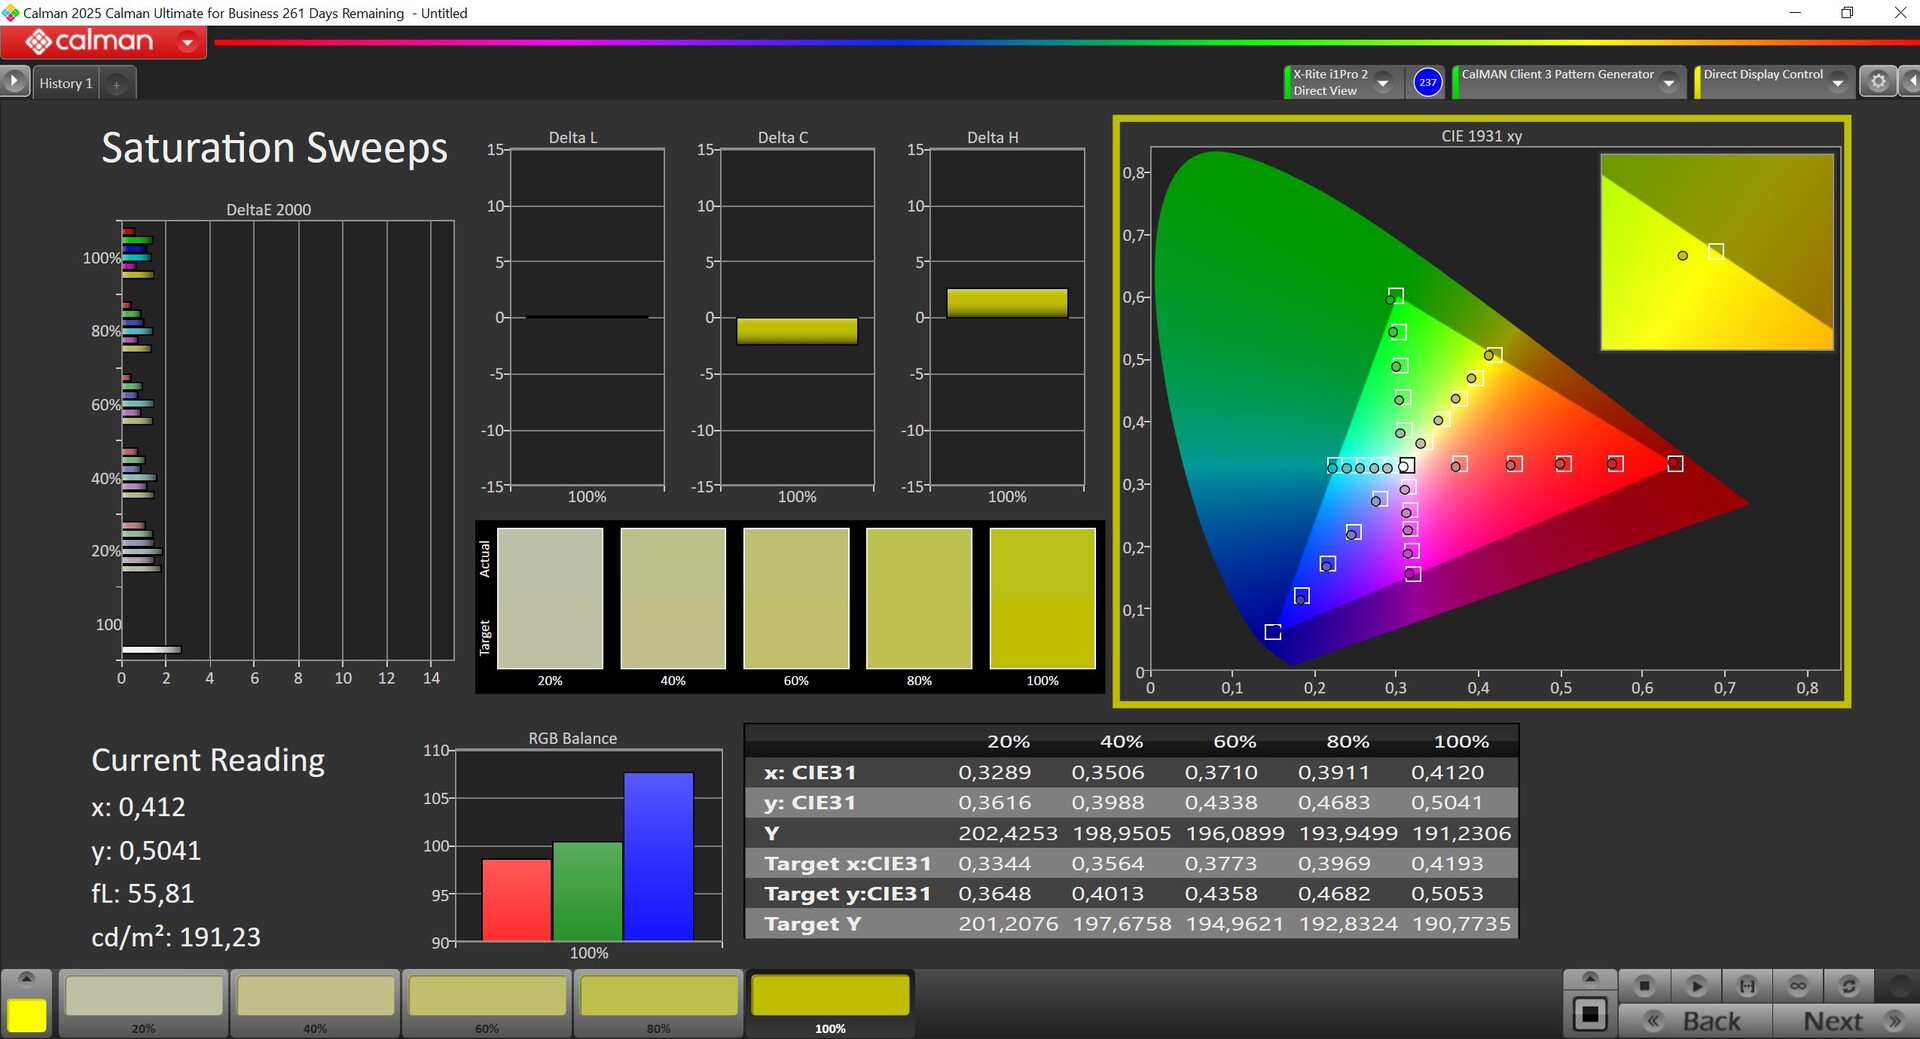
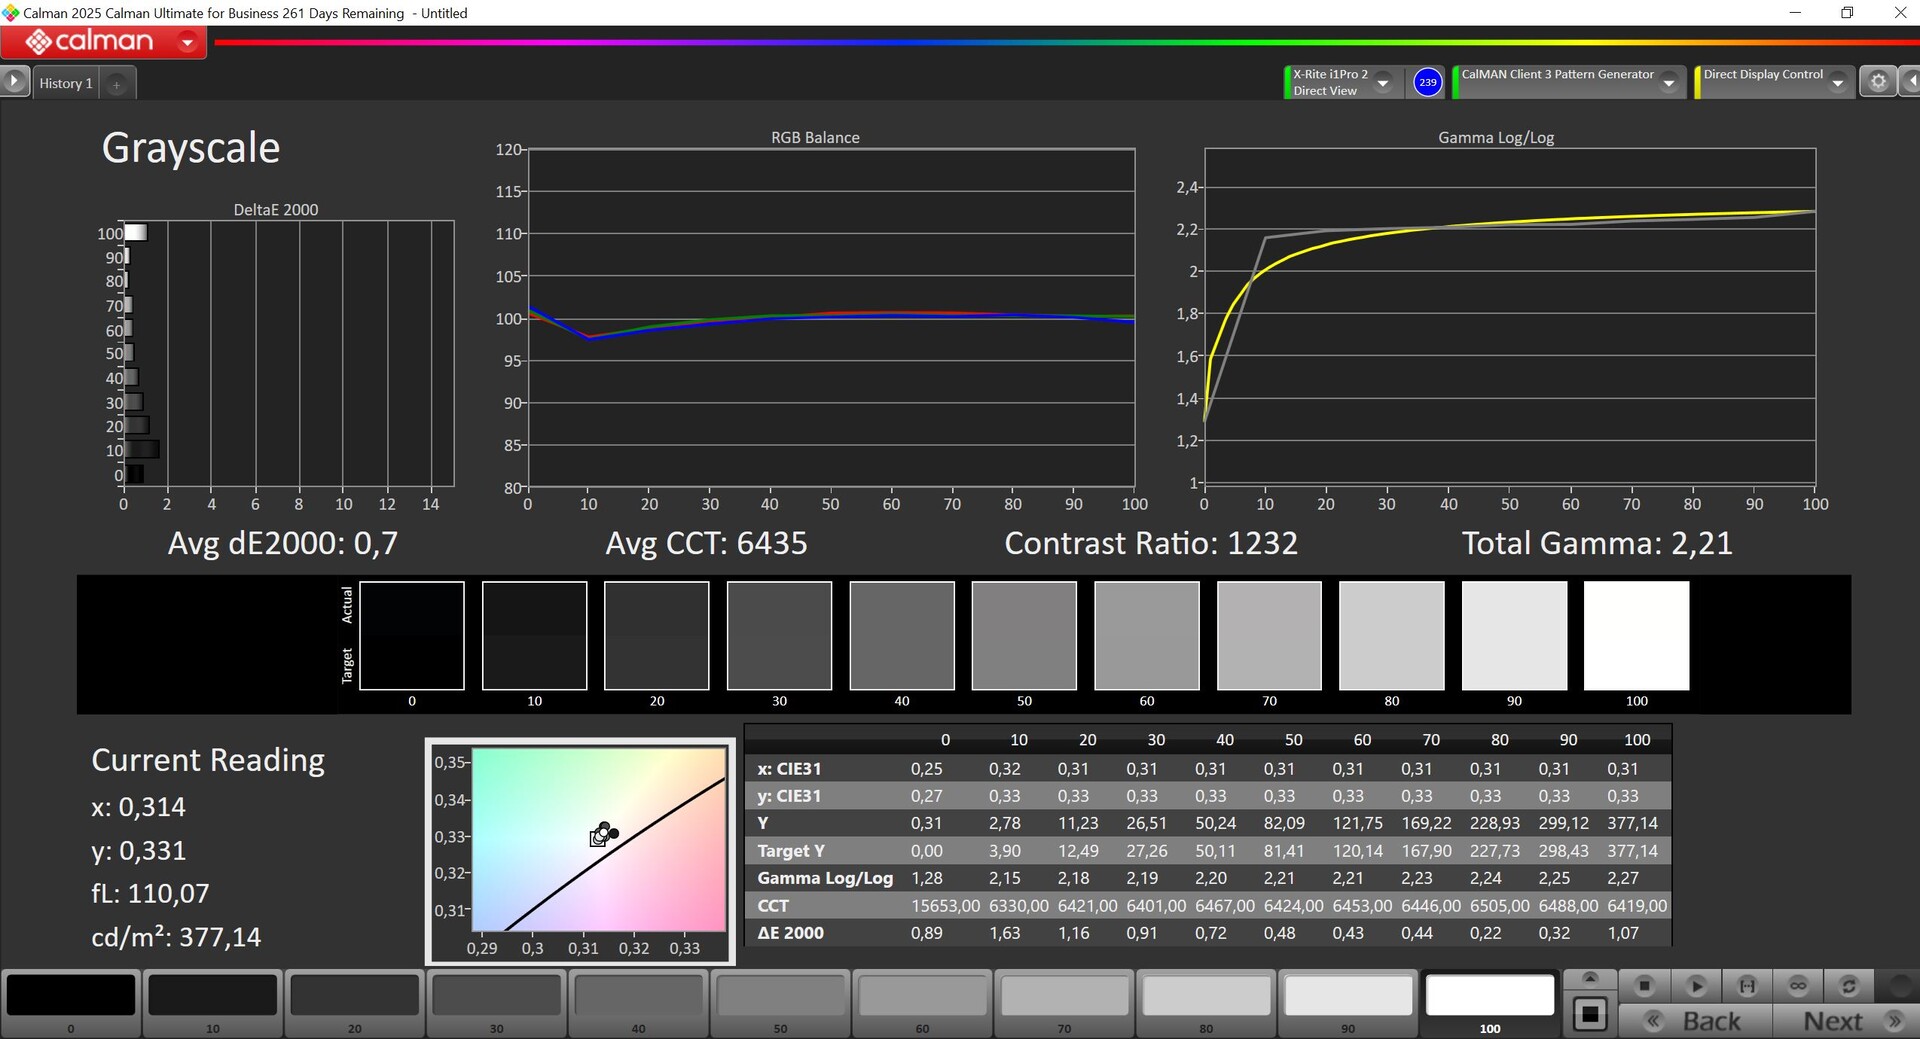
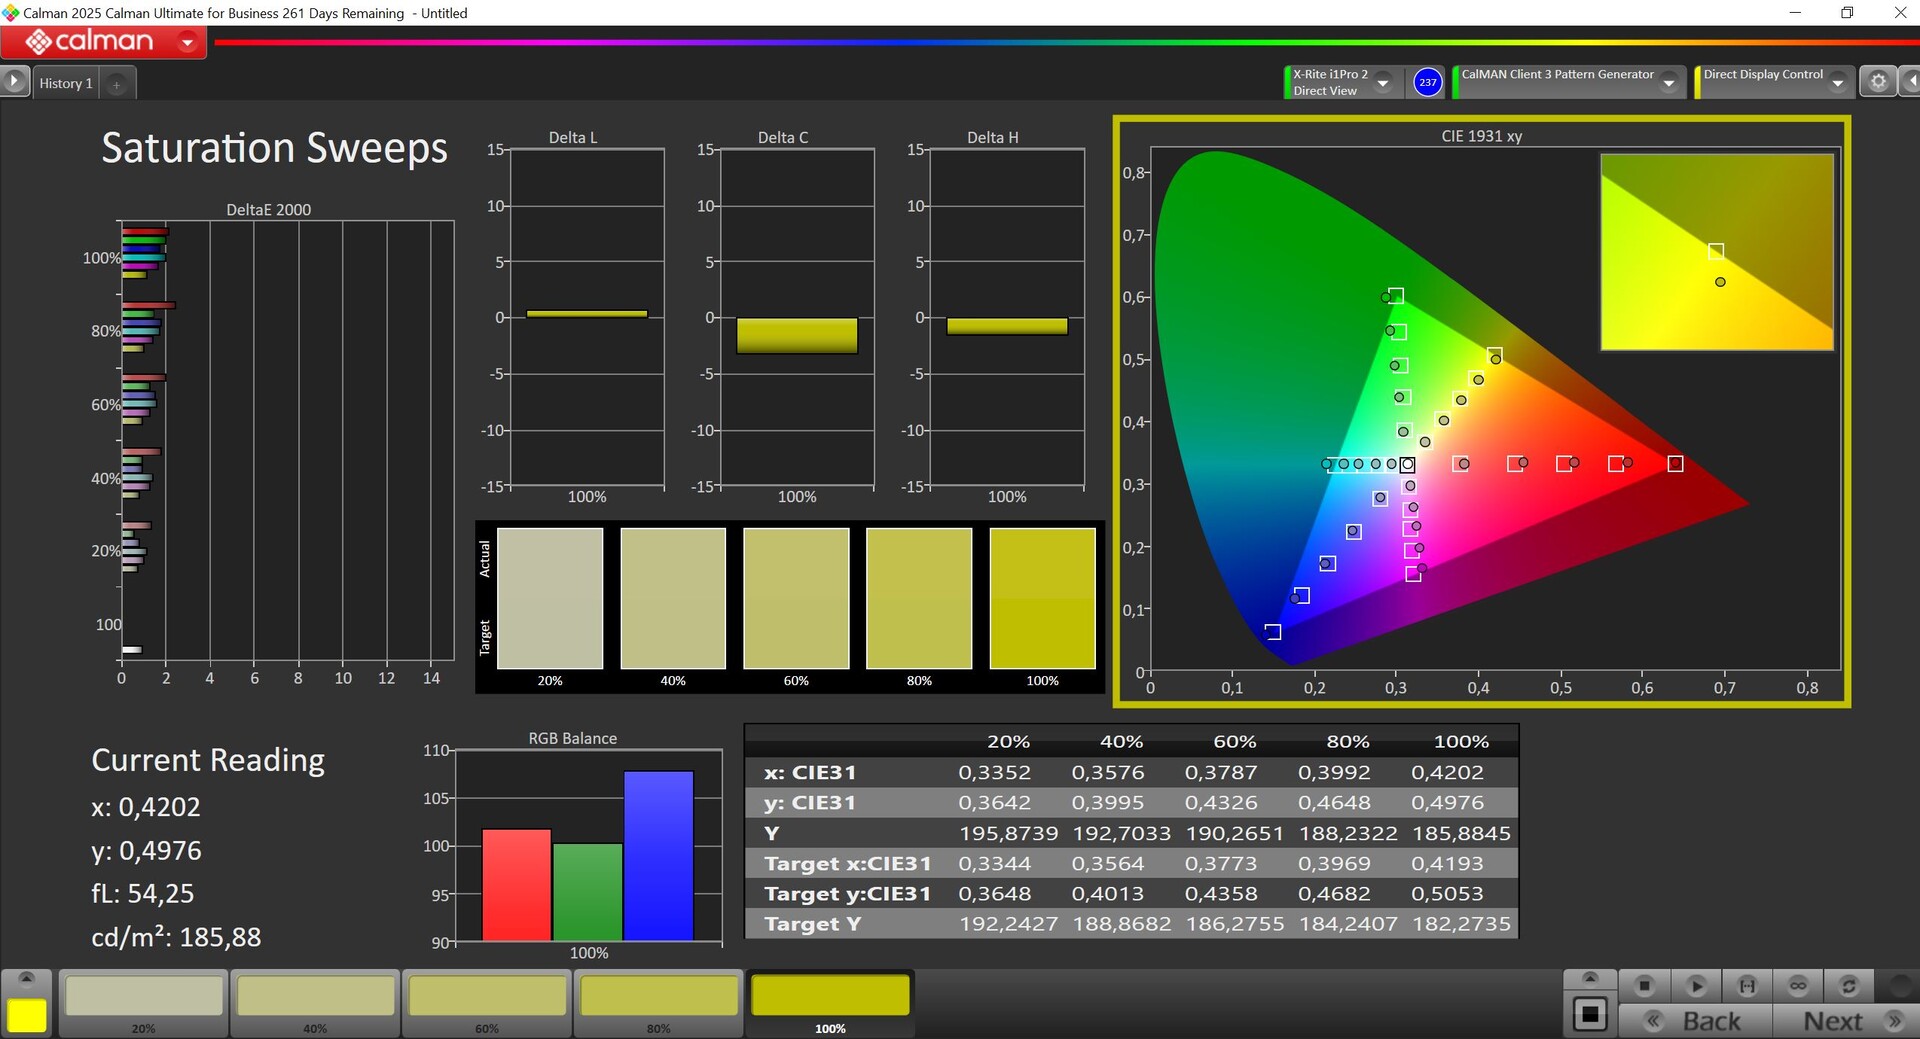
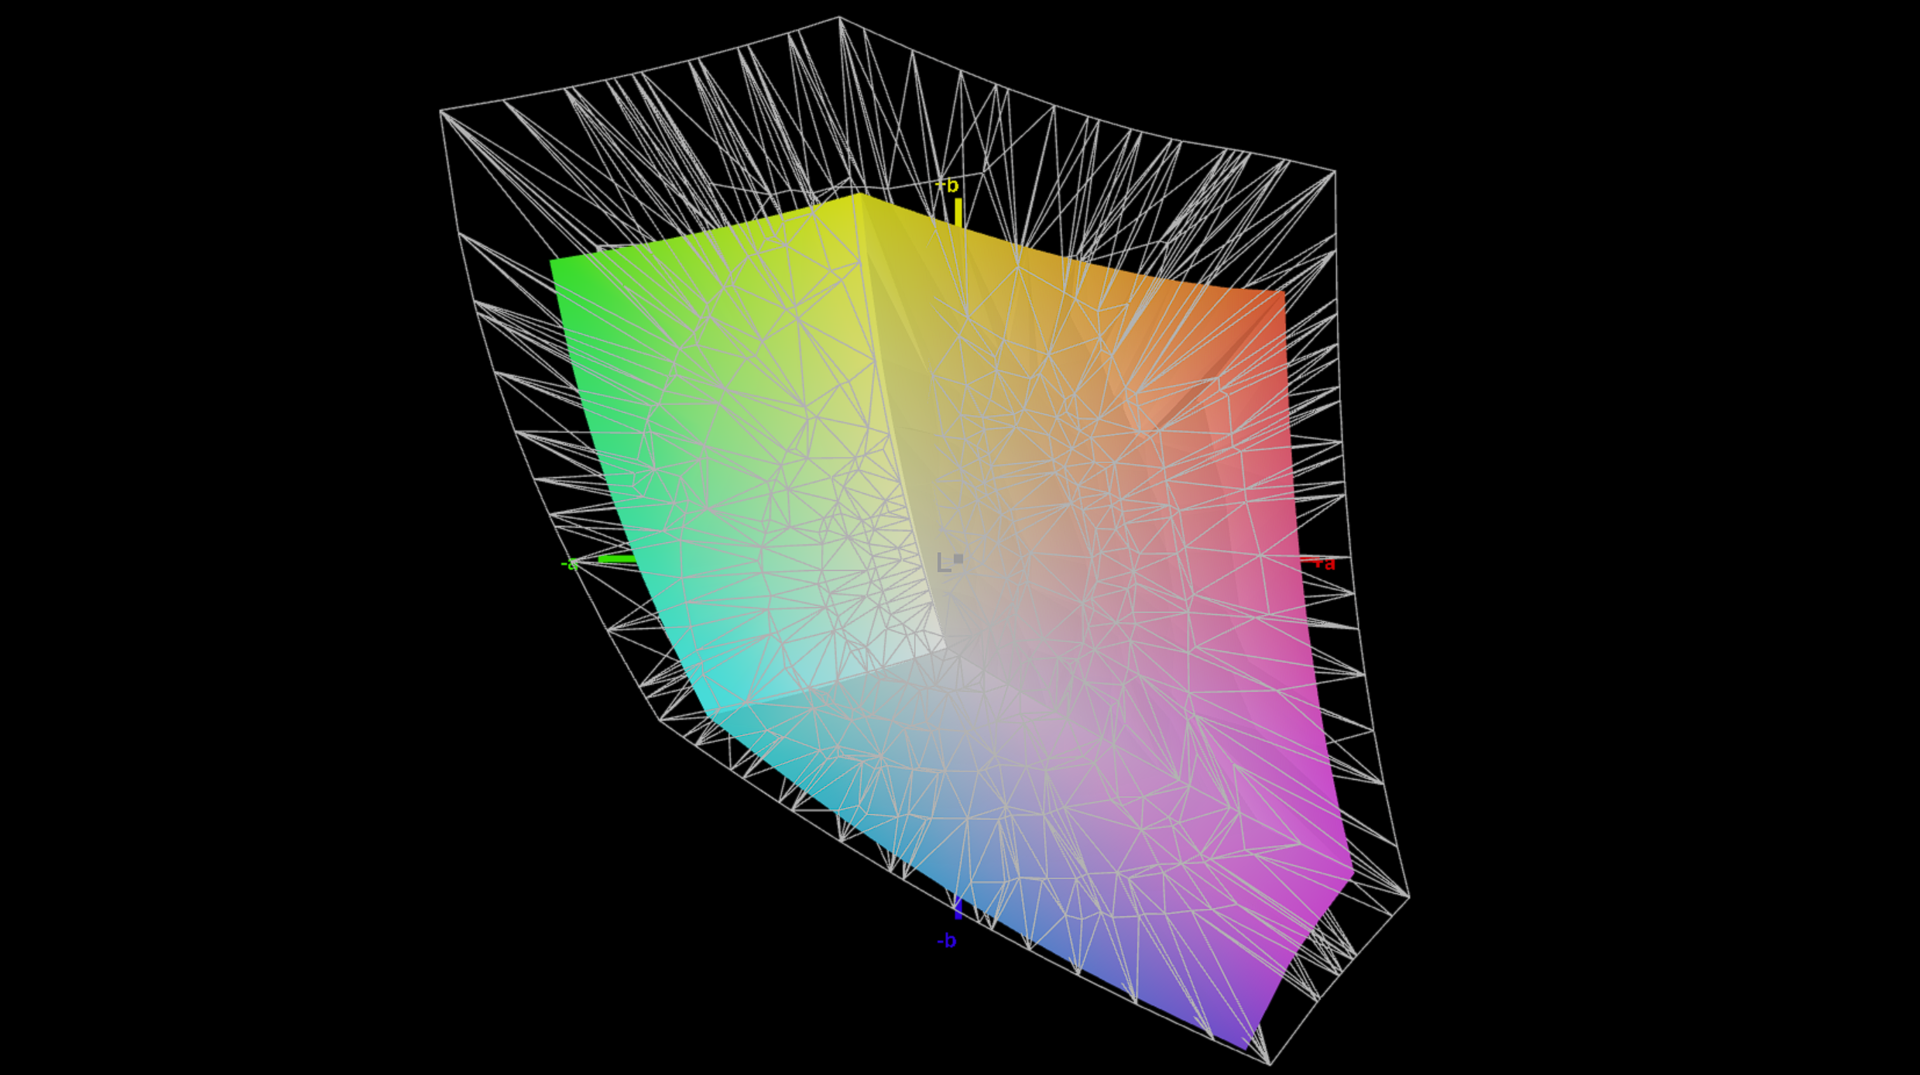
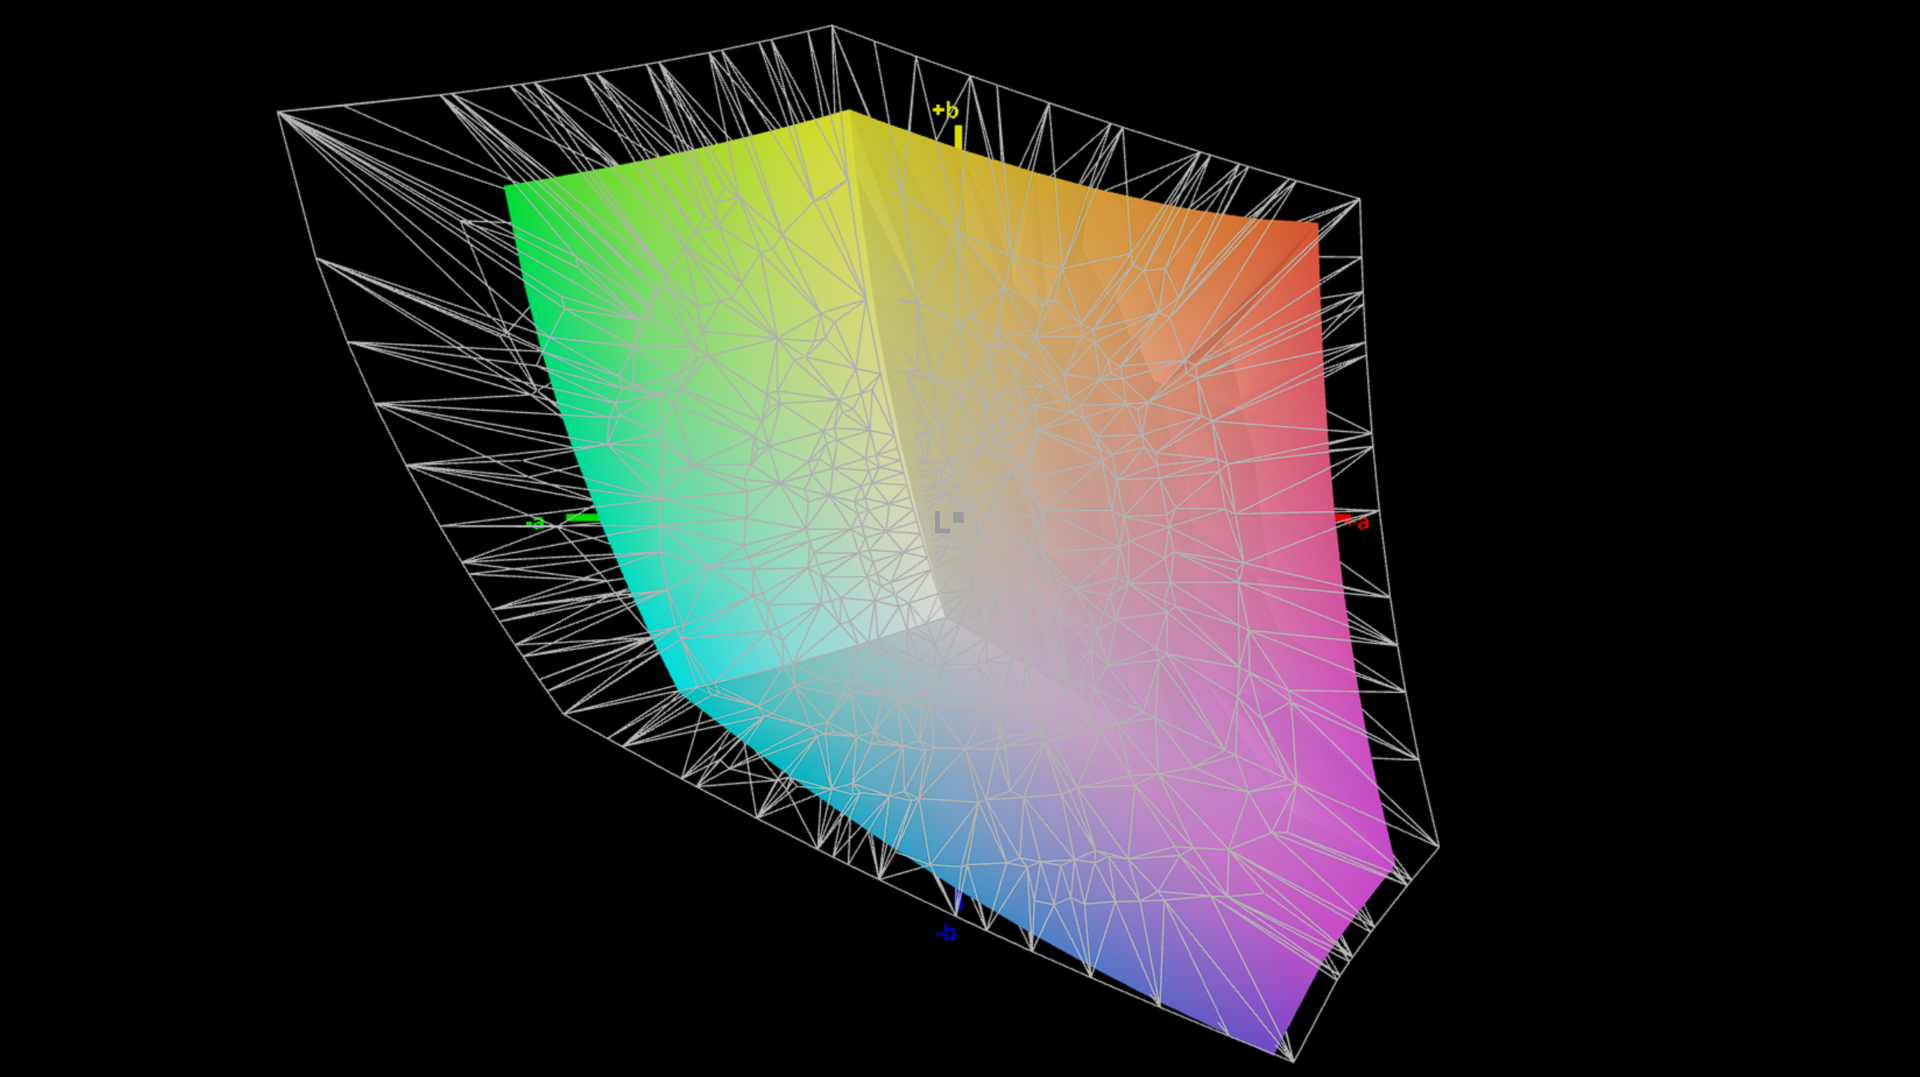
使用 Portrait Displays 提供的专业 Calman Ultimate 软件进行分析,已经显示出非常准确的工作前色彩,但偏蓝光极少,色温稍低。
我们可以通过自己的校准来纠正这一点,但最大亮度会下降约 25 cd/m²。sRGB 色彩空间已完全覆盖,因此 Aero X16 也适用于编辑图像和视频。
| |||||||||||||||||||||||||
Brightness Distribution: 97 %
Center on Battery: 395 cd/m²
Contrast: 1234:1 (Black: 0.32 cd/m²)
ΔE ColorChecker Calman: 1.3 | ∀{0.5-29.43 Ø4.72}
calibrated: 1.4
ΔE Greyscale Calman: 1.8 | ∀{0.09-98 Ø4.97}
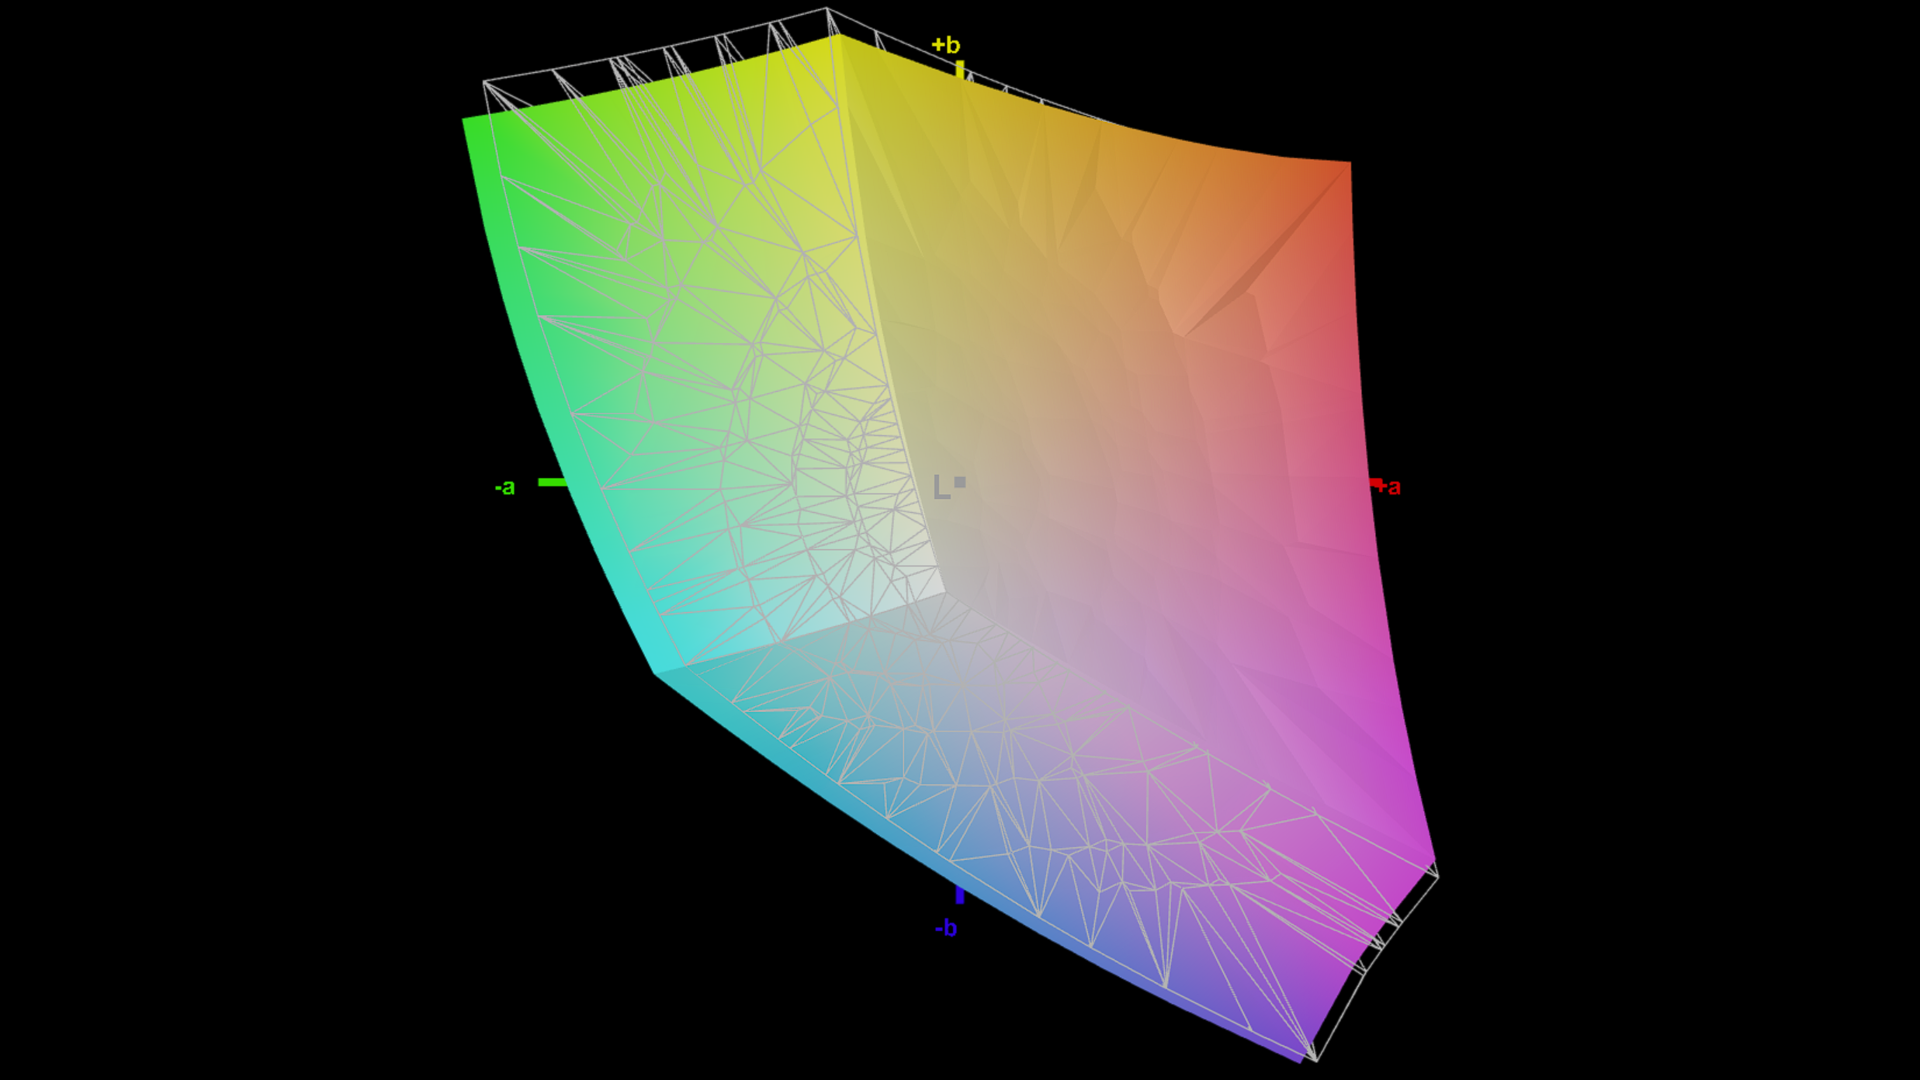
71.2% AdobeRGB 1998 (Argyll 3D)
96.1% sRGB (Argyll 3D)
68.7% Display P3 (Argyll 3D)
Gamma: 2.2
CCT: 6842 K
| Gigabyte Aero X16 1WH MNG007DA5-1, IPS, 2560x1600, 16", 165 Hz | Asus TUF Gaming A16 FA608WV B160UAN08.1 (AUO9BB0), IPS, 1920x1200, 16", 144 Hz | Lenovo Yoga Pro 9 16IMH9 LEN160-3.2K, Mini-LED, 3200x2000, 16", 165 Hz | Dell XPS 16 9640 SDC4196, OLED, 3840x2400, 16.3", 90 Hz | Asus ROG Zephyrus G16 2024 GU605M ATNA60DL01-0, OLED, 2560x1600, 16", 240 Hz | Schenker XMG CORE 16 (L23) BOE0AF0 (), IPS, 2560x1600, 16", 240 Hz | |
|---|---|---|---|---|---|---|
| Display | -41% | 22% | 23% | 28% | 0% | |
| Display P3 Coverage (%) | 68.7 | 39.8 -42% | 97 41% | 98.3 43% | 99.9 45% | 68.3 -1% |
| sRGB Coverage (%) | 96.1 | 59.7 -38% | 99.9 4% | 100 4% | 100 4% | 98.6 3% |
| AdobeRGB 1998 Coverage (%) | 71.2 | 41.1 -42% | 86.6 22% | 87.8 23% | 96.9 36% | 69.6 -2% |
| Response Times | -32% | -145% | 89% | 97% | -14% | |
| Response Time Grey 50% / Grey 80% * (ms) | 12 ? | 13.6 ? -13% | 22.2 ? -85% | 0.82 ? 93% | 0.22 ? 98% | 13.2 ? -10% |
| Response Time Black / White * (ms) | 5.6 ? | 8.4 ? -50% | 17 ? -204% | 0.85 ? 85% | 0.25 ? 96% | 6.6 ? -18% |
| PWM Frequency (Hz) | 4840 ? | 360 ? | 960 ? | |||
| Screen | -147% | 22% | -5% | -7% | -39% | |
| Brightness middle (cd/m²) | 395 | 347 -12% | 651 65% | 366 -7% | 416 5% | 376 -5% |
| Brightness (cd/m²) | 398 | 321 -19% | 673 69% | 367 -8% | 418 5% | 358 -10% |
| Brightness Distribution (%) | 97 | 88 -9% | 93 -4% | 96 -1% | 96 -1% | 88 -9% |
| Black Level * (cd/m²) | 0.32 | 0.3 6% | 0.22 31% | 0.33 -3% | ||
| Contrast (:1) | 1234 | 1157 -6% | 2959 140% | 1139 -8% | ||
| Colorchecker dE 2000 * | 1.3 | 5.89 -353% | 1.9 -46% | 1.3 -0% | 1.6 -23% | 2.74 -111% |
| Colorchecker dE 2000 max. * | 2.8 | 19.26 -588% | 4.2 -50% | 3.6 -29% | 2.1 25% | 6.78 -142% |
| Colorchecker dE 2000 calibrated * | 1.4 | 4.3 -207% | 0.6 57% | 1 29% | 0.88 37% | |
| Greyscale dE 2000 * | 1.8 | 4.27 -137% | 3 -67% | 2.2 -22% | 2.7 -50% | 3.57 -98% |
| Gamma | 2.2 100% | 2.47 89% | 2.18 101% | 2.14 103% | 2.16 102% | 2.4 92% |
| CCT | 6842 95% | 7158 91% | 6738 96% | 6680 97% | 6331 103% | 7246 90% |
| Total Average (Program / Settings) | -73% /
-108% | -34% /
-2% | 36% /
18% | 39% /
22% | -18% /
-27% |
* ... smaller is better


Display Response Times
| ↔ Response Time Black to White | ||
|---|---|---|
| 5.6 ms ... rise ↗ and fall ↘ combined | ↗ 2.1 ms rise | 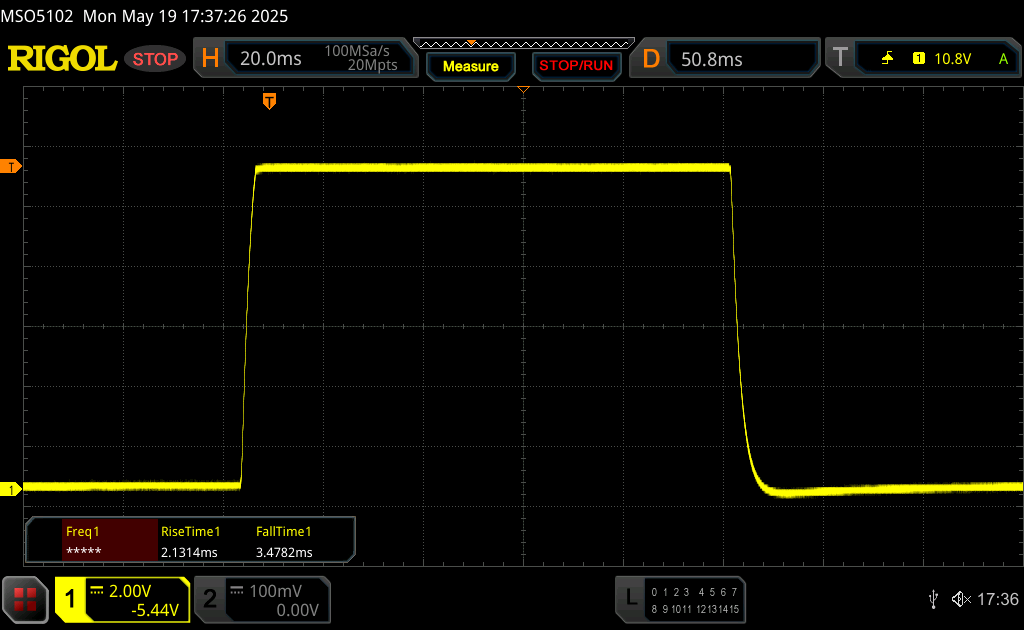 |
| ↘ 3.5 ms fall | ||
| The screen shows very fast response rates in our tests and should be very well suited for fast-paced gaming. In comparison, all tested devices range from 0.1 (minimum) to 240 (maximum) ms. » 18 % of all devices are better. This means that the measured response time is better than the average of all tested devices (19.8 ms). | ||
| ↔ Response Time 50% Grey to 80% Grey | ||
| 12 ms ... rise ↗ and fall ↘ combined | ↗ 5.7 ms rise | 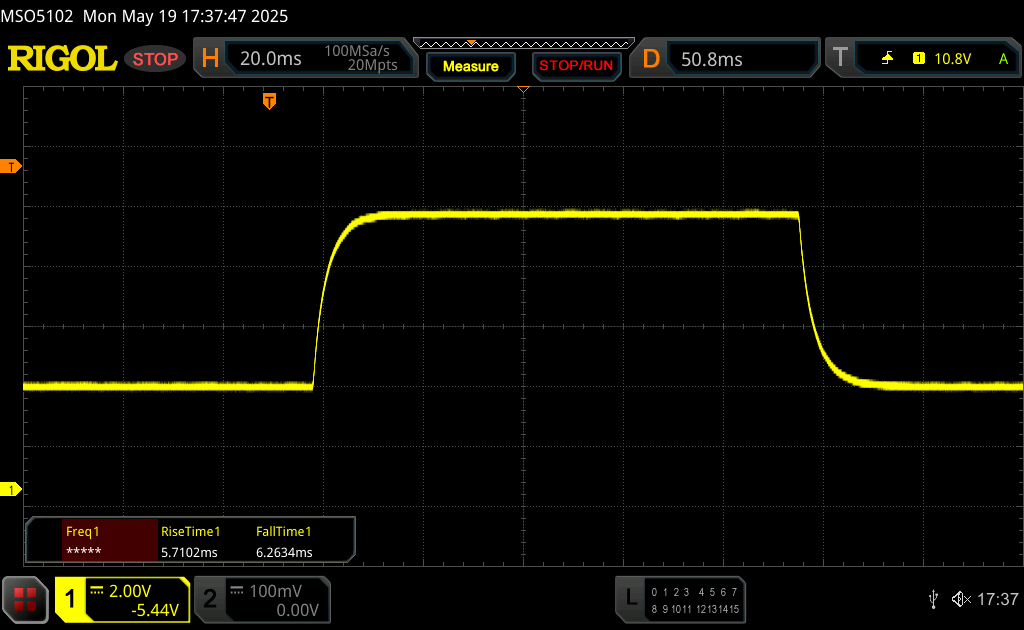 |
| ↘ 6.3 ms fall | ||
| The screen shows good response rates in our tests, but may be too slow for competitive gamers. In comparison, all tested devices range from 0.165 (minimum) to 636 (maximum) ms. » 25 % of all devices are better. This means that the measured response time is better than the average of all tested devices (31 ms). | ||
Screen Flickering / PWM (Pulse-Width Modulation)
| Screen flickering / PWM not detected |  | ||
In comparison: 52 % of all tested devices do not use PWM to dim the display. If PWM was detected, an average of 7769 (minimum: 5 - maximum: 343500) Hz was measured. | |||


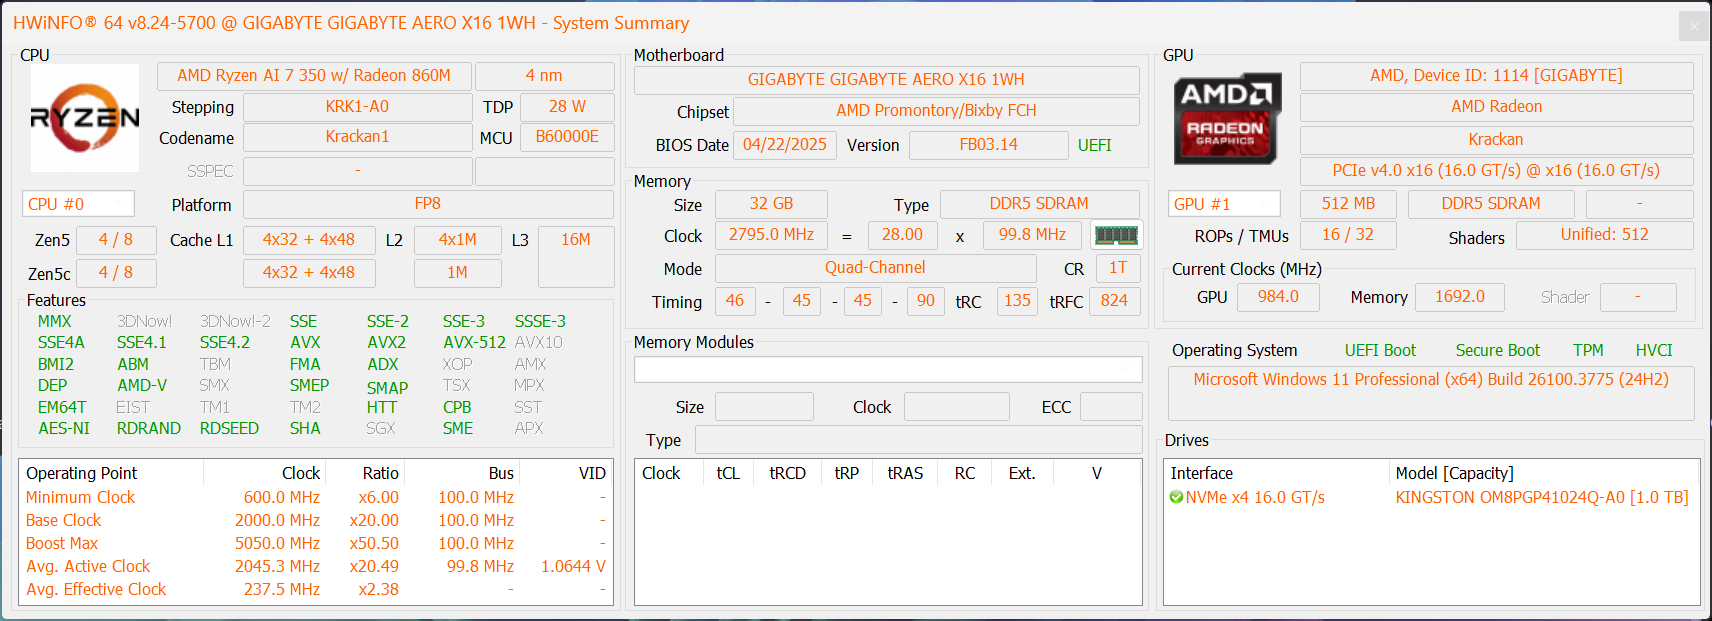
性能AMD Zen 5,可扩展内存
测试条件
技嘉通过自己的 GiMATE 软件提供了各种能耗配置文件和广泛的设置选项。我们在性能(游戏)模式下进行了所有基准测试和测量。
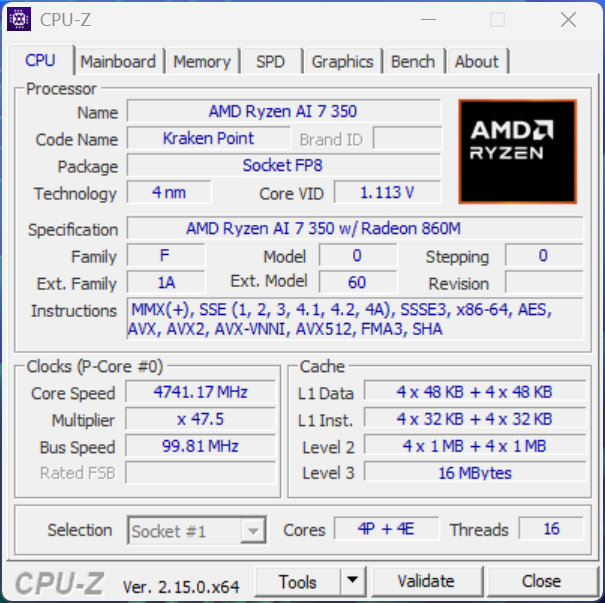
处理器
AMD Ryzen AI 7 350 AMD Ryzen AI 7 350(Krackan Point)配备 8 个 Zen 5 内核(4x Zen 5 + 4x Zen 5c),主要用于廉价笔记本电脑,性能不俗。可选的 Ryzen AI 9 HX 370可选的 Ryzen AI 9 HX 370 肯定会从更高的 70 W 功率限制中获益更多。
在负载情况下,持续多核性能保持完全稳定。在电池模式(最大 45 瓦)下,多核性能仅下降 6%。
Cinebench R15 Multi-core loop
Cinebench 2024: CPU Multi Core | CPU Single Core
Cinebench R23: Multi Core | Single Core
Cinebench R20: CPU (Multi Core) | CPU (Single Core)
Cinebench R15: CPU Multi 64Bit | CPU Single 64Bit
Blender: v2.79 BMW27 CPU
7-Zip 18.03: 7z b 4 | 7z b 4 -mmt1
Geekbench 6.7: Multi-Core | Single-Core
Geekbench 5.5: Multi-Core | Single-Core
HWBOT x265 Benchmark v2.2: 4k Preset
LibreOffice : 20 Documents To PDF
R Benchmark 2.5: Overall mean
| CPU Performance rating | |
| Average of class Gaming | |
| Asus TUF Gaming A16 FA608WV -2! | |
| Lenovo Yoga Pro 9 16IMH9 -2! | |
| Gigabyte Aero X16 1WH | |
| Dell XPS 16 9640 | |
| Schenker XMG CORE 16 (L23) -2! | |
| Average AMD Ryzen AI 7 350 | |
| Asus ROG Zephyrus G16 2024 GU605M | |
| Cinebench 2024 / CPU Multi Core | |
| Average of class Gaming (486 - 2298, n=91, last 2 years) | |
| Dell XPS 16 9640 | |
| Gigabyte Aero X16 1WH | |
| Average AMD Ryzen AI 7 350 (720 - 1011, n=15) | |
| Asus ROG Zephyrus G16 2024 GU605M | |
| Cinebench 2024 / CPU Single Core | |
| Average of class Gaming (95 - 138.2, n=91, last 2 years) | |
| Gigabyte Aero X16 1WH | |
| Average AMD Ryzen AI 7 350 (113.5 - 119, n=15) | |
| Dell XPS 16 9640 | |
| Asus ROG Zephyrus G16 2024 GU605M | |
| Cinebench R23 / Multi Core | |
| Average of class Gaming (10488 - 40970, n=111, last 2 years) | |
| Asus TUF Gaming A16 FA608WV | |
| Lenovo Yoga Pro 9 16IMH9 | |
| Dell XPS 16 9640 | |
| Gigabyte Aero X16 1WH | |
| Asus ROG Zephyrus G16 2024 GU605M | |
| Schenker XMG CORE 16 (L23) | |
| Average AMD Ryzen AI 7 350 (12647 - 18243, n=18) | |
| Cinebench R23 / Single Core | |
| Asus TUF Gaming A16 FA608WV | |
| Average of class Gaming (1166 - 2356, n=111, last 2 years) | |
| Gigabyte Aero X16 1WH | |
| Average AMD Ryzen AI 7 350 (1916 - 2006, n=18) | |
| Lenovo Yoga Pro 9 16IMH9 | |
| Dell XPS 16 9640 | |
| Schenker XMG CORE 16 (L23) | |
| Asus ROG Zephyrus G16 2024 GU605M | |
| Cinebench R20 / CPU (Multi Core) | |
| Average of class Gaming (4029 - 16108, n=110, last 2 years) | |
| Asus TUF Gaming A16 FA608WV | |
| Lenovo Yoga Pro 9 16IMH9 | |
| Dell XPS 16 9640 | |
| Gigabyte Aero X16 1WH | |
| Asus ROG Zephyrus G16 2024 GU605M | |
| Schenker XMG CORE 16 (L23) | |
| Average AMD Ryzen AI 7 350 (4897 - 7067, n=16) | |
| Cinebench R20 / CPU (Single Core) | |
| Asus TUF Gaming A16 FA608WV | |
| Average of class Gaming (442 - 895, n=110, last 2 years) | |
| Gigabyte Aero X16 1WH | |
| Average AMD Ryzen AI 7 350 (751 - 784, n=16) | |
| Lenovo Yoga Pro 9 16IMH9 | |
| Asus ROG Zephyrus G16 2024 GU605M | |
| Schenker XMG CORE 16 (L23) | |
| Dell XPS 16 9640 | |
| Cinebench R15 / CPU Multi 64Bit | |
| Average of class Gaming (1578 - 6271, n=109, last 2 years) | |
| Asus TUF Gaming A16 FA608WV | |
| Lenovo Yoga Pro 9 16IMH9 | |
| Dell XPS 16 9640 | |
| Schenker XMG CORE 16 (L23) | |
| Asus ROG Zephyrus G16 2024 GU605M | |
| Average AMD Ryzen AI 7 350 (1932 - 2734, n=17) | |
| Gigabyte Aero X16 1WH | |
| Cinebench R15 / CPU Single 64Bit | |
| Asus TUF Gaming A16 FA608WV | |
| Average of class Gaming (188.8 - 343, n=110, last 2 years) | |
| Lenovo Yoga Pro 9 16IMH9 | |
| Average AMD Ryzen AI 7 350 (203 - 305, n=17) | |
| Schenker XMG CORE 16 (L23) | |
| Asus ROG Zephyrus G16 2024 GU605M | |
| Dell XPS 16 9640 | |
| Gigabyte Aero X16 1WH | |
| Blender / v2.79 BMW27 CPU | |
| Average AMD Ryzen AI 7 350 (181 - 386, n=17) | |
| Asus ROG Zephyrus G16 2024 GU605M | |
| Schenker XMG CORE 16 (L23) | |
| Gigabyte Aero X16 1WH | |
| Dell XPS 16 9640 | |
| Lenovo Yoga Pro 9 16IMH9 | |
| Average of class Gaming (80 - 330, n=108, last 2 years) | |
| Asus TUF Gaming A16 FA608WV | |
| 7-Zip 18.03 / 7z b 4 | |
| Average of class Gaming (33491 - 148086, n=109, last 2 years) | |
| Asus TUF Gaming A16 FA608WV | |
| Lenovo Yoga Pro 9 16IMH9 | |
| Schenker XMG CORE 16 (L23) | |
| Dell XPS 16 9640 | |
| Asus ROG Zephyrus G16 2024 GU605M | |
| Gigabyte Aero X16 1WH | |
| Average AMD Ryzen AI 7 350 (48124 - 64653, n=16) | |
| 7-Zip 18.03 / 7z b 4 -mmt1 | |
| Schenker XMG CORE 16 (L23) | |
| Average of class Gaming (4199 - 7436, n=109, last 2 years) | |
| Asus TUF Gaming A16 FA608WV | |
| Gigabyte Aero X16 1WH | |
| Average AMD Ryzen AI 7 350 (4609 - 6371, n=16) | |
| Lenovo Yoga Pro 9 16IMH9 | |
| Dell XPS 16 9640 | |
| Asus ROG Zephyrus G16 2024 GU605M | |
| Geekbench 6.7 / Multi-Core | |
| Average of class Gaming (6625 - 22104, n=110, last 2 years) | |
| Lenovo Yoga Pro 9 16IMH9 | |
| Gigabyte Aero X16 1WH | |
| Asus TUF Gaming A16 FA608WV | |
| Dell XPS 16 9640 | |
| Asus ROG Zephyrus G16 2024 GU605M | |
| Schenker XMG CORE 16 (L23) | |
| Average AMD Ryzen AI 7 350 (10774 - 14194, n=17) | |
| Geekbench 6.7 / Single-Core | |
| Asus TUF Gaming A16 FA608WV | |
| Gigabyte Aero X16 1WH | |
| Average of class Gaming (1490 - 3259, n=110, last 2 years) | |
| Average AMD Ryzen AI 7 350 (1874 - 2942, n=17) | |
| Schenker XMG CORE 16 (L23) | |
| Lenovo Yoga Pro 9 16IMH9 | |
| Dell XPS 16 9640 | |
| Asus ROG Zephyrus G16 2024 GU605M | |
| Geekbench 5.5 / Multi-Core | |
| Average of class Gaming (6460 - 27010, n=109, last 2 years) | |
| Asus TUF Gaming A16 FA608WV | |
| Lenovo Yoga Pro 9 16IMH9 | |
| Dell XPS 16 9640 | |
| Asus ROG Zephyrus G16 2024 GU605M | |
| Gigabyte Aero X16 1WH | |
| Schenker XMG CORE 16 (L23) | |
| Average AMD Ryzen AI 7 350 (6705 - 12968, n=18) | |
| Geekbench 5.5 / Single-Core | |
| Asus TUF Gaming A16 FA608WV | |
| Gigabyte Aero X16 1WH | |
| Average of class Gaming (986 - 2474, n=109, last 2 years) | |
| Schenker XMG CORE 16 (L23) | |
| Lenovo Yoga Pro 9 16IMH9 | |
| Average AMD Ryzen AI 7 350 (805 - 2155, n=18) | |
| Dell XPS 16 9640 | |
| Asus ROG Zephyrus G16 2024 GU605M | |
| HWBOT x265 Benchmark v2.2 / 4k Preset | |
| Average of class Gaming (11.5 - 44.3, n=109, last 2 years) | |
| Asus TUF Gaming A16 FA608WV | |
| Lenovo Yoga Pro 9 16IMH9 | |
| Gigabyte Aero X16 1WH | |
| Schenker XMG CORE 16 (L23) | |
| Dell XPS 16 9640 | |
| Asus ROG Zephyrus G16 2024 GU605M | |
| Average AMD Ryzen AI 7 350 (14 - 22.9, n=16) | |
| LibreOffice / 20 Documents To PDF | |
| Schenker XMG CORE 16 (L23) | |
| Average AMD Ryzen AI 7 350 (43.3 - 88.8, n=16) | |
| Gigabyte Aero X16 1WH | |
| Asus ROG Zephyrus G16 2024 GU605M | |
| Average of class Gaming (19 - 88.8, n=109, last 2 years) | |
| Asus TUF Gaming A16 FA608WV | |
| Dell XPS 16 9640 | |
| Lenovo Yoga Pro 9 16IMH9 | |
| R Benchmark 2.5 / Overall mean | |
| Dell XPS 16 9640 | |
| Asus ROG Zephyrus G16 2024 GU605M | |
| Lenovo Yoga Pro 9 16IMH9 | |
| Schenker XMG CORE 16 (L23) | |
| Average AMD Ryzen AI 7 350 (0.403 - 0.565, n=16) | |
| Average of class Gaming (0.3439 - 0.759, n=110, last 2 years) | |
| Asus TUF Gaming A16 FA608WV | |
| Gigabyte Aero X16 1WH | |
* ... smaller is better
AIDA64: FP32 Ray-Trace | FPU Julia | CPU SHA3 | CPU Queen | FPU SinJulia | FPU Mandel | CPU AES | CPU ZLib | FP64 Ray-Trace | CPU PhotoWorxx
| Performance rating | |
| Asus TUF Gaming A16 FA608WV | |
| Average of class Gaming | |
| Schenker XMG CORE 16 (L23) | |
| Gigabyte Aero X16 1WH | |
| Lenovo Yoga Pro 9 16IMH9 | |
| Average AMD Ryzen AI 7 350 | |
| Dell XPS 16 9640 | |
| Asus ROG Zephyrus G16 2024 GU605M | |
| AIDA64 / FP32 Ray-Trace | |
| Asus TUF Gaming A16 FA608WV | |
| Average of class Gaming (10227 - 85542, n=108, last 2 years) | |
| Schenker XMG CORE 16 (L23) | |
| Gigabyte Aero X16 1WH | |
| Average AMD Ryzen AI 7 350 (20203 - 28112, n=16) | |
| Lenovo Yoga Pro 9 16IMH9 | |
| Dell XPS 16 9640 | |
| Asus ROG Zephyrus G16 2024 GU605M | |
| AIDA64 / FPU Julia | |
| Asus TUF Gaming A16 FA608WV | |
| Average of class Gaming (51376 - 238426, n=108, last 2 years) | |
| Schenker XMG CORE 16 (L23) | |
| Gigabyte Aero X16 1WH | |
| Average AMD Ryzen AI 7 350 (75098 - 110301, n=16) | |
| Lenovo Yoga Pro 9 16IMH9 | |
| Dell XPS 16 9640 | |
| Asus ROG Zephyrus G16 2024 GU605M | |
| AIDA64 / CPU SHA3 | |
| Average of class Gaming (2180 - 9817, n=108, last 2 years) | |
| Asus TUF Gaming A16 FA608WV | |
| Schenker XMG CORE 16 (L23) | |
| Gigabyte Aero X16 1WH | |
| Lenovo Yoga Pro 9 16IMH9 | |
| Dell XPS 16 9640 | |
| Average AMD Ryzen AI 7 350 (3395 - 4399, n=16) | |
| Asus ROG Zephyrus G16 2024 GU605M | |
| AIDA64 / CPU Queen | |
| Average of class Gaming (49785 - 173351, n=96, last 2 years) | |
| Schenker XMG CORE 16 (L23) | |
| Asus TUF Gaming A16 FA608WV | |
| Lenovo Yoga Pro 9 16IMH9 | |
| Asus ROG Zephyrus G16 2024 GU605M | |
| Dell XPS 16 9640 | |
| Gigabyte Aero X16 1WH | |
| Average AMD Ryzen AI 7 350 (67317 - 77400, n=16) | |
| AIDA64 / FPU SinJulia | |
| Asus TUF Gaming A16 FA608WV | |
| Schenker XMG CORE 16 (L23) | |
| Average of class Gaming (4424 - 33636, n=108, last 2 years) | |
| Gigabyte Aero X16 1WH | |
| Average AMD Ryzen AI 7 350 (11916 - 13856, n=16) | |
| Lenovo Yoga Pro 9 16IMH9 | |
| Asus ROG Zephyrus G16 2024 GU605M | |
| Dell XPS 16 9640 | |
| AIDA64 / FPU Mandel | |
| Asus TUF Gaming A16 FA608WV | |
| Average of class Gaming (25115 - 128721, n=108, last 2 years) | |
| Schenker XMG CORE 16 (L23) | |
| Gigabyte Aero X16 1WH | |
| Average AMD Ryzen AI 7 350 (39456 - 59540, n=15) | |
| Lenovo Yoga Pro 9 16IMH9 | |
| Dell XPS 16 9640 | |
| Asus ROG Zephyrus G16 2024 GU605M | |
| AIDA64 / CPU AES | |
| Average of class Gaming (39258 - 247074, n=108, last 2 years) | |
| Lenovo Yoga Pro 9 16IMH9 | |
| Schenker XMG CORE 16 (L23) | |
| Gigabyte Aero X16 1WH | |
| Dell XPS 16 9640 | |
| Asus TUF Gaming A16 FA608WV | |
| Asus ROG Zephyrus G16 2024 GU605M | |
| Average AMD Ryzen AI 7 350 (56915 - 87670, n=16) | |
| AIDA64 / CPU ZLib | |
| Average of class Gaming (574 - 2531, n=108, last 2 years) | |
| Asus TUF Gaming A16 FA608WV | |
| Lenovo Yoga Pro 9 16IMH9 | |
| Dell XPS 16 9640 | |
| Gigabyte Aero X16 1WH | |
| Asus ROG Zephyrus G16 2024 GU605M | |
| Schenker XMG CORE 16 (L23) | |
| Average AMD Ryzen AI 7 350 (663 - 1140, n=16) | |
| AIDA64 / FP64 Ray-Trace | |
| Asus TUF Gaming A16 FA608WV | |
| Average of class Gaming (5509 - 45446, n=108, last 2 years) | |
| Gigabyte Aero X16 1WH | |
| Schenker XMG CORE 16 (L23) | |
| Average AMD Ryzen AI 7 350 (10707 - 15222, n=15) | |
| Lenovo Yoga Pro 9 16IMH9 | |
| Dell XPS 16 9640 | |
| Asus ROG Zephyrus G16 2024 GU605M | |
| AIDA64 / CPU PhotoWorxx | |
| Lenovo Yoga Pro 9 16IMH9 | |
| Dell XPS 16 9640 | |
| Asus ROG Zephyrus G16 2024 GU605M | |
| Average of class Gaming (12271 - 89891, n=108, last 2 years) | |
| Gigabyte Aero X16 1WH | |
| Schenker XMG CORE 16 (L23) | |
| Average AMD Ryzen AI 7 350 (25170 - 47405, n=16) | |
| Asus TUF Gaming A16 FA608WV | |
系统性能
Aero X16 在系统基准测试中表现出色,在日常使用中也没有出现任何问题,所有应用程序都能毫无延迟地运行。
PCMark 10: Score | Essentials | Productivity | Digital Content Creation
CrossMark: Overall | Productivity | Creativity | Responsiveness
WebXPRT 3: Overall
WebXPRT 4: Overall
Mozilla Kraken 1.1: Total
| Performance rating | |
| Average of class Gaming | |
| Dell XPS 16 9640 -1! | |
| Average AMD Ryzen AI 7 350, NVIDIA GeForce RTX 5070 Laptop | |
| Gigabyte Aero X16 1WH | |
| Asus TUF Gaming A16 FA608WV | |
| Schenker XMG CORE 16 (L23) -1! | |
| Lenovo Yoga Pro 9 16IMH9 | |
| Asus ROG Zephyrus G16 2024 GU605M | |
| PCMark 10 / Score | |
| Average of class Gaming (5828 - 11574, n=96, last 2 years) | |
| Average AMD Ryzen AI 7 350, NVIDIA GeForce RTX 5070 Laptop (7717 - 8986, n=3) | |
| Schenker XMG CORE 16 (L23) | |
| Gigabyte Aero X16 1WH | |
| Asus TUF Gaming A16 FA608WV | |
| Lenovo Yoga Pro 9 16IMH9 | |
| Asus ROG Zephyrus G16 2024 GU605M | |
| Dell XPS 16 9640 | |
| PCMark 10 / Essentials | |
| Lenovo Yoga Pro 9 16IMH9 | |
| Schenker XMG CORE 16 (L23) | |
| Average AMD Ryzen AI 7 350, NVIDIA GeForce RTX 5070 Laptop (10496 - 11793, n=3) | |
| Average of class Gaming (8810 - 12600, n=100, last 2 years) | |
| Asus TUF Gaming A16 FA608WV | |
| Gigabyte Aero X16 1WH | |
| Dell XPS 16 9640 | |
| Asus ROG Zephyrus G16 2024 GU605M | |
| PCMark 10 / Productivity | |
| Average AMD Ryzen AI 7 350, NVIDIA GeForce RTX 5070 Laptop (10416 - 15127, n=3) | |
| Average of class Gaming (6845 - 21327, n=98, last 2 years) | |
| Schenker XMG CORE 16 (L23) | |
| Gigabyte Aero X16 1WH | |
| Asus TUF Gaming A16 FA608WV | |
| Asus ROG Zephyrus G16 2024 GU605M | |
| Dell XPS 16 9640 | |
| Lenovo Yoga Pro 9 16IMH9 | |
| PCMark 10 / Digital Content Creation | |
| Average of class Gaming (7602 - 19657, n=98, last 2 years) | |
| Schenker XMG CORE 16 (L23) | |
| Asus TUF Gaming A16 FA608WV | |
| Gigabyte Aero X16 1WH | |
| Lenovo Yoga Pro 9 16IMH9 | |
| Average AMD Ryzen AI 7 350, NVIDIA GeForce RTX 5070 Laptop (9858 - 12404, n=3) | |
| Asus ROG Zephyrus G16 2024 GU605M | |
| Dell XPS 16 9640 | |
| CrossMark / Overall | |
| Average of class Gaming (1366 - 2409, n=96, last 2 years) | |
| Dell XPS 16 9640 | |
| Average AMD Ryzen AI 7 350, NVIDIA GeForce RTX 5070 Laptop (1719 - 1858, n=3) | |
| Asus TUF Gaming A16 FA608WV | |
| Gigabyte Aero X16 1WH | |
| Asus ROG Zephyrus G16 2024 GU605M | |
| Lenovo Yoga Pro 9 16IMH9 | |
| Schenker XMG CORE 16 (L23) | |
| CrossMark / Productivity | |
| Average of class Gaming (1386 - 2254, n=96, last 2 years) | |
| Dell XPS 16 9640 | |
| Average AMD Ryzen AI 7 350, NVIDIA GeForce RTX 5070 Laptop (1635 - 1732, n=3) | |
| Gigabyte Aero X16 1WH | |
| Schenker XMG CORE 16 (L23) | |
| Asus ROG Zephyrus G16 2024 GU605M | |
| Lenovo Yoga Pro 9 16IMH9 | |
| Asus TUF Gaming A16 FA608WV | |
| CrossMark / Creativity | |
| Average of class Gaming (1343 - 2729, n=96, last 2 years) | |
| Asus TUF Gaming A16 FA608WV | |
| Dell XPS 16 9640 | |
| Average AMD Ryzen AI 7 350, NVIDIA GeForce RTX 5070 Laptop (1956 - 2077, n=3) | |
| Lenovo Yoga Pro 9 16IMH9 | |
| Gigabyte Aero X16 1WH | |
| Asus ROG Zephyrus G16 2024 GU605M | |
| Schenker XMG CORE 16 (L23) | |
| CrossMark / Responsiveness | |
| Average of class Gaming (1226 - 2334, n=96, last 2 years) | |
| Dell XPS 16 9640 | |
| Average AMD Ryzen AI 7 350, NVIDIA GeForce RTX 5070 Laptop (1357 - 1642, n=3) | |
| Gigabyte Aero X16 1WH | |
| Schenker XMG CORE 16 (L23) | |
| Asus ROG Zephyrus G16 2024 GU605M | |
| Asus TUF Gaming A16 FA608WV | |
| Lenovo Yoga Pro 9 16IMH9 | |
| WebXPRT 3 / Overall | |
| Gigabyte Aero X16 1WH | |
| Average of class Gaming (220 - 532, n=101, last 2 years) | |
| Average AMD Ryzen AI 7 350, NVIDIA GeForce RTX 5070 Laptop (288 - 336, n=3) | |
| Lenovo Yoga Pro 9 16IMH9 | |
| Schenker XMG CORE 16 (L23) | |
| Asus ROG Zephyrus G16 2024 GU605M | |
| Dell XPS 16 9640 | |
| Asus TUF Gaming A16 FA608WV | |
| WebXPRT 4 / Overall | |
| Average of class Gaming (165 - 354, n=101, last 2 years) | |
| Gigabyte Aero X16 1WH | |
| Asus TUF Gaming A16 FA608WV | |
| Lenovo Yoga Pro 9 16IMH9 | |
| Average AMD Ryzen AI 7 350, NVIDIA GeForce RTX 5070 Laptop (246 - 277, n=3) | |
| Asus ROG Zephyrus G16 2024 GU605M | |
| Dell XPS 16 9640 | |
| Mozilla Kraken 1.1 / Total | |
| Asus ROG Zephyrus G16 2024 GU605M | |
| Schenker XMG CORE 16 (L23) | |
| Lenovo Yoga Pro 9 16IMH9 | |
| Average of class Gaming (391 - 590, n=106, last 2 years) | |
| Average AMD Ryzen AI 7 350, NVIDIA GeForce RTX 5070 Laptop (431 - 470, n=2) | |
| Gigabyte Aero X16 1WH | |
| Asus TUF Gaming A16 FA608WV | |
* ... smaller is better
| PCMark 10 Score | 7925 points | |
Help | ||
| AIDA64 / Memory Copy | |
| Lenovo Yoga Pro 9 16IMH9 | |
| Dell XPS 16 9640 | |
| Asus TUF Gaming A16 FA608WV | |
| Asus ROG Zephyrus G16 2024 GU605M | |
| Average AMD Ryzen AI 7 350 (37823 - 106997, n=16) | |
| Gigabyte Aero X16 1WH | |
| Average of class Gaming (21750 - 129946, n=108, last 2 years) | |
| Schenker XMG CORE 16 (L23) | |
| AIDA64 / Memory Read | |
| Asus TUF Gaming A16 FA608WV | |
| Lenovo Yoga Pro 9 16IMH9 | |
| Asus ROG Zephyrus G16 2024 GU605M | |
| Dell XPS 16 9640 | |
| Average of class Gaming (22956 - 118858, n=108, last 2 years) | |
| Gigabyte Aero X16 1WH | |
| Schenker XMG CORE 16 (L23) | |
| Average AMD Ryzen AI 7 350 (43921 - 63650, n=16) | |
| AIDA64 / Memory Write | |
| Asus TUF Gaming A16 FA608WV | |
| Average AMD Ryzen AI 7 350 (42576 - 110817, n=16) | |
| Gigabyte Aero X16 1WH | |
| Schenker XMG CORE 16 (L23) | |
| Average of class Gaming (22297 - 135096, n=108, last 2 years) | |
| Lenovo Yoga Pro 9 16IMH9 | |
| Dell XPS 16 9640 | |
| Asus ROG Zephyrus G16 2024 GU605M | |
| AIDA64 / Memory Latency | |
| Asus ROG Zephyrus G16 2024 GU605M | |
| Dell XPS 16 9640 | |
| Lenovo Yoga Pro 9 16IMH9 | |
| Asus TUF Gaming A16 FA608WV | |
| Average of class Gaming (75.3 - 259, n=108, last 2 years) | |
| Average AMD Ryzen AI 7 350 (87.7 - 109.8, n=16) | |
| Gigabyte Aero X16 1WH | |
| Schenker XMG CORE 16 (L23) | |
* ... smaller is better
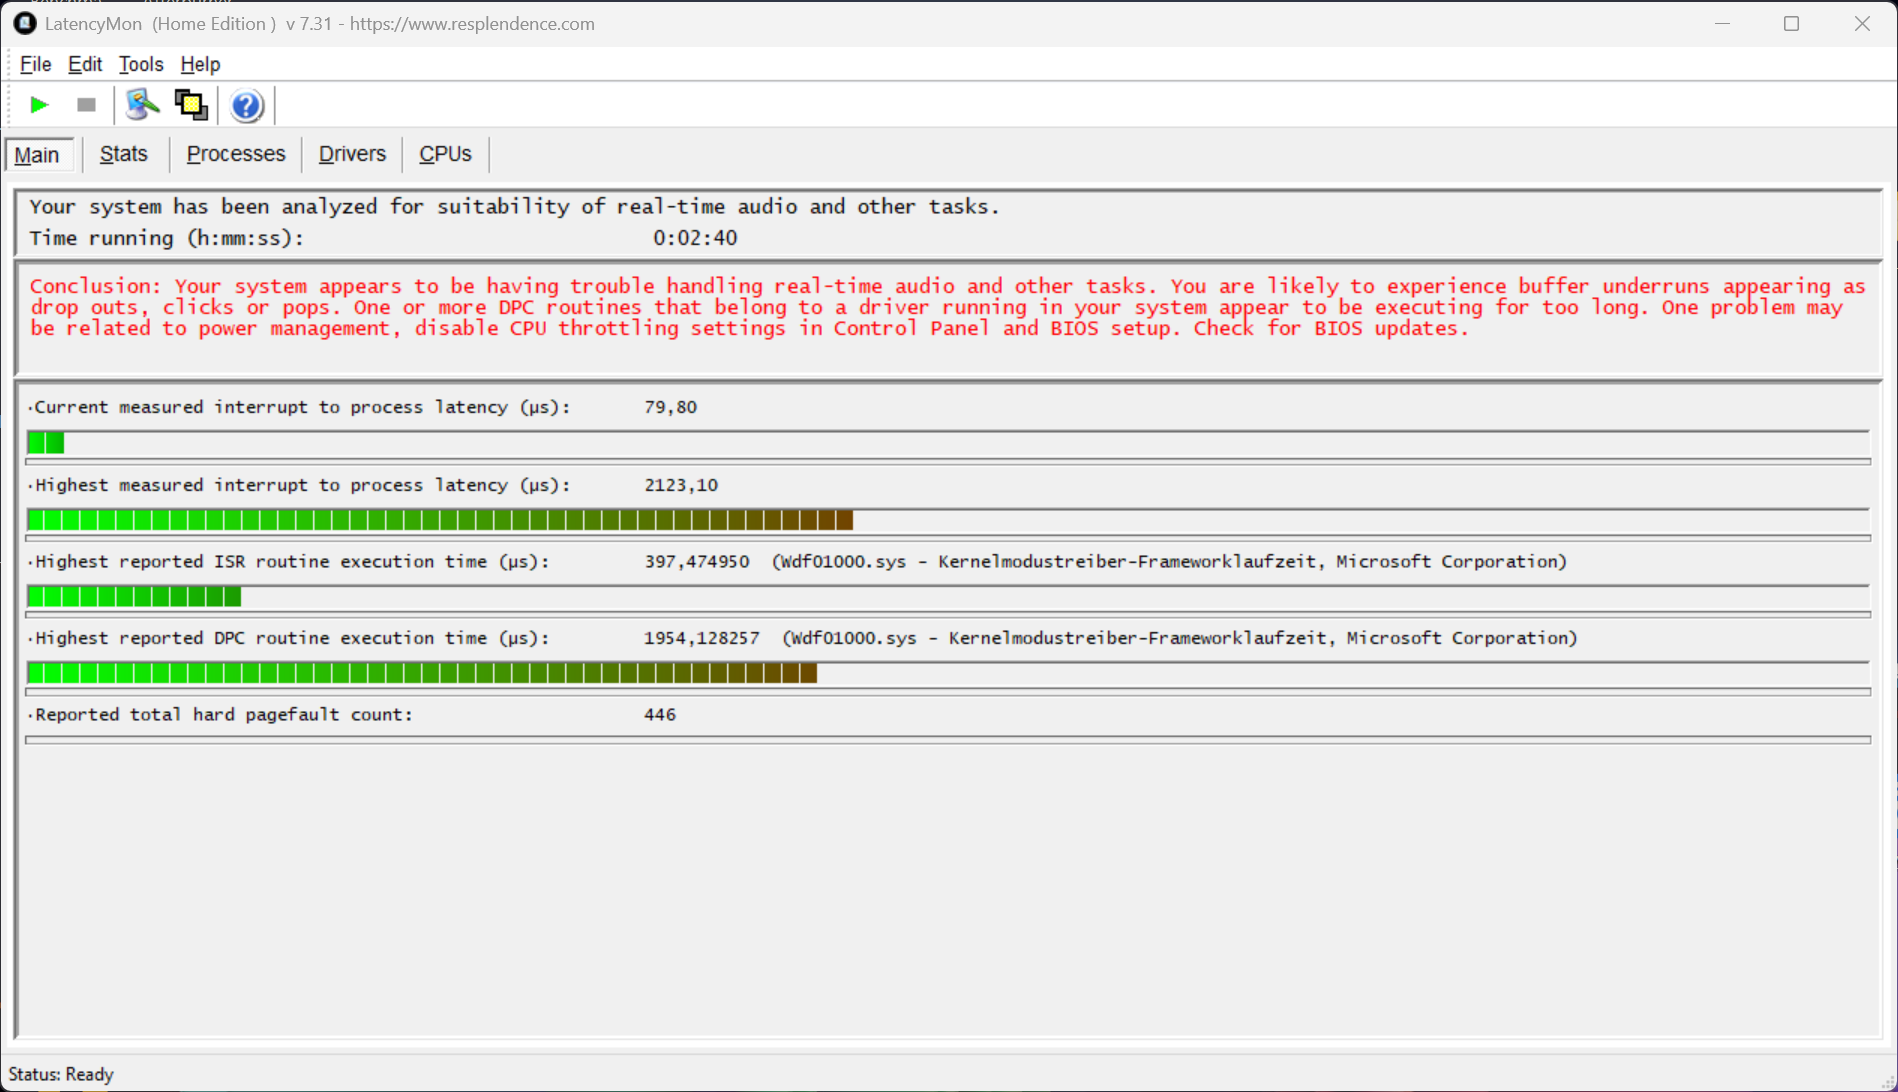
DPC 延迟
在我们的标准化延迟测试(上网、4K YouTube 播放、CPU 负载)中,使用当前 BIOS 版本的 Aero X16 在使用实时音频应用程序时表现出了局限性。
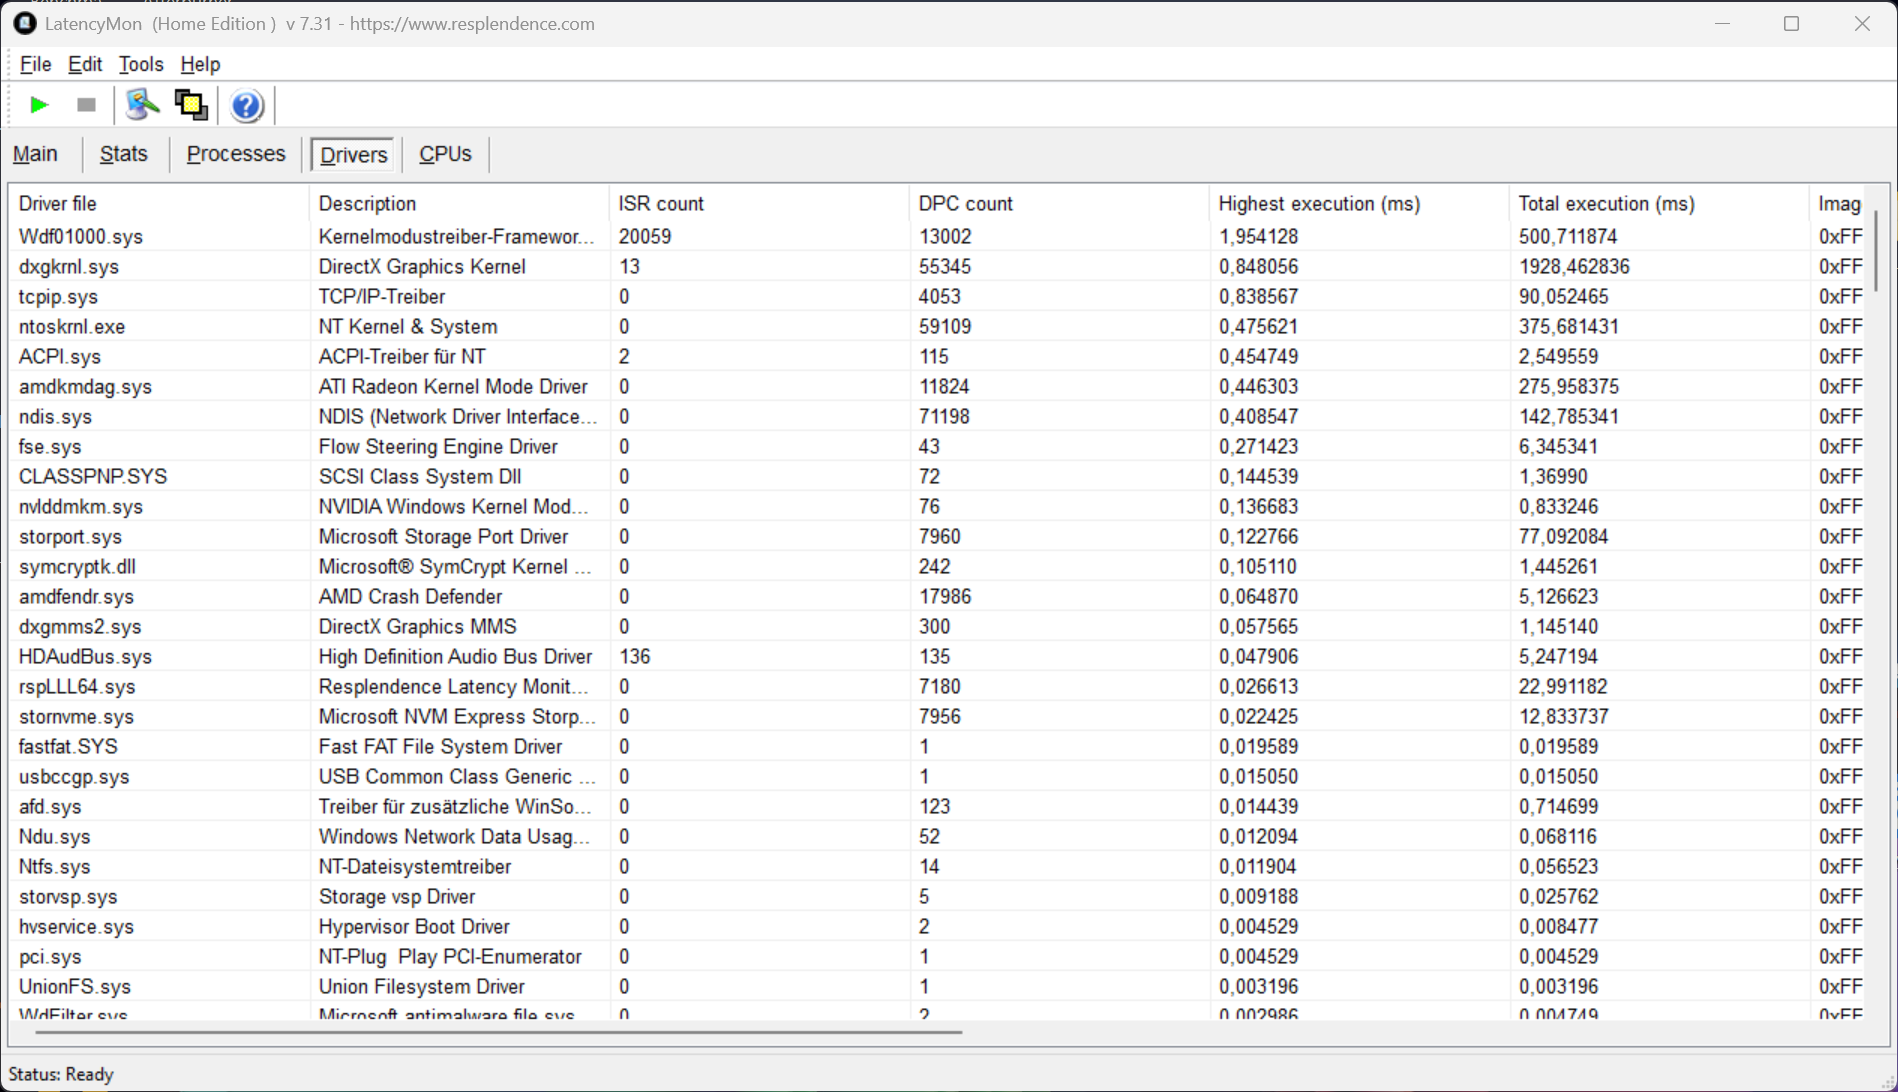
| DPC Latencies / LatencyMon - interrupt to process latency (max), Web, Youtube, Prime95 | |
| Asus ROG Zephyrus G16 2024 GU605M | |
| Gigabyte Aero X16 1WH | |
| Asus TUF Gaming A16 FA608WV | |
| Dell XPS 16 9640 | |
| Schenker XMG CORE 16 (L23) | |
| Lenovo Yoga Pro 9 16IMH9 | |
* ... smaller is better
存储设备
我们的 Aero X16 样品安装了金士顿的 1 TB SSD。PCIe 4.0 x4 固态硬盘的传输速率总体良好,即使在持续负载的情况下也能保持稳定。
不过,第二个固态硬盘插槽只能通过 PCIe 4.0 x2 连接,因此传输速率最高只能达到每秒 3.5 GB 左右。

* ... smaller is better
Disk throttling: DiskSpd Read Loop, Queue Depth 8
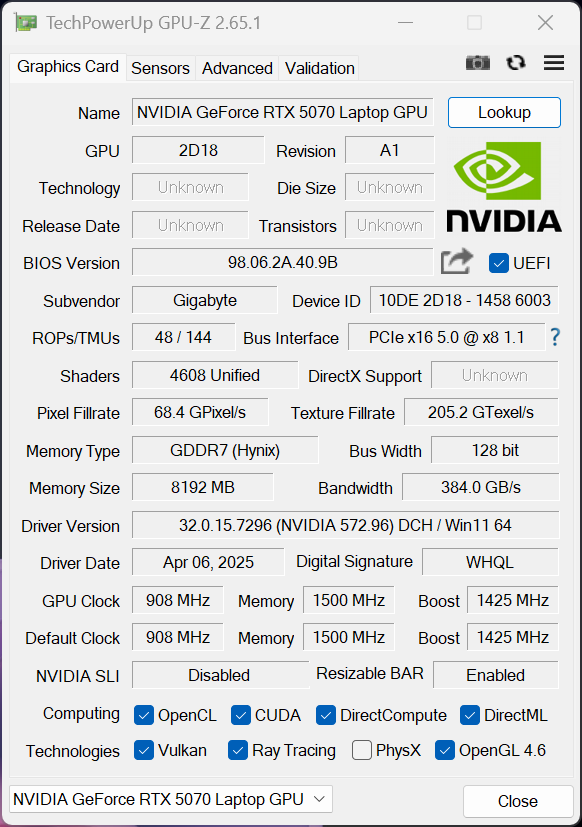
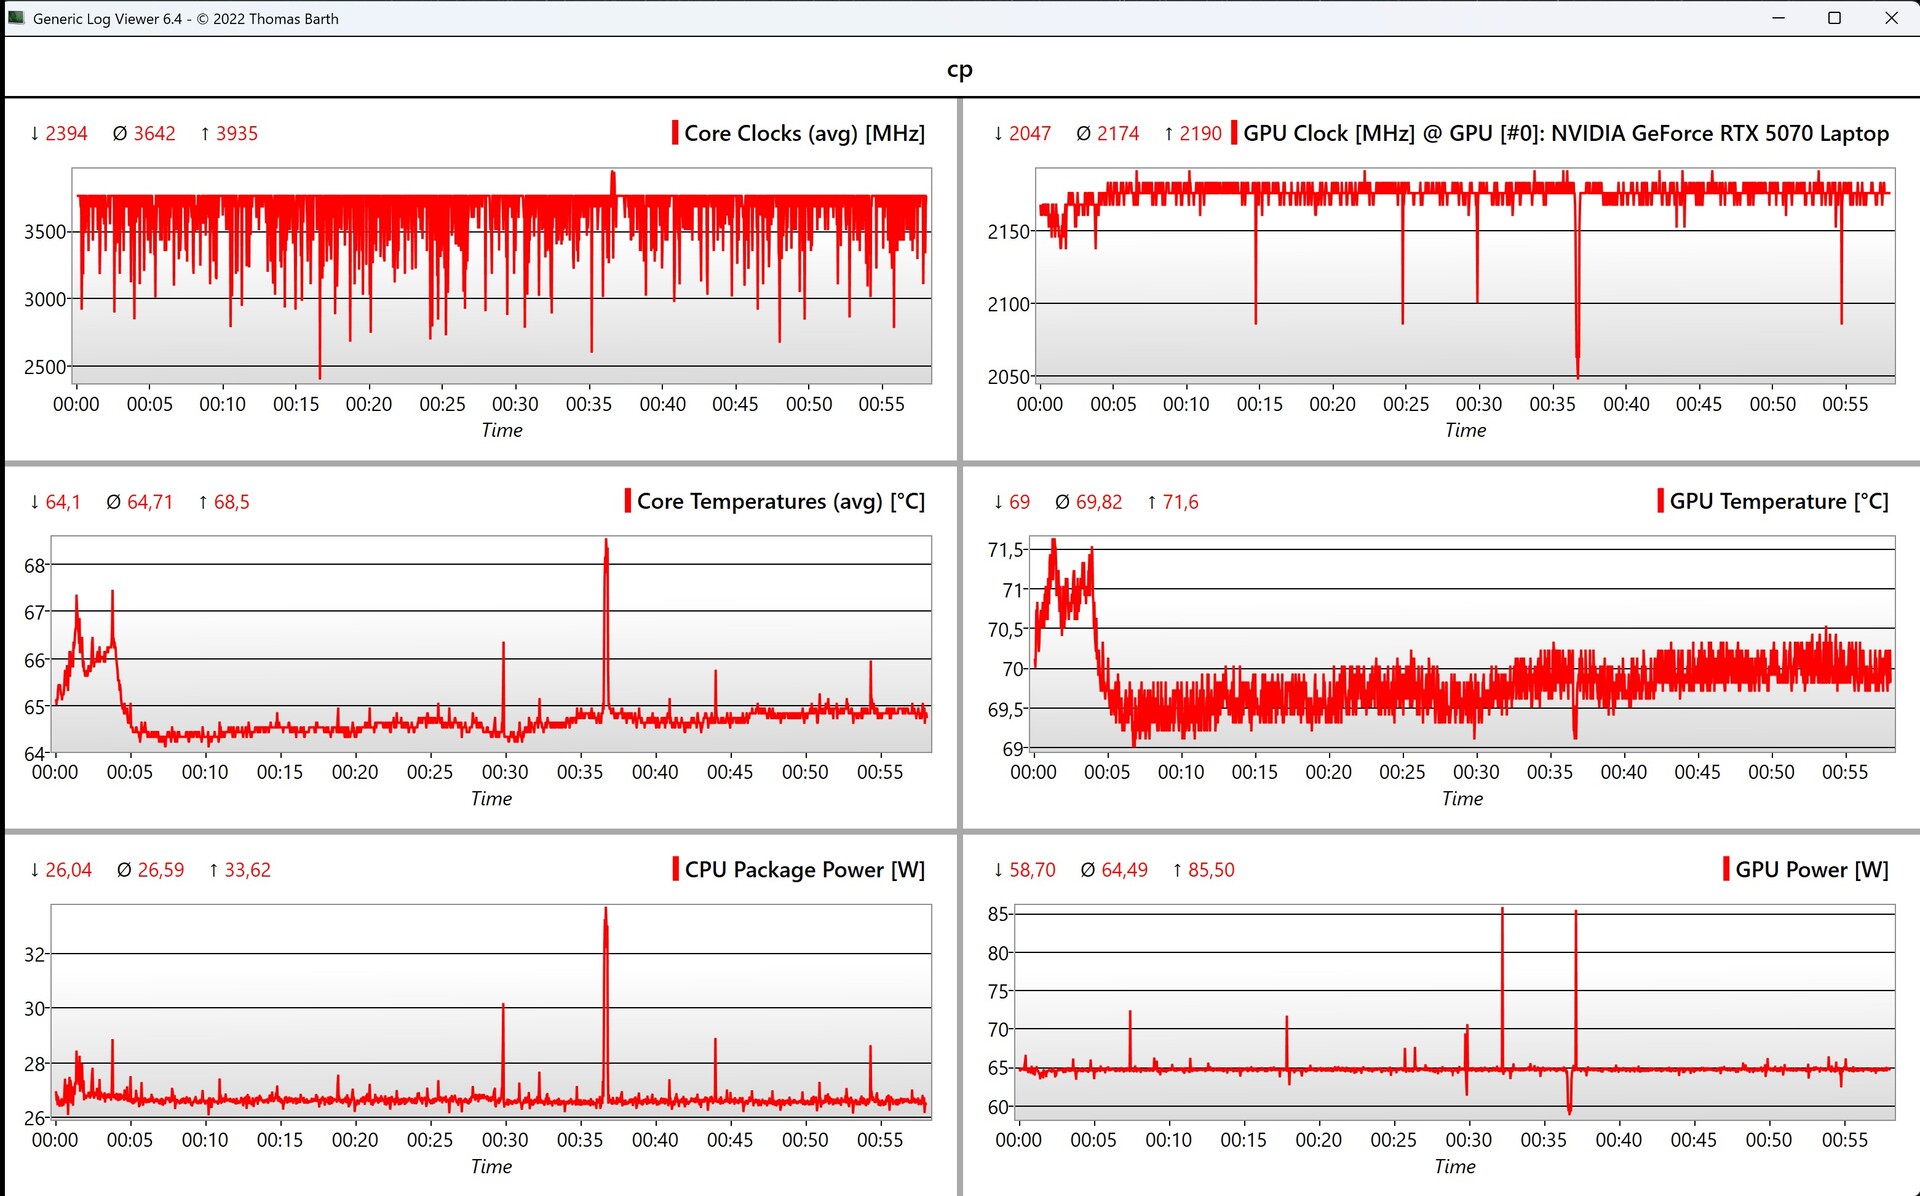
图形处理器性能
技嘉 Aero X16 基于新的 GeForce RTX 5070 笔记本电脑配备 85 W TGP 和普通 Optimus GPU 开关。正如我们在 我们的分析新款 5070 笔记本电脑并不比之前的 RTX 4070 笔记本电脑.8 GB 的 VRAM 也不是特别适合未来使用。
在合成和游戏基准测试中,RTX 5070 笔记本电脑与 TGP 值稍高的 RTX 4070 笔记本电脑的变体(最高达 100 W)不相上下,同时比 80 W 的 RTX 4070 笔记本电脑变体高出几个百分点。
所提供的游戏性能原则上足以满足当前游戏的 QHD 分辨率,不过在某些画质设置下,VRAM 可能会造成限制。
GPU 性能在持续负载下保持稳定,但电池功耗降低到 35 W(-53%)。
| 3DMark 11 Performance | 32789 points | |
| 3DMark Fire Strike Score | 27569 points | |
| 3DMark Time Spy Score | 11868 points | |
| 3DMark Steel Nomad Score | 2587 points | |
| 3DMark Steel Nomad Light Score | 11847 points | |
| 3DMark Steel Nomad Light Unlimited Score | 12062 points | |
Help | ||
| Blender / v3.3 Classroom OPTIX/RTX | |
| Asus ROG Zephyrus G16 2024 GU605M | |
| Dell XPS 16 9640 | |
| Asus TUF Gaming A16 FA608WV | |
| Gigabyte Aero X16 1WH | |
| Schenker XMG CORE 16 (L23) | |
| Average NVIDIA GeForce RTX 5070 Laptop (17 - 24, n=28) | |
| Lenovo Yoga Pro 9 16IMH9 | |
| Average of class Gaming (9 - 32, n=110, last 2 years) | |
| Blender / v3.3 Classroom CUDA | |
| Asus TUF Gaming A16 FA608WV | |
| Average NVIDIA GeForce RTX 5070 Laptop (29 - 228, n=29) | |
| Dell XPS 16 9640 | |
| Gigabyte Aero X16 1WH | |
| Average of class Gaming (15 - 233, n=111, last 2 years) | |
| Asus ROG Zephyrus G16 2024 GU605M | |
| Schenker XMG CORE 16 (L23) | |
| Lenovo Yoga Pro 9 16IMH9 | |
| Blender / v3.3 Classroom CPU | |
| Asus ROG Zephyrus G16 2024 GU605M | |
| Gigabyte Aero X16 1WH | |
| Dell XPS 16 9640 | |
| Schenker XMG CORE 16 (L23) | |
| Lenovo Yoga Pro 9 16IMH9 | |
| Average NVIDIA GeForce RTX 5070 Laptop (137 - 507, n=26) | |
| Average of class Gaming (122 - 565, n=106, last 2 years) | |
| Asus TUF Gaming A16 FA608WV | |
* ... smaller is better
| Cyberpunk 2077 - 1920x1080 Ultra Preset (FSR off) | |
| Average of class Gaming (17.7 - 169.9, n=119, last 2 years) | |
| Gigabyte Aero X16 1WH | |
| Lenovo Yoga Pro 9 16IMH9 | |
| Asus TUF Gaming A16 FA608WV | |
| Asus ROG Zephyrus G16 2024 GU605M | |
| Dell XPS 16 9640 | |
| Baldur's Gate 3 - 1920x1080 Ultra Preset AA:T | |
| Average of class Gaming (59.4 - 246, n=106, last 2 years) | |
| Lenovo Yoga Pro 9 16IMH9 | |
| Gigabyte Aero X16 1WH | |
| Asus TUF Gaming A16 FA608WV | |
| Dell XPS 16 9640 | |
| GTA V - 1920x1080 Highest AA:4xMSAA + FX AF:16x | |
| Average of class Gaming (48.3 - 186.9, n=99, last 2 years) | |
| Schenker XMG CORE 16 (L23) | |
| Asus TUF Gaming A16 FA608WV | |
| Gigabyte Aero X16 1WH | |
| Lenovo Yoga Pro 9 16IMH9 | |
| Dell XPS 16 9640 | |
| Asus ROG Zephyrus G16 2024 GU605M | |
| Final Fantasy XV Benchmark - 1920x1080 High Quality | |
| Average of class Gaming (41 - 215, n=100, last 2 years) | |
| Schenker XMG CORE 16 (L23) | |
| Gigabyte Aero X16 1WH | |
| Lenovo Yoga Pro 9 16IMH9 | |
| Asus TUF Gaming A16 FA608WV | |
| Asus ROG Zephyrus G16 2024 GU605M | |
| Dell XPS 16 9640 | |
| Strange Brigade - 1920x1080 ultra AA:ultra AF:16 | |
| Average of class Gaming (76.3 - 456, n=90, last 2 years) | |
| Gigabyte Aero X16 1WH | |
| Schenker XMG CORE 16 (L23) | |
| Lenovo Yoga Pro 9 16IMH9 | |
| Asus TUF Gaming A16 FA608WV | |
| Dell XPS 16 9640 | |
| Asus ROG Zephyrus G16 2024 GU605M | |
| Dota 2 Reborn - 1920x1080 ultra (3/3) best looking | |
| Average of class Gaming (84.8 - 248, n=111, last 2 years) | |
| Lenovo Yoga Pro 9 16IMH9 | |
| Asus TUF Gaming A16 FA608WV | |
| Schenker XMG CORE 16 (L23) | |
| Gigabyte Aero X16 1WH | |
| Asus ROG Zephyrus G16 2024 GU605M | |
| Dell XPS 16 9640 | |
Cyberpunk 2077 1080p Ultra FPS chart
| low | med. | high | ultra | QHD DLSS | QHD | 4K DLSS | 4K | |
|---|---|---|---|---|---|---|---|---|
| GTA V (2015) | 111.8 | 105.7 | ||||||
| The Witcher 3 (2015) | 104.7 | |||||||
| Dota 2 Reborn (2015) | 158 | 129.5 | 141.6 | 131.9 | ||||
| Final Fantasy XV Benchmark (2018) | 210 | 149.9 | 119.5 | 85.8 | 49.1 | |||
| X-Plane 11.11 (2018) | 104.3 | 100.7 | 83.7 | |||||
| Strange Brigade (2018) | 511 | 331 | 270 | 234 | 164.2 | 90.3 | ||
| Baldur's Gate 3 (2023) | 109.4 | 75.8 | 65.1 | 41.1 | ||||
| Cyberpunk 2077 (2023) | 90.1 | 58.3 | 26.4 | |||||
| Alan Wake 2 (2023) | 64.6 | 41.5 | 18.6 | |||||
| F1 24 (2024) | 77.7 | 76.1 | 48.7 | 18.9 | 15.5 | |||
| Call of Duty Black Ops 6 (2024) | 95 | 73 | 68 | 39 | 38 | |||
| Assassin's Creed Shadows (2025) | 40 | 39 | 30 | 24 | 18 |
排放与能源:无压力时可承受的热量和噪音输出
噪音排放
Aero X16 的双风扇在日常使用中通常处于关闭状态,只有在玩游戏或负载很高时才会真正打开。
不过,在性能模式下,双风扇的声压级(SPL)会达到 50 dB(A)左右,非常响亮。
在平衡模式下,我们录得的最大声压级为 46.8 dB(A),在环保模式下为 35.4 dB(A)。测试设备没有发出其他电子噪音。
Noise level
| Idle |
| 23.9 / 23.9 / 23.9 dB(A) |
| Load |
| 33.2 / 50.2 dB(A) |
 | ||
30 dB silent 40 dB(A) audible 50 dB(A) loud |
||
min: | ||
| Gigabyte Aero X16 1WH GeForce RTX 5070 Laptop, Ryzen AI 7 350, Kingston OM8PGP41024Q-A0 | Asus TUF Gaming A16 FA608WV GeForce RTX 4060 Laptop GPU, Ryzen AI 9 HX 370, Micron 2400 MTFDKBA1T0QFM | Lenovo Yoga Pro 9 16IMH9 GeForce RTX 4070 Laptop GPU, Ultra 9 185H, SK Hynix HFS001TEJ9X115N | Dell XPS 16 9640 GeForce RTX 4070 Laptop GPU, Ultra 7 155H, Kioxia XG8 KXG80ZNV1T02 | Asus ROG Zephyrus G16 2024 GU605M GeForce RTX 4070 Laptop GPU, Ultra 7 155H, WD PC SN560 SDDPNQE-1T00 | Schenker XMG CORE 16 (L23) GeForce RTX 4070 Laptop GPU, R7 7840HS, Samsung 990 Pro 1 TB | |
|---|---|---|---|---|---|---|
| Noise | 7% | -11% | -7% | -6% | -5% | |
| off / environment * (dB) | 23.9 | 23 4% | 24.3 -2% | 24.5 -3% | 23.9 -0% | 23 4% |
| Idle Minimum * (dB) | 23.9 | 23 4% | 24.3 -2% | 24.5 -3% | 23.9 -0% | 23 4% |
| Idle Average * (dB) | 23.9 | 23 4% | 24.3 -2% | 24.5 -3% | 27.8 -16% | 28.48 -19% |
| Idle Maximum * (dB) | 23.9 | 29.11 -22% | 25.8 -8% | 27.5 -15% | 30.1 -26% | 28.48 -19% |
| Load Average * (dB) | 33.2 | 31 7% | 48.1 -45% | 39.6 -19% | 34.2 -3% | 30 10% |
| Cyberpunk 2077 ultra * (dB) | 50.2 | 36.23 28% | ||||
| Load Maximum * (dB) | 50.2 | 39.44 21% | 53.9 -7% | 49.7 1% | 46.4 8% | 54.12 -8% |
| Witcher 3 ultra * (dB) | 49.7 | 49.7 | 46.4 | 54.12 |
* ... smaller is better
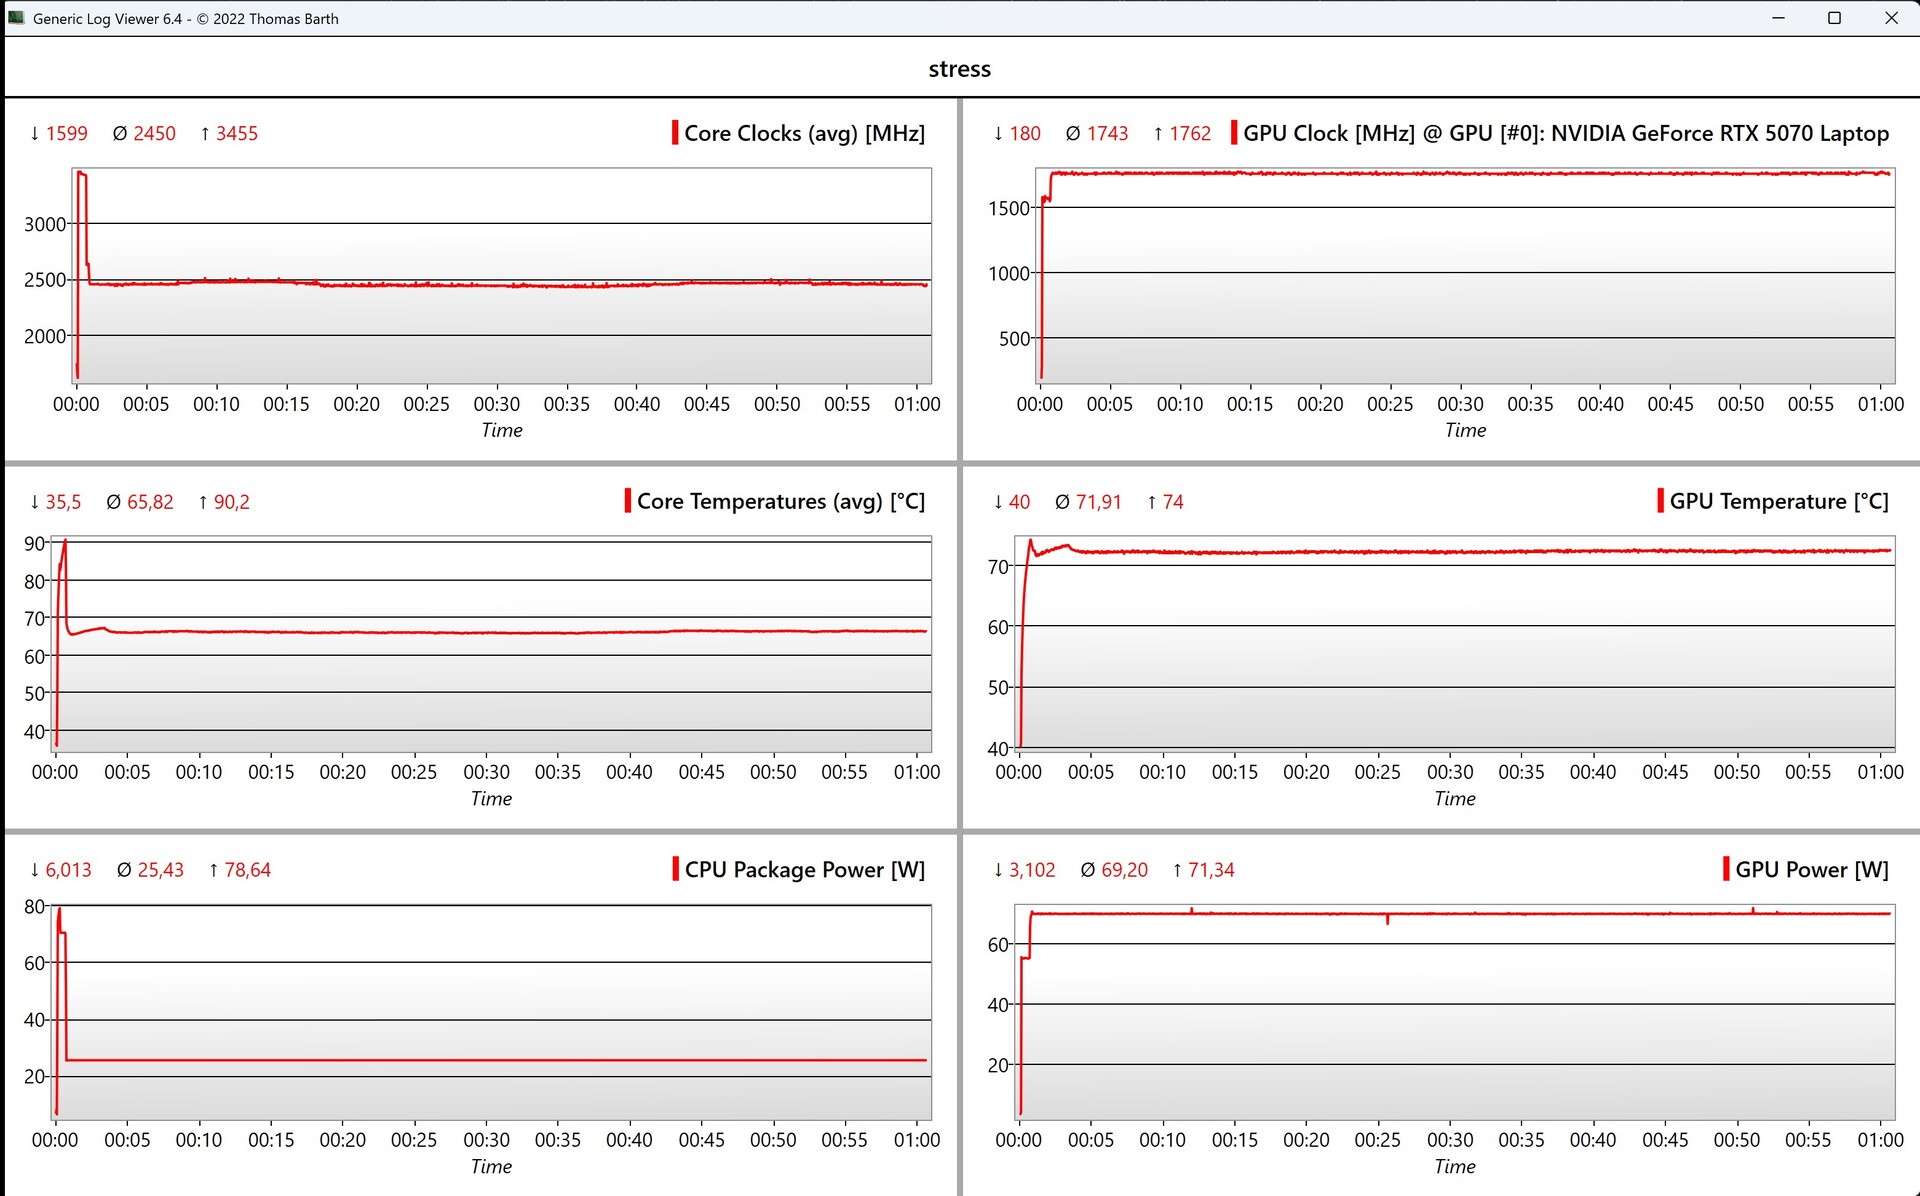
温度
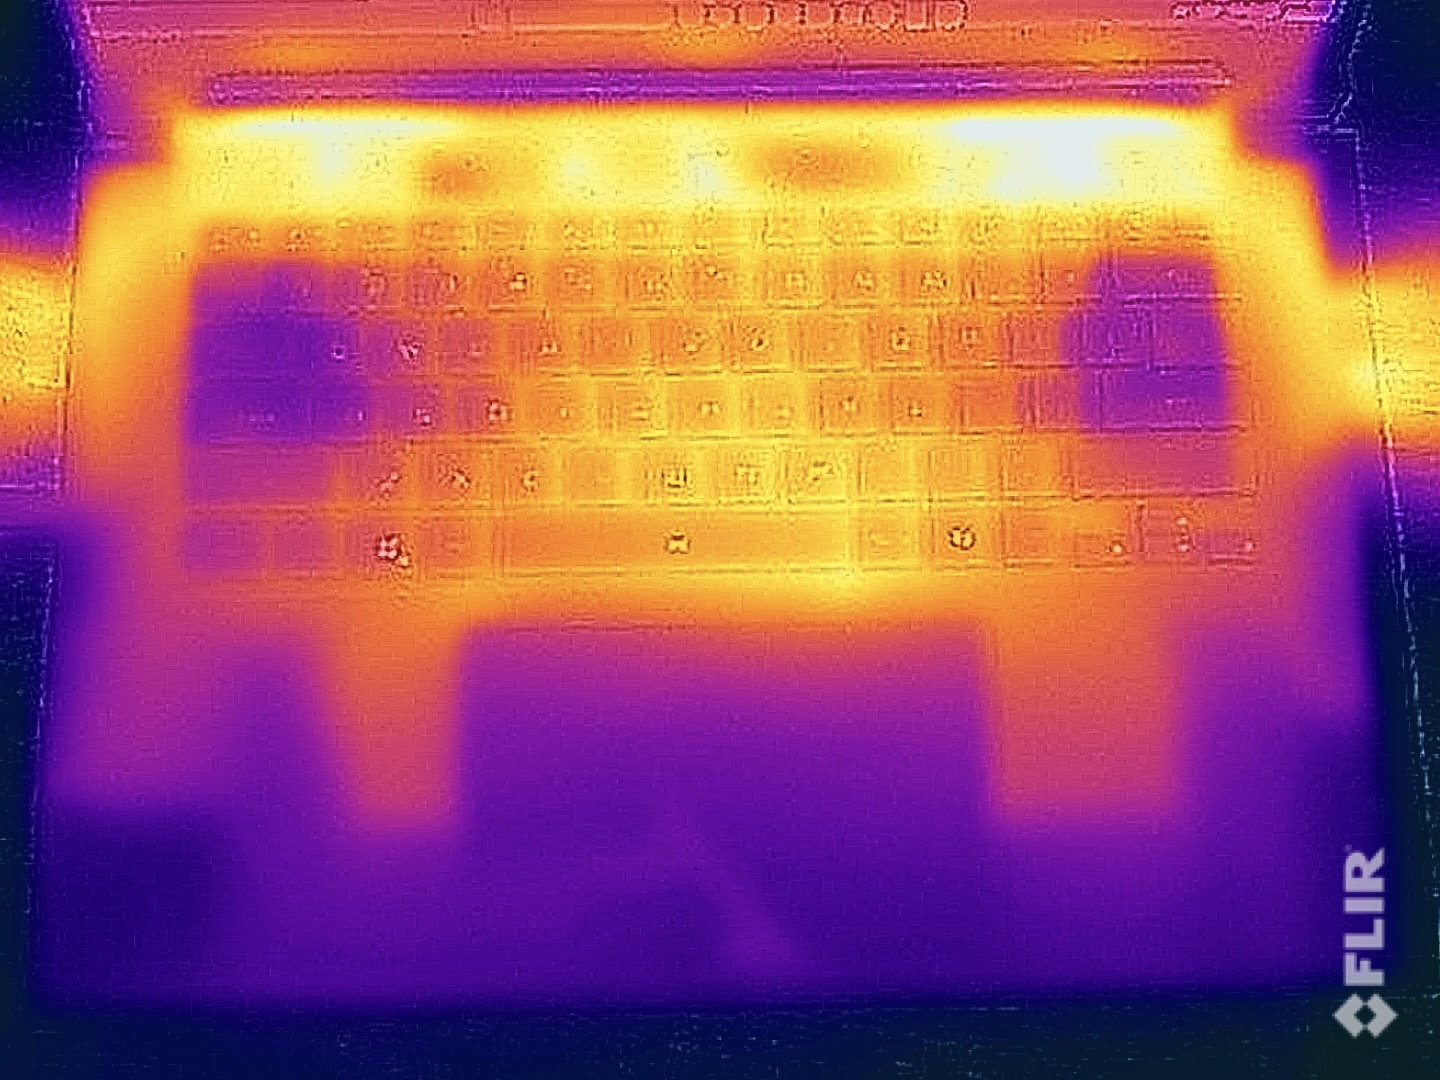
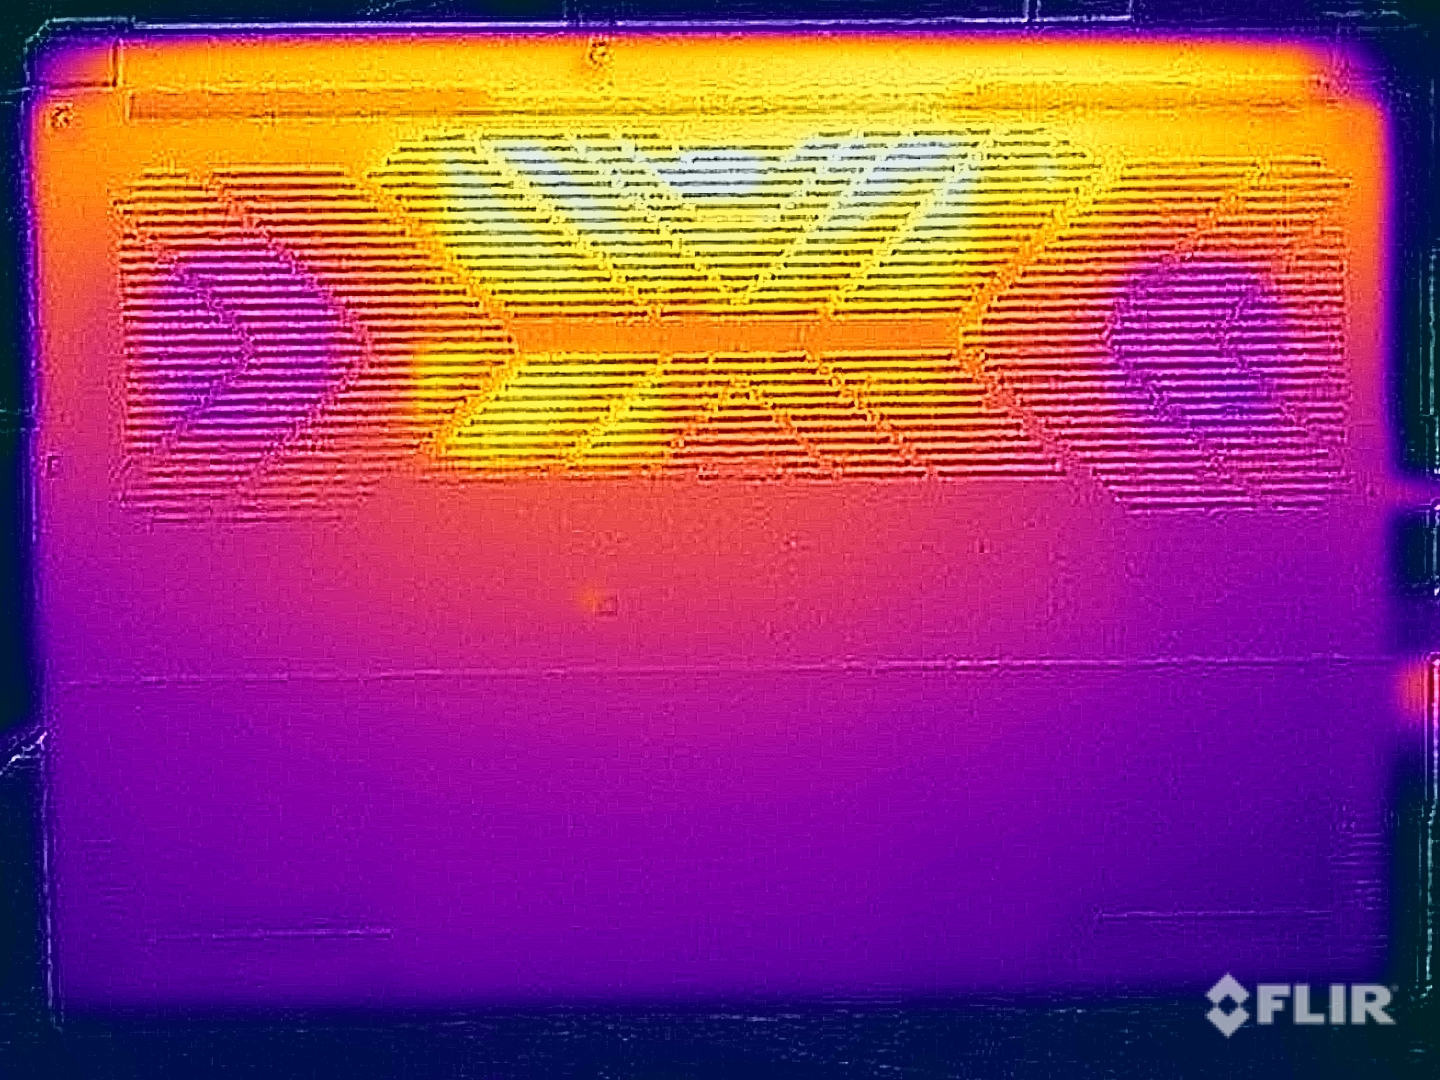
在执行基本任务时,机箱仍能保持凉爽,但在压力下,我们测得底部后部区域的温度接近 50 °C。因此,在高负载情况下,不应将 Aero X16 放在大腿上。
不过,底座顶部的温度相对较低,在运行重负载时打字不会受到任何限制。在 CPU/GPU 综合负载的压力测试中,RTX 5070 笔记本显卡的运行功耗为 70 W,而 Ryzen AI 7 350 的功耗则被限制在 25 W。
(±) The maximum temperature on the upper side is 43.3 °C / 110 F, compared to the average of 40.4 °C / 105 F, ranging from 21.2 to 68.8 °C for the class Gaming.
(-) The bottom heats up to a maximum of 50.3 °C / 123 F, compared to the average of 43.2 °C / 110 F
(+) In idle usage, the average temperature for the upper side is 26.6 °C / 80 F, compared to the device average of 33.9 °C / 93 F.
(±) 3: The average temperature for the upper side is 36.5 °C / 98 F, compared to the average of 33.9 °C / 93 F for the class Gaming.
(+) The palmrests and touchpad are reaching skin temperature as a maximum (32.5 °C / 90.5 F) and are therefore not hot.
(-) The average temperature of the palmrest area of similar devices was 28.8 °C / 83.8 F (-3.7 °C / -6.7 F).
| Gigabyte Aero X16 1WH AMD Ryzen AI 7 350, NVIDIA GeForce RTX 5070 Laptop | Asus TUF Gaming A16 FA608WV AMD Ryzen AI 9 HX 370, NVIDIA GeForce RTX 4060 Laptop GPU | Lenovo Yoga Pro 9 16IMH9 Intel Core Ultra 9 185H, NVIDIA GeForce RTX 4070 Laptop GPU | Dell XPS 16 9640 Intel Core Ultra 7 155H, NVIDIA GeForce RTX 4070 Laptop GPU | Asus ROG Zephyrus G16 2024 GU605M Intel Core Ultra 7 155H, NVIDIA GeForce RTX 4070 Laptop GPU | Schenker XMG CORE 16 (L23) AMD Ryzen 7 7840HS, NVIDIA GeForce RTX 4070 Laptop GPU | |
|---|---|---|---|---|---|---|
| Heat | 7% | 5% | 9% | -6% | -7% | |
| Maximum Upper Side * (°C) | 43.3 | 38 12% | 41.7 4% | 39.4 9% | 50.3 -16% | 46 -6% |
| Maximum Bottom * (°C) | 50.3 | 37 26% | 46.3 8% | 36.9 27% | 48 5% | 44 13% |
| Idle Upper Side * (°C) | 27 | 28 -4% | 26.2 3% | 28.2 -4% | 28.8 -7% | 32 -19% |
| Idle Bottom * (°C) | 28.3 | 30 -6% | 27.2 4% | 27.4 3% | 29.8 -5% | 33 -17% |
* ... smaller is better
发言人
两个立体声扬声器(2x 2 瓦)声音清晰,给人留下深刻印象,但整体功率不大。
Gigabyte Aero X16 1WH audio analysis
(±) | speaker loudness is average but good (76 dB)
Bass 100 - 315 Hz
(-) | nearly no bass - on average 15.4% lower than median
(±) | linearity of bass is average (13.1% delta to prev. frequency)
Mids 400 - 2000 Hz
(+) | balanced mids - only 3.3% away from median
(+) | mids are linear (5.5% delta to prev. frequency)
Highs 2 - 16 kHz
(+) | balanced highs - only 2.8% away from median
(+) | highs are linear (5.7% delta to prev. frequency)
Overall 100 - 16.000 Hz
(±) | linearity of overall sound is average (15.5% difference to median)
Compared to same class
» 35% of all tested devices in this class were better, 7% similar, 58% worse
» The best had a delta of 6%, average was 18%, worst was 132%
Compared to all devices tested
» 23% of all tested devices were better, 4% similar, 73% worse
» The best had a delta of 4%, average was 24%, worst was 134%
Asus TUF Gaming A16 FA608WV audio analysis
(±) | speaker loudness is average but good (79.84 dB)
Bass 100 - 315 Hz
(-) | nearly no bass - on average 18.3% lower than median
(+) | bass is linear (6.8% delta to prev. frequency)
Mids 400 - 2000 Hz
(±) | higher mids - on average 5.6% higher than median
(+) | mids are linear (5.5% delta to prev. frequency)
Highs 2 - 16 kHz
(+) | balanced highs - only 4.4% away from median
(+) | highs are linear (5.4% delta to prev. frequency)
Overall 100 - 16.000 Hz
(±) | linearity of overall sound is average (18.8% difference to median)
Compared to same class
» 62% of all tested devices in this class were better, 8% similar, 30% worse
» The best had a delta of 6%, average was 18%, worst was 132%
Compared to all devices tested
» 43% of all tested devices were better, 8% similar, 49% worse
» The best had a delta of 4%, average was 24%, worst was 134%
Lenovo Yoga Pro 9 16IMH9 audio analysis
(+) | speakers can play relatively loud (84.5 dB)
Bass 100 - 315 Hz
(±) | reduced bass - on average 7% lower than median
(±) | linearity of bass is average (7.2% delta to prev. frequency)
Mids 400 - 2000 Hz
(+) | balanced mids - only 3.9% away from median
(+) | mids are linear (4.5% delta to prev. frequency)
Highs 2 - 16 kHz
(+) | balanced highs - only 2.8% away from median
(+) | highs are linear (3.2% delta to prev. frequency)
Overall 100 - 16.000 Hz
(+) | overall sound is linear (8.8% difference to median)
Compared to same class
» 11% of all tested devices in this class were better, 2% similar, 87% worse
» The best had a delta of 5%, average was 17%, worst was 45%
Compared to all devices tested
» 3% of all tested devices were better, 1% similar, 97% worse
» The best had a delta of 4%, average was 24%, worst was 134%
Dell XPS 16 9640 audio analysis
(+) | speakers can play relatively loud (83.4 dB)
Bass 100 - 315 Hz
(±) | reduced bass - on average 11.2% lower than median
(±) | linearity of bass is average (8.9% delta to prev. frequency)
Mids 400 - 2000 Hz
(+) | balanced mids - only 4.5% away from median
(+) | mids are linear (3% delta to prev. frequency)
Highs 2 - 16 kHz
(+) | balanced highs - only 1.4% away from median
(+) | highs are linear (2% delta to prev. frequency)
Overall 100 - 16.000 Hz
(+) | overall sound is linear (10% difference to median)
Compared to same class
» 13% of all tested devices in this class were better, 2% similar, 84% worse
» The best had a delta of 5%, average was 17%, worst was 45%
Compared to all devices tested
» 4% of all tested devices were better, 1% similar, 94% worse
» The best had a delta of 4%, average was 24%, worst was 134%
Asus ROG Zephyrus G16 2024 GU605M audio analysis
(+) | speakers can play relatively loud (83.3 dB)
Bass 100 - 315 Hz
(+) | good bass - only 3.8% away from median
(±) | linearity of bass is average (8.1% delta to prev. frequency)
Mids 400 - 2000 Hz
(+) | balanced mids - only 3.5% away from median
(+) | mids are linear (2.4% delta to prev. frequency)
Highs 2 - 16 kHz
(+) | balanced highs - only 2.2% away from median
(+) | highs are linear (3.7% delta to prev. frequency)
Overall 100 - 16.000 Hz
(+) | overall sound is linear (7.3% difference to median)
Compared to same class
» 1% of all tested devices in this class were better, 0% similar, 99% worse
» The best had a delta of 6%, average was 18%, worst was 132%
Compared to all devices tested
» 1% of all tested devices were better, 0% similar, 99% worse
» The best had a delta of 4%, average was 24%, worst was 134%
Schenker XMG CORE 16 (L23) audio analysis
(±) | speaker loudness is average but good (79.4 dB)
Bass 100 - 315 Hz
(-) | nearly no bass - on average 21.6% lower than median
(±) | linearity of bass is average (11.4% delta to prev. frequency)
Mids 400 - 2000 Hz
(±) | higher mids - on average 5.4% higher than median
(+) | mids are linear (6.7% delta to prev. frequency)
Highs 2 - 16 kHz
(+) | balanced highs - only 2.3% away from median
(+) | highs are linear (6.6% delta to prev. frequency)
Overall 100 - 16.000 Hz
(±) | linearity of overall sound is average (17.1% difference to median)
Compared to same class
» 46% of all tested devices in this class were better, 12% similar, 43% worse
» The best had a delta of 6%, average was 18%, worst was 132%
Compared to all devices tested
» 31% of all tested devices were better, 8% similar, 61% worse
» The best had a delta of 4%, average was 24%, worst was 134%
能源消耗
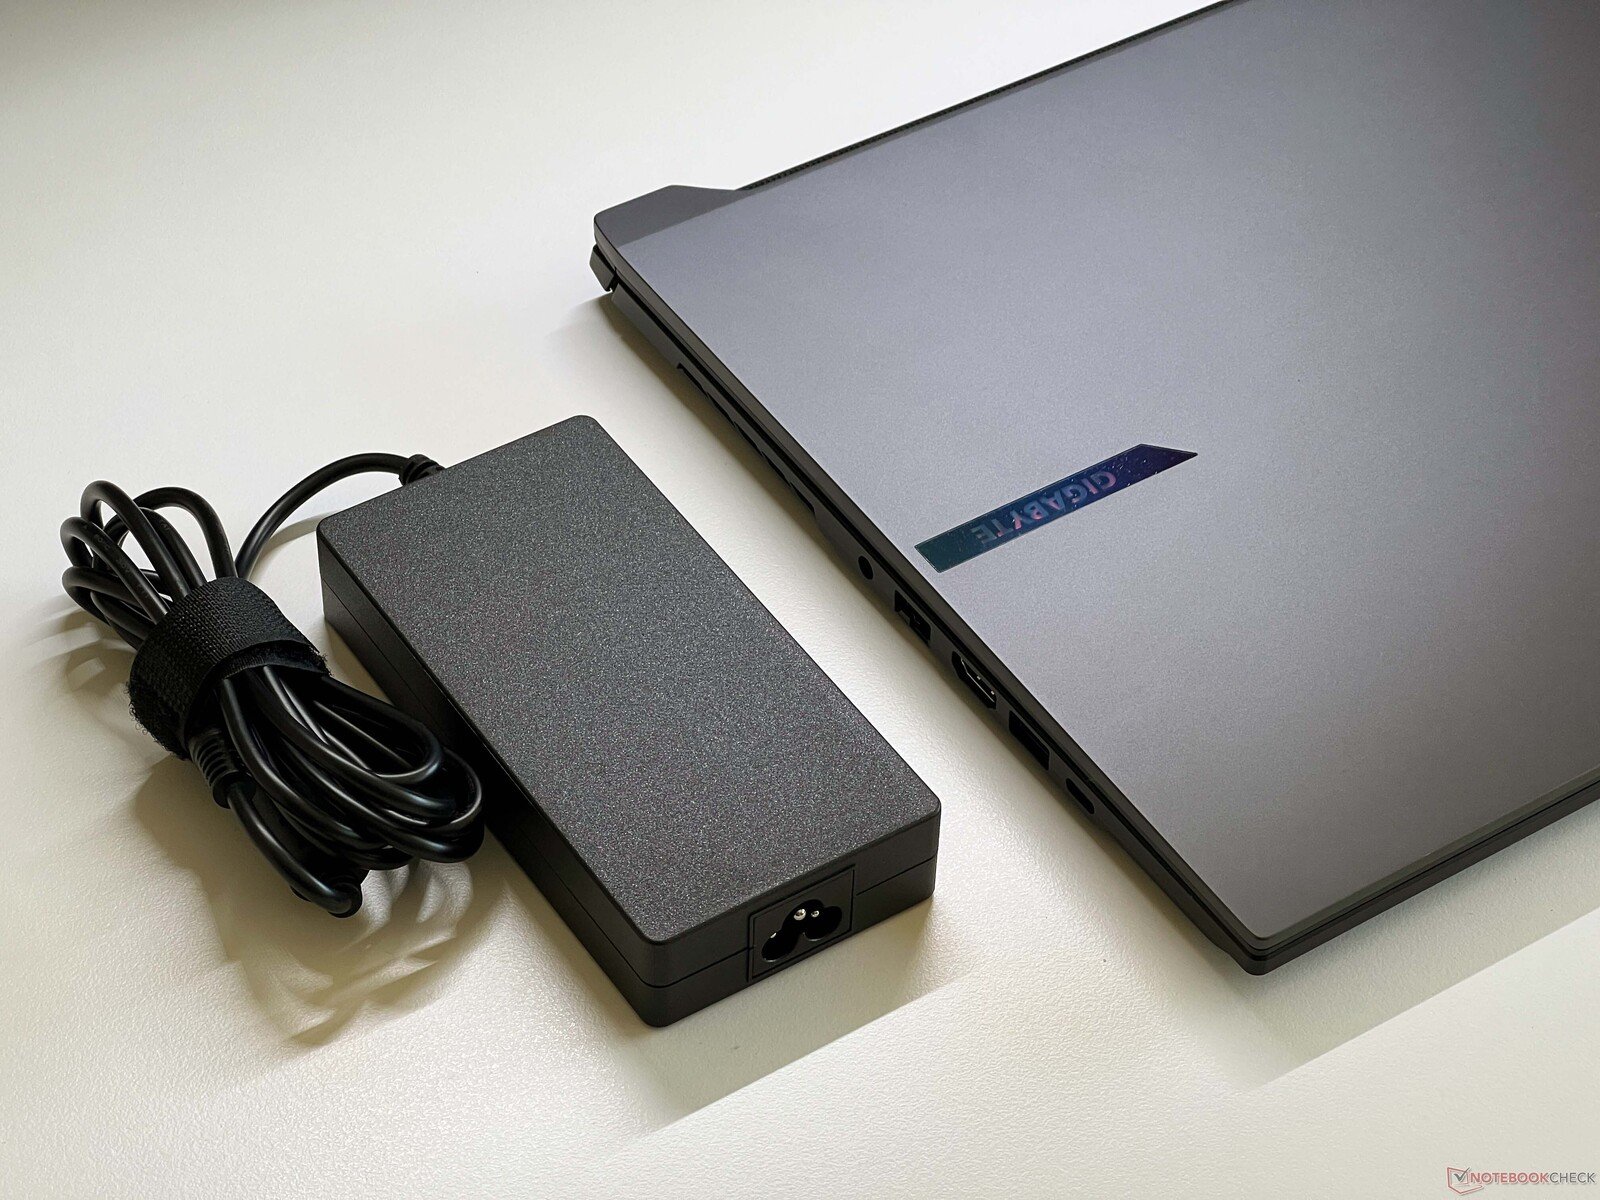
Aero X16 是一款比较经济的设备,空闲模式下的功耗为 11 W。我们的测量结果显示,在压力测试中的最大功耗为 155 W,随后迅速降至 127 W。
在玩游戏时,笔记本电脑的功耗约为 120 W,因此所提供的 150 W 紧凑型电源装置可以保证笔记本电脑有足够的电力供应。
| Off / Standby | |
| Idle | |
| Load |
|
Key:
min: | |
| Gigabyte Aero X16 1WH Ryzen AI 7 350, GeForce RTX 5070 Laptop, Kingston OM8PGP41024Q-A0, IPS, 2560x1600, 16" | Asus TUF Gaming A16 FA608WV Ryzen AI 9 HX 370, GeForce RTX 4060 Laptop GPU, Micron 2400 MTFDKBA1T0QFM, IPS, 1920x1200, 16" | Lenovo Yoga Pro 9 16IMH9 Ultra 9 185H, GeForce RTX 4070 Laptop GPU, SK Hynix HFS001TEJ9X115N, Mini-LED, 3200x2000, 16" | Dell XPS 16 9640 Ultra 7 155H, GeForce RTX 4070 Laptop GPU, Kioxia XG8 KXG80ZNV1T02, OLED, 3840x2400, 16.3" | Asus ROG Zephyrus G16 2024 GU605M Ultra 7 155H, GeForce RTX 4070 Laptop GPU, WD PC SN560 SDDPNQE-1T00, OLED, 2560x1600, 16" | Schenker XMG CORE 16 (L23) R7 7840HS, GeForce RTX 4070 Laptop GPU, Samsung 990 Pro 1 TB, IPS, 2560x1600, 16" | |
|---|---|---|---|---|---|---|
| Power Consumption | -18% | -59% | 1% | -12% | -44% | |
| Idle Minimum * (Watt) | 5.8 | 6.8 -17% | 10.3 -78% | 7.7 -33% | 8.3 -43% | 11 -90% |
| Idle Average * (Watt) | 10.9 | 12.7 -17% | 21.9 -101% | 10.3 6% | 12.5 -15% | 15.2 -39% |
| Idle Maximum * (Watt) | 11.2 | 15.2 -36% | 22.4 -100% | 10.6 5% | 12.8 -14% | 16 -43% |
| Load Average * (Watt) | 91.3 | 85 7% | 96.9 -6% | 76.5 16% | 71.3 22% | 64 30% |
| Cyberpunk 2077 ultra external monitor * (Watt) | 117.9 | 143 -21% | ||||
| Cyberpunk 2077 ultra * (Watt) | 123.8 | 145 -17% | ||||
| Load Maximum * (Watt) | 155.3 | 199 -28% | 173.8 -12% | 138.5 11% | 169.1 -9% | 280 -80% |
| Witcher 3 ultra * (Watt) | 159.6 | 126.4 | 127.5 | 179 |
* ... smaller is better
Power consumption: Cyberpunk 2077 / Stress test
Power consumption: External monitor
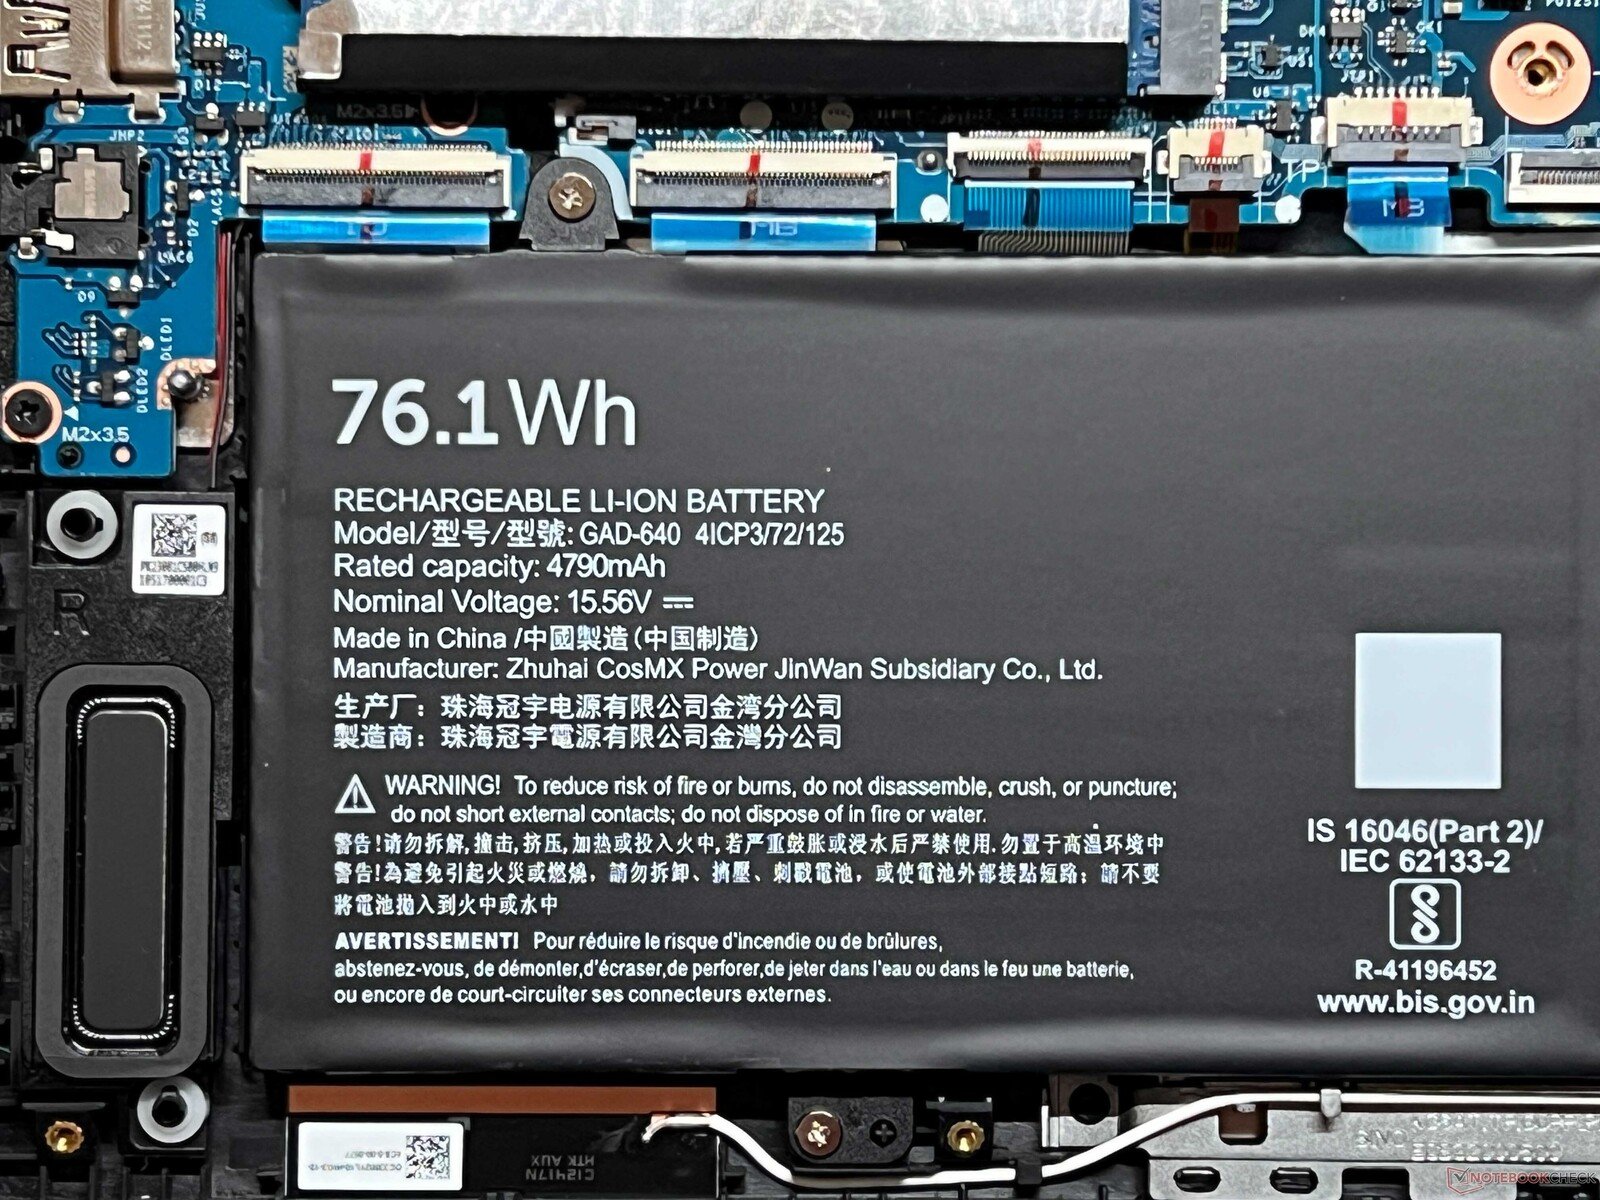
电池寿命
对于一款 16 英寸设备来说,76 Whr 的电池容量相对较小,因此电池续航时间也只能算一般。我们的标准 WLAN 测试在亮度为 150 cd/m² 时可使用 8.5 小时,而在全亮度时仅可使用不到 6.5 小时。
在设备打开的情况下,充满电需要 94 分钟,45 分钟后可充满 80%的电量。
Notebookcheck 总体评分
技嘉 Aero X16 是一款性能全面的中端游戏笔记本电脑,规格相当不错,但配备 8 GB VRAM 的 RTX 5070 笔记本电脑 GPU 在 QHD 最大设置下很快就会成为现代 AAA 游戏的限制因素。
Gigabyte Aero X16 1WH
- 05/21/2025 v8
Andreas Osthoff
 Total Sustainability Score:
 Potential competitors in comparison
Image | Model / Review | Price | Weight | Height | Display |
|---|---|---|---|---|---|
1. 83.7%  | Gigabyte Aero X16 1WH AMD Ryzen AI 7 350 ⎘ NVIDIA GeForce RTX 5070 Laptop ⎘ 32 GB Memory, 1024 GB SSD | Amazon: List Price: 1799€ | 2 kg | 19.9 mm | 16.00" 2560x1600 189 PPI IPS |
2. 83%  | Asus TUF Gaming A16 FA608WV AMD Ryzen AI 9 HX 370 ⎘ NVIDIA GeForce RTX 4060 Laptop GPU ⎘ 16 GB Memory, 1024 GB SSD | Amazon: List Price: 1399 Euro | 2.2 kg | 25.7 mm | 16.00" 1920x1200 142 PPI IPS |
3. 88.7% v7 (old)  | Lenovo Yoga Pro 9 16IMH9 Intel Core Ultra 9 185H ⎘ NVIDIA GeForce RTX 4070 Laptop GPU ⎘ 32 GB Memory, 1024 GB SSD | Amazon: List Price: 2700€ | 2.1 kg | 18.3 mm | 16.00" 3200x2000 236 PPI Mini-LED |
4. 88.6% v7 (old)  | Dell XPS 16 9640 Intel Core Ultra 7 155H ⎘ NVIDIA GeForce RTX 4070 Laptop GPU ⎘ 32 GB Memory, 1024 GB SSD | Amazon: 1. $2,099.99 Dell XPS 16 9640 Laptop | In... 2. $2,199.00 New XPS 16 9640 Business Lap... 3. $2,499.00 Dell XPS 16 9640 16.3" Touch... | 2.3 kg | 18.7 mm | 16.30" 3840x2400 139 PPI OLED |
5. 92.3% v7 (old)  | Asus ROG Zephyrus G16 2024 GU605M Intel Core Ultra 7 155H ⎘ NVIDIA GeForce RTX 4070 Laptop GPU ⎘ 16 GB Memory, 1024 GB SSD | Amazon: List Price: 3000€ | 1.8 kg | 16.4 mm | 16.00" 2560x1600 189 PPI OLED |
6. 89.2% v7 (old)  | Schenker XMG CORE 16 (L23) AMD Ryzen 7 7840HS ⎘ NVIDIA GeForce RTX 4070 Laptop GPU ⎘ 32 GB Memory, 1024 GB SSD | Amazon: 1. $26.00 Laptop GPU Cooling Fan for S... 2. $26.00 Laptop CPU Cooling Fan for S... List Price: 2230 Euro | 2.4 kg | 26.1 mm | 16.00" 2560x1600 189 PPI IPS |
Transparency
The selection of devices to be reviewed is made by our editorial team. The test sample was provided to the author as a loan by the manufacturer or retailer for the purpose of this review. The lender had no influence on this review, nor did the manufacturer receive a copy of this review before publication. There was no obligation to publish this review. As an independent media company, Notebookcheck is not subjected to the authority of manufacturers, retailers or publishers.
This is how Notebookcheck is testing
Every year, Notebookcheck independently reviews hundreds of laptops and smartphones using standardized procedures to ensure that all results are comparable. We have continuously developed our test methods for around 20 years and set industry standards in the process. In our test labs, high-quality measuring equipment is utilized by experienced technicians and editors. These tests involve a multi-stage validation process. Our complex rating system is based on hundreds of well-founded measurements and benchmarks, which maintains objectivity. Further information on our test methods can be found here.
