判决
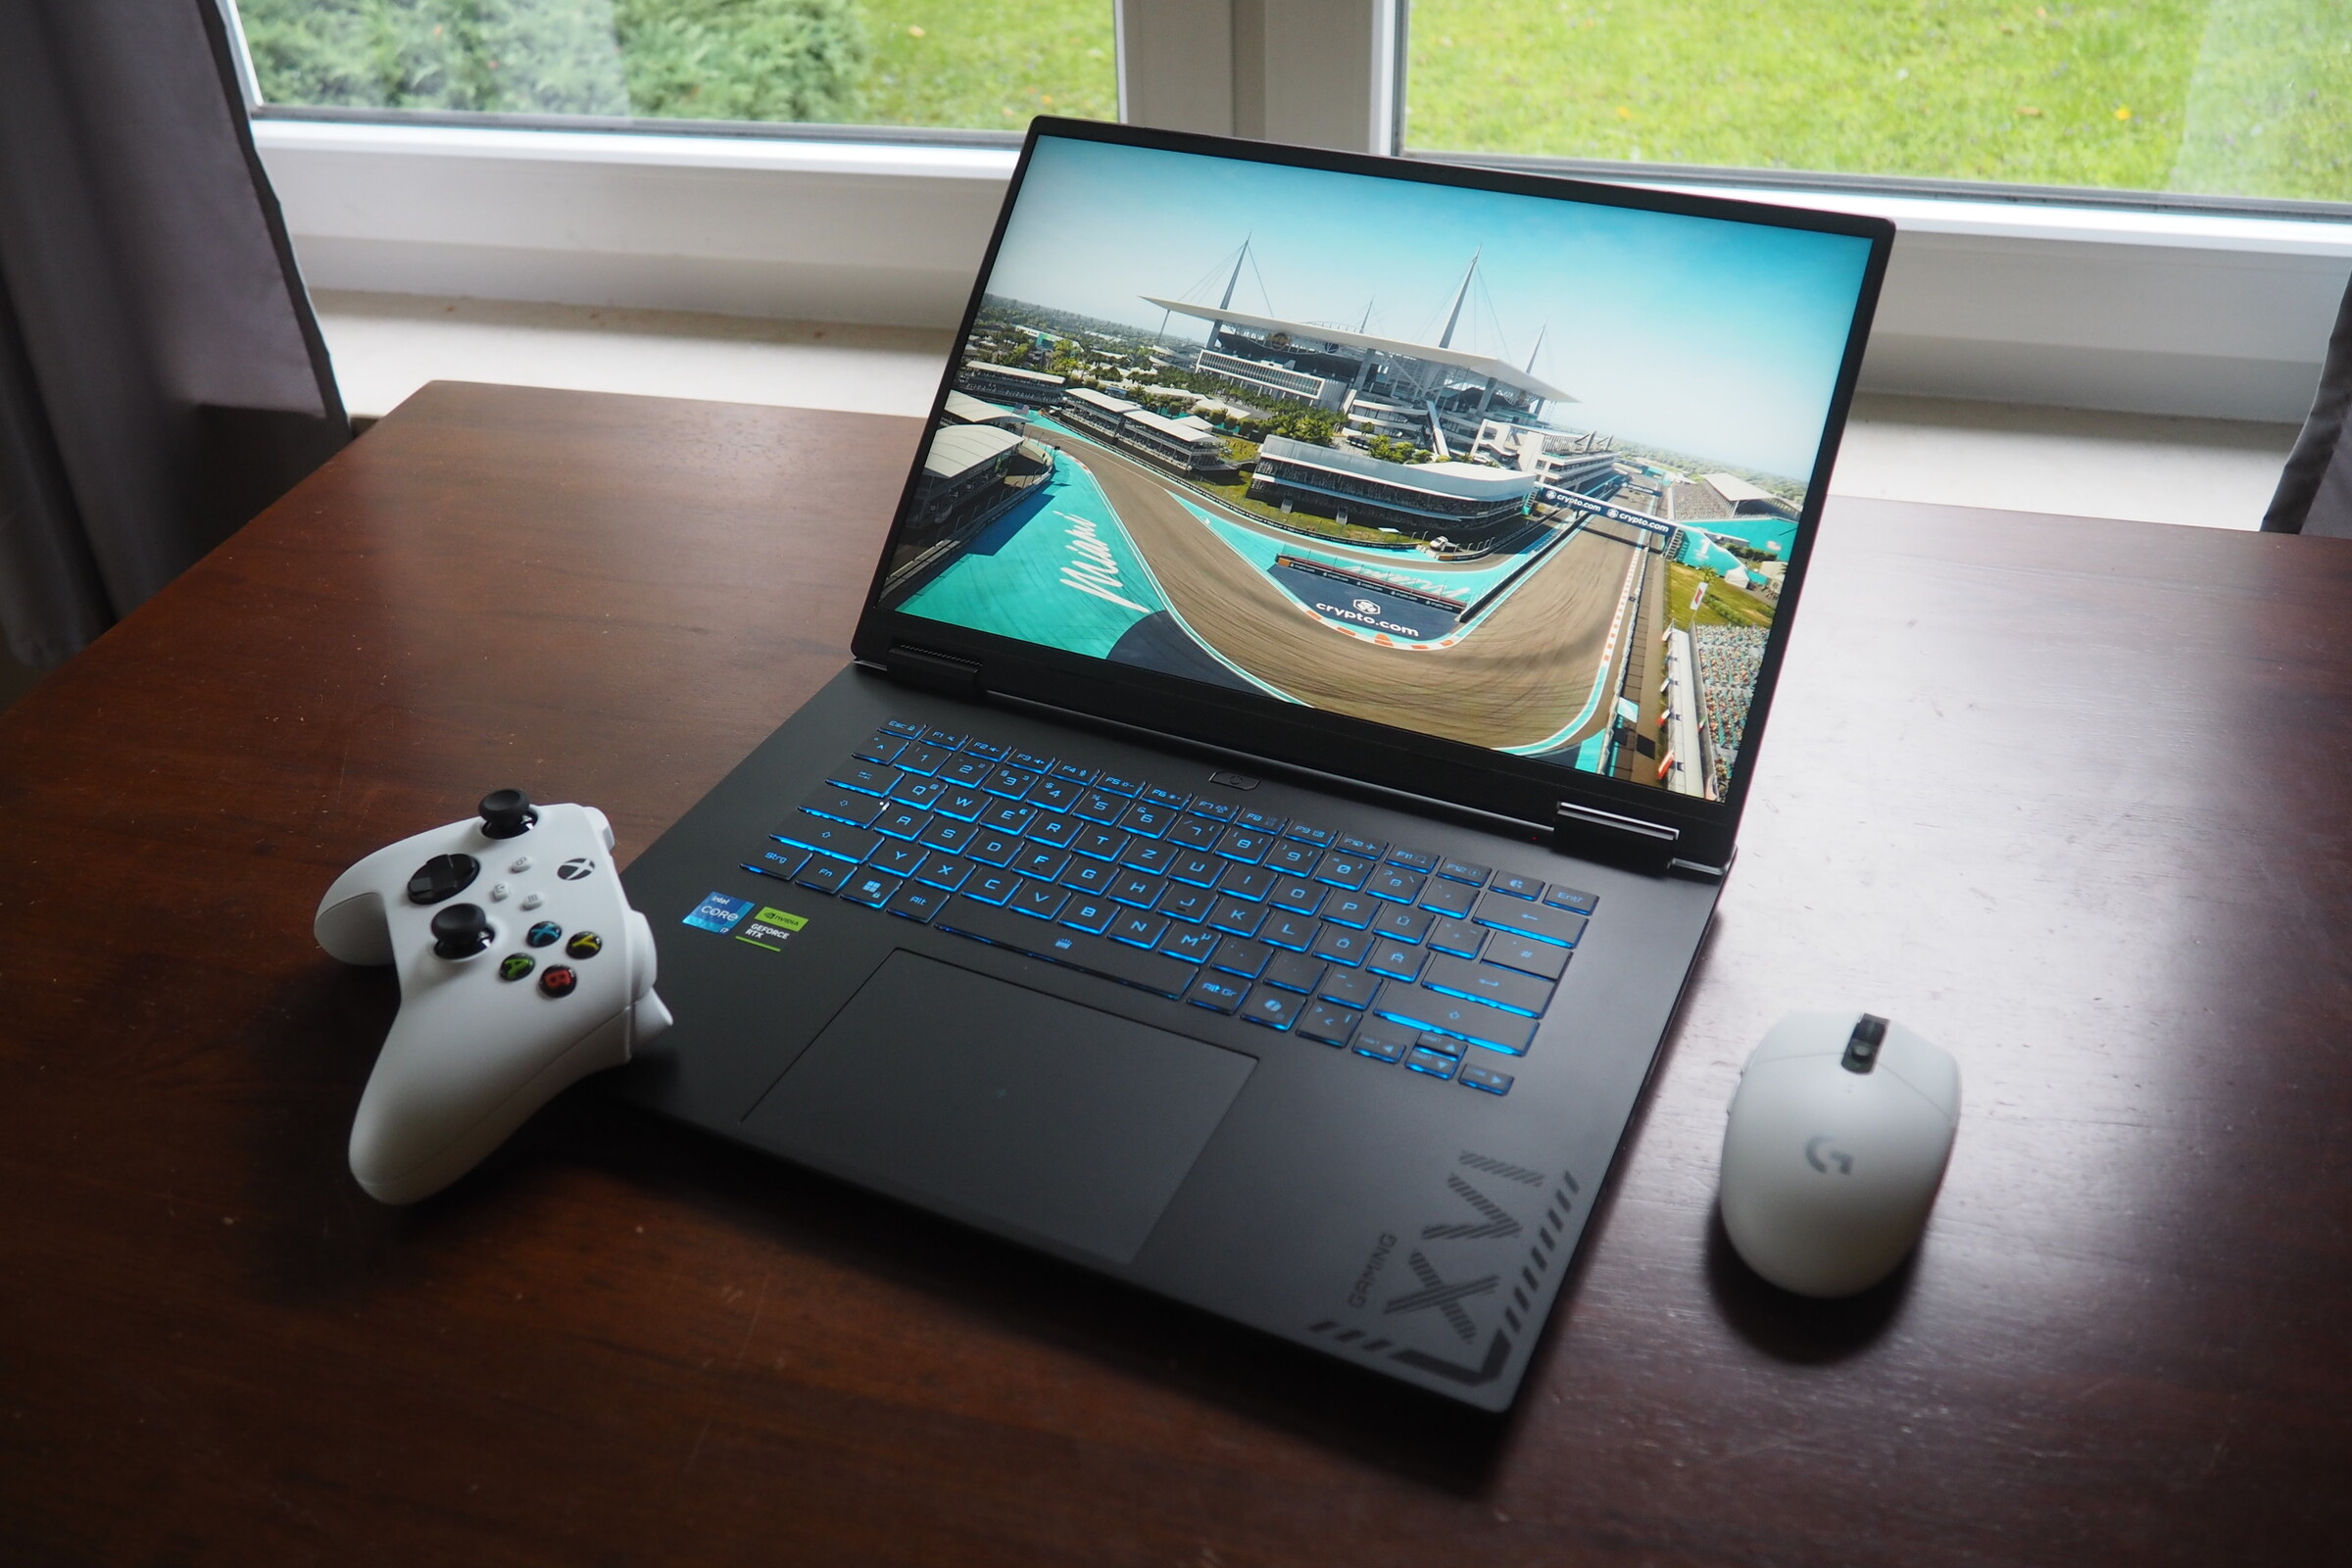
Gaming A16 获得了 80% 的良好综合评分。值得肯定的是,CPU 和 GPU 性能始终如一。虽然从技术上讲,内置的酷睿 i7-13620H 已不再完全是最新的处理器,但猛禽湖处理器仍能轻松满足现代游戏的需求。
除了 8GB 的问题外,GeForce RTX 5070 也取得了不错的成绩,尽管有时你不得不在其原生 QHD+ 分辨率下的更高细节处借助 DLSS 或帧生成。机箱在质量和稳定性方面可以说是非常扎实,但并不是特别突出。输入设备也是如此。
虽然内置的酷睿 i7-13620H 在技术上已不再是完全最新的处理器,但猛禽湖处理器仍可轻松满足现代游戏的需求。
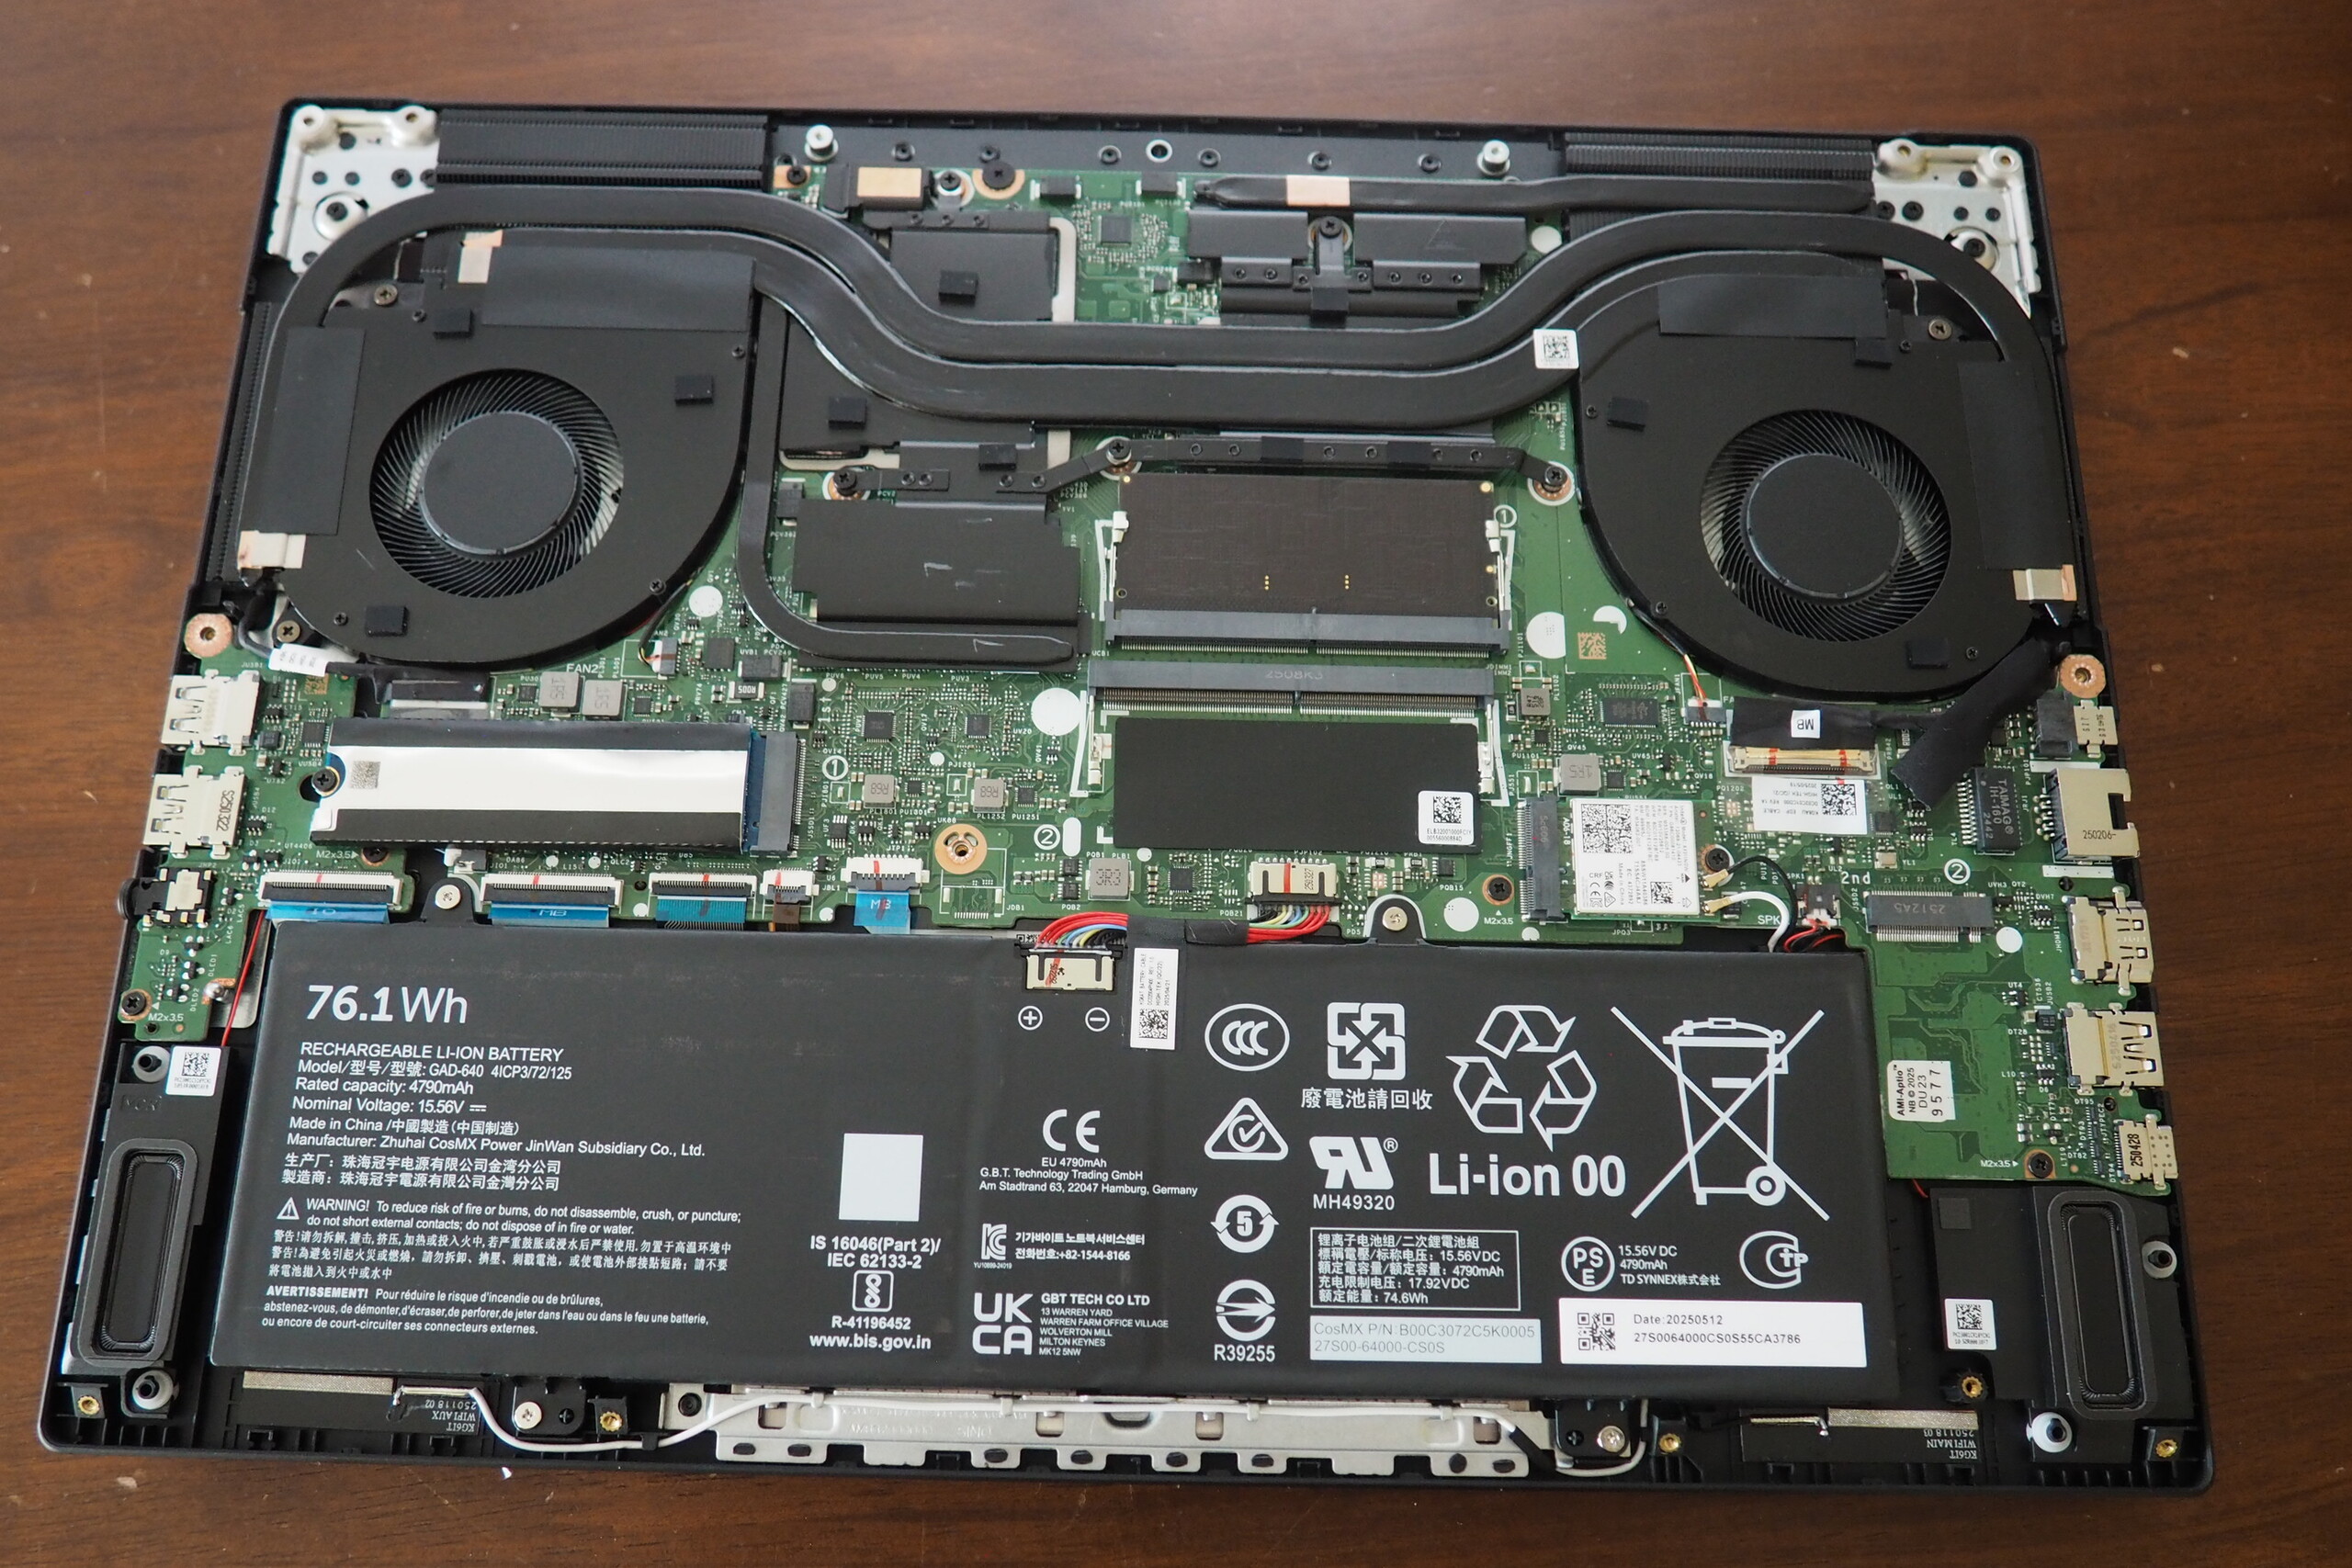
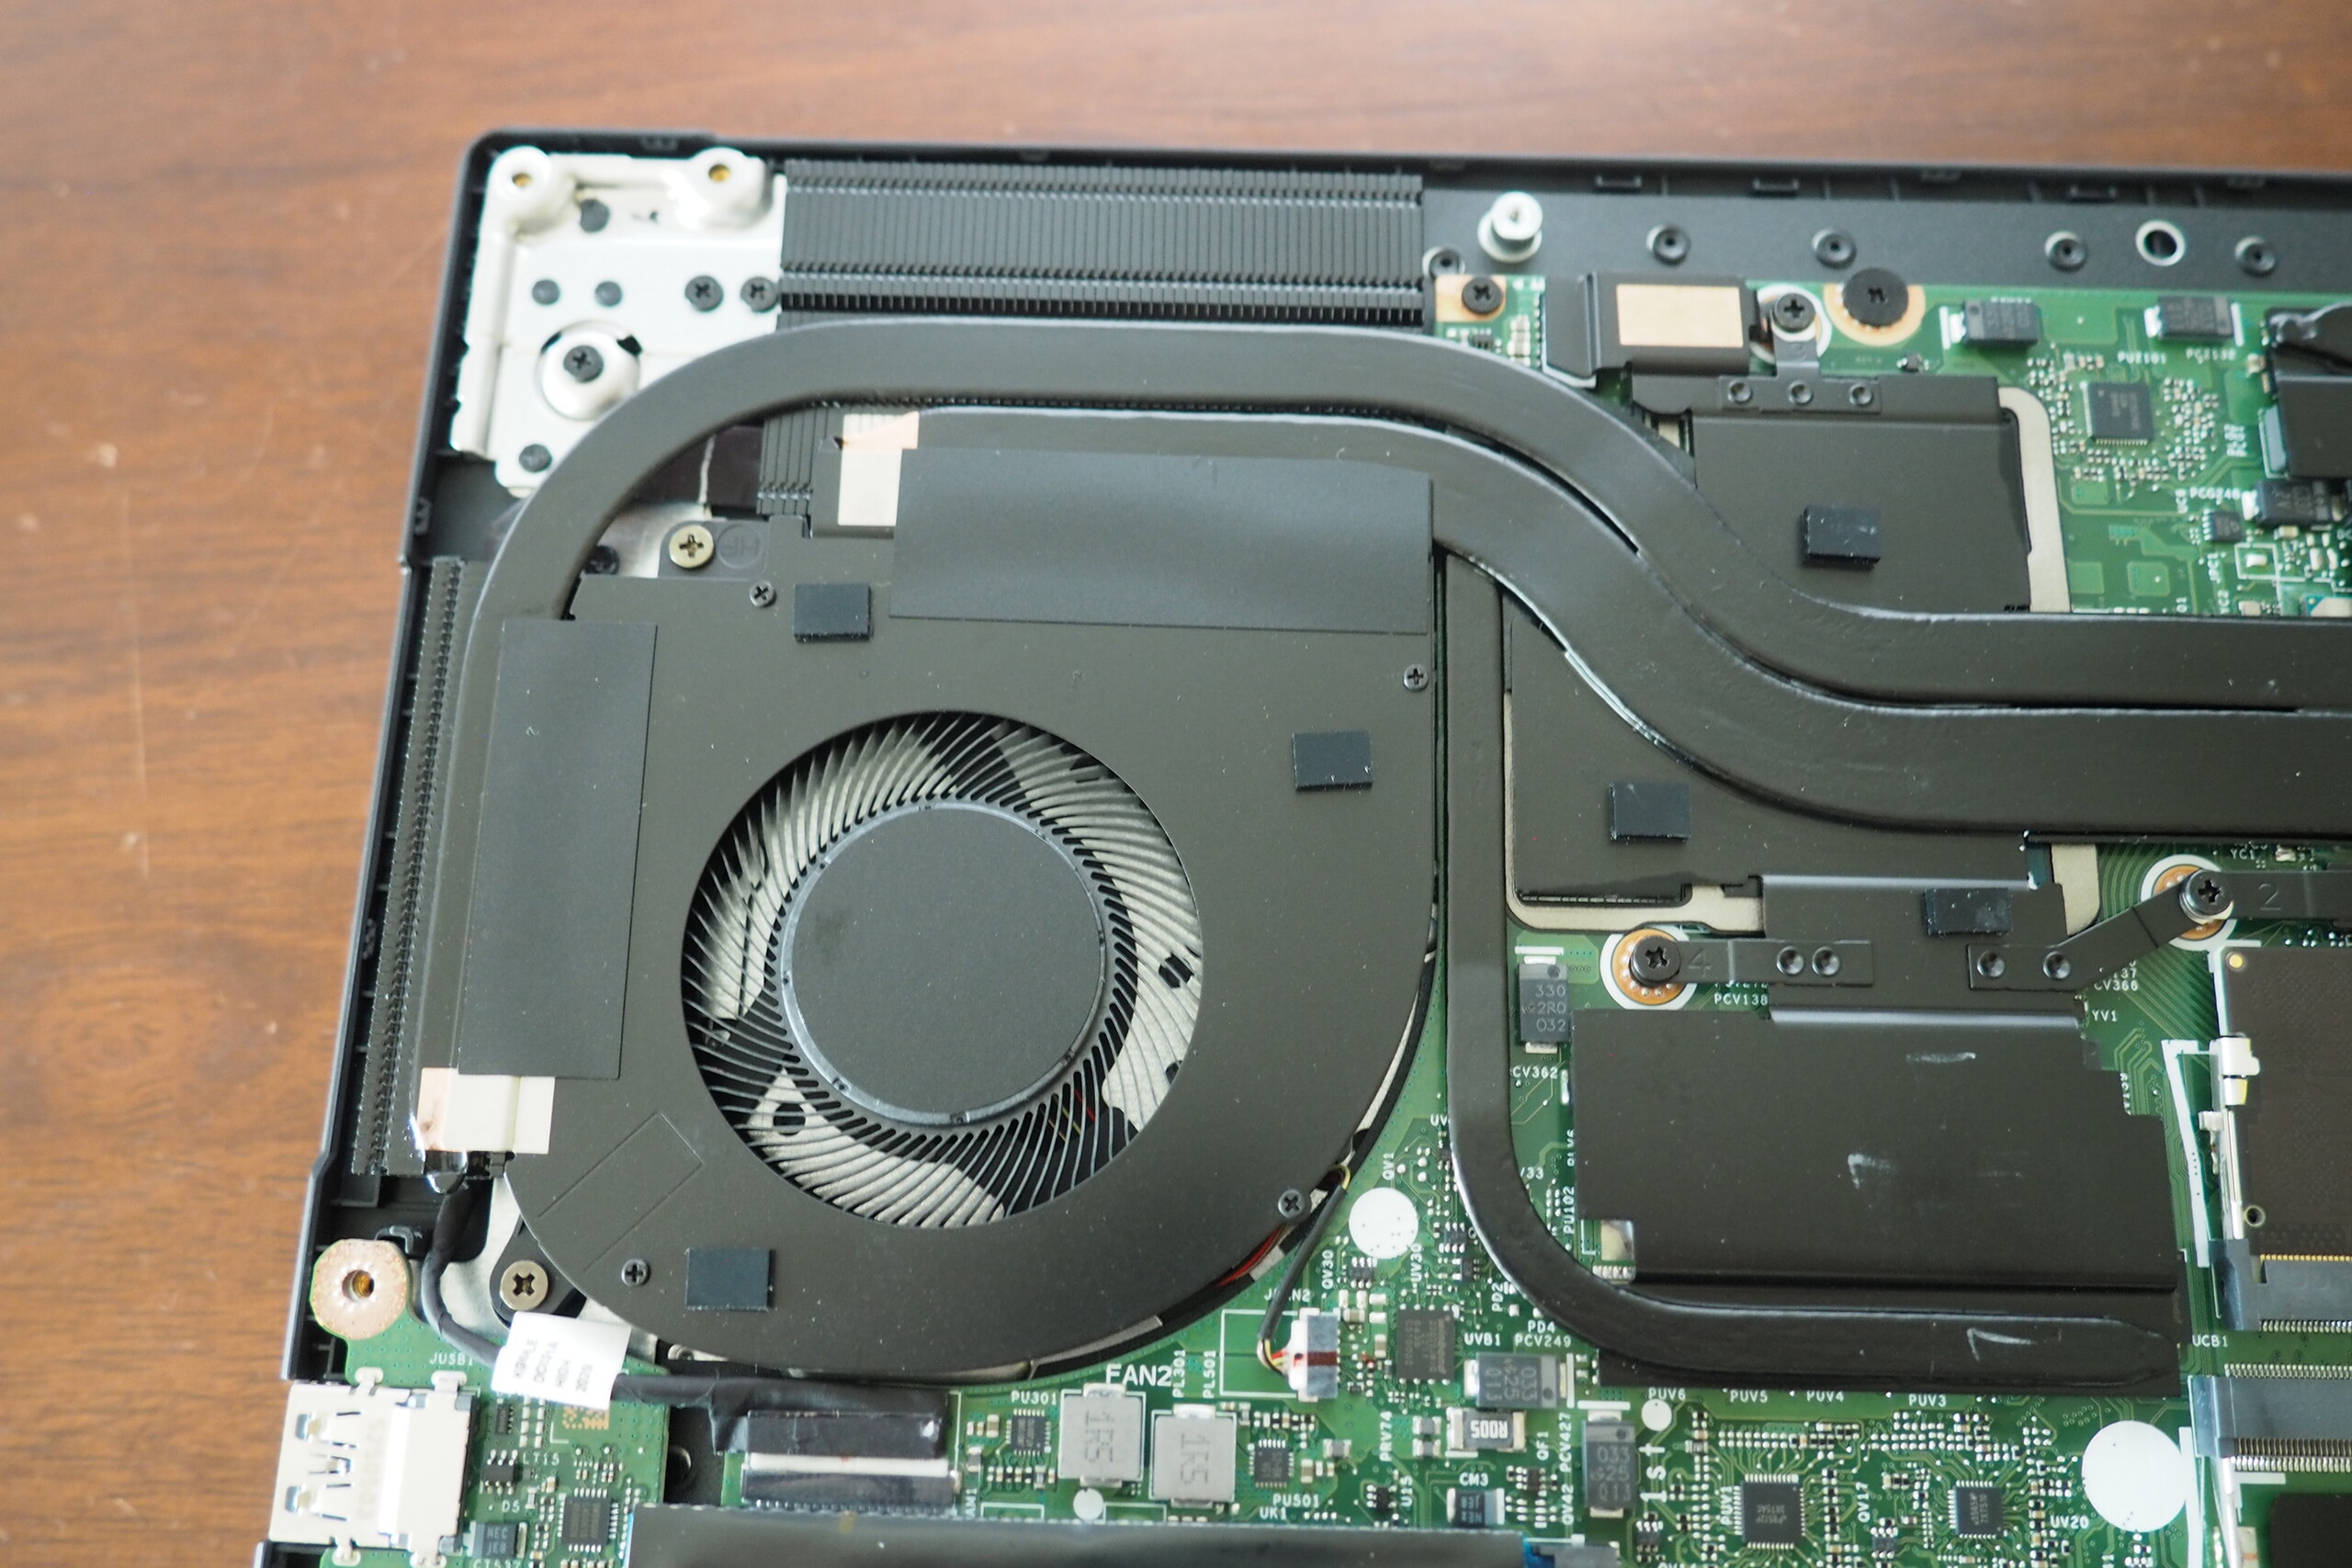
在维护选项方面,Gaming A16 配备了两个 SO-DIMM 插槽和两个 M.2 插槽,其中一个是空闲的。165 Hz IPS 显示屏拥有可用的亮度,在其他方面也没有任何明显的缺陷(除了边缘有明显的屏幕出血)。电池续航时间和音效也不错。技嘉可以改进固态硬盘冷却系统,因为内置的 1 TB 硬盘在长时间使用时性能会受到影响。正如我们在游戏模式测试中强调的那样,该设备在负载情况下也会变得非常嘈杂,这与大多数游戏笔记本电脑类似。
Pros
Cons
竞争者包括 Aero X16和 微星卡塔纳 17 HX(都拥有 RTX 5070)、联想 联想 LOQ 15(RTX 5060)和 微星 Vector 17 HX AI以及 Medion Erazer Major 16 X1(均搭载了 RTX 5070 Ti),所有这些都被列为表格中的对比设备。
规格
案例
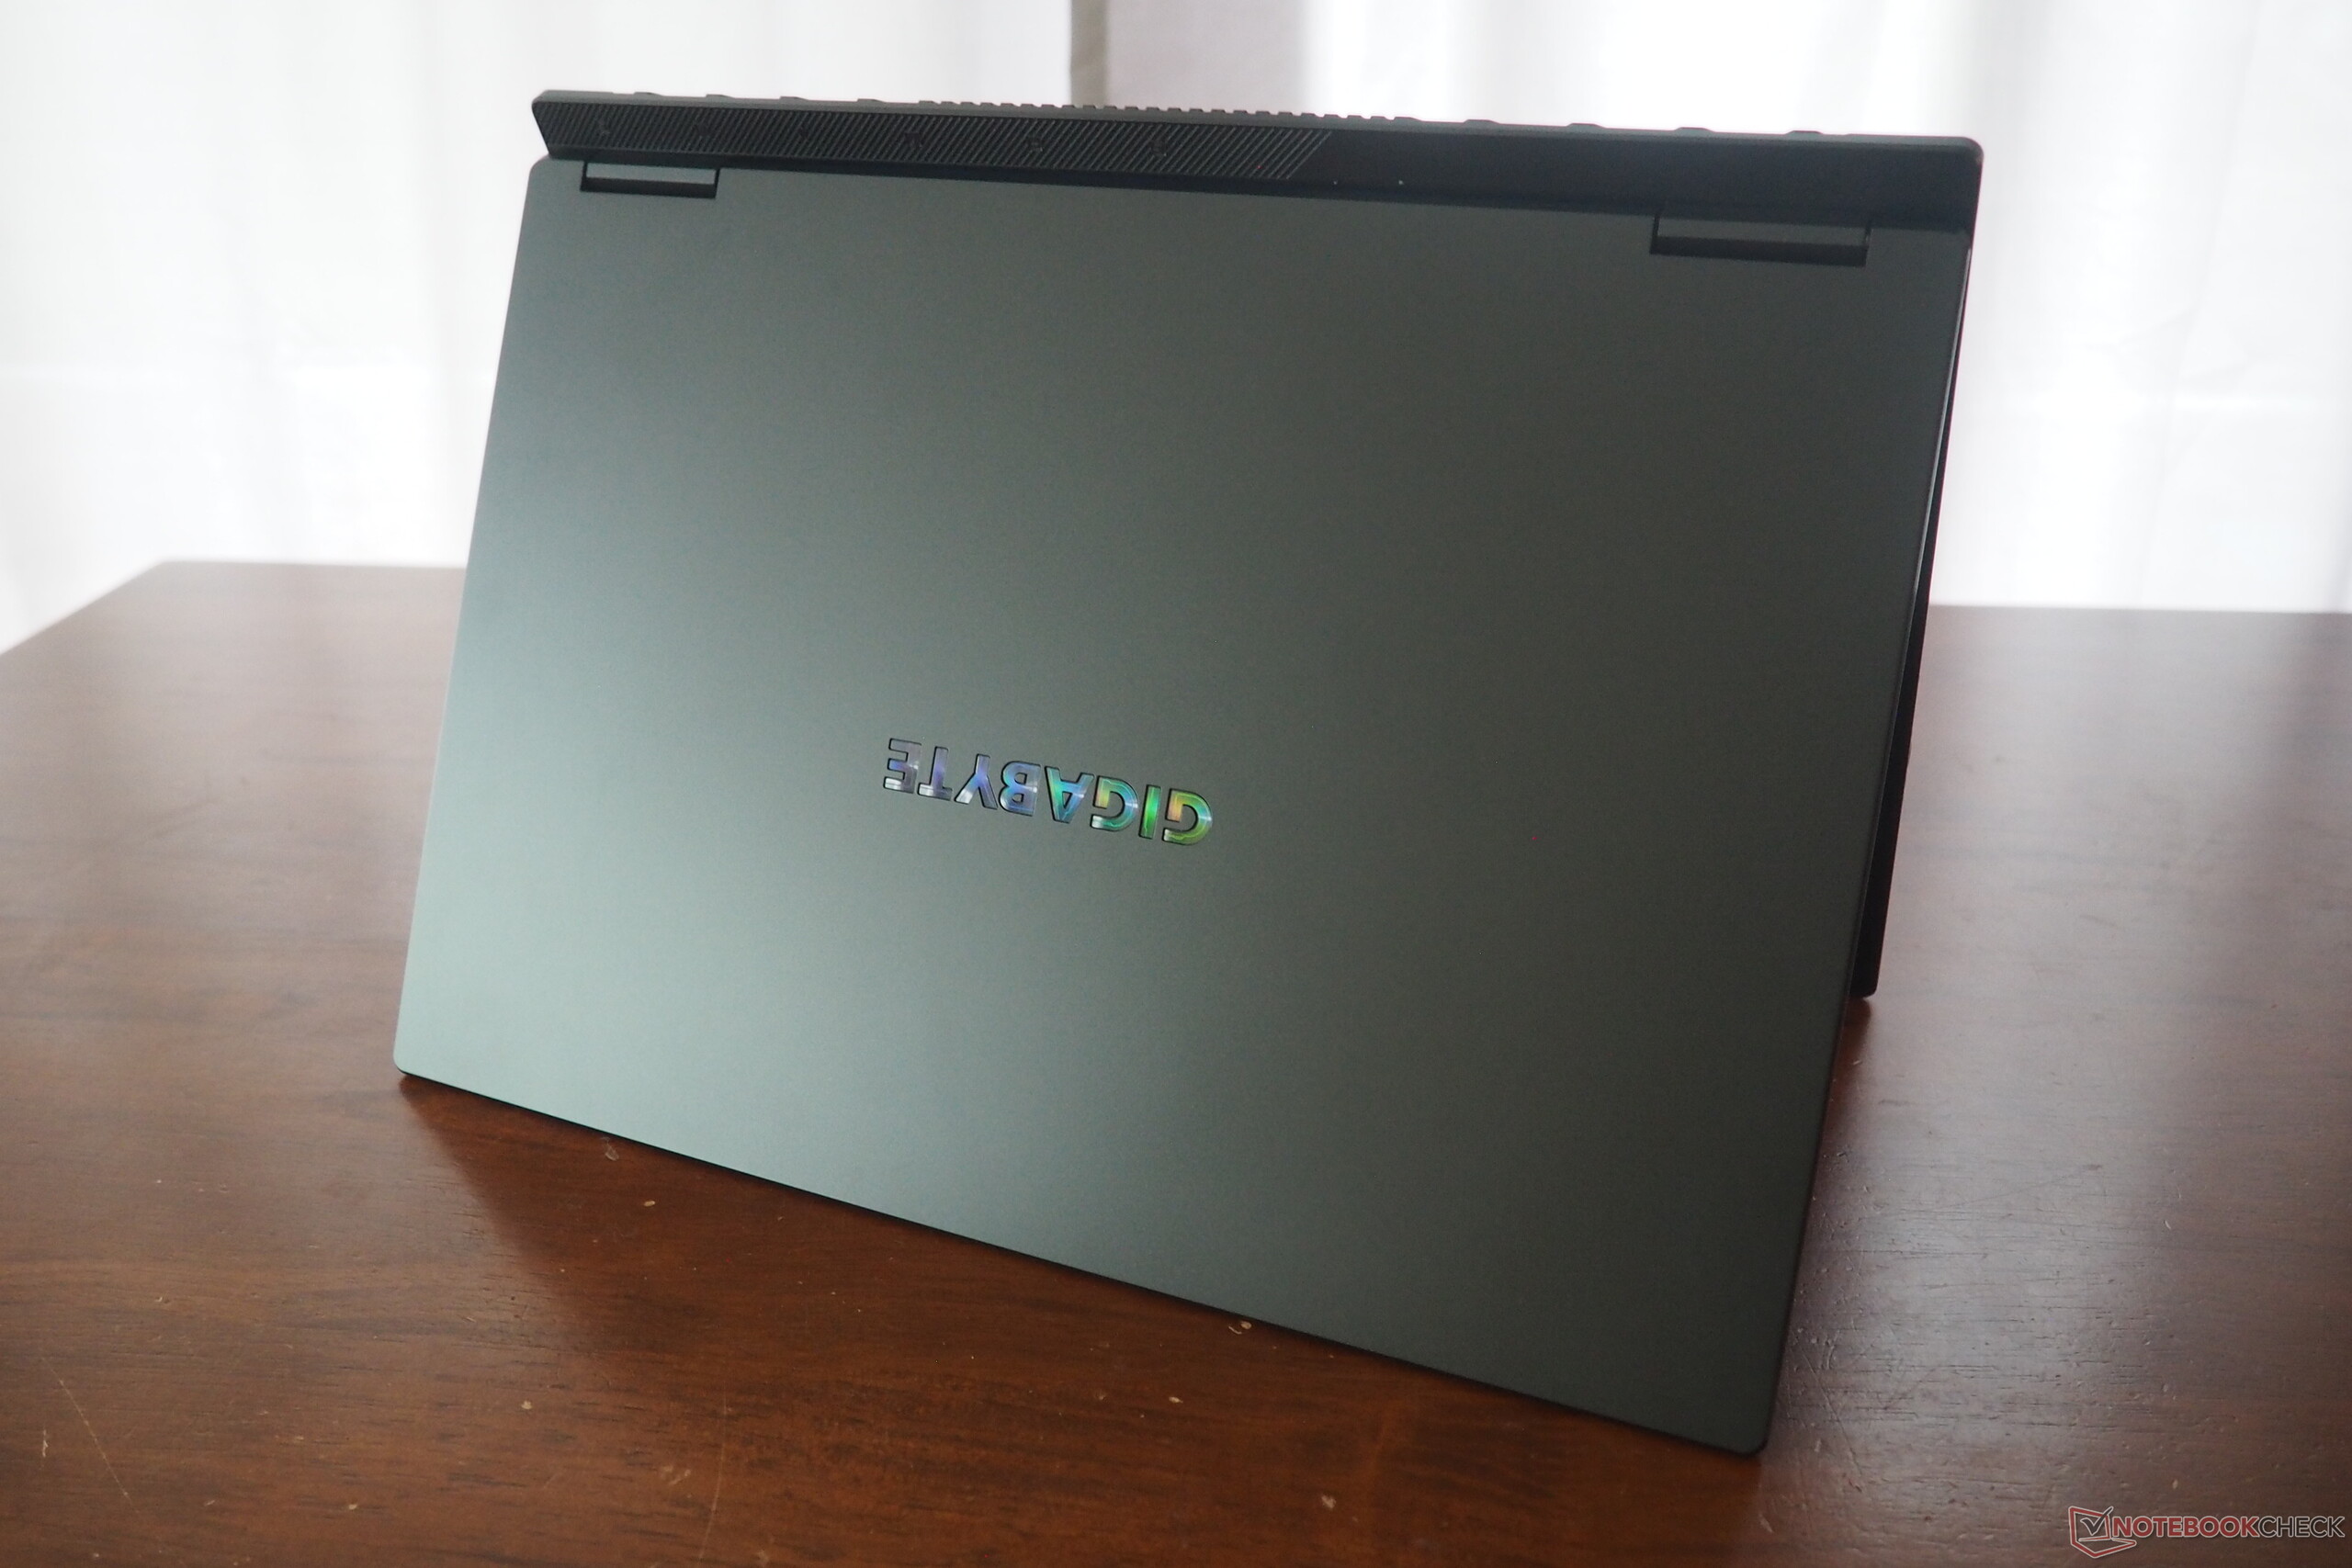
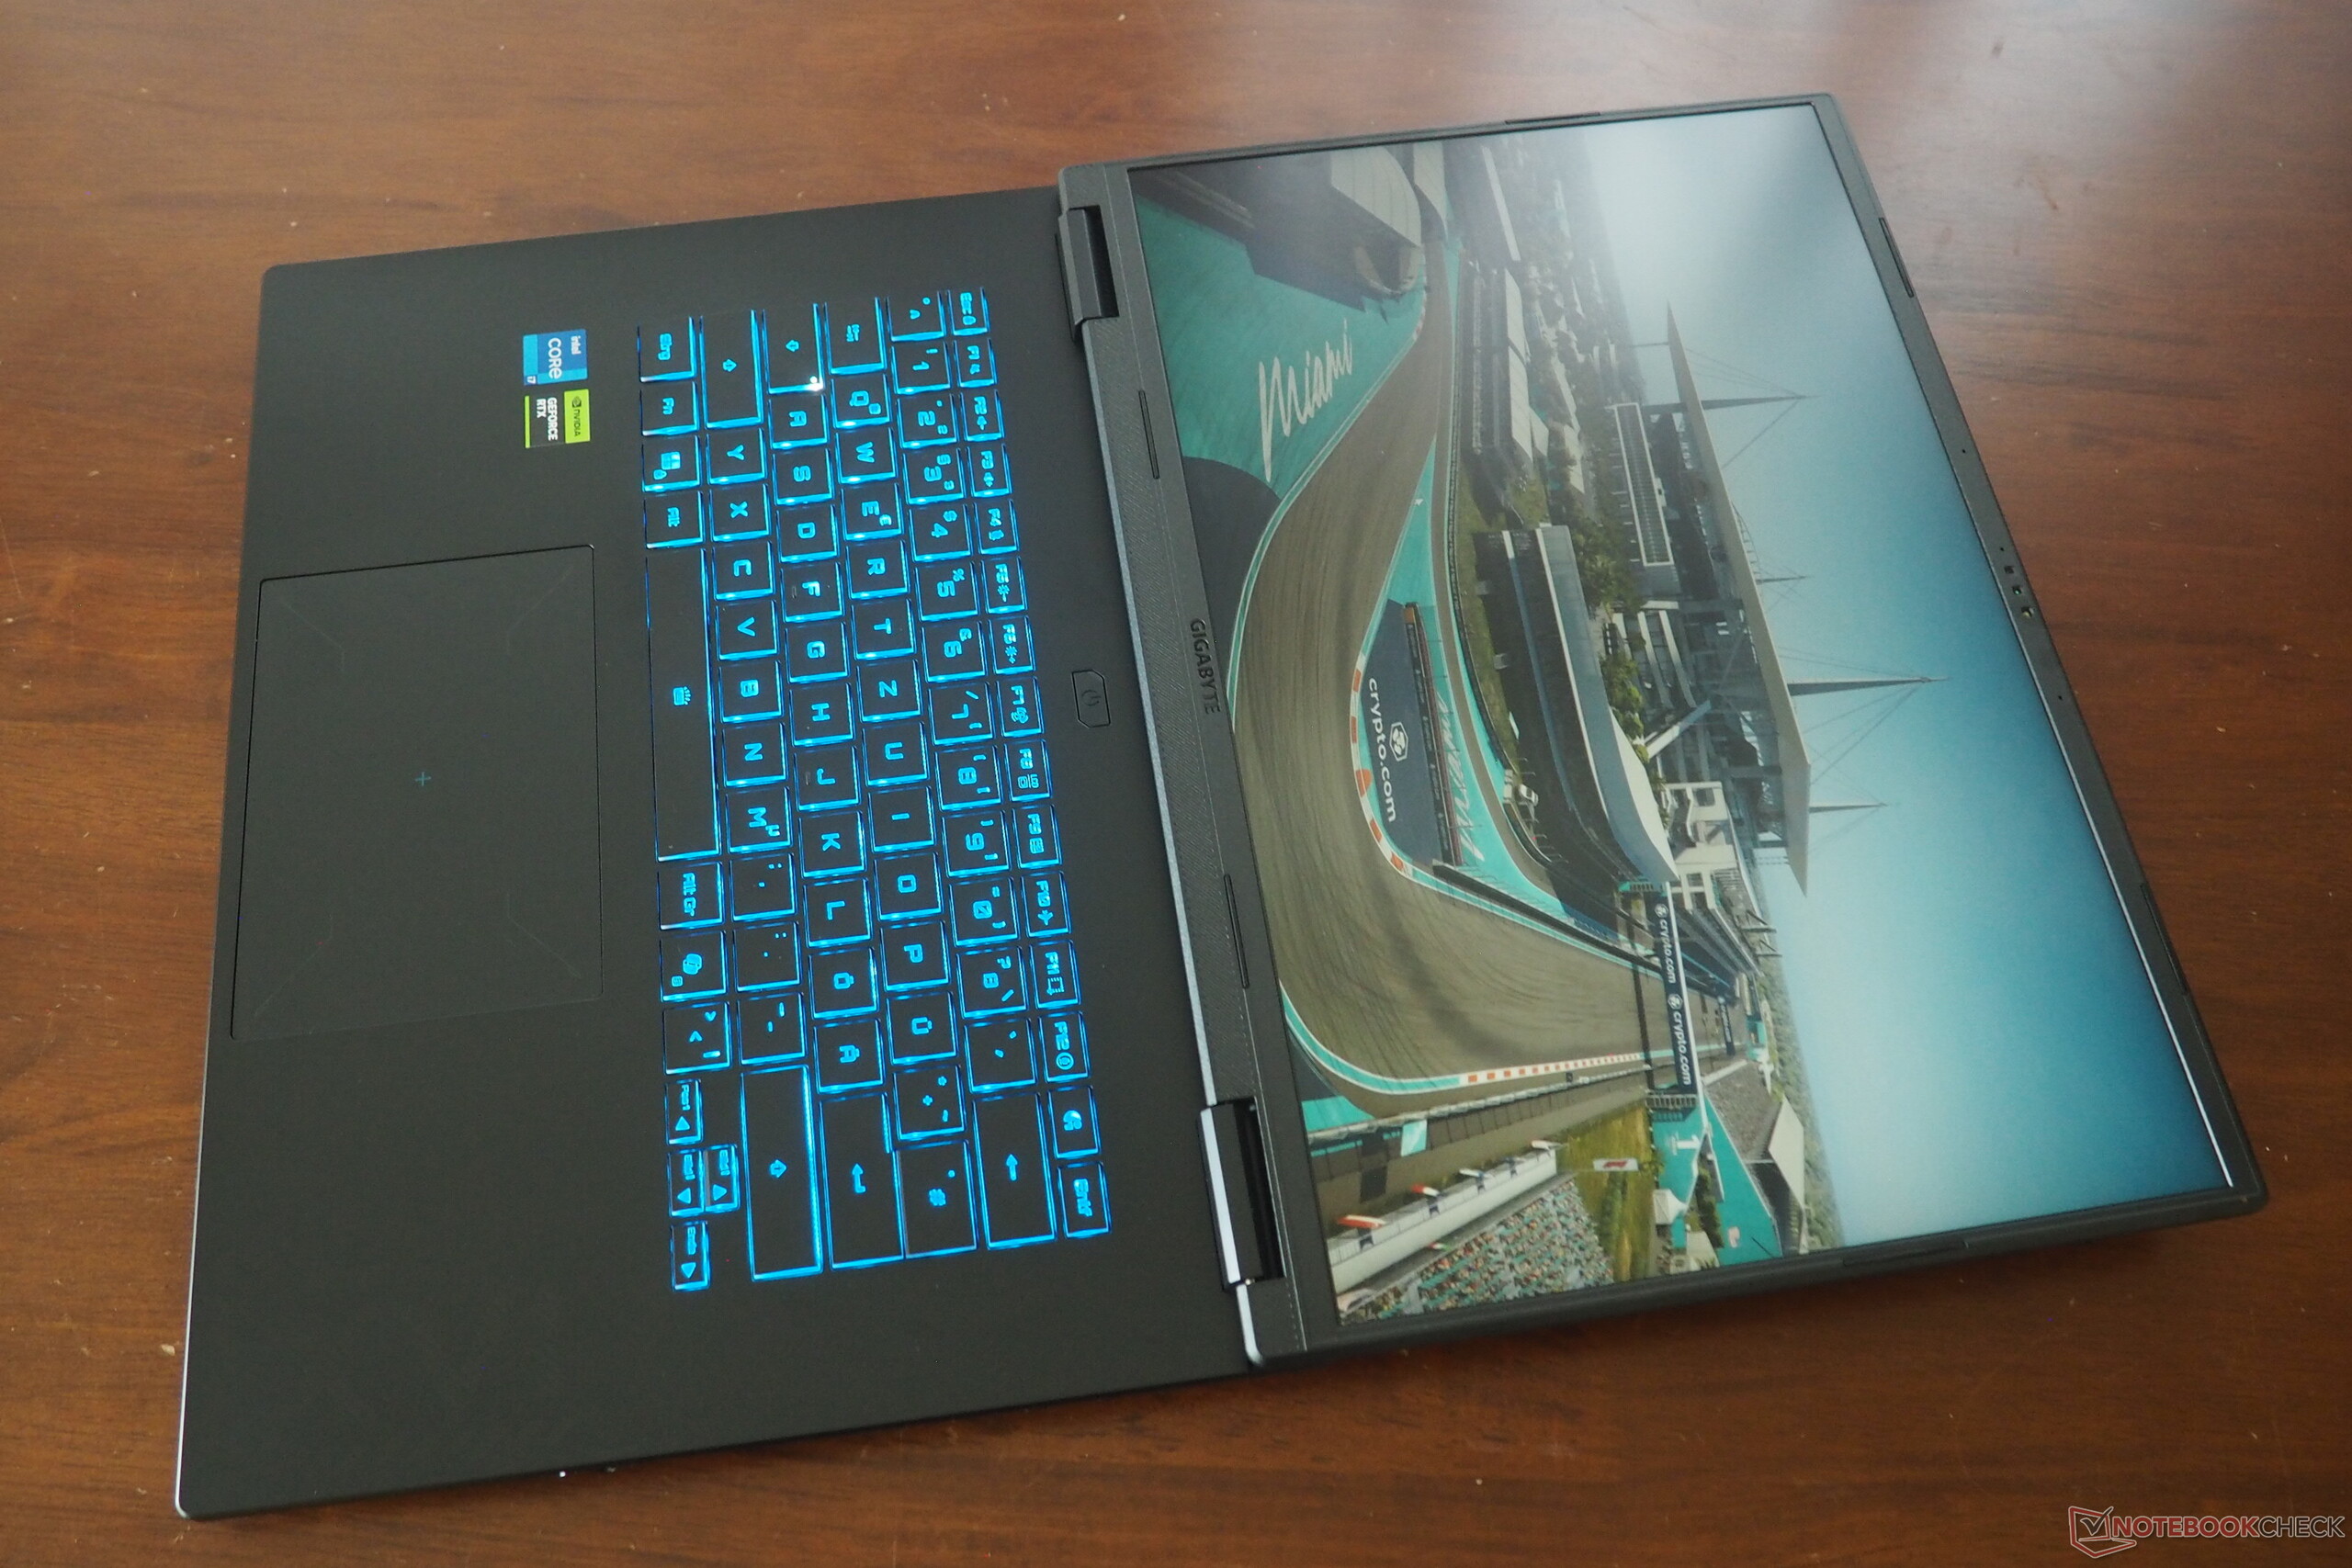
技嘉选择了塑料作为外壳材料,因此手感平庸,这一点不足为奇。不过,其稳定性并不逊色于竞争对手。在大多数地方,机箱即使在重压下也几乎不会变形。GAMING A16 的亮点之一是其宽敞的 180° 开启角度,这在游戏笔记本电脑中并不多见。机身设计时不时会有一些俏皮的元素(尤其是在机箱底部),但总体而言,这款 16 英寸机型给人的印象还是相当低调和稳重。
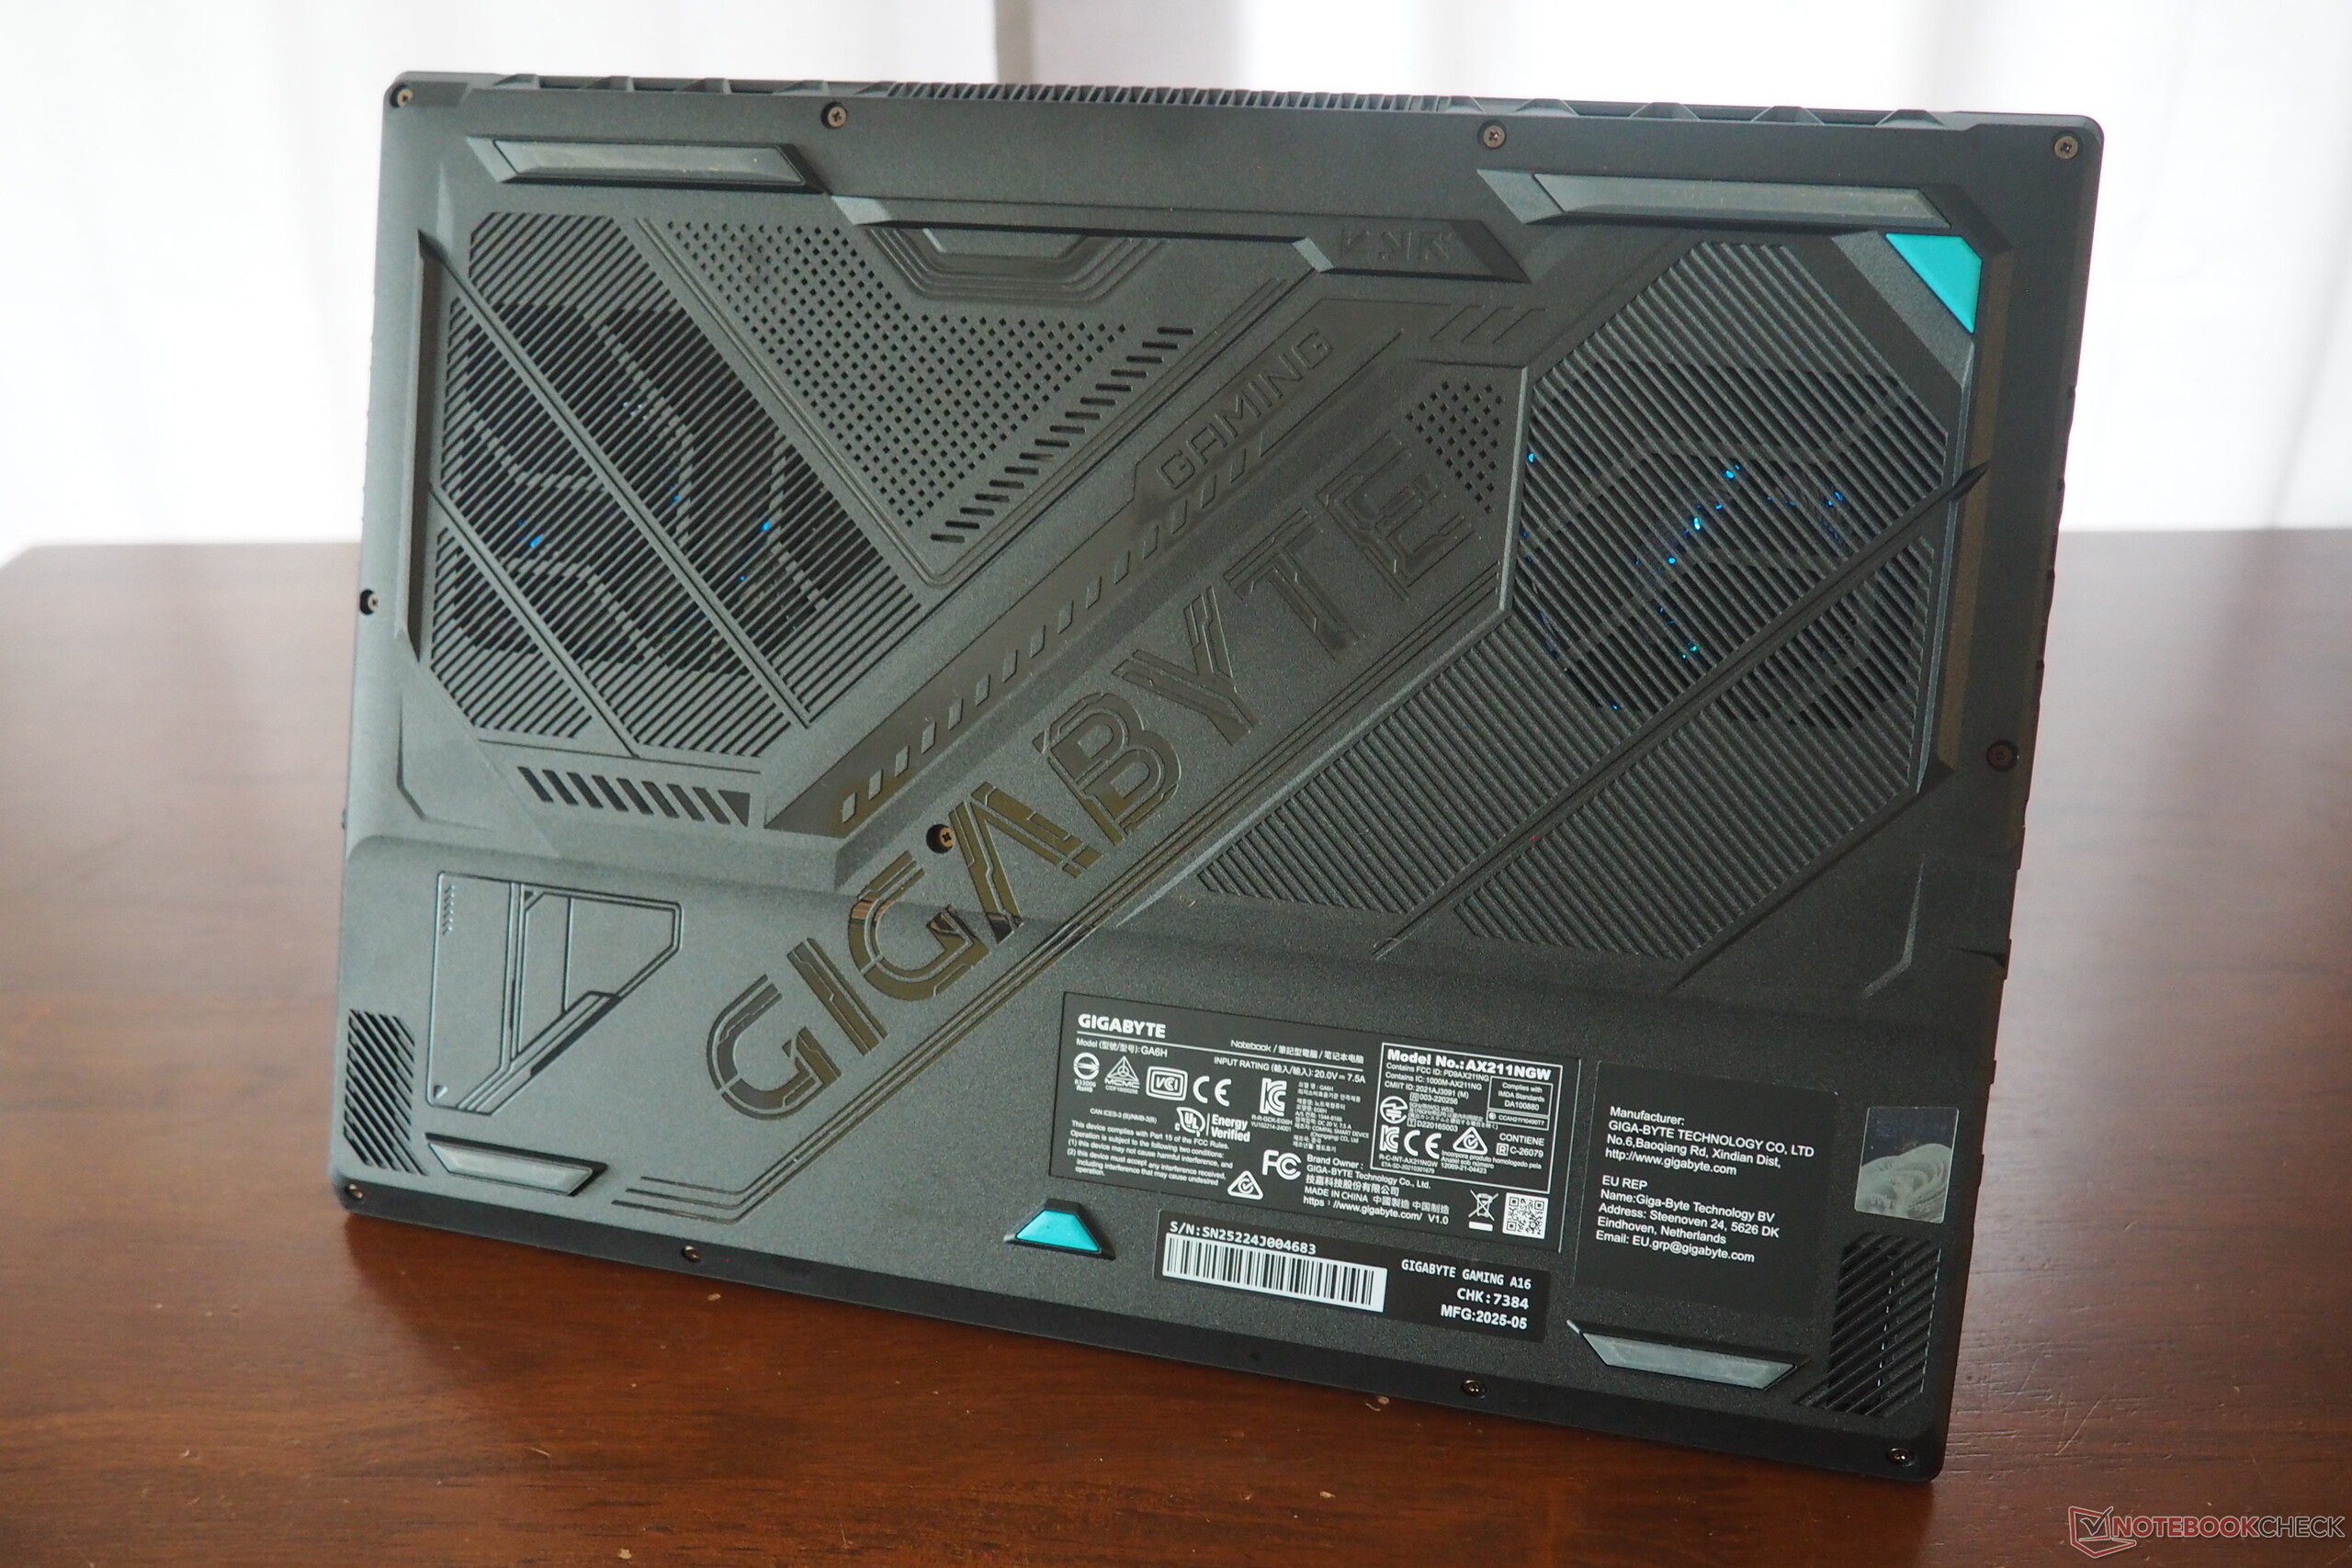
该设备重约 2.3 千克,也比重量在 2.4 至 2.7 千克之间的竞争对手略轻。由于高度仅为 2.3 厘米,机身也显得相对较薄。
特点
接口
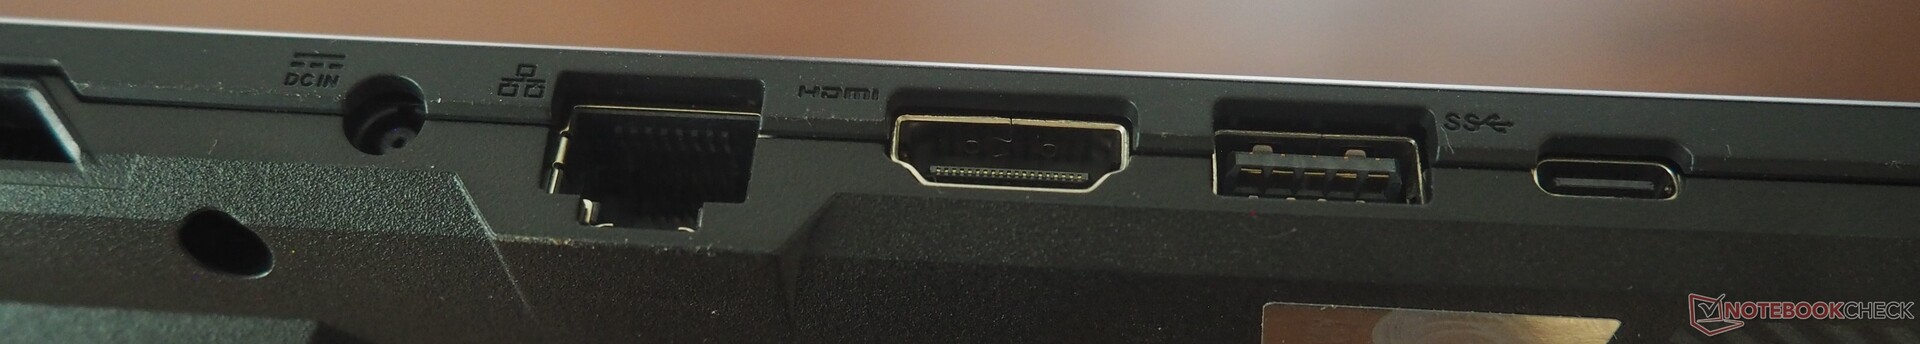
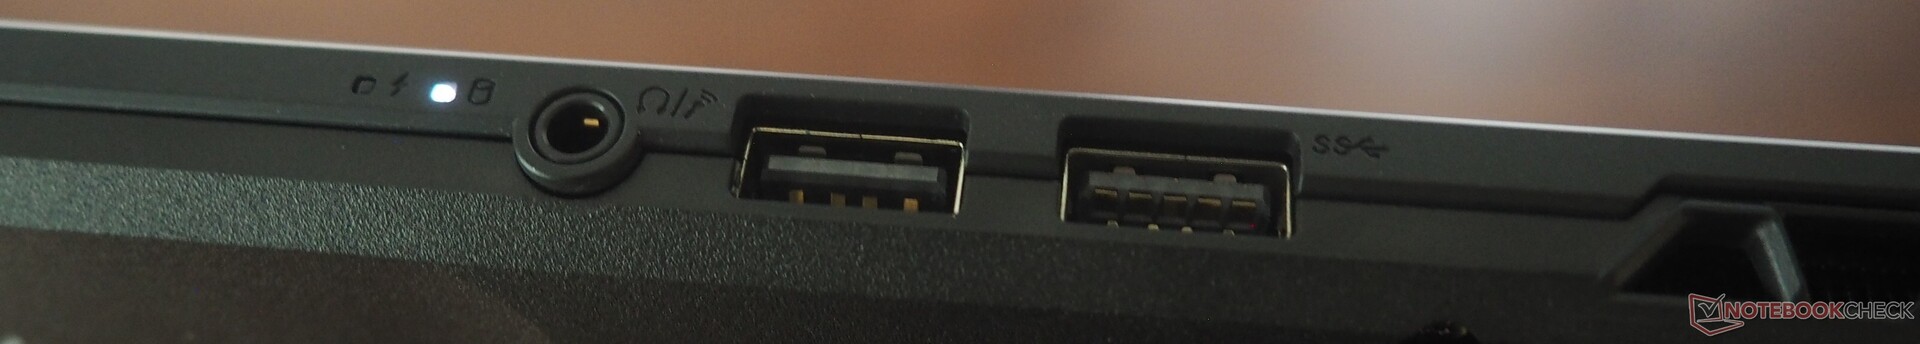
技嘉为其游戏笔记本电脑配备了四个 USB 端口,其中只有一个是 Type-C。可通过 USB-C(DisplayPort 1.4)和 HDMI 2.1 进行视频输出。此外,还有一个千兆 LAN 端口和一个音频插孔,但没有读卡器,买家只能将就了。
交流
在测试过程中,无线模块没有出现任何问题。英特尔 Wi-Fi 6E AX211 的发射和接收性能都相当出色。
网络摄像头
作为一款笔记本电脑,全高清网络摄像头的图像清晰度尚可,但缺少隐私快门。


配件
笔记本电脑附带了一些信息宣传单和一个相当小巧的 150 瓦电源。
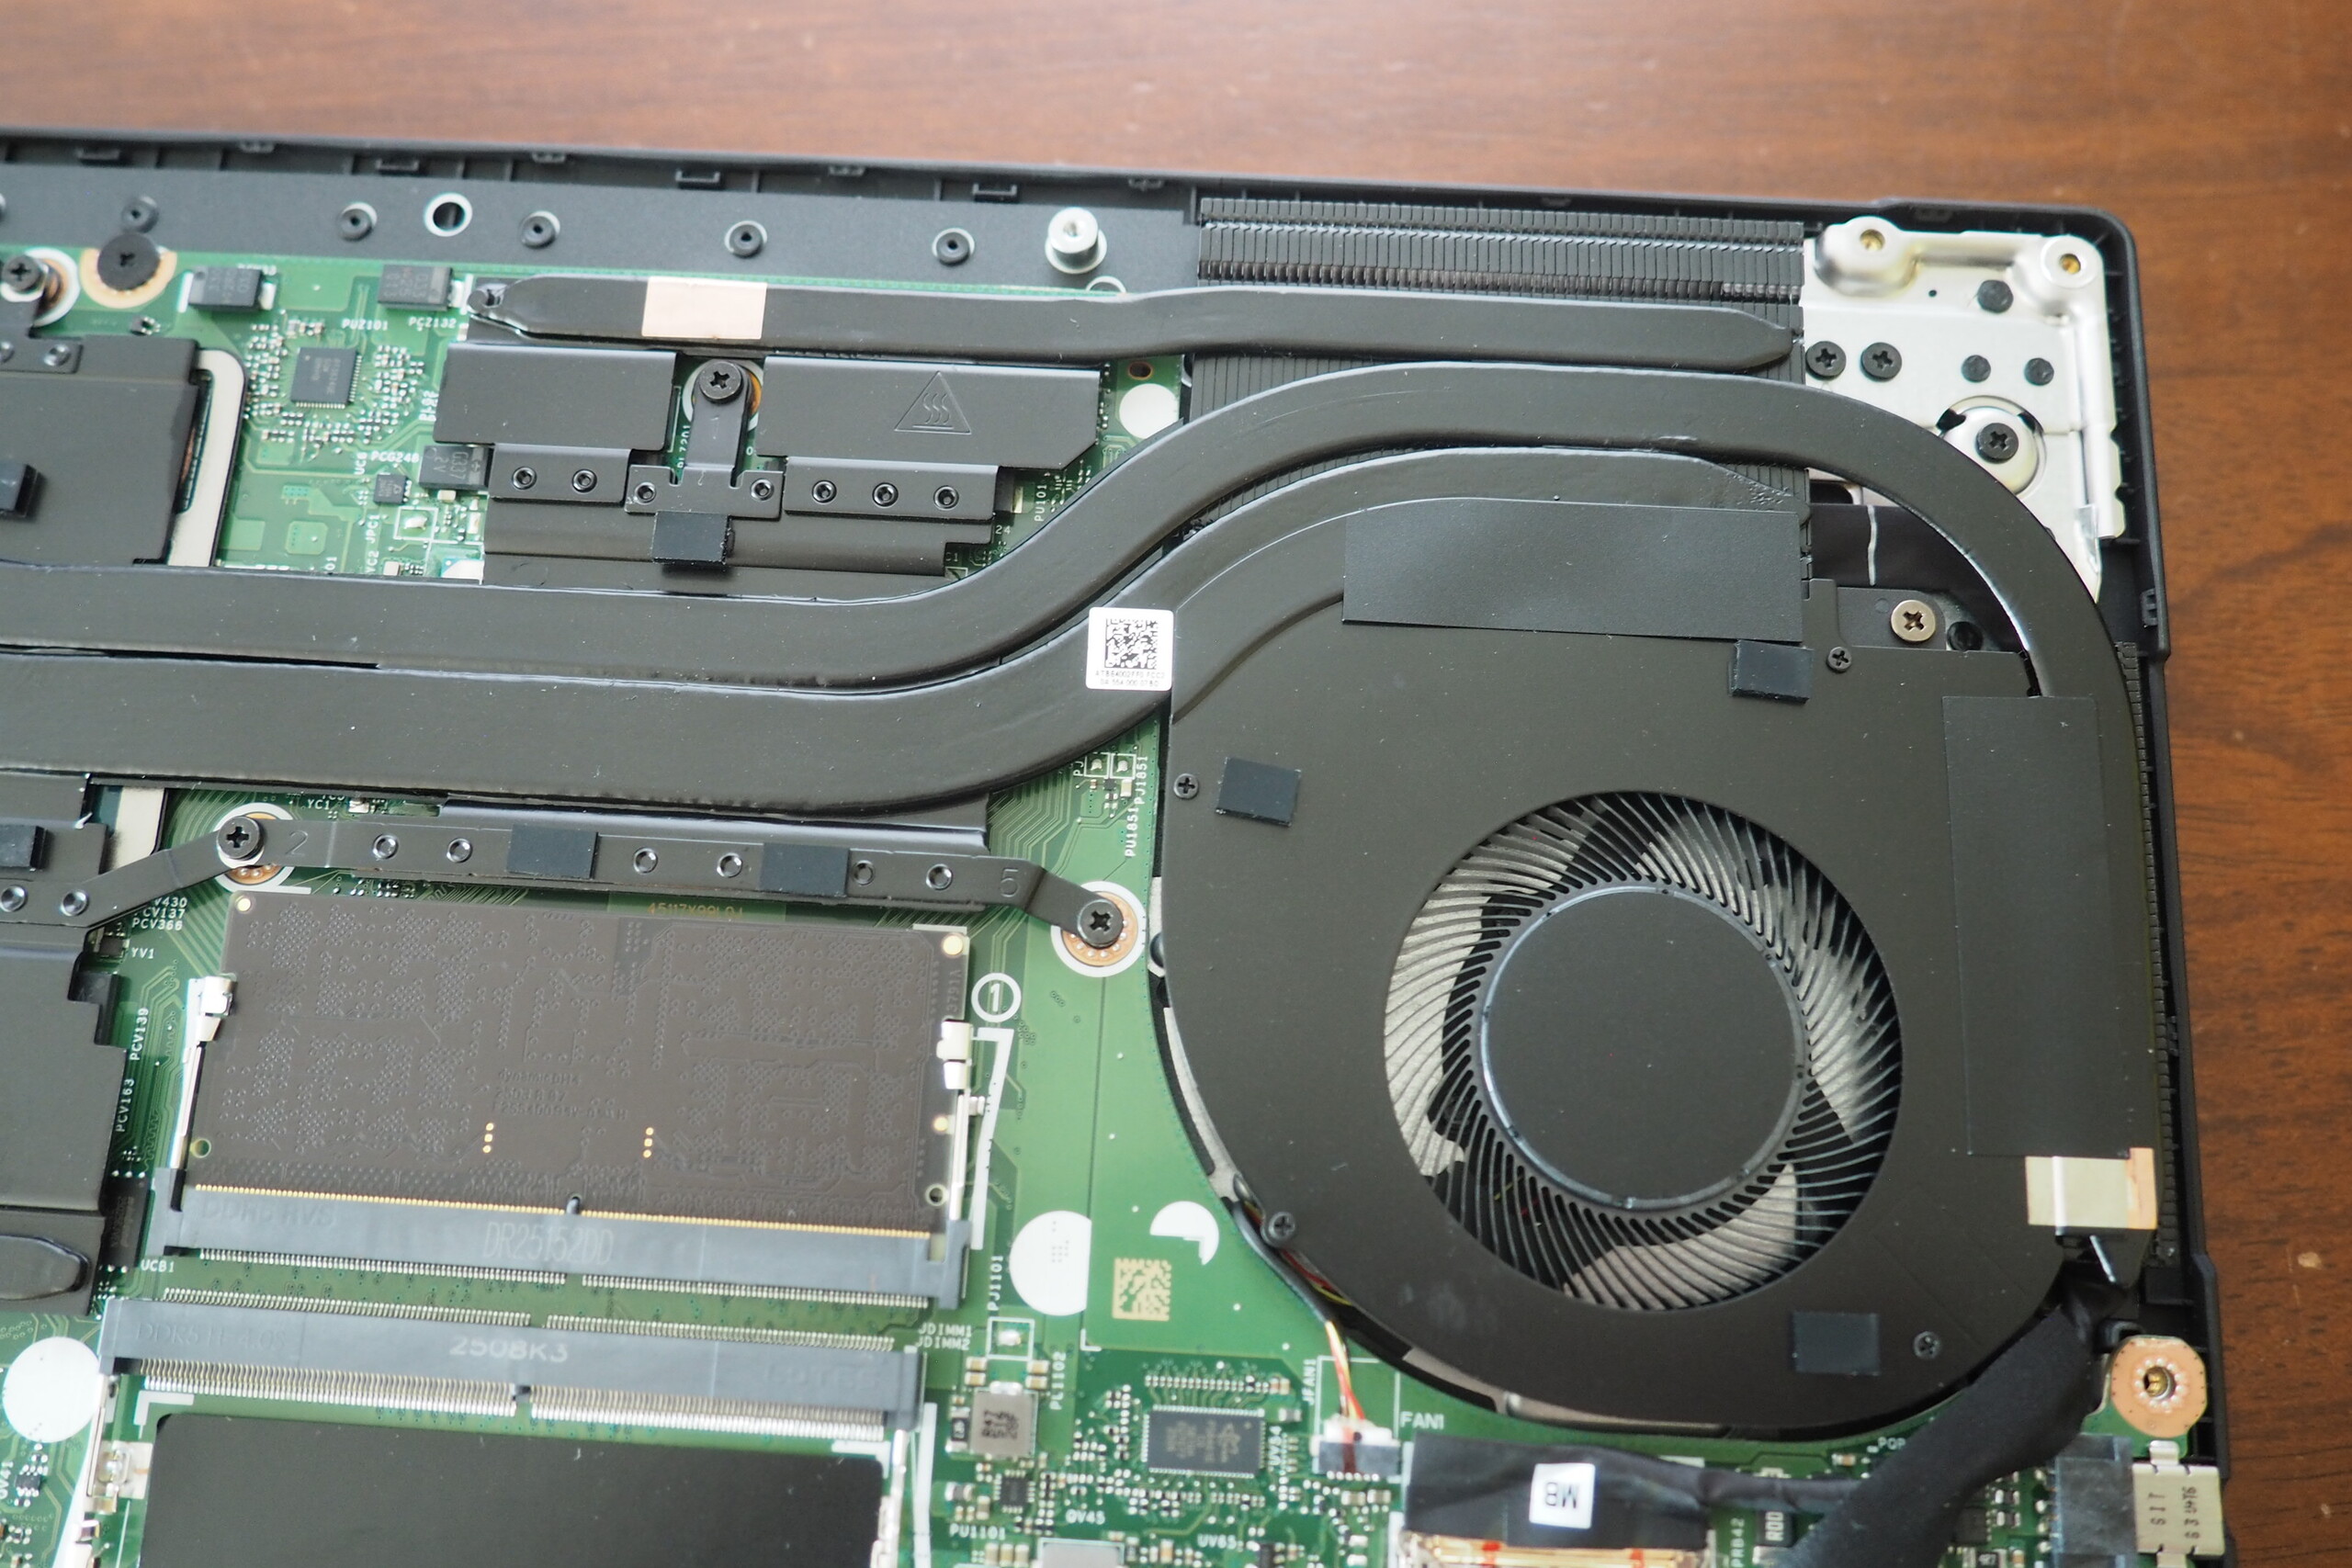
维护
要卸下底板,必须卸下 11 颗十字螺丝。如图所示,散热系统由两个风扇和几根热管组成。除了内存和存储设备外,必要时还可以更换无线模块。
可持续性
技嘉的包装主要使用纸板,但也并非完全不使用塑料。
保修
在德国,该设备提供 24 个月的保修服务。
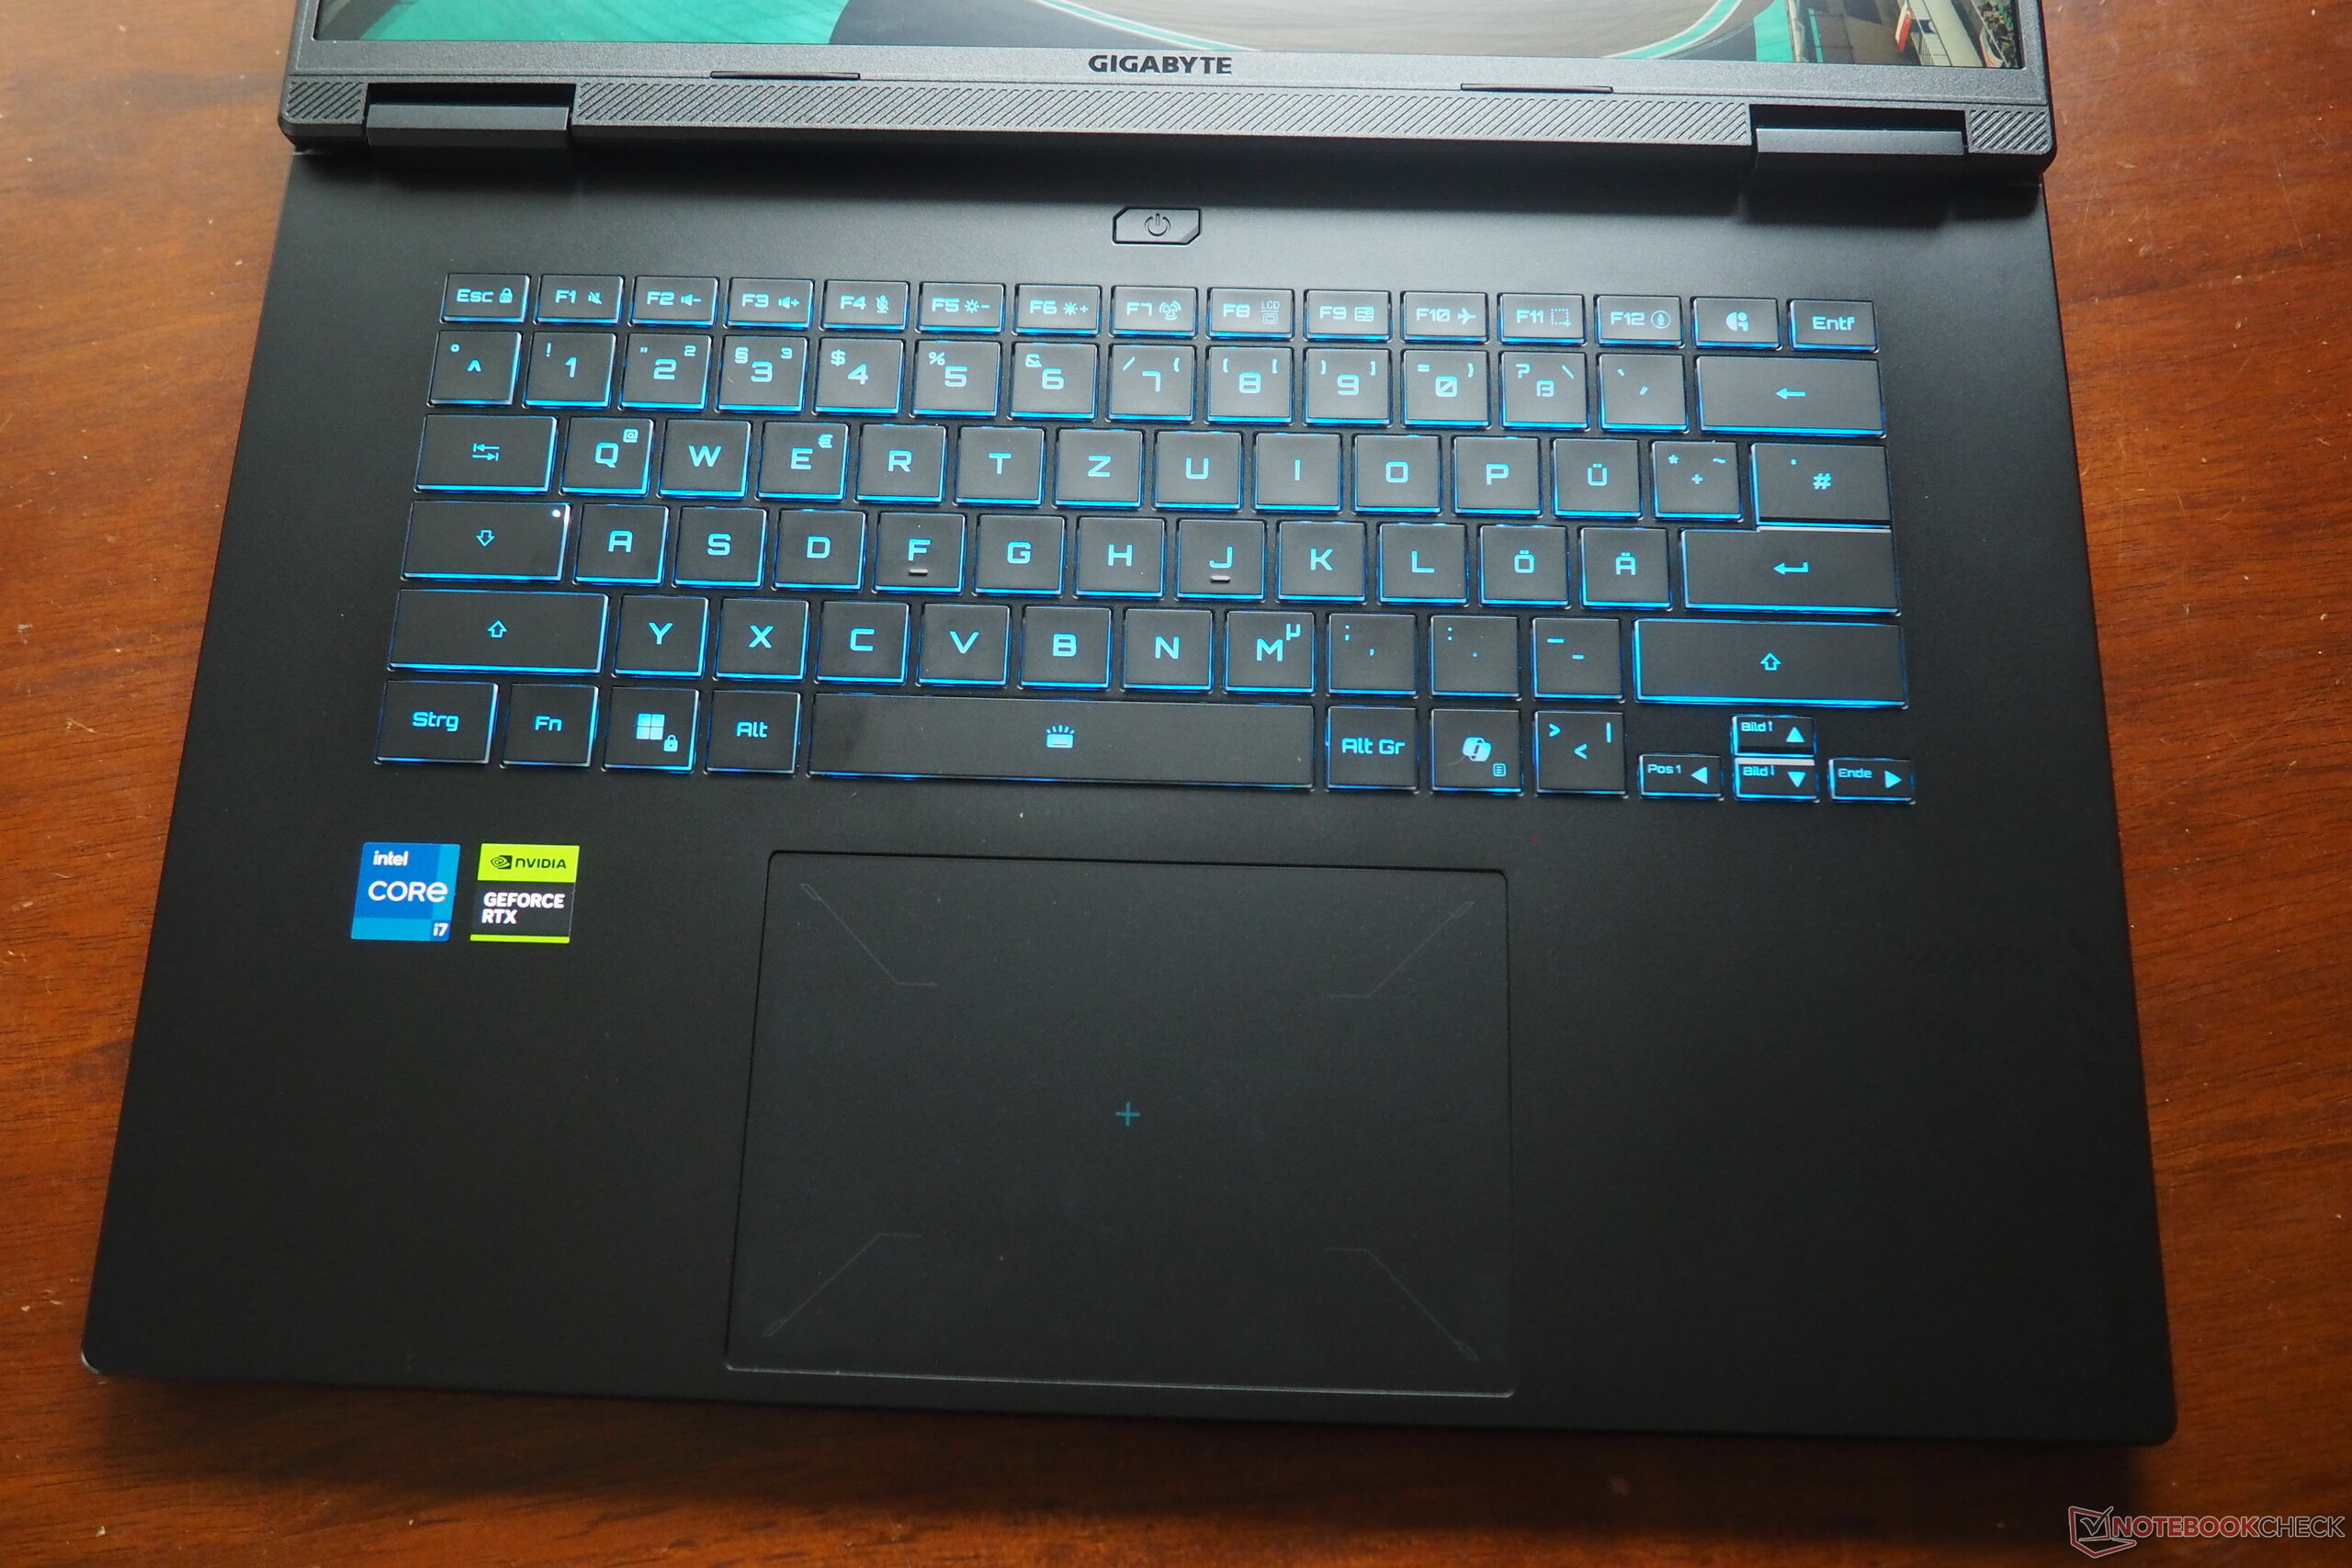
输入设备
键盘
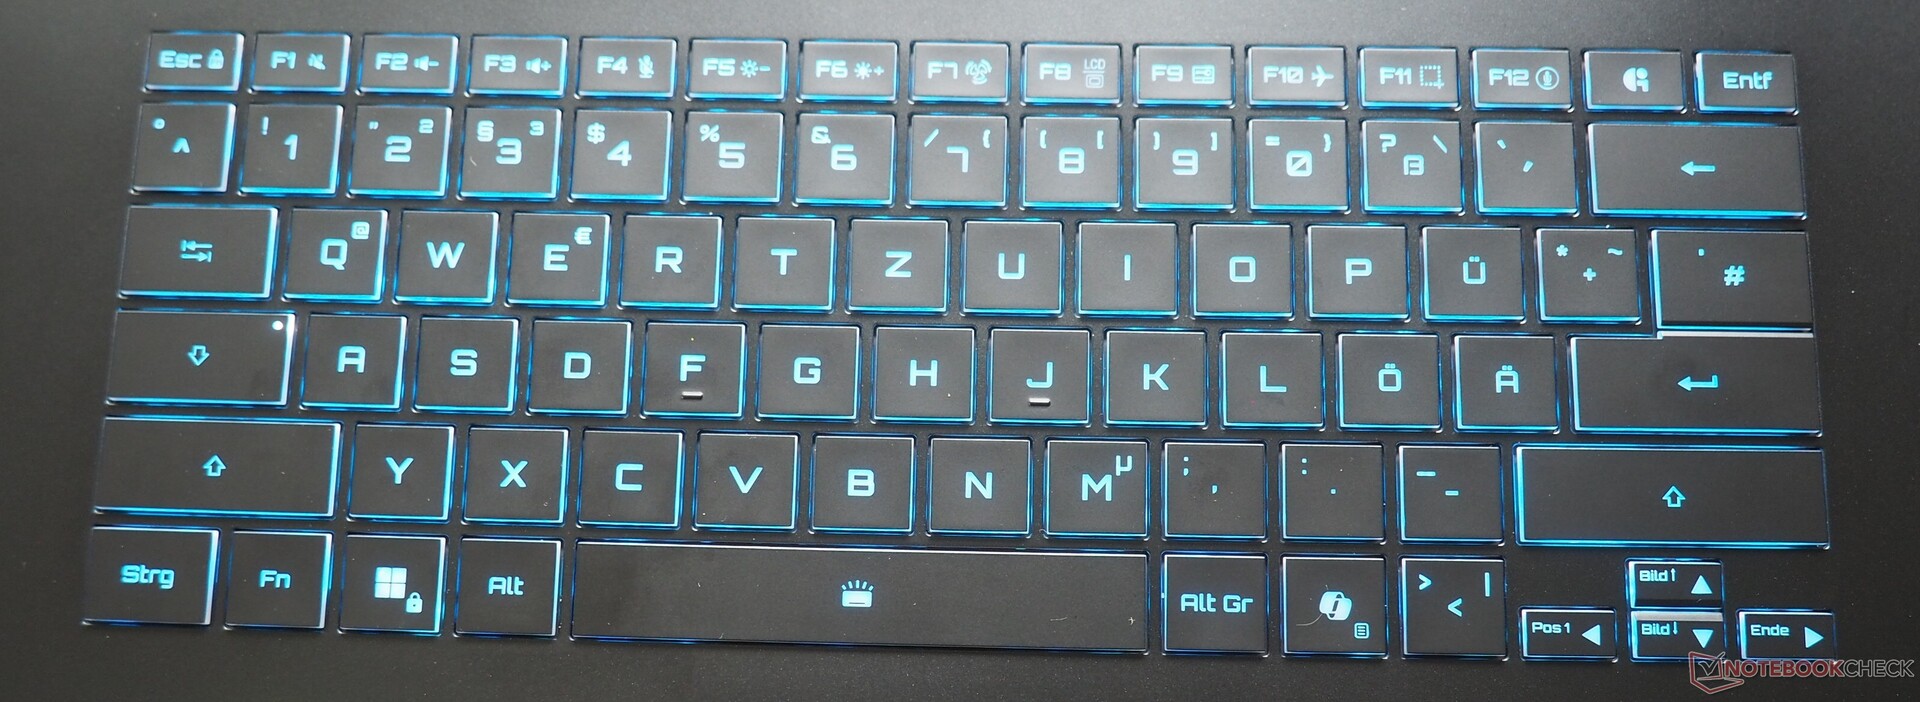
背光 Chiclet 键盘的布局有点特立独行。与微星类似,技嘉将 <>| 键移至别处,并在德文版中使用单行回车键。细小的方向箭头可能也会让一些用户感到厌烦。作为一款橡胶圆顶机型,打字手感还是可以接受的。顺便提一下,右上角的 G 键可启动 GiMATE 向导,帮助进行硬件管理。
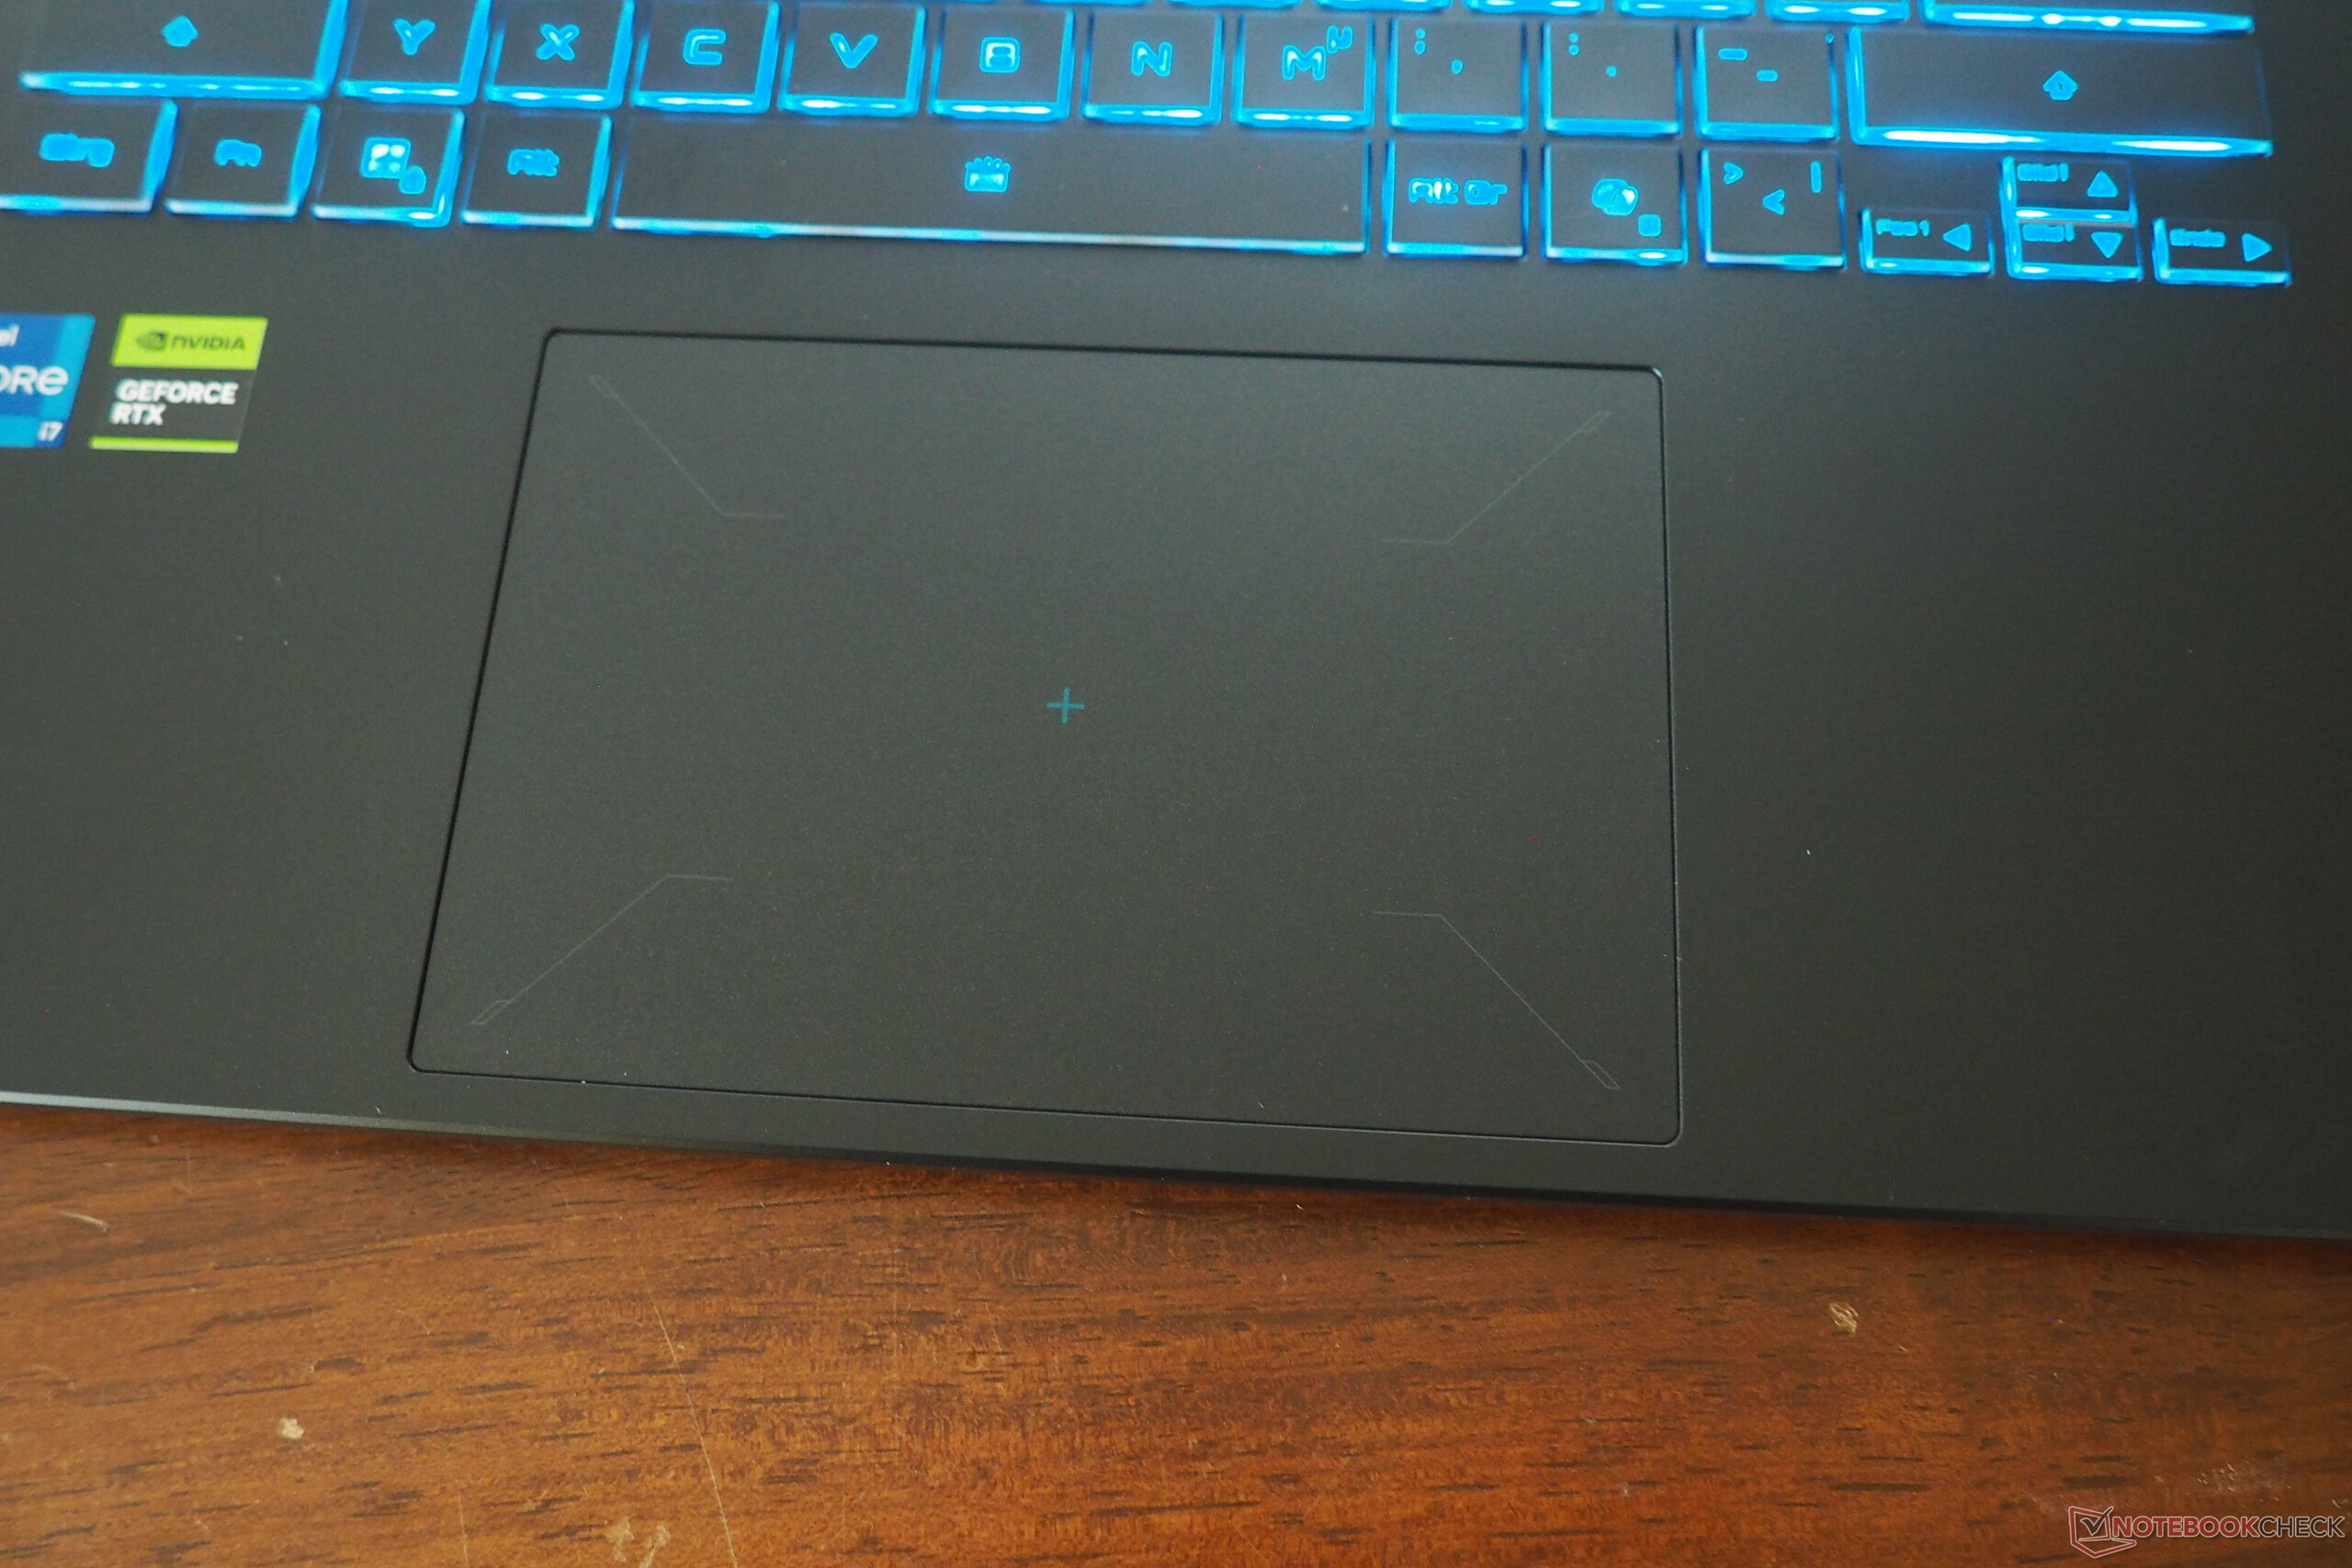
触摸板
触摸板的尺寸为 13.5 x 9 厘米,对于一款 16 英寸设备来说相当大。表面触感光滑,精度令人满意。像往常一样,触摸板还支持多点触摸手势。点击表面反应良好。
显示屏
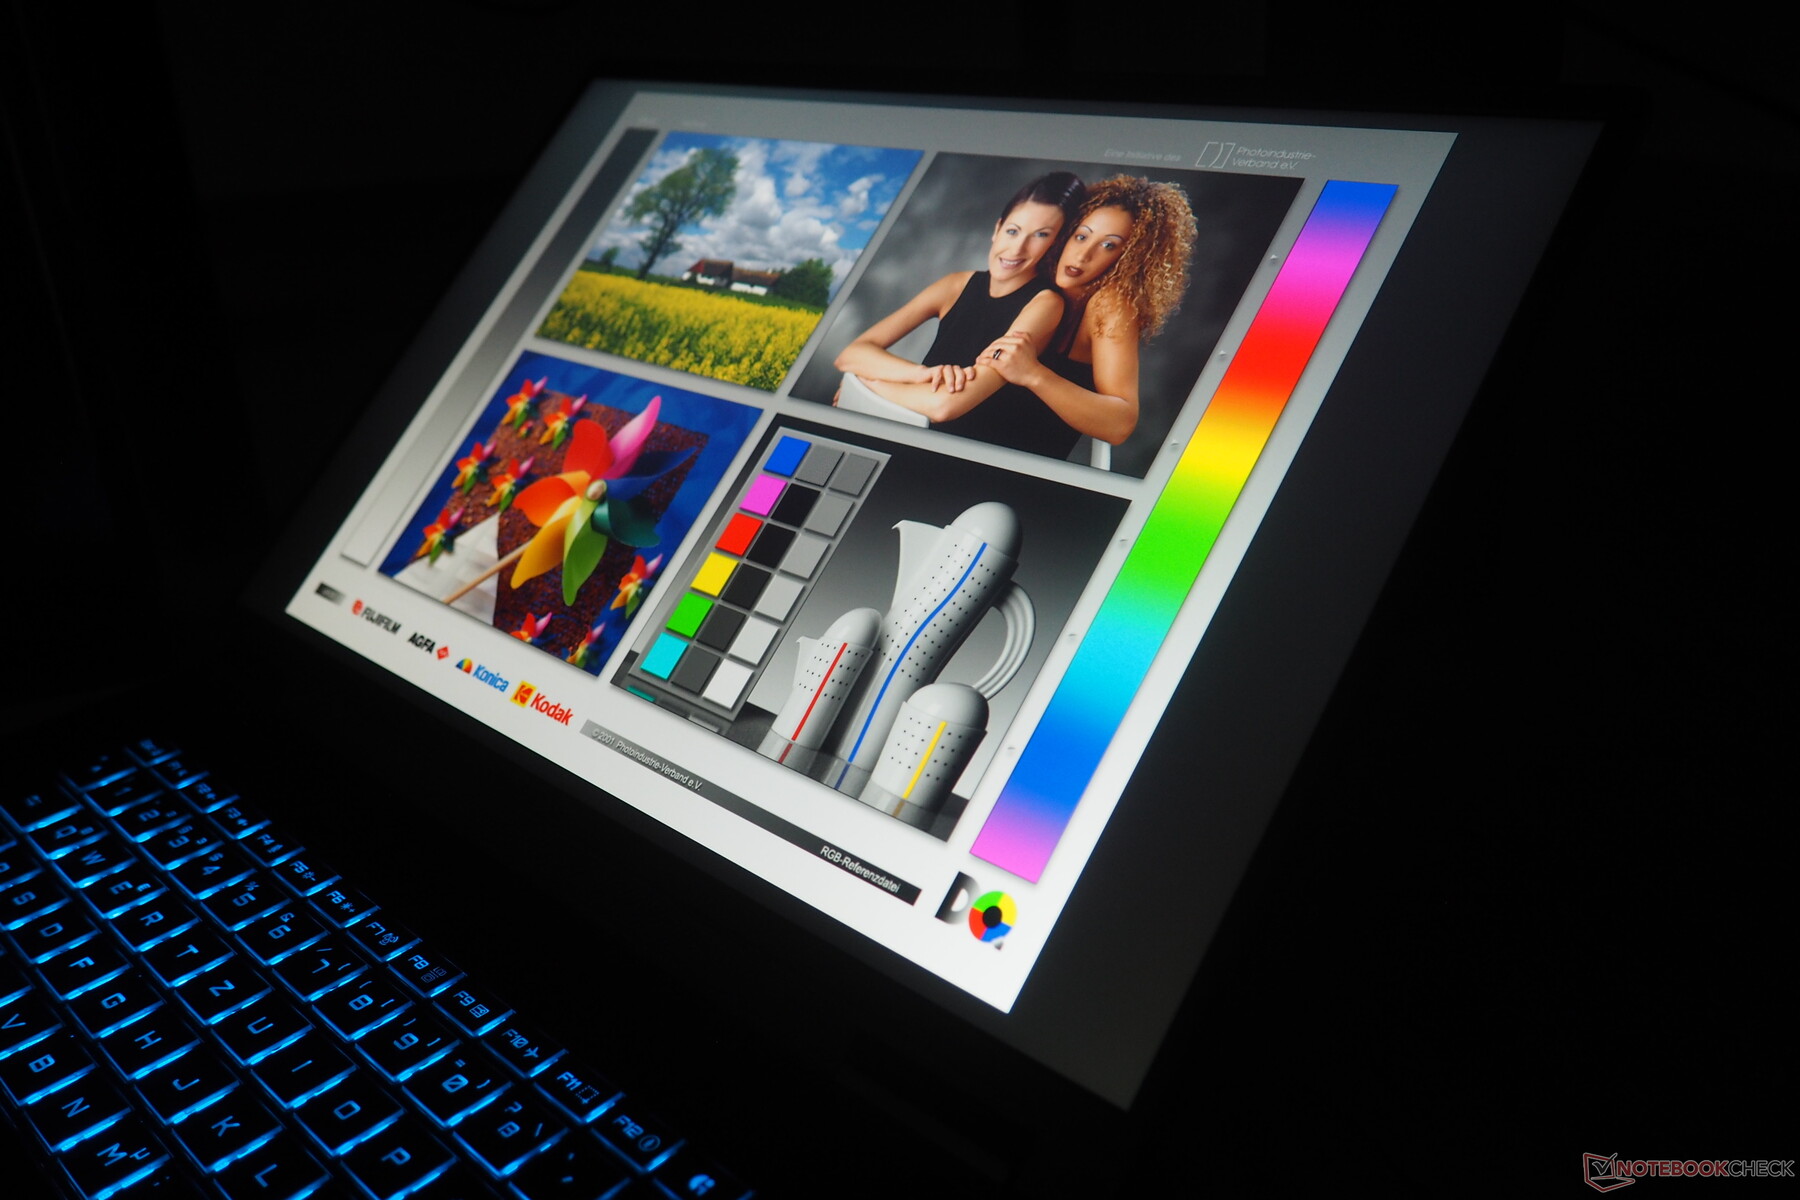
尽管如此,技嘉还是采用了优质的 IPS 面板。
| |||||||||||||||||||||||||
Brightness Distribution: 91 %
Center on Battery: 432 cd/m²
Contrast: 1168:1 (Black: 0.37 cd/m²)
ΔE ColorChecker Calman: 4.76 | ∀{0.5-29.43 Ø4.71}
calibrated: 1.18
ΔE Greyscale Calman: 6.2 | ∀{0.09-98 Ø4.96}
71.6% AdobeRGB 1998 (Argyll 3D)
99.5% sRGB (Argyll 3D)
69.4% Display P3 (Argyll 3D)
Gamma: 2.079
CCT: 6690 K
| Gigabyte Gaming A16 GA6H NE160QDM-NYJ (BOE0C80), IPS, 2560x1600, 16", 165 Hz | Gigabyte Aero X16 1WH MNG007DA5-1, IPS, 2560x1600, 16", 165 Hz | MSI Katana 17 HX B14WGK CSOT MNH301CA3-1, IPS, 2560x1440, 17.3", 240 Hz | MSI Vector 16 HX AI A2XWHG B160QAN02.3 (AUO7DB2), IPS, 2560x1600, 16", 240 Hz | Medion Erazer Major 16 X1 MD62736 NE160QDM-NZL (BOE0D55), IPS, 2560x1600, 16", 300 Hz | Lenovo LOQ 15AHP10 CSOT MNF601BA1-4, IPS, 1920x1080, 15.6", 144 Hz | |
|---|---|---|---|---|---|---|
| Display | -2% | 21% | 19% | 3% | -2% | |
| Display P3 Coverage (%) | 69.4 | 68.7 -1% | 97.3 40% | 96.6 39% | 73.2 5% | 67.3 -3% |
| sRGB Coverage (%) | 99.5 | 96.1 -3% | 99.6 0% | 99.8 0% | 99.8 0% | 99.2 0% |
| AdobeRGB 1998 Coverage (%) | 71.6 | 71.2 -1% | 89 24% | 84.4 18% | 73.9 3% | 69.1 -3% |
| Response Times | 18% | 17% | 42% | 28% | -170% | |
| Response Time Grey 50% / Grey 80% * (ms) | 14.3 ? | 12 ? 16% | 5.2 ? 64% | 4.3 ? 70% | 10 ? 30% | 33.9 ? -137% |
| Response Time Black / White * (ms) | 7 ? | 5.6 ? 20% | 9.2 ? -31% | 6 ? 14% | 5.2 ? 26% | 21.2 ? -203% |
| PWM Frequency (Hz) | ||||||
| Screen | 23% | 17% | 7% | 21% | 26% | |
| Brightness middle (cd/m²) | 432 | 395 -9% | 296 -31% | 473 9% | 577 34% | 318 -26% |
| Brightness (cd/m²) | 425 | 398 -6% | 272 -36% | 426 0% | 539 27% | 300 -29% |
| Brightness Distribution (%) | 91 | 97 7% | 87 -4% | 85 -7% | 85 -7% | 89 -2% |
| Black Level * (cd/m²) | 0.37 | 0.32 14% | 0.27 27% | 0.42 -14% | 0.5 -35% | 0.2 46% |
| Contrast (:1) | 1168 | 1234 6% | 1096 -6% | 1126 -4% | 1154 -1% | 1590 36% |
| Colorchecker dE 2000 * | 4.76 | 1.3 73% | 1.35 72% | 3.47 27% | 2.12 55% | 1.33 72% |
| Colorchecker dE 2000 max. * | 8.59 | 2.8 67% | 4.76 45% | 7.24 16% | 3.32 61% | 4.42 49% |
| Colorchecker dE 2000 calibrated * | 1.18 | 1.4 -19% | 0.78 34% | 1.36 -15% | 1.33 -13% | 0.94 20% |
| Greyscale dE 2000 * | 6.2 | 1.8 71% | 2.7 56% | 3.1 50% | 2.2 65% | 1.9 69% |
| Gamma | 2.079 106% | 2.2 100% | 2.201 100% | 2.486 88% | 2.123 104% | 2.187 101% |
| CCT | 6690 97% | 6842 95% | 6770 96% | 6832 95% | 6457 101% | 6678 97% |
| Total Average (Program / Settings) | 13% /
17% | 18% /
18% | 23% /
15% | 17% /
18% | -49% /
-8% |
* ... smaller is better
虽然在色彩空间方面仍有改进的余地(没有完全覆盖 AdobeRGB 或 DCI-P3),但哑光表面和相当不错的亮度(平均 425 cd/m²)相结合,确保了在某些条件下的良好户外性能。
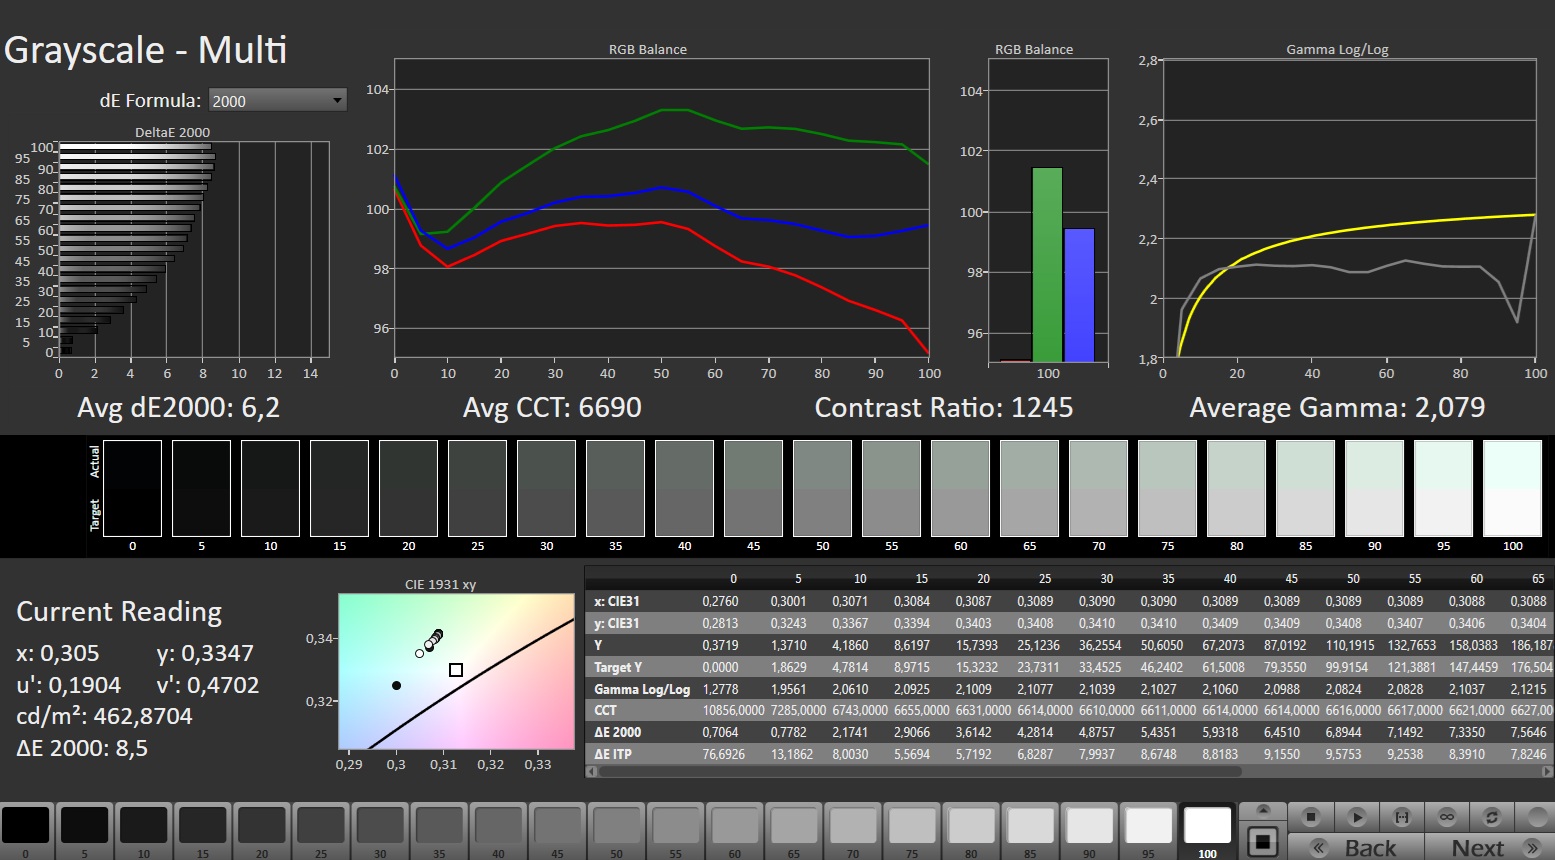
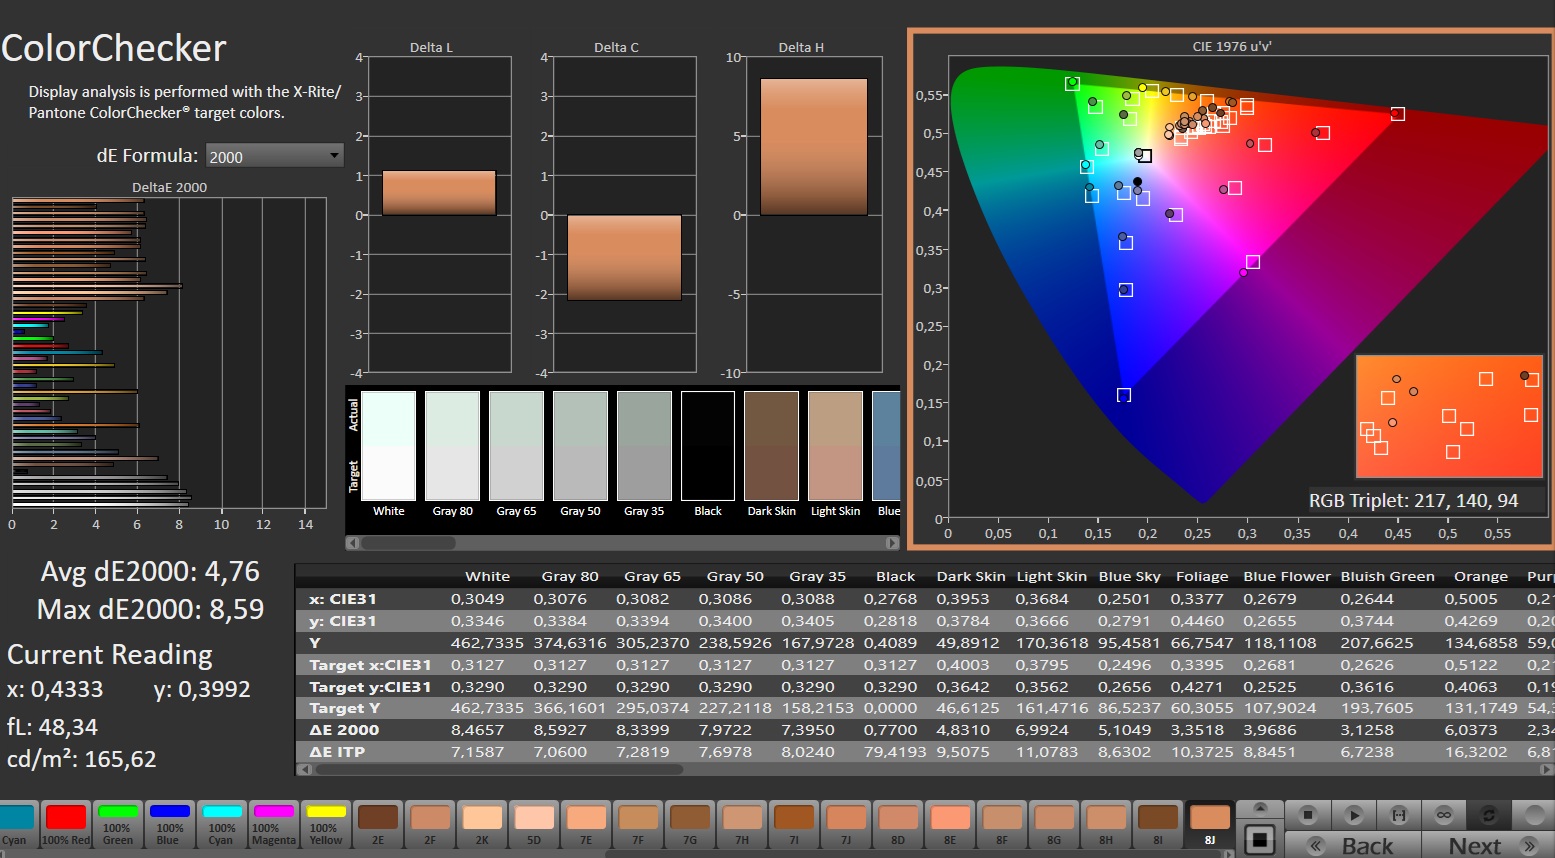
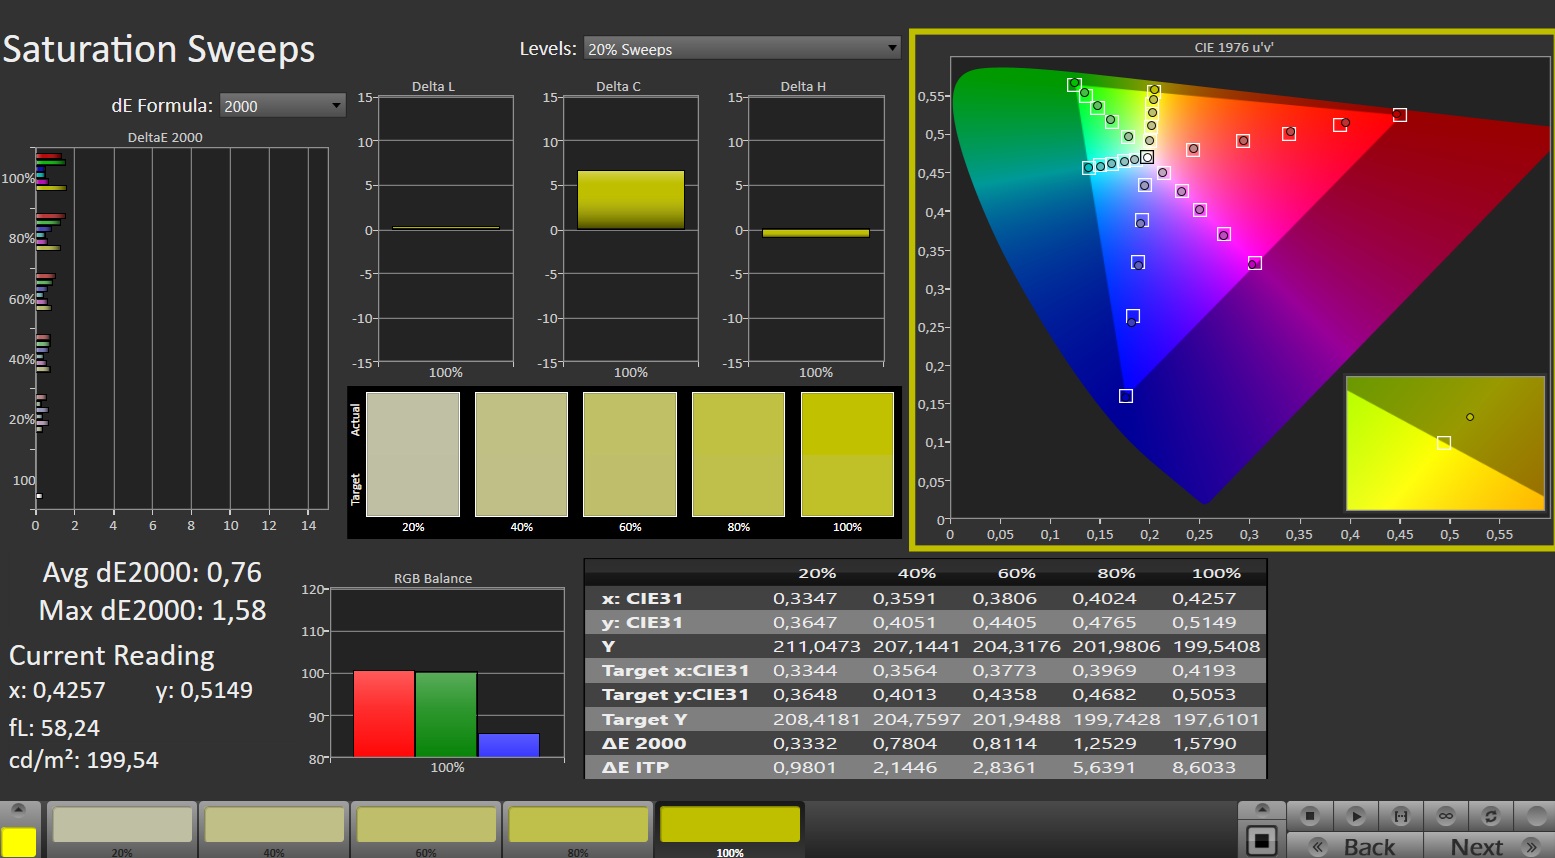
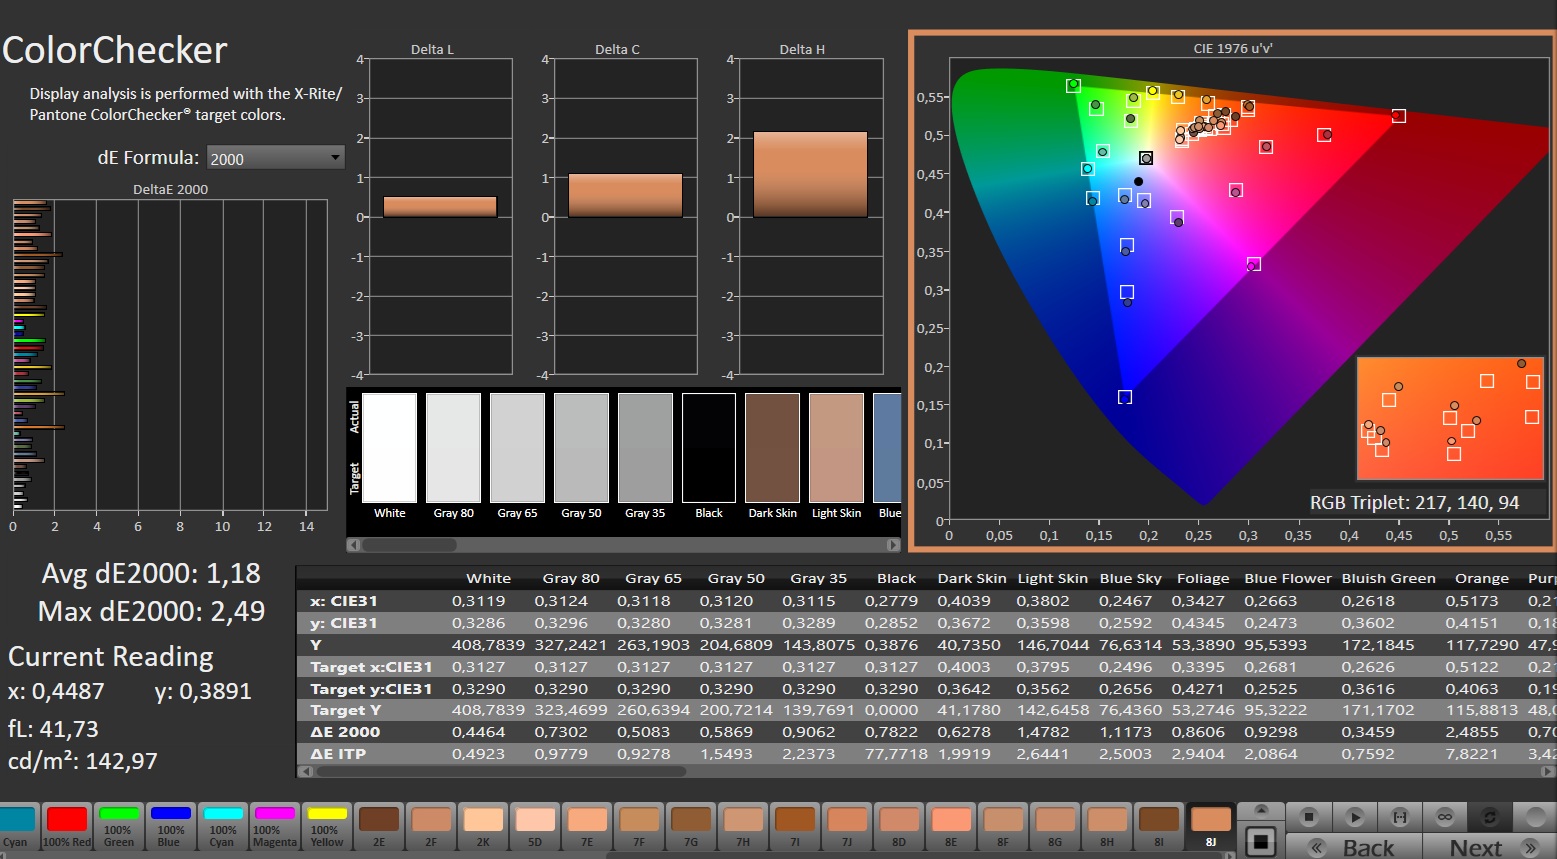
对比度超过 1,100:1,与竞争对手不相上下,我们测得的黑度为 0.37 cd/m²。响应时间也在典型的 IPS 范围之内。视角稳定性也是如此。
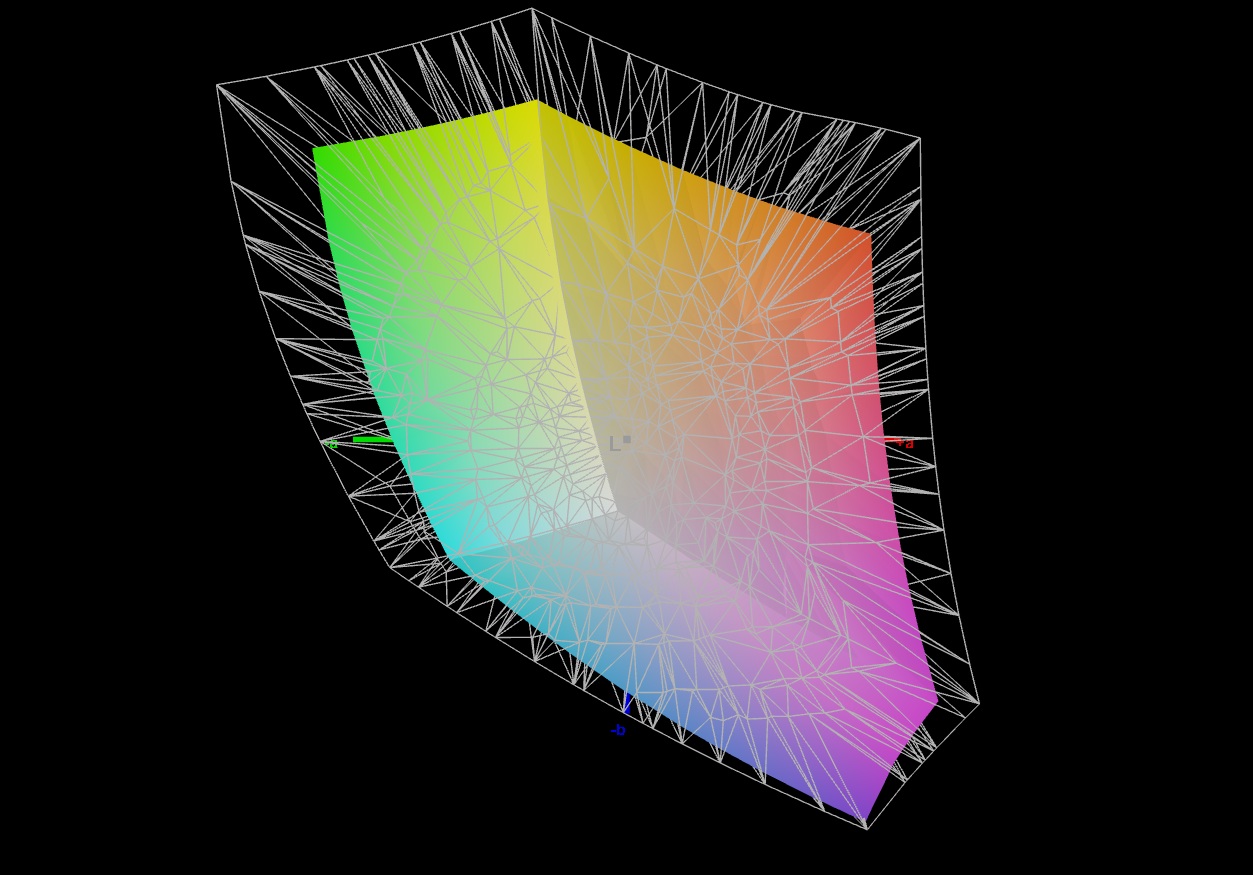
165 Hz 面板在色彩准确度方面表现不佳。开箱后,图像带有绿色色调,可以通过校准进行纠正(我们的 ICC 文件链接在上面的照明图中)。
Display Response Times
| ↔ Response Time Black to White | ||
|---|---|---|
| 7 ms ... rise ↗ and fall ↘ combined | ↗ 2.3 ms rise | 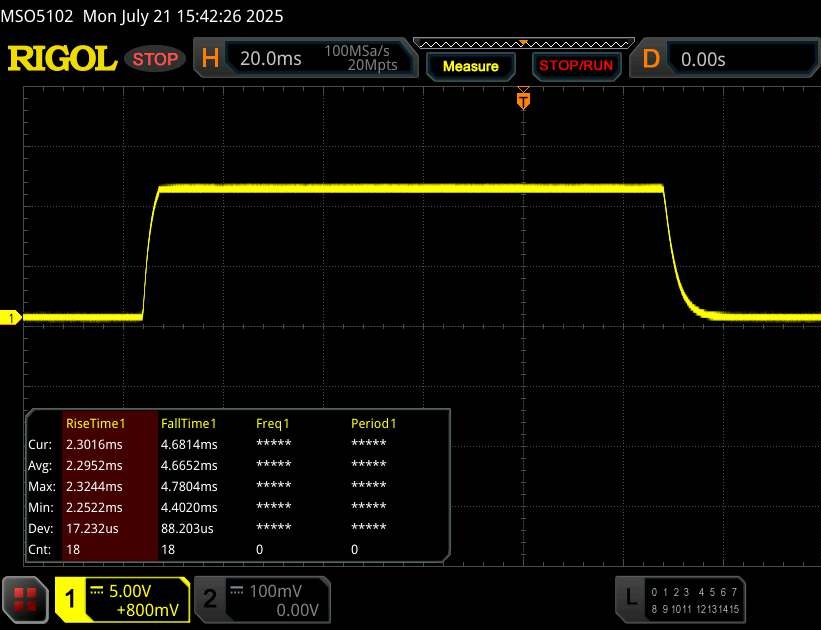 |
| ↘ 4.7 ms fall | ||
| The screen shows very fast response rates in our tests and should be very well suited for fast-paced gaming. In comparison, all tested devices range from 0.1 (minimum) to 240 (maximum) ms. » 21 % of all devices are better. This means that the measured response time is better than the average of all tested devices (19.8 ms). | ||
| ↔ Response Time 50% Grey to 80% Grey | ||
| 14.3 ms ... rise ↗ and fall ↘ combined | ↗ 6.8 ms rise | 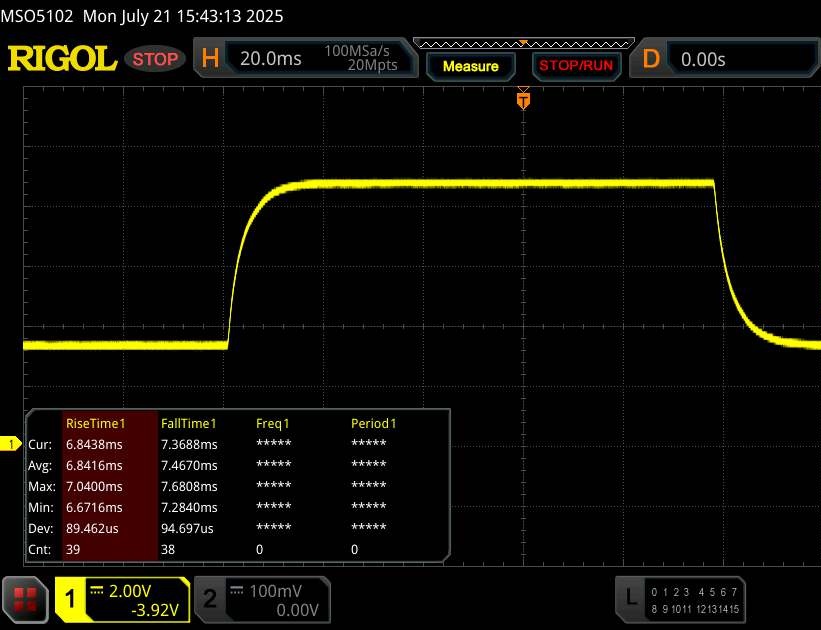 |
| ↘ 7.5 ms fall | ||
| The screen shows good response rates in our tests, but may be too slow for competitive gamers. In comparison, all tested devices range from 0.165 (minimum) to 636 (maximum) ms. » 28 % of all devices are better. This means that the measured response time is better than the average of all tested devices (31 ms). | ||
Screen Flickering / PWM (Pulse-Width Modulation)
| Screen flickering / PWM not detected |  | ||
In comparison: 52 % of all tested devices do not use PWM to dim the display. If PWM was detected, an average of 7754 (minimum: 5 - maximum: 343500) Hz was measured. | |||
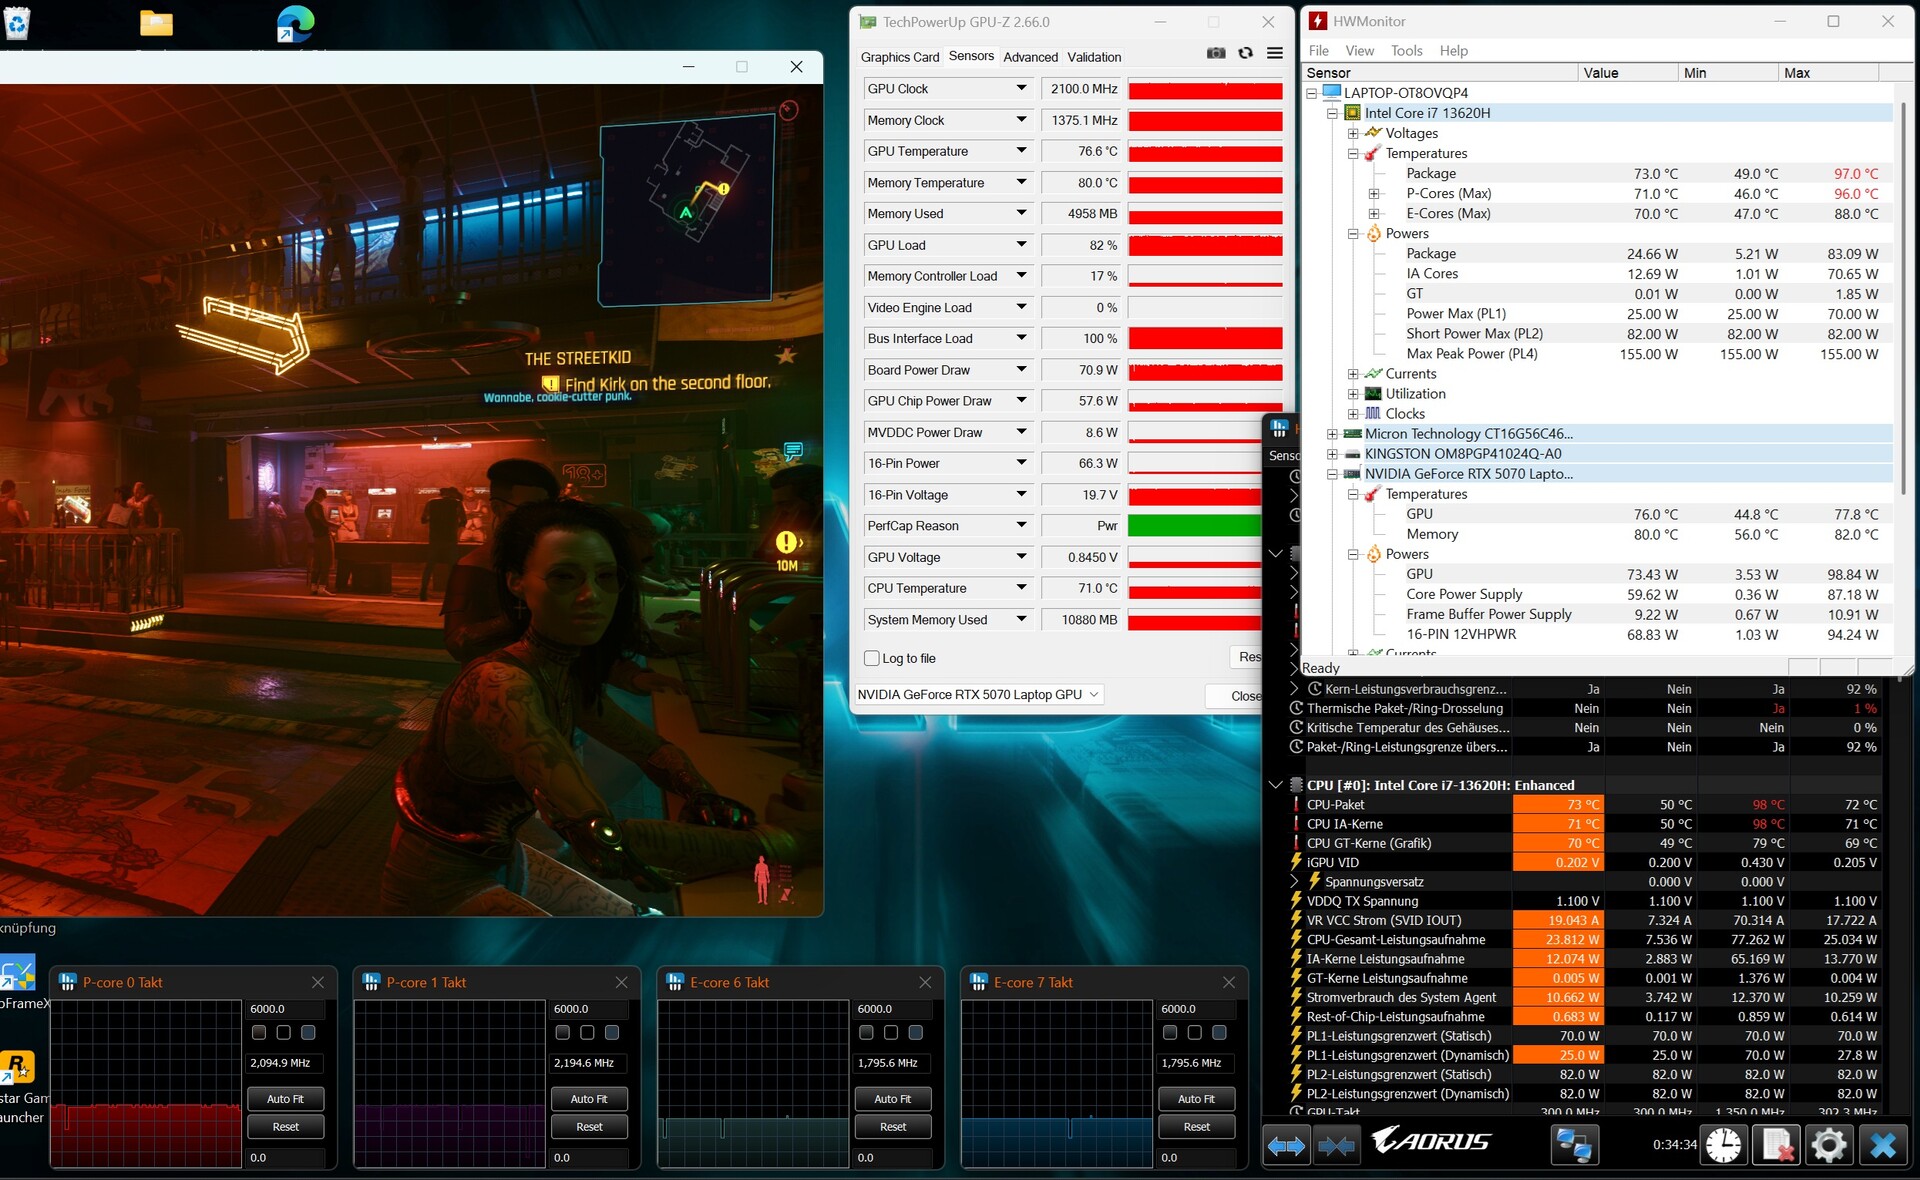
性能
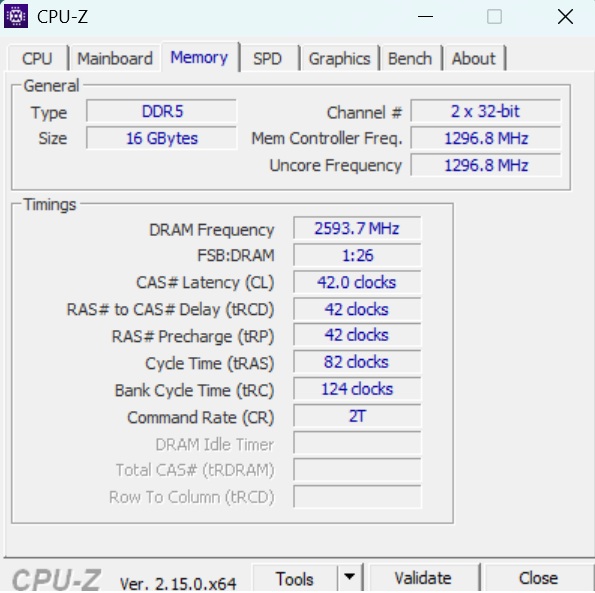
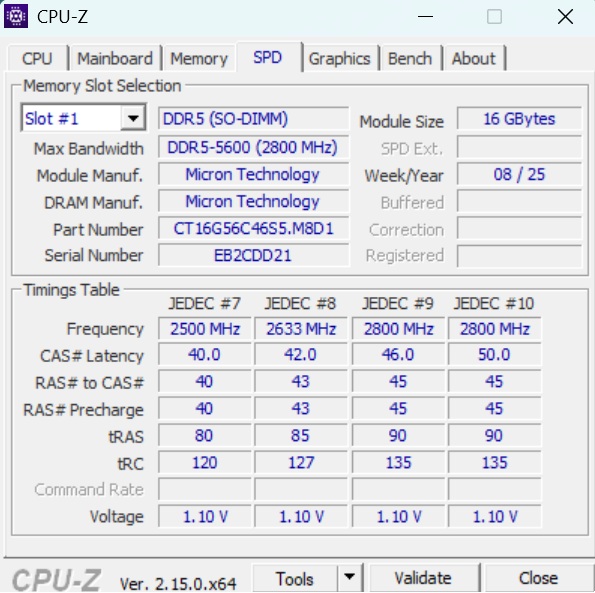
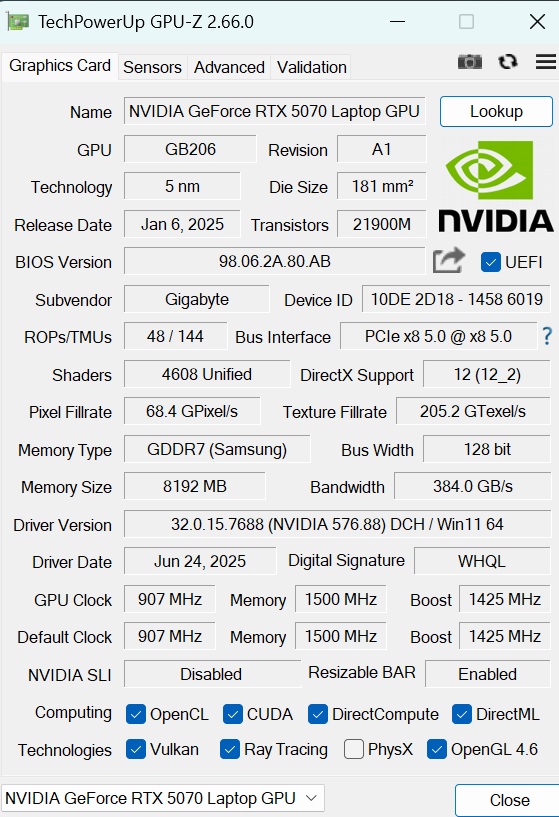
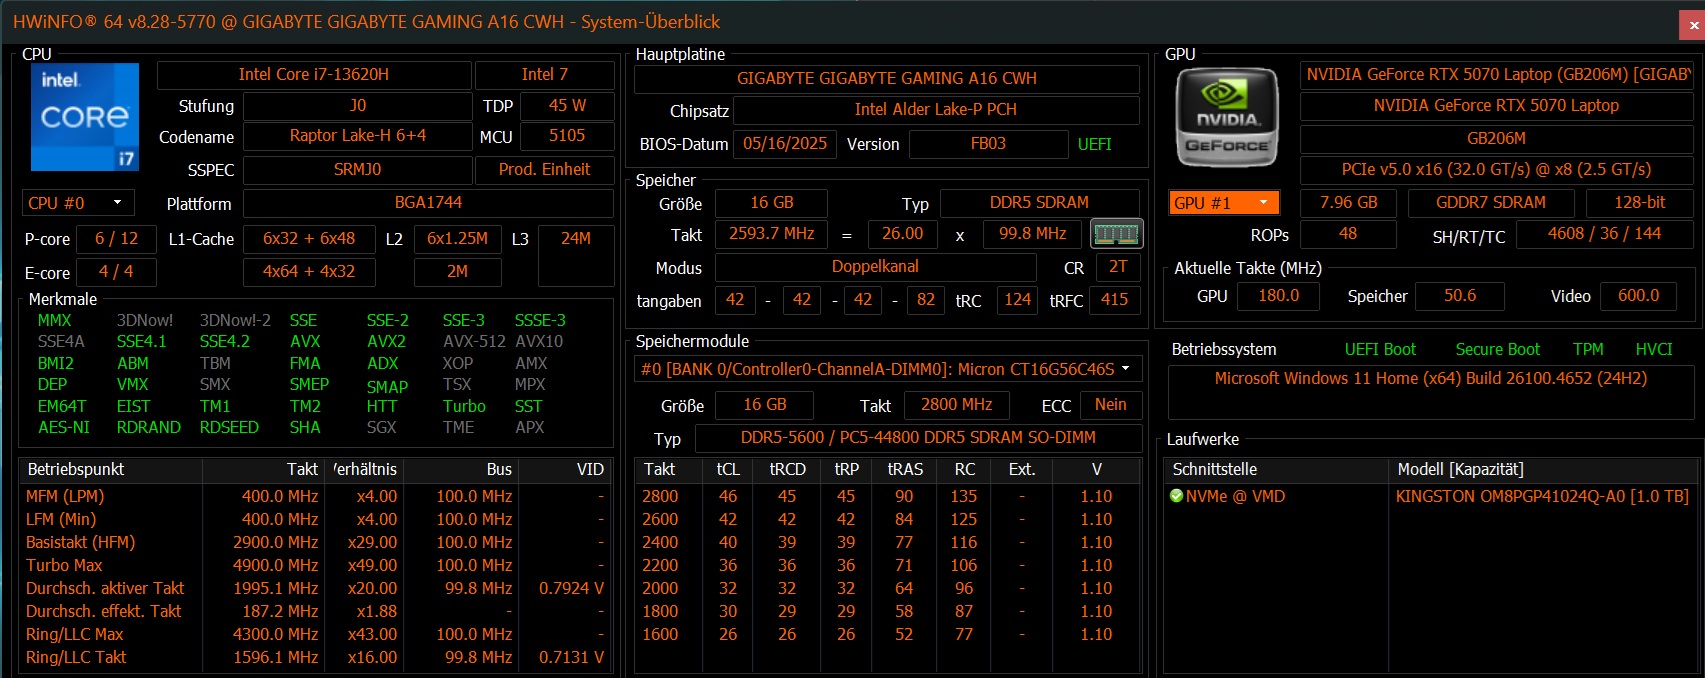
在组件方面,Gaming A16 属于中端产品。虽然 16 GB 内存和 1 TB SSD 在 2025 年并不值得一提,但如前所述,其容量很容易扩展。从游戏玩家的角度来看,VRAM 的容量更令人担忧--8 GB 并不能提供多少面向未来的功能,而且经常会达到极限。
测试条件
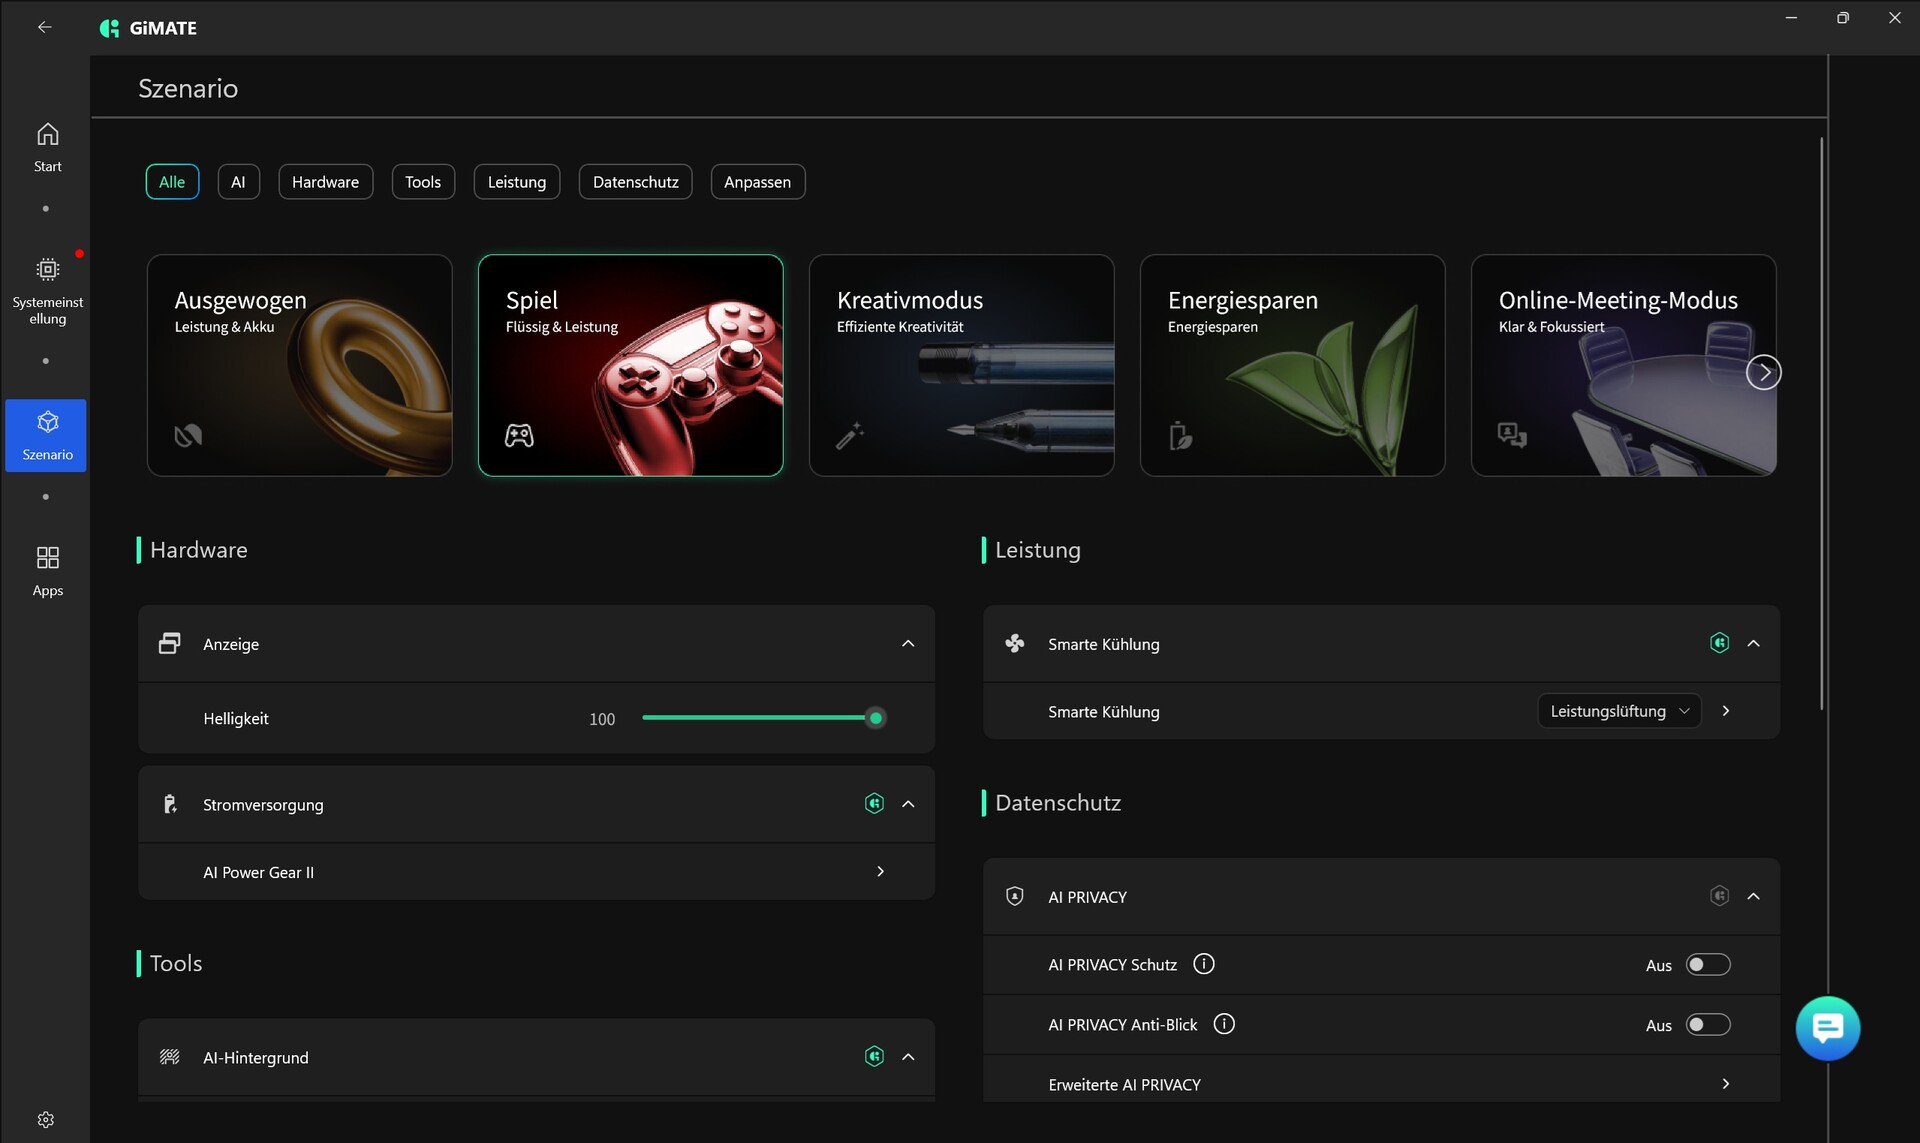
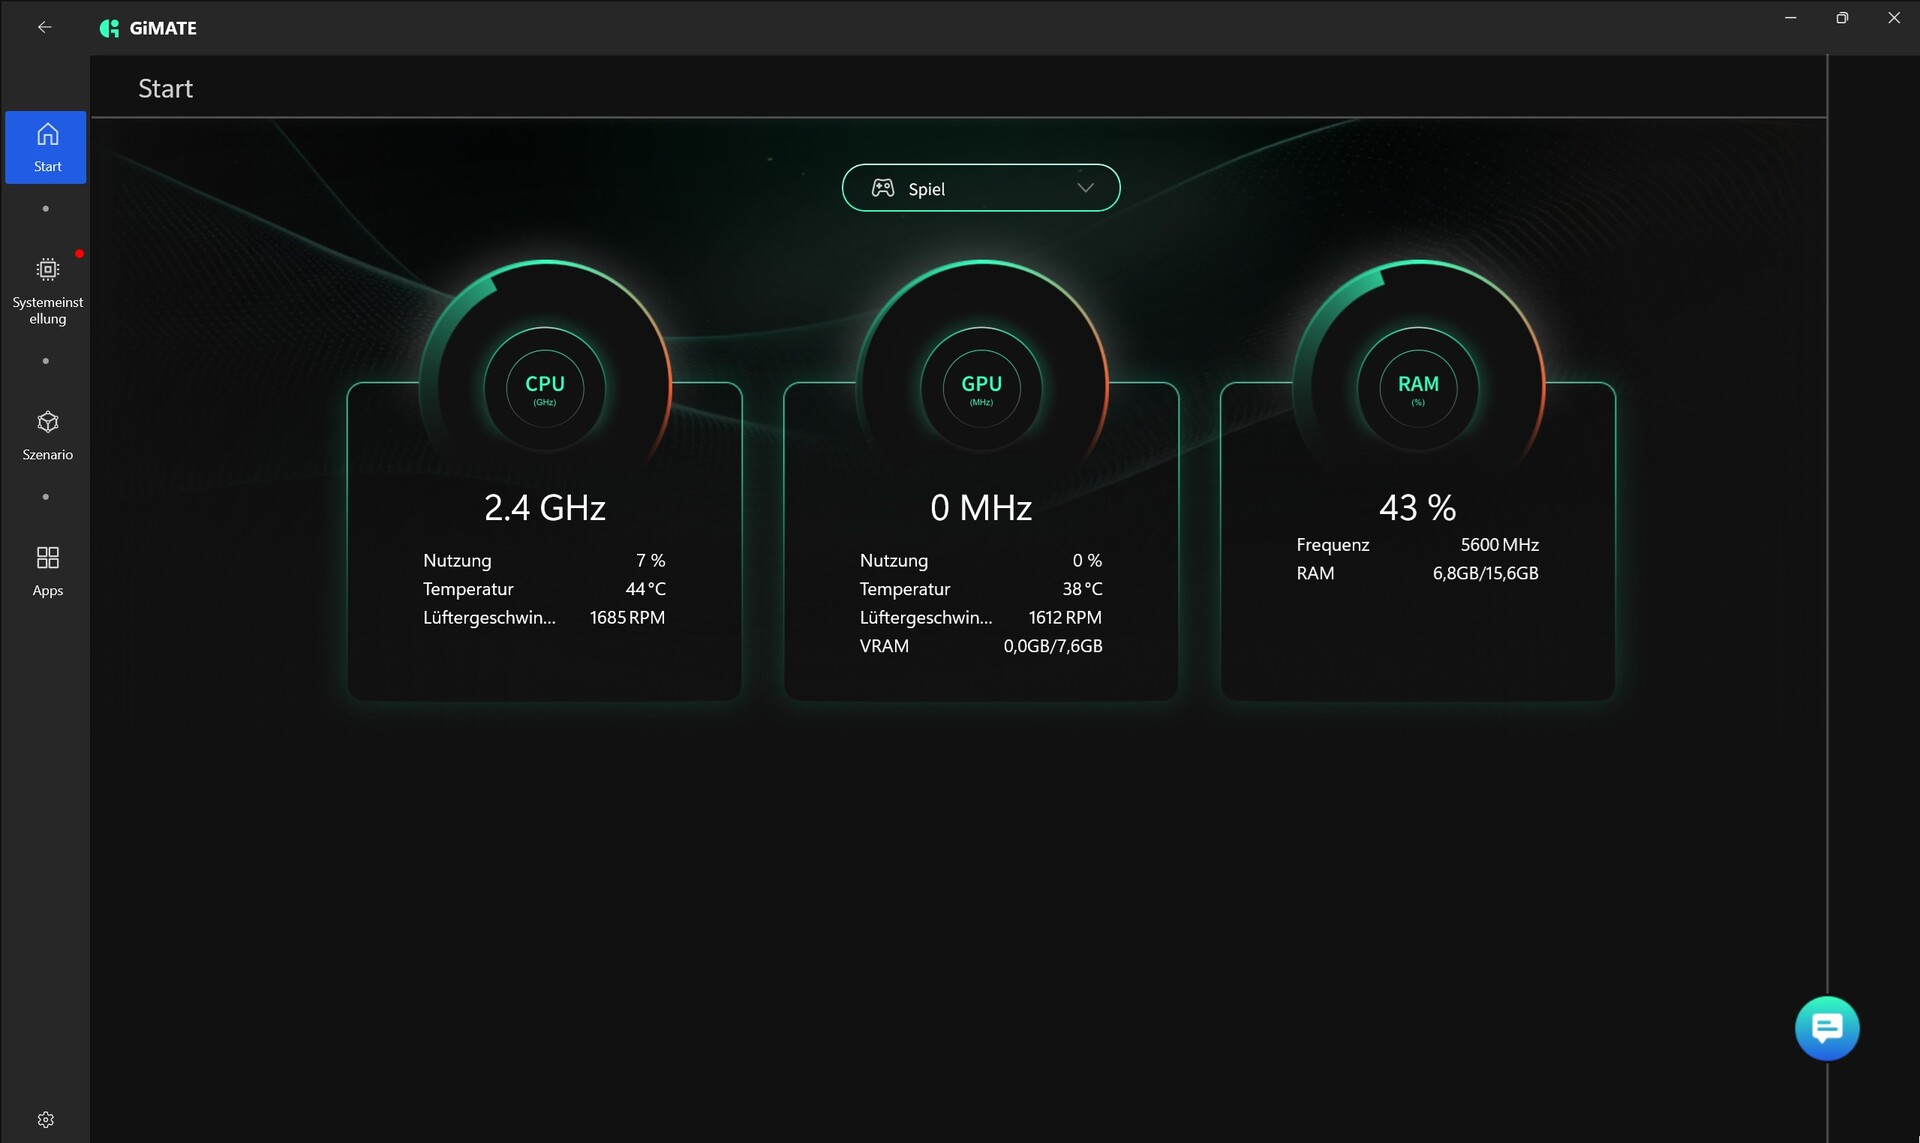
预装的 GiMATE 软件提供多种运行模式。在测试中,我们使用了 "游戏模式",该模式在 CPU 和 GPU 速度方面与 "创意模式 "差别不大。自动图形切换始终处于激活状态。
| 模式 | 平衡 | 游戏 | 创意 | 节能 |
| 赛博朋克 2077 噪音 | 45 dB(A) | 54 dB(A) | 54 dB(A) | 45 dB(A) |
| 赛博朋克 2077》性能(FHD/超高清) | 72.1fps | 82.4fps | 82.1fps | 63.1fps |
| Cinebench R15 Multi Score | 2,302 分 | 2,351 分 | 2,334 分 | 1,796 分 |
| CPU PL1 | 50 瓦 | 50 瓦 | 50 瓦 | 35 瓦 |
| CPU PL2 | 82 瓦 | 82 瓦 | 82 瓦 | 65 瓦 |
处理器
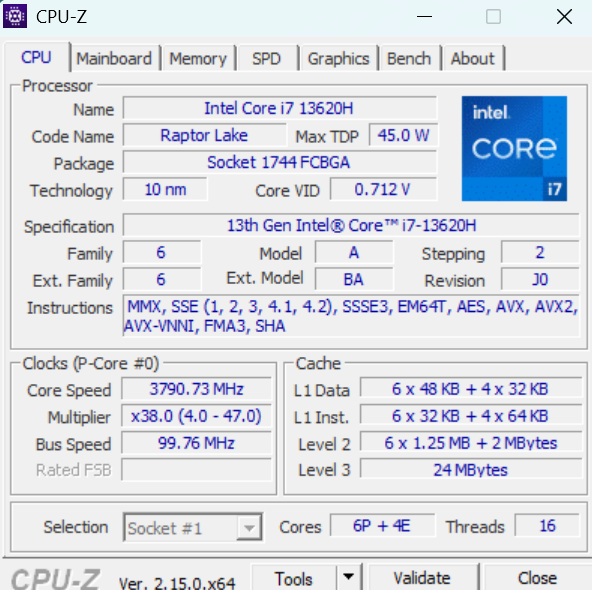
英特尔 酷睿 i7-13620H仍采用 10 纳米工艺制造,提供包括超线程在内的 6 个性能内核和 4 个不含超线程的效率内核。性能大致基于 Ryzen 7 250.更新的 酷睿 i7-14650HX然而,该型号并不接近当前的 酷睿至尊 7 255HX.
Cinebench R15 Multi Sustained Test
* ... smaller is better
AIDA64: FP32 Ray-Trace | FPU Julia | CPU SHA3 | CPU Queen | FPU SinJulia | FPU Mandel | CPU AES | CPU ZLib | FP64 Ray-Trace | CPU PhotoWorxx
| Performance rating | |
| Medion Erazer Major 16 X1 MD62736 | |
| Average of class Gaming | |
| MSI Vector 16 HX AI A2XWHG | |
| Gigabyte Aero X16 1WH | |
| Lenovo LOQ 15AHP10 | |
| MSI Katana 17 HX B14WGK | |
| Average Intel Core i7-13620H | |
| Gigabyte Gaming A16 GA6H | |
| AIDA64 / FP32 Ray-Trace | |
| Medion Erazer Major 16 X1 MD62736 | |
| Average of class Gaming (10227 - 85542, n=105, last 2 years) | |
| MSI Vector 16 HX AI A2XWHG | |
| Gigabyte Aero X16 1WH | |
| Lenovo LOQ 15AHP10 | |
| MSI Katana 17 HX B14WGK | |
| Gigabyte Gaming A16 GA6H | |
| Average Intel Core i7-13620H (10779 - 13601, n=7) | |
| AIDA64 / FPU Julia | |
| Medion Erazer Major 16 X1 MD62736 | |
| MSI Vector 16 HX AI A2XWHG | |
| Average of class Gaming (51376 - 238426, n=105, last 2 years) | |
| Gigabyte Aero X16 1WH | |
| Lenovo LOQ 15AHP10 | |
| MSI Katana 17 HX B14WGK | |
| Gigabyte Gaming A16 GA6H | |
| Average Intel Core i7-13620H (54287 - 67187, n=7) | |
| AIDA64 / CPU SHA3 | |
| Medion Erazer Major 16 X1 MD62736 | |
| MSI Vector 16 HX AI A2XWHG | |
| Average of class Gaming (2180 - 10115, n=105, last 2 years) | |
| Lenovo LOQ 15AHP10 | |
| Gigabyte Aero X16 1WH | |
| MSI Katana 17 HX B14WGK | |
| Gigabyte Gaming A16 GA6H | |
| Average Intel Core i7-13620H (2327 - 2773, n=7) | |
| AIDA64 / CPU Queen | |
| Medion Erazer Major 16 X1 MD62736 | |
| Average of class Gaming (49785 - 173351, n=90, last 2 years) | |
| MSI Vector 16 HX AI A2XWHG | |
| Lenovo LOQ 15AHP10 | |
| MSI Katana 17 HX B14WGK | |
| Gigabyte Aero X16 1WH | |
| Gigabyte Gaming A16 GA6H | |
| Average Intel Core i7-13620H (66885 - 78867, n=7) | |
| AIDA64 / FPU SinJulia | |
| Lenovo LOQ 15AHP10 | |
| Average of class Gaming (4424 - 33636, n=105, last 2 years) | |
| Gigabyte Aero X16 1WH | |
| Medion Erazer Major 16 X1 MD62736 | |
| MSI Vector 16 HX AI A2XWHG | |
| MSI Katana 17 HX B14WGK | |
| Gigabyte Gaming A16 GA6H | |
| Average Intel Core i7-13620H (6737 - 8421, n=7) | |
| AIDA64 / FPU Mandel | |
| Medion Erazer Major 16 X1 MD62736 | |
| Average of class Gaming (25115 - 128721, n=105, last 2 years) | |
| MSI Vector 16 HX AI A2XWHG | |
| Gigabyte Aero X16 1WH | |
| Lenovo LOQ 15AHP10 | |
| MSI Katana 17 HX B14WGK | |
| Gigabyte Gaming A16 GA6H | |
| Average Intel Core i7-13620H (27242 - 32787, n=7) | |
| AIDA64 / CPU AES | |
| Medion Erazer Major 16 X1 MD62736 | |
| Average of class Gaming (39258 - 247074, n=105, last 2 years) | |
| MSI Vector 16 HX AI A2XWHG | |
| Gigabyte Aero X16 1WH | |
| Lenovo LOQ 15AHP10 | |
| MSI Katana 17 HX B14WGK | |
| Average Intel Core i7-13620H (48646 - 85895, n=7) | |
| Gigabyte Gaming A16 GA6H | |
| AIDA64 / CPU ZLib | |
| Medion Erazer Major 16 X1 MD62736 | |
| Average of class Gaming (574 - 2531, n=105, last 2 years) | |
| MSI Vector 16 HX AI A2XWHG | |
| Gigabyte Aero X16 1WH | |
| Lenovo LOQ 15AHP10 | |
| MSI Katana 17 HX B14WGK | |
| Gigabyte Gaming A16 GA6H | |
| Average Intel Core i7-13620H (688 - 835, n=7) | |
| AIDA64 / FP64 Ray-Trace | |
| Medion Erazer Major 16 X1 MD62736 | |
| Average of class Gaming (5509 - 45446, n=105, last 2 years) | |
| MSI Vector 16 HX AI A2XWHG | |
| Gigabyte Aero X16 1WH | |
| Lenovo LOQ 15AHP10 | |
| MSI Katana 17 HX B14WGK | |
| Gigabyte Gaming A16 GA6H | |
| Average Intel Core i7-13620H (5919 - 7364, n=7) | |
| AIDA64 / CPU PhotoWorxx | |
| Medion Erazer Major 16 X1 MD62736 | |
| Average of class Gaming (12271 - 89891, n=105, last 2 years) | |
| Gigabyte Aero X16 1WH | |
| MSI Vector 16 HX AI A2XWHG | |
| MSI Katana 17 HX B14WGK | |
| Average Intel Core i7-13620H (19421 - 34544, n=7) | |
| Lenovo LOQ 15AHP10 | |
| Gigabyte Gaming A16 GA6H | |
系统性能
在系统性能方面,双方的差距较小,尤其是 Gaming A16 以微弱优势超过了联想 LOQ 15。
PCMark 10: Score | Essentials | Productivity | Digital Content Creation
CrossMark: Overall | Productivity | Creativity | Responsiveness
WebXPRT 3: Overall
WebXPRT 4: Overall
Mozilla Kraken 1.1: Total
| Performance rating | |
| Medion Erazer Major 16 X1 MD62736 | |
| Average of class Gaming | |
| MSI Vector 16 HX AI A2XWHG | |
| Gigabyte Aero X16 1WH | |
| MSI Katana 17 HX B14WGK | |
| Gigabyte Gaming A16 GA6H | |
| Average Intel Core i7-13620H, NVIDIA GeForce RTX 5070 Laptop | |
| Lenovo LOQ 15AHP10 -2! | |
| PCMark 10 / Score | |
| Average of class Gaming (5828 - 12414, n=93, last 2 years) | |
| Gigabyte Aero X16 1WH | |
| Medion Erazer Major 16 X1 MD62736 | |
| MSI Vector 16 HX AI A2XWHG | |
| Lenovo LOQ 15AHP10 | |
| MSI Katana 17 HX B14WGK | |
| Gigabyte Gaming A16 GA6H | |
| Average Intel Core i7-13620H, NVIDIA GeForce RTX 5070 Laptop (n=1) | |
| PCMark 10 / Essentials | |
| Medion Erazer Major 16 X1 MD62736 | |
| MSI Vector 16 HX AI A2XWHG | |
| Average of class Gaming (8810 - 11935, n=97, last 2 years) | |
| Gigabyte Aero X16 1WH | |
| Lenovo LOQ 15AHP10 | |
| MSI Katana 17 HX B14WGK | |
| Gigabyte Gaming A16 GA6H | |
| Average Intel Core i7-13620H, NVIDIA GeForce RTX 5070 Laptop (n=1) | |
| PCMark 10 / Productivity | |
| Average of class Gaming (6845 - 25323, n=95, last 2 years) | |
| Gigabyte Aero X16 1WH | |
| MSI Vector 16 HX AI A2XWHG | |
| Medion Erazer Major 16 X1 MD62736 | |
| Lenovo LOQ 15AHP10 | |
| Gigabyte Gaming A16 GA6H | |
| Average Intel Core i7-13620H, NVIDIA GeForce RTX 5070 Laptop (n=1) | |
| MSI Katana 17 HX B14WGK | |
| PCMark 10 / Digital Content Creation | |
| Average of class Gaming (7602 - 19954, n=95, last 2 years) | |
| Medion Erazer Major 16 X1 MD62736 | |
| MSI Vector 16 HX AI A2XWHG | |
| Gigabyte Aero X16 1WH | |
| MSI Katana 17 HX B14WGK | |
| Gigabyte Gaming A16 GA6H | |
| Average Intel Core i7-13620H, NVIDIA GeForce RTX 5070 Laptop (n=1) | |
| Lenovo LOQ 15AHP10 | |
| CrossMark / Overall | |
| Medion Erazer Major 16 X1 MD62736 | |
| Average of class Gaming (1366 - 2409, n=94, last 2 years) | |
| MSI Katana 17 HX B14WGK | |
| MSI Vector 16 HX AI A2XWHG | |
| Gigabyte Gaming A16 GA6H | |
| Average Intel Core i7-13620H, NVIDIA GeForce RTX 5070 Laptop (n=1) | |
| Gigabyte Aero X16 1WH | |
| Lenovo LOQ 15AHP10 | |
| CrossMark / Productivity | |
| Medion Erazer Major 16 X1 MD62736 | |
| MSI Katana 17 HX B14WGK | |
| Average of class Gaming (1386 - 2254, n=94, last 2 years) | |
| MSI Vector 16 HX AI A2XWHG | |
| Gigabyte Gaming A16 GA6H | |
| Average Intel Core i7-13620H, NVIDIA GeForce RTX 5070 Laptop (n=1) | |
| Lenovo LOQ 15AHP10 | |
| Gigabyte Aero X16 1WH | |
| CrossMark / Creativity | |
| Medion Erazer Major 16 X1 MD62736 | |
| MSI Vector 16 HX AI A2XWHG | |
| Average of class Gaming (1343 - 2786, n=94, last 2 years) | |
| MSI Katana 17 HX B14WGK | |
| Gigabyte Aero X16 1WH | |
| Gigabyte Gaming A16 GA6H | |
| Average Intel Core i7-13620H, NVIDIA GeForce RTX 5070 Laptop (n=1) | |
| Lenovo LOQ 15AHP10 | |
| CrossMark / Responsiveness | |
| MSI Katana 17 HX B14WGK | |
| Gigabyte Gaming A16 GA6H | |
| Average Intel Core i7-13620H, NVIDIA GeForce RTX 5070 Laptop (n=1) | |
| Medion Erazer Major 16 X1 MD62736 | |
| Average of class Gaming (1226 - 2334, n=94, last 2 years) | |
| Lenovo LOQ 15AHP10 | |
| MSI Vector 16 HX AI A2XWHG | |
| Gigabyte Aero X16 1WH | |
| WebXPRT 3 / Overall | |
| Gigabyte Aero X16 1WH | |
| Medion Erazer Major 16 X1 MD62736 | |
| MSI Vector 16 HX AI A2XWHG | |
| Average of class Gaming (220 - 532, n=98, last 2 years) | |
| MSI Katana 17 HX B14WGK | |
| Gigabyte Gaming A16 GA6H | |
| Average Intel Core i7-13620H, NVIDIA GeForce RTX 5070 Laptop (n=1) | |
| WebXPRT 4 / Overall | |
| Medion Erazer Major 16 X1 MD62736 | |
| MSI Vector 16 HX AI A2XWHG | |
| Average of class Gaming (165 - 354, n=98, last 2 years) | |
| Gigabyte Aero X16 1WH | |
| MSI Katana 17 HX B14WGK | |
| Gigabyte Gaming A16 GA6H | |
| Average Intel Core i7-13620H, NVIDIA GeForce RTX 5070 Laptop (n=1) | |
| Mozilla Kraken 1.1 / Total | |
| Lenovo LOQ 15AHP10 | |
| Gigabyte Gaming A16 GA6H | |
| Average Intel Core i7-13620H, NVIDIA GeForce RTX 5070 Laptop (n=1) | |
| MSI Katana 17 HX B14WGK | |
| Average of class Gaming (391 - 590, n=100, last 2 years) | |
| Gigabyte Aero X16 1WH | |
| MSI Vector 16 HX AI A2XWHG | |
| Medion Erazer Major 16 X1 MD62736 | |
* ... smaller is better
| PCMark 10 Score | 6805 points | |
Help | ||
| AIDA64 / Memory Copy | |
| Medion Erazer Major 16 X1 MD62736 | |
| Gigabyte Aero X16 1WH | |
| Average of class Gaming (21750 - 129946, n=105, last 2 years) | |
| MSI Vector 16 HX AI A2XWHG | |
| MSI Katana 17 HX B14WGK | |
| Average Intel Core i7-13620H (31629 - 53927, n=7) | |
| Lenovo LOQ 15AHP10 | |
| Gigabyte Gaming A16 GA6H | |
| AIDA64 / Memory Read | |
| Medion Erazer Major 16 X1 MD62736 | |
| MSI Vector 16 HX AI A2XWHG | |
| Average of class Gaming (22956 - 118858, n=105, last 2 years) | |
| MSI Katana 17 HX B14WGK | |
| Gigabyte Aero X16 1WH | |
| Average Intel Core i7-13620H (35115 - 61853, n=7) | |
| Gigabyte Gaming A16 GA6H | |
| Lenovo LOQ 15AHP10 | |
| AIDA64 / Memory Write | |
| Medion Erazer Major 16 X1 MD62736 | |
| Gigabyte Aero X16 1WH | |
| Average of class Gaming (22297 - 135096, n=105, last 2 years) | |
| MSI Vector 16 HX AI A2XWHG | |
| MSI Katana 17 HX B14WGK | |
| Average Intel Core i7-13620H (30611 - 54111, n=7) | |
| Lenovo LOQ 15AHP10 | |
| Gigabyte Gaming A16 GA6H | |
| AIDA64 / Memory Latency | |
| Medion Erazer Major 16 X1 MD62736 | |
| Average of class Gaming (75.3 - 259, n=105, last 2 years) | |
| MSI Vector 16 HX AI A2XWHG | |
| Gigabyte Gaming A16 GA6H | |
| Average Intel Core i7-13620H (75.9 - 108.2, n=7) | |
| Lenovo LOQ 15AHP10 | |
| Gigabyte Aero X16 1WH | |
| MSI Katana 17 HX B14WGK | |
* ... smaller is better
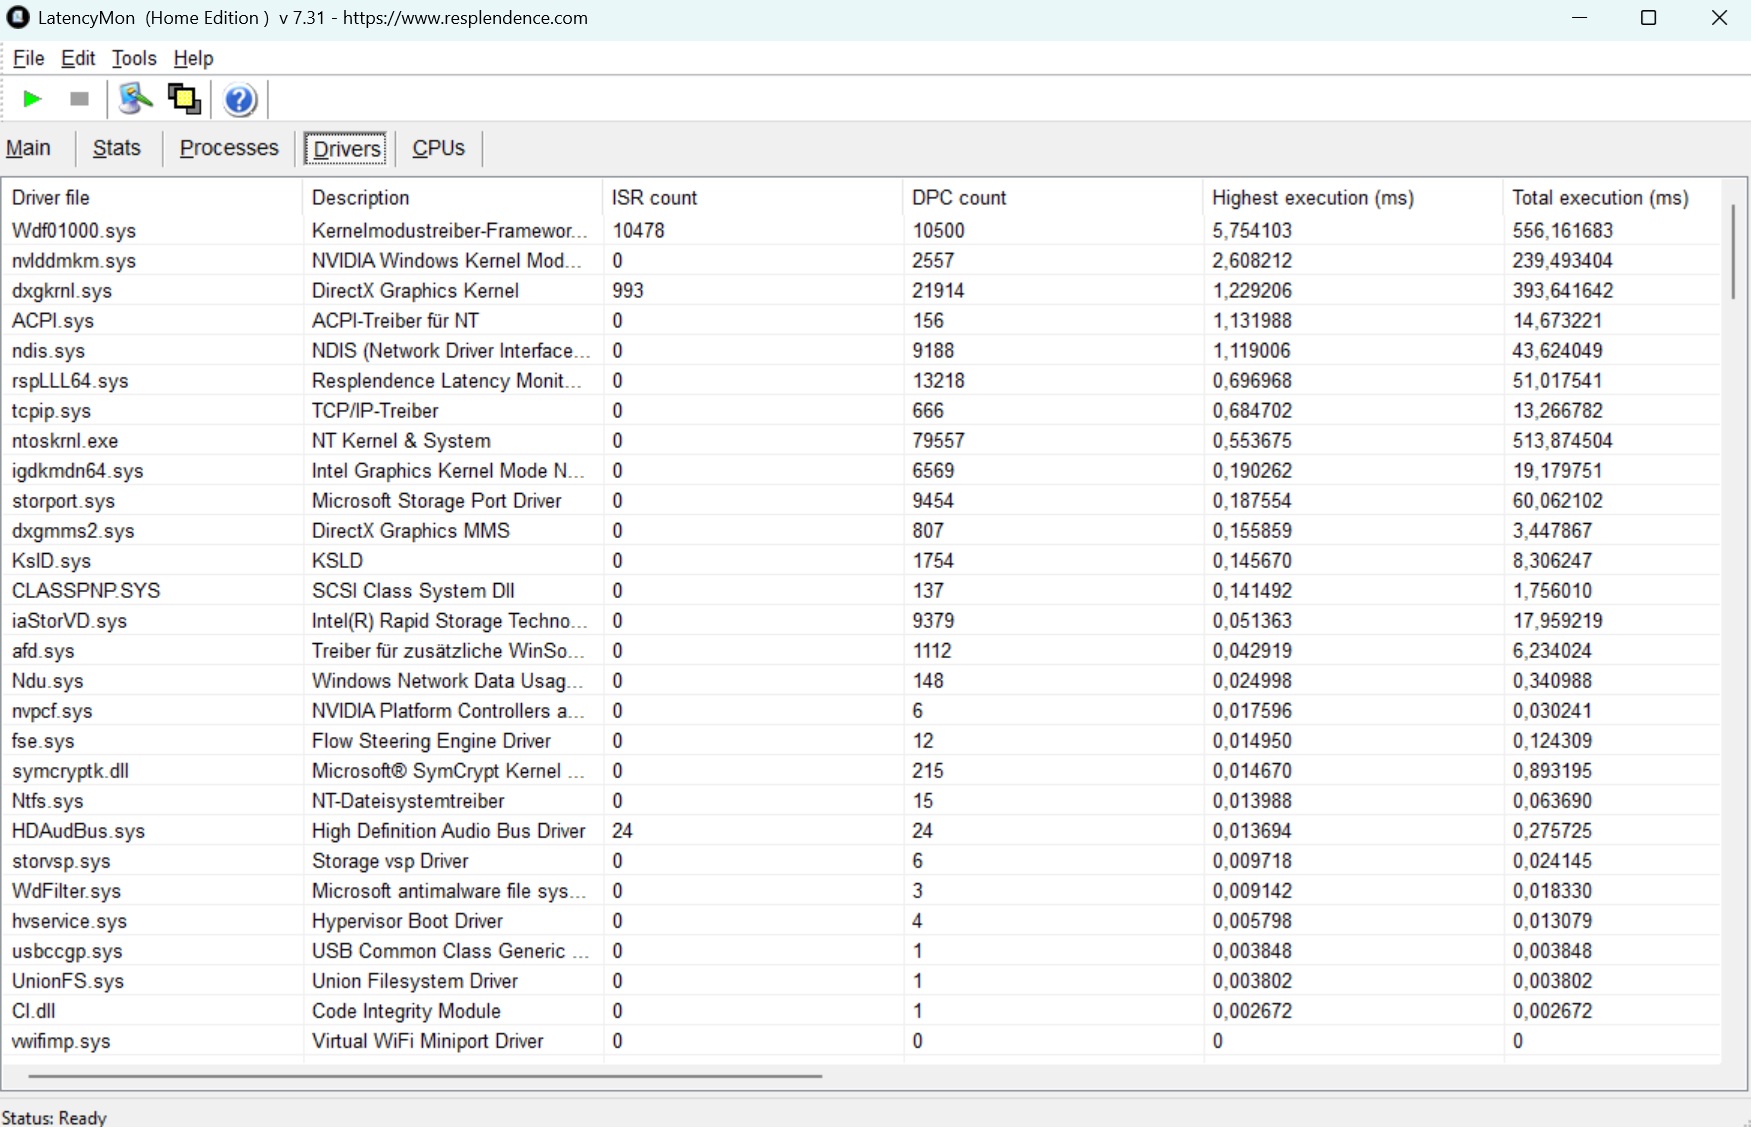
DPC 延迟
目前,延迟几乎是所有 Windows 笔记本电脑的软肋,而技嘉机型在这方面的表现也不尽如人意。
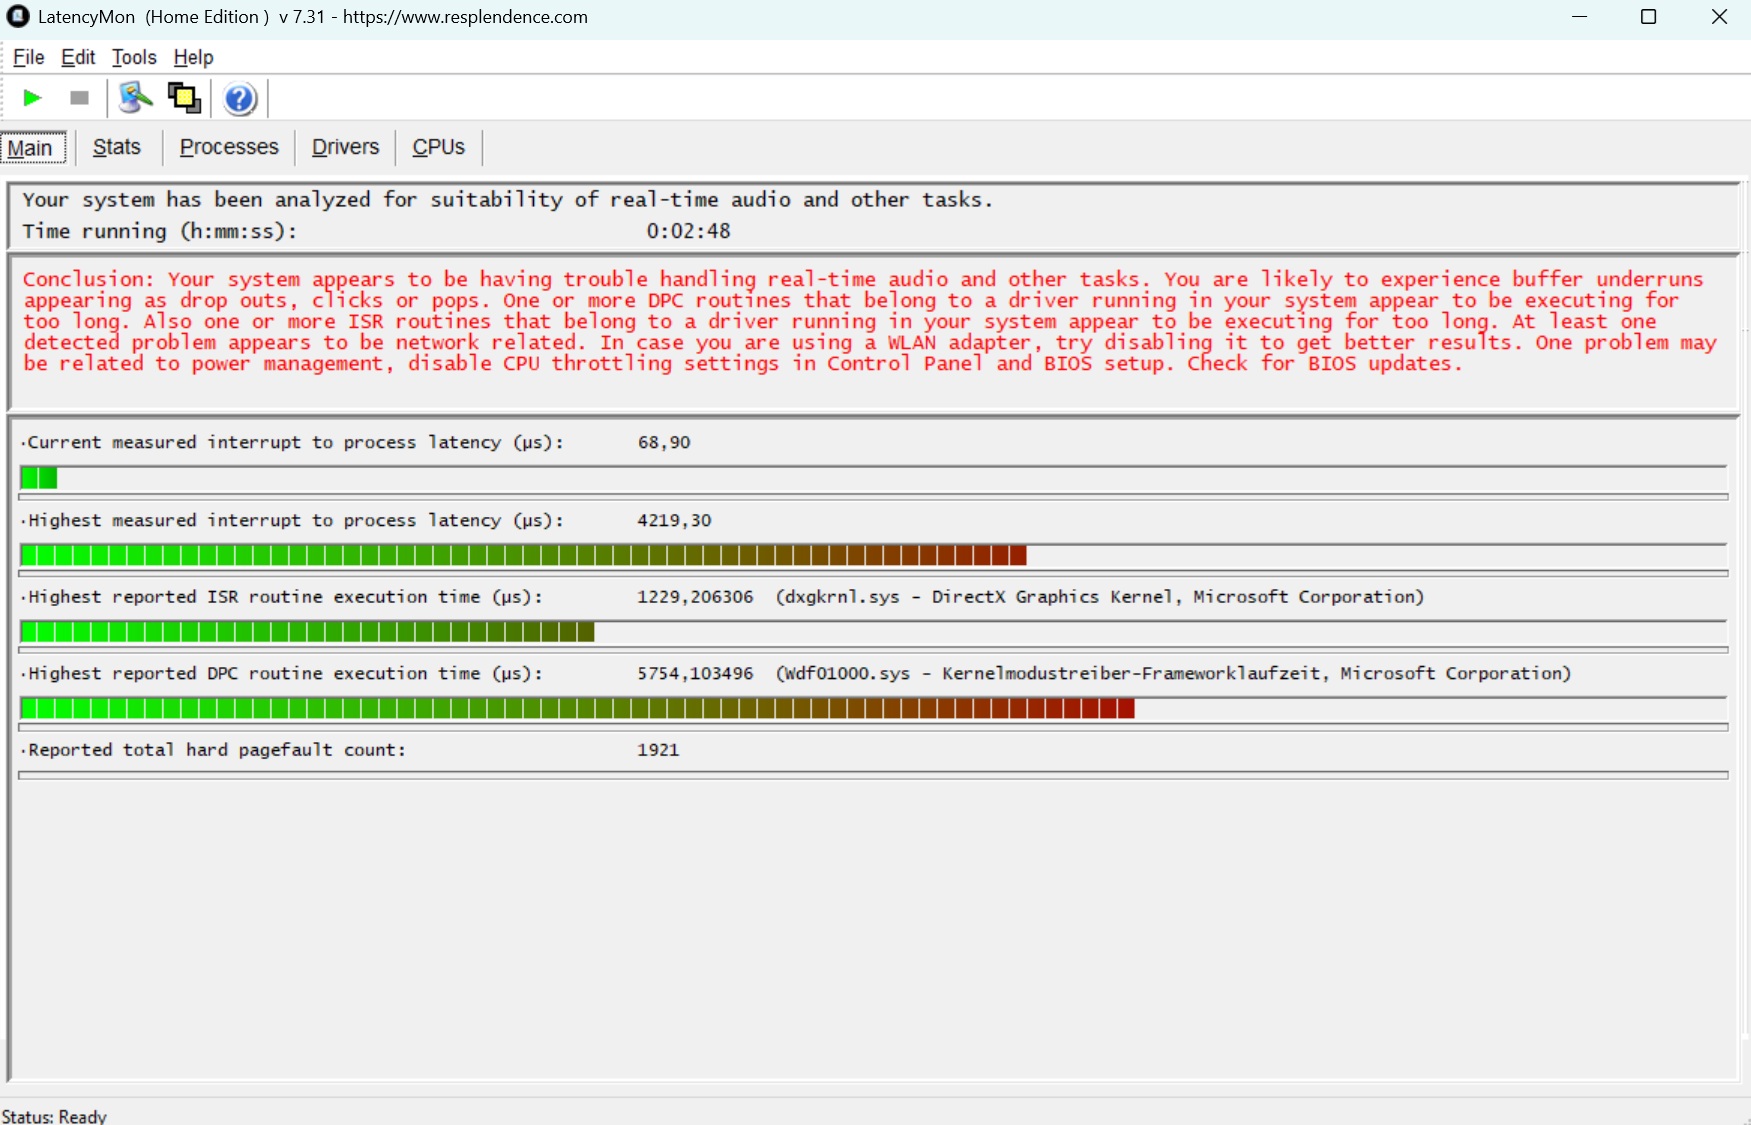
| DPC Latencies / LatencyMon - interrupt to process latency (max), Web, Youtube, Prime95 | |
| MSI Katana 17 HX B14WGK | |
| MSI Vector 16 HX AI A2XWHG | |
| Gigabyte Gaming A16 GA6H | |
| Medion Erazer Major 16 X1 MD62736 | |
| Gigabyte Aero X16 1WH | |
| Lenovo LOQ 15AHP10 | |
* ... smaller is better
大容量存储器
在 DiskSpd 循环中,Gaming A16 遗憾地落后于 LOQ 15,后者也在固态硬盘速度随时间节流的问题上挣扎。除此之外,金士顿 NVMe 硬盘的性能表现一般(见表)。

* ... smaller is better
Sustained Performance Read: DiskSpd Read Loop, Queue Depth 8
图形处理器性能
在笔记本电脑领域,几乎没有哪款显卡能像GeForce RTX 5070 一样备受热议。虽然 Ti 型号拥有 12 GB 的 VRAM,但标准版只能使用微不足道的 8 GB,尤其是因为技嘉将 TGP 限制在 85 瓦(包括动态提升)。尤其是后一项决定,并没有在合成测试中取得优异成绩。Gaming A16 的成绩略低于迄今为止该显卡的平均成绩,与廉价版联想 LOQ 15 中的 RTX 5060 相比,几乎毫无优势可言。
| 3DMark 11 Performance | 33991 points | |
| 3DMark Cloud Gate Standard Score | 62493 points | |
| 3DMark Fire Strike Score | 26381 points | |
| 3DMark Time Spy Score | 11917 points | |
Help | ||
* ... smaller is better
游戏性能
| Final Fantasy XV Benchmark - 1920x1080 High Quality | |
| Medion Erazer Major 16 X1 MD62736 | |
| MSI Vector 16 HX AI A2XWHG | |
| Average of class Gaming (41 - 215, n=95, last 2 years) | |
| Average NVIDIA GeForce RTX 5070 Laptop (96 - 150.7, n=26) | |
| Gigabyte Aero X16 1WH | |
| Lenovo LOQ 15AHP10 | |
| Gigabyte Gaming A16 GA6H | |
| Strange Brigade - 1920x1080 ultra AA:ultra AF:16 | |
| Average of class Gaming (76.3 - 458, n=87, last 2 years) | |
| Average NVIDIA GeForce RTX 5070 Laptop (203 - 261, n=24) | |
| Gigabyte Aero X16 1WH | |
| Lenovo LOQ 15AHP10 | |
| Gigabyte Gaming A16 GA6H | |
| The Elder Scrolls IV Oblivion Remastered | |
| 2560x1440 Ultra Preset AA:T | |
| Medion Erazer Major 16 X1 MD62736 | |
| MSI Vector 16 HX AI A2XWHG | |
| Average of class Gaming (12.7 - 45.9, n=14, last 2 years) | |
| MSI Katana 17 HX B14WGK | |
| Gigabyte Gaming A16 GA6H | |
| Average NVIDIA GeForce RTX 5070 Laptop (19.5 - 20.9, n=3) | |
| Lenovo LOQ 15AHP10 | |
| 2560x1440 Ultra Preset + Quality DLSS | |
| Medion Erazer Major 16 X1 MD62736 | |
| MSI Vector 16 HX AI A2XWHG | |
| Average of class Gaming (25.3 - 59.7, n=12, last 2 years) | |
| Average NVIDIA GeForce RTX 5070 Laptop (30.3 - 34, n=3) | |
| MSI Katana 17 HX B14WGK | |
| Gigabyte Gaming A16 GA6H | |
| Lenovo LOQ 15AHP10 | |
| low | med. | high | ultra | QHD DLSS | QHD | |
|---|---|---|---|---|---|---|
| GTA V (2015) | 179 | 158.2 | 102.5 | 96 | ||
| Dota 2 Reborn (2015) | 182.6 | 165.1 | 159 | 148.7 | ||
| Final Fantasy XV Benchmark (2018) | 128.6 | 96 | 86.5 | |||
| X-Plane 11.11 (2018) | 125.9 | 112.9 | 99.4 | |||
| Strange Brigade (2018) | 287 | 243 | 203 | 149.7 | ||
| Baldur's Gate 3 (2023) | 118.5 | 106 | 103.5 | 71.1 | ||
| Cyberpunk 2077 (2023) | 90.2 | 84.5 | 82.4 | 57.2 | ||
| Stalker 2 (2024) | 54.7 | 51.7 | 45.7 | 66.9 | 34.2 | |
| Indiana Jones and the Great Circle (2024) | 54.7 | 31 | 24 | |||
| Kingdom Come Deliverance 2 (2025) | 101.7 | 86.1 | 63.8 | 58.5 | 42.6 | |
| Civilization 7 (2025) | 155.9 | 131.7 | 90.7 | |||
| The Elder Scrolls IV Oblivion Remastered (2025) | 55.6 | 47.3 | 27.8 | 30.3 | 20.2 | |
| Doom: The Dark Ages (2025) | 64.6 | 60.5 | 59 | 54.6 | 39.5 |
在 30 分钟的 赛博朋克 2077测试中没有出现异常情况,帧速率在整个测试期间保持相当稳定
Cyberpunk 2077 ultra FPS diagram
排放量
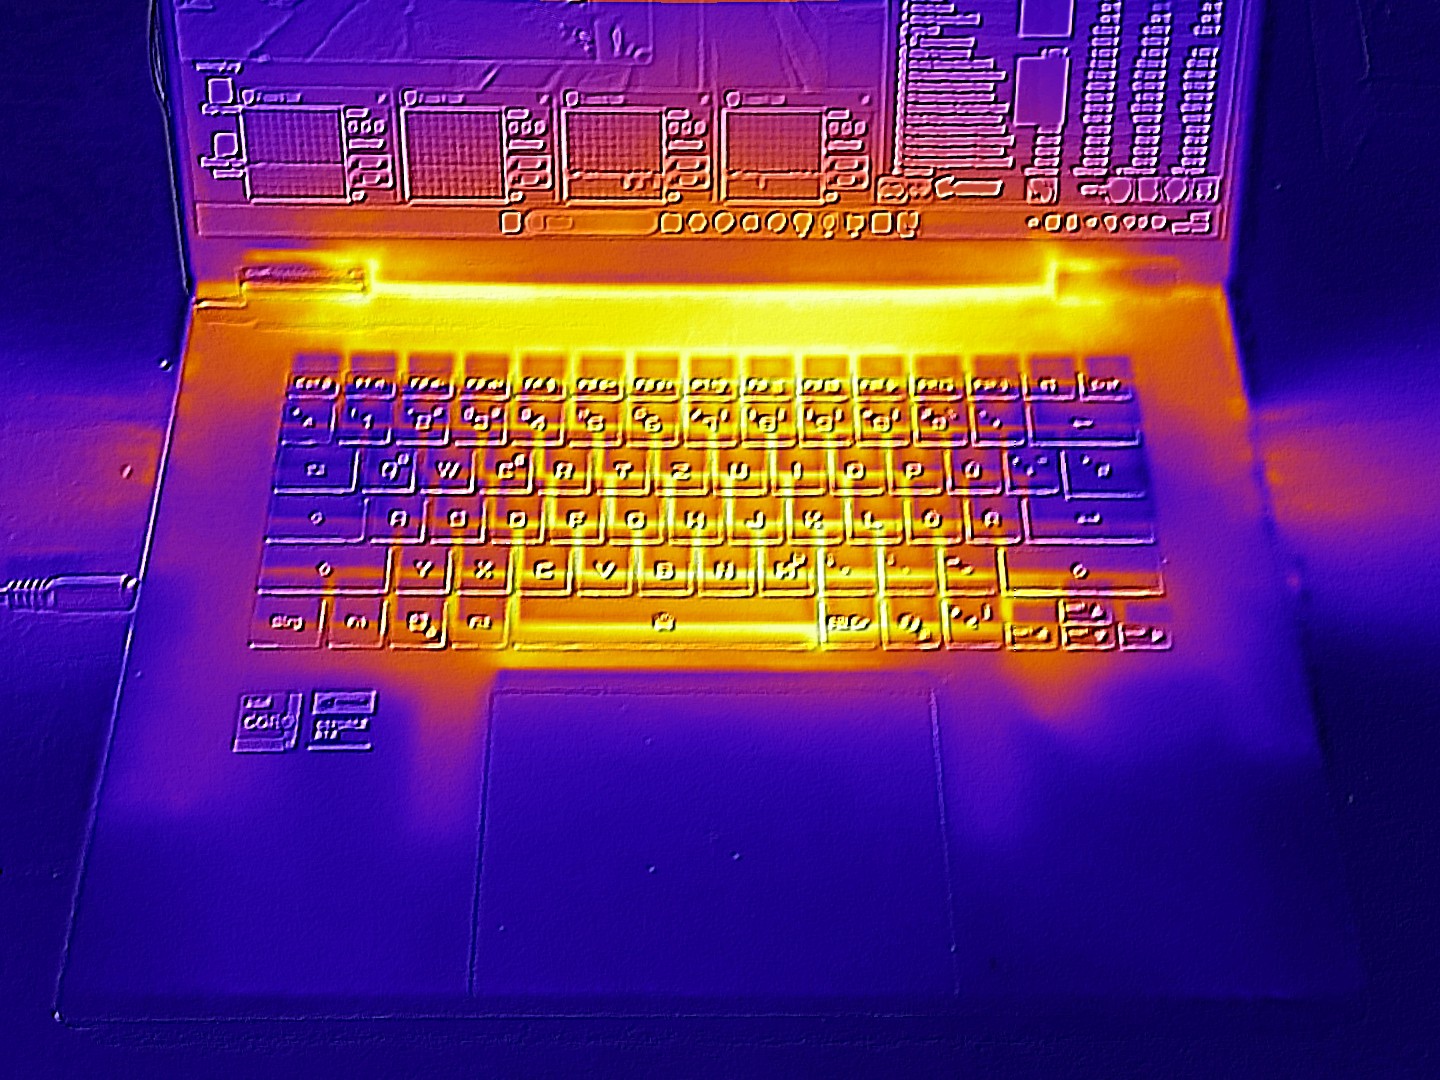
噪音排放
空载运行时,Gaming A16 仍然安静宜人。25 至 27 分贝(A)的噪音比大多数竞争对手都要小。不过,当使用游戏模式时,风扇在负载情况下会大幅转动,达到 54 至 55 分贝(A)的极高噪音水平--这表明你最好使用耳机。
Noise level
| Idle |
| 25 / 26 / 27 dB(A) |
| Load |
| 54 / 55 dB(A) |
 | ||
30 dB silent 40 dB(A) audible 50 dB(A) loud |
||
min: | ||
| Gigabyte Gaming A16 GA6H i7-13620H, GeForce RTX 5070 Laptop | Gigabyte Aero X16 1WH Ryzen AI 7 350, GeForce RTX 5070 Laptop | MSI Katana 17 HX B14WGK i7-14650HX, GeForce RTX 5070 Laptop | MSI Vector 16 HX AI A2XWHG Ultra 7 255HX, GeForce RTX 5070 Ti Laptop | Medion Erazer Major 16 X1 MD62736 Ultra 7 255HX, GeForce RTX 5070 Ti Laptop | Lenovo LOQ 15AHP10 R7 250, GeForce RTX 5060 Laptop | |
|---|---|---|---|---|---|---|
| Noise | 11% | -12% | -10% | -3% | -31% | |
| off / environment * (dB) | 24 | 23.9 -0% | 25 -4% | 25 -4% | 25 -4% | 25 -4% |
| Idle Minimum * (dB) | 25 | 23.9 4% | 31 -24% | 33 -32% | 26 -4% | 43 -72% |
| Idle Average * (dB) | 26 | 23.9 8% | 32 -23% | 34 -31% | 27 -4% | 45 -73% |
| Idle Maximum * (dB) | 27 | 23.9 11% | 34 -26% | 38 -41% | 30 -11% | 48 -78% |
| Load Average * (dB) | 54 | 33.2 39% | 50 7% | 46 15% | 53 2% | 53 2% |
| Cyberpunk 2077 ultra * (dB) | 54 | 50.2 7% | 58 -7% | 47 13% | 54 -0% | 51 6% |
| Load Maximum * (dB) | 55 | 50.2 9% | 59 -7% | 49 11% | 54 2% | 53 4% |
* ... smaller is better
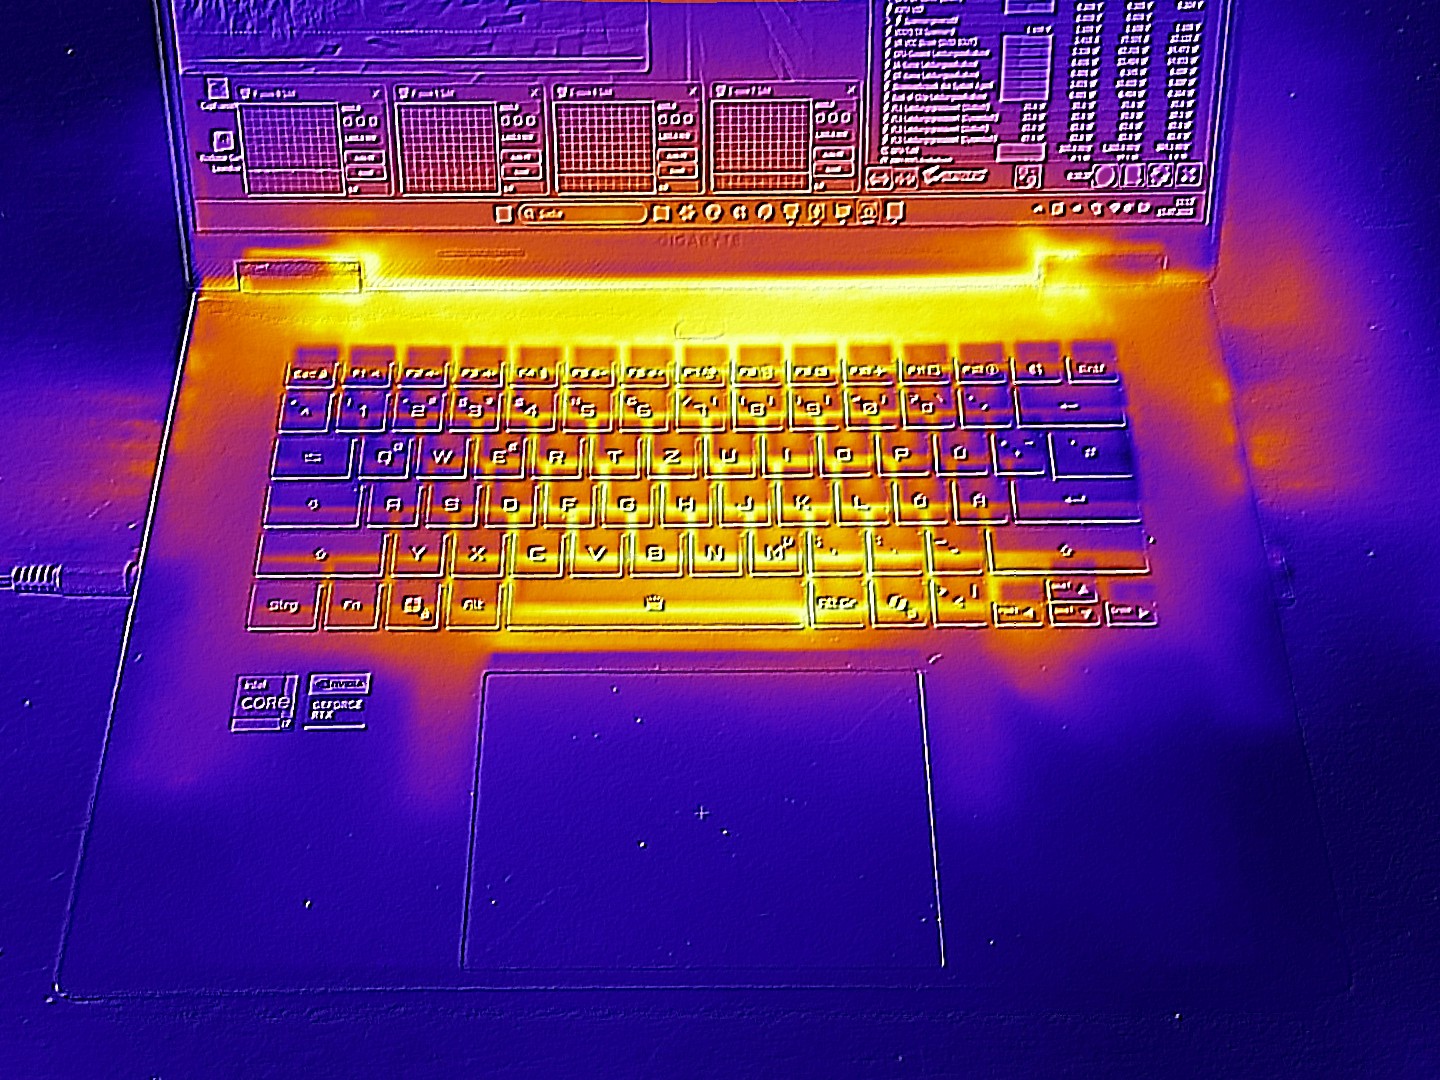
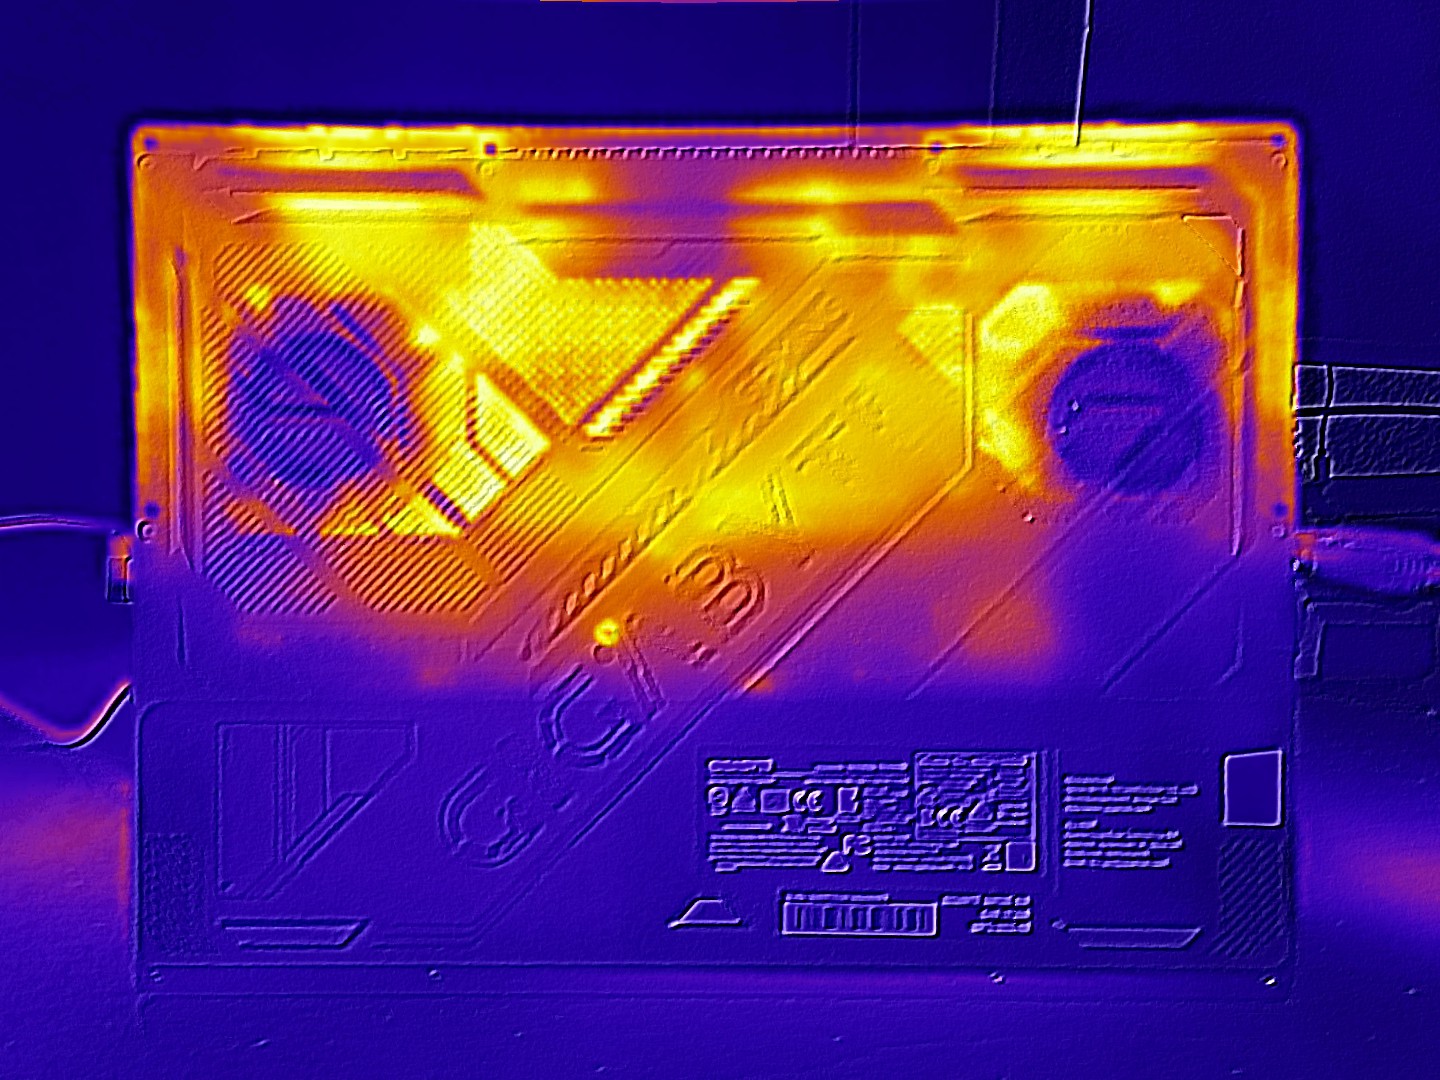
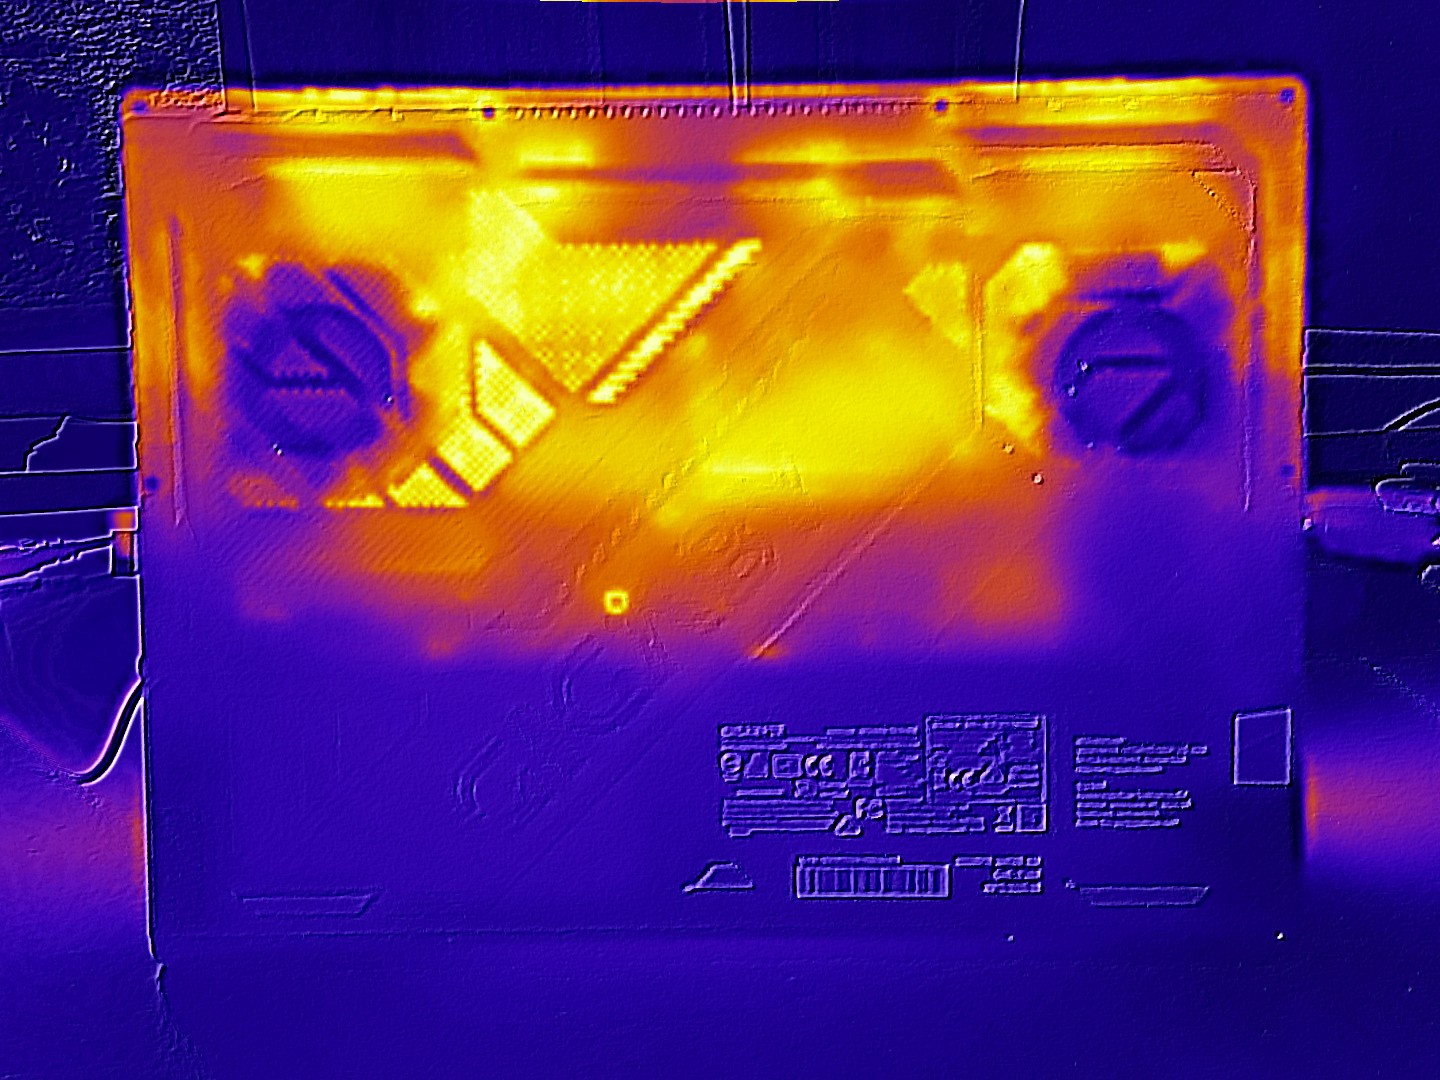
温度
下面我们来看看温度,这主要是基于其他游戏机型。在 3D 运行时,我们测得机箱顶部温度高达 50°C,底部温度高达 49°C,而在空转时,机箱温度则保持在 31°C 左右。
(-) The maximum temperature on the upper side is 50 °C / 122 F, compared to the average of 40.4 °C / 105 F, ranging from 21.2 to 68.8 °C for the class Gaming.
(-) The bottom heats up to a maximum of 49 °C / 120 F, compared to the average of 43.2 °C / 110 F
(+) In idle usage, the average temperature for the upper side is 31.2 °C / 88 F, compared to the device average of 33.9 °C / 93 F.
(-) 3: The average temperature for the upper side is 42.2 °C / 108 F, compared to the average of 33.9 °C / 93 F for the class Gaming.
(+) The palmrests and touchpad are reaching skin temperature as a maximum (35 °C / 95 F) and are therefore not hot.
(-) The average temperature of the palmrest area of similar devices was 28.8 °C / 83.8 F (-6.2 °C / -11.2 F).
| Gigabyte Gaming A16 GA6H i7-13620H, GeForce RTX 5070 Laptop | Gigabyte Aero X16 1WH Ryzen AI 7 350, GeForce RTX 5070 Laptop | MSI Katana 17 HX B14WGK i7-14650HX, GeForce RTX 5070 Laptop | MSI Vector 16 HX AI A2XWHG Ultra 7 255HX, GeForce RTX 5070 Ti Laptop | Medion Erazer Major 16 X1 MD62736 Ultra 7 255HX, GeForce RTX 5070 Ti Laptop | Lenovo LOQ 15AHP10 R7 250, GeForce RTX 5060 Laptop | |
|---|---|---|---|---|---|---|
| Heat | 13% | -2% | 2% | -3% | 2% | |
| Maximum Upper Side * (°C) | 50 | 43.3 13% | 52 -4% | 53 -6% | 49 2% | 49 2% |
| Maximum Bottom * (°C) | 49 | 50.3 -3% | 56 -14% | 52 -6% | 50 -2% | 58 -18% |
| Idle Upper Side * (°C) | 35 | 27 23% | 33 6% | 33 6% | 36 -3% | 32 9% |
| Idle Bottom * (°C) | 34 | 28.3 17% | 32 6% | 29 15% | 37 -9% | 29 15% |
* ... smaller is better
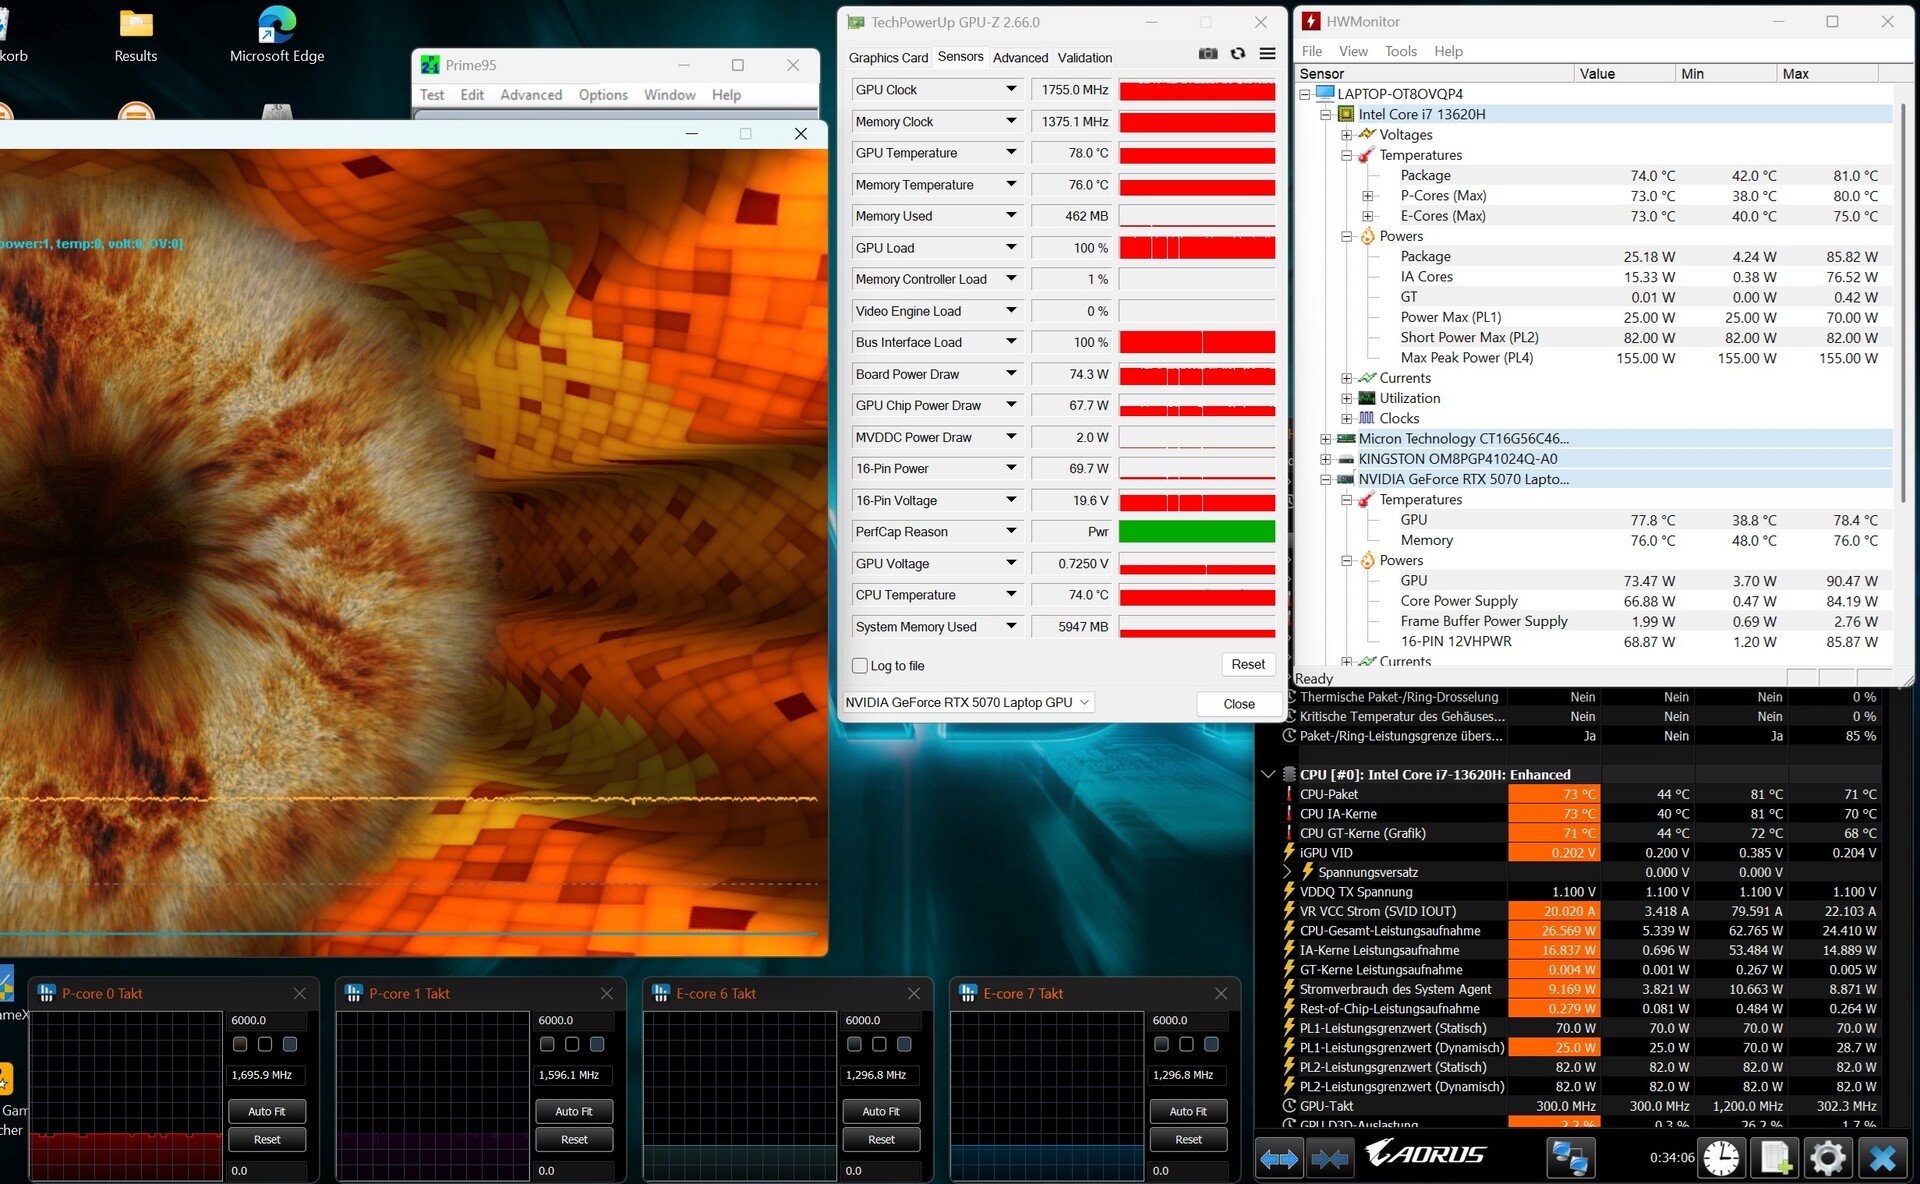
压力测试
我们使用 Furmark 和 Prime95 工具进行的压力测试结果显示,CPU 温度约为 74°C,GPU 温度约为 78°C,这两个数值都还算适中。
发言人
与竞争对手相比,这款 16 英寸设备的音质出奇地好。例如,技嘉型号就比微星 Vector 16 表现更好,尽管后者在低音方面有些欠缺。
Gigabyte Gaming A16 GA6H audio analysis
(±) | speaker loudness is average but good (81 dB)
Bass 100 - 315 Hz
(±) | reduced bass - on average 13.3% lower than median
(±) | linearity of bass is average (12.1% delta to prev. frequency)
Mids 400 - 2000 Hz
(+) | balanced mids - only 4.9% away from median
(+) | mids are linear (5.2% delta to prev. frequency)
Highs 2 - 16 kHz
(+) | balanced highs - only 2.2% away from median
(+) | highs are linear (6.4% delta to prev. frequency)
Overall 100 - 16.000 Hz
(+) | overall sound is linear (13.3% difference to median)
Compared to same class
» 19% of all tested devices in this class were better, 5% similar, 76% worse
» The best had a delta of 6%, average was 18%, worst was 132%
Compared to all devices tested
» 14% of all tested devices were better, 3% similar, 83% worse
» The best had a delta of 4%, average was 23%, worst was 134%
MSI Vector 16 HX AI A2XWHG audio analysis
(+) | speakers can play relatively loud (86 dB)
Bass 100 - 315 Hz
(±) | reduced bass - on average 12.3% lower than median
(±) | linearity of bass is average (8.5% delta to prev. frequency)
Mids 400 - 2000 Hz
(±) | higher mids - on average 9.9% higher than median
(+) | mids are linear (6.8% delta to prev. frequency)
Highs 2 - 16 kHz
(+) | balanced highs - only 1.8% away from median
(+) | highs are linear (2.9% delta to prev. frequency)
Overall 100 - 16.000 Hz
(±) | linearity of overall sound is average (15.8% difference to median)
Compared to same class
» 37% of all tested devices in this class were better, 7% similar, 56% worse
» The best had a delta of 6%, average was 18%, worst was 132%
Compared to all devices tested
» 24% of all tested devices were better, 5% similar, 70% worse
» The best had a delta of 4%, average was 23%, worst was 134%
能源管理
耗电量
怠速功耗从正面看并不突出。它的功耗范围为 9 至 23 瓦,而在负载情况下,功耗会增加到 91 至 155 瓦。这向许多竞争对手证明了游戏笔记本电脑的经济性。不过,值得注意的是,当连接到外部显示器时,dGPU 始终处于激活状态。
| Off / Standby | |
| Idle | |
| Load |
|
Key:
min: | |
| Gigabyte Gaming A16 GA6H i7-13620H, GeForce RTX 5070 Laptop | Gigabyte Aero X16 1WH Ryzen AI 7 350, GeForce RTX 5070 Laptop | MSI Katana 17 HX B14WGK i7-14650HX, GeForce RTX 5070 Laptop | MSI Vector 16 HX AI A2XWHG Ultra 7 255HX, GeForce RTX 5070 Ti Laptop | Medion Erazer Major 16 X1 MD62736 Ultra 7 255HX, GeForce RTX 5070 Ti Laptop | Lenovo LOQ 15AHP10 R7 250, GeForce RTX 5060 Laptop | Average of class Gaming | |
|---|---|---|---|---|---|---|---|
| Power Consumption | 15% | -34% | -49% | -65% | -33% | -43% | |
| Idle Minimum * (Watt) | 9 | 5.8 36% | 9.7 -8% | 7.1 21% | 17.8 -98% | 20 -122% | 13 ? -44% |
| Idle Average * (Watt) | 11 | 10.9 1% | 15 -36% | 15.9 -45% | 20.7 -88% | 20.7 -88% | 19 ? -73% |
| Idle Maximum * (Watt) | 23 | 11.2 51% | 23.7 -3% | 29.5 -28% | 23.4 -2% | 22.7 1% | 24.6 ? -7% |
| Load Average * (Watt) | 91 | 91.3 -0% | 126 -38% | 124 -36% | 110 -21% | 71 22% | 110.7 ? -22% |
| Cyberpunk 2077 ultra * (Watt) | 132.5 | 123.8 7% | 205 -55% | 222 -68% | 233 -76% | 153.1 -16% | |
| Cyberpunk 2077 ultra external monitor * (Watt) | 130 | 117.9 9% | 202 -55% | 217 -67% | 232 -78% | 151.1 -16% | |
| Load Maximum * (Watt) | 155 | 155.3 -0% | 227 -46% | 336 -117% | 297 -92% | 172 -11% | 259 ? -67% |
* ... smaller is better
Power consumption Cyberpunk / stress test
Power consumption with an external monitor
电池寿命
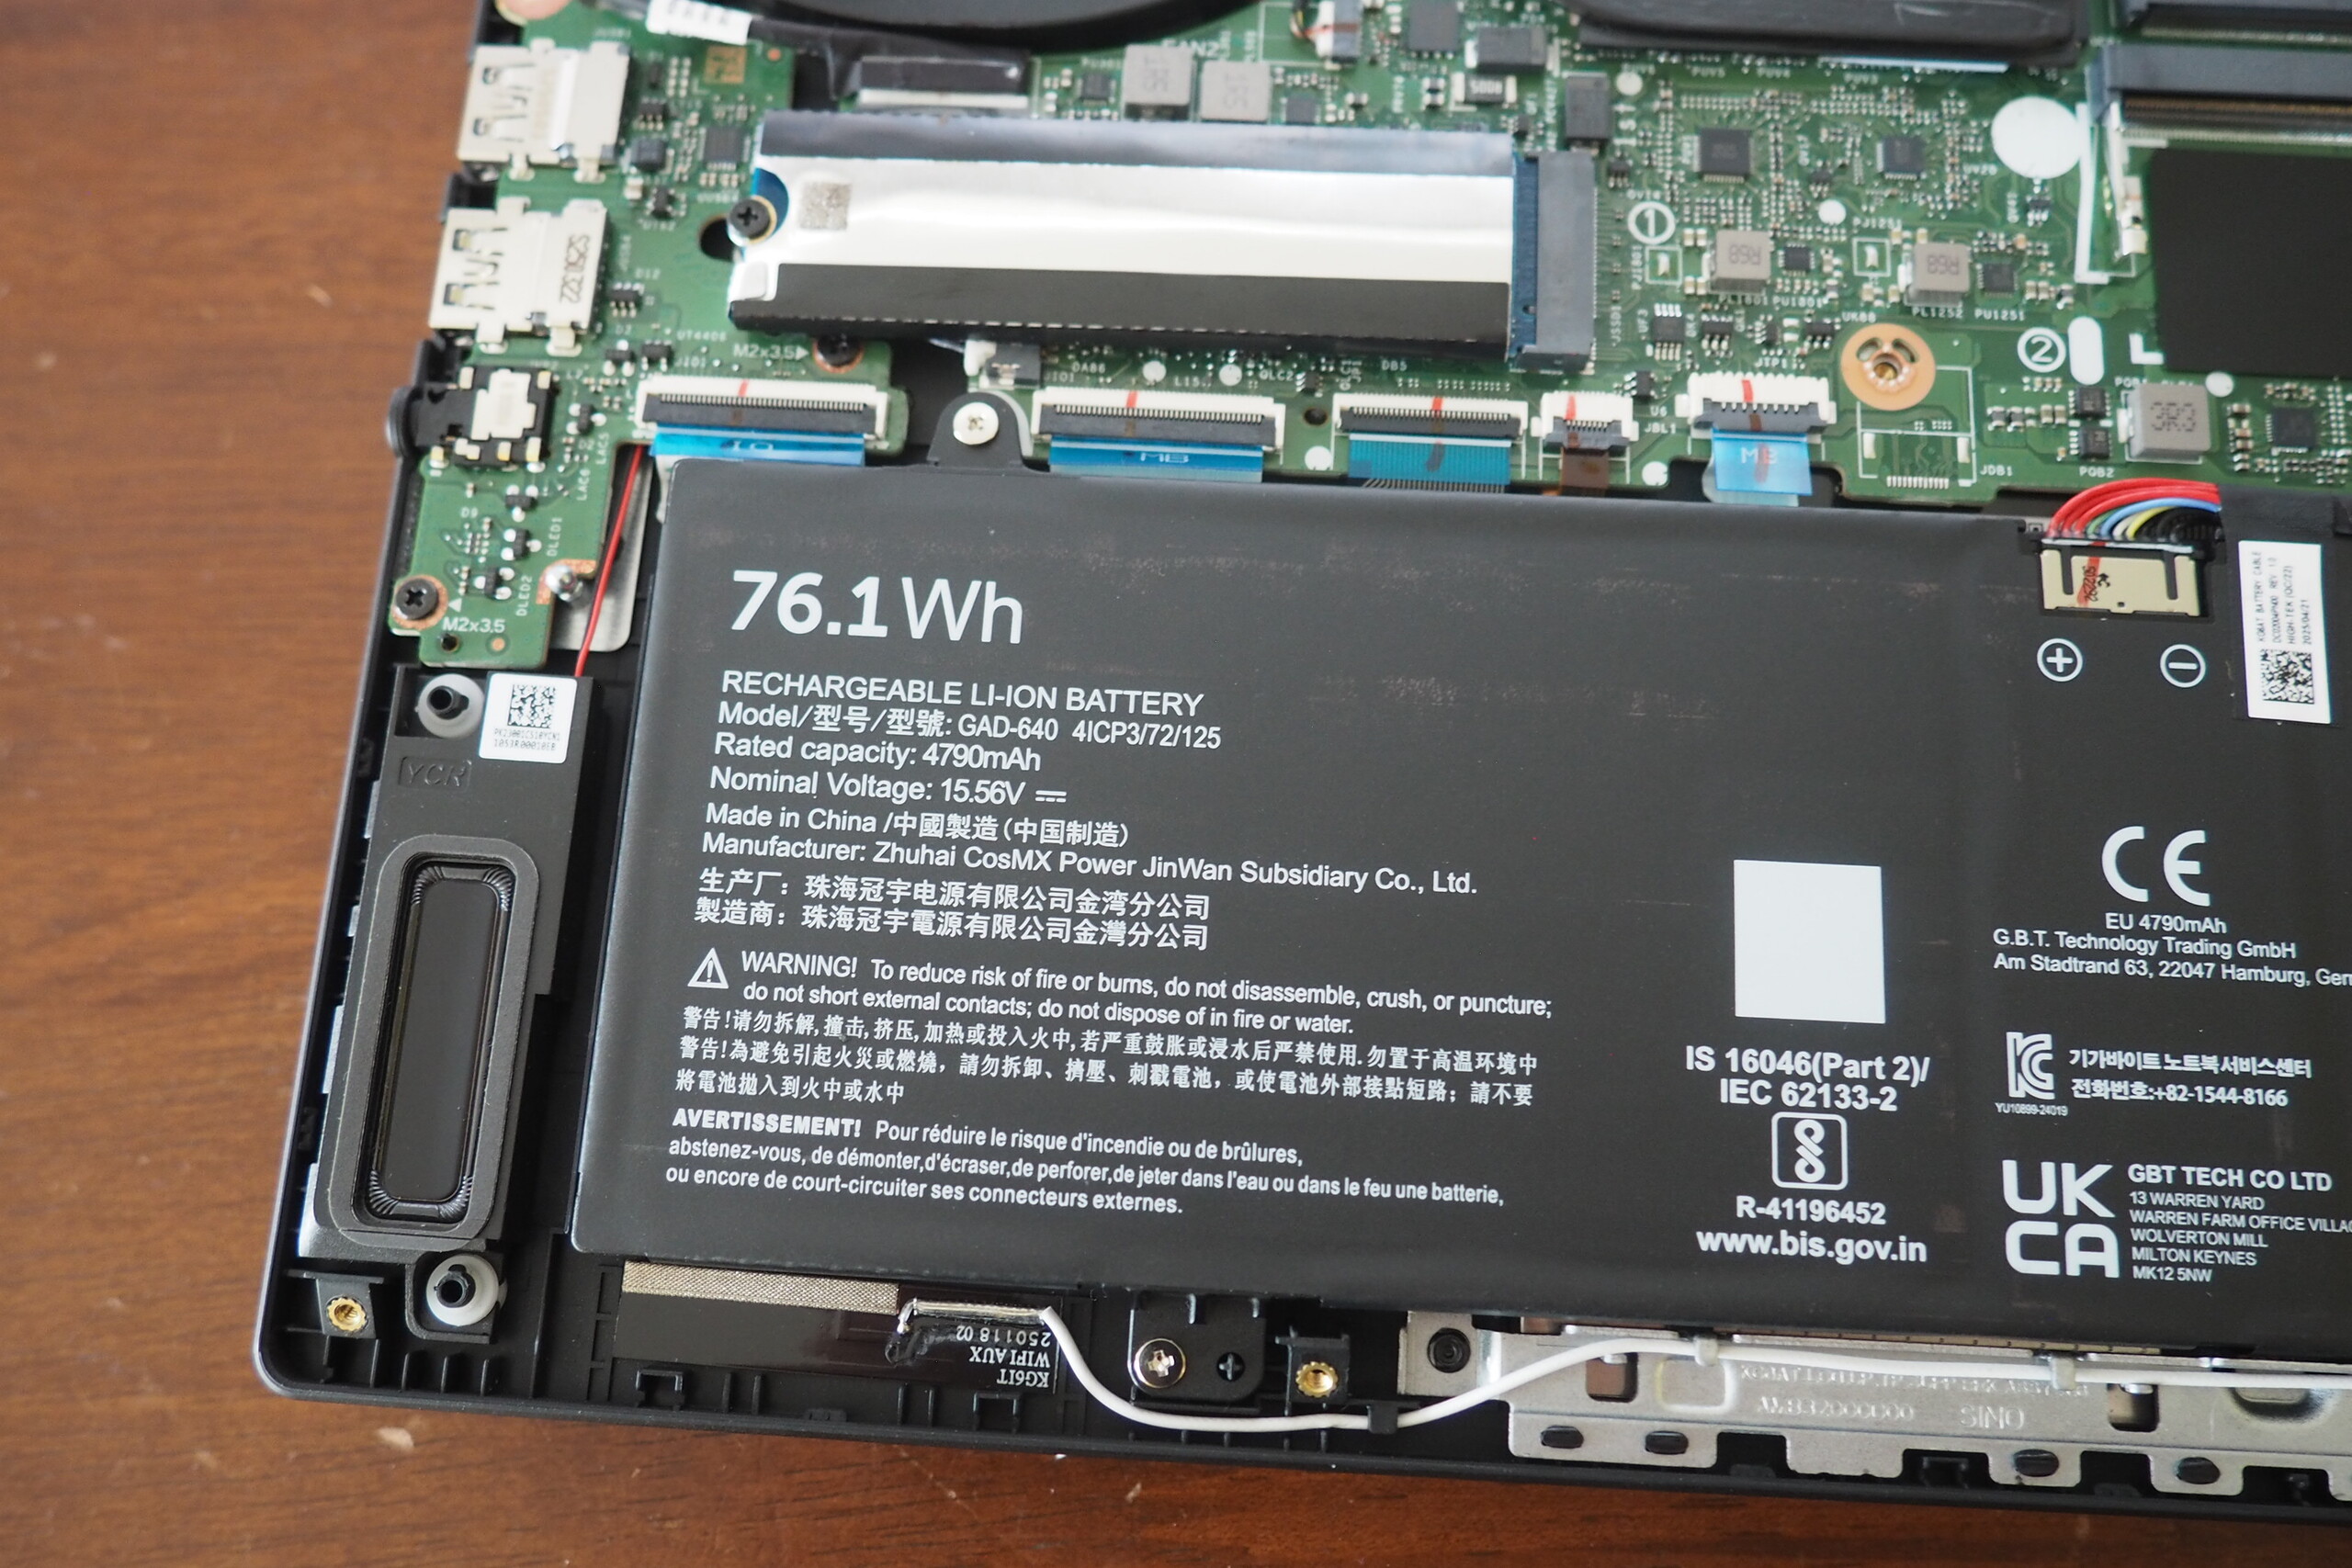
因此,电池寿命也高于平均水平。除 Aero X16 外,其他竞争对手在 Wi-Fi 测试(亮度降至 150 cd/m²)中都无法达到(几乎)7.5 小时,尽管技嘉的电池容量(76 Wh)甚至都不是最大的。
| Gigabyte Gaming A16 GA6H i7-13620H, GeForce RTX 5070 Laptop, 76 Wh | Gigabyte Aero X16 1WH Ryzen AI 7 350, GeForce RTX 5070 Laptop, 76 Wh | MSI Katana 17 HX B14WGK i7-14650HX, GeForce RTX 5070 Laptop, 75 Wh | MSI Vector 16 HX AI A2XWHG Ultra 7 255HX, GeForce RTX 5070 Ti Laptop, 90 Wh | Medion Erazer Major 16 X1 MD62736 Ultra 7 255HX, GeForce RTX 5070 Ti Laptop, 80 Wh | Lenovo LOQ 15AHP10 R7 250, GeForce RTX 5060 Laptop, 60 Wh | Average of class Gaming | |
|---|---|---|---|---|---|---|---|
| Battery runtime | 12% | -34% | -9% | -18% | -42% | -8% | |
| WiFi v1.3 (h) | 7.7 | 8.6 12% | 5.1 -34% | 7 -9% | 6.3 -18% | 4.5 -42% | 7.11 ? -8% |
| Reader / Idle (h) | 6.9 | 8.27 ? | |||||
| Load (h) | 1.3 | 1.502 ? |
Notebookcheck 总体评分
技嘉的 Gaming A16 是一款成功的 16 英寸机型,几乎没有什么独特的卖点,也不存在任何重大弱点。
Gigabyte Gaming A16 GA6H
- 07/22/2025 v8
Florian Glaser
 Total Sustainability Score:
 潜在竞争对手比较
Image | Model / Review | Price | Weight | Height | Display |
|---|---|---|---|---|---|
1. 80.1%  | Gigabyte Gaming A16 GA6H Intel Core i7-13620H ⎘ NVIDIA GeForce RTX 5070 Laptop ⎘ 16 GB Memory, 1024 GB SSD | Amazon: 1. $1,048.89 GIGABYTE - Gaming A16 Gaming... 2. $1,065.00 GIGABYTE - Gaming A16 Gaming... 3. $1,225.98 GIGABYTE - Gaming A16 Gaming... List Price: 1700 EUR | 2.3 kg | 23 mm | 16.00" 2560x1600 189 PPI IPS |
2. 83.7%  | Gigabyte Aero X16 1WH AMD Ryzen AI 7 350 ⎘ NVIDIA GeForce RTX 5070 Laptop ⎘ 32 GB Memory, 1024 GB SSD | Amazon: List Price: 1799€ | 2 kg | 19.9 mm | 16.00" 2560x1600 189 PPI IPS |
3. 77.3%  | MSI Katana 17 HX B14WGK Intel Core i7-14650HX ⎘ NVIDIA GeForce RTX 5070 Laptop ⎘ 16 GB Memory, 1024 GB SSD | Amazon: List Price: 1800 EUR | 2.7 kg | 28 mm | 17.30" 2560x1440 170 PPI IPS |
4. 84%  | MSI Vector 16 HX AI A2XWHG Intel Core Ultra 7 255HX ⎘ NVIDIA GeForce RTX 5070 Ti Laptop ⎘ 16 GB Memory, 512 GB SSD | Amazon: List Price: 2000 EUR | 2.6 kg | 28.6 mm | 16.00" 2560x1600 189 PPI IPS |
5. 85.2%  | Medion Erazer Major 16 X1 MD62736 Intel Core Ultra 7 255HX ⎘ NVIDIA GeForce RTX 5070 Ti Laptop ⎘ 32 GB Memory, SSD | Amazon: List Price: 2600 EUR | 2.5 kg | 22.7 mm | 16.00" 2560x1600 189 PPI IPS |
6. 77.5%  | Lenovo LOQ 15AHP10 AMD Ryzen 7 250 ⎘ NVIDIA GeForce RTX 5060 Laptop ⎘ 16 GB Memory, 1024 GB SSD | Amazon: | 2.4 kg | 24 mm | 15.60" 1920x1080 141 PPI IPS |
Transparency
The selection of devices to be reviewed is made by our editorial team. The test sample was provided to the author as a loan by the manufacturer or retailer for the purpose of this review. The lender had no influence on this review, nor did the manufacturer receive a copy of this review before publication. There was no obligation to publish this review. As an independent media company, Notebookcheck is not subjected to the authority of manufacturers, retailers or publishers.
This is how Notebookcheck is testing
Every year, Notebookcheck independently reviews hundreds of laptops and smartphones using standardized procedures to ensure that all results are comparable. We have continuously developed our test methods for around 20 years and set industry standards in the process. In our test labs, high-quality measuring equipment is utilized by experienced technicians and editors. These tests involve a multi-stage validation process. Our complex rating system is based on hundreds of well-founded measurements and benchmarks, which maintains objectivity. Further information on our test methods can be found here.

