
结论 -Galaxy Book6 Ultra 是一款非常出色的多媒体笔记本电脑
三星新推出的Galaxy Book6 Ultra 是一款非常出色的多媒体笔记本电脑,它拥有绚丽的 OLED 屏幕、性能强劲的 Panther Lake 处理器和 Nvidia Blackwell GPU 以及出色的扬声器系统。不过,新的机身设计与Apple 的 MacBook Pro 非常相似,如果很多用户将这两款系统混淆,我们也不会感到惊讶。这也意味着三星放弃了数字键盘,这对某些用户来说可能是个问题。
对于一款多媒体笔记本电脑来说,部件的性能非常出色,散热装置也运行良好。如果在高性能模式下使用笔记本电脑,风扇的声音会比较大,但仍比许多竞争对手安静。新的 OLED 触摸屏给我们留下了特别深刻的印象,它的画质令人惊叹,色彩准确,但高振幅的 PWM 闪烁是个问题。
OLED 屏幕的刷新率在 30-120 Hz 之间可调,效率也非常高,尽管电池容量最小,但其出色的电池续航时间明显优于所有 Windows 替代产品。不过,如果您想要更高的性能、更好的屏幕(串联 OLED 面板)和更出色的键盘,您应该看看 华硕 ProArt P16或 联想的 Yoga Pro 9i 16.Apple's MacBook Pro显然,MacBook Pro 也是竞争对手,它还提供更亮的屏幕、更多的端口和更安静的风扇。M4 Pro 或 M4 Max 的性能也更出色,即将推出的 M5 Pro/M5 Max 机型应该会进一步拉大差距。
Pros
Cons
价格和供应情况
我们还不知道美国的定价或供应情况。
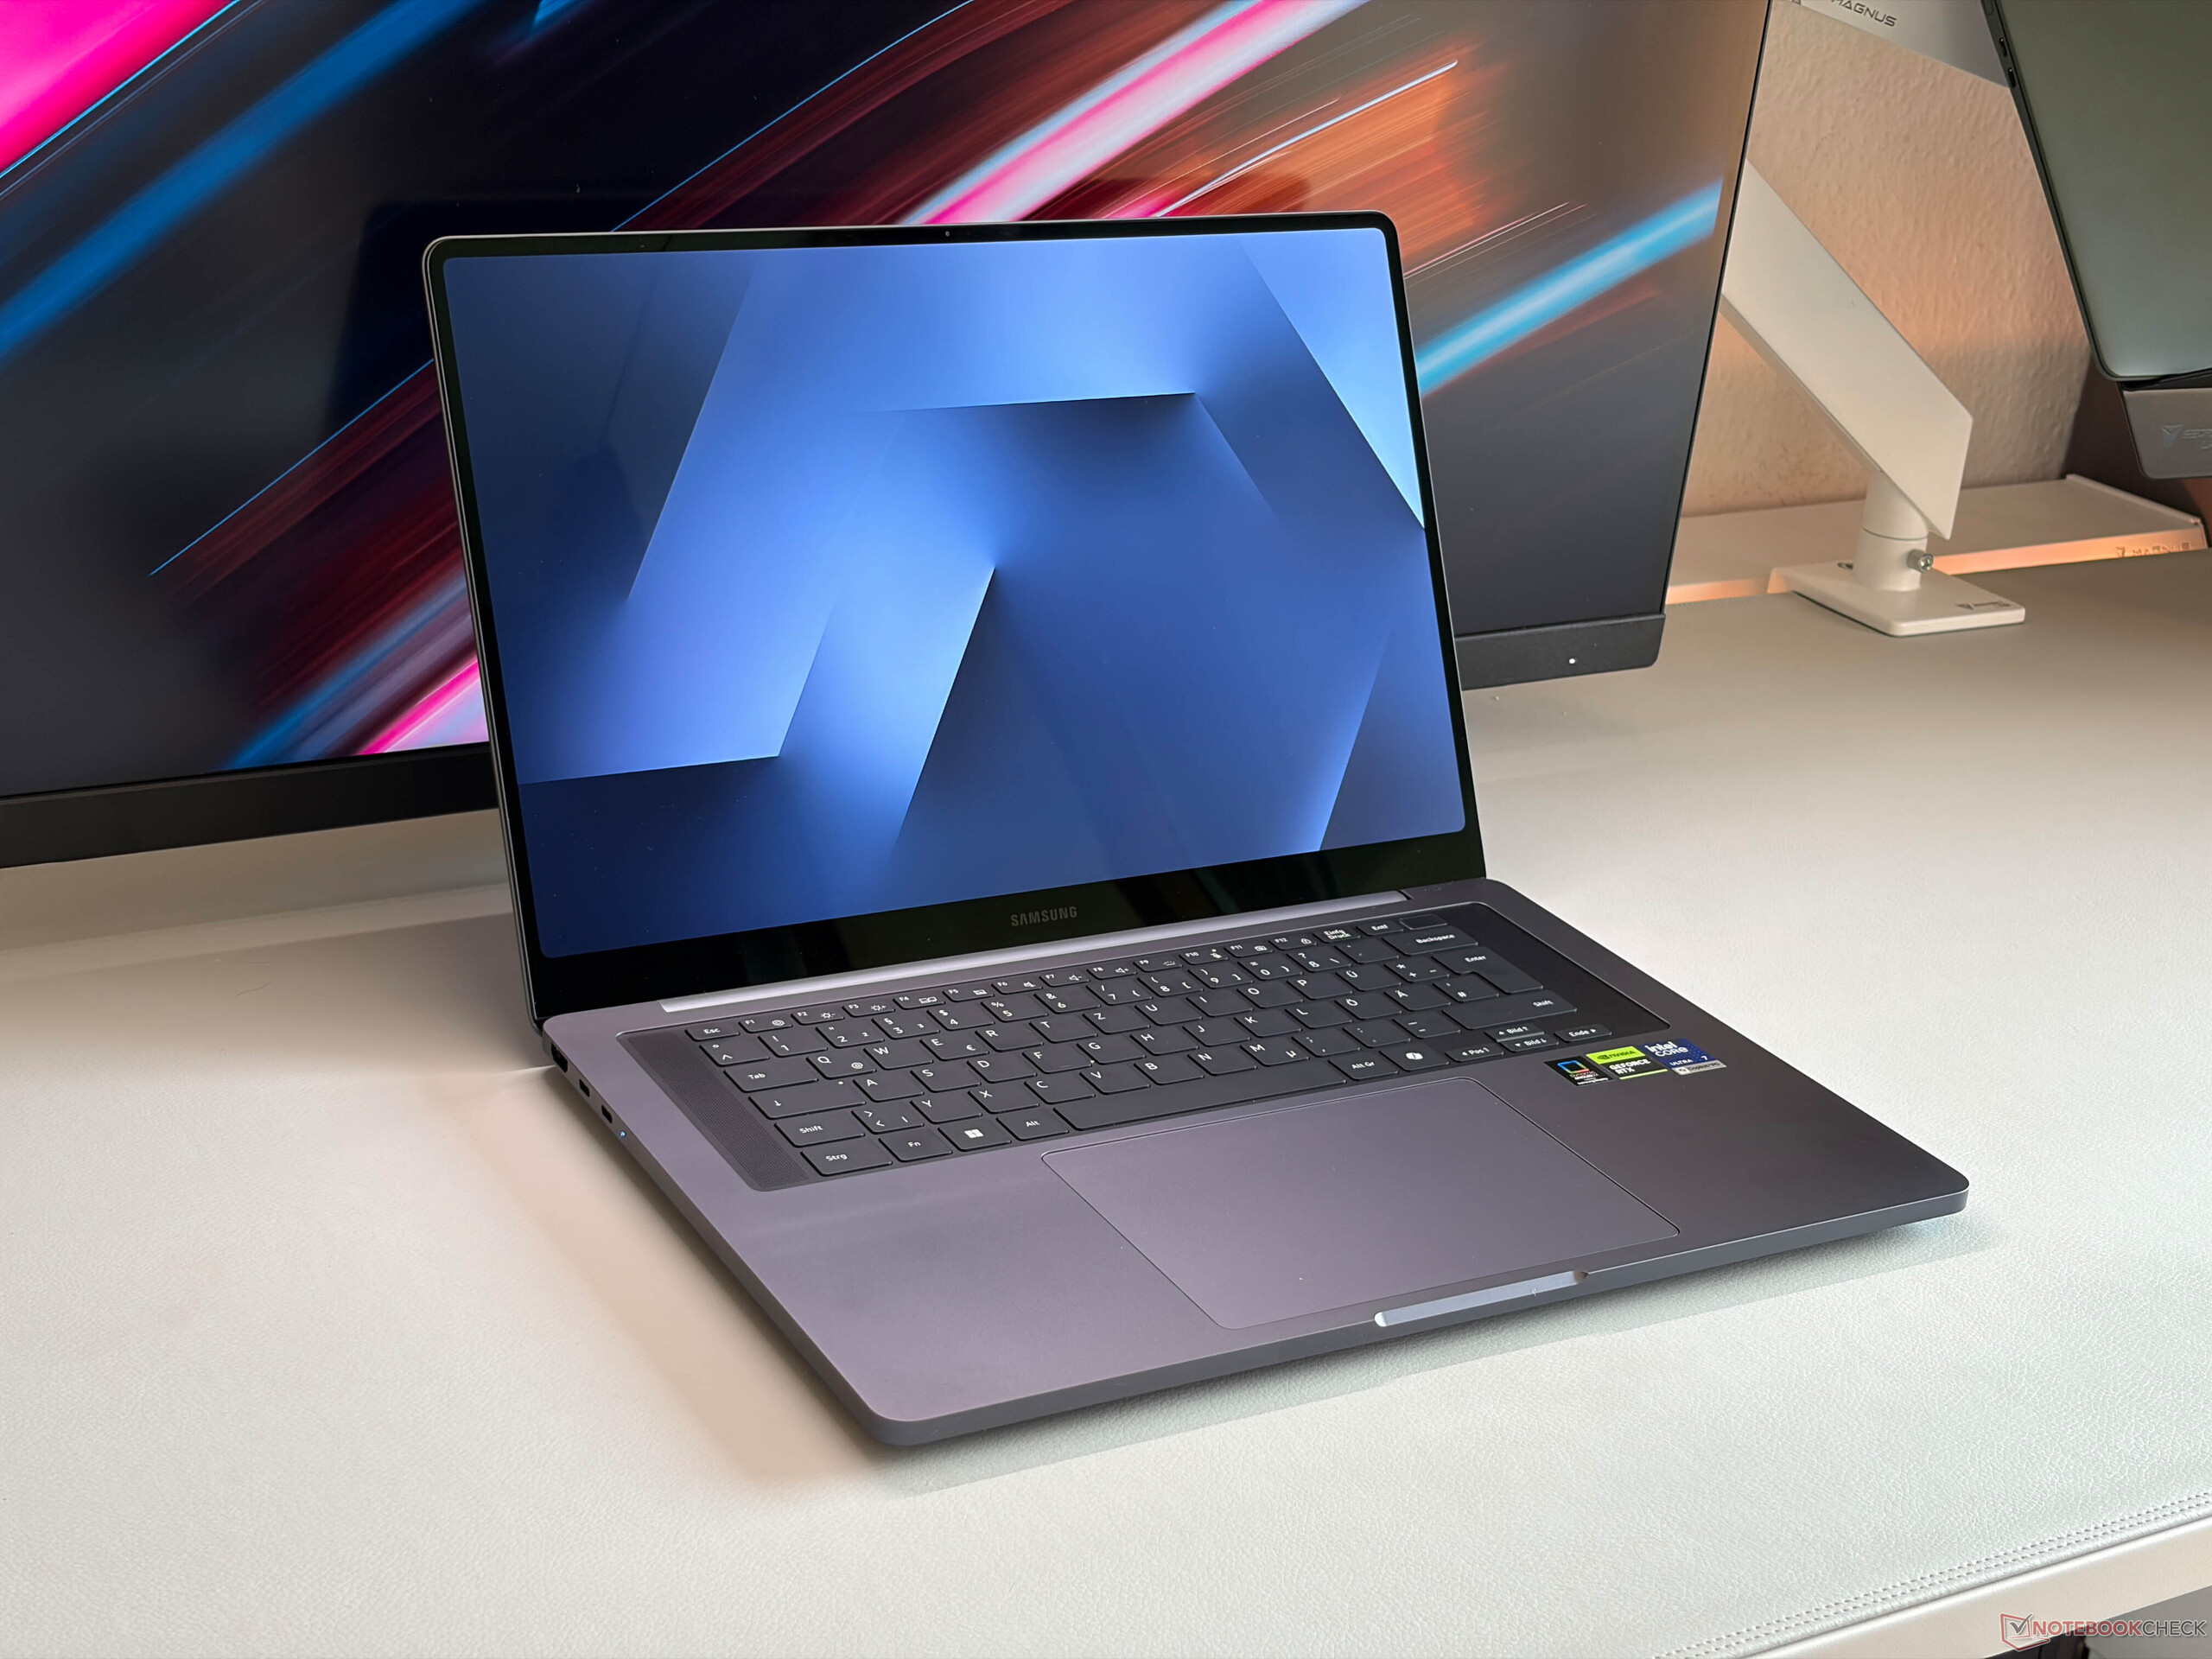
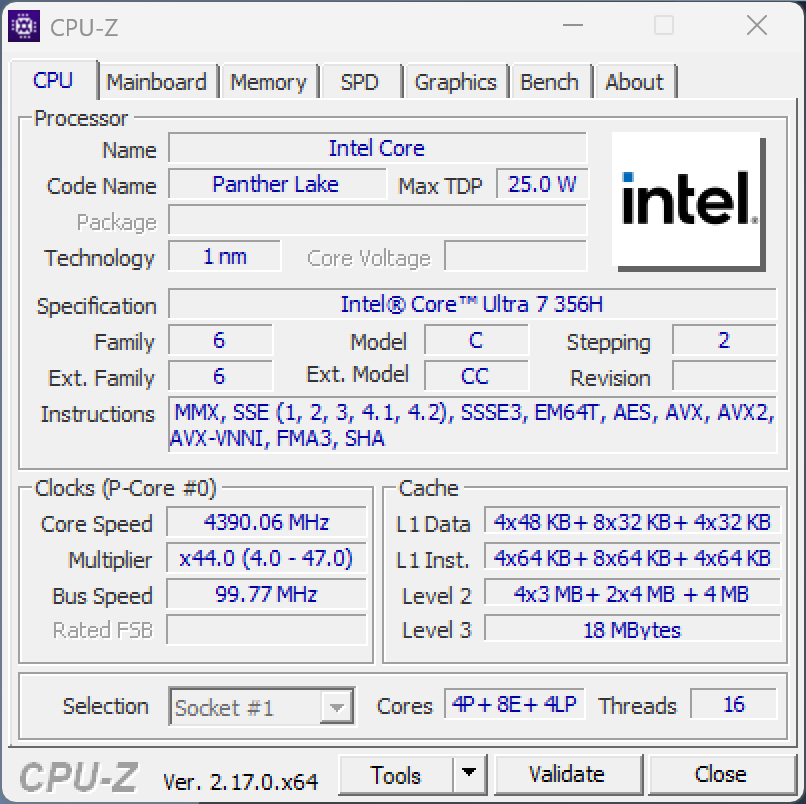
三星更新了其功能最强大的笔记本电脑Galaxy Book6 Ultra。这款 16 英寸的多媒体设备现在配备了新的英特尔 Panther Lake 芯片、可选的 Nvidia Blackwell GPU 以及新的 OLED 触摸屏,机身也进行了改良。我们对配备酷睿 Ultra 7 356H、GeForce RTX 5070、32 GB 内存和 1 TB SSD 存储的机型进行了评测。
规格
外壳和连接
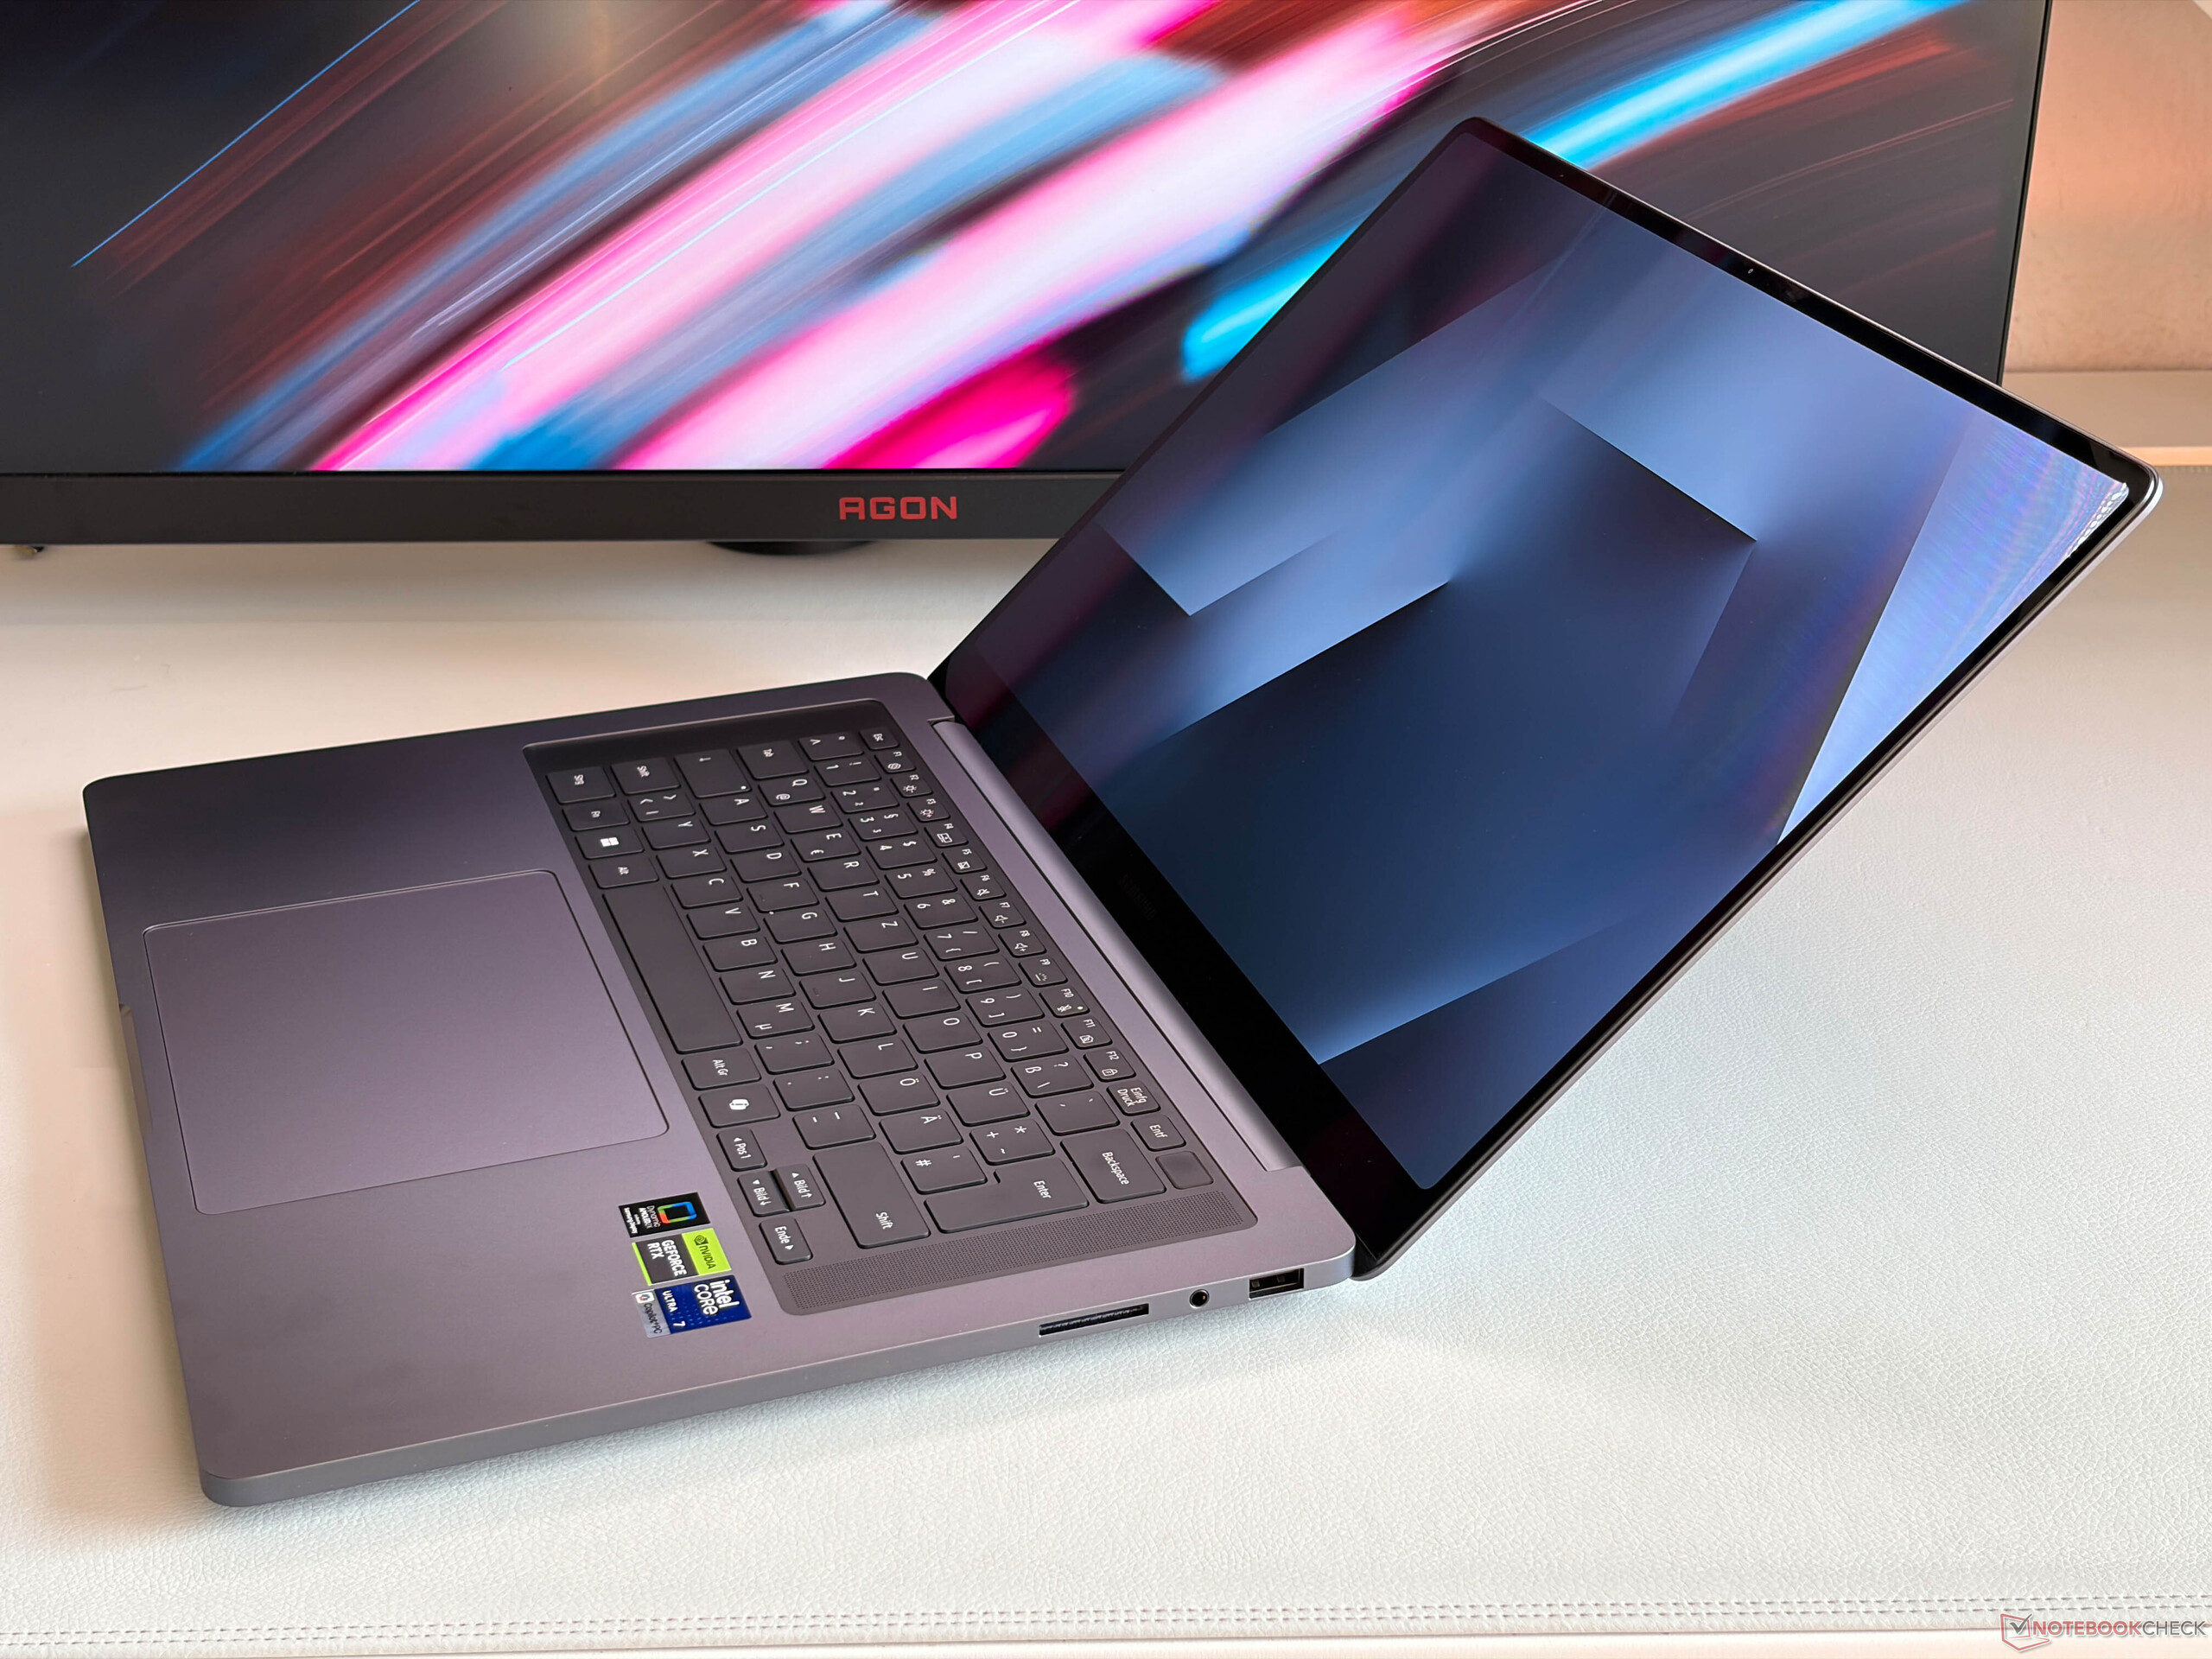
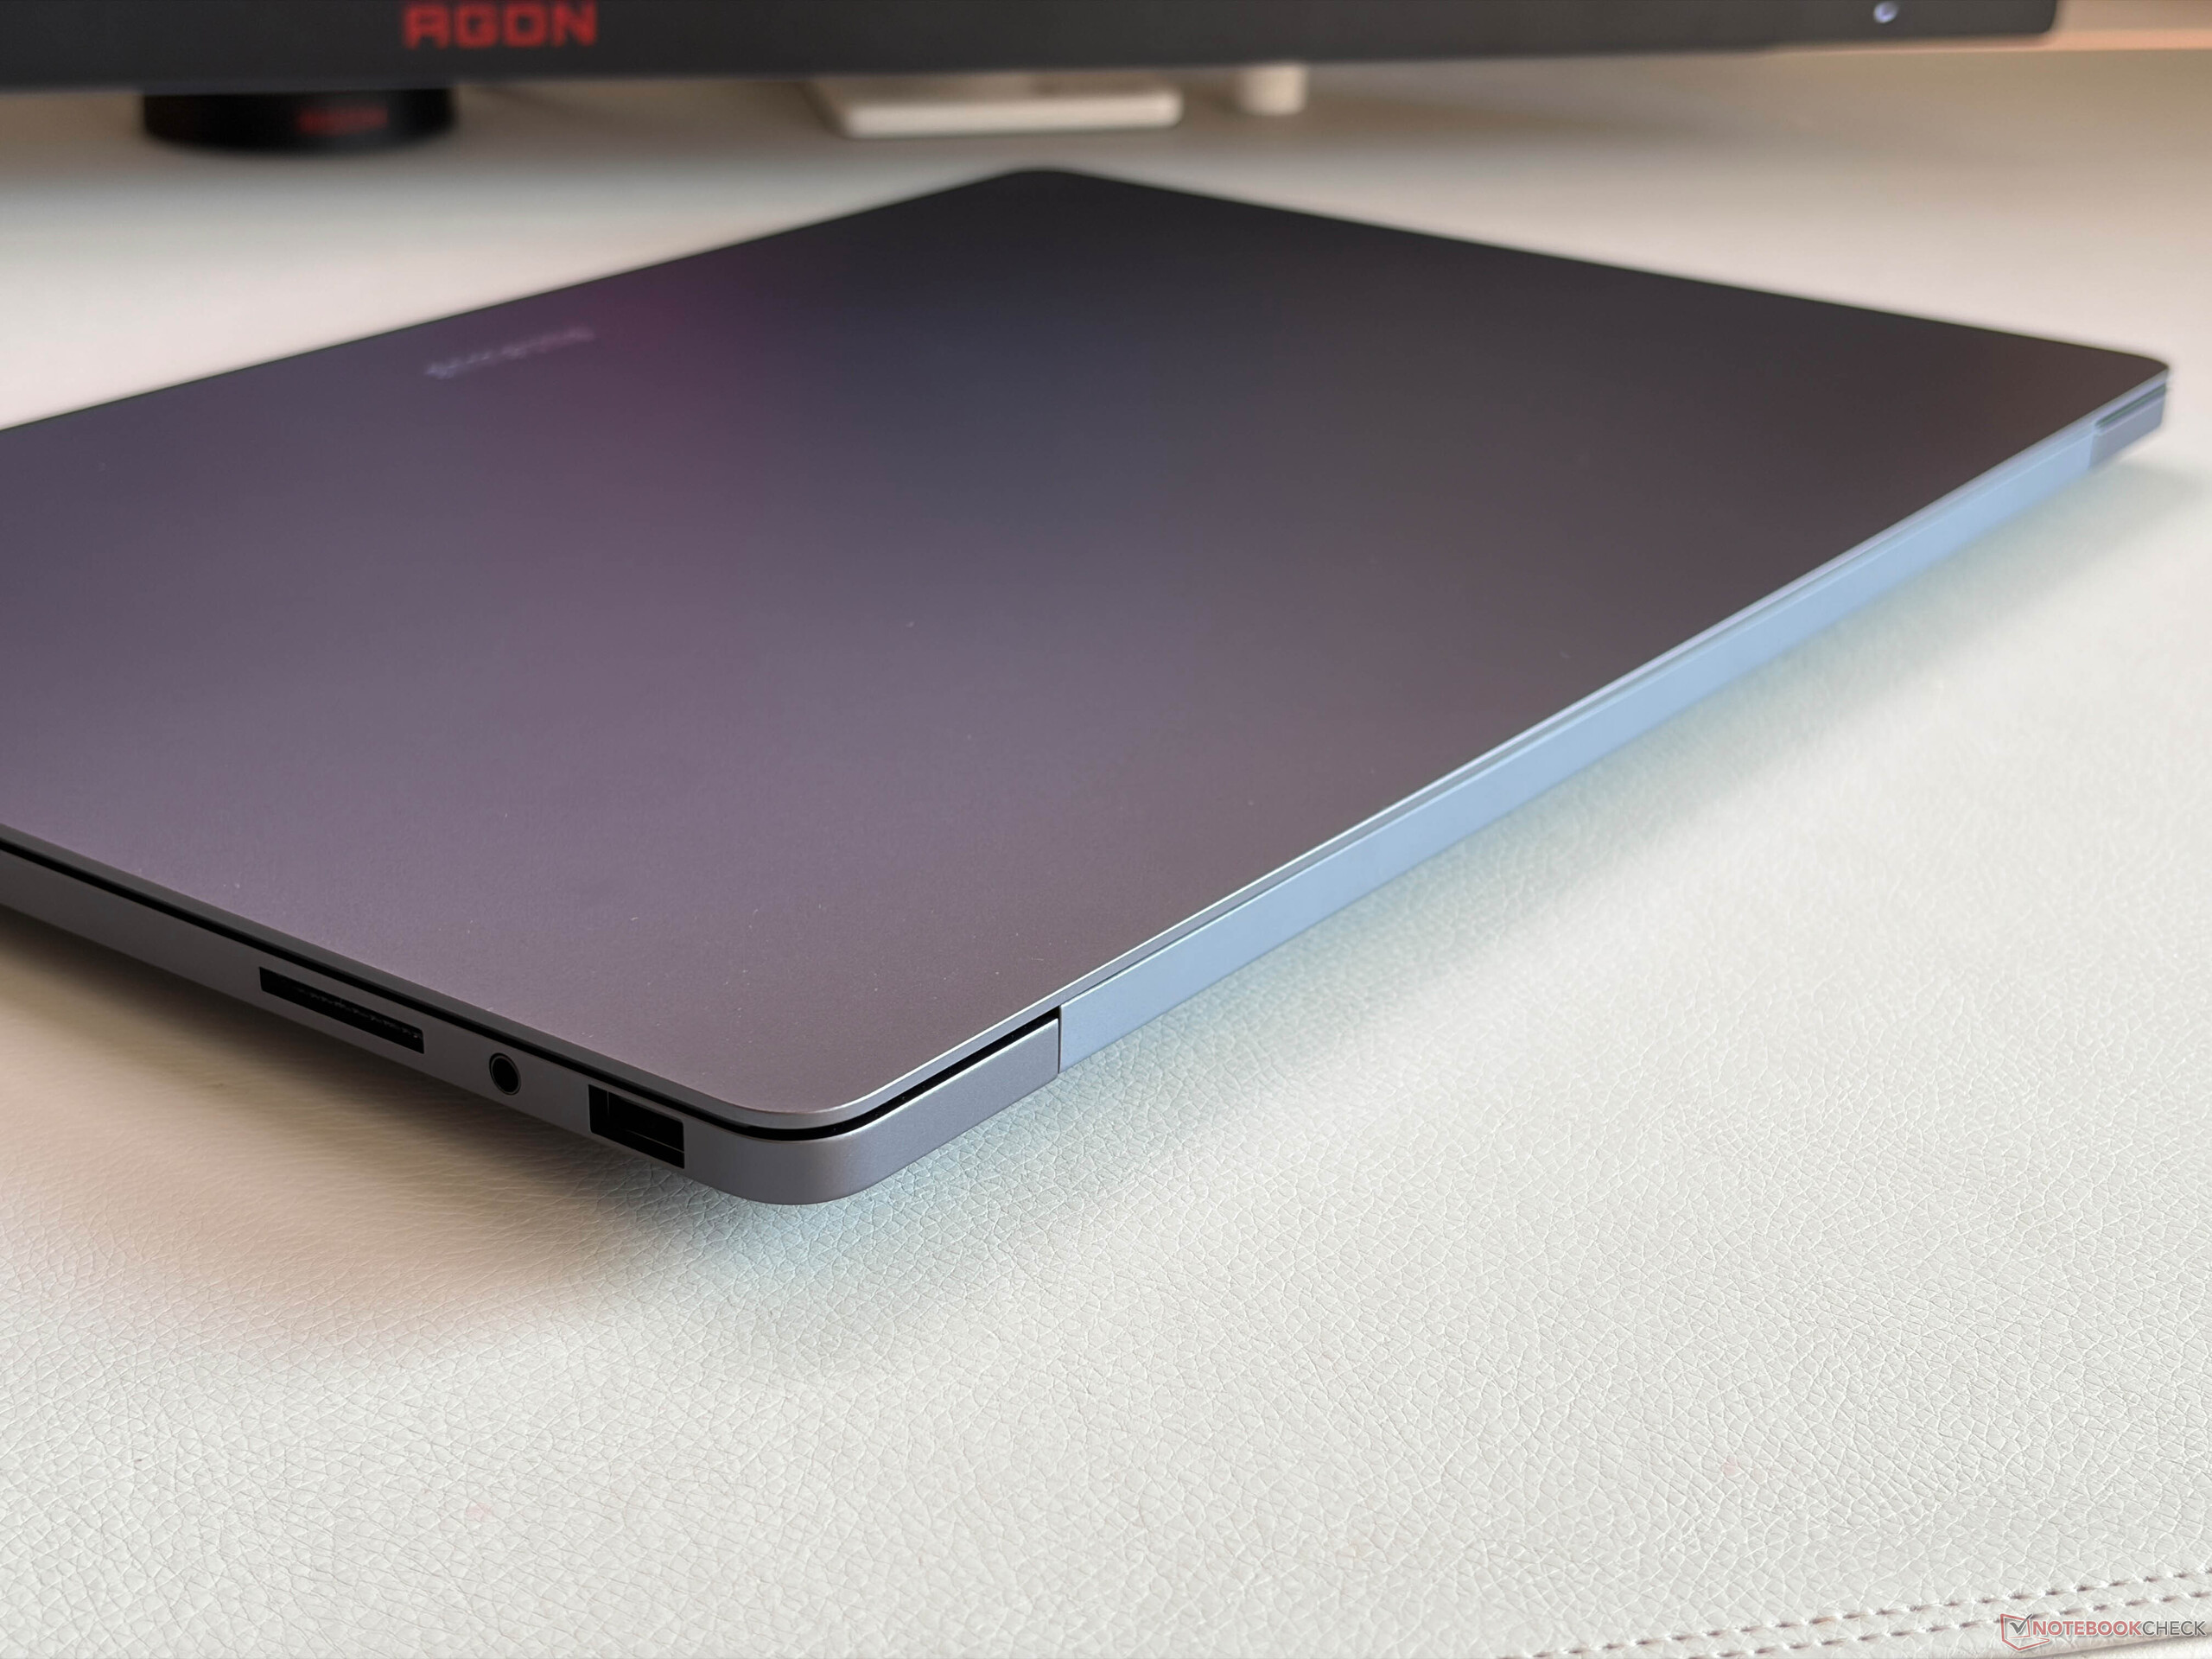
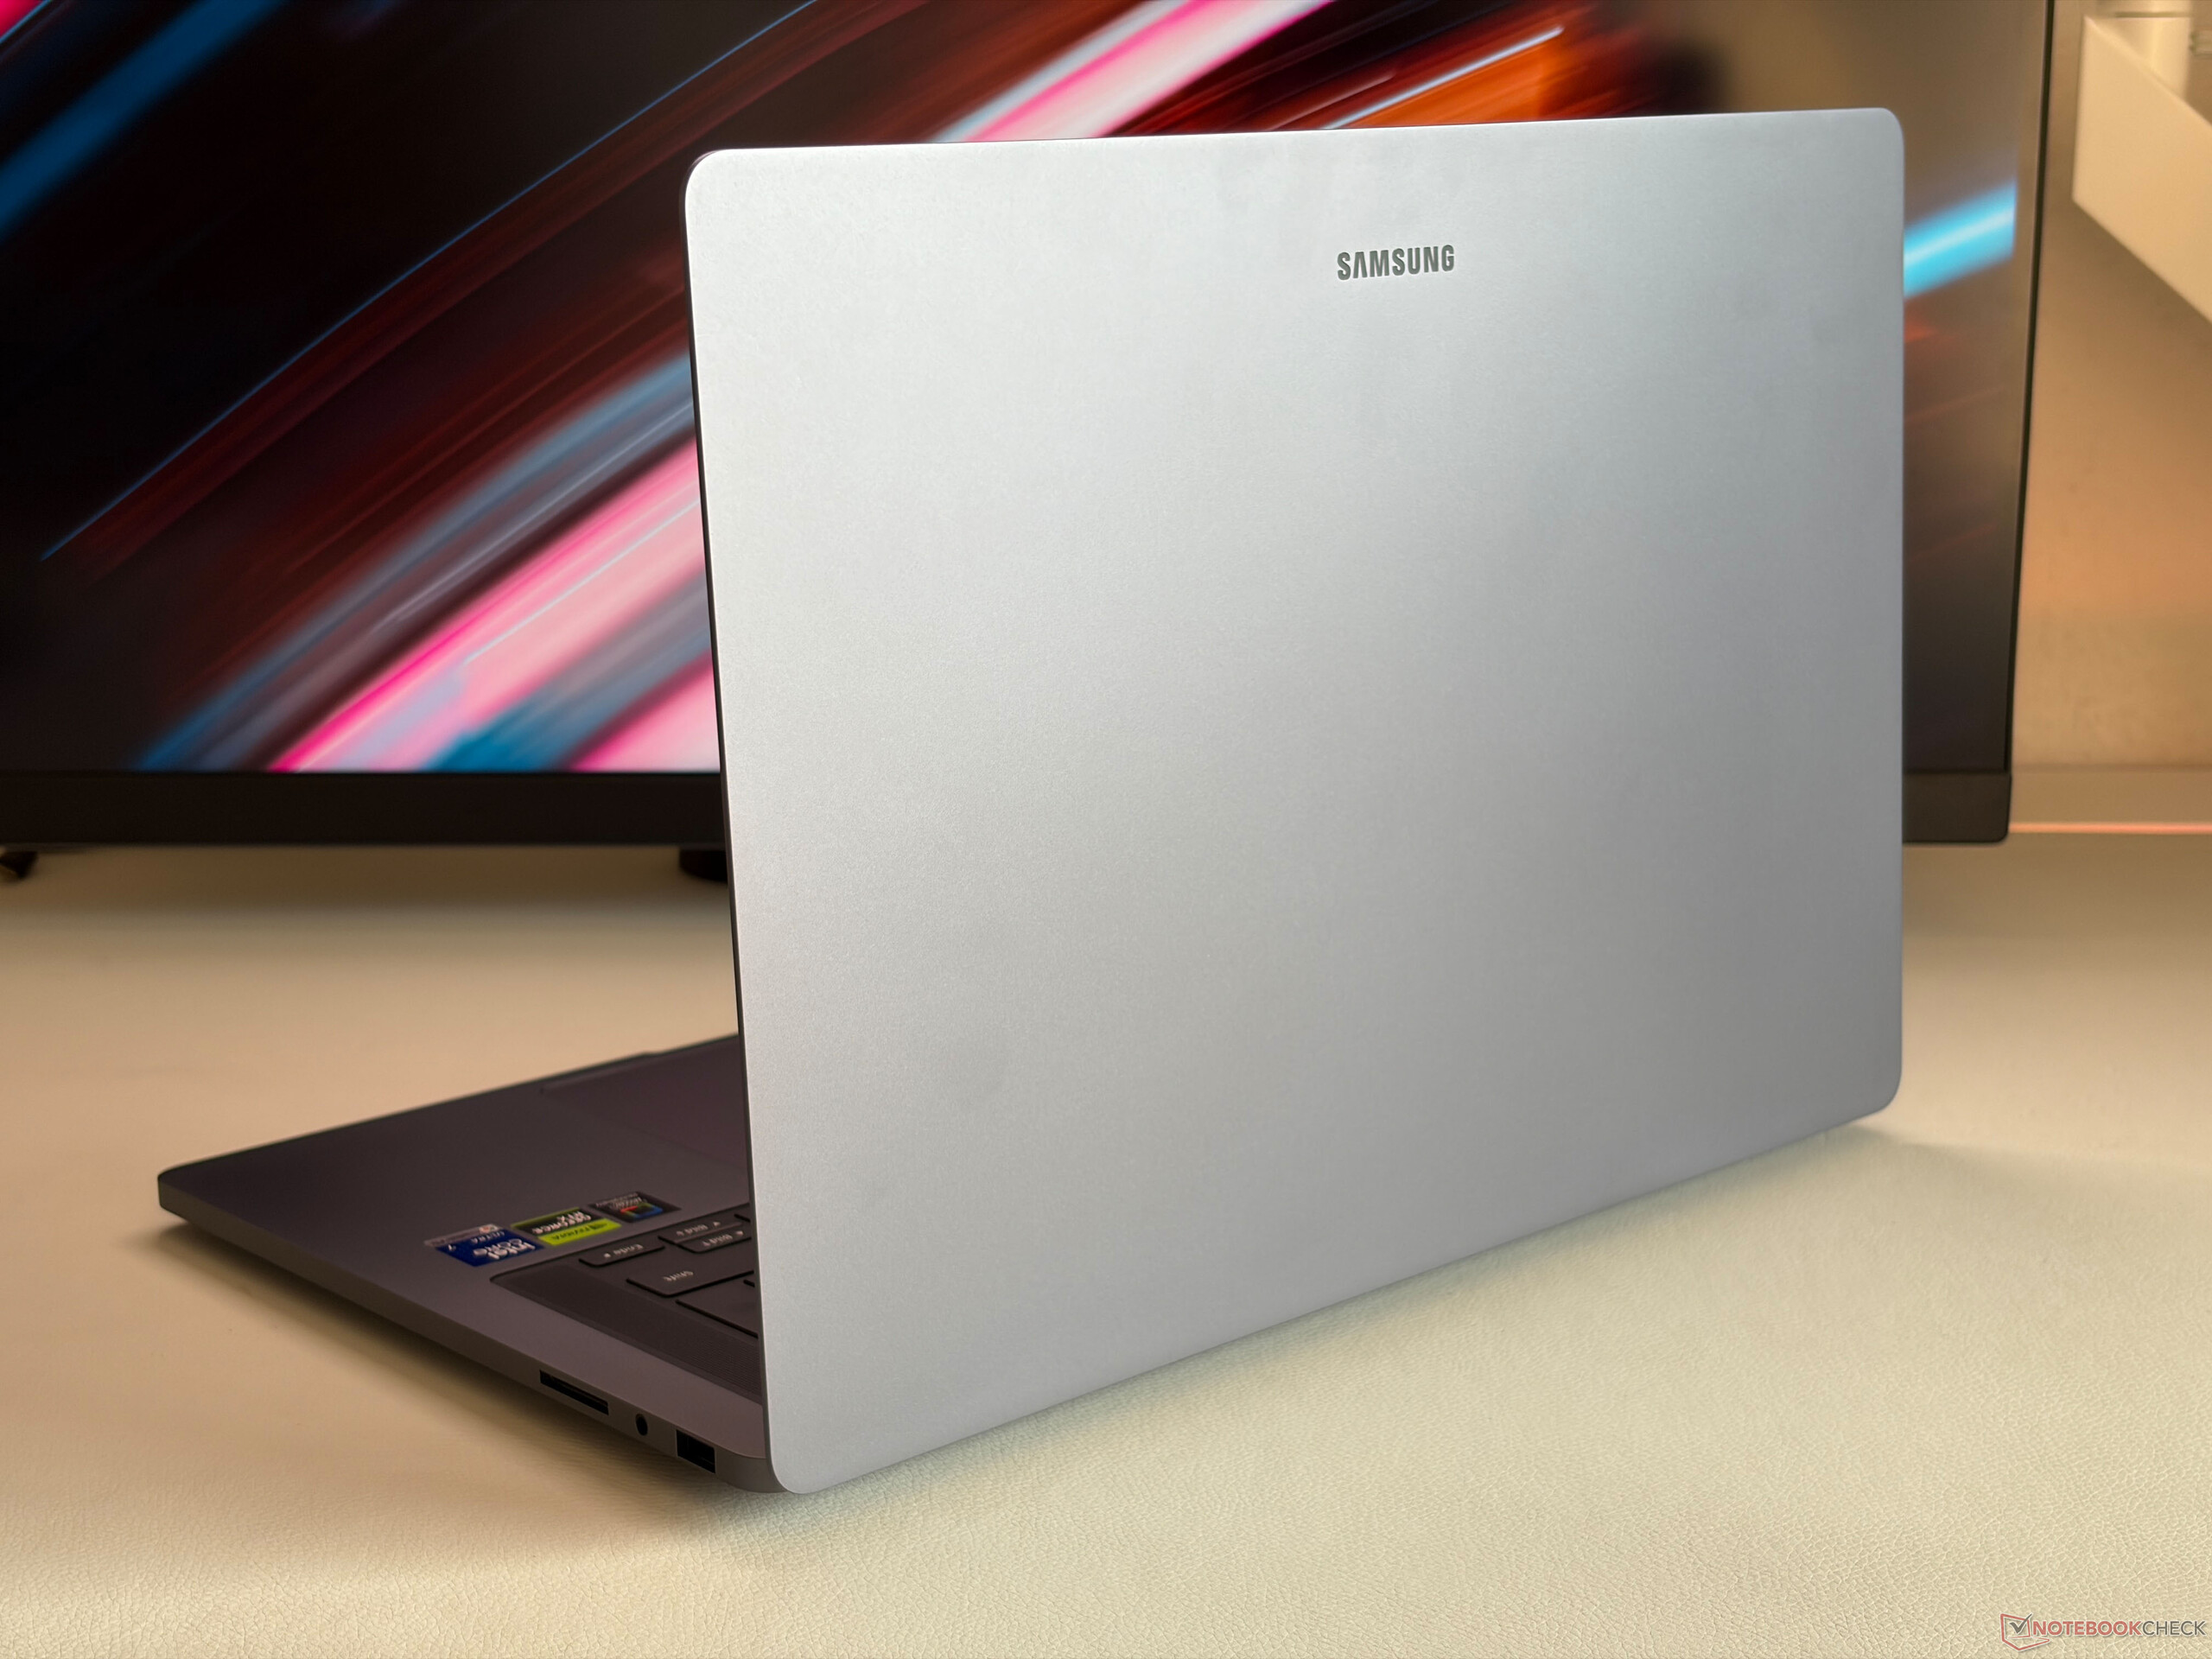
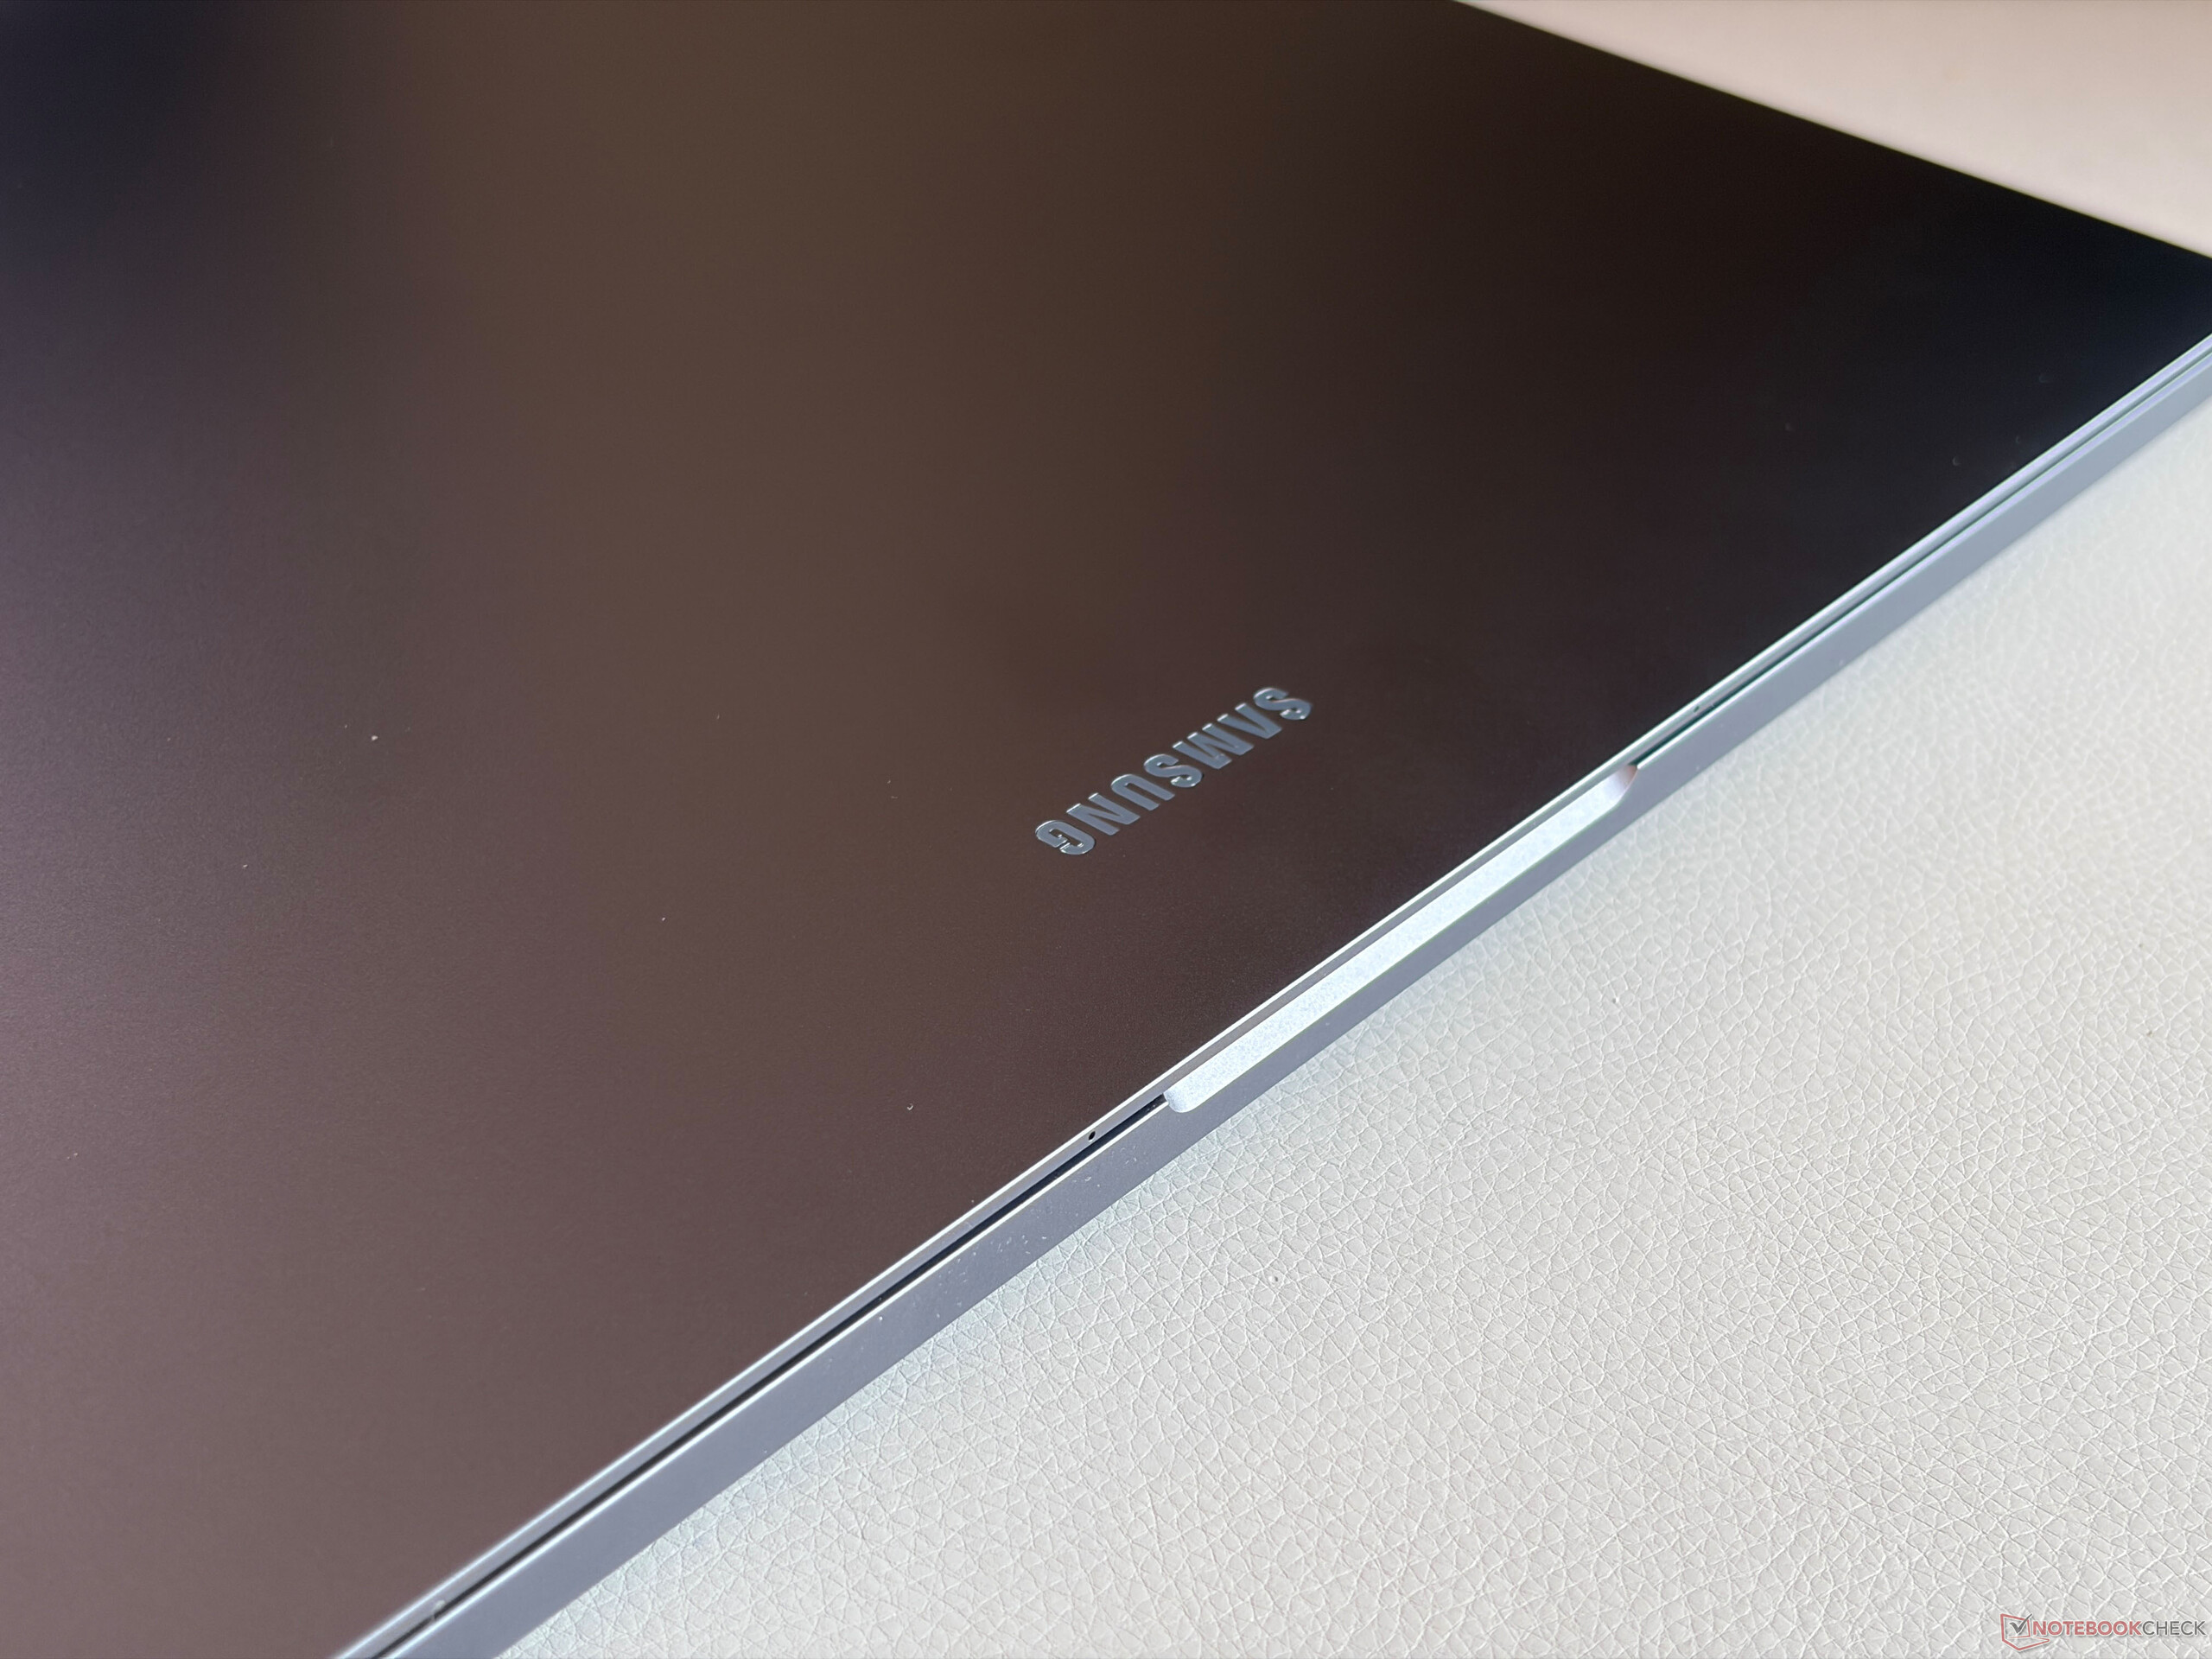
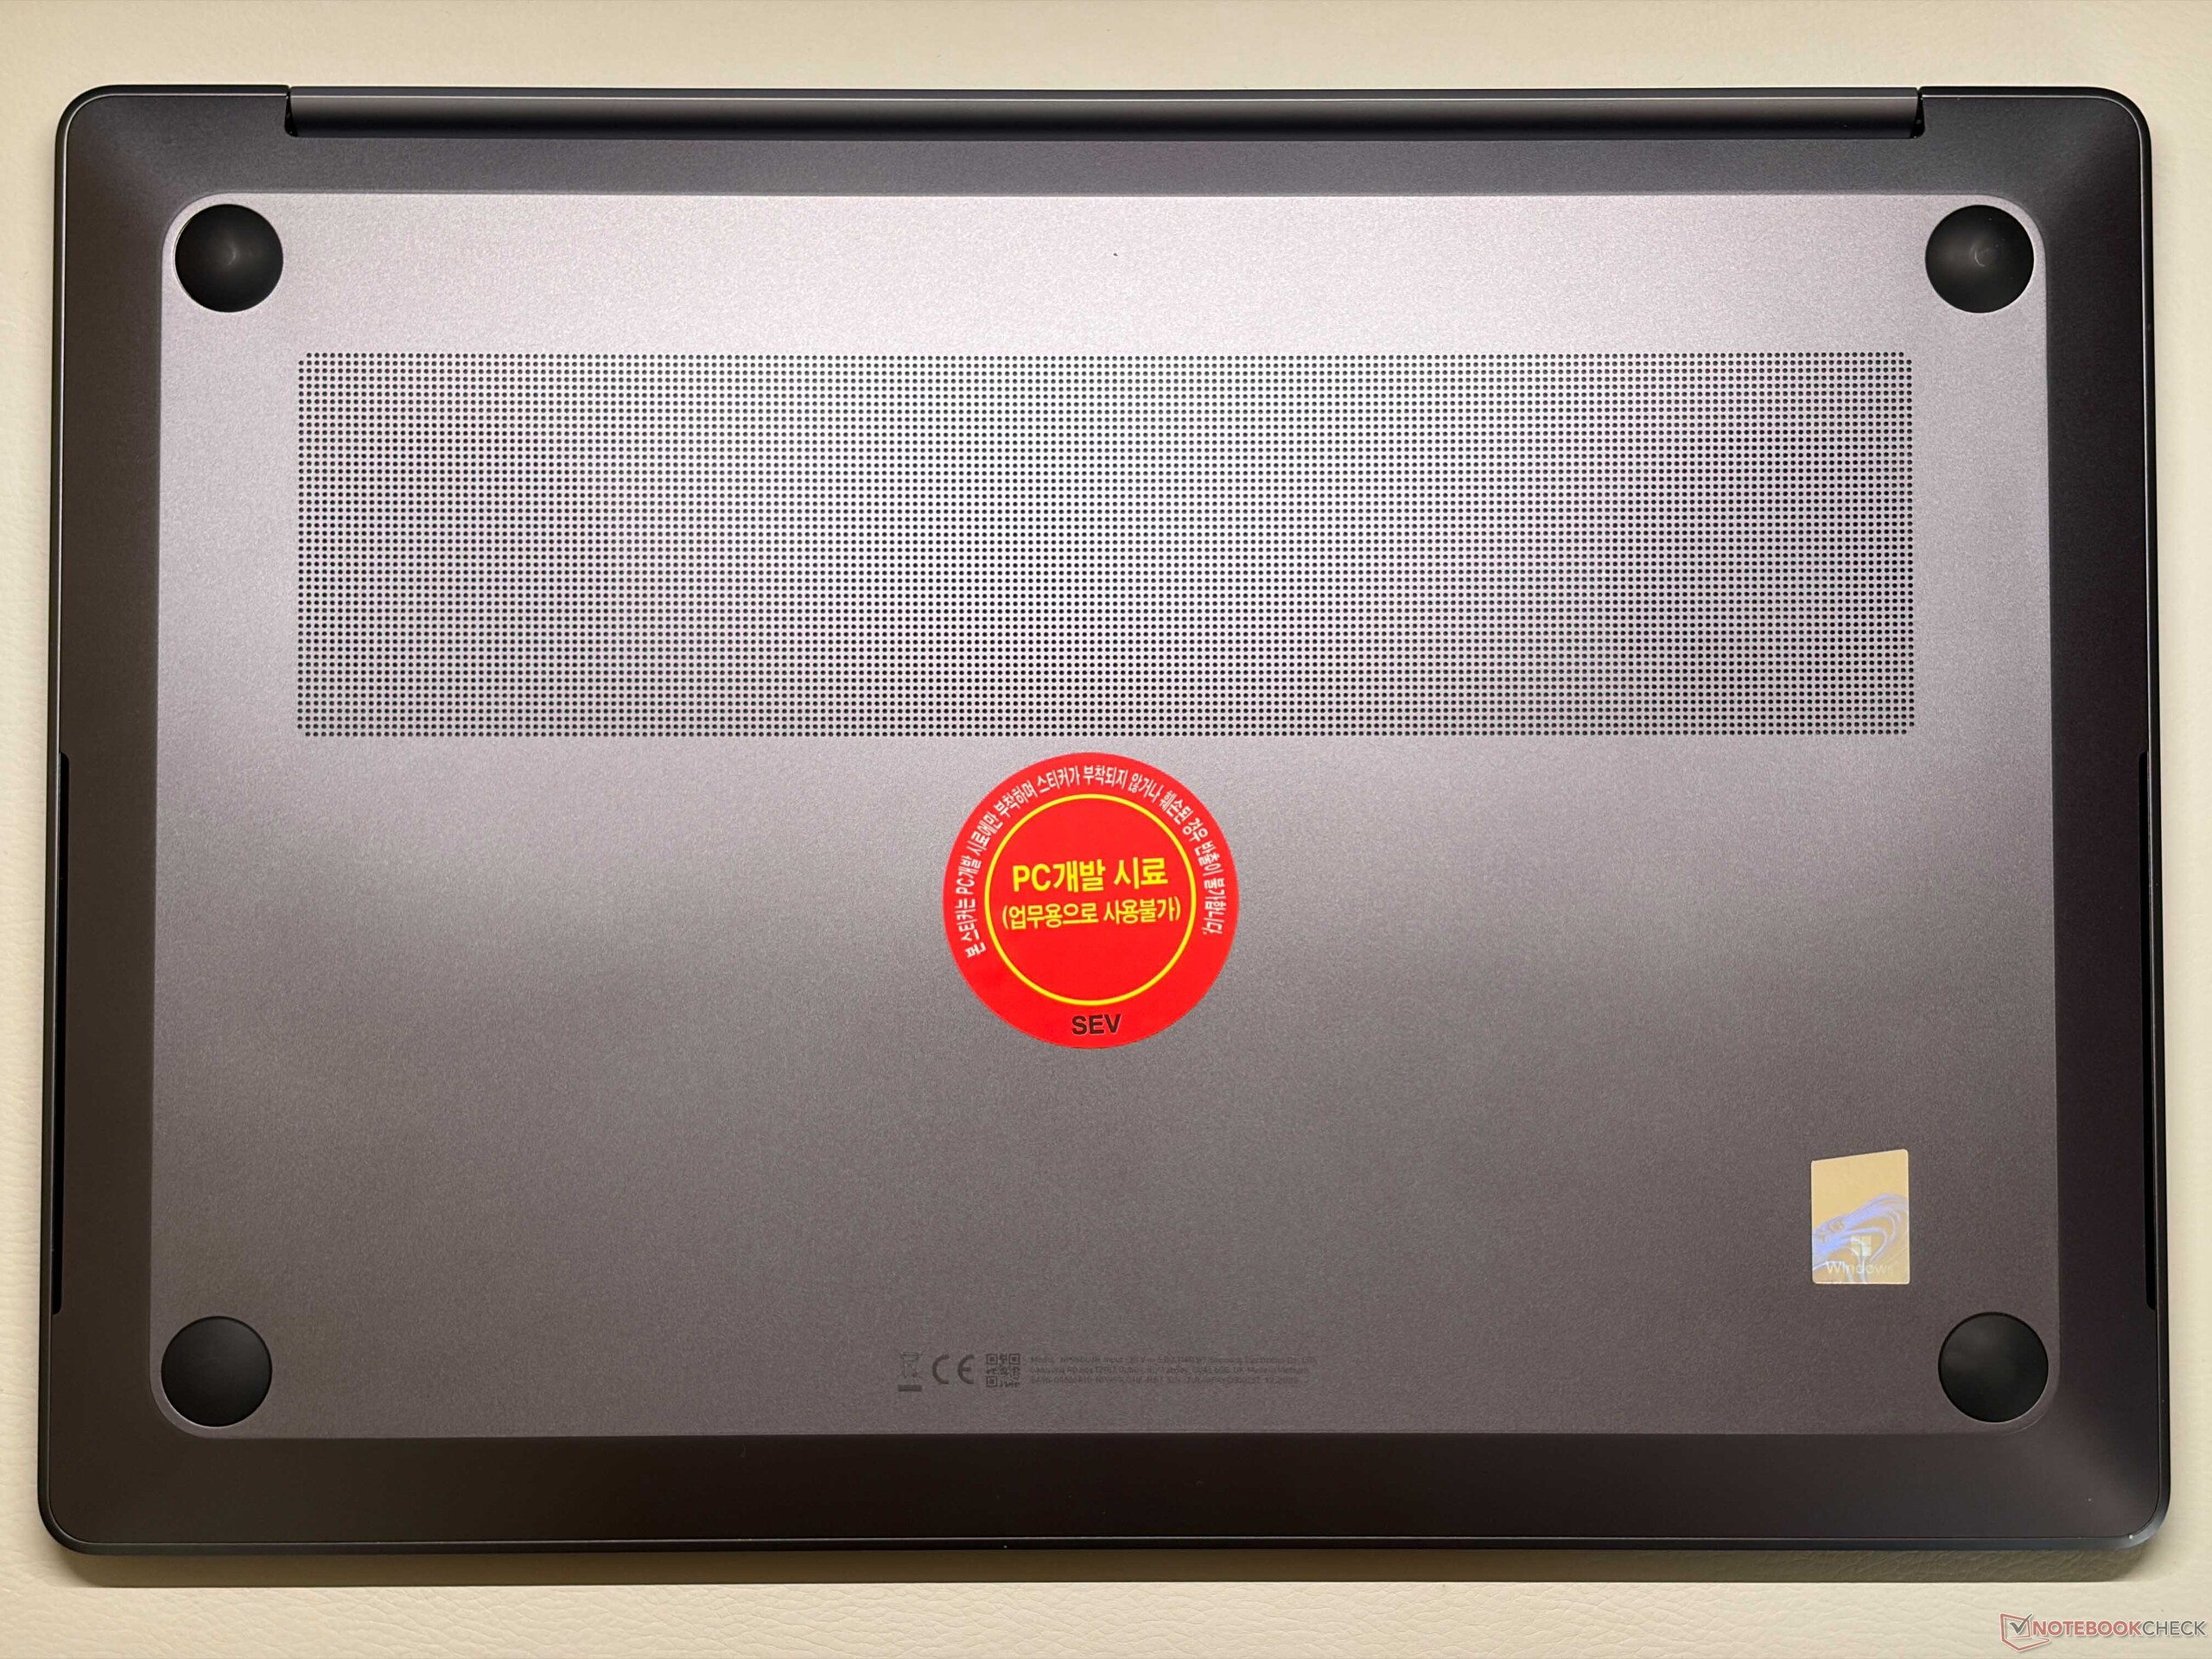
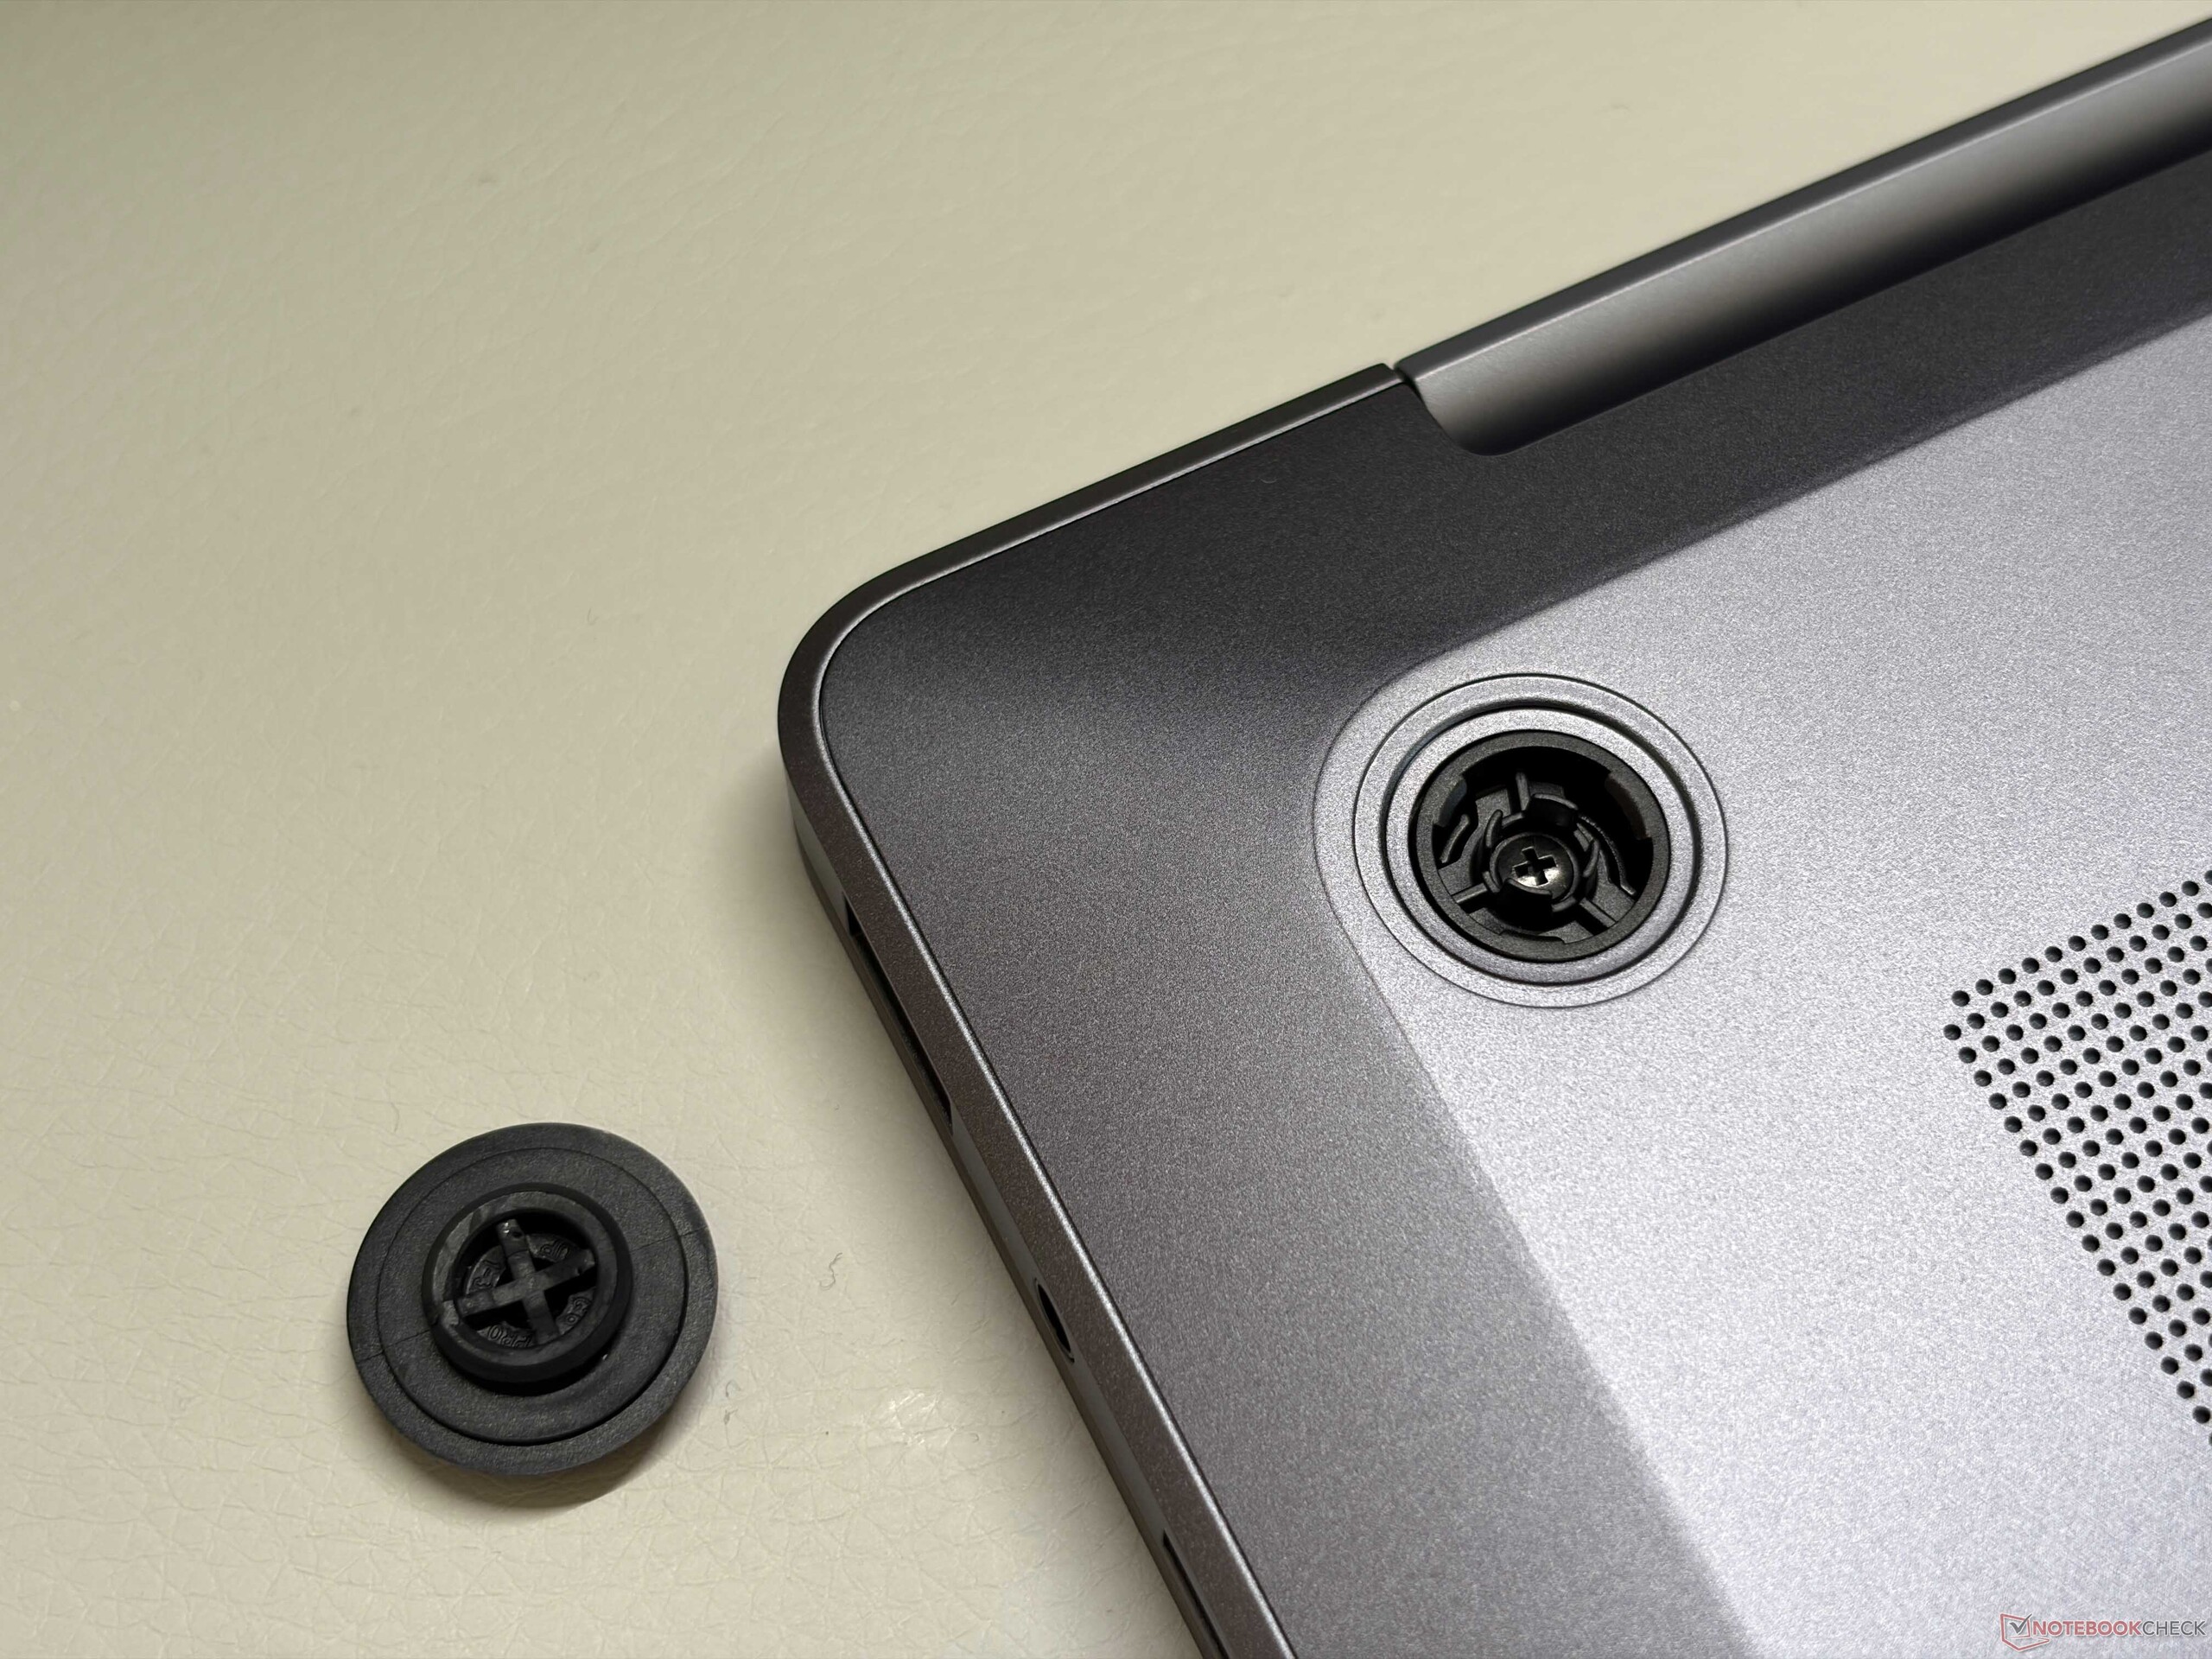
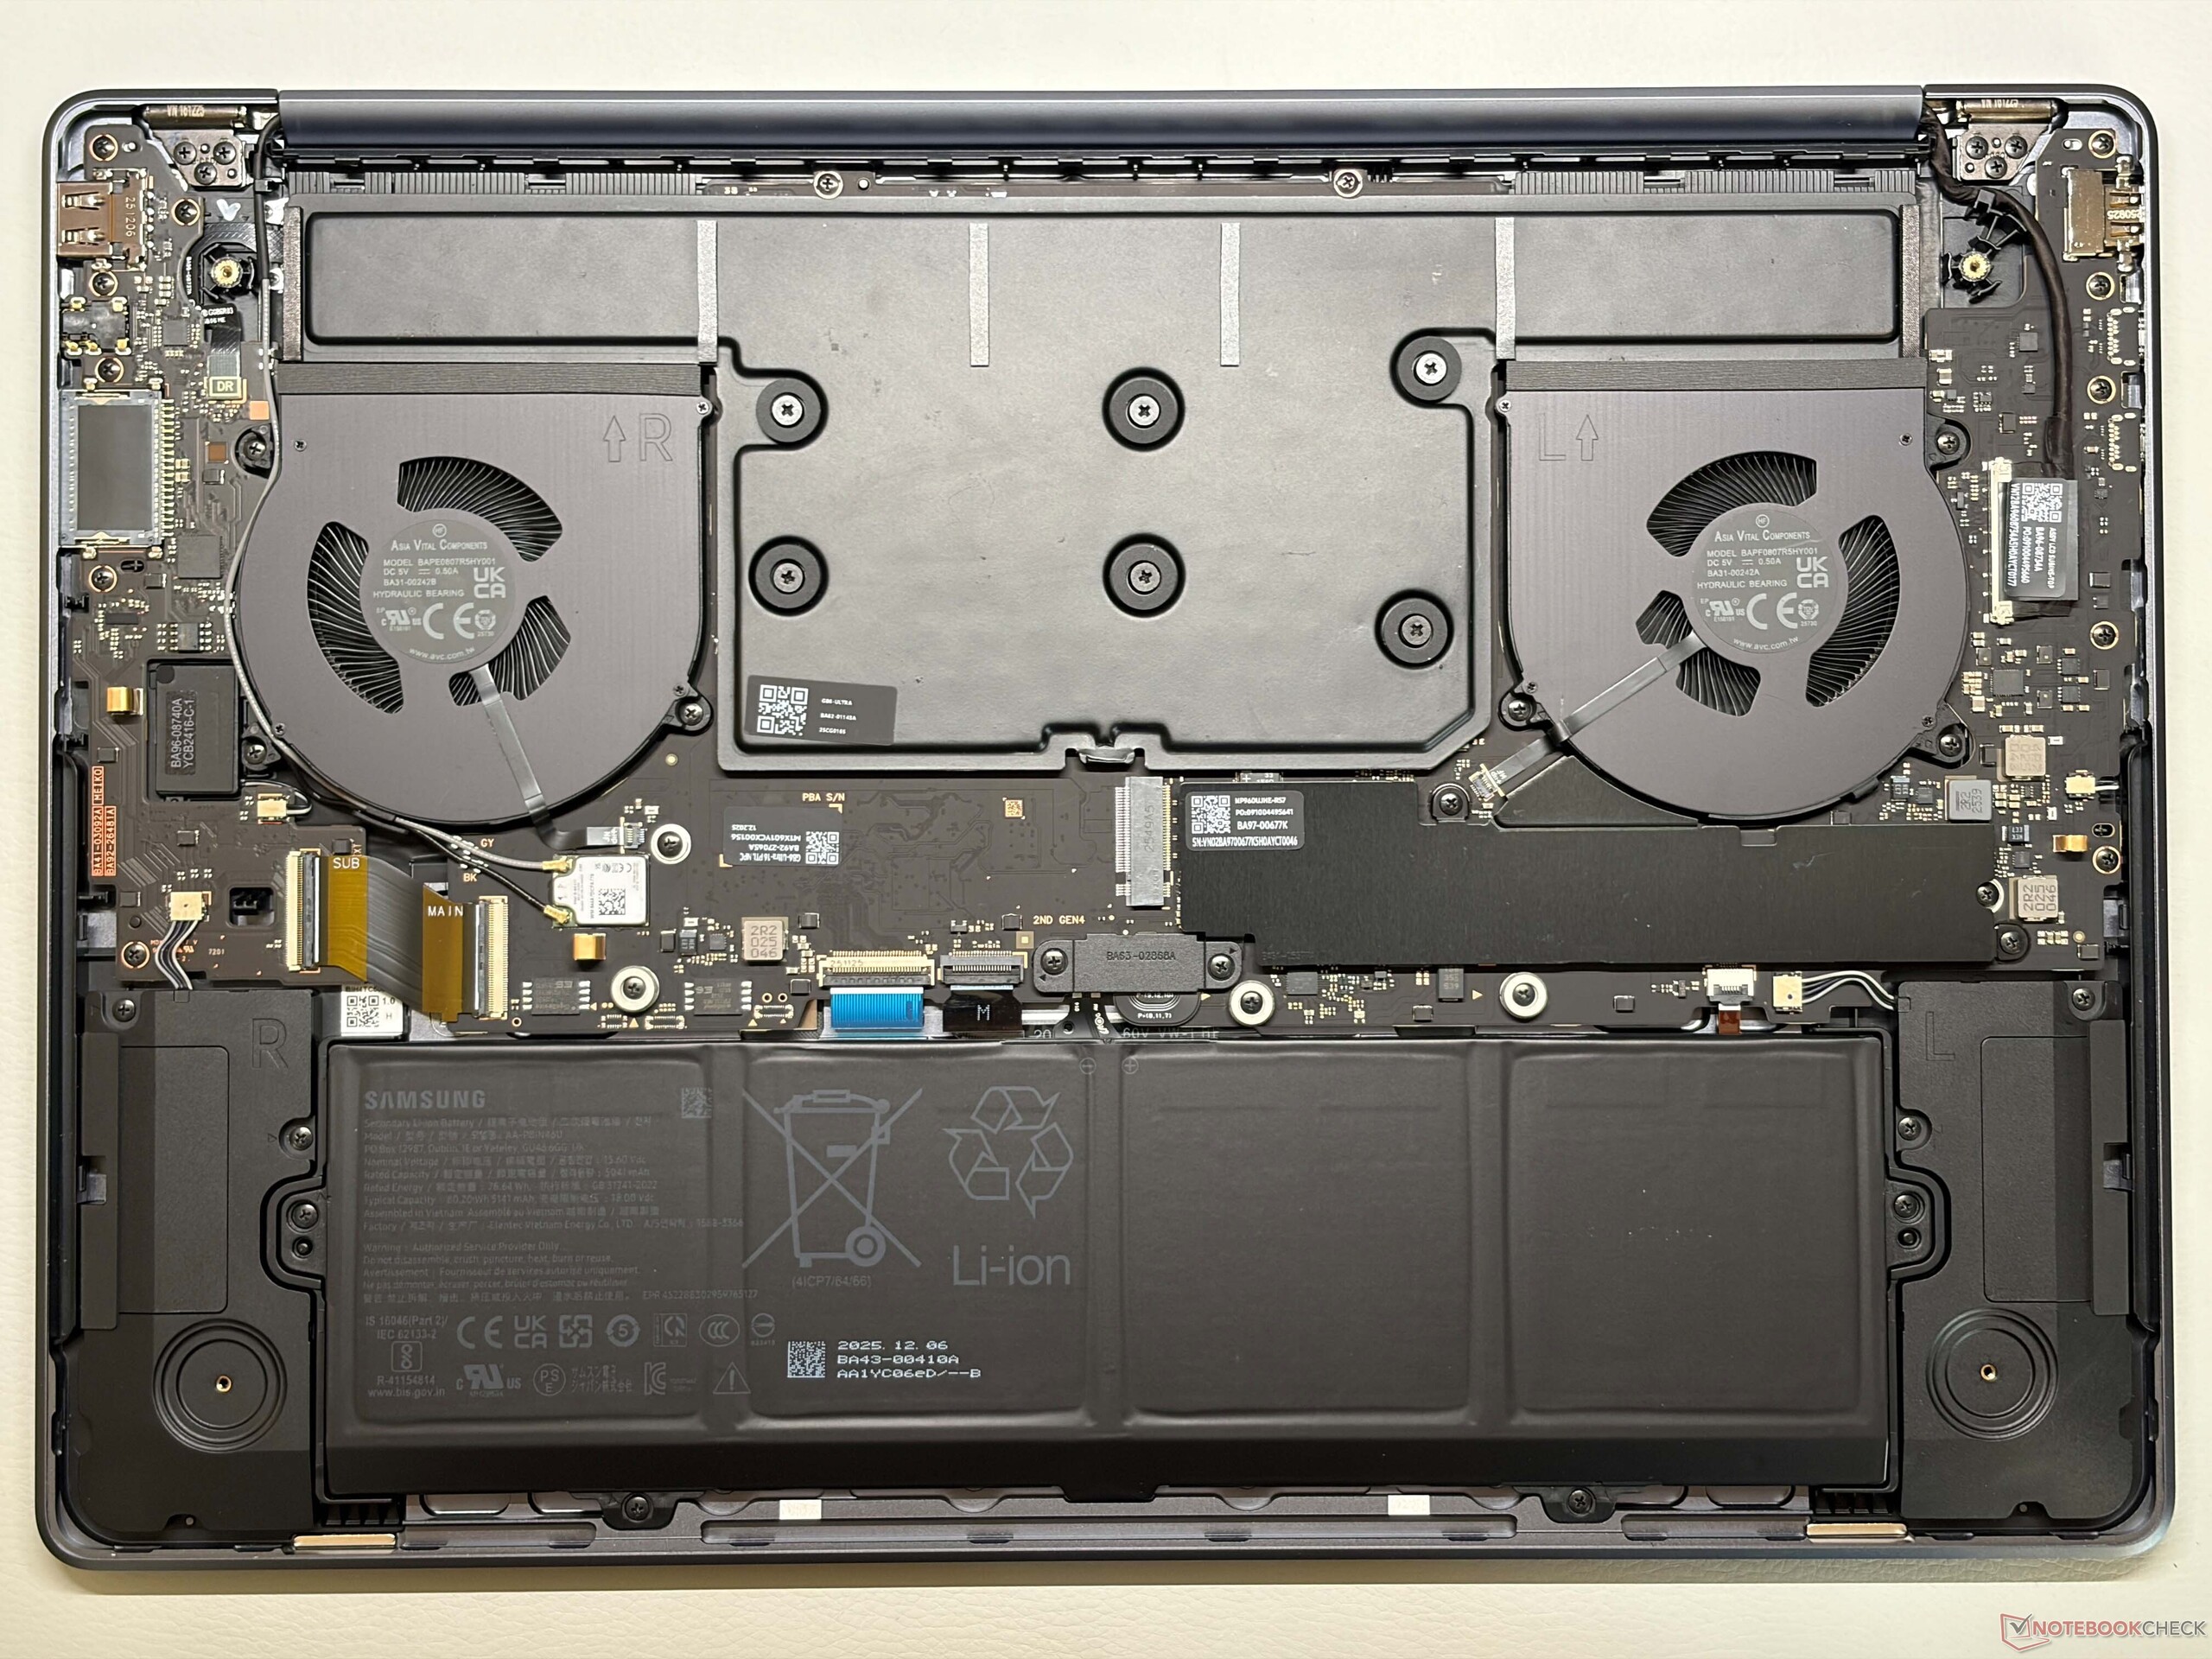
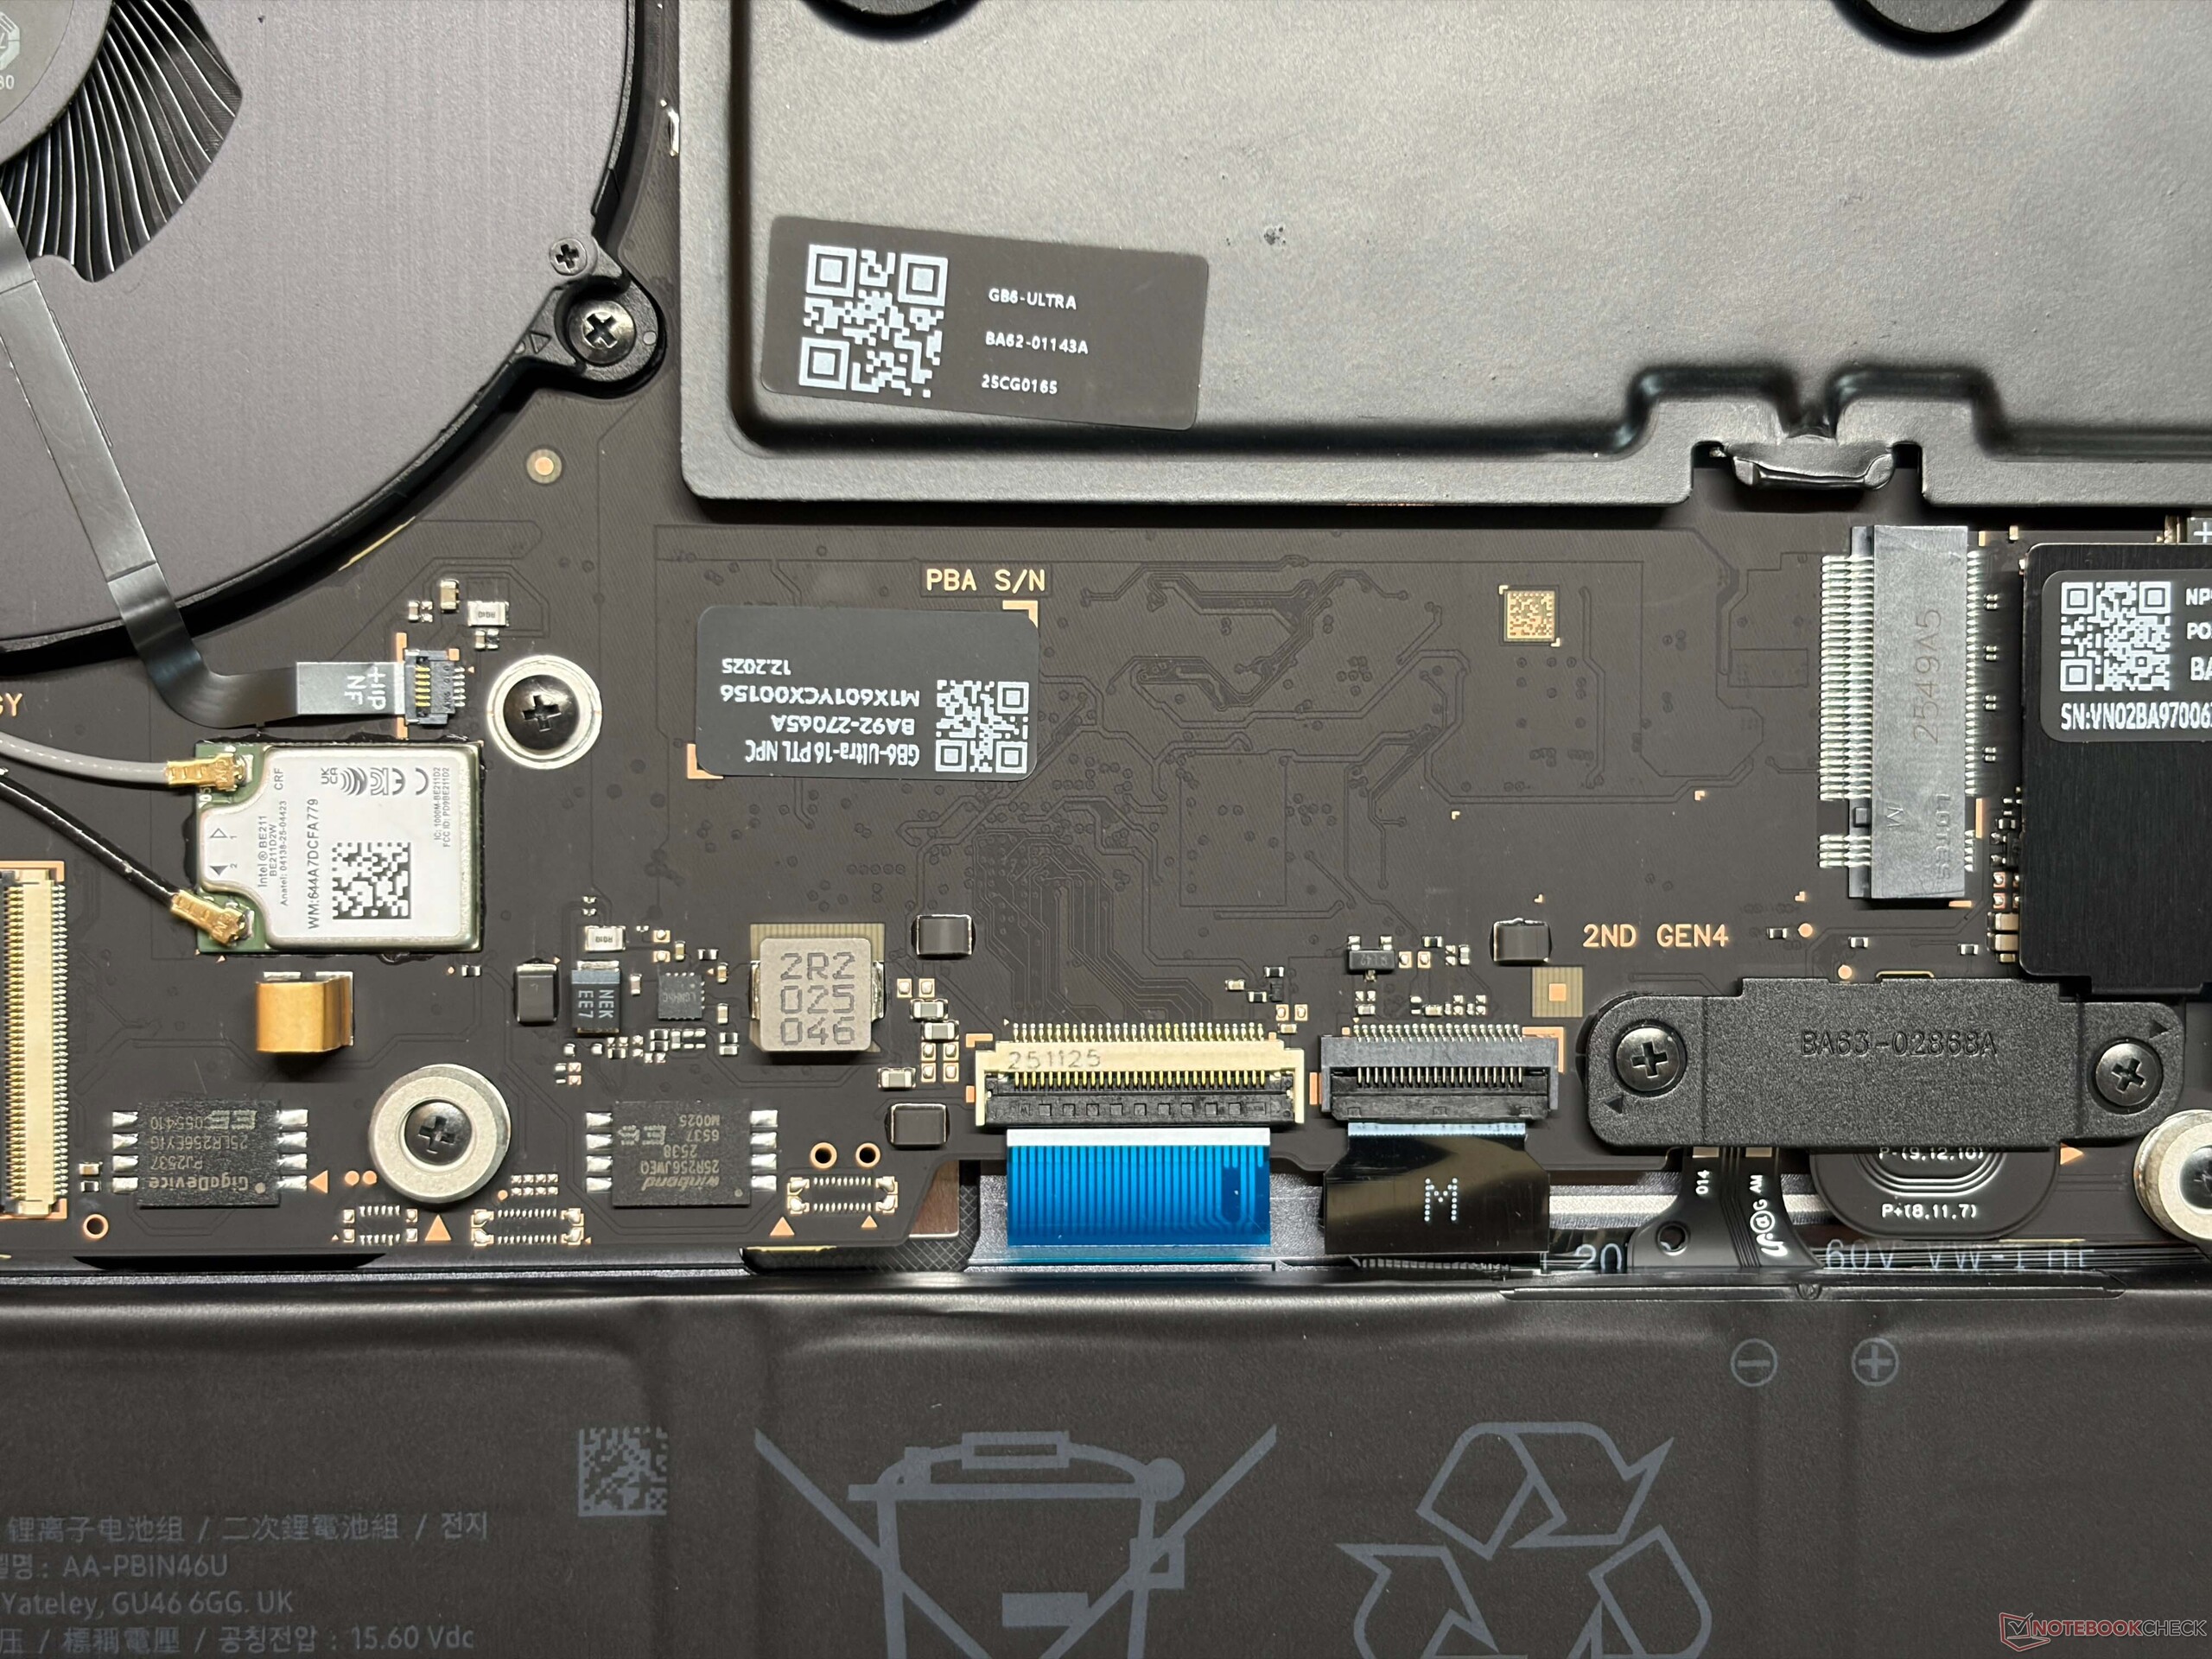
三星放弃了之前的楔形底座设计(其他Galaxy Book6 机型仍在使用),新款Galaxy Book6 Ultra 的外观和手感更像 MacBook Pro 16。我们确信,如果去掉标识,许多用户很难区分这两种机型。Galaxy Book6 Ultra 采用铝制机身,无论是稳定性还是制造质量,整体质量都非常出色。但指纹是个问题,而且表面不容易清洁。我们对铰链(最大开启角度约 135 度)不太满意,因为屏幕晃动很大。下边框也很厚。你可以拆下底部面板,访问固态硬盘插槽、电池和风扇,但不能更换内存和 Wi-Fi 模块。
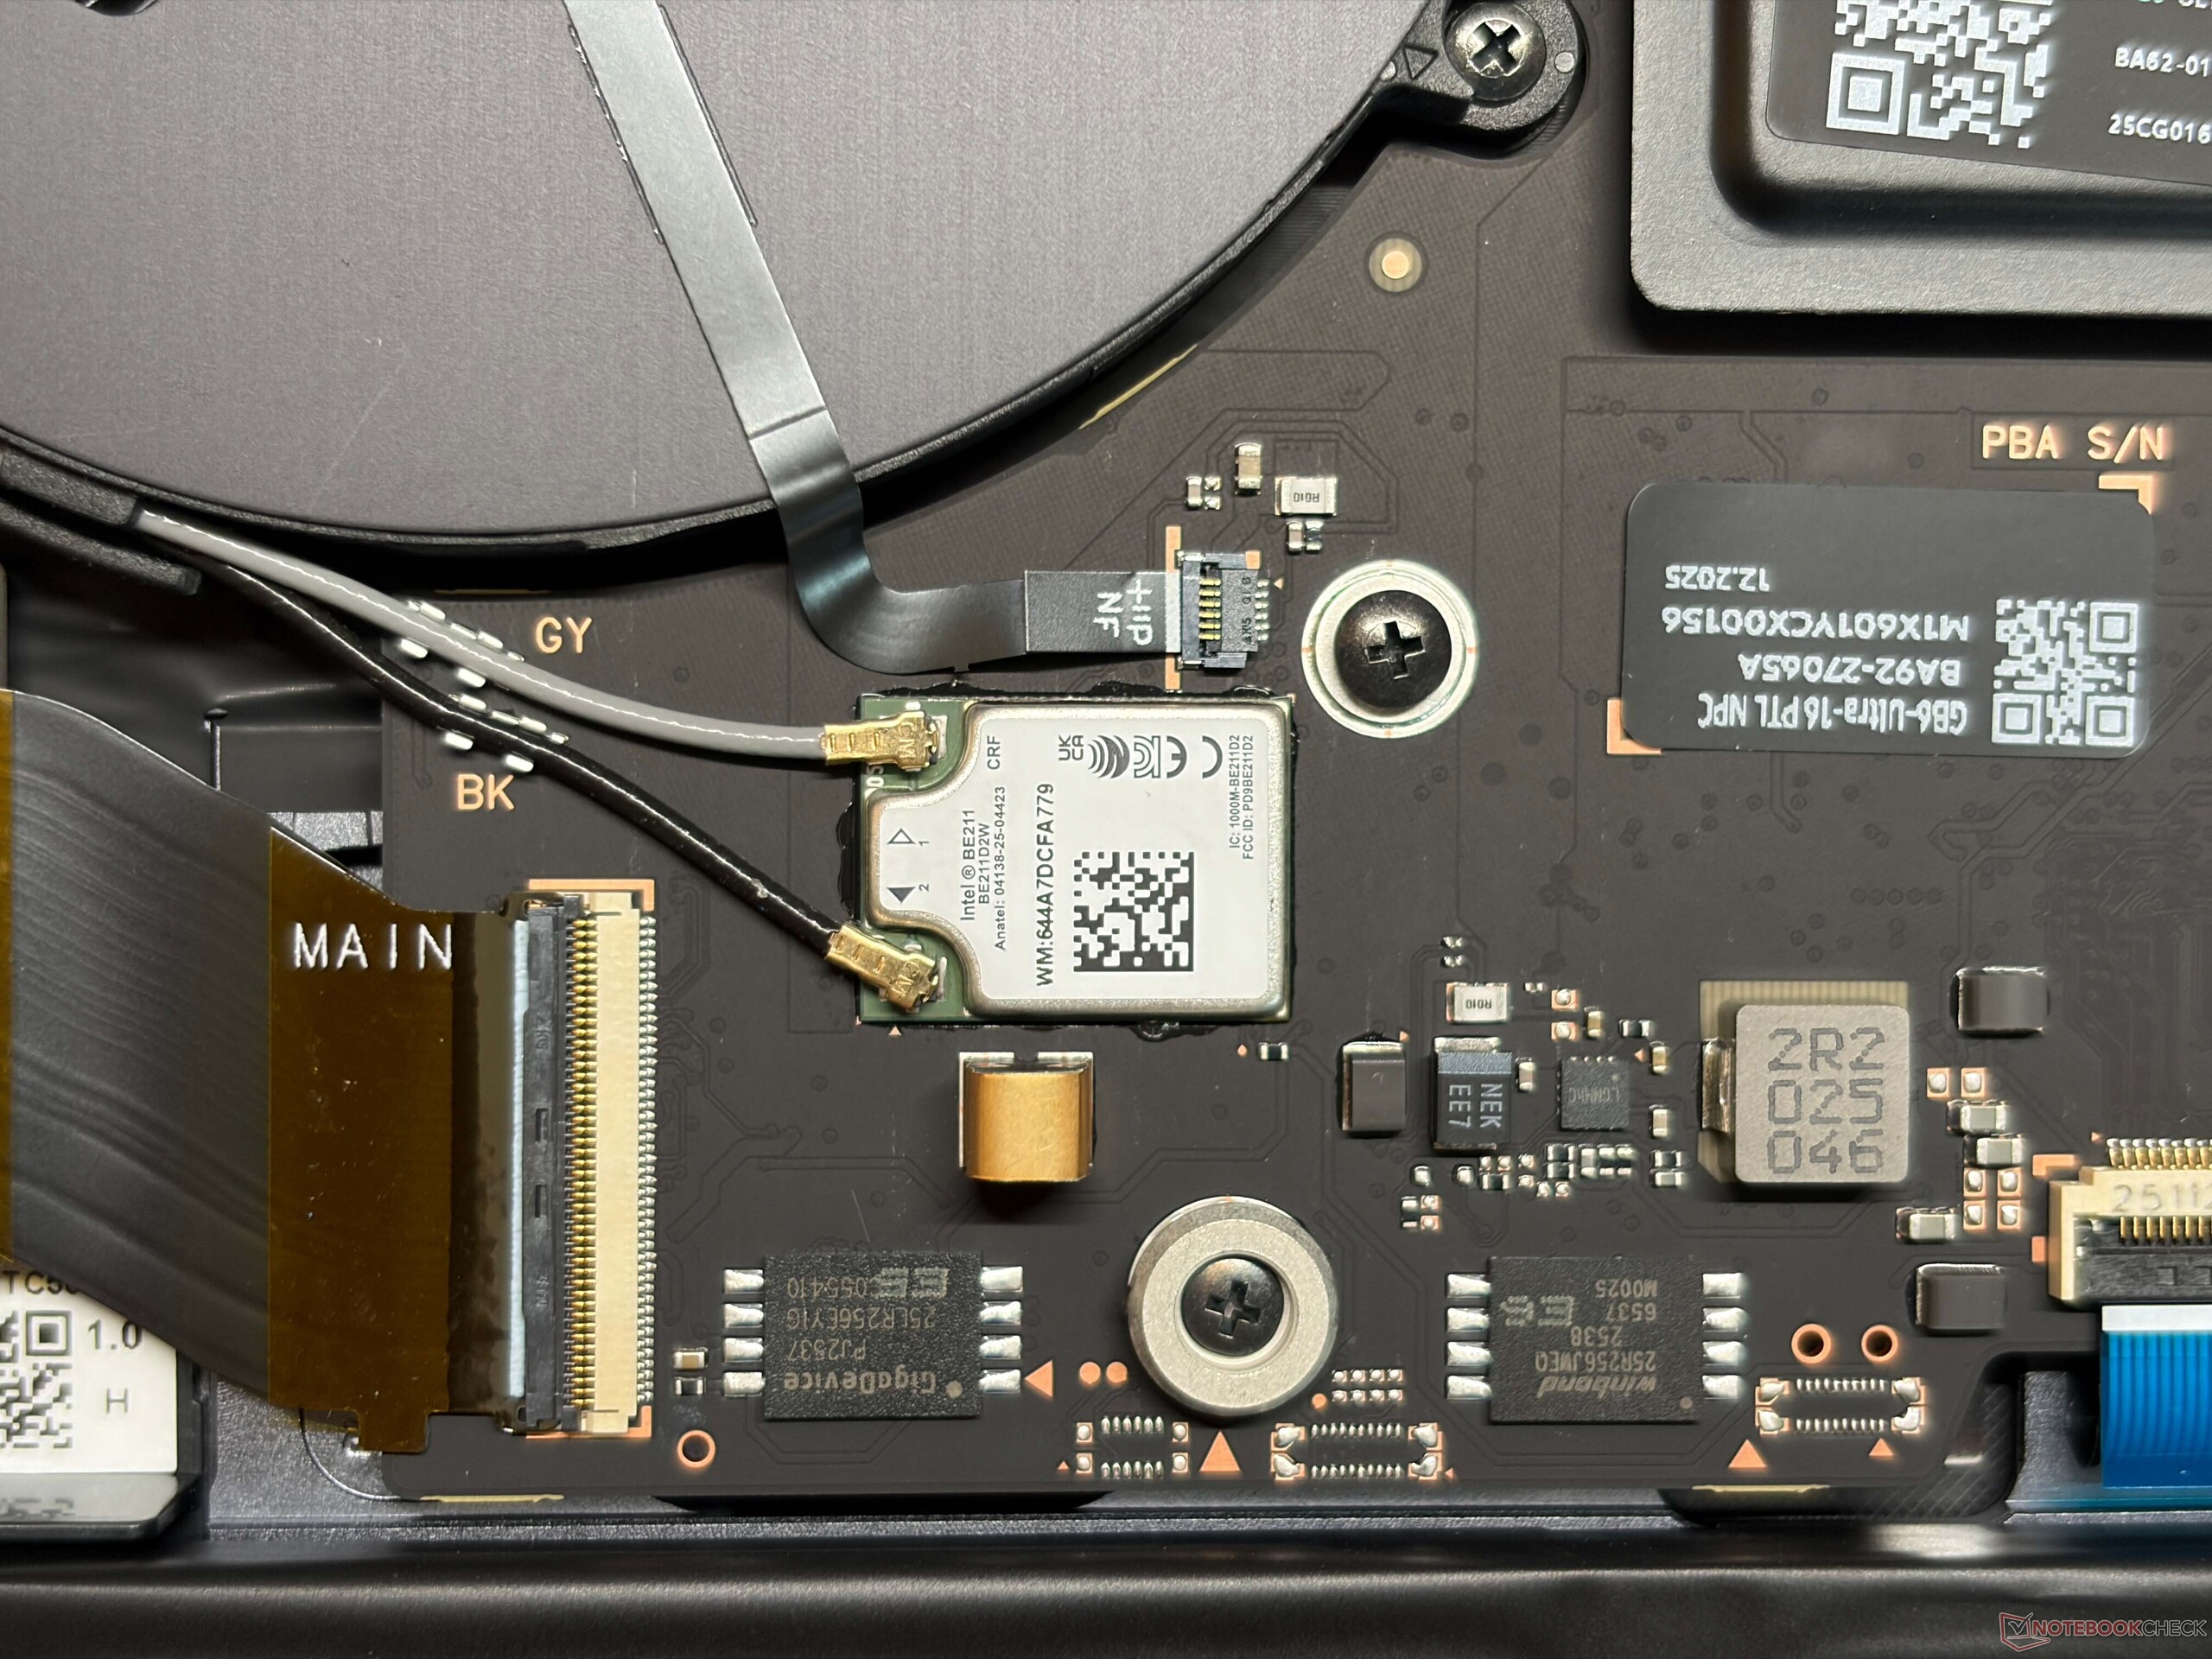
端口有限,只有两个 USB-C 端口和一个 USB-A 端口。其中一个 USB-C 端口还被电源适配器占用,因此可用端口数量有限。SD 卡读卡器的速度非常慢,大约为 80-90 MB/s,而且不支持 SD-Express。它配备了现代的 Wi-Fi 7 模块和蓝牙 5.4,传输速率不错。1080p 摄像头拍照效果一般,还支持面部识别,但没有快门。


| SD Card Reader | |
| average JPG Copy Test (av. of 3 runs) | |
| Lenovo ThinkPad T1g Gen 8 21TD003GE (ADATA SD8.0 Express 512 GBAV Pro V60) | |
| Lenovo ThinkPad T1g Gen 8 21TD003GE (Angelbird AV Pro V60) | |
| Asus ProArt P16 H7606WP (Angelbird AV Pro V60) | |
| Apple MacBook Pro 16 2024 M4 Pro (Angelbird AV Pro V60) | |
| Average of class Multimedia (23 - 531, n=41, last 2 years) | |
| Lenovo Yoga Pro 9i 16 RTX 5070 (Angelbird AV Pro V60) | |
| Samsung Galaxy Book6 Ultra (Angelbird AV Pro V60) | |
| maximum AS SSD Seq Read Test (1GB) | |
| Lenovo ThinkPad T1g Gen 8 21TD003GE (ADATA SD8.0 Express 512 GB) | |
| Lenovo ThinkPad T1g Gen 8 21TD003GE (Angelbird AV Pro V60) | |
| Asus ProArt P16 H7606WP (Angelbird AV Pro V60) | |
| Apple MacBook Pro 16 2024 M4 Pro (Angelbird AV Pro V60) | |
| Average of class Multimedia (37.3 - 1455, n=40, last 2 years) | |
| Lenovo Yoga Pro 9i 16 RTX 5070 (Angelbird AV Pro V60) | |
| Samsung Galaxy Book6 Ultra (Angelbird AV Pro V60) | |
| Networking | |
| Samsung Galaxy Book6 Ultra | |
| iperf3 transmit AXE11000 | |
| iperf3 receive AXE11000 | |
| Apple MacBook Pro 16 2024 M4 Pro | |
| iperf3 transmit AXE11000 | |
| iperf3 receive AXE11000 | |
| Lenovo Yoga Pro 9i 16 RTX 5070 | |
| iperf3 transmit AXE11000 | |
| iperf3 receive AXE11000 | |
| Dell 16 Premium DA16250 | |
| iperf3 transmit AXE11000 | |
| iperf3 receive AXE11000 | |
| iperf3 transmit AXE11000 6GHz | |
| iperf3 receive AXE11000 6GHz | |
| Lenovo ThinkPad T1g Gen 8 21TD003GE | |
| iperf3 transmit AXE11000 | |
| iperf3 receive AXE11000 | |
| Asus ProArt P16 H7606WP | |
| iperf3 transmit AXE11000 | |
| iperf3 receive AXE11000 | |


输入设备
三星还试图复制 MacBook Pro 的键盘,并取消了上一代机型的数字键盘。键程比较浅,三星和Apple 的键入体验其实非常相似,总体来说还不错,但也有更舒适的键盘,如 华硕 ProArt P16或 联想 Yoga Pro 9i 16.触觉触摸板效果很好,你也可以使用电容式触摸屏进行输入。


显示屏 - 新型 OLED 触摸屏

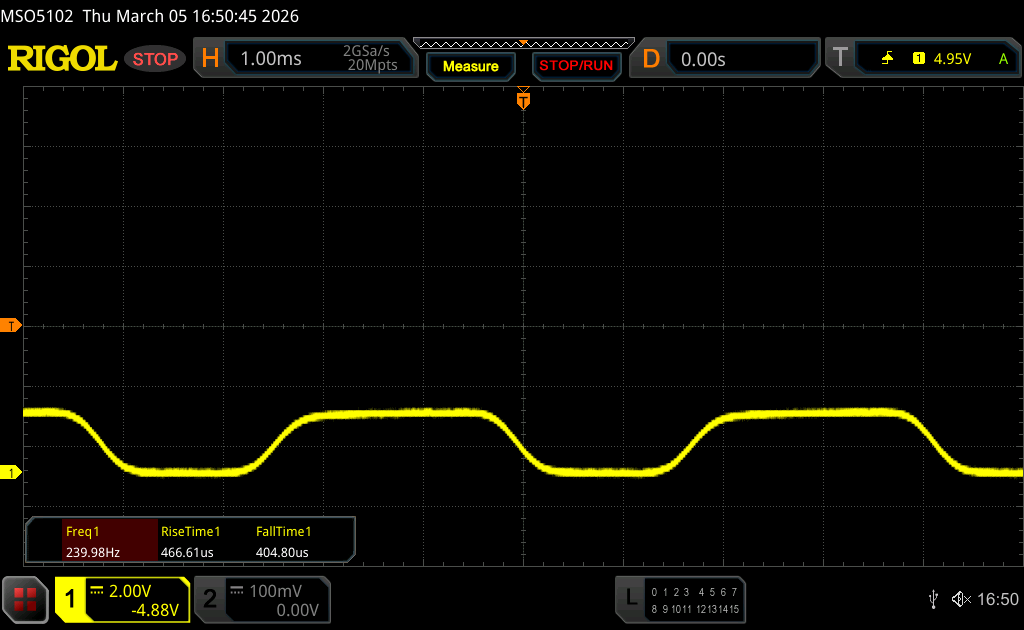
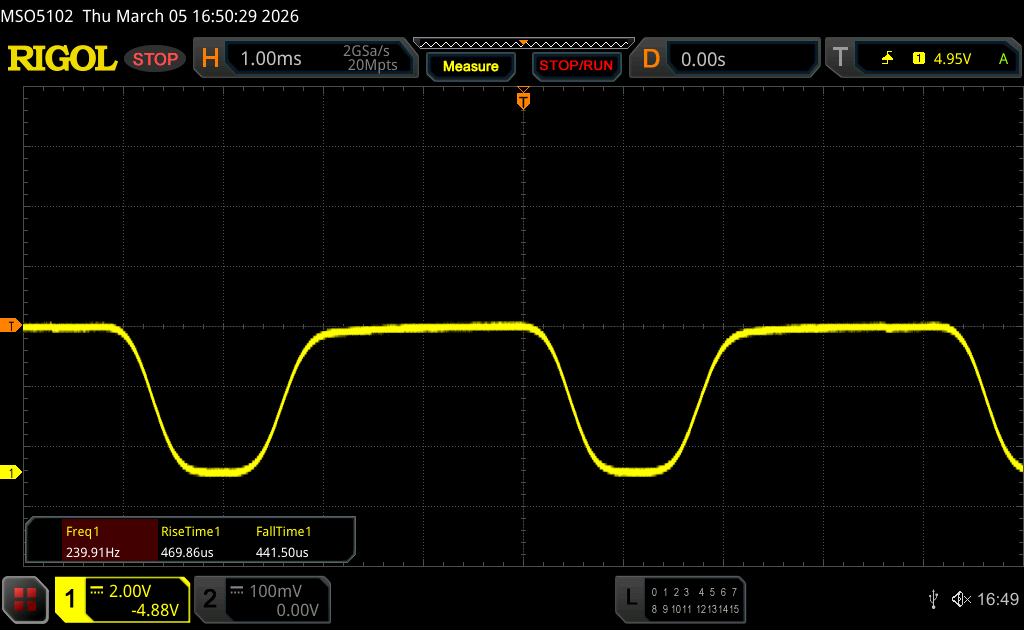
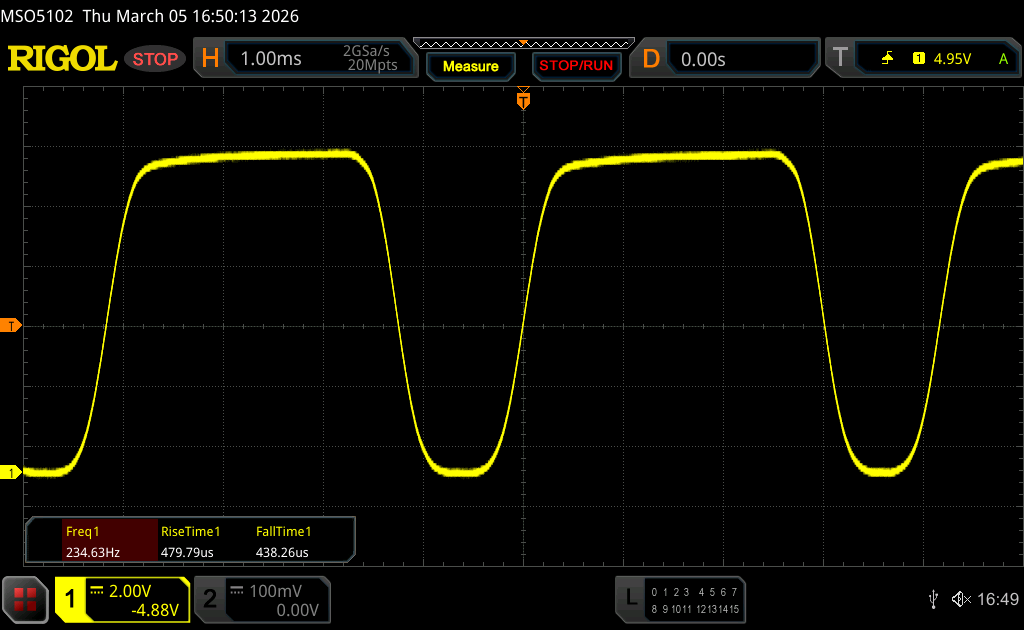
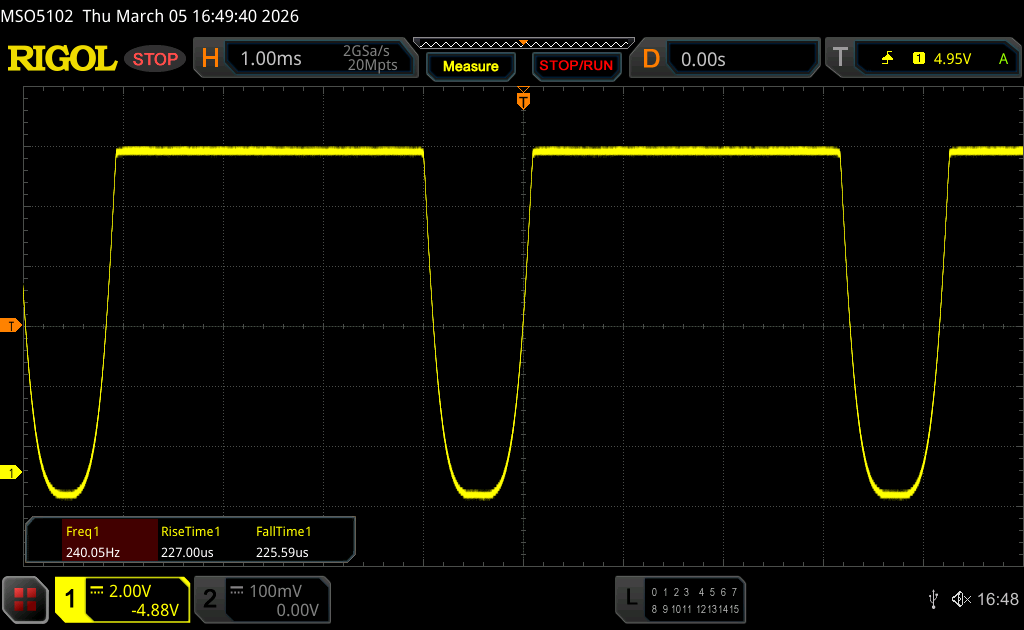
三星为Galaxy Book6 Ultra 采用了全新的 OLED 触摸屏(2880 x 1800 像素),主观画质非常出色,黑色深邃,色彩丰富,由于采用了 120 Hz(30-120 Hz 之间自适应),动作流畅,明亮的内容也不会受到触摸层的影响。响应时间很快,但我们可以测量到在每个亮度级别都会出现 PWM 闪烁,频率为 240 Hz,幅度相当大,因此敏感用户应先试用该面板。
亮度也有所提高,现在我们测量到 SDR 的亮度约为 500 尼特,HDR 内容的亮度可达 1182 尼特(全白图像为 645 尼特)。这是一个进步,但还不能与串联式 OLED 屏幕或 MacBook 的 Mini-LED 屏幕相提并论。三星提供了多种色彩配置文件,包括 P3 和 sRGB。我们使用专业的 CalMAN 软件进行了分析,结果显示色彩准确度非常好,而我们自己的校准并没有进一步改善图像质量。因此,Galaxy Book6 Ultra 非常适合图片编辑。
| |||||||||||||||||||||||||
Brightness Distribution: 97 %
Center on Battery: 499 cd/m²
Contrast: ∞:1 (Black: 0 cd/m²)
ΔE ColorChecker Calman: 0.9 | ∀{0.5-29.43 Ø4.72}
ΔE Greyscale Calman: 1.6 | ∀{0.09-98 Ø4.97}
85.3% AdobeRGB 1998 (Argyll 3D)
99.9% sRGB (Argyll 3D)
97% Display P3 (Argyll 3D)
Gamma: 2.22
CCT: 6445 K
| Samsung Galaxy Book6 Ultra ATNA60HR05-0, OLED, 2880x1800, 16", 120 Hz | Apple MacBook Pro 16 2024 M4 Pro Mini-LED, 3456x2234, 16.2", 120 Hz | Lenovo Yoga Pro 9i 16 RTX 5070 ATNA60KA01-0, OLED, 3200x2000, 16", 120 Hz | Asus ProArt P16 RTX 5090 ATNA60HC03-0, OLED, 3840x2400, 16", 120 Hz | Dell 16 Premium DA16250 Samsung 163DU02, OLED, 3840x2400, 16.3", 120 Hz | Lenovo ThinkPad T1g Gen 8 21TD003GE ATNA60KA02-0, Tandem-OLED, 3200x2000, 16", 120 Hz | |
|---|---|---|---|---|---|---|
| Display | 2% | 4% | 2% | 2% | 2% | |
| Display P3 Coverage (%) | 97 | 99.7 3% | 97.4 0% | 98.9 2% | 99.7 3% | 98.8 2% |
| sRGB Coverage (%) | 99.9 | 100 0% | 100 0% | 100 0% | 100 0% | 100 0% |
| AdobeRGB 1998 Coverage (%) | 85.3 | 88.8 4% | 96.8 13% | 88.6 4% | 88.1 3% | 88.9 4% |
| Response Times | -6230% | 44% | 30% | -26% | 40% | |
| Response Time Grey 50% / Grey 80% * (ms) | 0.5 ? | 43 ? -8500% | 0.27 ? 46% | 0.3 ? 40% | 0.61 ? -22% | 0.26 ? 48% |
| Response Time Black / White * (ms) | 0.4 ? | 41.2 ? -10200% | 0.37 ? 7% | 0.45 ? -13% | 0.88 ? -120% | 0.42 ? -5% |
| PWM Frequency (Hz) | 240 ? | 14880 | 1200 | 480 ? | 490.8 ? | 1200 ? |
| PWM Amplitude * (%) | 100 | 90 10% | 22 78% | 38 62% | 35 65% | 22 78% |
| Screen | 29% | 38% | 34% | -19% | -37% | |
| Brightness middle (cd/m²) | 499 | 632 27% | 974 95% | 661 32% | 385.7 -23% | 578 16% |
| Brightness (cd/m²) | 505 | 616 22% | 979 94% | 663 31% | 387 -23% | 583 15% |
| Brightness Distribution (%) | 97 | 95 -2% | 98 1% | 99 2% | 98 1% | 98 1% |
| Black Level * (cd/m²) | ||||||
| Colorchecker dE 2000 * | 0.9 | 0.6 33% | 0.9 -0% | 0.5 44% | 1.36 -51% | 1.6 -78% |
| Colorchecker dE 2000 max. * | 2.1 | 1.2 43% | 1.7 19% | 1.4 33% | 2.85 -36% | 4.5 -114% |
| Greyscale dE 2000 * | 1.6 | 0.8 50% | 1.3 19% | 0.6 63% | 1.3 19% | 2.6 -63% |
| Gamma | 2.22 99% | 2.21 100% | 2.21 100% | 2.19 100% | 2.2 100% | 2.19 100% |
| CCT | 6445 101% | 6450 101% | 6751 96% | 6565 99% | 6282 103% | 6527 100% |
| Colorchecker dE 2000 calibrated * | 0.65 | |||||
| Total Average (Program / Settings) | -2066% /
-1543% | 29% /
31% | 22% /
25% | -14% /
-15% | 2% /
-8% |
* ... smaller is better


Display Response Times
| ↔ Response Time Black to White | ||
|---|---|---|
| 0.4 ms ... rise ↗ and fall ↘ combined | ↗ 0.2 ms rise | 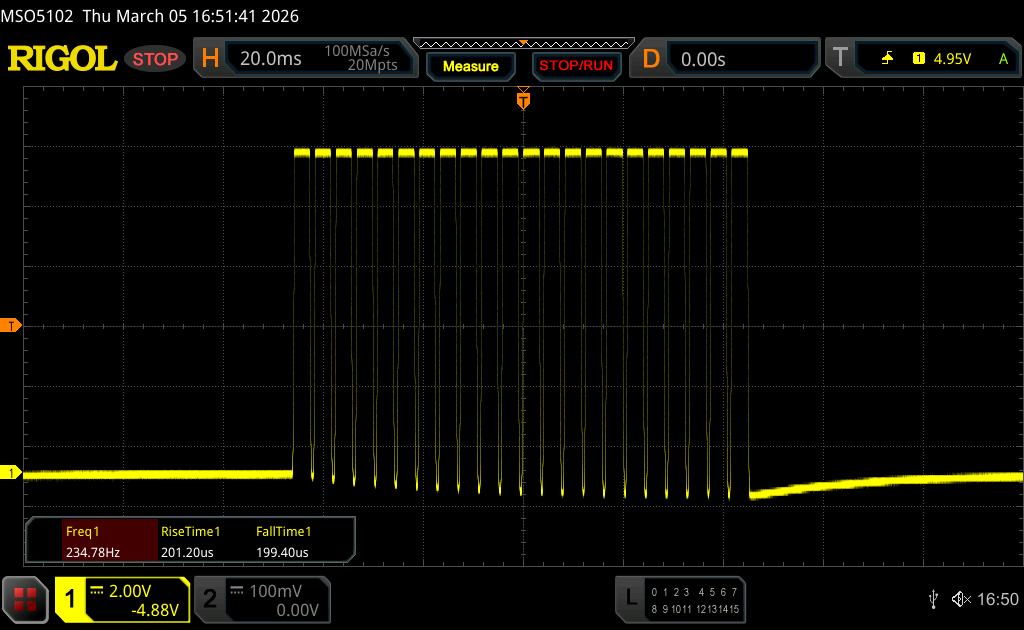 |
| ↘ 0.2 ms fall | ||
| The screen shows very fast response rates in our tests and should be very well suited for fast-paced gaming. In comparison, all tested devices range from 0.1 (minimum) to 240 (maximum) ms. » 0 % of all devices are better. This means that the measured response time is better than the average of all tested devices (19.8 ms). | ||
| ↔ Response Time 50% Grey to 80% Grey | ||
| 0.5 ms ... rise ↗ and fall ↘ combined | ↗ 0.25 ms rise | 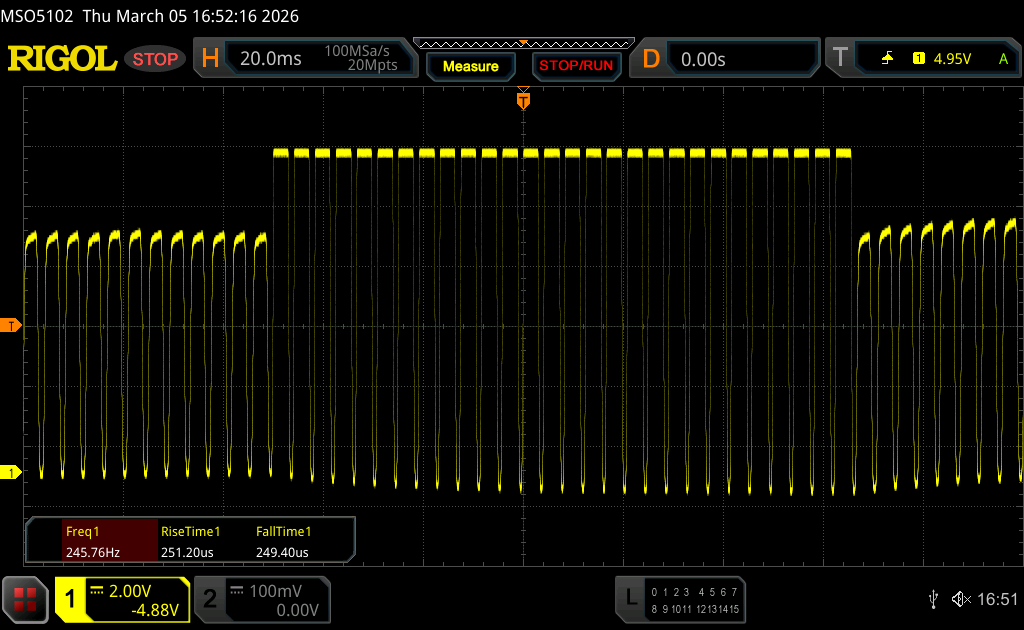 |
| ↘ 0.25 ms fall | ||
| The screen shows very fast response rates in our tests and should be very well suited for fast-paced gaming. In comparison, all tested devices range from 0.165 (minimum) to 636 (maximum) ms. » 1 % of all devices are better. This means that the measured response time is better than the average of all tested devices (31 ms). | ||
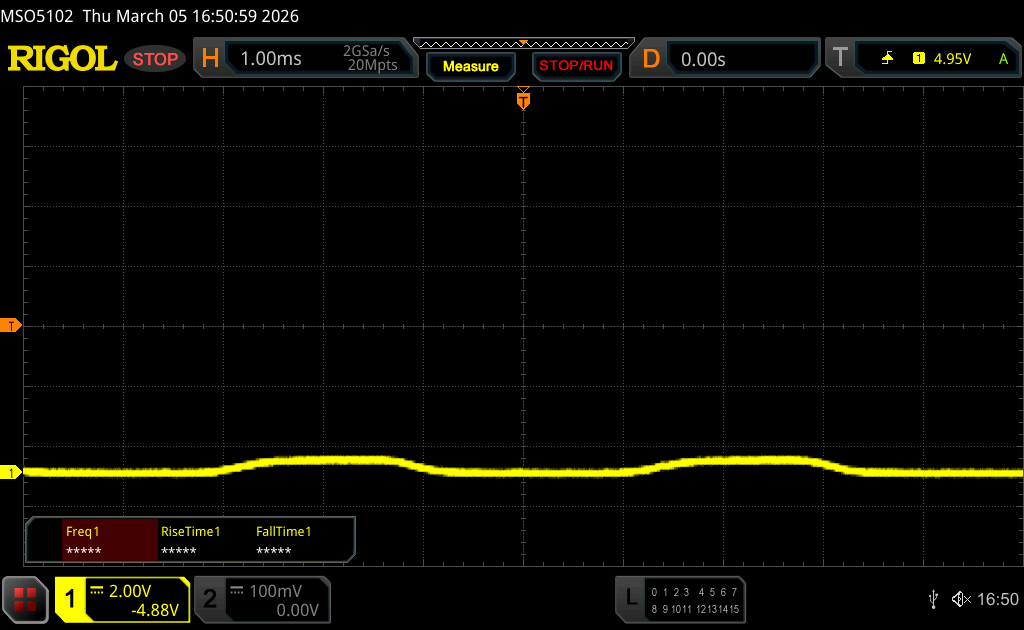
Screen Flickering / PWM (Pulse-Width Modulation)
| Screen flickering / PWM detected | 240 Hz Amplitude: 100 % | ≤ 100 % brightness setting | 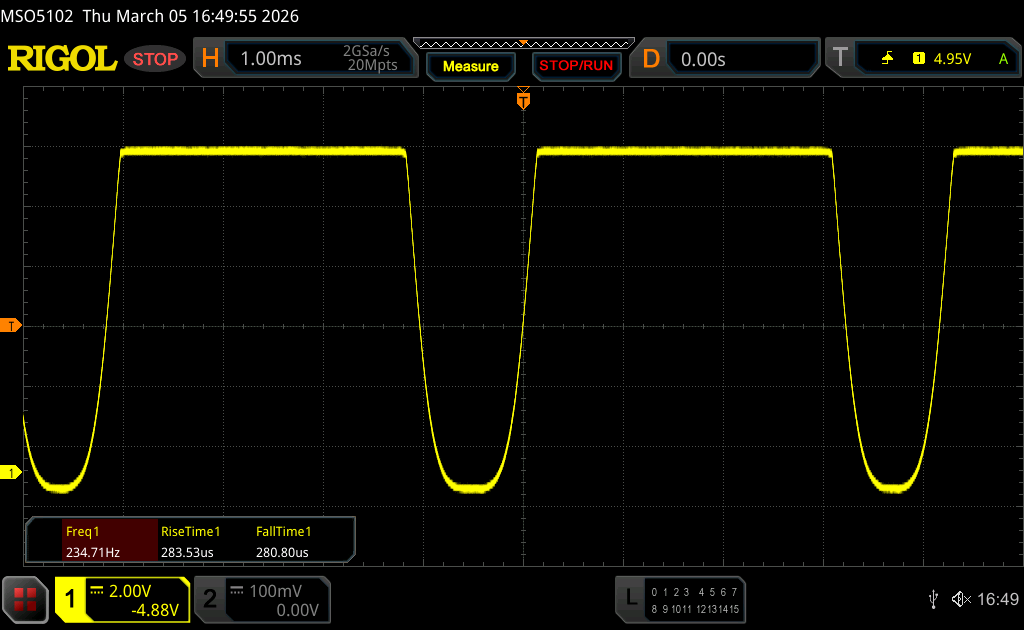 |
The display backlight flickers at 240 Hz (worst case, e.g., utilizing PWM) Flickering detected at a brightness setting of 100 % and below. There should be no flickering or PWM above this brightness setting. The frequency of 240 Hz is relatively low, so sensitive users will likely notice flickering and experience eyestrain at the stated brightness setting and below. In comparison: 52 % of all tested devices do not use PWM to dim the display. If PWM was detected, an average of 7747 (minimum: 5 - maximum: 343500) Hz was measured. | |||


表演 - 黑豹湖与布莱克韦尔
测试条件
三星内置多个电源配置文件,并与 Windows 设置同步。我们在高性能模式下进行了基准测试。
| Profile | TDP (Watts) | CB R24 Multi (points) | TGP (Watts) | Time Sy Graphics (Points) | Cyberpunk 2077 QHD Ultra (FPS) | 最大风扇噪音(dB(A)) |
|---|---|---|---|---|---|---|
| 安静型 | 45/30 | 916 | 22 | 3054 | 14.4 | 33.7 |
| 优化型 | 65/45/35 | 1002 | 60 | 9149 | 47.2 | 40.3 |
| 高性能 | 65 | 1232 | 90 | 12027 | 57.4 | 48.5 |
| 电池 | 65/50 | 1173 | 70 | 10258 | 49.7 | 48.2 |
处理器
我们的评测机配备了 酷睿至尊 7 356H(Panther Lake),它提供 16 个内核,最高主频为 4.7 GHz。它与 Core Ultra X7(最高主频 4.8 GHz)几乎完全相同,但不包括快速的 Arc B390 GPU。在 65 瓦的功率限制下,CPU 性能良好且稳定。所有 Windows 设备的性能都非常接近,只有配备 M4 Pro 的 MacBook Pro 在多核尤其是单核情况下明显更胜一筹,而即将推出的 M5 Pro 很可能会进一步拉大差距。
Cinebench R15 多回路运行
Cinebench 2024: CPU Multi Core | CPU Single Core
Cinebench R23: Multi Core | Single Core
Cinebench R20: CPU (Multi Core) | CPU (Single Core)
Cinebench R15: CPU Multi 64Bit | CPU Single 64Bit
Blender: v2.79 BMW27 CPU
7-Zip 18.03: 7z b 4 | 7z b 4 -mmt1
Geekbench 6.7: Multi-Core | Single-Core
Geekbench 5.5: Multi-Core | Single-Core
HWBOT x265 Benchmark v2.2: 4k Preset
LibreOffice : 20 Documents To PDF
R Benchmark 2.5: Overall mean
| CPU Performance rating | |
| Apple MacBook Pro 16 M4 Max -8! | |
| Apple MacBook Pro 16 2024 M4 Pro -12! | |
| Lenovo Yoga Pro 9i 16 RTX 5070 | |
| Lenovo ThinkPad T1g Gen 8 21TD003GE | |
| Asus ProArt P16 RTX 5090 | |
| Samsung Galaxy Book6 Ultra | |
| Dell 16 Premium DA16250 | |
| Average Intel Core Ultra 7 356H | |
| Average of class Multimedia | |
| Cinebench 2024 / CPU Multi Core | |
| Apple MacBook Pro 16 M4 Max | |
| Apple MacBook Pro 16 M4 Max | |
| Apple MacBook Pro 16 2024 M4 Pro | |
| Asus ProArt P16 RTX 5090 | |
| Samsung Galaxy Book6 Ultra | |
| Lenovo Yoga Pro 9i 16 RTX 5070 | |
| Average Intel Core Ultra 7 356H (1006 - 1232, n=3) | |
| Lenovo ThinkPad T1g Gen 8 21TD003GE | |
| Dell 16 Premium DA16250 | |
| Average of class Multimedia (327 - 2437, n=76, last 2 years) | |
| Cinebench 2024 / CPU Single Core | |
| Apple MacBook Pro 16 2024 M4 Pro | |
| Apple MacBook Pro 16 M4 Max | |
| Average of class Multimedia (72.5 - 201, n=60, last 2 years) | |
| Lenovo Yoga Pro 9i 16 RTX 5070 | |
| Lenovo ThinkPad T1g Gen 8 21TD003GE | |
| Samsung Galaxy Book6 Ultra | |
| Dell 16 Premium DA16250 | |
| Average Intel Core Ultra 7 356H (116 - 122.4, n=3) | |
| Asus ProArt P16 RTX 5090 | |
| Cinebench R23 / Multi Core | |
| Apple MacBook Pro 16 M4 Max | |
| Asus ProArt P16 RTX 5090 | |
| Lenovo Yoga Pro 9i 16 RTX 5070 | |
| Apple MacBook Pro 16 2024 M4 Pro | |
| Lenovo ThinkPad T1g Gen 8 21TD003GE | |
| Dell 16 Premium DA16250 | |
| Samsung Galaxy Book6 Ultra | |
| Average Intel Core Ultra 7 356H (18395 - 20650, n=2) | |
| Average of class Multimedia (4861 - 33362, n=77, last 2 years) | |
| Cinebench R23 / Single Core | |
| Apple MacBook Pro 16 2024 M4 Pro | |
| Apple MacBook Pro 16 M4 Max | |
| Lenovo Yoga Pro 9i 16 RTX 5070 | |
| Lenovo ThinkPad T1g Gen 8 21TD003GE | |
| Samsung Galaxy Book6 Ultra | |
| Average Intel Core Ultra 7 356H (2040 - 2045, n=2) | |
| Asus ProArt P16 RTX 5090 | |
| Average of class Multimedia (1128 - 2459, n=69, last 2 years) | |
| Dell 16 Premium DA16250 | |
| Cinebench R20 / CPU (Multi Core) | |
| Asus ProArt P16 RTX 5090 | |
| Lenovo Yoga Pro 9i 16 RTX 5070 | |
| Lenovo ThinkPad T1g Gen 8 21TD003GE | |
| Dell 16 Premium DA16250 | |
| Samsung Galaxy Book6 Ultra | |
| Average Intel Core Ultra 7 356H (7180 - 8074, n=2) | |
| Apple MacBook Pro 16 M4 Max | |
| Average of class Multimedia (1887 - 12912, n=60, last 2 years) | |
| Cinebench R20 / CPU (Single Core) | |
| Lenovo Yoga Pro 9i 16 RTX 5070 | |
| Lenovo ThinkPad T1g Gen 8 21TD003GE | |
| Asus ProArt P16 RTX 5090 | |
| Average Intel Core Ultra 7 356H (773 - 774, n=2) | |
| Samsung Galaxy Book6 Ultra | |
| Dell 16 Premium DA16250 | |
| Average of class Multimedia (425 - 853, n=60, last 2 years) | |
| Apple MacBook Pro 16 M4 Max | |
| Cinebench R15 / CPU Multi 64Bit | |
| Apple MacBook Pro 16 M4 Max | |
| Asus ProArt P16 RTX 5090 | |
| Lenovo Yoga Pro 9i 16 RTX 5070 | |
| Lenovo ThinkPad T1g Gen 8 21TD003GE | |
| Dell 16 Premium DA16250 | |
| Samsung Galaxy Book6 Ultra | |
| Average Intel Core Ultra 7 356H (2937 - 3201, n=2) | |
| Average of class Multimedia (856 - 5224, n=64, last 2 years) | |
| Cinebench R15 / CPU Single 64Bit | |
| Lenovo Yoga Pro 9i 16 RTX 5070 | |
| Lenovo ThinkPad T1g Gen 8 21TD003GE | |
| Apple MacBook Pro 16 M4 Max | |
| Samsung Galaxy Book6 Ultra | |
| Average Intel Core Ultra 7 356H (303 - 306, n=2) | |
| Dell 16 Premium DA16250 | |
| Average of class Multimedia (184.8 - 326, n=62, last 2 years) | |
| Asus ProArt P16 RTX 5090 | |
| Blender / v2.79 BMW27 CPU | |
| Average of class Multimedia (100 - 557, n=61, last 2 years) | |
| Average Intel Core Ultra 7 356H (163 - 196, n=2) | |
| Dell 16 Premium DA16250 | |
| Samsung Galaxy Book6 Ultra | |
| Lenovo ThinkPad T1g Gen 8 21TD003GE | |
| Lenovo Yoga Pro 9i 16 RTX 5070 | |
| Asus ProArt P16 RTX 5090 | |
| 7-Zip 18.03 / 7z b 4 | |
| Asus ProArt P16 RTX 5090 | |
| Lenovo Yoga Pro 9i 16 RTX 5070 | |
| Samsung Galaxy Book6 Ultra | |
| Lenovo ThinkPad T1g Gen 8 21TD003GE | |
| Dell 16 Premium DA16250 | |
| Average Intel Core Ultra 7 356H (65579 - 69785, n=2) | |
| Average of class Multimedia (26062 - 130368, n=58, last 2 years) | |
| 7-Zip 18.03 / 7z b 4 -mmt1 | |
| Average Intel Core Ultra 7 356H (6305 - 6375, n=2) | |
| Samsung Galaxy Book6 Ultra | |
| Lenovo Yoga Pro 9i 16 RTX 5070 | |
| Asus ProArt P16 RTX 5090 | |
| Lenovo ThinkPad T1g Gen 8 21TD003GE | |
| Average of class Multimedia (3666 - 7545, n=59, last 2 years) | |
| Dell 16 Premium DA16250 | |
| Geekbench 6.7 / Multi-Core | |
| Apple MacBook Pro 16 M4 Max | |
| Apple MacBook Pro 16 2024 M4 Pro | |
| Lenovo Yoga Pro 9i 16 RTX 5070 | |
| Lenovo ThinkPad T1g Gen 8 21TD003GE | |
| Dell 16 Premium DA16250 | |
| Samsung Galaxy Book6 Ultra | |
| Average Intel Core Ultra 7 356H (15578 - 16676, n=3) | |
| Asus ProArt P16 RTX 5090 | |
| Average of class Multimedia (4983 - 29415, n=72, last 2 years) | |
| Geekbench 6.7 / Single-Core | |
| Apple MacBook Pro 16 M4 Max | |
| Apple MacBook Pro 16 2024 M4 Pro | |
| Lenovo Yoga Pro 9i 16 RTX 5070 | |
| Lenovo ThinkPad T1g Gen 8 21TD003GE | |
| Asus ProArt P16 RTX 5090 | |
| Average of class Multimedia (1534 - 4335, n=71, last 2 years) | |
| Samsung Galaxy Book6 Ultra | |
| Dell 16 Premium DA16250 | |
| Average Intel Core Ultra 7 356H (2532 - 2851, n=3) | |
| Geekbench 5.5 / Multi-Core | |
| Lenovo Yoga Pro 9i 16 RTX 5070 | |
| Lenovo ThinkPad T1g Gen 8 21TD003GE | |
| Samsung Galaxy Book6 Ultra | |
| Average Intel Core Ultra 7 356H (16721 - 16761, n=2) | |
| Dell 16 Premium DA16250 | |
| Asus ProArt P16 RTX 5090 | |
| Average of class Multimedia (4652 - 20422, n=59, last 2 years) | |
| Geekbench 5.5 / Single-Core | |
| Asus ProArt P16 RTX 5090 | |
| Lenovo Yoga Pro 9i 16 RTX 5070 | |
| Lenovo ThinkPad T1g Gen 8 21TD003GE | |
| Average Intel Core Ultra 7 356H (2086 - 2098, n=2) | |
| Samsung Galaxy Book6 Ultra | |
| Average of class Multimedia (805 - 2974, n=59, last 2 years) | |
| Dell 16 Premium DA16250 | |
| HWBOT x265 Benchmark v2.2 / 4k Preset | |
| Asus ProArt P16 RTX 5090 | |
| Lenovo Yoga Pro 9i 16 RTX 5070 | |
| Lenovo ThinkPad T1g Gen 8 21TD003GE | |
| Samsung Galaxy Book6 Ultra | |
| Dell 16 Premium DA16250 | |
| Average Intel Core Ultra 7 356H (20 - 25.1, n=2) | |
| Average of class Multimedia (5.26 - 36.1, n=59, last 2 years) | |
| LibreOffice / 20 Documents To PDF | |
| Average Intel Core Ultra 7 356H (47.3 - 57.8, n=2) | |
| Average of class Multimedia (23.9 - 146.7, n=60, last 2 years) | |
| Asus ProArt P16 RTX 5090 | |
| Samsung Galaxy Book6 Ultra | |
| Lenovo Yoga Pro 9i 16 RTX 5070 | |
| Dell 16 Premium DA16250 | |
| Lenovo ThinkPad T1g Gen 8 21TD003GE | |
| R Benchmark 2.5 / Overall mean | |
| Average of class Multimedia (0.3604 - 0.947, n=59, last 2 years) | |
| Dell 16 Premium DA16250 | |
| Average Intel Core Ultra 7 356H (0.4268 - 0.459, n=2) | |
| Samsung Galaxy Book6 Ultra | |
| Lenovo ThinkPad T1g Gen 8 21TD003GE | |
| Asus ProArt P16 RTX 5090 | |
| Lenovo Yoga Pro 9i 16 RTX 5070 | |
* ... smaller is better
AIDA64: FP32 Ray-Trace | FPU Julia | CPU SHA3 | CPU Queen | FPU SinJulia | FPU Mandel | CPU AES | CPU ZLib | FP64 Ray-Trace | CPU PhotoWorxx | CPU CheckMate
| Performance rating | |
| Asus ProArt P16 RTX 5090 -1! | |
| Lenovo Yoga Pro 9i 16 RTX 5070 -1! | |
| Lenovo ThinkPad T1g Gen 8 21TD003GE -1! | |
| Samsung Galaxy Book6 Ultra -1! | |
| Average Intel Core Ultra 7 356H -1! | |
| Average of class Multimedia | |
| AIDA64 / FP32 Ray-Trace | |
| Asus ProArt P16 RTX 5090 (v6.92.6600) | |
| Lenovo Yoga Pro 9i 16 RTX 5070 (v6.92.6600) | |
| Lenovo ThinkPad T1g Gen 8 21TD003GE (v6.92.6600) | |
| Samsung Galaxy Book6 Ultra (v8.20.8100) | |
| Average Intel Core Ultra 7 356H (16303 - 20528, n=2) | |
| Average of class Multimedia (2214 - 50388, n=56, last 2 years) | |
| AIDA64 / FPU Julia | |
| Asus ProArt P16 RTX 5090 (v6.92.6600) | |
| Lenovo Yoga Pro 9i 16 RTX 5070 (v6.92.6600) | |
| Lenovo ThinkPad T1g Gen 8 21TD003GE (v6.92.6600) | |
| Samsung Galaxy Book6 Ultra (v8.20.8100) | |
| Average Intel Core Ultra 7 356H (81236 - 108092, n=2) | |
| Average of class Multimedia (12867 - 201874, n=57, last 2 years) | |
| AIDA64 / CPU SHA3 | |
| Lenovo Yoga Pro 9i 16 RTX 5070 (v6.92.6600) | |
| Lenovo ThinkPad T1g Gen 8 21TD003GE (v6.92.6600) | |
| Samsung Galaxy Book6 Ultra (v8.20.8100) | |
| Asus ProArt P16 RTX 5090 (v6.92.6600) | |
| Average Intel Core Ultra 7 356H (4141 - 5284, n=2) | |
| Average of class Multimedia (626 - 8623, n=57, last 2 years) | |
| AIDA64 / CPU Queen | |
| Asus ProArt P16 RTX 5090 (v6.92.6600) | |
| Average of class Multimedia (13483 - 181505, n=44, last 2 years) | |
| Lenovo ThinkPad T1g Gen 8 21TD003GE (v6.92.6600) | |
| Lenovo Yoga Pro 9i 16 RTX 5070 (v6.92.6600) | |
| AIDA64 / FPU SinJulia | |
| Asus ProArt P16 RTX 5090 (v6.92.6600) | |
| Lenovo Yoga Pro 9i 16 RTX 5070 (v6.92.6600) | |
| Lenovo ThinkPad T1g Gen 8 21TD003GE (v6.92.6600) | |
| Average of class Multimedia (886 - 28794, n=57, last 2 years) | |
| Average Intel Core Ultra 7 356H (6960 - 6965, n=2) | |
| Samsung Galaxy Book6 Ultra (v8.20.8100) | |
| AIDA64 / FPU Mandel | |
| Asus ProArt P16 RTX 5090 (v6.92.6600) | |
| Lenovo Yoga Pro 9i 16 RTX 5070 (v6.92.6600) | |
| Lenovo ThinkPad T1g Gen 8 21TD003GE (v6.92.6600) | |
| Samsung Galaxy Book6 Ultra (v8.20.8100) | |
| Average Intel Core Ultra 7 356H (44538 - 58505, n=2) | |
| Average of class Multimedia (6395 - 105740, n=56, last 2 years) | |
| AIDA64 / CPU AES | |
| Asus ProArt P16 RTX 5090 (v6.92.6600) | |
| Lenovo Yoga Pro 9i 16 RTX 5070 (v6.92.6600) | |
| Lenovo ThinkPad T1g Gen 8 21TD003GE (v6.92.6600) | |
| Samsung Galaxy Book6 Ultra (v8.20.8100) | |
| Average Intel Core Ultra 7 356H (64920 - 67037, n=2) | |
| Average of class Multimedia (8171 - 126790, n=57, last 2 years) | |
| AIDA64 / CPU ZLib | |
| Asus ProArt P16 RTX 5090 (v6.92.6600) | |
| Lenovo Yoga Pro 9i 16 RTX 5070 (v6.92.6600) | |
| Lenovo ThinkPad T1g Gen 8 21TD003GE (v6.92.6600) | |
| Samsung Galaxy Book6 Ultra (v8.20.8100) | |
| Average Intel Core Ultra 7 356H (1086 - 1199, n=2) | |
| Average of class Multimedia (143.8 - 2022, n=57, last 2 years) | |
| AIDA64 / FP64 Ray-Trace | |
| Asus ProArt P16 RTX 5090 (v6.92.6600) | |
| Lenovo Yoga Pro 9i 16 RTX 5070 (v6.92.6600) | |
| Lenovo ThinkPad T1g Gen 8 21TD003GE (v6.92.6600) | |
| Samsung Galaxy Book6 Ultra (v8.20.8100) | |
| Average Intel Core Ultra 7 356H (8201 - 11057, n=2) | |
| Average of class Multimedia (1014 - 26875, n=57, last 2 years) | |
| AIDA64 / CPU PhotoWorxx | |
| Average Intel Core Ultra 7 356H (83099 - 83163, n=2) | |
| Samsung Galaxy Book6 Ultra (v8.20.8100) | |
| Lenovo Yoga Pro 9i 16 RTX 5070 (v6.92.6600) | |
| Lenovo ThinkPad T1g Gen 8 21TD003GE (v6.92.6600) | |
| Average of class Multimedia (8187 - 88154, n=57, last 2 years) | |
| Asus ProArt P16 RTX 5090 (v6.92.6600) | |
| AIDA64 / CPU CheckMate | |
| Samsung Galaxy Book6 Ultra (v8.20.8100) | |
| Average Intel Core Ultra 7 356H (4196 - 4629, n=2) | |
| Average of class Multimedia (569 - 4742, n=16, last 2 years) | |
系统性能
主观性能印象极佳,基准测试分数也很高。在评测期间,我们没有遇到任何稳定性问题。
PCMark 10: Score | Essentials | Productivity | Digital Content Creation
CrossMark: Overall | Productivity | Creativity | Responsiveness
WebXPRT 3: Overall
WebXPRT 4: Overall
Mozilla Kraken 1.1: Total
| Performance rating | |
| Apple MacBook Pro 16 2024 M4 Pro -4! | |
| Lenovo ThinkPad T1g Gen 8 21TD003GE | |
| Lenovo Yoga Pro 9i 16 RTX 5070 | |
| Samsung Galaxy Book6 Ultra | |
| Average Intel Core Ultra 7 356H, NVIDIA GeForce RTX 5070 Laptop | |
| Dell 16 Premium DA16250 -4! | |
| Average of class Multimedia | |
| Asus ProArt P16 RTX 5090 -4! | |
| PCMark 10 / Score | |
| Lenovo ThinkPad T1g Gen 8 21TD003GE | |
| Samsung Galaxy Book6 Ultra | |
| Average Intel Core Ultra 7 356H, NVIDIA GeForce RTX 5070 Laptop (n=1) | |
| Lenovo Yoga Pro 9i 16 RTX 5070 | |
| Average of class Multimedia (4325 - 10386, n=55, last 2 years) | |
| PCMark 10 / Essentials | |
| Lenovo Yoga Pro 9i 16 RTX 5070 | |
| Average of class Multimedia (8025 - 11664, n=54, last 2 years) | |
| Lenovo ThinkPad T1g Gen 8 21TD003GE | |
| Samsung Galaxy Book6 Ultra | |
| Average Intel Core Ultra 7 356H, NVIDIA GeForce RTX 5070 Laptop (n=1) | |
| PCMark 10 / Productivity | |
| Lenovo ThinkPad T1g Gen 8 21TD003GE | |
| Samsung Galaxy Book6 Ultra | |
| Average Intel Core Ultra 7 356H, NVIDIA GeForce RTX 5070 Laptop (n=1) | |
| Average of class Multimedia (7323 - 18233, n=54, last 2 years) | |
| Lenovo Yoga Pro 9i 16 RTX 5070 | |
| PCMark 10 / Digital Content Creation | |
| Lenovo Yoga Pro 9i 16 RTX 5070 | |
| Lenovo ThinkPad T1g Gen 8 21TD003GE | |
| Samsung Galaxy Book6 Ultra | |
| Average Intel Core Ultra 7 356H, NVIDIA GeForce RTX 5070 Laptop (n=1) | |
| Average of class Multimedia (3651 - 16240, n=54, last 2 years) | |
| CrossMark / Overall | |
| Lenovo ThinkPad T1g Gen 8 21TD003GE | |
| Apple MacBook Pro 16 2024 M4 Pro | |
| Lenovo Yoga Pro 9i 16 RTX 5070 | |
| Dell 16 Premium DA16250 | |
| Asus ProArt P16 RTX 5090 | |
| Samsung Galaxy Book6 Ultra | |
| Average Intel Core Ultra 7 356H, NVIDIA GeForce RTX 5070 Laptop (n=1) | |
| Average of class Multimedia (866 - 2728, n=63, last 2 years) | |
| CrossMark / Productivity | |
| Lenovo ThinkPad T1g Gen 8 21TD003GE | |
| Apple MacBook Pro 16 2024 M4 Pro | |
| Lenovo Yoga Pro 9i 16 RTX 5070 | |
| Dell 16 Premium DA16250 | |
| Asus ProArt P16 RTX 5090 | |
| Average of class Multimedia (931 - 2489, n=63, last 2 years) | |
| Samsung Galaxy Book6 Ultra | |
| Average Intel Core Ultra 7 356H, NVIDIA GeForce RTX 5070 Laptop (n=1) | |
| CrossMark / Creativity | |
| Apple MacBook Pro 16 2024 M4 Pro | |
| Lenovo ThinkPad T1g Gen 8 21TD003GE | |
| Lenovo Yoga Pro 9i 16 RTX 5070 | |
| Asus ProArt P16 RTX 5090 | |
| Samsung Galaxy Book6 Ultra | |
| Average Intel Core Ultra 7 356H, NVIDIA GeForce RTX 5070 Laptop (n=1) | |
| Dell 16 Premium DA16250 | |
| Average of class Multimedia (907 - 3465, n=63, last 2 years) | |
| CrossMark / Responsiveness | |
| Lenovo ThinkPad T1g Gen 8 21TD003GE | |
| Dell 16 Premium DA16250 | |
| Lenovo Yoga Pro 9i 16 RTX 5070 | |
| Apple MacBook Pro 16 2024 M4 Pro | |
| Samsung Galaxy Book6 Ultra | |
| Average Intel Core Ultra 7 356H, NVIDIA GeForce RTX 5070 Laptop (n=1) | |
| Average of class Multimedia (605 - 2024, n=63, last 2 years) | |
| Asus ProArt P16 RTX 5090 | |
| WebXPRT 3 / Overall | |
| Apple MacBook Pro 16 2024 M4 Pro | |
| Lenovo Yoga Pro 9i 16 RTX 5070 | |
| Average of class Multimedia (136.4 - 596, n=66, last 2 years) | |
| Dell 16 Premium DA16250 | |
| Lenovo ThinkPad T1g Gen 8 21TD003GE | |
| Samsung Galaxy Book6 Ultra | |
| Average Intel Core Ultra 7 356H, NVIDIA GeForce RTX 5070 Laptop (n=1) | |
| Asus ProArt P16 RTX 5090 | |
| WebXPRT 4 / Overall | |
| Apple MacBook Pro 16 2024 M4 Pro | |
| Lenovo Yoga Pro 9i 16 RTX 5070 | |
| Lenovo ThinkPad T1g Gen 8 21TD003GE | |
| Dell 16 Premium DA16250 | |
| Samsung Galaxy Book6 Ultra | |
| Average Intel Core Ultra 7 356H, NVIDIA GeForce RTX 5070 Laptop (n=1) | |
| Average of class Multimedia (167.3 - 402, n=68, last 2 years) | |
| Asus ProArt P16 RTX 5090 | |
| Mozilla Kraken 1.1 / Total | |
| Dell 16 Premium DA16250 | |
| Samsung Galaxy Book6 Ultra | |
| Average Intel Core Ultra 7 356H, NVIDIA GeForce RTX 5070 Laptop (n=1) | |
| Average of class Multimedia (228 - 835, n=69, last 2 years) | |
| Lenovo ThinkPad T1g Gen 8 21TD003GE | |
| Lenovo Yoga Pro 9i 16 RTX 5070 | |
| Asus ProArt P16 RTX 5090 | |
| Apple MacBook Pro 16 2024 M4 Pro | |
* ... smaller is better
| PCMark 10 Score | 9383 points | |
Help | ||
| AIDA64 / Memory Copy | |
| Average Intel Core Ultra 7 356H (116043 - 121055, n=2) | |
| Samsung Galaxy Book6 Ultra | |
| Lenovo Yoga Pro 9i 16 RTX 5070 | |
| Lenovo ThinkPad T1g Gen 8 21TD003GE | |
| Asus ProArt P16 RTX 5090 | |
| Average of class Multimedia (11299 - 132135, n=57, last 2 years) | |
| AIDA64 / Memory Read | |
| Average Intel Core Ultra 7 356H (107881 - 112376, n=2) | |
| Samsung Galaxy Book6 Ultra | |
| Asus ProArt P16 RTX 5090 | |
| Lenovo Yoga Pro 9i 16 RTX 5070 | |
| Average of class Multimedia (11624 - 174586, n=57, last 2 years) | |
| Lenovo ThinkPad T1g Gen 8 21TD003GE | |
| AIDA64 / Memory Write | |
| Average Intel Core Ultra 7 356H (120431 - 120449, n=2) | |
| Samsung Galaxy Book6 Ultra | |
| Asus ProArt P16 RTX 5090 | |
| Average of class Multimedia (11755 - 134998, n=57, last 2 years) | |
| Lenovo ThinkPad T1g Gen 8 21TD003GE | |
| Lenovo Yoga Pro 9i 16 RTX 5070 | |
| AIDA64 / Memory Latency | |
| Lenovo ThinkPad T1g Gen 8 21TD003GE | |
| Average of class Multimedia (7 - 535, n=56, last 2 years) | |
| Lenovo Yoga Pro 9i 16 RTX 5070 | |
| Asus ProArt P16 RTX 5090 | |
| Samsung Galaxy Book6 Ultra | |
| Average Intel Core Ultra 7 356H (88.6 - 90, n=2) | |
* ... smaller is better
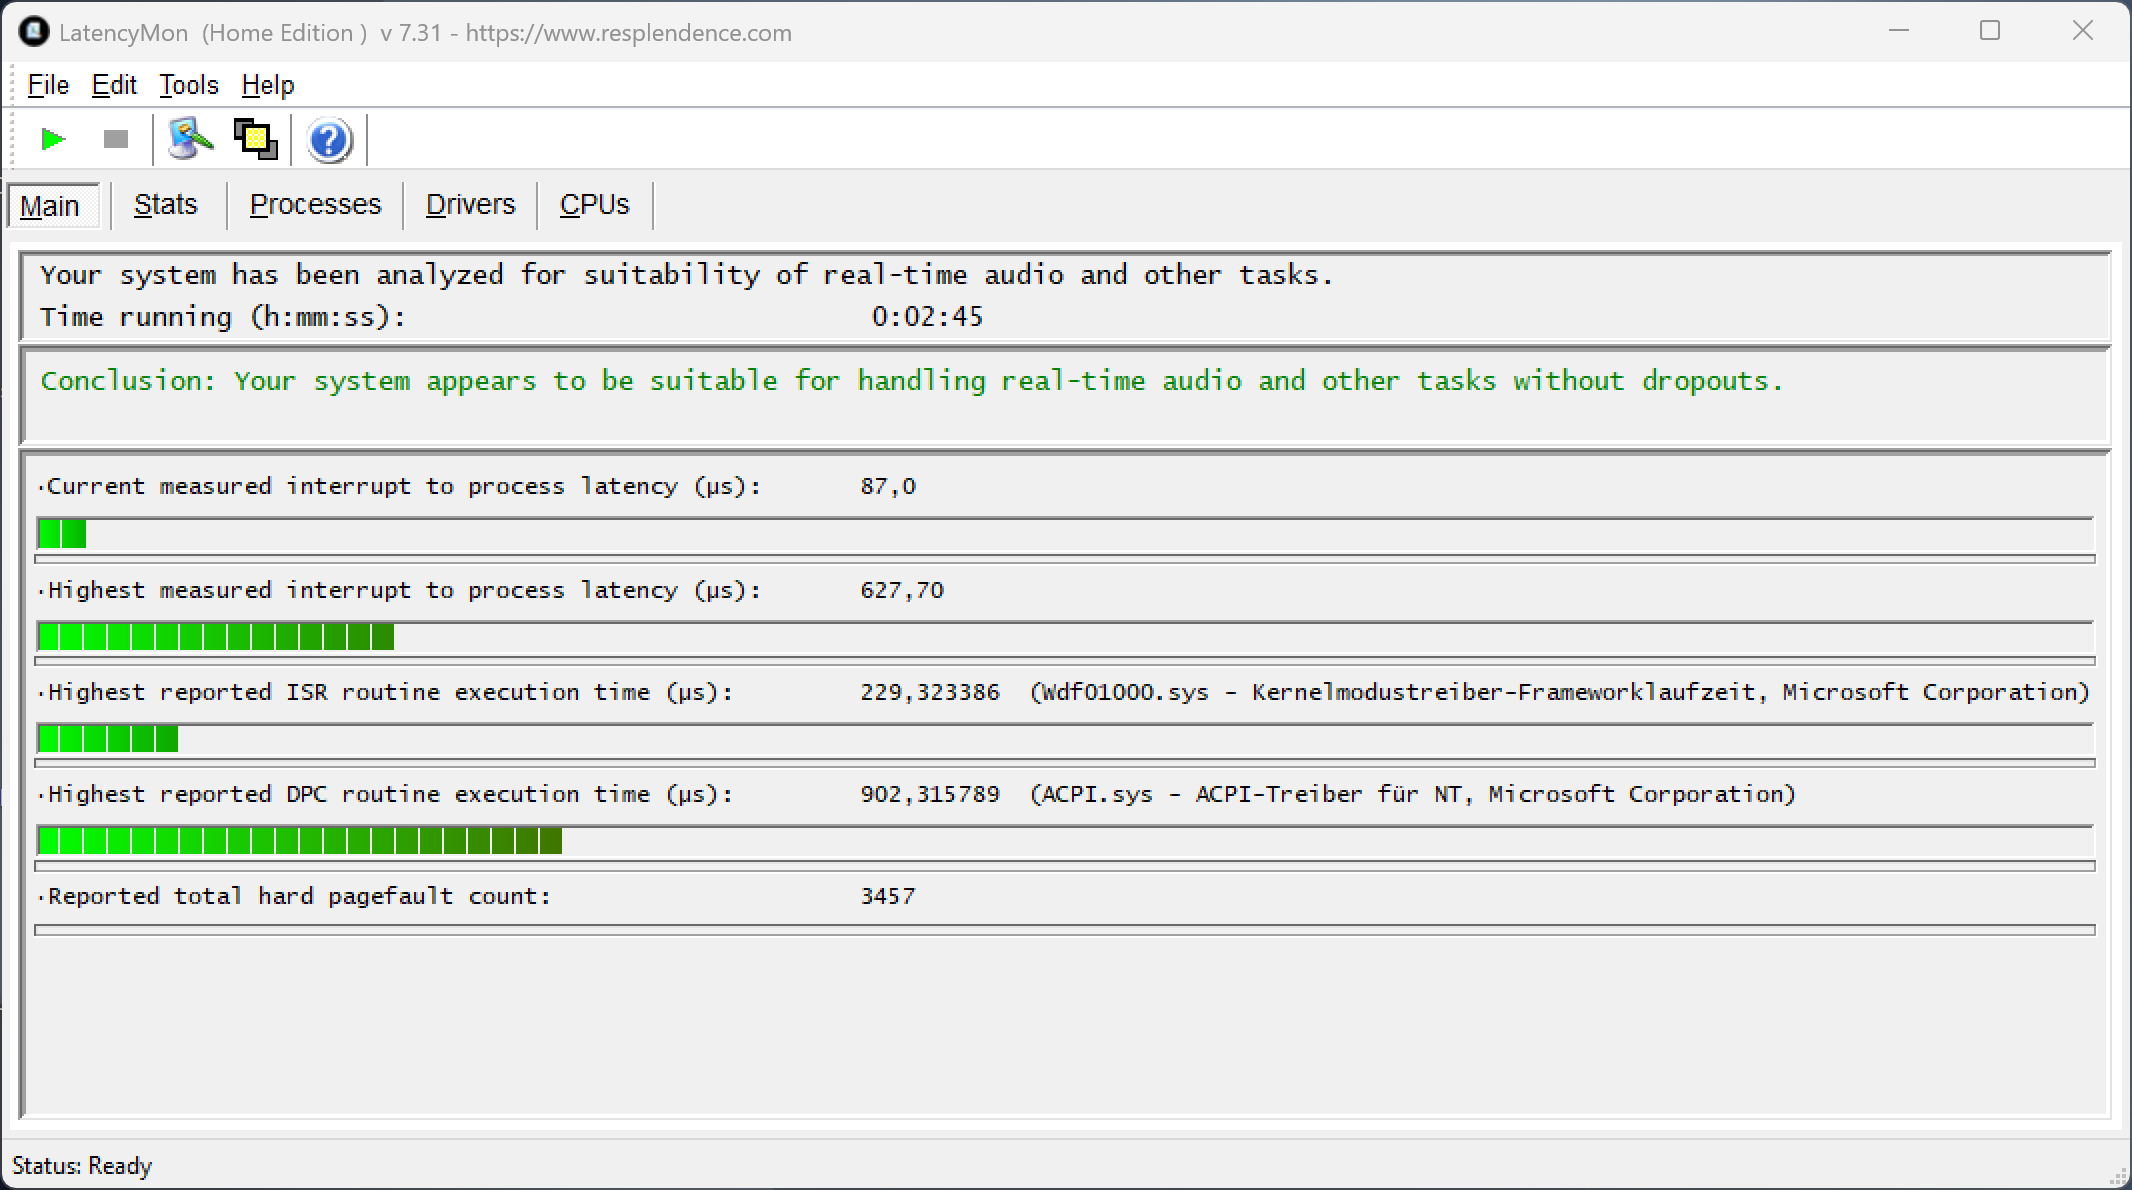
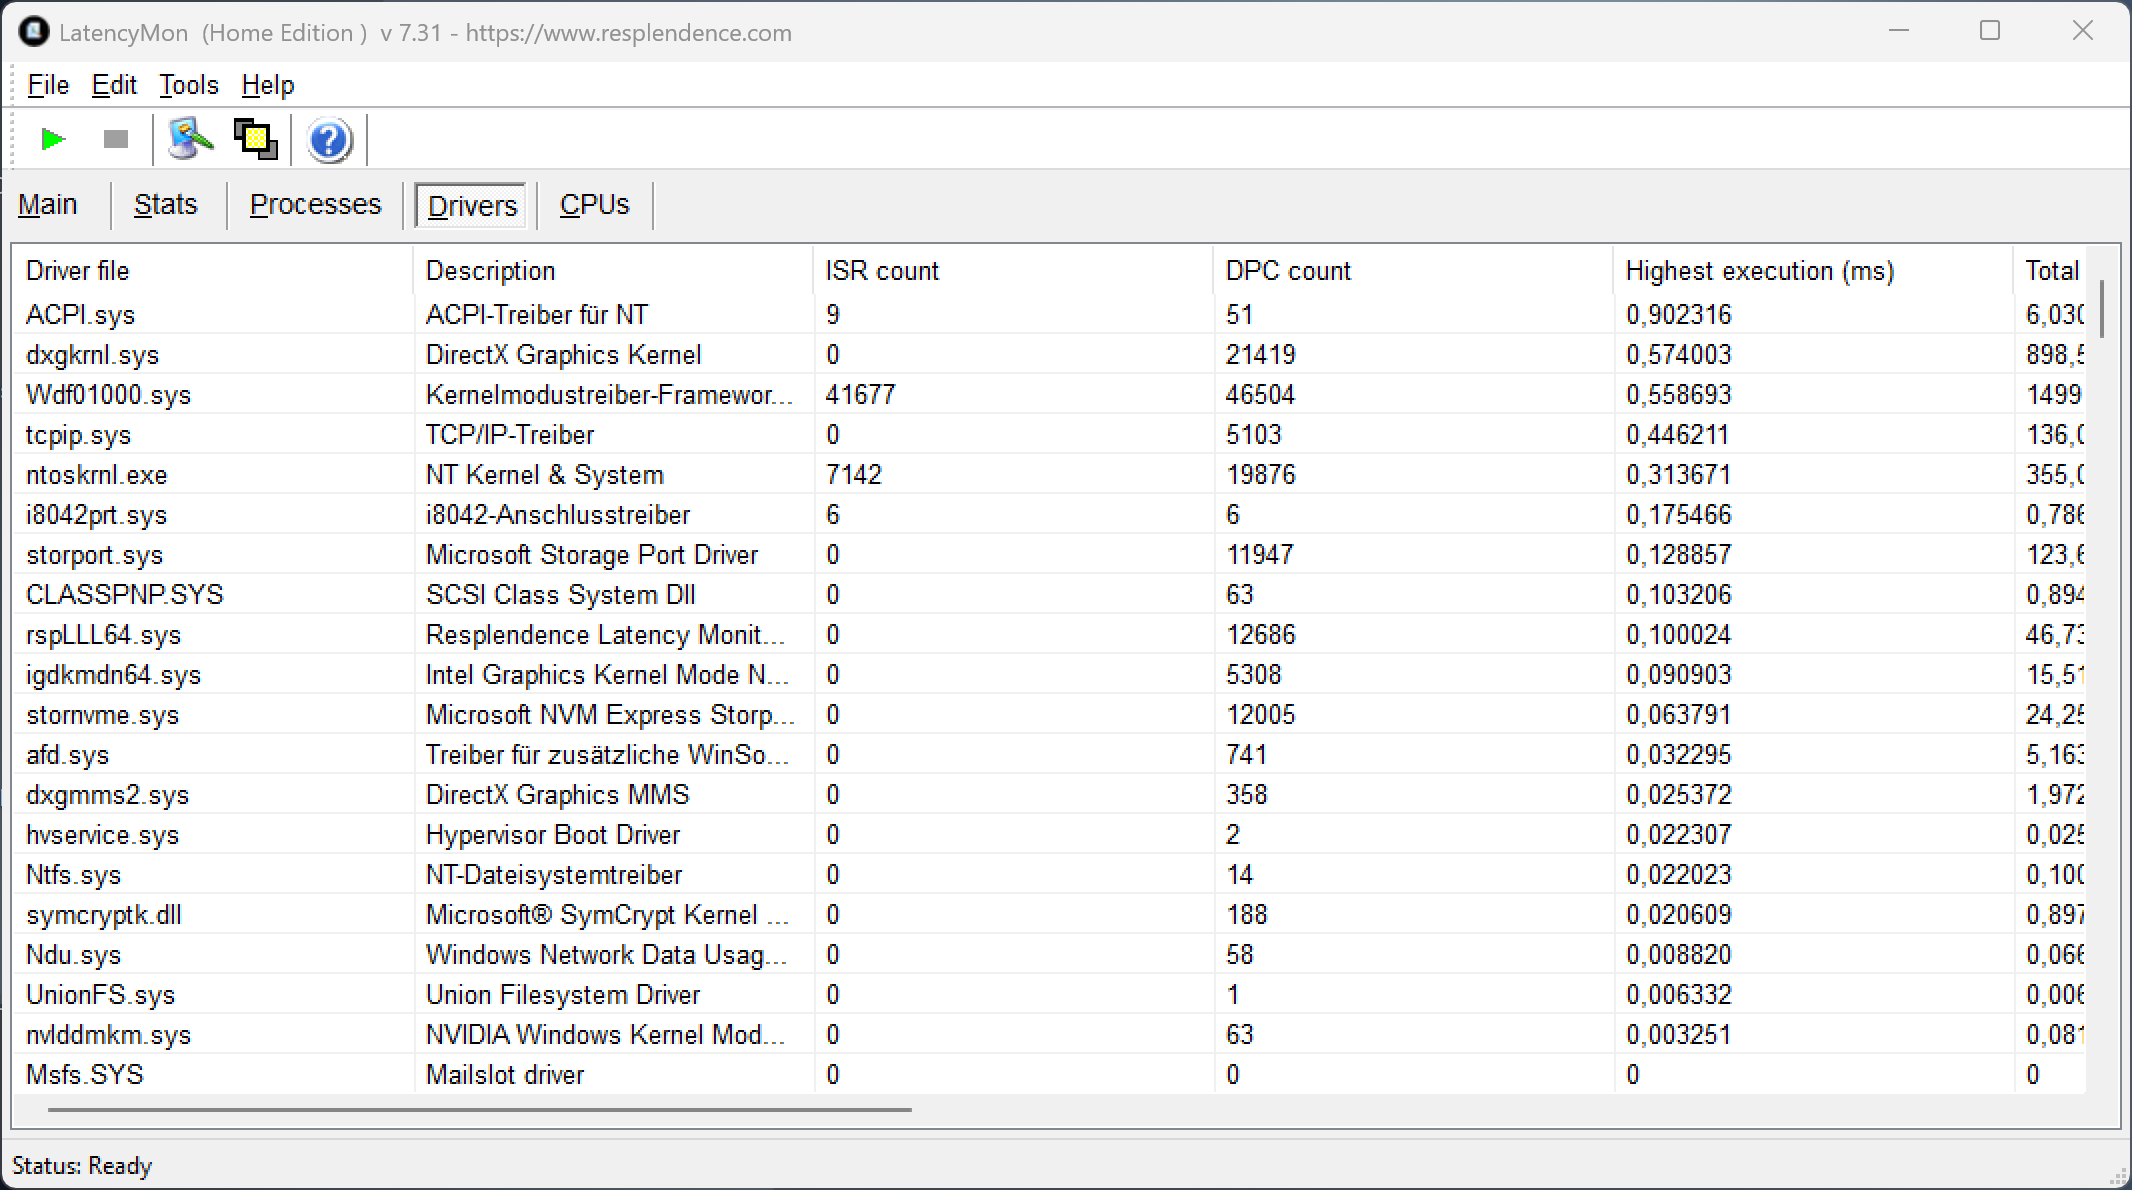
DPC 延迟
在我们的标准延迟测试(网页浏览、4K YouTube 播放、CPU 负载)中,评测机在实时音频应用方面没有出现任何问题。
| DPC Latencies / LatencyMon - interrupt to process latency (max), Web, Youtube, Prime95 | |
| Asus ProArt P16 RTX 5090 | |
| Lenovo ThinkPad T1g Gen 8 21TD003GE | |
| Lenovo Yoga Pro 9i 16 RTX 5070 | |
| Samsung Galaxy Book6 Ultra | |
| Dell 16 Premium DA16250 | |
* ... smaller is better
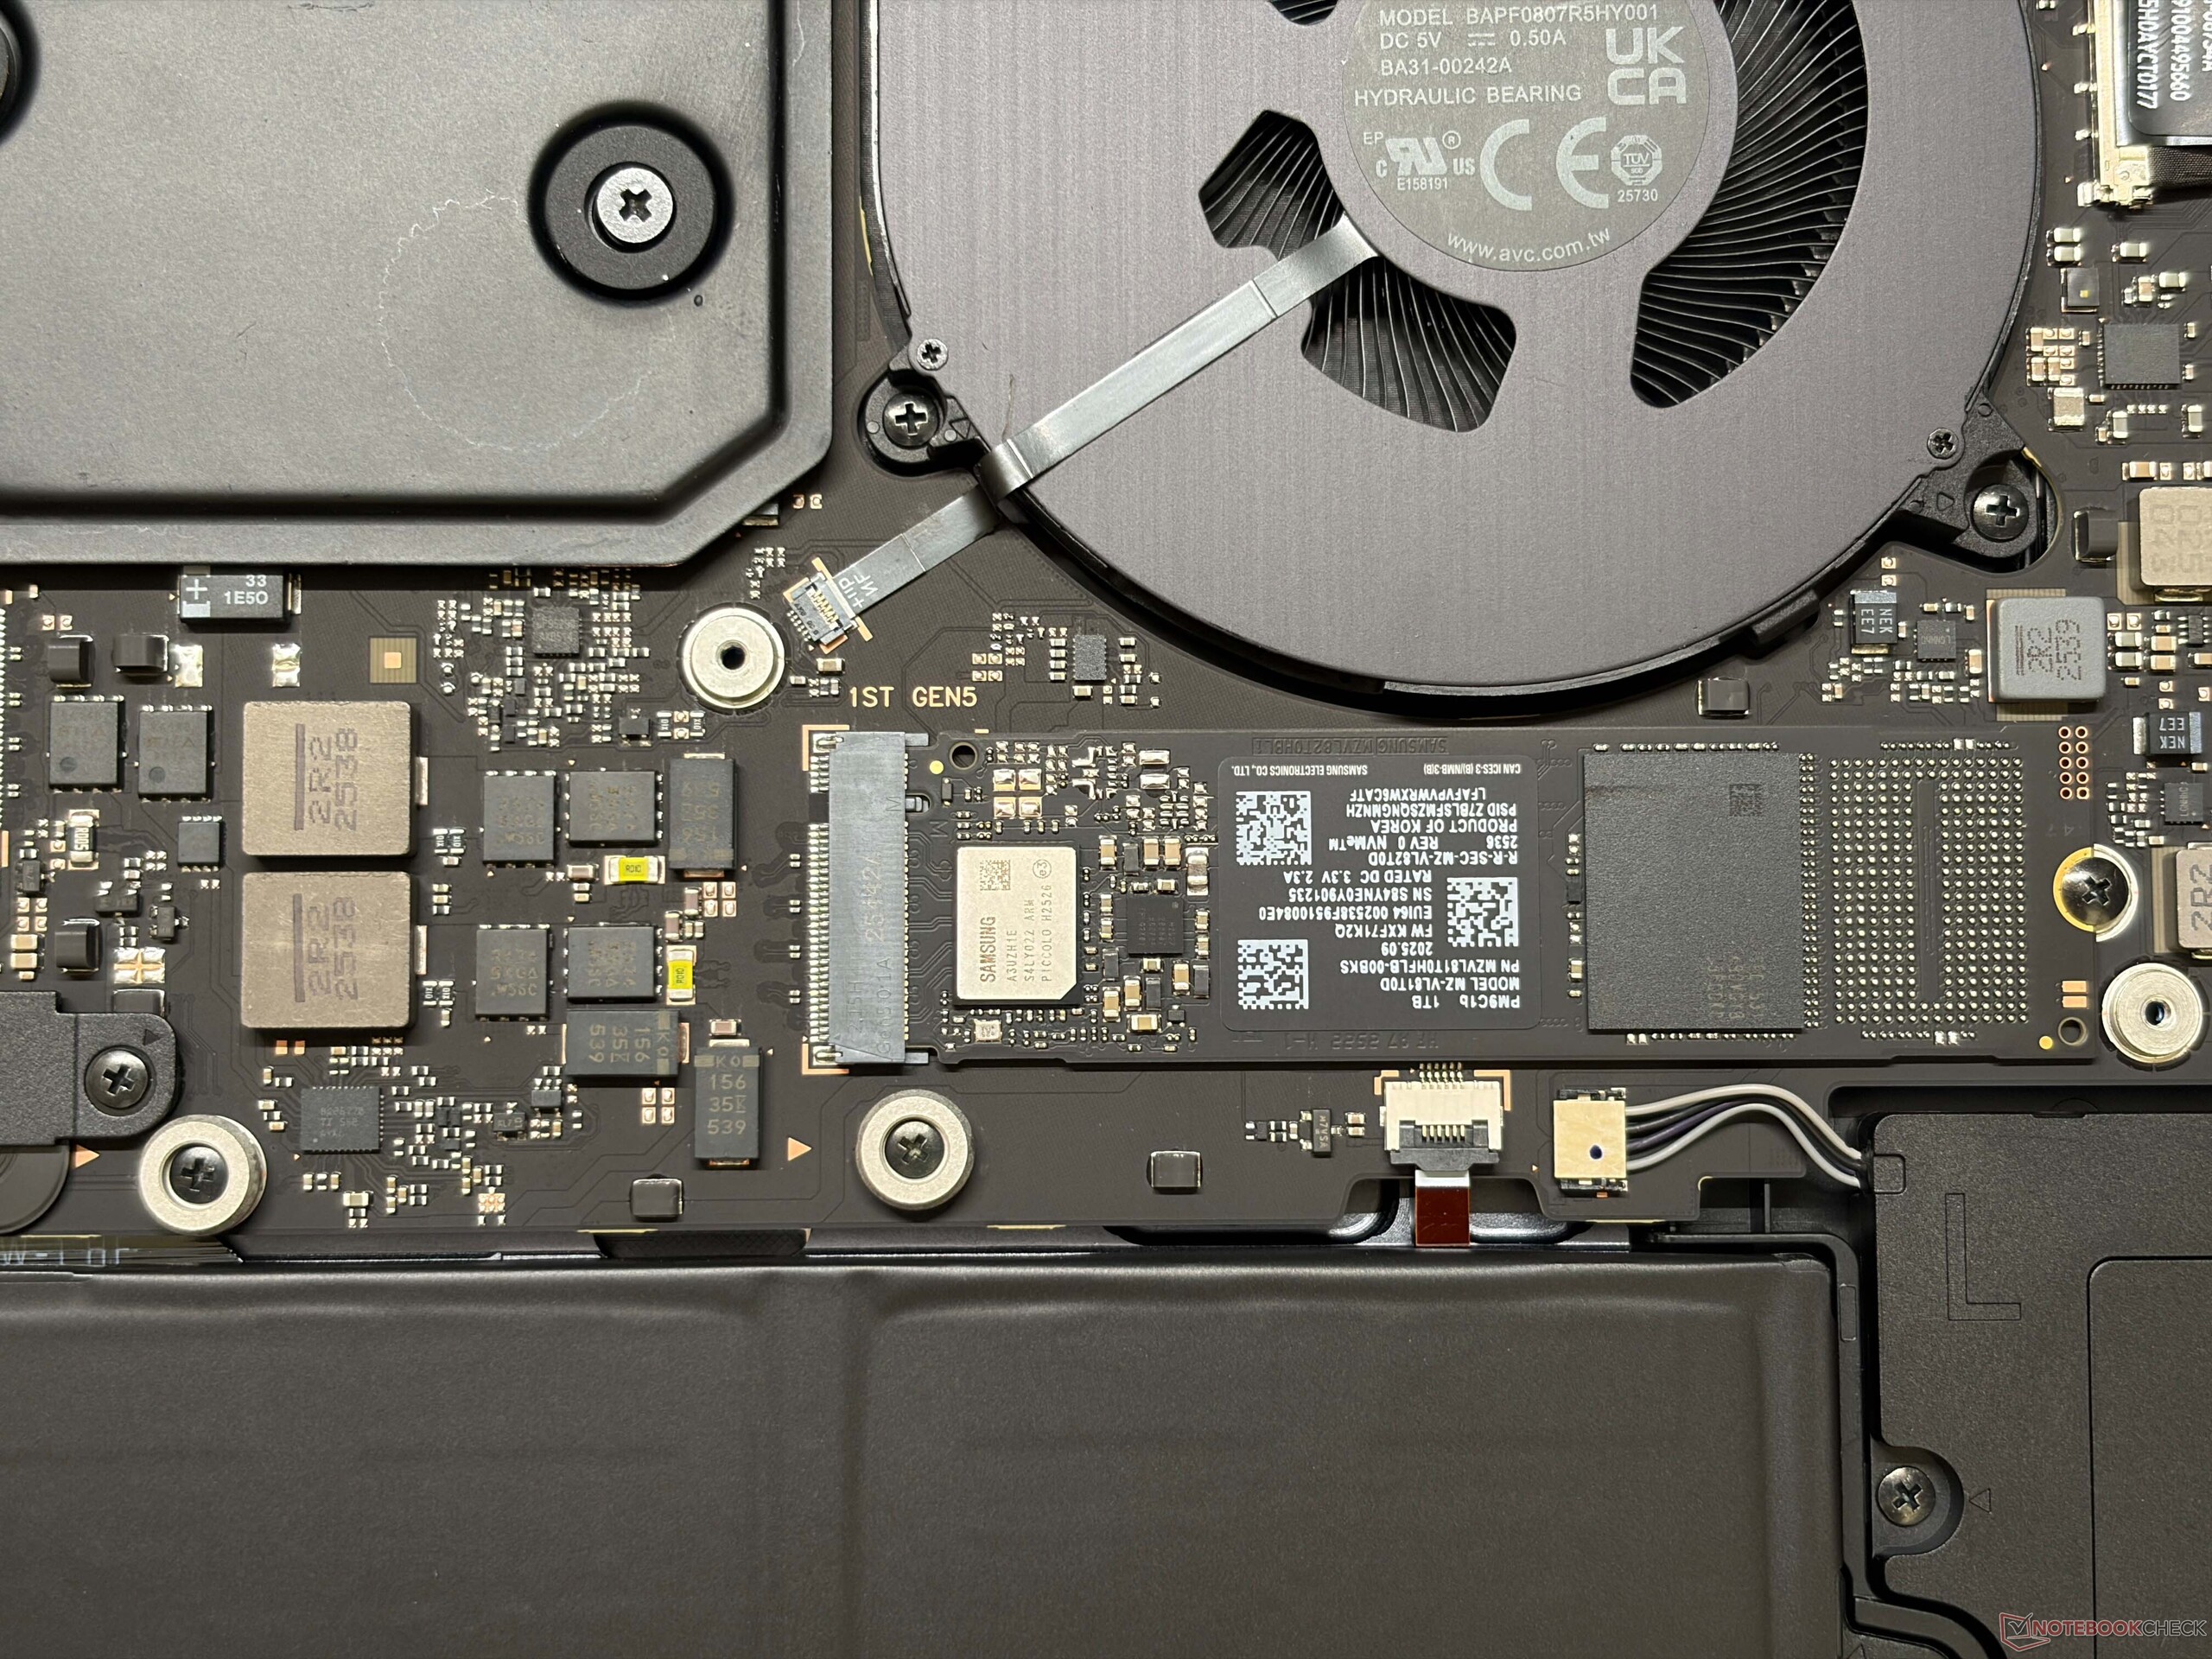
存储设备
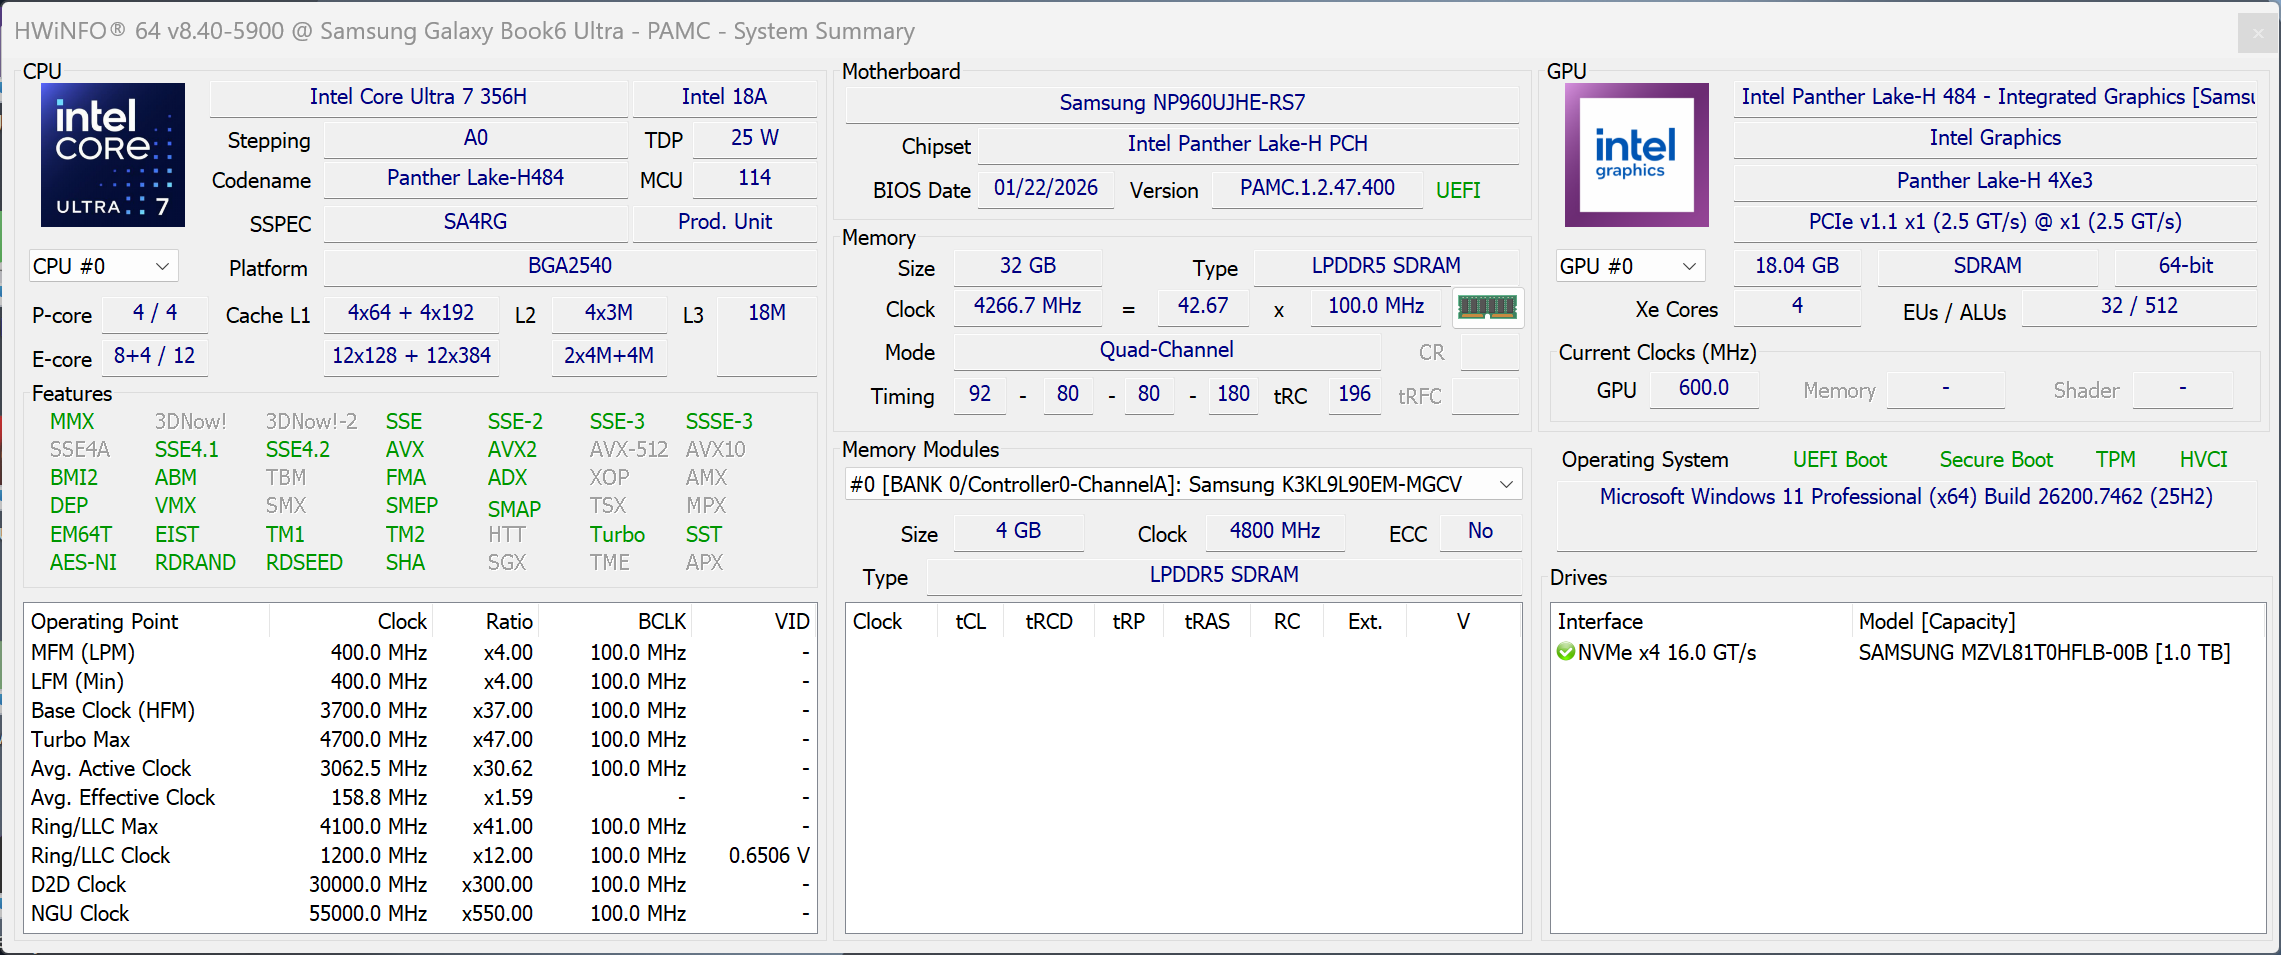
我们的评测机配备了三星的 1 TB 硬盘(PM9C1b,可用容量为 846 GB),传输速率相当稳定。如果你想添加更多存储空间,还有一个辅助 M.2-2280 插槽,但这两个插槽都仅限于 PCIe 4.0。

* ... smaller is better
磁盘节流DiskSpd 读取循环,队列深度 8
图形处理器性能
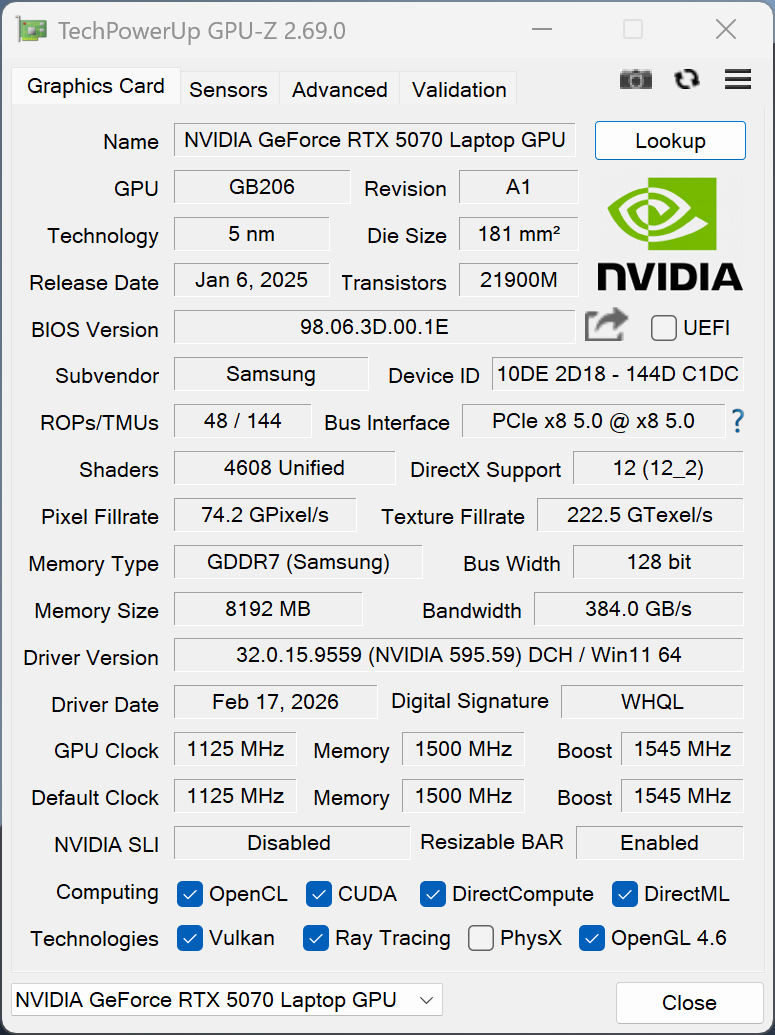
GeForce RTX 5070 的功耗最高可达 90 瓦,对于一款多媒体笔记本电脑来说,性能数据不错。游戏性能也不错且稳定,但有限的 VRAM(8 GB)可能会在要求较高的游戏中造成限制。请参阅我们的 专门文章了解更多信息。
| 3DMark 11 Performance | 33399 points | |
| 3DMark Fire Strike Score | 27336 points | |
| 3DMark Time Spy Score | 11467 points | |
| 3DMark Steel Nomad Score | 2784 points | |
| 3DMark Steel Nomad Light Score | 12271 points | |
Help | ||
| Blender / v3.3 Classroom OPTIX/RTX | |
| Average of class Multimedia (12 - 105, n=23, last 2 years) | |
| Lenovo Yoga Pro 9i 16 RTX 5070 | |
| Lenovo ThinkPad T1g Gen 8 21TD003GE | |
| Dell 16 Premium DA16250 | |
| Samsung Galaxy Book6 Ultra | |
| Average NVIDIA GeForce RTX 5070 Laptop (17 - 24, n=28) | |
| Asus ProArt P16 RTX 5090 | |
| Blender / v3.3 Classroom CUDA | |
| Average of class Multimedia (20 - 186, n=23, last 2 years) | |
| Average NVIDIA GeForce RTX 5070 Laptop (29 - 228, n=29) | |
| Lenovo ThinkPad T1g Gen 8 21TD003GE | |
| Dell 16 Premium DA16250 | |
| Lenovo Yoga Pro 9i 16 RTX 5070 | |
| Samsung Galaxy Book6 Ultra | |
| Asus ProArt P16 RTX 5090 | |
| Blender / v3.3 Classroom CPU | |
| Average of class Multimedia (134.5 - 1042, n=64, last 2 years) | |
| Dell 16 Premium DA16250 | |
| Samsung Galaxy Book6 Ultra | |
| Lenovo ThinkPad T1g Gen 8 21TD003GE | |
| Average NVIDIA GeForce RTX 5070 Laptop (137 - 507, n=26) | |
| Lenovo Yoga Pro 9i 16 RTX 5070 | |
| Asus ProArt P16 RTX 5090 | |
* ... smaller is better
| GTA V - 1920x1080 Highest AA:4xMSAA + FX AF:16x | |
| Lenovo Yoga Pro 9i 16 RTX 5070 | |
| Samsung Galaxy Book6 Ultra | |
| Lenovo ThinkPad T1g Gen 8 21TD003GE | |
| Dell 16 Premium DA16250 | |
| Asus ProArt P16 RTX 5090 | |
| Average of class Multimedia (7.92 - 141.6, n=59, last 2 years) | |
| Final Fantasy XV Benchmark - 1920x1080 High Quality | |
| Asus ProArt P16 RTX 5090 | |
| Lenovo Yoga Pro 9i 16 RTX 5070 | |
| Lenovo ThinkPad T1g Gen 8 21TD003GE | |
| Samsung Galaxy Book6 Ultra | |
| Dell 16 Premium DA16250 | |
| Average of class Multimedia (7.61 - 144.4, n=61, last 2 years) | |
| Strange Brigade - 1920x1080 ultra AA:ultra AF:16 | |
| Asus ProArt P16 RTX 5090 | |
| Lenovo Yoga Pro 9i 16 RTX 5070 | |
| Samsung Galaxy Book6 Ultra | |
| Lenovo ThinkPad T1g Gen 8 21TD003GE | |
| Dell 16 Premium DA16250 | |
| Average of class Multimedia (13.3 - 303, n=61, last 2 years) | |
| Dota 2 Reborn - 1920x1080 ultra (3/3) best looking | |
| Lenovo Yoga Pro 9i 16 RTX 5070 | |
| Dell 16 Premium DA16250 | |
| Samsung Galaxy Book6 Ultra | |
| Lenovo ThinkPad T1g Gen 8 21TD003GE | |
| Asus ProArt P16 RTX 5090 | |
| Average of class Multimedia (29 - 179.9, n=63, last 2 years) | |
赛博朋克 2077》超 FPS 图表
| low | med. | high | ultra | QHD DLSS | QHD | 4K | |
|---|---|---|---|---|---|---|---|
| GTA V (2015) | 137.1 | 111.9 | |||||
| Dota 2 Reborn (2015) | 173.3 | 155.4 | 149.3 | 139.7 | |||
| Final Fantasy XV Benchmark (2018) | 178.8 | 137.3 | 116.6 | 88.8 | 48.7 | ||
| X-Plane 11.11 (2018) | 109.6 | 102.4 | 76 | ||||
| Strange Brigade (2018) | 479 | 315 | 257 | 220 | 151.8 | ||
| Baldur's Gate 3 (2023) | 149.1 | 129.7 | 111.1 | 109.2 | 76.2 | ||
| Cyberpunk 2077 (2023) | 114.1 | 104 | 92.5 | 84.6 | 67.5 | 57.4 | |
| F1 24 (2024) | 257 | 217 | 77.5 | 77.2 | 49.5 |
排放与功耗
系统噪音

Galaxy Book6 Ultra 采用了带两个风扇的蒸气室冷却装置,即使在高性能功率模式下,日常使用时也非常安静。当你开始对组件施加压力时,风扇的声音会变得清晰可闻,我们测得的最大风扇噪音为 48.5 dB(A)。其他电源配置文件则更安静(33-40 dB(A)),但也会牺牲一些性能。我们的测试设备在其他电子噪音方面没有问题。
Noise level
| Idle |
| 25.1 / 25.1 / 25.1 dB(A) |
| Load |
| 36.9 / 48.5 dB(A) |
 | ||
30 dB silent 40 dB(A) audible 50 dB(A) loud |
||
min: | ||
| Samsung Galaxy Book6 Ultra Ultra 7 356H, GeForce RTX 5070 Laptop | Apple MacBook Pro 16 2024 M4 Pro M4 Pro 14-Core, M4 Pro 20-Core GPU | Lenovo Yoga Pro 9i 16 RTX 5070 Ultra 9 285H, GeForce RTX 5070 Laptop | Asus ProArt P16 RTX 5090 Ryzen AI 9 HX 370, GeForce RTX 5090 Laptop | Dell 16 Premium DA16250 Ultra 7 255H, GeForce RTX 5070 Laptop | Lenovo ThinkPad T1g Gen 8 21TD003GE Ultra 9 285H, GeForce RTX 5070 Laptop | |
|---|---|---|---|---|---|---|
| Noise | 13% | -4% | -9% | 2% | -1% | |
| off / environment * (dB) | 25.1 | 24 4% | 24.1 4% | 24.2 4% | 23.2 8% | 25 -0% |
| Idle Minimum * (dB) | 25.1 | 24 4% | 24.1 4% | 24.2 4% | 23.2 8% | 25 -0% |
| Idle Average * (dB) | 25.1 | 24 4% | 24.1 4% | 27.6 -10% | 23.2 8% | 25 -0% |
| Idle Maximum * (dB) | 25.1 | 24 4% | 25.1 -0% | 32.6 -30% | 26.6 -6% | 27.3 -9% |
| Load Average * (dB) | 36.9 | 25.3 31% | 44.2 -20% | 42.6 -15% | 39.4 -7% | 37.3 -1% |
| Cyberpunk 2077 ultra * (dB) | 48.5 | 33.9 30% | 52.7 -9% | 51.2 -6% | 47.3 2% | 47.8 1% |
| Load Maximum * (dB) | 48.5 | 42.3 13% | 52.7 -9% | 53.2 -10% | 48.9 -1% | 47.8 1% |
* ... smaller is better
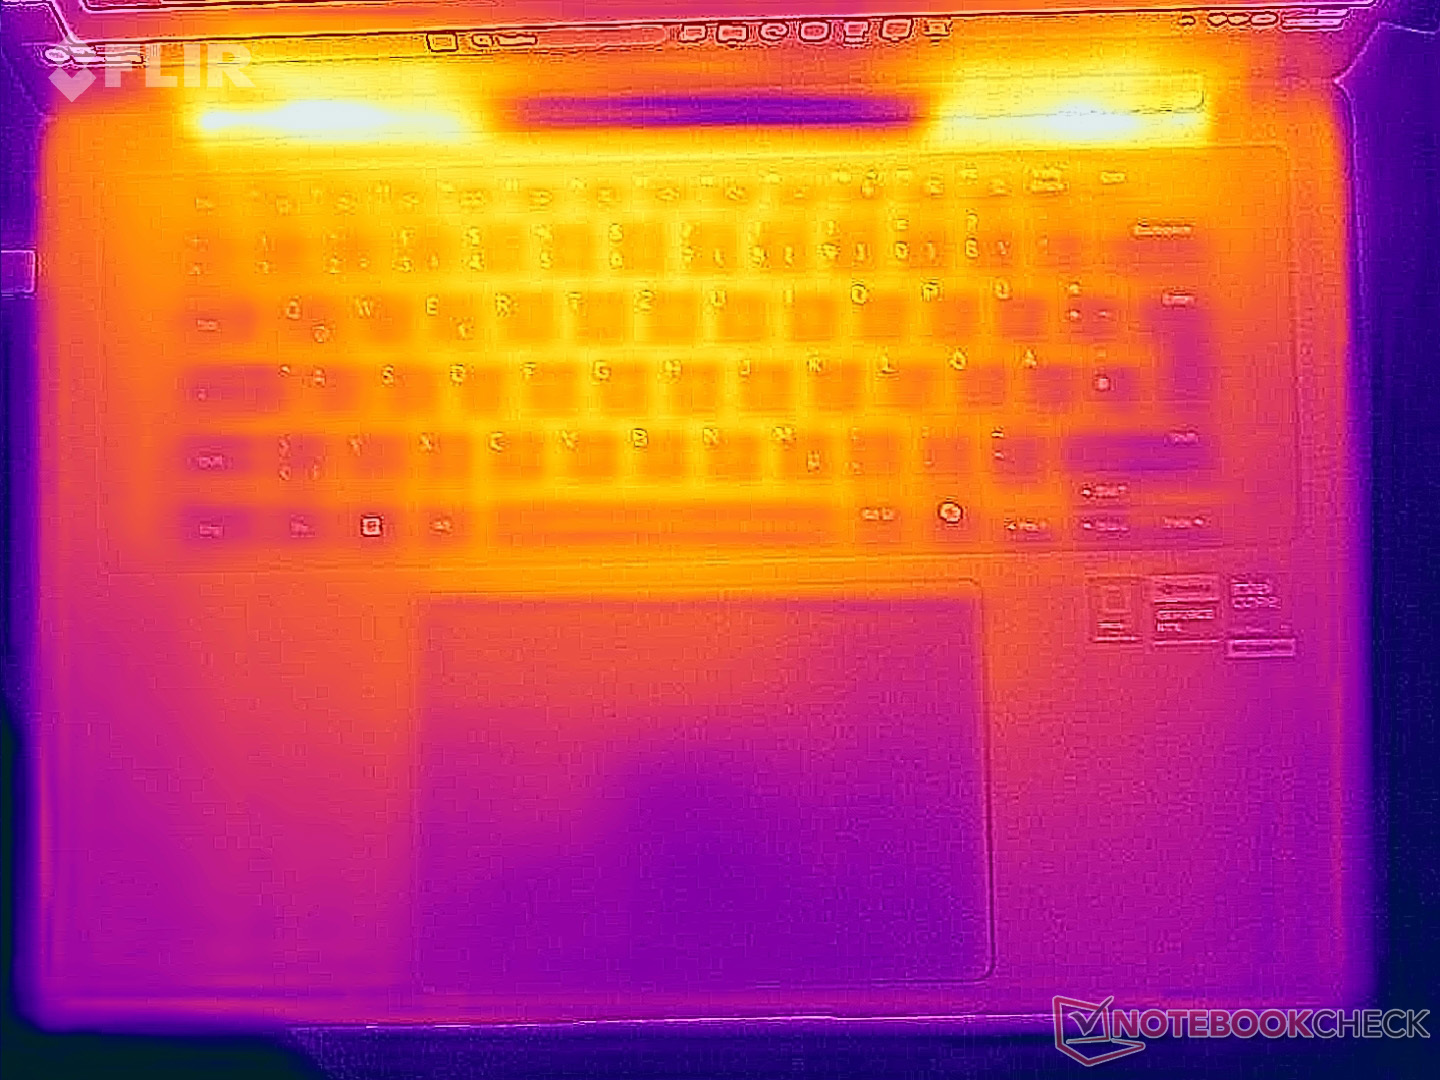
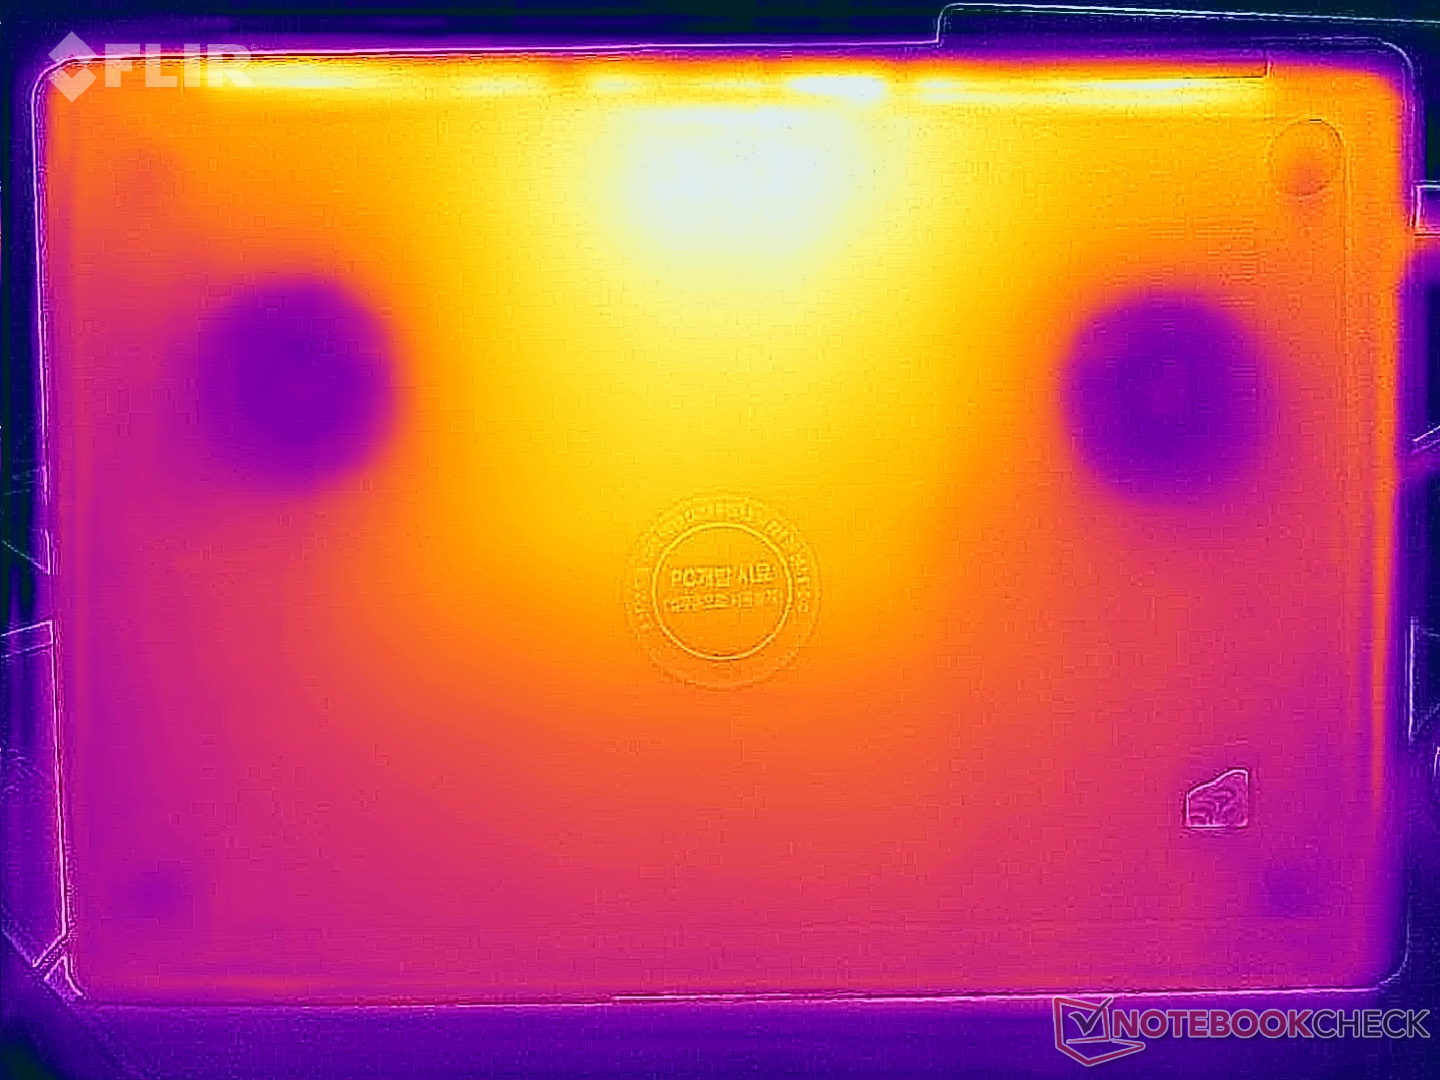
温度
铝制表面在日常情况下非常凉爽,但在负载情况下,某些地方会变得非常热。我们在底板中上部测得的温度接近 50 °C,因此应避免皮肤接触。除此之外,没有其他限制,键盘的温度仅为 40 °C,因此打字不会受到影响。在压力测试中,CPU 的功耗仅为 20 瓦,而 GPU 则保持在 80 瓦。

(±) The maximum temperature on the upper side is 42.7 °C / 109 F, compared to the average of 36.8 °C / 98 F, ranging from 21 to 71 °C for the class Multimedia.
(-) The bottom heats up to a maximum of 49.1 °C / 120 F, compared to the average of 39.1 °C / 102 F
(+) In idle usage, the average temperature for the upper side is 24.9 °C / 77 F, compared to the device average of 31.3 °C / 88 F.
(-) 3: The average temperature for the upper side is 38.5 °C / 101 F, compared to the average of 31.3 °C / 88 F for the class Multimedia.
(+) The palmrests and touchpad are reaching skin temperature as a maximum (34.7 °C / 94.5 F) and are therefore not hot.
(-) The average temperature of the palmrest area of similar devices was 28.7 °C / 83.7 F (-6 °C / -10.8 F).
| Samsung Galaxy Book6 Ultra Ultra 7 356H, GeForce RTX 5070 Laptop | Apple MacBook Pro 16 2024 M4 Pro M4 Pro 14-Core, M4 Pro 20-Core GPU | Lenovo Yoga Pro 9i 16 RTX 5070 Ultra 9 285H, GeForce RTX 5070 Laptop | Asus ProArt P16 RTX 5090 Ryzen AI 9 HX 370, GeForce RTX 5090 Laptop | Dell 16 Premium DA16250 Ultra 7 255H, GeForce RTX 5070 Laptop | Lenovo ThinkPad T1g Gen 8 21TD003GE Ultra 9 285H, GeForce RTX 5070 Laptop | |
|---|---|---|---|---|---|---|
| Heat | 11% | -2% | -3% | -0% | -1% | |
| Maximum Upper Side * (°C) | 42.7 | 42.7 -0% | 41.8 2% | 47 -10% | 36.8 14% | 44.7 -5% |
| Maximum Bottom * (°C) | 49.1 | 43.1 12% | 47.9 2% | 51.6 -5% | 34.8 29% | 42.8 13% |
| Idle Upper Side * (°C) | 25.4 | 21.5 15% | 26.3 -4% | 24.9 2% | 31.2 -23% | 26.9 -6% |
| Idle Bottom * (°C) | 25.5 | 21.5 16% | 27.6 -8% | 25.5 -0% | 30.8 -21% | 27.3 -7% |
* ... smaller is better
发言人
六扬声器音响系统的音质表现令人印象深刻,无需躲在竞争对手后面。不过,公平地说,所有对比设备的音质都非常出色,很难听得出区别。
Samsung Galaxy Book6 Ultra audio analysis
(+) | speakers can play relatively loud (85.6 dB)
Bass 100 - 315 Hz
(±) | reduced bass - on average 5.9% lower than median
(±) | linearity of bass is average (7.9% delta to prev. frequency)
Mids 400 - 2000 Hz
(+) | balanced mids - only 3.7% away from median
(+) | mids are linear (4.3% delta to prev. frequency)
Highs 2 - 16 kHz
(+) | balanced highs - only 2.2% away from median
(+) | highs are linear (3.4% delta to prev. frequency)
Overall 100 - 16.000 Hz
(+) | overall sound is linear (7.3% difference to median)
Compared to same class
» 6% of all tested devices in this class were better, 1% similar, 94% worse
» The best had a delta of 5%, average was 17%, worst was 45%
Compared to all devices tested
» 1% of all tested devices were better, 0% similar, 99% worse
» The best had a delta of 4%, average was 23%, worst was 134%
Apple MacBook Pro 16 2024 M4 Pro audio analysis
(+) | speakers can play relatively loud (84.6 dB)
Bass 100 - 315 Hz
(±) | reduced bass - on average 5.1% lower than median
(+) | bass is linear (5.6% delta to prev. frequency)
Mids 400 - 2000 Hz
(+) | balanced mids - only 1.4% away from median
(+) | mids are linear (2.4% delta to prev. frequency)
Highs 2 - 16 kHz
(+) | balanced highs - only 1.6% away from median
(+) | highs are linear (3% delta to prev. frequency)
Overall 100 - 16.000 Hz
(+) | overall sound is linear (4.8% difference to median)
Compared to same class
» 0% of all tested devices in this class were better, 0% similar, 99% worse
» The best had a delta of 5%, average was 17%, worst was 45%
Compared to all devices tested
» 0% of all tested devices were better, 0% similar, 100% worse
» The best had a delta of 4%, average was 23%, worst was 134%
Lenovo Yoga Pro 9i 16 RTX 5070 audio analysis
(±) | speaker loudness is average but good (81.4 dB)
Bass 100 - 315 Hz
(±) | reduced bass - on average 5.5% lower than median
(±) | linearity of bass is average (7.5% delta to prev. frequency)
Mids 400 - 2000 Hz
(+) | balanced mids - only 1.7% away from median
(+) | mids are linear (3.1% delta to prev. frequency)
Highs 2 - 16 kHz
(±) | reduced highs - on average 6.2% lower than median
(+) | highs are linear (3.9% delta to prev. frequency)
Overall 100 - 16.000 Hz
(+) | overall sound is linear (9.7% difference to median)
Compared to same class
» 13% of all tested devices in this class were better, 1% similar, 85% worse
» The best had a delta of 5%, average was 17%, worst was 45%
Compared to all devices tested
» 4% of all tested devices were better, 1% similar, 95% worse
» The best had a delta of 4%, average was 23%, worst was 134%
Asus ProArt P16 RTX 5090 audio analysis
(±) | speaker loudness is average but good (80.8 dB)
Bass 100 - 315 Hz
(+) | good bass - only 3.3% away from median
(±) | linearity of bass is average (7.7% delta to prev. frequency)
Mids 400 - 2000 Hz
(+) | balanced mids - only 2.9% away from median
(+) | mids are linear (1.9% delta to prev. frequency)
Highs 2 - 16 kHz
(+) | balanced highs - only 4.1% away from median
(+) | highs are linear (5.5% delta to prev. frequency)
Overall 100 - 16.000 Hz
(+) | overall sound is linear (8.3% difference to median)
Compared to same class
» 9% of all tested devices in this class were better, 2% similar, 89% worse
» The best had a delta of 5%, average was 17%, worst was 45%
Compared to all devices tested
» 2% of all tested devices were better, 1% similar, 97% worse
» The best had a delta of 4%, average was 23%, worst was 134%
Dell 16 Premium DA16250 audio analysis
(+) | speakers can play relatively loud (84.2 dB)
Bass 100 - 315 Hz
(±) | reduced bass - on average 6.1% lower than median
(+) | bass is linear (4.2% delta to prev. frequency)
Mids 400 - 2000 Hz
(+) | balanced mids - only 1.4% away from median
(+) | mids are linear (3.6% delta to prev. frequency)
Highs 2 - 16 kHz
(+) | balanced highs - only 1.5% away from median
(+) | highs are linear (2.2% delta to prev. frequency)
Overall 100 - 16.000 Hz
(+) | overall sound is linear (5.1% difference to median)
Compared to same class
» 1% of all tested devices in this class were better, 0% similar, 99% worse
» The best had a delta of 5%, average was 17%, worst was 45%
Compared to all devices tested
» 0% of all tested devices were better, 0% similar, 100% worse
» The best had a delta of 4%, average was 23%, worst was 134%
Lenovo ThinkPad T1g Gen 8 21TD003GE audio analysis
(+) | speakers can play relatively loud (85.6 dB)
Bass 100 - 315 Hz
(±) | reduced bass - on average 9.3% lower than median
(±) | linearity of bass is average (11.9% delta to prev. frequency)
Mids 400 - 2000 Hz
(+) | balanced mids - only 2.5% away from median
(+) | mids are linear (4% delta to prev. frequency)
Highs 2 - 16 kHz
(+) | balanced highs - only 3.4% away from median
(±) | linearity of highs is average (7.5% delta to prev. frequency)
Overall 100 - 16.000 Hz
(+) | overall sound is linear (8.7% difference to median)
Compared to same class
» 11% of all tested devices in this class were better, 2% similar, 87% worse
» The best had a delta of 5%, average was 17%, worst was 45%
Compared to all devices tested
» 3% of all tested devices were better, 1% similar, 97% worse
» The best had a delta of 4%, average was 23%, worst was 134%
耗电量

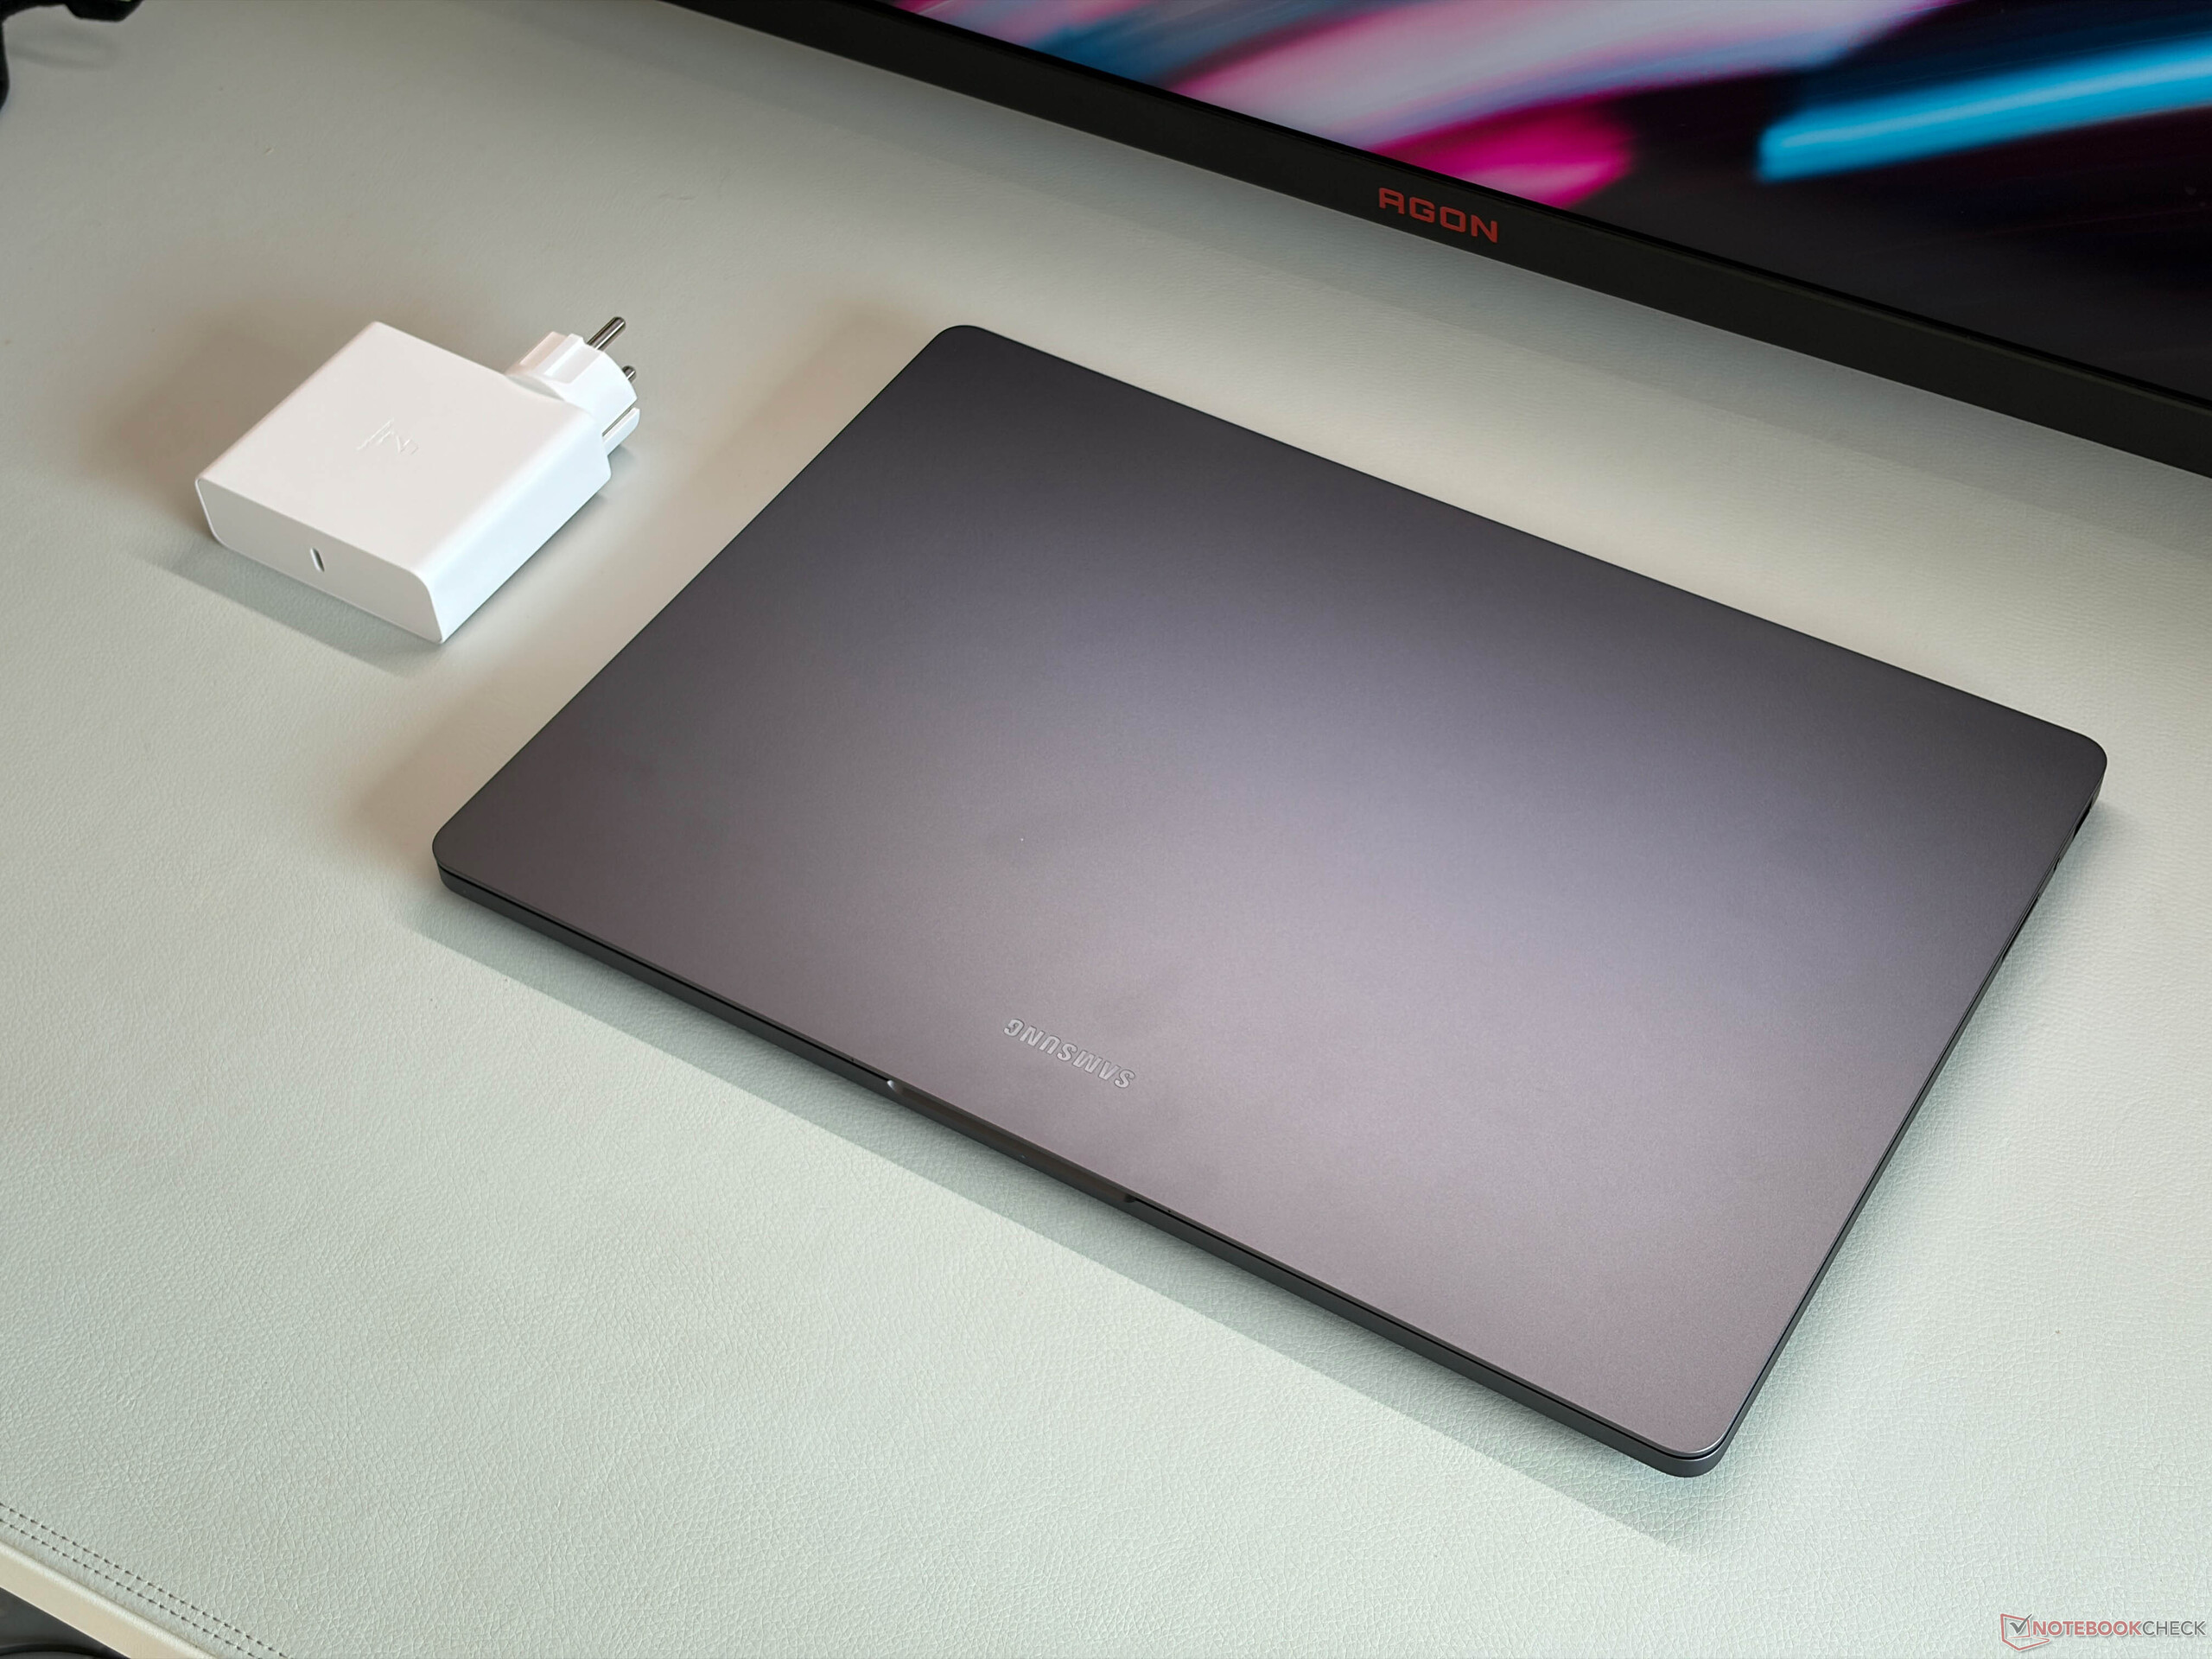
Galaxy Book6 Ultra 在空闲时的能效出人意料,SDR 全亮度下的最大功耗仅为 7.1 瓦。在压力测试中,我们测得前 40 秒的功耗约为 140-144 瓦特,但随后功耗趋于平稳,约为 124 瓦特,电池也没有耗尽,因此 140 瓦特的电源适配器足够使用。
| Off / Standby | |
| Idle | |
| Load |
|
Key:
min: | |
| Samsung Galaxy Book6 Ultra Ultra 7 356H, GeForce RTX 5070 Laptop, Samsung PM9C1b MZVL81T0HFLB-00BH1, OLED, 2880x1800, 16" | Apple MacBook Pro 16 2024 M4 Pro M4 Pro 14-Core, M4 Pro 20-Core GPU, Apple SSD AP2048Z, Mini-LED, 3456x2234, 16.2" | Lenovo Yoga Pro 9i 16 RTX 5070 Ultra 9 285H, GeForce RTX 5070 Laptop, WD PC SN7100S SDFPMSL-1T00-1101, OLED, 3200x2000, 16" | Asus ProArt P16 RTX 5090 Ryzen AI 9 HX 370, GeForce RTX 5090 Laptop, Micron 2500 2TB MTFDKBA2T0QGN-1BN1AABGA, OLED, 3840x2400, 16" | Dell 16 Premium DA16250 Ultra 7 255H, GeForce RTX 5070 Laptop, Kioxia BG6 KBG6AZNV1T02, OLED, 3840x2400, 16.3" | Lenovo ThinkPad T1g Gen 8 21TD003GE Ultra 9 285H, GeForce RTX 5070 Laptop, Samsung PM9E1 MZVLC2T0HBLD, Tandem-OLED, 3200x2000, 16" | Average NVIDIA GeForce RTX 5070 Laptop | Average of class Multimedia | |
|---|---|---|---|---|---|---|---|---|
| Power Consumption | -38% | -73% | -82% | -66% | -48% | -122% | -32% | |
| Idle Minimum * (Watt) | 4.4 | 4.6 -5% | 8.8 -100% | 10.9 -148% | 6.5 -48% | 8.5 -93% | 10.8 ? -145% | 5.68 ? -29% |
| Idle Average * (Watt) | 6.4 | 16.8 -163% | 16.1 -152% | 12.1 -89% | 8.1 -27% | 13.6 -113% | 15.4 ? -141% | 10.2 ? -59% |
| Idle Maximum * (Watt) | 7.1 | 17.1 -141% | 16.5 -132% | 12.5 -76% | 33 -365% | 14.1 -99% | 21 ? -196% | 12.4 ? -75% |
| Load Average * (Watt) | 55.1 | 76.4 -39% | 89.3 -62% | 129.3 -135% | 88.9 -61% | 84.5 -53% | 98.7 ? -79% | 65.4 ? -19% |
| Cyberpunk 2077 ultra external monitor * (Watt) | 133 | 79.3 40% | 157.9 -19% | 172.8 -30% | 108.9 18% | 118.1 11% | ||
| Cyberpunk 2077 ultra * (Watt) | 134.3 | 83.4 38% | 160.6 -20% | 176.6 -31% | 108.7 19% | 120.3 10% | ||
| Load Maximum * (Watt) | 143.9 | 138.1 4% | 177.4 -23% | 233.9 -63% | 138.3 4% | 143 1% | 218 ? -51% | 113.3 ? 21% |
* ... smaller is better
功耗 赛博朋克/压力测试
外部显示器功耗
电池寿命
尽管Galaxy Book6 Ultra 的电池容量在我们的对比组中最小,只有 80.2 Wh,但它的电池续航时间却令人印象深刻,甚至接近 MacBook Pro。在 150 尼特的条件下,我们的 Wi-Fi 测试可持续近 17 个小时,因此比其他 Windows 竞争对手要长得多。在全亮度状态下,我们仍然记录了近 8.5 小时的运行时间,甚至比 MacBook Pro(亮度稍高)还长约 1 小时。

笔记本检查评级
Samsung Galaxy Book6 Ultra
- 03/06/2026 v8
Andreas Osthoff
 Total Sustainability Score:
 潜在竞争对手比较
Image | Model / Review | Price | Weight | Height | Display |
|---|---|---|---|---|---|
1. 90.7%  | Samsung Galaxy Book6 Ultra Intel Core Ultra 7 356H ⎘ NVIDIA GeForce RTX 5070 Laptop ⎘ 32 GB Memory, 1000 GB SSD | Amazon: List Price: 3599€ | 1.9 kg | 15.4 mm | 16.00" 2880x1800 212 PPI OLED |
2. 93%  | Apple MacBook Pro 16 2024 M4 Pro Apple M4 Pro 14-Core ⎘ Apple M4 Pro 20-Core GPU ⎘ 48 GB Memory, 2048 GB SSD | Amazon: List Price: 4219€ | 2.1 kg | 16.8 mm | 16.20" 3456x2234 254 PPI Mini-LED |
3. 90.4%  | Lenovo Yoga Pro 9i 16 RTX 5070 Intel Core Ultra 9 285H ⎘ NVIDIA GeForce RTX 5070 Laptop ⎘ 64 GB Memory, 1024 GB SSD | Amazon: List Price: 2800€ | 1.9 kg | 17.9 mm | 16.00" 3200x2000 236 PPI OLED |
4. 89.7%  | Asus ProArt P16 RTX 5090 AMD Ryzen AI 9 HX 370 ⎘ NVIDIA GeForce RTX 5090 Laptop ⎘ 64 GB Memory, 2048 GB SSD | Amazon: List Price: 4799€ | 2 kg | 18.3 mm | 16.00" 3840x2400 283 PPI OLED |
5. 87.9%  | Dell 16 Premium DA16250 Intel Core Ultra 7 255H ⎘ NVIDIA GeForce RTX 5070 Laptop ⎘ 32 GB Memory, 1024 GB SSD | Amazon: List Price: 3300 USD | 2.3 kg | 18.7 mm | 16.30" 3840x2400 278 PPI OLED |
6. 92.4%  | Lenovo ThinkPad T1g Gen 8 21TD003GE Intel Core Ultra 9 285H ⎘ NVIDIA GeForce RTX 5070 Laptop ⎘ 64 GB Memory, 2048 GB SSD | Amazon: List Price: 4500€ | 1.9 kg | 15.8 mm | 16.00" 3200x2000 236 PPI Tandem-OLED |
Transparency
The selection of devices to be reviewed is made by our editorial team. The test sample was provided to the author as a loan by the manufacturer or retailer for the purpose of this review. The lender had no influence on this review, nor did the manufacturer receive a copy of this review before publication. There was no obligation to publish this review. As an independent media company, Notebookcheck is not subjected to the authority of manufacturers, retailers or publishers.
This is how Notebookcheck is testing
Every year, Notebookcheck independently reviews hundreds of laptops and smartphones using standardized procedures to ensure that all results are comparable. We have continuously developed our test methods for around 20 years and set industry standards in the process. In our test labs, high-quality measuring equipment is utilized by experienced technicians and editors. These tests involve a multi-stage validation process. Our complex rating system is based on hundreds of well-founded measurements and benchmarks, which maintains objectivity. Further information on our test methods can be found here.

