Dell XPS 15 7590笔记本电脑评测:基础款i5处理器FHD屏幕型号是否足够

| SD Card Reader | |
| average JPG Copy Test (av. of 3 runs) | |
| Dell XPS 15 7590 i5 iGPU FHD (Toshiba Exceria Pro SDXC 64 GB UHS-II) | |
| Dell XPS 15 9570 i7 UHD (Toshiba Exceria Pro SDXC 64 GB UHS-II) | |
| Dell XPS 15 7590 9980HK GTX 1650 (Toshiba Exceria Pro SDXC 64 GB UHS-II) | |
| Average of class Multimedia (23 - 531, n=43, last 2 years) | |
| maximum AS SSD Seq Read Test (1GB) | |
| Dell XPS 15 7590 9980HK GTX 1650 (Toshiba Exceria Pro SDXC 64 GB UHS-II) | |
| Dell XPS 15 9570 i7 UHD (Toshiba Exceria Pro SDXC 64 GB UHS-II) | |
| Average of class Multimedia (27.9 - 1455, n=42, last 2 years) | |
| Dell XPS 15 7590 i5 iGPU FHD (Toshiba Exceria Pro SDXC 64 GB UHS-II) | |
| Networking | |
| iperf3 transmit AX12 | |
| Dell XPS 15 7590 i5 iGPU FHD | |
| Dell XPS 15 9570 Core i9 UHD | |
| Dell XPS 15 7590 9980HK GTX 1650 | |
| iperf3 receive AX12 | |
| Dell XPS 15 7590 9980HK GTX 1650 | |
| Dell XPS 15 9570 Core i9 UHD | |
| Dell XPS 15 7590 i5 iGPU FHD | |
| |||||||||||||||||||||||||
Brightness Distribution: 89 %
Center on Battery: 586 cd/m²
Contrast: 1470:1 (Black: 0.4 cd/m²)
ΔE ColorChecker Calman: 2.5 | ∀{0.5-29.43 Ø4.73}
calibrated: 0.6
ΔE Greyscale Calman: 4.5 | ∀{0.09-98 Ø4.97}
98% sRGB (Argyll 1.6.3 3D)
63.2% AdobeRGB 1998 (Argyll 1.6.3 3D)
68.4% AdobeRGB 1998 (Argyll 3D)
98% sRGB (Argyll 3D)
66.5% Display P3 (Argyll 3D)
Gamma: 2.2
CCT: 6836 K
| Dell XPS 15 7590 i5 iGPU FHD LQ156M1, , 1920x1080, 15.6" | Dell XPS 15 7590 9980HK GTX 1650 Samsung 156WR04, SDCA029, , 3840x2160, 15.6" | Dell XPS 15 9570 Core i9 UHD LQ156D1, , 3840x2160, 15.6" | Dell XPS 15 9570 i7 UHD LQ156D1, , 3840x2160, 15.6" | Dell XPS 15 2017 9560 (7300HQ, Full-HD) Sharp SHP1453 LQ156M1, , 1920x1080, 15.6" | |
|---|---|---|---|---|---|
| Display | 23% | 12% | 12% | 3% | |
| Display P3 Coverage (%) | 66.5 | 88.1 32% | 79.6 20% | 79.1 19% | 68.9 4% |
| sRGB Coverage (%) | 98 | 99.6 2% | 98.4 0% | 98.8 1% | 98.9 1% |
| AdobeRGB 1998 Coverage (%) | 68.4 | 91.8 34% | 79.7 17% | 79.2 16% | 70.9 4% |
| Response Times | 94% | 1% | 6% | -33% | |
| Response Time Grey 50% / Grey 80% * (ms) | 52.8 ? | 2.3 ? 96% | 52.4 ? 1% | 46.4 ? 12% | 54 ? -2% |
| Response Time Black / White * (ms) | 32 ? | 2.4 ? 92% | 31.6 ? 1% | 32 ? -0% | 52.4 ? -64% |
| PWM Frequency (Hz) | 1020 ? | 59.5 ? | 1000 ? | 980 ? | |
| Screen | -26% | -71% | -25% | -25% | |
| Brightness middle (cd/m²) | 588 | 421.2 -28% | 451.9 -23% | 494 -16% | 400 -32% |
| Brightness (cd/m²) | 555 | 417 -25% | 414 -25% | 457 -18% | 392 -29% |
| Brightness Distribution (%) | 89 | 94 6% | 81 -9% | 88 -1% | 89 0% |
| Black Level * (cd/m²) | 0.4 | 0.36 10% | 0.34 15% | 0.26 35% | |
| Contrast (:1) | 1470 | 1255 -15% | 1453 -1% | 1538 5% | |
| Colorchecker dE 2000 * | 2.5 | 6.06 -142% | 5.62 -125% | 5.2 -108% | 4.9 -96% |
| Colorchecker dE 2000 max. * | 6.3 | 11.89 -89% | 19.1 -203% | 17.5 -178% | 11 -75% |
| Colorchecker dE 2000 calibrated * | 0.6 | 2.69 -348% | |||
| Greyscale dE 2000 * | 4.5 | 2.8 38% | 6.9 -53% | 2.7 40% | 7.2 -60% |
| Gamma | 2.2 100% | 2.15 102% | 2.2 100% | 2.1 105% | 2.11 104% |
| CCT | 6836 95% | 6235 104% | 6254 104% | 7038 92% | 6911 94% |
| Color Space (Percent of AdobeRGB 1998) (%) | 63.2 | 81 28% | 71.8 14% | 71.2 13% | 64.2 2% |
| Color Space (Percent of sRGB) (%) | 98 | 99.6 2% | 98.5 1% | 98.8 1% | 98.9 1% |
| Total Average (Program / Settings) | 30% /
4% | -19% /
-46% | -2% /
-14% | -18% /
-20% |
* ... smaller is better
Display Response Times
| ↔ Response Time Black to White | ||
|---|---|---|
| 32 ms ... rise ↗ and fall ↘ combined | ↗ 16.4 ms rise | 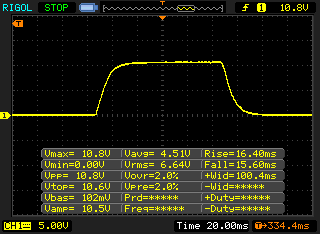 |
| ↘ 15.6 ms fall | ||
| The screen shows slow response rates in our tests and will be unsatisfactory for gamers. In comparison, all tested devices range from 0.1 (minimum) to 240 (maximum) ms. » 86 % of all devices are better. This means that the measured response time is worse than the average of all tested devices (19.9 ms). | ||
| ↔ Response Time 50% Grey to 80% Grey | ||
| 52.8 ms ... rise ↗ and fall ↘ combined | ↗ 25.6 ms rise | 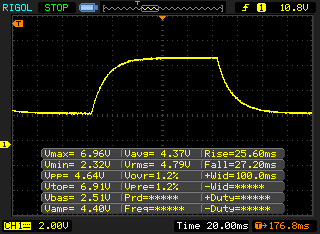 |
| ↘ 27.2 ms fall | ||
| The screen shows slow response rates in our tests and will be unsatisfactory for gamers. In comparison, all tested devices range from 0.165 (minimum) to 636 (maximum) ms. » 89 % of all devices are better. This means that the measured response time is worse than the average of all tested devices (31.1 ms). | ||
Screen Flickering / PWM (Pulse-Width Modulation)
| Screen flickering / PWM detected | 1020 Hz | ≤ 25 % brightness setting | 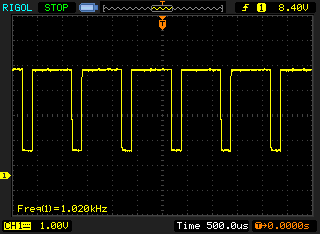 |
The display backlight flickers at 1020 Hz (worst case, e.g., utilizing PWM) Flickering detected at a brightness setting of 25 % and below. There should be no flickering or PWM above this brightness setting. The frequency of 1020 Hz is quite high, so most users sensitive to PWM should not notice any flickering. In comparison: 52 % of all tested devices do not use PWM to dim the display. If PWM was detected, an average of 7798 (minimum: 5 - maximum: 343500) Hz was measured. | |||
| PCMark 8 Home Score Accelerated v2 | 4175 points | |
| PCMark 8 Creative Score Accelerated v2 | 5022 points | |
| PCMark 8 Work Score Accelerated v2 | 5070 points | |
| PCMark 10 Score | 4105 points | |
Help | ||

| 3DMark 11 Performance | 1989 points | |
| 3DMark Cloud Gate Standard Score | 9545 points | |
| 3DMark Fire Strike Score | 1100 points | |
| 3DMark Time Spy Score | 441 points | |
Help | ||
| low | med. | high | ultra | 4K | |
|---|---|---|---|---|---|
| BioShock Infinite (2013) | 58.7 | 34.7 | 29.9 | 9.8 | |
| Dota 2 Reborn (2015) | 78 | 49.5 | 20.2 | 17.9 | 6.5 |
| X-Plane 11.11 (2018) | 24.5 | 15.1 | 13.3 |
Noise level
| Idle |
| 29.3 / 29.3 / 29.8 dB(A) |
| Load |
| 32.4 / 37.2 dB(A) |
 | ||
30 dB silent 40 dB(A) audible 50 dB(A) loud |
||
min: | ||
| Dell XPS 15 7590 i5 iGPU FHD UHD Graphics 630, i5-9300H, Toshiba XG6 KXG60ZNV512G | Dell XPS 15 7590 9980HK GTX 1650 GeForce GTX 1650 Mobile, i9-9980HK, Toshiba XG6 KXG60ZNV1T02 | Dell XPS 15 9570 i7 UHD GeForce GTX 1050 Ti Max-Q, i7-8750H, Toshiba XG5 KXG50ZNV512G | Dell XPS 15 9570 Core i9 UHD GeForce GTX 1050 Ti Max-Q, i9-8950HK, Samsung SSD PM981 MZVLB1T0HALR | Dell XPS 15 2017 9560 (7300HQ, Full-HD) GeForce GTX 1050 Mobile, i5-7300HQ, WDC WD10SPCX-75KHST0 + SanDisk Z400s M.2 2242 32 GB Cache | |
|---|---|---|---|---|---|
| Noise | -9% | -5% | -5% | -18% | |
| off / environment * (dB) | 29.3 | 28.2 4% | 29.9 -2% | 28.2 4% | 30.3 -3% |
| Idle Minimum * (dB) | 29.3 | 28.2 4% | 29.9 -2% | 28.5 3% | 31.6 -8% |
| Idle Average * (dB) | 29.3 | 28.2 4% | 29.9 -2% | 28.6 2% | 31.6 -8% |
| Idle Maximum * (dB) | 29.8 | 30.4 -2% | 30.3 -2% | 28.8 3% | 33.4 -12% |
| Load Average * (dB) | 32.4 | 43.8 -35% | 36.5 -13% | 36.2 -12% | 47.8 -48% |
| Load Maximum * (dB) | 37.2 | 47.2 -27% | 40.4 -9% | 47.6 -28% | 47.8 -28% |
| Witcher 3 ultra * (dB) | 47.2 | 40.4 | 47.6 |
* ... smaller is better
(±) The maximum temperature on the upper side is 44.6 °C / 112 F, compared to the average of 36.8 °C / 98 F, ranging from 21 to 71 °C for the class Multimedia.
(+) The bottom heats up to a maximum of 39 °C / 102 F, compared to the average of 39.1 °C / 102 F
(+) In idle usage, the average temperature for the upper side is 23.1 °C / 74 F, compared to the device average of 31.3 °C / 88 F.
(+) The palmrests and touchpad are cooler than skin temperature with a maximum of 28.9 °C / 84 F and are therefore cool to the touch.
(±) The average temperature of the palmrest area of similar devices was 28.7 °C / 83.7 F (-0.2 °C / -0.3 F).
Dell XPS 15 7590 i5 iGPU FHD audio analysis
(±) | speaker loudness is average but good (79 dB)
Bass 100 - 315 Hz
(-) | nearly no bass - on average 26.4% lower than median
(±) | linearity of bass is average (12.1% delta to prev. frequency)
Mids 400 - 2000 Hz
(+) | balanced mids - only 4.5% away from median
(±) | linearity of mids is average (8% delta to prev. frequency)
Highs 2 - 16 kHz
(+) | balanced highs - only 1.4% away from median
(+) | highs are linear (2.8% delta to prev. frequency)
Overall 100 - 16.000 Hz
(±) | linearity of overall sound is average (21.2% difference to median)
Compared to same class
» 73% of all tested devices in this class were better, 7% similar, 20% worse
» The best had a delta of 5%, average was 17%, worst was 45%
Compared to all devices tested
» 59% of all tested devices were better, 7% similar, 34% worse
» The best had a delta of 4%, average was 24%, worst was 134%
| Off / Standby | |
| Idle | |
| Load |
|
Key:
min: | |
| Dell XPS 15 7590 i5 iGPU FHD i5-9300H, UHD Graphics 630, IPS, 1920x1080 | Dell XPS 15 7590 9980HK GTX 1650 i9-9980HK, GeForce GTX 1650 Mobile, OLED, 3840x2160 | Dell XPS 15 9570 i7 UHD i7-8750H, GeForce GTX 1050 Ti Max-Q, IPS, 3840x2160 | Dell XPS 15 9570 Core i9 UHD i9-8950HK, GeForce GTX 1050 Ti Max-Q, IPS, 3840x2160 | Dell XPS 15 2017 9560 (7300HQ, Full-HD) i5-7300HQ, GeForce GTX 1050 Mobile, LED IGZO IPS InfinityEdge, 1920x1080 | |
|---|---|---|---|---|---|
| Power Consumption | -65% | -87% | -65% | -33% | |
| Idle Minimum * (Watt) | 3.79 | 6.2 -64% | 9.48 -150% | 7.1 -87% | 6.6 -74% |
| Idle Average * (Watt) | 6.9 | 9.6 -39% | 16.1 -133% | 13.6 -97% | 9 -30% |
| Idle Maximum * (Watt) | 9.2 | 21.2 -130% | 16.9 -84% | 14.1 -53% | 10.7 -16% |
| Load Average * (Watt) | 62 | 104.3 -68% | 90.8 -46% | 103.9 -68% | 77.5 -25% |
| Load Maximum * (Watt) | 108 | 135.3 -25% | 134.4 -24% | 130.9 -21% | 130 -20% |
| Witcher 3 ultra * (Watt) | 91.7 | 103 |
* ... smaller is better
| Dell XPS 15 7590 i5 iGPU FHD i5-9300H, UHD Graphics 630, 97 Wh | Dell XPS 15 7590 9980HK GTX 1650 i9-9980HK, GeForce GTX 1650 Mobile, 97 Wh | Dell XPS 15 9570 i7 UHD i7-8750H, GeForce GTX 1050 Ti Max-Q, 97 Wh | Dell XPS 15 9570 Core i9 UHD i9-8950HK, GeForce GTX 1050 Ti Max-Q, 97 Wh | Dell XPS 15 2017 9560 (7300HQ, Full-HD) i5-7300HQ, GeForce GTX 1050 Mobile, 56 Wh | Average of class Multimedia | |
|---|---|---|---|---|---|---|
| Battery runtime | 25% | -29% | -40% | -39% | -8% | |
| H.264 (h) | 17.6 | 12.3 -30% | 16.4 ? -7% | |||
| WiFi v1.3 (h) | 14.1 | 7.8 -45% | 9.6 -32% | 8.6 -39% | 5.6 -60% | 12 ? -15% |
| Load (h) | 1.7 | 3.3 94% | 1.3 -24% | 1 -41% | 1.4 -18% | 1.675 ? -1% |
| Witcher 3 ultra (h) | 1 |
Pros
Cons
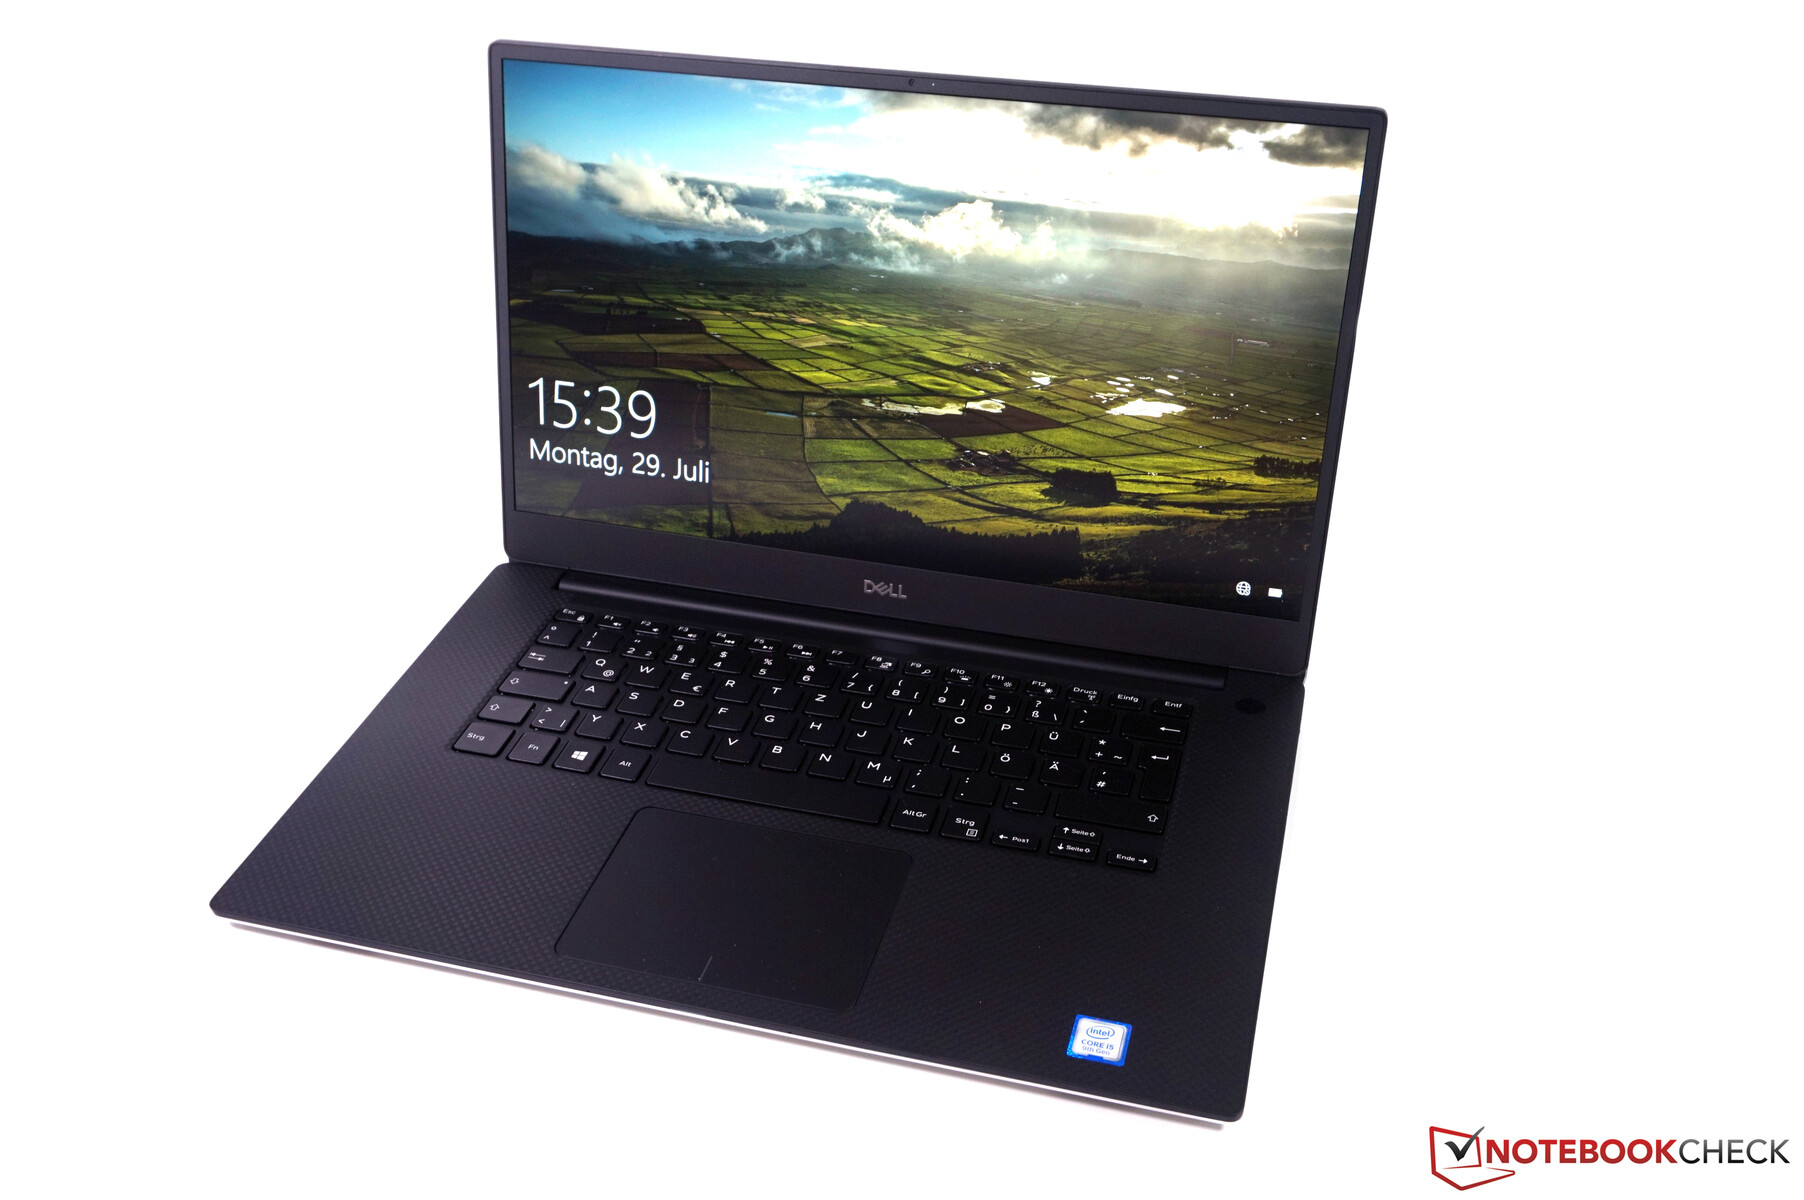
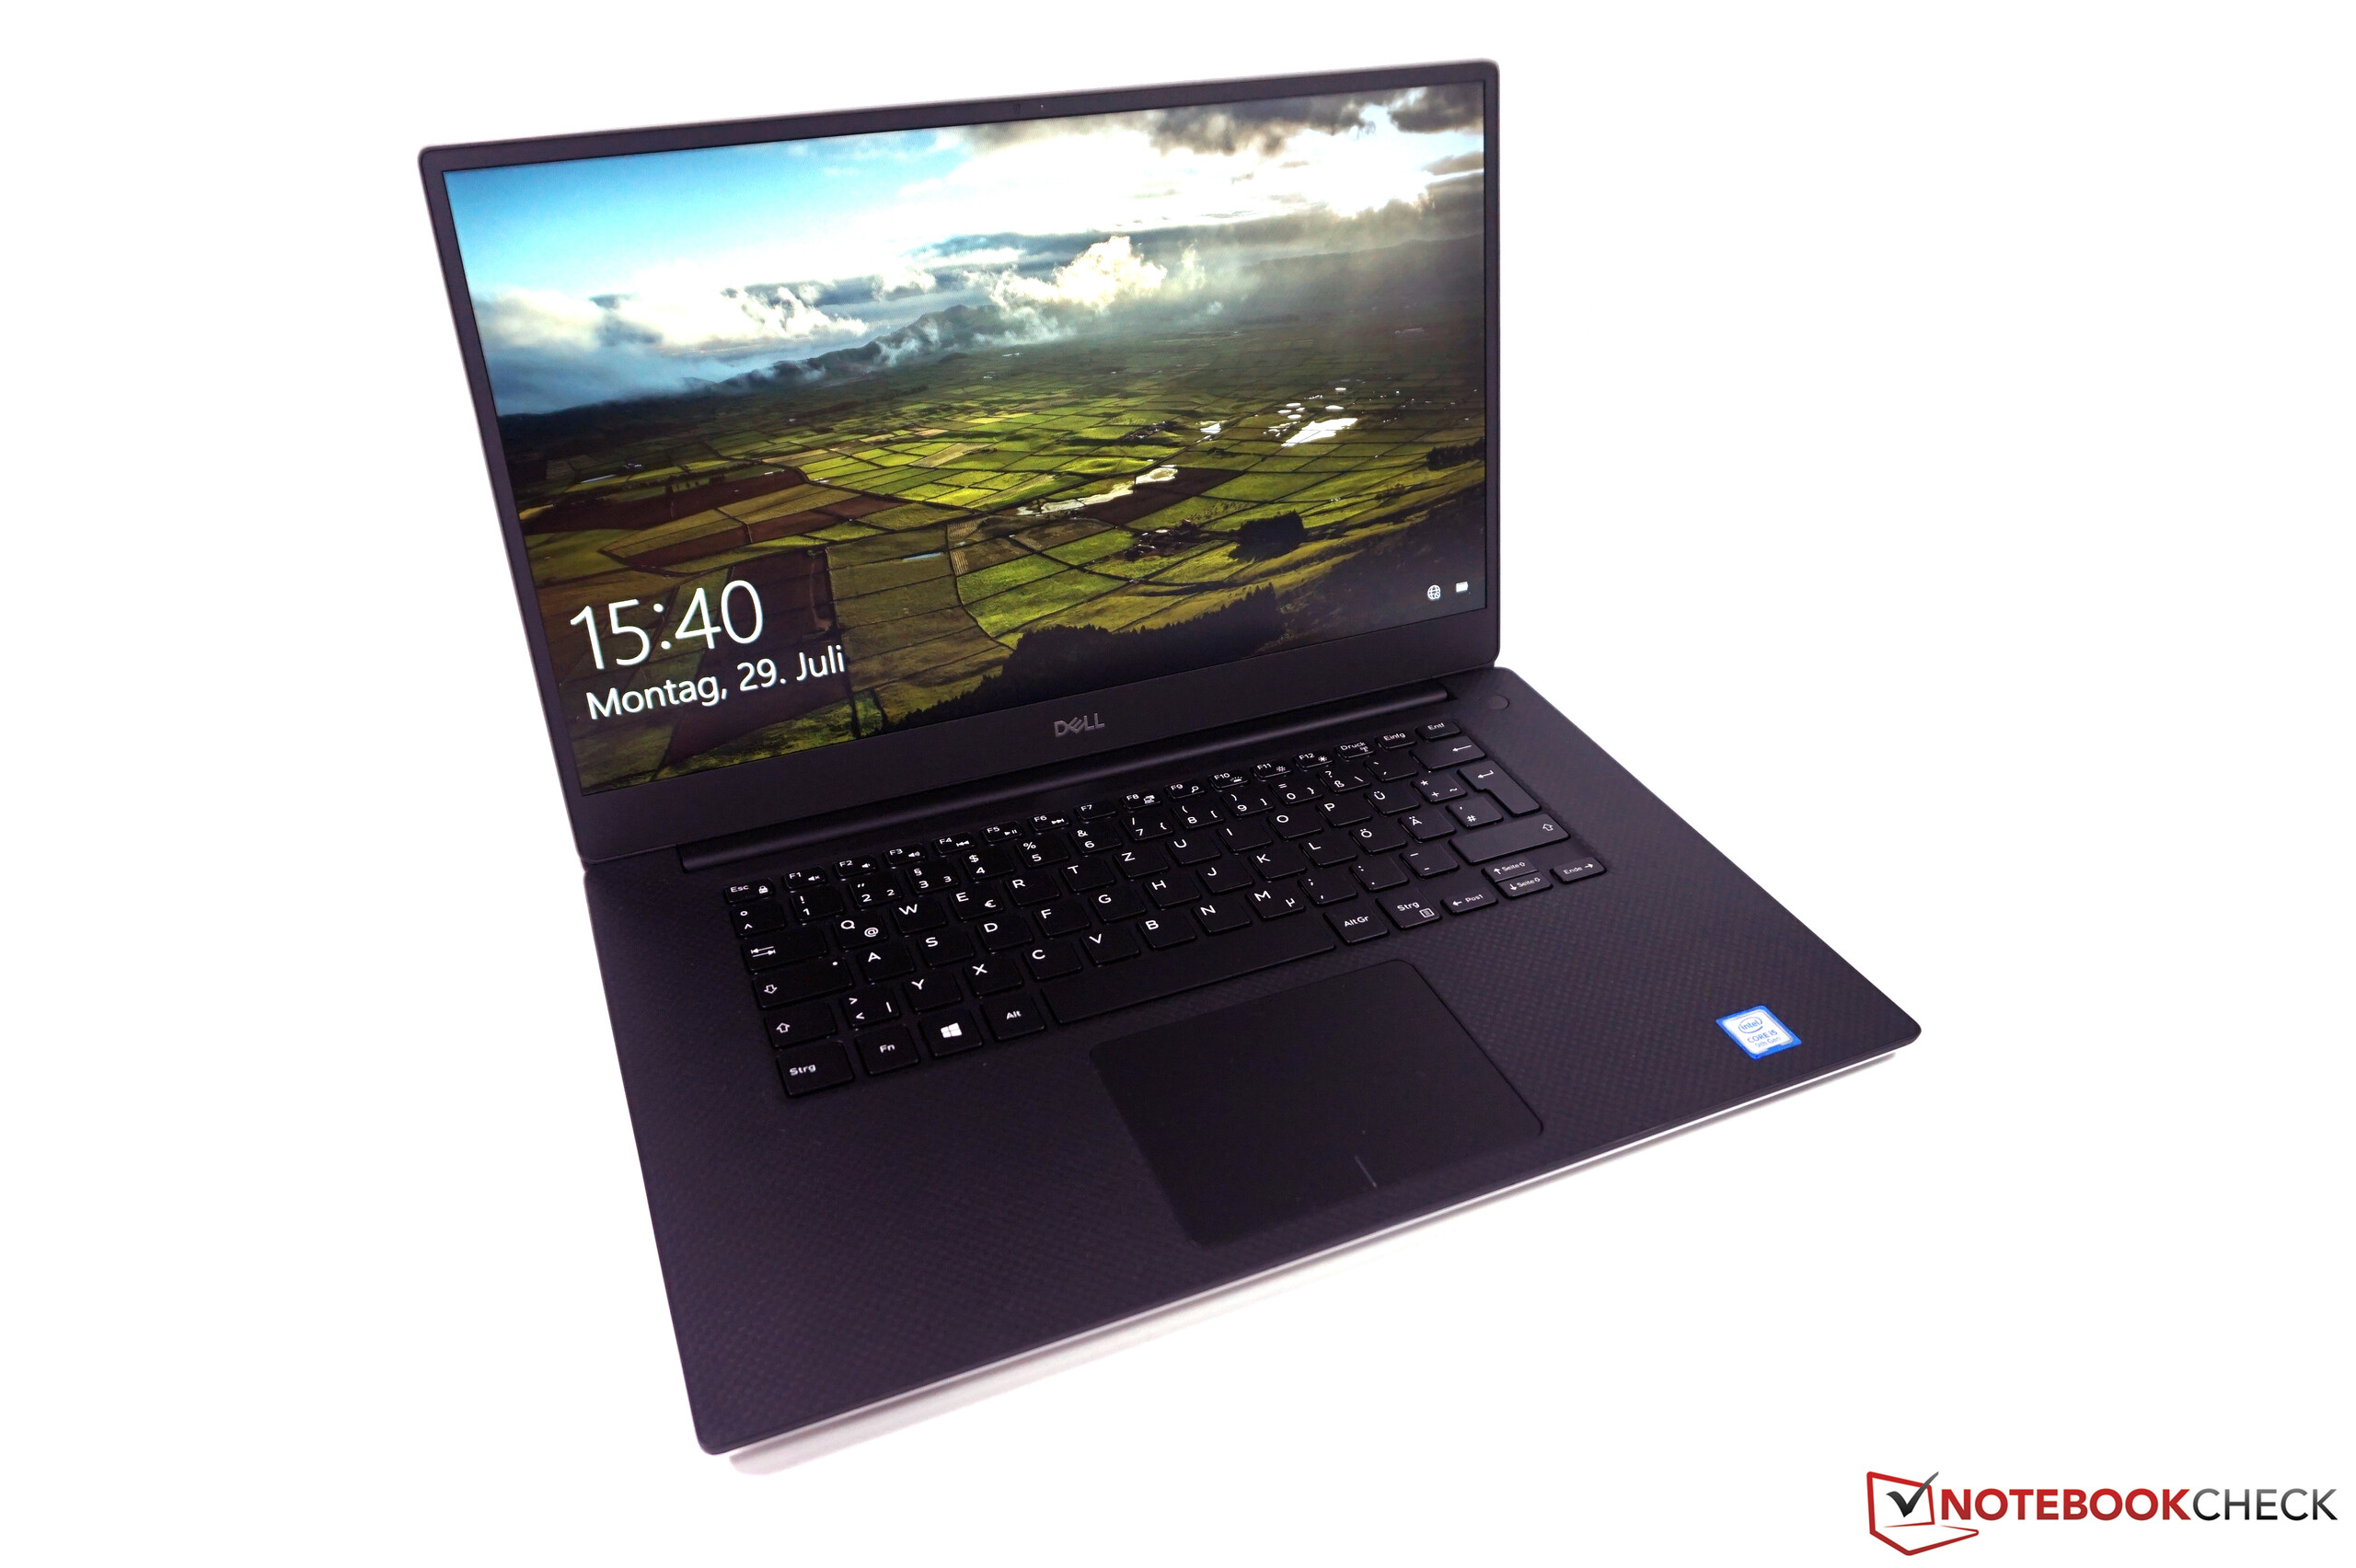
即使没有独立的GeForce显卡,Dell XPS 15也是一款出色的多媒体笔记本。那些不想玩游戏或可以接受外接显卡的人无论如何都更适合iGPU版本。特别是在排放(温度和噪声)和价格方面,有一些明显的优势。对于大多数用户而言,基本配置的其余设备在日常使用中肯定足够。
那些不玩游戏,而只想要具有出色1080p显示屏的高质量多媒体笔记本的人,入门版Dell XPS 15绝对不会让人失望。甚至还有一些优点,例如更好的可用性。以及XPS 15 4K版本无法提供的出色电池续航能力。
磨砂全高清显示屏是一个很好的选择,与4K面板相比,它在最大亮度方面甚至具有优势。结合磨砂表面和低功耗,如果您经常进行移动工作,显然是更好的选择。并且您还可以受益于极长的电池寿命,而XPS 15的4K版本(无论是IPS还是OLED)都无法实现。
Dell XPS 15 7590 i5 iGPU FHD
- 09/26/2019 v7 (old)
Andreas Osthoff
Price comparison

