


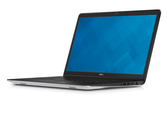
戴尔 Inspiron 15-5547 笔记本电脑简短评测
简约,仍有魅力? 你希望买一款设计时髦且有不错游戏性能的实惠多媒体笔记本电脑吗?如果是的话,戴尔的Inspiron 15-5547可能是个不错的选择。我们的评测将会告诉你以低于600欧元的价格可以达到什么样的质量水平。
Intel Core i5-4210U, AMD Radeon R7 M265, 15.6", 2.2 kg
AMD Radeon R7 M265是一款支持DirectX 11的中低端笔记本显卡。与较老的Radeon HD 8750M一样,它基于Mars芯片设计(GCN架构),提供384个着色核心,24个TMU和8个ROP。它的核心频率最高可达825MHz,支持最大2GB的DDR3显存(1000MHz,128位)。 性能 Radeon R7 M265的性能与Nvidia GeForce GT 640M和GeForce GT 730M相当。最新的和2013/2014年要求较高的游戏只能够在低分辨率和细节设定下流畅运行。不过在较老的游戏中,它可以运行于更高的设定下。 384个着色器可以通过OpenCL 1.2用于一般运算(作为6个运算单元)。相比于较老的TeraScale 2芯片,基于GCN的Mars芯片架构在这方面提供了更好的性能。 特性 R7 M265提供了对MPEG-4 AVC/H.264, VC-1, MPEG-2, and Flash的硬解码支持。同样支持的还有Multi-View Codec(MVC)和MPEG-4 part 2(DivX, xVid)格式的高清视频。 R7系列也提供了在集成显卡和独立显卡间自动转换的功能。名为Enduro的这项技术替代了AMD的Dynamic Switchable Graphics技术,与Nvidia的Optimus相似。而且,当Enduro禁用时,M265借助于Eyefinity技术可以提供对多显示器的支持。 其他的特性还包括了用于降低屏幕关闭时的能耗的ZeroCore技术,和可以关闭没有在使用的芯片区域的Power Gating技术。PowerTune技术提供了在TDP范围内自动超频和降频的可能性。例如,它会在运行一些测试软件如FurMark和OCCT时降频,但在运行最新游戏如Lost Planet,Crysis或Resident Evil 5时则会自动超频。 集成的高清音频处理器可以通过HDMI或DisplayPort(如当播放蓝光视频时)传输高清音频信号(TrueHD或DTS Master Audio)。另外,它支持通过新的DDMA(Discrete Digital Multipoint Audio)技术同时传输音频信号给多个设备。 功耗 它的功耗和较老的HD 8750M或Nvidia GeForce GT 730M相近。因此,R7 M265最适合于13寸或更大的笔记本电脑。
Radeon R7 M200 Series
| ||||||||||||||||
| Codename | Opal XT / Mars | |||||||||||||||
| Architecture | GCN | |||||||||||||||
| Pipelines | 384 - unified | |||||||||||||||
| Core Speed | 825 - 980 (Boost) MHz | |||||||||||||||
| Memory Speed | 1800 - 2000 MHz | |||||||||||||||
| Memory Bus Width | 64/128 Bit | |||||||||||||||
| Memory Type | DDR3 | |||||||||||||||
| Max. Amount of Memory | 4 GB | |||||||||||||||
| Shared Memory | no | |||||||||||||||
| API | DirectX 12 (FL 11_1), Shader 5.0, OpenGL 4.3 | |||||||||||||||
| Transistor Count | 1 Billion | |||||||||||||||
| Man. Technology | 28 nm | |||||||||||||||
| Features | Mantle, PCIe 3.0, Zero Core, PowerTune | |||||||||||||||
| Notebook Size | medium sized | |||||||||||||||
| Date of Announcement | 07.01.2014 | |||||||||||||||
The following benchmarks stem from our benchmarks of review laptops. The performance depends on the used graphics memory, clock rate, processor, system settings, drivers, and operating systems. So the results don't have to be representative for all laptops with this GPU. For detailed information on the benchmark results, click on the fps number.


For more games that might be playable and a list of all games and graphics cards visit our Gaming List
Lenovo ThinkPad E550-20DF00CNGE: Intel Core i7-5500U, 15.60", 2.4 kg
External Review » Lenovo ThinkPad E550-20DF00CNGE
Dell Inspiron 15-5545: AMD A10-7300, 15.60", 2.4 kg
External Review » Dell Inspiron 15-5545
Acer Aspire E5-551G-83ED: AMD A8-7100, 15.60", 2.5 kg
External Review » Acer Aspire E5-551G-83ED
Acer Aspire E5-551G-F1EW: AMD FX-7500, 15.60", 2.5 kg
External Review » Acer Aspire E5-551G-T0JN
Acer Aspire V5-561G: Intel Core i5-4200U, 15.60", 2.4 kg
External Review » Acer Aspire V5-561G
Dell Inspiron 15-5547: Intel Core i5-4210U, 15.60", 2.2 kg
External Review » Dell Inspiron 15-5547
» Comparison of GPUs
Detailed list of all laptop GPUs sorted by class and performance.
» Benchmark List
Sort and restrict laptop GPUs based on performance in synthetic benchmarks.
» Notebook Gaming List
Playable games for each graphics card and their average FPS results.
* Approximate position of the graphics adapter
» Notebookcheck多媒体笔记本电脑Top 10排名
» Notebookcheck游戏笔记本电脑Top 10排名
» Notebookcheck低价办公/商务笔记本电脑Top 10排名
» Notebookcheck高端办公/商务笔记本电脑Top 10排名
» Notebookcheck工作站笔记本电脑Top 10排名
» Notebookcheck亚笔记本电脑Top 10排名
» Notebookcheck超级本产品Top 10排名
» Notebookcheck变形本产品Top 10排名
» Notebookcheck平板电脑Top 10排名
» Notebookcheck智能手机Top 10排名
» Notebookcheck评测过最出色的笔记本电脑屏幕
» Notebookcheck售价500欧元以下笔记本电脑Top 10排名
» Notebookcheck售价300欧元以下笔记本电脑Top 10排名