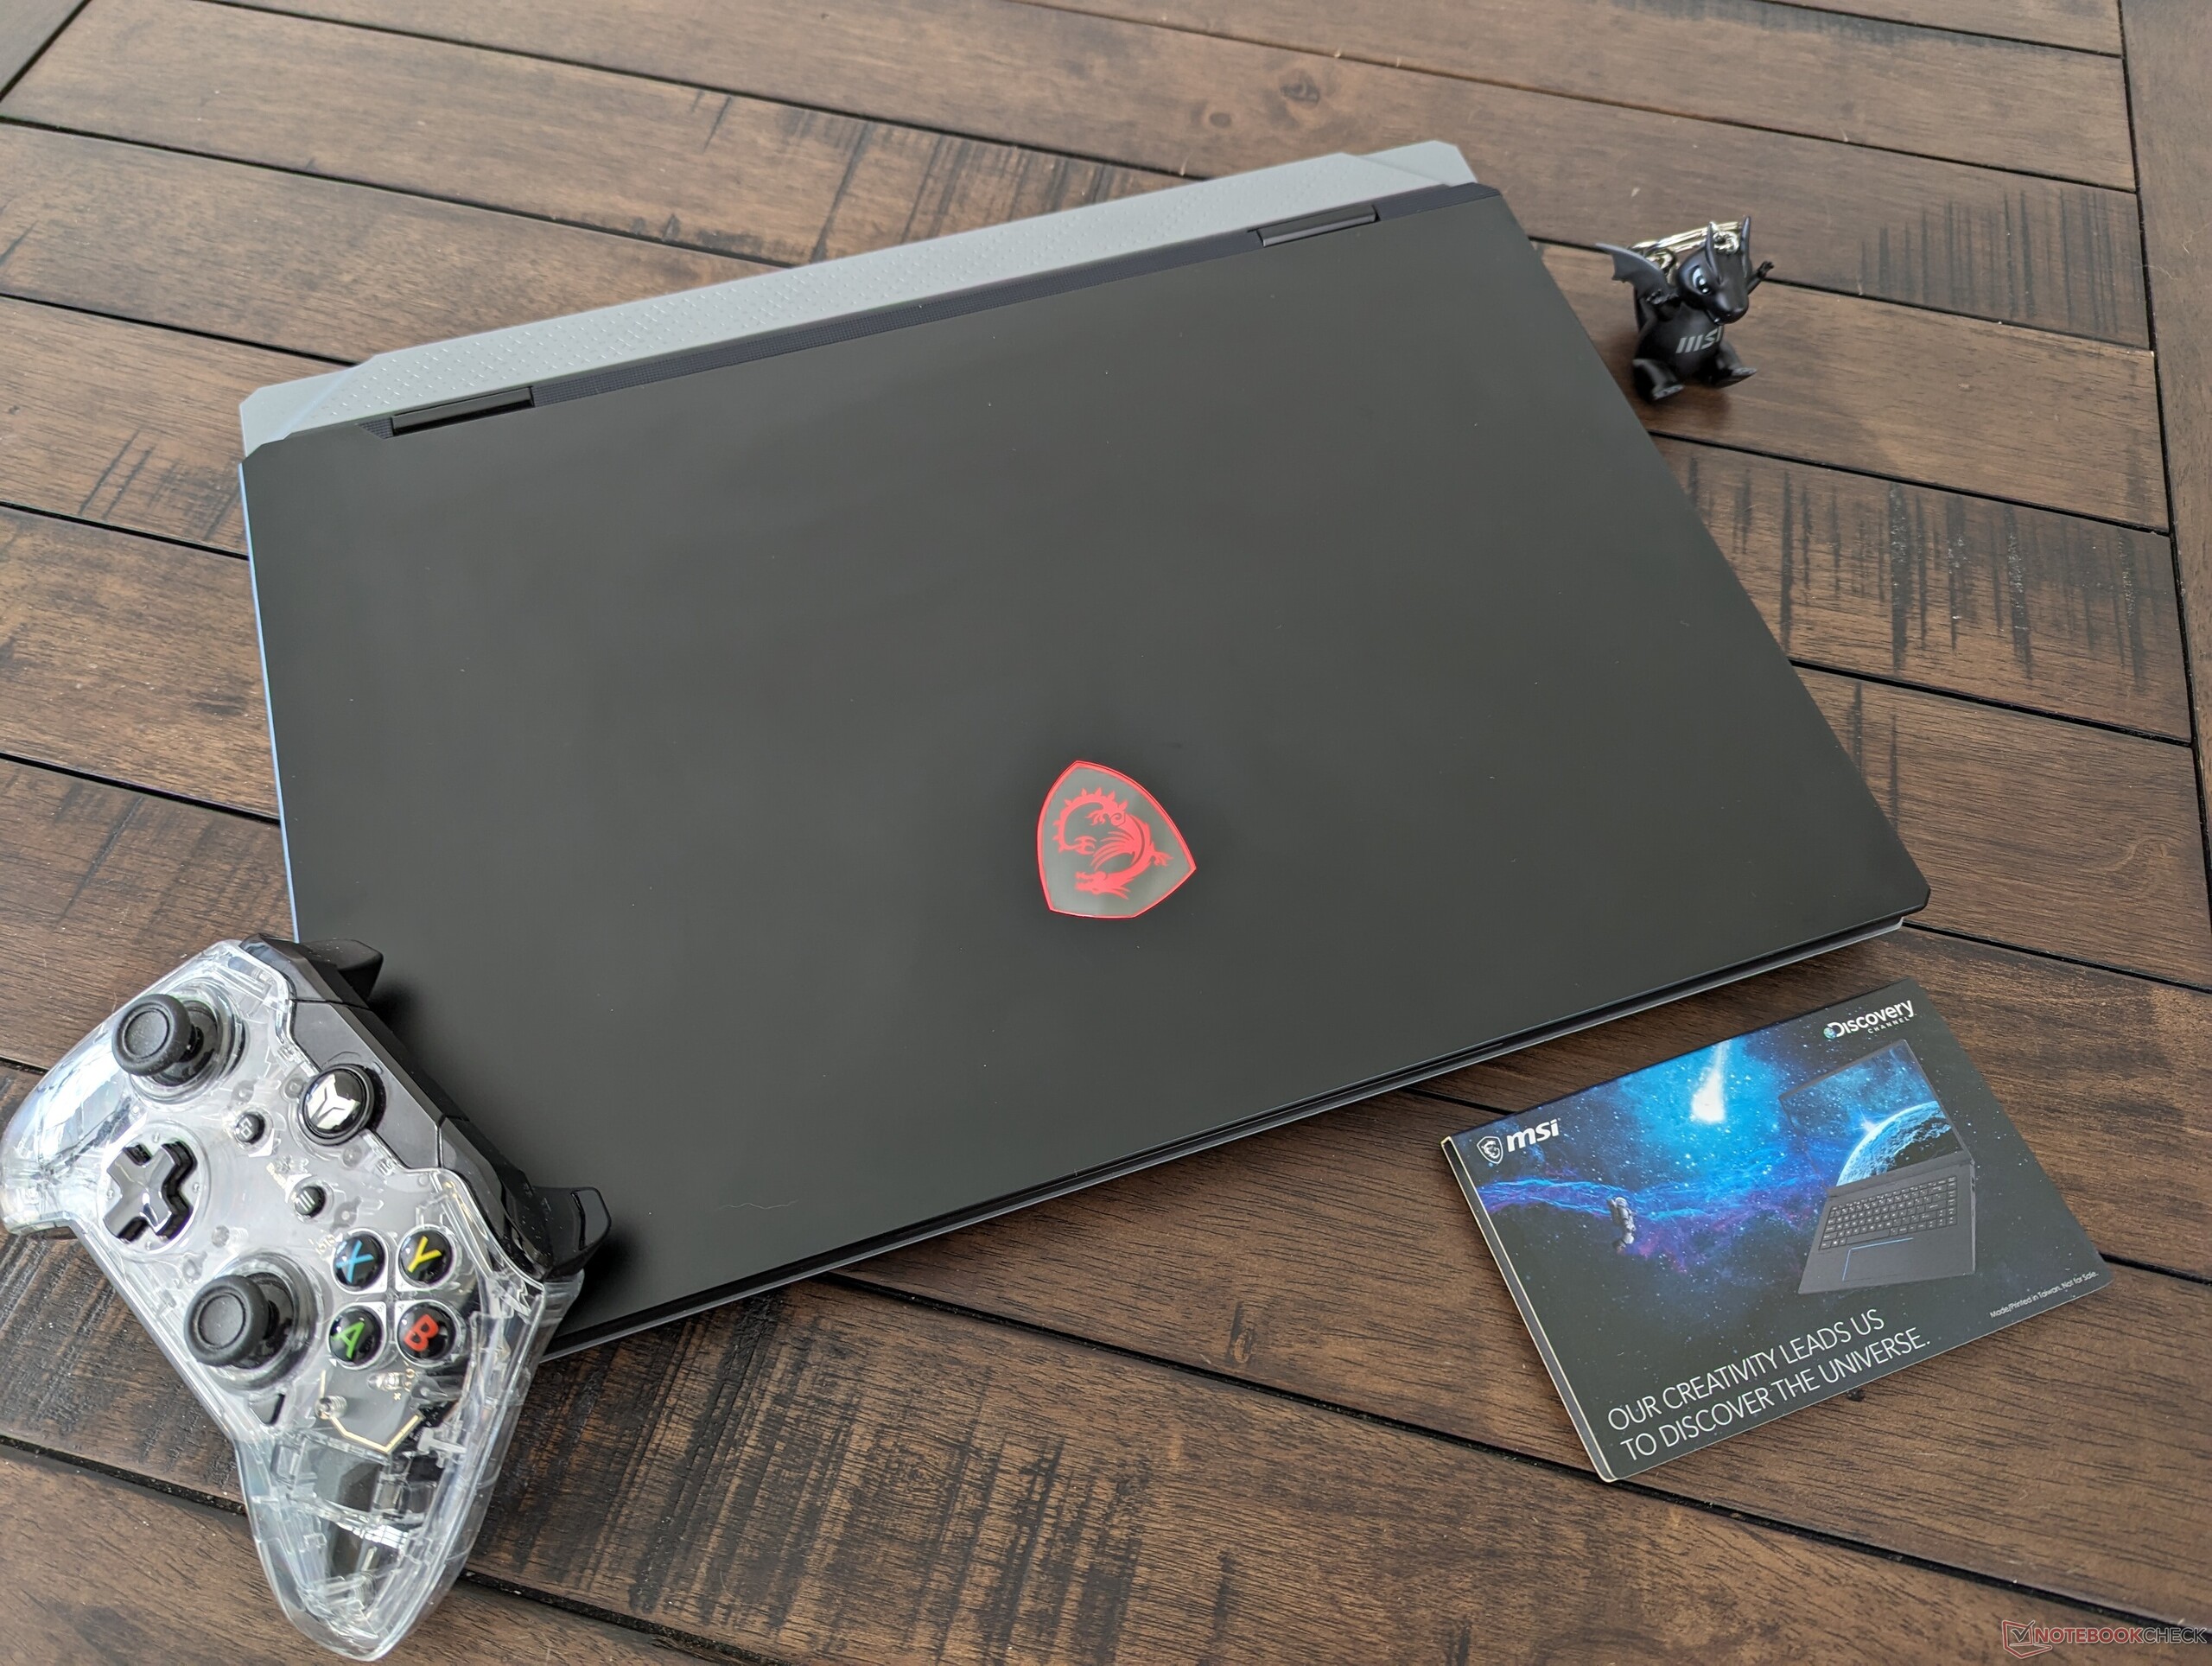
微星 Titan 18 HX A14VIG 笔记本电脑评测:龙年

在 2023 年的 CES 上,我们曾质问微星为什么没有推出 18 英寸游戏笔记本电脑,而华硕、Alienware 和雷蛇都推出了各自的 18 英寸产品。直到 2024 年的 CES 展上,我们终于看到了微星正式推出的 18 英寸机型 Titan 18 HX。这款产品的推出可能有点晚,但其规格和硬件同样具有竞争力。
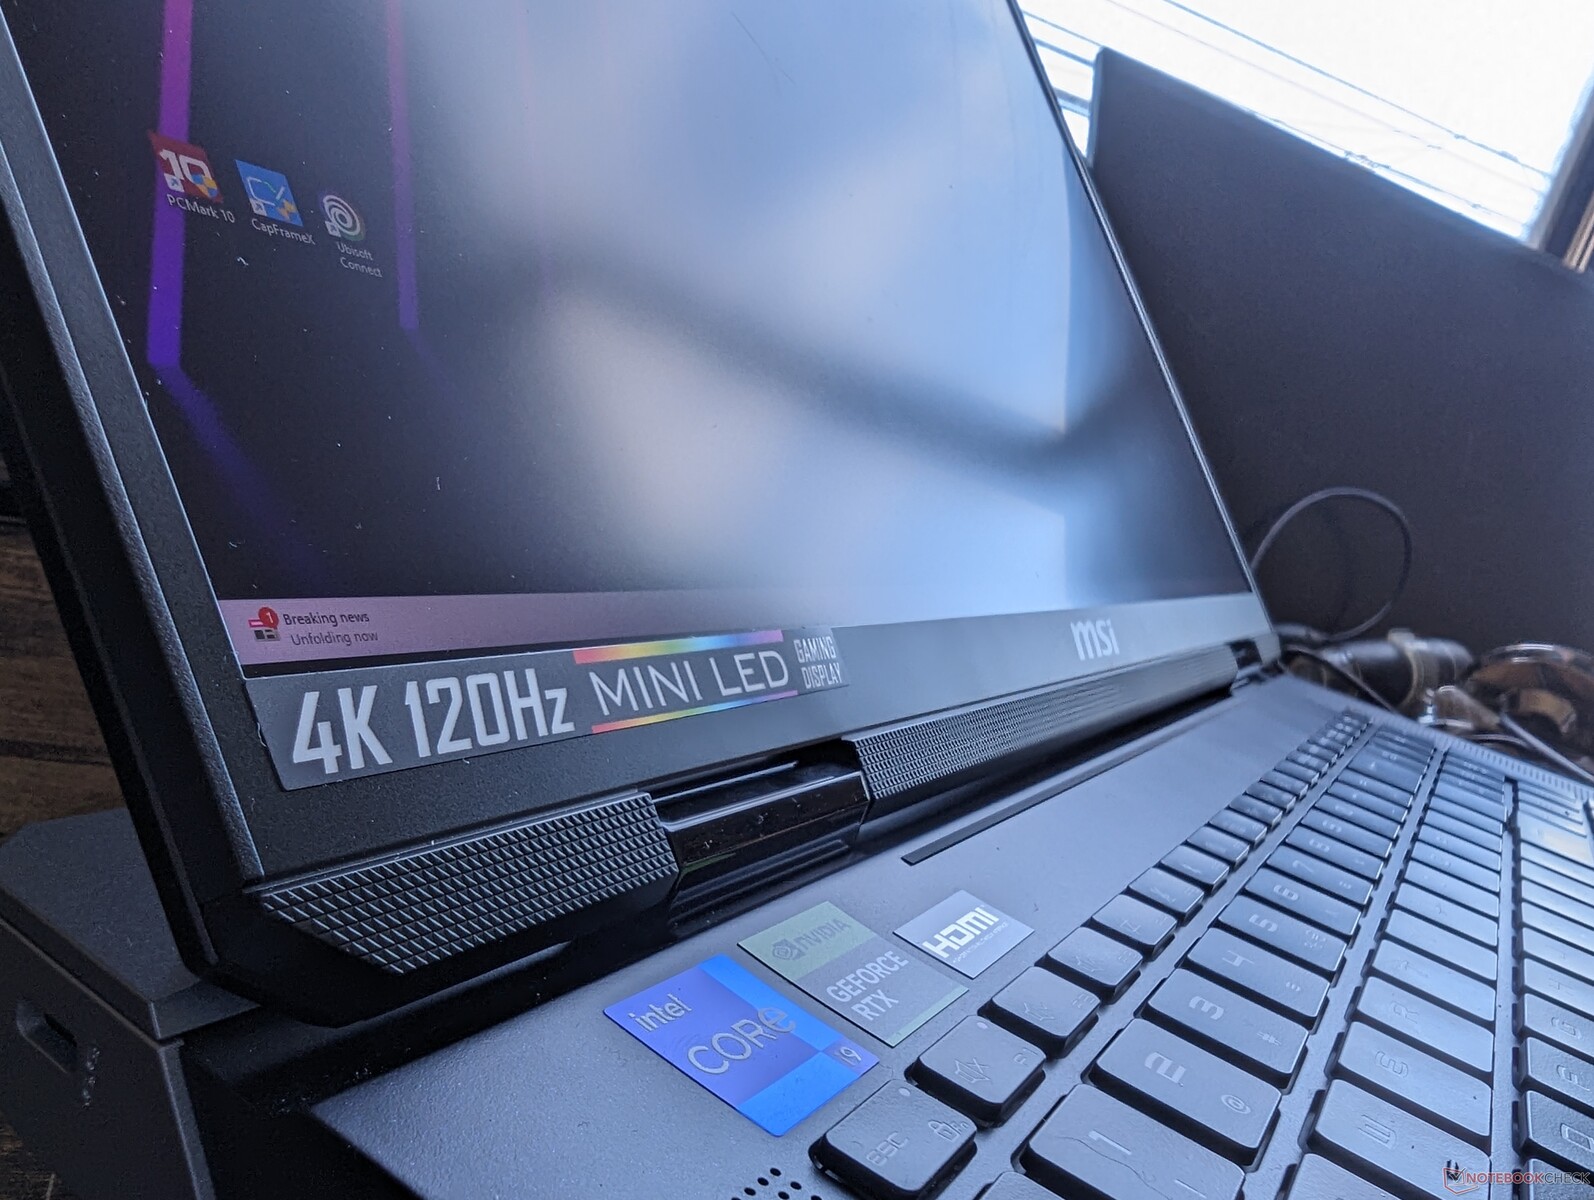
我们的评测配置配备了全新的第 14 代英特尔猛禽湖酷睿 i9-14900HX CPU、175 WGeForce RTX 4090 GPU 和 120 Hz Mini-LED 4K (2400p) 显示屏,售价约为 4999 美元。在撰写本文时,还没有配备不同 CPU、GPU 或显示器的更低配置。
泰坦 18 HX 的替代产品包括其他 18 英寸游戏笔记本电脑,如 华硕 ROG Strix G18, Alienware m18, 雷蛇刀锋 18或 宏碁掠夺者 Helios 18.
更多微星评论:
潜在的竞争对手比较
Rating | Date | Model | Weight | Height | Size | Resolution | Price |
|---|---|---|---|---|---|---|---|
| 88.8 % v7 (old) | 01 / 2024 | MSI Titan 18 HX A14VIG i9-14900HX, GeForce RTX 4090 Laptop GPU | 3.6 kg | 32.1 mm | 18.00" | 3840x2400 | |
| 89 % v7 (old) | 02 / 2023 | MSI Titan GT77 HX 13VI i9-13950HX, GeForce RTX 4090 Laptop GPU | 3.5 kg | 23 mm | 17.30" | 3840x2160 | |
| 90.7 % v7 (old) | 04 / 2023 | Alienware m18 R1 i9-13980HX, GeForce RTX 4090 Laptop GPU | 3.9 kg | 26.7 mm | 18.00" | 1920x1200 | |
| 87.4 % v7 (old) | 03 / 2023 | Asus ROG Strix G18 G814JI i7-13650HX, GeForce RTX 4070 Laptop GPU | 3 kg | 31 mm | 18.00" | 2560x1600 | |
| 88.3 % v7 (old) | 10 / 2023 | Acer Predator Helios 18 N23Q2 i9-13900HX, GeForce RTX 4080 Laptop GPU | 3.2 kg | 29.15 mm | 18.00" | 2560x1600 | |
| 91.4 % v7 (old) | 02 / 2023 | Razer Blade 18 RTX 4070 i9-13950HX, GeForce RTX 4070 Laptop GPU | 3 kg | 21.9 mm | 18.00" | 2560x1600 |
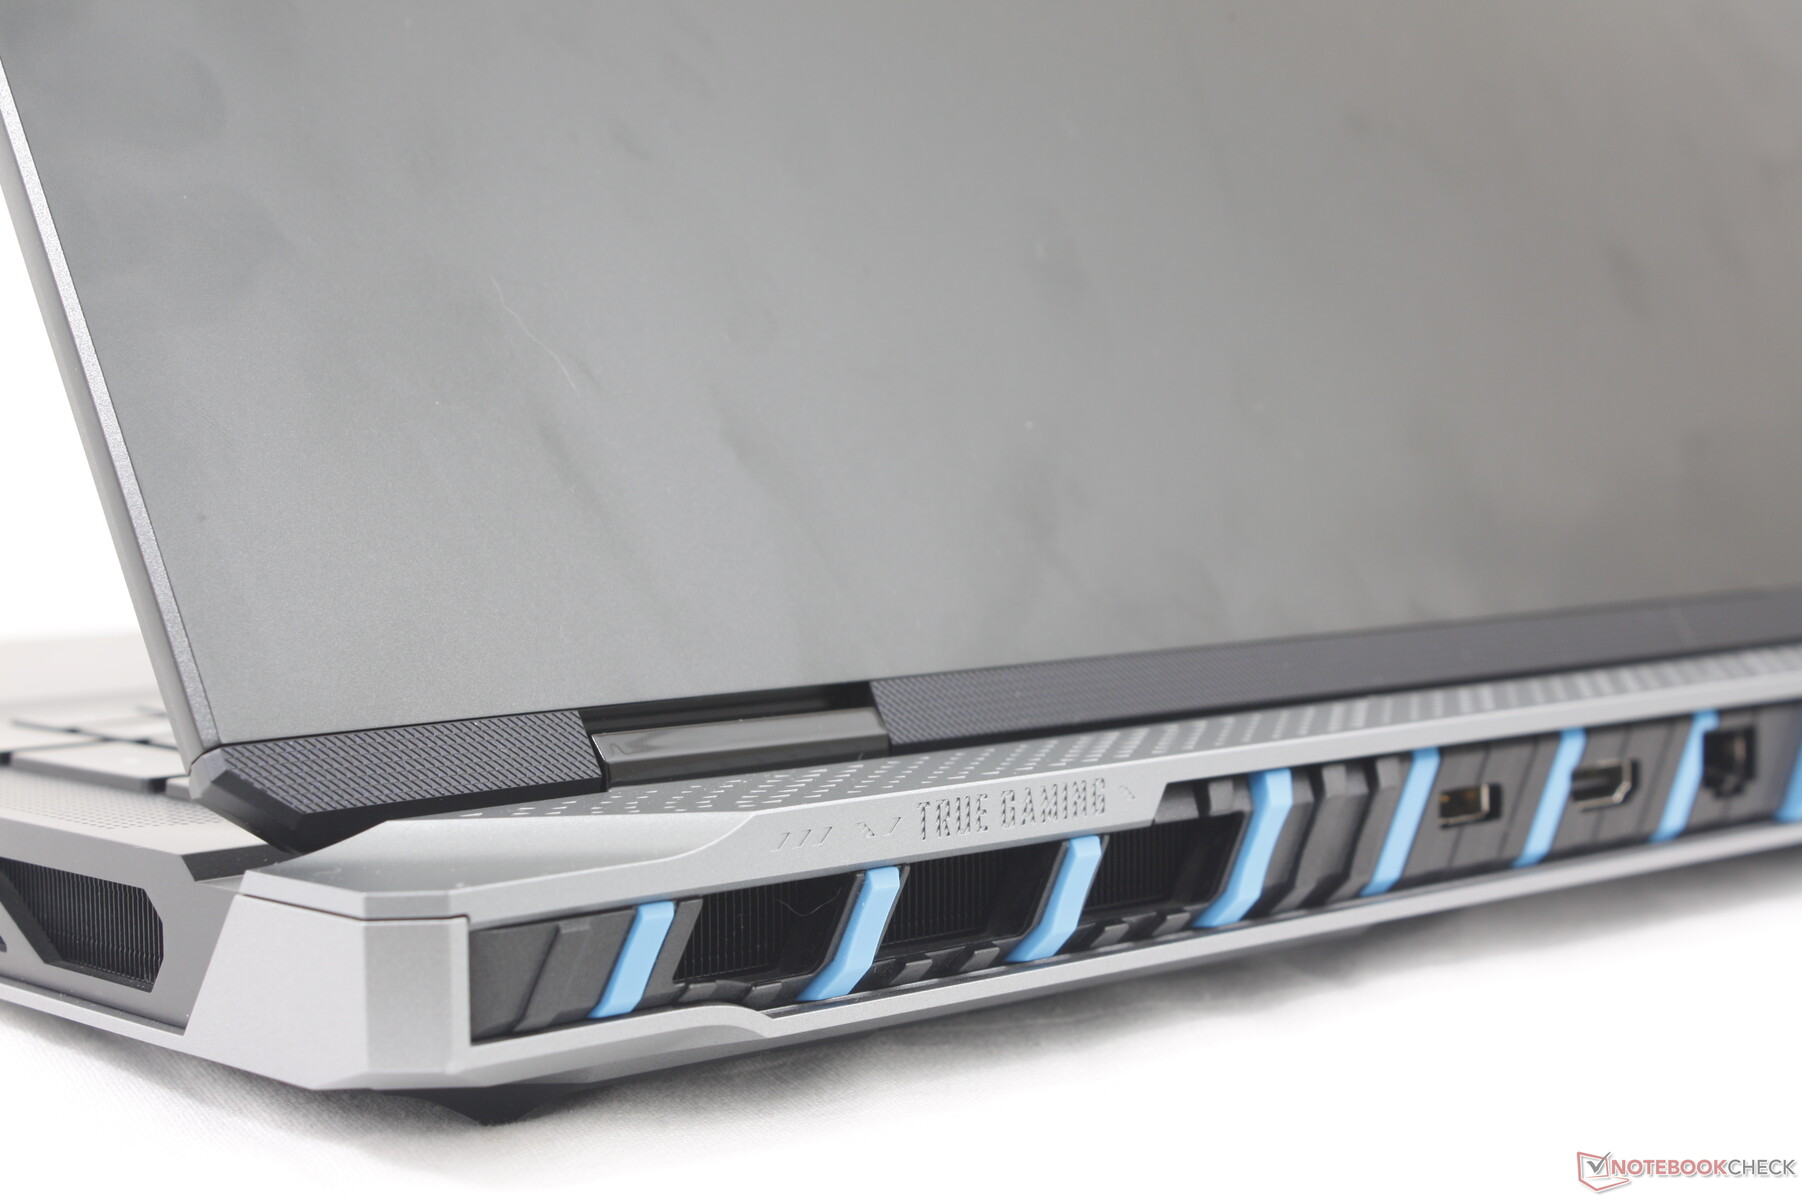
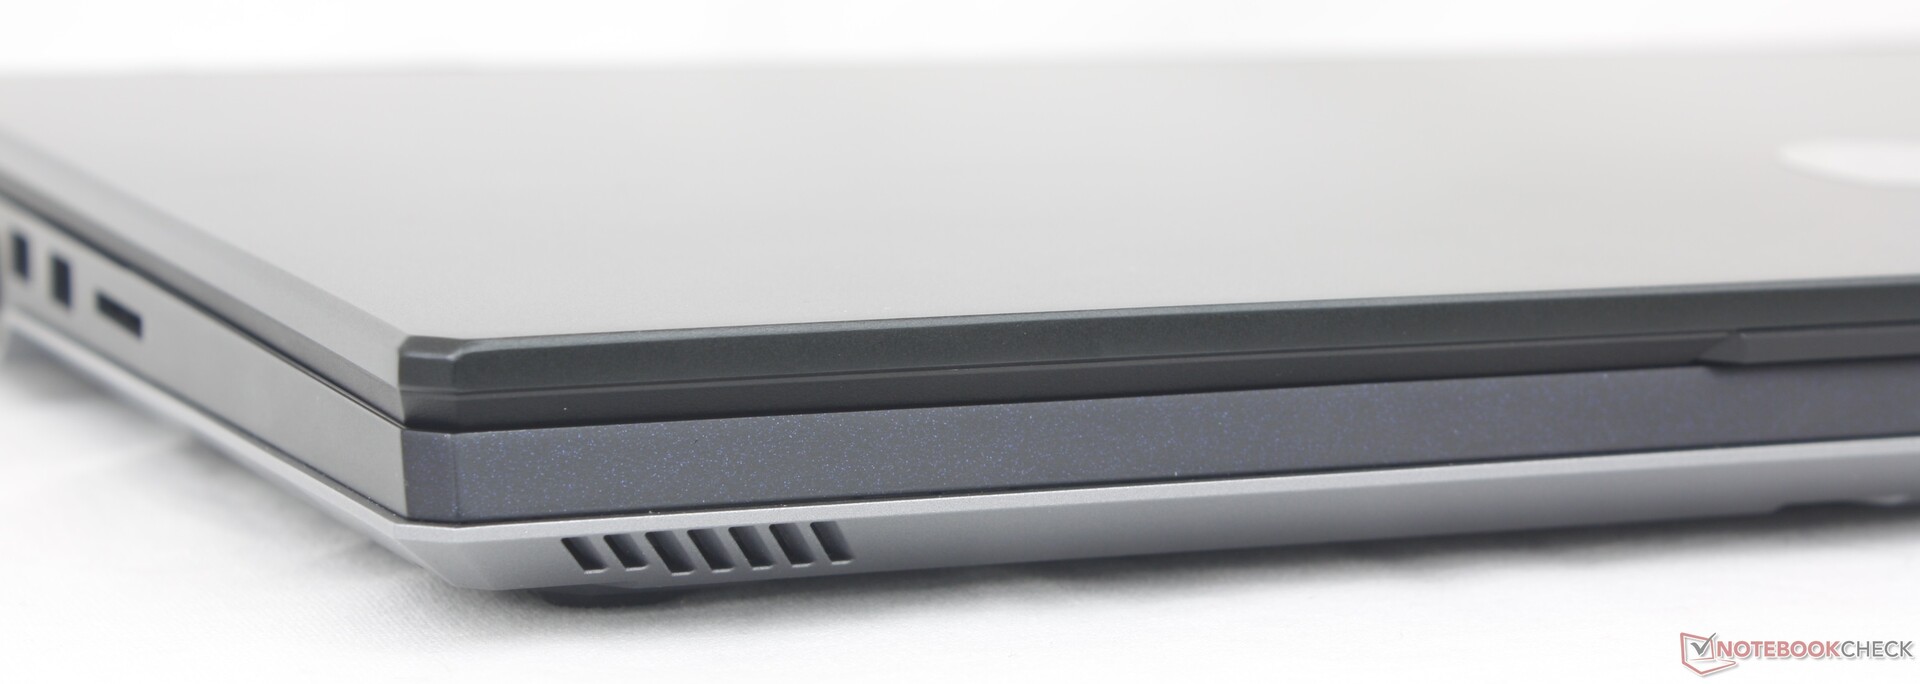
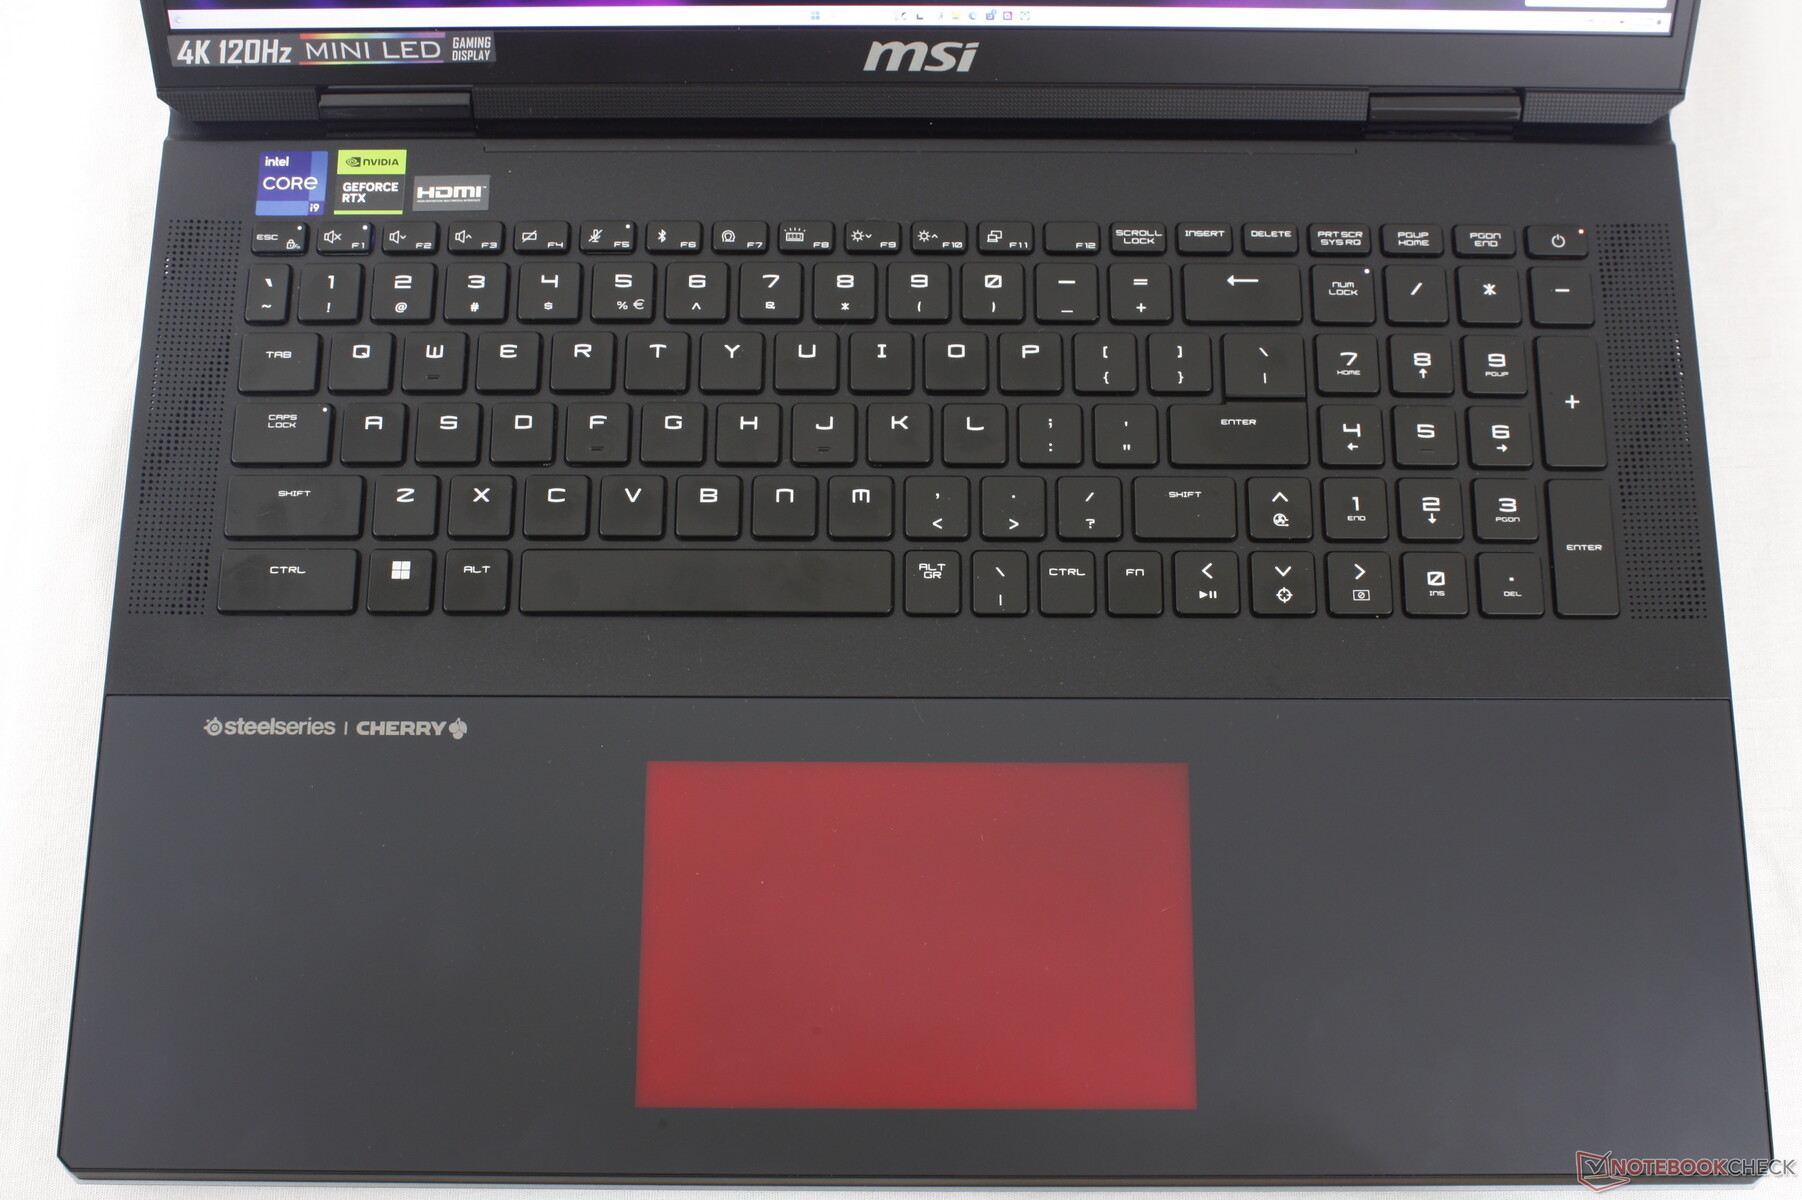
外壳 - 更少的 RGB LED
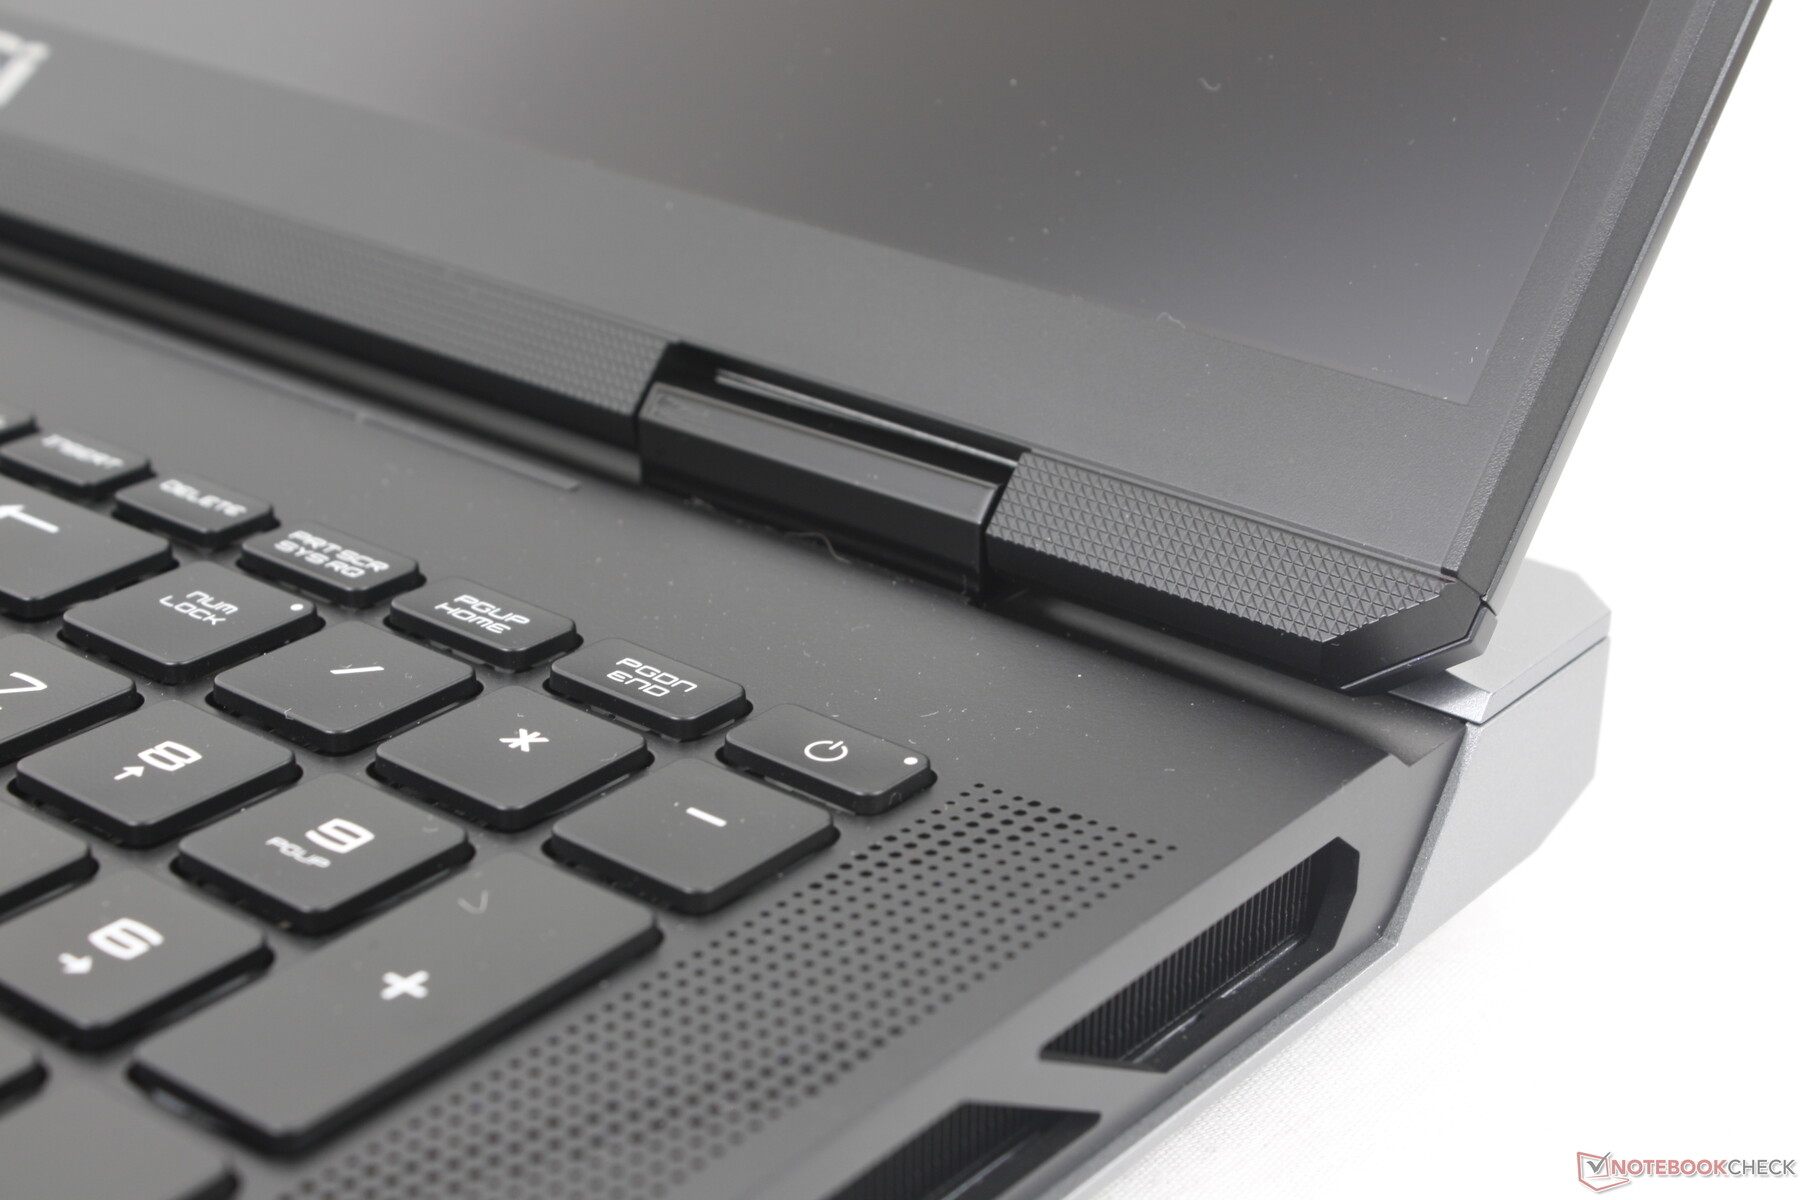
新底盘是泰坦 GT77 的进化版,而不是更炫目、更复古的 GE78。与 GT77 相比,Titan 18 增加了银色和蓝色双色,与原本漆黑的外观相得益彰。微星还取消了机身后部的 LED 灯条,从而避免了 "不必要的 "RGB 灯光。
Titan 18 最容易辨认的地方可能是延伸至掌托和点击板的平板玻璃。因此,点击板与掌托齐平,并配有 RGB 灯光效果。最终的结果是设计更加圆滑流畅,同时仍保留了高端玩家的美感。
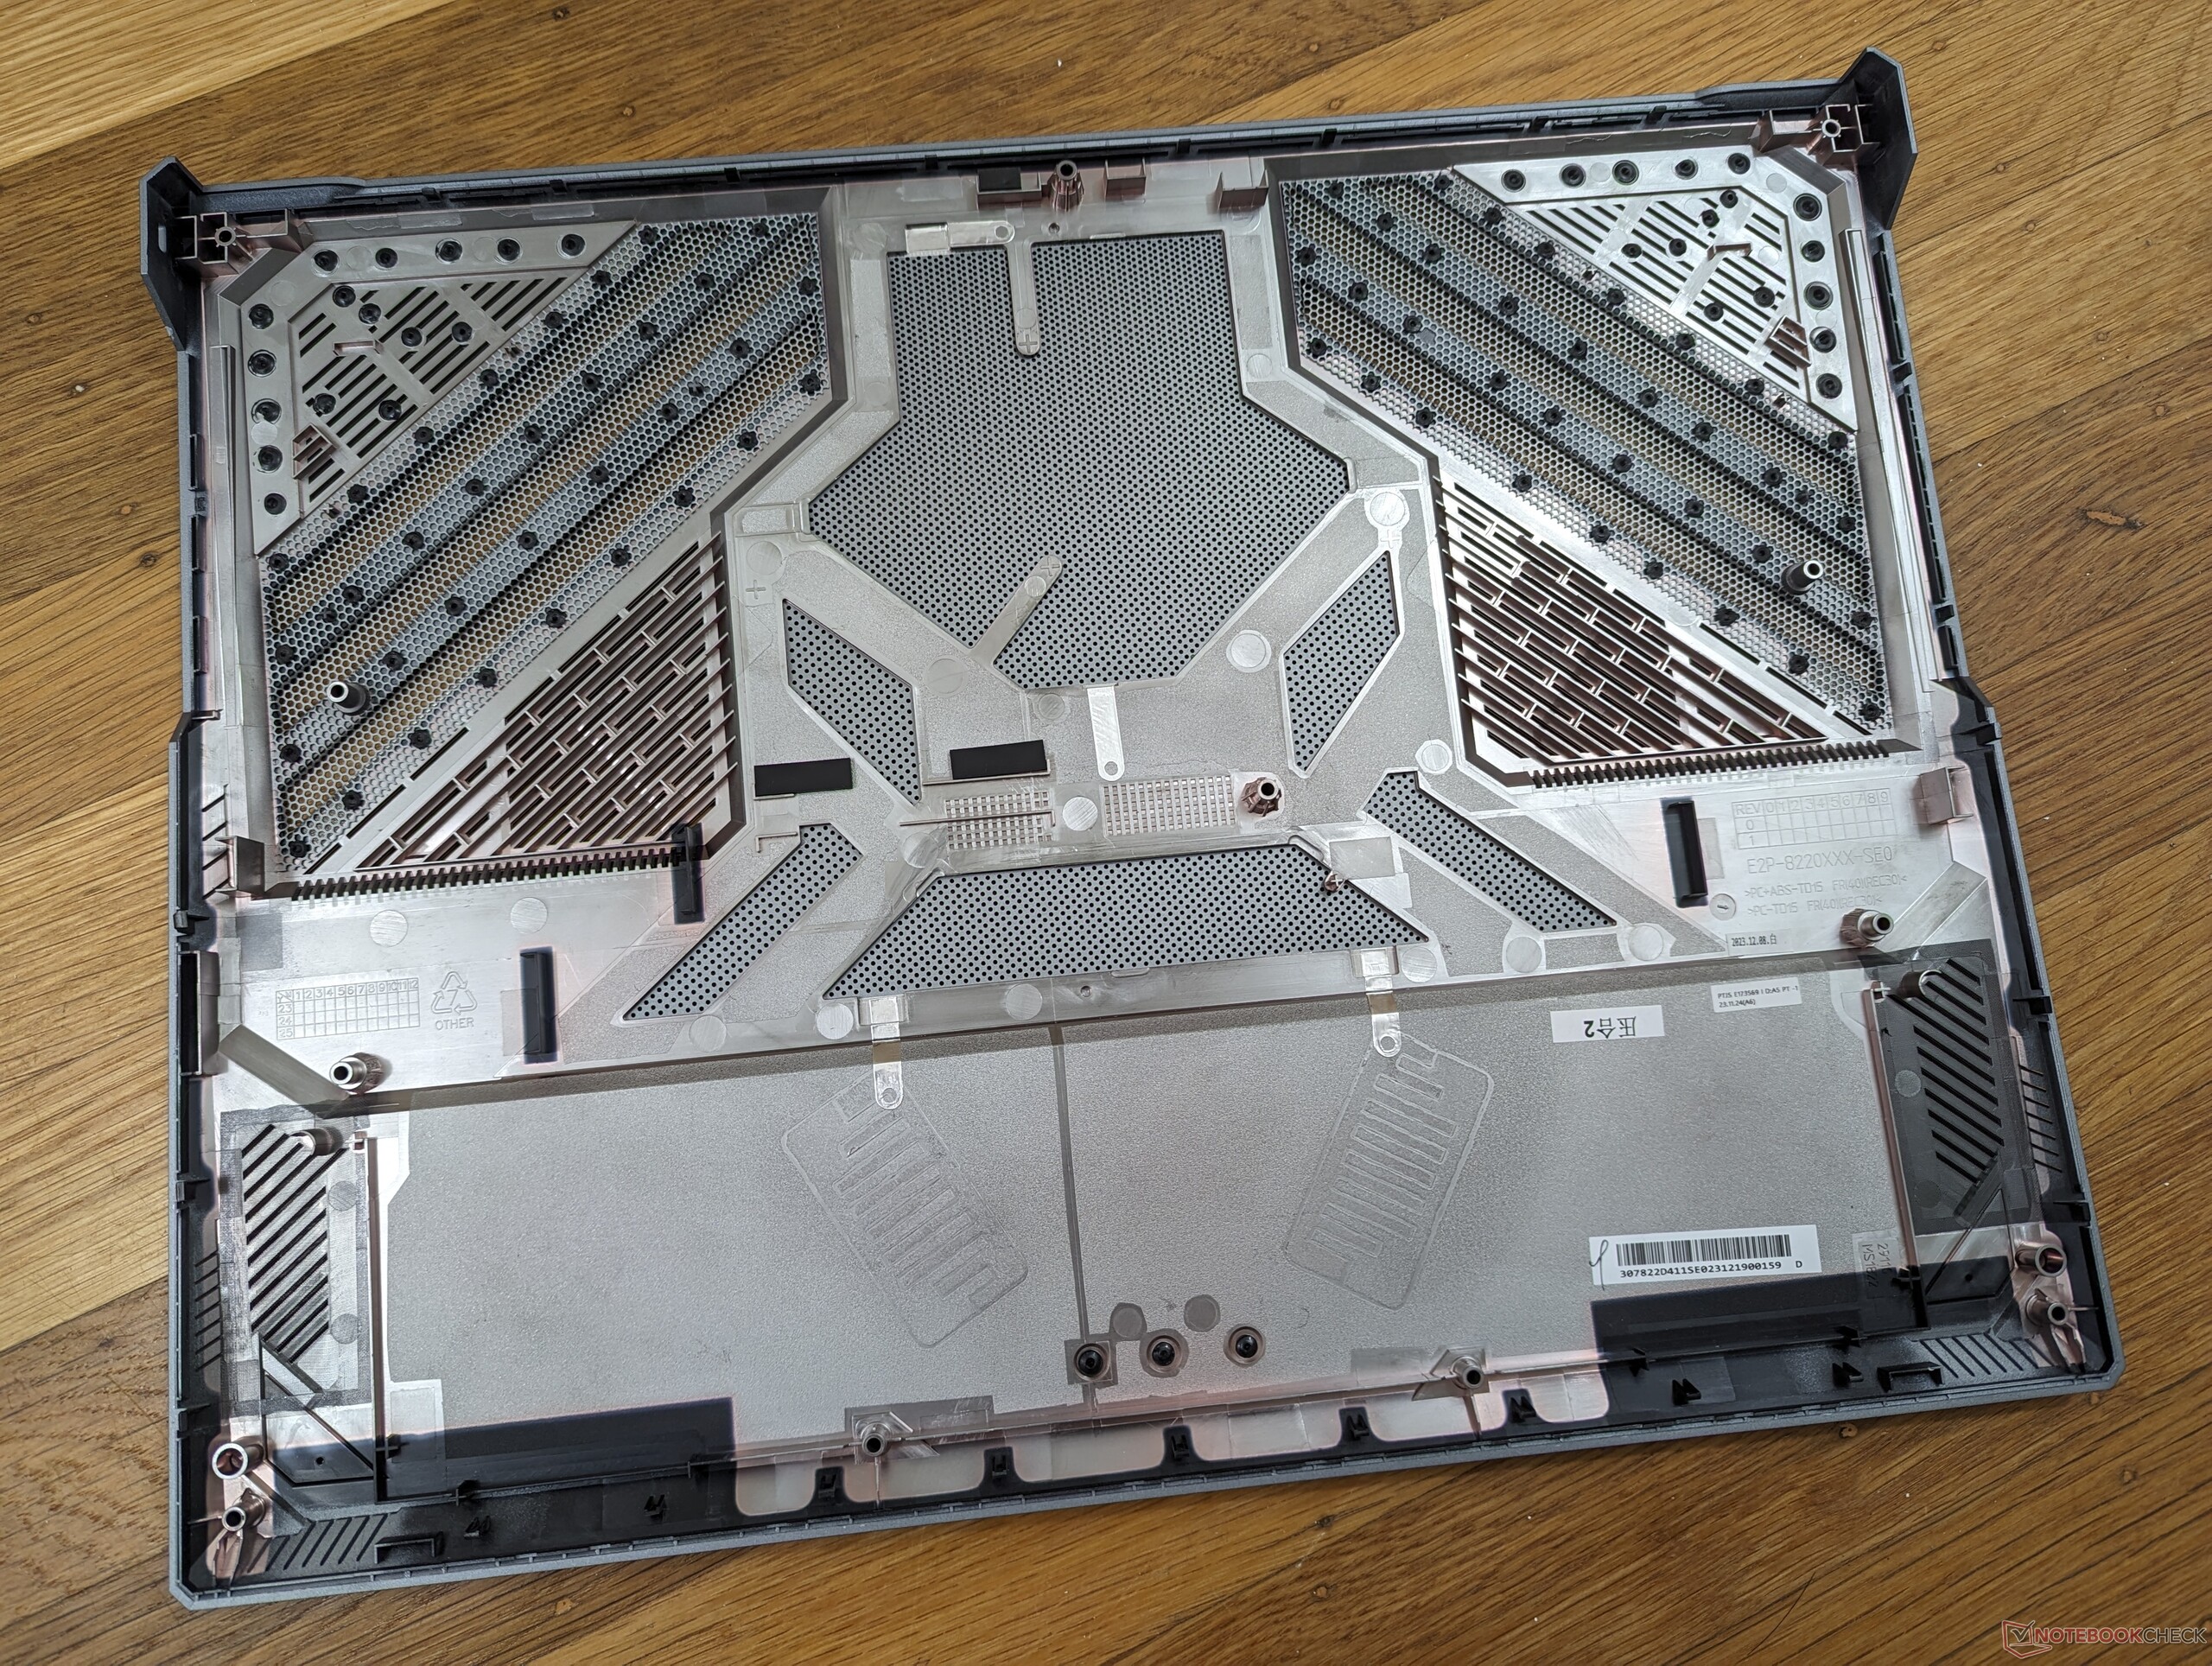
镁铝合金底盘的刚性非常出色,只有在按下键盘中心时才会出现轻微的翘曲。与微星廉价机型(如 Cyborg 或 卡塔纳.不过,铰链本可以更坚固一些,以获得更好的耐用性,而且整个系统就是一块巨大的指纹磁铁。
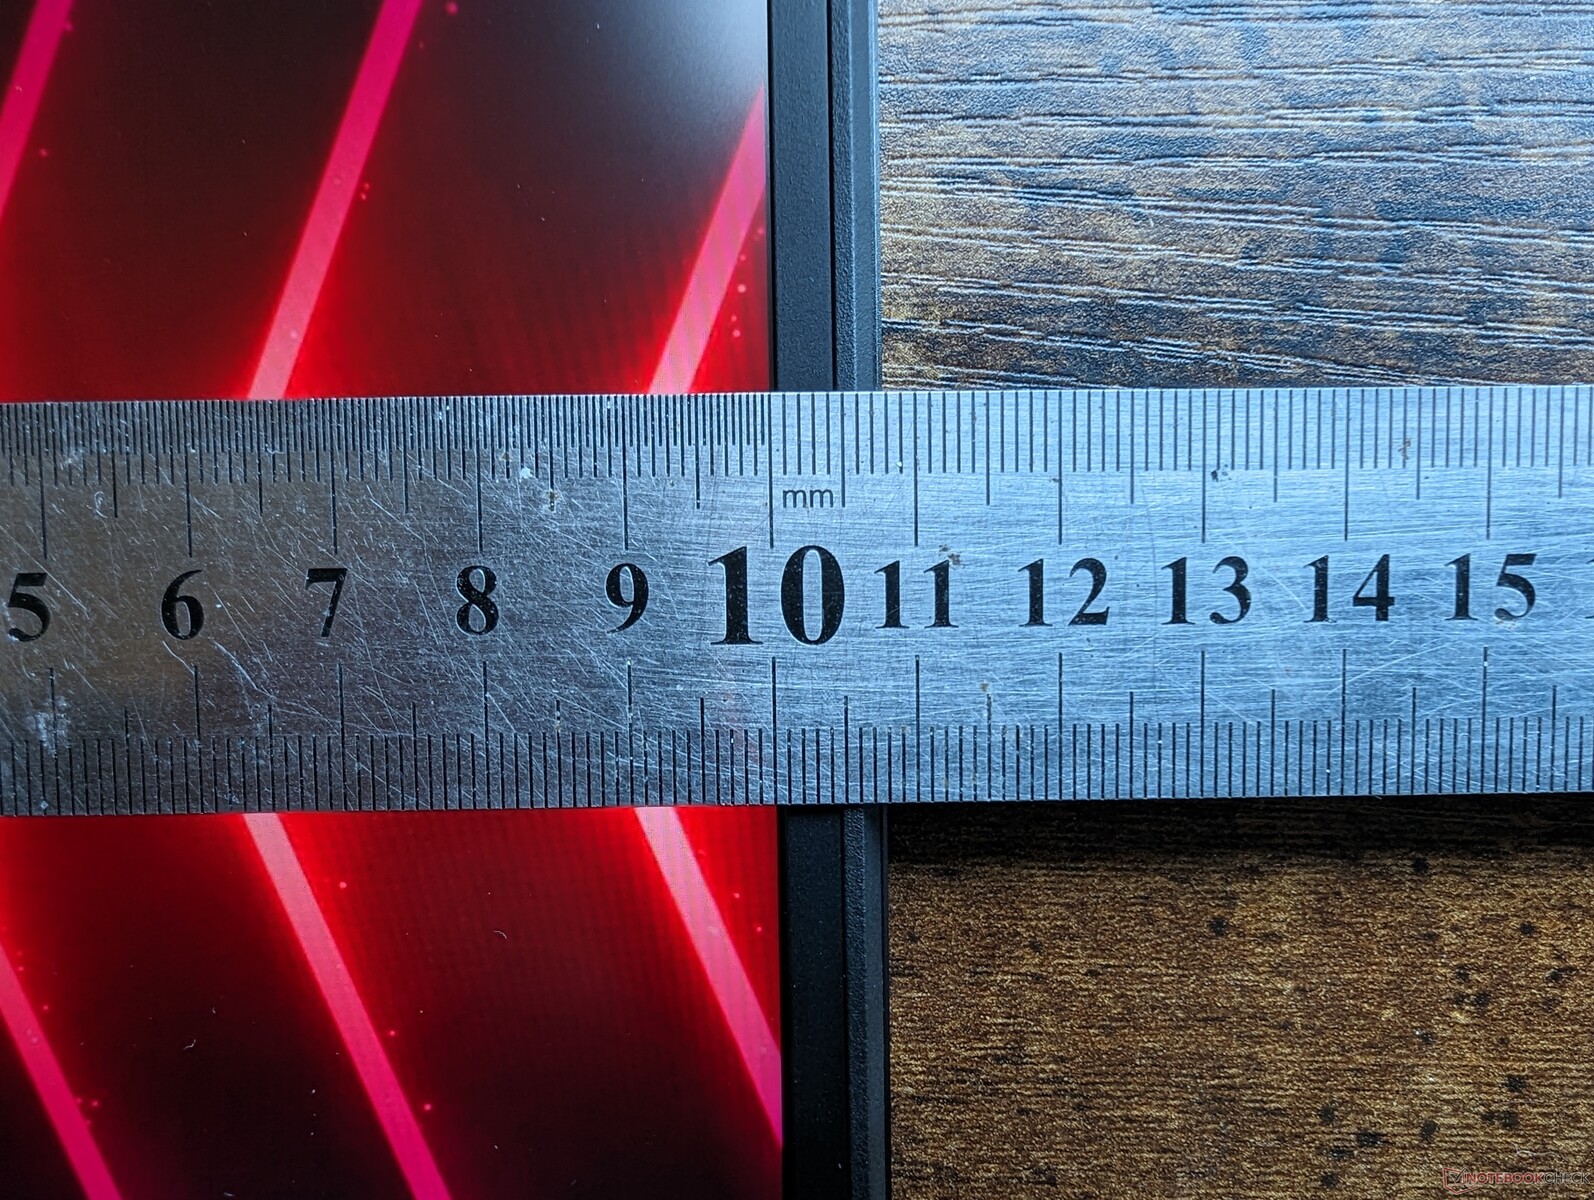
值得注意的是,16:10 的 18 英寸 Titan 18 HX 比 16:9 的 17.3 英寸 泰坦 GT77更短的车尾。不过,新款机型的厚度明显增加了近 10 毫米,成为目前最厚的 18 英寸游戏笔记本电脑之一。它不一定是最重的,因为这一桂冠属于 Alienware m18 R1,但它仍明显比华硕 ROG Strix G18 或 Razer Blade 18 各重 500 多克。
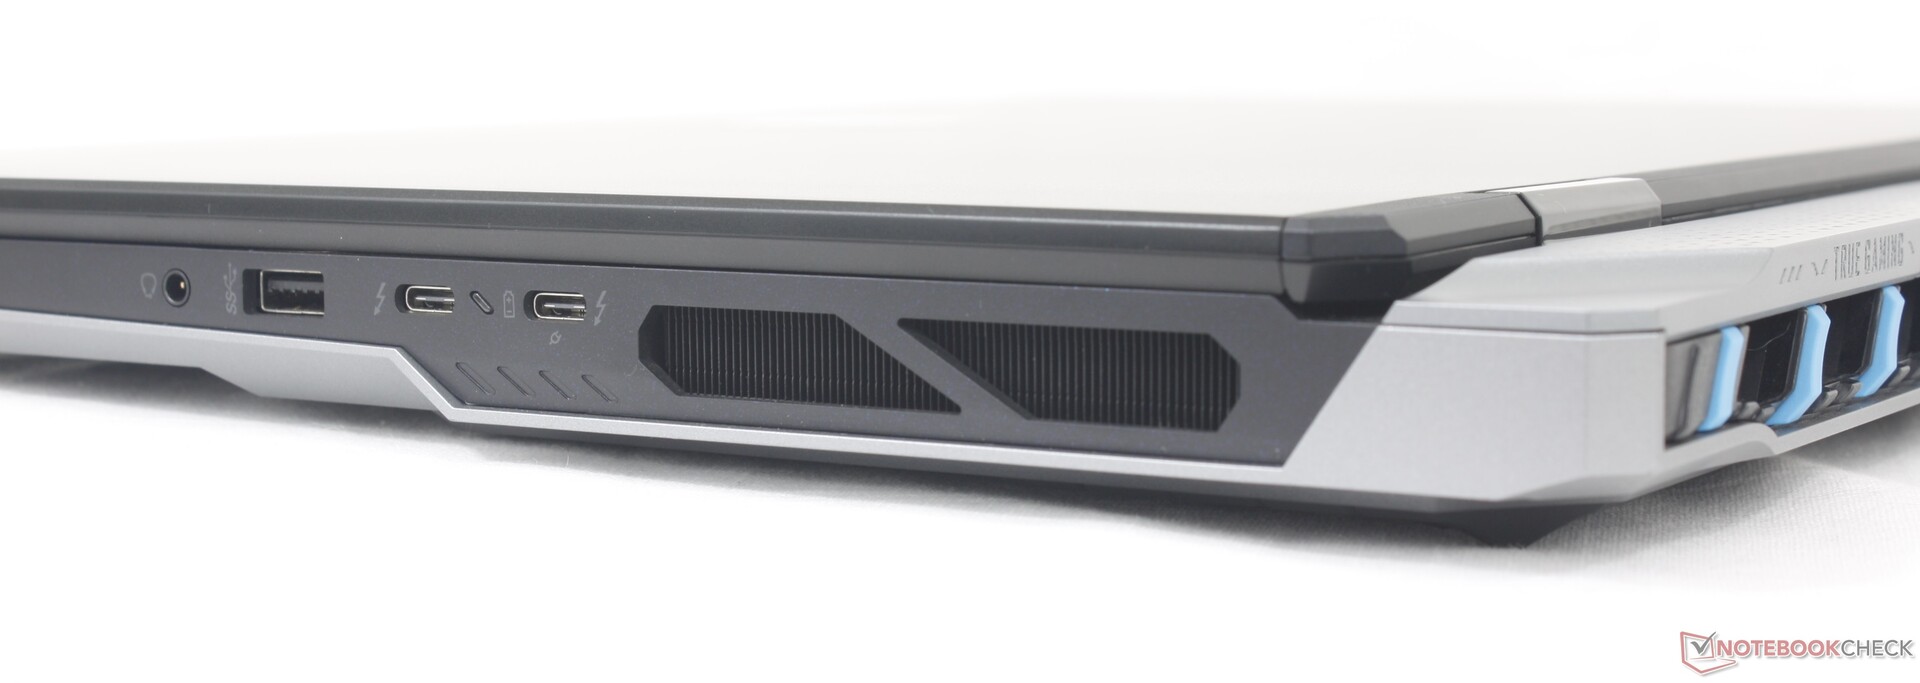
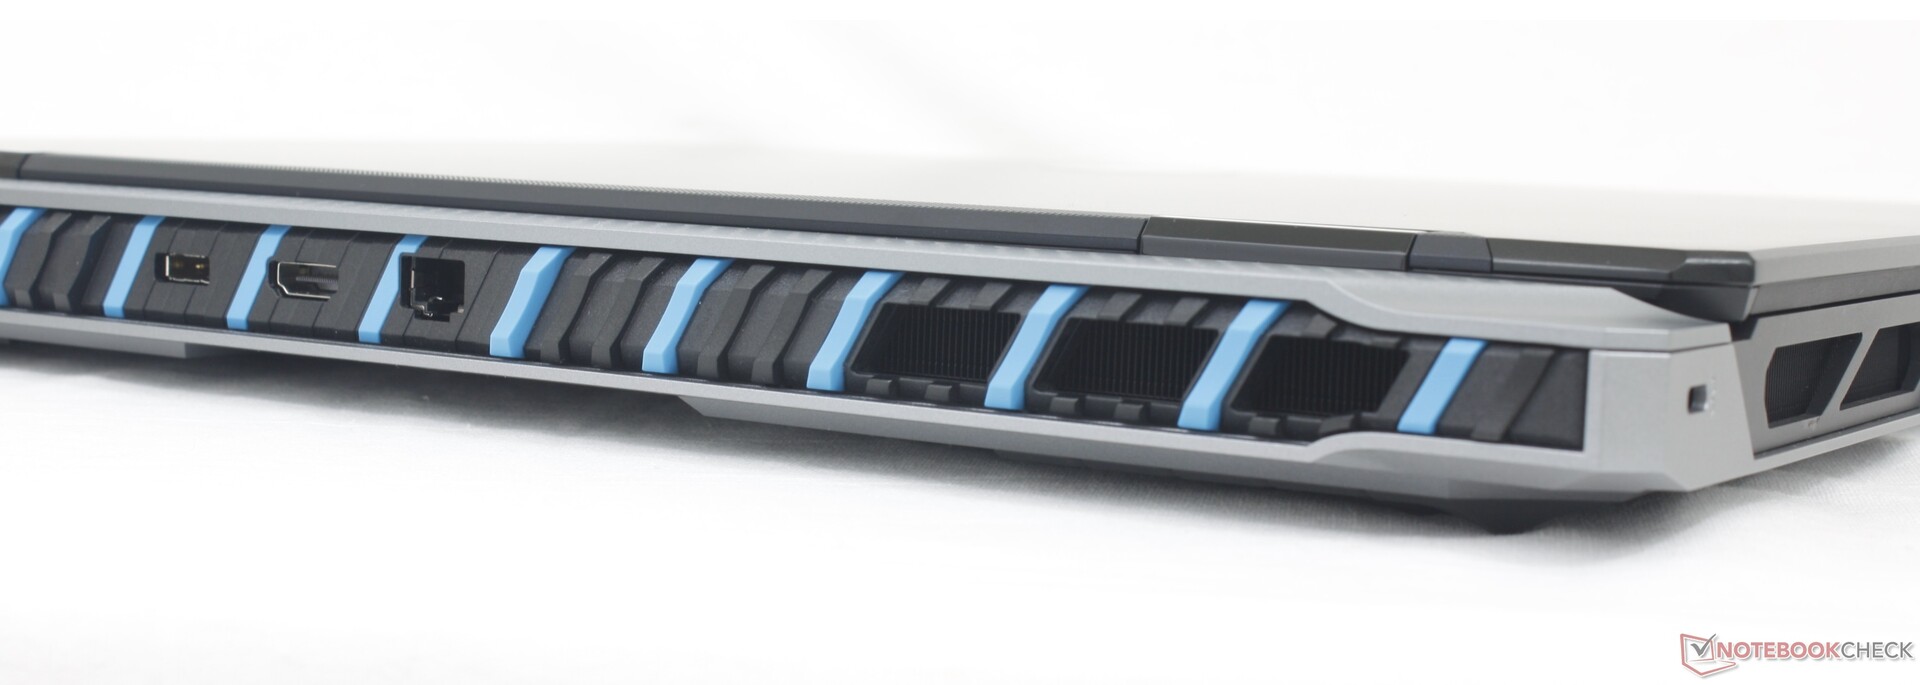
连接性
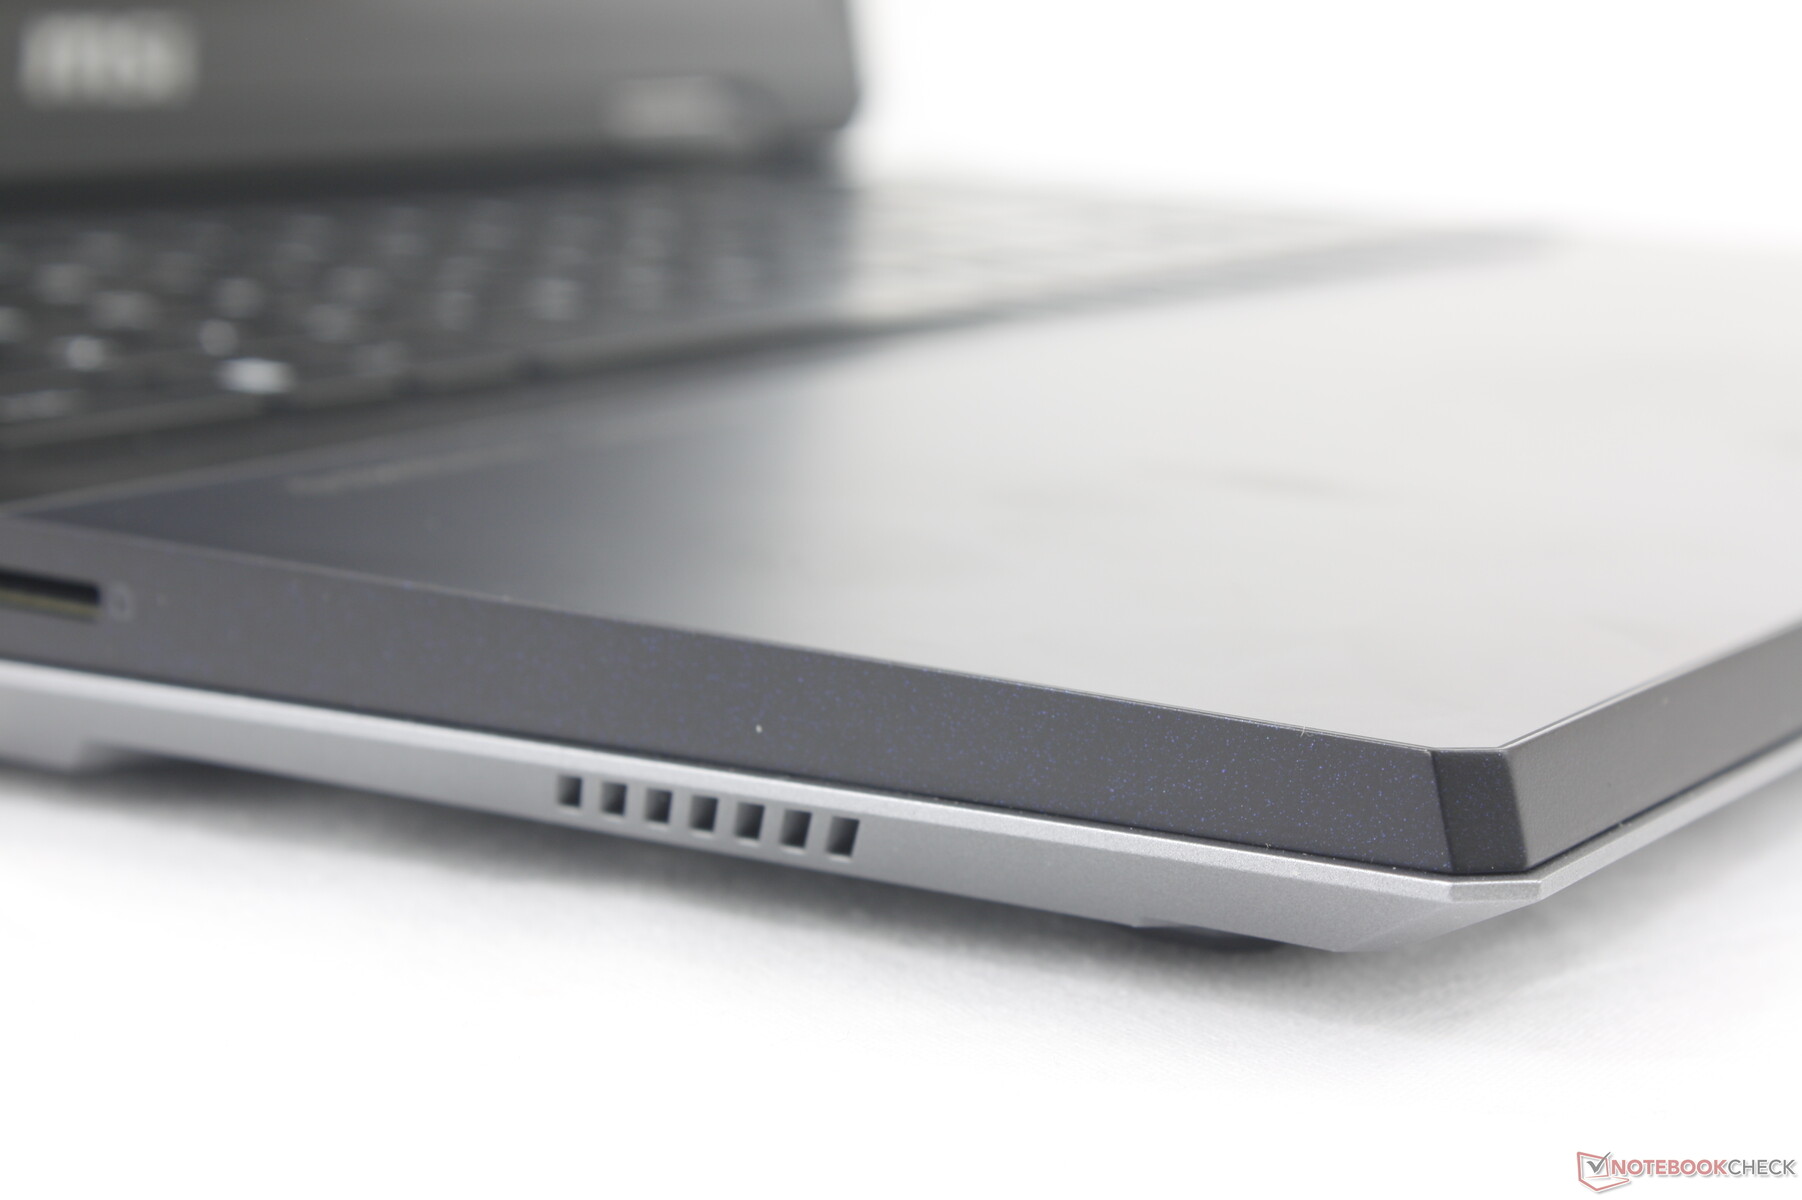
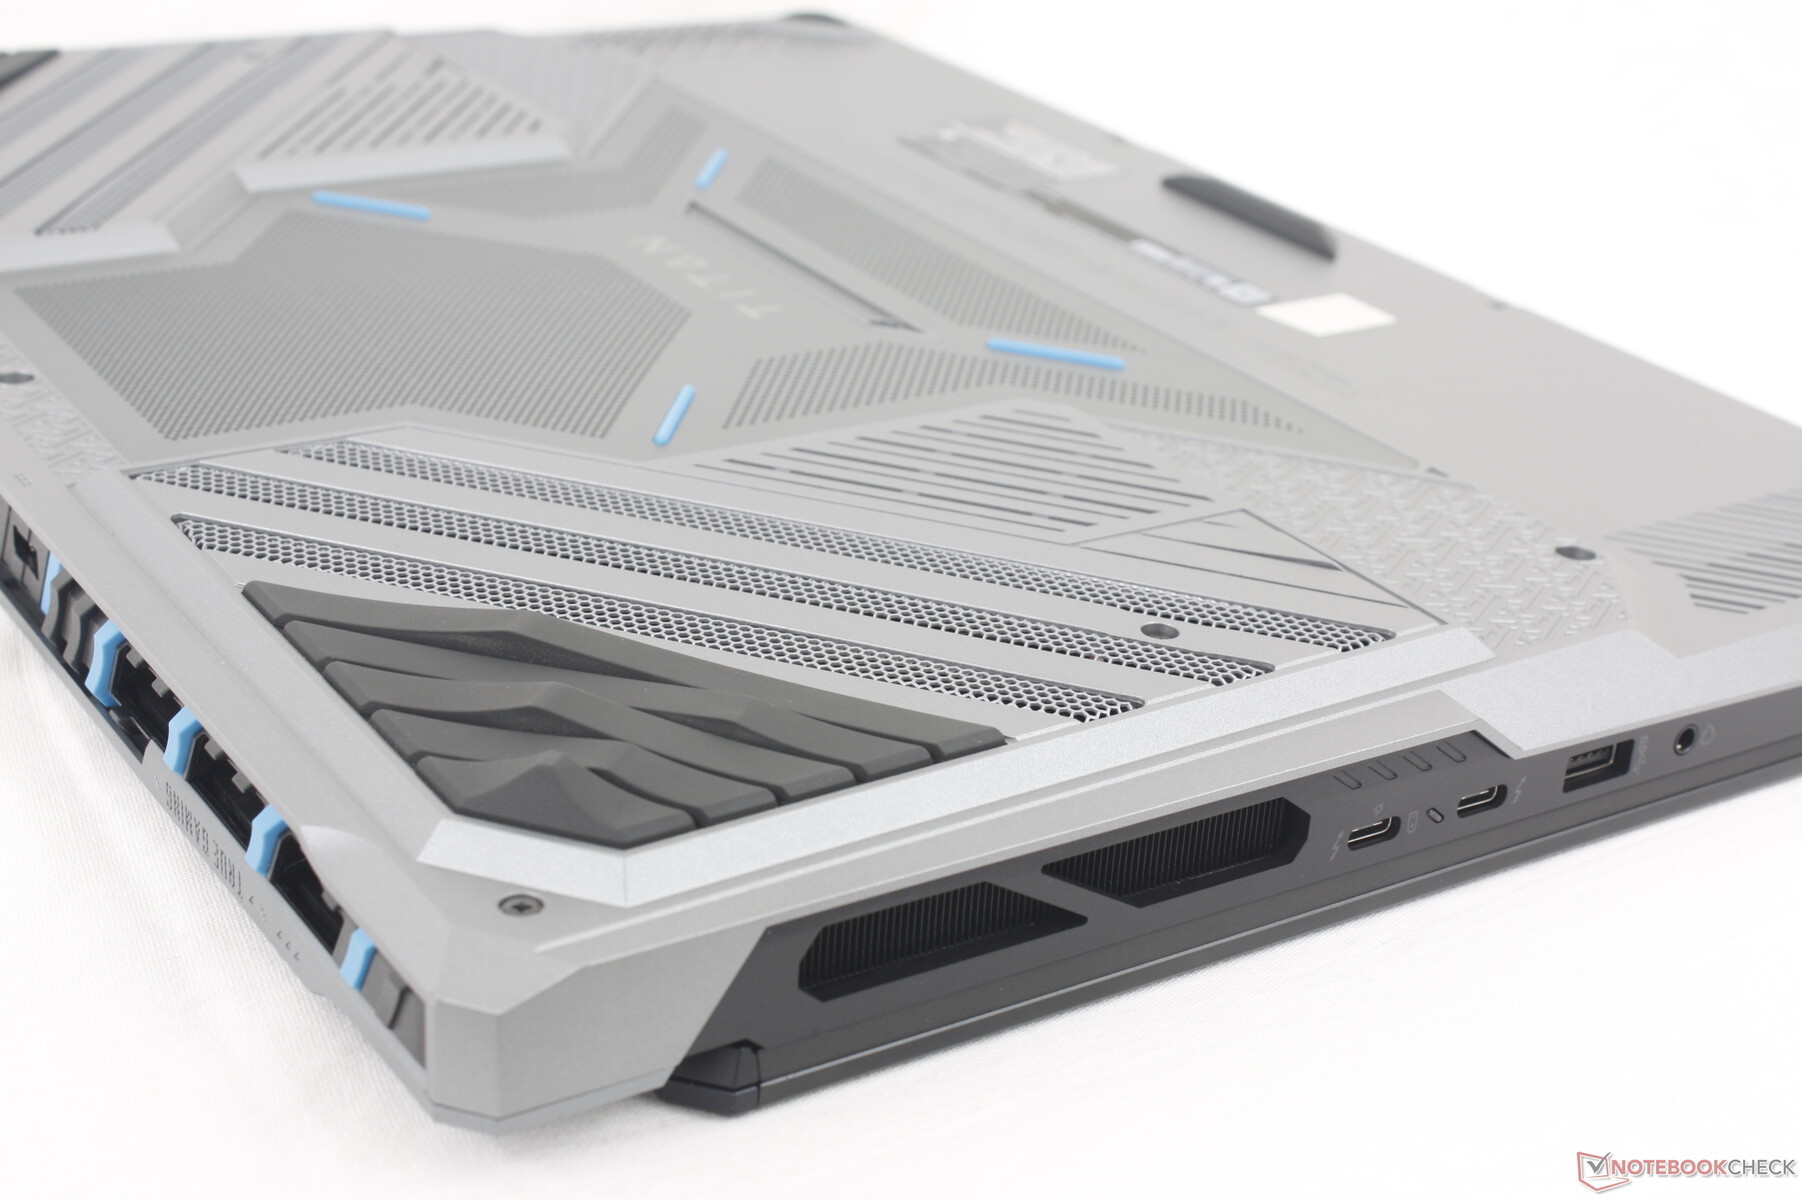
除了专用的迷你 DisplayPort 外,微星还恢复了去年 GT77 的所有端口。最明显的是,为了减少杂乱无章的端口,微星还在机身后部重新布置了端口。相比之下,GT77 上的端口都紧挨着左右边缘。
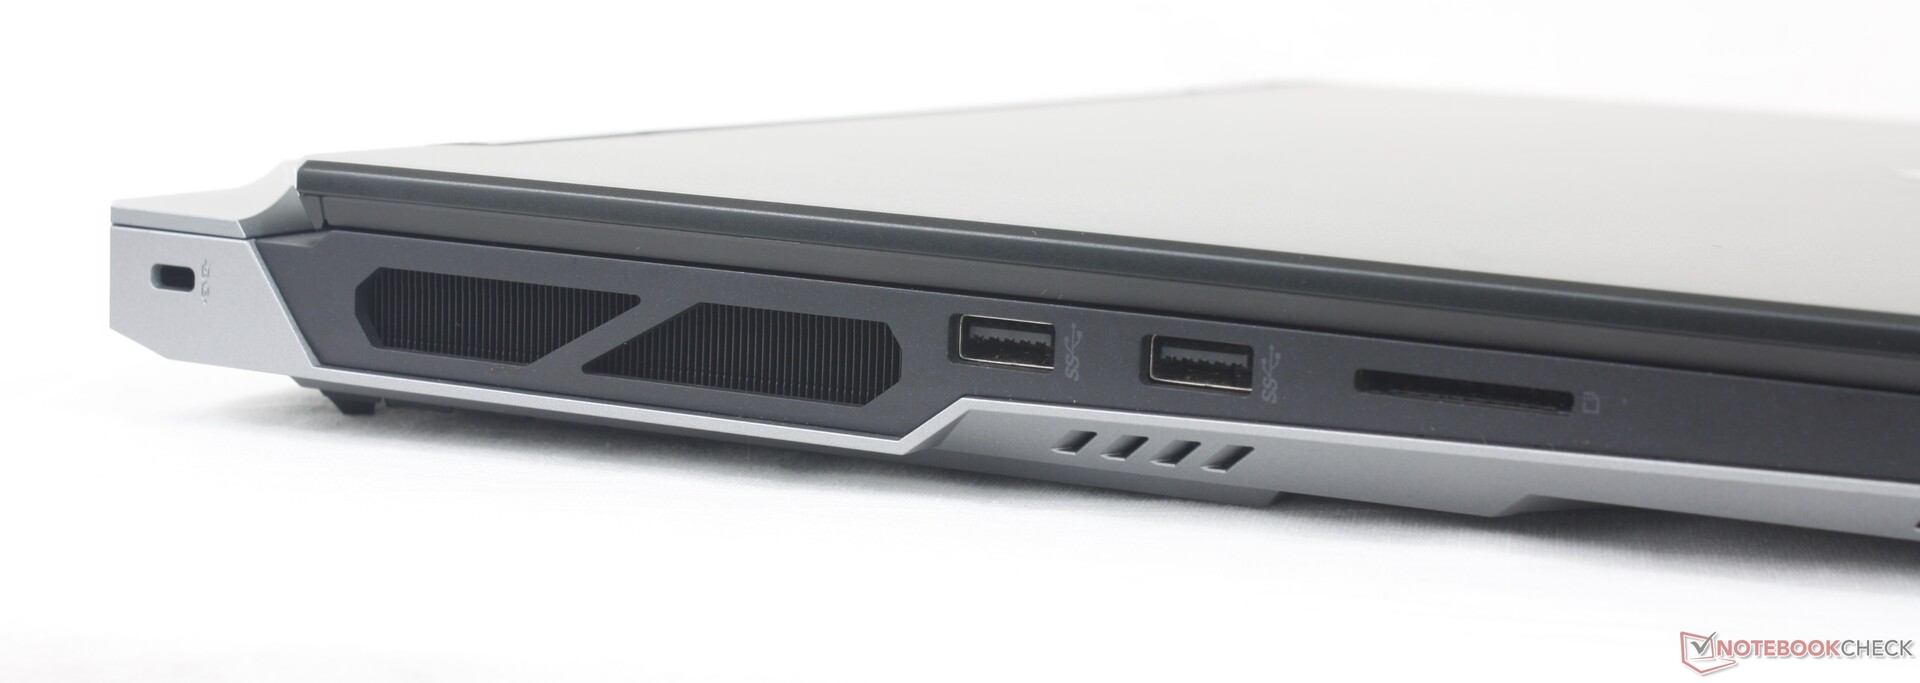
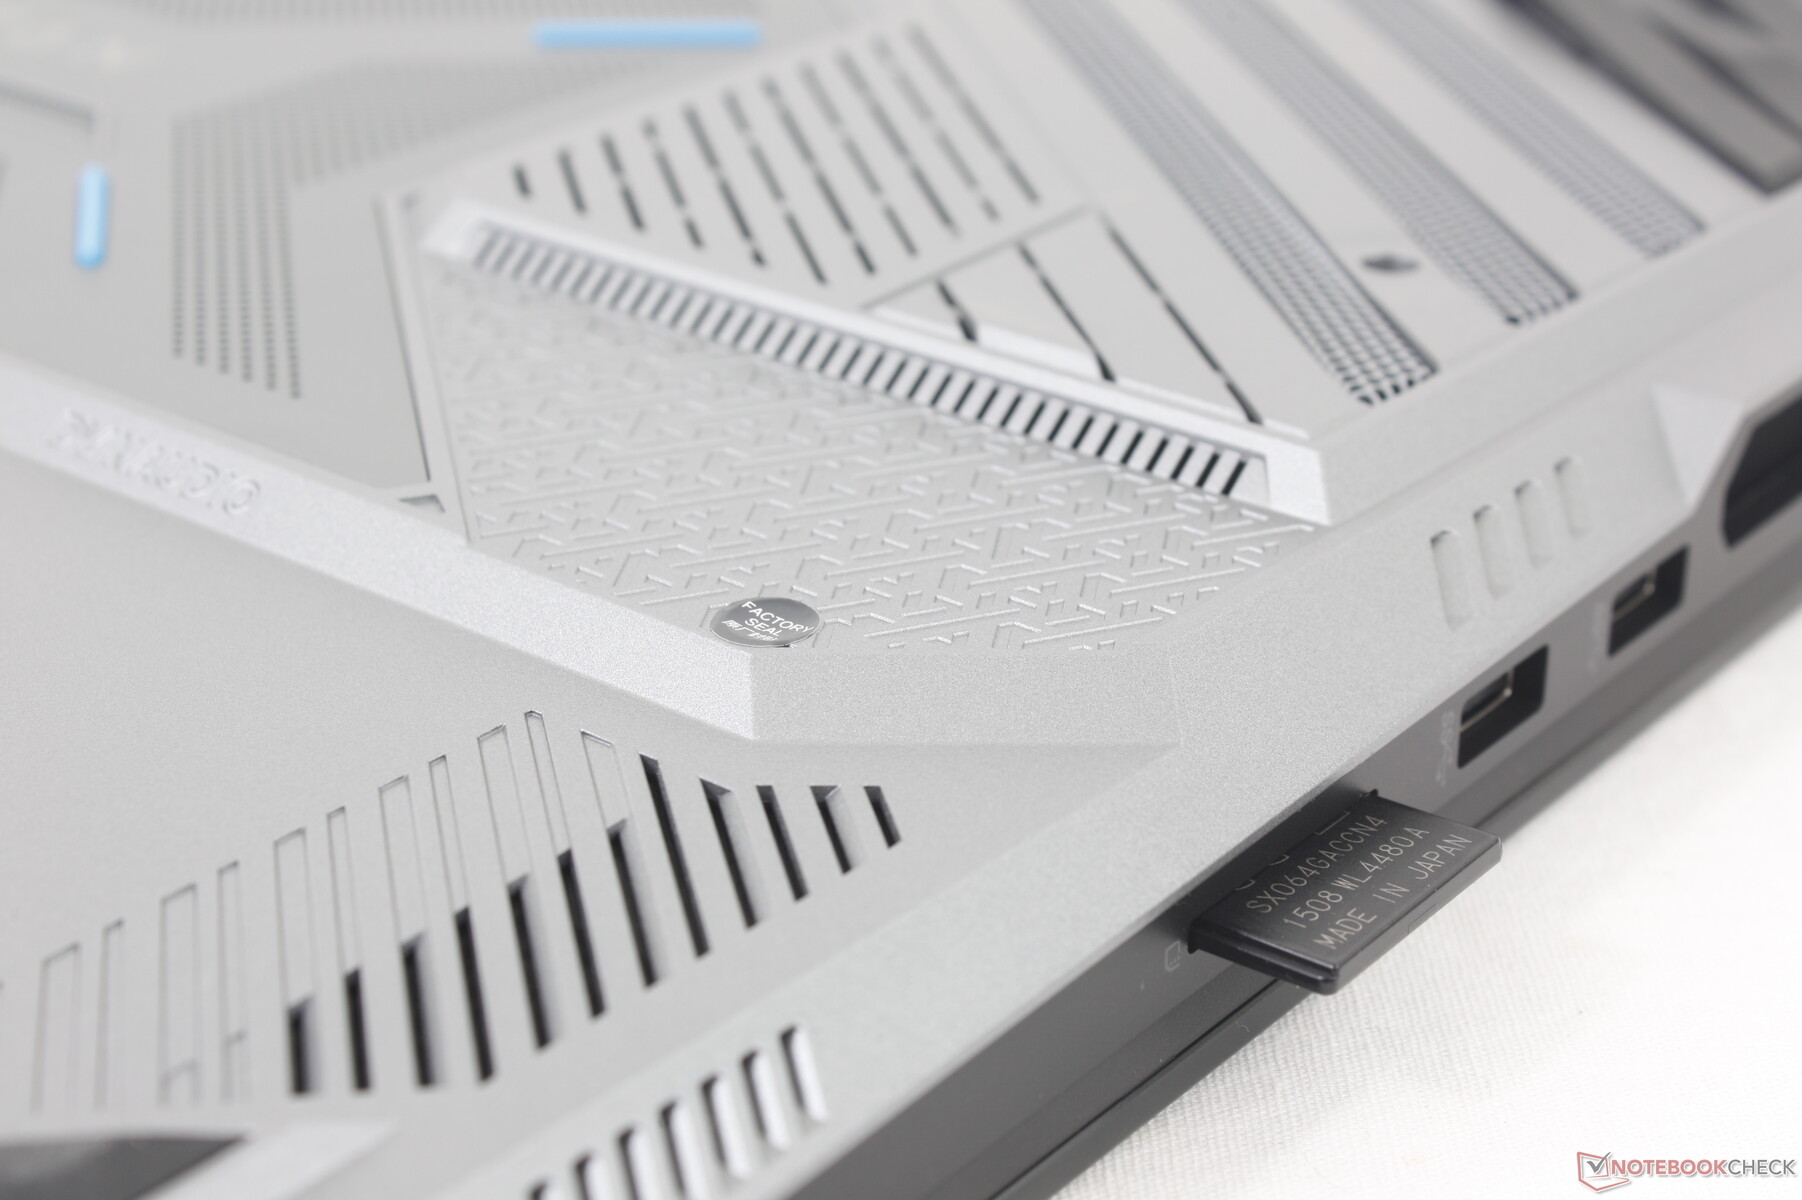
SD 读卡器
虽然机身进行了改进,但读卡器的速度依然缓慢。将 1 GB 的图像从 UHS-II 测试卡移动到桌面需要 12 秒左右,比 Razer Blade 18 上的读卡器慢 2 倍。 Razer Blade 18或 Alienware m18 R1 的读卡器慢 2 倍。
| SD Card Reader | |
| average JPG Copy Test (av. of 3 runs) | |
| Razer Blade 18 RTX 4070 (Angelibird AV Pro V60) | |
| Alienware m18 R1 (Angelibird AV Pro V60) | |
| MSI Titan 18 HX A14VIG (Toshiba Exceria Pro SDXC 64 GB UHS-II) | |
| MSI Titan GT77 HX 13VI (Angelibird AV Pro V60) | |
| Acer Predator Helios 18 N23Q2 | |
| maximum AS SSD Seq Read Test (1GB) | |
| Alienware m18 R1 (Angelibird AV Pro V60) | |
| Razer Blade 18 RTX 4070 (Angelibird AV Pro V60) | |
| MSI Titan 18 HX A14VIG (Toshiba Exceria Pro SDXC 64 GB UHS-II) | |
| MSI Titan GT77 HX 13VI (Angelibird AV Pro V60) | |
| Acer Predator Helios 18 N23Q2 | |
交流
无线局域网由 Killer BE1750x 提供,它是 BE1750W 的游戏变体。尽管 Wi-Fi 7 路由器尚未成为主流,但该模块仍支持 Wi-Fi 7。在与 Wi-Fi 6E 测试路由器配对时,我们没有遇到任何连接问题。
| Networking | |
| iperf3 transmit AXE11000 | |
| Asus ROG Strix G18 G814JI | |
| MSI Titan GT77 HX 13VI | |
| Alienware m18 R1 | |
| Razer Blade 18 RTX 4070 | |
| MSI Titan 18 HX A14VIG | |
| Acer Predator Helios 18 N23Q2 | |
| iperf3 receive AXE11000 | |
| Asus ROG Strix G18 G814JI | |
| MSI Titan GT77 HX 13VI | |
| Razer Blade 18 RTX 4070 | |
| Alienware m18 R1 | |
| MSI Titan 18 HX A14VIG | |
| Acer Predator Helios 18 N23Q2 | |
| iperf3 transmit AXE11000 6GHz | |
| Acer Predator Helios 18 N23Q2 | |
| Alienware m18 R1 | |
| Razer Blade 18 RTX 4070 | |
| MSI Titan 18 HX A14VIG | |
| iperf3 receive AXE11000 6GHz | |
| Razer Blade 18 RTX 4070 | |
| Acer Predator Helios 18 N23Q2 | |
| MSI Titan 18 HX A14VIG | |
| Alienware m18 R1 | |
网络摄像头
标配的 200 万像素网络摄像头带有物理隐私快门和红外传感器。如下图所示,摄像头可能存在亮度问题。

")
")
维护
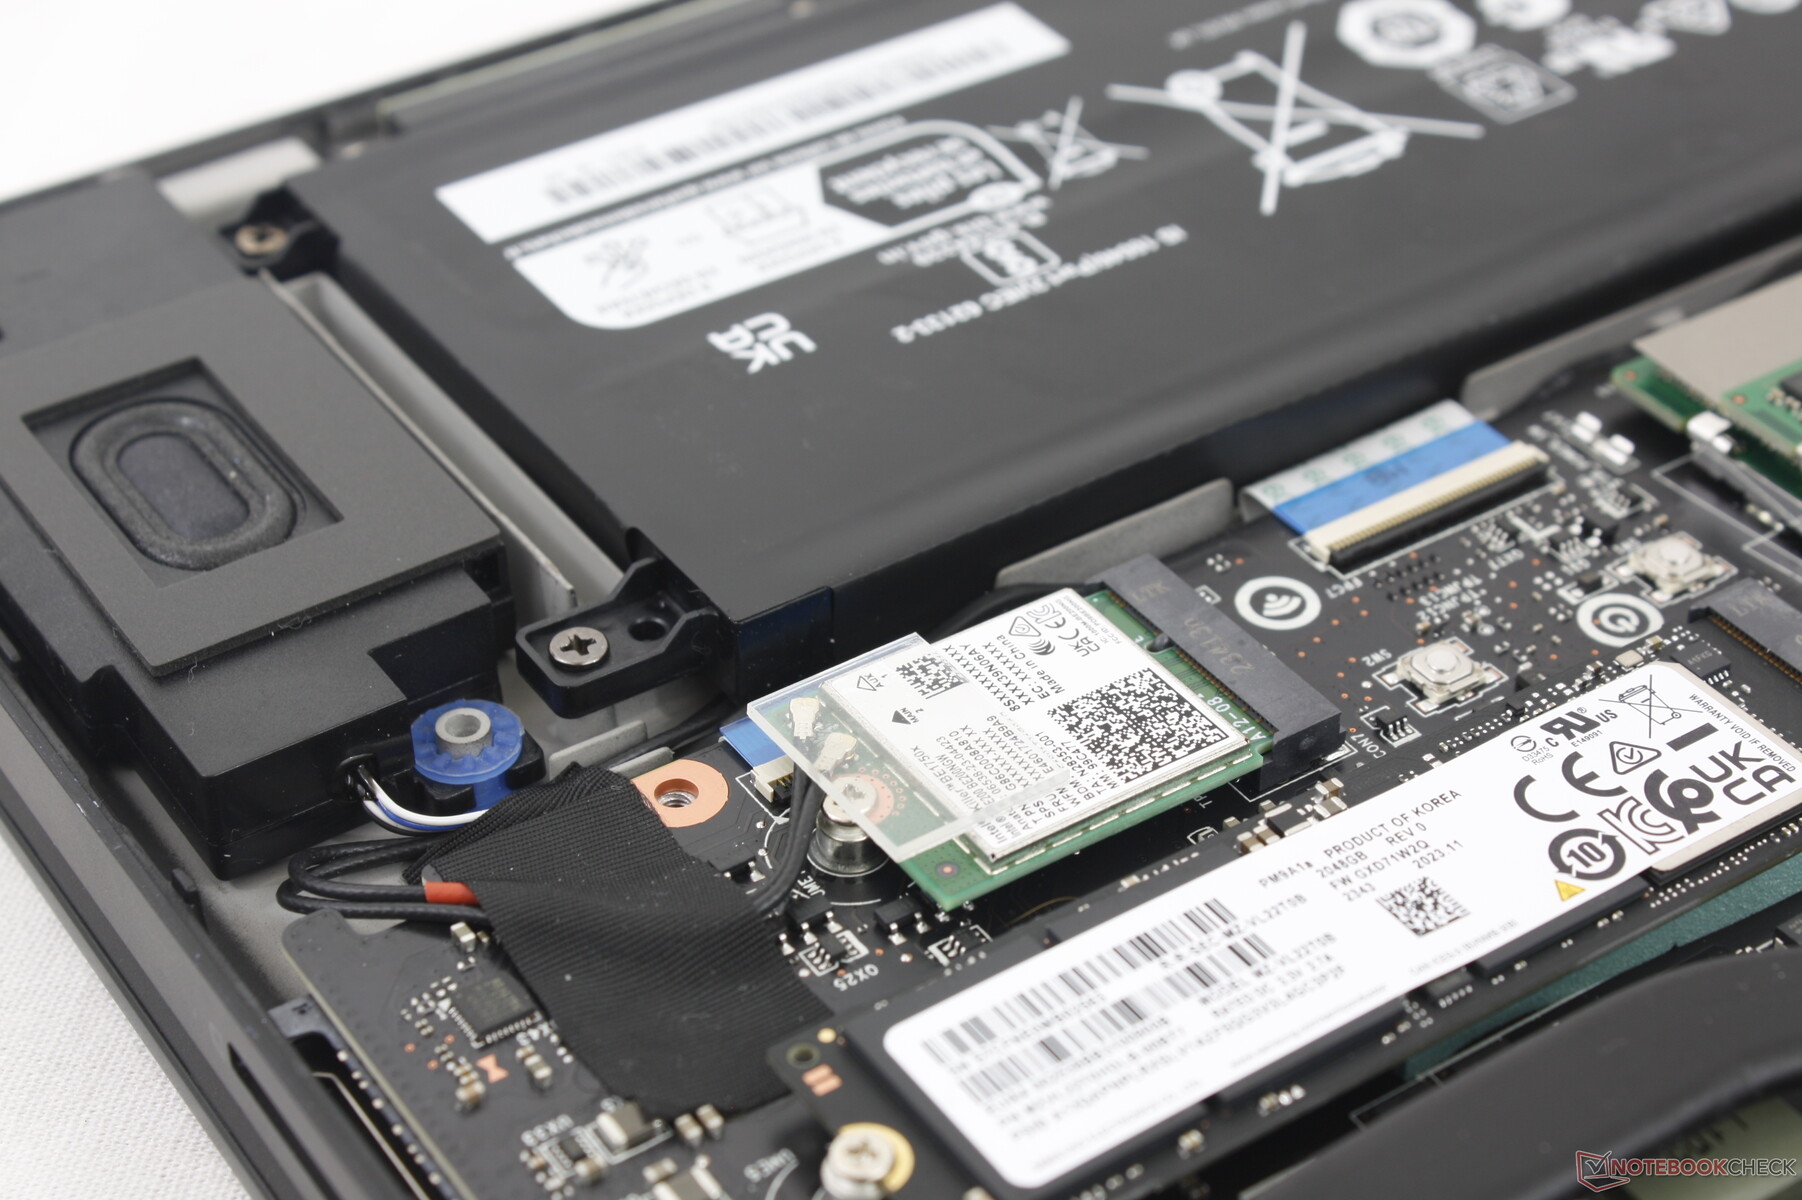
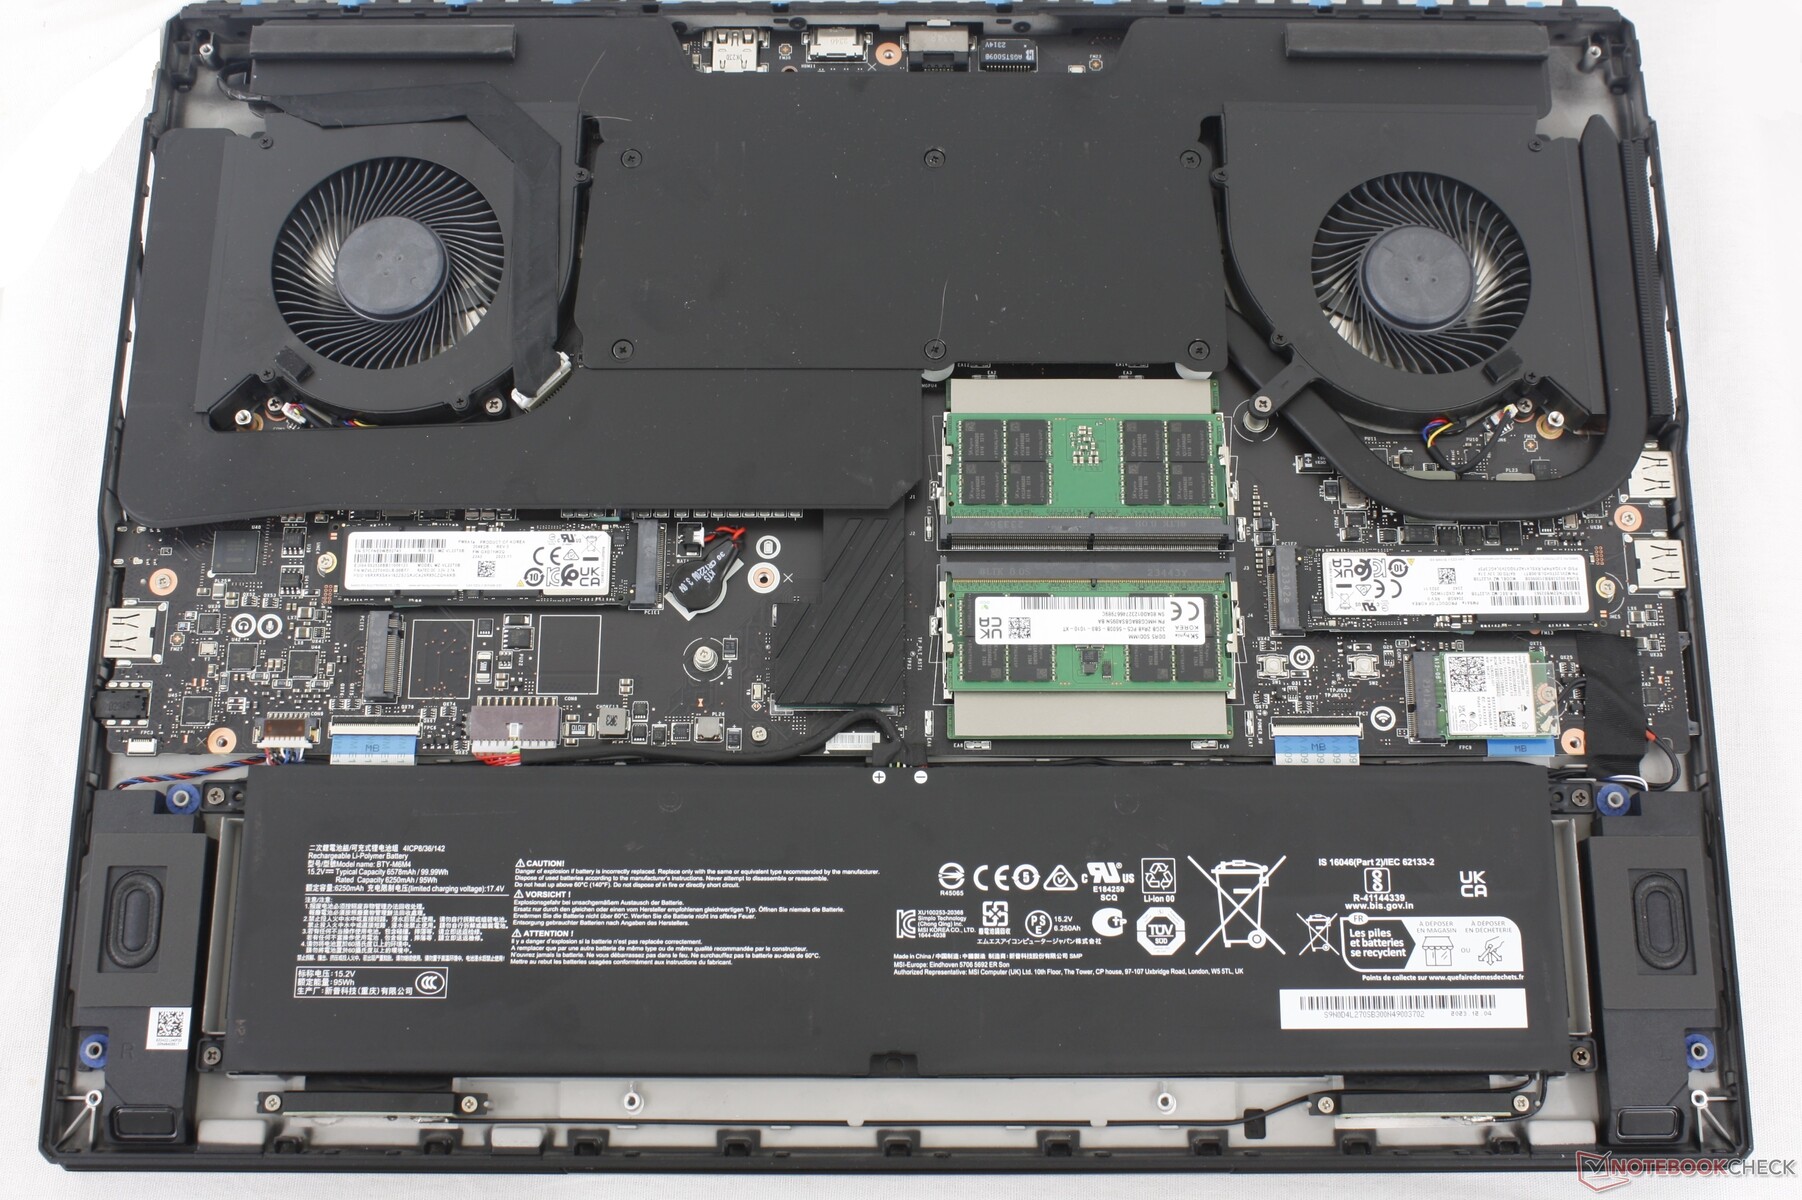
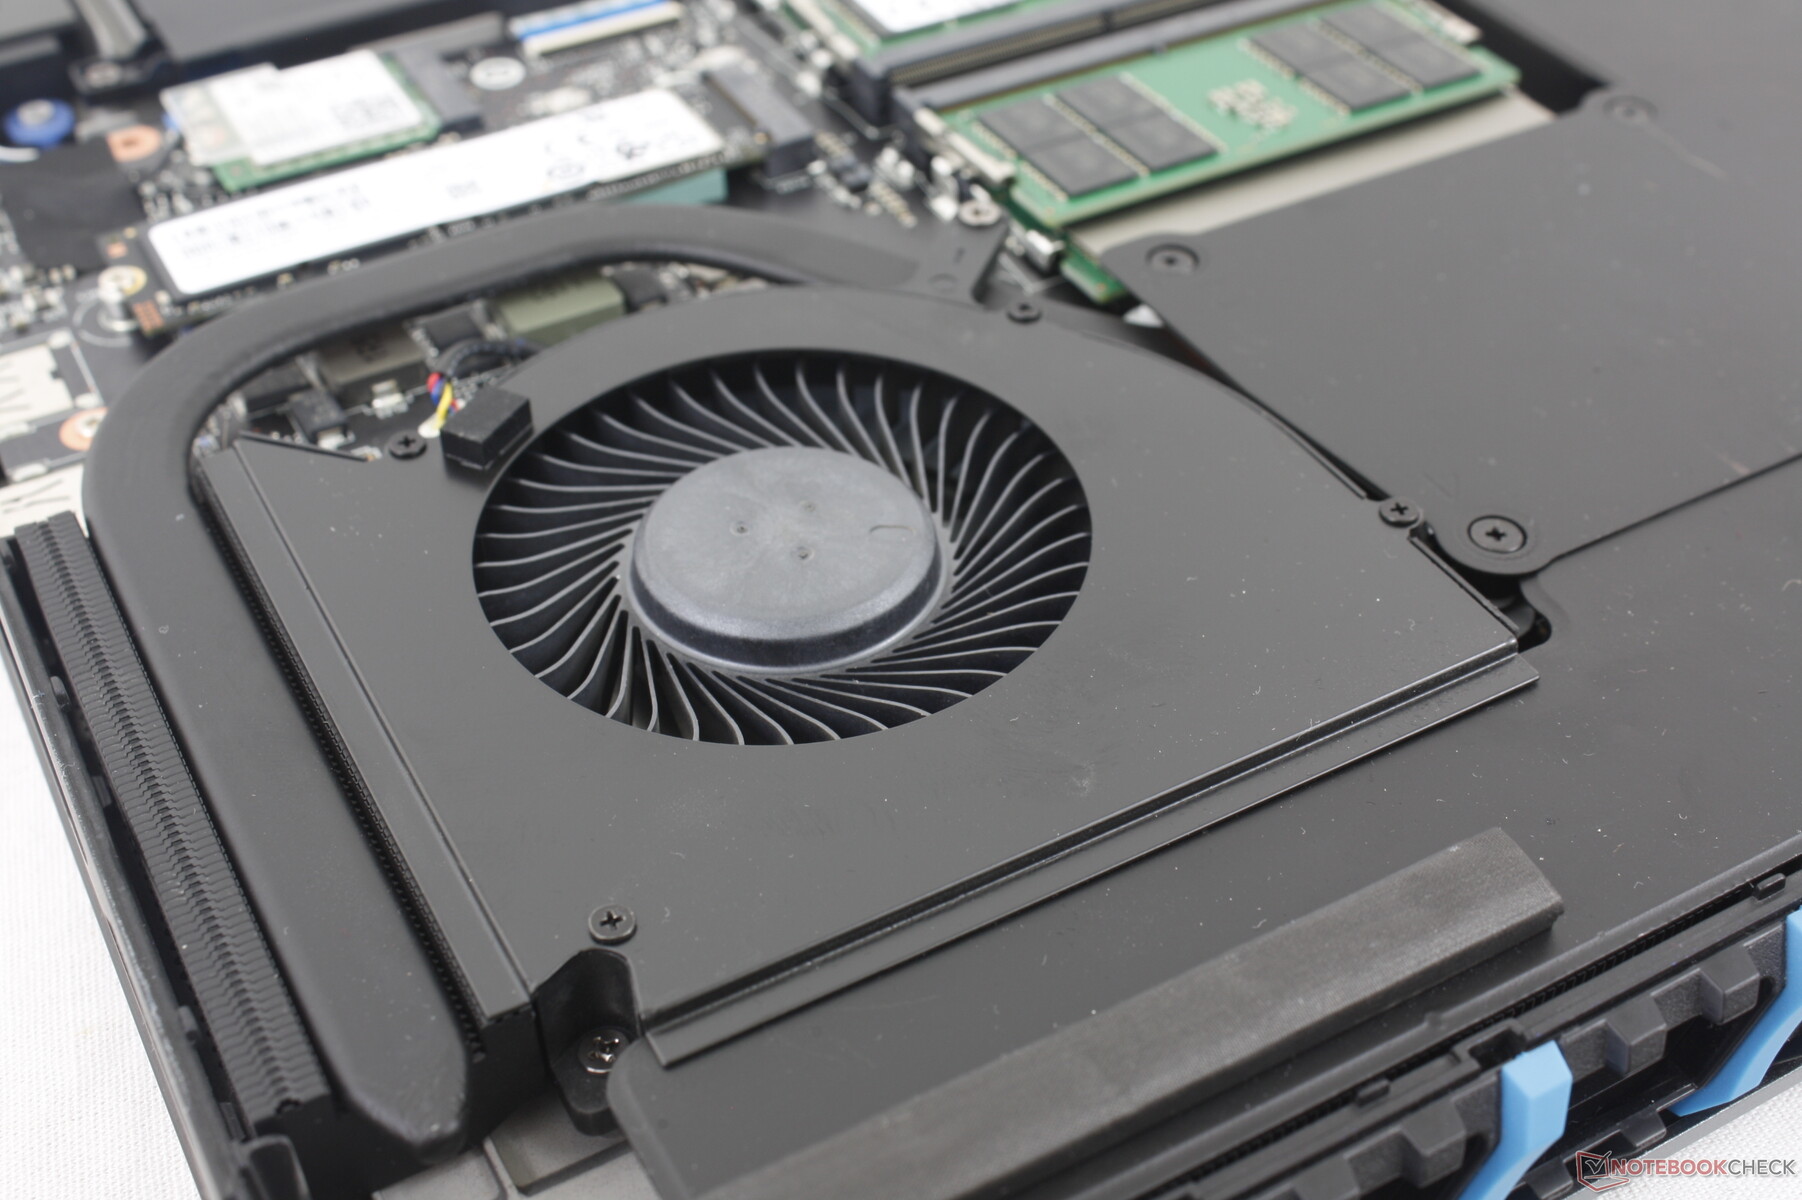
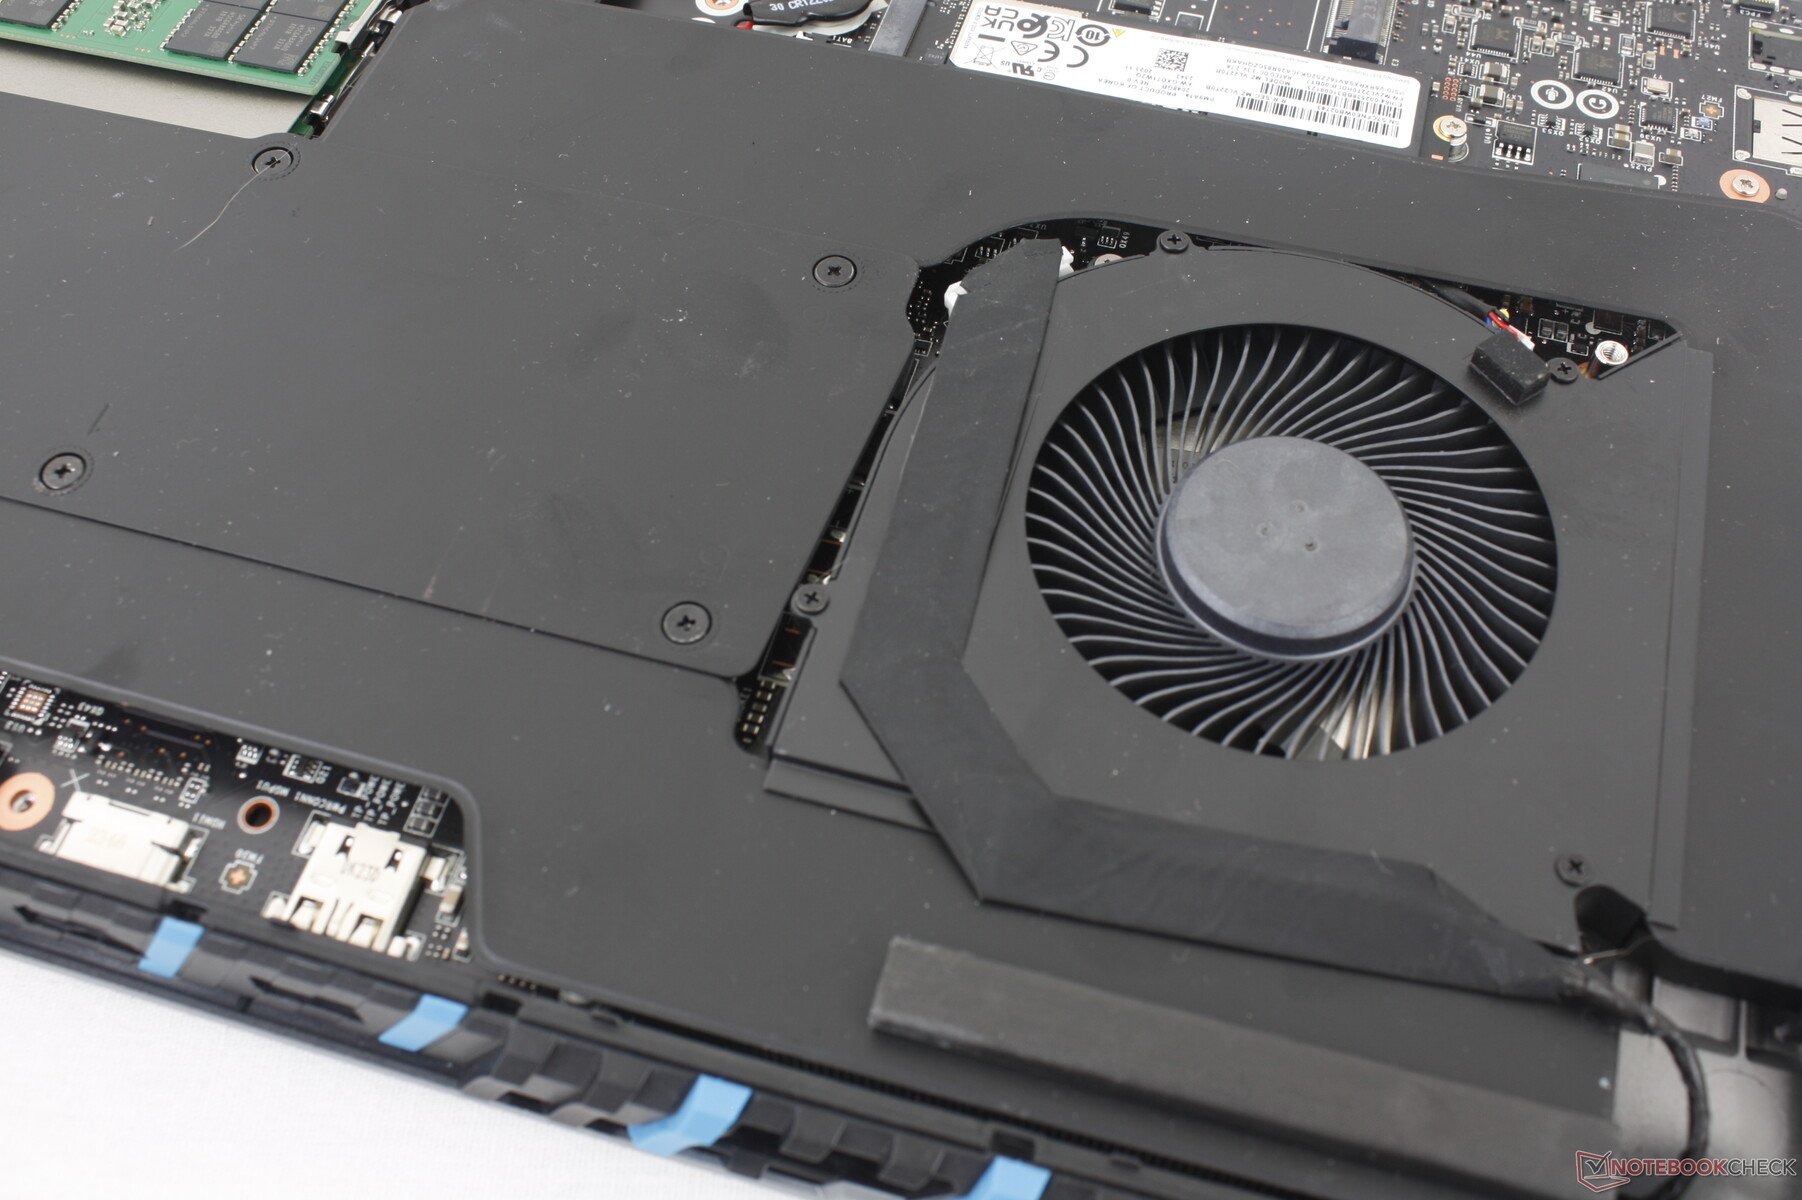
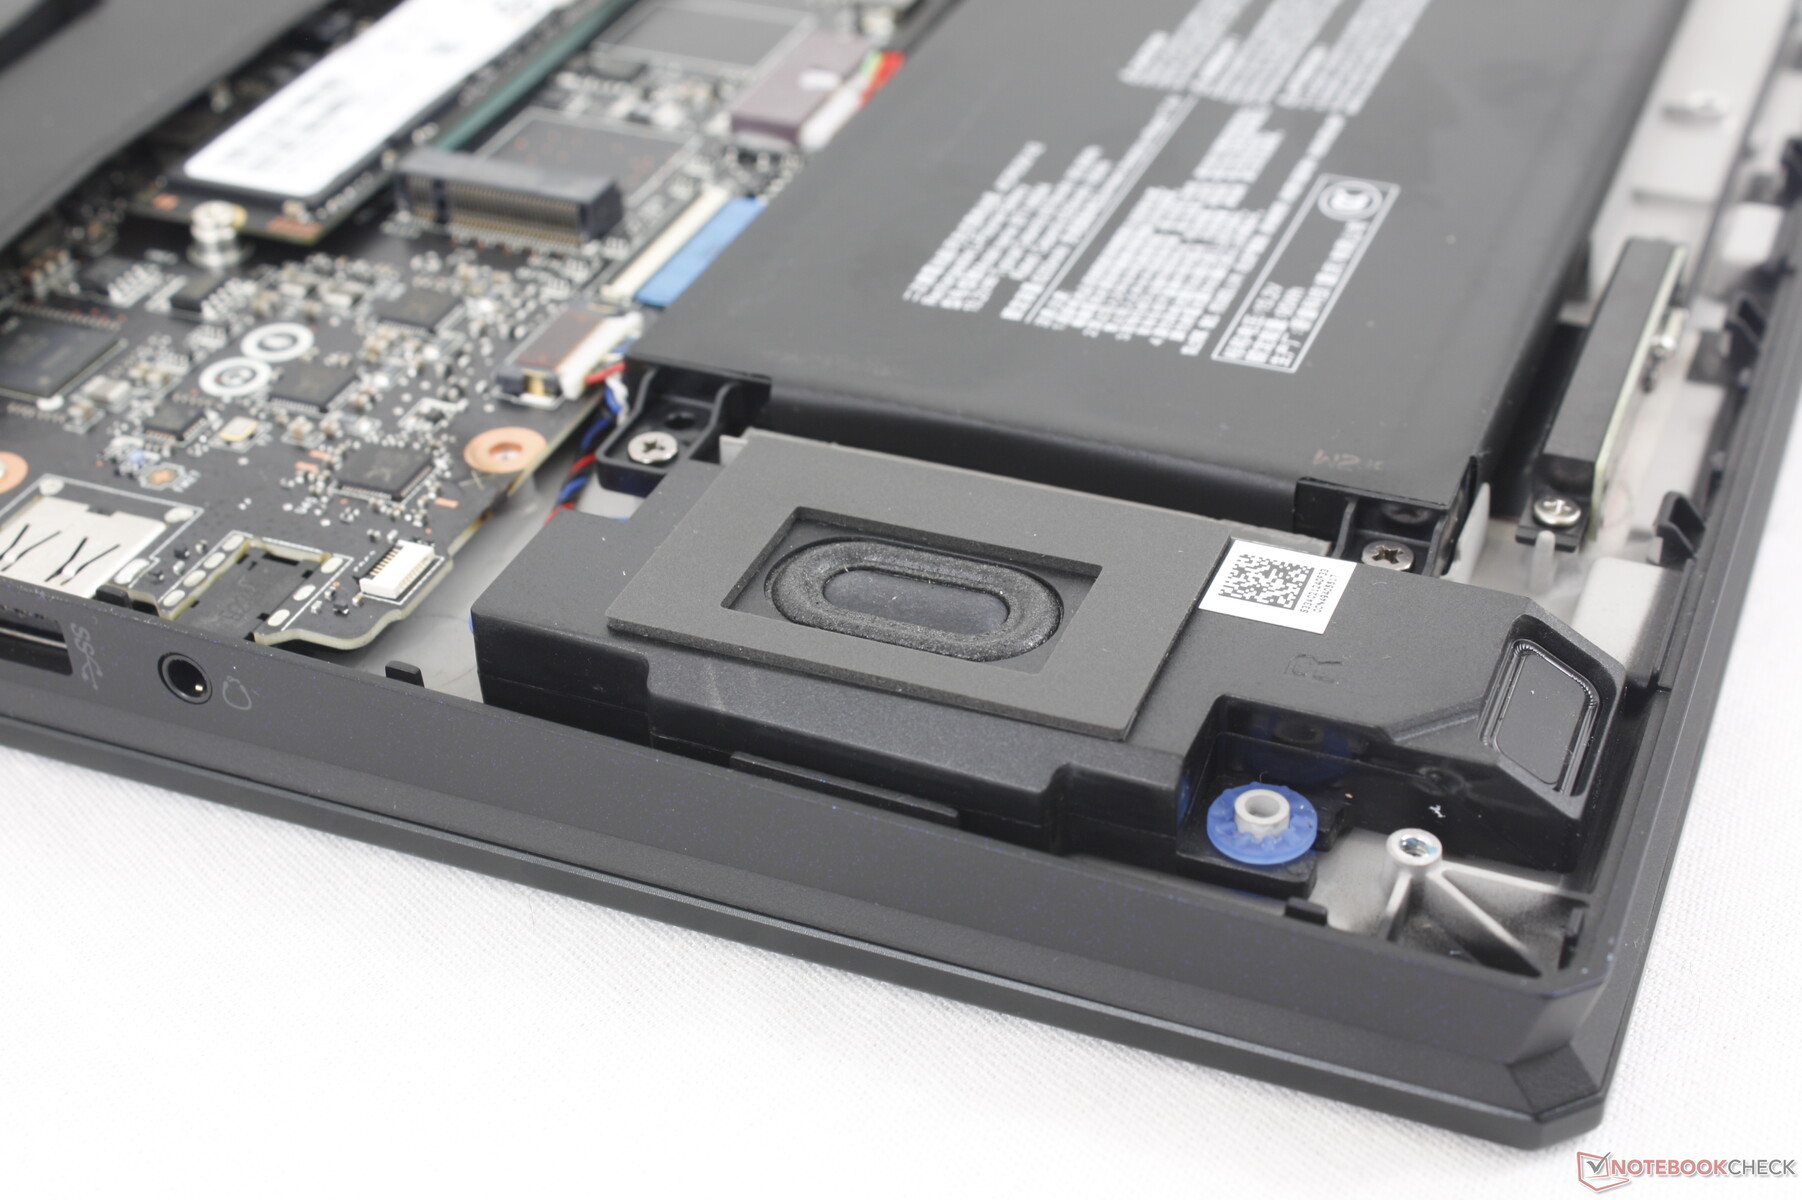
底部面板由 12 颗十字螺丝固定,维修相对容易。但请注意,必须撕开工厂密封贴纸才能进行维修。
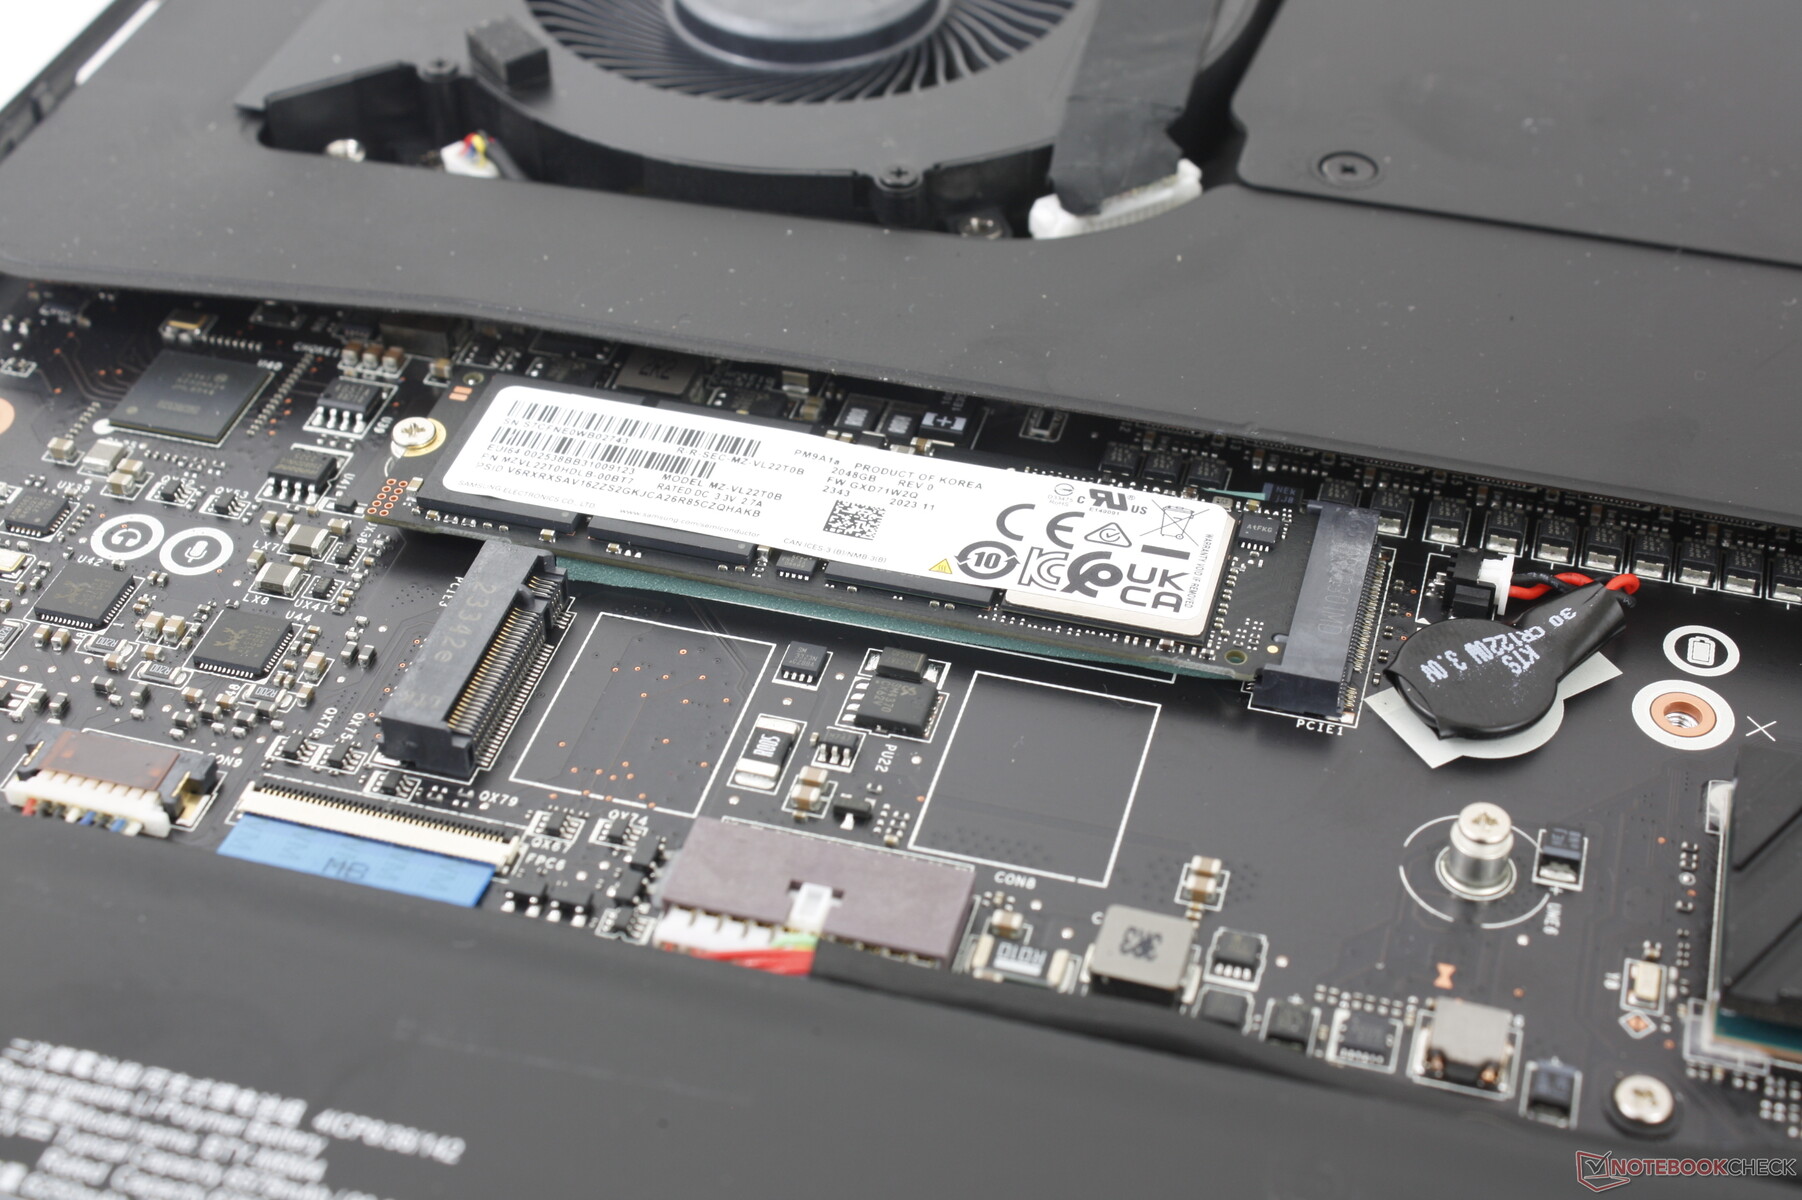
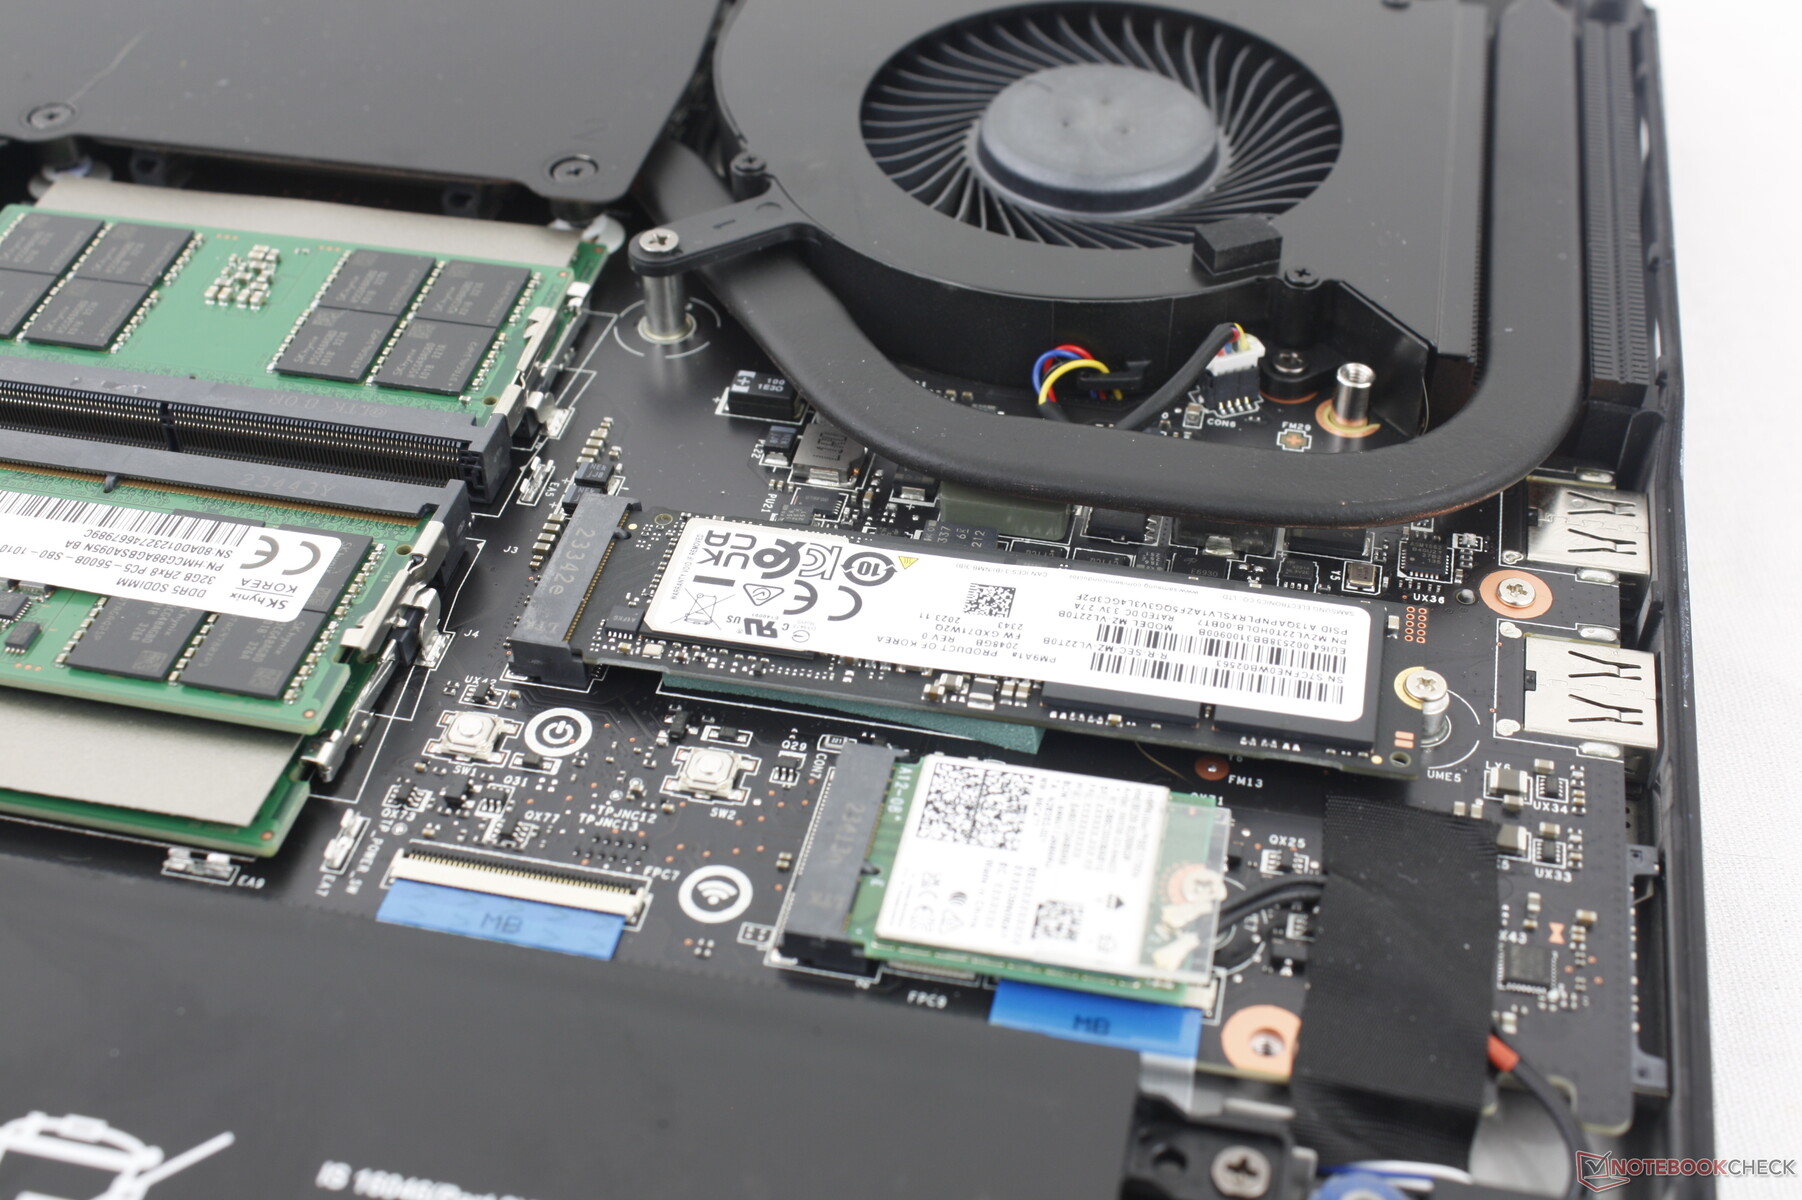
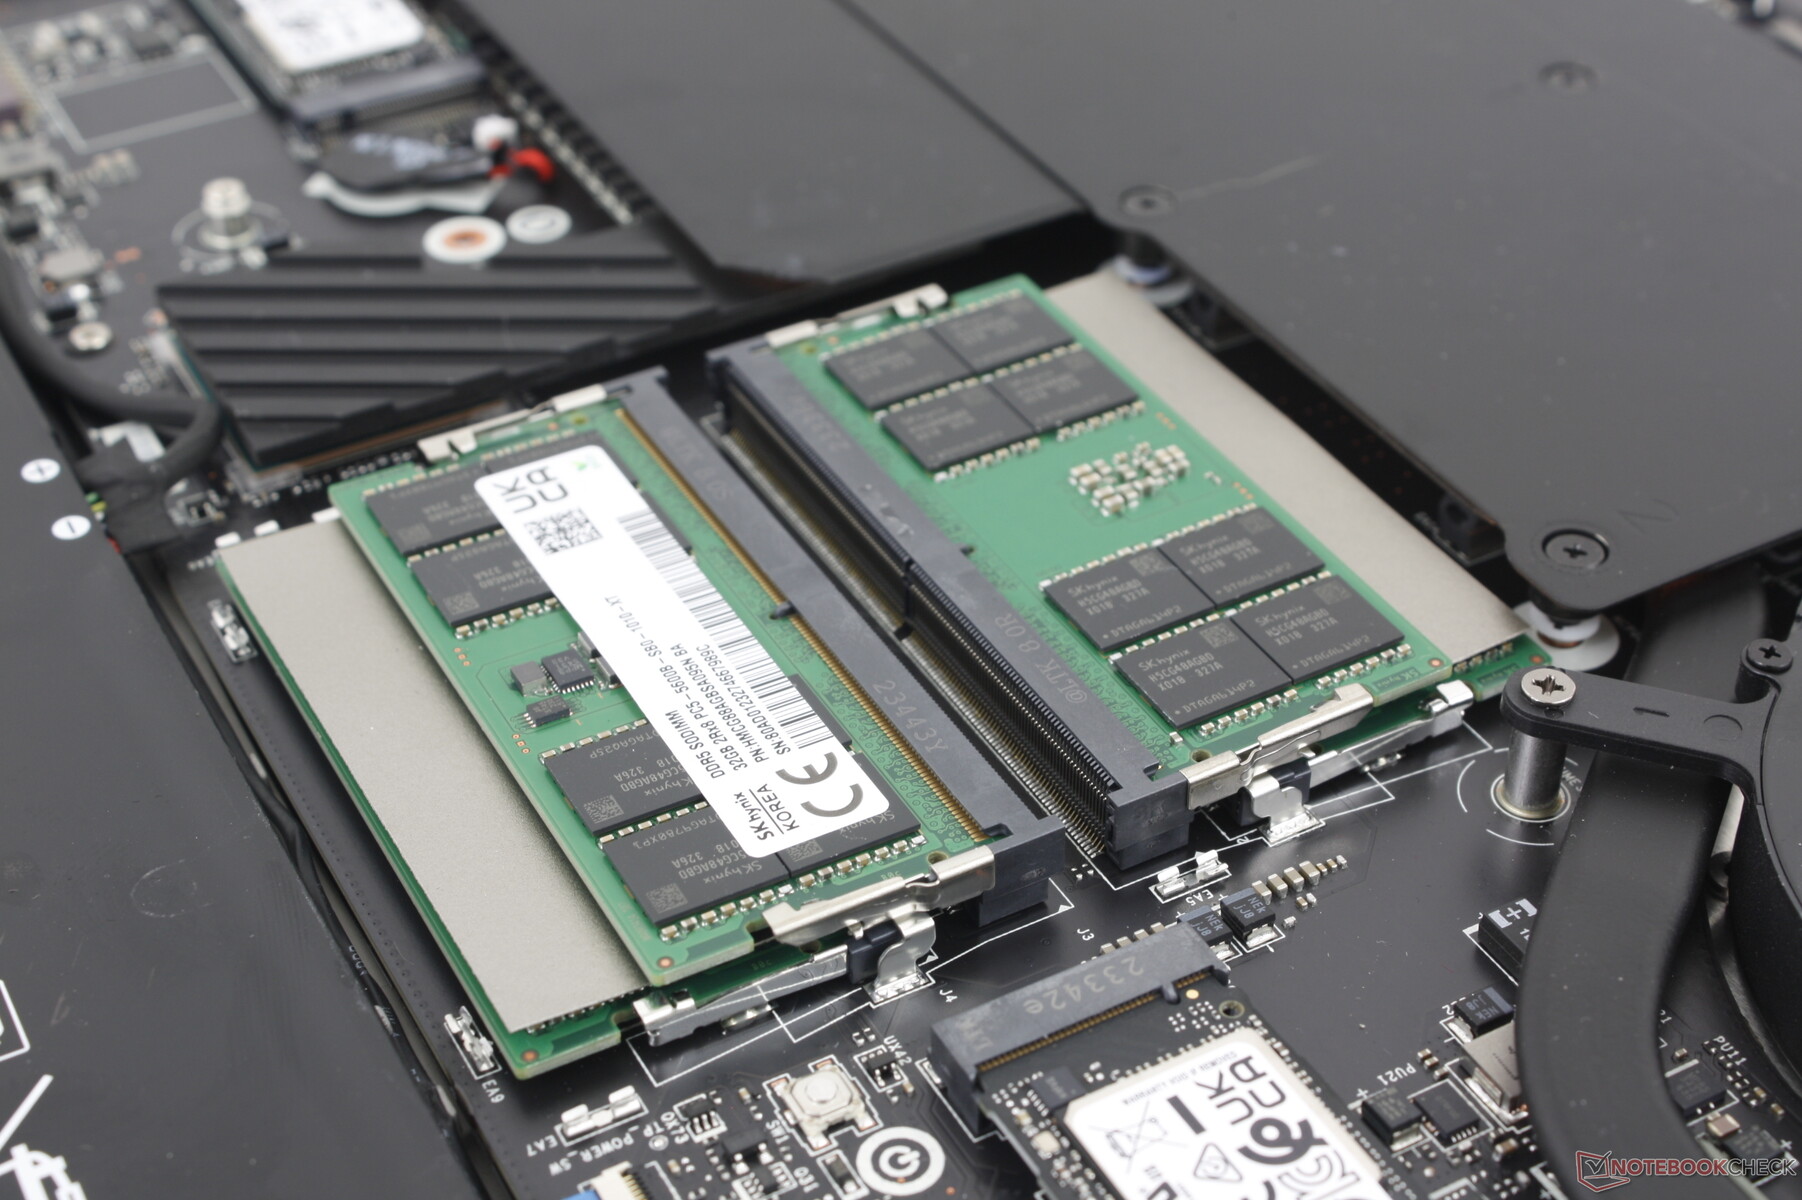
进入机箱后,用户可以直接访问 4 个 SODIMM 插槽、3 个 M.2 2280 SSD 插槽(2 个 PCIe4 x4、1 个 PCIe5 x4)和可拆卸的 WLAN 模块。相比之下,去年的 GT77 最多可支持 4 个固态硬盘,因此这次的存储选项略显有限。
配件和保修
零售包装盒包括一个 USB 鼠标(M99 Pro)、天鹅绒清洁布、256 GB USB 闪存盘和一个幸运龙钥匙扣。奇怪的是,钥匙扣是黑色的,而不是吉祥物通常的红色。
如果在美国购买,制造商提供一年有限保修。
输入设备 - 舒适的点击式按键
键盘
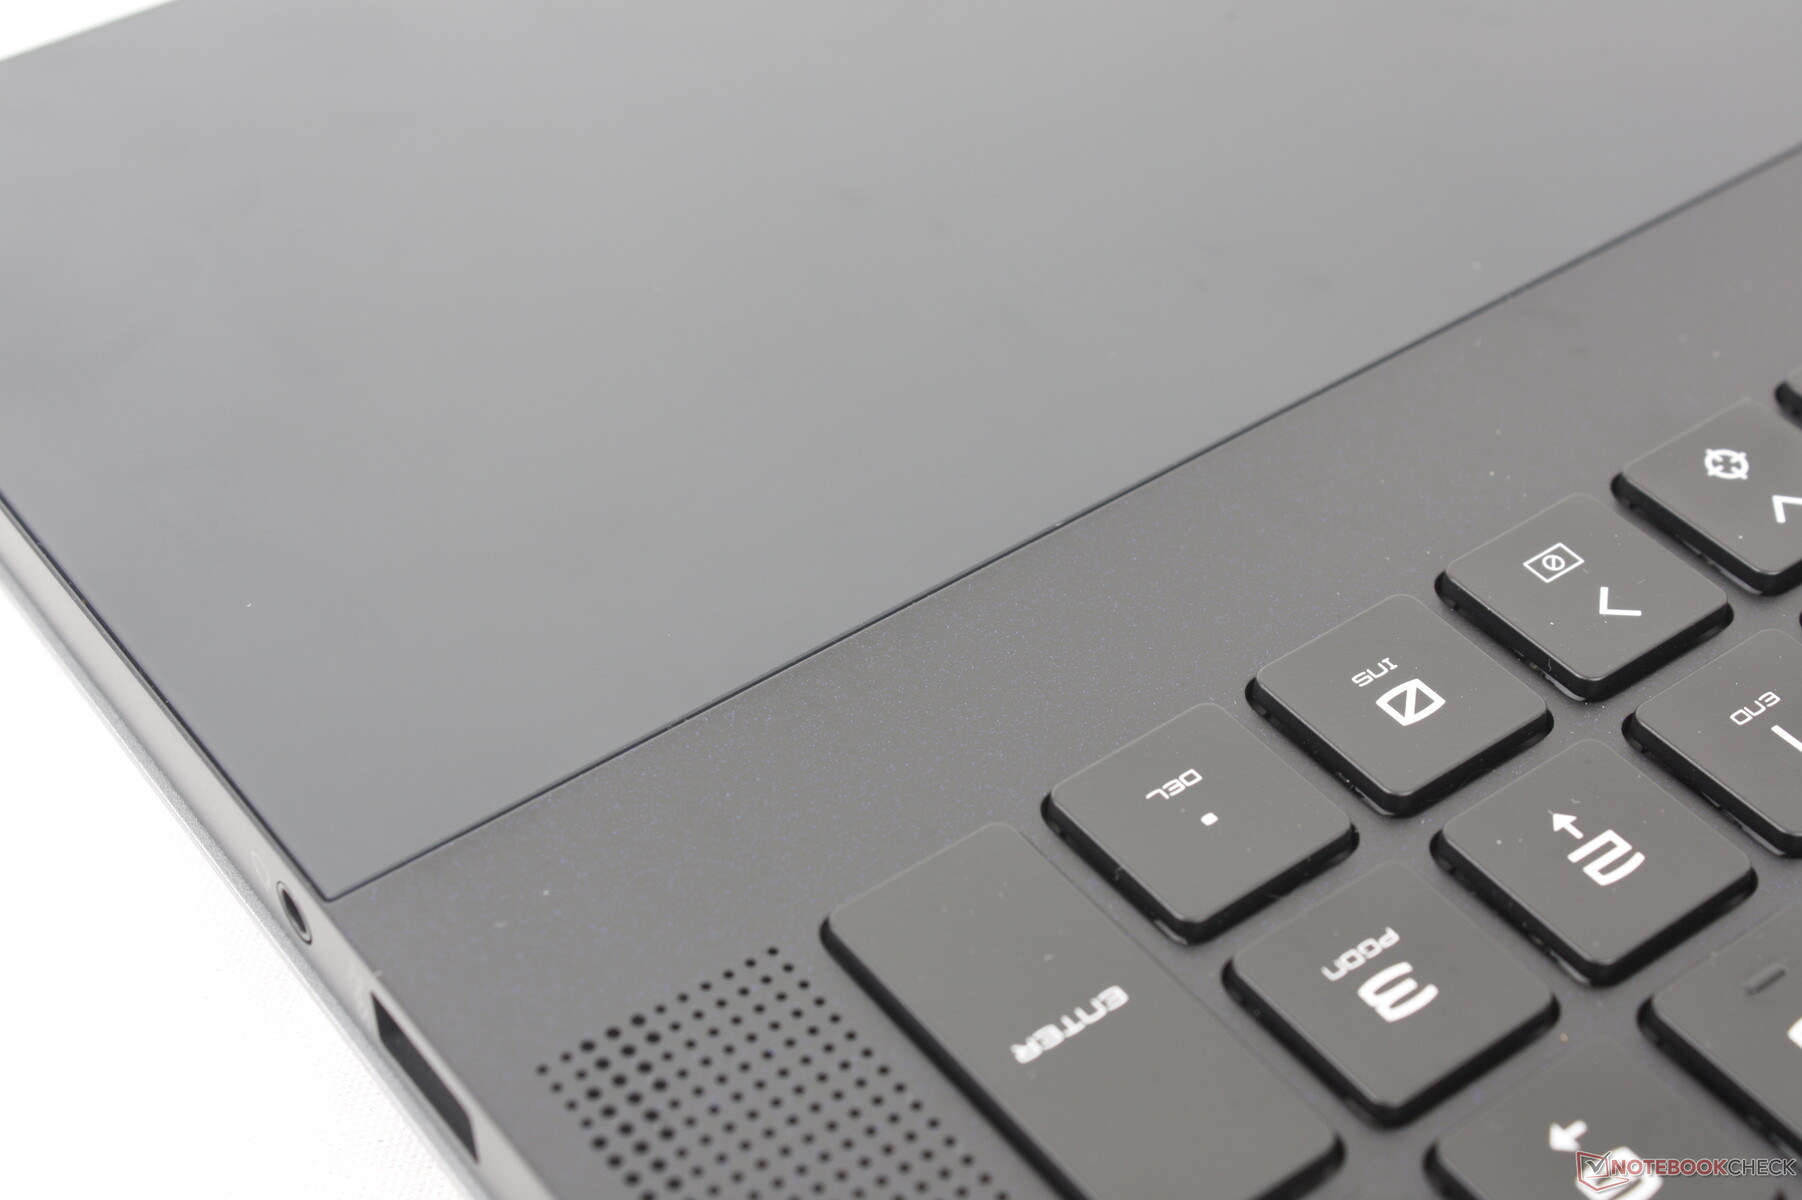
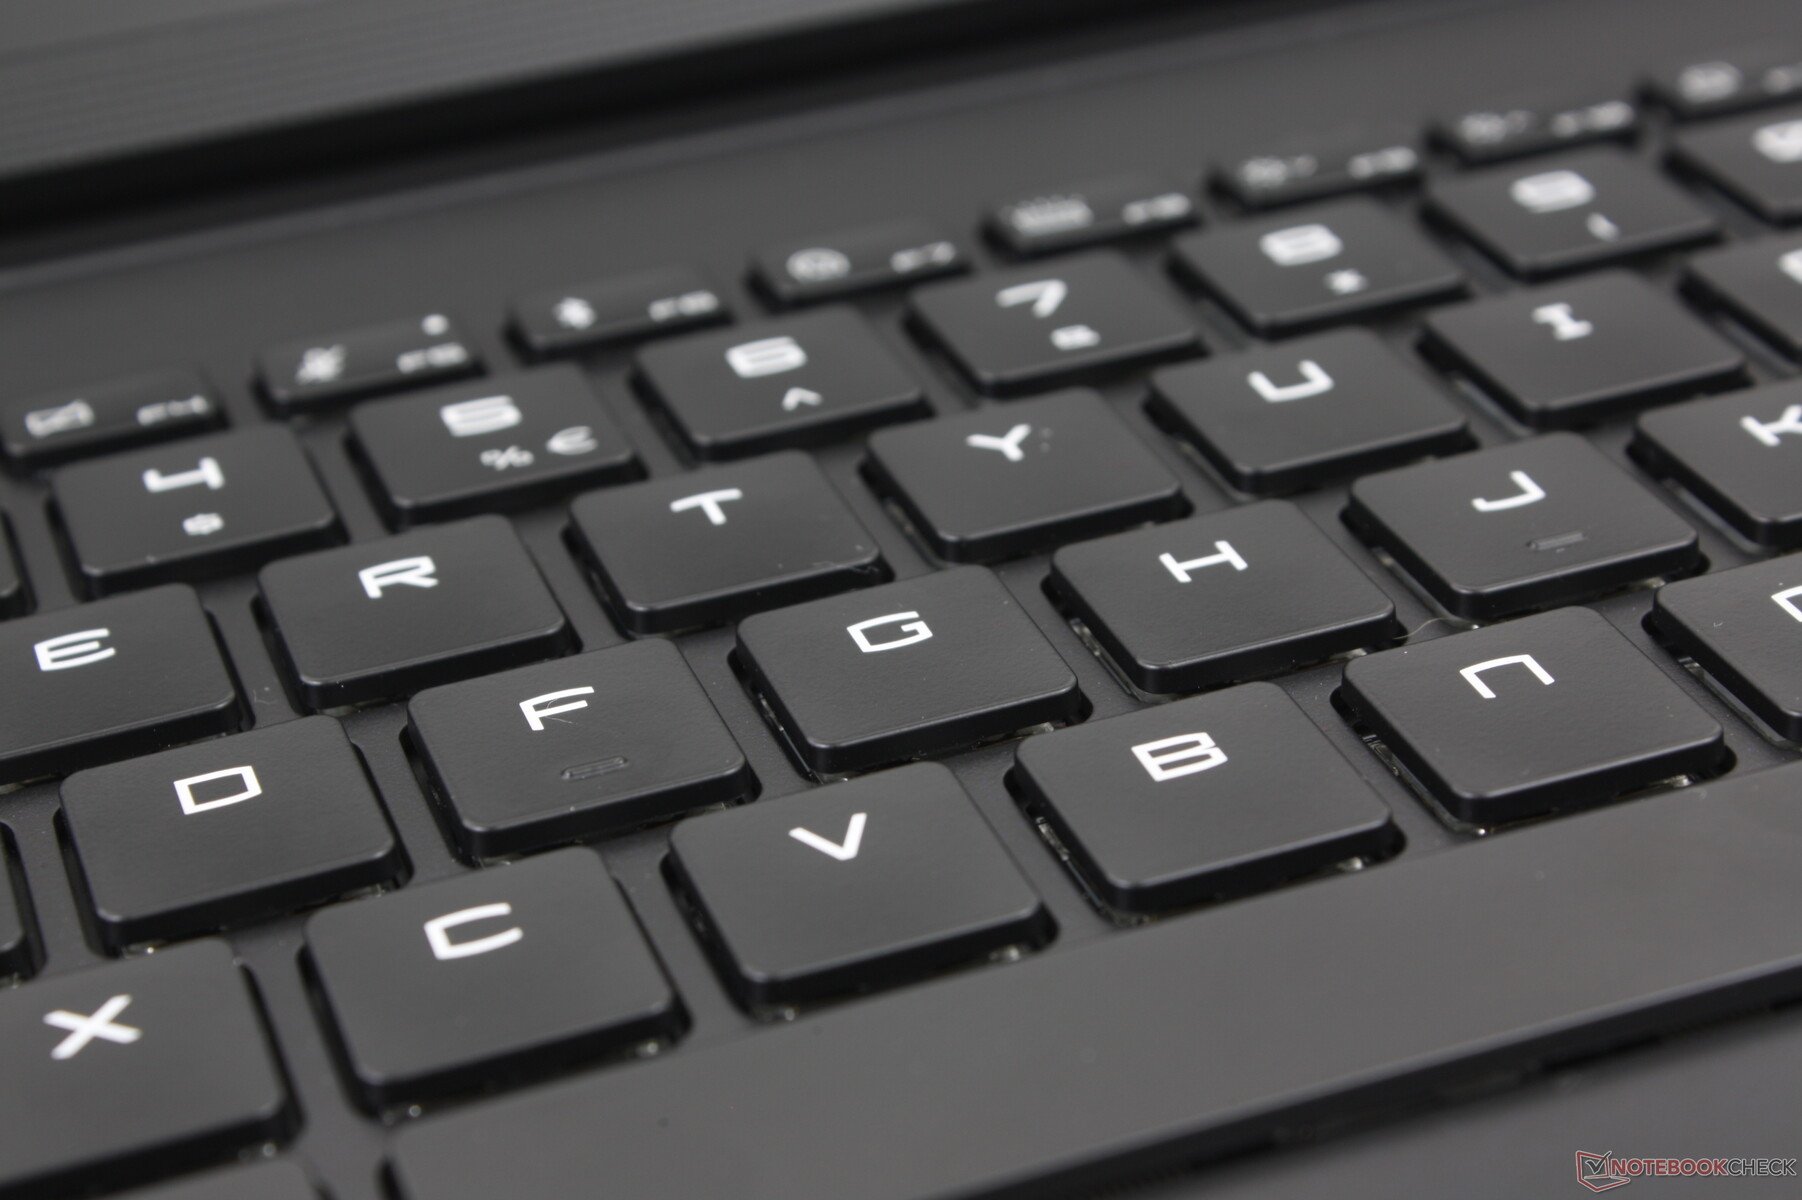
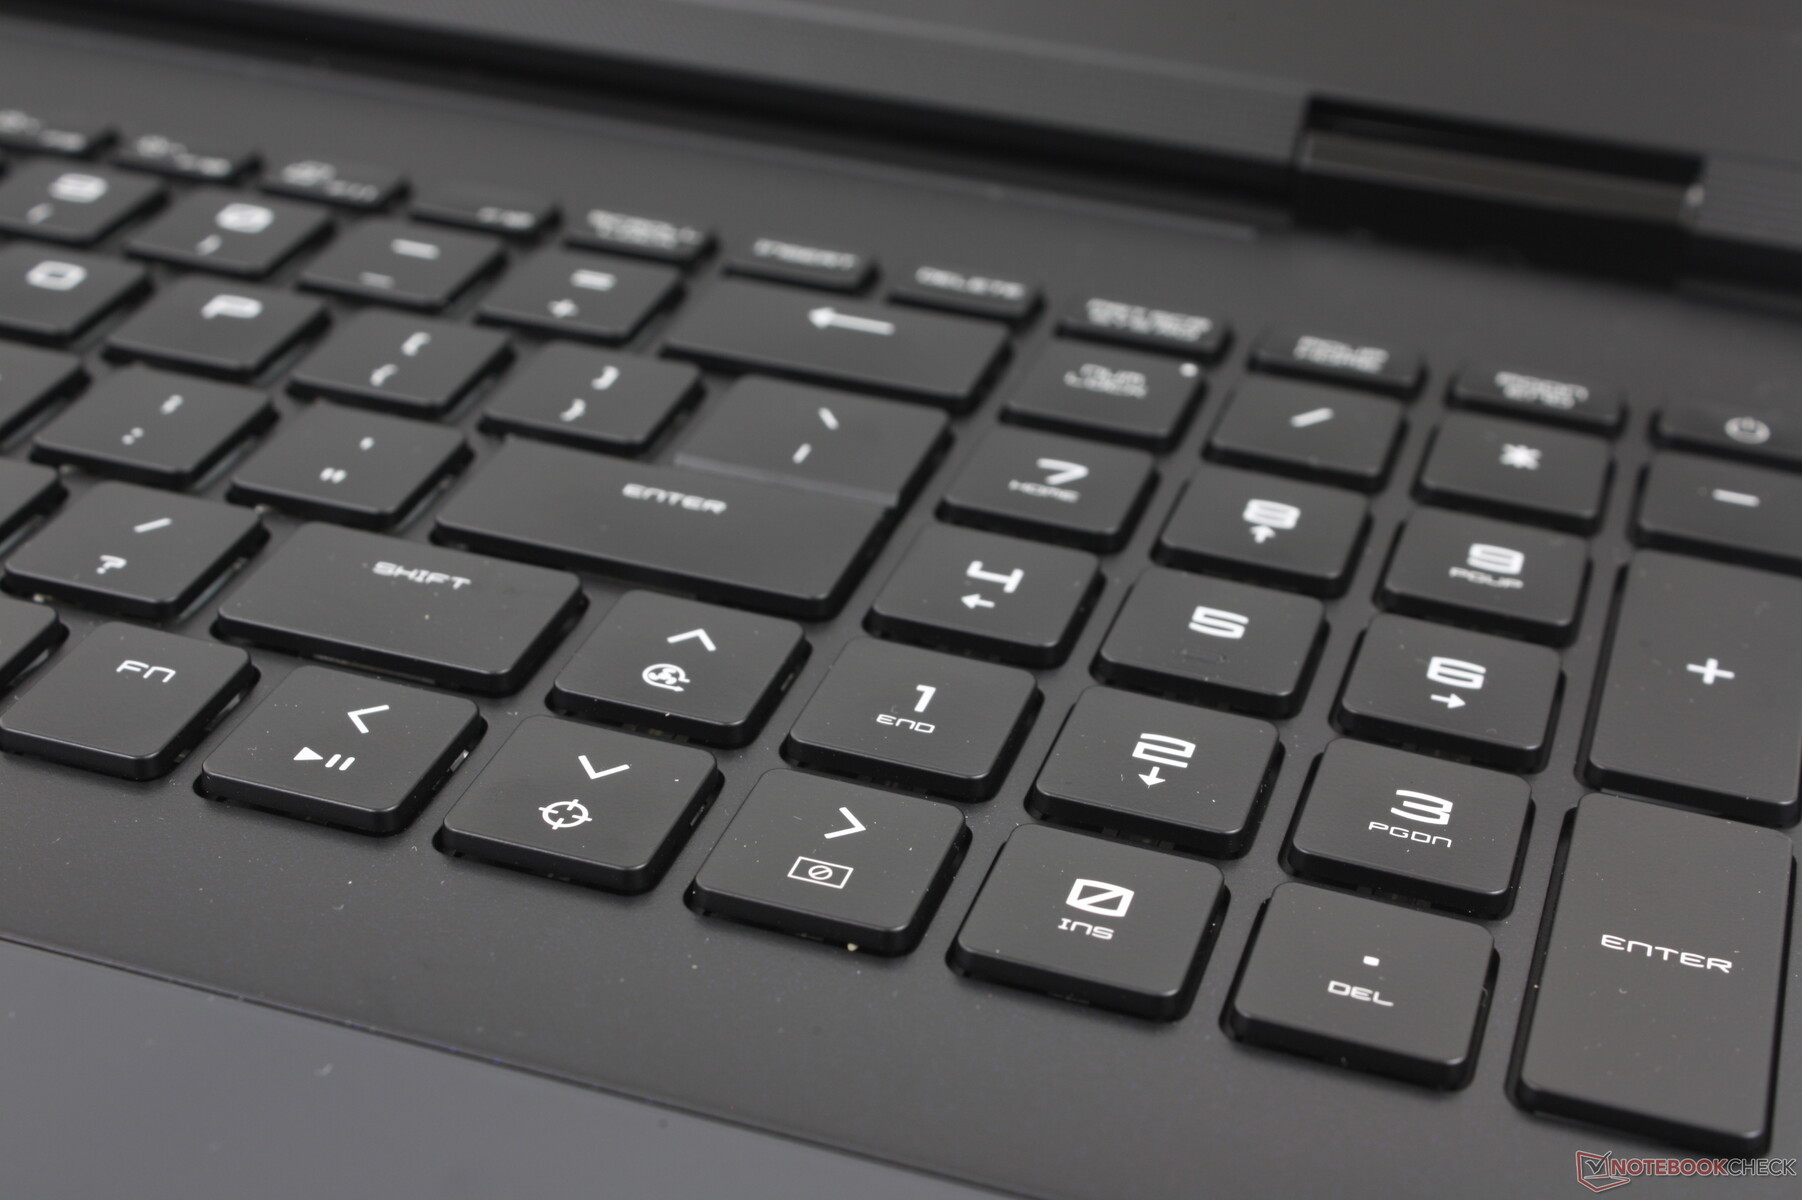
所有配置均标配按键式 RGB Cherry 超扁平机械键盘,与某些 Alienware 机型的配置类似。 某些 Alienware 型号.在键程和反馈方面,它是我们在所有笔记本电脑上体验过的最佳键程和反馈之一,因为与标准薄膜按键相比,它的差异是显而易见的。当然,它的主要缺点是声音较大且音调较高,尤其是在按回车键和空格键时。这款键盘绝对不适合在教室或图书馆使用。
遗憾的是,Titan 18 HX 上并非每个按键都是机械式的。数字键盘和方向键是薄膜键盘,因此按下时感觉更柔和、更安静。
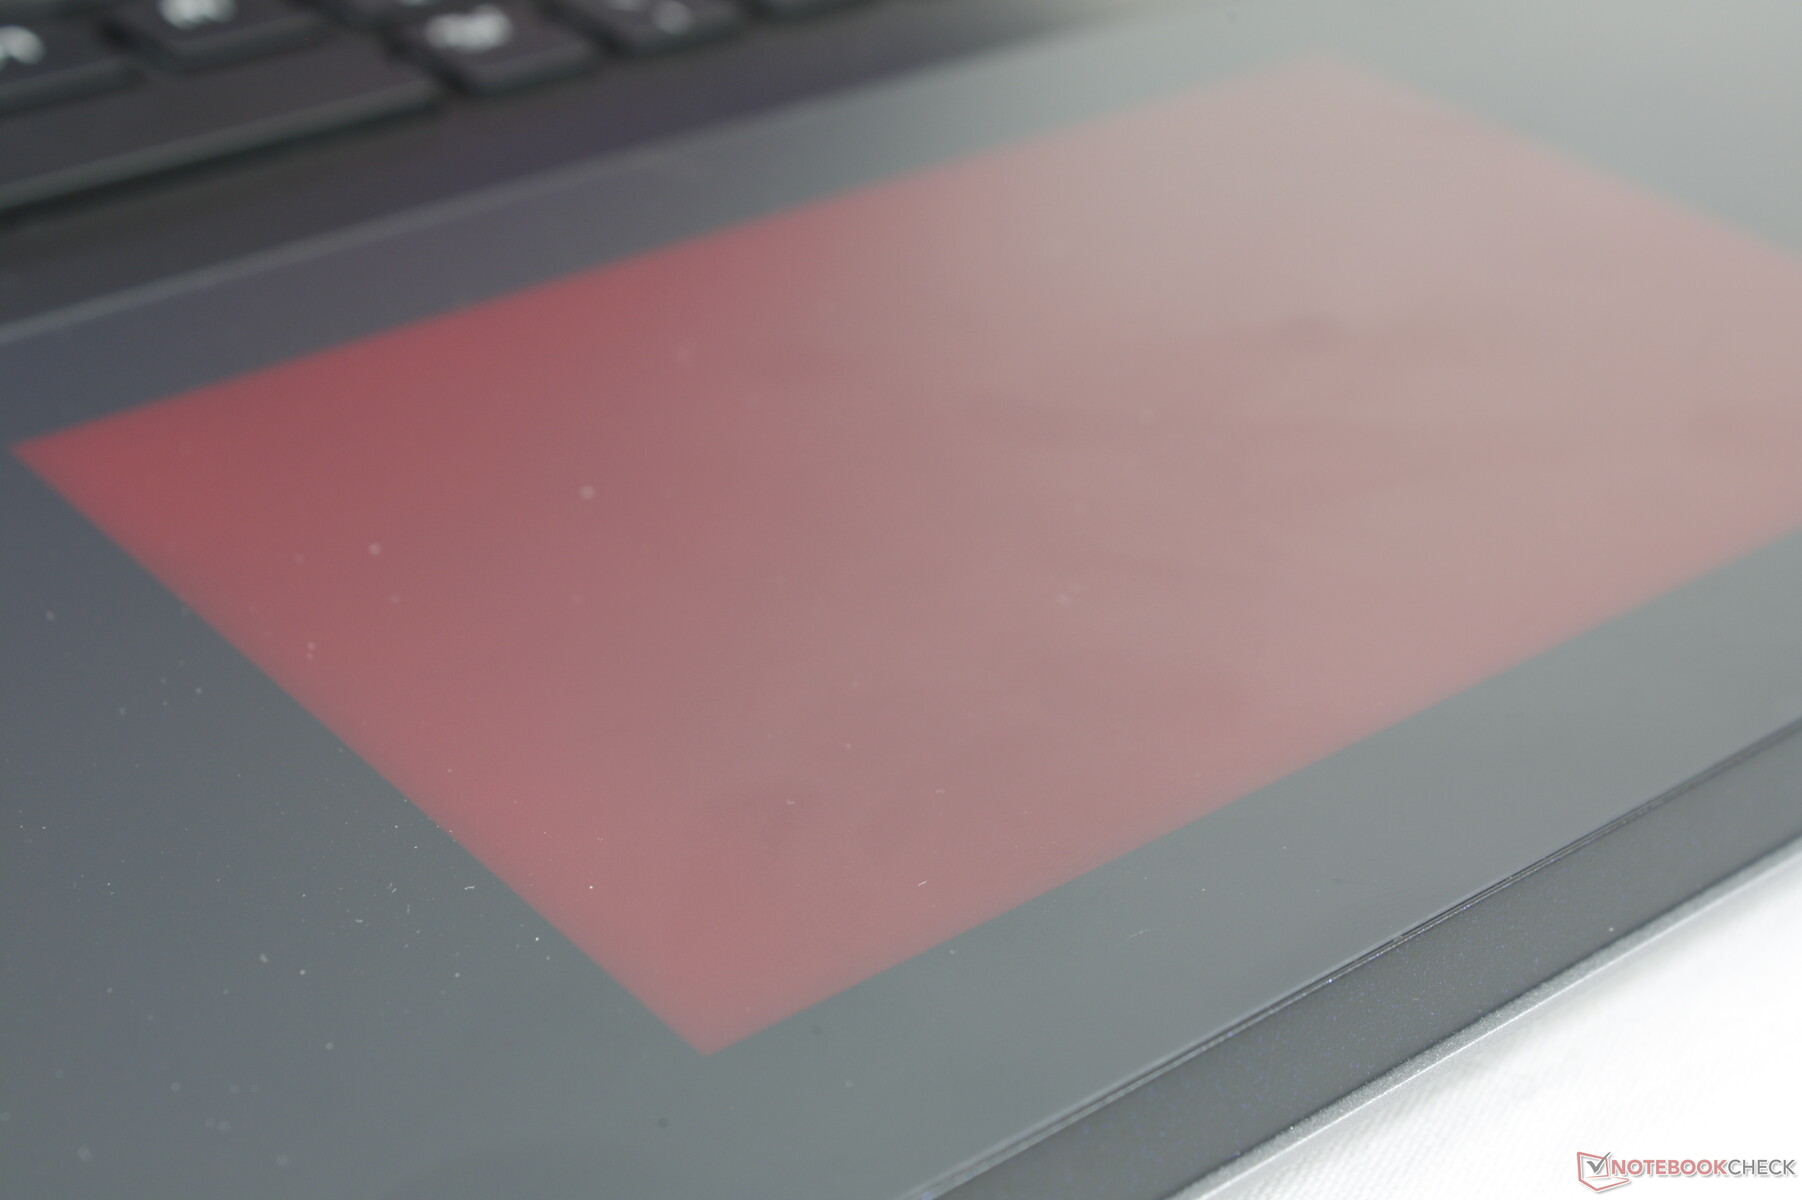
触摸板
13 x 8.2 厘米的点击板采用了 RGB 照明技术,就像某些 Alienware 机型一样。但不同的是,微星的点击板与周围的掌托完全齐平,实现了边缘到边缘的平滑无过渡。这种设计虽然时尚性感,但实用性却不如带有触感边角的传统点击板。按下鼠标来输入鼠标点击也变得更加困难和不可靠,尤其是拖放等多点触控输入。标准包装包括一个免费的 USB 鼠标,因此很明显微星在设计点击板时偏向于形式而非功能。
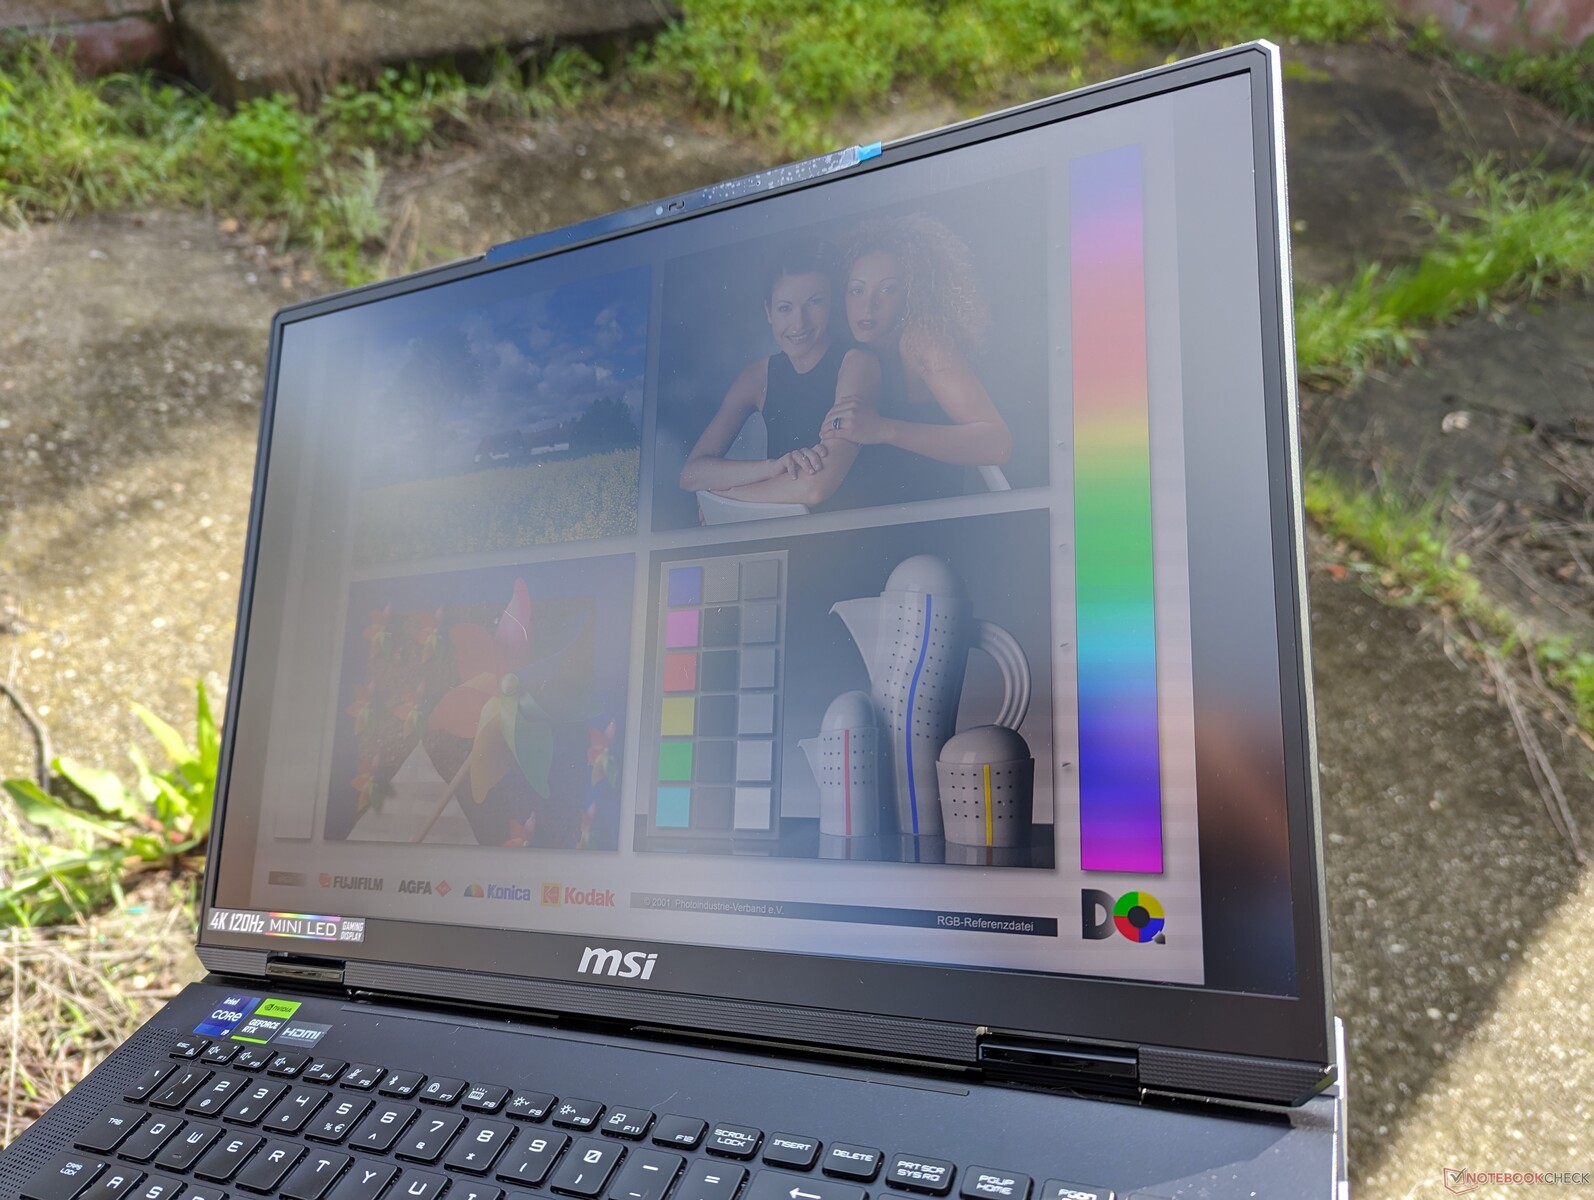
显示屏--泰坦 18 HX 的最大特色
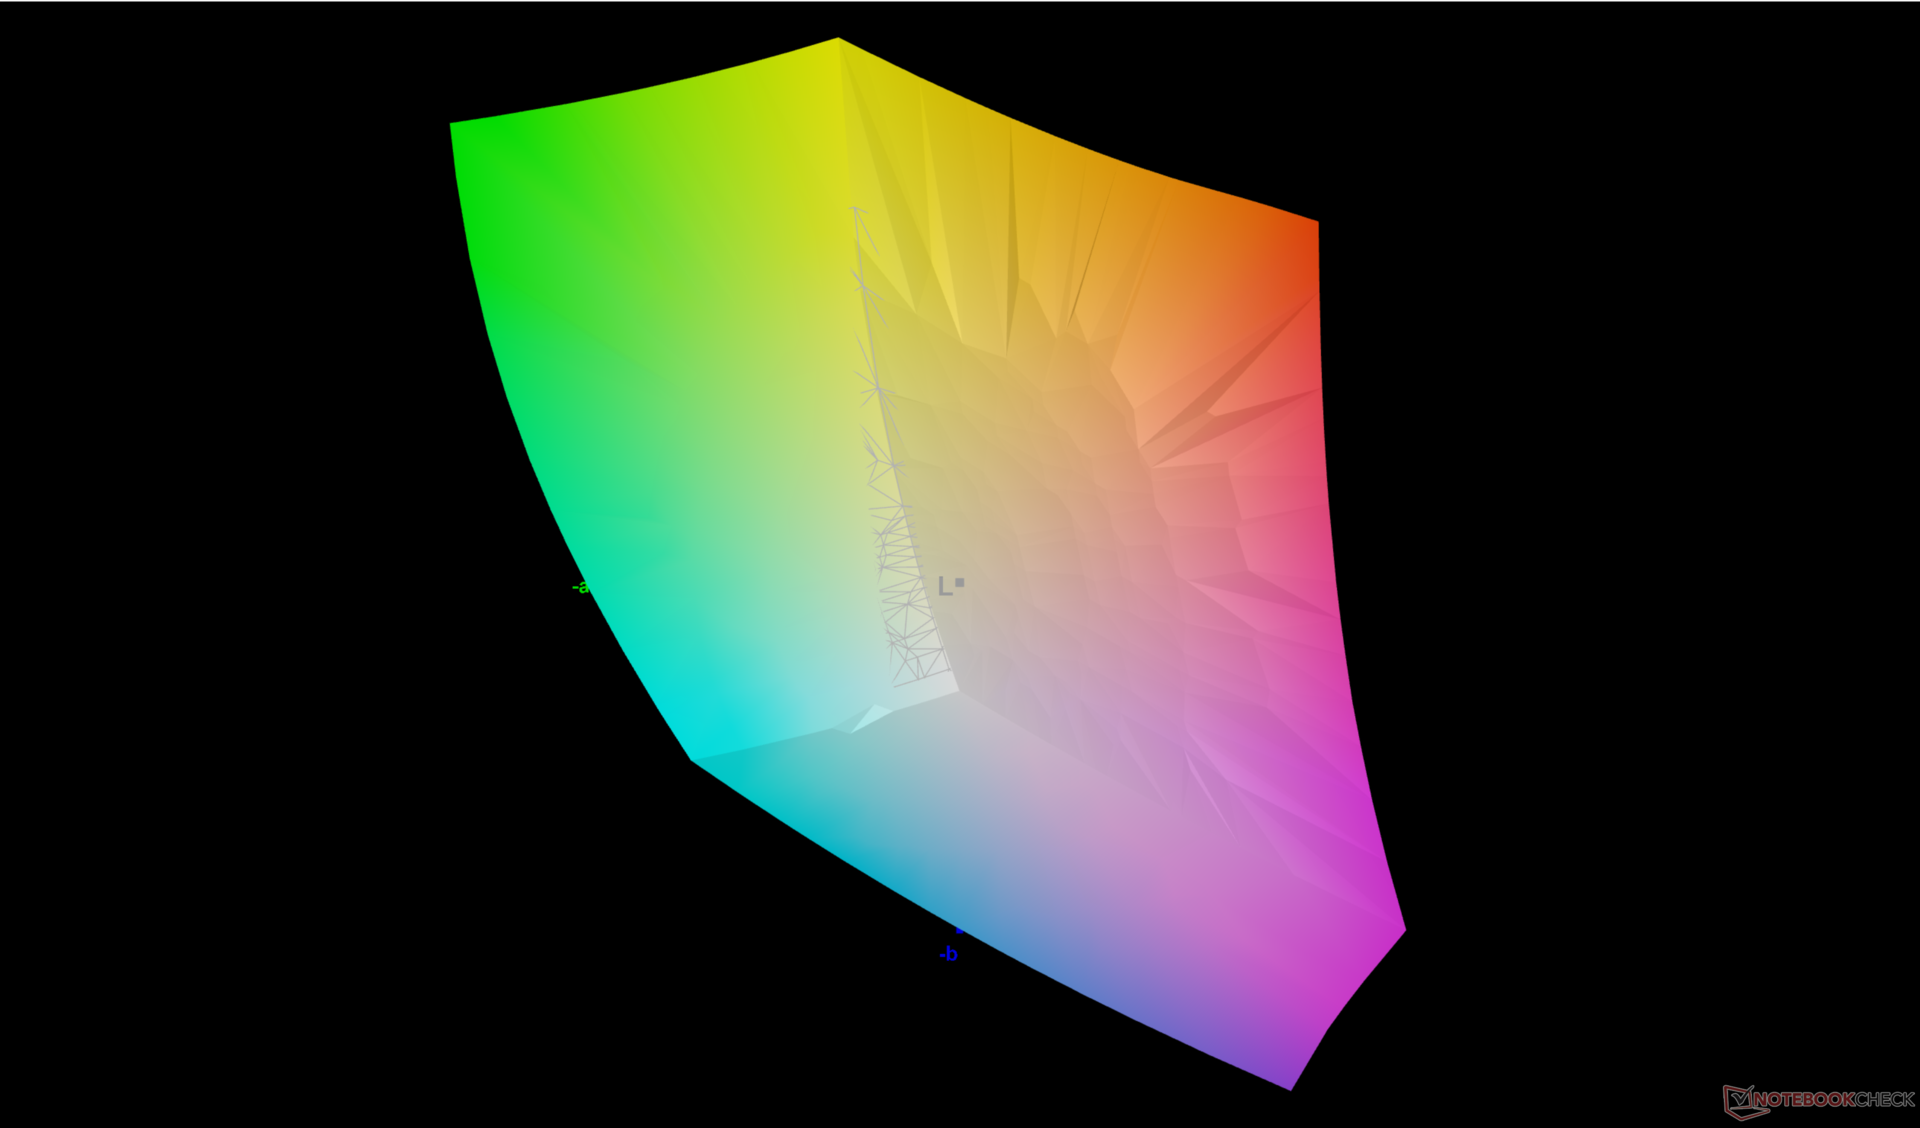
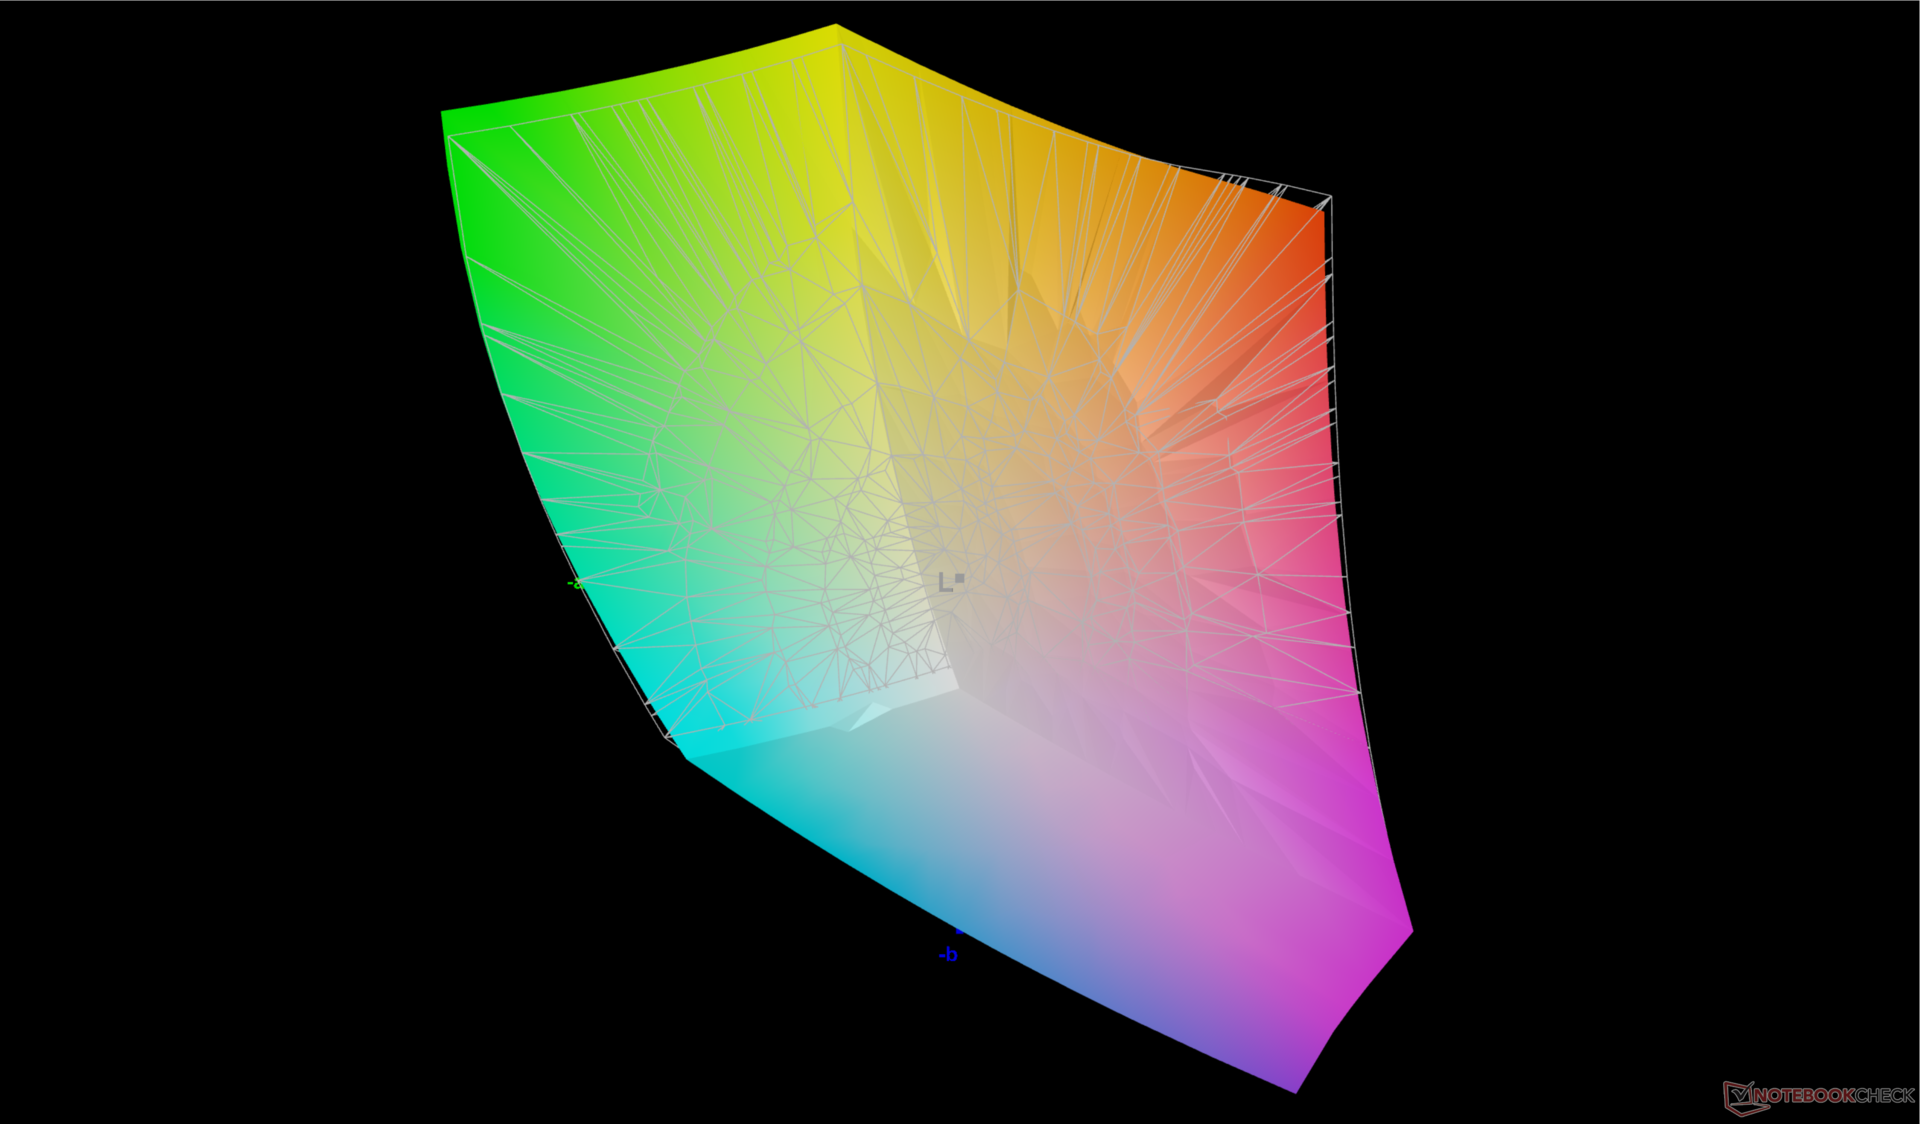
Titan 18 HX 是今年首批配备 120 Hz 4K mini-LED 显示屏的 18 英寸笔记本电脑之一。与 IPS 和 OLED 相比,mini-LED 面板的亮度要高得多,同时还能提供与 OLED 相似的 DCI-P3 色彩和黑度,从而更好地支持 HDR。在这种情况下,根据我们的色度计,Titan 18 HX 显示屏在 HDR 模式下可达到 1155 尼特,支持 HDR1000 播放。如果在 SDR 模式下,显示屏的亮度将被限制在 470 尼特左右,这与许多 IPS 面板类似。
请注意,如果使用电池供电,HDR 模式将不可用。使用电池供电时,即使禁用显示屏省电功能,最大亮度也会降至 323 尼特。我们不确定后者是否是一个错误,但在电池和电源之间,亮度的下降确实很明显。
遗憾的是,该显示器的主要缺点是不支持 G-Sync 或可变刷新率(VRR)。此外,由于其亮度上限较高,因此对功耗的要求也很高,下面的功耗部分将对此进行说明。尽管如此,这款显示屏仍然是我们所见过的笔记本电脑中最适合游戏和多媒体用途的显示屏之一。
| |||||||||||||||||||||||||
Brightness Distribution: 90 %
Center on Battery: 323 cd/m²
Contrast: ∞:1 (Black: 0 cd/m²)
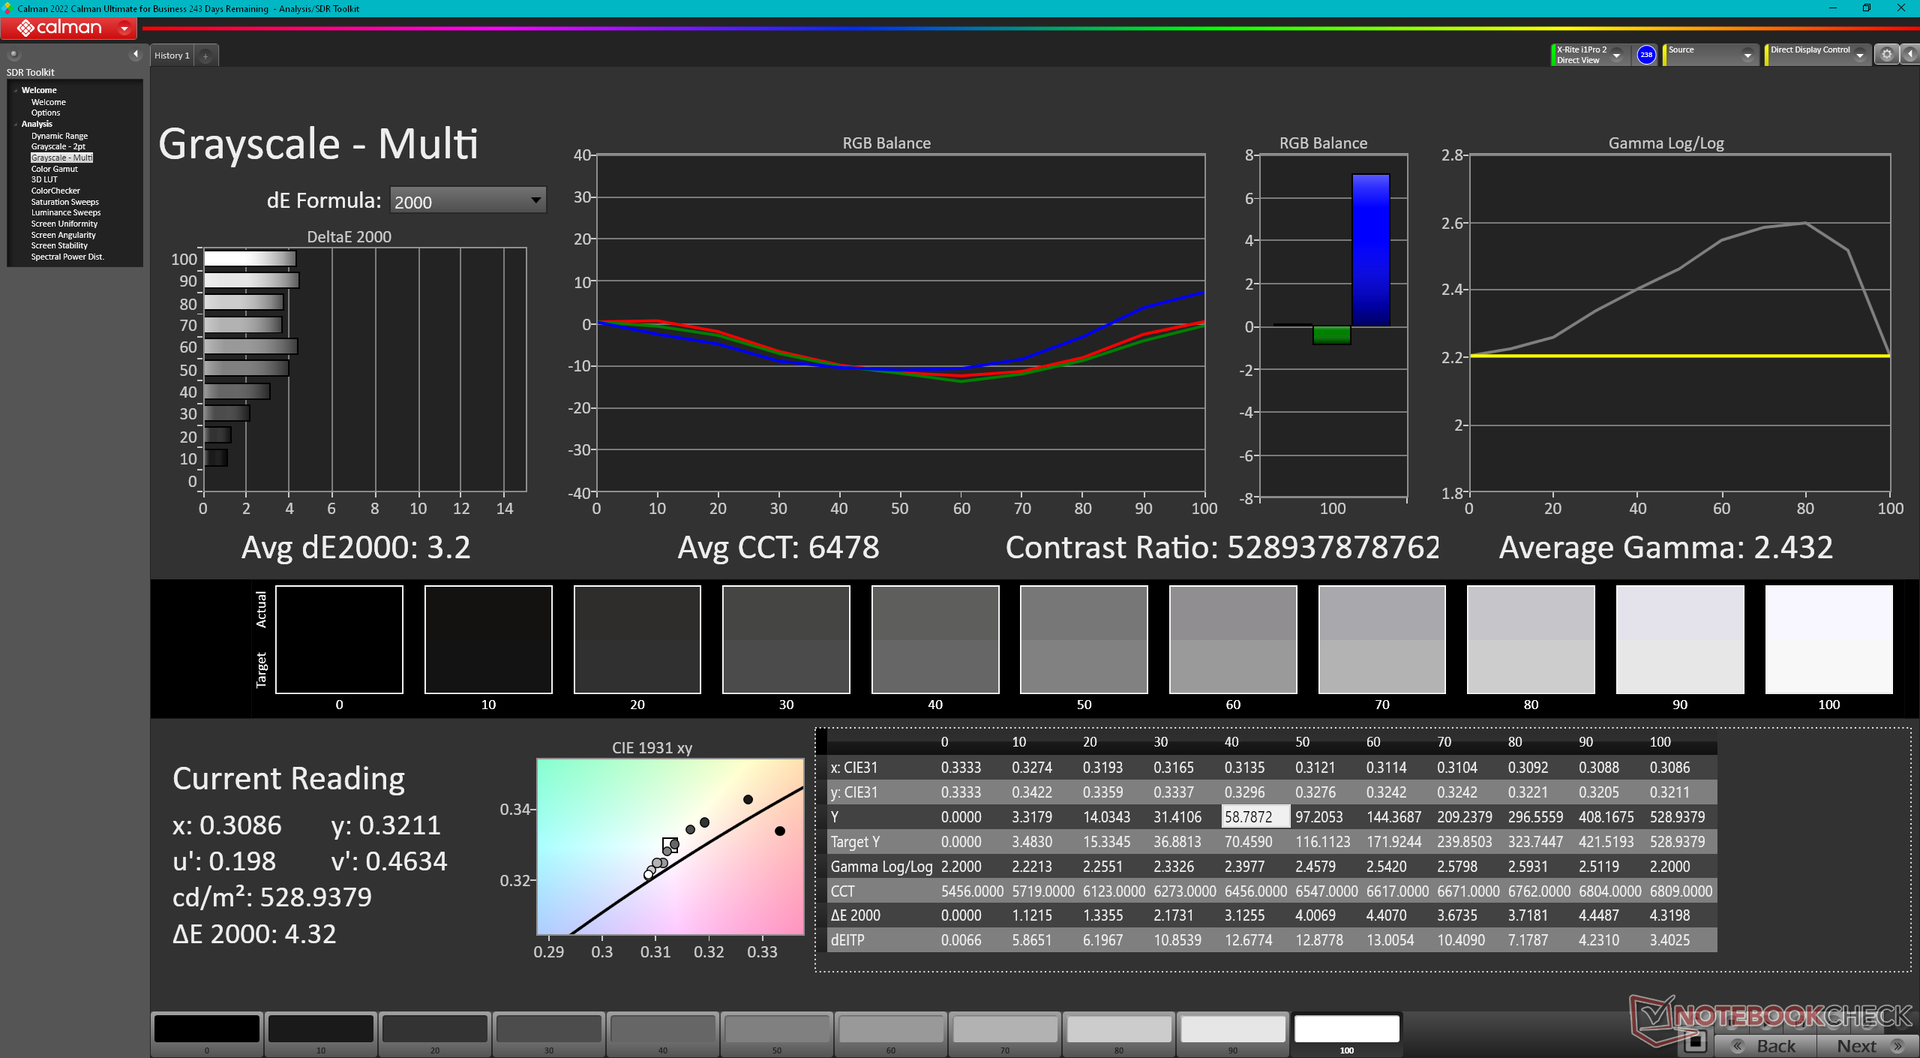
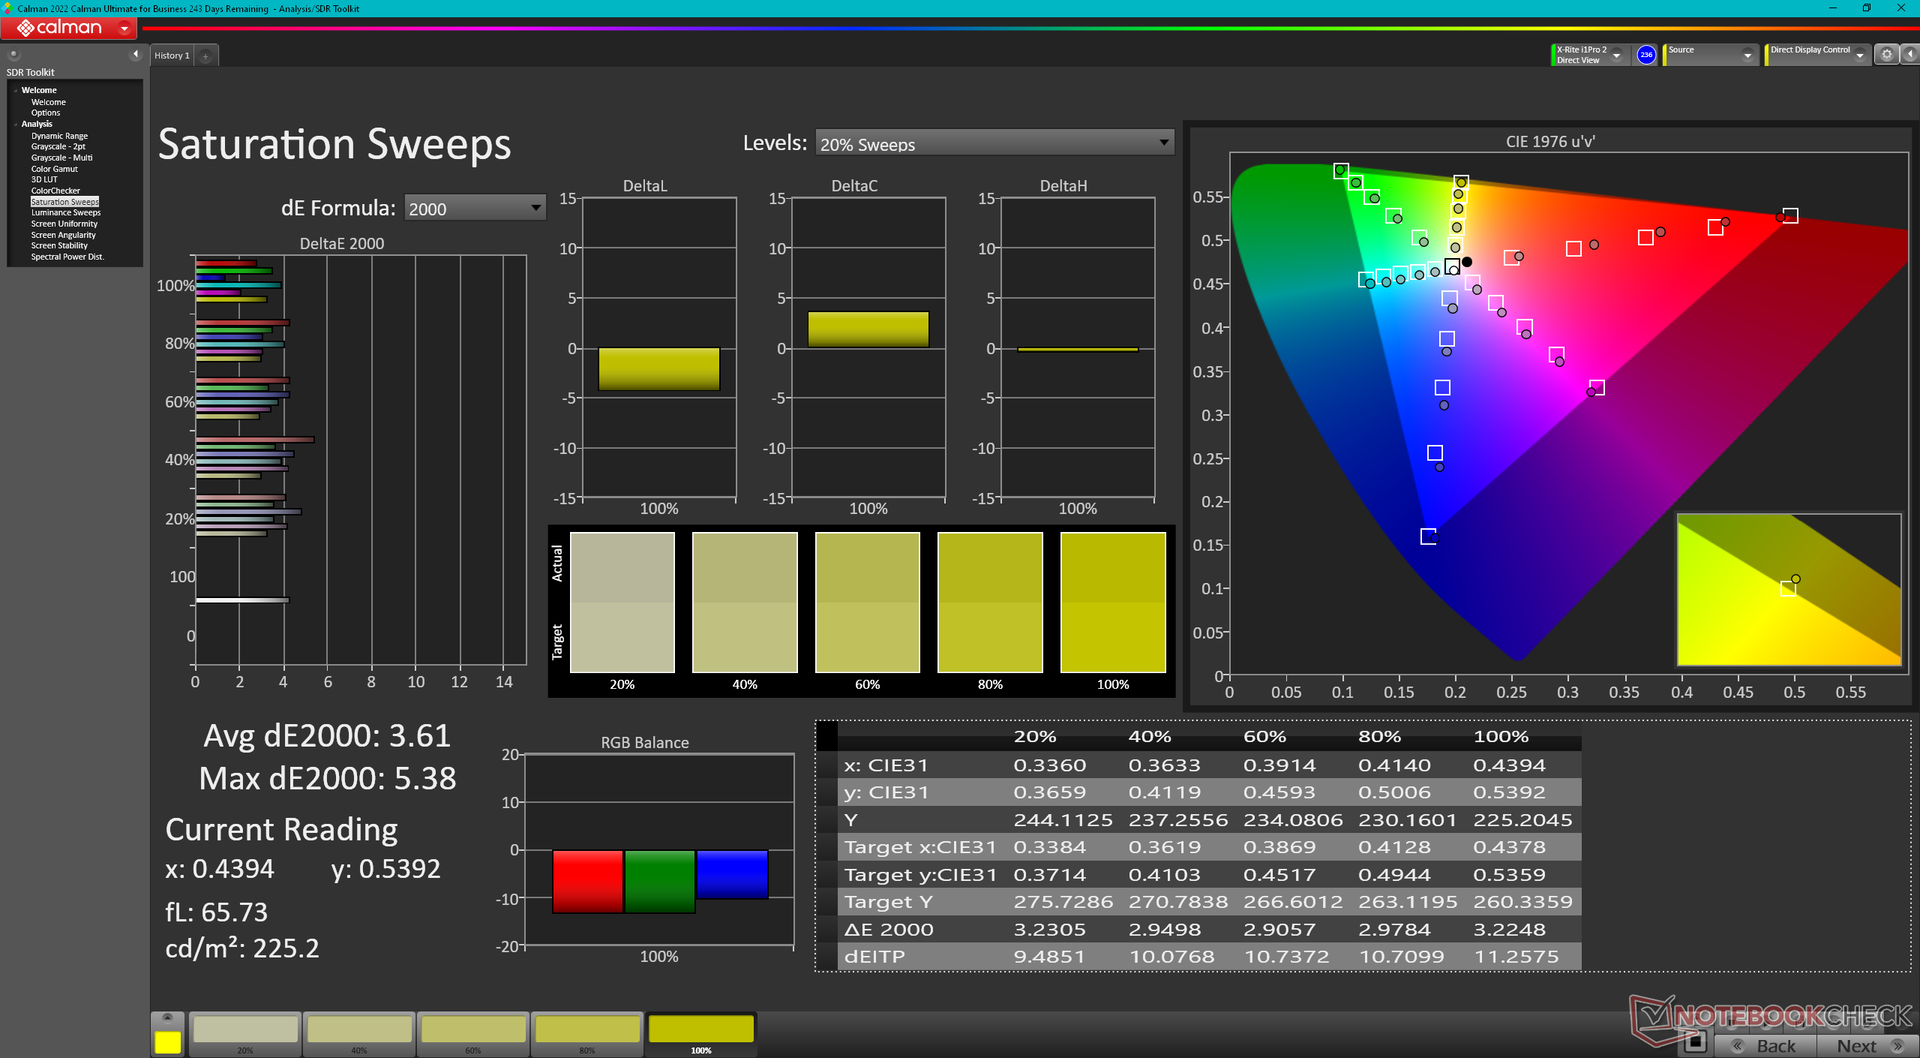
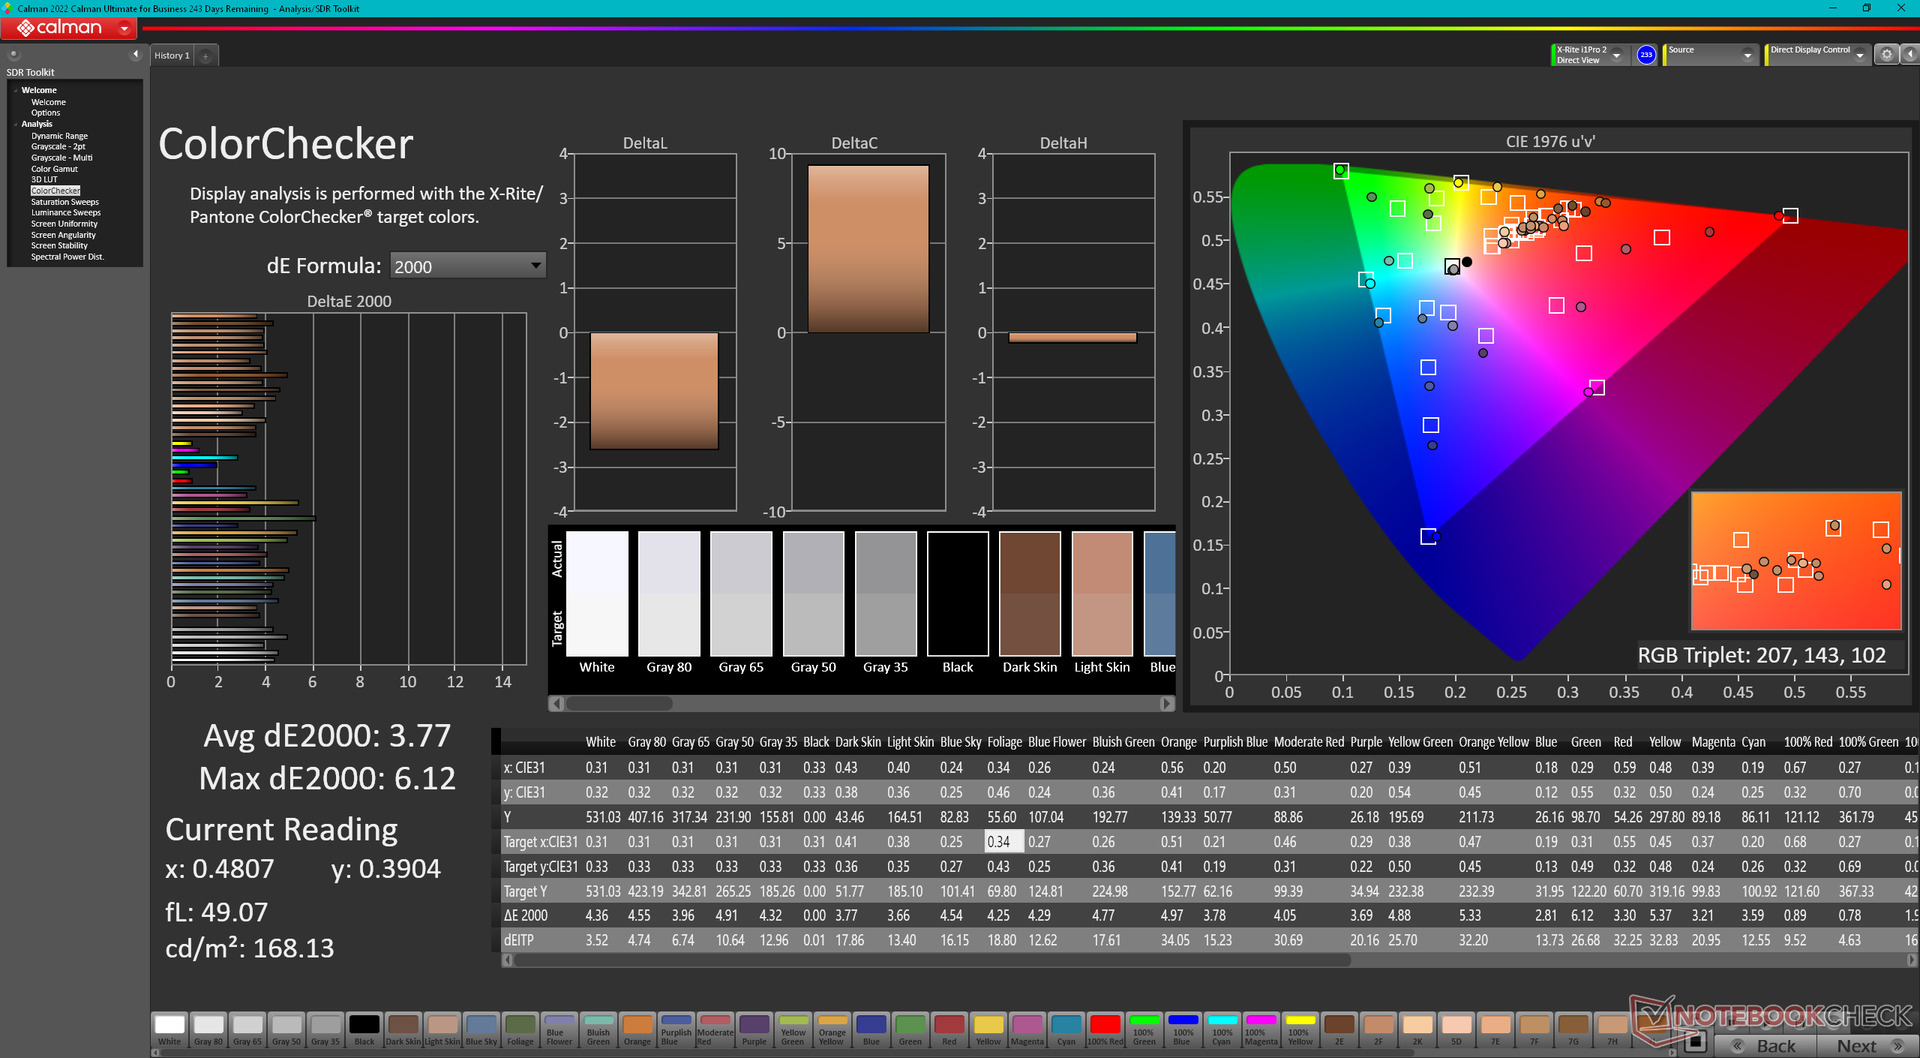
ΔE ColorChecker Calman: 3.77 | ∀{0.5-29.43 Ø4.71}
calibrated: 2.94
ΔE Greyscale Calman: 3.2 | ∀{0.09-98 Ø4.96}
86.2% AdobeRGB 1998 (Argyll 3D)
99.8% sRGB (Argyll 3D)
98.1% Display P3 (Argyll 3D)
Gamma: 2.43
CCT: 6478 K
| MSI Titan 18 HX A14VIG AU Optronics B180ZAN01.0, Mini-LED, 3840x2400, 18" | MSI Titan GT77 HX 13VI B173ZAN06.C, Mini-LED, 3840x2160, 17.3" | Alienware m18 R1 Chi Mei 180JME, IPS, 1920x1200, 18" | Asus ROG Strix G18 G814JI NE180QDM-NZ2 (BOE0B35), IPS, 2560x1600, 18" | Acer Predator Helios 18 N23Q2 AUO45A8 (B180QAN01.2), IPS, 2560x1600, 18" | Razer Blade 18 RTX 4070 AU Optronics B180QAN01.0, IPS, 2560x1600, 18" | |
|---|---|---|---|---|---|---|
| Display | 1% | 1% | -0% | 3% | -1% | |
| Display P3 Coverage (%) | 98.1 | 94.9 -3% | 97.7 0% | 98.1 0% | 99.8 2% | 96.9 -1% |
| sRGB Coverage (%) | 99.8 | 99.9 0% | 100 0% | 99.9 0% | 100 0% | 99.8 0% |
| AdobeRGB 1998 Coverage (%) | 86.2 | 92.4 7% | 89.8 4% | 85.6 -1% | 91.8 6% | 85.3 -1% |
| Response Times | -140% | 77% | 62% | 45% | 71% | |
| Response Time Grey 50% / Grey 80% * (ms) | 8.6 ? | 38.4 ? -347% | 3 ? 65% | 5.6 ? 35% | 7.6 ? 12% | 4.2 ? 51% |
| Response Time Black / White * (ms) | 81.8 ? | 26.6 ? 67% | 9.9 ? 88% | 9 ? 89% | 17.8 ? 78% | 8 ? 90% |
| PWM Frequency (Hz) | 2592 ? | 2380 ? | 2509 | |||
| Screen | -9% | 28% | 21% | -14% | 11% | |
| Brightness middle (cd/m²) | 467.5 | 606 30% | 372.8 -20% | 471 1% | 360 -23% | 549.6 18% |
| Brightness (cd/m²) | 459 | 602 31% | 367 -20% | 422 -8% | 355 -23% | 524 14% |
| Brightness Distribution (%) | 90 | 93 3% | 97 8% | 83 -8% | 92 2% | 89 -1% |
| Black Level * (cd/m²) | 0.0001 | 0.32 | 0.47 | 0.21 | 0.53 | |
| Colorchecker dE 2000 * | 3.77 | 4.8 -27% | 1.92 49% | 2.05 46% | 3.82 -1% | 3.32 12% |
| Colorchecker dE 2000 max. * | 6.12 | 8.2 -34% | 3.65 40% | 4.15 32% | 7.38 -21% | 6.63 -8% |
| Colorchecker dE 2000 calibrated * | 2.94 | 1.8 39% | 0.51 83% | 0.8 73% | 2.24 24% | 2.7 8% |
| Greyscale dE 2000 * | 3.2 | 6.5 -103% | 1.5 53% | 2.8 13% | 5.06 -58% | 2 37% |
| Gamma | 2.43 91% | 2.63 84% | 2.34 94% | 2.204 100% | 2.52 87% | 2.29 96% |
| CCT | 6478 100% | 6596 99% | 6607 98% | 7122 91% | 5657 115% | 6319 103% |
| Contrast (:1) | 6060000 | 1165 | 1002 | 1714 | 1037 | |
| Total Average (Program / Settings) | -49% /
-28% | 35% /
29% | 28% /
23% | 11% /
-0% | 27% /
18% |
* ... smaller is better
尽管 Titan 的售价不菲,但微星并没有进行 Pantone 校准。不过,平均灰度和色彩 deltaE 值仍然非常不错,分别为 3.2 和 3.77。
Display Response Times
| ↔ Response Time Black to White | ||
|---|---|---|
| 81.8 ms ... rise ↗ and fall ↘ combined | ↗ 76 ms rise | 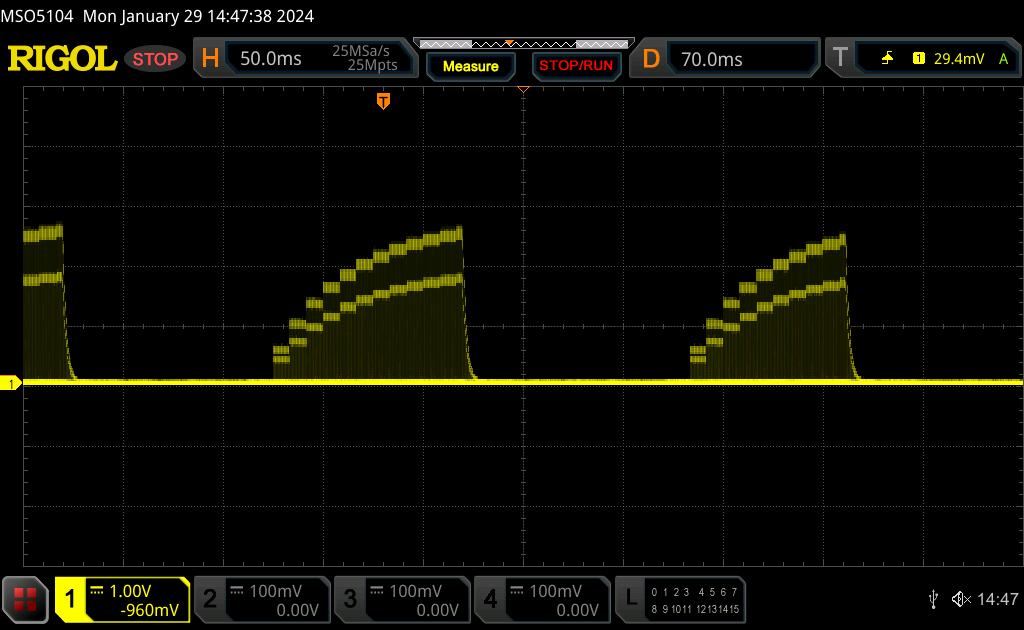 |
| ↘ 5.8 ms fall | ||
| The screen shows slow response rates in our tests and will be unsatisfactory for gamers. In comparison, all tested devices range from 0.1 (minimum) to 240 (maximum) ms. » 100 % of all devices are better. This means that the measured response time is worse than the average of all tested devices (19.8 ms). | ||
| ↔ Response Time 50% Grey to 80% Grey | ||
| 8.6 ms ... rise ↗ and fall ↘ combined | ↗ 4.2 ms rise | 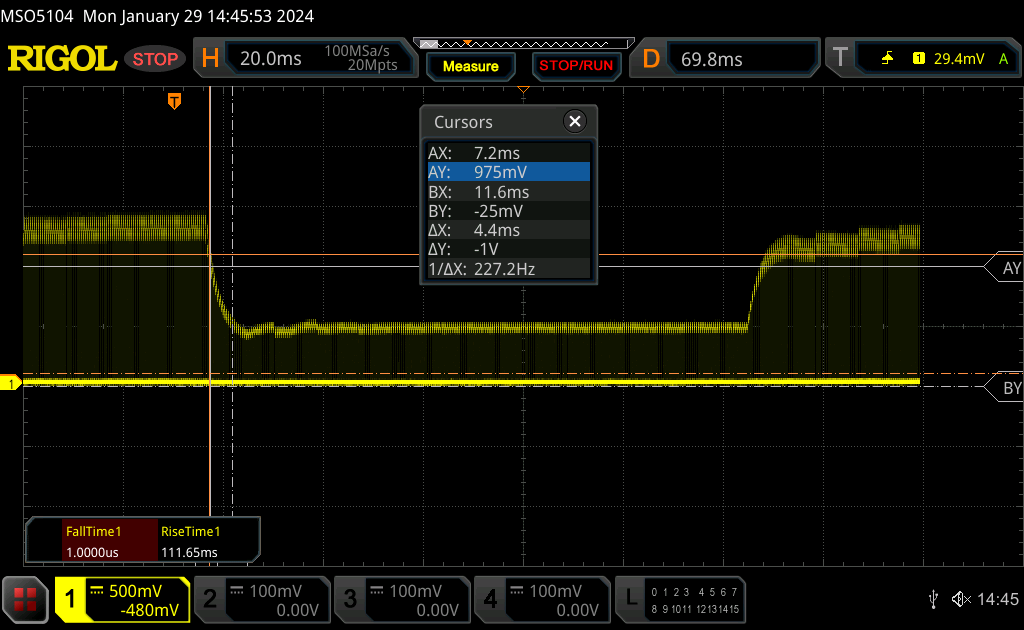 |
| ↘ 4.4 ms fall | ||
| The screen shows fast response rates in our tests and should be suited for gaming. In comparison, all tested devices range from 0.165 (minimum) to 636 (maximum) ms. » 22 % of all devices are better. This means that the measured response time is better than the average of all tested devices (30.9 ms). | ||
Screen Flickering / PWM (Pulse-Width Modulation)
| Screen flickering / PWM detected | 2592 Hz | ≤ 100 % brightness setting |  |
The display backlight flickers at 2592 Hz (worst case, e.g., utilizing PWM) Flickering detected at a brightness setting of 100 % and below. There should be no flickering or PWM above this brightness setting. The frequency of 2592 Hz is quite high, so most users sensitive to PWM should not notice any flickering. In comparison: 52 % of all tested devices do not use PWM to dim the display. If PWM was detected, an average of 7741 (minimum: 5 - maximum: 343500) Hz was measured. | |||
迷你 LED 的黑白和灰度响应时间很难通过传统方法测量。不过,我们可以主观地说,游戏时不会出现重影。快速动作显示流畅,没有拖影,体验更接近于 OLED 或响应时间极快的 IPS 显示屏。
在包括最高亮度在内的所有亮度下,闪烁的频率都很稳定。

如果在阴凉处,室外能见度还可以接受,但如果亮度更高,屏幕就会变得模糊不清。如上所述,如果使用电池供电,则无法实现超亮背光。
性能 - 第 14 代猛禽 Lake-HX
测试条件
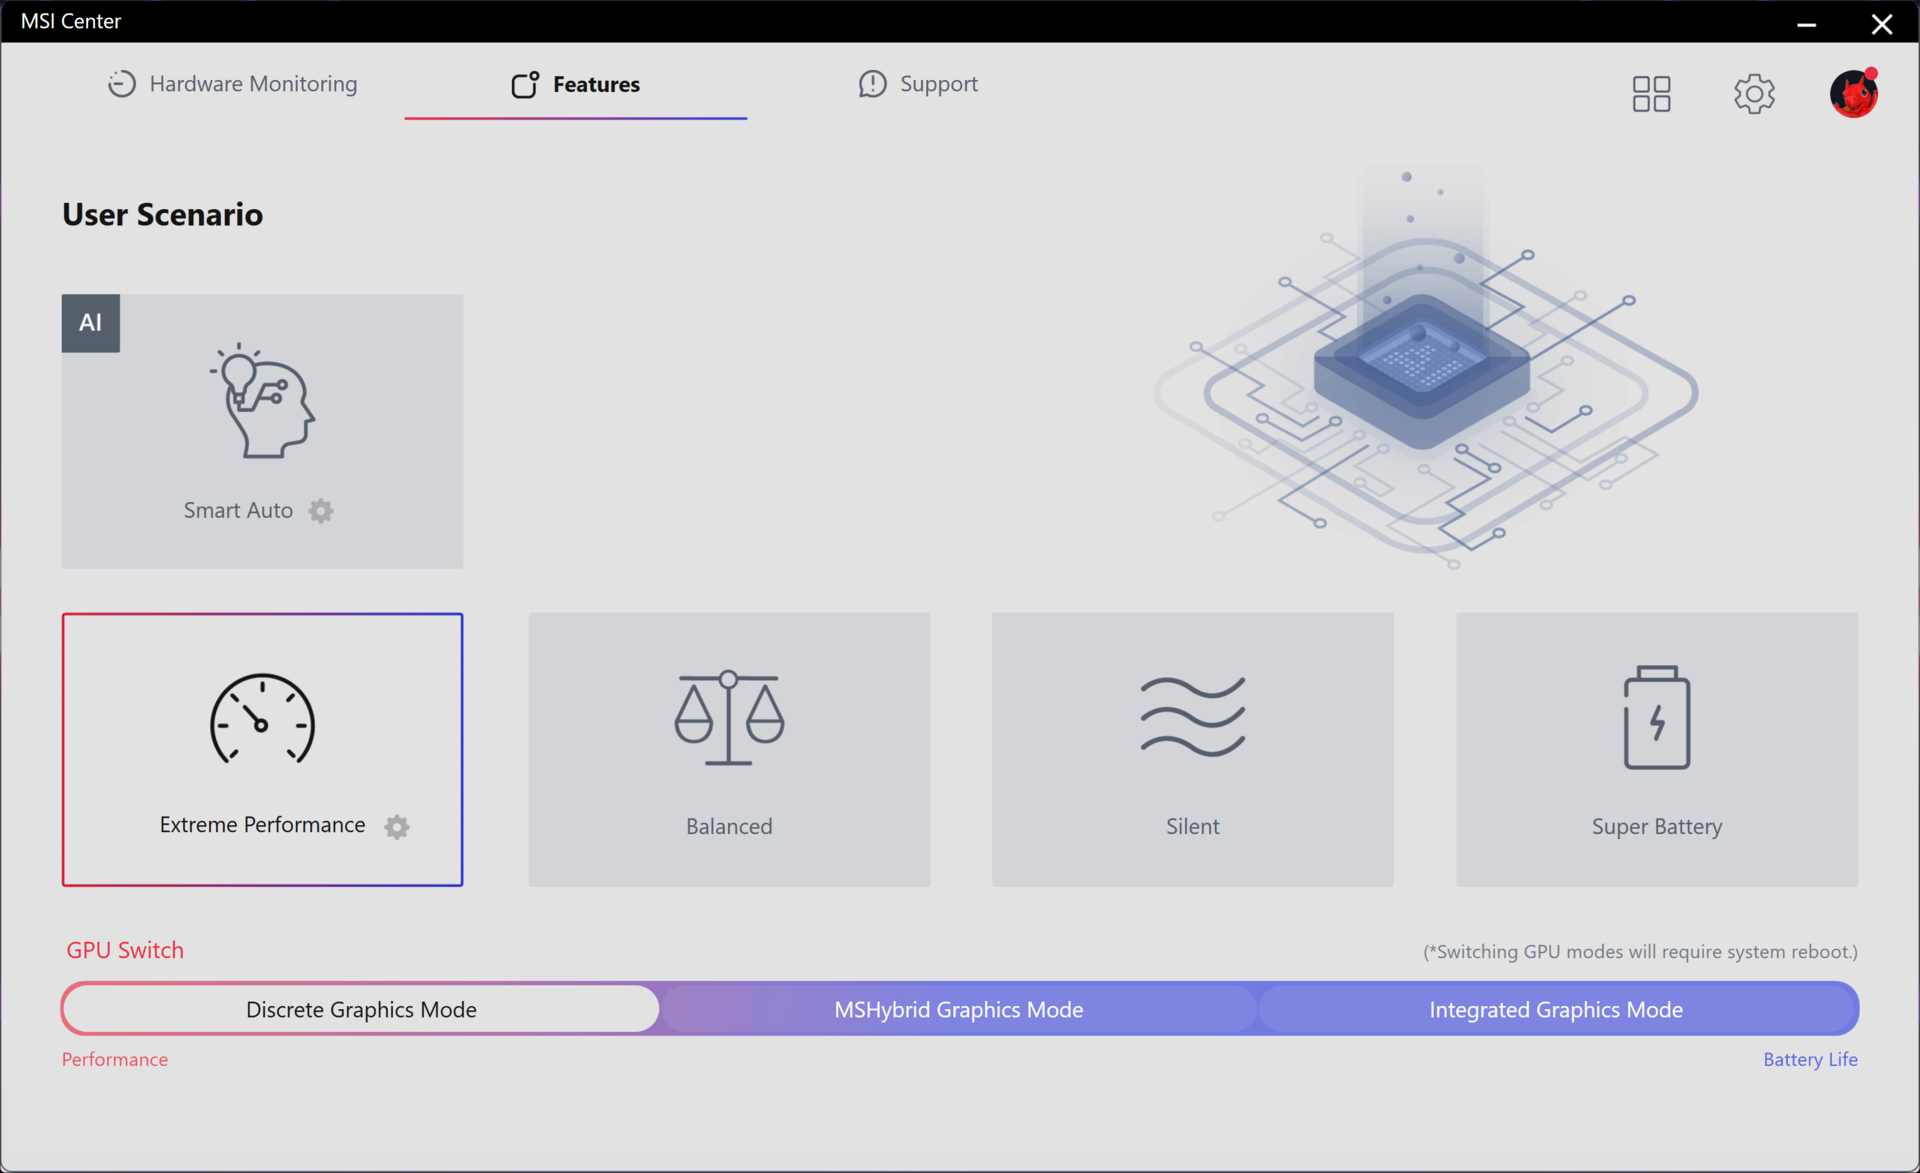
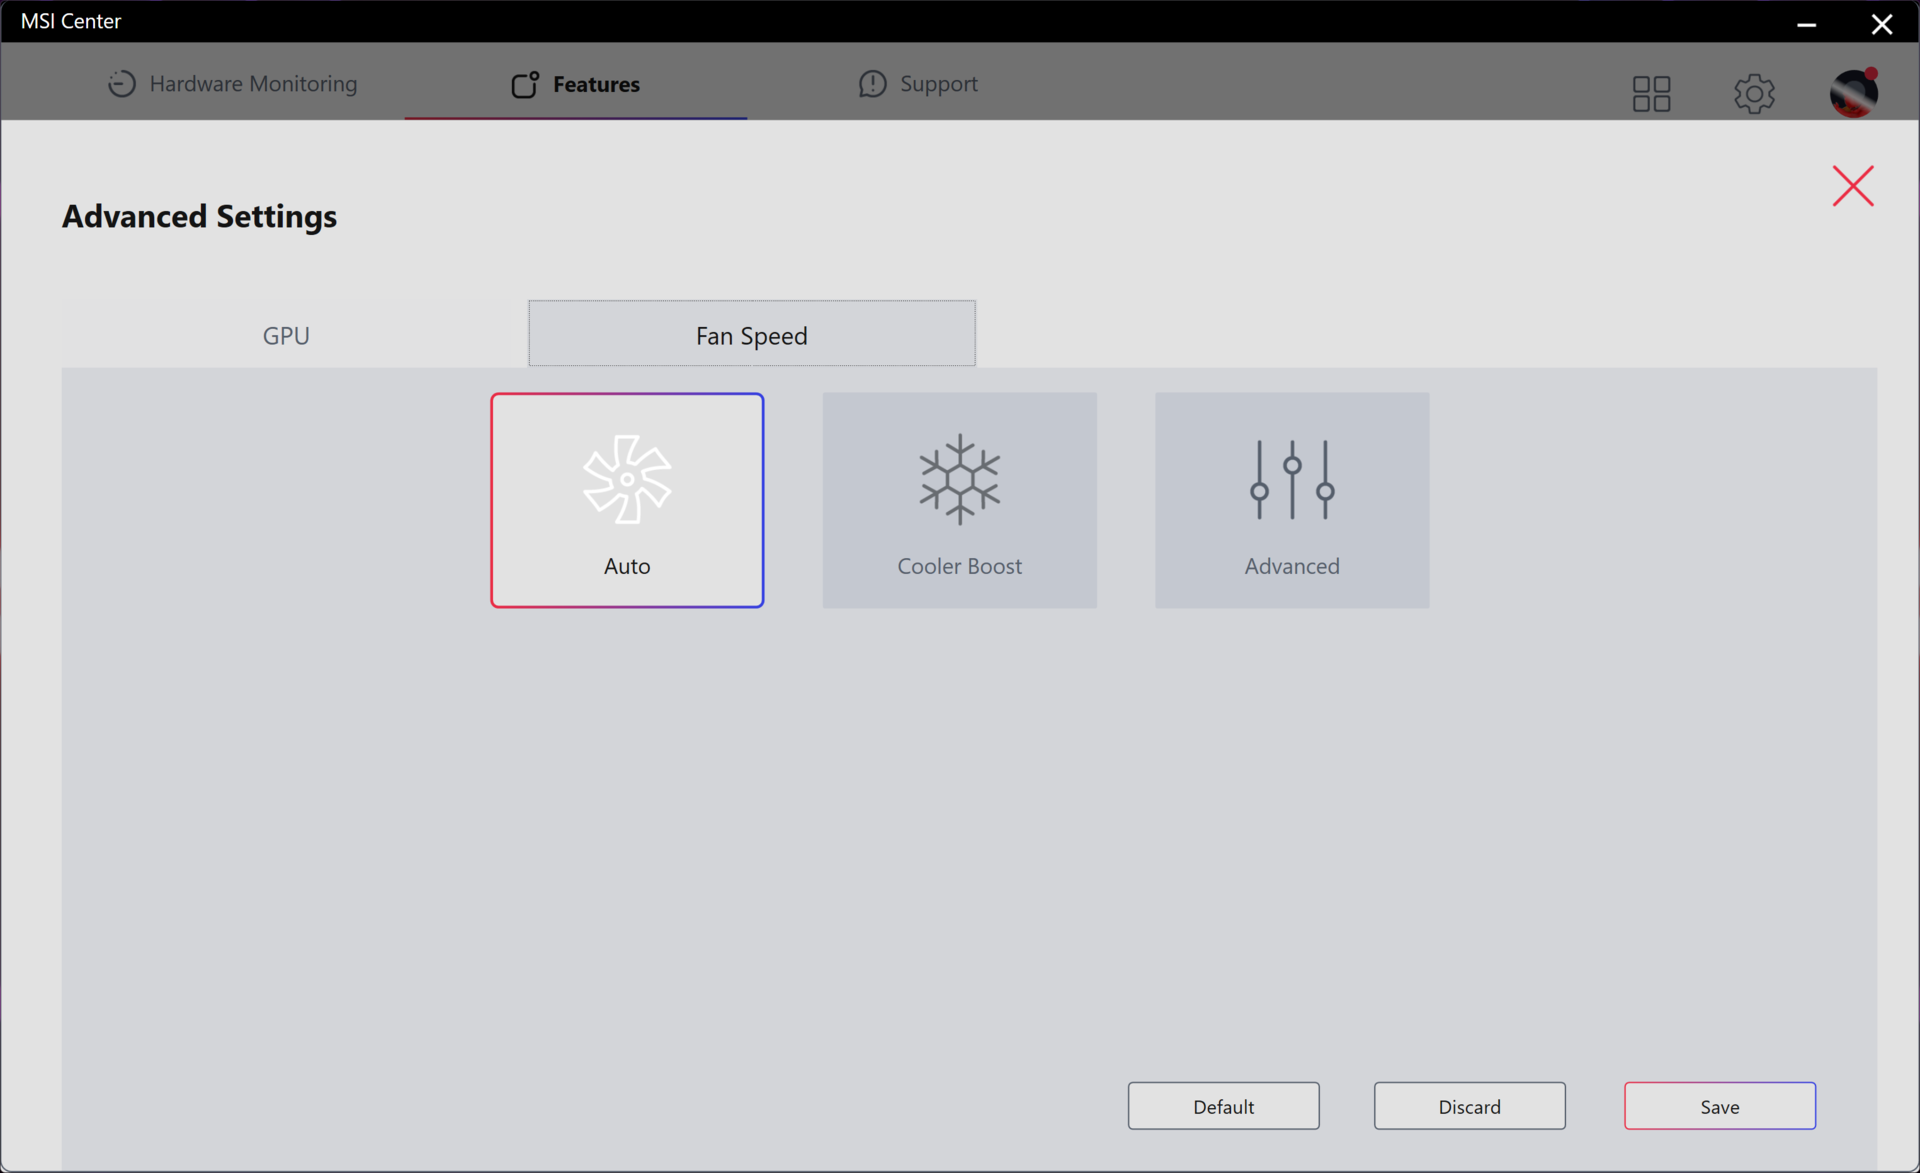
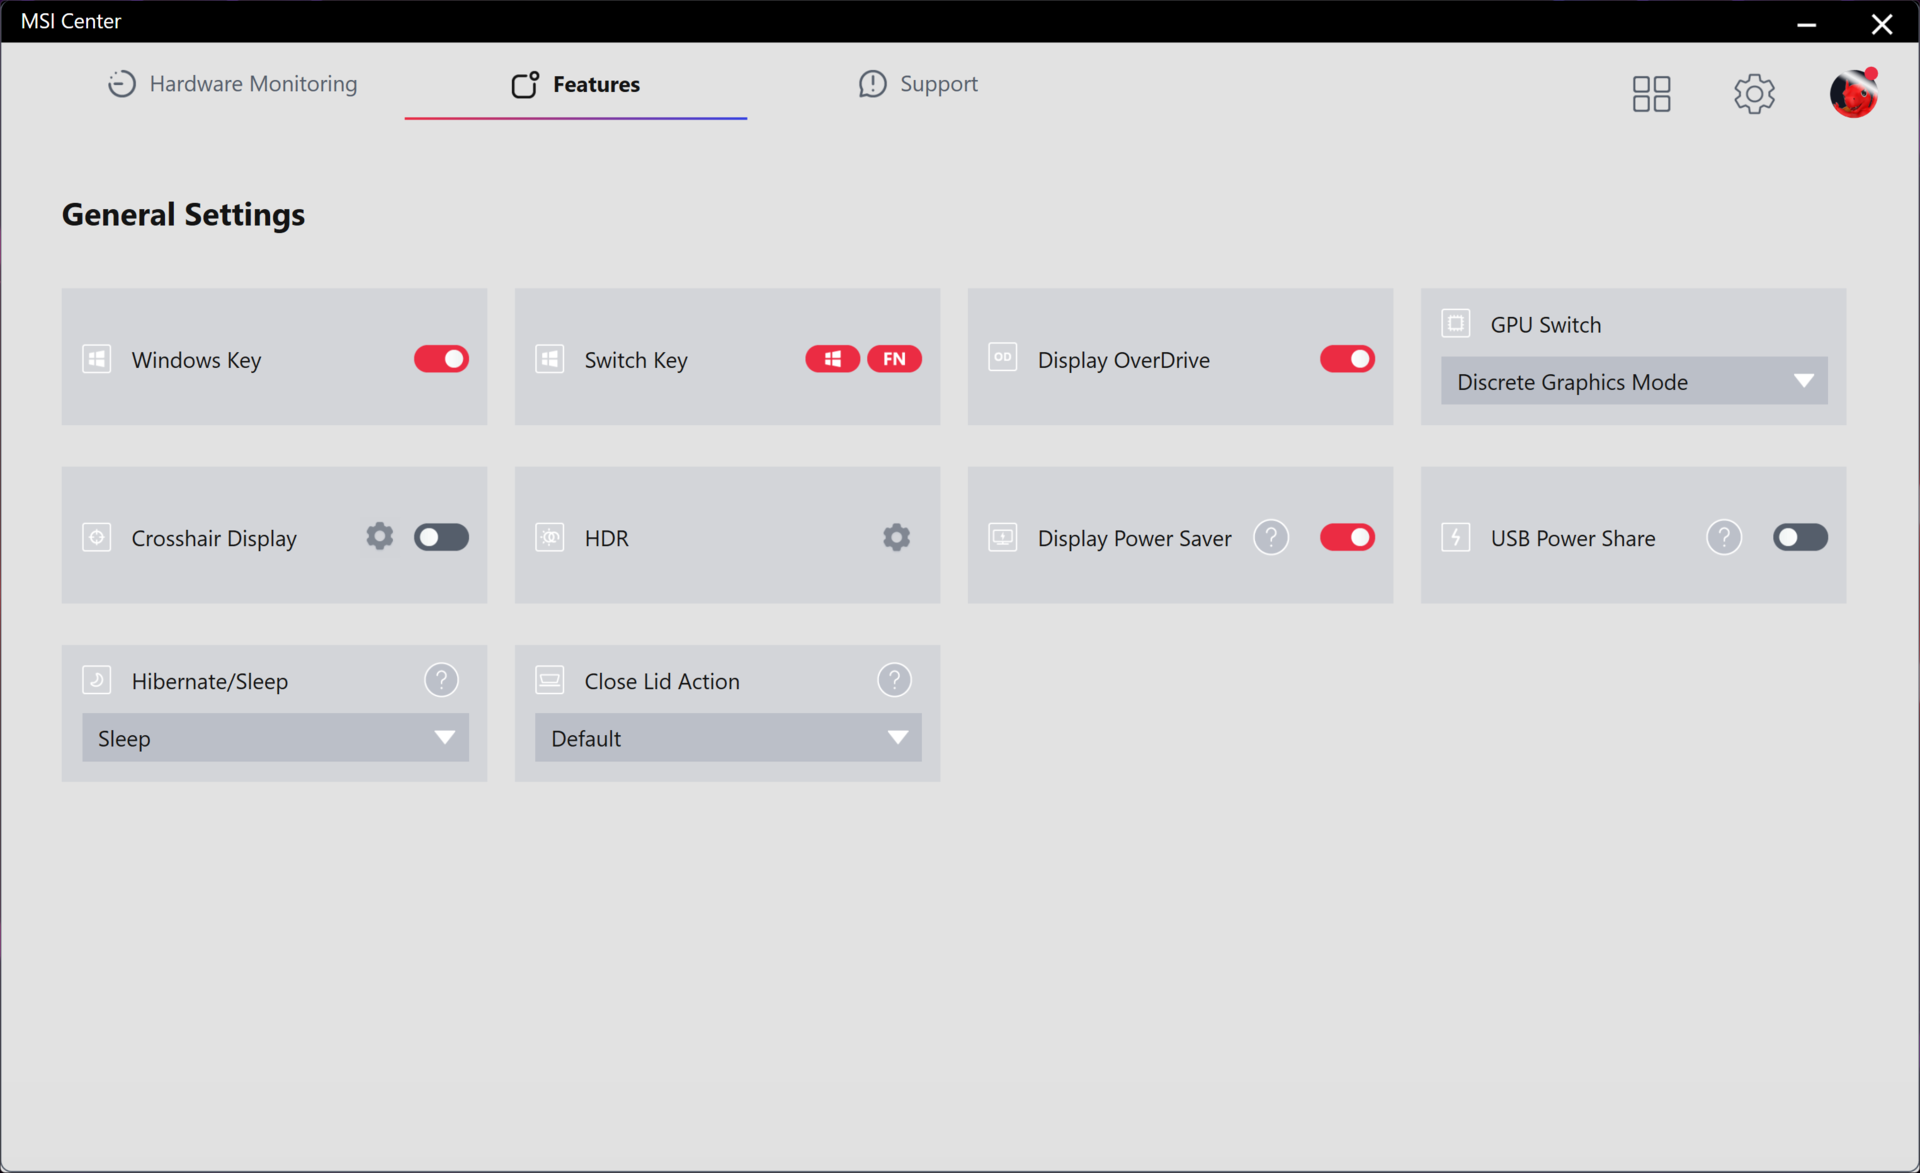
在运行以下基准测试之前,我们将微星中心设置为独立 GPU 模式和激活 Cooler Boost 的极致性能模式。Cooler Boost 是微星最大风扇速度模式的品牌名称。用户应该熟悉微星中心,因为它是监控系统状态、安装微星专用更新和切换大多数功能的控制中心。
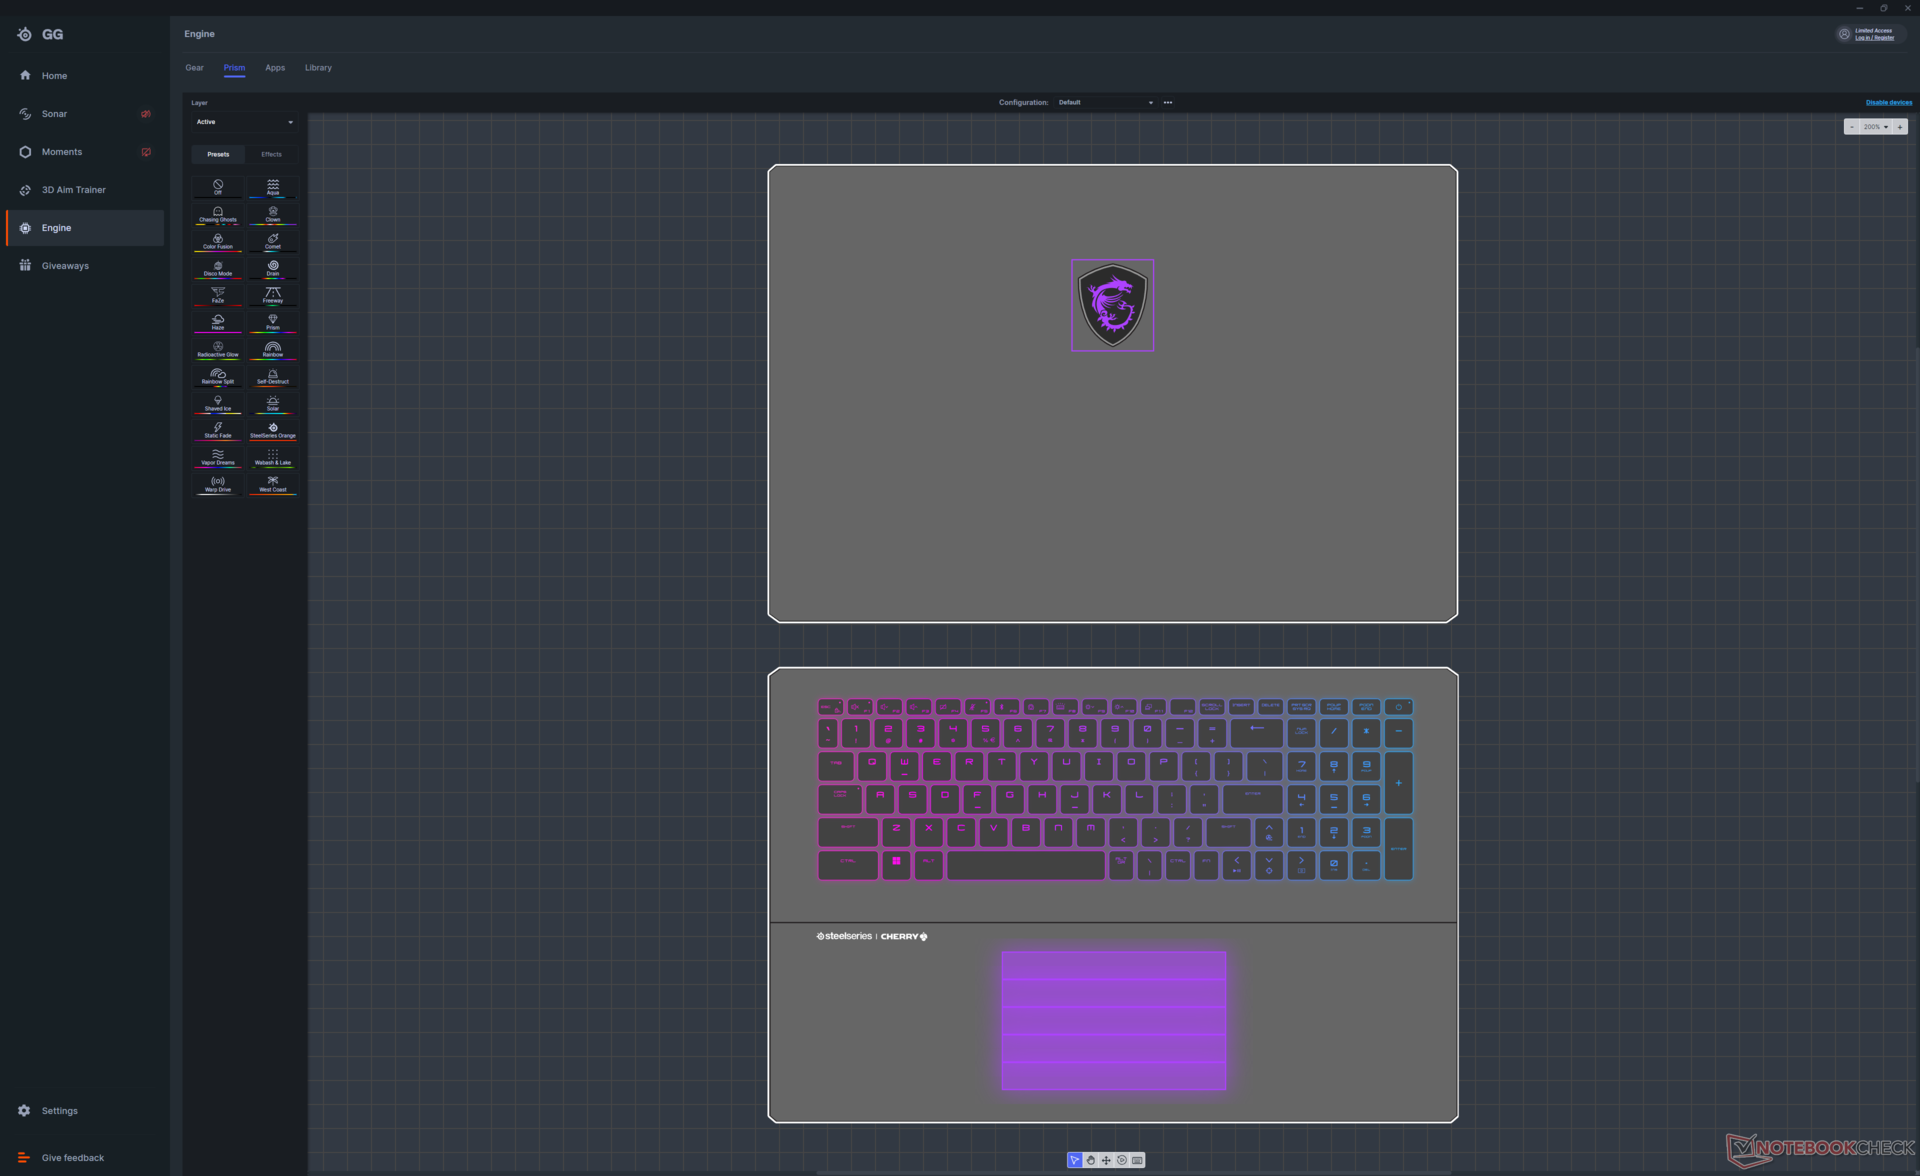
键盘照明由一个名为 SteelSeries GG 的单独预装应用程序控制。
处理器
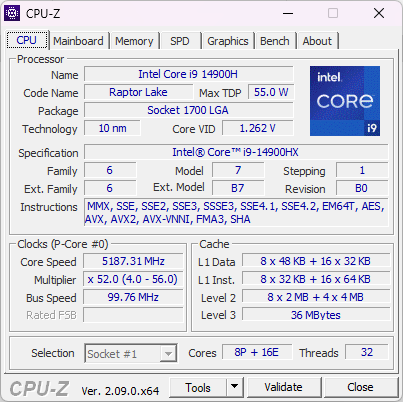
我们的 酷睿 i9-14900HX基本上与 酷睿 i9-13950HX不相上下。因此,在运行传统的重 CPU 应用程序时,不要指望会有任何明显的性能提升。与集成了 NPU 的 Meteor Lake 系列不同,第 14 代 Raptor Lake-HX CPU 也没有新的 AI 功能。
微星准备在 2 月份为配备第 14 代英特尔 CPU 的笔记本电脑推出 AI Artist 应用程序。该程序利用英特尔的人工智能加速功能,根据提示在本地生成艺术作品,而不是依赖云服务,以获得更快的用户体验。如果你对人工智能增强型应用不感兴趣,那么较旧的第 13 代英特尔 CPU 也能满足你的需求。
Cinebench R15 Multi Loop
Cinebench R23: Multi Core | Single Core
Cinebench R20: CPU (Multi Core) | CPU (Single Core)
Cinebench R15: CPU Multi 64Bit | CPU Single 64Bit
Blender: v2.79 BMW27 CPU
7-Zip 18.03: 7z b 4 | 7z b 4 -mmt1
Geekbench 6.7: Multi-Core | Single-Core
Geekbench 5.5: Multi-Core | Single-Core
HWBOT x265 Benchmark v2.2: 4k Preset
LibreOffice : 20 Documents To PDF
R Benchmark 2.5: Overall mean
| CPU Performance rating | |
| Asus ROG Strix Scar 17 G733PYV-LL053X | |
| Asus ROG Strix Scar 17 G733PY-XS96 -2! | |
| Alienware m18 R1 -2! | |
| MSI Titan GT77 HX 13VI -2! | |
| MSI Titan 18 HX A14VIG | |
| Acer Predator Helios 18 N23Q2 | |
| Average Intel Core i9-14900HX | |
| Razer Blade 18 RTX 4070 -2! | |
| Alienware m16 R1 AMD | |
| MSI Raider GE68 HX 13VG, i7-13700HX | |
| NVIDIA GeForce RTX 4070 Super Founders Edition -15! | |
| Asus TUF Gaming A17 FA707XI-NS94 | |
| Asus ROG Strix G18 G814JI -2! | |
| MSI Stealth 16 Studio A13VG -2! | |
| Dell G16 7620 -2! | |
| Alienware m17 R5 (R9 6900HX, RX 6850M XT) -2! | |
| Cinebench R23 / Multi Core | |
| Asus ROG Strix Scar 17 G733PY-XS96 | |
| MSI Titan GT77 HX 13VI | |
| Asus ROG Strix Scar 17 G733PYV-LL053X | |
| Alienware m18 R1 | |
| MSI Titan 18 HX A14VIG | |
| Acer Predator Helios 18 N23Q2 | |
| Average Intel Core i9-14900HX (17078 - 36249, n=37) | |
| Razer Blade 18 RTX 4070 | |
| Alienware m16 R1 AMD | |
| MSI Raider GE68 HX 13VG, i7-13700HX | |
| Asus ROG Strix G18 G814JI | |
| MSI Stealth 16 Studio A13VG | |
| Asus TUF Gaming A17 FA707XI-NS94 | |
| Dell G16 7620 | |
| Alienware m17 R5 (R9 6900HX, RX 6850M XT) | |
| Cinebench R23 / Single Core | |
| Average Intel Core i9-14900HX (1720 - 2245, n=37) | |
| MSI Titan 18 HX A14VIG | |
| Alienware m18 R1 | |
| MSI Titan GT77 HX 13VI | |
| Acer Predator Helios 18 N23Q2 | |
| Razer Blade 18 RTX 4070 | |
| Asus ROG Strix Scar 17 G733PYV-LL053X | |
| Asus ROG Strix G18 G814JI | |
| MSI Raider GE68 HX 13VG, i7-13700HX | |
| Asus ROG Strix Scar 17 G733PY-XS96 | |
| MSI Stealth 16 Studio A13VG | |
| Alienware m16 R1 AMD | |
| Asus TUF Gaming A17 FA707XI-NS94 | |
| Dell G16 7620 | |
| Alienware m17 R5 (R9 6900HX, RX 6850M XT) | |
| Cinebench R20 / CPU (Multi Core) | |
| Asus ROG Strix Scar 17 G733PY-XS96 | |
| Asus ROG Strix Scar 17 G733PYV-LL053X | |
| MSI Titan GT77 HX 13VI | |
| Alienware m18 R1 | |
| MSI Titan 18 HX A14VIG | |
| Acer Predator Helios 18 N23Q2 | |
| Average Intel Core i9-14900HX (6579 - 13832, n=37) | |
| Razer Blade 18 RTX 4070 | |
| Alienware m16 R1 AMD | |
| MSI Raider GE68 HX 13VG, i7-13700HX | |
| Asus ROG Strix G18 G814JI | |
| MSI Stealth 16 Studio A13VG | |
| Asus TUF Gaming A17 FA707XI-NS94 | |
| Dell G16 7620 | |
| Alienware m17 R5 (R9 6900HX, RX 6850M XT) | |
| Cinebench R20 / CPU (Single Core) | |
| Average Intel Core i9-14900HX (657 - 859, n=37) | |
| MSI Titan 18 HX A14VIG | |
| Alienware m18 R1 | |
| Acer Predator Helios 18 N23Q2 | |
| MSI Titan GT77 HX 13VI | |
| Razer Blade 18 RTX 4070 | |
| Asus ROG Strix Scar 17 G733PYV-LL053X | |
| Asus ROG Strix G18 G814JI | |
| MSI Raider GE68 HX 13VG, i7-13700HX | |
| Asus ROG Strix Scar 17 G733PY-XS96 | |
| MSI Stealth 16 Studio A13VG | |
| Alienware m16 R1 AMD | |
| Asus TUF Gaming A17 FA707XI-NS94 | |
| Dell G16 7620 | |
| Alienware m17 R5 (R9 6900HX, RX 6850M XT) | |
| Cinebench R15 / CPU Multi 64Bit | |
| Asus ROG Strix Scar 17 G733PYV-LL053X | |
| Asus ROG Strix Scar 17 G733PY-XS96 | |
| MSI Titan GT77 HX 13VI | |
| Alienware m18 R1 | |
| MSI Titan 18 HX A14VIG | |
| Acer Predator Helios 18 N23Q2 | |
| Razer Blade 18 RTX 4070 | |
| Average Intel Core i9-14900HX (3263 - 5589, n=38) | |
| Alienware m16 R1 AMD | |
| MSI Raider GE68 HX 13VG, i7-13700HX | |
| Asus ROG Strix G18 G814JI | |
| MSI Stealth 16 Studio A13VG | |
| Asus TUF Gaming A17 FA707XI-NS94 | |
| Dell G16 7620 | |
| Alienware m17 R5 (R9 6900HX, RX 6850M XT) | |
| Cinebench R15 / CPU Single 64Bit | |
| Asus ROG Strix Scar 17 G733PYV-LL053X | |
| Asus ROG Strix Scar 17 G733PY-XS96 | |
| Average Intel Core i9-14900HX (247 - 323, n=37) | |
| Alienware m18 R1 | |
| MSI Titan GT77 HX 13VI | |
| MSI Titan 18 HX A14VIG | |
| Razer Blade 18 RTX 4070 | |
| Alienware m16 R1 AMD | |
| Acer Predator Helios 18 N23Q2 | |
| Asus TUF Gaming A17 FA707XI-NS94 | |
| Asus ROG Strix G18 G814JI | |
| MSI Stealth 16 Studio A13VG | |
| MSI Raider GE68 HX 13VG, i7-13700HX | |
| Alienware m17 R5 (R9 6900HX, RX 6850M XT) | |
| Dell G16 7620 | |
| 7-Zip 18.03 / 7z b 4 -mmt1 | |
| Asus ROG Strix Scar 17 G733PY-XS96 | |
| Asus ROG Strix Scar 17 G733PYV-LL053X | |
| Average Intel Core i9-14900HX (5452 - 7545, n=37) | |
| Alienware m16 R1 AMD | |
| Acer Predator Helios 18 N23Q2 | |
| MSI Titan GT77 HX 13VI | |
| Alienware m18 R1 | |
| Razer Blade 18 RTX 4070 | |
| Asus TUF Gaming A17 FA707XI-NS94 | |
| MSI Titan 18 HX A14VIG | |
| MSI Raider GE68 HX 13VG, i7-13700HX | |
| Asus ROG Strix G18 G814JI | |
| MSI Stealth 16 Studio A13VG | |
| Alienware m17 R5 (R9 6900HX, RX 6850M XT) | |
| Dell G16 7620 | |
| Geekbench 6.7 / Multi-Core | |
| Acer Predator Helios 18 N23Q2 | |
| Average Intel Core i9-14900HX (13158 - 19665, n=37) | |
| Asus ROG Strix Scar 17 G733PYV-LL053X | |
| MSI Titan 18 HX A14VIG | |
| MSI Raider GE68 HX 13VG, i7-13700HX | |
| Alienware m16 R1 AMD | |
| Asus TUF Gaming A17 FA707XI-NS94 | |
| Geekbench 6.7 / Single-Core | |
| Average Intel Core i9-14900HX (2419 - 3129, n=37) | |
| Asus ROG Strix Scar 17 G733PYV-LL053X | |
| Acer Predator Helios 18 N23Q2 | |
| MSI Titan 18 HX A14VIG | |
| Asus TUF Gaming A17 FA707XI-NS94 | |
| Alienware m16 R1 AMD | |
| MSI Raider GE68 HX 13VG, i7-13700HX | |
| Geekbench 5.5 / Multi-Core | |
| Alienware m18 R1 | |
| MSI Titan GT77 HX 13VI | |
| Acer Predator Helios 18 N23Q2 | |
| Razer Blade 18 RTX 4070 | |
| Asus ROG Strix Scar 17 G733PYV-LL053X | |
| Average Intel Core i9-14900HX (8618 - 23194, n=37) | |
| Asus ROG Strix Scar 17 G733PY-XS96 | |
| MSI Titan 18 HX A14VIG | |
| MSI Raider GE68 HX 13VG, i7-13700HX | |
| Alienware m16 R1 AMD | |
| Asus ROG Strix G18 G814JI | |
| MSI Stealth 16 Studio A13VG | |
| Dell G16 7620 | |
| Asus TUF Gaming A17 FA707XI-NS94 | |
| Alienware m17 R5 (R9 6900HX, RX 6850M XT) | |
| Geekbench 5.5 / Single-Core | |
| Asus ROG Strix Scar 17 G733PYV-LL053X | |
| MSI Titan 18 HX A14VIG | |
| Average Intel Core i9-14900HX (1669 - 2210, n=37) | |
| Alienware m18 R1 | |
| Acer Predator Helios 18 N23Q2 | |
| Asus ROG Strix Scar 17 G733PY-XS96 | |
| MSI Titan GT77 HX 13VI | |
| Razer Blade 18 RTX 4070 | |
| Asus TUF Gaming A17 FA707XI-NS94 | |
| Alienware m16 R1 AMD | |
| MSI Raider GE68 HX 13VG, i7-13700HX | |
| Asus ROG Strix G18 G814JI | |
| MSI Stealth 16 Studio A13VG | |
| Dell G16 7620 | |
| Alienware m17 R5 (R9 6900HX, RX 6850M XT) | |
| HWBOT x265 Benchmark v2.2 / 4k Preset | |
| Asus ROG Strix Scar 17 G733PY-XS96 | |
| Asus ROG Strix Scar 17 G733PYV-LL053X | |
| Alienware m18 R1 | |
| MSI Titan GT77 HX 13VI | |
| Razer Blade 18 RTX 4070 | |
| MSI Titan 18 HX A14VIG | |
| Acer Predator Helios 18 N23Q2 | |
| Alienware m16 R1 AMD | |
| Average Intel Core i9-14900HX (16.8 - 38.9, n=37) | |
| MSI Raider GE68 HX 13VG, i7-13700HX | |
| Asus ROG Strix G18 G814JI | |
| Asus TUF Gaming A17 FA707XI-NS94 | |
| MSI Stealth 16 Studio A13VG | |
| Dell G16 7620 | |
| Alienware m17 R5 (R9 6900HX, RX 6850M XT) | |
| LibreOffice / 20 Documents To PDF | |
| Asus ROG Strix G18 G814JI | |
| Alienware m17 R5 (R9 6900HX, RX 6850M XT) | |
| MSI Stealth 16 Studio A13VG | |
| Dell G16 7620 | |
| MSI Raider GE68 HX 13VG, i7-13700HX | |
| Acer Predator Helios 18 N23Q2 | |
| Asus TUF Gaming A17 FA707XI-NS94 | |
| Alienware m18 R1 | |
| MSI Titan GT77 HX 13VI | |
| MSI Titan 18 HX A14VIG | |
| Razer Blade 18 RTX 4070 | |
| Average Intel Core i9-14900HX (19 - 85.1, n=37) | |
| Alienware m16 R1 AMD | |
| Asus ROG Strix Scar 17 G733PYV-LL053X | |
| Asus ROG Strix Scar 17 G733PY-XS96 | |
| R Benchmark 2.5 / Overall mean | |
| Dell G16 7620 | |
| Alienware m17 R5 (R9 6900HX, RX 6850M XT) | |
| MSI Stealth 16 Studio A13VG | |
| Asus ROG Strix G18 G814JI | |
| MSI Raider GE68 HX 13VG, i7-13700HX | |
| Asus TUF Gaming A17 FA707XI-NS94 | |
| Alienware m16 R1 AMD | |
| Asus ROG Strix Scar 17 G733PYV-LL053X | |
| Asus ROG Strix Scar 17 G733PY-XS96 | |
| MSI Titan GT77 HX 13VI | |
| Acer Predator Helios 18 N23Q2 | |
| Razer Blade 18 RTX 4070 | |
| Alienware m18 R1 | |
| MSI Titan 18 HX A14VIG | |
| Average Intel Core i9-14900HX (0.3604 - 0.4859, n=37) | |
Cinebench R23: Multi Core | Single Core
Cinebench R20: CPU (Multi Core) | CPU (Single Core)
Cinebench R15: CPU Multi 64Bit | CPU Single 64Bit
Blender: v2.79 BMW27 CPU
7-Zip 18.03: 7z b 4 | 7z b 4 -mmt1
Geekbench 6.7: Multi-Core | Single-Core
Geekbench 5.5: Multi-Core | Single-Core
HWBOT x265 Benchmark v2.2: 4k Preset
LibreOffice : 20 Documents To PDF
R Benchmark 2.5: Overall mean
* ... smaller is better
AIDA64: FP32 Ray-Trace | FPU Julia | CPU SHA3 | CPU Queen | FPU SinJulia | FPU Mandel | CPU AES | CPU ZLib | FP64 Ray-Trace | CPU PhotoWorxx
| Performance rating | |
| Alienware m18 R1 | |
| Acer Predator Helios 18 N23Q2 | |
| MSI Titan 18 HX A14VIG | |
| MSI Titan GT77 HX 13VI | |
| Razer Blade 18 RTX 4070 | |
| Average Intel Core i9-14900HX | |
| Asus ROG Strix G18 G814JI | |
| AIDA64 / FP32 Ray-Trace | |
| Alienware m18 R1 | |
| MSI Titan 18 HX A14VIG | |
| MSI Titan GT77 HX 13VI | |
| Acer Predator Helios 18 N23Q2 | |
| Razer Blade 18 RTX 4070 | |
| Average Intel Core i9-14900HX (13098 - 33474, n=36) | |
| Asus ROG Strix G18 G814JI | |
| AIDA64 / FPU Julia | |
| MSI Titan 18 HX A14VIG | |
| Alienware m18 R1 | |
| MSI Titan GT77 HX 13VI | |
| Acer Predator Helios 18 N23Q2 | |
| Razer Blade 18 RTX 4070 | |
| Average Intel Core i9-14900HX (67573 - 166040, n=36) | |
| Asus ROG Strix G18 G814JI | |
| AIDA64 / CPU SHA3 | |
| MSI Titan 18 HX A14VIG | |
| Alienware m18 R1 | |
| MSI Titan GT77 HX 13VI | |
| Acer Predator Helios 18 N23Q2 | |
| Razer Blade 18 RTX 4070 | |
| Average Intel Core i9-14900HX (3589 - 7979, n=36) | |
| Asus ROG Strix G18 G814JI | |
| AIDA64 / CPU Queen | |
| MSI Titan 18 HX A14VIG | |
| Alienware m18 R1 | |
| MSI Titan GT77 HX 13VI | |
| Average Intel Core i9-14900HX (118405 - 148966, n=36) | |
| Razer Blade 18 RTX 4070 | |
| Acer Predator Helios 18 N23Q2 | |
| Asus ROG Strix G18 G814JI | |
| AIDA64 / FPU SinJulia | |
| MSI Titan 18 HX A14VIG | |
| MSI Titan GT77 HX 13VI | |
| Alienware m18 R1 | |
| Razer Blade 18 RTX 4070 | |
| Acer Predator Helios 18 N23Q2 | |
| Average Intel Core i9-14900HX (10475 - 18517, n=36) | |
| Asus ROG Strix G18 G814JI | |
| AIDA64 / FPU Mandel | |
| Alienware m18 R1 | |
| MSI Titan 18 HX A14VIG | |
| MSI Titan GT77 HX 13VI | |
| Acer Predator Helios 18 N23Q2 | |
| Razer Blade 18 RTX 4070 | |
| Average Intel Core i9-14900HX (32543 - 83662, n=36) | |
| Asus ROG Strix G18 G814JI | |
| AIDA64 / CPU AES | |
| Acer Predator Helios 18 N23Q2 | |
| Average Intel Core i9-14900HX (86964 - 241777, n=36) | |
| MSI Titan 18 HX A14VIG | |
| MSI Titan GT77 HX 13VI | |
| Alienware m18 R1 | |
| Razer Blade 18 RTX 4070 | |
| Asus ROG Strix G18 G814JI | |
| AIDA64 / CPU ZLib | |
| MSI Titan 18 HX A14VIG | |
| MSI Titan GT77 HX 13VI | |
| Alienware m18 R1 | |
| Acer Predator Helios 18 N23Q2 | |
| Razer Blade 18 RTX 4070 | |
| Average Intel Core i9-14900HX (1054 - 2292, n=36) | |
| Asus ROG Strix G18 G814JI | |
| AIDA64 / FP64 Ray-Trace | |
| Alienware m18 R1 | |
| MSI Titan 18 HX A14VIG | |
| MSI Titan GT77 HX 13VI | |
| Acer Predator Helios 18 N23Q2 | |
| Razer Blade 18 RTX 4070 | |
| Average Intel Core i9-14900HX (6809 - 18349, n=36) | |
| Asus ROG Strix G18 G814JI | |
| AIDA64 / CPU PhotoWorxx | |
| Alienware m18 R1 | |
| Acer Predator Helios 18 N23Q2 | |
| Razer Blade 18 RTX 4070 | |
| Average Intel Core i9-14900HX (23903 - 54702, n=36) | |
| Asus ROG Strix G18 G814JI | |
| MSI Titan GT77 HX 13VI | |
| MSI Titan 18 HX A14VIG | |
系统性能
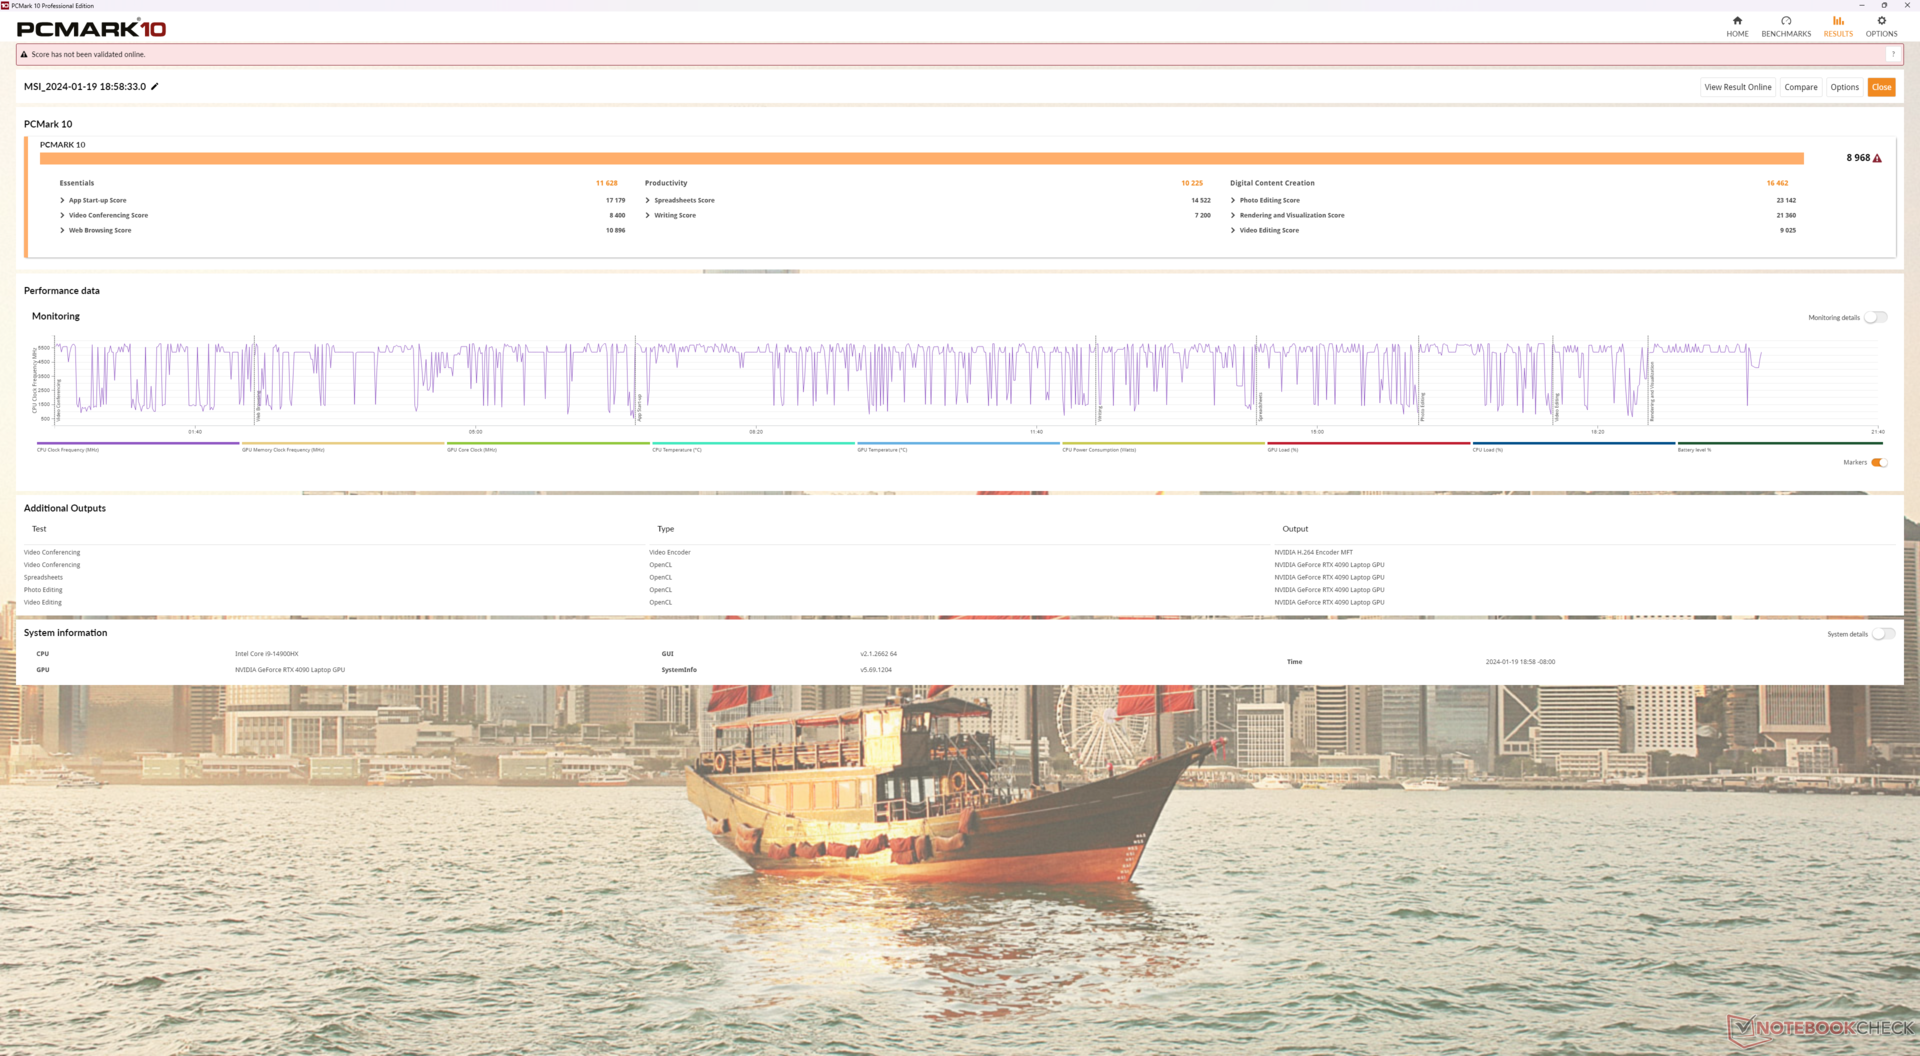
PCMark 结果与去年的 GT77 相差几个百分点,表明在运行日常任务时,CPU 和 GPU 之间的性能差异不大。
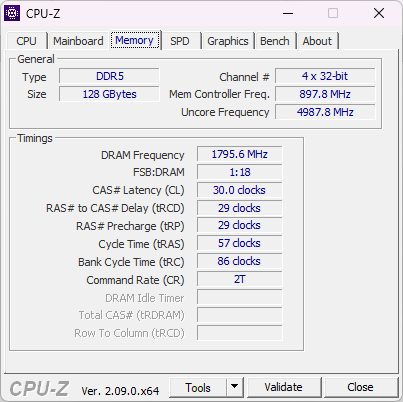
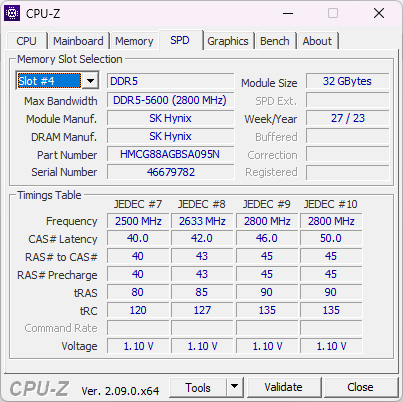
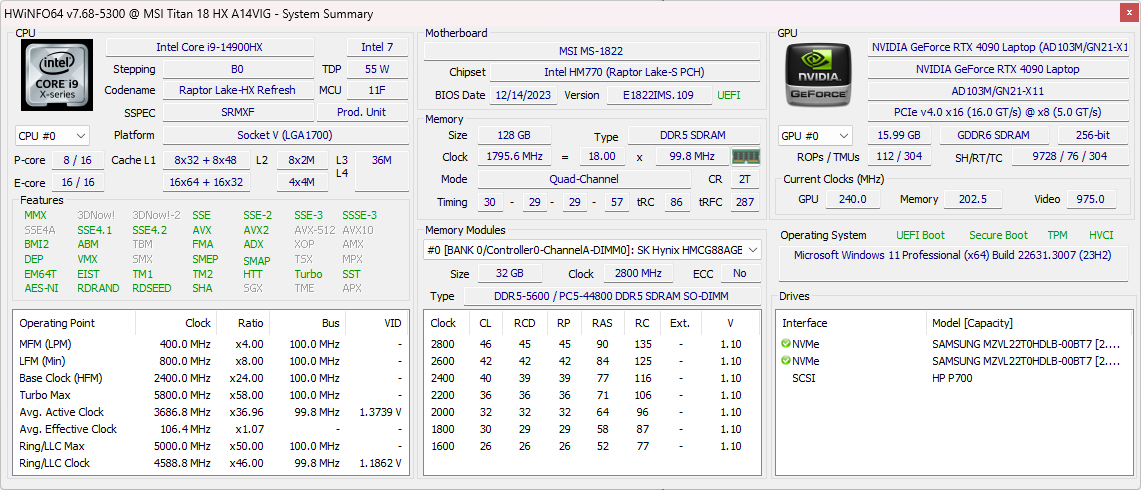
需要注意的是,我们的 128 GB 配置与 32 GB 配置的 Alienware m18 R1 相比,内存性能降低了 30% 至 40%。 Alienware m18 R1.这是意料之中的,因为老化的 SODIMM 接口限制了高容量内存的性能。
CrossMark: Overall | Productivity | Creativity | Responsiveness
WebXPRT 3: Overall
WebXPRT 4: Overall
Mozilla Kraken 1.1: Total
| PCMark 10 / Score | |
| MSI Titan 18 HX A14VIG | |
| MSI Titan GT77 HX 13VI | |
| Alienware m18 R1 | |
| Average Intel Core i9-14900HX, NVIDIA GeForce RTX 4090 Laptop GPU (8230 - 9234, n=13) | |
| Acer Predator Helios 18 N23Q2 | |
| Razer Blade 18 RTX 4070 | |
| Asus ROG Strix G18 G814JI | |
| PCMark 10 / Essentials | |
| MSI Titan GT77 HX 13VI | |
| Razer Blade 18 RTX 4070 | |
| MSI Titan 18 HX A14VIG | |
| Alienware m18 R1 | |
| Average Intel Core i9-14900HX, NVIDIA GeForce RTX 4090 Laptop GPU (10778 - 11628, n=13) | |
| Acer Predator Helios 18 N23Q2 | |
| Asus ROG Strix G18 G814JI | |
| PCMark 10 / Productivity | |
| Average Intel Core i9-14900HX, NVIDIA GeForce RTX 4090 Laptop GPU (9458 - 11759, n=13) | |
| Acer Predator Helios 18 N23Q2 | |
| MSI Titan 18 HX A14VIG | |
| Alienware m18 R1 | |
| MSI Titan GT77 HX 13VI | |
| Razer Blade 18 RTX 4070 | |
| Asus ROG Strix G18 G814JI | |
| PCMark 10 / Digital Content Creation | |
| MSI Titan 18 HX A14VIG | |
| MSI Titan GT77 HX 13VI | |
| Alienware m18 R1 | |
| Average Intel Core i9-14900HX, NVIDIA GeForce RTX 4090 Laptop GPU (13219 - 16462, n=13) | |
| Acer Predator Helios 18 N23Q2 | |
| Razer Blade 18 RTX 4070 | |
| Asus ROG Strix G18 G814JI | |
| CrossMark / Overall | |
| Acer Predator Helios 18 N23Q2 | |
| Alienware m18 R1 | |
| MSI Titan GT77 HX 13VI | |
| Razer Blade 18 RTX 4070 | |
| Average Intel Core i9-14900HX, NVIDIA GeForce RTX 4090 Laptop GPU (1877 - 2344, n=10) | |
| MSI Titan 18 HX A14VIG | |
| CrossMark / Productivity | |
| Acer Predator Helios 18 N23Q2 | |
| Alienware m18 R1 | |
| MSI Titan GT77 HX 13VI | |
| Razer Blade 18 RTX 4070 | |
| Average Intel Core i9-14900HX, NVIDIA GeForce RTX 4090 Laptop GPU (1738 - 2162, n=10) | |
| MSI Titan 18 HX A14VIG | |
| CrossMark / Creativity | |
| Alienware m18 R1 | |
| MSI Titan GT77 HX 13VI | |
| Acer Predator Helios 18 N23Q2 | |
| Razer Blade 18 RTX 4070 | |
| Average Intel Core i9-14900HX, NVIDIA GeForce RTX 4090 Laptop GPU (2195 - 2660, n=10) | |
| MSI Titan 18 HX A14VIG | |
| CrossMark / Responsiveness | |
| Acer Predator Helios 18 N23Q2 | |
| Alienware m18 R1 | |
| Razer Blade 18 RTX 4070 | |
| Average Intel Core i9-14900HX, NVIDIA GeForce RTX 4090 Laptop GPU (1478 - 2327, n=10) | |
| MSI Titan GT77 HX 13VI | |
| MSI Titan 18 HX A14VIG | |
| WebXPRT 3 / Overall | |
| Razer Blade 18 RTX 4070 | |
| Alienware m18 R1 | |
| MSI Titan 18 HX A14VIG | |
| Average Intel Core i9-14900HX, NVIDIA GeForce RTX 4090 Laptop GPU (279 - 339, n=10) | |
| MSI Titan GT77 HX 13VI | |
| Acer Predator Helios 18 N23Q2 | |
| Asus ROG Strix G18 G814JI | |
| Asus ROG Strix G18 G814JI | |
| WebXPRT 4 / Overall | |
| Alienware m18 R1 | |
| Razer Blade 18 RTX 4070 | |
| MSI Titan GT77 HX 13VI | |
| Average Intel Core i9-14900HX, NVIDIA GeForce RTX 4090 Laptop GPU (246 - 309, n=8) | |
| MSI Titan 18 HX A14VIG | |
| Asus ROG Strix G18 G814JI | |
| Asus ROG Strix G18 G814JI | |
| Mozilla Kraken 1.1 / Total | |
| Asus ROG Strix G18 G814JI | |
| Asus ROG Strix G18 G814JI | |
| MSI Titan GT77 HX 13VI | |
| Razer Blade 18 RTX 4070 | |
| Alienware m18 R1 | |
| Acer Predator Helios 18 N23Q2 | |
| Average Intel Core i9-14900HX, NVIDIA GeForce RTX 4090 Laptop GPU (428 - 535, n=11) | |
| MSI Titan 18 HX A14VIG | |
* ... smaller is better
| PCMark 10 Score | 8968 points | |
Help | ||
| AIDA64 / Memory Copy | |
| Alienware m18 R1 | |
| Acer Predator Helios 18 N23Q2 | |
| Razer Blade 18 RTX 4070 | |
| Average Intel Core i9-14900HX (38028 - 83392, n=36) | |
| Asus ROG Strix G18 G814JI | |
| MSI Titan GT77 HX 13VI | |
| MSI Titan 18 HX A14VIG | |
| AIDA64 / Memory Read | |
| Alienware m18 R1 | |
| Acer Predator Helios 18 N23Q2 | |
| Razer Blade 18 RTX 4070 | |
| Average Intel Core i9-14900HX (43306 - 87568, n=36) | |
| Asus ROG Strix G18 G814JI | |
| MSI Titan GT77 HX 13VI | |
| MSI Titan 18 HX A14VIG | |
| AIDA64 / Memory Write | |
| Alienware m18 R1 | |
| Razer Blade 18 RTX 4070 | |
| Acer Predator Helios 18 N23Q2 | |
| Average Intel Core i9-14900HX (37146 - 80589, n=36) | |
| MSI Titan GT77 HX 13VI | |
| Asus ROG Strix G18 G814JI | |
| MSI Titan 18 HX A14VIG | |
| AIDA64 / Memory Latency | |
| MSI Titan 18 HX A14VIG | |
| MSI Titan GT77 HX 13VI | |
| Average Intel Core i9-14900HX (76.1 - 105, n=36) | |
| Razer Blade 18 RTX 4070 | |
| Asus ROG Strix G18 G814JI | |
| Acer Predator Helios 18 N23Q2 | |
| Alienware m18 R1 | |
* ... smaller is better
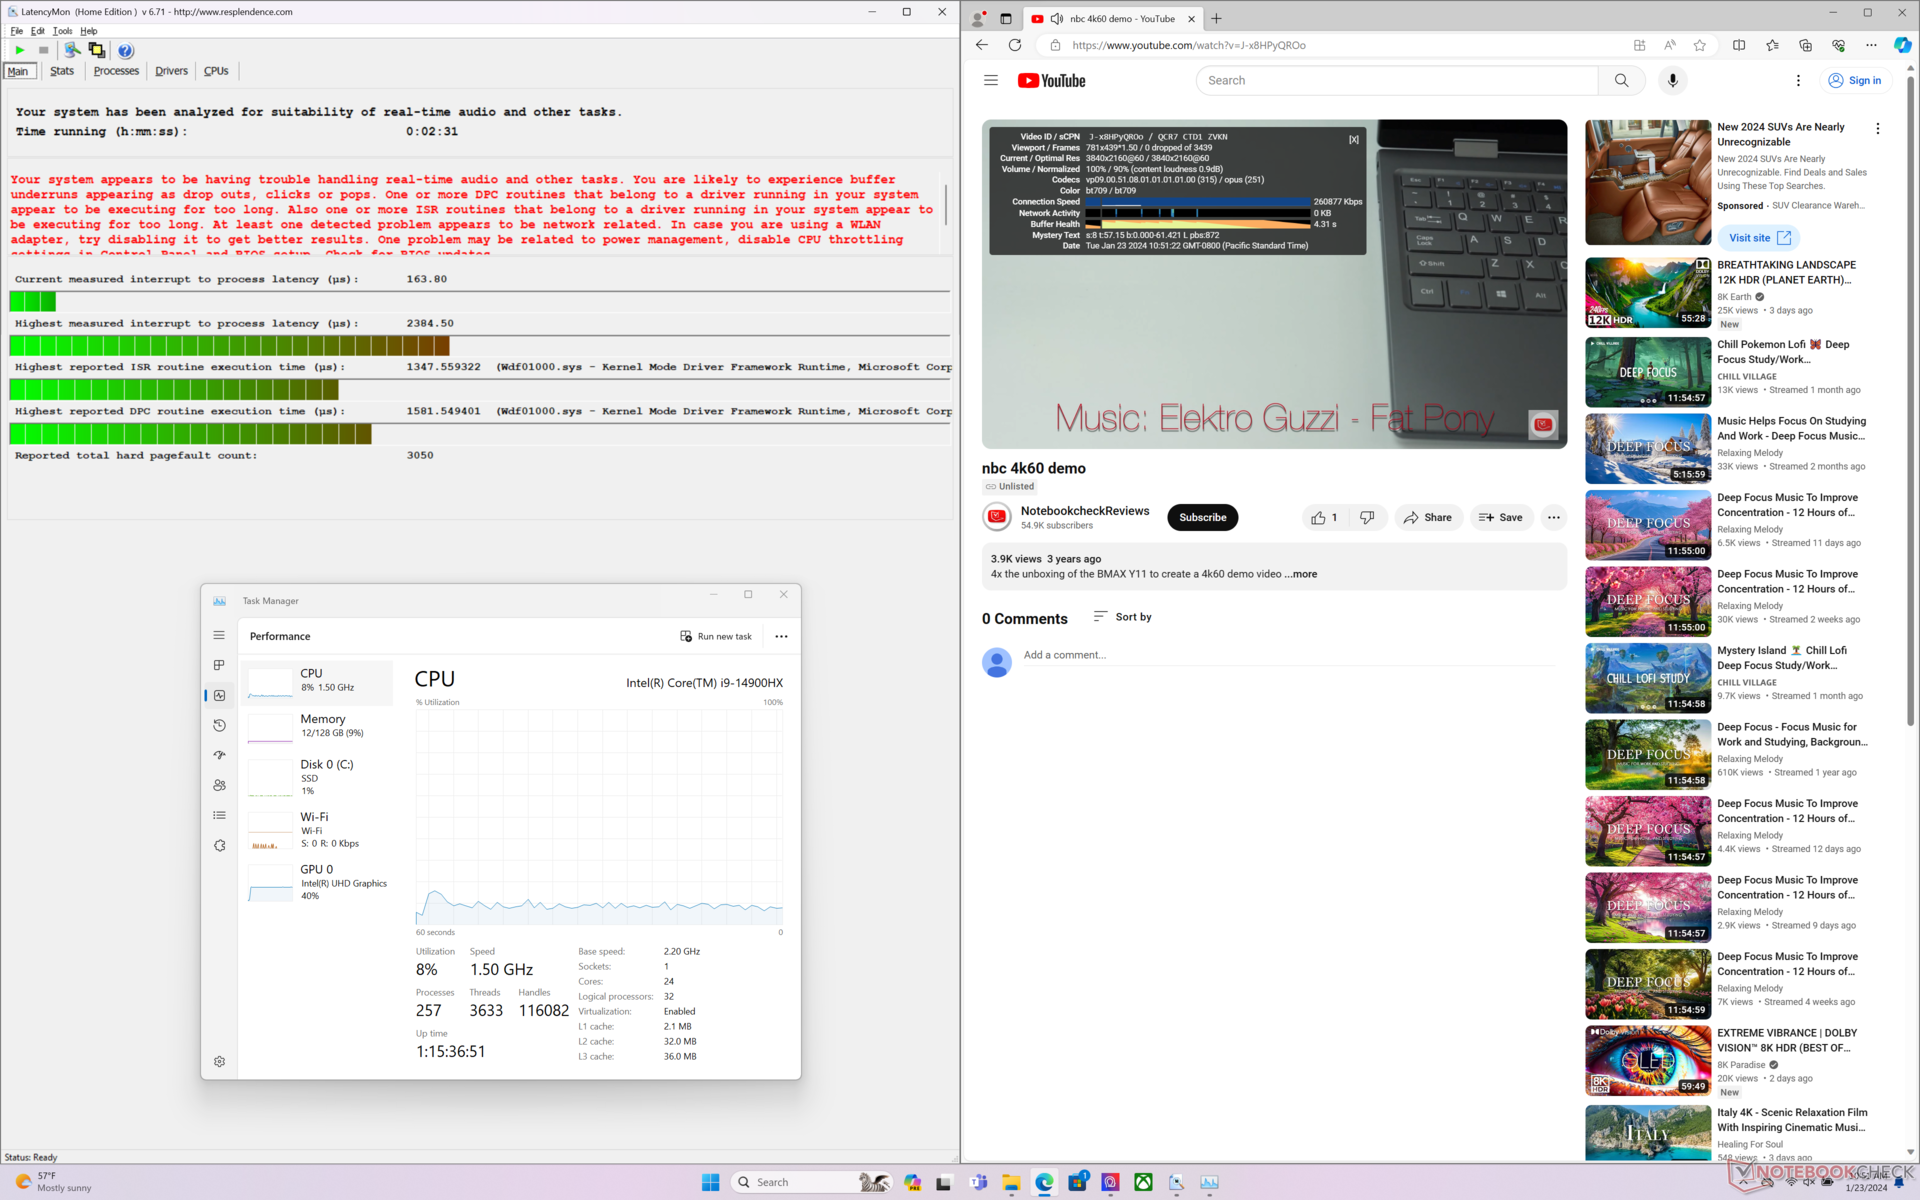
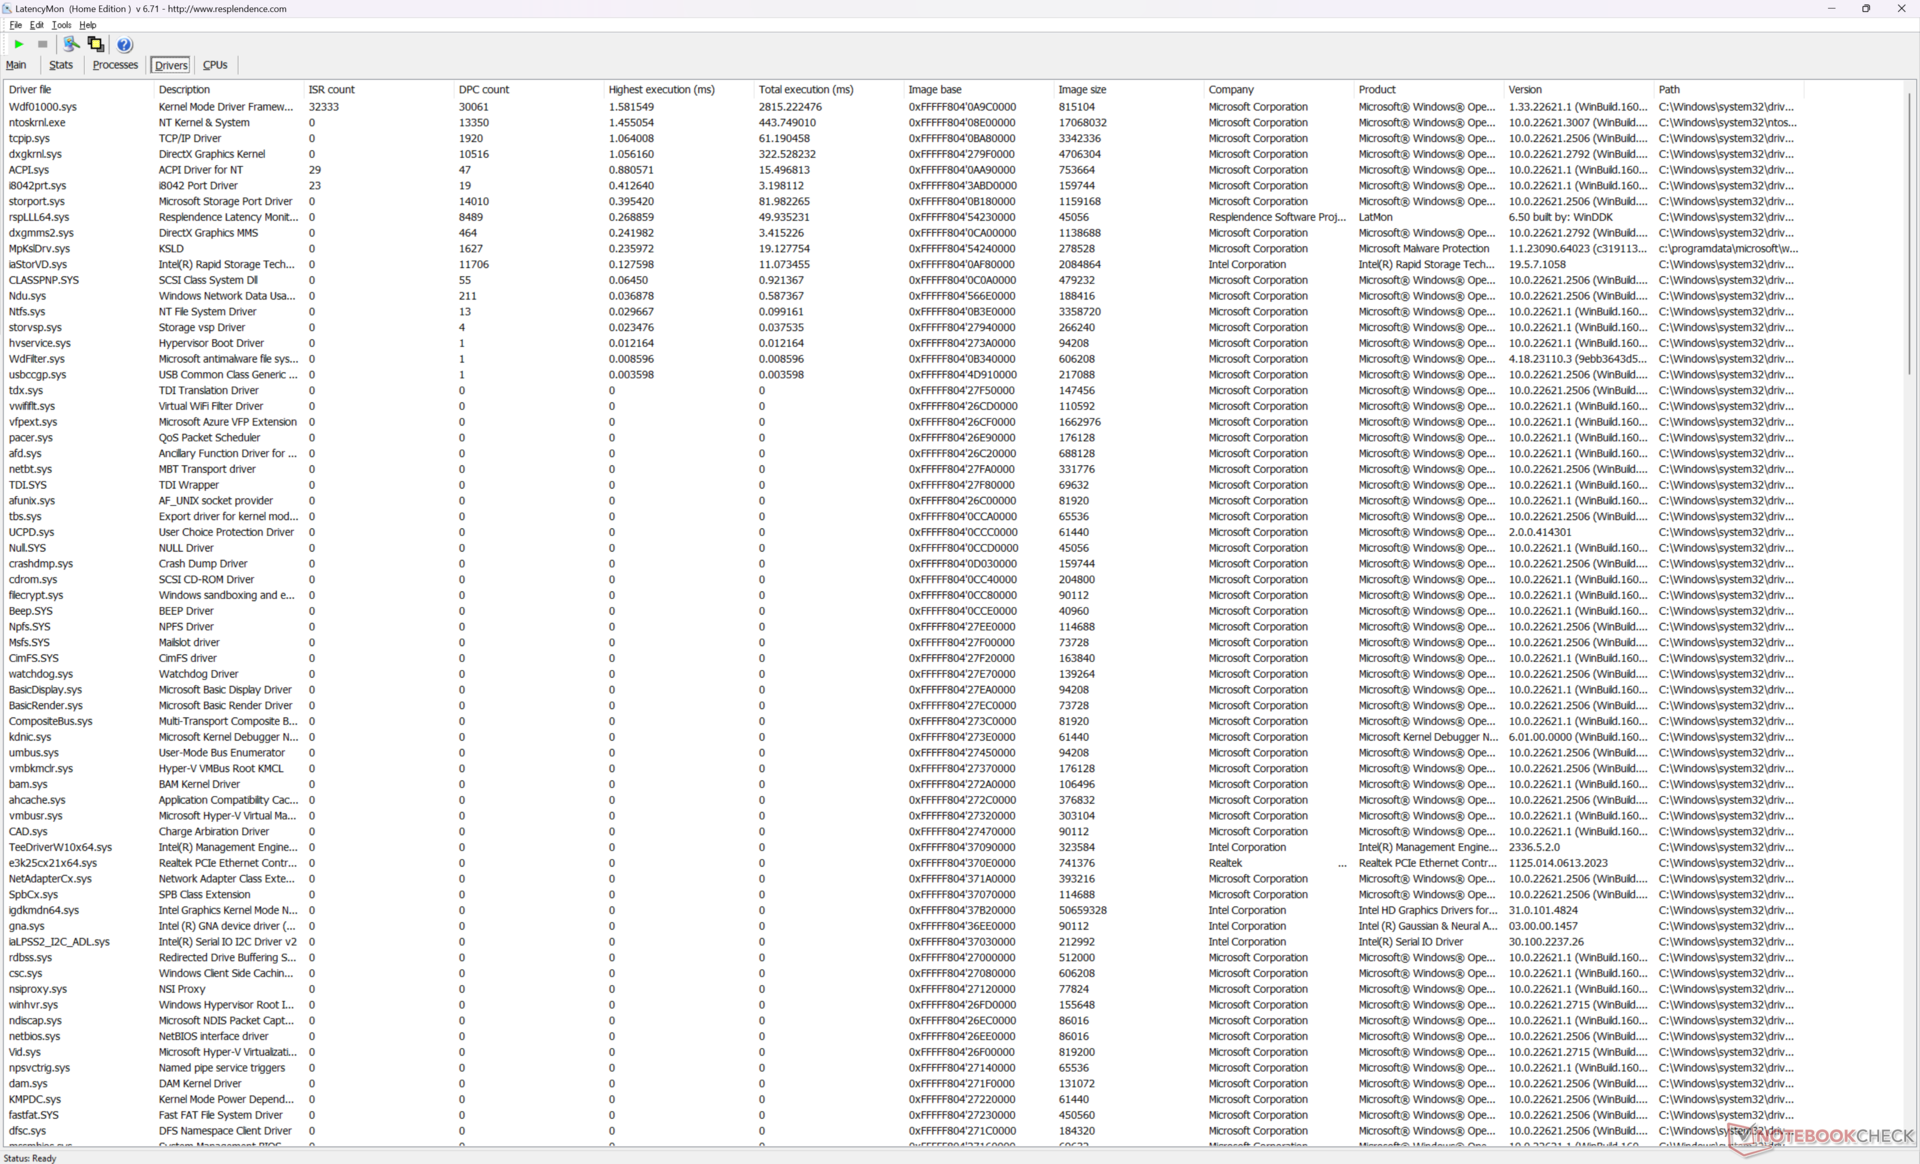
DPC 延迟
在打开我们主页的多个浏览器标签页时,LatencyMon 会显示 DPC 问题。此外,在 iGPU 模式下以 60 FPS 播放 4K 视频时也非常完美,没有掉帧记录。
| DPC Latencies / LatencyMon - interrupt to process latency (max), Web, Youtube, Prime95 | |
| Acer Predator Helios 18 N23Q2 | |
| MSI Titan GT77 HX 13VI | |
| Alienware m18 R1 | |
| MSI Titan 18 HX A14VIG | |
| Razer Blade 18 RTX 4070 | |
| Asus ROG Strix G18 G814JI | |
* ... smaller is better
存储设备
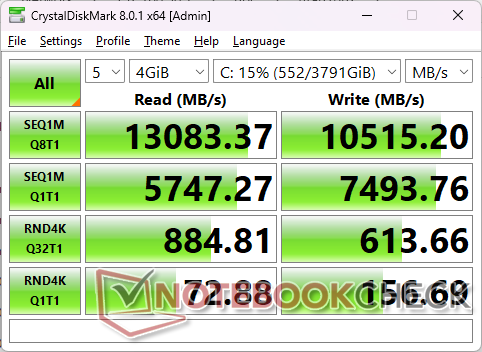
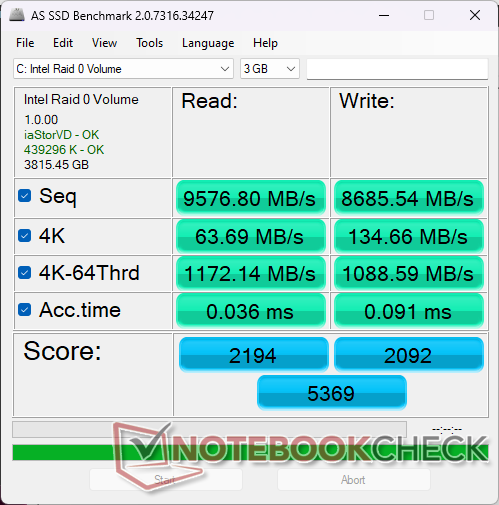
我们的设备配有两个 三星 MZVL22T0HDLBPM9A1a PCIe4 x4 NVMe SSD,在 RAID 0 配置中的传输速率接近 13000 MB/s,而不是大多数单 PCIe4 x4 SSD 通常的 7000 MB/s。硬盘在 DiskSpd 下承受数分钟压力时不会出现节流问题。
Titan 18 HX 还可支持单个 PCIe5 M.2 固态硬盘,但此类硬盘的库存仍然有限,因此目前的大多数配置都使用 PCIe4 x4 硬盘。

| Drive Performance rating - Percent | |
| Alienware m18 R1 | |
| Acer Predator Helios 18 N23Q2 | |
| Razer Blade 18 RTX 4070 | |
| MSI Titan GT77 HX 13VI | |
| MSI Titan 18 HX A14VIG | |
| Asus ROG Strix G18 G814JI | |
* ... smaller is better
Disk Throttling: DiskSpd Read Loop, Queue Depth 8
图形处理器性能 - 175 瓦图形处理器 + 95 瓦处理器
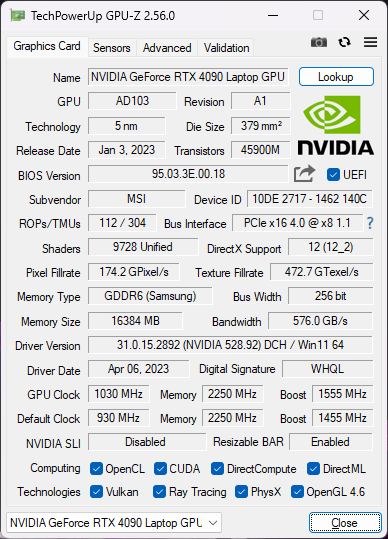
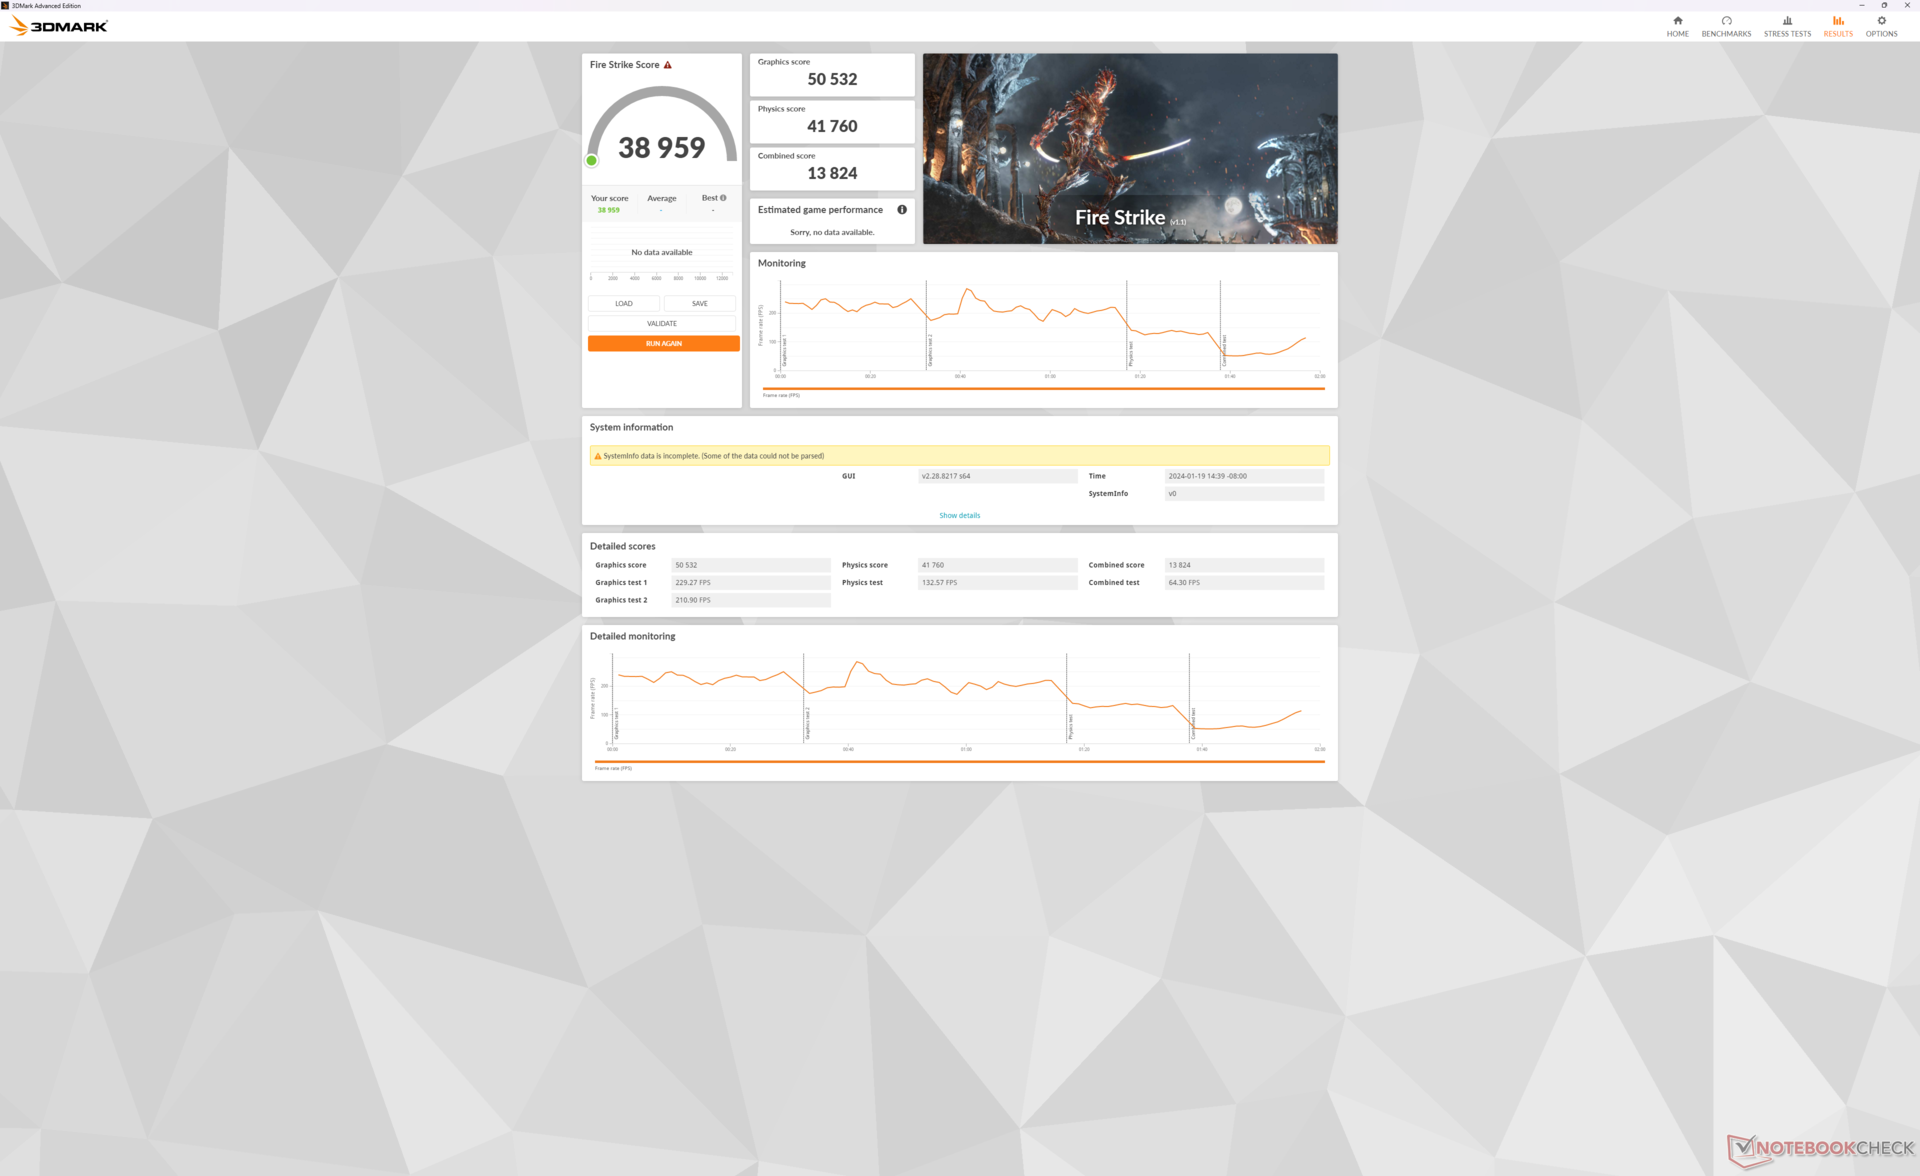
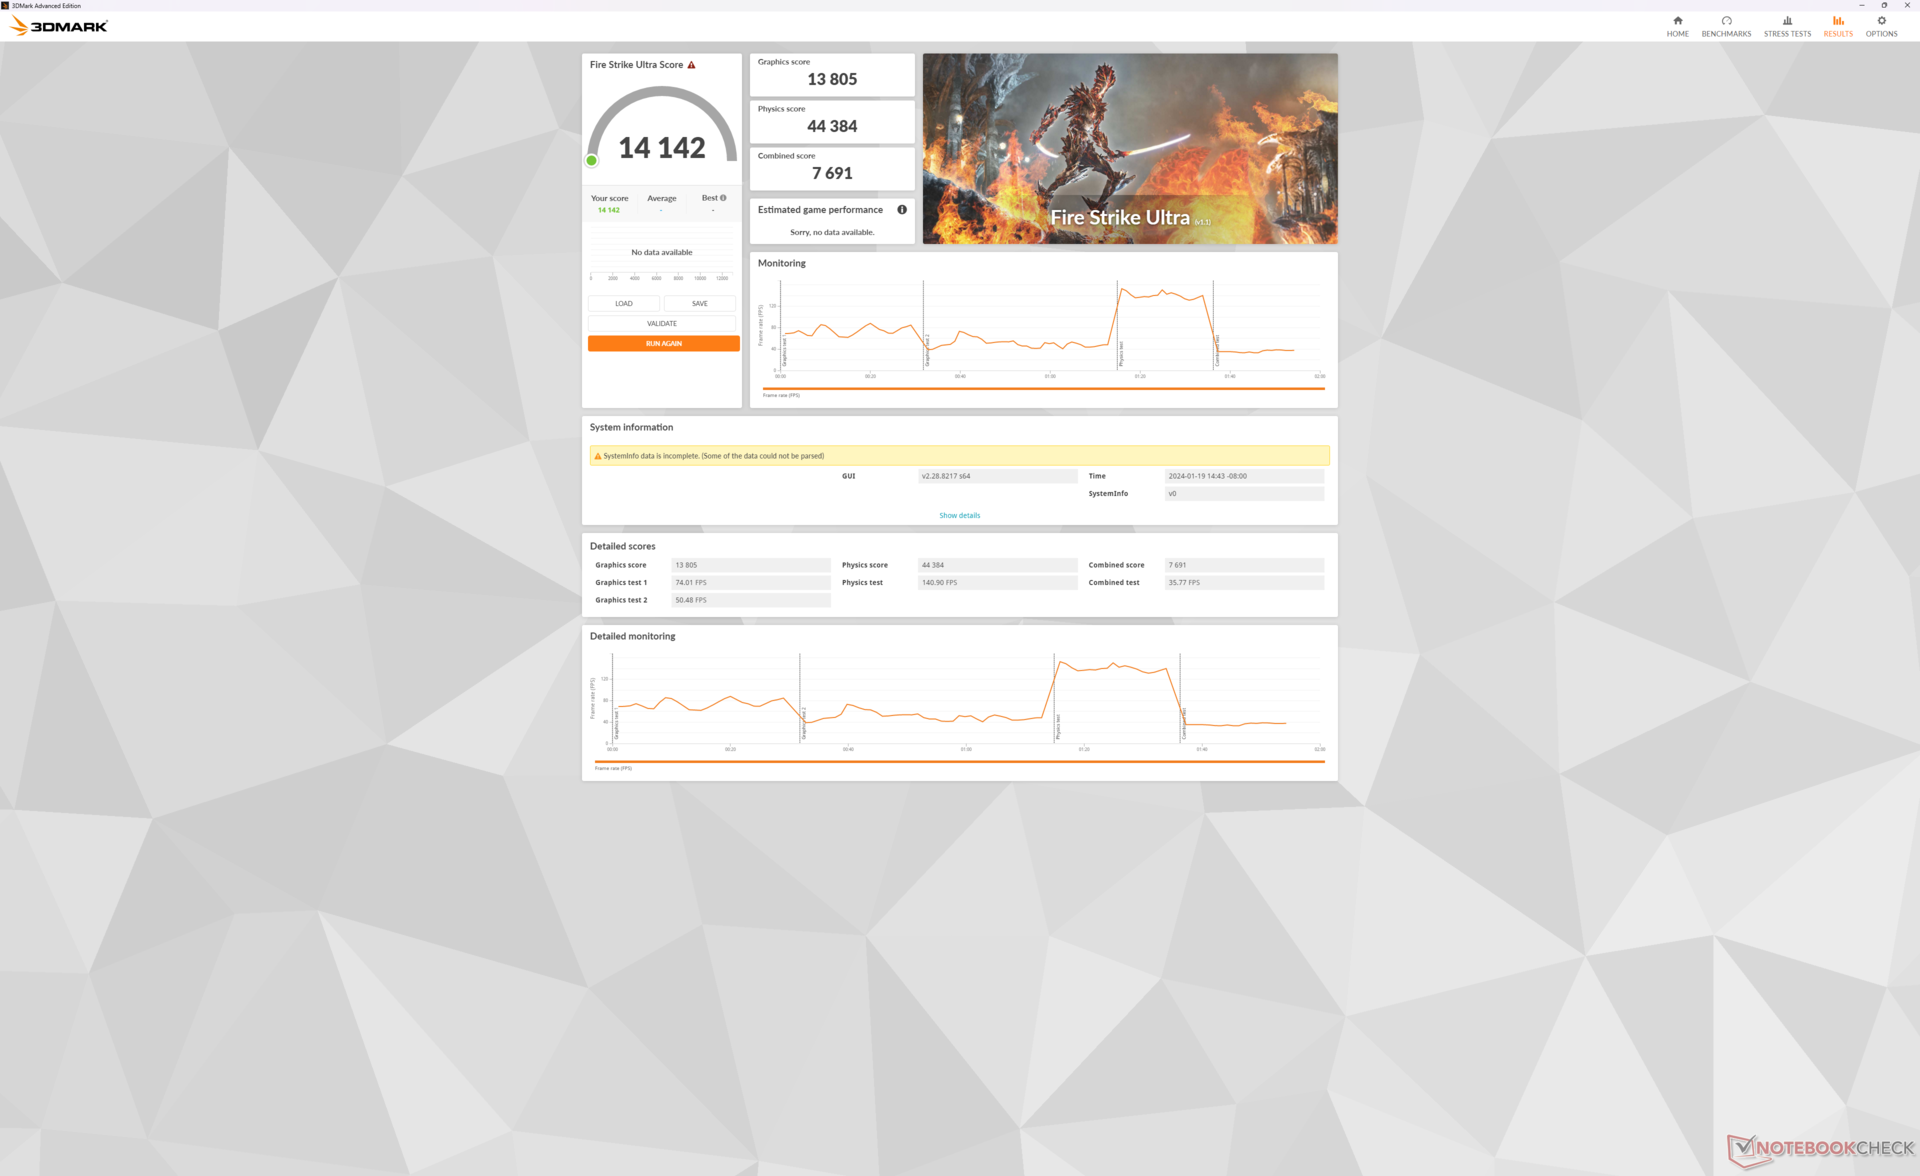
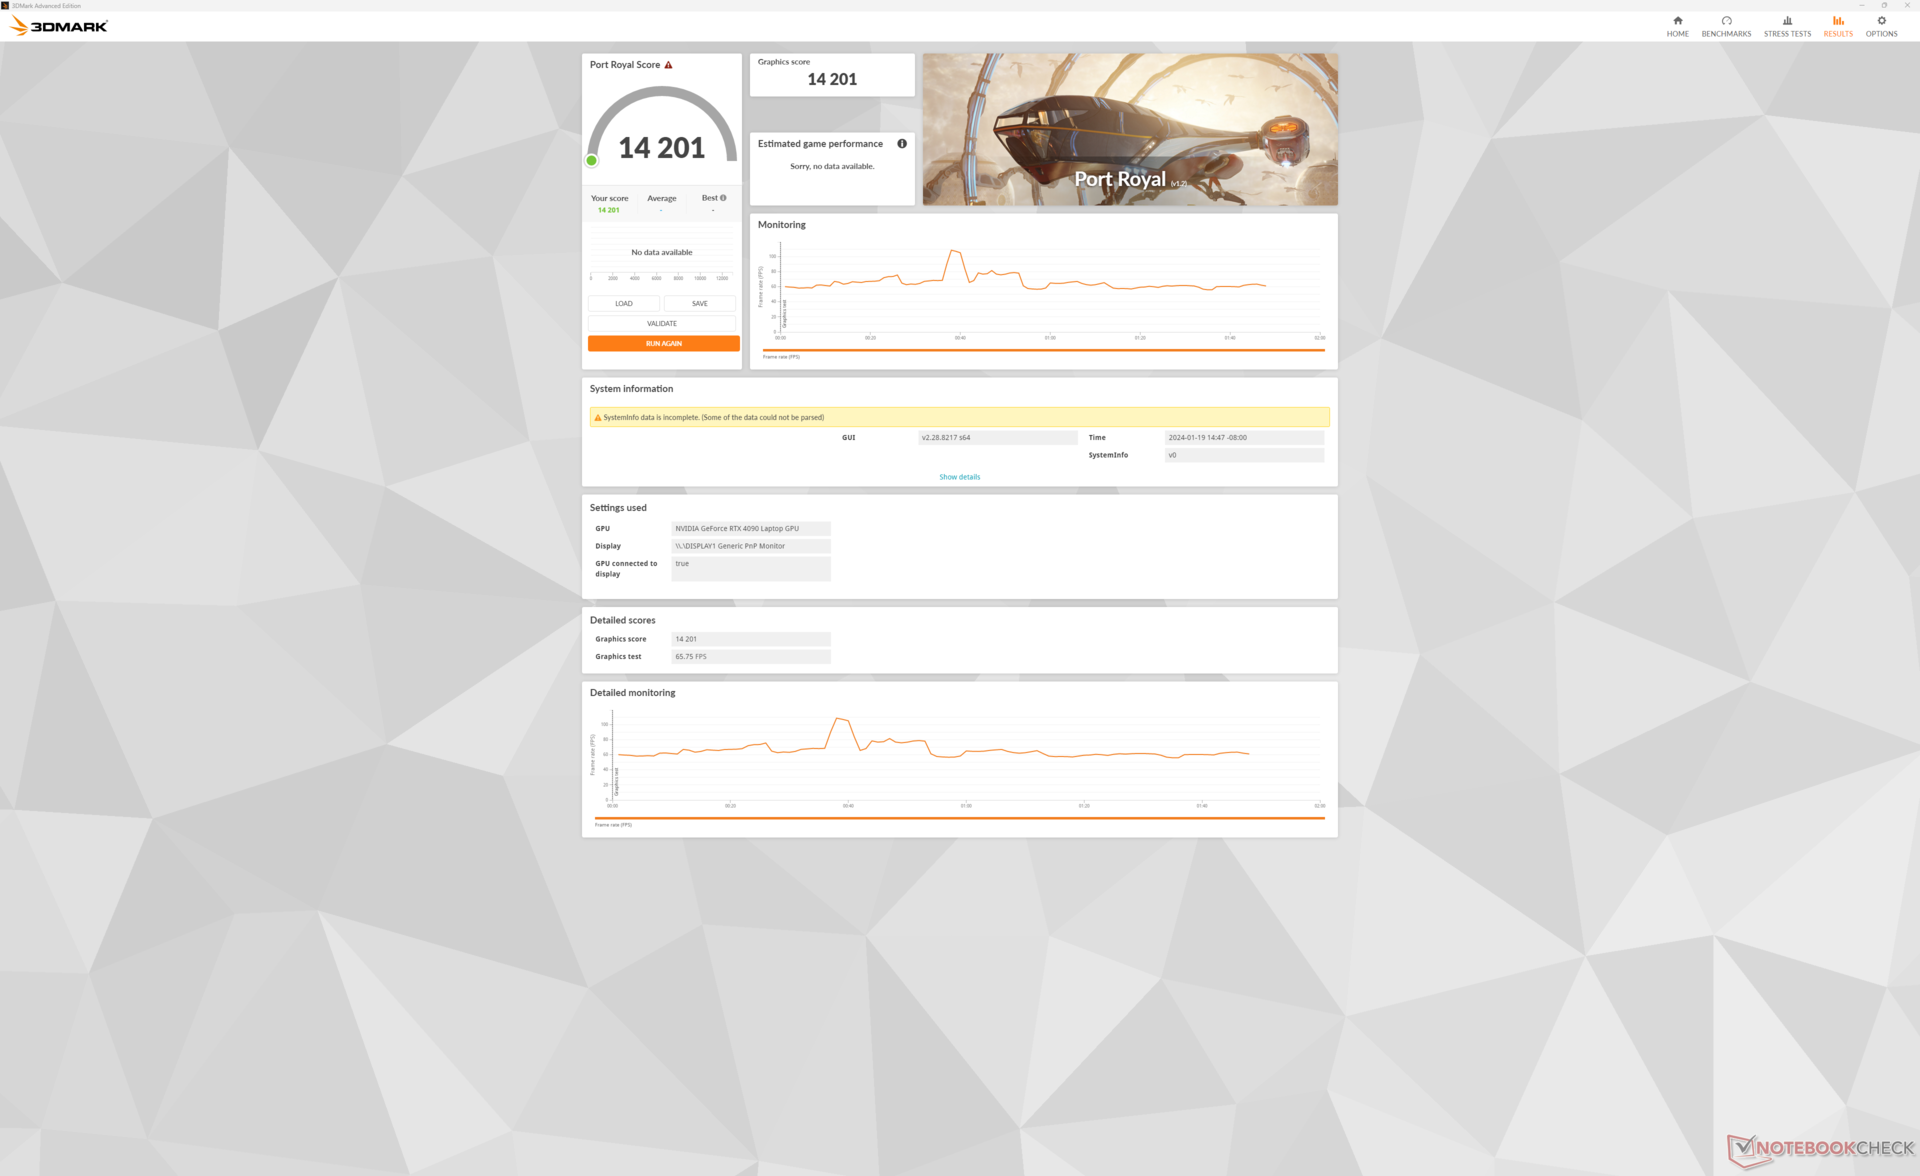
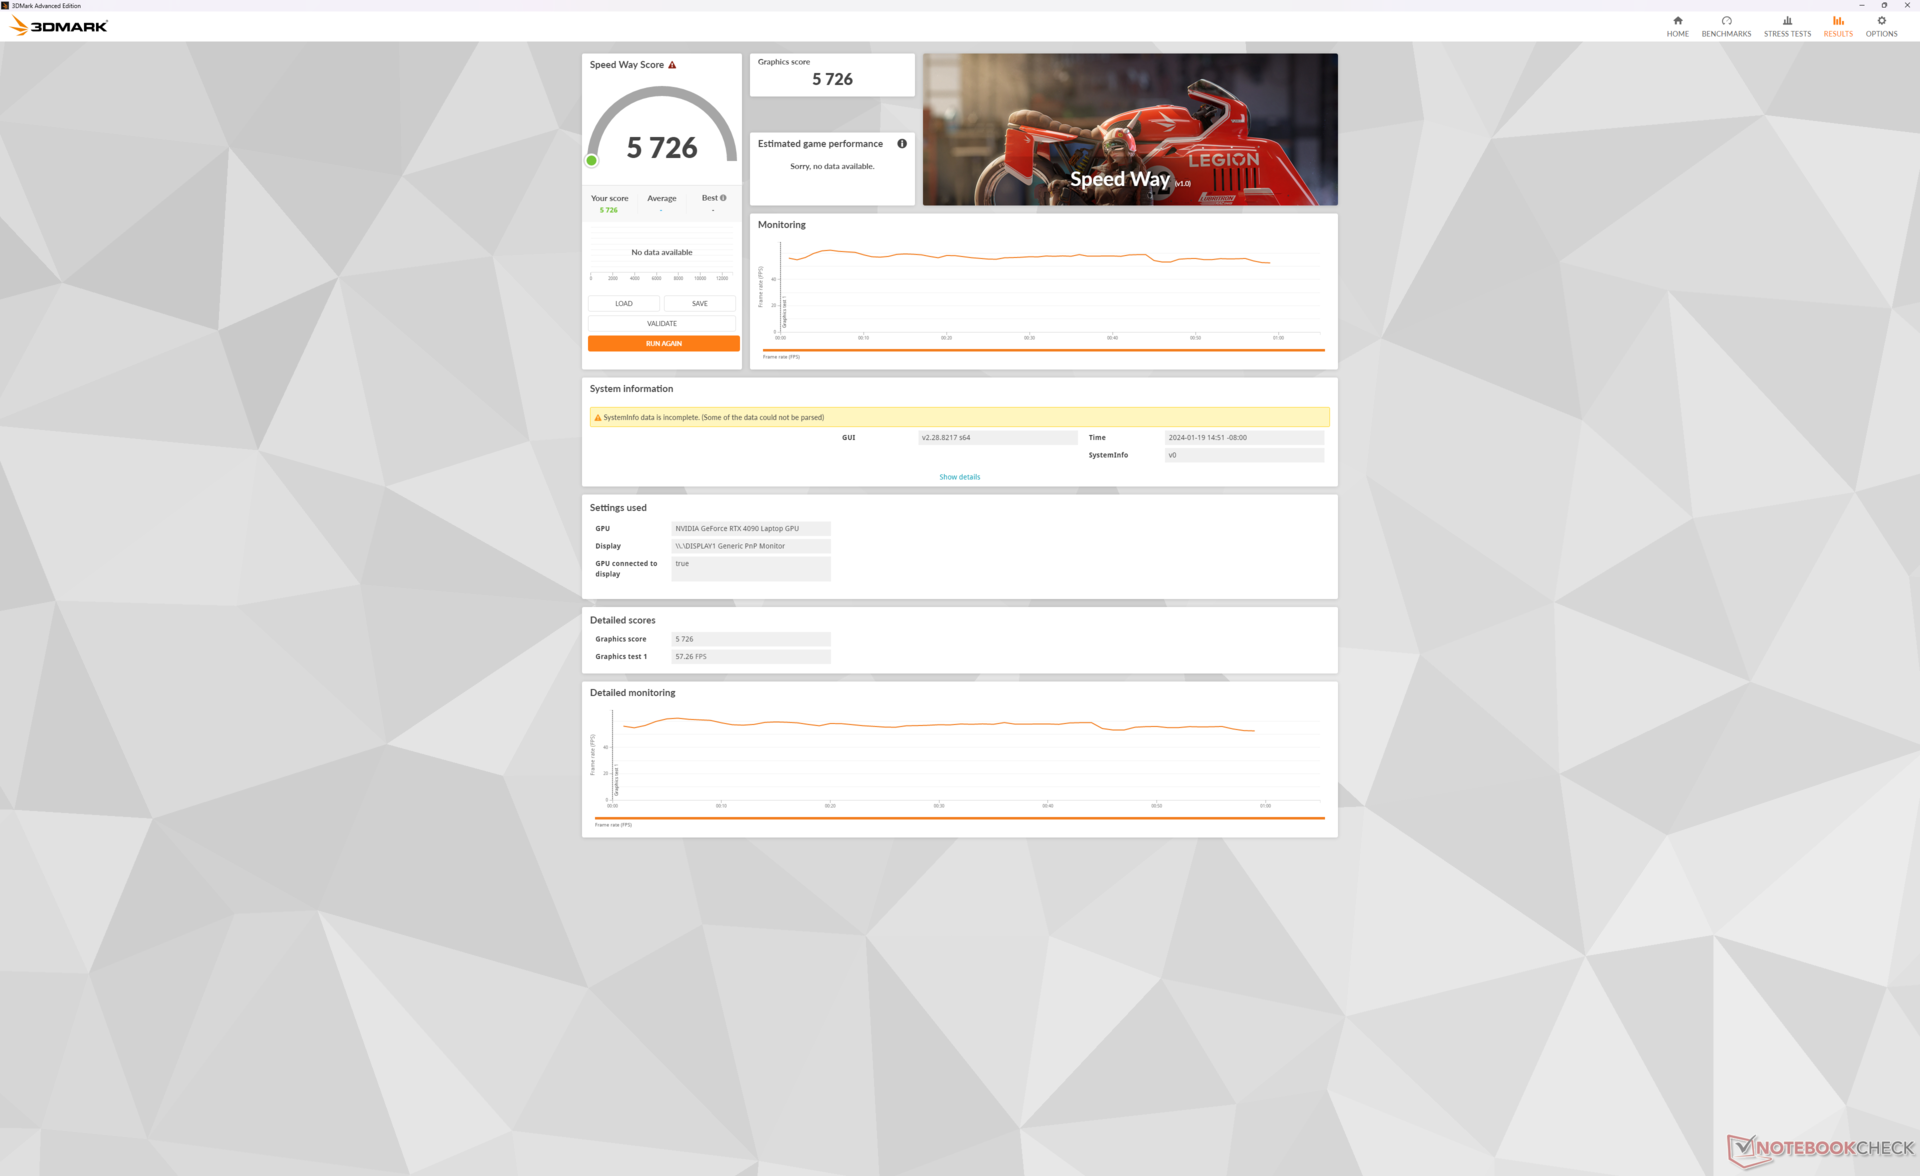
175 瓦移动 GeForce RTX 4090我们的 Titan 18 HX 中的 GPU 与去年配备相同 GPU 的 GT77 的 3DMark 分数几乎相同。换句话说,尽管采用了新的花哨的外观设计,但不要指望微星新系统的性能会比以前更快。尽管如此,它仍是市场上速度最快的游戏笔记本之一,性能水平与台式机最为接近 GeForce RTX 4070 超级.
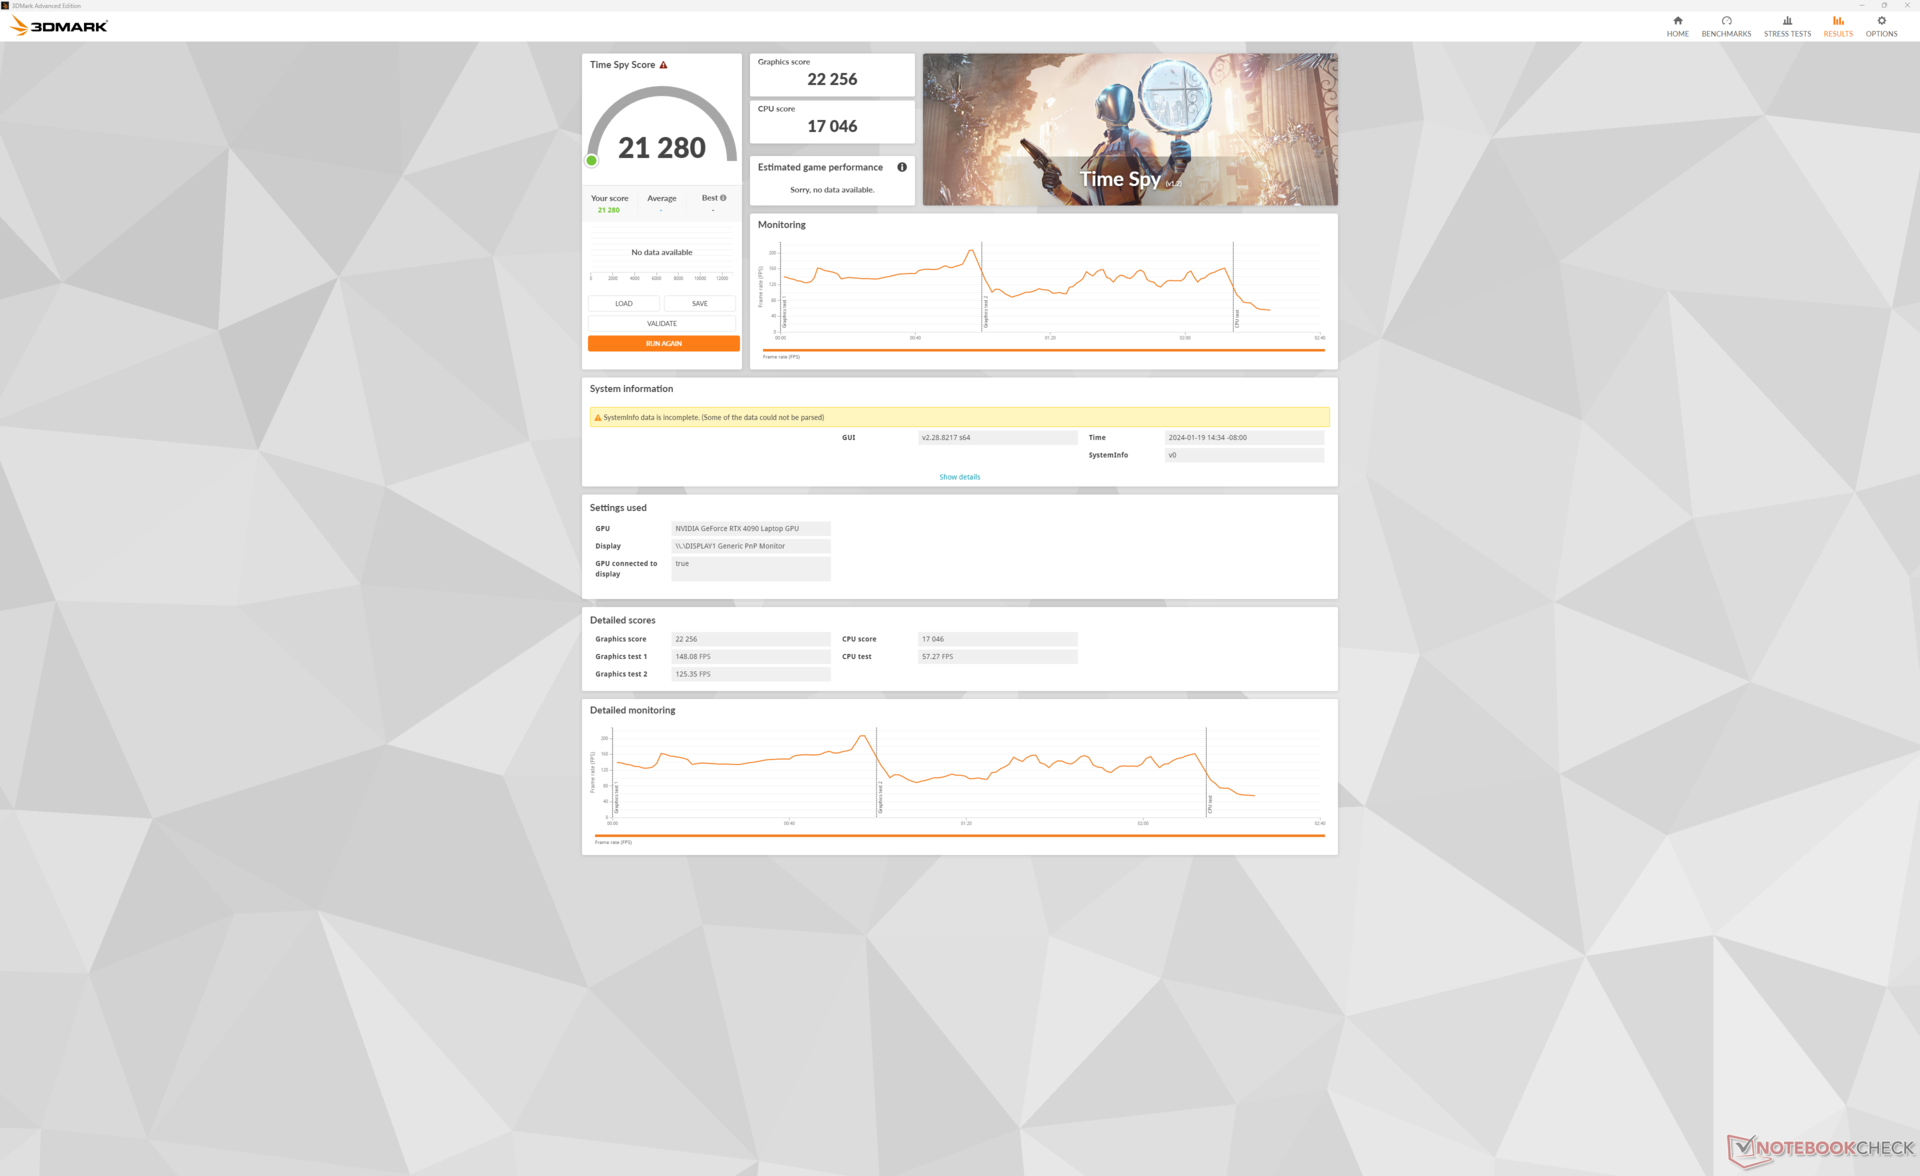
启用或禁用 Cooler Boost 对性能似乎没有明显影响,如下表Time Spy 结果所示,尽管两种模式下的风扇噪音差异很大。因此,只有在担心核心温度或超频时,才建议使用 Cooler Boost。不过,如果使用平衡模式而不是极限性能模式,图形性能将降低约 10%。
| 电源配置文件 | 图形性能得分 | CPU 分数 | 总分 |
| 极致性能(开启 Cooler Boost) | 22256 | 17046 | 21280 |
| 极致性能(关闭冷却器增强功能) | 22097 (-1%) | 16608 (-3%) | 21053 (-1%) |
| 平衡模式 | 20121 (-10%) | 16532 (-3%) | 19486 (-8%) |
| 电池电量 | 6480 (-71%) | 6999 (-59%) | 6552 (-69%) |
| 3DMark Performance rating - Percent | |
| AMD Ryzen 9 7900 -2! | |
| MSI Titan GT77 HX 13VI | |
| MSI Titan 18 HX A14VIG | |
| NVIDIA GeForce RTX 4070 Super Founders Edition | |
| Average NVIDIA GeForce RTX 4090 Laptop GPU | |
| Alienware m18 R1 AMD -1! | |
| Acer Predator Helios 18 N23Q2 -1! | |
| Asus ROG Strix Scar 17 SE G733CX-LL014W | |
| Alienware m17 R5 (R9 6900HX, RX 6850M XT) -1! | |
| Razer Blade 18 RTX 4070 | |
| MSI Raider GE68 HX 13VG, i7-13700HX -1! | |
| Asus ROG Strix G18 G814JI -1! | |
| Asus ROG Zephyrus M16 GU603Z -1! | |
| Dell G16 7620 -1! | |
| Lenovo ThinkPad Z16 Gen 2 -1! | |
| 3DMark 11 Performance | 46238 points | |
| 3DMark Fire Strike Score | 38959 points | |
| 3DMark Time Spy Score | 21280 points | |
Help | ||
* ... smaller is better
游戏性能
即使将大多数设置调至最高,所有当前的游戏都能在移动 RTX 4090 上流畅运行。不过,在 4K 下 GPU 开始有点吃力,《F1 22》和《赛博朋克 2077》的平均帧数仅为 44 FPS。在这些情况下,建议启用 DLSS,尤其是显示器不支持 G-Sync。例如,在原生 4K 和 Ultra RT 设置下运行《赛博朋克2077》,平均帧数仅为 21.6 FPS,而启用 DLSS 自动和帧生成功能后,平均帧数将提升至 89 FPS。
| Performance rating - Percent | |
| Alienware m18 R1 | |
| MSI Titan GT77 HX 13VI | |
| MSI Titan 18 HX A14VIG | |
| Acer Predator Helios 18 N23Q2 | |
| Razer Blade 18 RTX 4070 | |
| Asus ROG Strix G18 G814JI | |
| The Witcher 3 - 1920x1080 Ultra Graphics & Postprocessing (HBAO+) | |
| Alienware m18 R1 | |
| MSI Titan 18 HX A14VIG | |
| MSI Titan GT77 HX 13VI | |
| Acer Predator Helios 18 N23Q2 | |
| Asus ROG Strix G18 G814JI | |
| Razer Blade 18 RTX 4070 | |
| GTA V - 1920x1080 Highest AA:4xMSAA + FX AF:16x | |
| Acer Predator Helios 18 N23Q2 | |
| Alienware m18 R1 | |
| MSI Titan GT77 HX 13VI | |
| MSI Titan 18 HX A14VIG | |
| Razer Blade 18 RTX 4070 | |
| Asus ROG Strix G18 G814JI | |
| Final Fantasy XV Benchmark - 1920x1080 High Quality | |
| Alienware m18 R1 | |
| MSI Titan GT77 HX 13VI | |
| MSI Titan 18 HX A14VIG | |
| Acer Predator Helios 18 N23Q2 | |
| Asus ROG Strix G18 G814JI | |
| Razer Blade 18 RTX 4070 | |
| Strange Brigade - 1920x1080 ultra AA:ultra AF:16 | |
| MSI Titan 18 HX A14VIG | |
| MSI Titan GT77 HX 13VI | |
| Alienware m18 R1 | |
| Acer Predator Helios 18 N23Q2 | |
| Asus ROG Strix G18 G814JI | |
| Razer Blade 18 RTX 4070 | |
| Dota 2 Reborn - 1920x1080 ultra (3/3) best looking | |
| Alienware m18 R1 | |
| Acer Predator Helios 18 N23Q2 | |
| MSI Titan GT77 HX 13VI | |
| Razer Blade 18 RTX 4070 | |
| MSI Titan 18 HX A14VIG | |
| Asus ROG Strix G18 G814JI | |
| X-Plane 11.11 - 1920x1080 high (fps_test=3) | |
| Alienware m18 R1 | |
| Acer Predator Helios 18 N23Q2 | |
| Razer Blade 18 RTX 4070 | |
| MSI Titan GT77 HX 13VI | |
| MSI Titan GT77 HX 13VI | |
| MSI Titan 18 HX A14VIG | |
| Asus ROG Strix G18 G814JI | |
| The Witcher 3 | |
| 1920x1080 Ultra Graphics & Postprocessing (HBAO+) | |
| AMD Ryzen 9 7900 | |
| MSI Titan 18 HX A14VIG | |
| MSI Titan GT77 HX 13VI | |
| Average NVIDIA GeForce RTX 4090 Laptop GPU (139.2 - 216, n=35) | |
| NVIDIA GeForce RTX 4070 Super Founders Edition | |
| Acer Predator Helios 18 N23Q2 | |
| Alienware m18 R1 AMD | |
| Alienware m17 R5 (R9 6900HX, RX 6850M XT) | |
| MSI Raider GE68 HX 13VG, i7-13700HX | |
| Asus ROG Strix G18 G814JI | |
| Asus ROG Strix Scar 17 SE G733CX-LL014W | |
| Razer Blade 18 RTX 4070 | |
| Asus ROG Zephyrus M16 GU603Z | |
| Dell G16 7620 | |
| Lenovo ThinkPad Z16 Gen 2 | |
| 3840x2160 High Graphics & Postprocessing (Nvidia HairWorks Off) | |
| AMD Ryzen 9 7900 | |
| MSI Titan 18 HX A14VIG | |
| MSI Titan GT77 HX 13VI | |
| Average NVIDIA GeForce RTX 4090 Laptop GPU (96.3 - 167.6, n=19) | |
| NVIDIA GeForce RTX 4070 Super Founders Edition | |
| Alienware m18 R1 AMD | |
| Razer Blade 18 RTX 4070 | |
| Alienware m17 R5 (R9 6900HX, RX 6850M XT) | |
| Tiny Tina's Wonderlands | |
| 1920x1080 Badass Preset (DX12) | |
| MSI Titan GT77 HX 13VI | |
| MSI Titan 18 HX A14VIG | |
| Average NVIDIA GeForce RTX 4090 Laptop GPU (141.1 - 189.4, n=14) | |
| Alienware m18 R1 AMD | |
| Lenovo ThinkPad Z16 Gen 2 | |
| 2560x1440 Badass Preset (DX12) | |
| MSI Titan GT77 HX 13VI | |
| MSI Titan 18 HX A14VIG | |
| Average NVIDIA GeForce RTX 4090 Laptop GPU (103.4 - 137.8, n=14) | |
| Alienware m18 R1 AMD | |
| Lenovo ThinkPad Z16 Gen 2 | |
| 3840x2160 Badass Preset (DX12) | |
| MSI Titan 18 HX A14VIG | |
| MSI Titan GT77 HX 13VI | |
| Average NVIDIA GeForce RTX 4090 Laptop GPU (53.3 - 73.7, n=12) | |
| Alienware m18 R1 AMD | |
| Cyberpunk 2077 | |
| 1920x1080 Ultra Preset (FSR off) | |
| NVIDIA GeForce RTX 4070 Super Founders Edition | |
| MSI Titan 18 HX A14VIG | |
| Alienware m18 R1 AMD | |
| Acer Predator Helios 18 N23Q2 | |
| Average NVIDIA GeForce RTX 4090 Laptop GPU (93.1 - 158, n=21) | |
| Lenovo ThinkPad Z16 Gen 2 | |
| 2560x1440 Ultra Preset (FSR off) | |
| MSI Titan 18 HX A14VIG | |
| Average NVIDIA GeForce RTX 4090 Laptop GPU (68.1 - 103.9, n=21) | |
| Alienware m18 R1 AMD | |
| NVIDIA GeForce RTX 4070 Super Founders Edition | |
| Acer Predator Helios 18 N23Q2 | |
| Lenovo ThinkPad Z16 Gen 2 | |
| 3840x2160 Ultra Preset (FSR off) | |
| MSI Titan 18 HX A14VIG | |
| Average NVIDIA GeForce RTX 4090 Laptop GPU (31.6 - 50.6, n=11) | |
| NVIDIA GeForce RTX 4070 Super Founders Edition | |
| Alienware m18 R1 AMD | |
| 3840x2160 Ray Tracing Ultra Preset (DLSS off, no Path Tracing) | |
| Average NVIDIA GeForce RTX 4090 Laptop GPU (20.2 - 22.3, n=4) | |
| NVIDIA GeForce RTX 4070 Super Founders Edition | |
| F1 22 | |
| 1920x1080 Ultra High Preset AA:T AF:16x | |
| AMD Ryzen 9 7900 | |
| MSI Titan GT77 HX 13VI | |
| MSI Titan 18 HX A14VIG | |
| NVIDIA GeForce RTX 4070 Super Founders Edition | |
| Average NVIDIA GeForce RTX 4090 Laptop GPU (70.3 - 144.7, n=25) | |
| Alienware m18 R1 AMD | |
| MSI Raider GE68 HX 13VG, i7-13700HX | |
| Asus ROG Strix Scar 17 SE G733CX-LL014W | |
| Lenovo ThinkPad Z16 Gen 2 | |
| 2560x1440 Ultra High Preset AA:T AF:16x | |
| AMD Ryzen 9 7900 | |
| MSI Titan 18 HX A14VIG | |
| MSI Titan GT77 HX 13VI | |
| Average NVIDIA GeForce RTX 4090 Laptop GPU (65.9 - 92.2, n=25) | |
| NVIDIA GeForce RTX 4070 Super Founders Edition | |
| Alienware m18 R1 AMD | |
| Asus ROG Strix Scar 17 SE G733CX-LL014W | |
| MSI Raider GE68 HX 13VG, i7-13700HX | |
| Lenovo ThinkPad Z16 Gen 2 | |
| 3840x2160 Ultra High Preset AA:T AF:16x | |
| AMD Ryzen 9 7900 | |
| MSI Titan GT77 HX 13VI | |
| MSI Titan 18 HX A14VIG | |
| Average NVIDIA GeForce RTX 4090 Laptop GPU (36.8 - 46.1, n=18) | |
| NVIDIA GeForce RTX 4070 Super Founders Edition | |
| Alienware m18 R1 AMD | |
| MSI Raider GE68 HX 13VG, i7-13700HX | |
Witcher 3 FPS Chart
| low | med. | high | ultra | QHD | 4K | |
|---|---|---|---|---|---|---|
| GTA V (2015) | 139.2 | |||||
| The Witcher 3 (2015) | 595.3 | 506.6 | 412.2 | 211.2 | 160.7 | |
| Dota 2 Reborn (2015) | 218 | 196.3 | 186.5 | 174.5 | 168.3 | |
| Final Fantasy XV Benchmark (2018) | 229 | 216 | 184 | 158 | 93.6 | |
| X-Plane 11.11 (2018) | 184.9 | 161.8 | 126.1 | 106.5 | ||
| Far Cry 5 (2018) | 191 | 164 | 158 | 155 | 152 | 112 |
| Strange Brigade (2018) | 511 | 423 | 406 | 385 | 307 | 156.1 |
| Tiny Tina's Wonderlands (2022) | 324.7 | 279.8 | 223.7 | 182 | 130.8 | 71 |
| F1 22 (2022) | 307 | 297 | 280 | 132.7 | 90.5 | 44.6 |
| Baldur's Gate 3 (2023) | 246.7 | 226.9 | 208.6 | 207.7 | 155.2 | 80.8 |
| Cyberpunk 2077 (2023) | 155.7 | 145.4 | 135.9 | 129.8 | 94.5 | 43.9 |
| Avatar Frontiers of Pandora (2023) | 103 | 69 | 35 |
排放量
系统噪音
风扇噪音和行为与微星中心电源配置文件直接相关:开启 Cooler Boost 时的极致性能、关闭 Cooler Boost 时的极致性能、平衡和静音。开启 Cooler Boost 时的游戏噪音可达 63 dB(A),而关闭 Cooler Boost 时为 57.3 dB(A)。不过,如上所述,这两种模式的性能差异很小,因此建议关闭 Cooler Boost 模式进行游戏,以免笔记本电脑发出吹风机般的声音。
在平衡模式下进行游戏时,风扇噪音最高为 53 分贝(A),明显低于两种极致性能模式。不过,需要注意的是,如上所述,在平衡模式下运行时,性能差距会更大。无论如何,请做好在游戏时系统噪音非常大的准备。
Noise level
| Idle |
| 23.8 / 23.8 / 28 dB(A) |
| Load |
| 38 / 62.8 dB(A) |
 | ||
30 dB silent 40 dB(A) audible 50 dB(A) loud |
||
min: | ||
| MSI Titan 18 HX A14VIG GeForce RTX 4090 Laptop GPU, i9-14900HX, 2x Samsung PM9A1a MZVL22T0HDLB (RAID 0) | MSI Titan GT77 HX 13VI GeForce RTX 4090 Laptop GPU, i9-13950HX, Samsung PM9A1 MZVL22T0HBLB | Alienware m18 R1 GeForce RTX 4090 Laptop GPU, i9-13980HX, SK hynix PC801 HFS001TEJ9X101N | Asus ROG Strix G18 G814JI GeForce RTX 4070 Laptop GPU, i7-13650HX, Micron 2400 MTFDKBA1T0QFM | Acer Predator Helios 18 N23Q2 GeForce RTX 4080 Laptop GPU, i9-13900HX, Samsung PM9A1 MZVL22T0HBLB | Razer Blade 18 RTX 4070 GeForce RTX 4070 Laptop GPU, i9-13950HX, SSSTC CA6-8D1024 | |
|---|---|---|---|---|---|---|
| Noise | -12% | 7% | 0% | 1% | 5% | |
| off / environment * (dB) | 22.8 | 24.6 -8% | 22.8 -0% | 25 -10% | 23 -1% | 23.5 -3% |
| Idle Minimum * (dB) | 23.8 | 29.2 -23% | 23 3% | 26 -9% | 23 3% | 23.8 -0% |
| Idle Average * (dB) | 23.8 | 29.2 -23% | 23 3% | 28 -18% | 23 3% | 23.8 -0% |
| Idle Maximum * (dB) | 28 | 29.2 -4% | 23 18% | 29 -4% | 23 18% | 26.8 4% |
| Load Average * (dB) | 38 | 50.7 -33% | 35.6 6% | 41 -8% | 45.26 -19% | 37.3 2% |
| Witcher 3 ultra * (dB) | 57.3 | 53.3 7% | 51.3 10% | 44 23% | 59.82 -4% | 48 16% |
| Load Maximum * (dB) | 62.8 | 61 3% | 56.7 10% | 46 27% | 59.94 5% | 53.5 15% |
* ... smaller is better
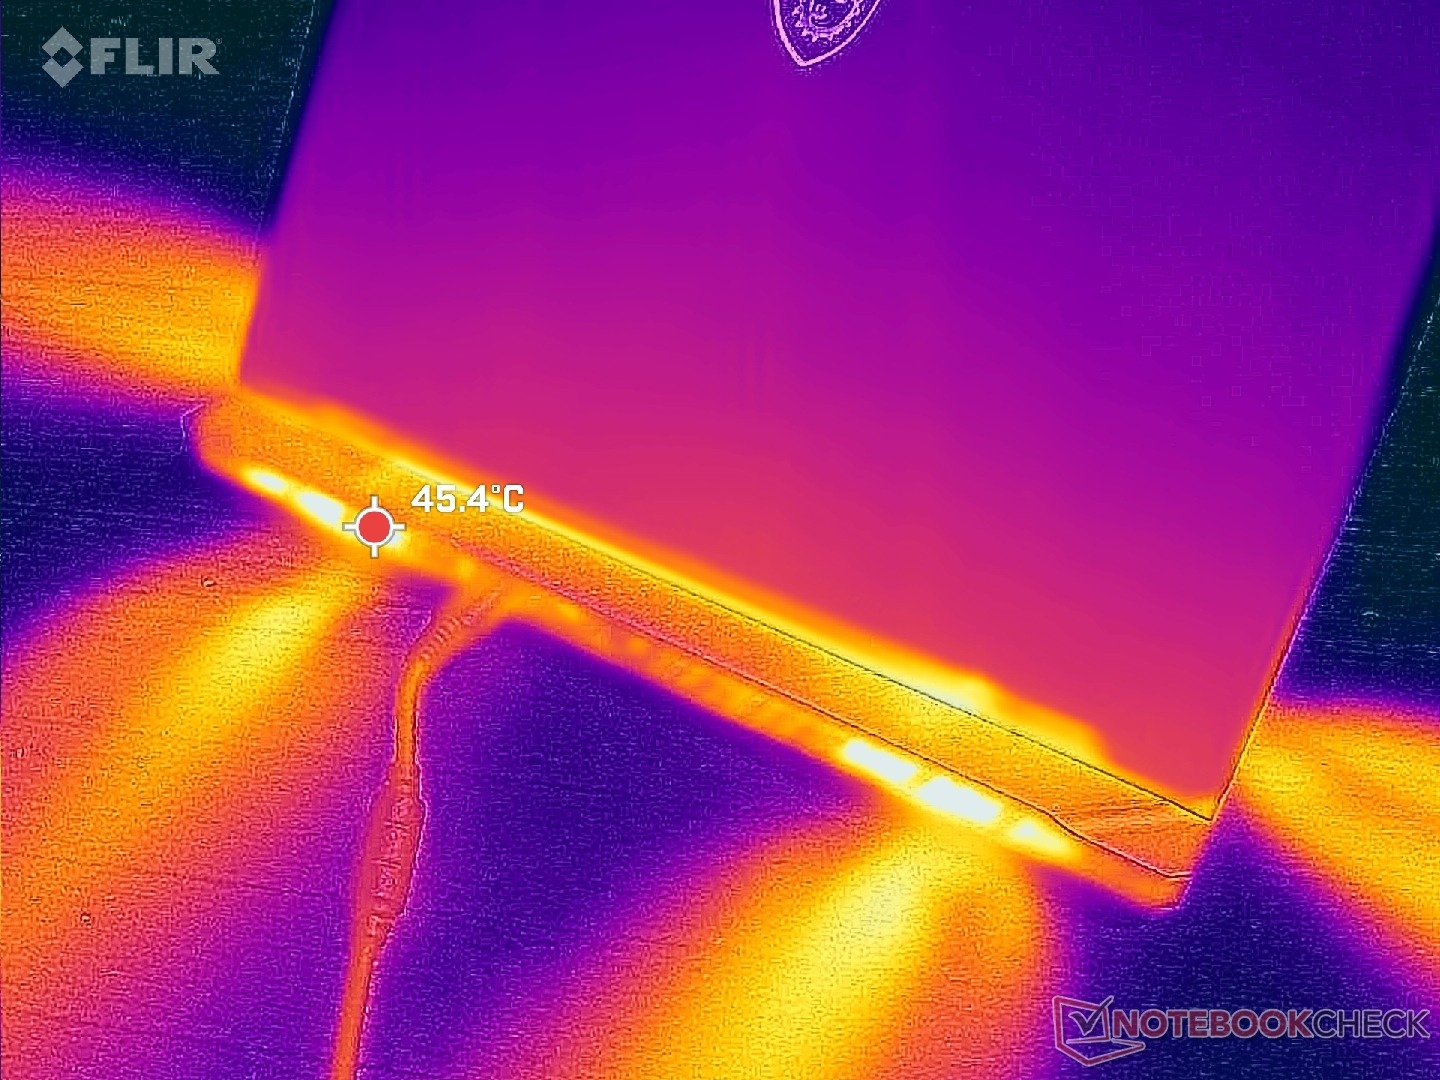
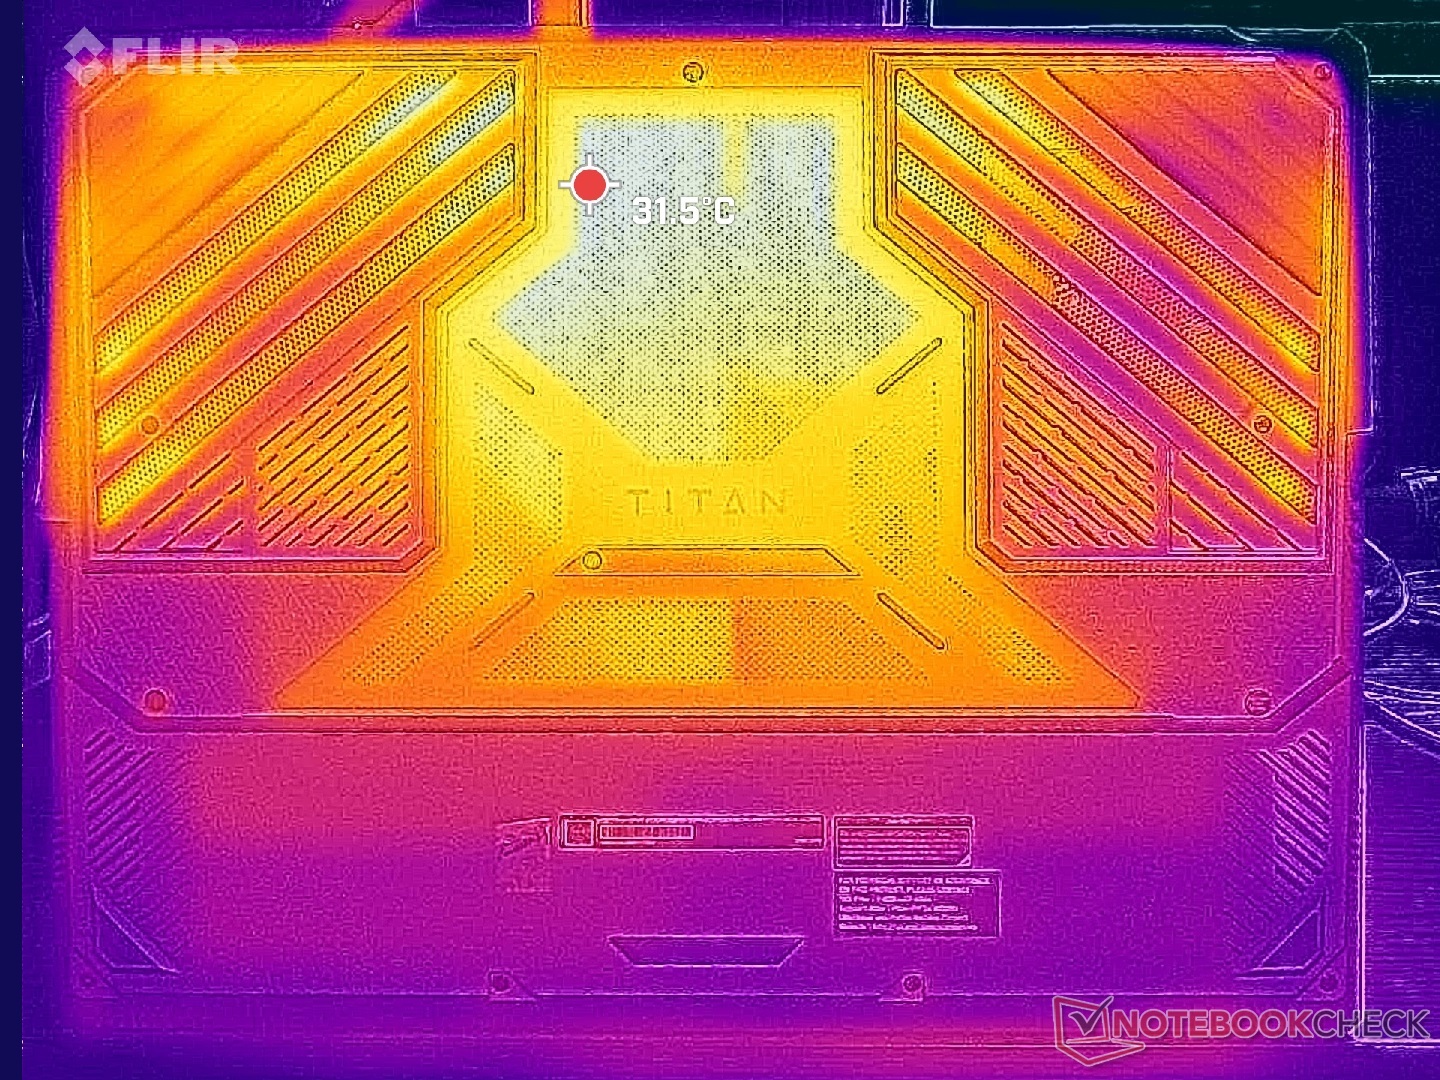
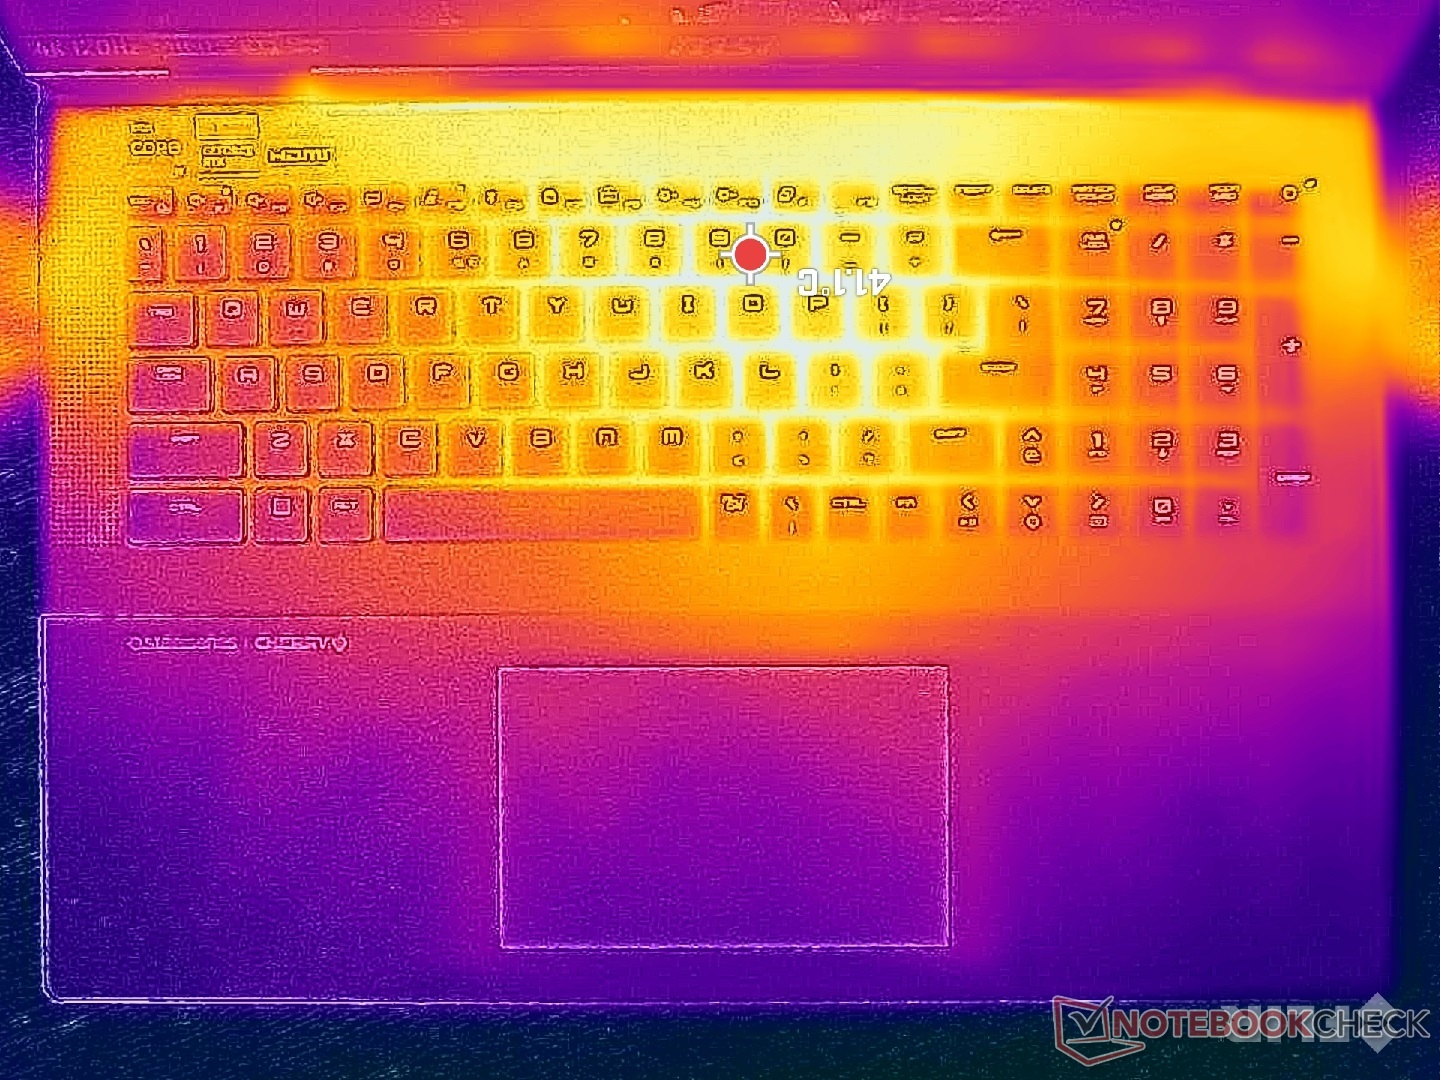
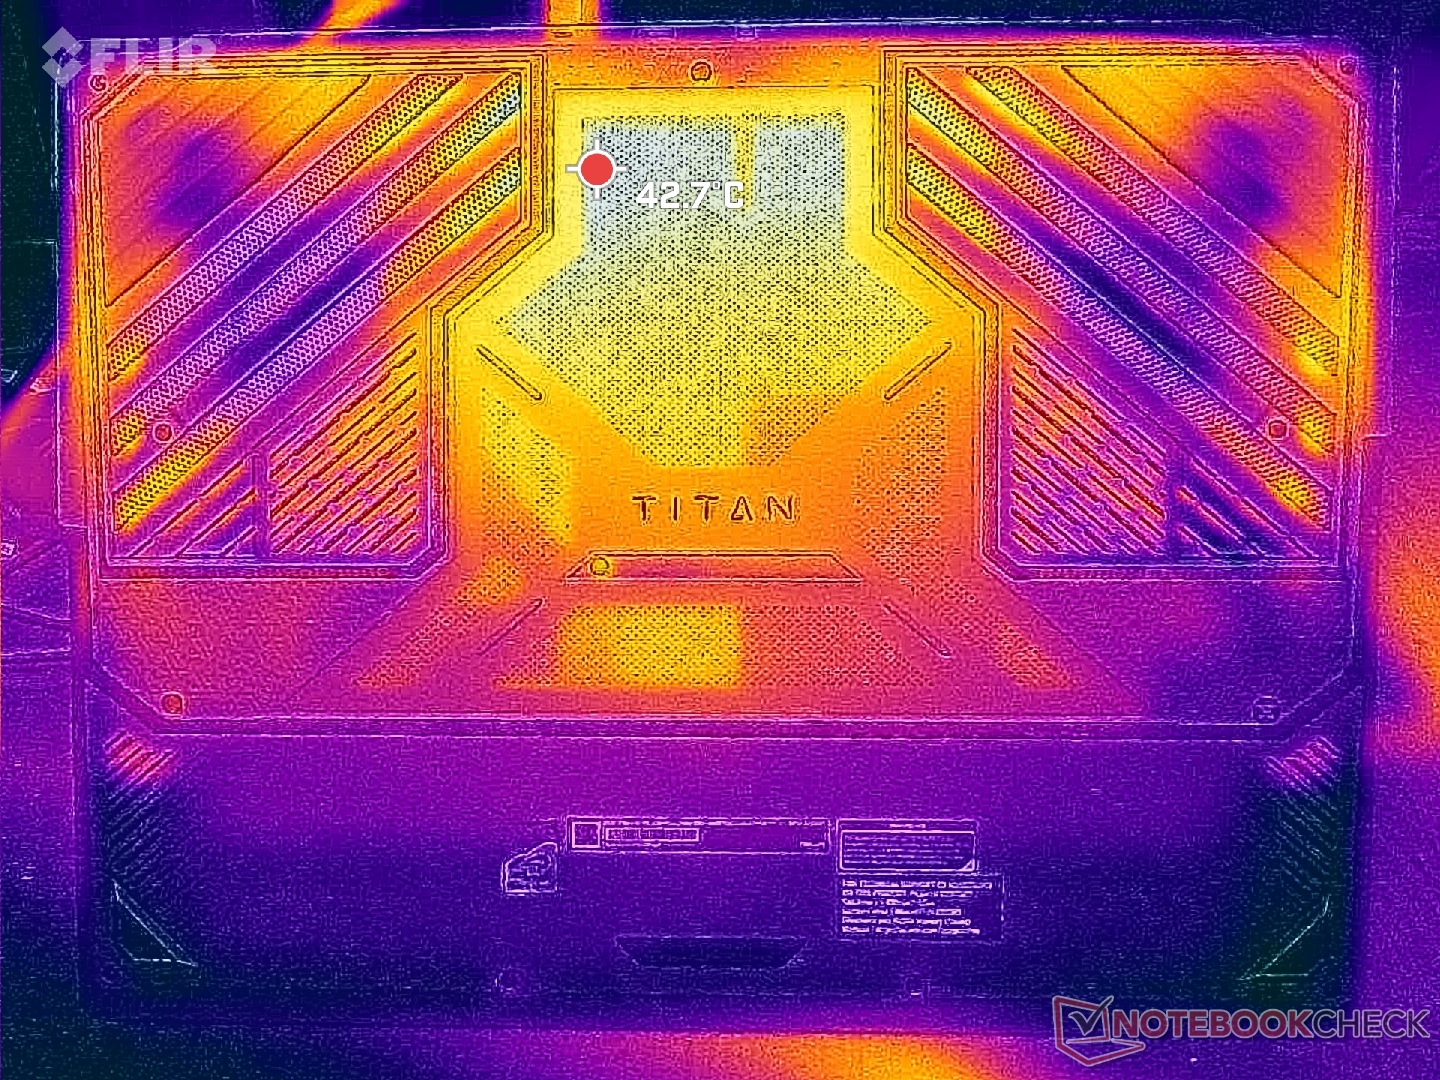
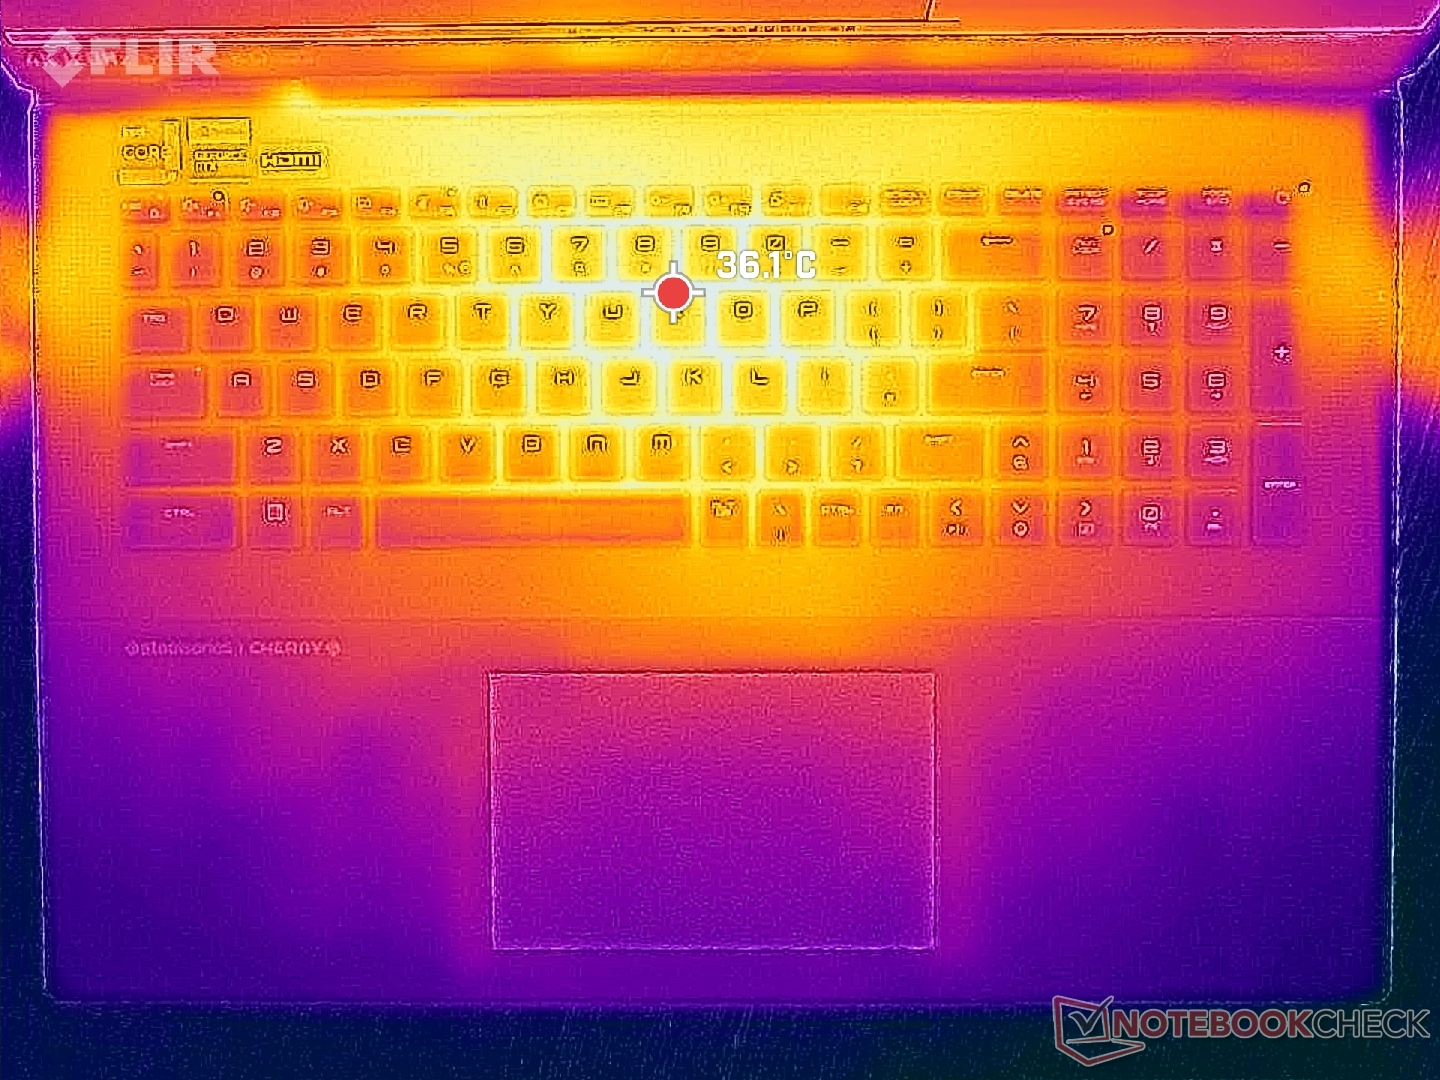
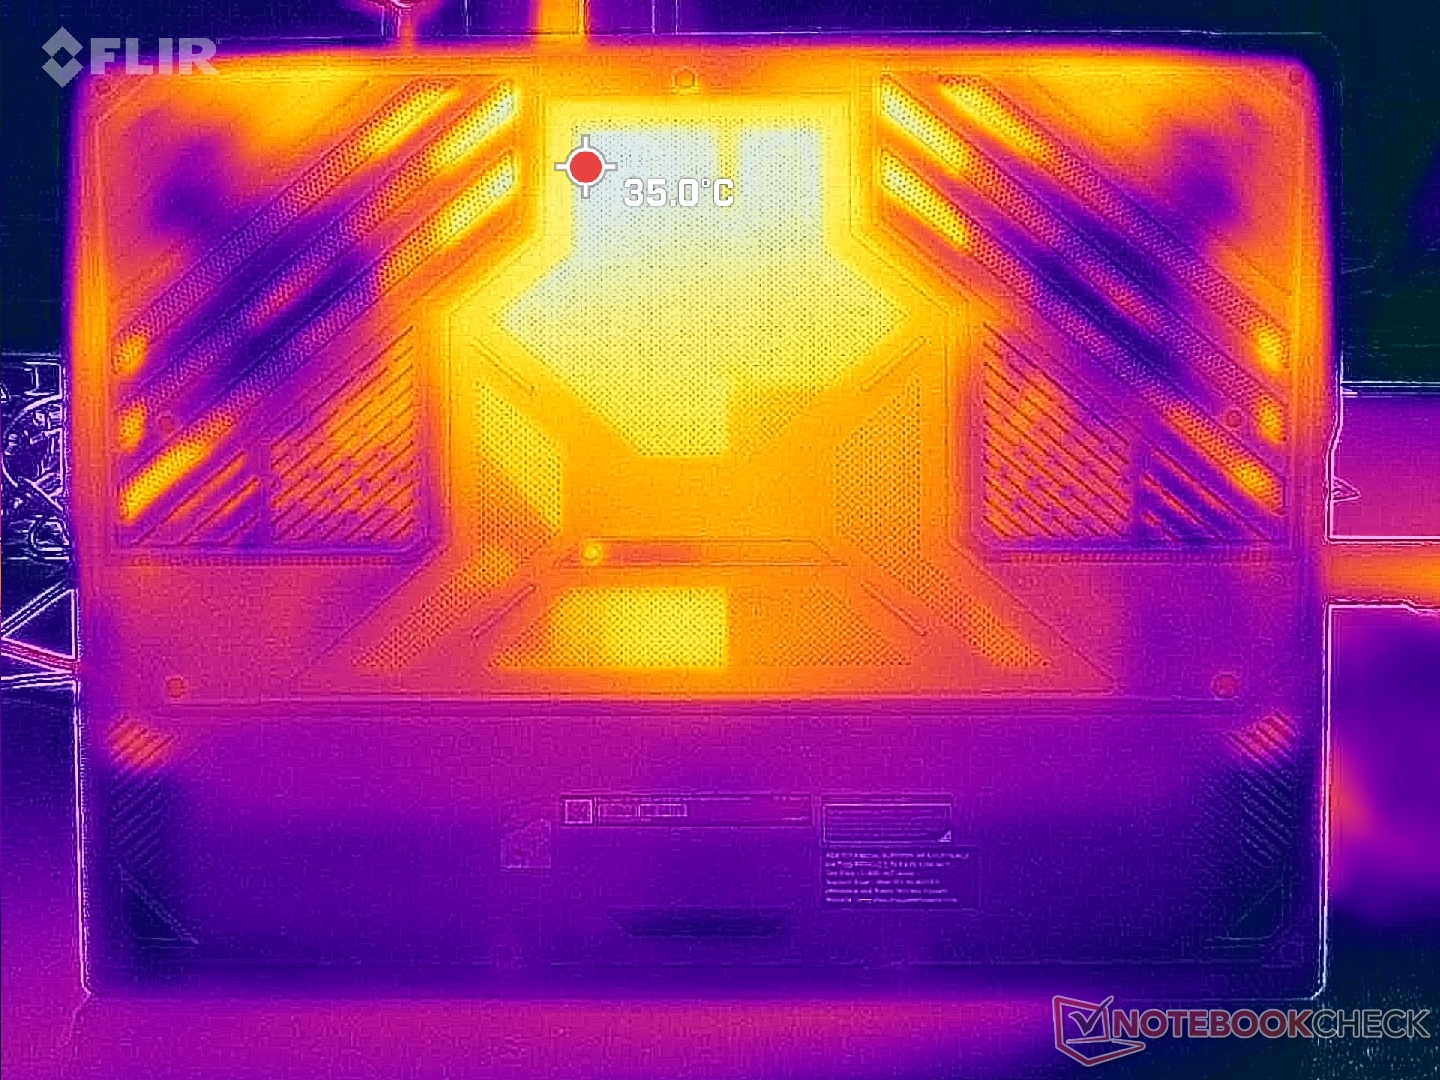
温度
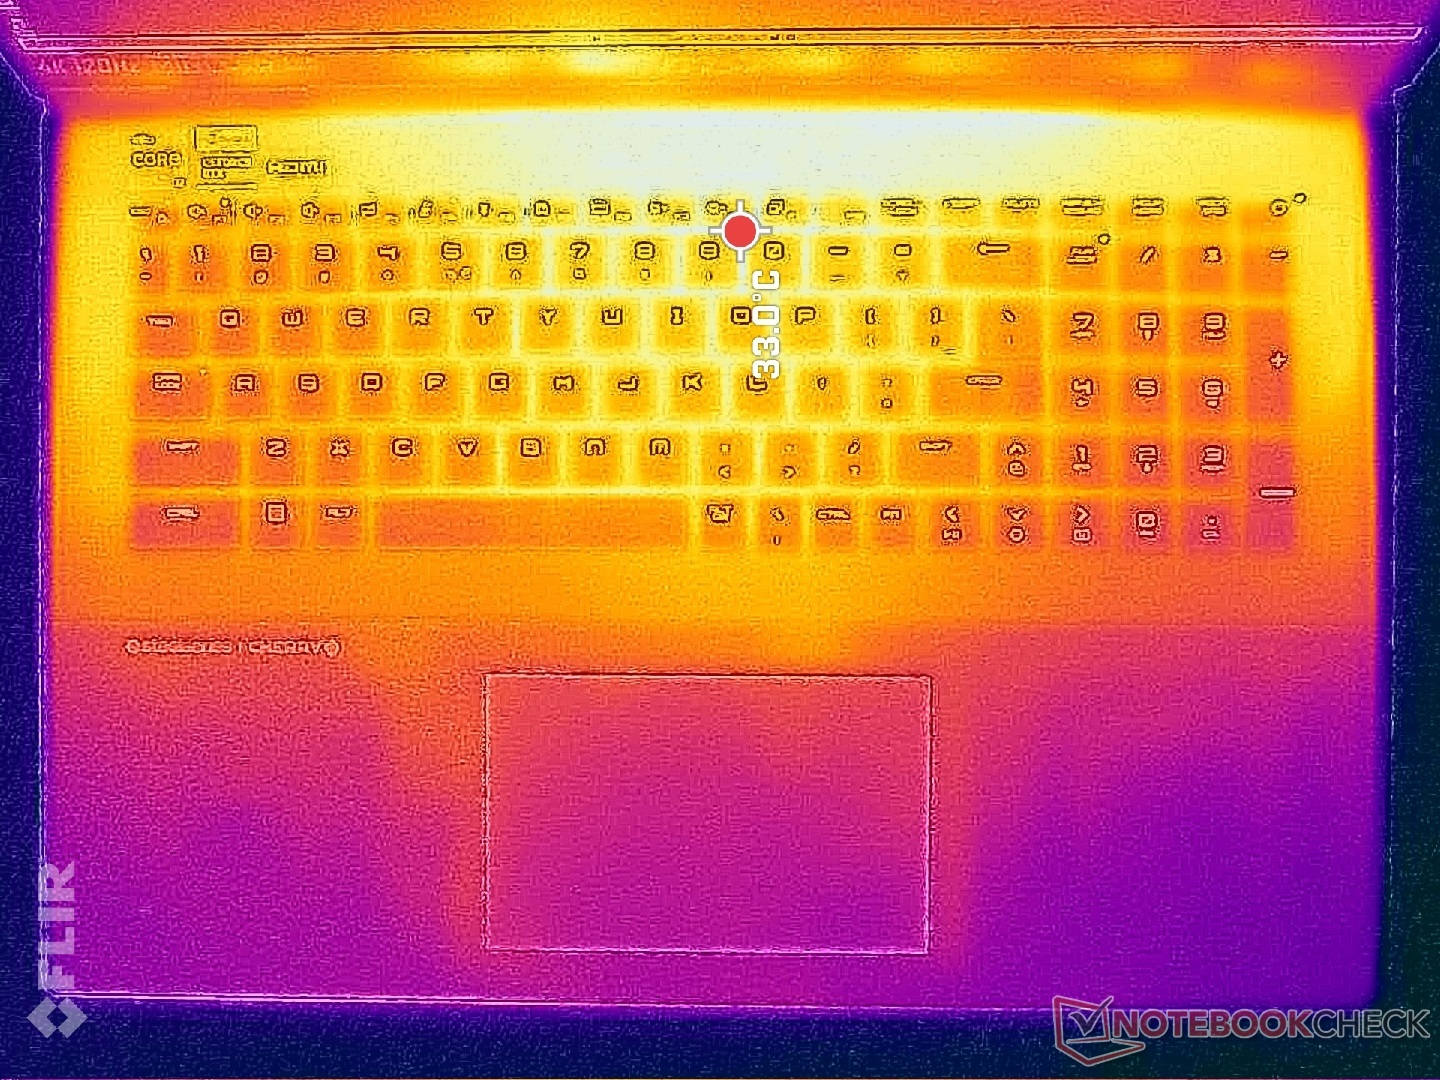
令人惊讶的是,这里的表面温度比我们在一体式机身上记录的温度略高。 雷蛇刀锋 18尽管微星的设计更厚。在Cooler Boost激活和未激活的情况下,热点温度分别为41摄氏度和37摄氏度,而雷蛇为35摄氏度至40摄氏度。值得庆幸的是,发热点位于系统的后部,手和手指不太可能接触到。在游戏时,我们从未发现掌托或按键发热让人不舒服。
(+) The maximum temperature on the upper side is 37.8 °C / 100 F, compared to the average of 40.4 °C / 105 F, ranging from 21.2 to 68.8 °C for the class Gaming.
(+) The bottom heats up to a maximum of 37.6 °C / 100 F, compared to the average of 43.2 °C / 110 F
(+) In idle usage, the average temperature for the upper side is 29.8 °C / 86 F, compared to the device average of 33.9 °C / 93 F.
(±) Playing The Witcher 3, the average temperature for the upper side is 32.3 °C / 90 F, compared to the device average of 33.9 °C / 93 F.
(+) The palmrests and touchpad are cooler than skin temperature with a maximum of 25.6 °C / 78.1 F and are therefore cool to the touch.
(+) The average temperature of the palmrest area of similar devices was 28.8 °C / 83.8 F (+3.2 °C / 5.7 F).
| MSI Titan 18 HX A14VIG Intel Core i9-14900HX, NVIDIA GeForce RTX 4090 Laptop GPU | MSI Titan GT77 HX 13VI Intel Core i9-13950HX, NVIDIA GeForce RTX 4090 Laptop GPU | Alienware m18 R1 Intel Core i9-13980HX, NVIDIA GeForce RTX 4090 Laptop GPU | Asus ROG Strix G18 G814JI Intel Core i7-13650HX, NVIDIA GeForce RTX 4070 Laptop GPU | Acer Predator Helios 18 N23Q2 Intel Core i9-13900HX, NVIDIA GeForce RTX 4080 Laptop GPU | Razer Blade 18 RTX 4070 Intel Core i9-13950HX, NVIDIA GeForce RTX 4070 Laptop GPU | |
|---|---|---|---|---|---|---|
| Heat | 6% | 10% | -3% | -12% | 5% | |
| Maximum Upper Side * (°C) | 37.8 | 40.6 -7% | 39 -3% | 45 -19% | 35 7% | 39.2 -4% |
| Maximum Bottom * (°C) | 37.6 | 41.1 -9% | 36.4 3% | 47 -25% | 56 -49% | 35.6 5% |
| Idle Upper Side * (°C) | 34.8 | 26.2 25% | 29.2 16% | 28 20% | 34 2% | 31.8 9% |
| Idle Bottom * (°C) | 36 | 30.3 16% | 27.8 23% | 31 14% | 39 -8% | 33.2 8% |
* ... smaller is better
压力测试
即使启用了 Cooler Boost,CPU 在负载情况下的温度也会比预期的要高。例如,运行Witcher 3 来代表典型的游戏负载,在关闭和开启 Cooler Boost 的情况下,CPU 的温度会分别稳定在 97 C 和 90 C。Meanwhile, the GPU would stabilize at the more reasonable 60 C range.在 Razer Blade 18 或 Alienware m18 R1 上重复这项测试,GPU 的温度会相似,但 CPU 的温度会更低,在 80 C 左右。
需要注意的是,开启 Cooler Boost 和关闭 Cooler Boost 在性能上没有明显差异,这与我们在上面 GPU 性能部分观察到的情况类似。运行Witcher 3 时,GPU 时钟频率和主板功耗都相对稳定,分别为 2370 MHz 和 169 W。
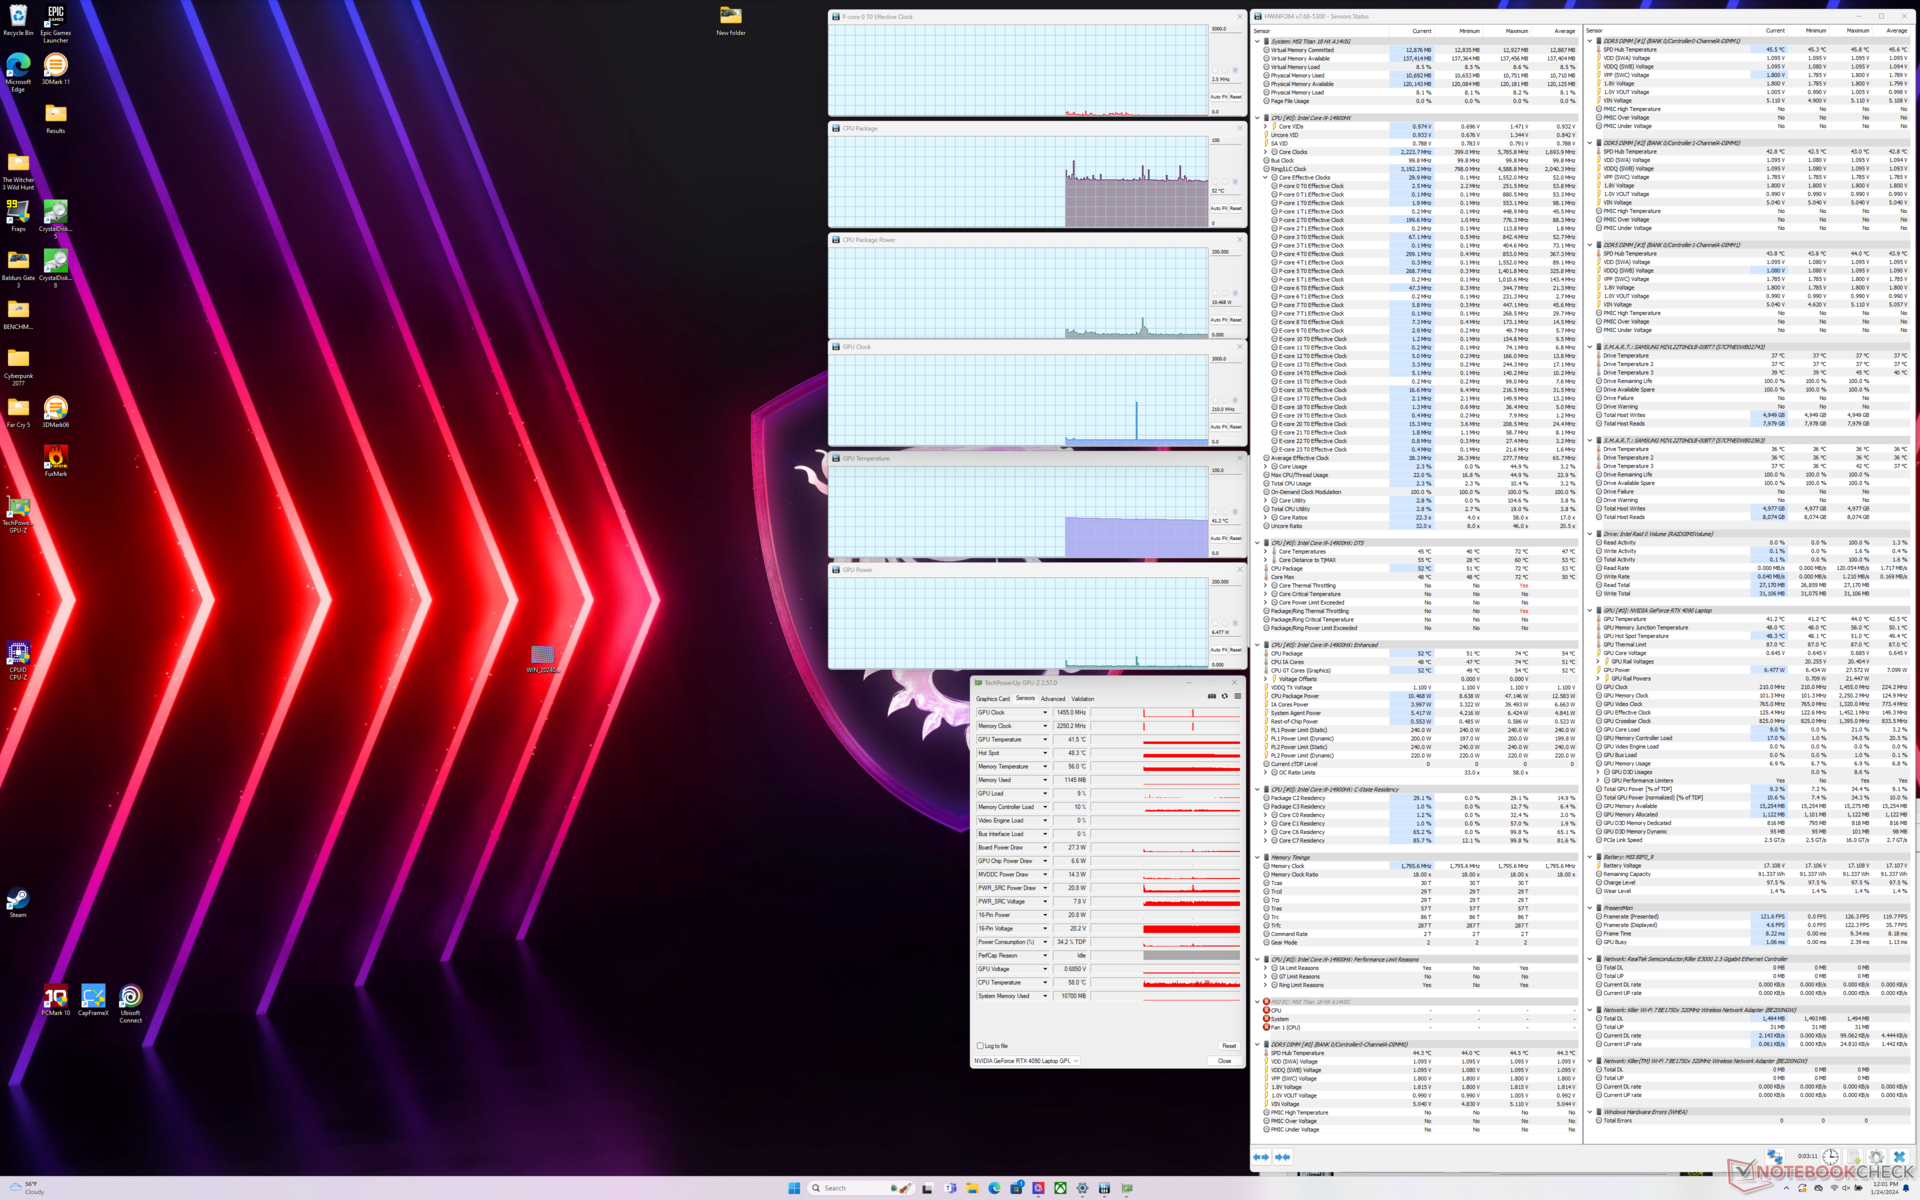
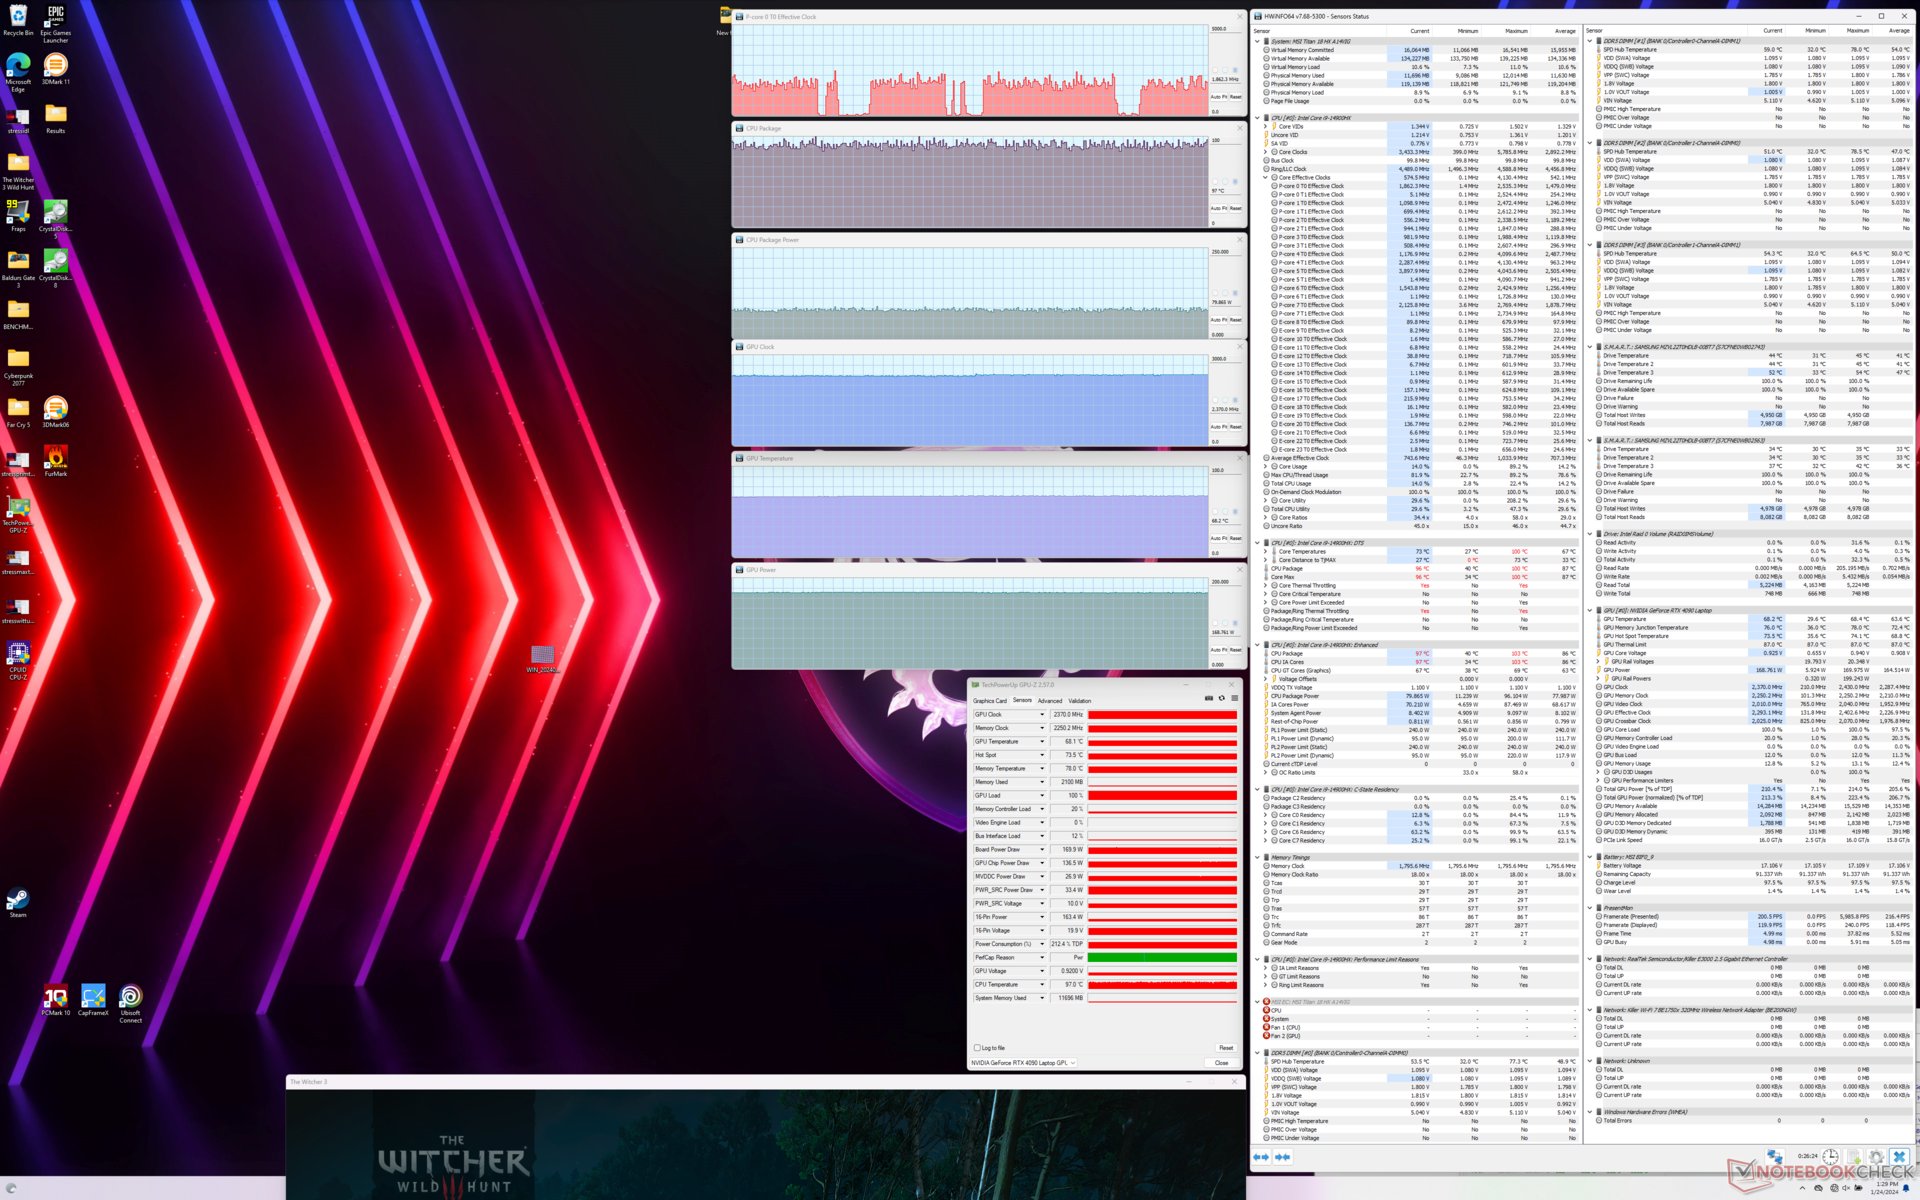
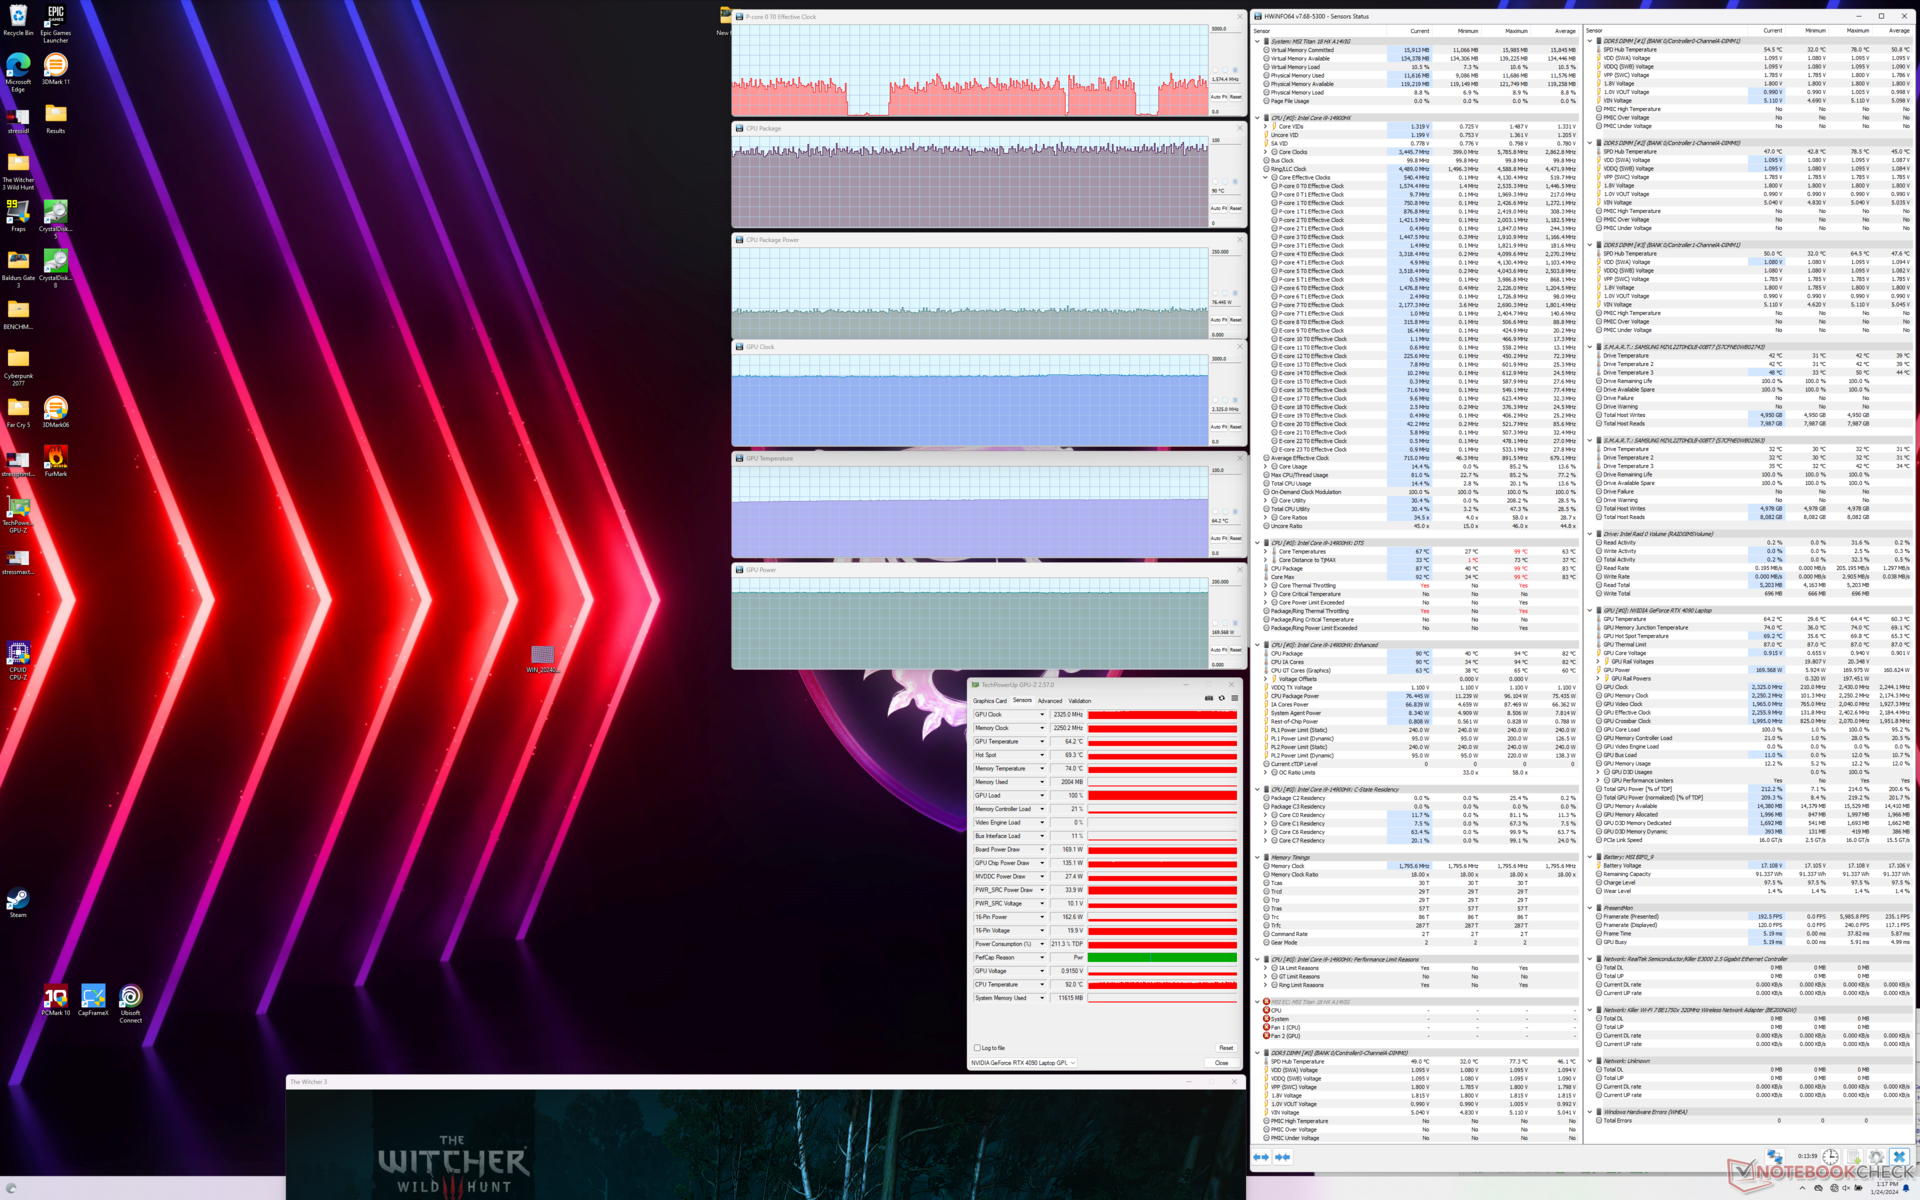
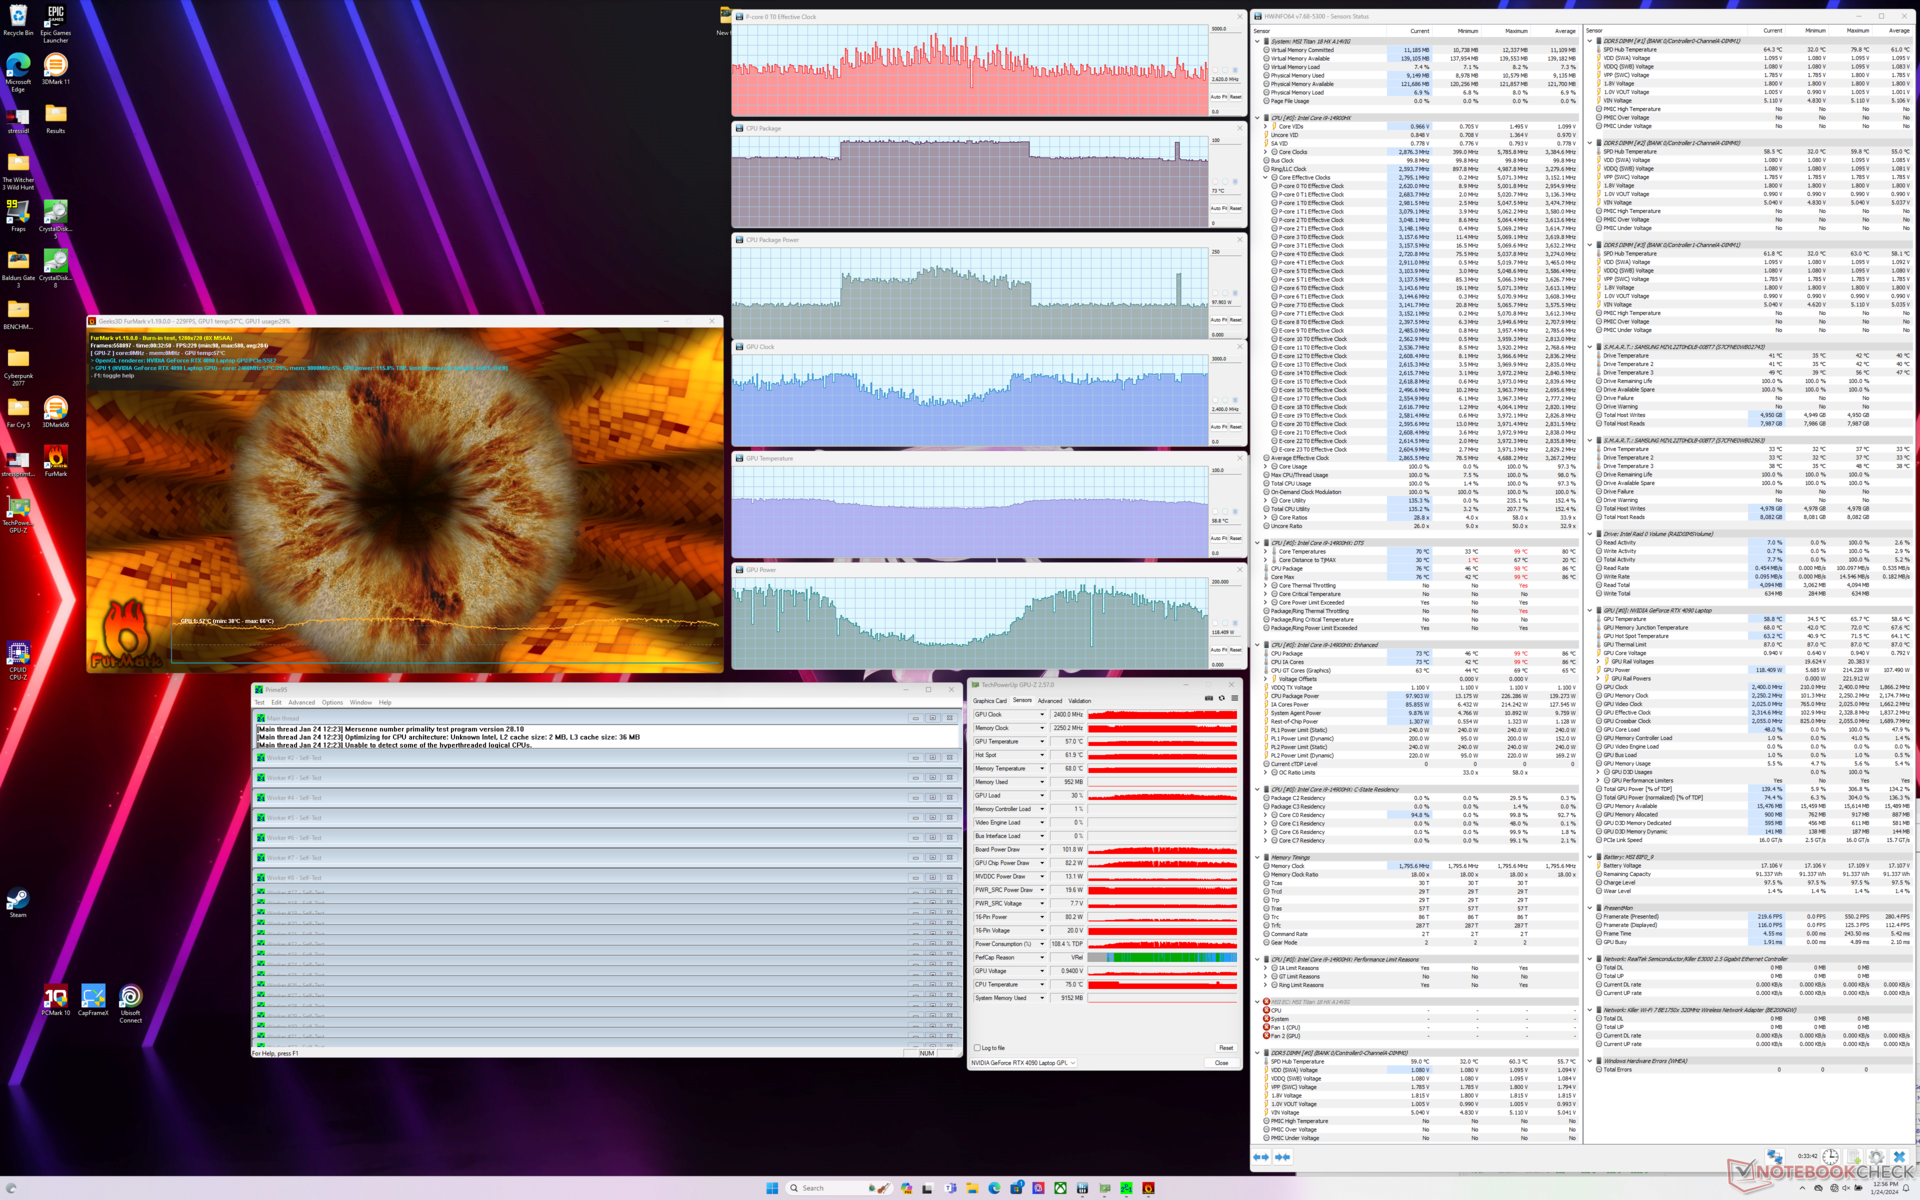
| CPU 时钟 (GHz) | GPU 时钟 (MHz) | CPU 平均温度 (°C) | GPU 平均温度(°C) | |
| 系统闲置 | -- | -- | 52 | 41 |
| Prime95 压力 | ~3.8 | -- | 94 | 46 |
| Prime95 + FurMark 压力 | ~2.6 - ~4.3 | 1300 - 2400 | 73 - 95 | 55 - 65 |
| Witcher 3 压力(平衡模式) | ~1.4 | 2130 | 85 | 68 |
| Witcher 3 压力(极致性能冷却器增强关闭) | ~1.8 | 2370 | 97 | 68 |
| Witcher 3 压力(开启极高性能冷却器增强功能) | ~1.8 | 2325 | 90 | 64 |
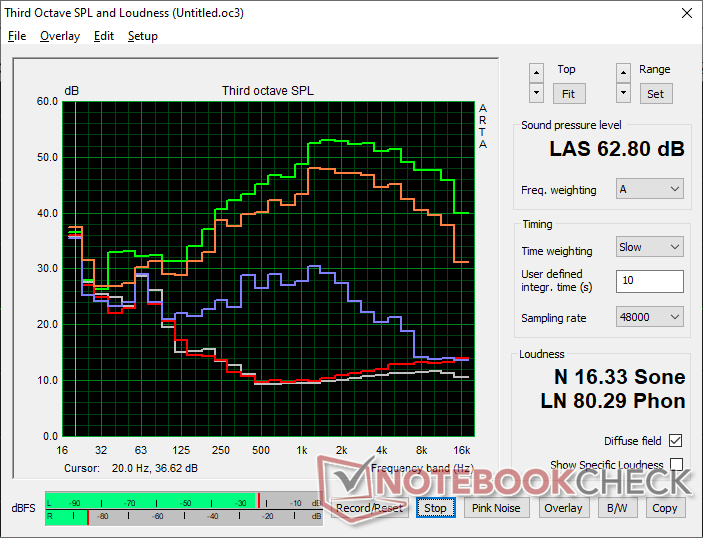
发言人
MSI Titan 18 HX A14VIG audio analysis
(+) | speakers can play relatively loud (89.2 dB)
Bass 100 - 315 Hz
(-) | nearly no bass - on average 17.6% lower than median
(±) | linearity of bass is average (8% delta to prev. frequency)
Mids 400 - 2000 Hz
(+) | balanced mids - only 1.8% away from median
(+) | mids are linear (3.7% delta to prev. frequency)
Highs 2 - 16 kHz
(+) | balanced highs - only 1.2% away from median
(+) | highs are linear (2% delta to prev. frequency)
Overall 100 - 16.000 Hz
(+) | overall sound is linear (9.9% difference to median)
Compared to same class
» 5% of all tested devices in this class were better, 2% similar, 94% worse
» The best had a delta of 6%, average was 18%, worst was 132%
Compared to all devices tested
» 4% of all tested devices were better, 1% similar, 95% worse
» The best had a delta of 4%, average was 23%, worst was 134%
Apple MacBook Pro 16 2021 M1 Pro audio analysis
(+) | speakers can play relatively loud (84.7 dB)
Bass 100 - 315 Hz
(+) | good bass - only 3.8% away from median
(+) | bass is linear (5.2% delta to prev. frequency)
Mids 400 - 2000 Hz
(+) | balanced mids - only 1.3% away from median
(+) | mids are linear (2.1% delta to prev. frequency)
Highs 2 - 16 kHz
(+) | balanced highs - only 1.9% away from median
(+) | highs are linear (2.7% delta to prev. frequency)
Overall 100 - 16.000 Hz
(+) | overall sound is linear (4.6% difference to median)
Compared to same class
» 0% of all tested devices in this class were better, 0% similar, 100% worse
» The best had a delta of 5%, average was 17%, worst was 45%
Compared to all devices tested
» 0% of all tested devices were better, 0% similar, 100% worse
» The best had a delta of 4%, average was 23%, worst was 134%
能源管理
耗电量
由于采用了 95 W CPU、175 W GPU 和超亮 4K 120 Hz 迷你 LED 显示屏,整体功耗普遍高于其他 18 英寸游戏笔记本电脑。根据亮度设置和 dGPU/iGPU 设置的不同,仅在桌面上空转就会消耗 13 W 到 54 W 的功率,这比采用标准 IPS 面板的华硕 ROG Strix G18 或宏碁掠夺者 Helios 18 要大得多。
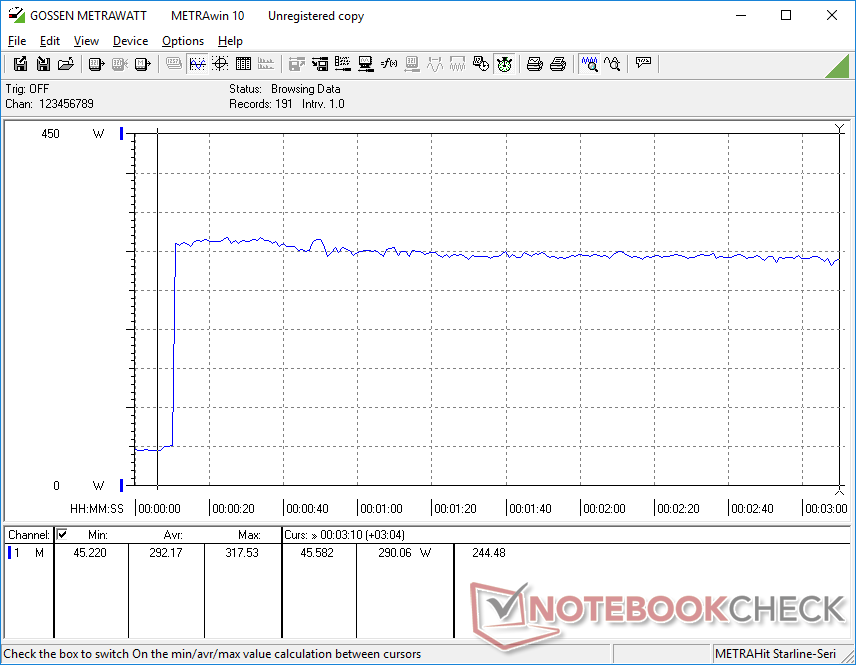
如果玩游戏,微星系统仍然是要求最高的笔记本电脑之一。运行Witcher 3 将消耗近 340 W,而去年的产品仅为 265 W 和 311 W。 GT77 或 Alienware m18 R1的功耗分别为 265 瓦和 311 瓦,它们都采用了相同的 RTX 4090 GPU。
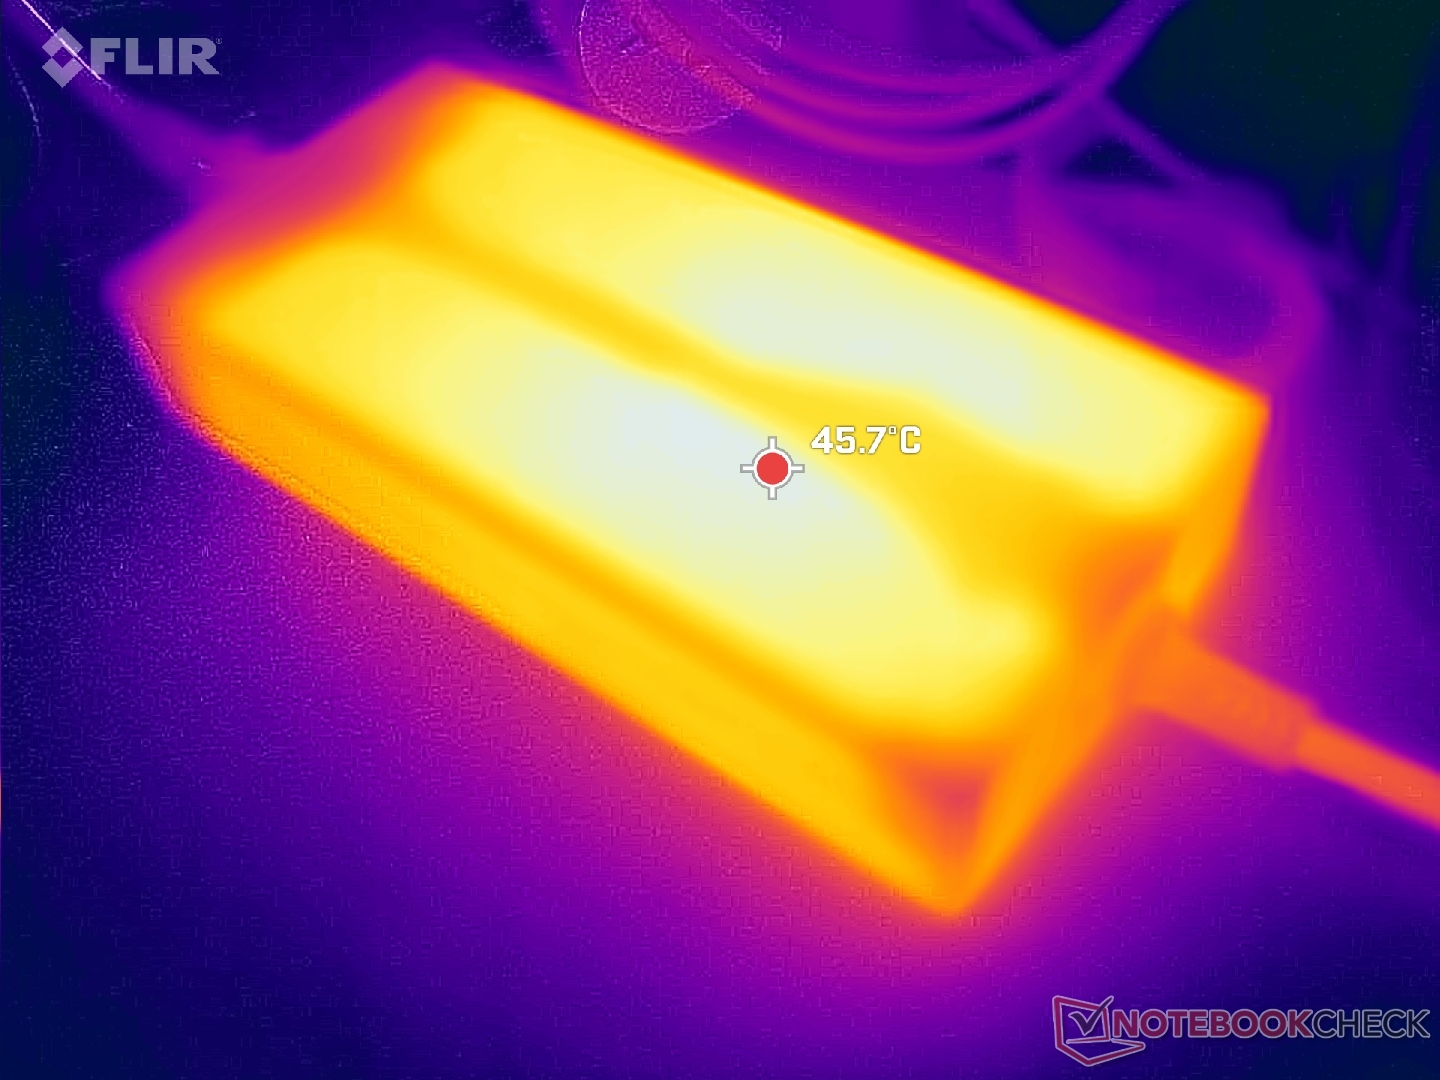
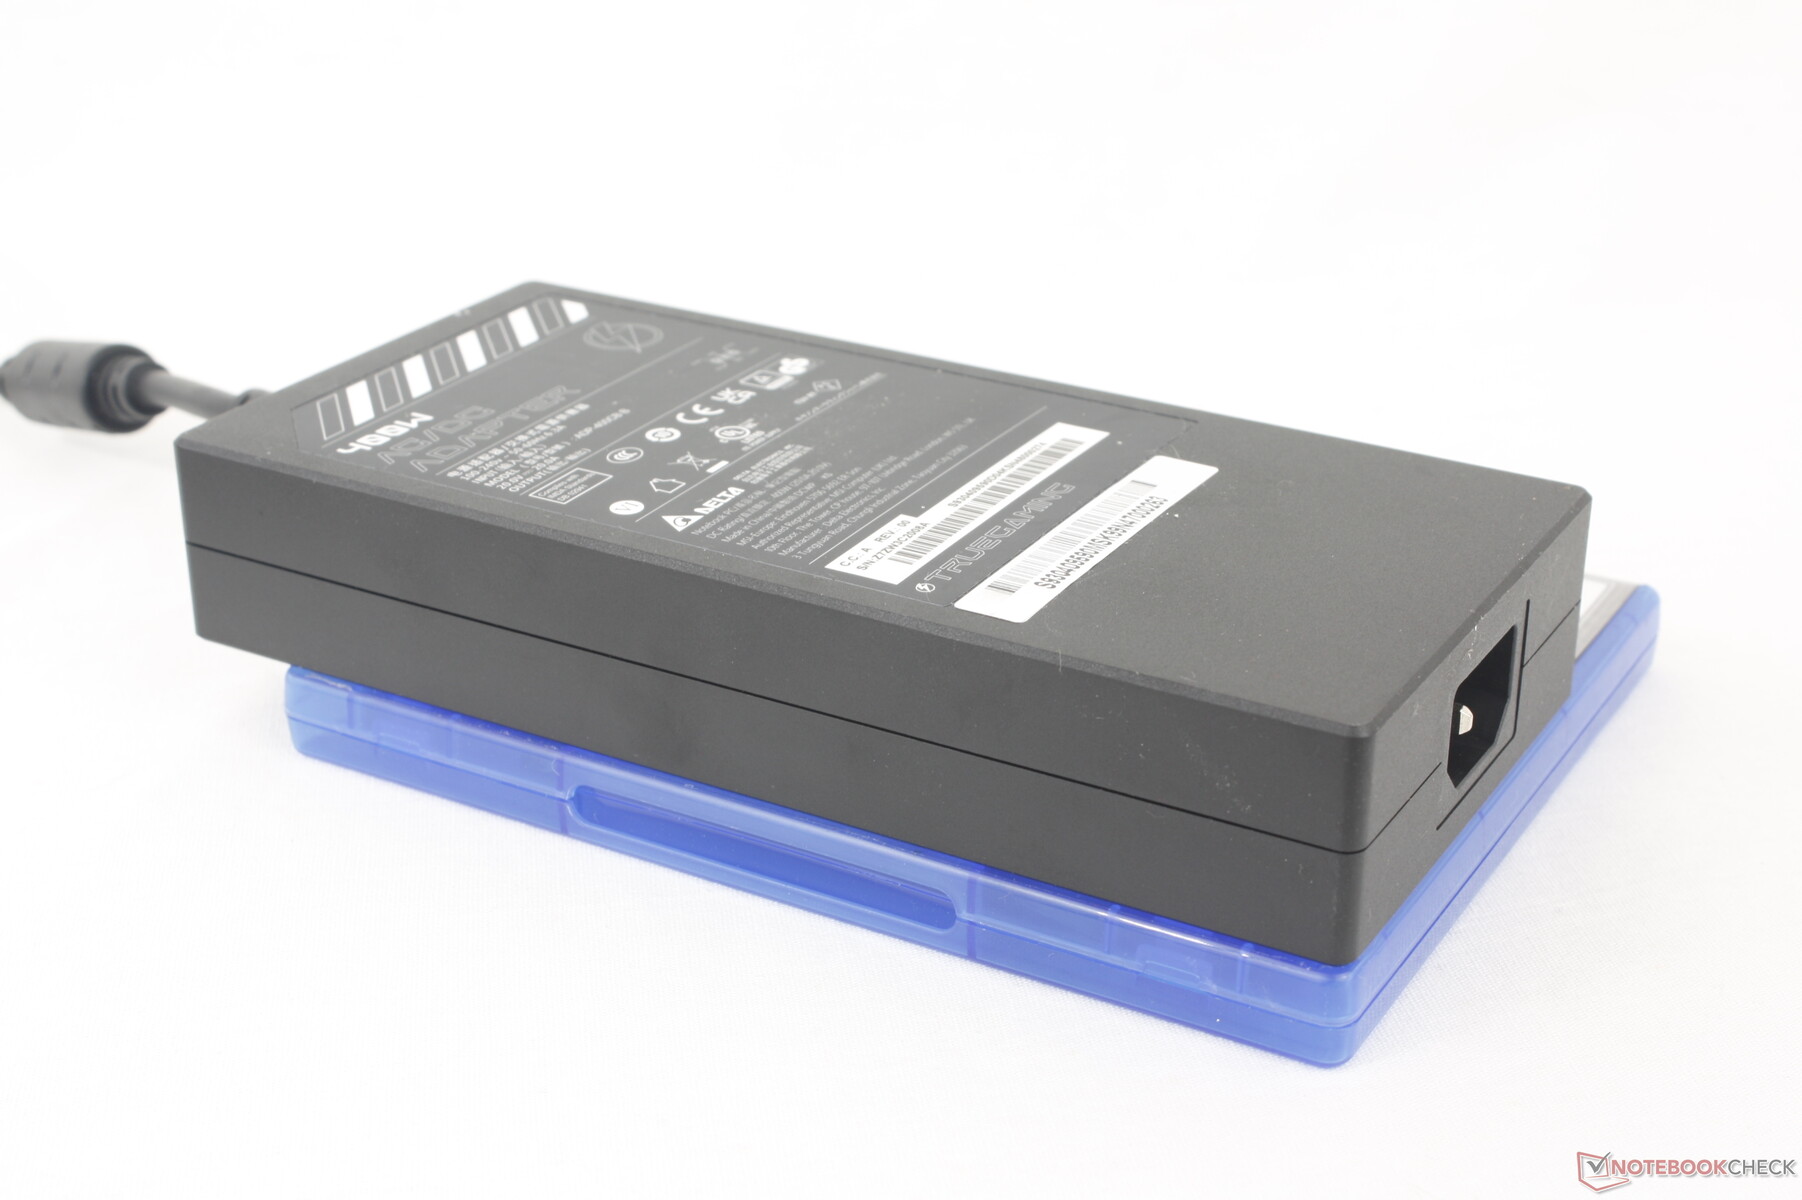
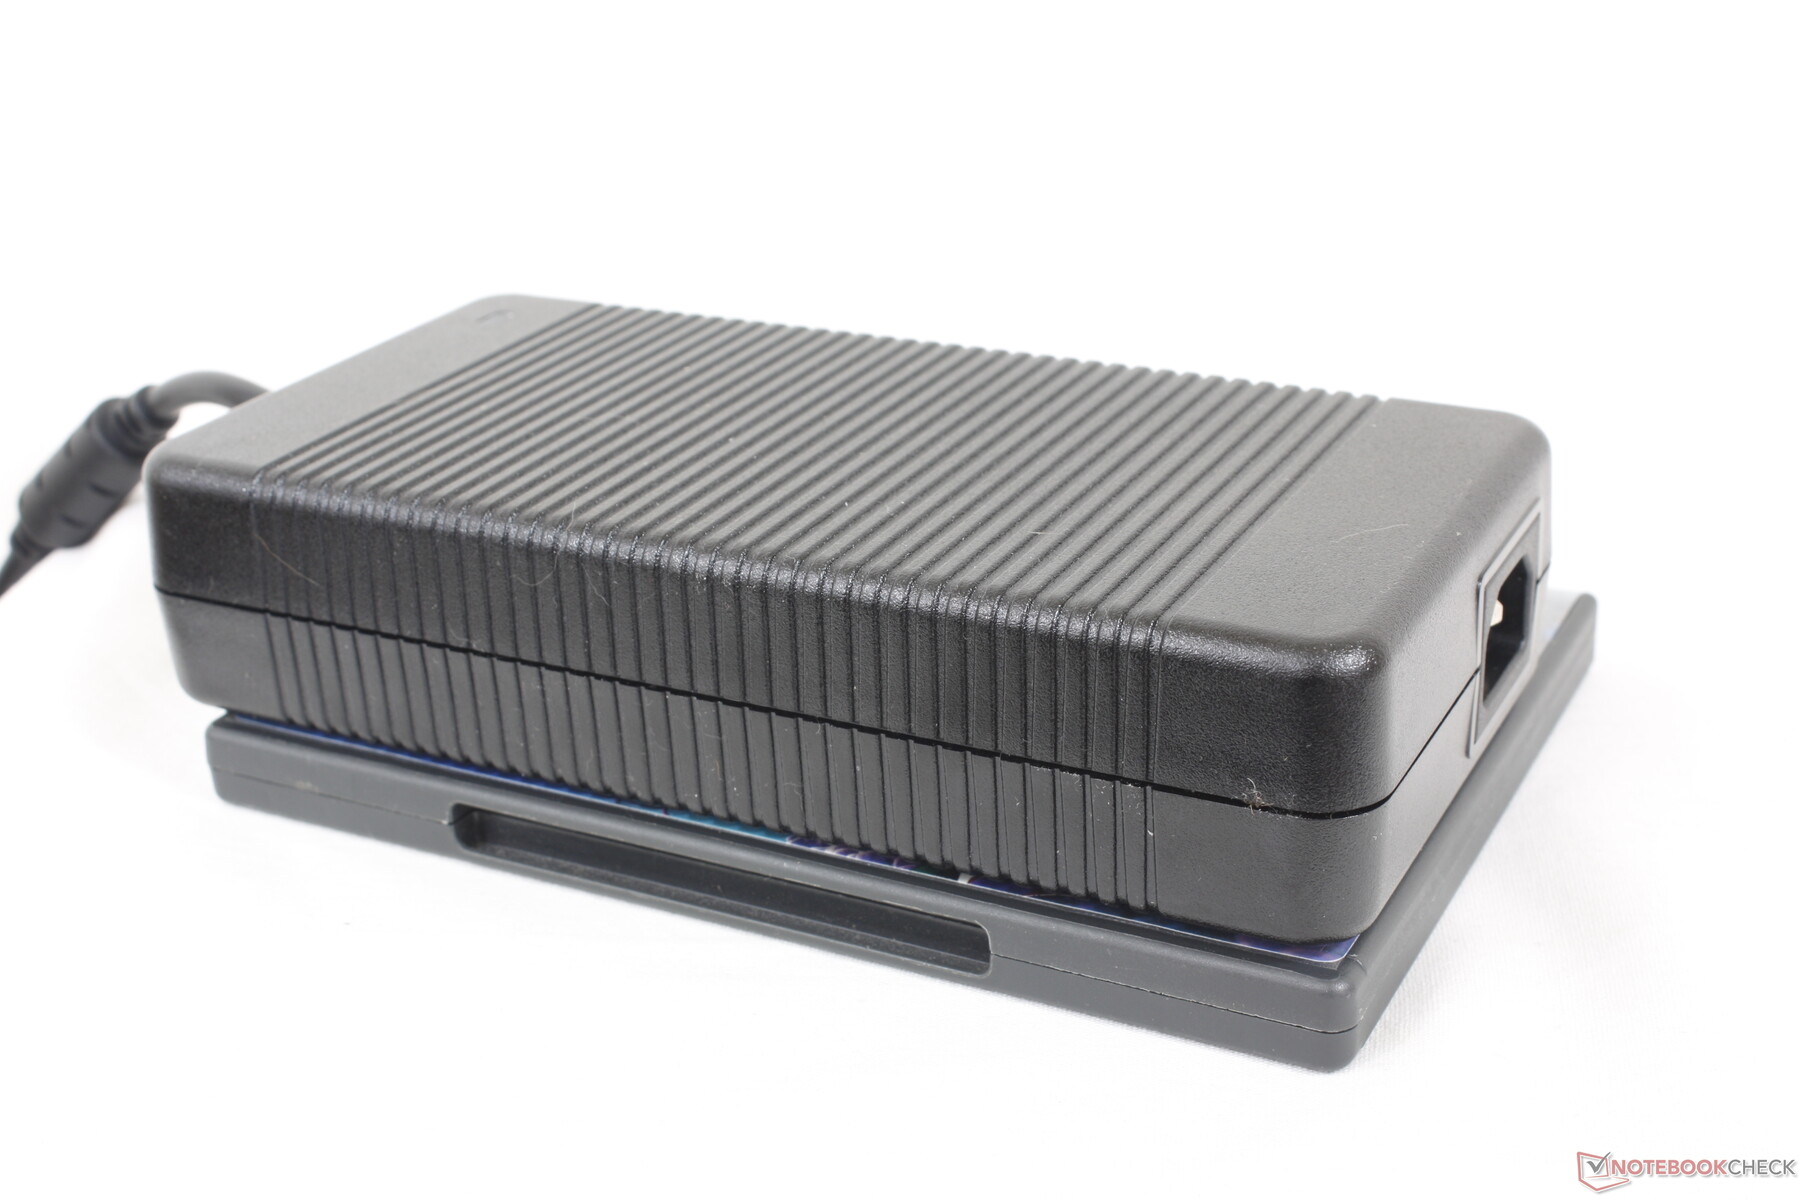
微星笔记本电脑今年的新产品是重新设计的交流适配器,它现在比以前更轻薄、功能更强大。过去的交流适配器相当大,尤其是 330 W 版本,会随强大的笔记本电脑(如 突击者 GE78.Titan 16 HX 采用 400 W AC 适配器(约 18.8 x 8.8 x 3.2 厘米),体积缩小了约 35%,单位体积功率更高。更大容量的适配器可在运行苛刻负载时实现更稳定的性能和充电率。相比之下,大多数其他高性能游戏笔记本电脑仍然只配备 330 W 或更小的交流适配器。
| Off / Standby | |
| Idle | |
| Load |
|
Key:
min: | |
| MSI Titan 18 HX A14VIG i9-14900HX, GeForce RTX 4090 Laptop GPU, 2x Samsung PM9A1a MZVL22T0HDLB (RAID 0), Mini-LED, 3840x2400, 18" | MSI Titan GT77 HX 13VI i9-13950HX, GeForce RTX 4090 Laptop GPU, Samsung PM9A1 MZVL22T0HBLB, Mini-LED, 3840x2160, 17.3" | Alienware m18 R1 i9-13980HX, GeForce RTX 4090 Laptop GPU, SK hynix PC801 HFS001TEJ9X101N, IPS, 1920x1200, 18" | Asus ROG Strix G18 G814JI i7-13650HX, GeForce RTX 4070 Laptop GPU, Micron 2400 MTFDKBA1T0QFM, IPS, 2560x1600, 18" | Acer Predator Helios 18 N23Q2 i9-13900HX, GeForce RTX 4080 Laptop GPU, Samsung PM9A1 MZVL22T0HBLB, IPS, 2560x1600, 18" | Razer Blade 18 RTX 4070 i9-13950HX, GeForce RTX 4070 Laptop GPU, SSSTC CA6-8D1024, IPS, 2560x1600, 18" | |
|---|---|---|---|---|---|---|
| Power Consumption | 16% | -9% | 41% | 19% | -5% | |
| Idle Minimum * (Watt) | 13.2 | 14 -6% | 21.6 -64% | 8 39% | 16 -21% | 24.5 -86% |
| Idle Average * (Watt) | 25.4 | 21.6 15% | 25.2 1% | 15 41% | 19 25% | 34.1 -34% |
| Idle Maximum * (Watt) | 53.5 | 24.8 54% | 56.7 -6% | 26 51% | 21.3 60% | 47.7 11% |
| Load Average * (Watt) | 151.4 | 122.5 19% | 164.1 -8% | 102 33% | 124 18% | 140 8% |
| Witcher 3 ultra * (Watt) | 336 | 265 21% | 311 7% | 178.6 47% | 289 14% | 202 40% |
| Load Maximum * (Watt) | 395.2 | 418 -6% | 338.9 14% | 267 32% | 319 19% | 261 34% |
* ... smaller is better
Power Consumption Witcher 3 / Stresstest
Power Consumption external Monitor
电池寿命
在 dGPU 未激活的情况下,当设置为平衡模式时,我们可以记录 4 个多小时的实际浏览时间。虽然时间不长,但对于配备 120 Hz 迷你 LED 显示屏的 18 英寸大屏幕来说,这也在意料之中。即使在微星电池保护模式下以最低亮度设置闲置,在最佳情况下也仅能使用不到 6 小时。Alienware m18 R1 或 Razer Blade 18 的结果与此类似。
使用随附的交流适配器从空闲状态充至满电需要约 2 至 2.5 小时。该系统还可以使用第三方 USB-C 适配器充电,不过充电速度要慢得多。请注意,两个 USB-C 端口中只有一个支持 USB-C Power Delivery。
| MSI Titan 18 HX A14VIG i9-14900HX, GeForce RTX 4090 Laptop GPU, 99.9 Wh | MSI Titan GT77 HX 13VI i9-13950HX, GeForce RTX 4090 Laptop GPU, 99.9 Wh | Alienware m18 R1 i9-13980HX, GeForce RTX 4090 Laptop GPU, 97 Wh | Asus ROG Strix G18 G814JI i7-13650HX, GeForce RTX 4070 Laptop GPU, 90 Wh | Acer Predator Helios 18 N23Q2 i9-13900HX, GeForce RTX 4080 Laptop GPU, 90 Wh | Razer Blade 18 RTX 4070 i9-13950HX, GeForce RTX 4070 Laptop GPU, 91.7 Wh | |
|---|---|---|---|---|---|---|
| Battery runtime | 22% | -15% | 64% | 24% | 7% | |
| Reader / Idle (h) | 5.9 | 5.6 -5% | 11.7 98% | 7 19% | ||
| WiFi v1.3 (h) | 4.2 | 5.3 26% | 4.3 2% | 8.1 93% | 4.4 5% | 4 -5% |
| Load (h) | 1.2 | 1.4 17% | 0.7 -42% | 1.2 0% | 1.7 42% | 1.3 8% |
| H.264 (h) | 6 | 4.8 |
Pros
Cons
结论:全新的外观设计,相同的内部性能
由于今年没有新的 Nvidia GPU 用于笔记本电脑,微星不得不刷新显卡周围的一切来弥补。用户将获得新的 18 英寸机箱设计、新的第 14 代英特尔 HX CPU、新的交流适配器、更大的按键和新的 120 Hz HDR1000 迷你 LED 4K 显示屏,以配合高昂的价格。与去年的 GT77的升级,但用户最终还是能从这两款机型中获得相同的游戏性能。
Titan 18 的亮点包括迷你 LED 显示屏和酷睿 i9-14900HX CPU。前者无疑令人印象深刻,也是在任何笔记本电脑上观看 HDR 内容的最佳方式之一,但不支持 G-Sync 却令人难以忽视,尤其是在旗舰游戏机型上。与此同时,新 CPU 的性能与 GT77 上的第 13 代酷睿 i9-13950HX 几乎完全相同,这让人觉得它不过是改头换面而已。因此,与 GT77 相比,Titan 18 可以说是一个巨大的飞跃,因为所有的外部变化,但相比之下,英特尔和 Nvidia 的内部结构却让人感觉停滞不前。
微星 Titan 18 HX 是本年度速度最快的游戏笔记本之一,其 4K mini LED 显示屏同样令人印象深刻。不过,它的性能与去年的 GT77 几乎相同。
如果你对超大、超亮的 18 英寸迷你 LED 显示屏情有独钟,那么在撰写本文时,Titan 18 HX 是你能找到的唯一产品之一。如果没有,则可选择 Alienware m18 R1, 华硕 ROG Strix G18或 Razer Blade 18所有这些产品都提供 G-Sync、更快的刷新率和相同的GeForce RTX 4090 选项,机身设计更薄,有时还更轻。
MSI Titan 18 HX A14VIG
- 01/30/2024 v7 (old)
Allen Ngo
Transparency
The selection of devices to be reviewed is made by our editorial team. The test sample was provided to the author as a loan by the manufacturer or retailer for the purpose of this review. The lender had no influence on this review, nor did the manufacturer receive a copy of this review before publication. There was no obligation to publish this review. As an independent media company, Notebookcheck is not subjected to the authority of manufacturers, retailers or publishers.
This is how Notebookcheck is testing
Every year, Notebookcheck independently reviews hundreds of laptops and smartphones using standardized procedures to ensure that all results are comparable. We have continuously developed our test methods for around 20 years and set industry standards in the process. In our test labs, high-quality measuring equipment is utilized by experienced technicians and editors. These tests involve a multi-stage validation process. Our complex rating system is based on hundreds of well-founded measurements and benchmarks, which maintains objectivity. Further information on our test methods can be found here.
Price comparison

