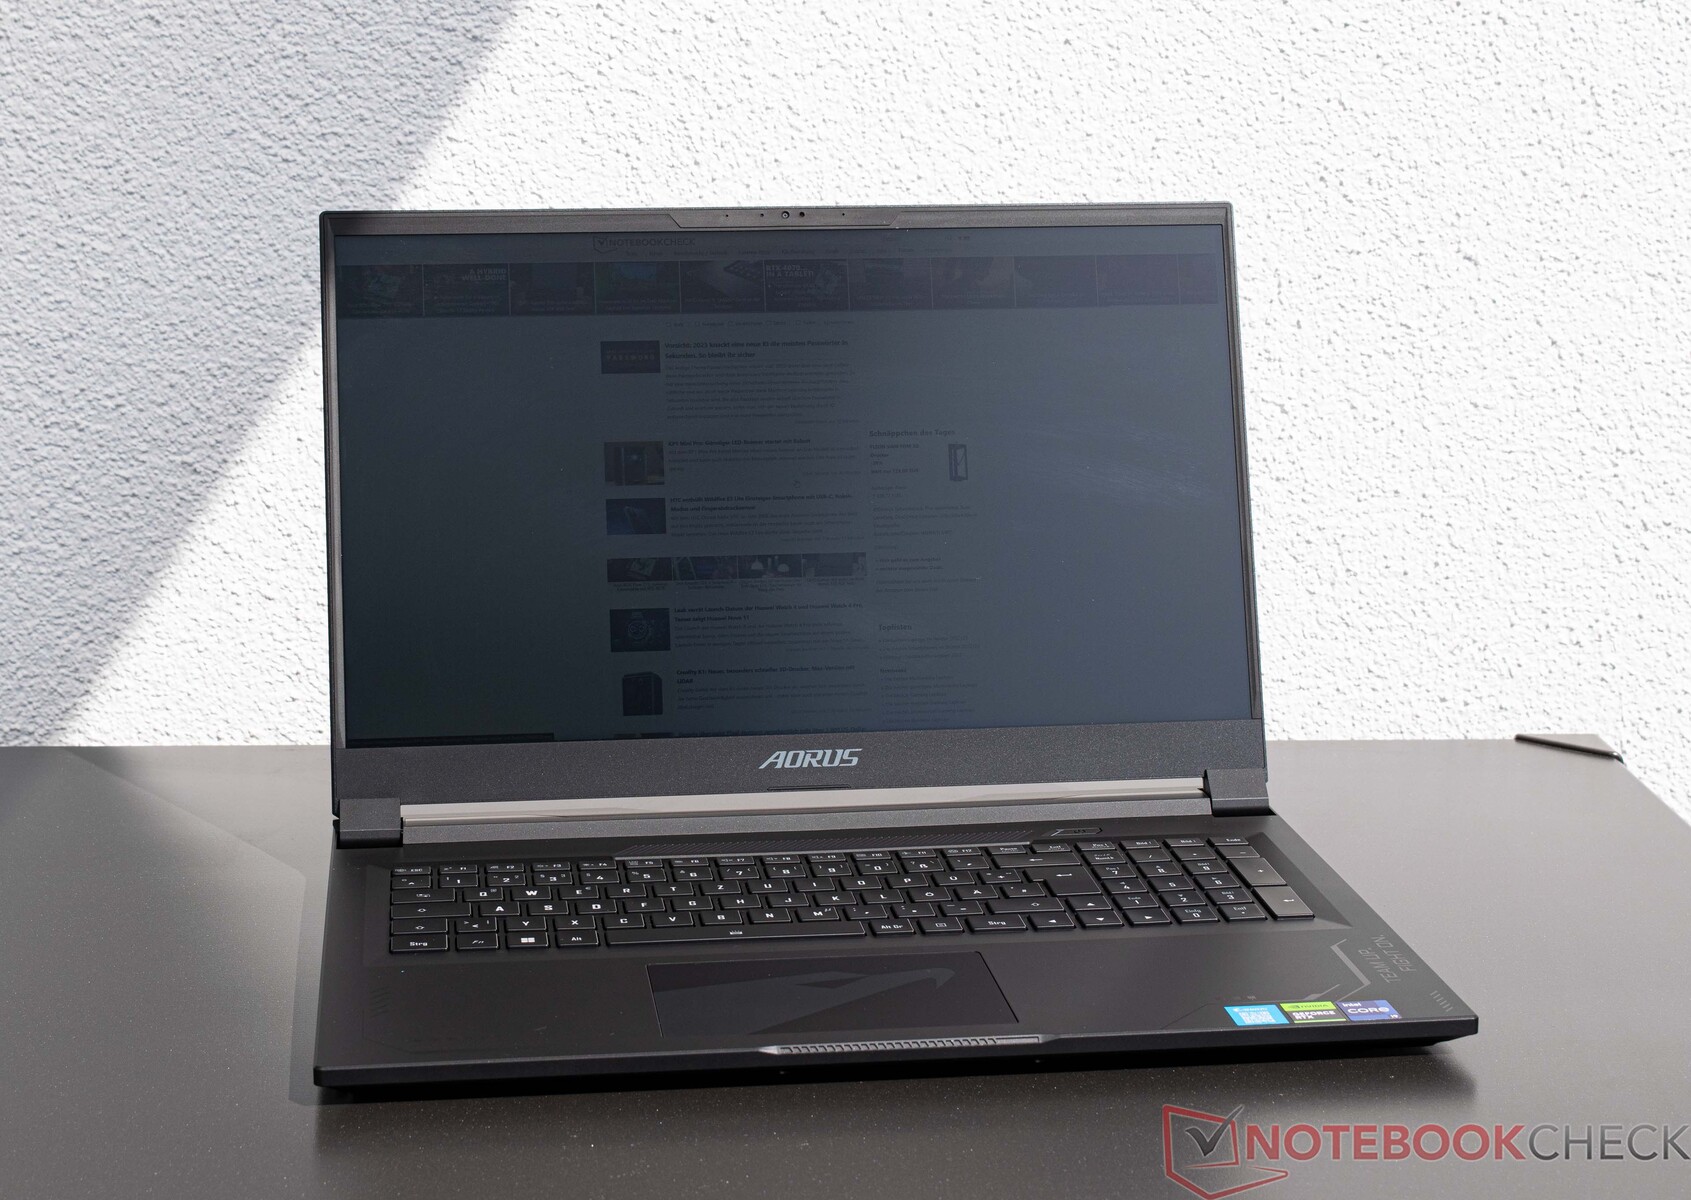
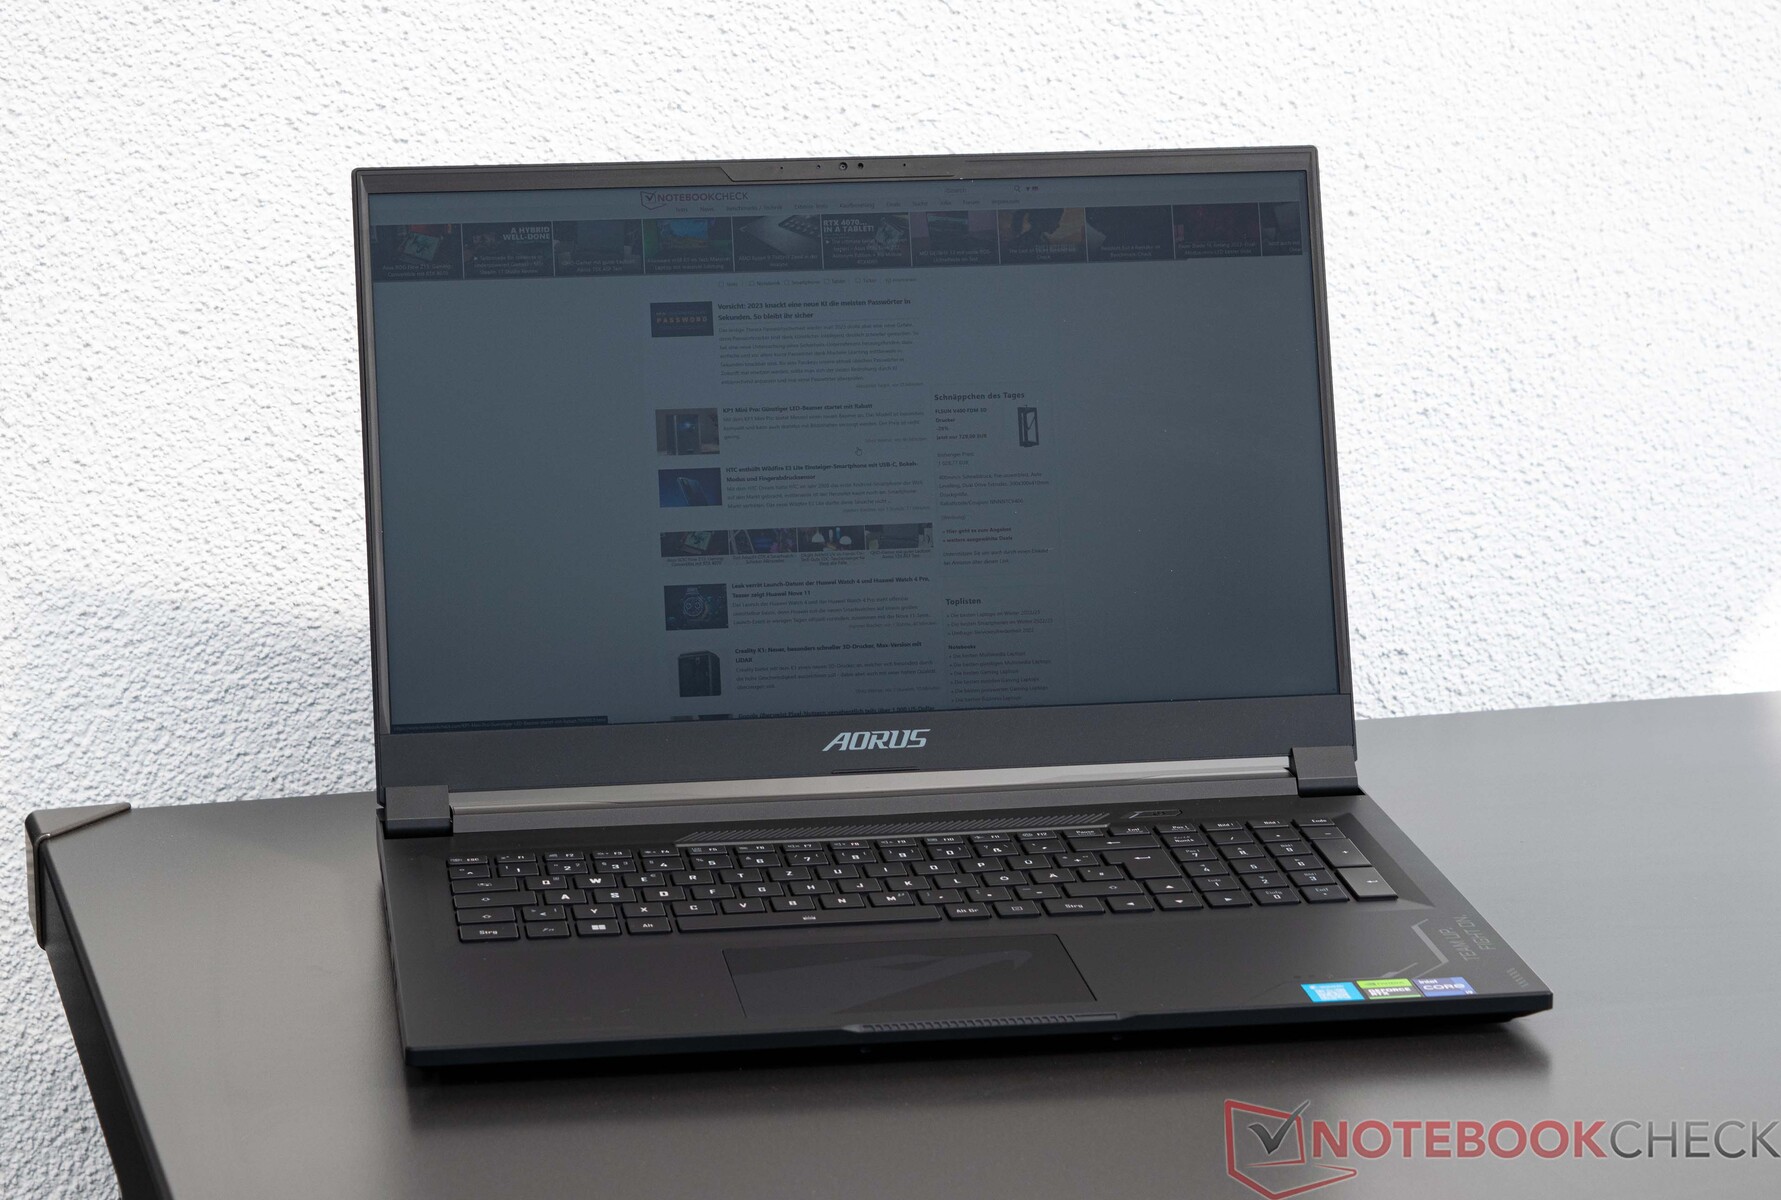
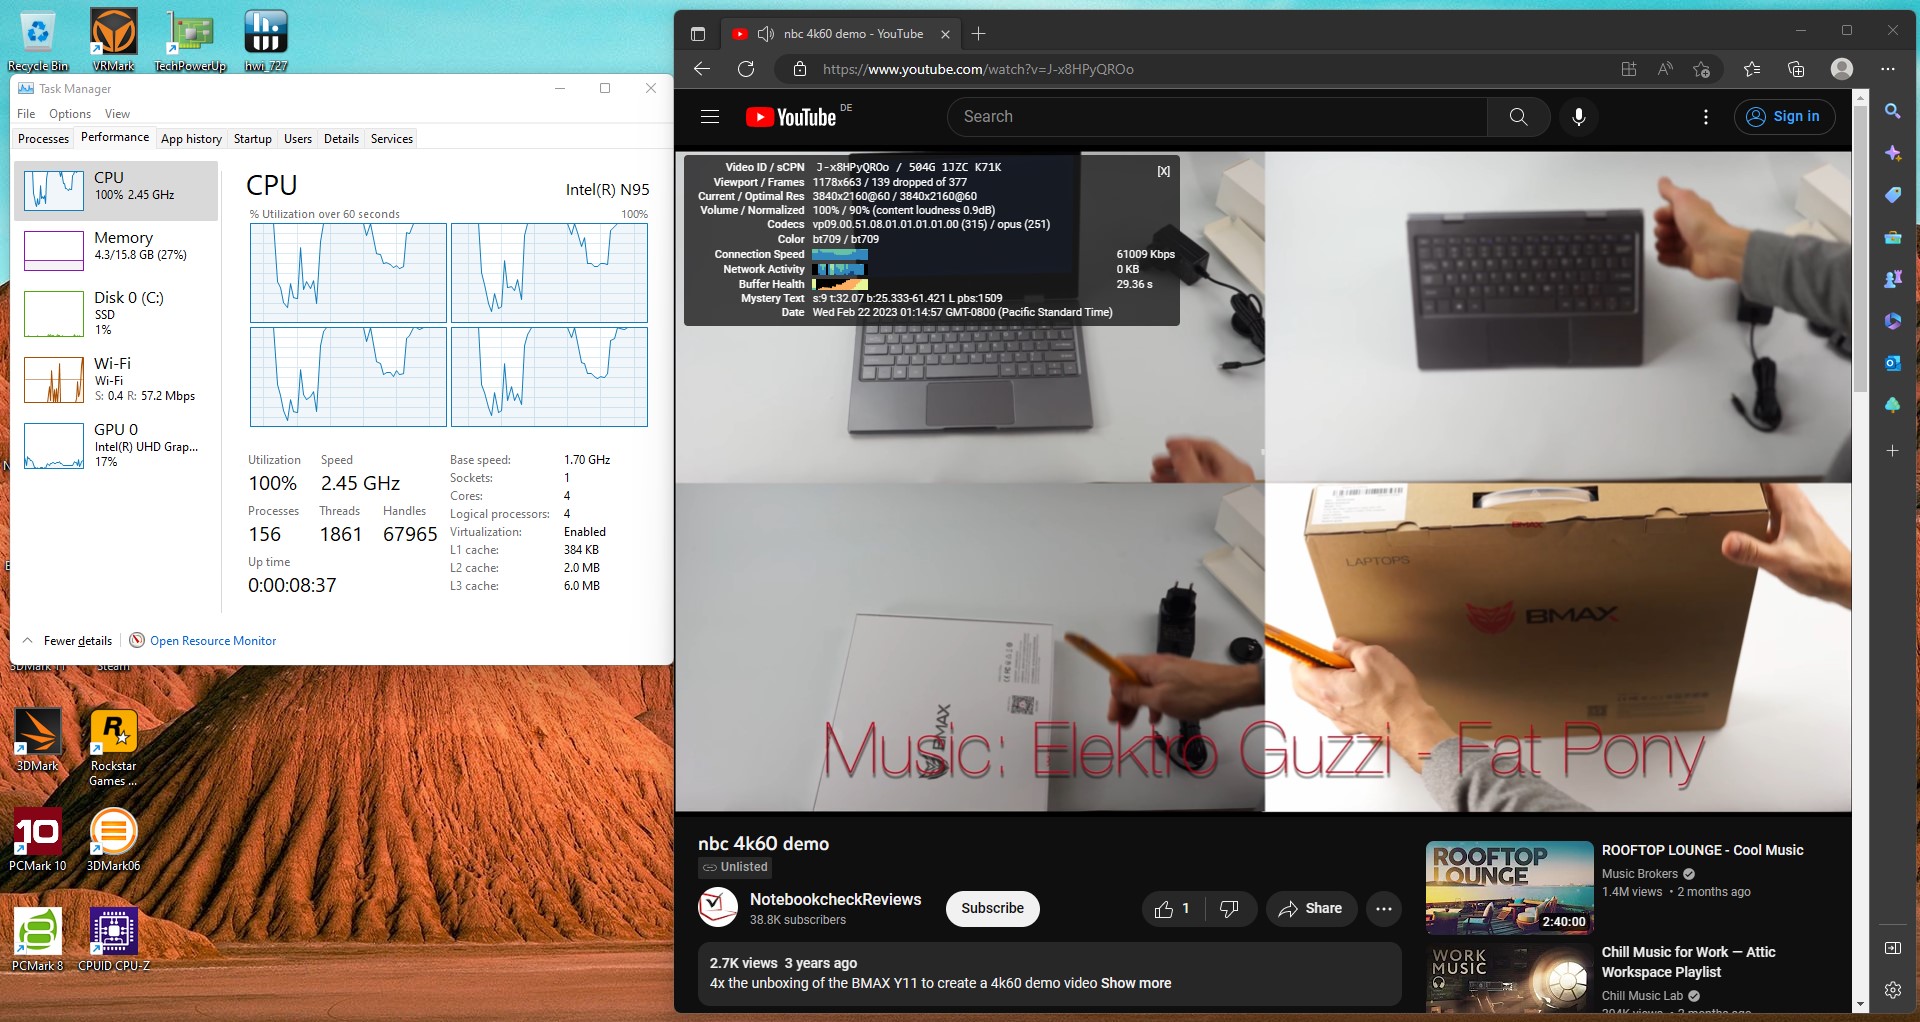
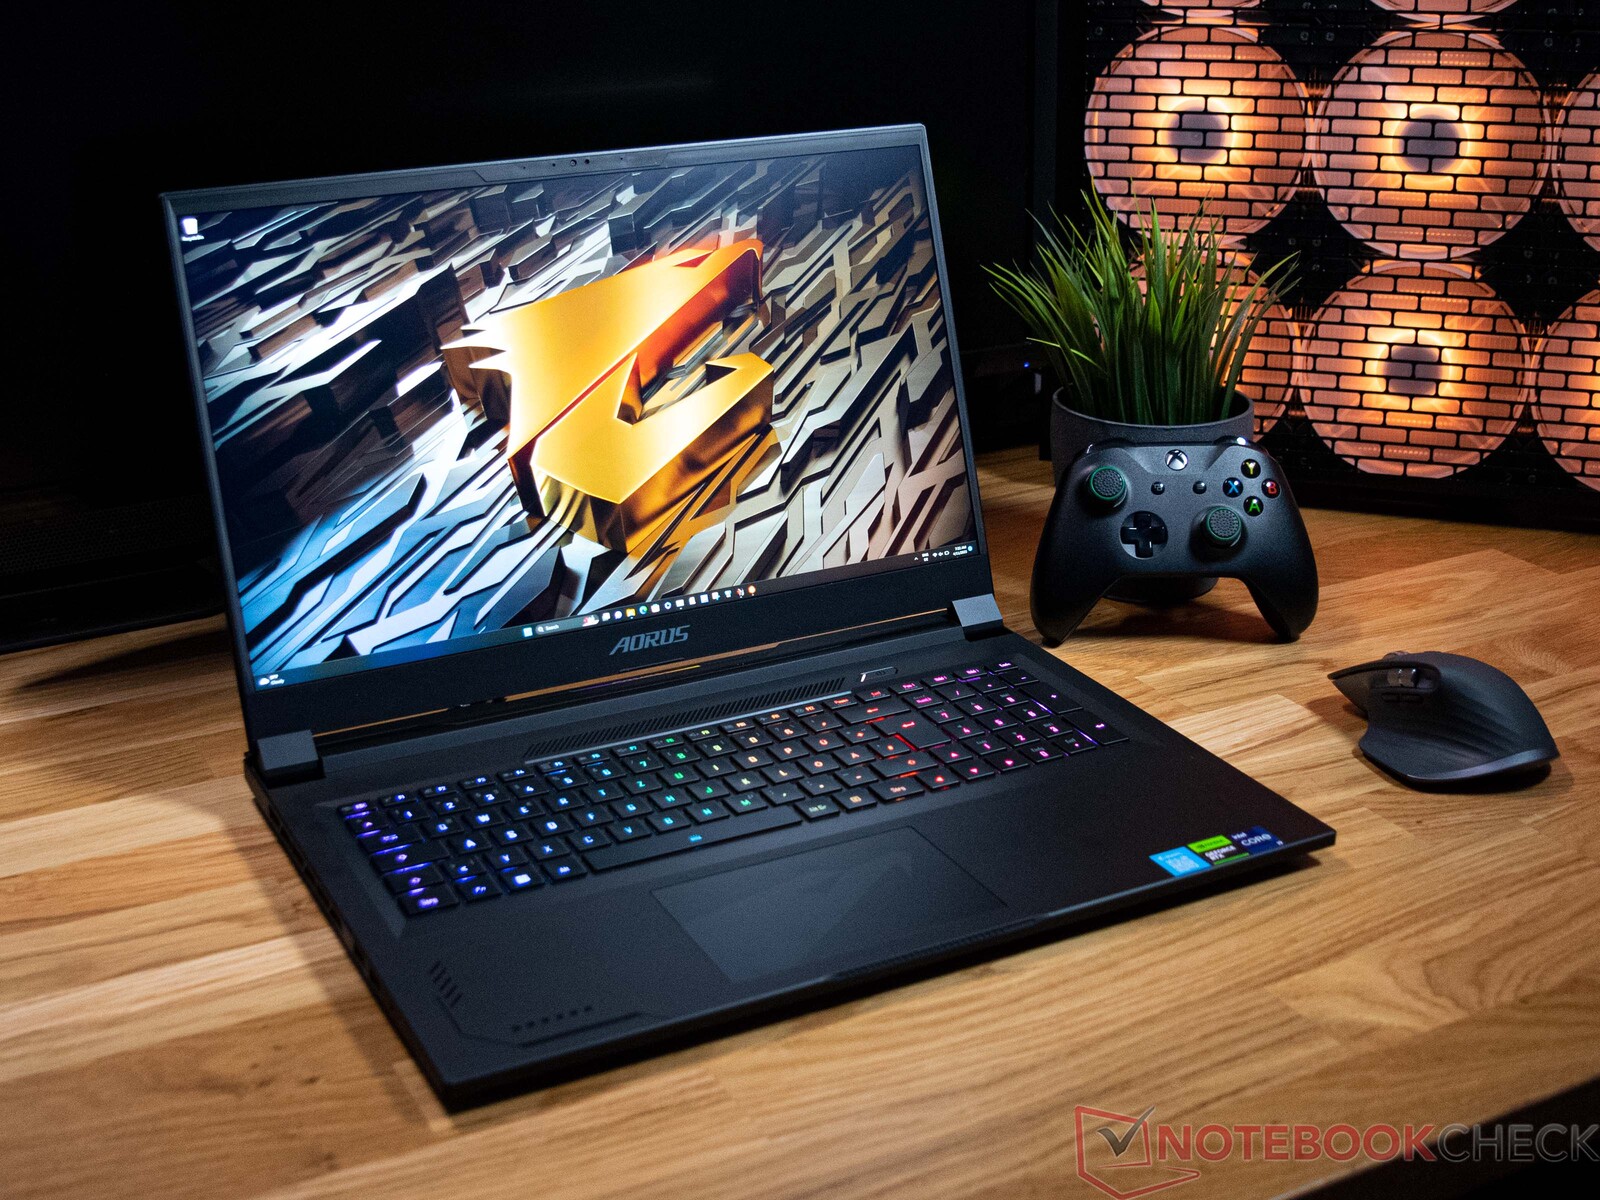
Aorus 17X AZF回顾:带有i9-13900HX和RTX 4090的高端游戏笔记本电脑在一个薄薄的盒子里
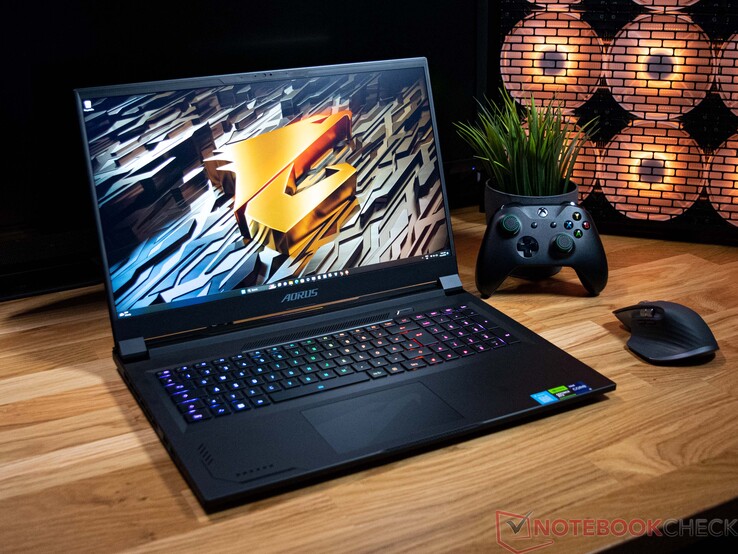
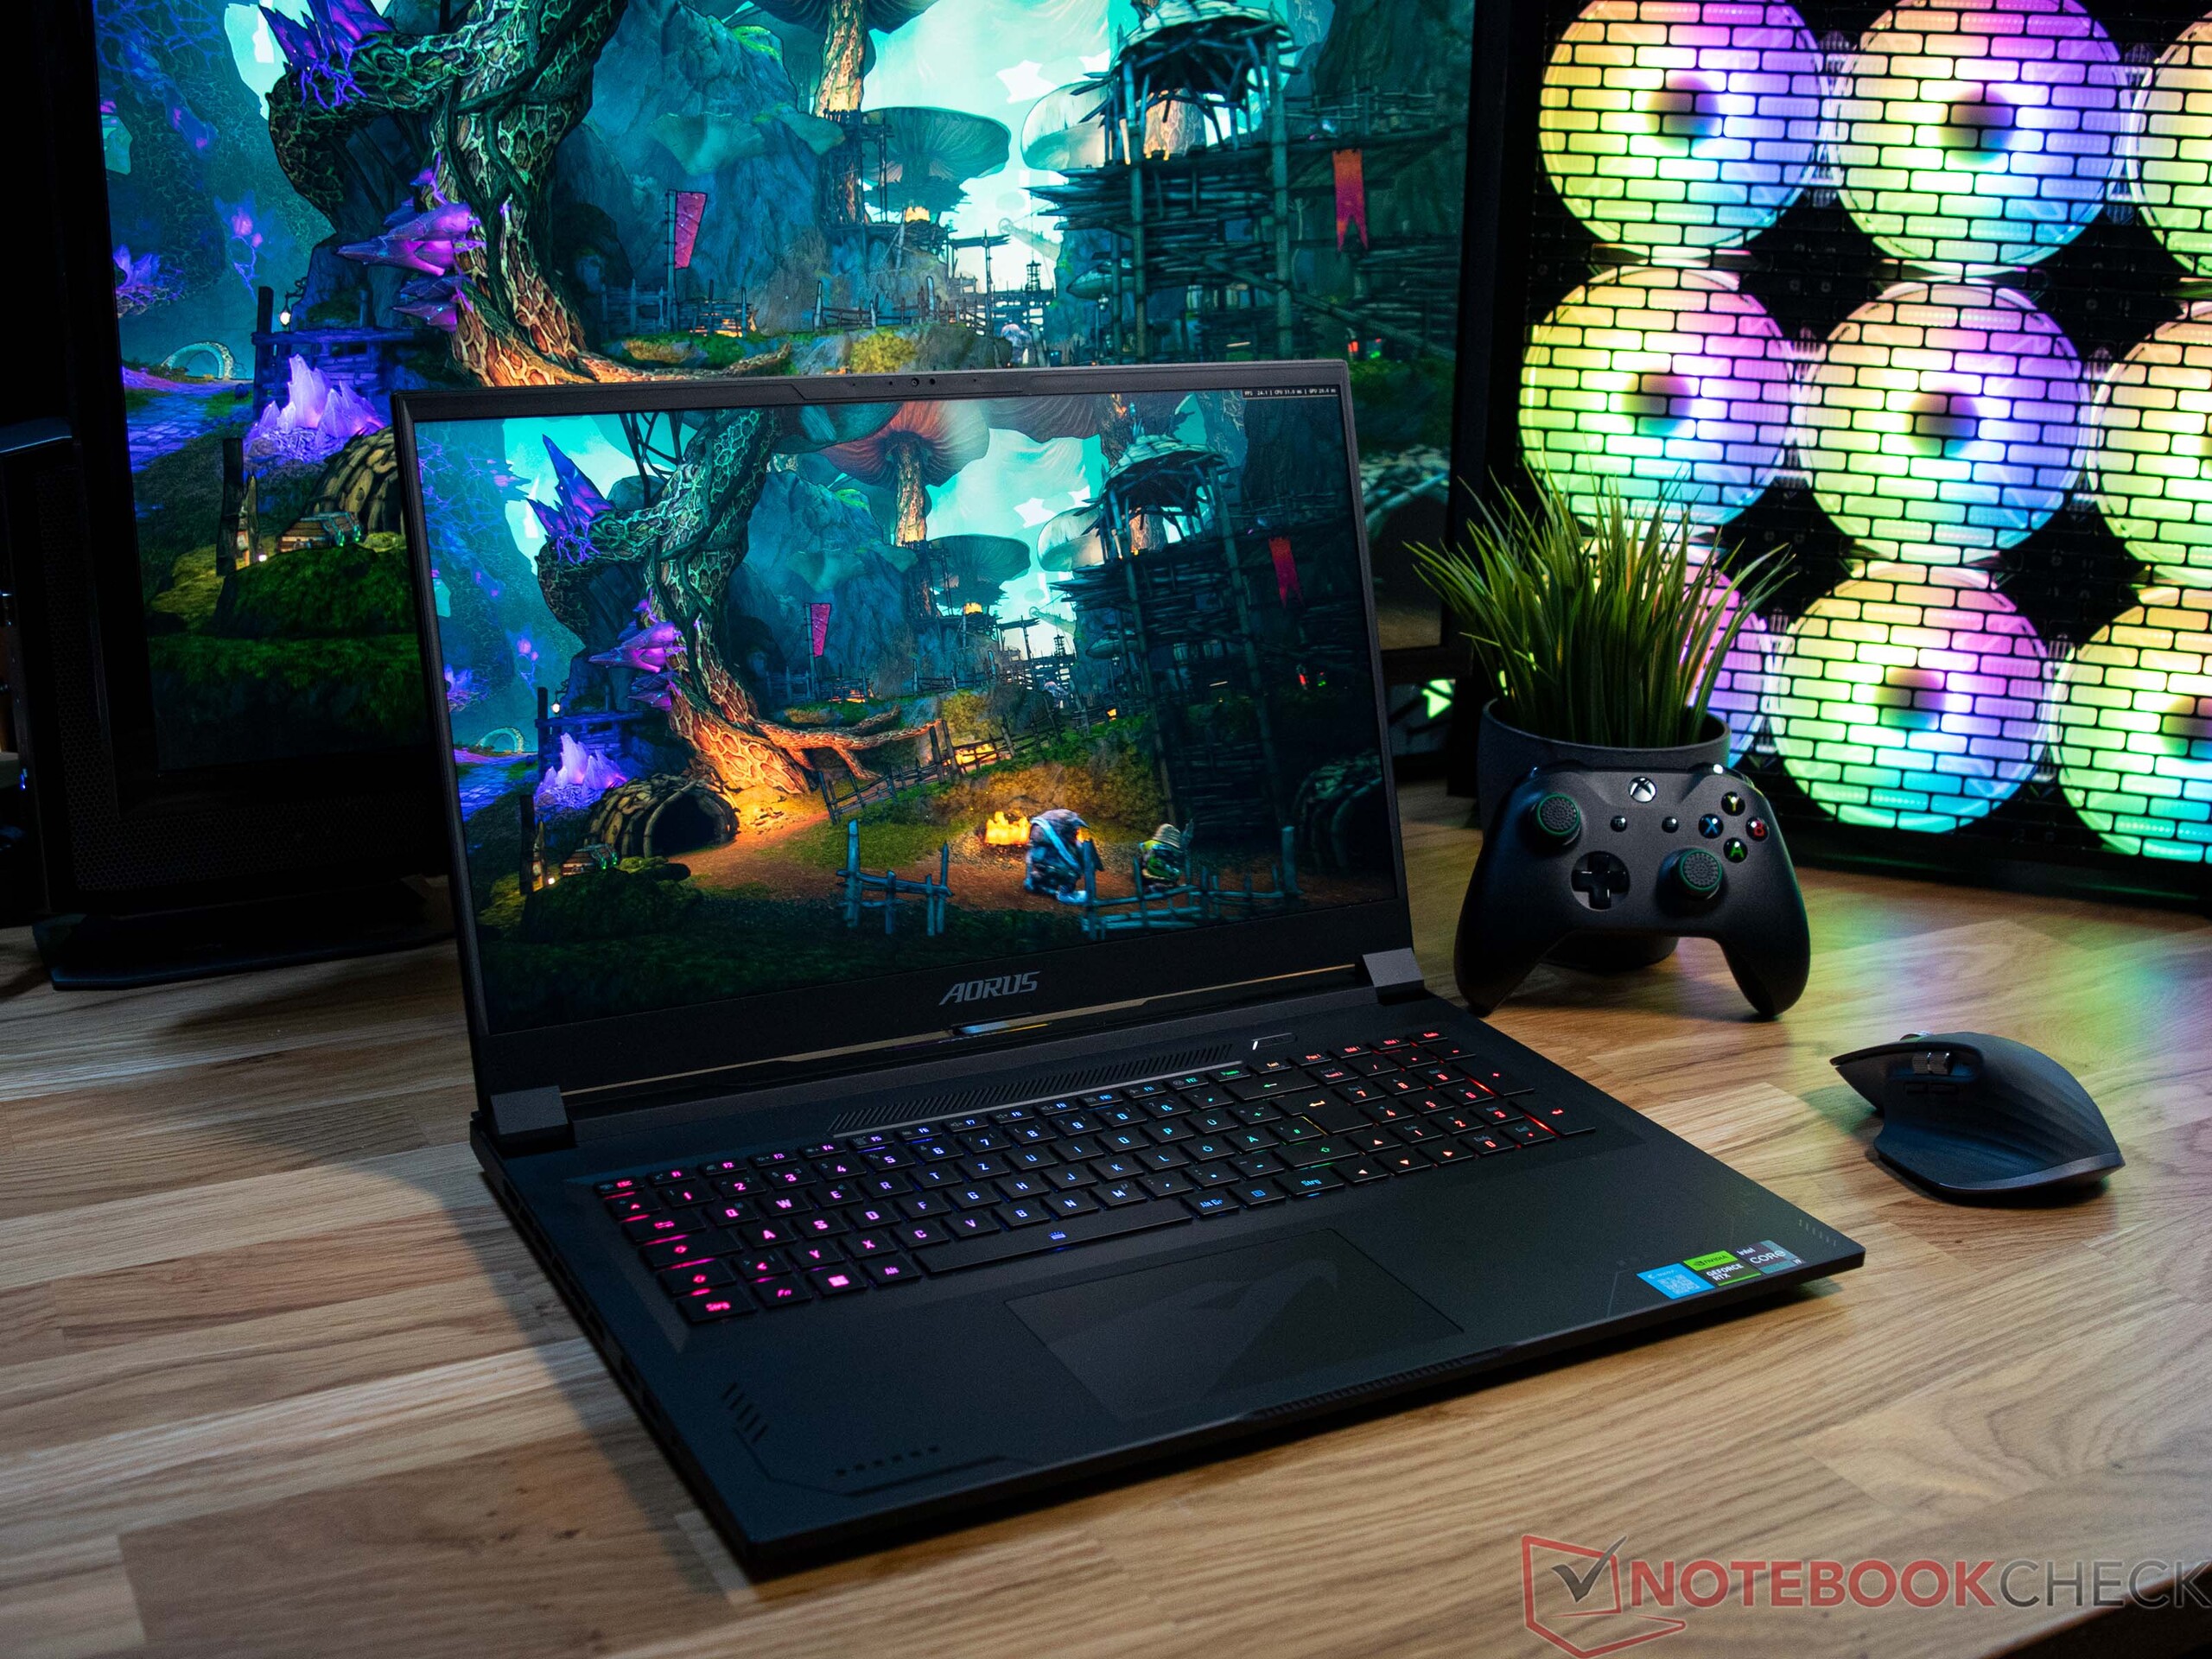
新的Aorus 17X AZF建立在英特尔猛禽湖H处理器和Nvidia的最新移动GPU旗舰上。一个 英特尔酷睿i9 13900HX与一个 NvidiaGeForce RTX 4090笔记本GPU在引擎盖下。仅仅是这两个组件就可以看出这台笔记本电脑的预期用途。但是,硬件在超薄的情况下表现如何?我们看了一下,以后会有更多细节。但是,仅有CPU和GPU并不能成为一台好的游戏笔记本电脑--在Aorus 17X AZF中,这些都伴随着240赫兹的17英寸屏幕,以及总共2TB的SSD存储,可以轻松存储大量的游戏和其他程序。这样一个配置的价格为3,499.00美元。
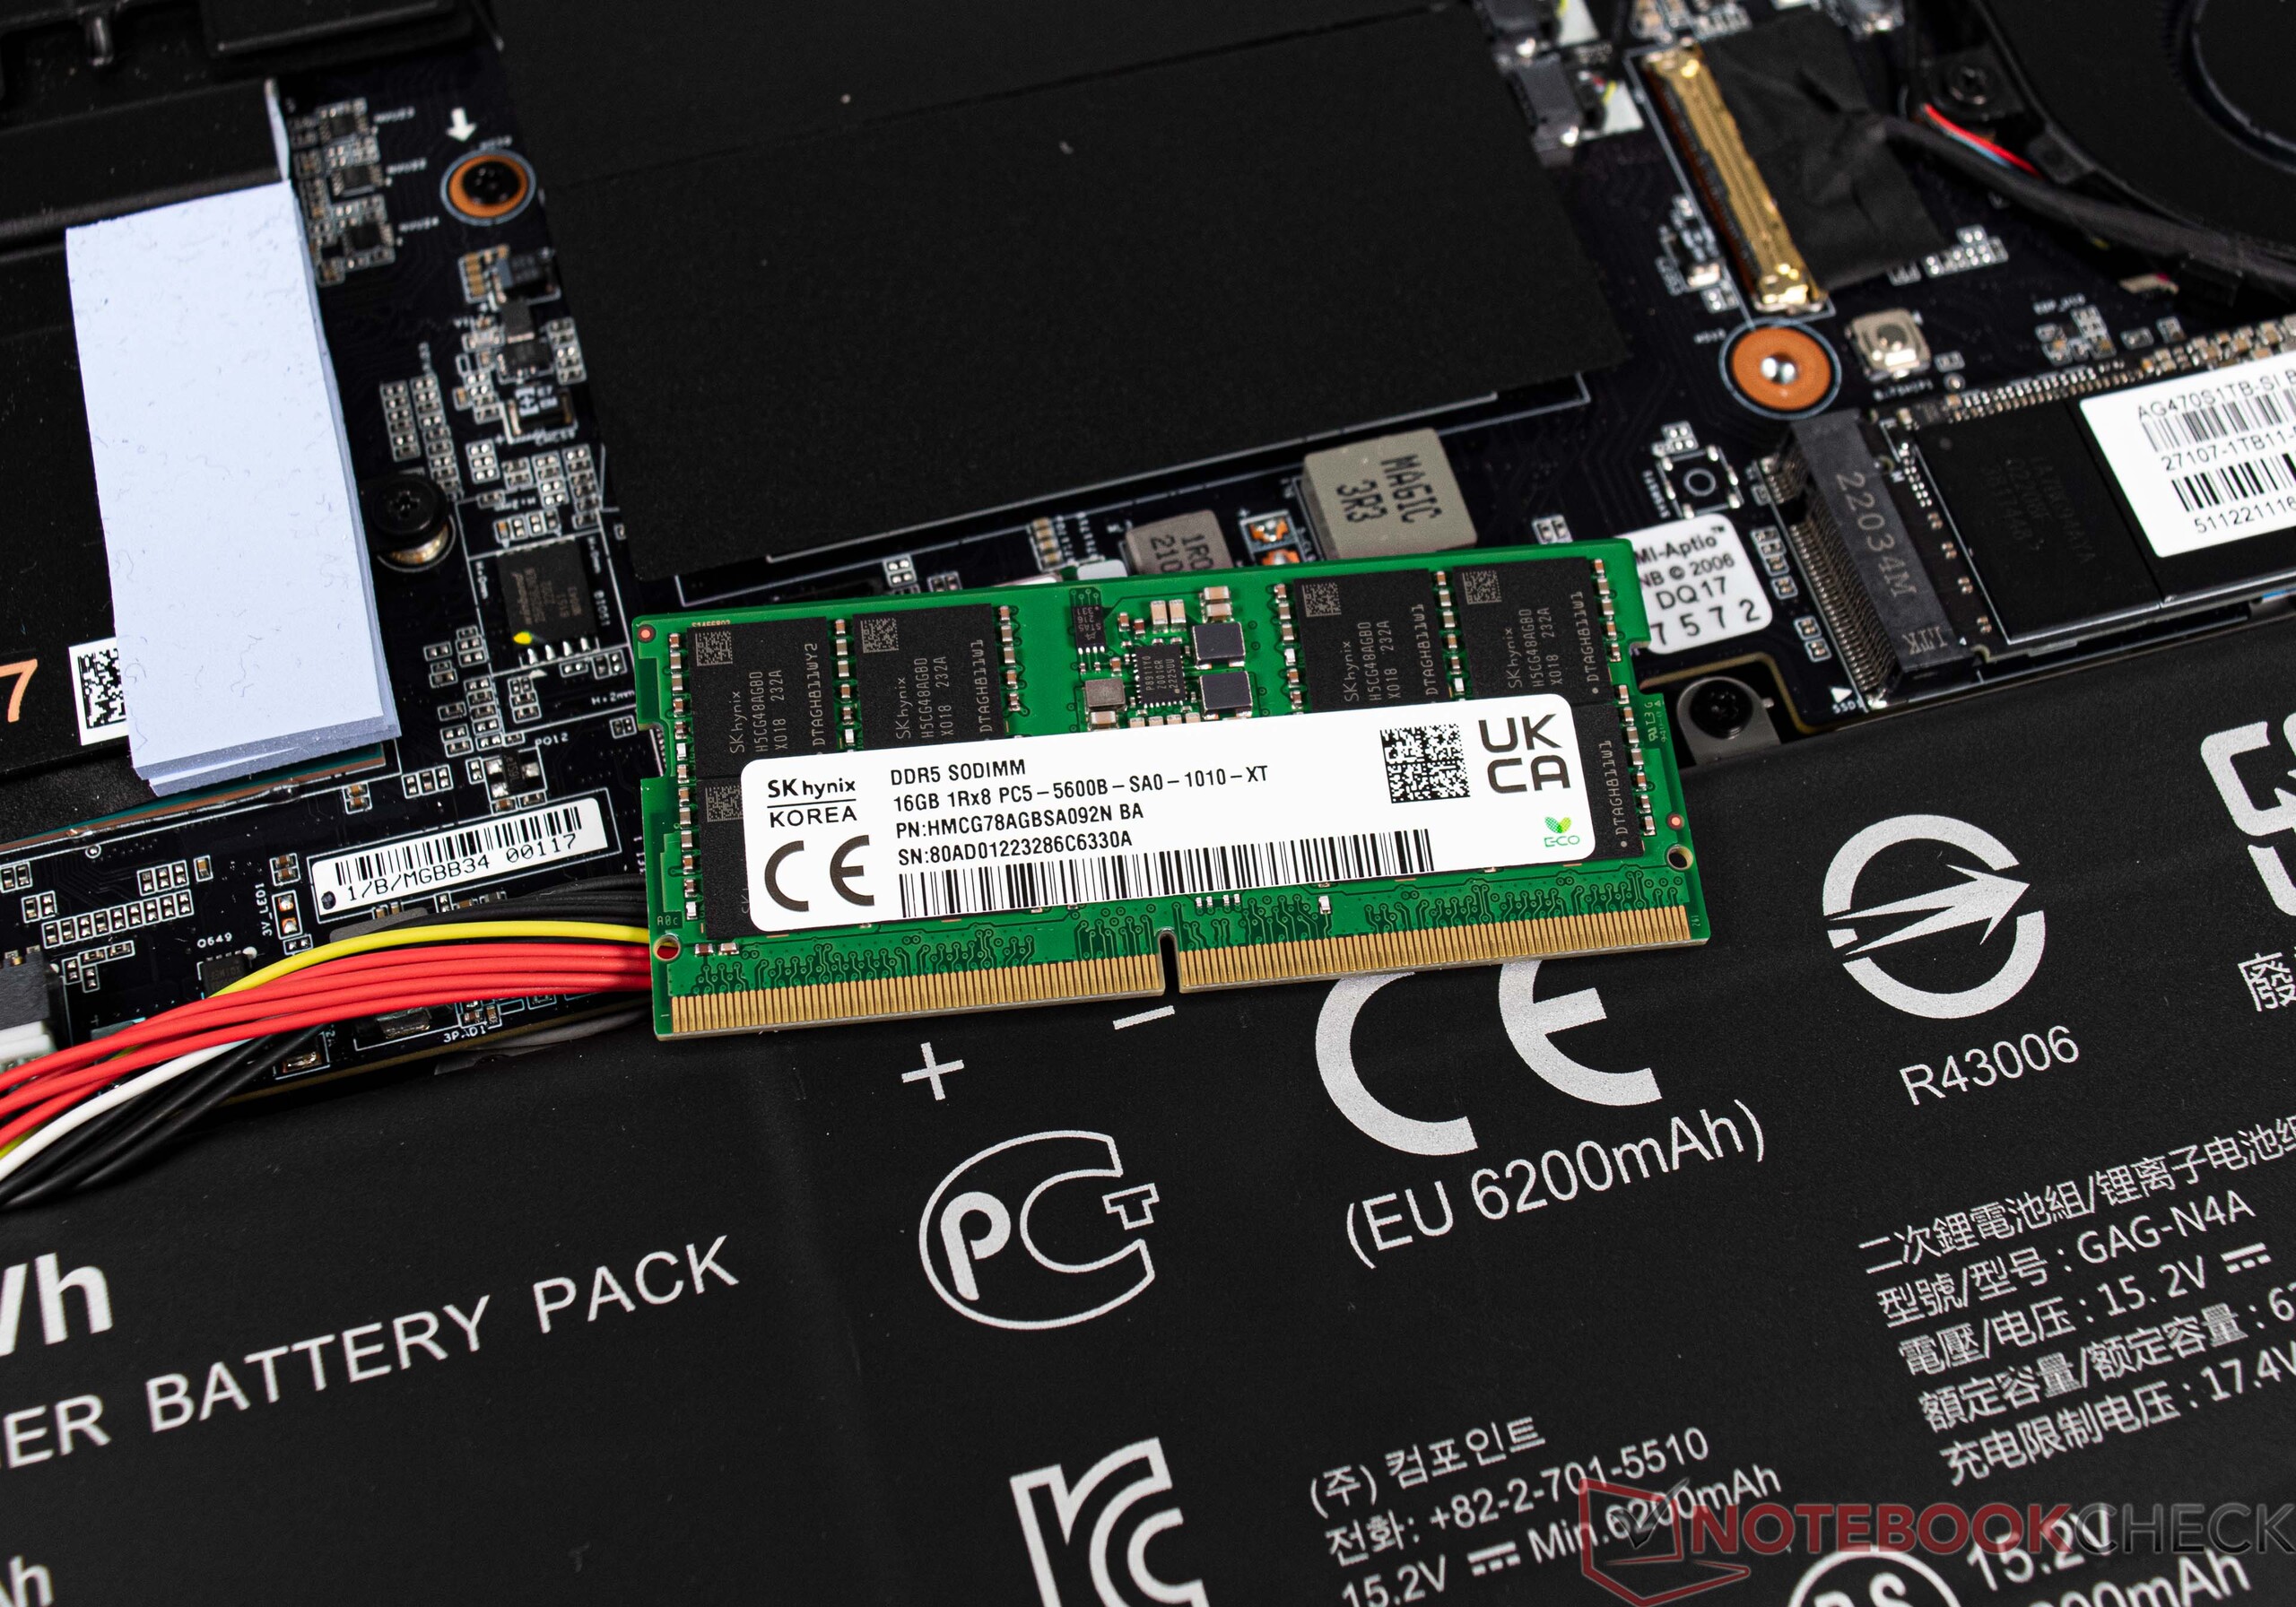
另外,Aorus 17X还可以选择配备英特尔酷睿i7 13700HX。虽然在显卡方面没有其他选择,但DDR5内存的速度可以有所不同。酷睿i7在技术上被限制在最高4800MT/s,而酷睿i9型号则有最高5600MT/s供其使用。
当你看技术规格时,这个级别的竞争笔记本电脑也提供类似的性能水平,因为它们也配备了英特尔猛禽湖H处理器和移动Ada-Lovelace GPU。对比设备的详细概述可在下表中找到。
潜在的竞争对手比较
Rating | Date | Model | Weight | Height | Size | Resolution | Price |
|---|---|---|---|---|---|---|---|
| 86 % v7 (old) | 04 / 2023 | Aorus 17X AZF i9-13900HX, GeForce RTX 4090 Laptop GPU | 2.9 kg | 21.8 mm | 17.30" | 2560x1440 | |
| 88.4 % v7 (old) | 03 / 2023 | Medion Erazer Beast X40 i9-13900HX, GeForce RTX 4090 Laptop GPU | 2.9 kg | 33 mm | 17.00" | 2560x1600 | |
| 88.3 % v7 (old) | 03 / 2023 | MSI GE78HX 13VH-070US i9-13950HX, GeForce RTX 4080 Laptop GPU | 3 kg | 23 mm | 17.00" | 2560x1600 | |
| 85.4 % v7 (old) | 03 / 2023 | HP Omen 17-ck2097ng i9-13900HX, GeForce RTX 4080 Laptop GPU | 2.8 kg | 27 mm | 17.30" | 2560x1440 | |
| 90.7 % v7 (old) | 04 / 2023 | Alienware m18 R1 i9-13980HX, GeForce RTX 4090 Laptop GPU | 3.9 kg | 26.7 mm | 18.00" | 1920x1200 | |
| 89 % v7 (old) | 02 / 2023 | MSI Titan GT77 HX 13VI i9-13950HX, GeForce RTX 4090 Laptop GPU | 3.5 kg | 23 mm | 17.30" | 3840x2160 |
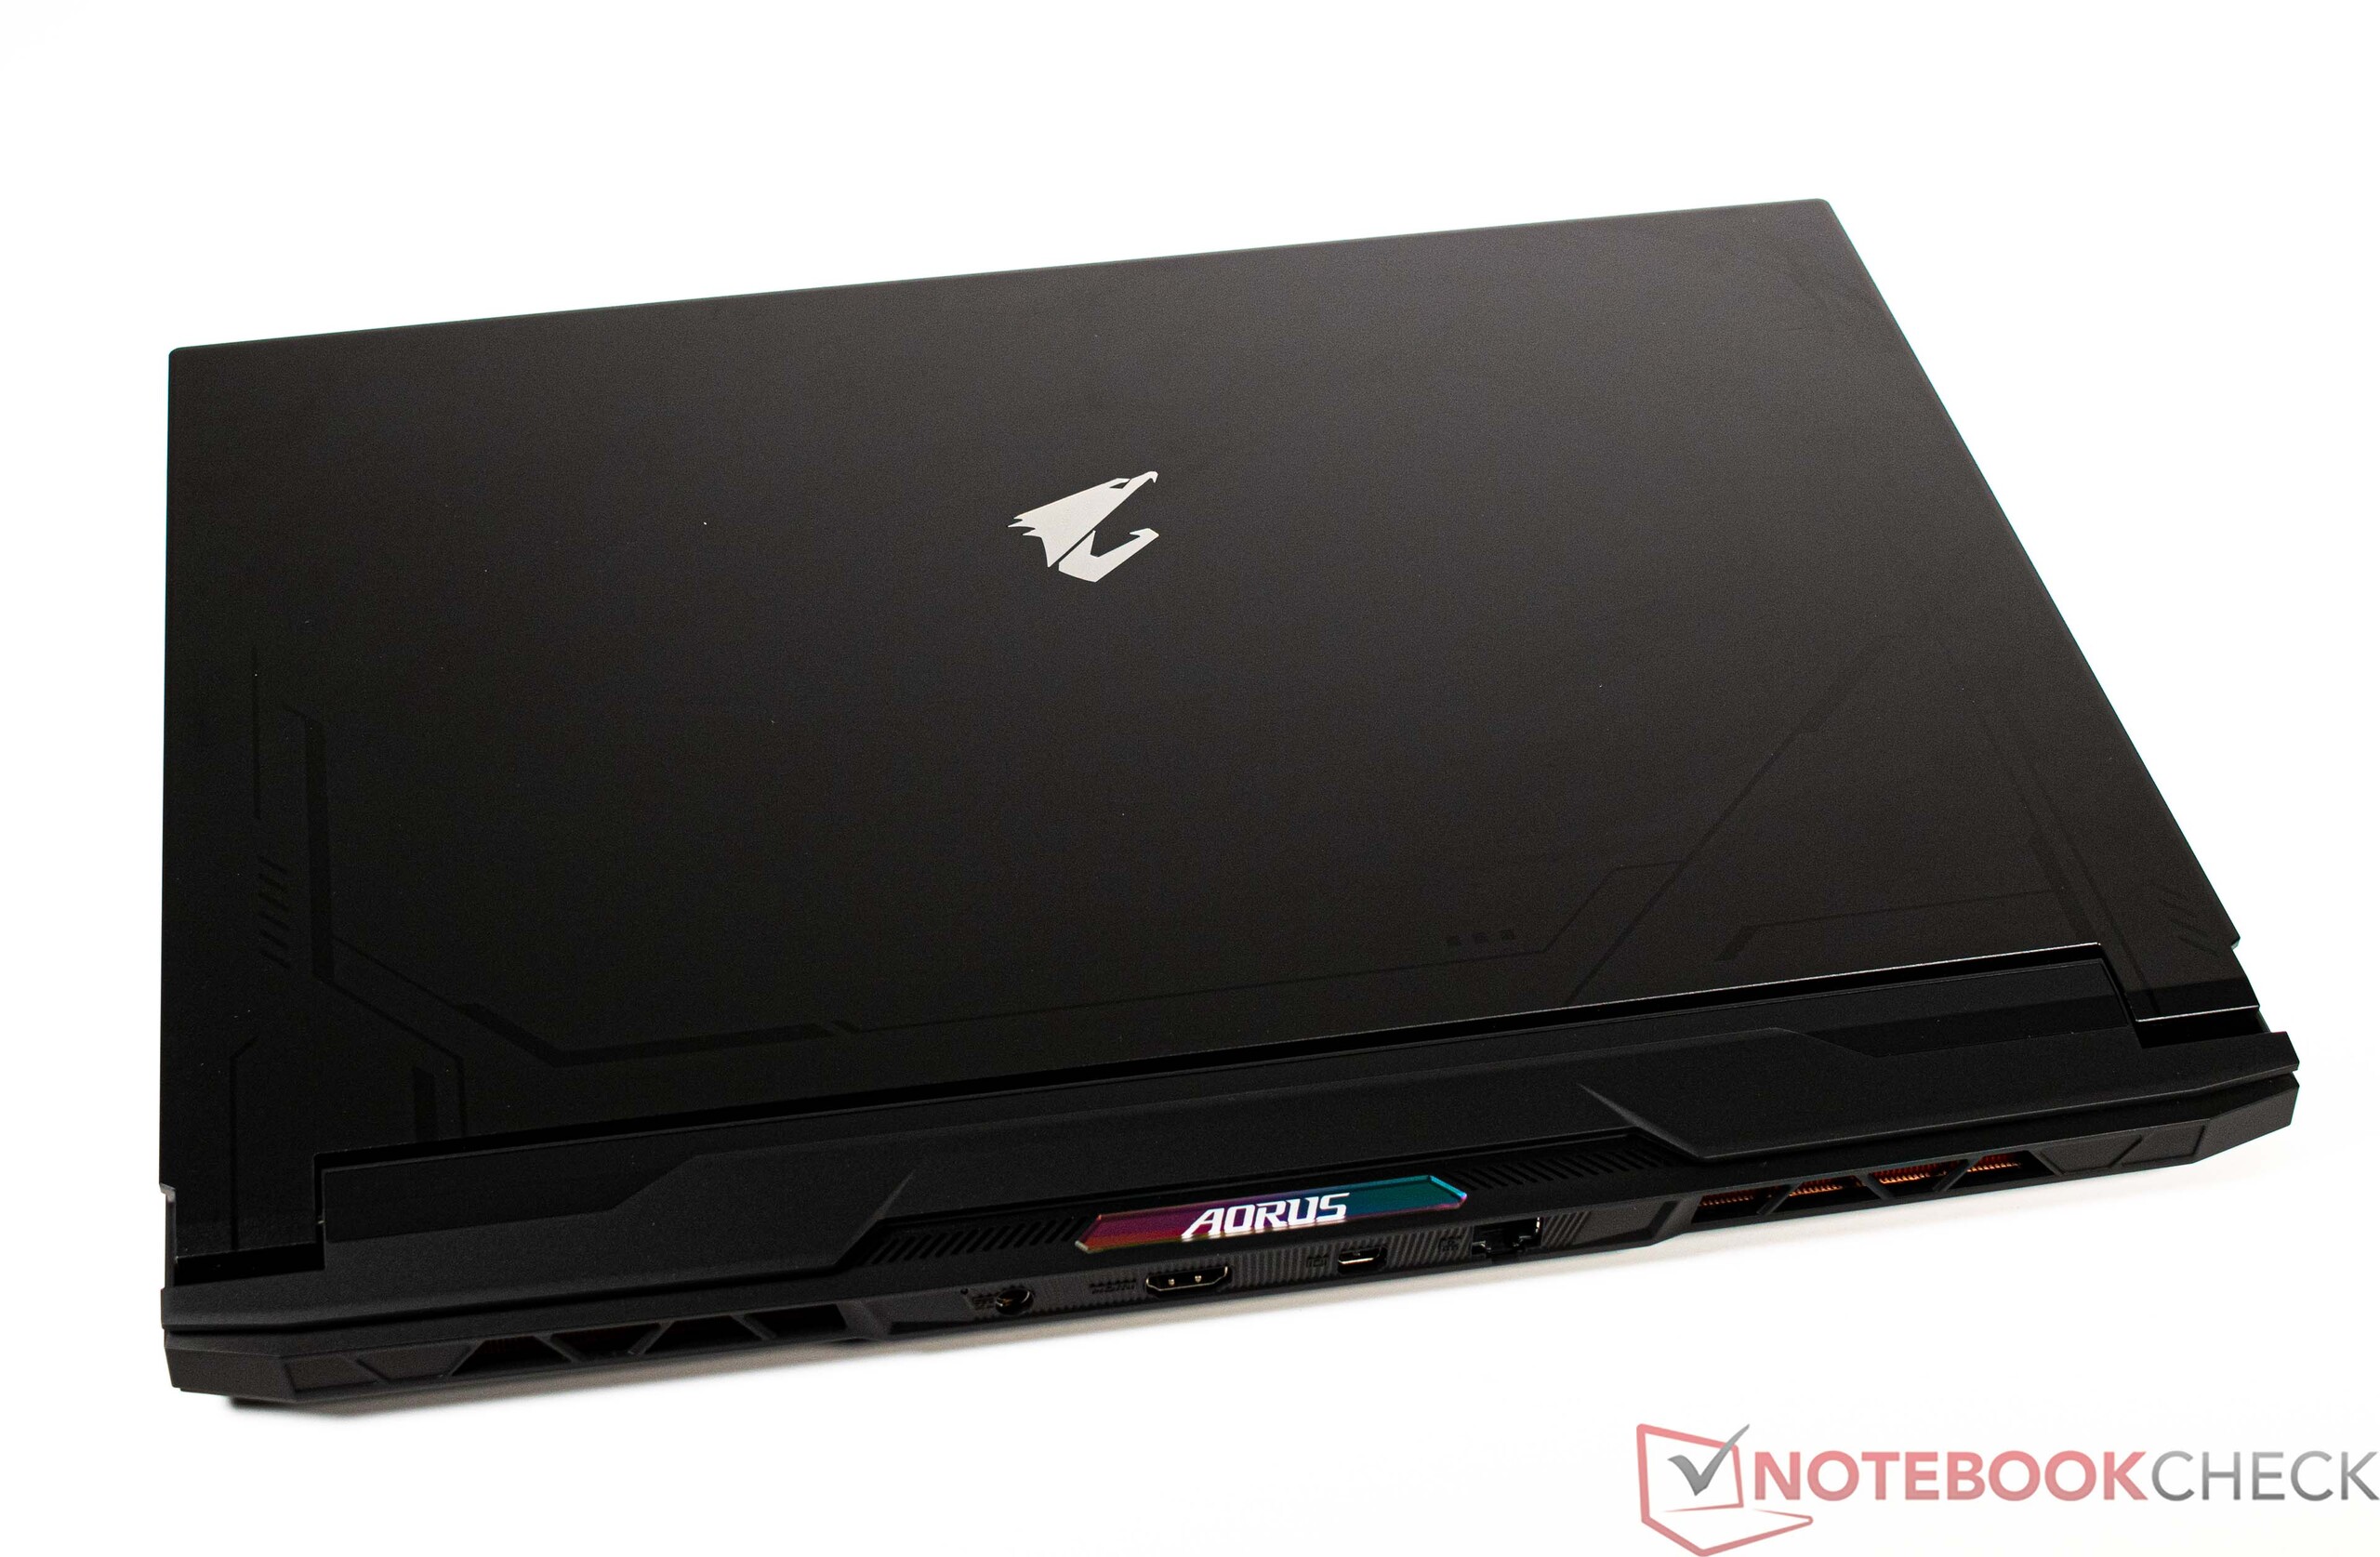
外壳 - Aorus 17X上的铝和塑料
Aorus 17X主要由铝和塑料制成。这有低重量的优势,因为不到3公斤,该设备是这里比较轻的代表之一。只有惠普Omen 17稍微轻一些。
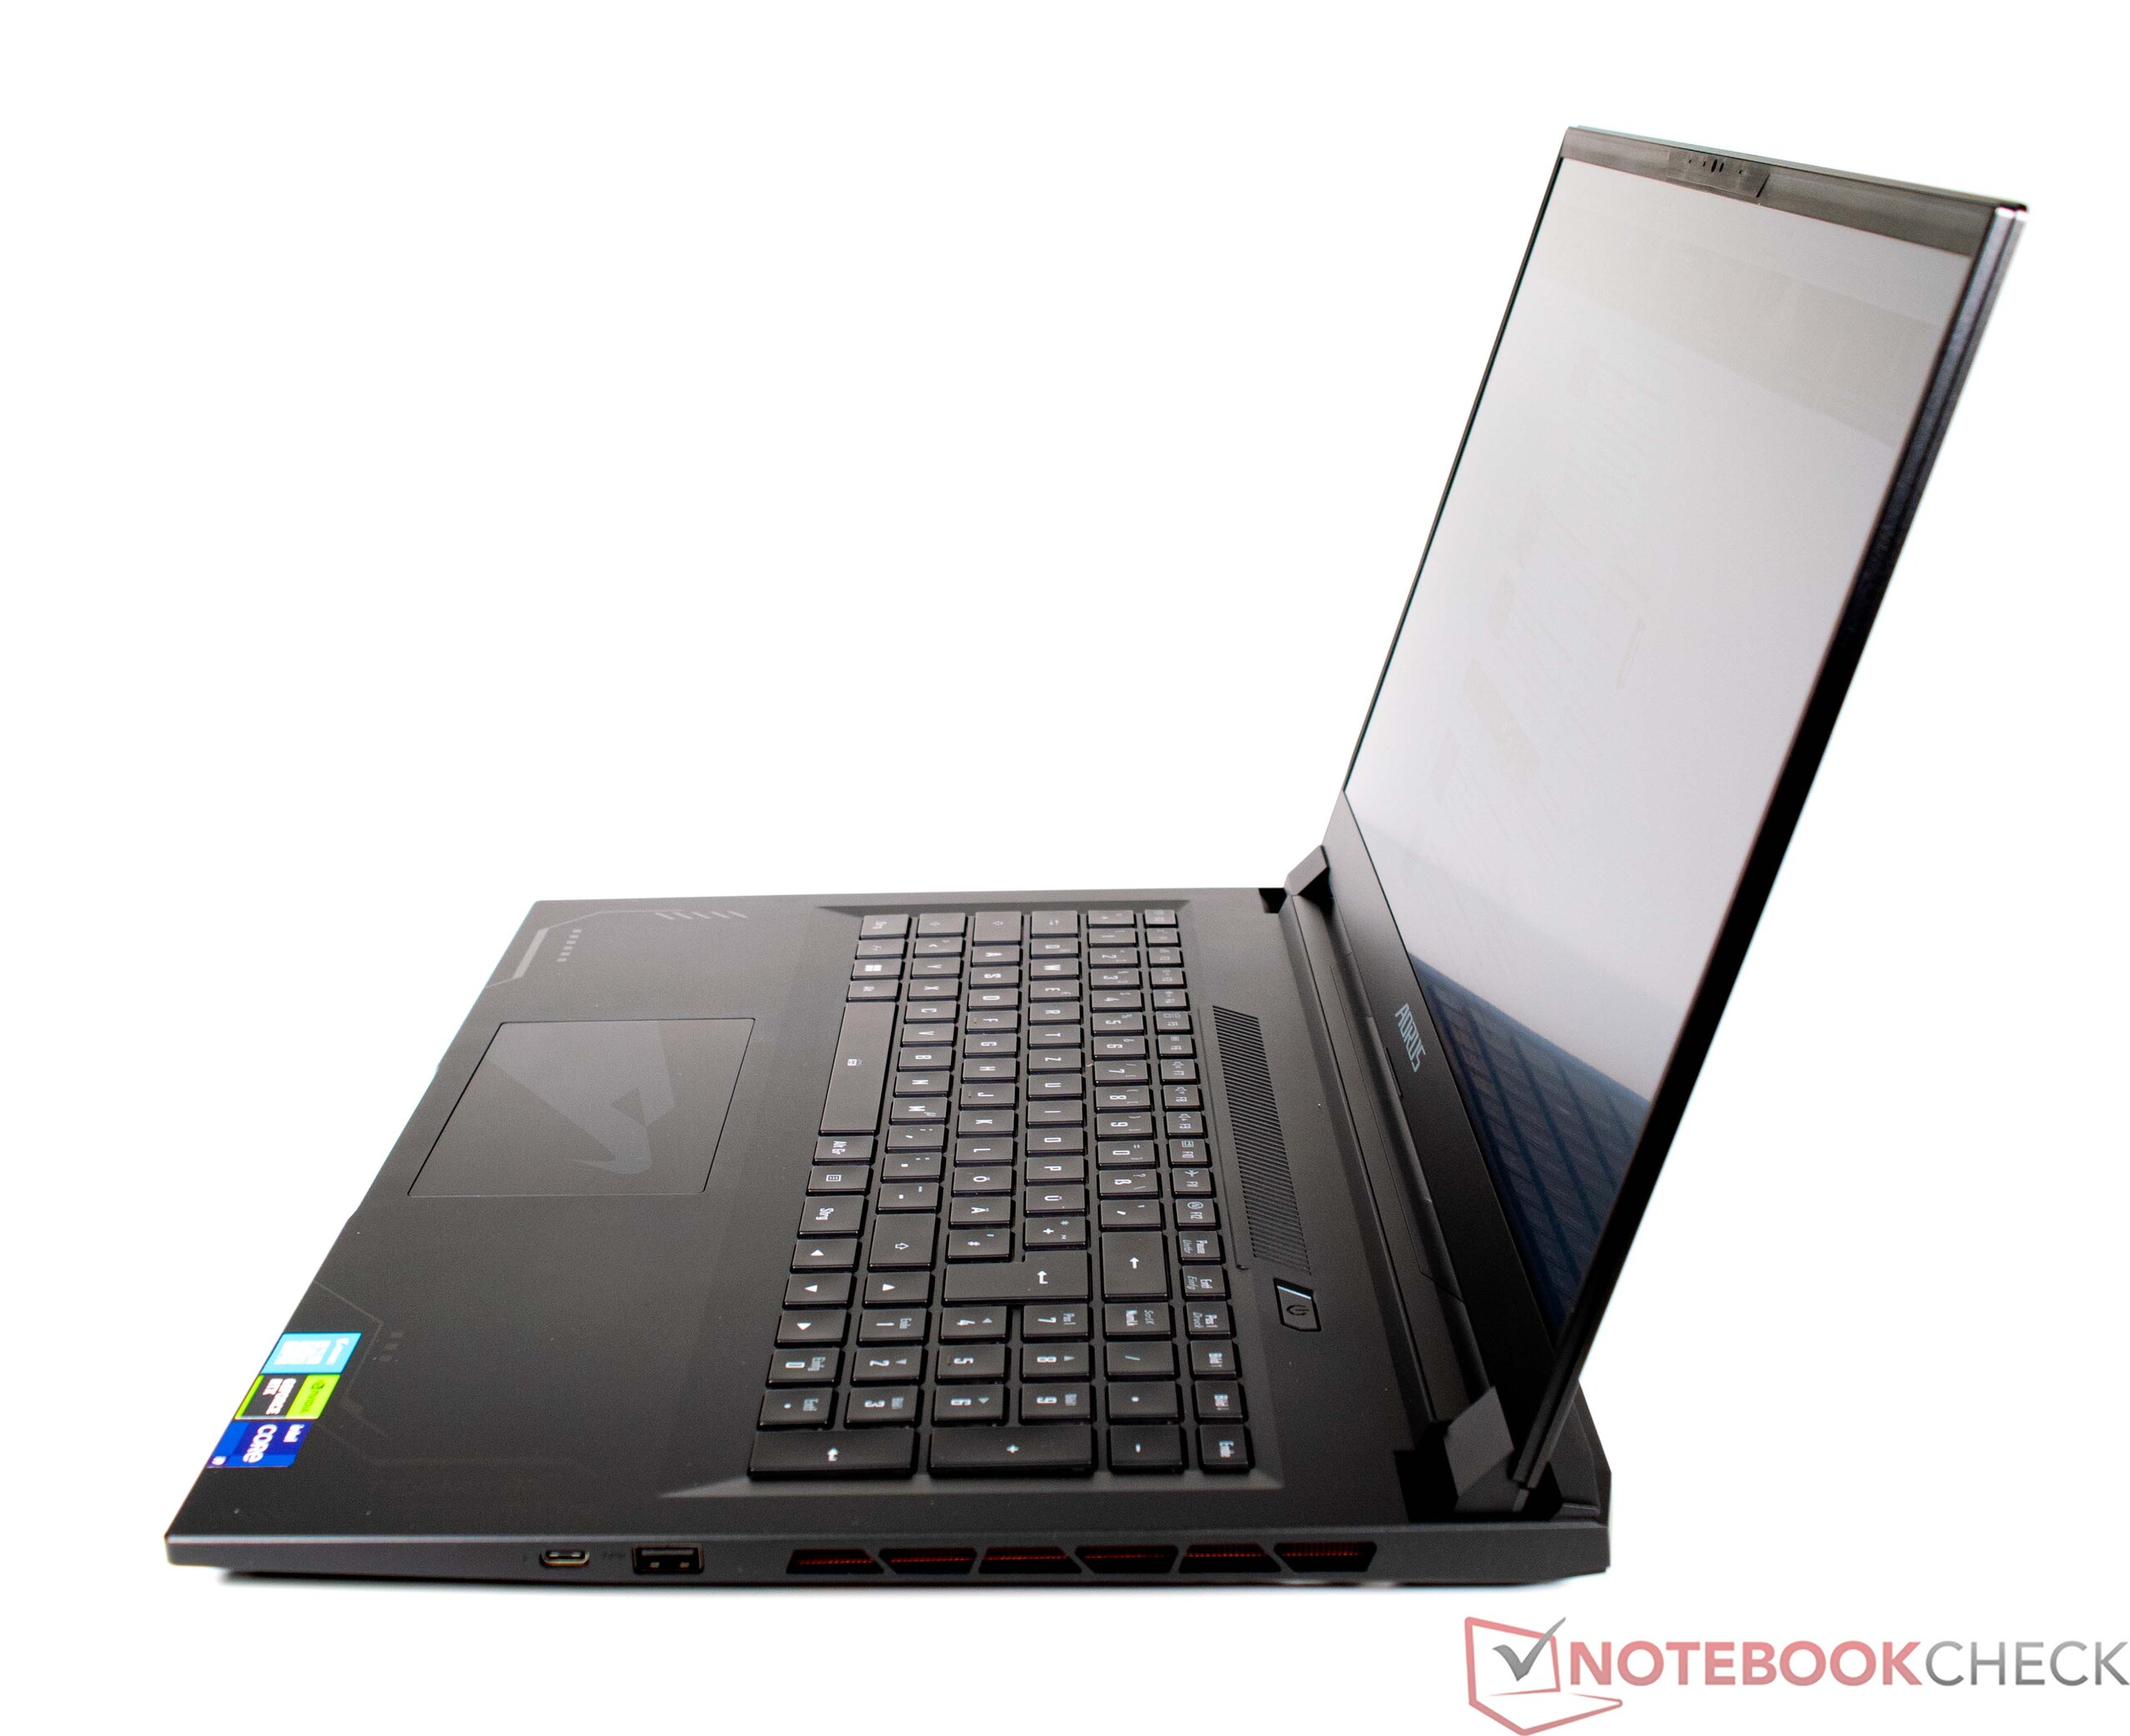
在稳定性方面,材料的选择被证明是有些不利的,但在我们的压力测试中仍然被证明是稳固的。制造商总是要在大型17英寸笔记本电脑的稳定性和移动性之间取得平衡,我们认为这在Aorus 17X AZF上是成功的。上方由铝制成的显示盖相对稳定,尽管它仍然可以用一点力气扭动。铰链也很稳定,感觉很扎实,将摇晃减少到最低限度。此外,单手打开显示屏是可能的。
唯一的颜色元素是在背面以发光的Aorus字母形式出现。显示屏盖上还有一个银色的Aorus标志,这打破了完全黑色设备的单调性。
装备
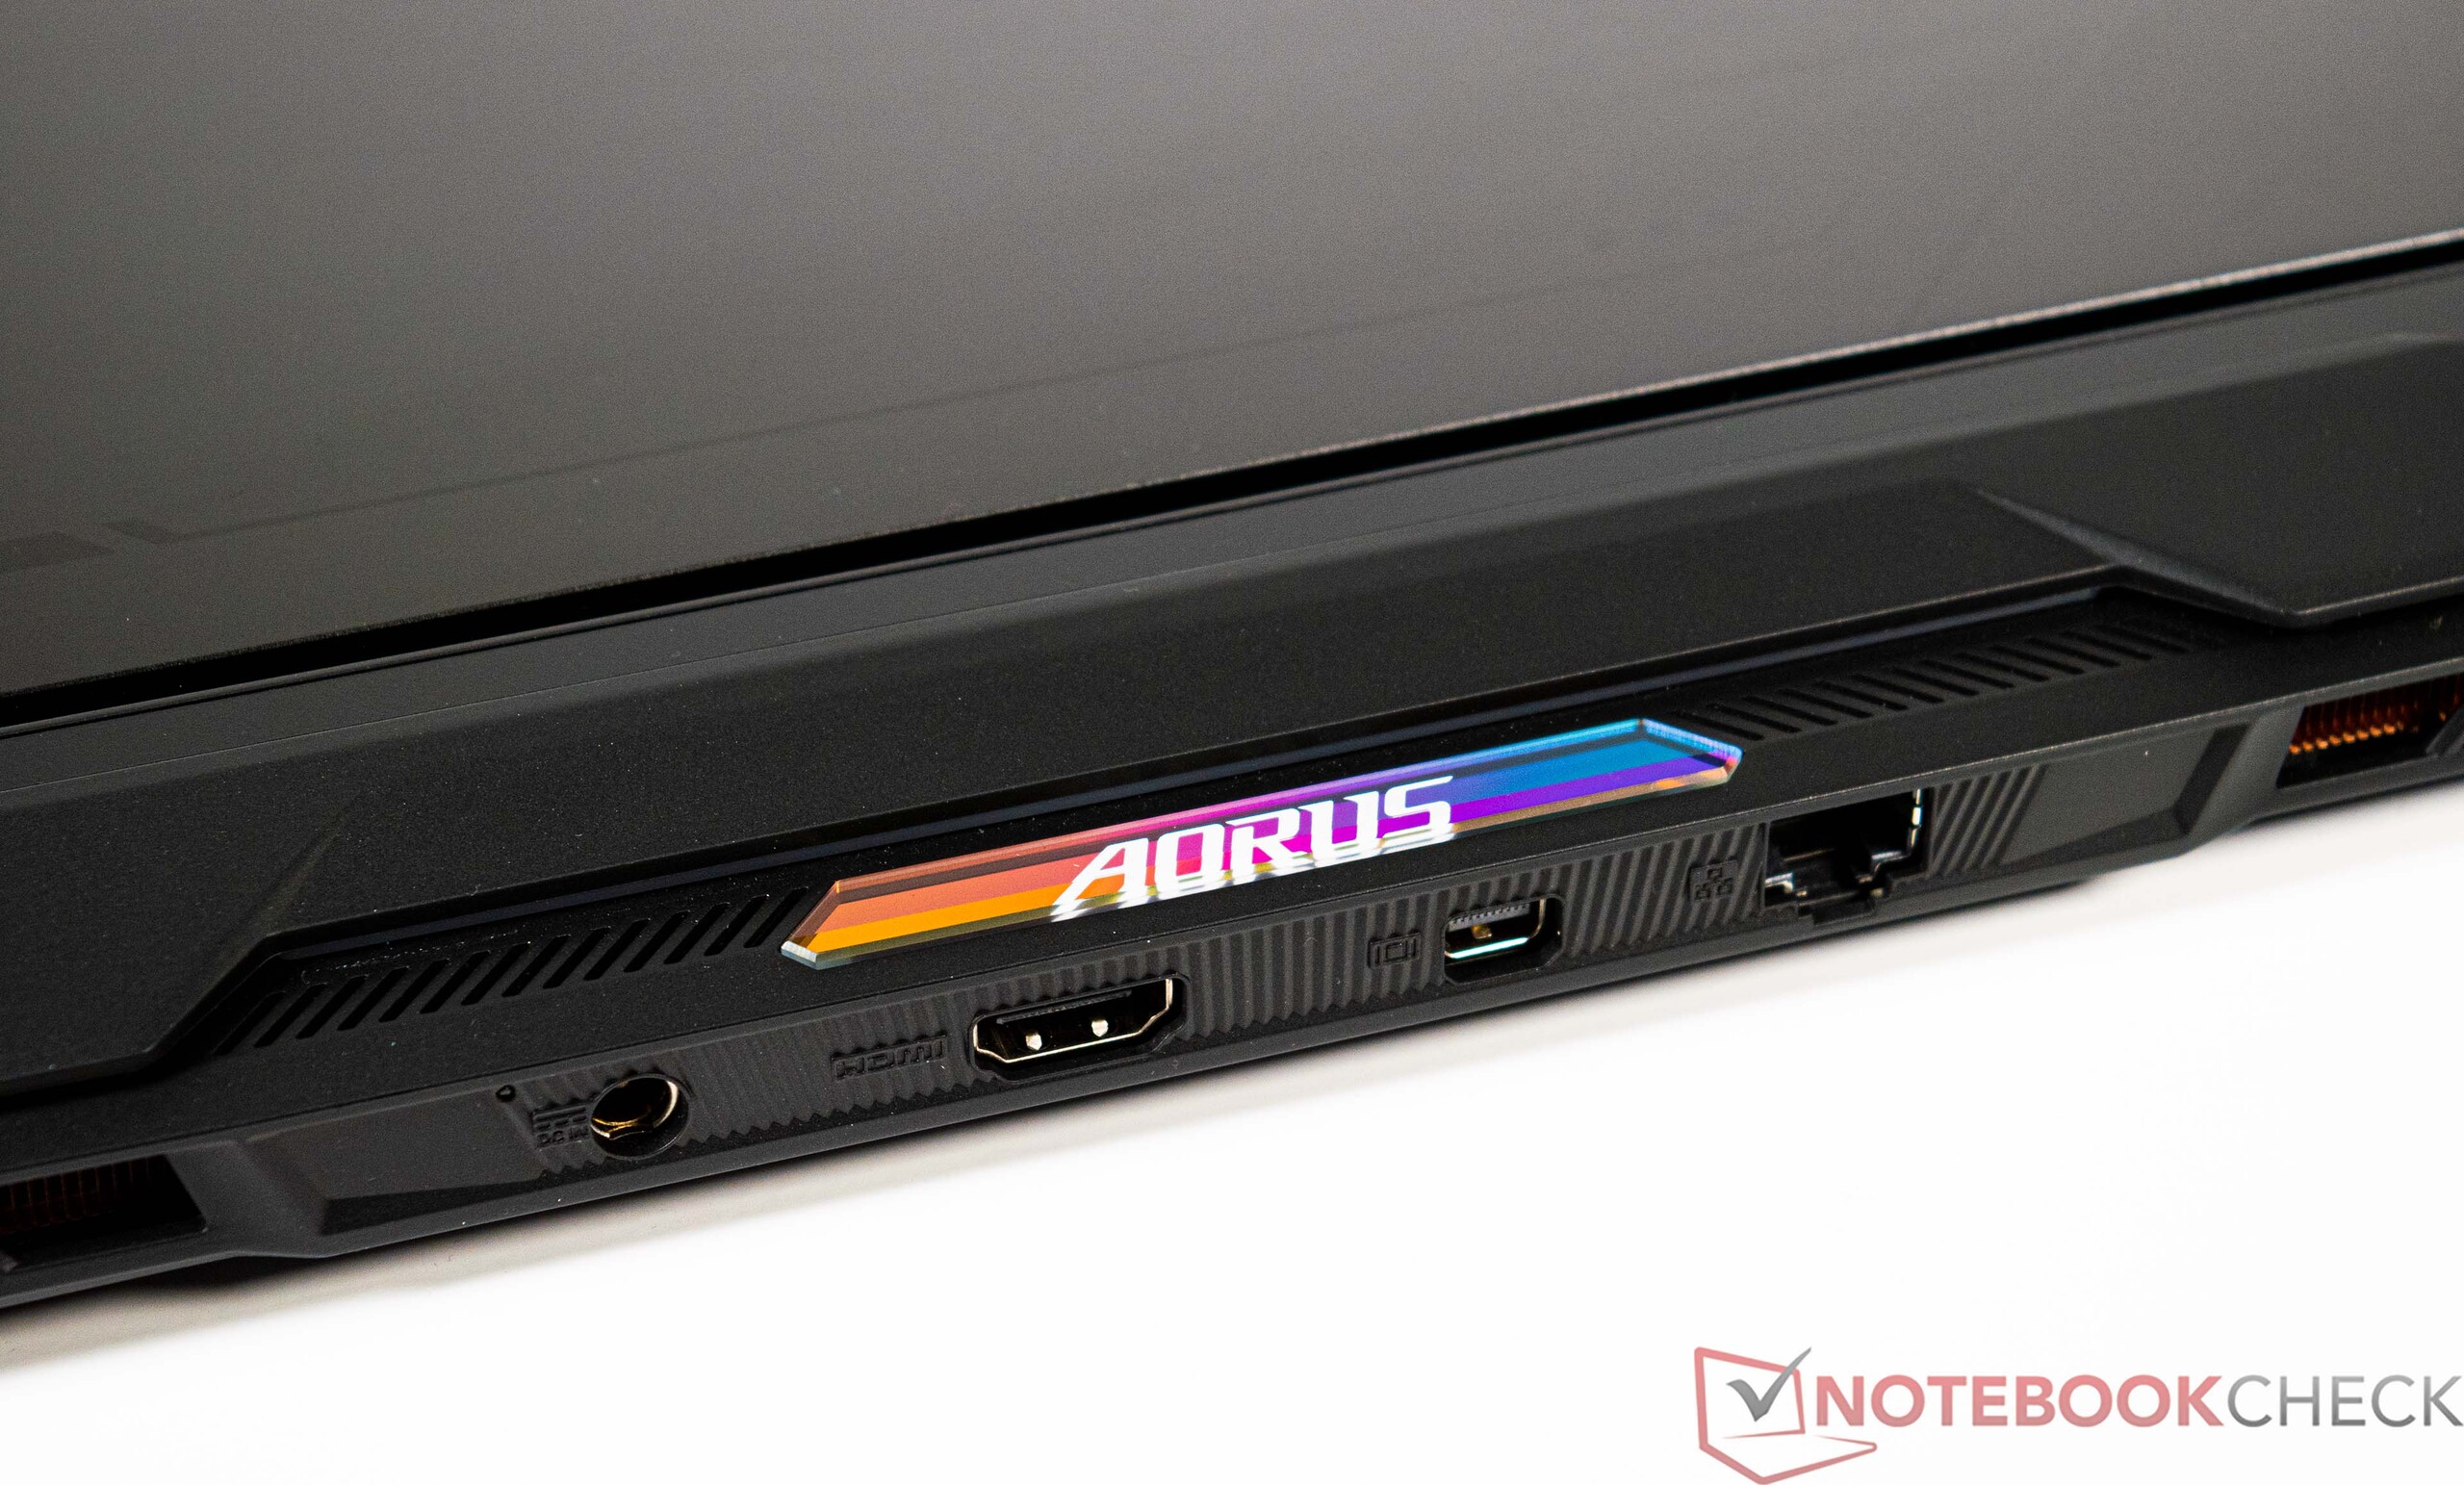
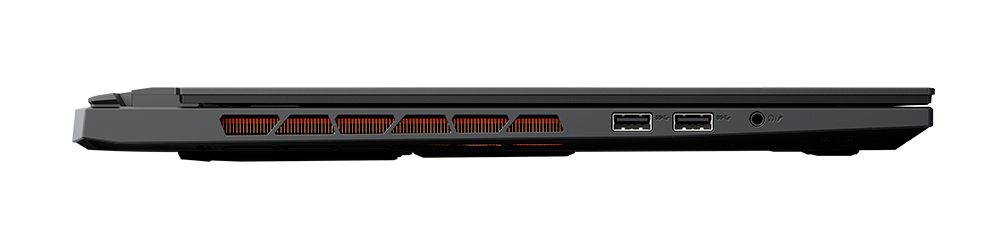
不幸的是,Aorus 17X AZF没有提供这么多的端口选择,但可用的接口还是应该满足大多数用户。毕竟,有一个带有Power Delivery(PD)的现代Thunderbolt 4端口和三个传统USB端口。同时,外部显示器可以通过HDMI或DisplayPort连接。接口的位置很好,尽管由于内部有膨胀的热管结构,制造商并没有很多选择。
沟通
安装的WLAN模块提供了良好的性能,因此Aorus 17X AZF在这里不必回避竞争。我们的华硕ROG Rapture GT-AXE11000被用来作为测试路由器。另外,Aorus 17X AZF还提供一个以太网端口,提供高达2.5 GBit/s的速率。
网络摄像头
Aorus 17X AZF的网络摄像头具有FHD功能,使其适用于简单的视频电话。由于缺乏色彩保真度,因此被扣了几分。另一方面,双阵列麦克风做得很好,因为来自不同方向的录音都以类似的音量播放。


维护
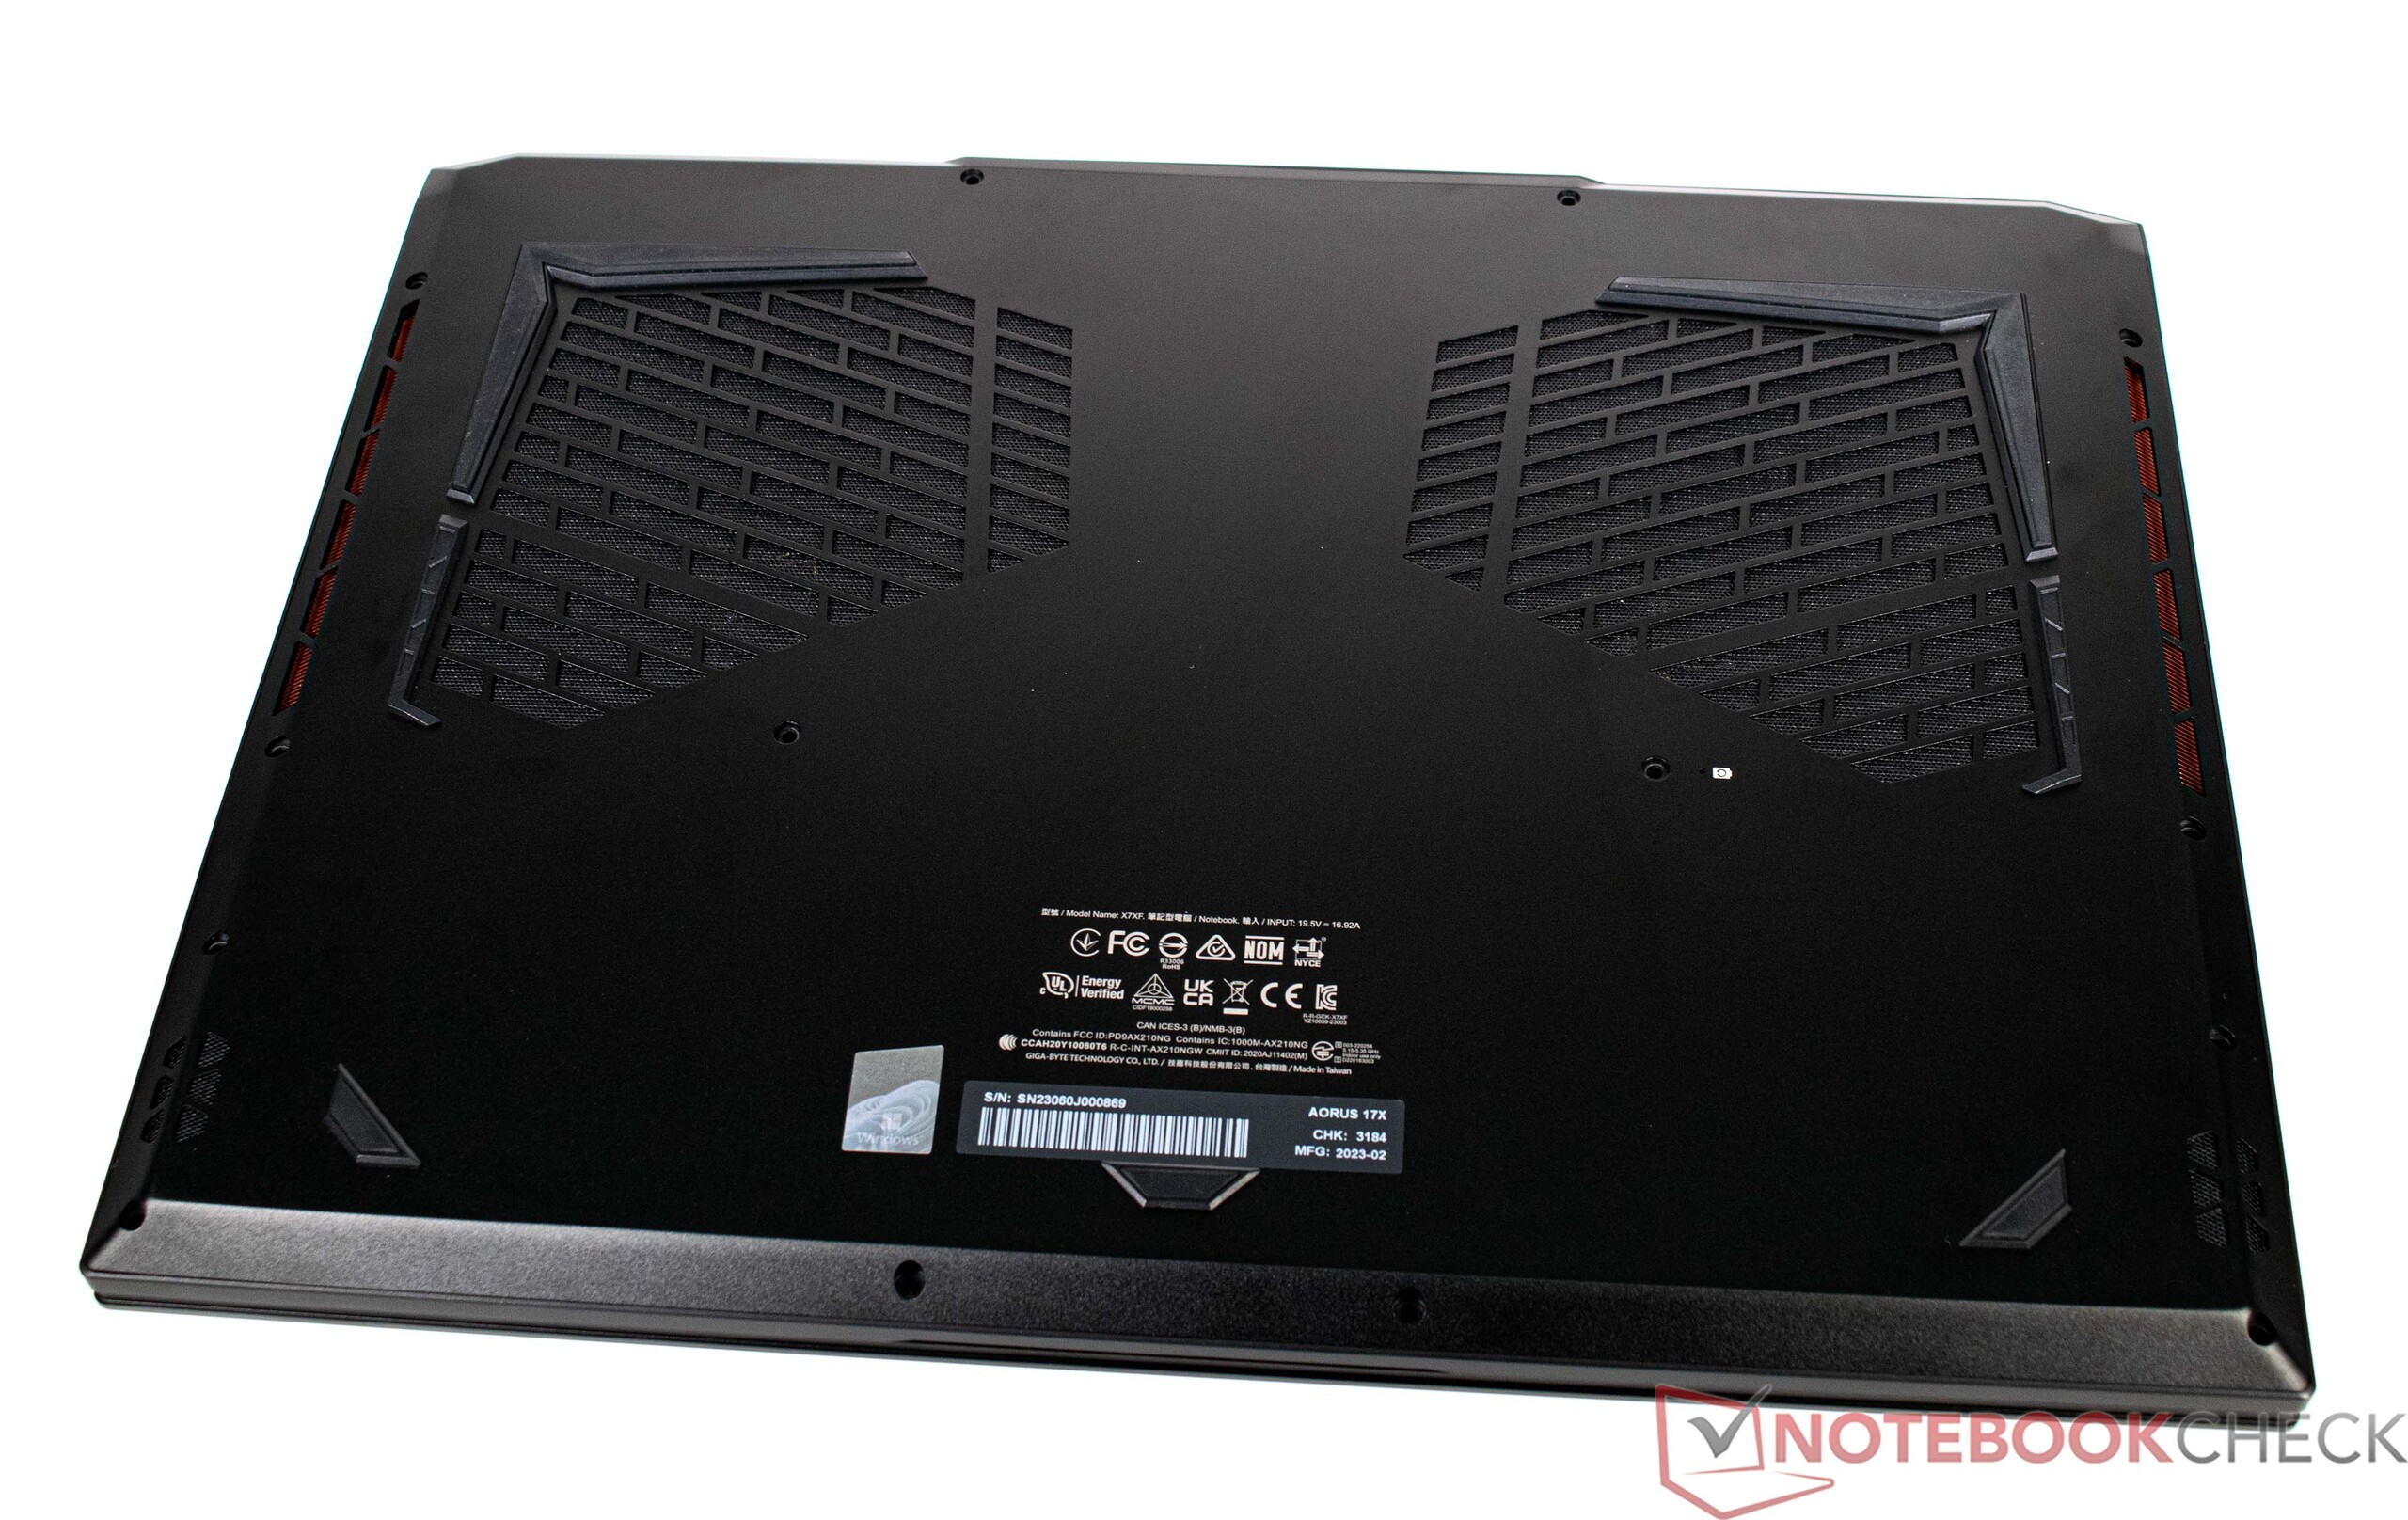
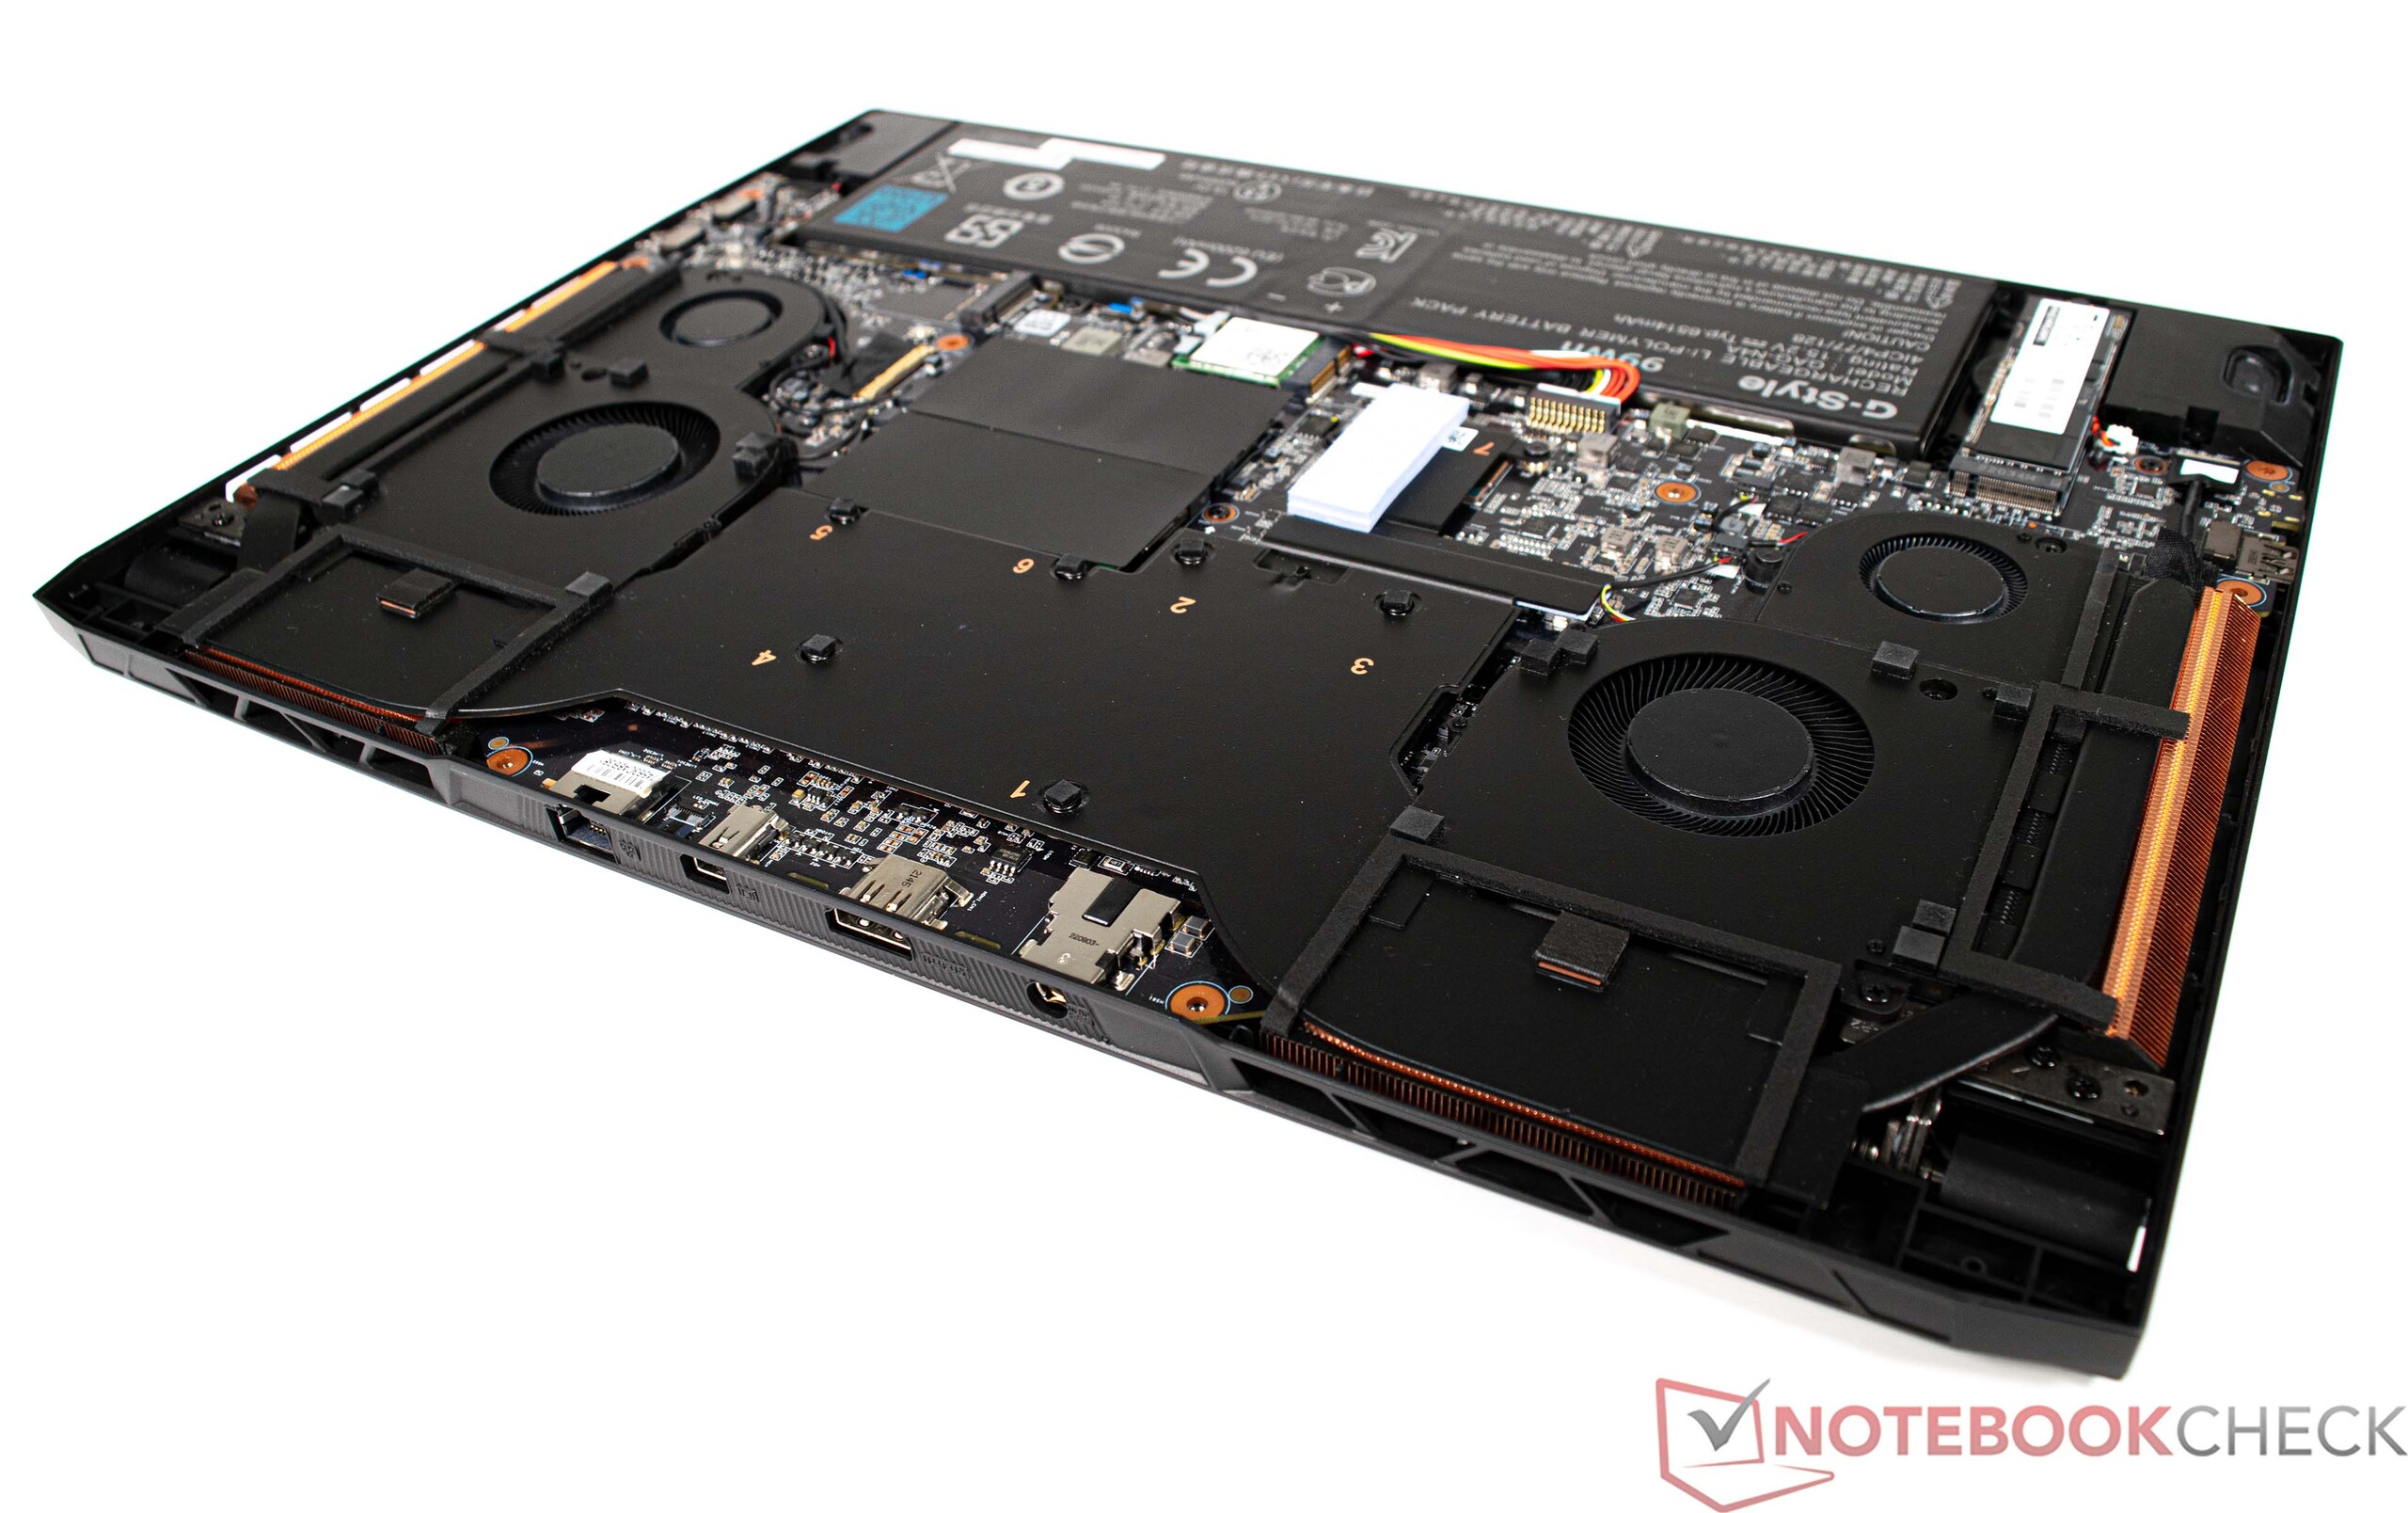
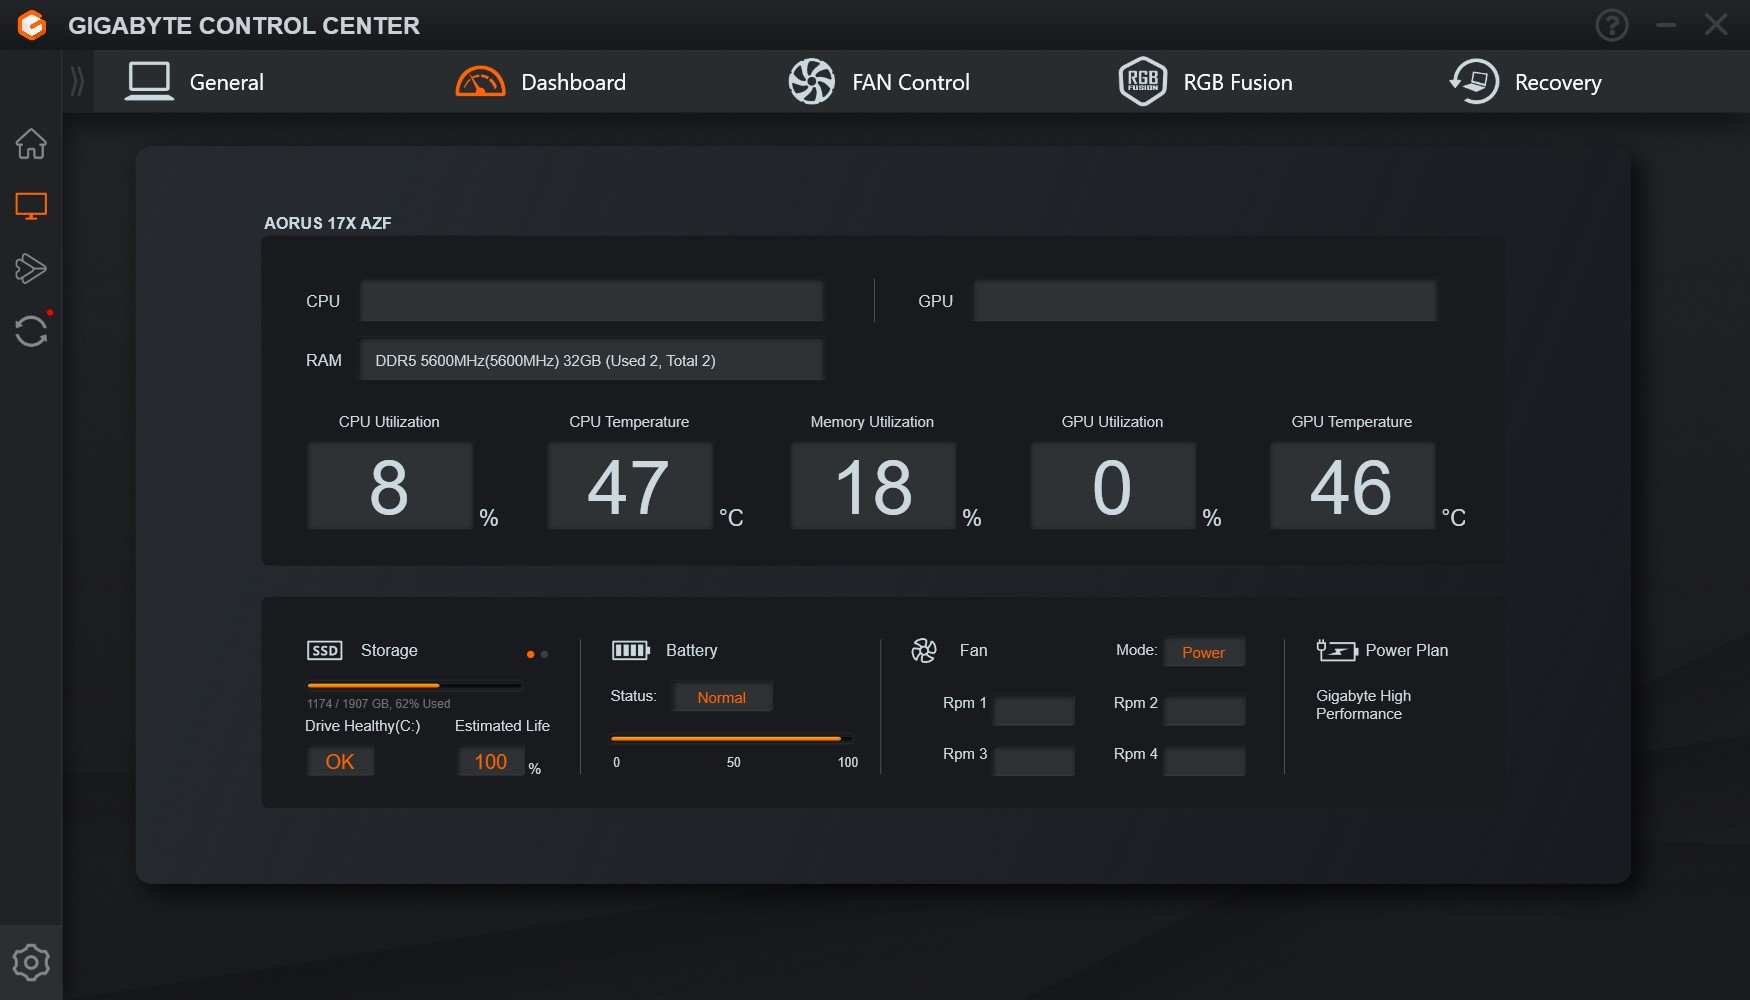
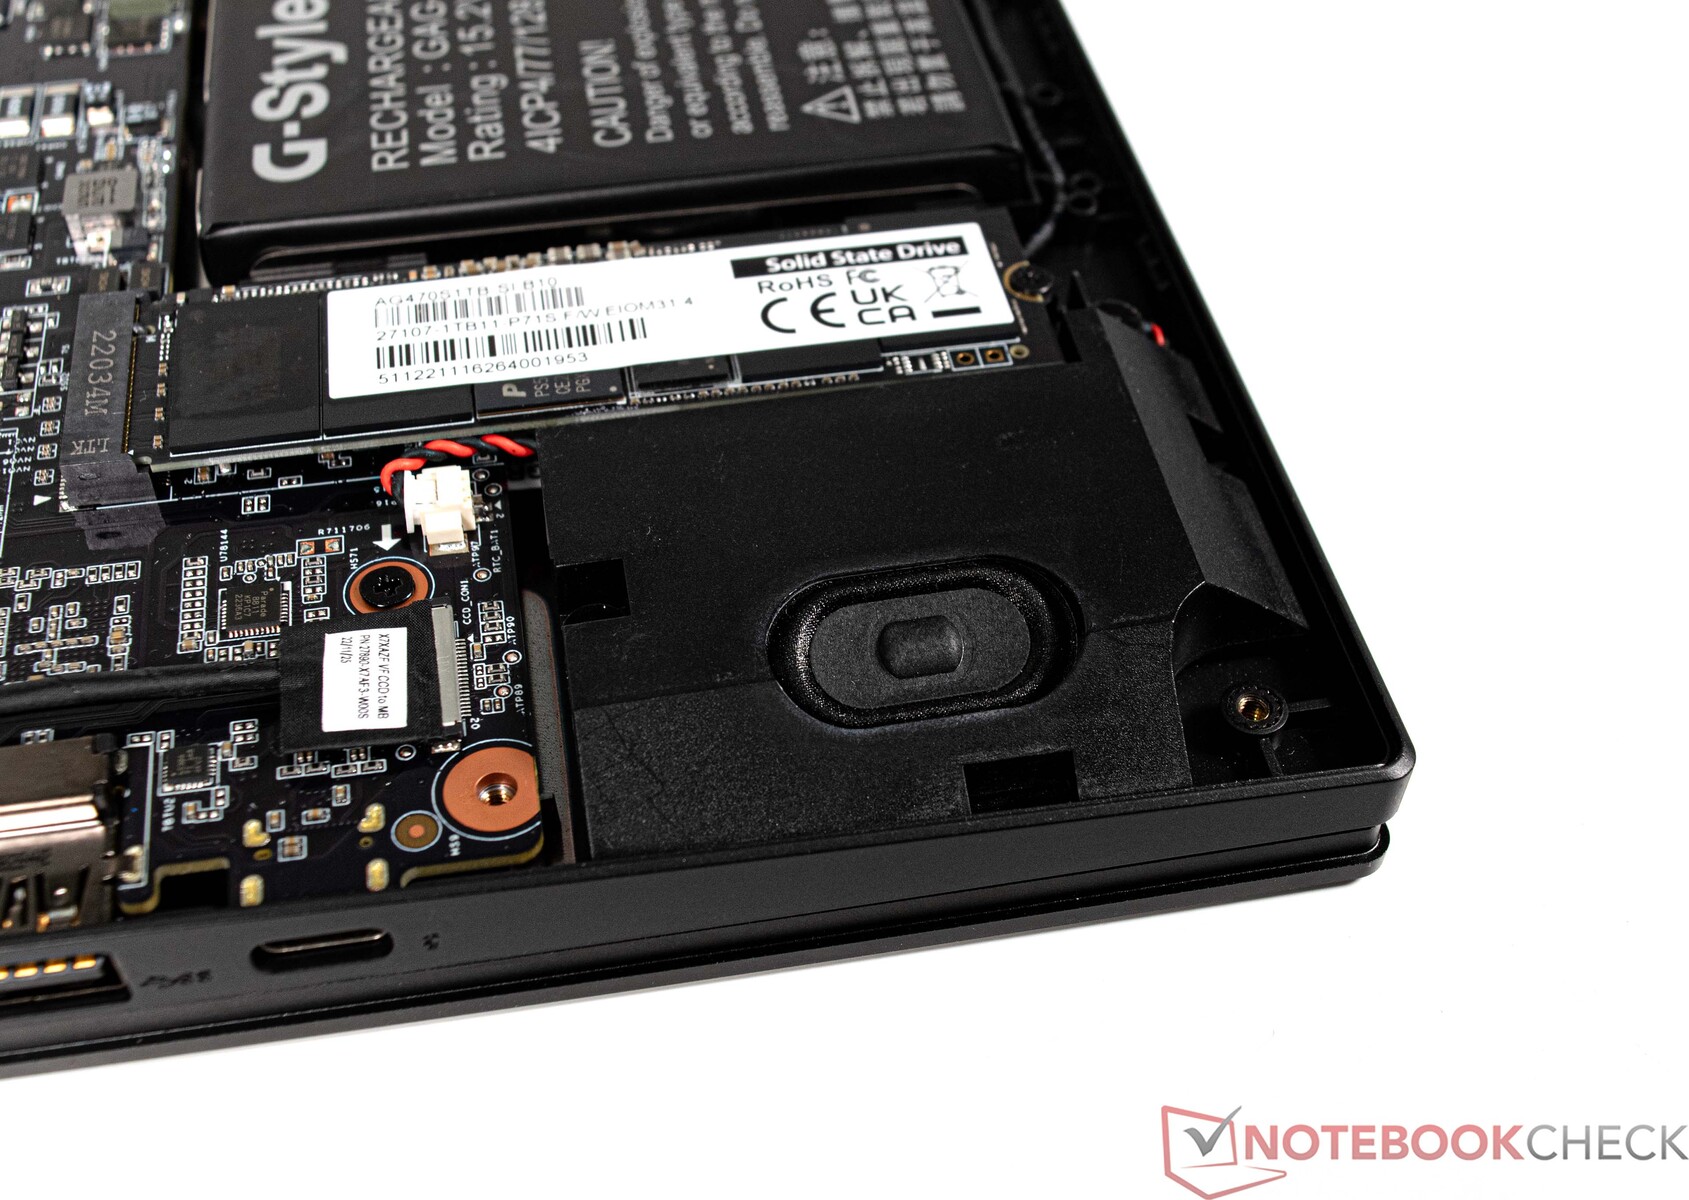
Aorus 17X AZF的维护工作从根本上说是可能的。然而,用许多螺钉连接的底板必须被卸下。所有重要的东西都在底板下面,如四个风扇、大容量存储和内存。在我们的案例中,笔记本电脑已经配备齐全,没有空闲的插槽用于内存或SSD。
担保
在德国,Aorus 17X AZF有24个月的保修期,包括提货和退货服务。当然,这可能会因国家而异,所以买家在购买前应仔细检查。
软件
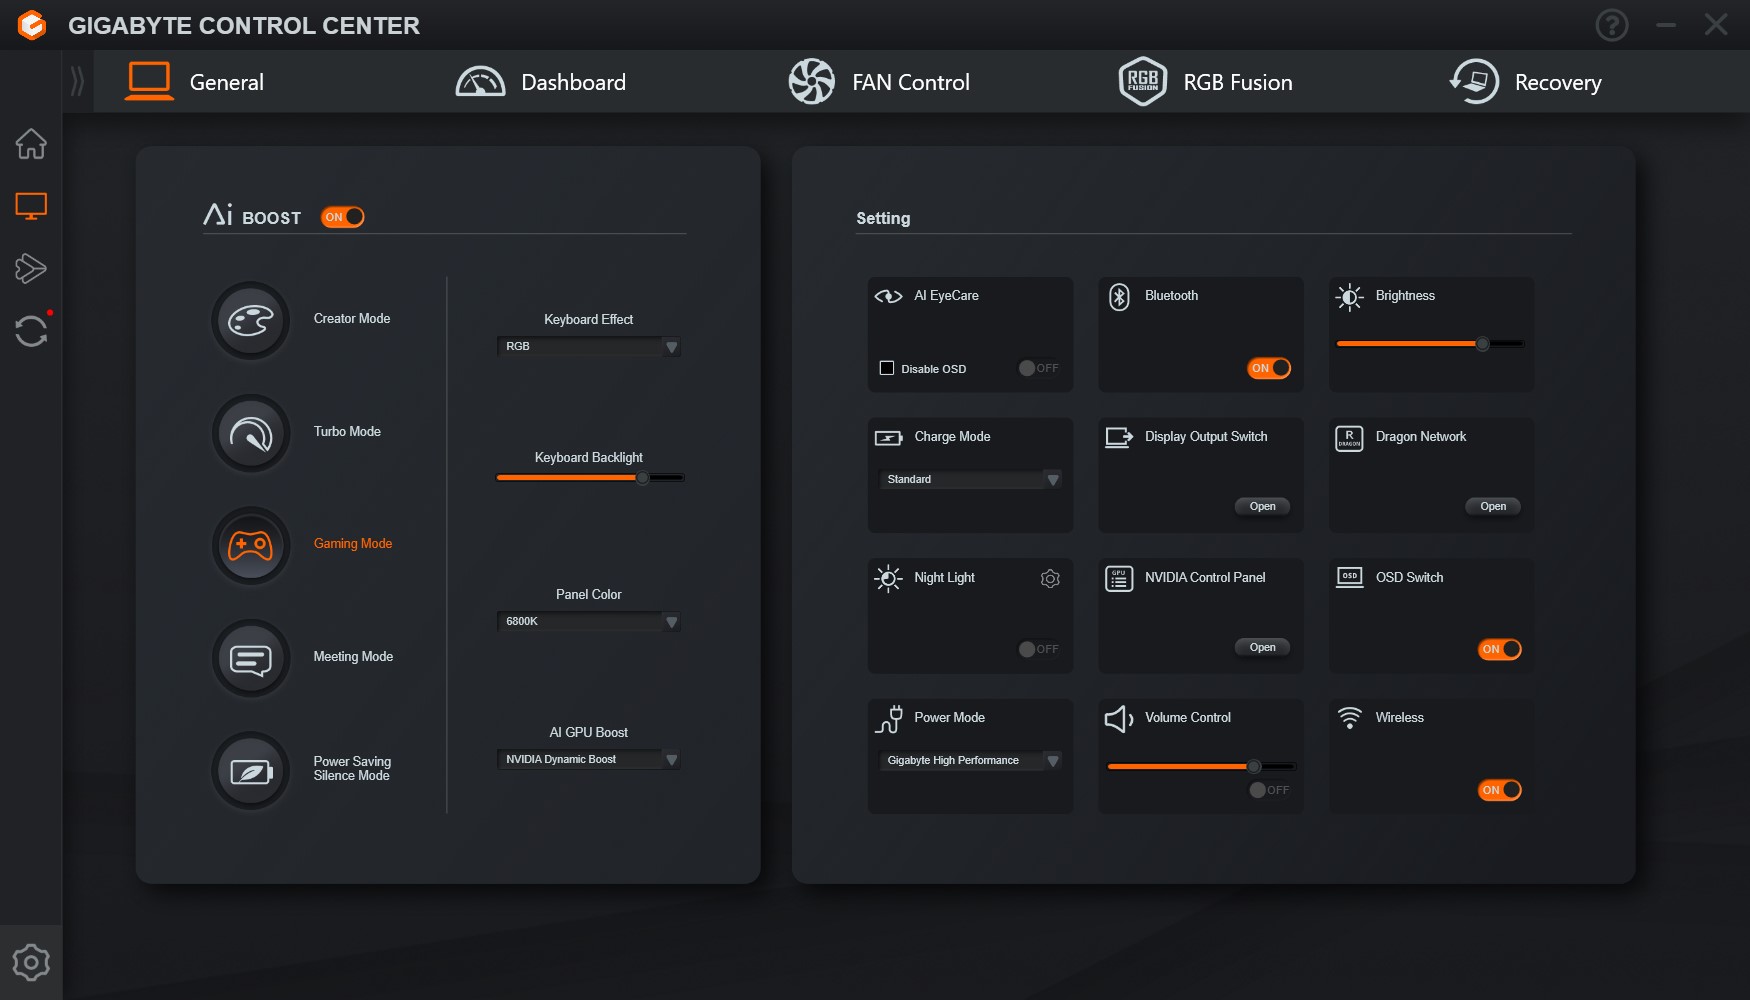
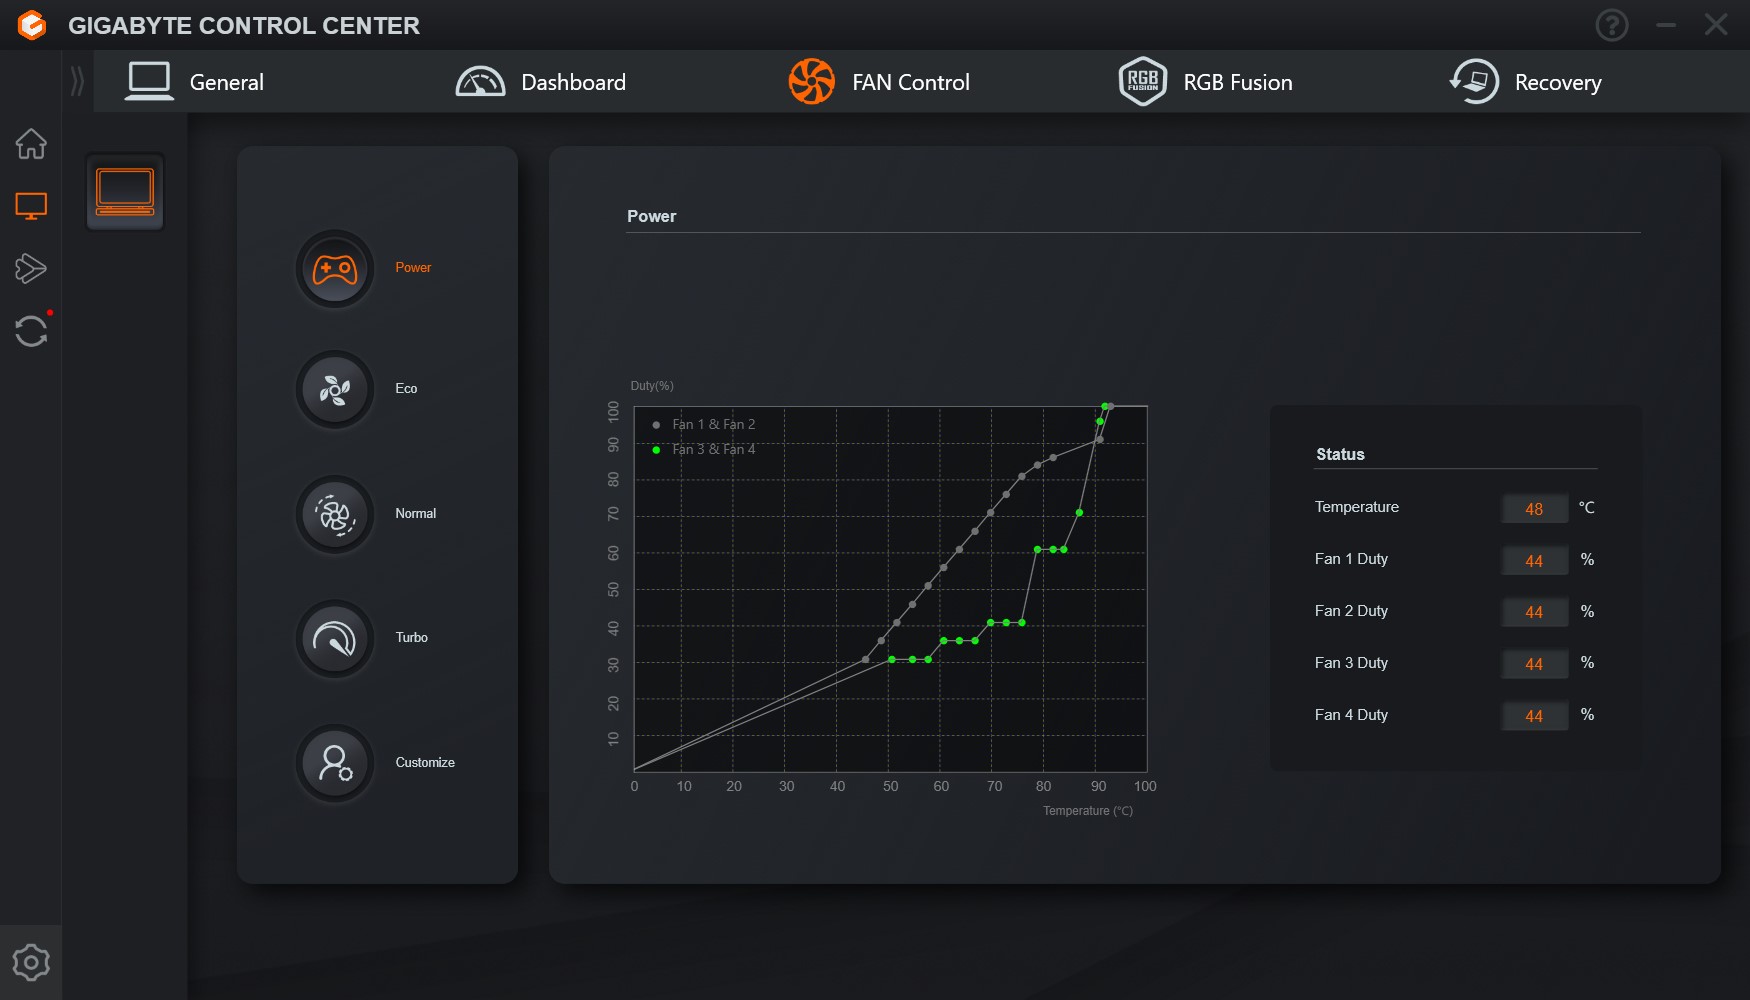
技嘉控制中心(GCC)用于控制和监测Aorus 17X AZF的组件。在我们的测试中,GCC没有遇到任何问题,它可以用来调节笔记本性能,从而影响背景噪音。风扇曲线可以通过风扇控制选项卡稍作调整。此外,可以为键盘选择大量的背光效果。
输入设备
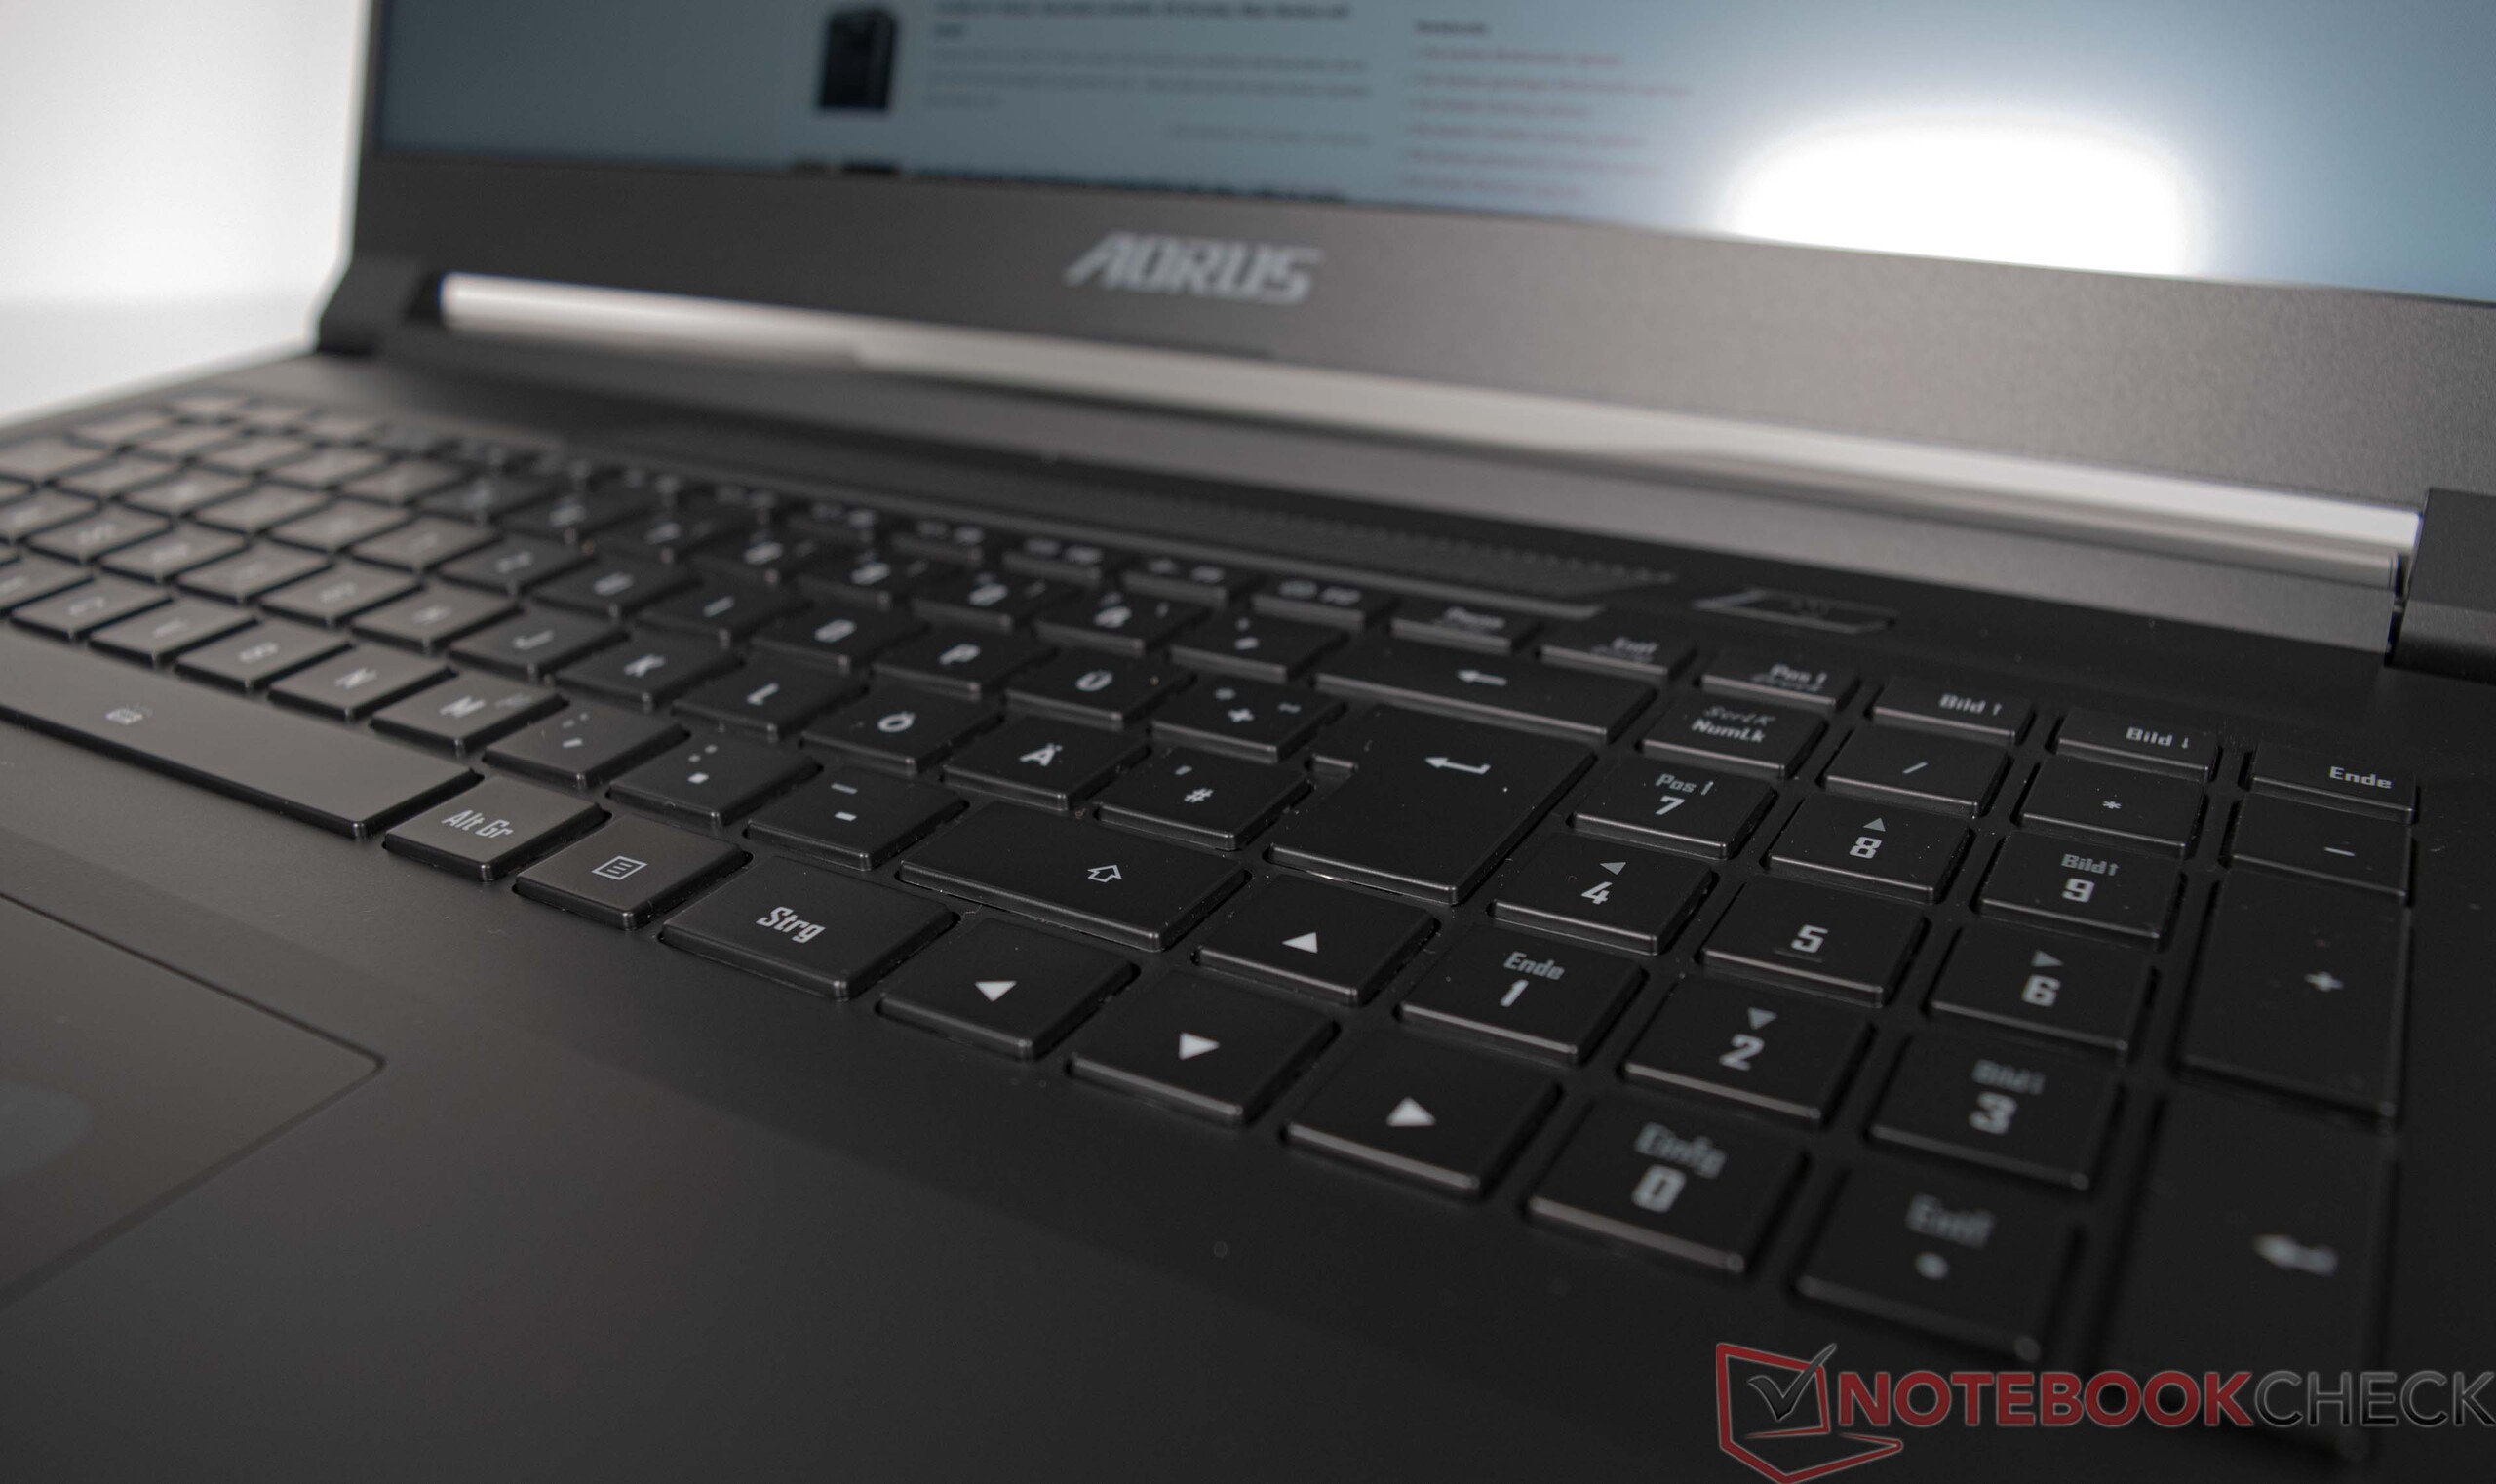
键盘
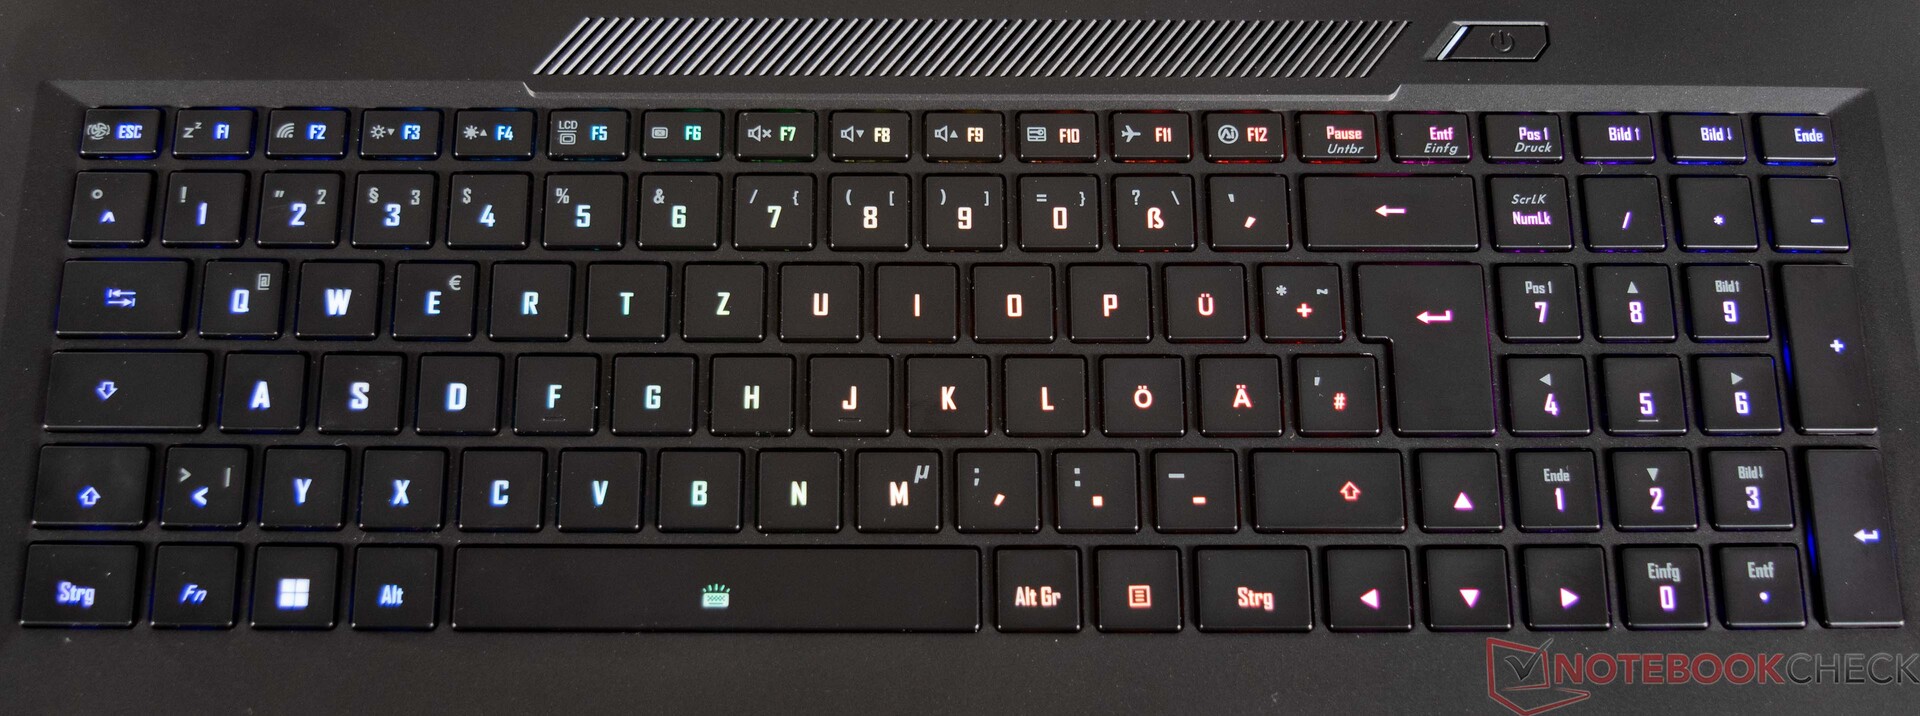
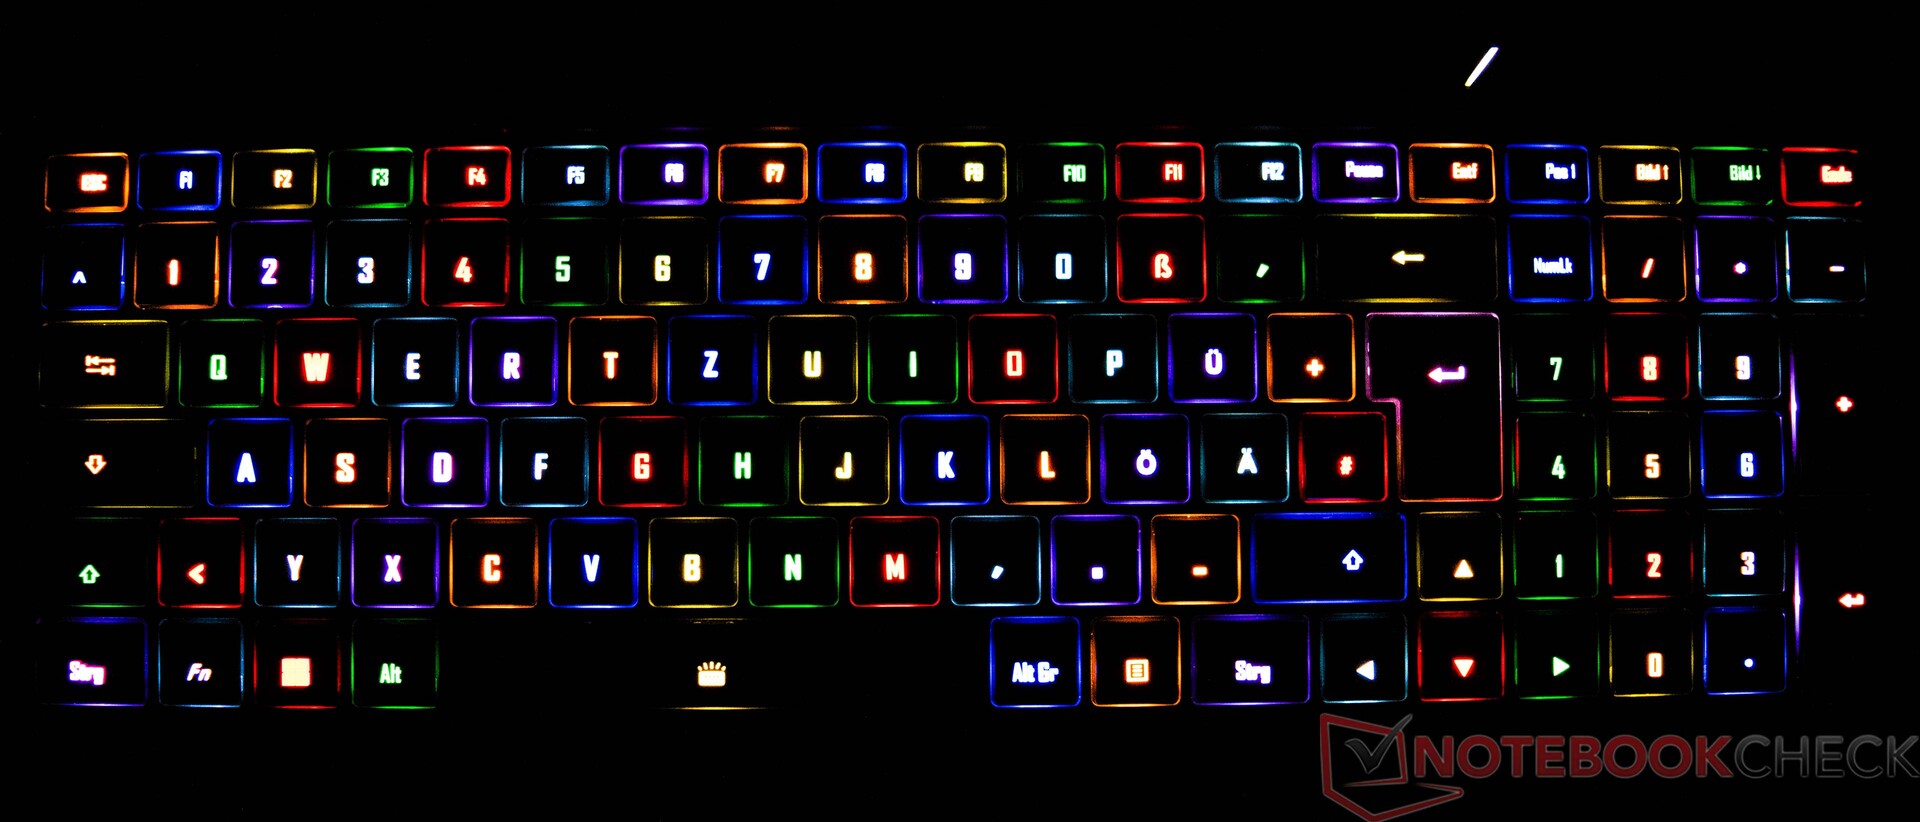
Aorus 17X AZF配备了一个背光的6排chiclet键盘,包括一个数字键盘。平滑的按键具有中等行程和清晰的压力点。键盘在打字时略微倾斜,但这并不过分明显。背光可以通过组合键调节三个级别的亮度,而且通过GCC(技嘉控制中心)还有更多的照明效果选项。
触摸板
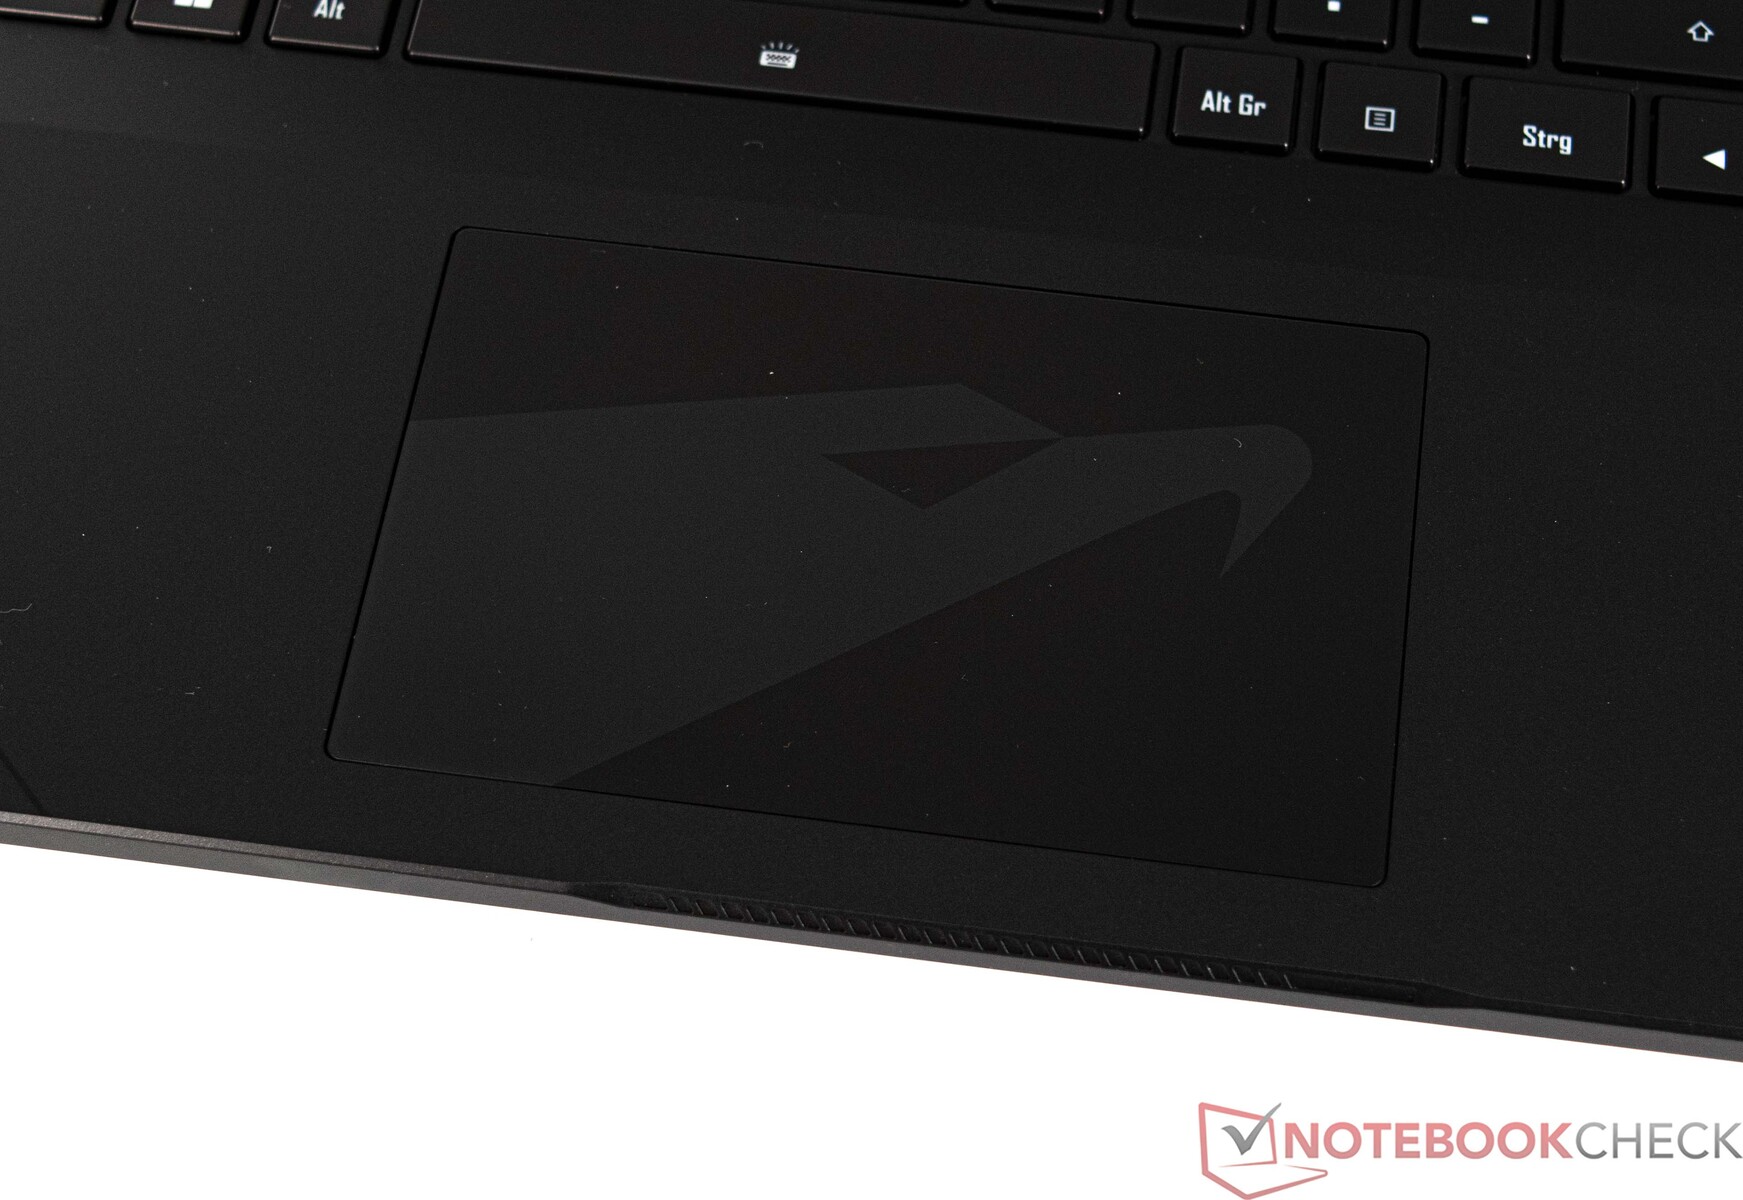
多点触摸ClickPad形式的鼠标替代品(约12.1 x 7.6厘米)提供了一个令人愉快的尺寸。Aorus还在触摸板上叠加了自己的标志,在视觉上令人愉悦。ClickPad提供了一个光滑的表面,使手指能够顺利滑动。输入表面可以整体使用,在角落里也有良好的反应。触摸板为输入提供了一个短的行程,由于其清晰的压力点,提供了清晰的反馈。
显示

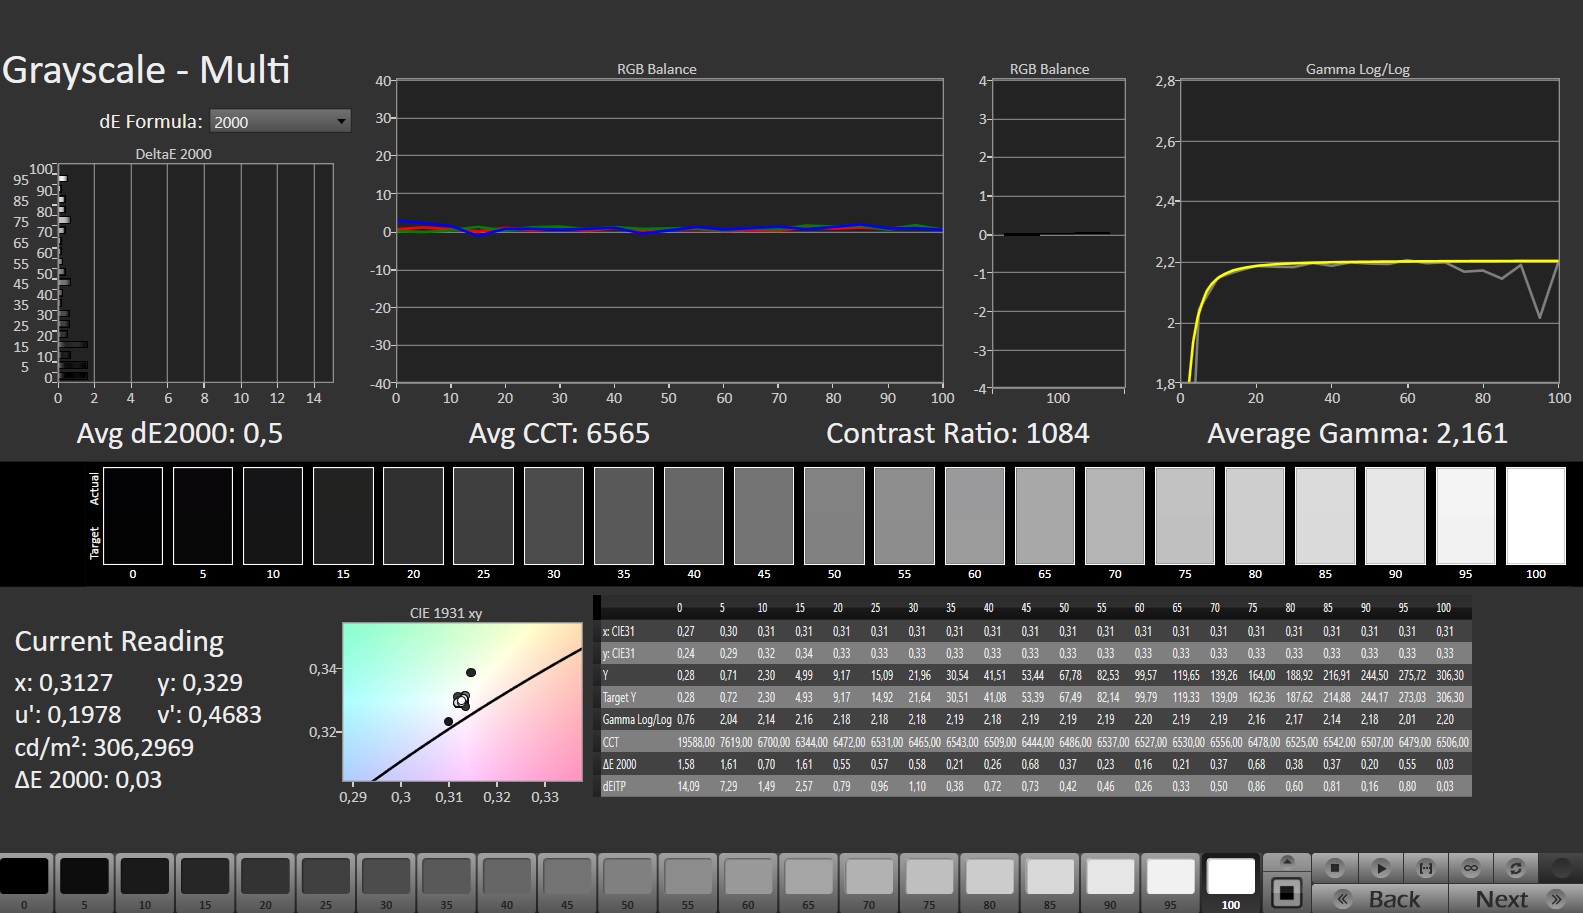
Aorus 17X AZF配备了良好的QHD面板,刷新率为240赫兹,应该能满足大多数游戏玩家的需求。然而,与竞争对手相比,我们的测试设备的平均亮度明显较弱。平均只有276cd/m²,太低了,只够排在最后。Aorus 17X AZF在显示得分方面也因轻微的光晕而失去了重要分数。没有检测到PWM。
其他显示选项,如4K面板,并不打算用于Aorus 17X AZF。
| |||||||||||||||||||||||||
Brightness Distribution: 90 %
Center on Battery: 294 cd/m²
Contrast: 1050:1 (Black: 0.28 cd/m²)
ΔE ColorChecker Calman: 2.81 | ∀{0.5-29.43 Ø4.71}
calibrated: 0.86
ΔE Greyscale Calman: 3.4 | ∀{0.09-98 Ø4.96}
84.5% AdobeRGB 1998 (Argyll 3D)
99.9% sRGB (Argyll 3D)
96.7% Display P3 (Argyll 3D)
Gamma: 2.301
CCT: 7389 K
| Aorus 17X AZF BOE09F9, IPS, 2560x1440, 17.3" | Medion Erazer Beast X40 BOE NE170QDM-NZ1, IPS, 2560x1600, 17" | MSI GE78HX 13VH-070US AU Optronics B170QAN01.2, IPS, 2560x1600, 17" | HP Omen 17-ck2097ng BOE BOE09BF, IPS, 2560x1440, 17.3" | MSI Titan GT77 HX 13VI B173ZAN06.C, Mini-LED, 3840x2160, 17.3" | Alienware m18 R1 Chi Mei 180JME, IPS, 1920x1200, 18" | |
|---|---|---|---|---|---|---|
| Display | -16% | 1% | -17% | 2% | 2% | |
| Display P3 Coverage (%) | 96.7 | 68.6 -29% | 97.6 1% | 67.4 -30% | 94.9 -2% | 97.7 1% |
| sRGB Coverage (%) | 99.9 | 99.8 0% | 99.9 0% | 97.6 -2% | 99.9 0% | 100 0% |
| AdobeRGB 1998 Coverage (%) | 84.5 | 69.4 -18% | 86.5 2% | 69.6 -18% | 92.4 9% | 89.8 6% |
| Response Times | 23% | 54% | 1% | -169% | 41% | |
| Response Time Grey 50% / Grey 80% * (ms) | 14 ? | 11.3 ? 19% | 4.2 ? 70% | 15.6 ? -11% | 38.4 ? -174% | 3 ? 79% |
| Response Time Black / White * (ms) | 10.1 ? | 7.5 ? 26% | 6.4 ? 37% | 8.9 ? 12% | 26.6 ? -163% | 9.9 ? 2% |
| PWM Frequency (Hz) | 2380 ? | |||||
| Screen | 11% | -24% | 14% | 64117% | 26% | |
| Brightness middle (cd/m²) | 294 | 384 31% | 398.6 36% | 371 26% | 606 106% | 372.8 27% |
| Brightness (cd/m²) | 276 | 377 37% | 384 39% | 350 27% | 602 118% | 367 33% |
| Brightness Distribution (%) | 90 | 90 0% | 89 -1% | 90 0% | 93 3% | 97 8% |
| Black Level * (cd/m²) | 0.28 | 0.45 -61% | 0.46 -64% | 0.32 -14% | 0.0001 100% | 0.32 -14% |
| Contrast (:1) | 1050 | 853 -19% | 867 -17% | 1159 10% | 6060000 577043% | 1165 11% |
| Colorchecker dE 2000 * | 2.81 | 2.05 27% | 4.05 -44% | 1.74 38% | 4.8 -71% | 1.92 32% |
| Colorchecker dE 2000 max. * | 5.7 | 3.64 36% | 8.68 -52% | 3.59 37% | 8.2 -44% | 3.65 36% |
| Colorchecker dE 2000 calibrated * | 0.86 | 0.74 14% | 1.02 -19% | 1.01 -17% | 1.8 -109% | 0.51 41% |
| Greyscale dE 2000 * | 3.4 | 2.3 32% | 6.5 -91% | 2.8 18% | 6.5 -91% | 1.5 56% |
| Gamma | 2.301 96% | 2.017 109% | 2.11 104% | 2.19 100% | 2.63 84% | 2.34 94% |
| CCT | 7389 88% | 6546 99% | 7518 86% | 6474 100% | 6596 99% | 6607 98% |
| Total Average (Program / Settings) | 6% /
7% | 10% /
-7% | -1% /
5% | 21317% /
41195% | 23% /
23% |
* ... smaller is better
从主观上看,屏幕的显示质量无可挑剔,尽管是哑光表面,但没有明显的纹理。总之,在交付状态下,测量的DeltaE-2000值相对接近目标值3。然而,同类产品中的其他笔记本电脑表明,这可以做得更好。我们能够通过手动校准大大改善这些数值。此外,我们还能够减少一点偏蓝。因此,如果你想使用该设备进行图像编辑,我们建议使用上面链接的ICC配置文件。
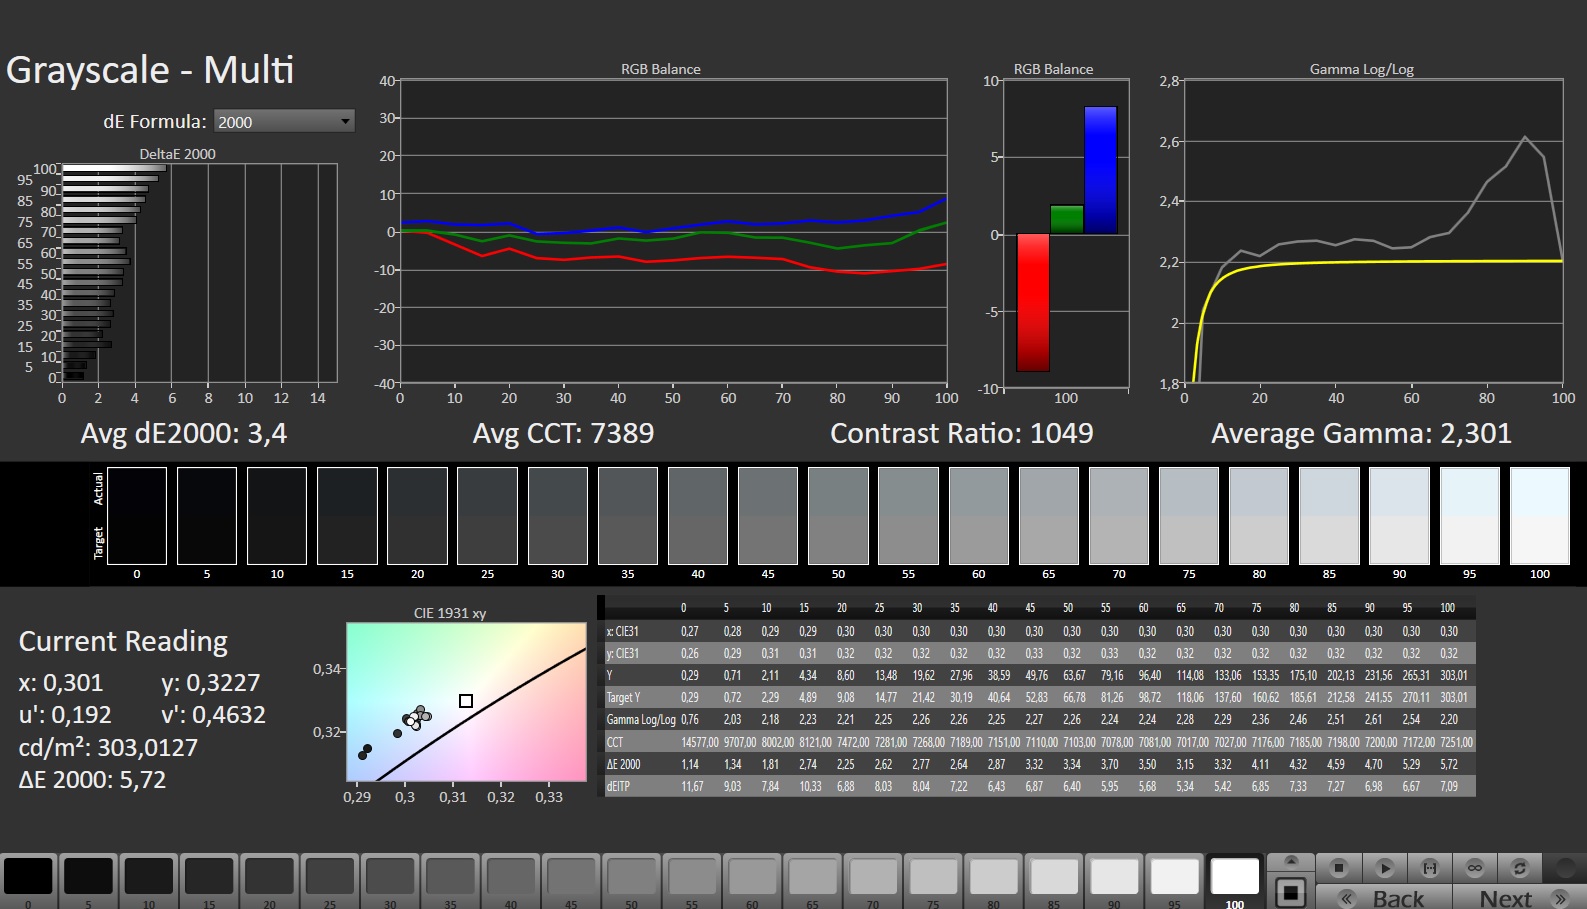
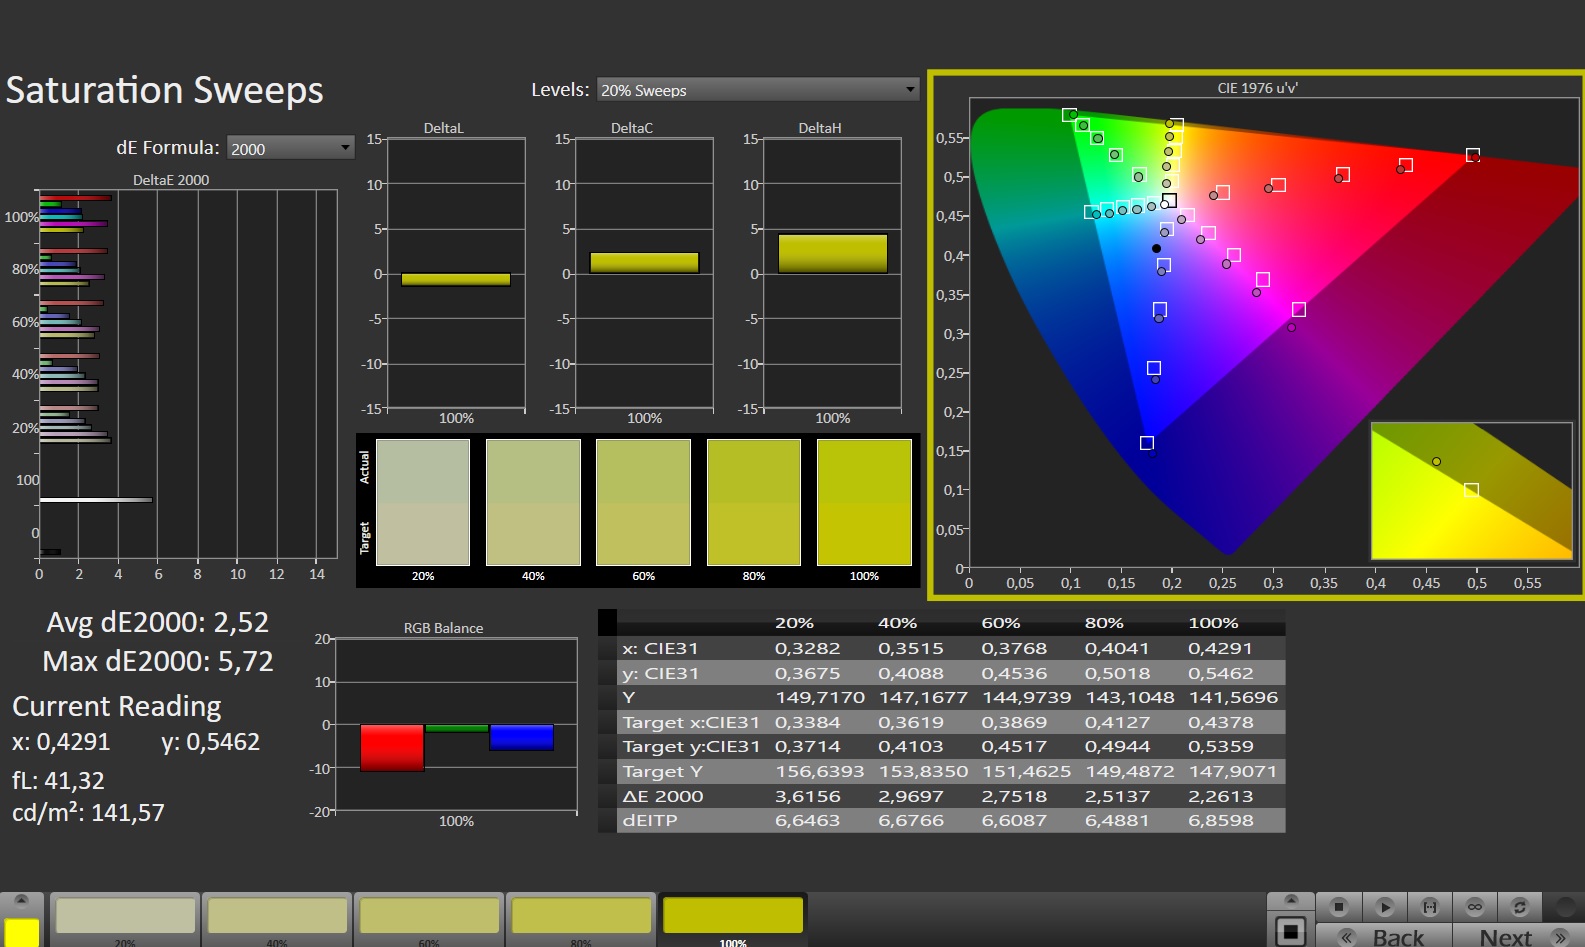
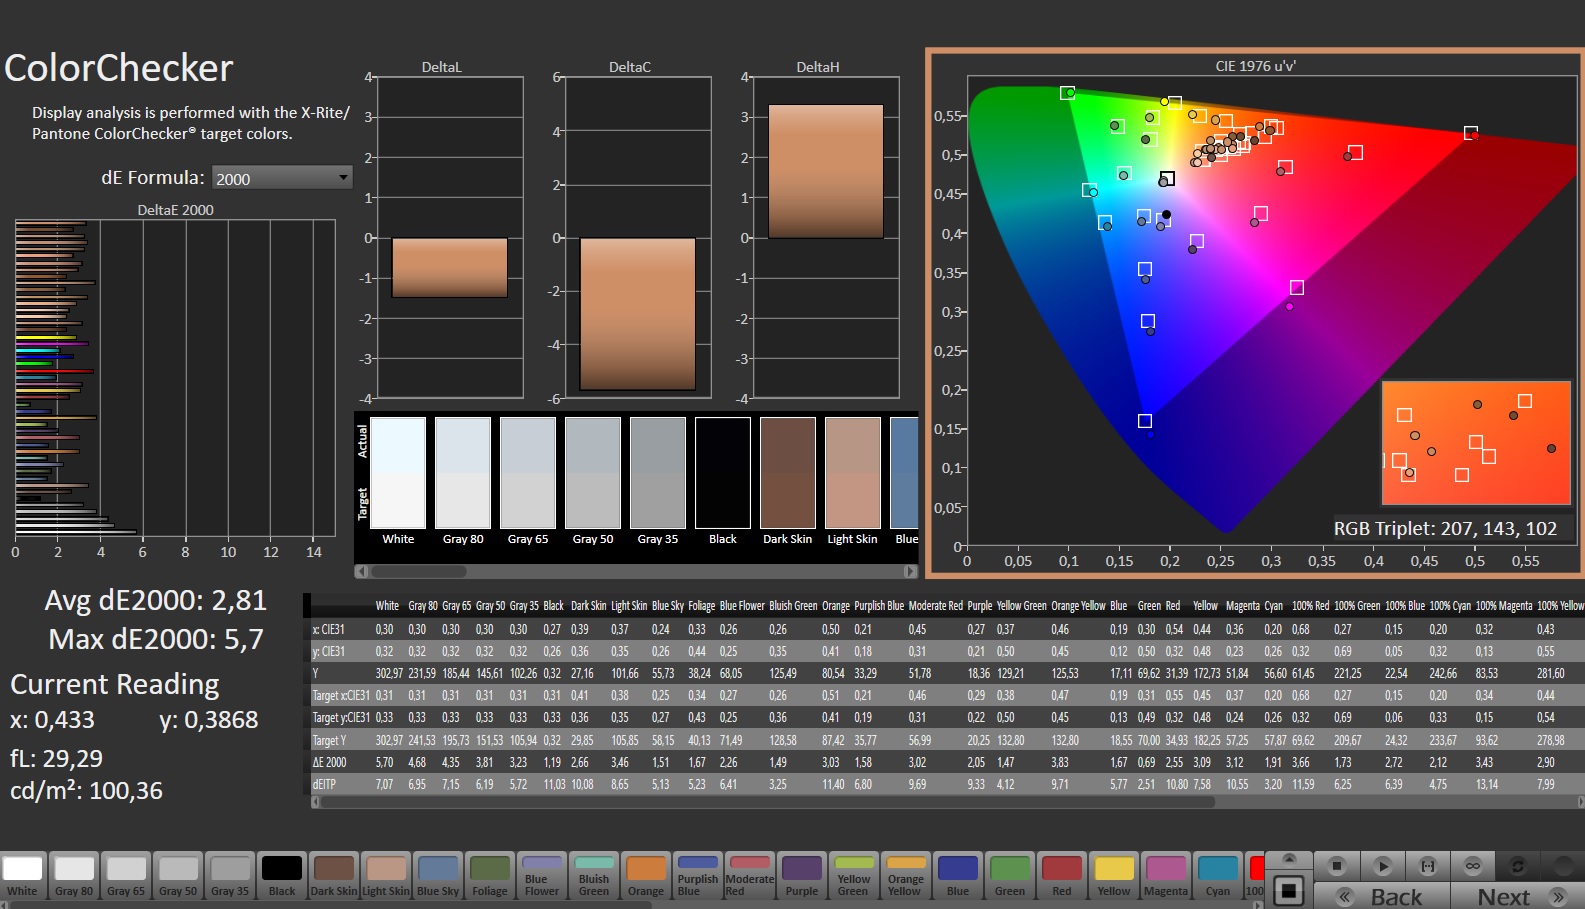
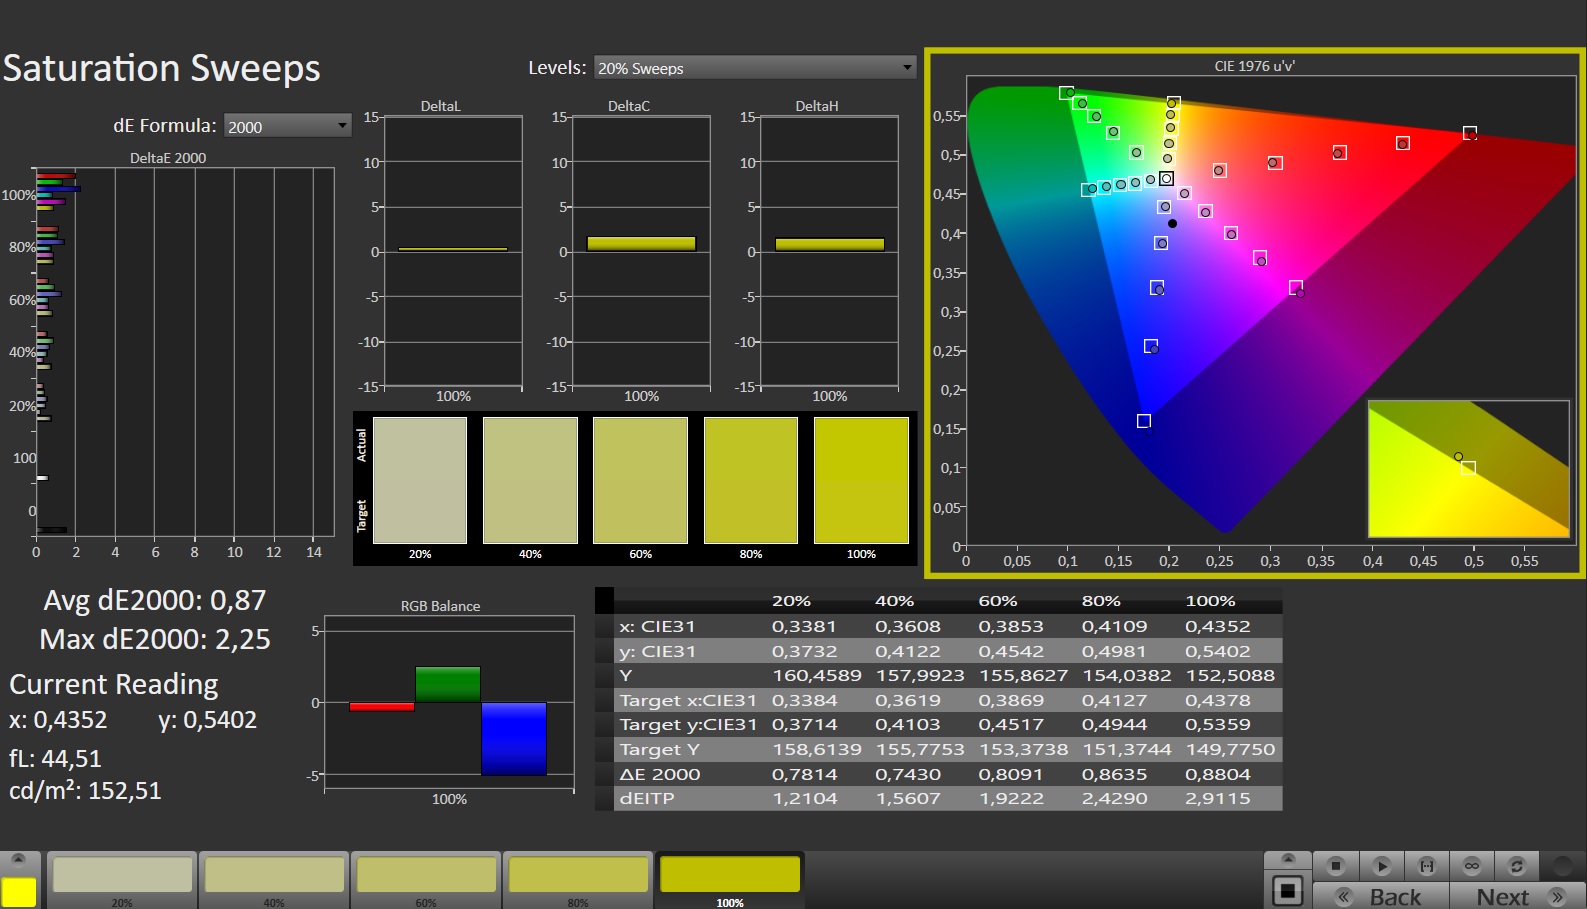
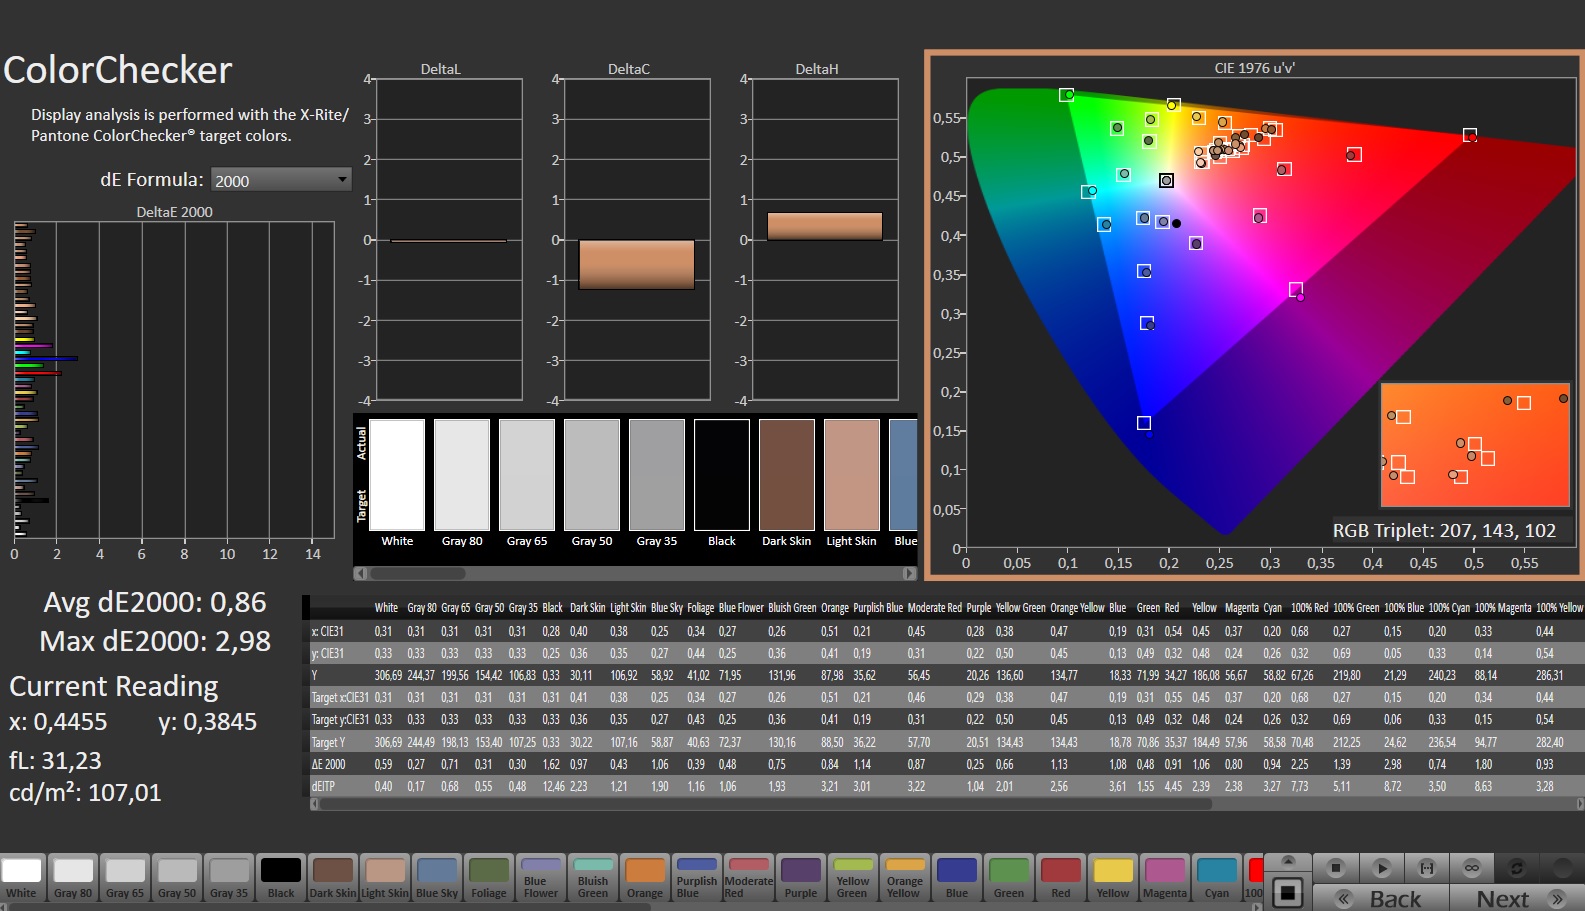
测量的色彩空间覆盖率很好,sRGB色彩空间完全覆盖,达到100%。扩展的AdobeRGB色彩空间被充分覆盖,为84.5%,P3色彩空间为96.7%。

Display Response Times
| ↔ Response Time Black to White | ||
|---|---|---|
| 10.1 ms ... rise ↗ and fall ↘ combined | ↗ 5.3 ms rise | 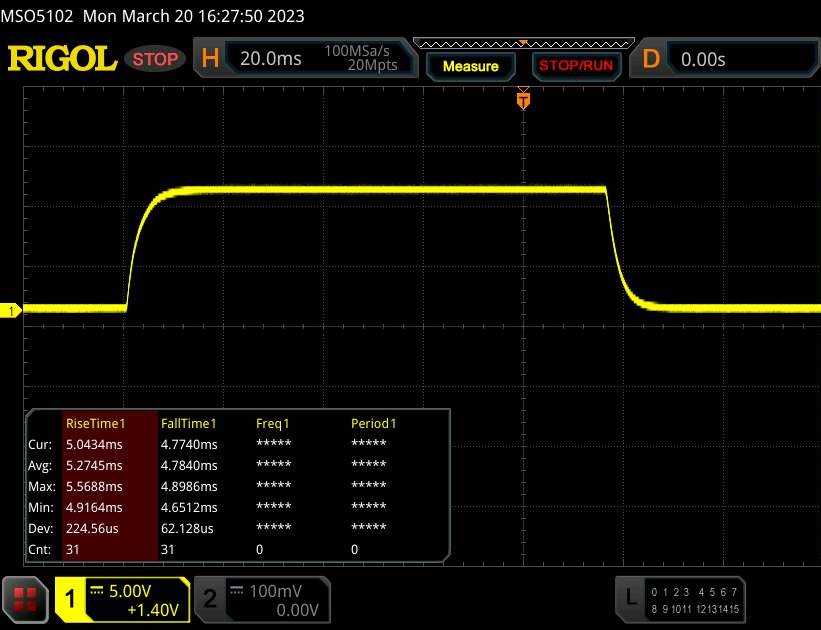 |
| ↘ 4.8 ms fall | ||
| The screen shows good response rates in our tests, but may be too slow for competitive gamers. In comparison, all tested devices range from 0.1 (minimum) to 240 (maximum) ms. » 28 % of all devices are better. This means that the measured response time is better than the average of all tested devices (19.8 ms). | ||
| ↔ Response Time 50% Grey to 80% Grey | ||
| 14 ms ... rise ↗ and fall ↘ combined | ↗ 6.9 ms rise | 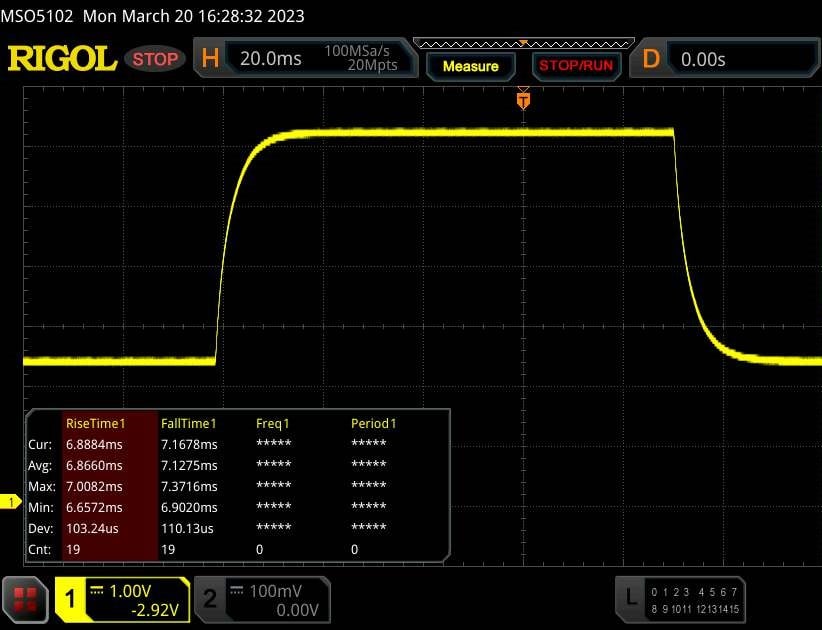 |
| ↘ 7.1 ms fall | ||
| The screen shows good response rates in our tests, but may be too slow for competitive gamers. In comparison, all tested devices range from 0.165 (minimum) to 636 (maximum) ms. » 28 % of all devices are better. This means that the measured response time is better than the average of all tested devices (31 ms). | ||
Screen Flickering / PWM (Pulse-Width Modulation)
| Screen flickering / PWM not detected |  | ||
In comparison: 52 % of all tested devices do not use PWM to dim the display. If PWM was detected, an average of 7754 (minimum: 5 - maximum: 343500) Hz was measured. | |||
相对较低的显示亮度不利于户外使用。然而,在全亮度的情况下,户外工作是可能的,尽管有一些限制。应避免阳光直接照射。
安装的IPS面板在正常使用中提供了出色的图像质量。只有在四个角的图像中会出现轻微起雾的困难。

表演 - 猛禽湖与阿达-洛夫莱斯的结合
Aorus 17X AZF是目前最强大的游戏笔记本之一,在Raptor Lake和Ada Lovelace的推动下提供了出色的性能。该测试装置的配置为3499.99美元。
测试条件
除了典型的性能模式(见表),Aorus 17X AZF的控制中心(Gigabyte Control Center)提供了一个更高级别的AI Boost功能,我们使用了这个功能。然后控制中心选择适当的配置文件--游戏模式和创造者模式用于基准测试, 节能睡眠模式用于电池测试。
涡轮增压模式在个别情况下会启动,使性能小幅提高,但这是有代价的:风扇一直在全功率工作。在会议模式下,设备的工作非常安静,几乎达到了无声的程度。性能因此而明显下降,尽管多线程性能比单线程性能受到的影响更大。
| Creator Modus | Turbo Modus | Gaming Modus | Meeting Modus | Energiespar Ruhemodus | |
|---|---|---|---|---|---|
| 功率限制1 | 86瓦特 | 86瓦特 | 86瓦特 | 15瓦特 | 15瓦特 |
| 功率限制2 | 157瓦 | 157瓦 | 157瓦 | 30瓦 | 30瓦 |
处理器
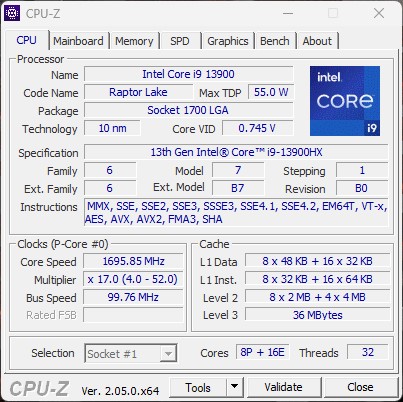
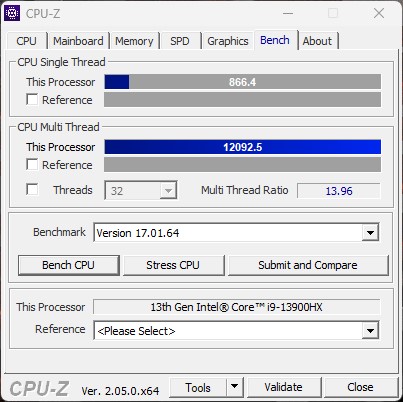
芯片 Intel Core-i7-13900HX-Prozessor(猛禽湖)包括16个高效核心(无超线程,1.6至3.9 GHz)和8个性能核心(超线程,2.2至5.4 GHz)。总共有32个逻辑CPU核心,这在我们的测试中伴随着巨大的多线程性能。在基准测试中,所有竞争者都处于激烈的正面竞争中。然而,在CPU性能评级中,这代表了所提出的基准的平均值,我们的测试装置排在倒数第二位。只有 惠普Omen 17、使用相同的SoC,在这里可以被打败,而 Medion Erazer Beast提供了更好的性能。其他竞争者由于其稍快的SoC而表现更好。然而,与微星GE78HX的差距 微星GE78HX的差距是可控的,只有12%。
CB15循环测试表明,CPU的提升只在开始时被利用。模拟的永久性多线程负载导致时钟在第一次运行后略有下降,尽管从第三次运行开始性能保持稳定。
Cinebench R15 Multi Sustained Load
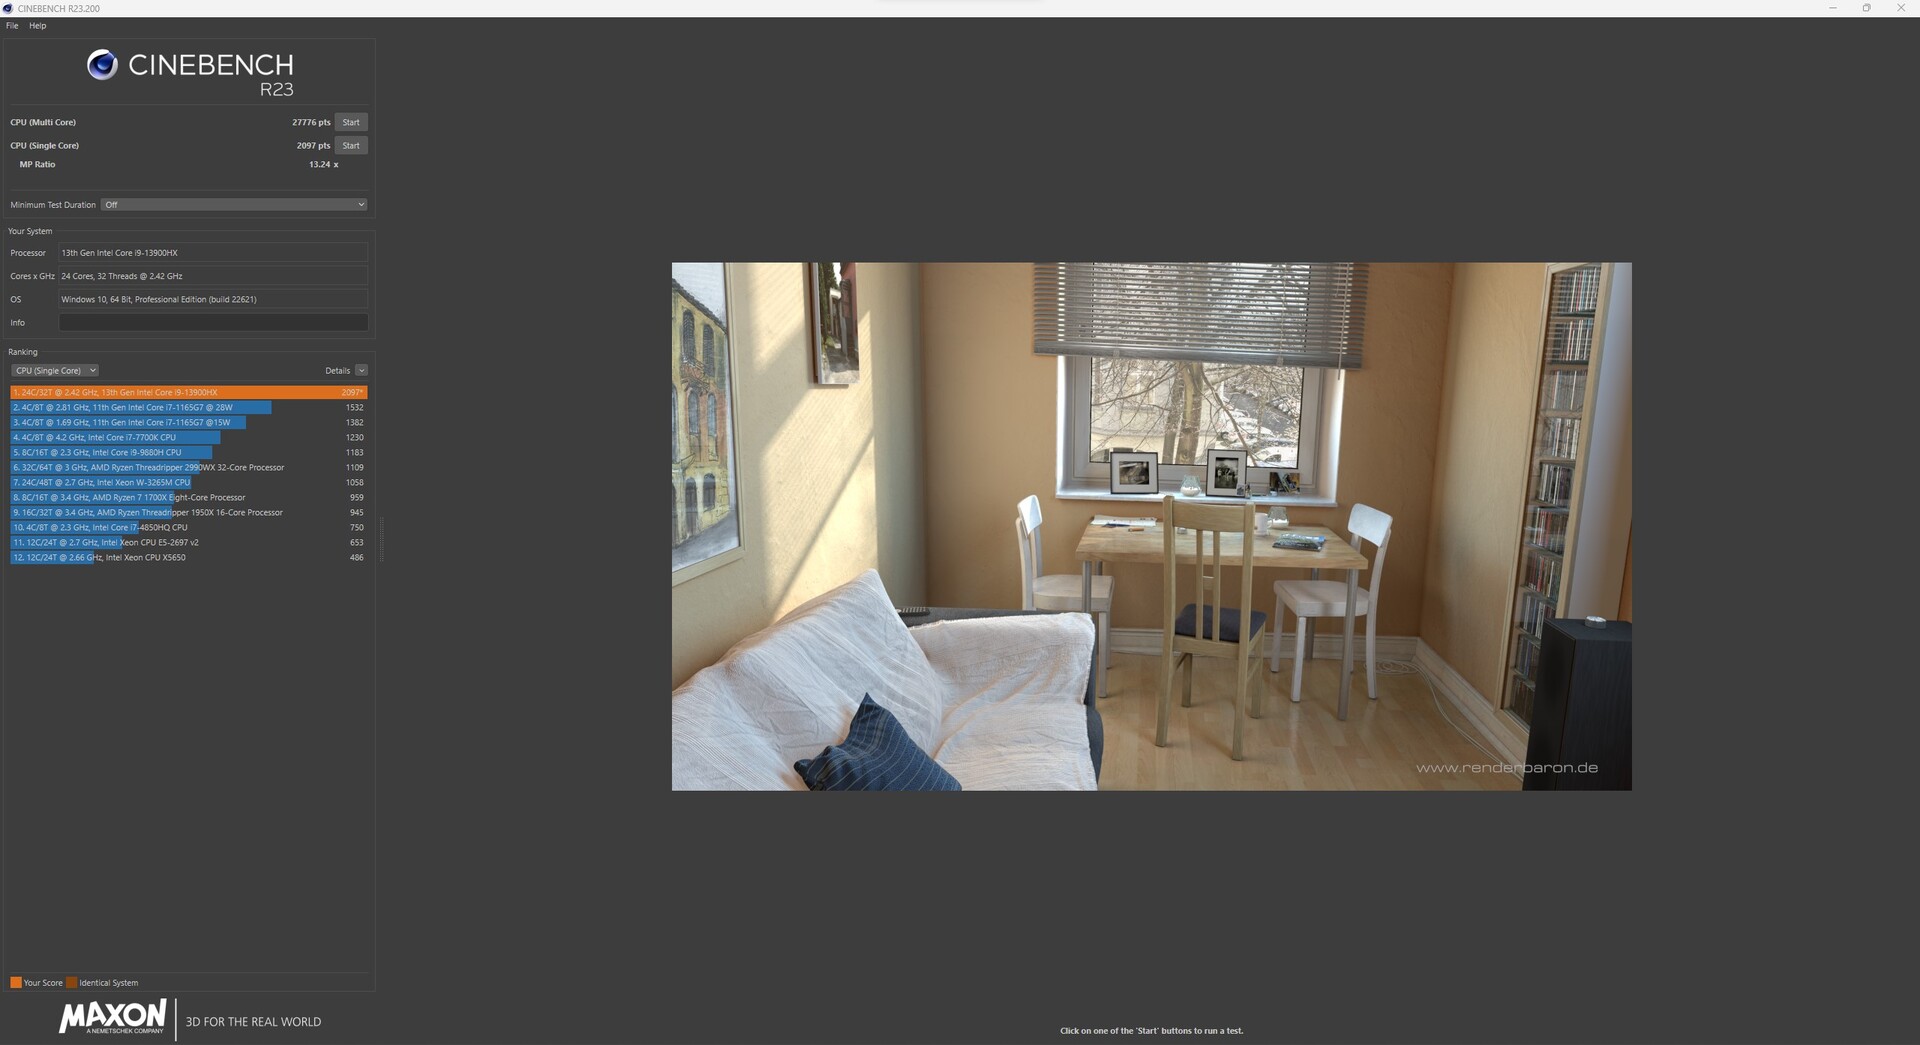
Cinebench R23: Multi Core | Single Core
Cinebench R20: CPU (Multi Core) | CPU (Single Core)
Cinebench R15: CPU Multi 64Bit | CPU Single 64Bit
Blender: v2.79 BMW27 CPU
7-Zip 18.03: 7z b 4 | 7z b 4 -mmt1
Geekbench 5.5: Multi-Core | Single-Core
HWBOT x265 Benchmark v2.2: 4k Preset
LibreOffice : 20 Documents To PDF
R Benchmark 2.5: Overall mean
| CPU Performance rating | |
| MSI GE78HX 13VH-070US | |
| Alienware m18 R1 | |
| MSI Titan GT77 HX 13VI | |
| Medion Erazer Beast X40 | |
| Average Intel Core i9-13900HX | |
| Aorus 17X AZF | |
| HP Omen 17-ck2097ng | |
| Average of class Gaming | |
| Cinebench R23 / Multi Core | |
| MSI Titan GT77 HX 13VI | |
| MSI GE78HX 13VH-070US | |
| Alienware m18 R1 | |
| Medion Erazer Beast X40 | |
| Average Intel Core i9-13900HX (24270 - 32623, n=23) | |
| Aorus 17X AZF | |
| HP Omen 17-ck2097ng | |
| Average of class Gaming (10488 - 42661, n=107, last 2 years) | |
| Cinebench R23 / Single Core | |
| MSI GE78HX 13VH-070US | |
| Alienware m18 R1 | |
| MSI Titan GT77 HX 13VI | |
| Aorus 17X AZF | |
| HP Omen 17-ck2097ng | |
| Average Intel Core i9-13900HX (1867 - 2105, n=20) | |
| Medion Erazer Beast X40 | |
| Average of class Gaming (1166 - 2415, n=107, last 2 years) | |
| Cinebench R20 / CPU (Multi Core) | |
| MSI Titan GT77 HX 13VI | |
| MSI GE78HX 13VH-070US | |
| Alienware m18 R1 | |
| Medion Erazer Beast X40 | |
| Average Intel Core i9-13900HX (9152 - 12541, n=21) | |
| Aorus 17X AZF | |
| Average of class Gaming (4029 - 16433, n=106, last 2 years) | |
| HP Omen 17-ck2097ng | |
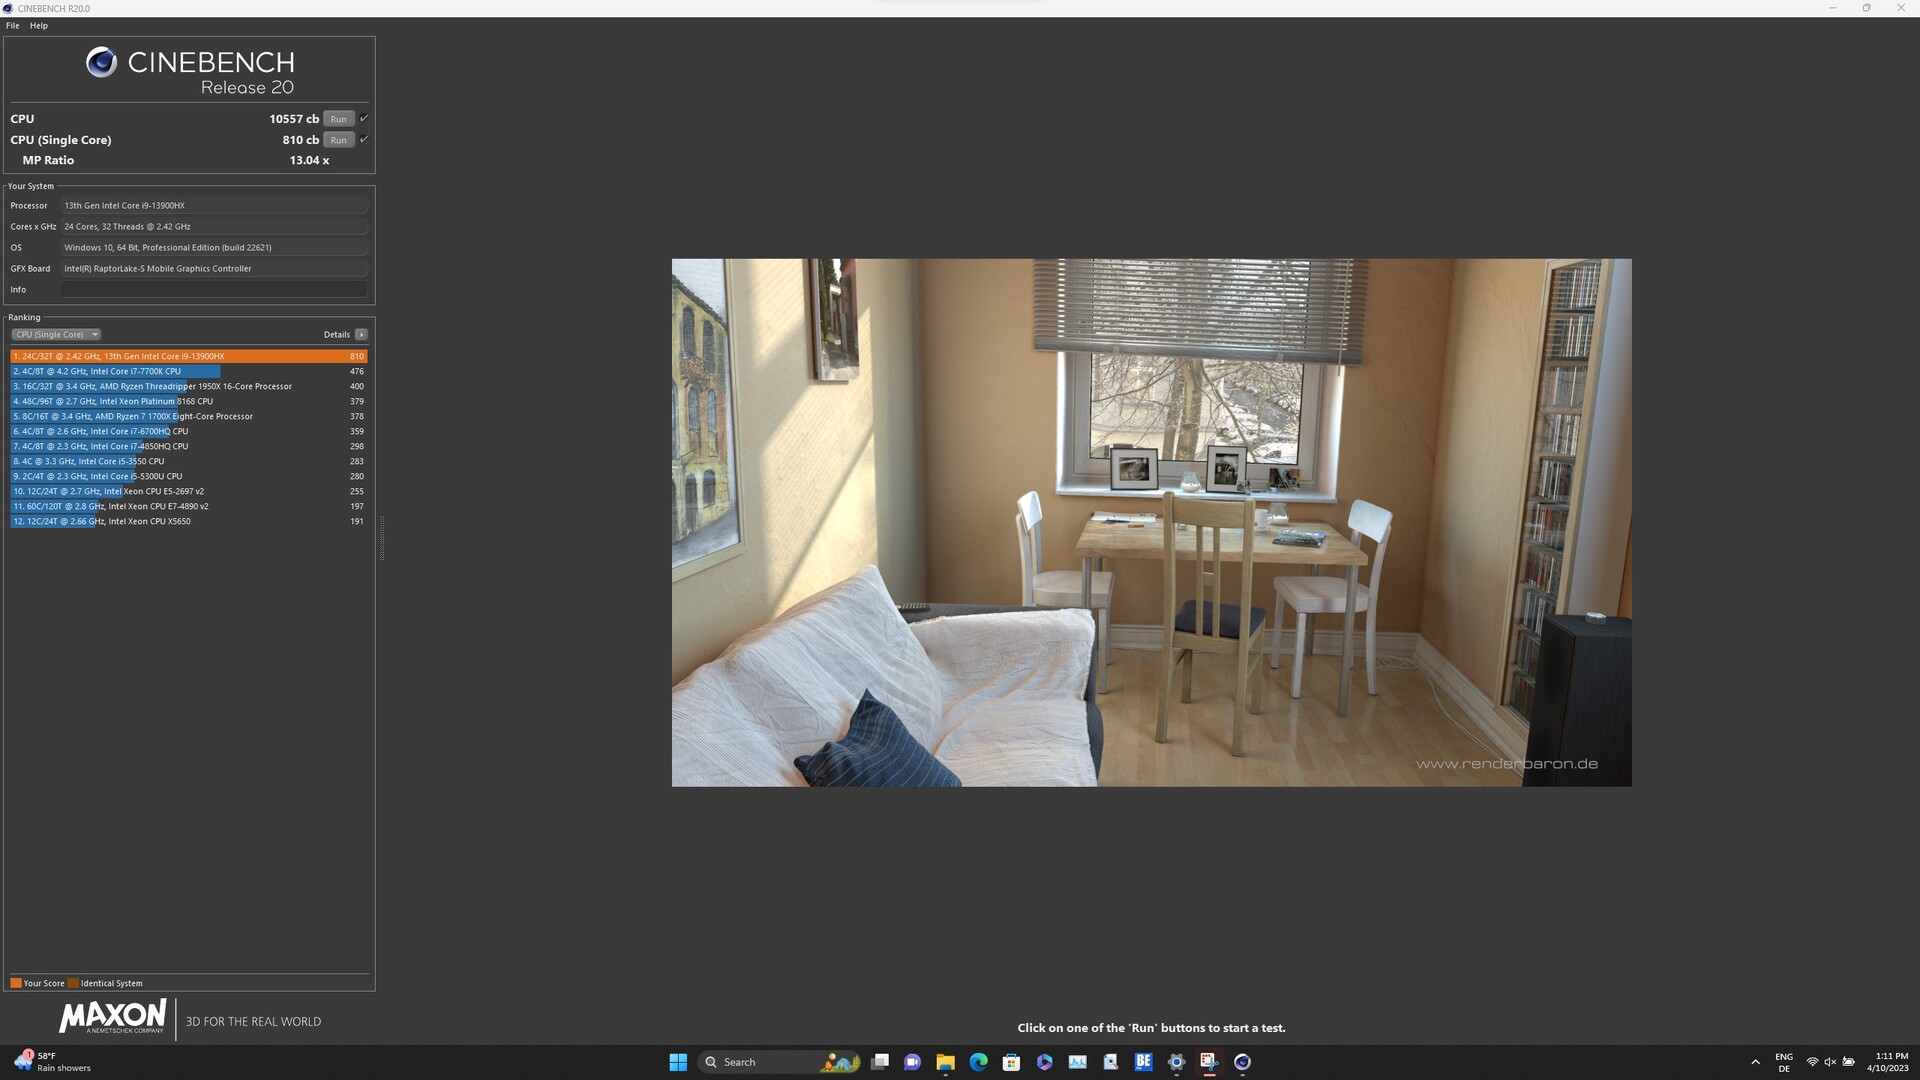
| Cinebench R20 / CPU (Single Core) | |
| Aorus 17X AZF | |
| Alienware m18 R1 | |
| HP Omen 17-ck2097ng | |
| MSI Titan GT77 HX 13VI | |
| MSI GE78HX 13VH-070US | |
| Average Intel Core i9-13900HX (722 - 810, n=21) | |
| Medion Erazer Beast X40 | |
| Average of class Gaming (442 - 913, n=106, last 2 years) | |
| Cinebench R15 / CPU Multi 64Bit | |
| MSI Titan GT77 HX 13VI | |
| MSI GE78HX 13VH-070US | |
| Alienware m18 R1 | |
| Medion Erazer Beast X40 | |
| Average Intel Core i9-13900HX (3913 - 4970, n=22) | |
| Aorus 17X AZF | |
| HP Omen 17-ck2097ng | |
| Average of class Gaming (1578 - 6330, n=105, last 2 years) | |
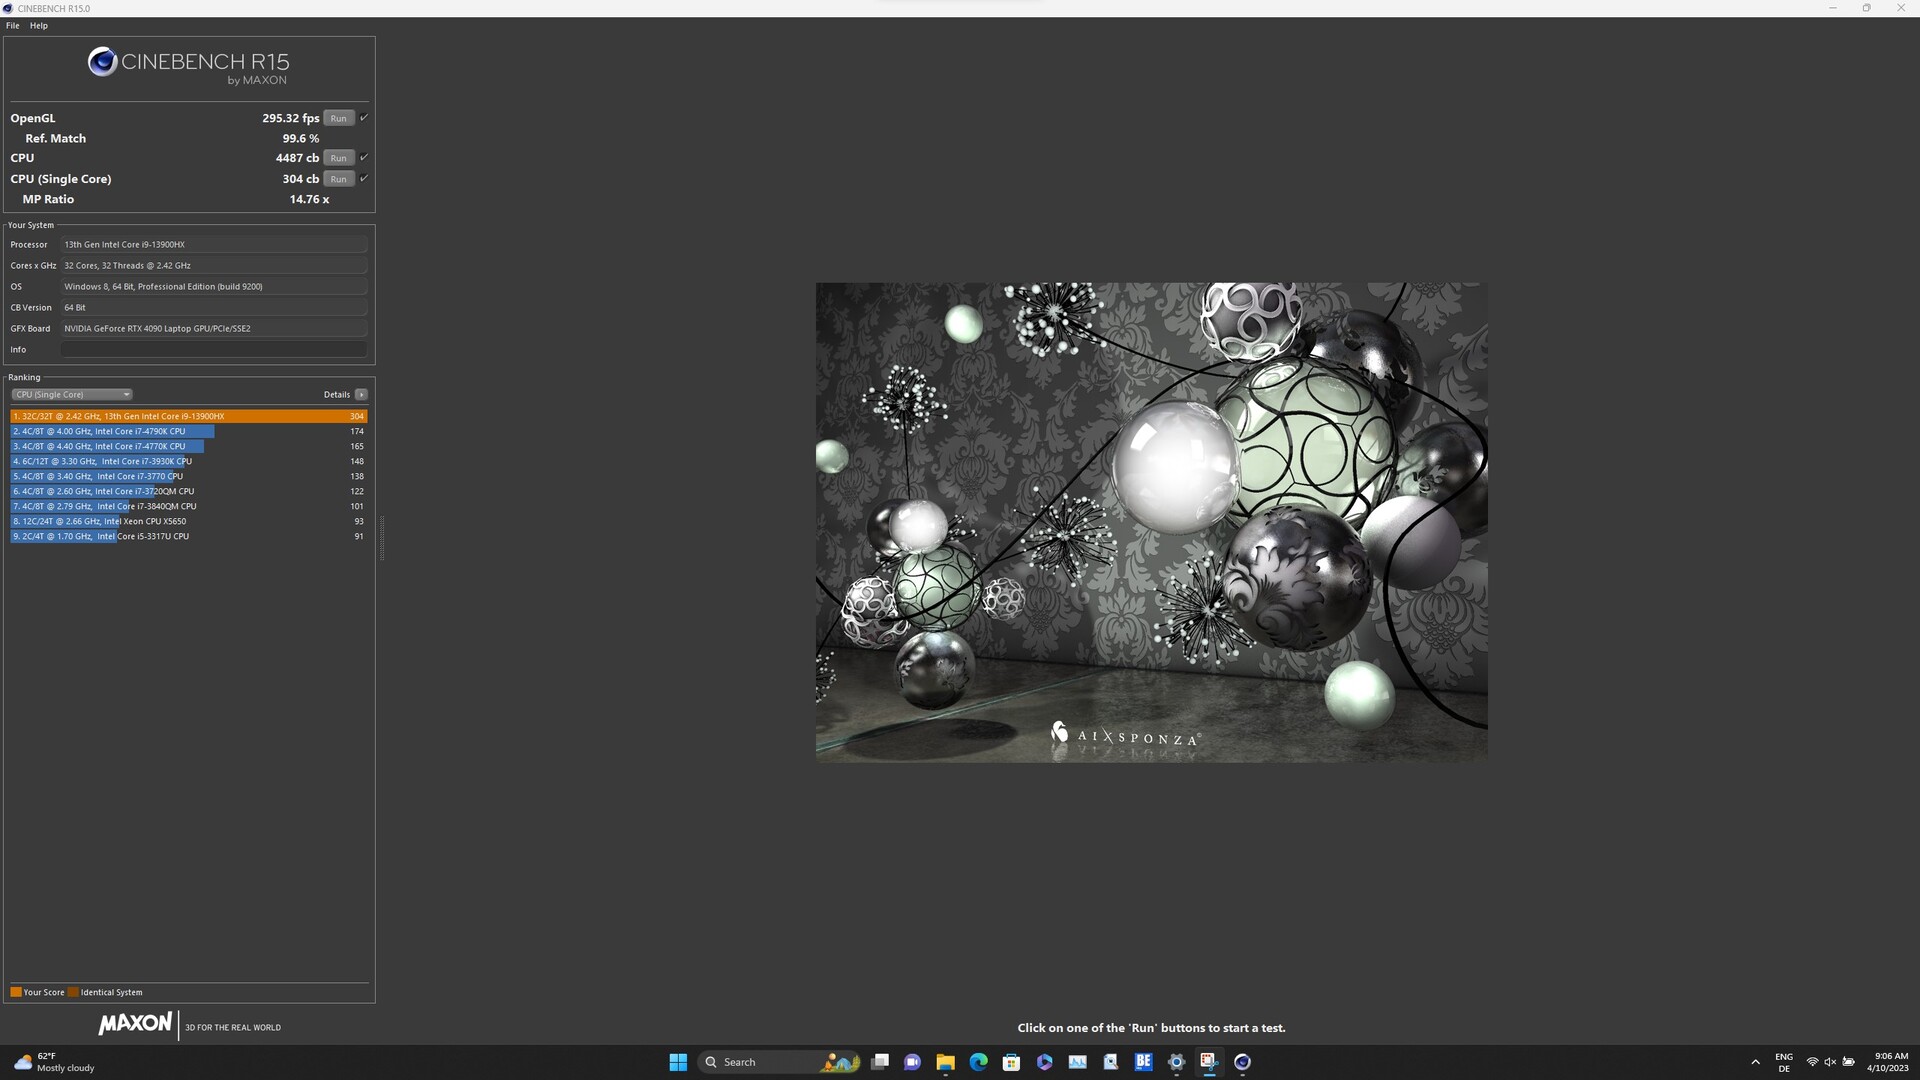
| Cinebench R15 / CPU Single 64Bit | |
| Aorus 17X AZF | |
| MSI GE78HX 13VH-070US | |
| Alienware m18 R1 | |
| HP Omen 17-ck2097ng | |
| MSI Titan GT77 HX 13VI | |
| Medion Erazer Beast X40 | |
| Average of class Gaming (188.8 - 350, n=106, last 2 years) | |
| Average Intel Core i9-13900HX (247 - 304, n=22) | |
| Blender / v2.79 BMW27 CPU | |
| HP Omen 17-ck2097ng | |
| Average of class Gaming (79 - 330, n=104, last 2 years) | |
| Aorus 17X AZF | |
| Average Intel Core i9-13900HX (101 - 153, n=22) | |
| Medion Erazer Beast X40 | |
| MSI GE78HX 13VH-070US | |
| MSI Titan GT77 HX 13VI | |
| Alienware m18 R1 | |
| 7-Zip 18.03 / 7z b 4 | |
| Alienware m18 R1 | |
| MSI Titan GT77 HX 13VI | |
| MSI GE78HX 13VH-070US | |
| Medion Erazer Beast X40 | |
| Average Intel Core i9-13900HX (90675 - 127283, n=21) | |
| HP Omen 17-ck2097ng | |
| Aorus 17X AZF | |
| Average of class Gaming (33491 - 148086, n=105, last 2 years) | |
| 7-Zip 18.03 / 7z b 4 -mmt1 | |
| Aorus 17X AZF | |
| MSI GE78HX 13VH-070US | |
| HP Omen 17-ck2097ng | |
| MSI Titan GT77 HX 13VI | |
| Medion Erazer Beast X40 | |
| Alienware m18 R1 | |
| Average Intel Core i9-13900HX (6340 - 7177, n=21) | |
| Average of class Gaming (4199 - 7436, n=105, last 2 years) | |
| Geekbench 5.5 / Multi-Core | |
| Alienware m18 R1 | |
| MSI GE78HX 13VH-070US | |
| MSI Titan GT77 HX 13VI | |
| HP Omen 17-ck2097ng | |
| Medion Erazer Beast X40 | |
| Average Intel Core i9-13900HX (17614 - 21075, n=22) | |
| Aorus 17X AZF | |
| Average of class Gaming (6460 - 28263, n=105, last 2 years) | |
| Geekbench 5.5 / Single-Core | |
| MSI GE78HX 13VH-070US | |
| HP Omen 17-ck2097ng | |
| Aorus 17X AZF | |
| Alienware m18 R1 | |
| Average of class Gaming (986 - 2474, n=105, last 2 years) | |
| MSI Titan GT77 HX 13VI | |
| Medion Erazer Beast X40 | |
| Average Intel Core i9-13900HX (1345 - 2093, n=22) | |
| HWBOT x265 Benchmark v2.2 / 4k Preset | |
| MSI GE78HX 13VH-070US | |
| Alienware m18 R1 | |
| MSI Titan GT77 HX 13VI | |
| Medion Erazer Beast X40 | |
| Average Intel Core i9-13900HX (23.5 - 34.4, n=22) | |
| Average of class Gaming (11.5 - 44.4, n=105, last 2 years) | |
| HP Omen 17-ck2097ng | |
| Aorus 17X AZF | |
| LibreOffice / 20 Documents To PDF | |
| Average of class Gaming (33.2 - 88.8, n=105, last 2 years) | |
| MSI GE78HX 13VH-070US | |
| Alienware m18 R1 | |
| MSI Titan GT77 HX 13VI | |
| Aorus 17X AZF | |
| HP Omen 17-ck2097ng | |
| Medion Erazer Beast X40 | |
| Average Intel Core i9-13900HX (32.8 - 51.1, n=21) | |
| R Benchmark 2.5 / Overall mean | |
| Average of class Gaming (0.3439 - 0.759, n=106, last 2 years) | |
| MSI Titan GT77 HX 13VI | |
| Average Intel Core i9-13900HX (0.375 - 0.4564, n=22) | |
| Medion Erazer Beast X40 | |
| Aorus 17X AZF | |
| Alienware m18 R1 | |
| HP Omen 17-ck2097ng | |
| MSI GE78HX 13VH-070US | |
* ... smaller is better
AIDA64: FP32 Ray-Trace | FPU Julia | CPU SHA3 | CPU Queen | FPU SinJulia | FPU Mandel | CPU AES | CPU ZLib | FP64 Ray-Trace | CPU PhotoWorxx
| Performance rating | |
| Alienware m18 R1 | |
| MSI GE78HX 13VH-070US | |
| MSI Titan GT77 HX 13VI | |
| Medion Erazer Beast X40 | |
| Average of class Gaming | |
| Average Intel Core i9-13900HX | |
| Aorus 17X AZF | |
| HP Omen 17-ck2097ng | |
| AIDA64 / FP32 Ray-Trace | |
| Average of class Gaming (10227 - 85542, n=105, last 2 years) | |
| Alienware m18 R1 | |
| MSI Titan GT77 HX 13VI | |
| MSI GE78HX 13VH-070US | |
| Medion Erazer Beast X40 | |
| Average Intel Core i9-13900HX (17589 - 27615, n=22) | |
| Aorus 17X AZF | |
| HP Omen 17-ck2097ng | |
| AIDA64 / FPU Julia | |
| Alienware m18 R1 | |
| MSI Titan GT77 HX 13VI | |
| MSI GE78HX 13VH-070US | |
| Average of class Gaming (51376 - 238426, n=105, last 2 years) | |
| Medion Erazer Beast X40 | |
| Average Intel Core i9-13900HX (88686 - 137015, n=22) | |
| Aorus 17X AZF | |
| HP Omen 17-ck2097ng | |
| AIDA64 / CPU SHA3 | |
| Alienware m18 R1 | |
| MSI Titan GT77 HX 13VI | |
| MSI GE78HX 13VH-070US | |
| Medion Erazer Beast X40 | |
| Average of class Gaming (2180 - 10115, n=105, last 2 years) | |
| Average Intel Core i9-13900HX (4362 - 7029, n=22) | |
| Aorus 17X AZF | |
| HP Omen 17-ck2097ng | |
| AIDA64 / CPU Queen | |
| Alienware m18 R1 | |
| MSI GE78HX 13VH-070US | |
| MSI Titan GT77 HX 13VI | |
| HP Omen 17-ck2097ng | |
| Average Intel Core i9-13900HX (125644 - 141385, n=22) | |
| Medion Erazer Beast X40 | |
| Aorus 17X AZF | |
| Average of class Gaming (49785 - 173351, n=90, last 2 years) | |
| AIDA64 / FPU SinJulia | |
| MSI Titan GT77 HX 13VI | |
| MSI GE78HX 13VH-070US | |
| Alienware m18 R1 | |
| Medion Erazer Beast X40 | |
| Average Intel Core i9-13900HX (12334 - 17179, n=22) | |
| Average of class Gaming (4424 - 33636, n=105, last 2 years) | |
| Aorus 17X AZF | |
| HP Omen 17-ck2097ng | |
| AIDA64 / FPU Mandel | |
| Alienware m18 R1 | |
| Average of class Gaming (25115 - 128721, n=105, last 2 years) | |
| MSI Titan GT77 HX 13VI | |
| MSI GE78HX 13VH-070US | |
| Medion Erazer Beast X40 | |
| Average Intel Core i9-13900HX (43850 - 69202, n=22) | |
| Aorus 17X AZF | |
| HP Omen 17-ck2097ng | |
| AIDA64 / CPU AES | |
| Aorus 17X AZF | |
| Average Intel Core i9-13900HX (89413 - 237881, n=22) | |
| MSI Titan GT77 HX 13VI | |
| Alienware m18 R1 | |
| MSI GE78HX 13VH-070US | |
| Medion Erazer Beast X40 | |
| Average of class Gaming (39258 - 247074, n=105, last 2 years) | |
| HP Omen 17-ck2097ng | |
| AIDA64 / CPU ZLib | |
| MSI GE78HX 13VH-070US | |
| MSI Titan GT77 HX 13VI | |
| Alienware m18 R1 | |
| Medion Erazer Beast X40 | |
| Average Intel Core i9-13900HX (1284 - 1958, n=22) | |
| Average of class Gaming (574 - 2531, n=105, last 2 years) | |
| Aorus 17X AZF | |
| HP Omen 17-ck2097ng | |
| AIDA64 / FP64 Ray-Trace | |
| Average of class Gaming (5509 - 45446, n=105, last 2 years) | |
| Alienware m18 R1 | |
| MSI Titan GT77 HX 13VI | |
| MSI GE78HX 13VH-070US | |
| Medion Erazer Beast X40 | |
| Average Intel Core i9-13900HX (9481 - 15279, n=22) | |
| Aorus 17X AZF | |
| HP Omen 17-ck2097ng | |
| AIDA64 / CPU PhotoWorxx | |
| Alienware m18 R1 | |
| HP Omen 17-ck2097ng | |
| Aorus 17X AZF | |
| MSI GE78HX 13VH-070US | |
| Average Intel Core i9-13900HX (42994 - 51994, n=22) | |
| Average of class Gaming (12271 - 89891, n=105, last 2 years) | |
| Medion Erazer Beast X40 | |
| MSI Titan GT77 HX 13VI | |
系统性能
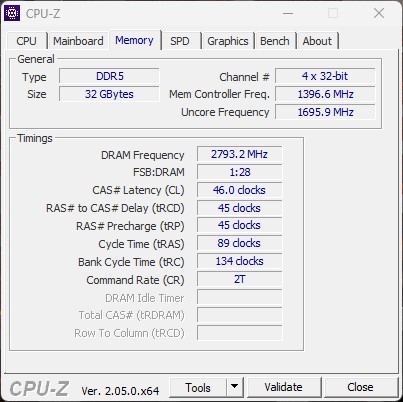
在系统性能基准测试中,Aorus 17X AZF的排名与CPU测试相似。然而,系统性能非常好,远高于过去两年中游戏笔记本的平均水平。在AIDA64基准测试中,由于快速的DDR5内存,Aorus 17X AZF提供了完美的结果,这使我们的评测装置在第二位,仅次于阿利安人m18 R1.
CrossMark: Overall | Productivity | Creativity | Responsiveness
| PCMark 10 / Score | |
| MSI Titan GT77 HX 13VI | |
| MSI GE78HX 13VH-070US | |
| Alienware m18 R1 | |
| Average Intel Core i9-13900HX, NVIDIA GeForce RTX 4090 Laptop GPU (7690 - 9331, n=8) | |
| Average of class Gaming (5828 - 12414, n=93, last 2 years) | |
| Medion Erazer Beast X40 | |
| Aorus 17X AZF | |
| HP Omen 17-ck2097ng | |
| PCMark 10 / Essentials | |
| HP Omen 17-ck2097ng | |
| MSI Titan GT77 HX 13VI | |
| MSI GE78HX 13VH-070US | |
| Average Intel Core i9-13900HX, NVIDIA GeForce RTX 4090 Laptop GPU (10972 - 11983, n=8) | |
| Medion Erazer Beast X40 | |
| Alienware m18 R1 | |
| Aorus 17X AZF | |
| Average of class Gaming (8810 - 11935, n=97, last 2 years) | |
| PCMark 10 / Productivity | |
| Medion Erazer Beast X40 | |
| Average of class Gaming (6845 - 25323, n=95, last 2 years) | |
| MSI GE78HX 13VH-070US | |
| Average Intel Core i9-13900HX, NVIDIA GeForce RTX 4090 Laptop GPU (9038 - 11680, n=8) | |
| Aorus 17X AZF | |
| Alienware m18 R1 | |
| HP Omen 17-ck2097ng | |
| MSI Titan GT77 HX 13VI | |
| PCMark 10 / Digital Content Creation | |
| MSI Titan GT77 HX 13VI | |
| Alienware m18 R1 | |
| MSI GE78HX 13VH-070US | |
| Average of class Gaming (7602 - 19954, n=95, last 2 years) | |
| Average Intel Core i9-13900HX, NVIDIA GeForce RTX 4090 Laptop GPU (10605 - 16395, n=8) | |
| Medion Erazer Beast X40 | |
| Aorus 17X AZF | |
| HP Omen 17-ck2097ng | |
| CrossMark / Overall | |
| Alienware m18 R1 | |
| Aorus 17X AZF | |
| MSI Titan GT77 HX 13VI | |
| Medion Erazer Beast X40 | |
| Average Intel Core i9-13900HX, NVIDIA GeForce RTX 4090 Laptop GPU (1825 - 2295, n=8) | |
| HP Omen 17-ck2097ng | |
| Average of class Gaming (1366 - 2409, n=94, last 2 years) | |
| MSI GE78HX 13VH-070US | |
| CrossMark / Productivity | |
| Aorus 17X AZF | |
| Alienware m18 R1 | |
| Medion Erazer Beast X40 | |
| MSI Titan GT77 HX 13VI | |
| Average Intel Core i9-13900HX, NVIDIA GeForce RTX 4090 Laptop GPU (1666 - 2166, n=8) | |
| Average of class Gaming (1386 - 2254, n=94, last 2 years) | |
| MSI GE78HX 13VH-070US | |
| HP Omen 17-ck2097ng | |
| CrossMark / Creativity | |
| Alienware m18 R1 | |
| MSI Titan GT77 HX 13VI | |
| Medion Erazer Beast X40 | |
| Average Intel Core i9-13900HX, NVIDIA GeForce RTX 4090 Laptop GPU (2162 - 2514, n=8) | |
| Aorus 17X AZF | |
| Average of class Gaming (1343 - 2786, n=94, last 2 years) | |
| HP Omen 17-ck2097ng | |
| MSI GE78HX 13VH-070US | |
| CrossMark / Responsiveness | |
| Aorus 17X AZF | |
| Alienware m18 R1 | |
| MSI Titan GT77 HX 13VI | |
| Medion Erazer Beast X40 | |
| Average Intel Core i9-13900HX, NVIDIA GeForce RTX 4090 Laptop GPU (1441 - 2275, n=8) | |
| HP Omen 17-ck2097ng | |
| Average of class Gaming (1226 - 2334, n=94, last 2 years) | |
| MSI GE78HX 13VH-070US | |
| PCMark 10 Score | 7690 points | |
Help | ||
| AIDA64 / Memory Copy | |
| Alienware m18 R1 | |
| Aorus 17X AZF | |
| HP Omen 17-ck2097ng | |
| MSI GE78HX 13VH-070US | |
| Average Intel Core i9-13900HX (67716 - 79193, n=22) | |
| Average of class Gaming (21750 - 129946, n=105, last 2 years) | |
| Medion Erazer Beast X40 | |
| MSI Titan GT77 HX 13VI | |
| AIDA64 / Memory Read | |
| Alienware m18 R1 | |
| Aorus 17X AZF | |
| HP Omen 17-ck2097ng | |
| MSI GE78HX 13VH-070US | |
| Average Intel Core i9-13900HX (73998 - 88462, n=22) | |
| Medion Erazer Beast X40 | |
| Average of class Gaming (22956 - 118858, n=105, last 2 years) | |
| MSI Titan GT77 HX 13VI | |
| AIDA64 / Memory Write | |
| Alienware m18 R1 | |
| HP Omen 17-ck2097ng | |
| Aorus 17X AZF | |
| MSI GE78HX 13VH-070US | |
| Average of class Gaming (22297 - 135096, n=105, last 2 years) | |
| Average Intel Core i9-13900HX (65472 - 77045, n=22) | |
| Medion Erazer Beast X40 | |
| MSI Titan GT77 HX 13VI | |
| AIDA64 / Memory Latency | |
| Average of class Gaming (75.3 - 259, n=105, last 2 years) | |
| MSI Titan GT77 HX 13VI | |
| Medion Erazer Beast X40 | |
| Average Intel Core i9-13900HX (75.3 - 91.1, n=22) | |
| HP Omen 17-ck2097ng | |
| MSI GE78HX 13VH-070US | |
| Aorus 17X AZF | |
| Alienware m18 R1 | |
* ... smaller is better
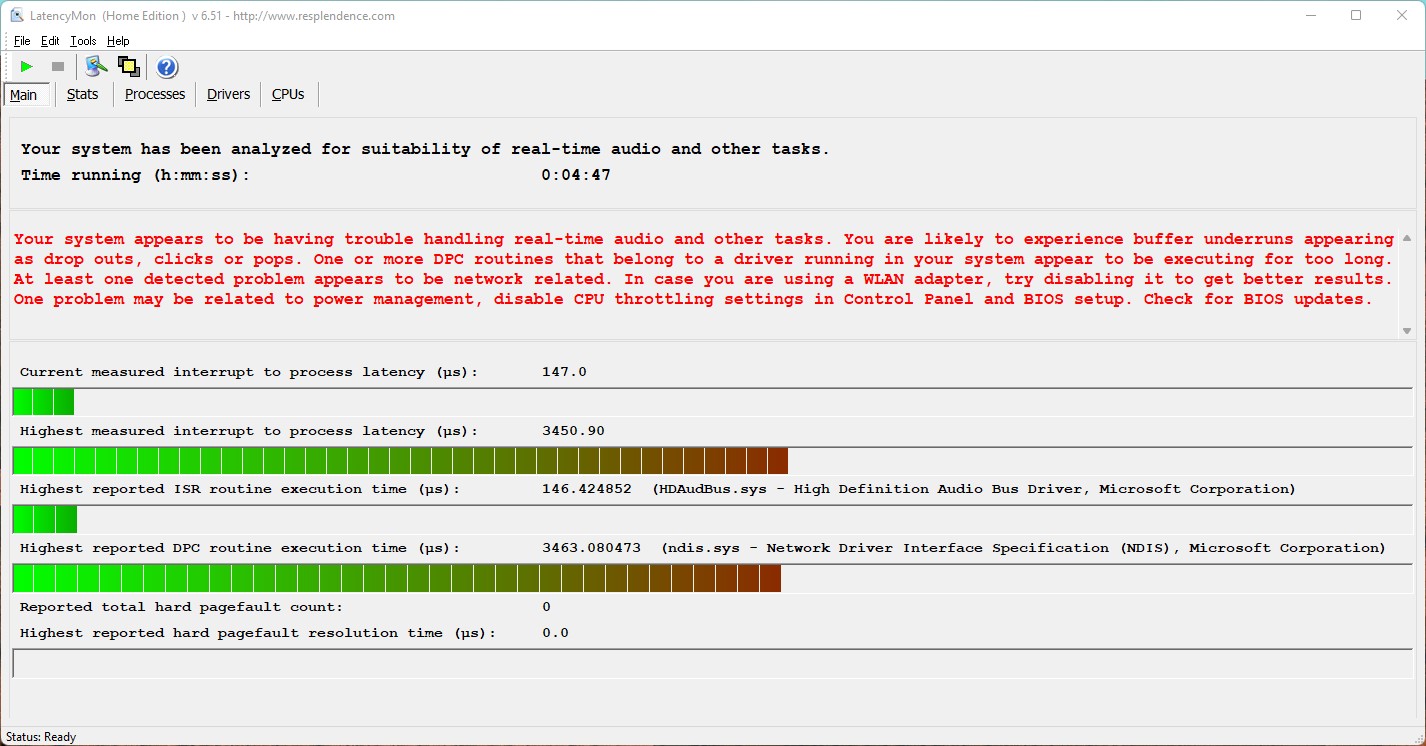
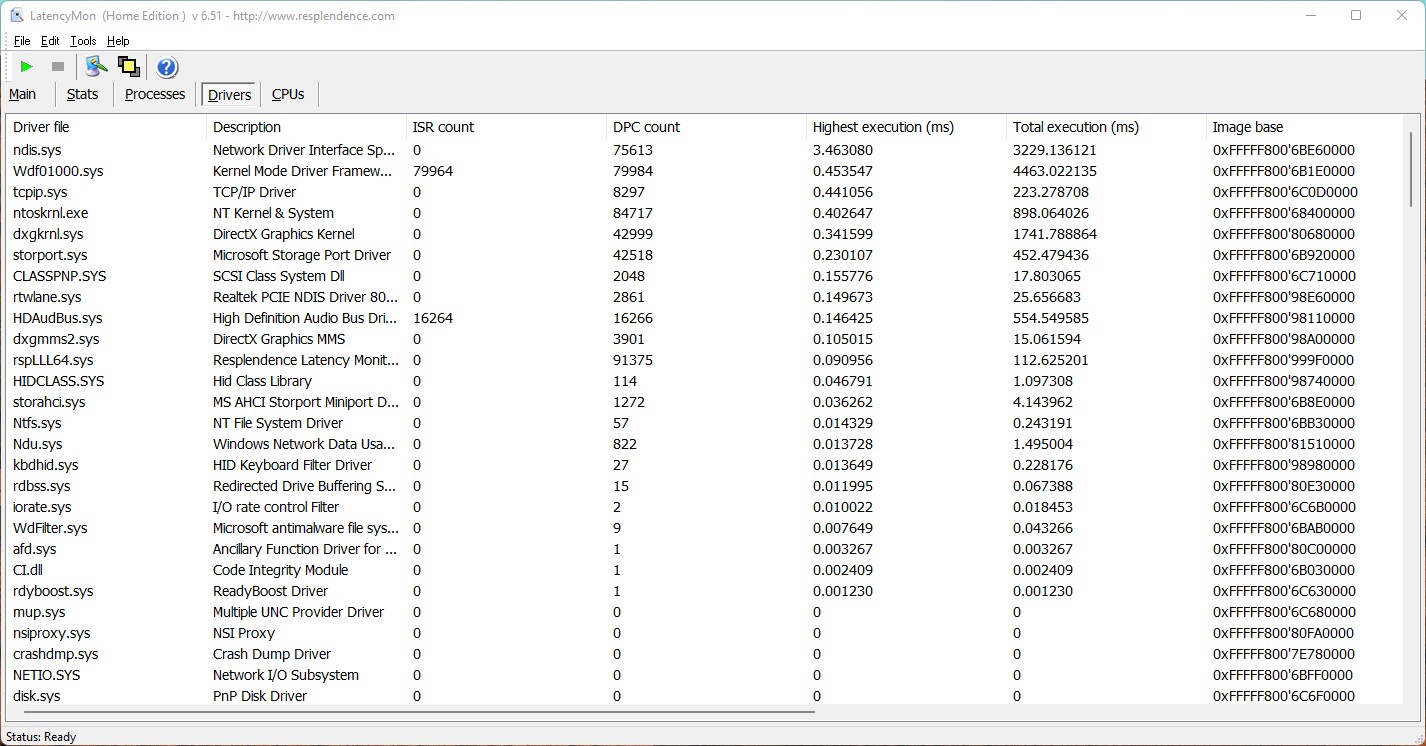
DPC延迟
我们的标准化延迟监测测试(网络冲浪、4k视频播放、Prime95高负荷)显示了Aorus 17X AZF的极端值。未来的软件更新应该会改善这一点,从而使该系统适合于实时视频和音频编辑,不受限制。
| DPC Latencies / LatencyMon - interrupt to process latency (max), Web, Youtube, Prime95 | |
| Aorus 17X AZF | |
| MSI Titan GT77 HX 13VI | |
| MSI GE78HX 13VH-070US | |
| Alienware m18 R1 | |
| Medion Erazer Beast X40 | |
| HP Omen 17-ck2097ng | |
* ... smaller is better
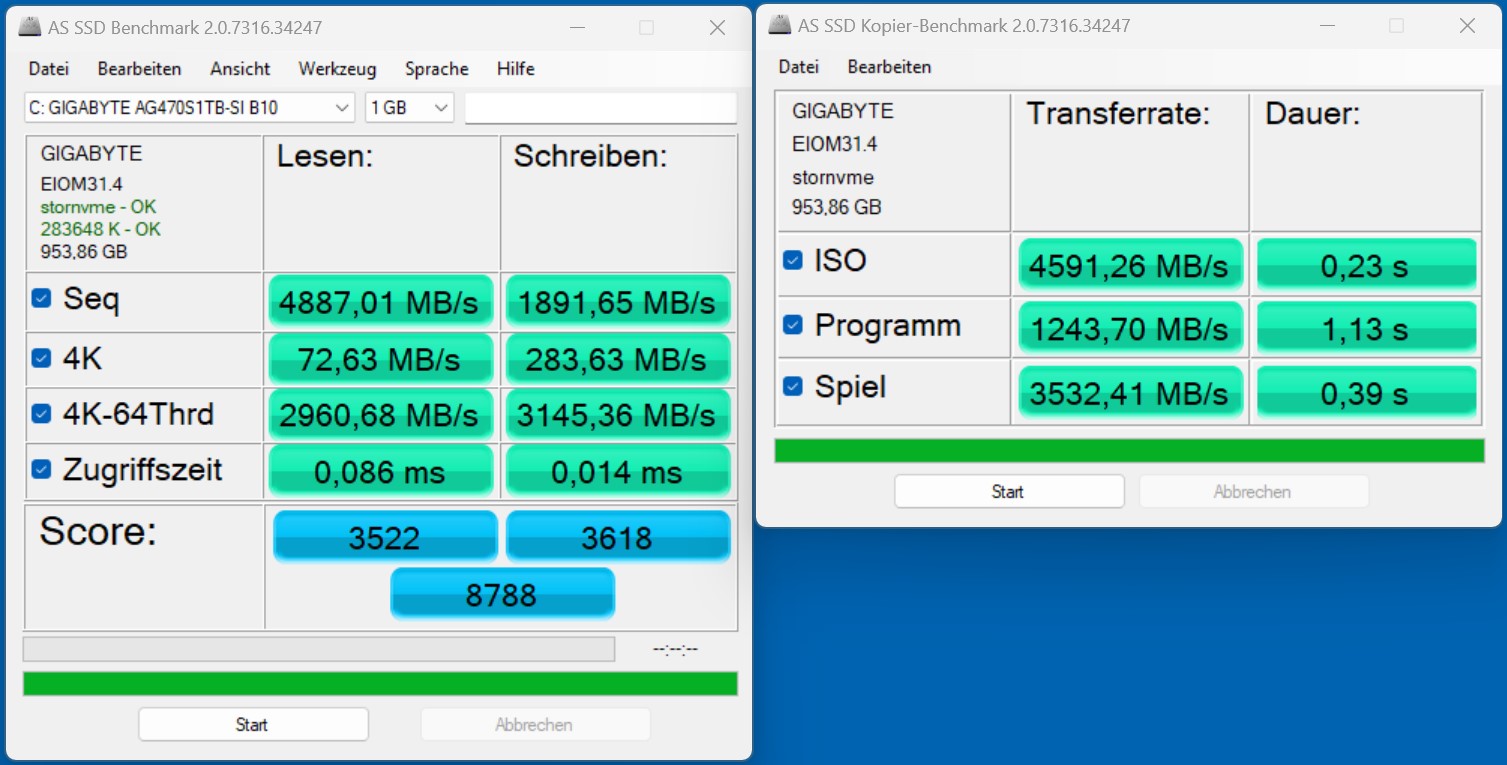
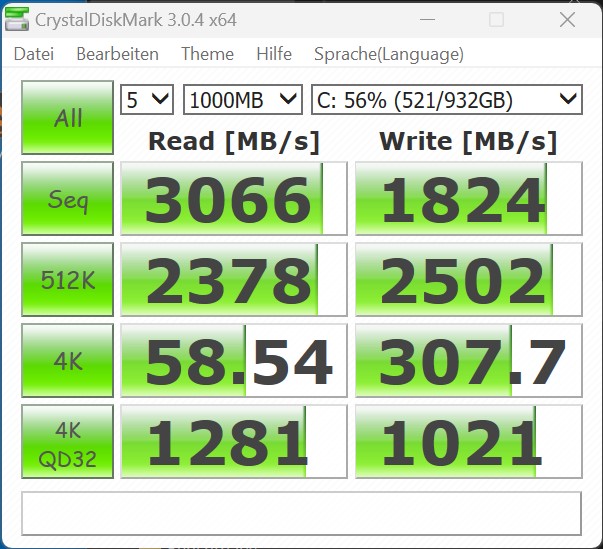
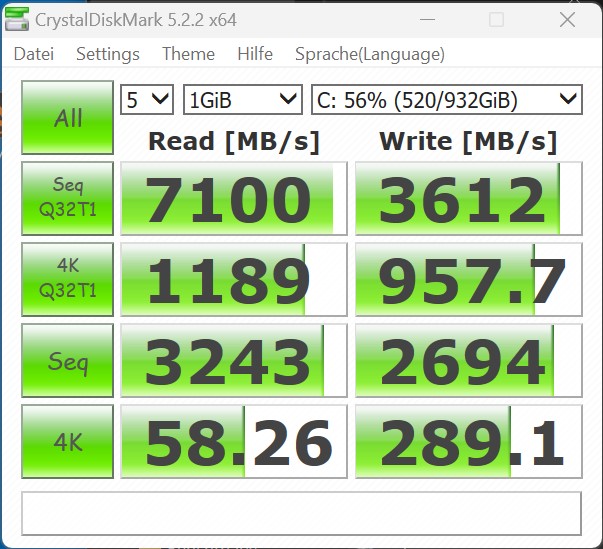
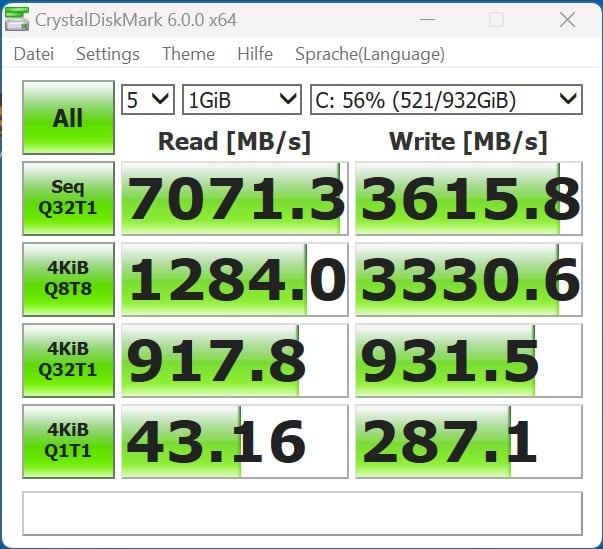
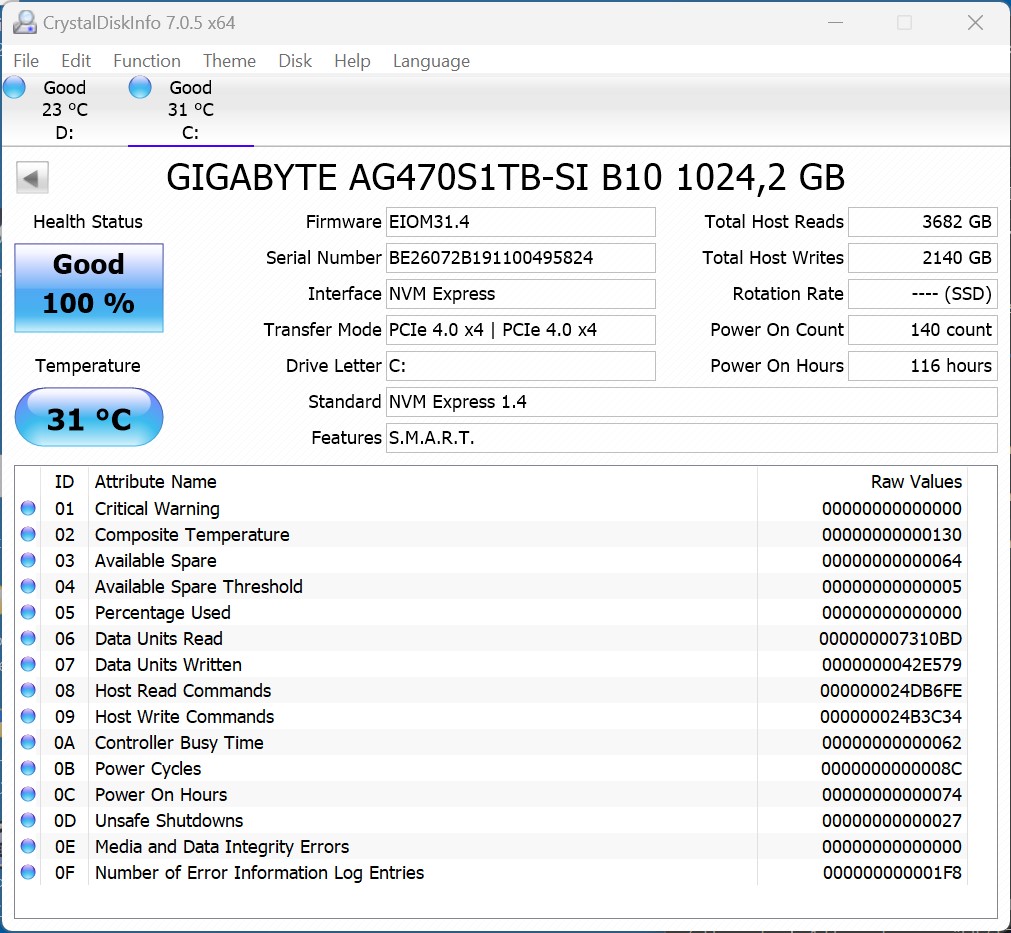
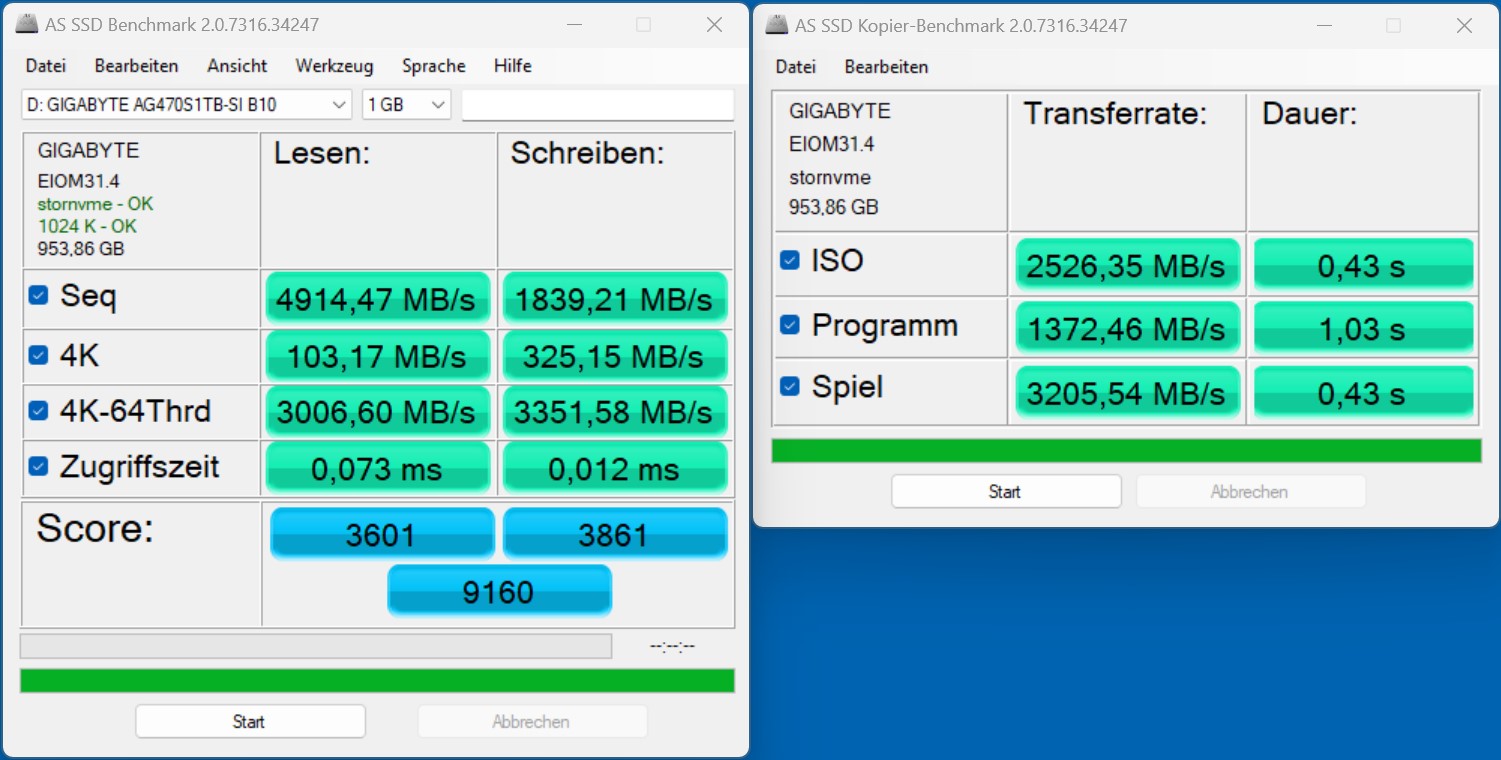
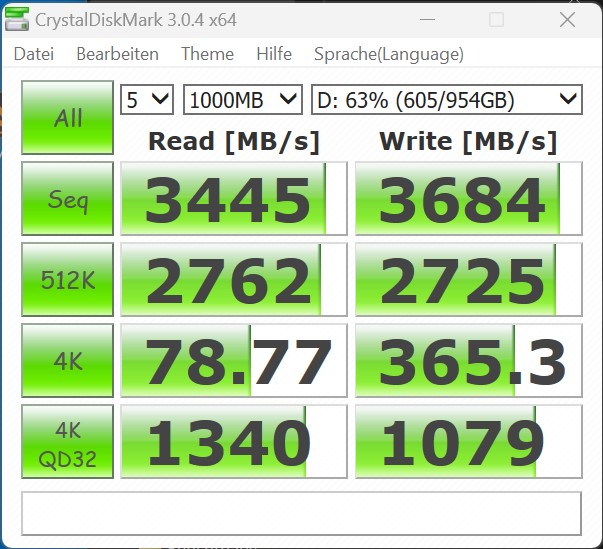
存储设备
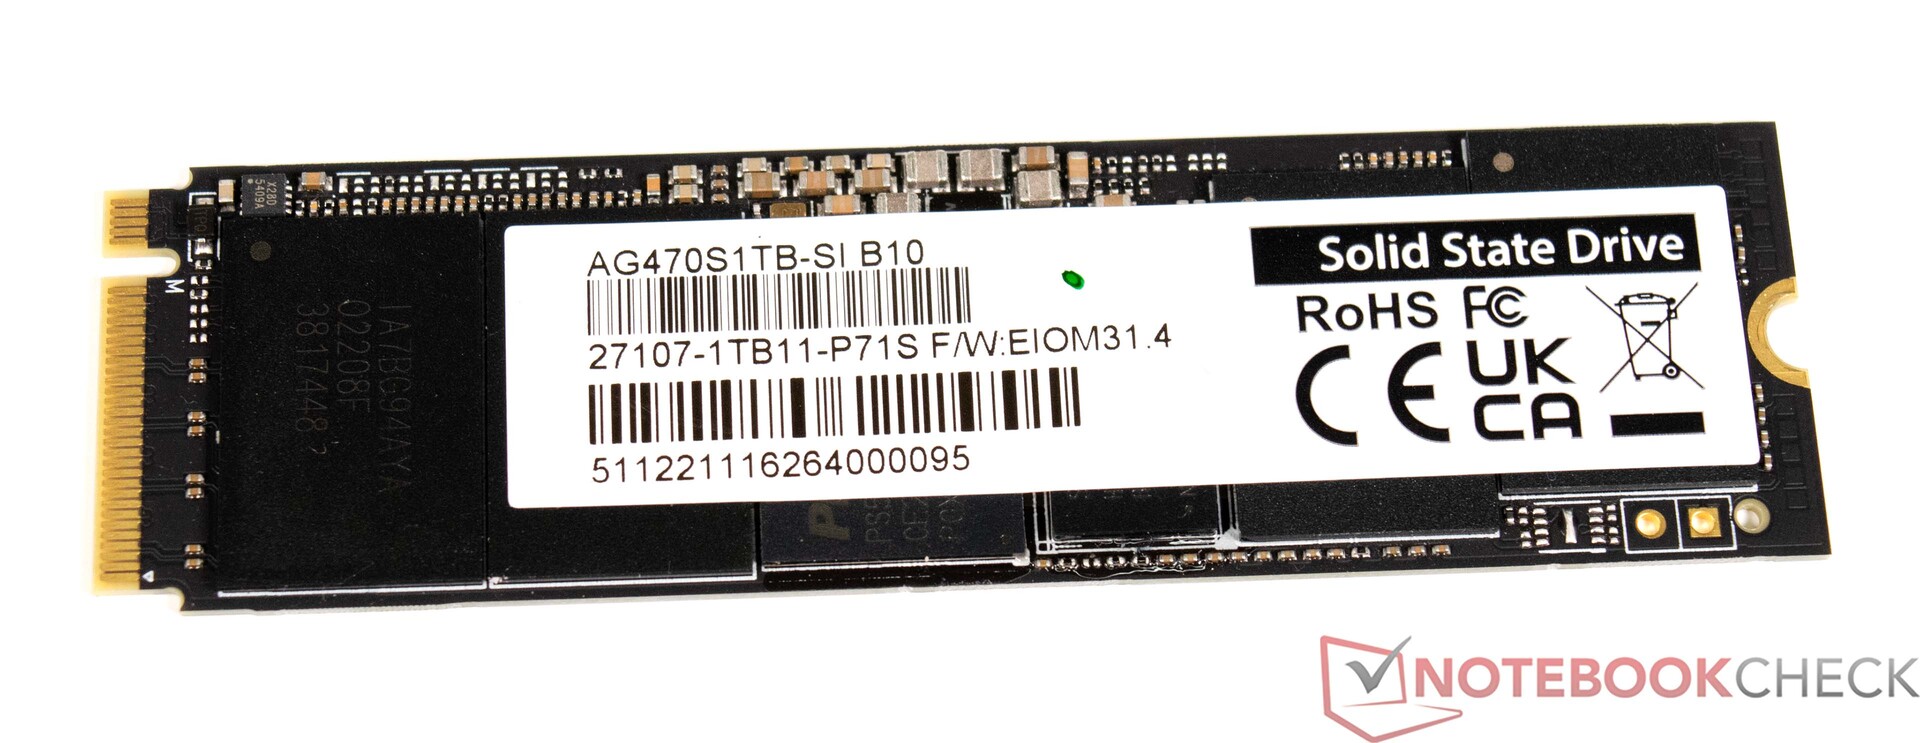
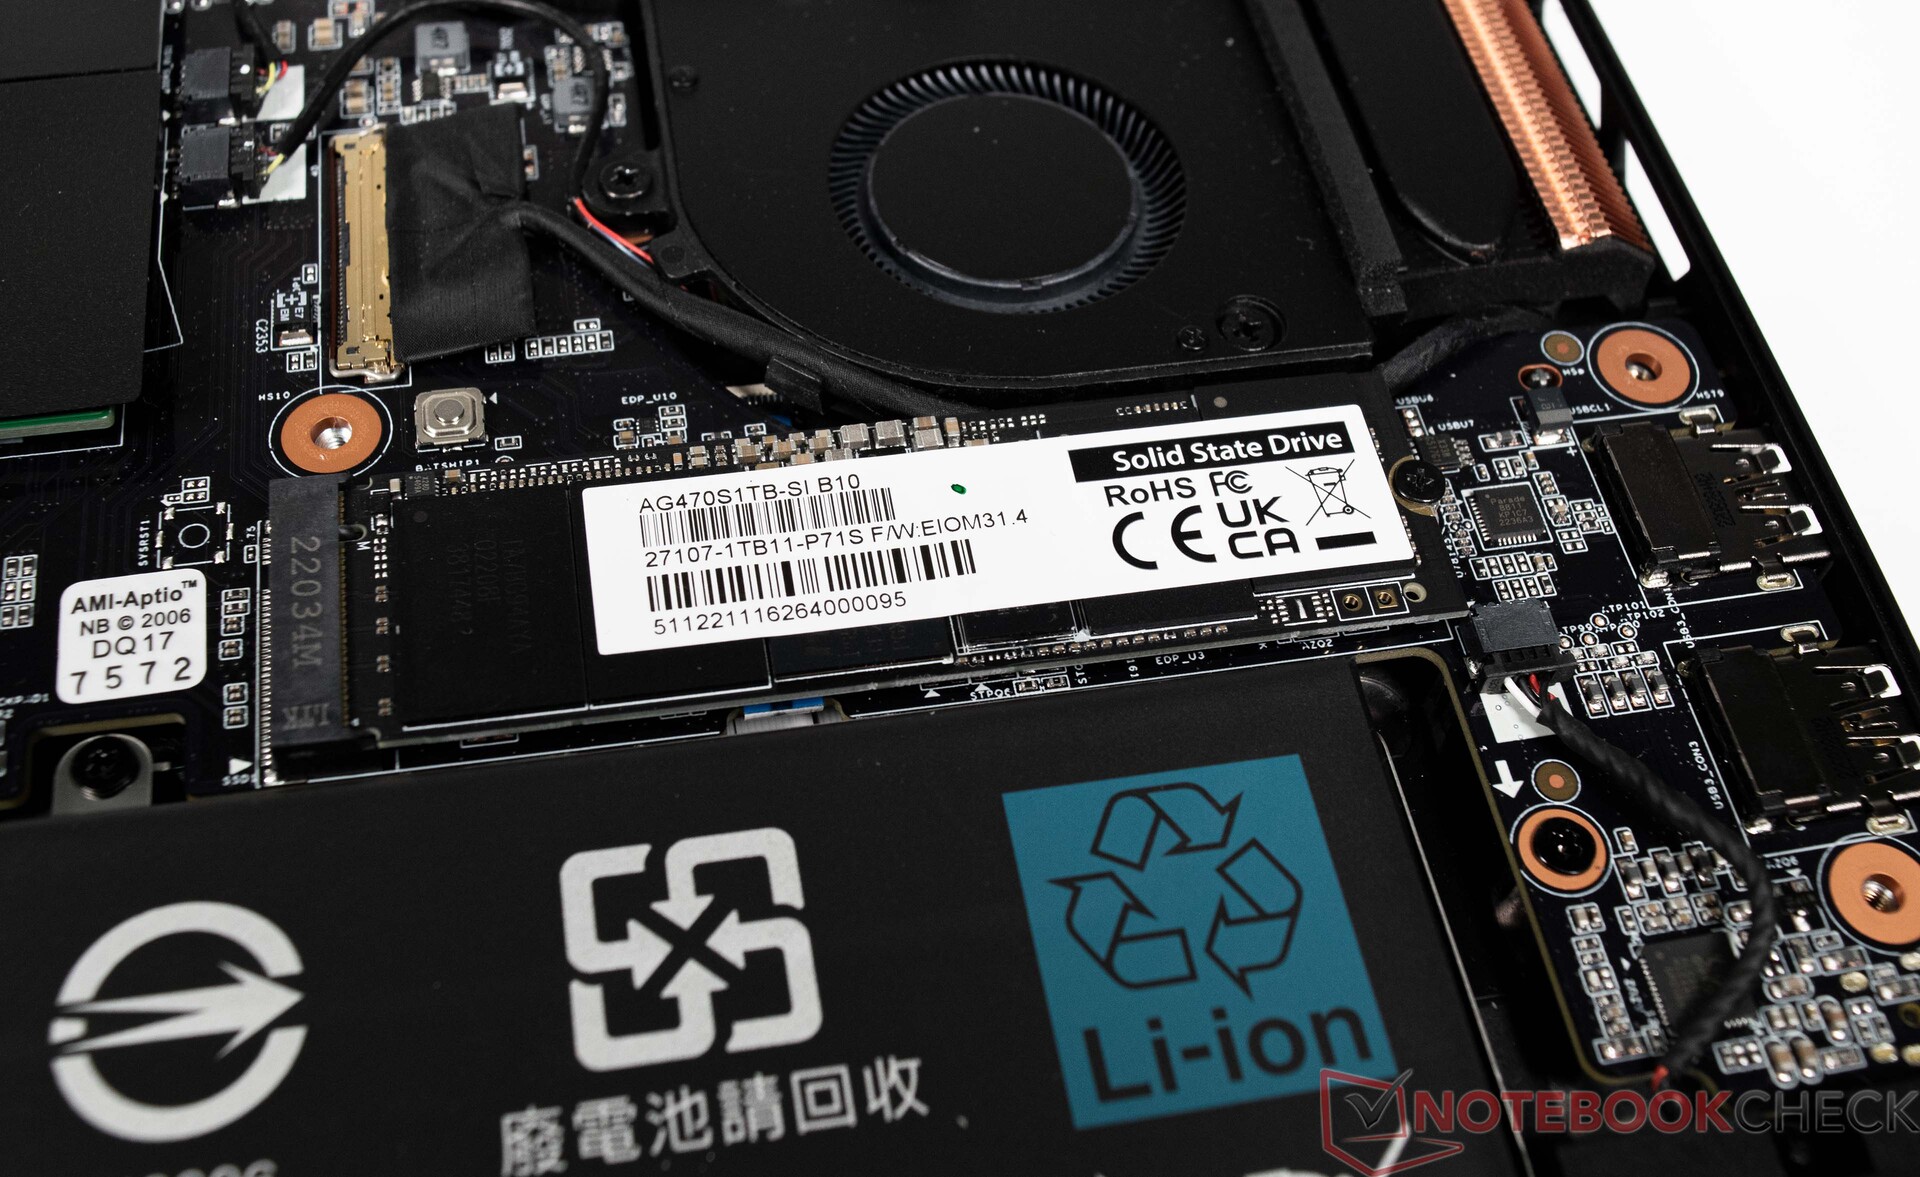
Aorus 17X AZF使用了内部的SSD。更准确地说,我们的测试装置提供了两块NVMe固态硬盘,每块都有1TB的存储空间,适合其预定用途。因此,大量的数据可以存储在这两个大容量存储设备上。这两个驱动器支持PCIe 4.0,并且还通过全带宽的四通道连接。性能是稳固的,即使在某些情况下几个比较设备显示出更好的性能。然而,Aorus 17X AZF已经完全配备了两块SSD。另外,2TB型号当然也可以安装在设备中。同时,机箱的底部被利用来进行有效的冷却,因此该设备以优异的成绩通过了我们的压力测试。
关于更多的比较和基准,我们参考了我们的比较表,这里.
SSD 1
SSD 2


* ... smaller is better
Sustained Read Performance: DiskSpd Read Loop, Queue Depth 8
图形卡
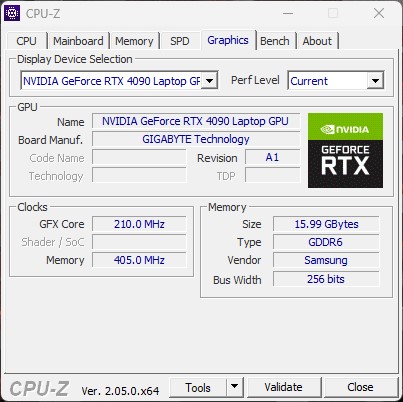
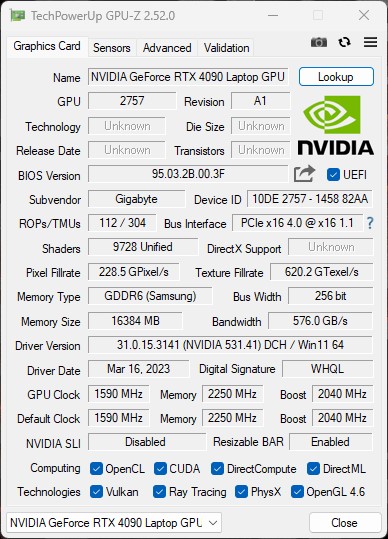
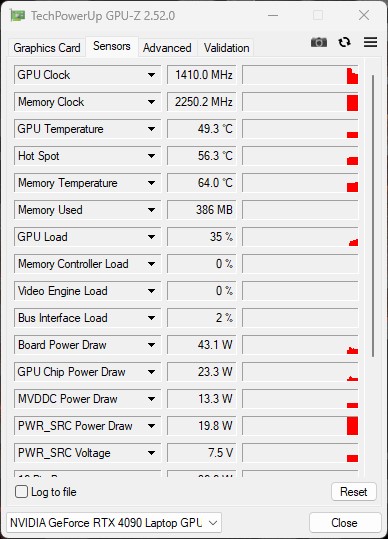
Aorus 17X AZF使用了一个NvidiaGeForce RTX 4090 笔记本电脑GPU,其最大可能的TGP高达175瓦(150瓦+25瓦的动态提升)。3D性能也相应不错,尽管采用相同显卡的竞争性笔记本电脑能够在性能上略胜一筹。与 NvidiaGeForce RTX 4080笔记本GPU的差距要大得多,分别为9%和18%。与之相比 Medion Erazer Beast相比,我们在Aorus 17X AZF中几乎看到了相同的性能。
更多关于NvidiaGeForce RTX 4090笔记本GPU的基准测试可以找到 这里。
| 3DMark 05 Standard | 61850 points | |
| 3DMark 06 Standard Score | 61681 points | |
| 3DMark 11 Performance | 43896 points | |
| 3DMark Ice Storm Standard Score | 247981 points | |
| 3DMark Cloud Gate Standard Score | 58934 points | |
| 3DMark Fire Strike Score | 35428 points | |
| 3DMark Fire Strike Extreme Score | 24235 points | |
| 3DMark Time Spy Score | 20085 points | |
Help | ||
* ... smaller is better
游戏性能
这款笔记本配备了QHD显示屏,这意味着所有当前的标题都能以最大的细节播放而没有问题。有时候,性能的NvidiaGeForce RTX 4090笔记本GPU可以轻松地为原生分辨率的外部4K显示器提供动力。16GB的VRAM很好,面向未来,即使在QHD中也不会成为瓶颈。在我们的游戏测试中,Aorus 17X AZF稳居第三位。所有使用 NvidiaGeForce RTX 4090笔记本GPU提供类似的性能水平。
| Performance rating - Percent | |
| Alienware m18 R1 | |
| MSI Titan GT77 HX 13VI | |
| Aorus 17X AZF | |
| Medion Erazer Beast X40 | |
| MSI GE78HX 13VH-070US | |
| HP Omen 17-ck2097ng | |
| Average of class Gaming | |
| The Witcher 3 - 1920x1080 Ultra Graphics & Postprocessing (HBAO+) | |
| Alienware m18 R1 | |
| Aorus 17X AZF | |
| MSI Titan GT77 HX 13VI | |
| Average of class Gaming (104.7 - 240, n=7, last 2 years) | |
| Medion Erazer Beast X40 | |
| MSI GE78HX 13VH-070US | |
| HP Omen 17-ck2097ng | |
| GTA V - 1920x1080 Highest AA:4xMSAA + FX AF:16x | |
| Medion Erazer Beast X40 | |
| Alienware m18 R1 | |
| MSI Titan GT77 HX 13VI | |
| Aorus 17X AZF | |
| Average of class Gaming (48.3 - 186.9, n=94, last 2 years) | |
| HP Omen 17-ck2097ng | |
| MSI GE78HX 13VH-070US | |
| Final Fantasy XV Benchmark - 1920x1080 High Quality | |
| Alienware m18 R1 | |
| MSI Titan GT77 HX 13VI | |
| Aorus 17X AZF | |
| Medion Erazer Beast X40 | |
| Average of class Gaming (41 - 215, n=95, last 2 years) | |
| MSI GE78HX 13VH-070US | |
| HP Omen 17-ck2097ng | |
| Strange Brigade - 1920x1080 ultra AA:ultra AF:16 | |
| Aorus 17X AZF | |
| MSI Titan GT77 HX 13VI | |
| Alienware m18 R1 | |
| Medion Erazer Beast X40 | |
| Average of class Gaming (76.3 - 458, n=87, last 2 years) | |
| HP Omen 17-ck2097ng | |
| MSI GE78HX 13VH-070US | |
| Dota 2 Reborn - 1920x1080 ultra (3/3) best looking | |
| Alienware m18 R1 | |
| MSI Titan GT77 HX 13VI | |
| Aorus 17X AZF | |
| Medion Erazer Beast X40 | |
| HP Omen 17-ck2097ng | |
| Average of class Gaming (84.8 - 248, n=107, last 2 years) | |
| MSI GE78HX 13VH-070US | |
| F1 22 - 1920x1080 Ultra High Preset AA:T AF:16x | |
| Alienware m18 R1 | |
| MSI Titan GT77 HX 13VI | |
| Aorus 17X AZF | |
| Medion Erazer Beast X40 | |
| MSI GE78HX 13VH-070US | |
| HP Omen 17-ck2097ng | |
| Average of class Gaming (40.1 - 121.2, n=4, last 2 years) | |
| The Callisto Protocol - 1920x1080 Ultra Preset (without FSR Upscaling) | |
| MSI Titan GT77 HX 13VI | |
| Aorus 17X AZF | |
| Average NVIDIA GeForce RTX 4090 Laptop GPU (102.6 - 150.7, n=6) | |
| Average NVIDIA GeForce RTX 4080 Laptop GPU (111.5 - 120.4, n=2) | |
| HP Omen 17-ck2097ng | |
| Atomic Heart - 1920x1080 Atomic Preset | |
| Average NVIDIA GeForce RTX 4090 Laptop GPU (128.6 - 166, n=3) | |
| Aorus 17X AZF | |
| Medion Erazer Beast X40 | |
| HP Omen 17-ck2097ng | |
| Average NVIDIA GeForce RTX 4080 Laptop GPU (n=1) | |
| Company of Heroes 3 - 1920x1080 Maximum Settings | |
| Aorus 17X AZF | |
| Average NVIDIA GeForce RTX 4090 Laptop GPU (215 - 235, n=2) | |
| Medion Erazer Beast X40 | |
| HP Omen 17-ck2097ng | |
| Average NVIDIA GeForce RTX 4080 Laptop GPU (n=1) | |
| Dead Space Remake - 1920x1080 Ultra Preset AA:T | |
| Aorus 17X AZF | |
| Average NVIDIA GeForce RTX 4090 Laptop GPU (129 - 140.8, n=2) | |
| MSI Titan GT77 HX 13VI | |
| Average NVIDIA GeForce RTX 4080 Laptop GPU (n=1) | |
| Average of class Gaming (n=1last 2 years) | |
| Tiny Tina's Wonderlands - 1920x1080 Badass Preset (DX12) | |
| Alienware m18 R1 | |
| MSI Titan GT77 HX 13VI | |
| Average NVIDIA GeForce RTX 4090 Laptop GPU (141.1 - 189.4, n=14) | |
| Aorus 17X AZF | |
| Average NVIDIA GeForce RTX 4080 Laptop GPU (112.9 - 167.1, n=9) | |
| Average of class Gaming (55 - 159.4, n=4, last 2 years) | |
| High On Life - 1920x1080 Very High Preset | |
| Aorus 17X AZF | |
| Average NVIDIA GeForce RTX 4090 Laptop GPU (180.3 - 185.2, n=2) | |
| Average NVIDIA GeForce RTX 4080 Laptop GPU (n=1) | |
| The Witcher 3 / High Graphics & Postprocessing (Nvidia HairWorks Off) | |
| Alienware m18 R1 | |
| MSI Titan GT77 HX 13VI | |
| Aorus 17X AZF | |
| MSI GE78HX 13VH-070US | |
| Average NVIDIA GeForce RTX 4090 Laptop GPU (290 - 449, n=23) | |
| Average of class Gaming (341 - 404, n=2, last 2 years) | |
| Medion Erazer Beast X40 | |
| HP Omen 17-ck2097ng | |
| The Witcher 3 / Ultra Graphics & Postprocessing (HBAO+) | |
| Alienware m18 R1 | |
| Aorus 17X AZF | |
| MSI Titan GT77 HX 13VI | |
| Average NVIDIA GeForce RTX 4090 Laptop GPU (139.2 - 216, n=35) | |
| Average of class Gaming (104.7 - 240, n=7, last 2 years) | |
| Medion Erazer Beast X40 | |
| MSI GE78HX 13VH-070US | |
| HP Omen 17-ck2097ng | |
为了检查帧率是否在较长时间内保持稳定和恒定,我们在全高清分辨率和最大细节下运行 "TheWitcher 3" 60分钟。游戏角色没有被移动。刷新率是一致的,正如图表所显示的那样。
Witcher 3 FPS chart
| low | med. | high | ultra | QHD | 4K | |
|---|---|---|---|---|---|---|
| GTA V (2015) | 187 | 186.1 | 182.2 | 135.3 | 132.9 | 174.3 |
| The Witcher 3 (2015) | 554.3 | 506.7 | 395.8 | 200 | 145.9 | |
| Dota 2 Reborn (2015) | 235.6 | 199.8 | 191.6 | 176.1 | 175.75 | |
| Final Fantasy XV Benchmark (2018) | 222 | 205 | 177.6 | 152.4 | 89.9 | |
| X-Plane 11.11 (2018) | 195.9 | 173.5 | 138.5 | 118.5 | ||
| Far Cry 5 (2018) | 186 | 170 | 161 | 162 | 152 | 98 |
| Strange Brigade (2018) | 527 | 441 | 414 | 386 | 300 | 154.6 |
| Shadow of the Tomb Raider (2018) | 247 | 219 | 210 | 198.6 | 162.5 | 95.2 |
| Far Cry New Dawn (2019) | 170 | 148 | 145 | 131 | 128 | 102 |
| Metro Exodus (2019) | 187.7 | 160.6 | 134.5 | 112.9 | 98 | 68.6 |
| Borderlands 3 (2019) | 208 | 182.1 | 163.6 | 146.5 | 115.8 | 67.9 |
| F1 2020 (2020) | 413 | 354 | 344 | 305 | 253 | 148.7 |
| F1 2021 (2021) | 466 | 421 | 356 | 204 | 182.7 | 107.8 |
| Far Cry 6 (2021) | 175.7 | 154.3 | 136.3 | 128.9 | 115.1 | 73.1 |
| God of War (2022) | 176.8 | 176.7 | 166.8 | 123.6 | 101.5 | 72.7 |
| GRID Legends (2022) | 227 | 209 | 190.1 | 183.2 | 178.9 | 128.6 |
| Tiny Tina's Wonderlands (2022) | 320 | 263 | 194 | 158.3 | 112.5 | 65.7 |
| F1 22 (2022) | 315 | 299 | 283 | 128.9 | 83.5 | 43 |
| The Callisto Protocol (2022) | 193.3 | 168.2 | 166.4 | 131.1 | 101.3 | 61.6 |
| High On Life (2023) | 277 | 246 | 211 | 185.2 | 126.1 | 56.9 |
| Dead Space Remake (2023) | 153.4 | 150.7 | 142.3 | 140.8 | 105.6 | 56.2 |
| Hogwarts Legacy (2023) | 116 | 100.7 | 93.7 | 89.7 | 80.9 | 50.5 |
| Returnal (2023) | 195 | 191 | 176 | 155 | 119 | 70 |
| Atomic Heart (2023) | 217 | 187.1 | 166.6 | 138.5 | 107.8 | 62.7 |
| Company of Heroes 3 (2023) | 308.5 | 280.4 | 239.6 | 235.2 | 194.8 | 117.4 |
| Resident Evil 4 Remake (2023) | 232 | 189.7 | 187.3 | 136.3 | 109.2 | 63.4 |
| The Last of Us (2023) | 113.7 | 110.8 | 109 | 105 | 81.8 | 43.8 |
排放 - Aorus 17X AZF也可以是安静的
噪声
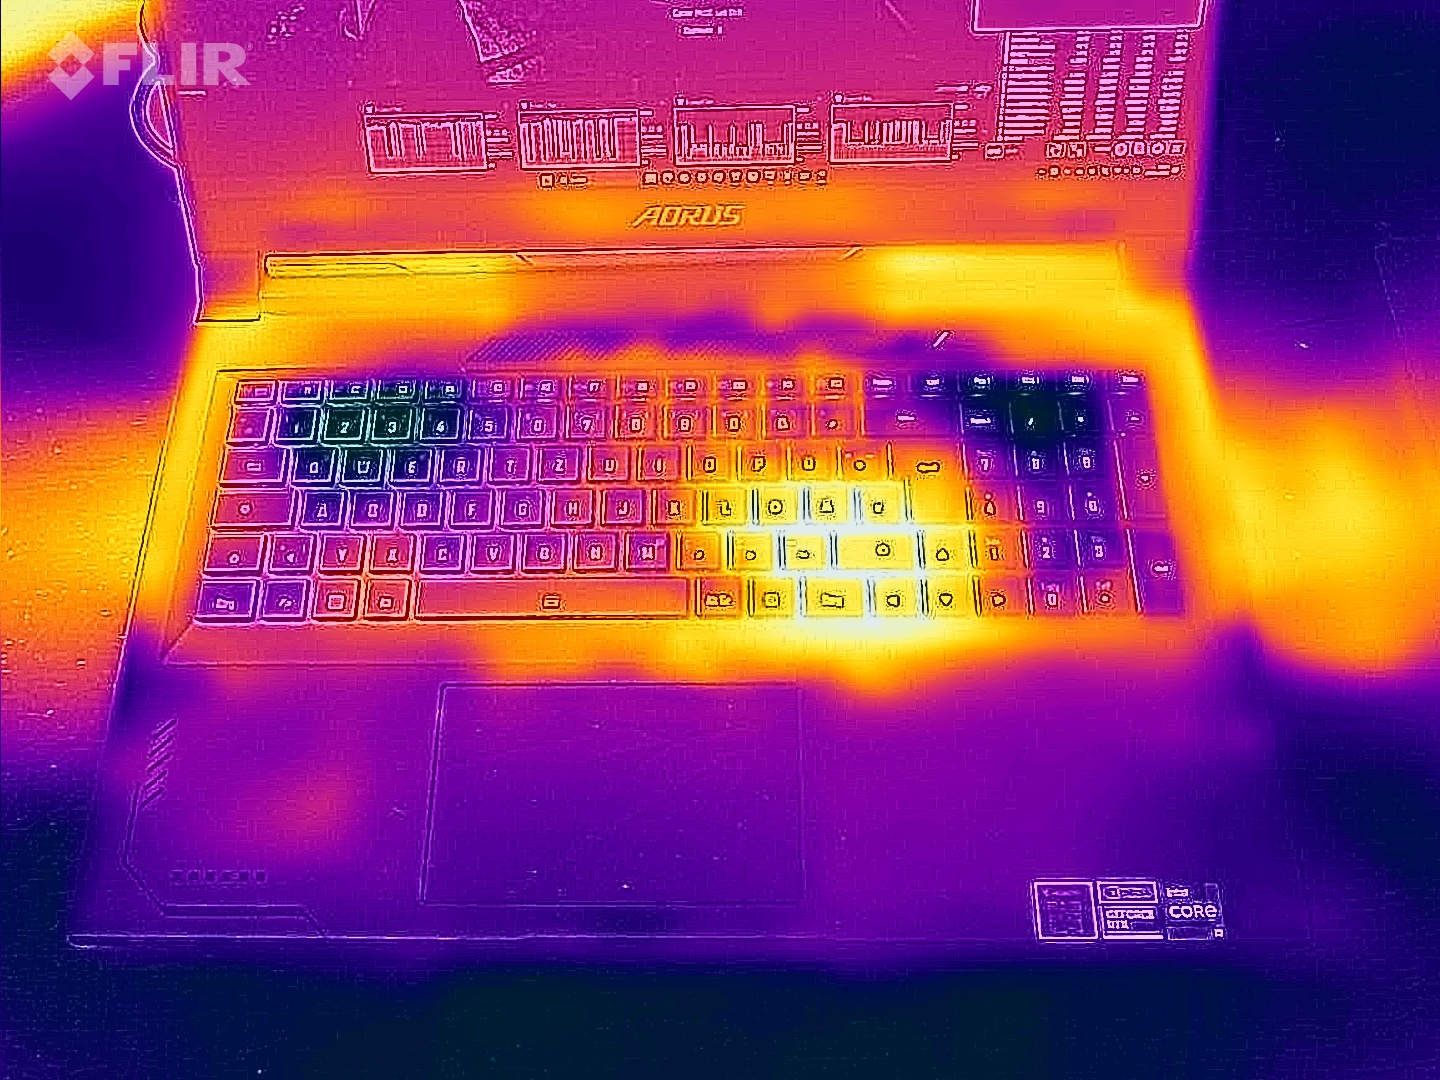
在闲置和日常使用(办公室和互联网)期间,四个风扇经常以低速旋转。在高达34 dB(A)的情况下,Aorus 17X AZF是非常可以忍受的。在负载情况下,它偶尔会变得非常响亮,在我们的压力测试中记录的最高值为54 dB(A)。此外,风扇会产生高频声音,主观上会使音量更大。
原则上,Aorus 17X AZF也可以实现近乎无声的操作。这需要使用会议模式 或节能睡眠模式配置文件,可以通过GCC(技嘉控制中心)选择。由此减少的CPU功耗仍足以满足日常使用。
GCC还可以用来手动控制风扇。除了预定义的配置文件外,您还可以使用自己的风扇曲线。
Noise level
| Idle |
| 28 / 29 / 34 dB(A) |
| Load |
| 51 / 54 dB(A) |
 | ||
30 dB silent 40 dB(A) audible 50 dB(A) loud |
||
min: | ||
| Aorus 17X AZF i9-13900HX, GeForce RTX 4090 Laptop GPU | Medion Erazer Beast X40 i9-13900HX, GeForce RTX 4090 Laptop GPU | MSI GE78HX 13VH-070US i9-13950HX, GeForce RTX 4080 Laptop GPU | HP Omen 17-ck2097ng i9-13900HX, GeForce RTX 4080 Laptop GPU | MSI Titan GT77 HX 13VI i9-13950HX, GeForce RTX 4090 Laptop GPU | Alienware m18 R1 i9-13980HX, GeForce RTX 4090 Laptop GPU | |
|---|---|---|---|---|---|---|
| Noise | 4% | 7% | 4% | 1% | 16% | |
| off / environment * (dB) | 25 | 24 4% | 23.4 6% | 24 4% | 24.6 2% | 22.8 9% |
| Idle Minimum * (dB) | 28 | 25 11% | 24.2 14% | 31 -11% | 29.2 -4% | 23 18% |
| Idle Average * (dB) | 29 | 29 -0% | 25.6 12% | 32 -10% | 29.2 -1% | 23 21% |
| Idle Maximum * (dB) | 34 | 35 -3% | 31 9% | 33 3% | 29.2 14% | 23 32% |
| Load Average * (dB) | 51 | 51 -0% | 43.3 15% | 45 12% | 50.7 1% | 35.6 30% |
| Witcher 3 ultra * (dB) | 57 | 51 11% | 56.3 1% | 45 21% | 53.3 6% | 51.3 10% |
| Load Maximum * (dB) | 54 | 53 2% | 59.1 -9% | 50 7% | 61 -13% | 56.7 -5% |
* ... smaller is better
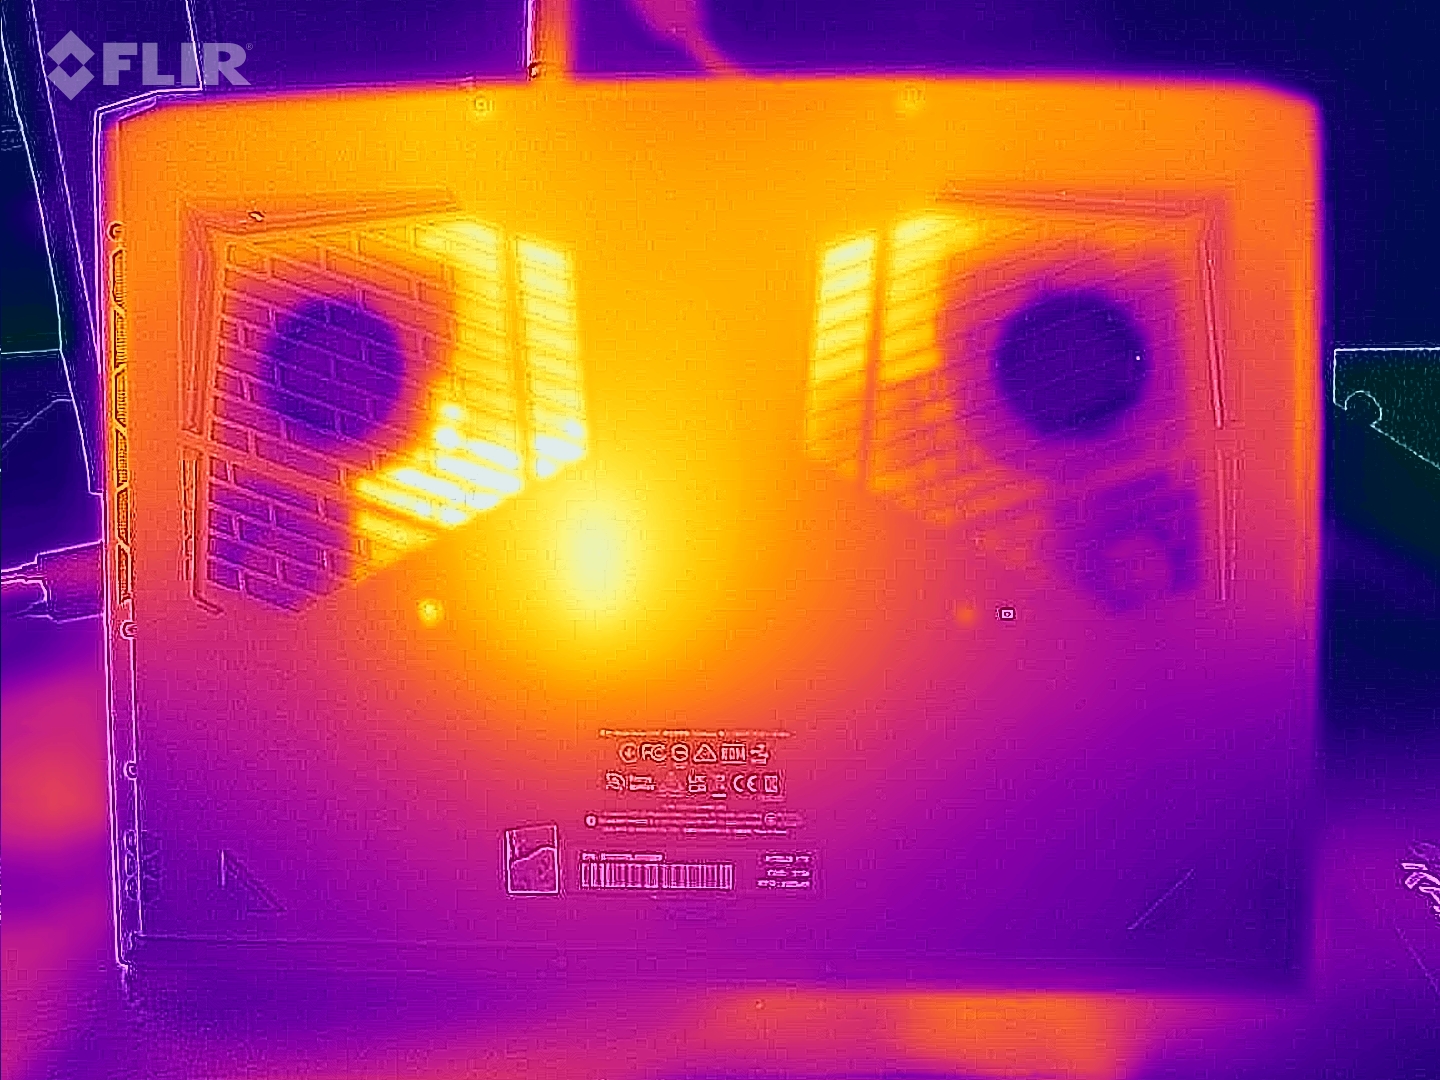
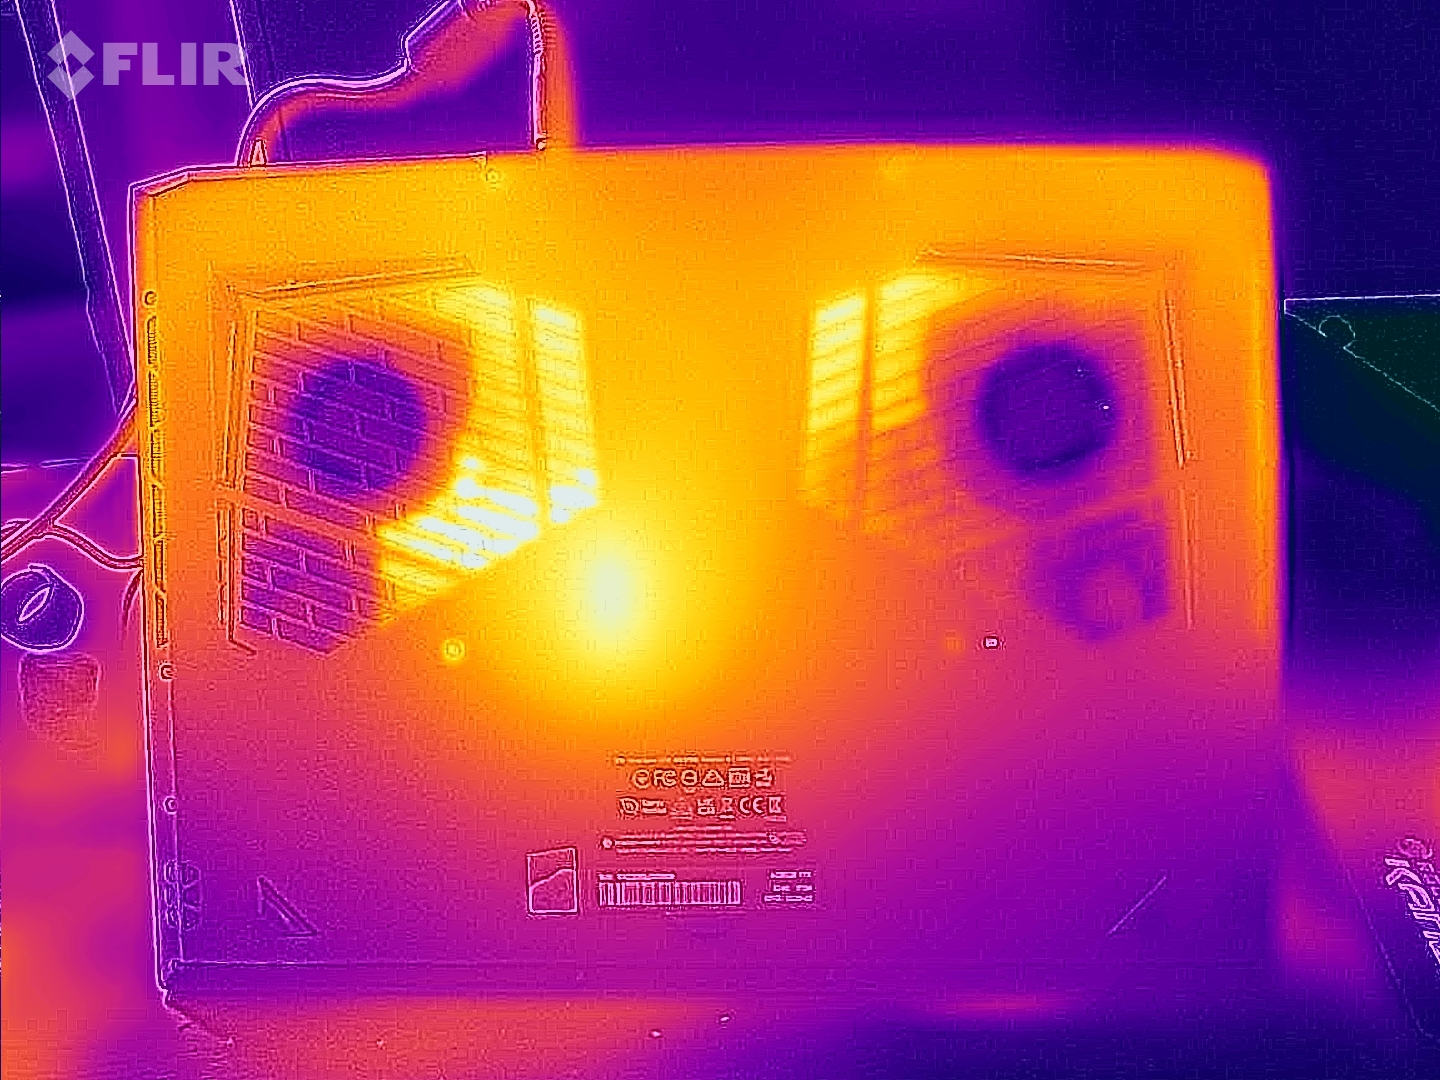
温度
在办公室和互联网的简单日常使用中,没有观察到高的外壳温度。只有在负载情况下,如压力测试或游戏期间,笔记本才会明显发热。我们在底部和风扇出口的区域登记了最高的温度。
(-) The maximum temperature on the upper side is 47 °C / 117 F, compared to the average of 40.4 °C / 105 F, ranging from 21.2 to 68.8 °C for the class Gaming.
(-) The bottom heats up to a maximum of 51 °C / 124 F, compared to the average of 43.2 °C / 110 F
(+) In idle usage, the average temperature for the upper side is 28.1 °C / 83 F, compared to the device average of 33.9 °C / 93 F.
(±) Playing The Witcher 3, the average temperature for the upper side is 38 °C / 100 F, compared to the device average of 33.9 °C / 93 F.
(+) The palmrests and touchpad are reaching skin temperature as a maximum (34 °C / 93.2 F) and are therefore not hot.
(-) The average temperature of the palmrest area of similar devices was 28.8 °C / 83.8 F (-5.2 °C / -9.4 F).
| Aorus 17X AZF Intel Core i9-13900HX, NVIDIA GeForce RTX 4090 Laptop GPU | Medion Erazer Beast X40 Intel Core i9-13900HX, NVIDIA GeForce RTX 4090 Laptop GPU | MSI GE78HX 13VH-070US Intel Core i9-13950HX, NVIDIA GeForce RTX 4080 Laptop GPU | HP Omen 17-ck2097ng Intel Core i9-13900HX, NVIDIA GeForce RTX 4080 Laptop GPU | MSI Titan GT77 HX 13VI Intel Core i9-13950HX, NVIDIA GeForce RTX 4090 Laptop GPU | Alienware m18 R1 Intel Core i9-13980HX, NVIDIA GeForce RTX 4090 Laptop GPU | |
|---|---|---|---|---|---|---|
| Heat | -1% | 7% | 13% | 12% | 15% | |
| Maximum Upper Side * (°C) | 47 | 48 -2% | 37.4 20% | 41 13% | 40.6 14% | 39 17% |
| Maximum Bottom * (°C) | 51 | 52 -2% | 45 12% | 51 -0% | 41.1 19% | 36.4 29% |
| Idle Upper Side * (°C) | 30 | 30 -0% | 29.8 1% | 24 20% | 26.2 13% | 29.2 3% |
| Idle Bottom * (°C) | 31 | 31 -0% | 32.4 -5% | 25 19% | 30.3 2% | 27.8 10% |
* ... smaller is better
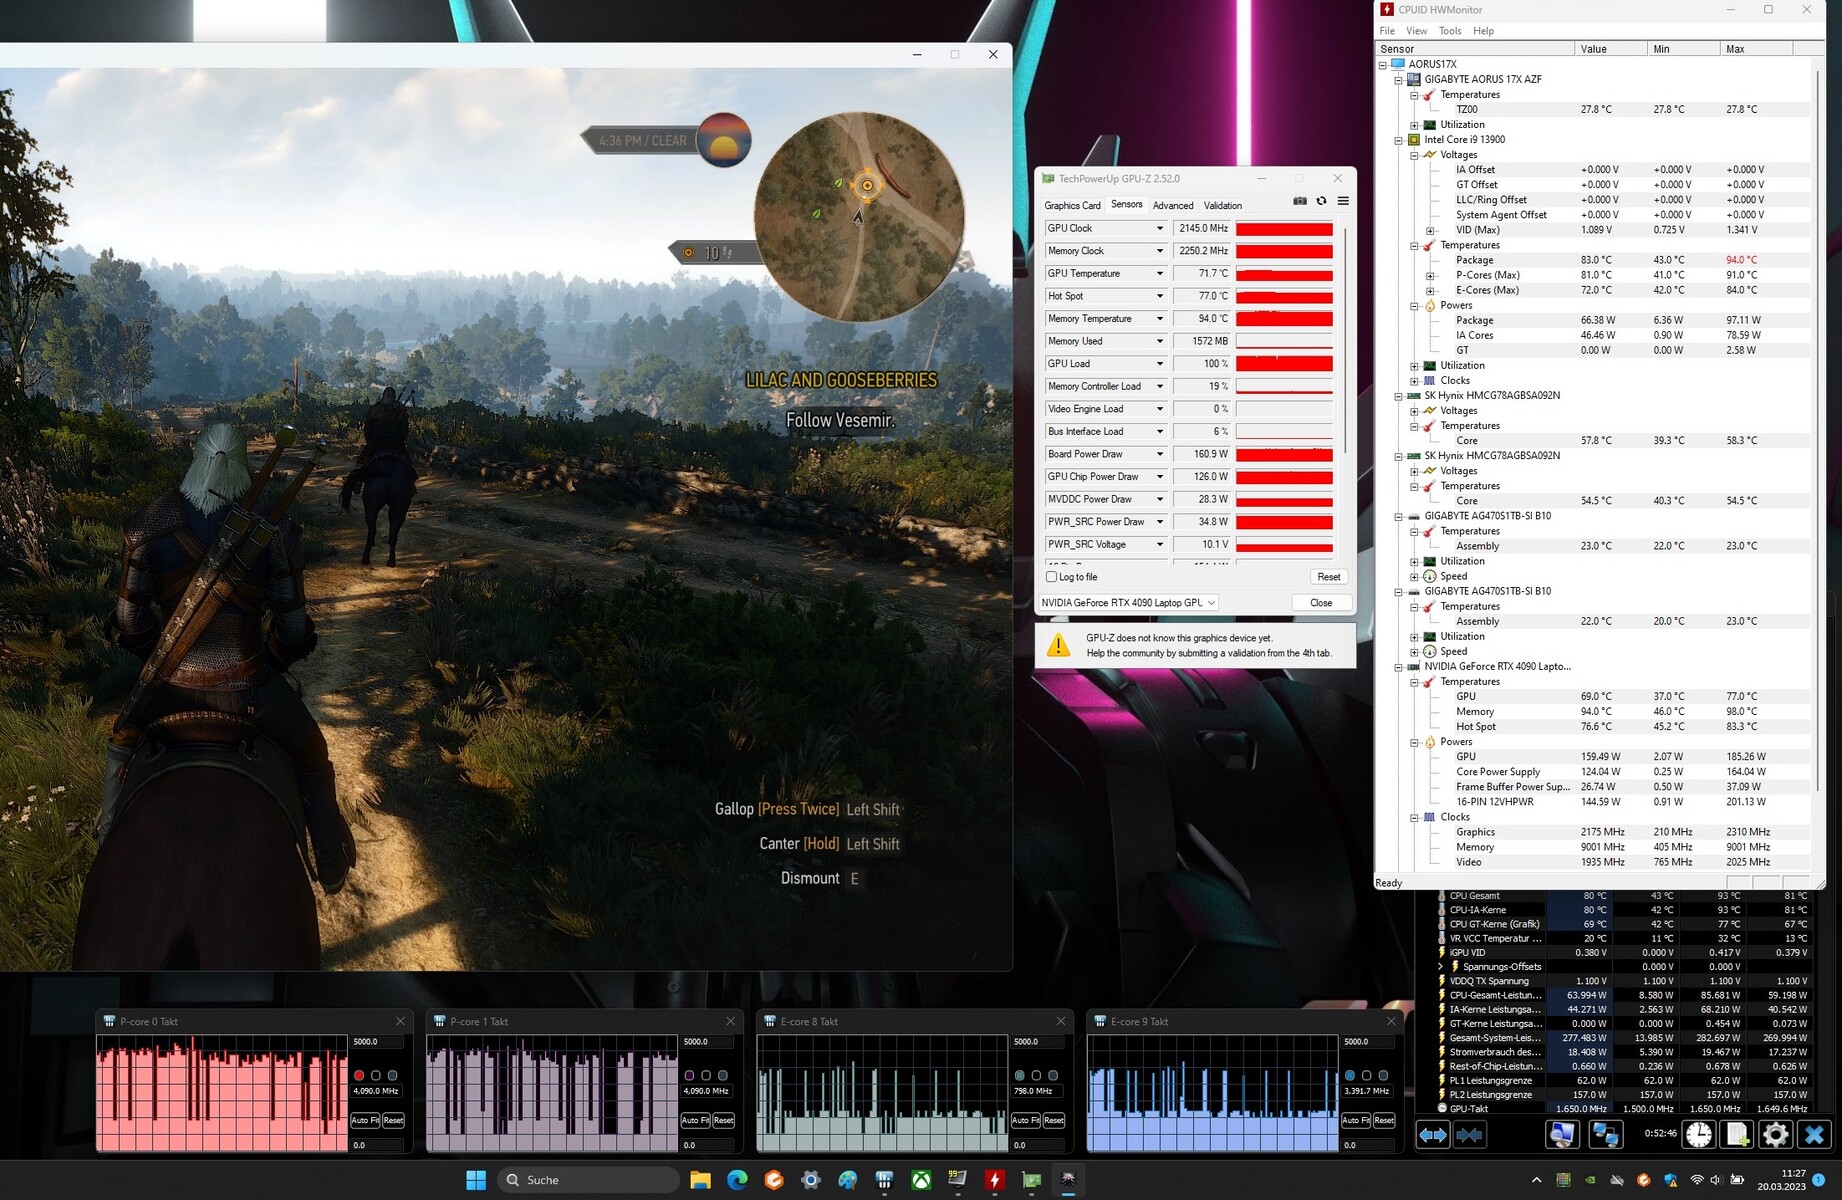
压力测试
我们用Prime95和Furmark模拟连续运行的压力测试,代表了检查系统在全负荷下的稳定性的一个极端情况。CPU以高的时钟速率开始,由于PL2不能永久保持,所以在很短的时间内就被扼杀。英特尔酷睿i7 13900HX的P核和E核 英特尔酷睿i7 13900HX长时间持续运行在略低于2GHz的水平。
发言人
立体声扬声器能产生扎实的声音,但由于音量不够,低音的效果不甚理想。建议使用耳机或外部扬声器系统以获得更好的声音体验。
Aorus 17X AZF audio analysis
(+) | speakers can play relatively loud (83 dB)
Bass 100 - 315 Hz
(-) | nearly no bass - on average 27.1% lower than median
(±) | linearity of bass is average (13% delta to prev. frequency)
Mids 400 - 2000 Hz
(+) | balanced mids - only 4.5% away from median
(+) | mids are linear (5% delta to prev. frequency)
Highs 2 - 16 kHz
(+) | balanced highs - only 1.4% away from median
(+) | highs are linear (4.3% delta to prev. frequency)
Overall 100 - 16.000 Hz
(±) | linearity of overall sound is average (17.9% difference to median)
Compared to same class
» 55% of all tested devices in this class were better, 9% similar, 37% worse
» The best had a delta of 6%, average was 18%, worst was 132%
Compared to all devices tested
» 37% of all tested devices were better, 8% similar, 55% worse
» The best had a delta of 4%, average was 23%, worst was 134%
Medion Erazer Beast X40 audio analysis
(+) | speakers can play relatively loud (88 dB)
Bass 100 - 315 Hz
(-) | nearly no bass - on average 20.2% lower than median
(±) | linearity of bass is average (8.4% delta to prev. frequency)
Mids 400 - 2000 Hz
(±) | higher mids - on average 5.5% higher than median
(+) | mids are linear (6.5% delta to prev. frequency)
Highs 2 - 16 kHz
(+) | balanced highs - only 3.1% away from median
(+) | highs are linear (5.8% delta to prev. frequency)
Overall 100 - 16.000 Hz
(±) | linearity of overall sound is average (16.1% difference to median)
Compared to same class
» 39% of all tested devices in this class were better, 7% similar, 54% worse
» The best had a delta of 6%, average was 18%, worst was 132%
Compared to all devices tested
» 26% of all tested devices were better, 5% similar, 69% worse
» The best had a delta of 4%, average was 23%, worst was 134%
能源管理
消耗功率
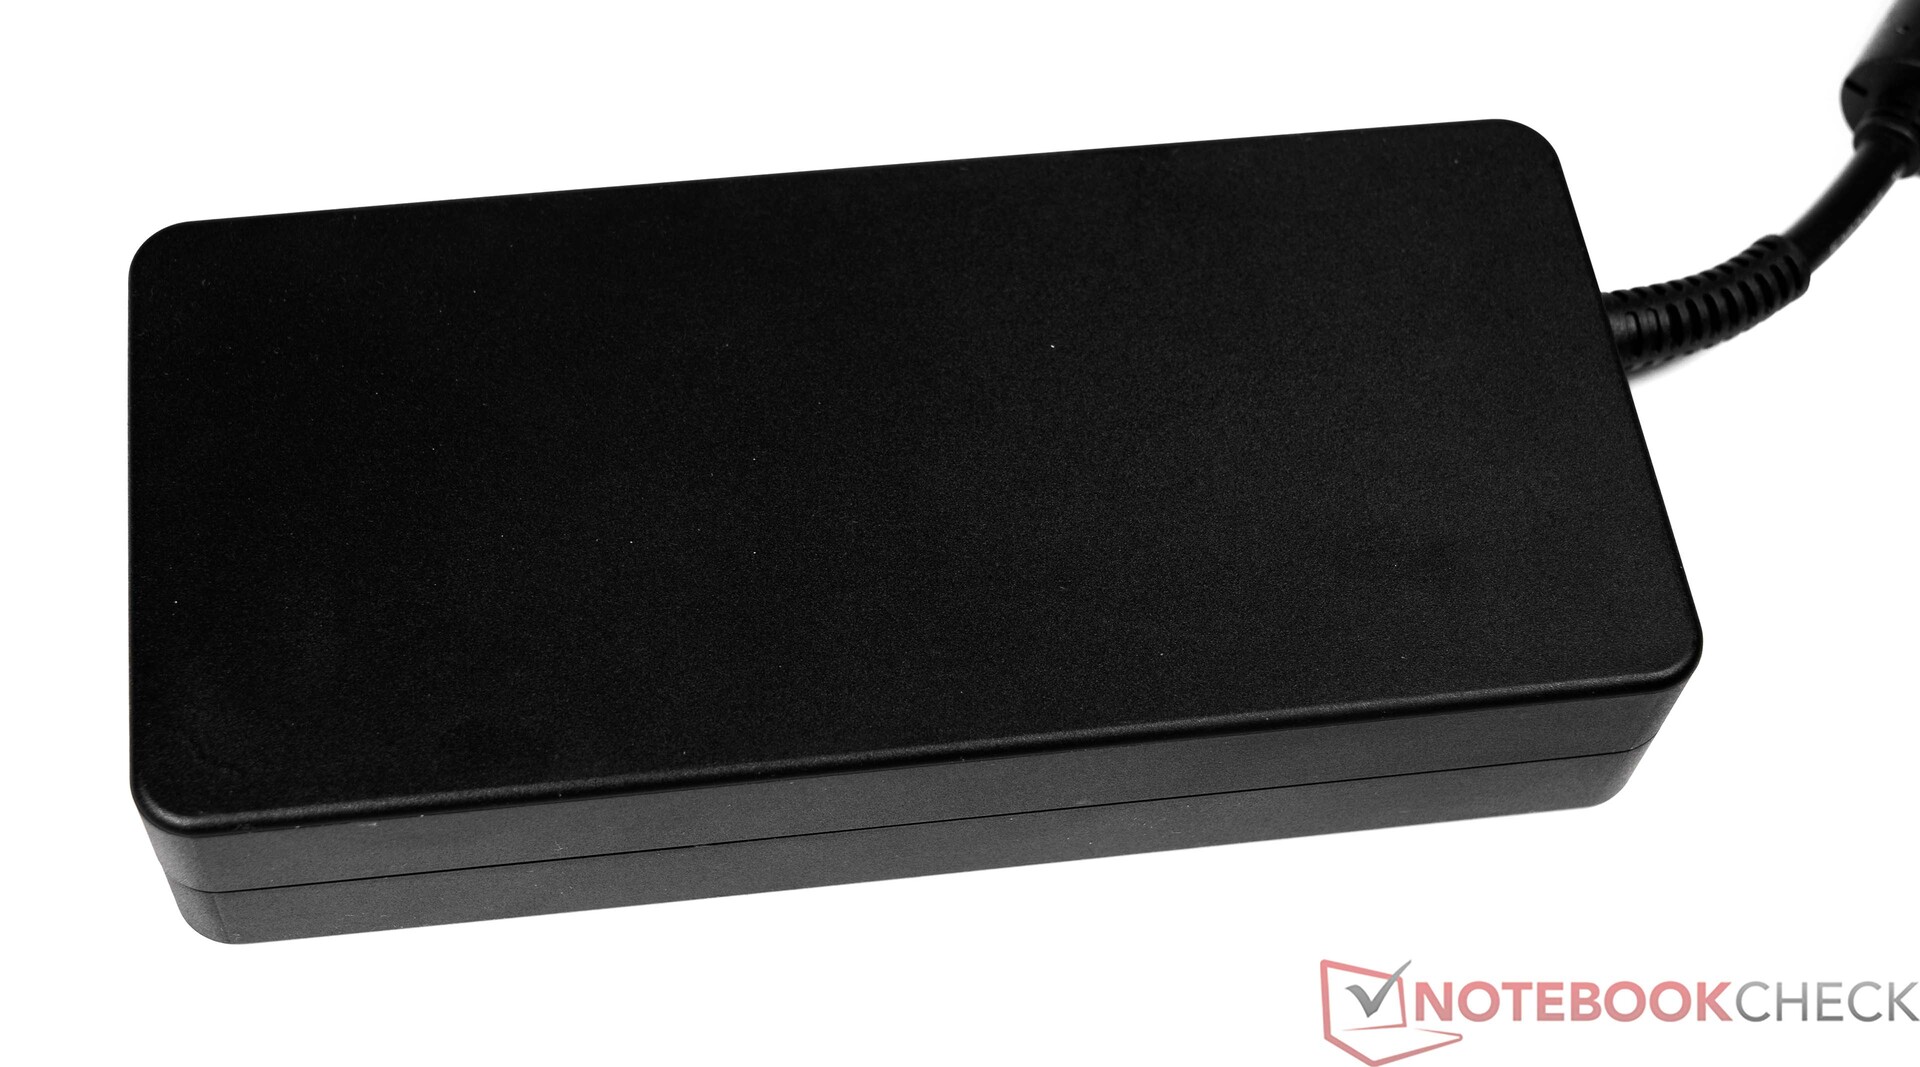
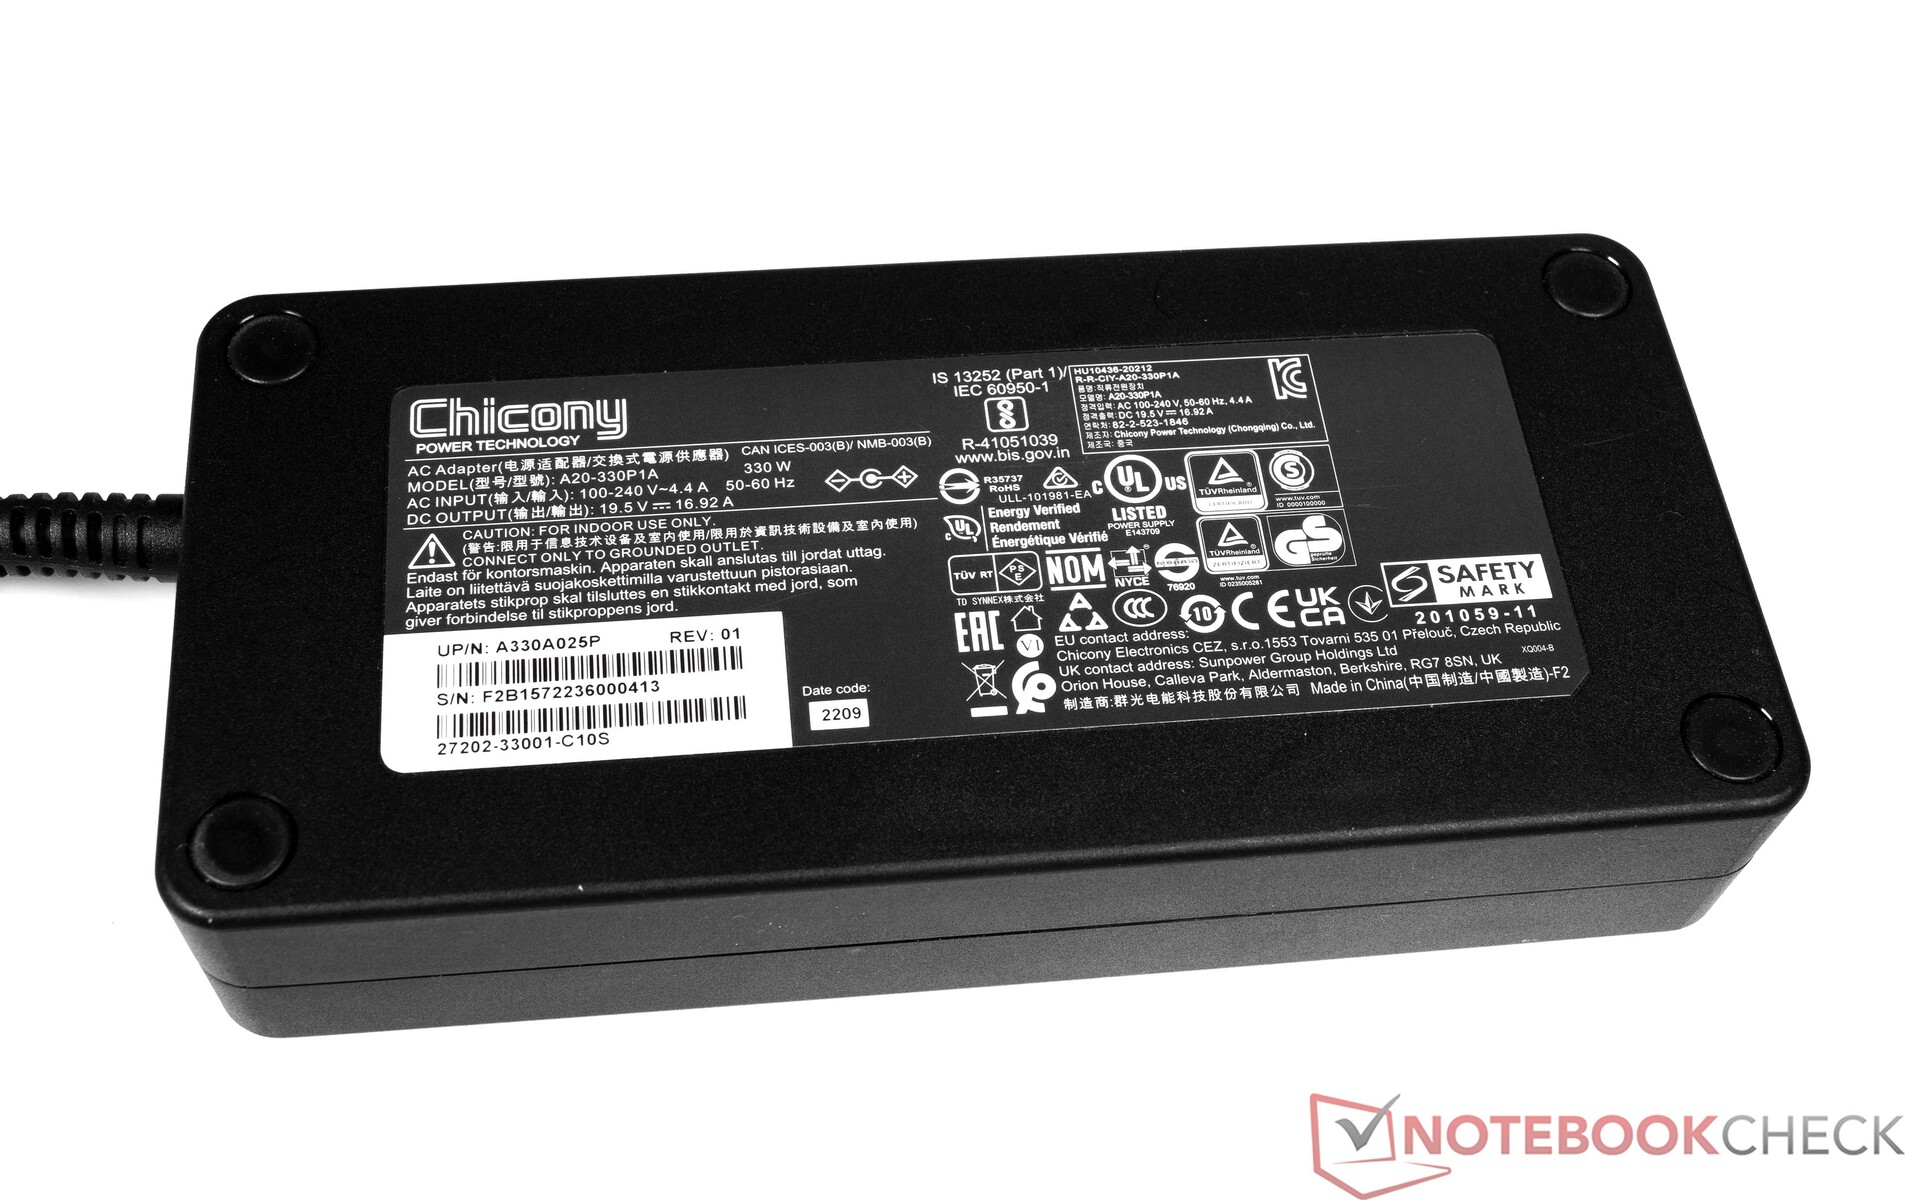
Aorus 17X AZF在能源消耗方面没有显示出任何异常情况。闲置时的确认值似乎相当好,在某些情况下明显优于竞争对手。我们看到负载下的正常比率。电源适配器的大小为330瓦,即使在短时间内需要334瓦,也是足够的。
| Off / Standby | |
| Idle | |
| Load |
|
Key:
min: | |
| Aorus 17X AZF i9-13900HX, GeForce RTX 4090 Laptop GPU | Medion Erazer Beast X40 i9-13900HX, GeForce RTX 4090 Laptop GPU | MSI GE78HX 13VH-070US i9-13950HX, GeForce RTX 4080 Laptop GPU | HP Omen 17-ck2097ng i9-13900HX, GeForce RTX 4080 Laptop GPU | MSI Titan GT77 HX 13VI i9-13950HX, GeForce RTX 4090 Laptop GPU | Alienware m18 R1 i9-13980HX, GeForce RTX 4090 Laptop GPU | Average NVIDIA GeForce RTX 4090 Laptop GPU | Average of class Gaming | |
|---|---|---|---|---|---|---|---|---|
| Power Consumption | -3% | -14% | -4% | -9% | -46% | -19% | 5% | |
| Idle Minimum * (Watt) | 11 | 11 -0% | 16.1 -46% | 16 -45% | 14 -27% | 21.6 -96% | 16.2 ? -47% | 13 ? -18% |
| Idle Average * (Watt) | 17 | 18 -6% | 24 -41% | 20 -18% | 21.6 -27% | 25.2 -48% | 23.1 ? -36% | 19 ? -12% |
| Idle Maximum * (Watt) | 29 | 30 -3% | 34 -17% | 26 10% | 24.8 14% | 56.7 -96% | 34.2 ? -18% | 24.6 ? 15% |
| Load Average * (Watt) | 134 | 136 -1% | 123.6 8% | 135 -1% | 122.5 9% | 164.1 -22% | 130.5 ? 3% | 110.7 ? 17% |
| Witcher 3 ultra * (Watt) | 278 | 280 -1% | 286 -3% | 215 23% | 265 5% | 311 -12% | ||
| Load Maximum * (Watt) | 334 | 363 -9% | 285.7 14% | 299 10% | 418 -25% | 338.9 -1% | 324 ? 3% | 259 ? 22% |
* ... smaller is better
Power consumption Witcher 3 / Stress test
Power consumption with an external monitor
电池寿命
Aorus 17X AZF在我们的WLAN测试(通过脚本调用网站)和视频测试(短片Big Buck Bunny,H.264编码,FHD,循环播放)中的运行时间分别为6:29 h和6:43 h。这些都是可以接受的速度,反映了游戏类笔记本电脑的平均水平。在这两项测试中,笔记本电脑的节能功能被禁用,显示亮度被设置为150cd/m²左右。在我们的案例中,这意味着亮度降低了50%。
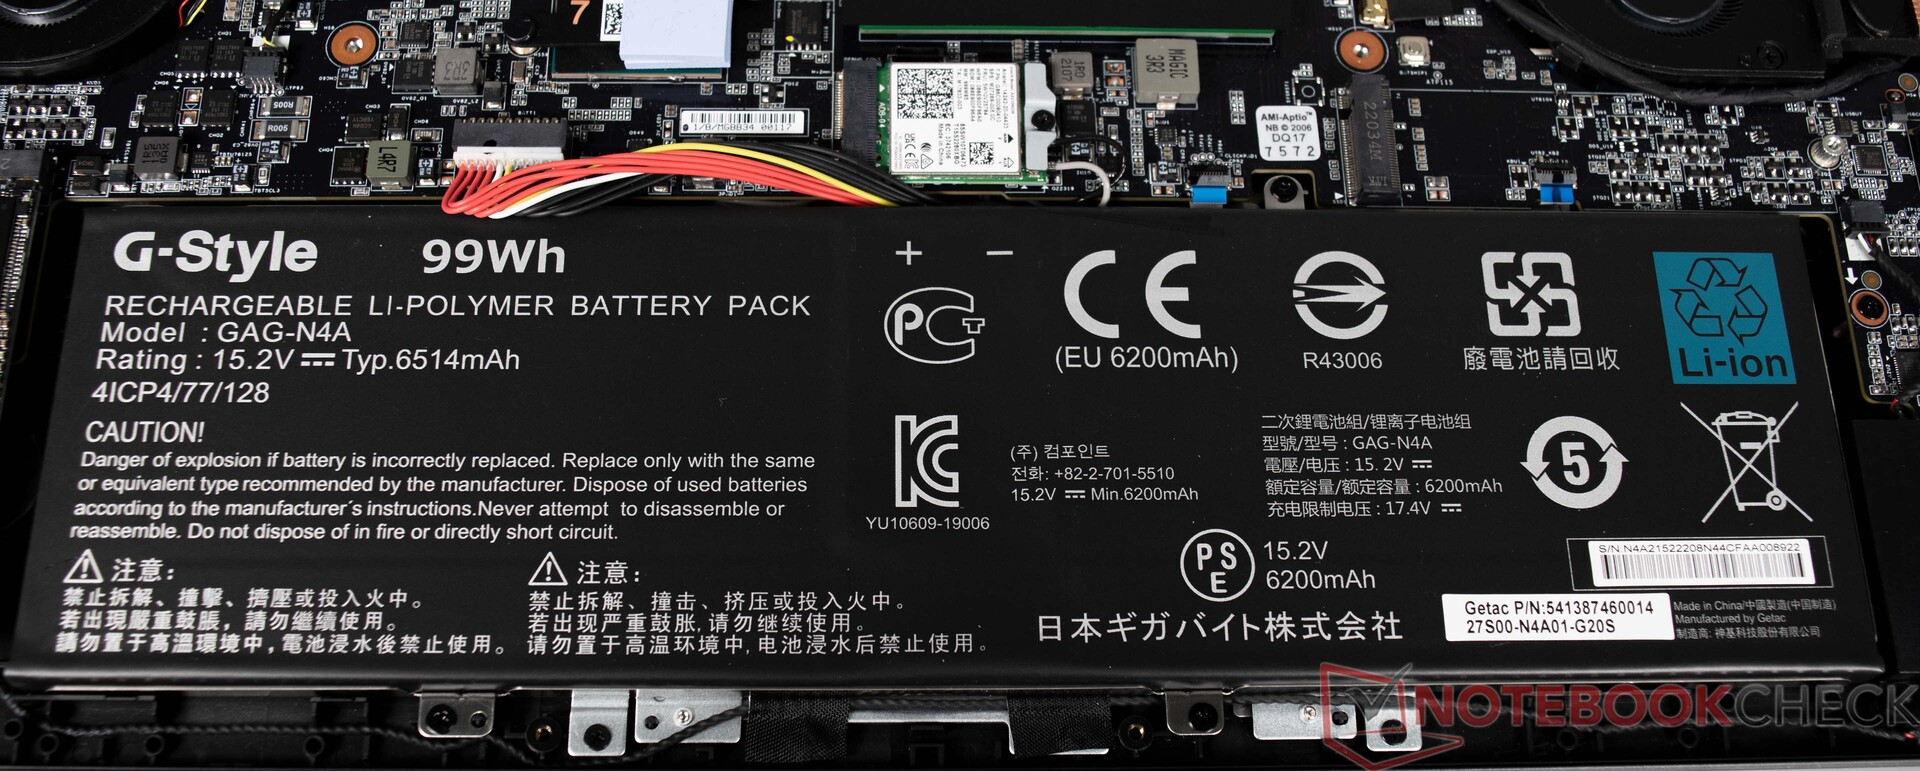
Aorus 17X AZF配备了一个99Wh的大电池,这也是笔记本电脑中的最大值。几乎所有的对比设备都提供相同容量的电池。只有惠普Omen 17不得不使用较小的83Wh电池,因此明显落后。
| Aorus 17X AZF i9-13900HX, GeForce RTX 4090 Laptop GPU, 99 Wh | Medion Erazer Beast X40 i9-13900HX, GeForce RTX 4090 Laptop GPU, 99.8 Wh | MSI GE78HX 13VH-070US i9-13950HX, GeForce RTX 4080 Laptop GPU, 99 Wh | HP Omen 17-ck2097ng i9-13900HX, GeForce RTX 4080 Laptop GPU, 83 Wh | MSI Titan GT77 HX 13VI i9-13950HX, GeForce RTX 4090 Laptop GPU, 99.9 Wh | Alienware m18 R1 i9-13980HX, GeForce RTX 4090 Laptop GPU, 97 Wh | Average of class Gaming | |
|---|---|---|---|---|---|---|---|
| Battery runtime | -1% | -18% | -44% | -20% | -46% | -1% | |
| Reader / Idle (h) | 9 | 9.4 4% | 7.3 -19% | 4.2 -53% | 5.6 -38% | 8.27 ? -8% | |
| H.264 (h) | 6.7 | 6.9 3% | 3.7 -45% | 6 -10% | 8.32 ? 24% | ||
| WiFi v1.3 (h) | 6.5 | 6.4 -2% | 6.1 -6% | 3.6 -45% | 5.3 -18% | 4.3 -34% | 7.11 ? 9% |
| Load (h) | 2.1 | 1.9 -10% | 1.5 -29% | 1.4 -33% | 1.4 -33% | 0.7 -67% | 1.502 ? -28% |
Pros
Cons
评语--移动游戏的动力源泉,不折不扣。
Aorus 17X AZF是一款为极端要求设计的游戏笔记本。这台17英寸的笔记本能够在原生显示分辨率下毫无问题地运行所有测试的游戏,并且在质量上没有损失。然而,人们被限制在1440p游戏,这很好。性能储备是可用的,可以通过外部4K显示器访问。该NvidiaGeForce RTX 4090笔记本GPU提供了大量的性能,并且能够永久地保持这种性能。它的侧面是一个强大的 英特尔Core-i7-13900HX.然而,在与同类设备的直接比较中,Aorus 17X AZF的CPU并不总是能够证明自己。然而,差距并不大,人们在日常生活中不太可能注意到这一点。
我们非常喜欢其余的硬件:32GB DDR5内存和总共2TB的固态硬盘存储使系统总体上非常出色,这样你就不必在一段时间内升级。支持QHD的显示屏也很适合笔记本电脑,也适用于照片和视频编辑。
另一方面,音量有限制,在加载过程中不能忽视。话说回来,这个问题也是其他游戏笔记本的通病,并不是Aorus 17X AZF独有的。连接性也需要改进,对于一个17英寸的设备来说可以更广泛。至少该笔记本有一个现代的Thunderbolt连接。
在移动性方面,Aorus 17X AZF的定位很好,因为记录的电池运行时间反映了一个良好的等级平均水平。该设备甚至可以通过技嘉控制中心进行几乎无声的操作,该中心提供了许多调整选项。
那些寻找更便宜的替代品的人应该看看惠普Omen 17,它在1,440p下也能提供出色的性能,并配有NvidiaGeForce RTX 4080笔记本GPU.
价格和可用性
Aorus 17X AZF
- 04/14/2023 v7 (old)
Sebastian Bade
Transparency
The selection of devices to be reviewed is made by our editorial team. The test sample was provided to the author as a loan by the manufacturer or retailer for the purpose of this review. The lender had no influence on this review, nor did the manufacturer receive a copy of this review before publication. There was no obligation to publish this review. As an independent media company, Notebookcheck is not subjected to the authority of manufacturers, retailers or publishers.
This is how Notebookcheck is testing
Every year, Notebookcheck independently reviews hundreds of laptops and smartphones using standardized procedures to ensure that all results are comparable. We have continuously developed our test methods for around 20 years and set industry standards in the process. In our test labs, high-quality measuring equipment is utilized by experienced technicians and editors. These tests involve a multi-stage validation process. Our complex rating system is based on hundreds of well-founded measurements and benchmarks, which maintains objectivity. Further information on our test methods can be found here.
Price comparison

