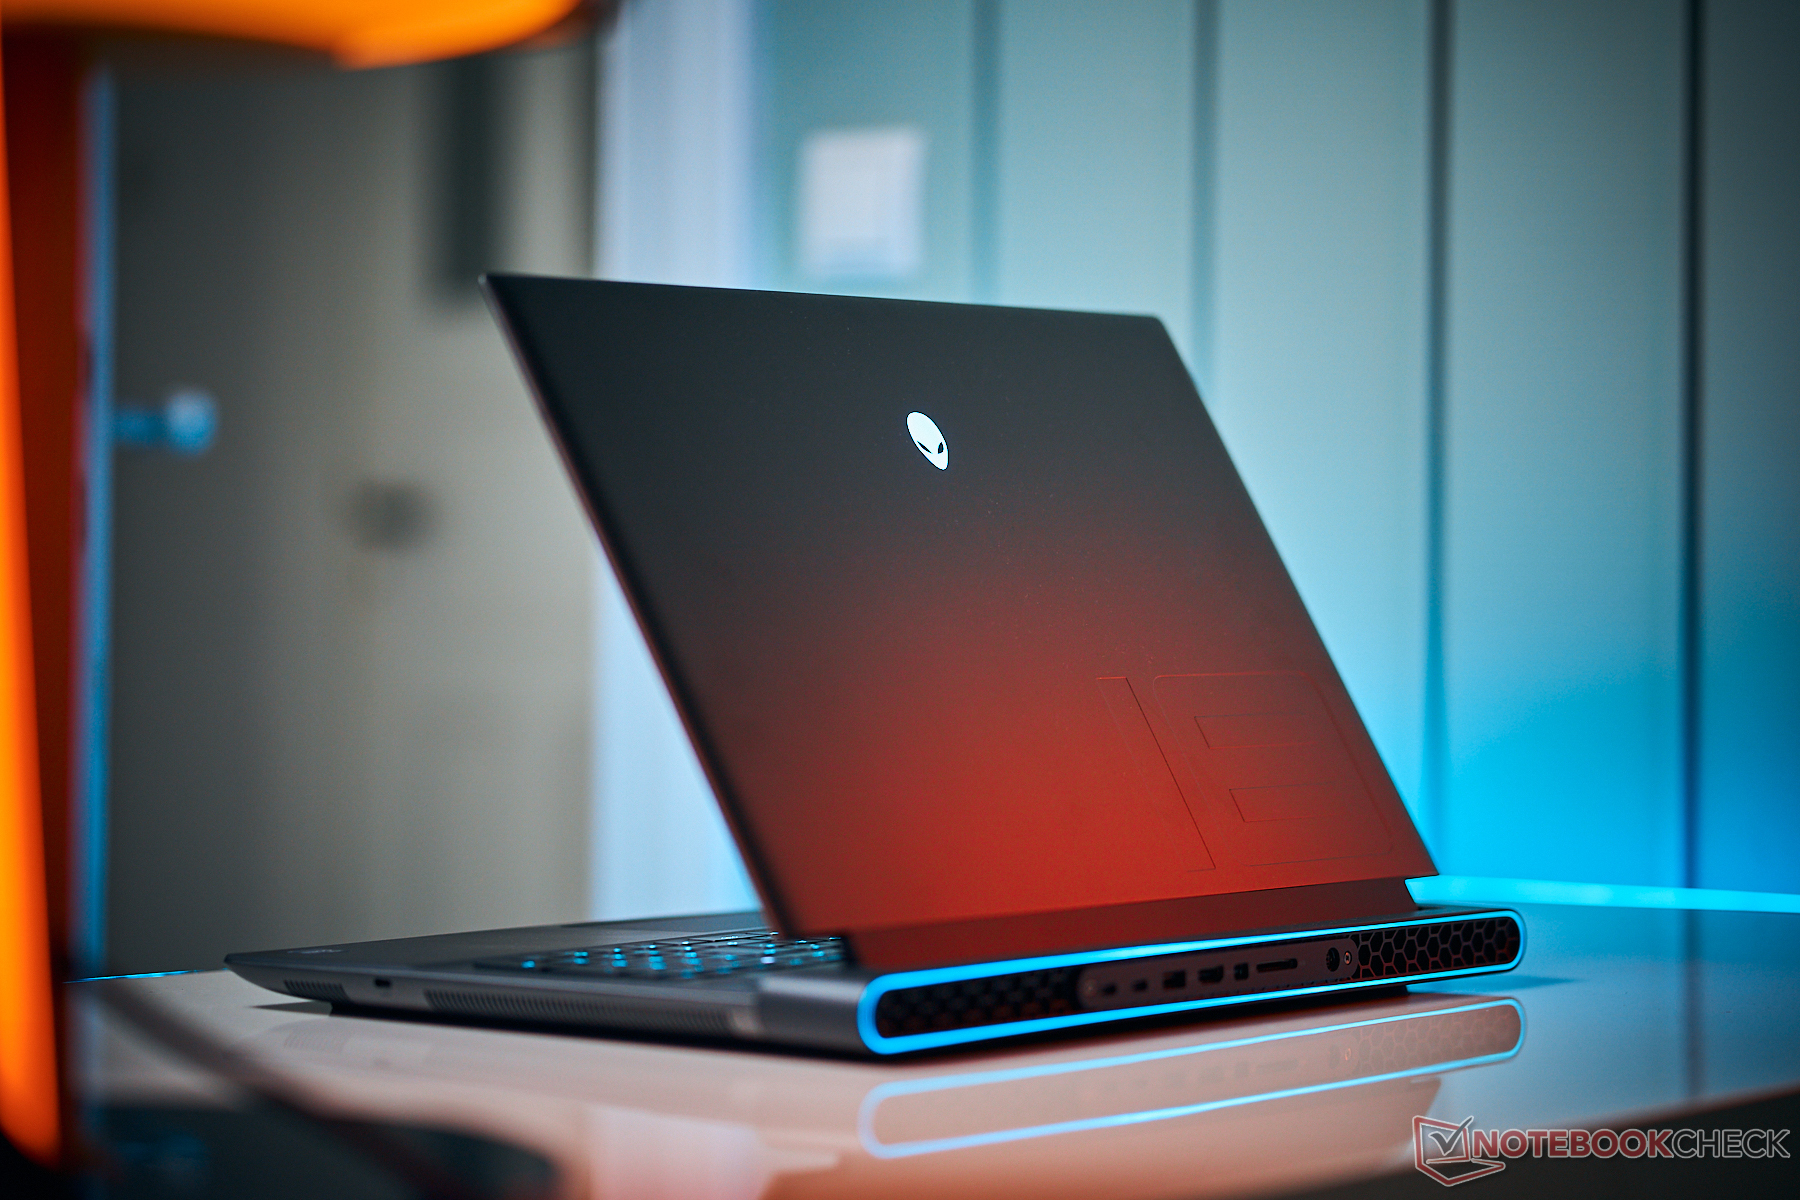
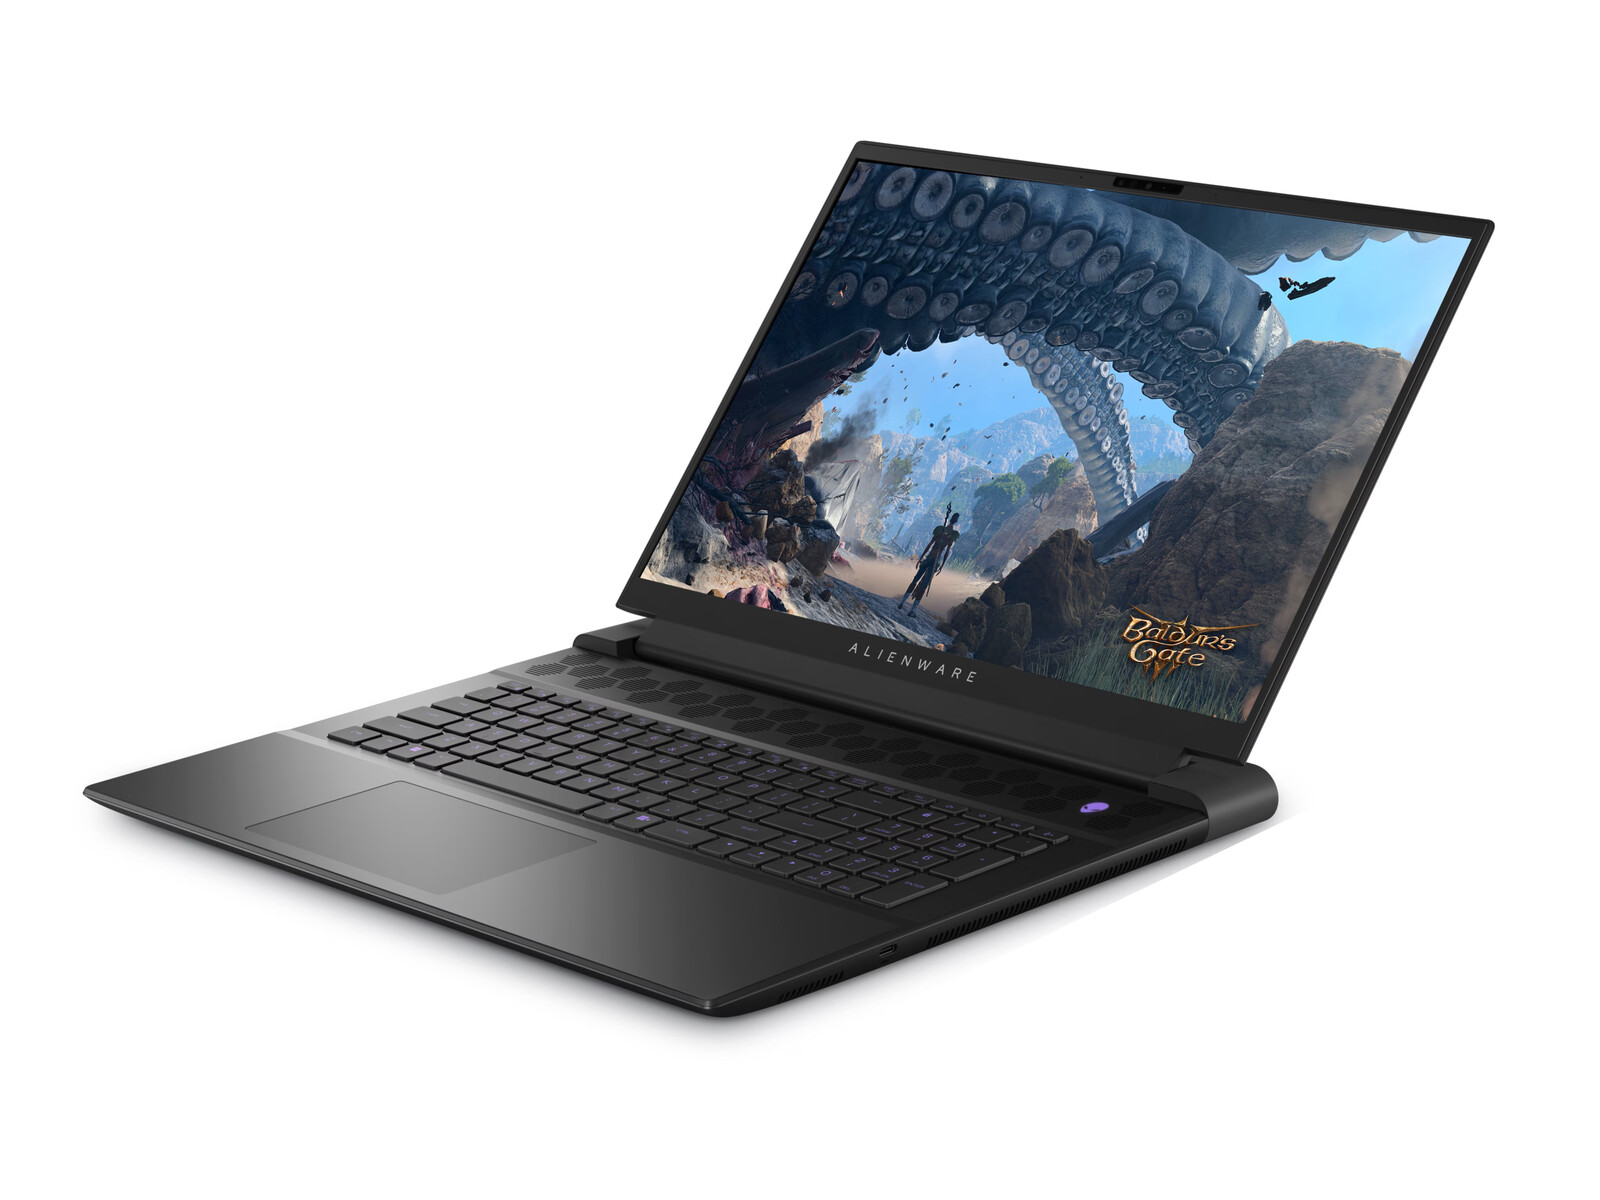
Alienware m18 R2 笔记本电脑评测:从酷睿 i9-13980HX 跃升至 i9-14900HX

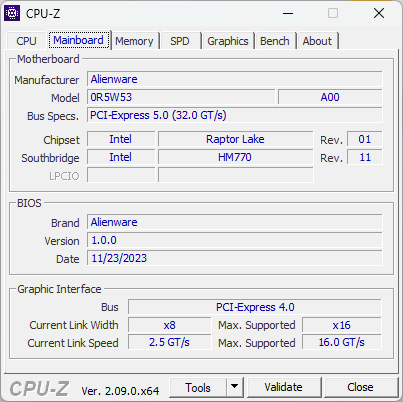
戴尔今年更新了 Alienware m18 系列,推出了全新的 m18 R2。与从 m16 R1到 m16 R2不同的是,m18 R2 采用了与其前代产品相同的机箱设计,但采用了新的 Raptor Lake-HX Core ix-14000HX CPU 来取代旧款 Core ix-13000HX CPU。其他方面几乎没有变化,因此我们建议查看我们现有的关于 m18 R1和 m18 R1 AMD配置的评论,以了解有关 m18 r2 物理特性的更多信息。
我们的评测机是最高端的配置,配备酷睿 i9-14900HX CPU、175 WGeForce RTX 4090 GPU、1600p 165 Hz IPS 显示屏和 CherryMX 超扁平机械键盘,售价约为 3200 美元。其他 SKU 可能包括酷睿 i7-14650HX、RTX 4060、1200p 480 Hz 显示屏和标准薄膜键盘,起价不到 2000 美元。
更多 Alienware 评论:
潜在的竞争对手比较
Rating | Date | Model | Weight | Height | Size | Resolution | Price |
|---|---|---|---|---|---|---|---|
| 89.5 % v7 (old) | 03 / 2024 | Alienware m18 R2 i9-14900HX, GeForce RTX 4090 Laptop GPU | 4 kg | 26.7 mm | 18.00" | 2560x1600 | |
| 89.2 % v7 (old) | 11 / 2023 | Alienware m18 R1 AMD R9 7945HX, Radeon RX 7900M | 3.9 kg | 26.7 mm | 18.00" | 1920x1200 | |
| 90.7 % v7 (old) | 04 / 2023 | Alienware m18 R1 i9-13980HX, GeForce RTX 4090 Laptop GPU | 3.9 kg | 26.7 mm | 18.00" | 1920x1200 | |
| 88.8 % v7 (old) | 01 / 2024 | MSI Titan 18 HX A14VIG i9-14900HX, GeForce RTX 4090 Laptop GPU | 3.6 kg | 32.1 mm | 18.00" | 3840x2400 | |
| 87.4 % v7 (old) | 03 / 2023 | Asus ROG Strix G18 G814JI i7-13650HX, GeForce RTX 4070 Laptop GPU | 3 kg | 31 mm | 18.00" | 2560x1600 | |
| 88.3 % v7 (old) | 10 / 2023 | Acer Predator Helios 18 N23Q2 i9-13900HX, GeForce RTX 4080 Laptop GPU | 3.2 kg | 29.15 mm | 18.00" | 2560x1600 |
机箱--后置散热底板依然宽大
今年,RJ-45 端口从 Killer E3000 升级到 Killer E5000,吞吐量提高了两倍(2.5 Gbps 对 5 Gbps)。除此之外,外部设计与以前相同。
SD 读卡器
| SD Card Reader | |
| average JPG Copy Test (av. of 3 runs) | |
| Alienware m18 R1 (Angelibird AV Pro V60) | |
| Alienware m18 R2 (Toshiba Exceria Pro SDXC 64 GB UHS-II) | |
| Alienware m18 R1 AMD (Toshiba Exceria Pro SDXC 64 GB UHS-II) | |
| MSI Titan 18 HX A14VIG (Toshiba Exceria Pro SDXC 64 GB UHS-II) | |
| Acer Predator Helios 18 N23Q2 | |
| maximum AS SSD Seq Read Test (1GB) | |
| Alienware m18 R1 AMD (Toshiba Exceria Pro SDXC 64 GB UHS-II) | |
| Alienware m18 R2 (Toshiba Exceria Pro SDXC 64 GB UHS-II) | |
| Alienware m18 R1 (Angelibird AV Pro V60) | |
| MSI Titan 18 HX A14VIG (Toshiba Exceria Pro SDXC 64 GB UHS-II) | |
| Acer Predator Helios 18 N23Q2 | |
交流
| Networking | |
| iperf3 transmit AXE11000 | |
| Asus ROG Strix G18 G814JI | |
| Alienware m18 R1 AMD | |
| Alienware m18 R1 | |
| MSI Titan 18 HX A14VIG | |
| Acer Predator Helios 18 N23Q2 | |
| Alienware m18 R2 | |
| iperf3 receive AXE11000 | |
| Asus ROG Strix G18 G814JI | |
| Alienware m18 R1 AMD | |
| Alienware m18 R2 | |
| Alienware m18 R1 | |
| MSI Titan 18 HX A14VIG | |
| Acer Predator Helios 18 N23Q2 | |
| iperf3 transmit AXE11000 6GHz | |
| Alienware m18 R1 AMD | |
| Acer Predator Helios 18 N23Q2 | |
| Alienware m18 R1 | |
| MSI Titan 18 HX A14VIG | |
| Alienware m18 R2 | |
| iperf3 receive AXE11000 6GHz | |
| Alienware m18 R1 AMD | |
| Acer Predator Helios 18 N23Q2 | |
| MSI Titan 18 HX A14VIG | |
| Alienware m18 R1 | |
| Alienware m18 R2 | |
网络摄像头


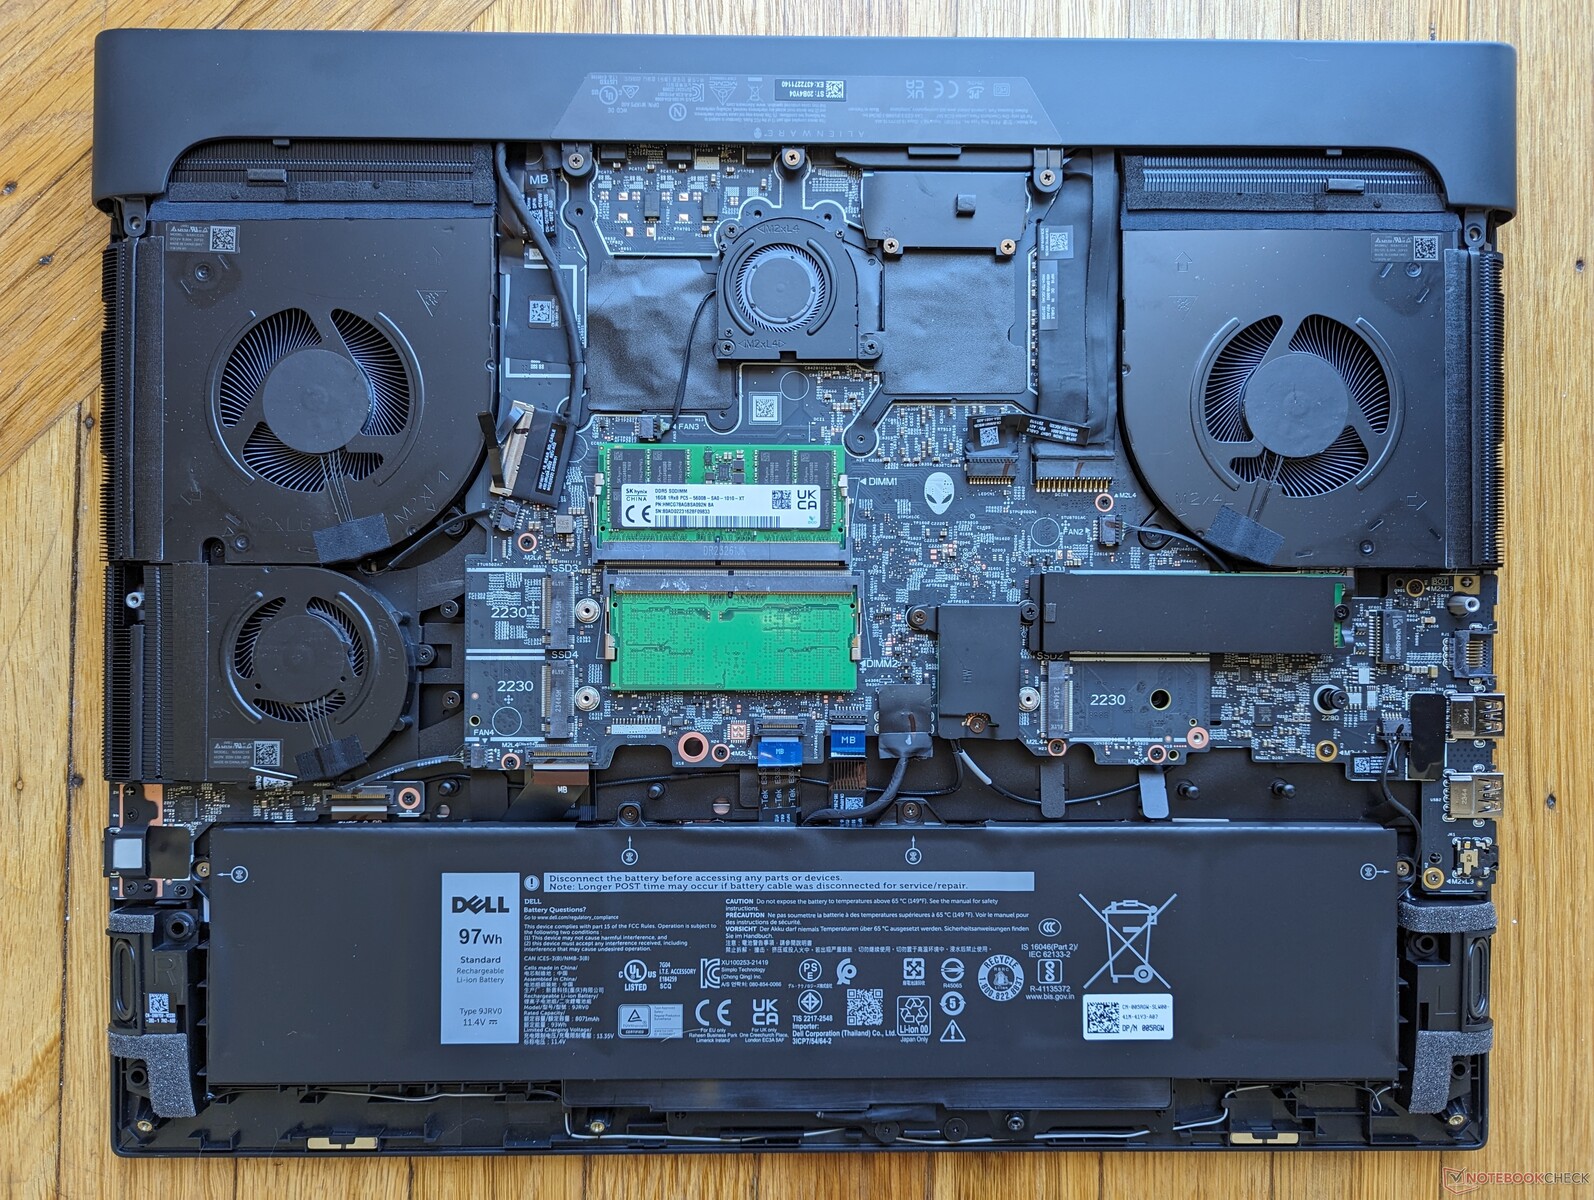
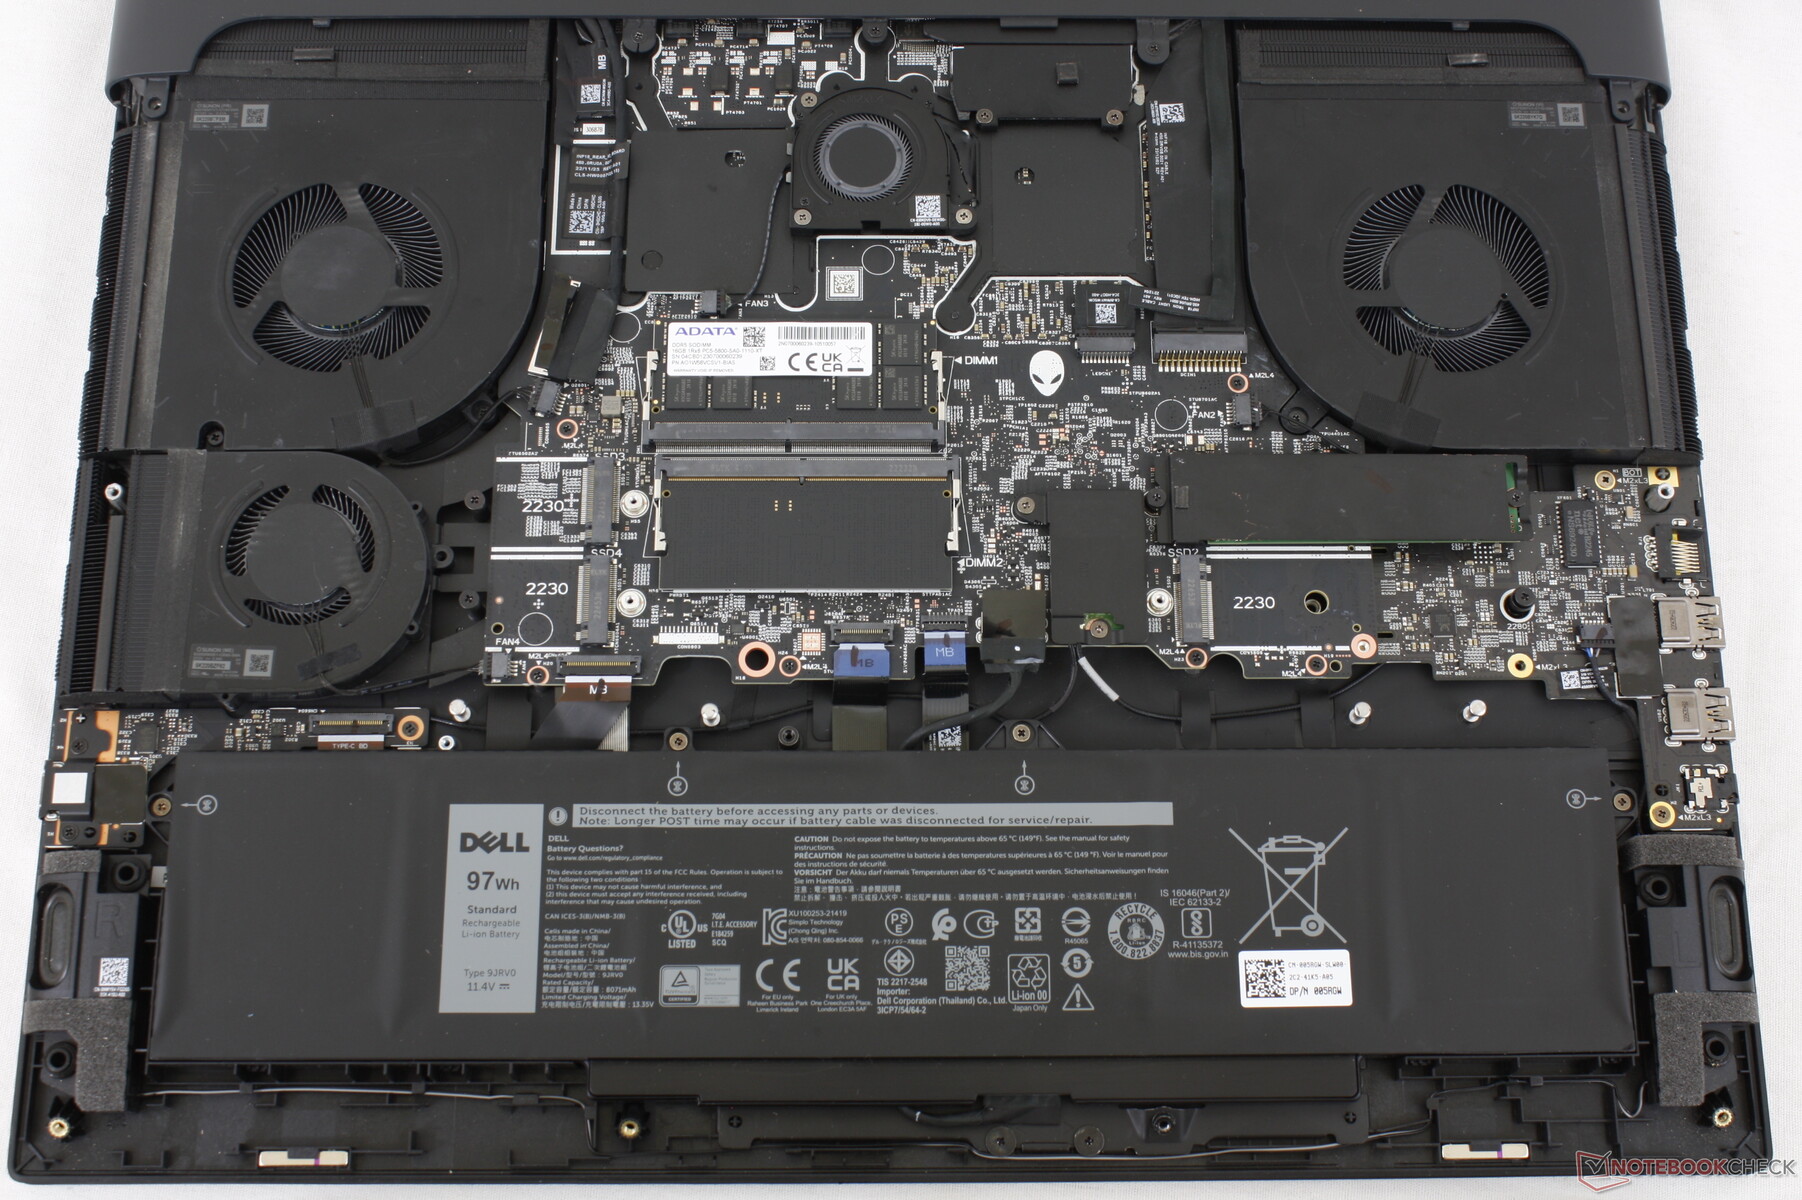
维护
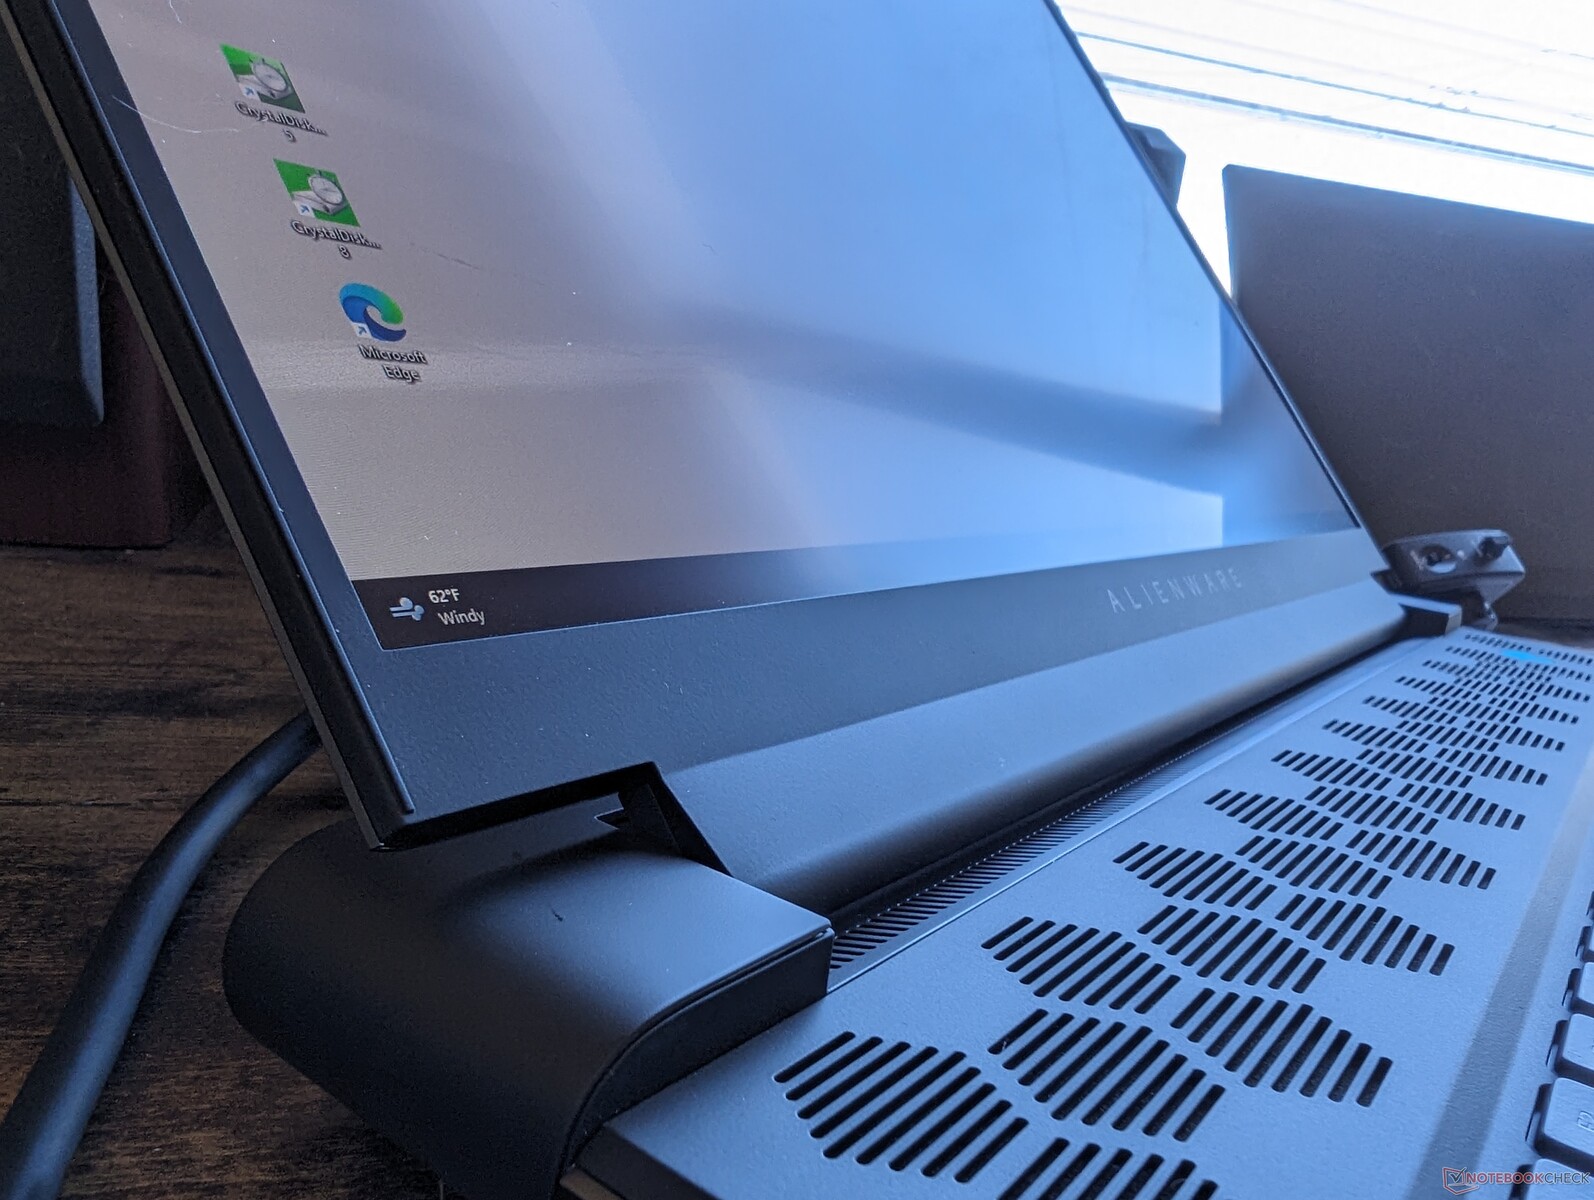
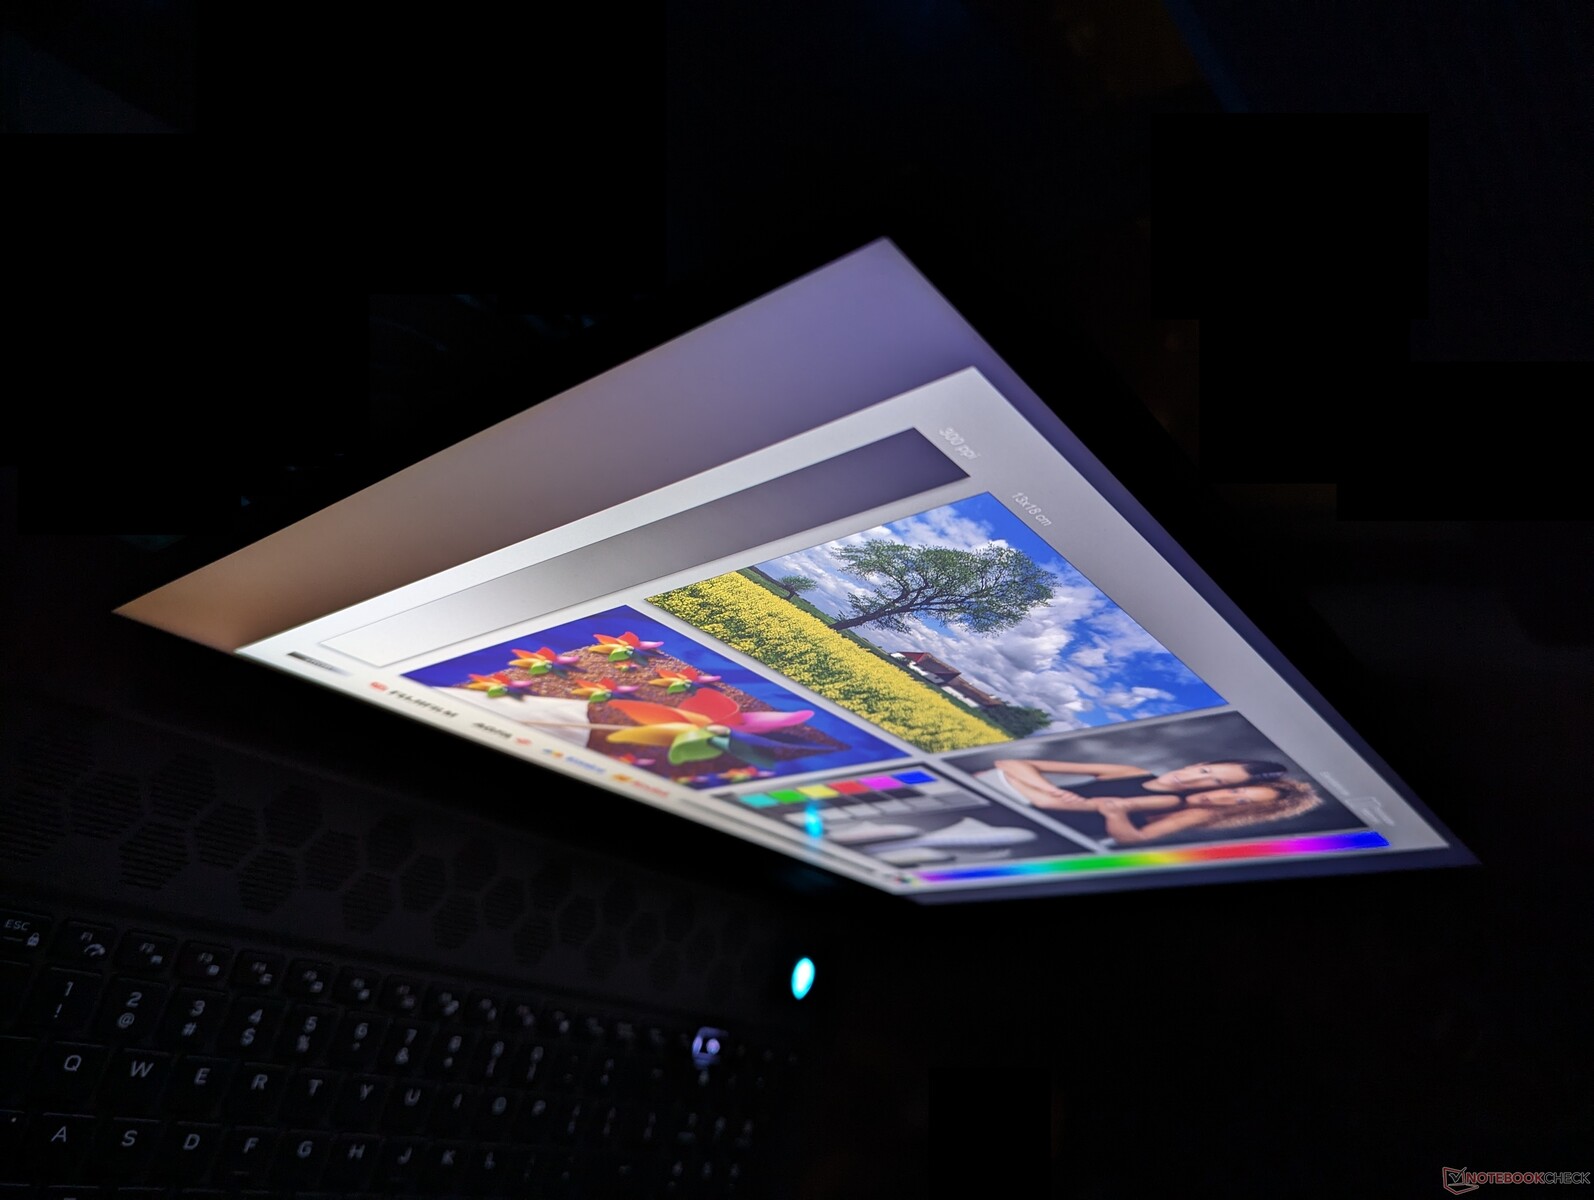
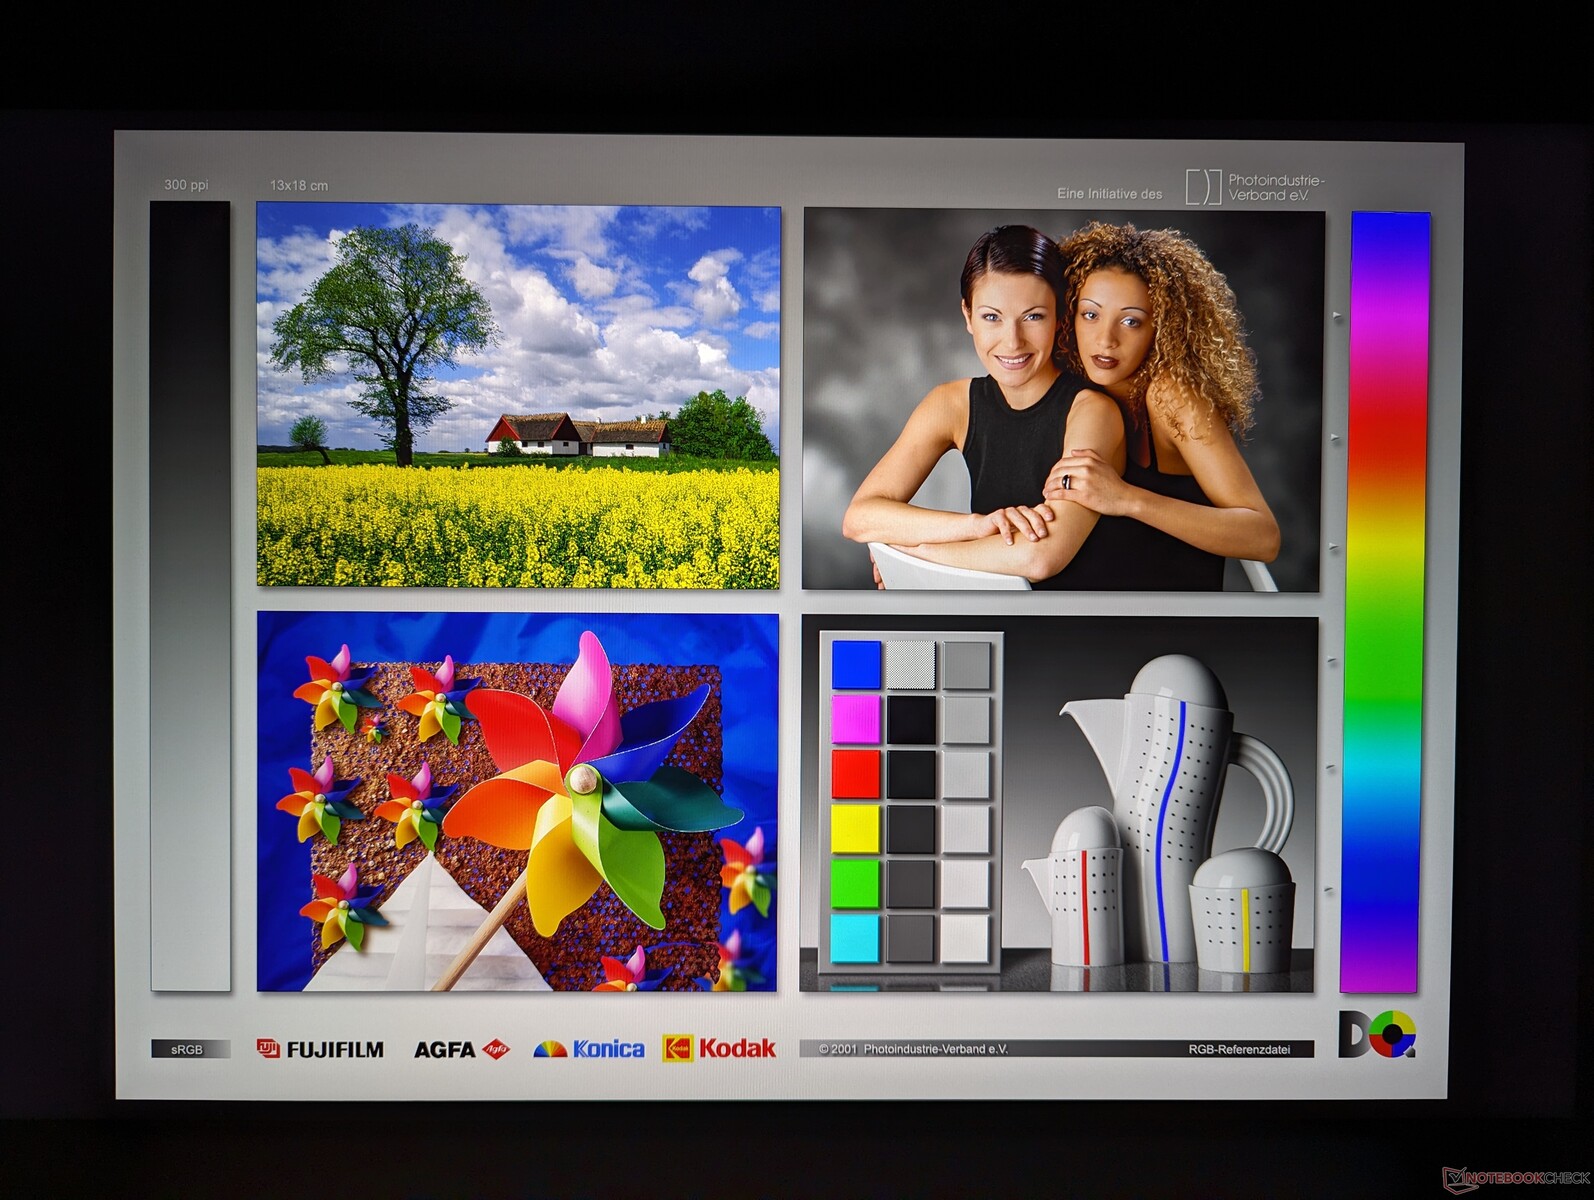
显示屏 - 1200p 还是 1600p?
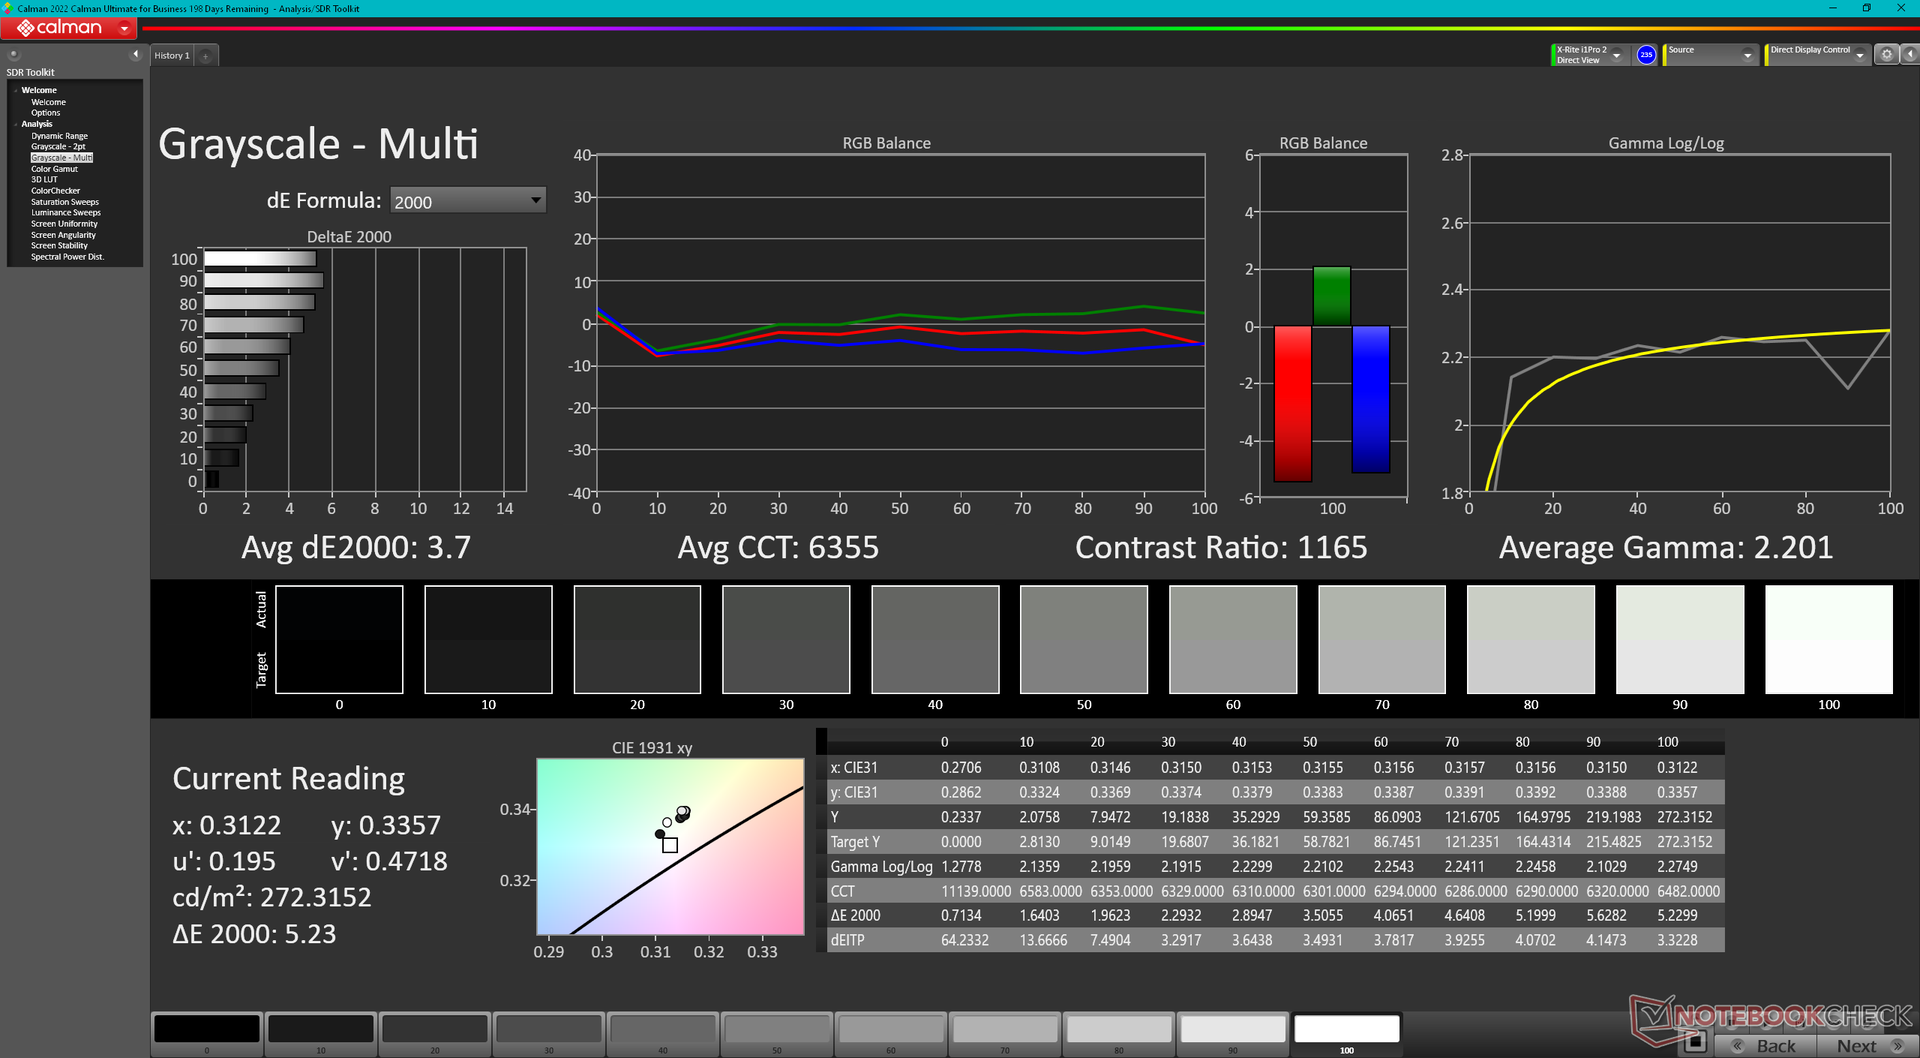
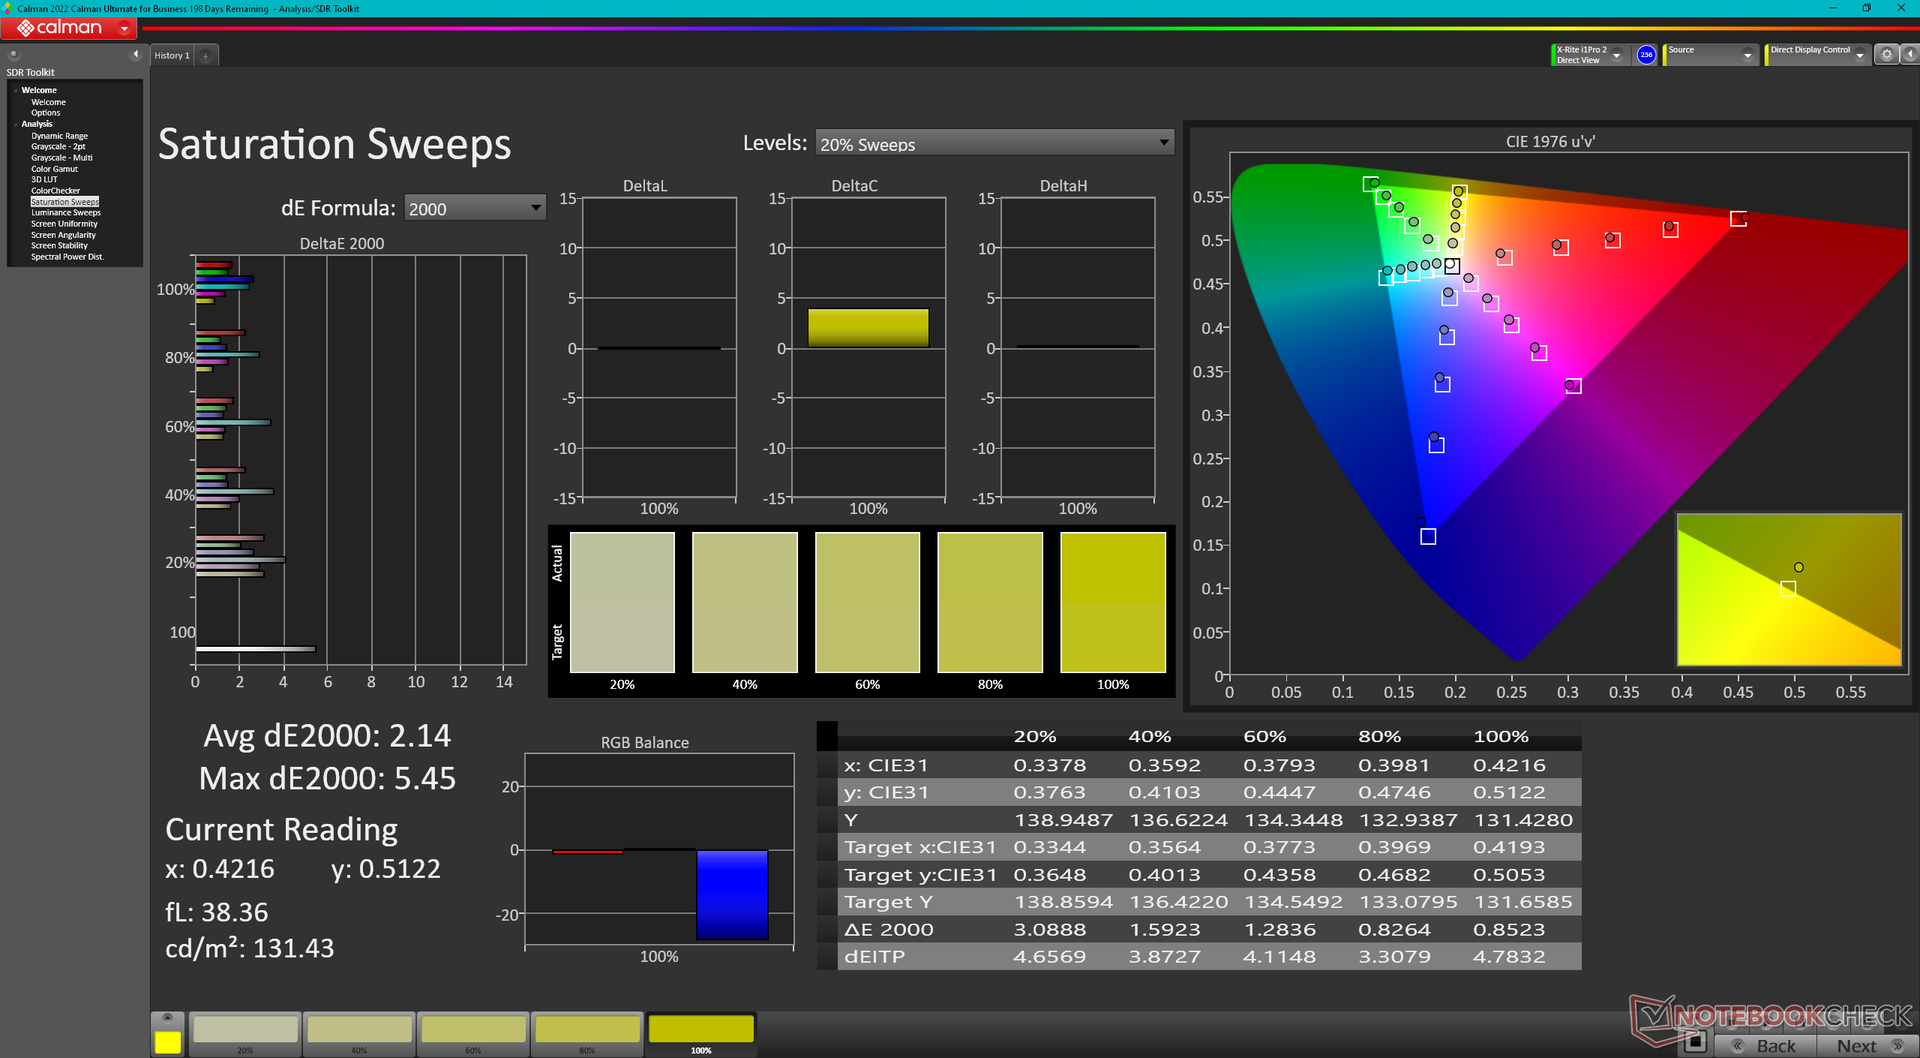
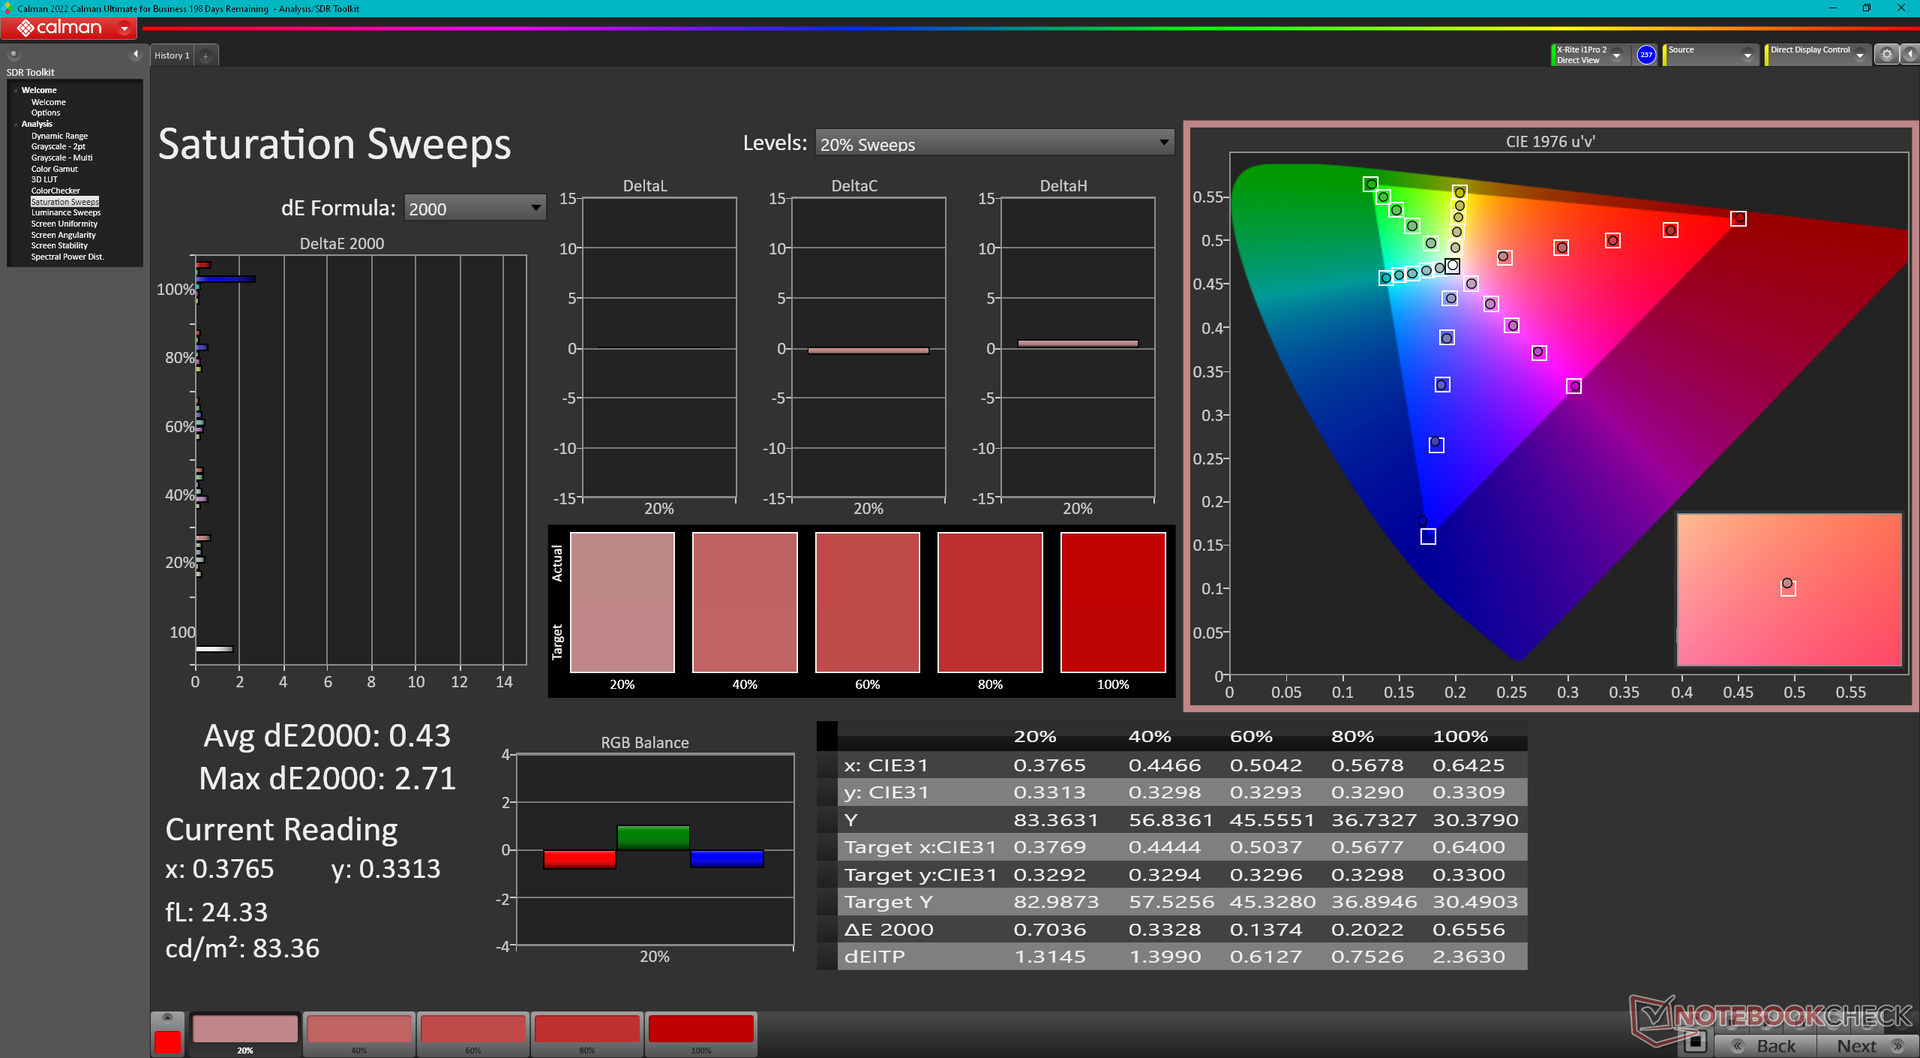
有趣的是,我们的 m18 R2 配置的面板名称与 m18 R1 配置的面板名称相同,尽管它们的原始分辨率(1600p 对 1200p)和刷新率(165 Hz 对 480 Hz)不同。除此之外,两款面板都具有相似的 P3 色彩、快速响应时间和不错的 ~1000:1 对比度。
在看过两款面板后,我们建议选择 1600p,因为 18 英寸屏幕上的 1200p 并不十分清晰,而 480 Hz 的刷新率在绝大多数使用情况下仅比 165 Hz 略胜一筹。
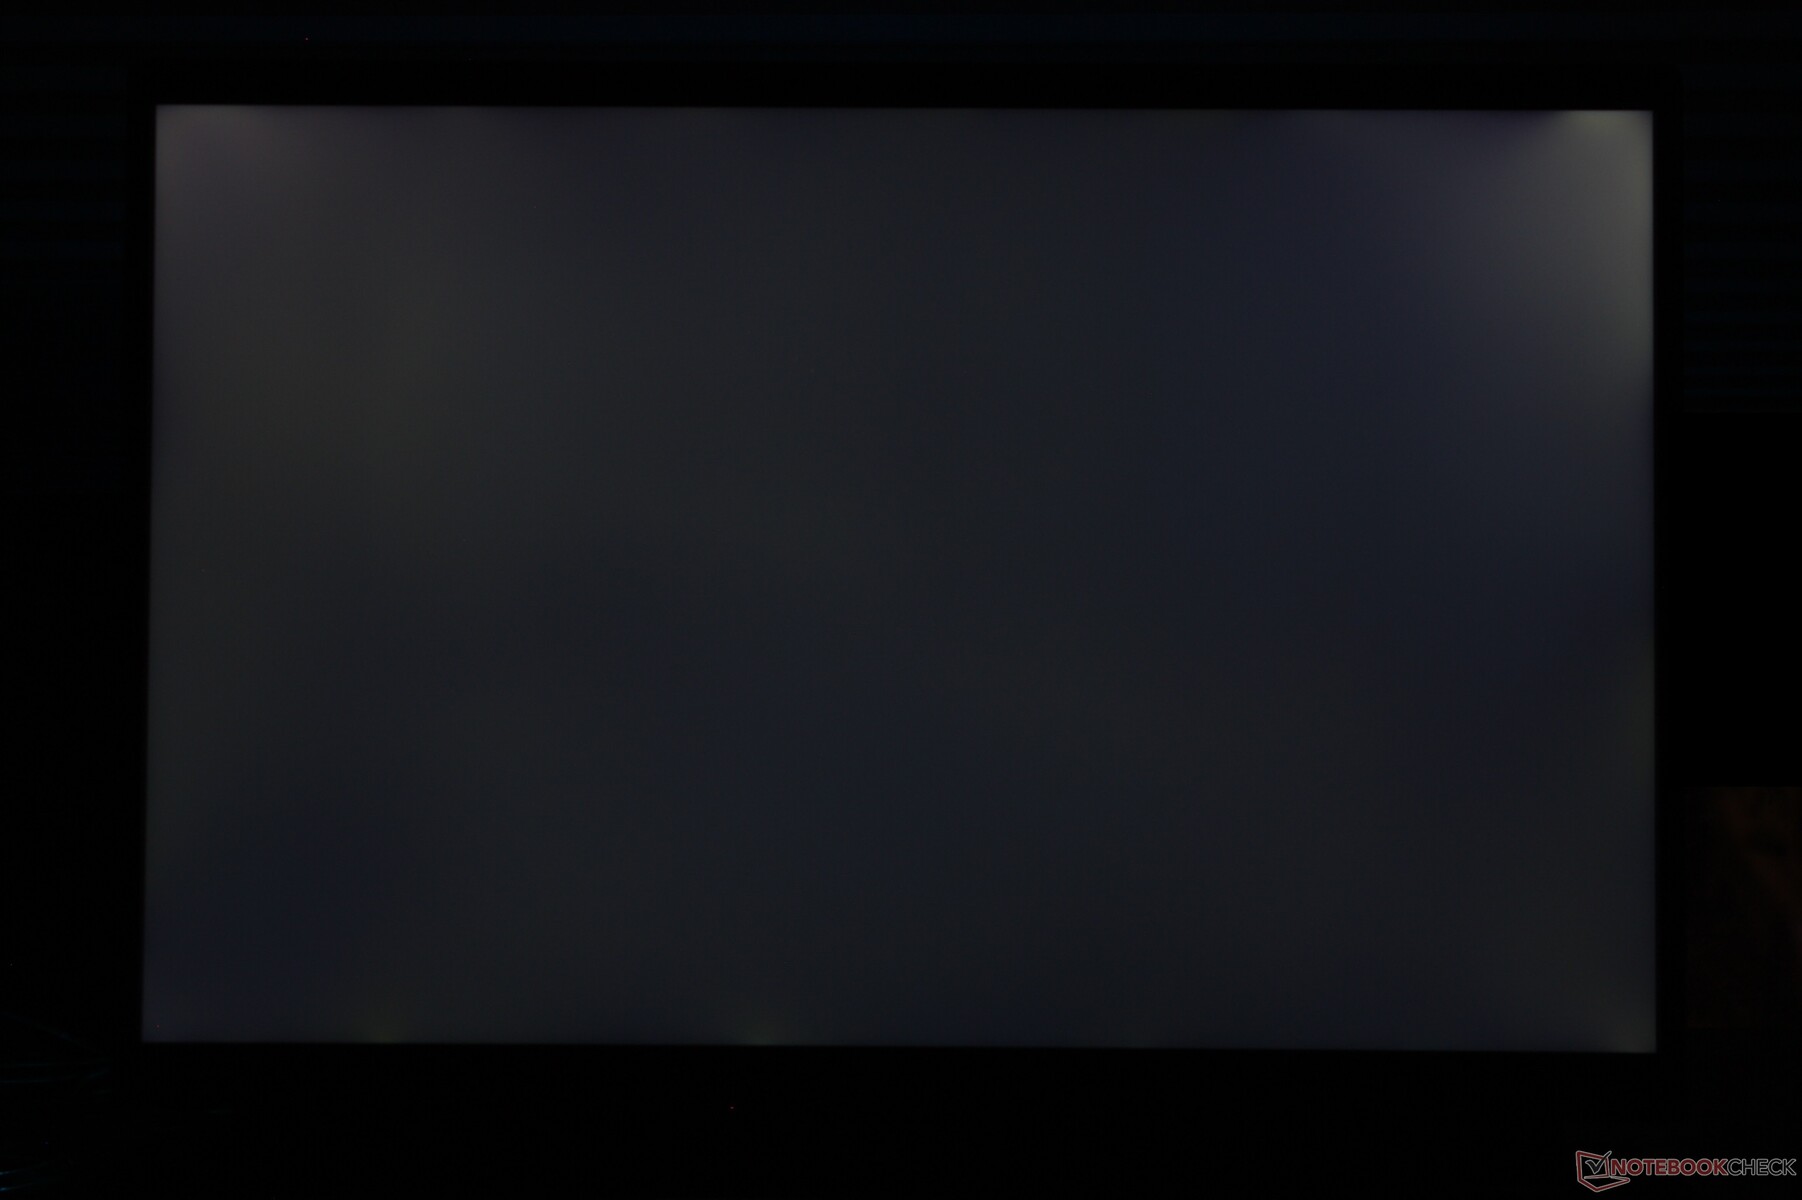
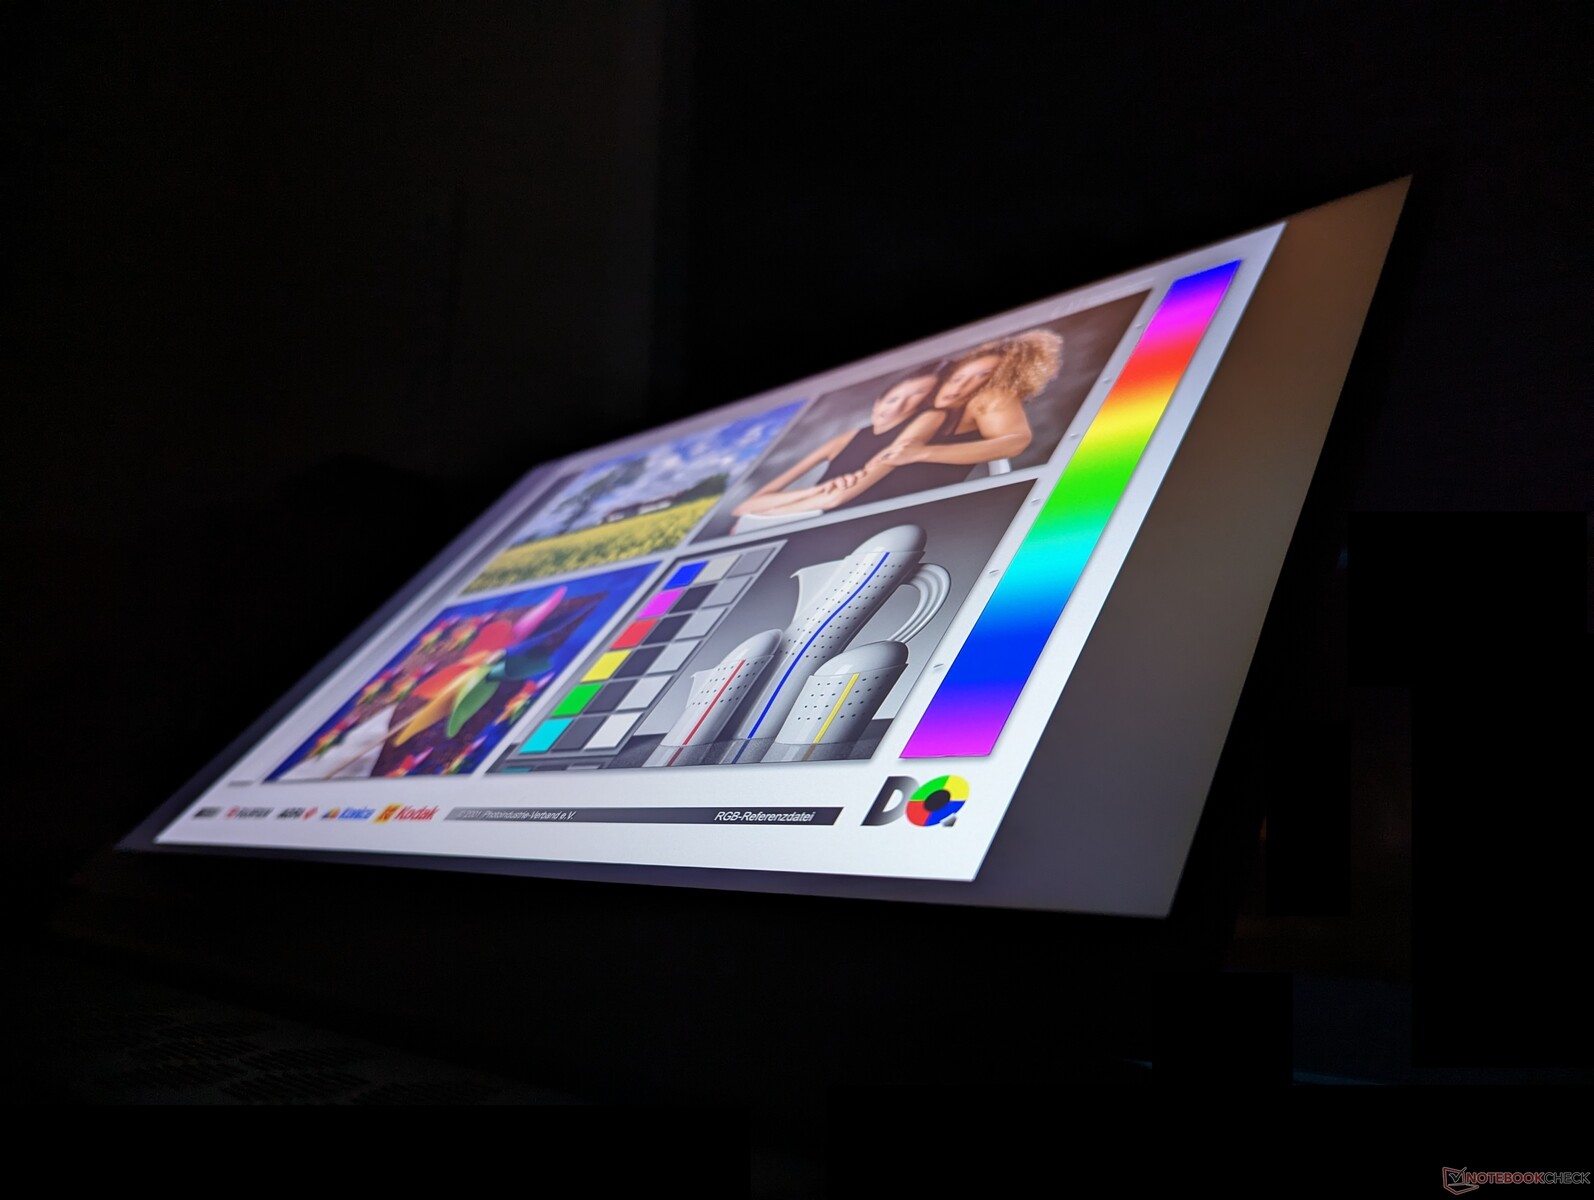
Windows 不支持动态分辨率,因此刷新率在操作系统上被固定为 165 Hz 或 60 Hz。不过,在 dGPU 模式下运行游戏时仍支持 G-Sync。由于背光亮度不足以满足 HDR 要求,因此不支持 HDR。事实上,我们的 1600p 显示屏甚至比 1200p 配置的平均亮度还要低一些。
| |||||||||||||||||||||||||
Brightness Distribution: 78 %
Center on Battery: 271.8 cd/m²
Contrast: 1007:1 (Black: 0.27 cd/m²)
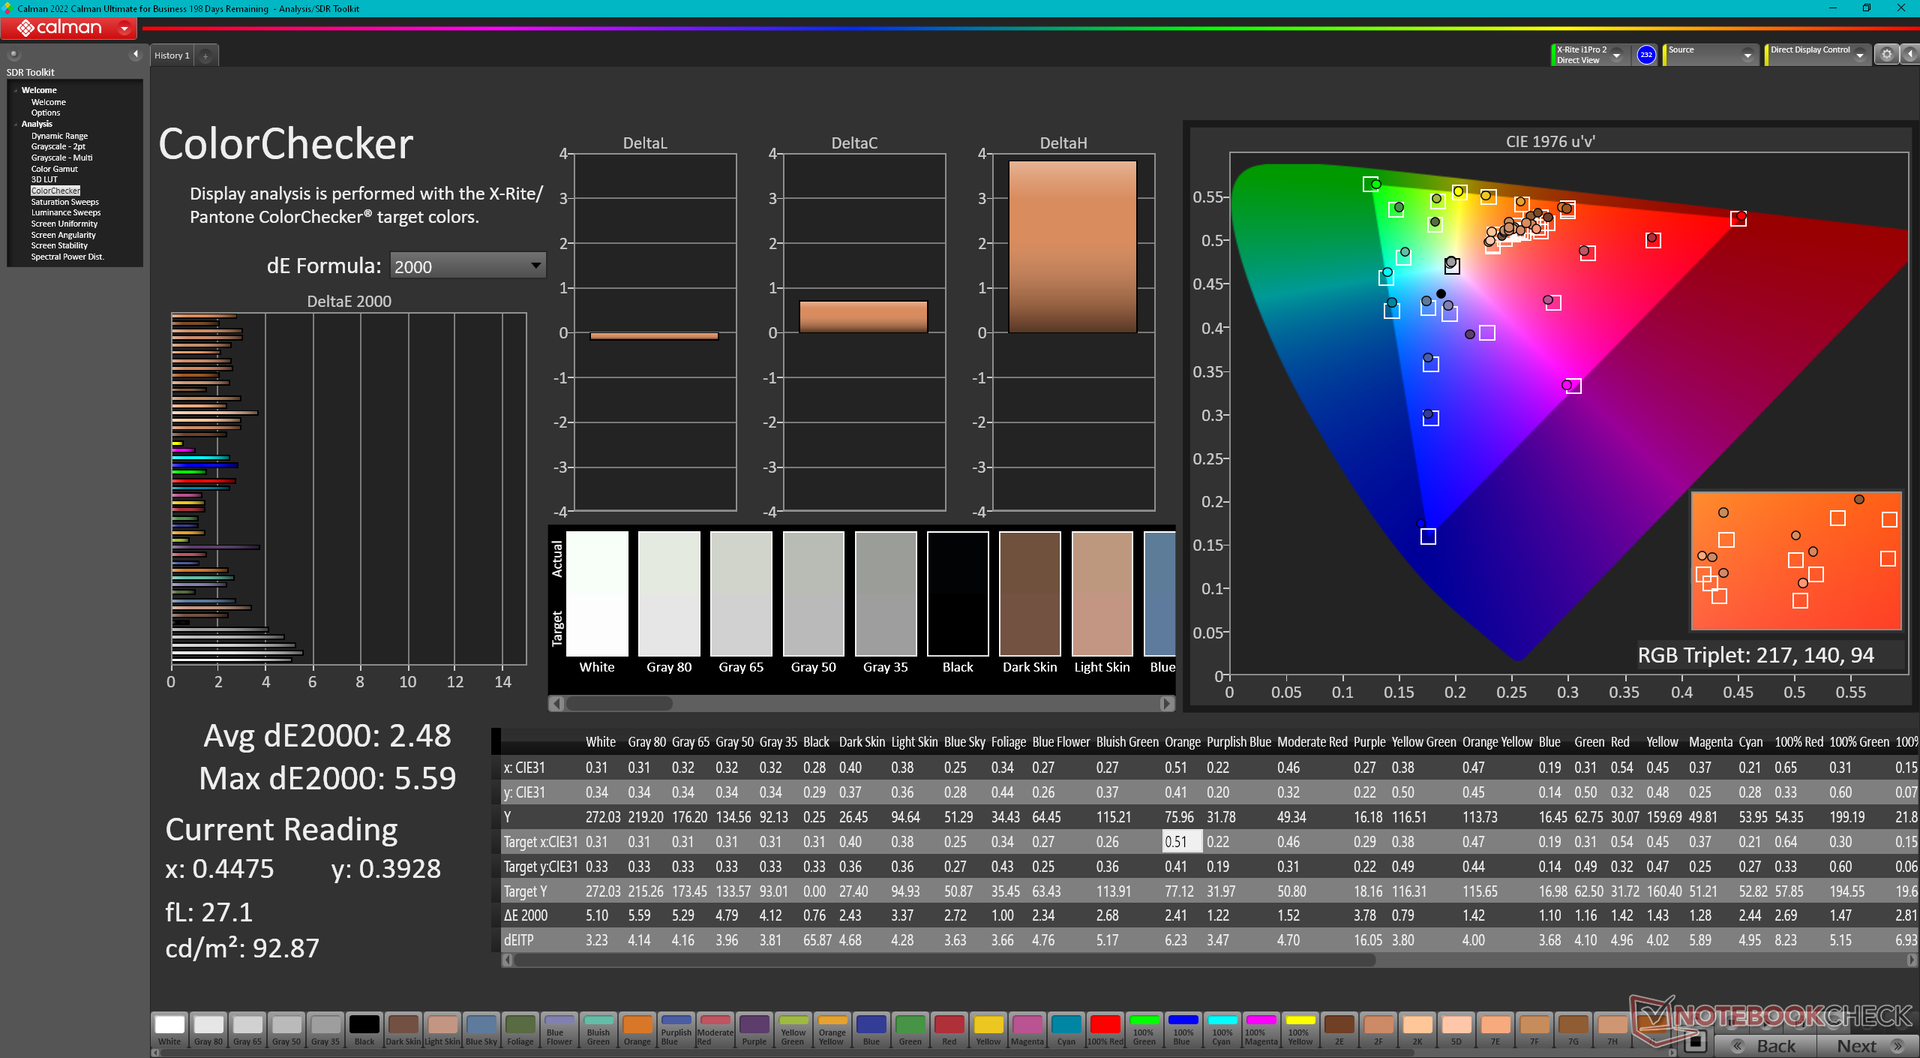
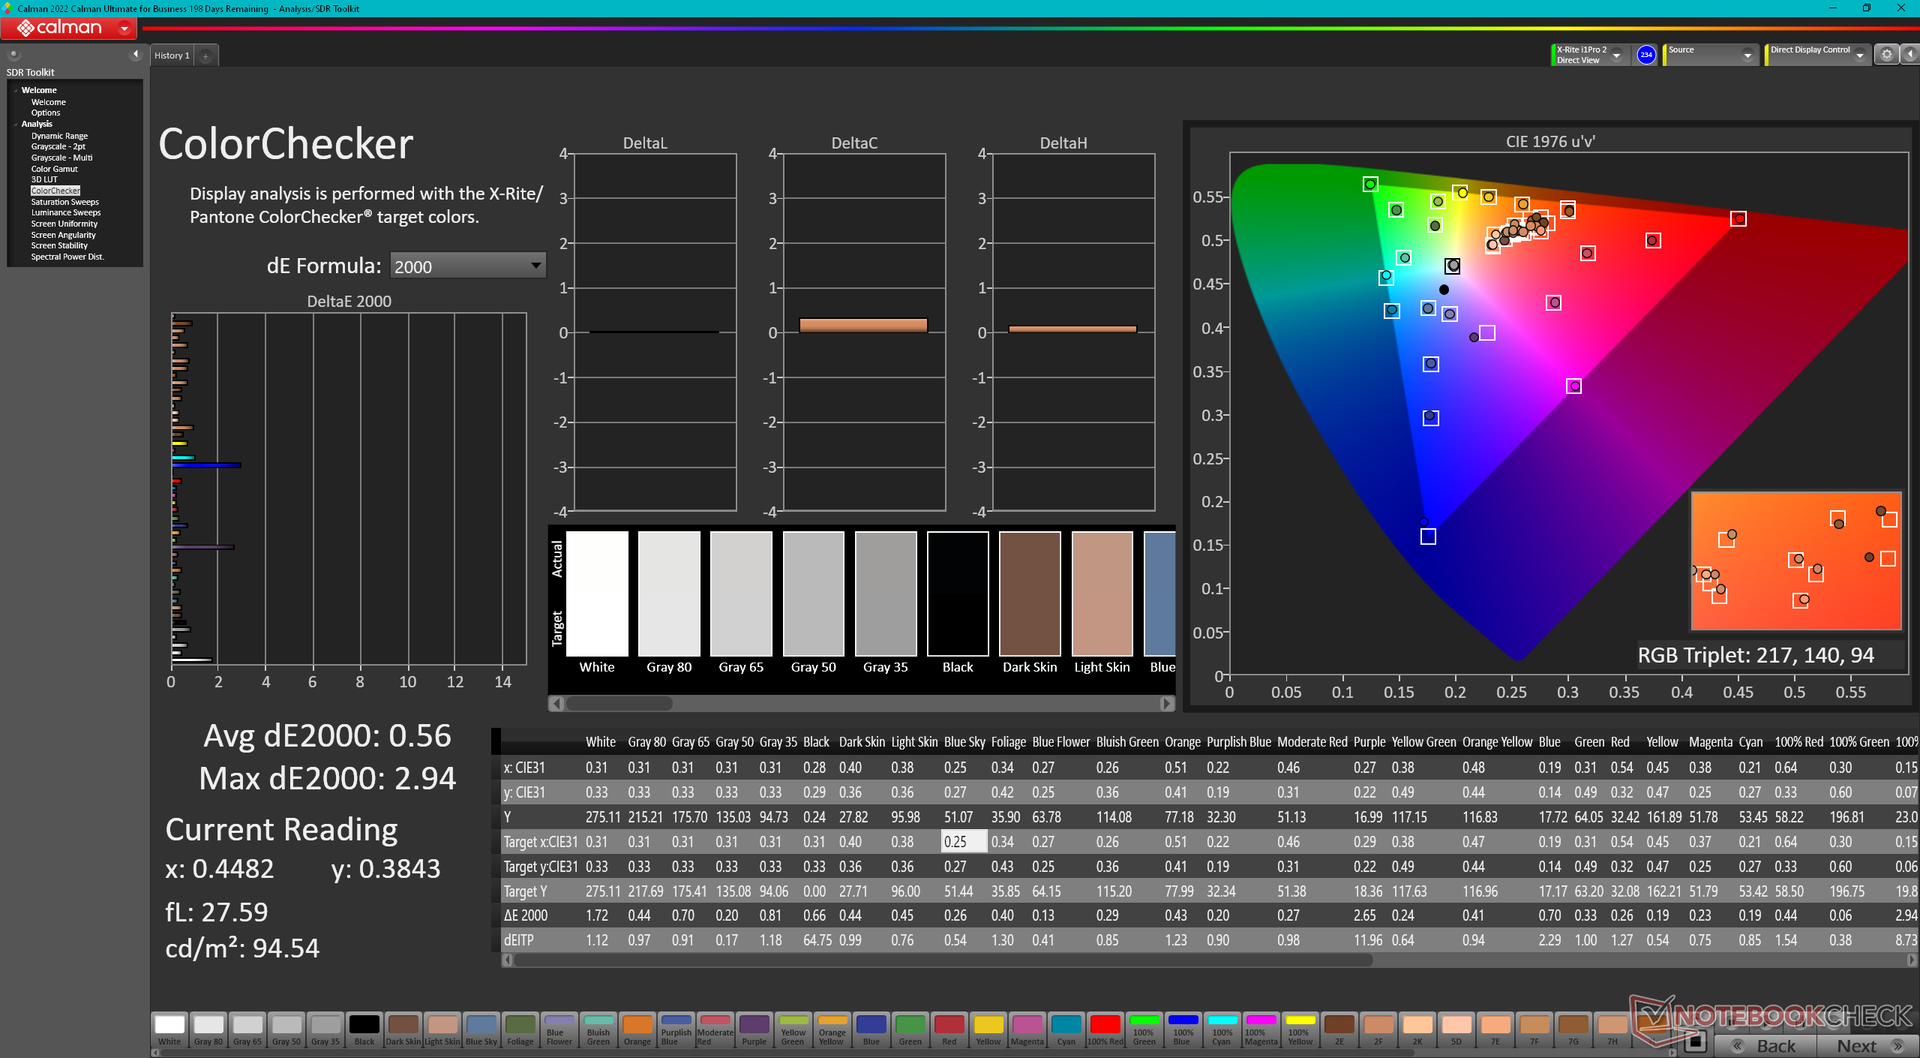
ΔE ColorChecker Calman: 2.48 | ∀{0.5-29.43 Ø4.71}
calibrated: 0.56
ΔE Greyscale Calman: 3.7 | ∀{0.09-98 Ø4.96}
88.9% AdobeRGB 1998 (Argyll 3D)
99.5% sRGB (Argyll 3D)
97.8% Display P3 (Argyll 3D)
Gamma: 2.2
CCT: 6355 K
| Alienware m18 R2 BOE NE18NZ1, IPS, 2560x1600, 18" | Alienware m18 R1 AMD BOE NE18NZ1, IPS, 1920x1200, 18" | Alienware m18 R1 Chi Mei 180JME, IPS, 1920x1200, 18" | MSI Titan 18 HX A14VIG AU Optronics B180ZAN01.0, Mini-LED, 3840x2400, 18" | Asus ROG Strix G18 G814JI NE180QDM-NZ2 (BOE0B35), IPS, 2560x1600, 18" | Acer Predator Helios 18 N23Q2 AUO45A8 (B180QAN01.2), IPS, 2560x1600, 18" | |
|---|---|---|---|---|---|---|
| Display | 0% | 1% | -1% | -1% | 2% | |
| Display P3 Coverage (%) | 97.8 | 98.5 1% | 97.7 0% | 98.1 0% | 98.1 0% | 99.8 2% |
| sRGB Coverage (%) | 99.5 | 99.7 0% | 100 1% | 99.8 0% | 99.9 0% | 100 1% |
| AdobeRGB 1998 Coverage (%) | 88.9 | 88.7 0% | 89.8 1% | 86.2 -3% | 85.6 -4% | 91.8 3% |
| Response Times | 28% | 24% | -375% | 4% | -57% | |
| Response Time Grey 50% / Grey 80% * (ms) | 5.3 ? | 2.8 ? 47% | 3 ? 43% | 8.6 ? -62% | 5.6 ? -6% | 7.6 ? -43% |
| Response Time Black / White * (ms) | 10.4 ? | 9.6 ? 8% | 9.9 ? 5% | 81.8 ? -687% | 9 ? 13% | 17.8 ? -71% |
| PWM Frequency (Hz) | 2592 ? | 2509 | ||||
| Screen | 29% | 24% | -45% | 9% | -28% | |
| Brightness middle (cd/m²) | 271.8 | 319.6 18% | 372.8 37% | 467.5 72% | 471 73% | 360 32% |
| Brightness (cd/m²) | 275 | 304 11% | 367 33% | 459 67% | 422 53% | 355 29% |
| Brightness Distribution (%) | 78 | 87 12% | 97 24% | 90 15% | 83 6% | 92 18% |
| Black Level * (cd/m²) | 0.27 | 0.25 7% | 0.32 -19% | 0.47 -74% | 0.21 22% | |
| Contrast (:1) | 1007 | 1278 27% | 1165 16% | 1002 0% | 1714 70% | |
| Colorchecker dE 2000 * | 2.48 | 1.22 51% | 1.92 23% | 3.77 -52% | 2.05 17% | 3.82 -54% |
| Colorchecker dE 2000 max. * | 5.59 | 3.1 45% | 3.65 35% | 6.12 -9% | 4.15 26% | 7.38 -32% |
| Colorchecker dE 2000 calibrated * | 0.56 | 0.47 16% | 0.51 9% | 2.94 -425% | 0.8 -43% | 2.24 -300% |
| Greyscale dE 2000 * | 3.7 | 0.8 78% | 1.5 59% | 3.2 14% | 2.8 24% | 5.06 -37% |
| Gamma | 2.2 100% | 2.23 99% | 2.34 94% | 2.43 91% | 2.204 100% | 2.52 87% |
| CCT | 6355 102% | 6471 100% | 6607 98% | 6478 100% | 7122 91% | 5657 115% |
| Total Average (Program / Settings) | 19% /
23% | 16% /
19% | -140% /
-89% | 4% /
6% | -28% /
-26% |
* ... smaller is better
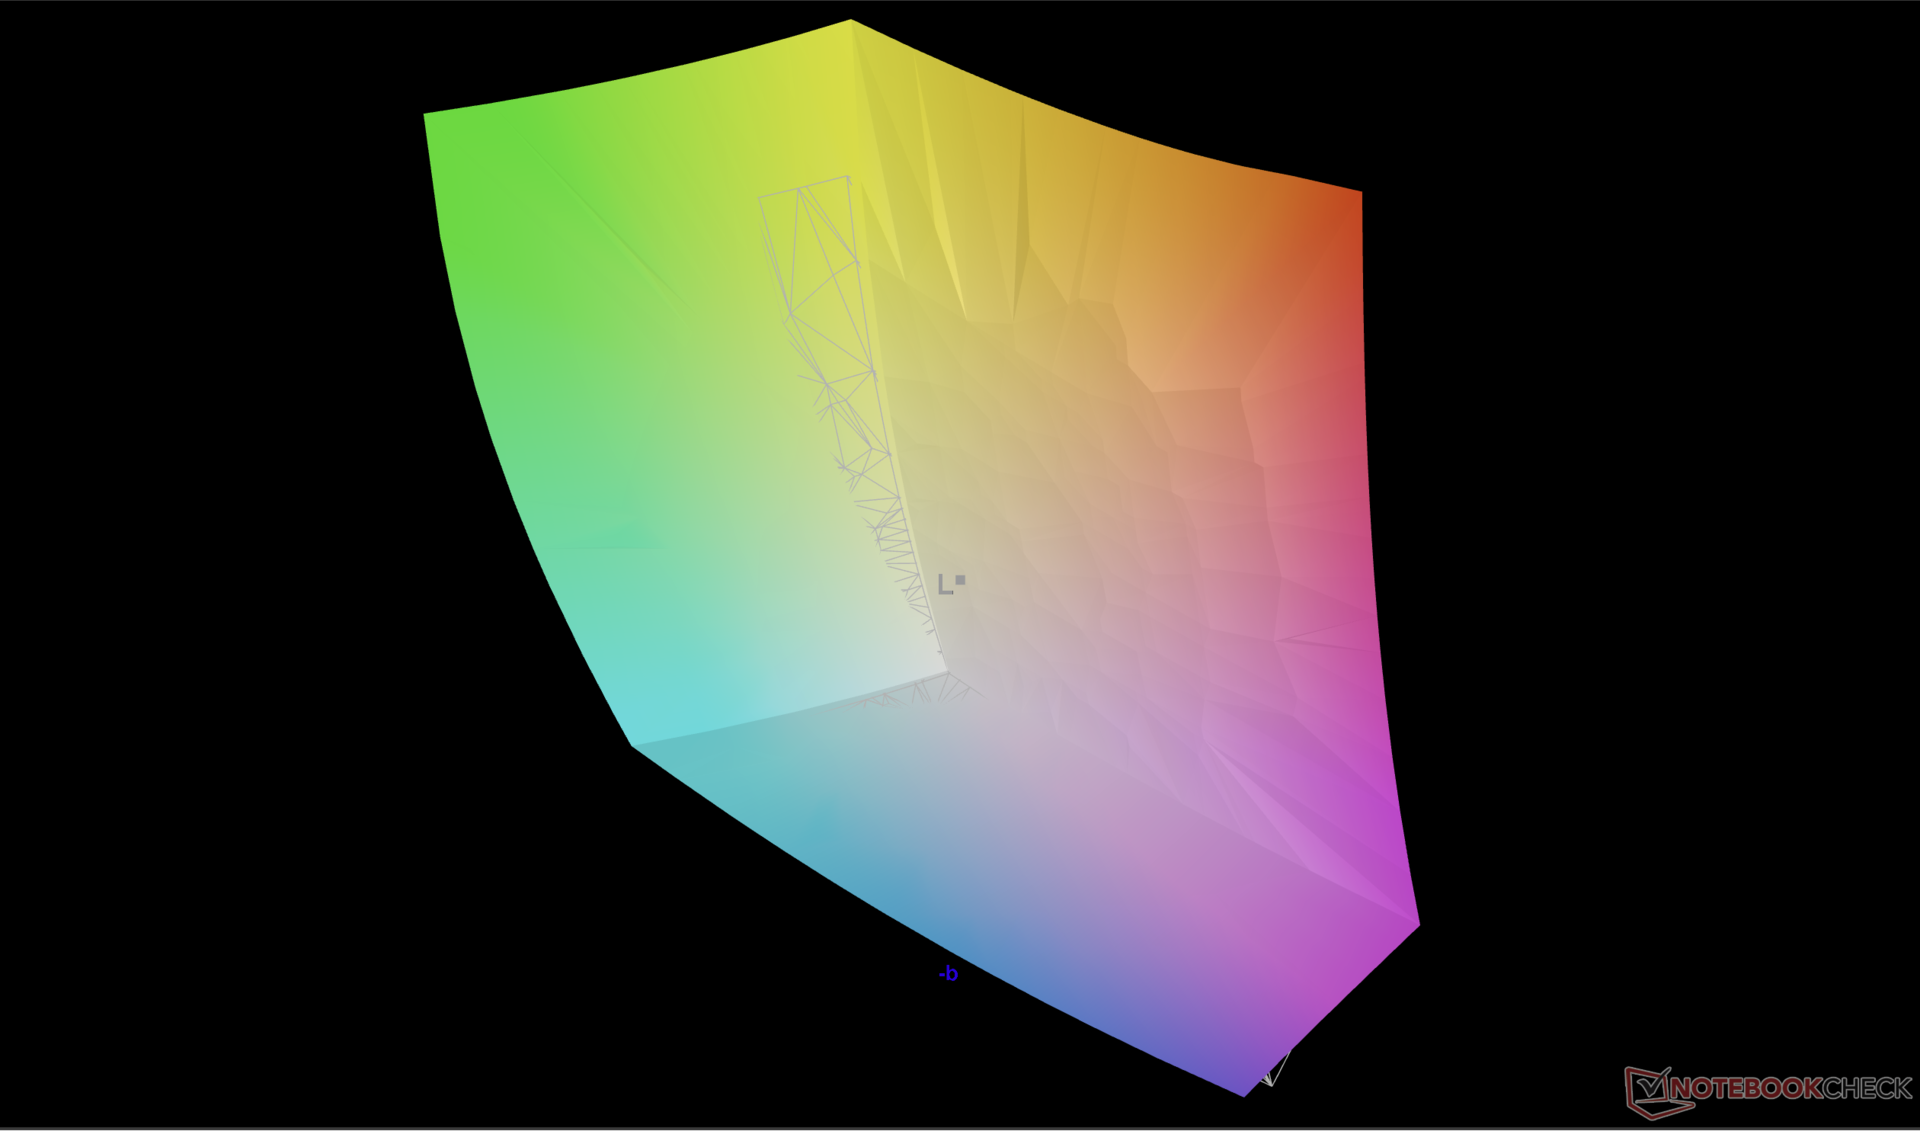
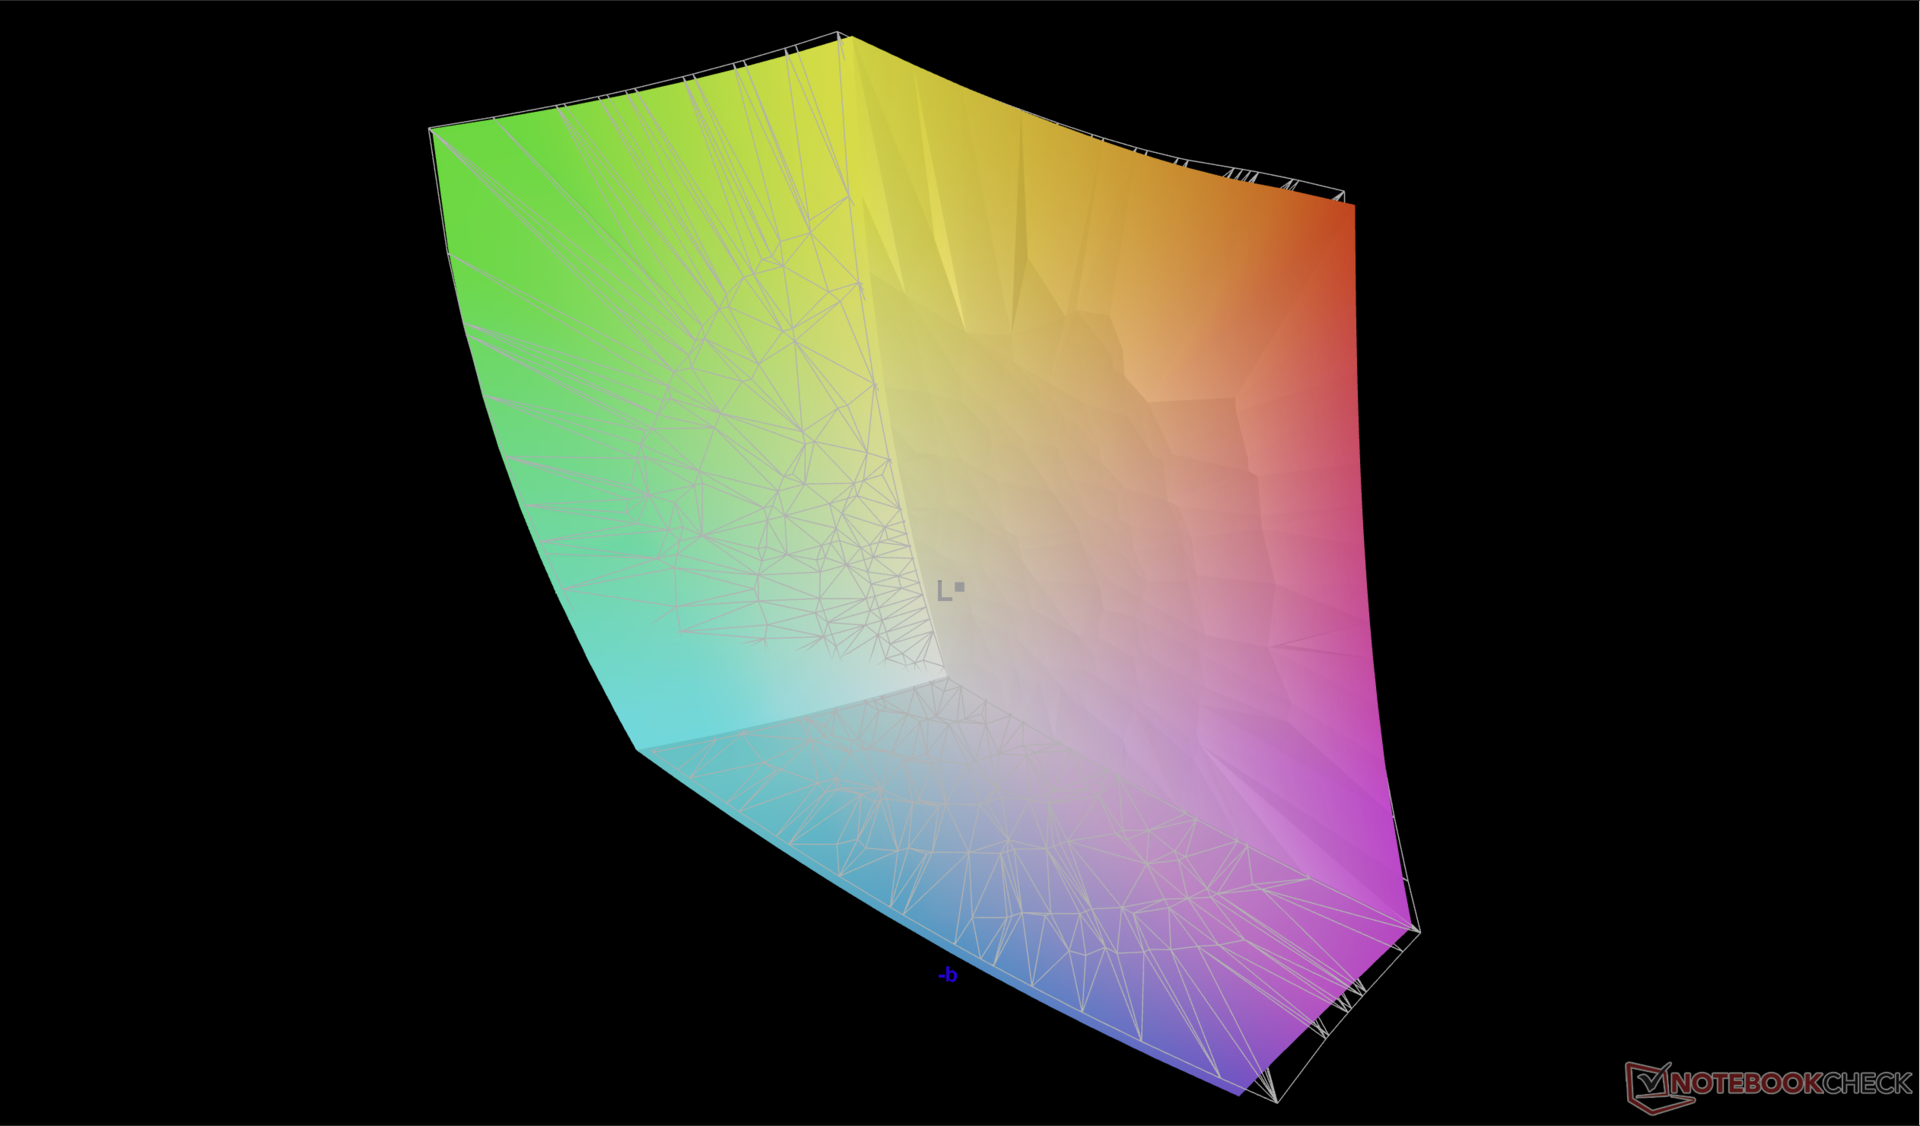
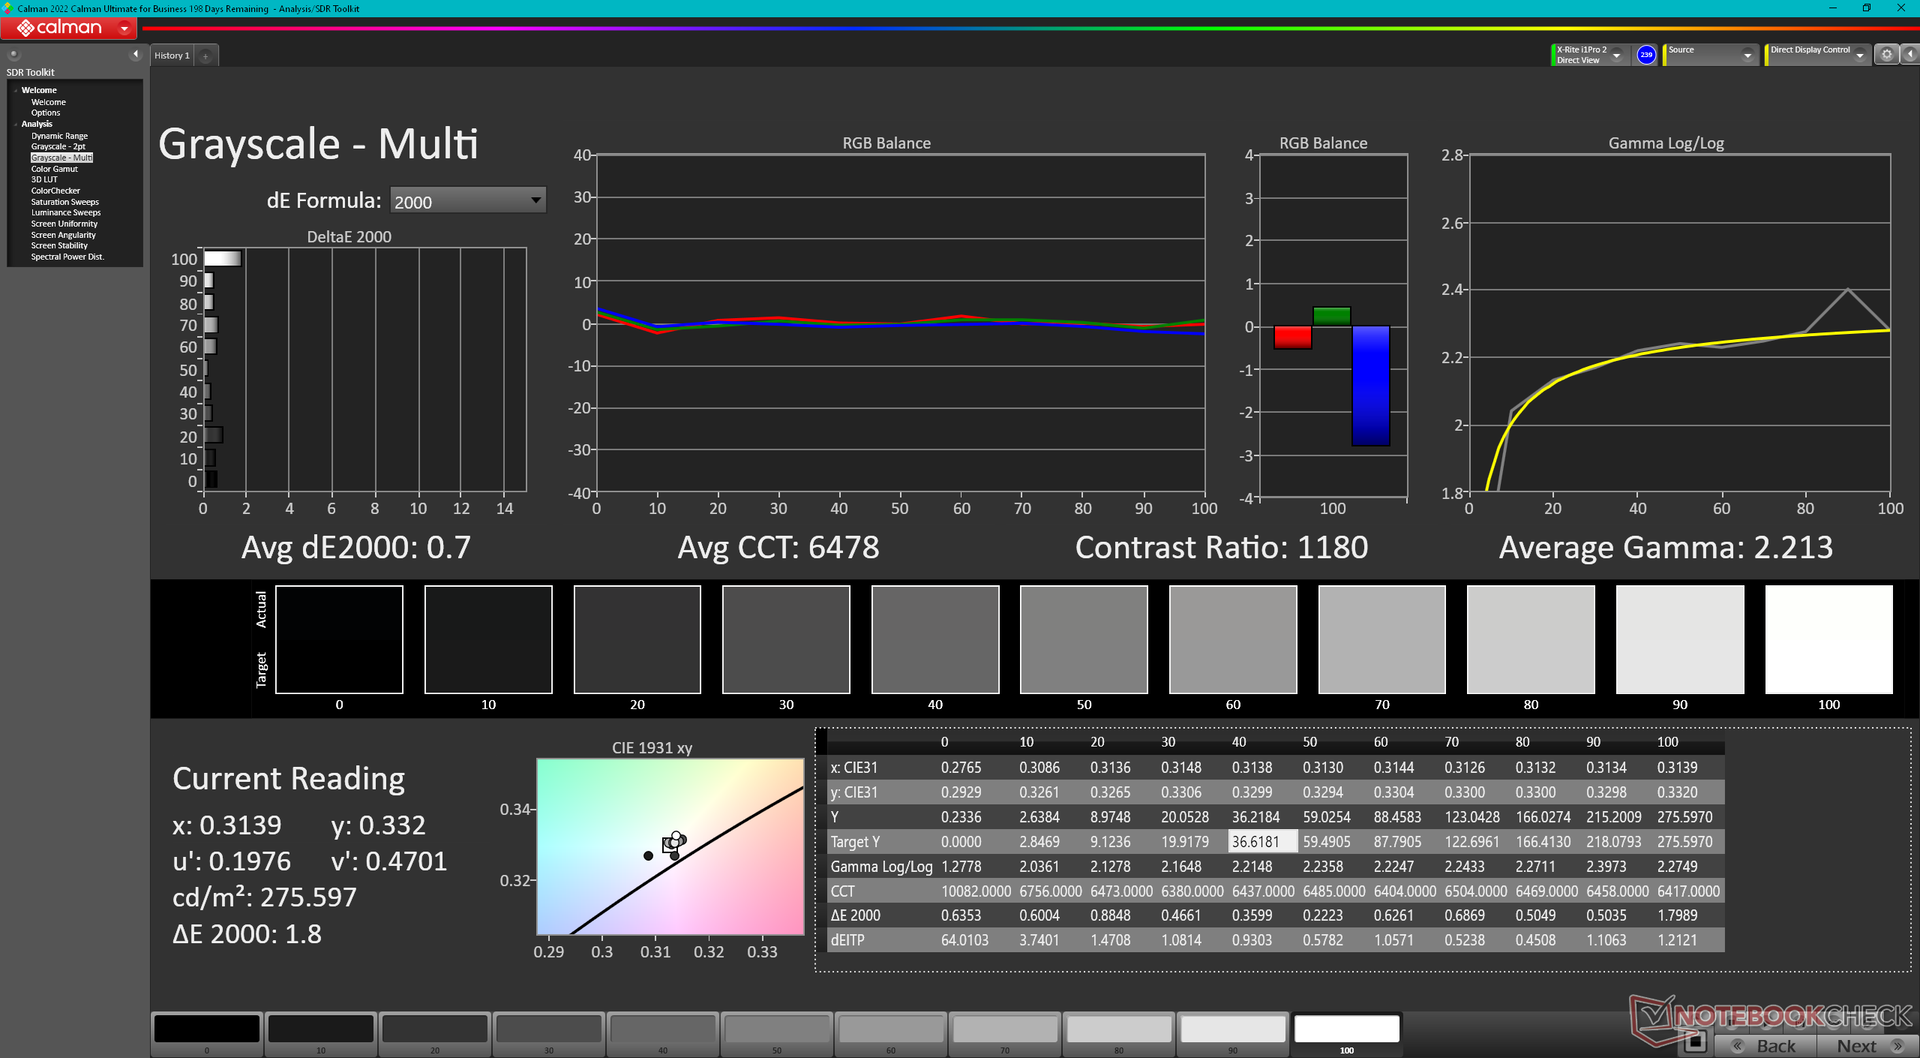
尽管显示屏没有经过预校准,但灰度和色彩开箱即相当准确。自行校准面板可将平均 deltaE 值提高到 <1,从而更好地利用 P3 的全部色彩。我们的校准 ICM 配置文件可在上面免费下载。
Display Response Times
| ↔ Response Time Black to White | ||
|---|---|---|
| 10.4 ms ... rise ↗ and fall ↘ combined | ↗ 4.8 ms rise | 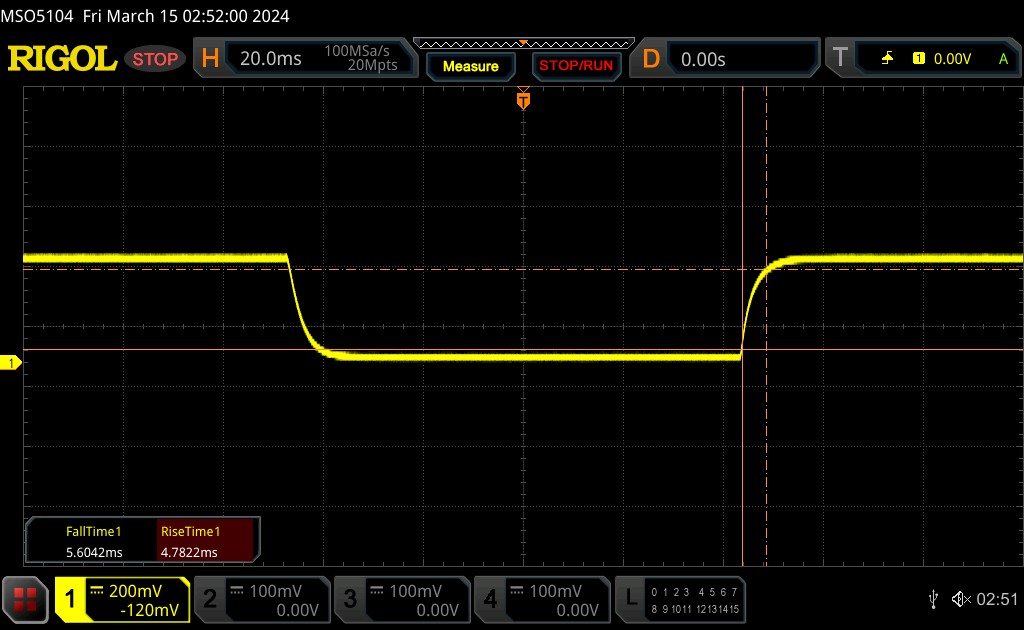 |
| ↘ 5.6 ms fall | ||
| The screen shows good response rates in our tests, but may be too slow for competitive gamers. In comparison, all tested devices range from 0.1 (minimum) to 240 (maximum) ms. » 28 % of all devices are better. This means that the measured response time is better than the average of all tested devices (19.8 ms). | ||
| ↔ Response Time 50% Grey to 80% Grey | ||
| 5.3 ms ... rise ↗ and fall ↘ combined | ↗ 2.2 ms rise | 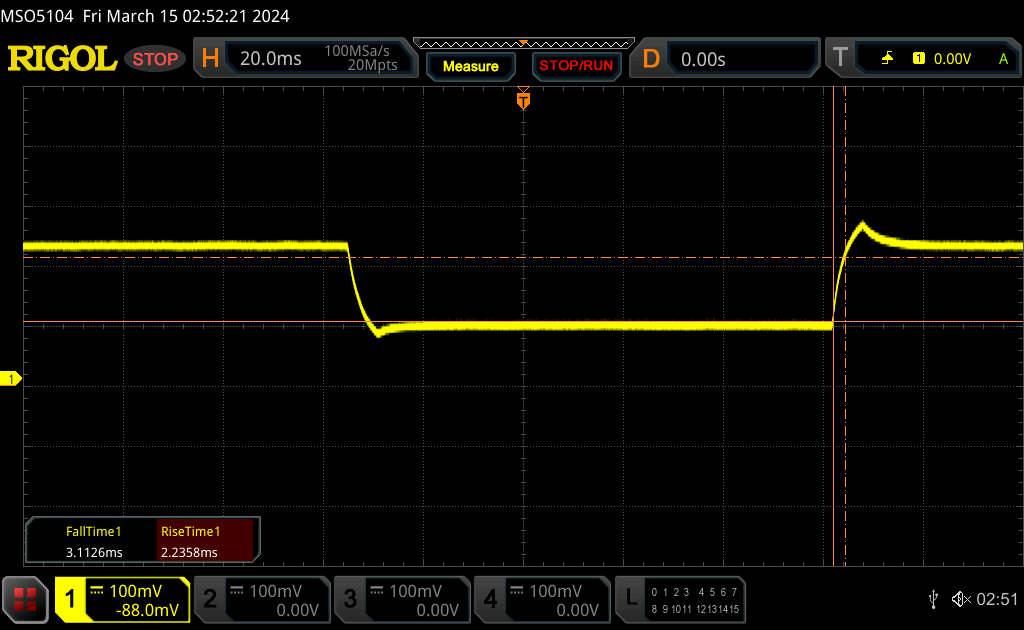 |
| ↘ 3.1 ms fall | ||
| The screen shows very fast response rates in our tests and should be very well suited for fast-paced gaming. In comparison, all tested devices range from 0.165 (minimum) to 636 (maximum) ms. » 18 % of all devices are better. This means that the measured response time is better than the average of all tested devices (31 ms). | ||
Screen Flickering / PWM (Pulse-Width Modulation)
| Screen flickering / PWM not detected | 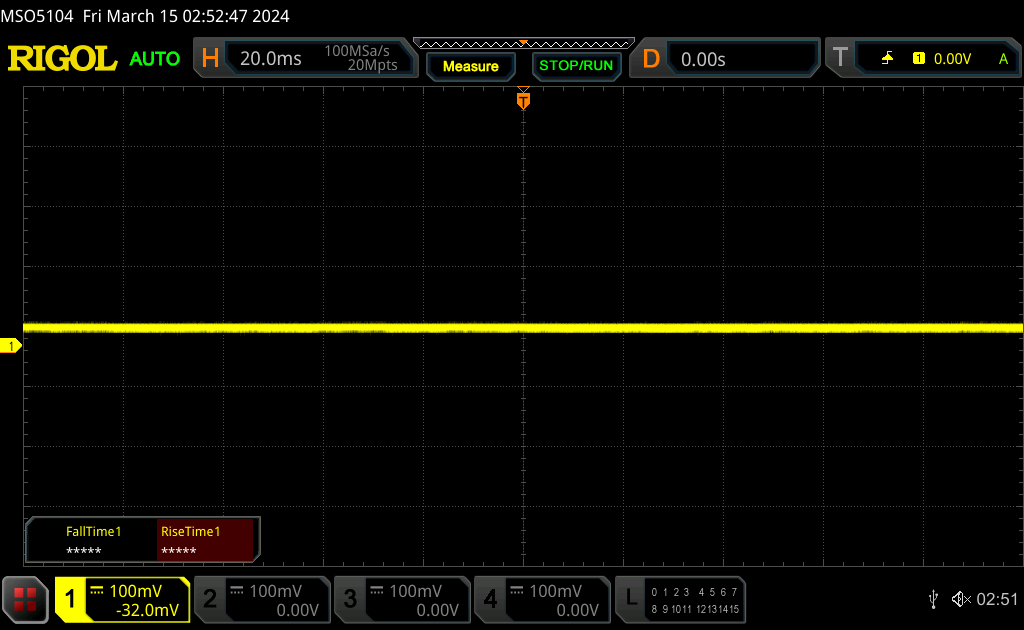 | ||
In comparison: 52 % of all tested devices do not use PWM to dim the display. If PWM was detected, an average of 7747 (minimum: 5 - maximum: 343500) Hz was measured. | |||
性能 - Raptor Lake-HX Refresh
测试条件
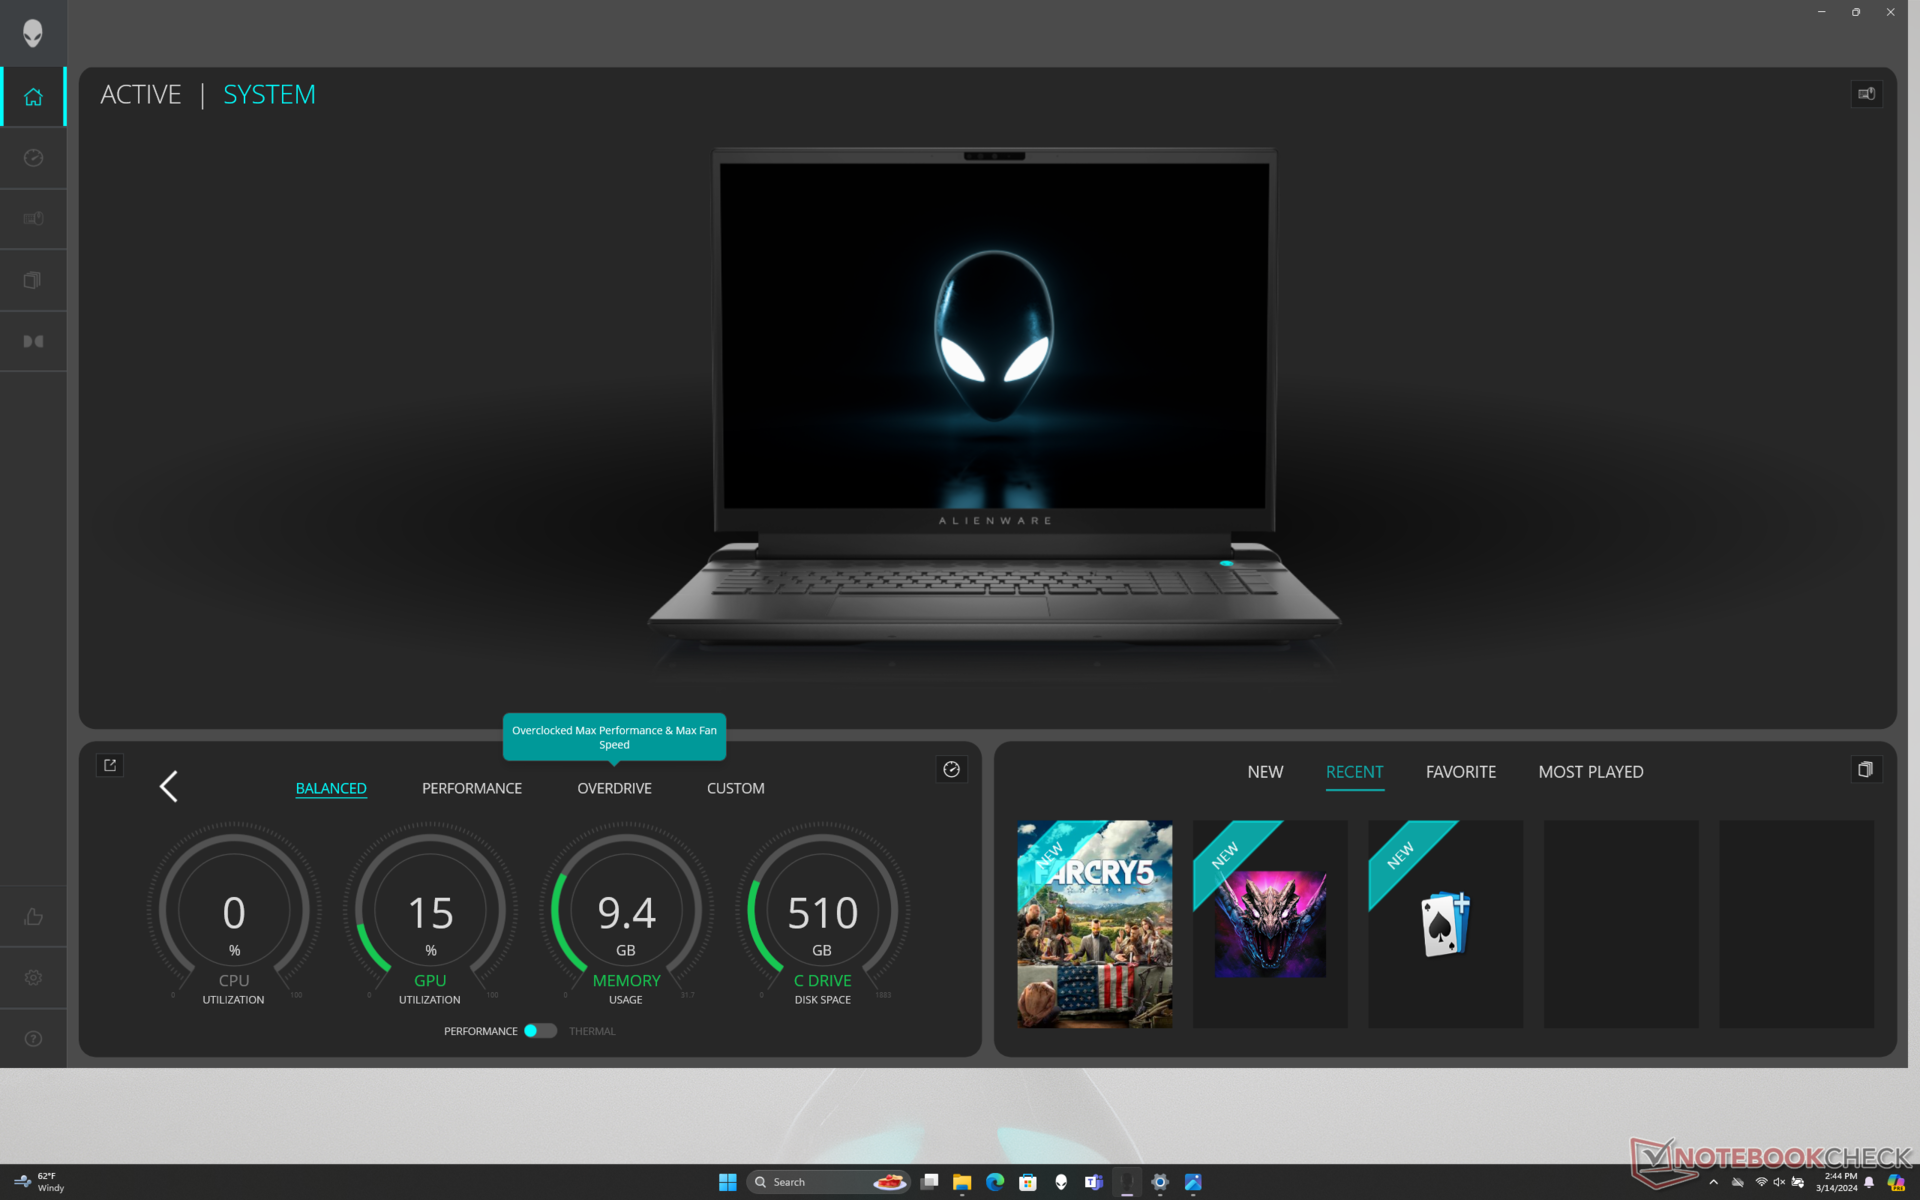
在运行以下基准测试之前,我们将 Alienware Command Center 设置为超频模式,将 Windows 设置为性能模式。我们还通过 Nvidia 控制面板将系统设置为 dGPU 模式。支持高级 Optimus 和 MUX,这意味着在 iGPU 和 dGPU 之间切换时无需重启。
值得注意的是,我们在设备上遇到了一些与睡眠模式有关的错误。关闭盖子时,系统有时无法正确进入睡眠模式,因此会无缘无故地变得非常热。如果在旅行时出现这种情况,电池可能会在没有任何警告的情况下耗尽。此外,从睡眠模式唤醒时,屏幕有时会冻结几秒钟。我们怀疑这可能是与 MUX 或 GPU 自动切换有关的问题。
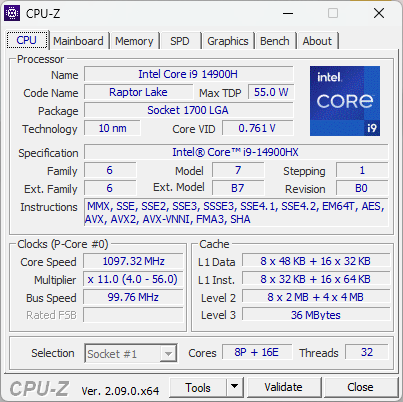
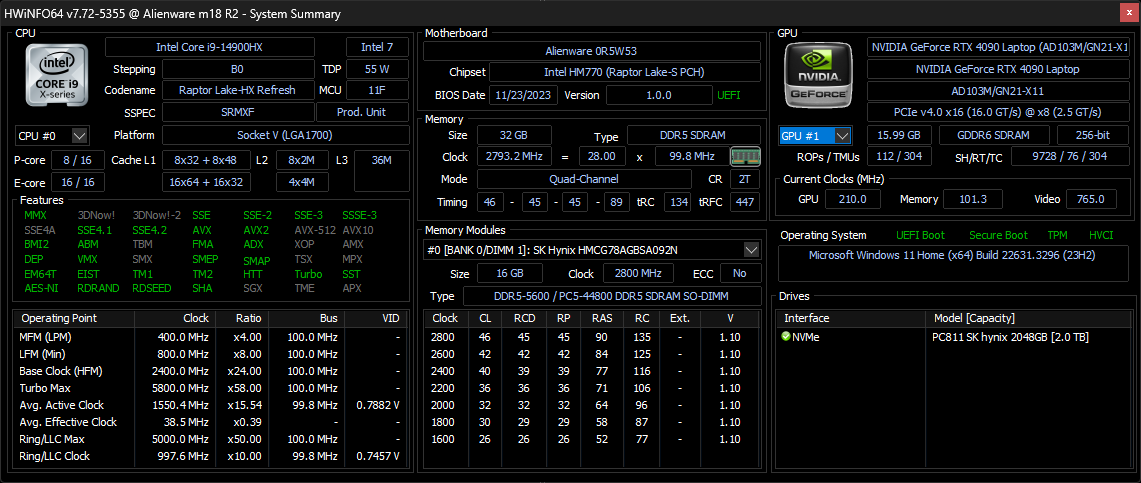
处理器
酷睿 i9-14900HX 酷睿 i9-14900HX 是去年 酷睿 i9-13900HX 因此,它们之间的性能差异充其量只是微不足道。事实上 酷睿 i9-13980HX在多线程工作负载中一直比 i9-14900HX 高几个百分点。
降级到酷睿 i7-14700HX 或酷睿 i7-14650HX 后,处理器性能预计将分别降低约 25% 至 30% 和 30% 至 35%。这些性能较低的处理器也是较早的酷睿 i7-13700HX 和酷睿 i7-14750HX 的换代产品。
Cinebench R15 Multi Loop
Cinebench R23: Multi Core | Single Core
Cinebench R20: CPU (Multi Core) | CPU (Single Core)
Cinebench R15: CPU Multi 64Bit | CPU Single 64Bit
Blender: v2.79 BMW27 CPU
7-Zip 18.03: 7z b 4 | 7z b 4 -mmt1
Geekbench 6.7: Multi-Core | Single-Core
Geekbench 5.5: Multi-Core | Single-Core
HWBOT x265 Benchmark v2.2: 4k Preset
LibreOffice : 20 Documents To PDF
R Benchmark 2.5: Overall mean
| CPU Performance rating | |
| Alienware m18 R1 AMD | |
| Alienware m18 R2 | |
| Alienware m18 R1 -2! | |
| MSI Titan 18 HX A14VIG | |
| Acer Predator Helios 18 N23Q2 | |
| Average Intel Core i9-14900HX | |
| Razer Blade 18 RTX 4070 -2! | |
| Asus TUF Gaming A17 FA707XI-NS94 | |
| Asus ROG Strix G18 G814JI -2! | |
| Schenker XMG Apex 17 (Late 23) | |
| Acer Nitro 17 AN17-51-71ER -2! | |
| Acer Nitro 17 AN17-41-R9LN | |
| Geekbench 6.7 / Multi-Core | |
| Alienware m18 R2 | |
| Acer Predator Helios 18 N23Q2 | |
| Average Intel Core i9-14900HX (13158 - 19665, n=37) | |
| MSI Titan 18 HX A14VIG | |
| Alienware m18 R1 AMD | |
| Schenker XMG Apex 17 (Late 23) | |
| Asus TUF Gaming A17 FA707XI-NS94 | |
| Acer Nitro 17 AN17-41-R9LN | |
| Geekbench 6.7 / Single-Core | |
| Alienware m18 R2 | |
| Average Intel Core i9-14900HX (2419 - 3129, n=37) | |
| Acer Predator Helios 18 N23Q2 | |
| Alienware m18 R1 AMD | |
| MSI Titan 18 HX A14VIG | |
| Asus TUF Gaming A17 FA707XI-NS94 | |
| Schenker XMG Apex 17 (Late 23) | |
| Acer Nitro 17 AN17-41-R9LN | |
* ... smaller is better
AIDA64: FP32 Ray-Trace | FPU Julia | CPU SHA3 | CPU Queen | FPU SinJulia | FPU Mandel | CPU AES | CPU ZLib | FP64 Ray-Trace | CPU PhotoWorxx
| Performance rating | |
| Alienware m18 R1 AMD | |
| Acer Predator Helios 18 N23Q2 | |
| Alienware m18 R1 | |
| Alienware m18 R2 | |
| MSI Titan 18 HX A14VIG | |
| Average Intel Core i9-14900HX | |
| Asus ROG Strix G18 G814JI | |
| AIDA64 / FP32 Ray-Trace | |
| Alienware m18 R1 AMD | |
| Alienware m18 R1 | |
| MSI Titan 18 HX A14VIG | |
| Alienware m18 R2 | |
| Acer Predator Helios 18 N23Q2 | |
| Average Intel Core i9-14900HX (13098 - 33474, n=36) | |
| Asus ROG Strix G18 G814JI | |
| AIDA64 / FPU Julia | |
| Alienware m18 R1 AMD | |
| MSI Titan 18 HX A14VIG | |
| Alienware m18 R1 | |
| Alienware m18 R2 | |
| Acer Predator Helios 18 N23Q2 | |
| Average Intel Core i9-14900HX (67573 - 166040, n=36) | |
| Asus ROG Strix G18 G814JI | |
| AIDA64 / CPU SHA3 | |
| Alienware m18 R1 AMD | |
| MSI Titan 18 HX A14VIG | |
| Alienware m18 R1 | |
| Alienware m18 R2 | |
| Acer Predator Helios 18 N23Q2 | |
| Average Intel Core i9-14900HX (3589 - 7979, n=36) | |
| Asus ROG Strix G18 G814JI | |
| AIDA64 / CPU Queen | |
| Alienware m18 R1 AMD | |
| MSI Titan 18 HX A14VIG | |
| Alienware m18 R1 | |
| Alienware m18 R2 | |
| Average Intel Core i9-14900HX (118405 - 148966, n=36) | |
| Acer Predator Helios 18 N23Q2 | |
| Asus ROG Strix G18 G814JI | |
| AIDA64 / FPU SinJulia | |
| Alienware m18 R1 AMD | |
| MSI Titan 18 HX A14VIG | |
| Alienware m18 R1 | |
| Alienware m18 R2 | |
| Acer Predator Helios 18 N23Q2 | |
| Average Intel Core i9-14900HX (10475 - 18517, n=36) | |
| Asus ROG Strix G18 G814JI | |
| AIDA64 / FPU Mandel | |
| Alienware m18 R1 AMD | |
| Alienware m18 R1 | |
| Alienware m18 R2 | |
| MSI Titan 18 HX A14VIG | |
| Acer Predator Helios 18 N23Q2 | |
| Average Intel Core i9-14900HX (32543 - 83662, n=36) | |
| Asus ROG Strix G18 G814JI | |
| AIDA64 / CPU AES | |
| Acer Predator Helios 18 N23Q2 | |
| Alienware m18 R1 AMD | |
| Average Intel Core i9-14900HX (86964 - 241777, n=36) | |
| MSI Titan 18 HX A14VIG | |
| Alienware m18 R1 | |
| Alienware m18 R2 | |
| Asus ROG Strix G18 G814JI | |
| AIDA64 / CPU ZLib | |
| Alienware m18 R1 AMD | |
| MSI Titan 18 HX A14VIG | |
| Alienware m18 R2 | |
| Alienware m18 R1 | |
| Acer Predator Helios 18 N23Q2 | |
| Average Intel Core i9-14900HX (1054 - 2292, n=36) | |
| Asus ROG Strix G18 G814JI | |
| AIDA64 / FP64 Ray-Trace | |
| Alienware m18 R1 AMD | |
| Alienware m18 R1 | |
| Alienware m18 R2 | |
| MSI Titan 18 HX A14VIG | |
| Acer Predator Helios 18 N23Q2 | |
| Average Intel Core i9-14900HX (6809 - 18349, n=36) | |
| Asus ROG Strix G18 G814JI | |
| AIDA64 / CPU PhotoWorxx | |
| Alienware m18 R1 | |
| Acer Predator Helios 18 N23Q2 | |
| Alienware m18 R2 | |
| Average Intel Core i9-14900HX (23903 - 54702, n=36) | |
| Asus ROG Strix G18 G814JI | |
| Alienware m18 R1 AMD | |
| MSI Titan 18 HX A14VIG | |
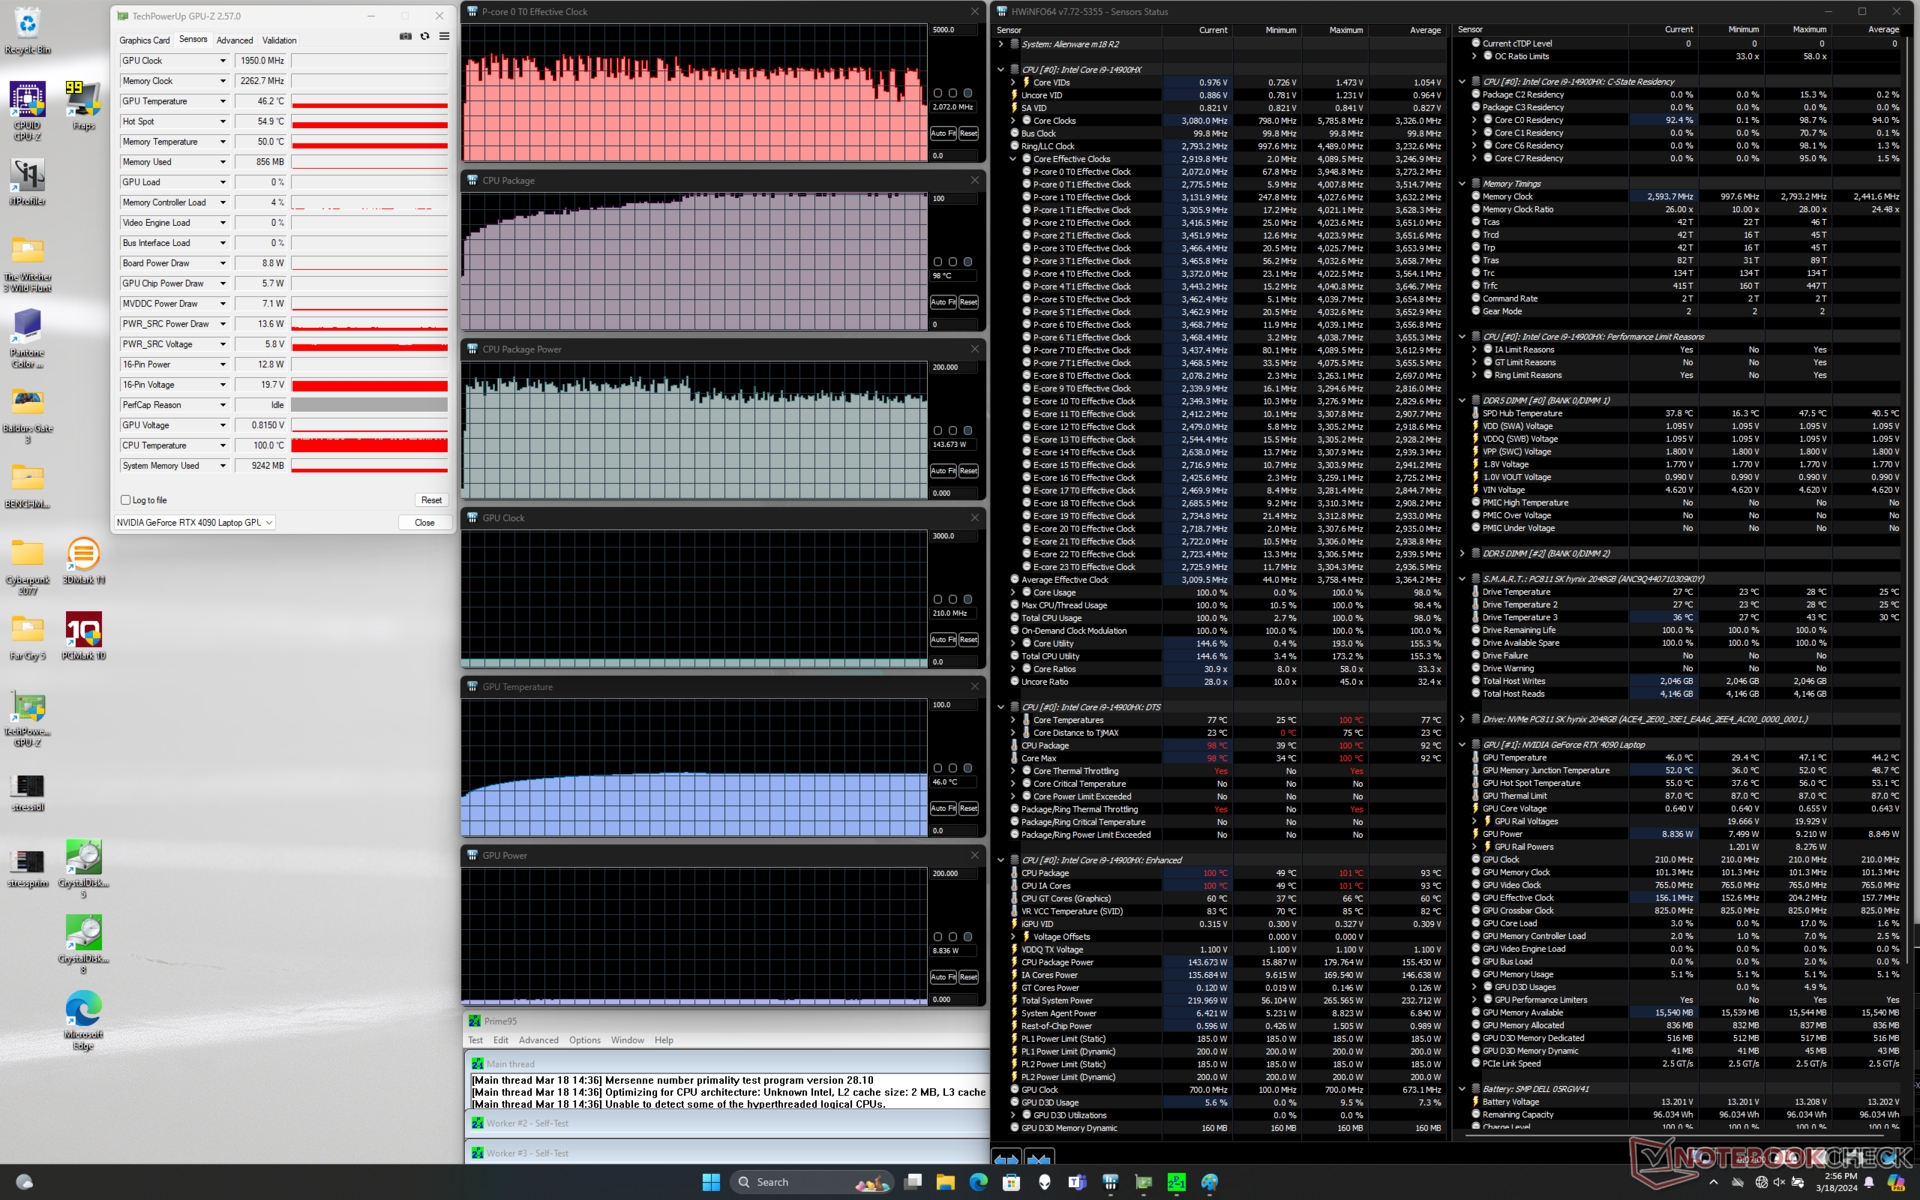
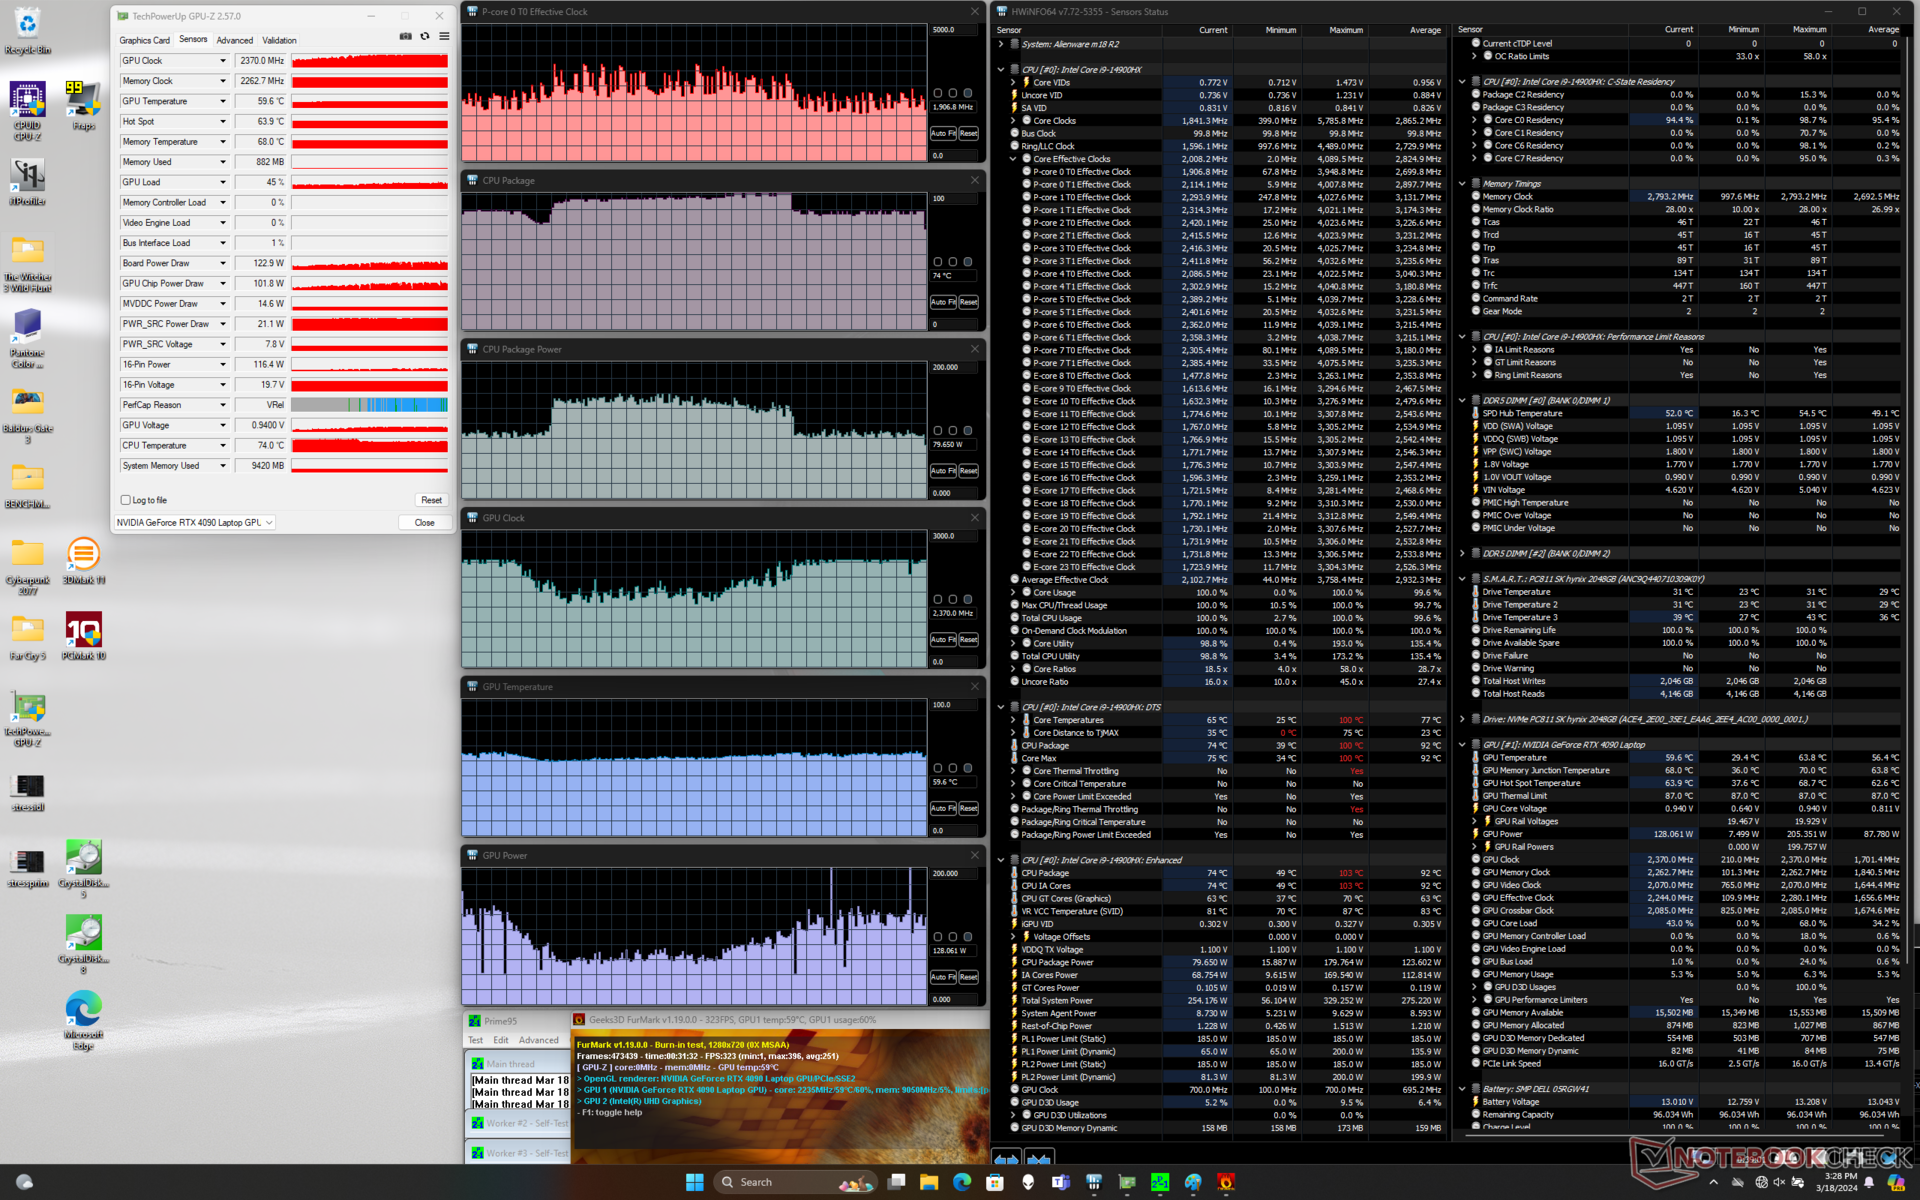
压力测试
运行 Prime95 压力测试时,核心温度稳定在 100 摄氏度,这与我们在去年的 m18 R1 上观察到的情况类似,尽管处理器已经更新换代。不过,i9-14900HX 的时钟频率波动似乎更频繁,这可能是其性能略低于上述 i9-13980HX 的原因。
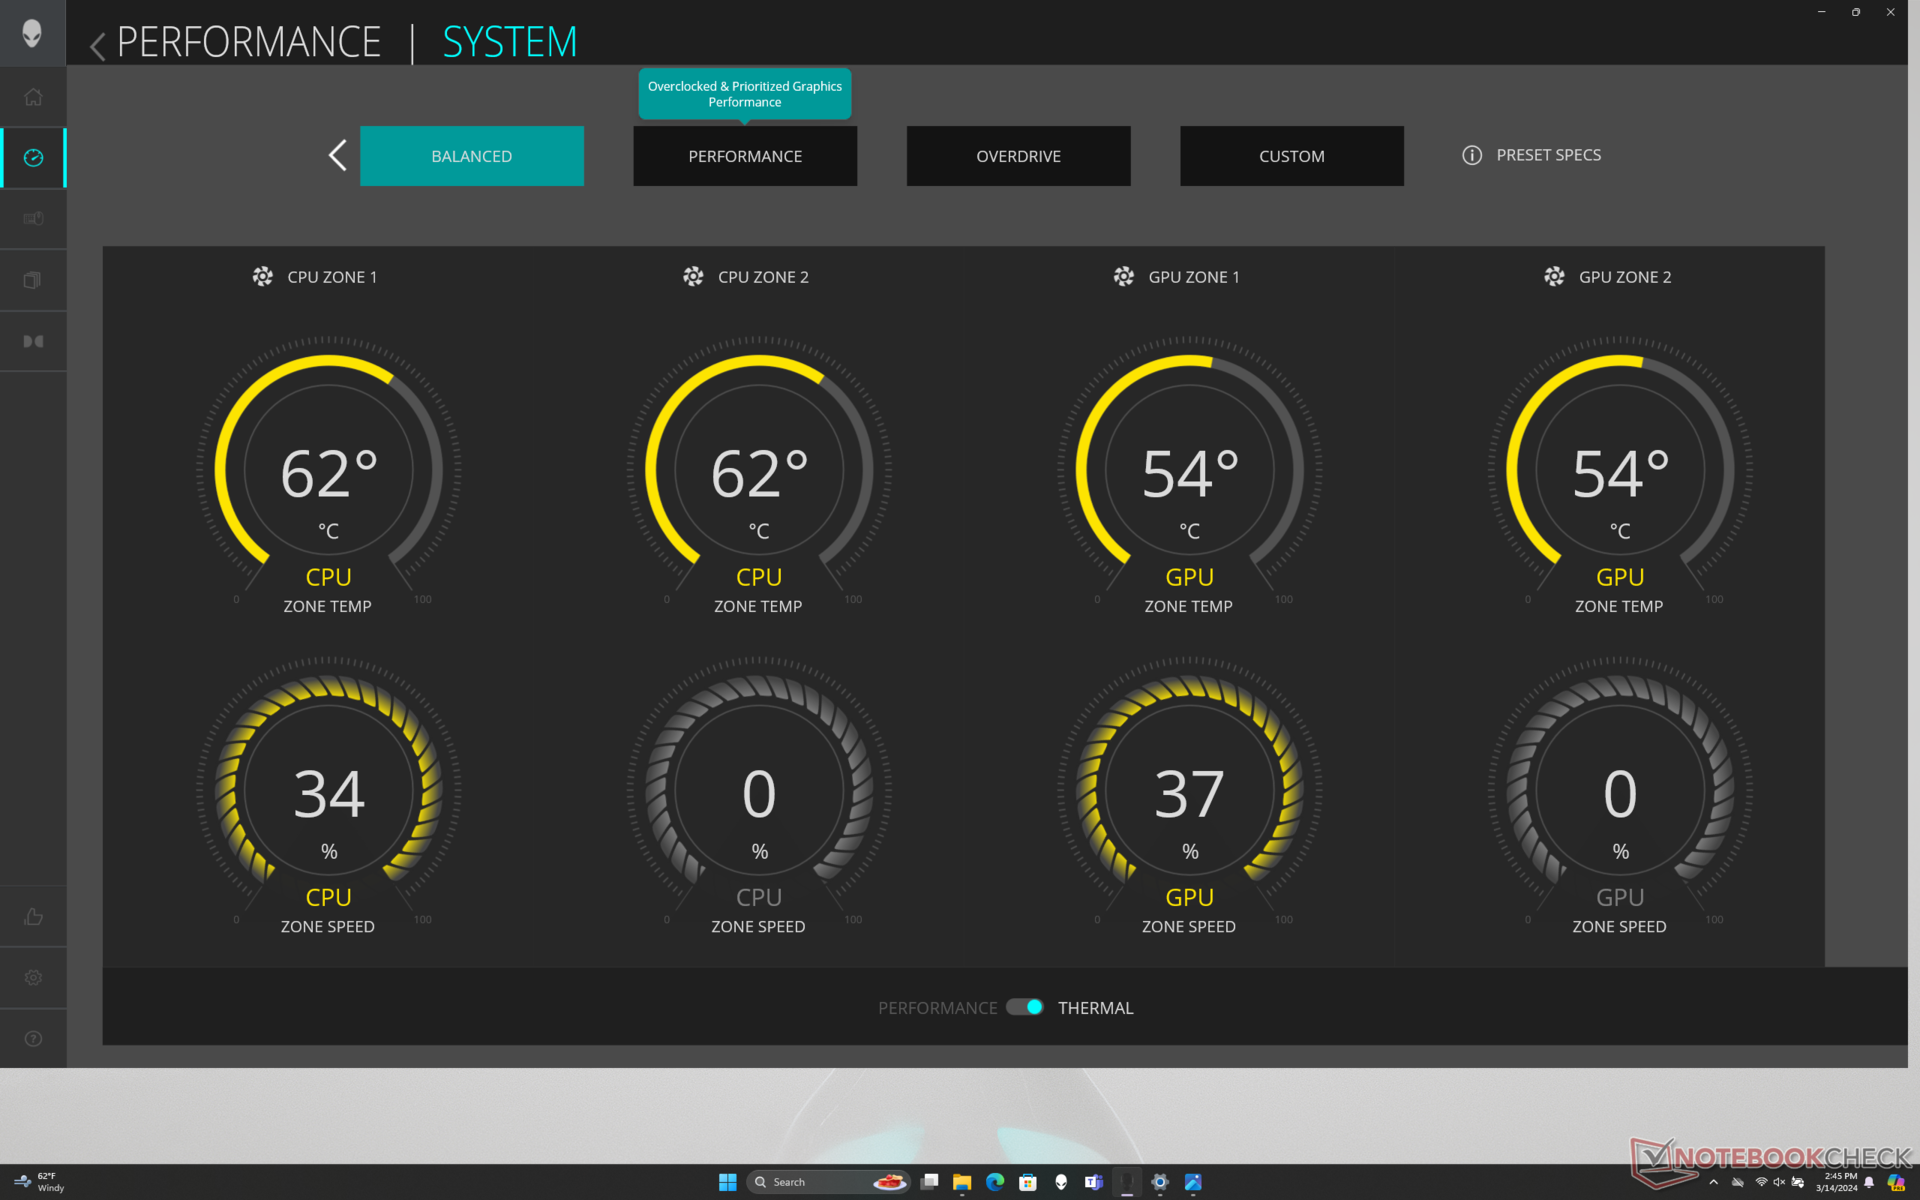
在平衡、性能和超频模式之间切换时,GPU 时钟率和主板功耗几乎没有变化,这与下文 GPU 性能部分的Fire Strike 测试结果一致。这种情况与其他大多数游戏笔记本电脑不同,在其他笔记本电脑中,平衡模式和性能模式之间的性能差距较大。
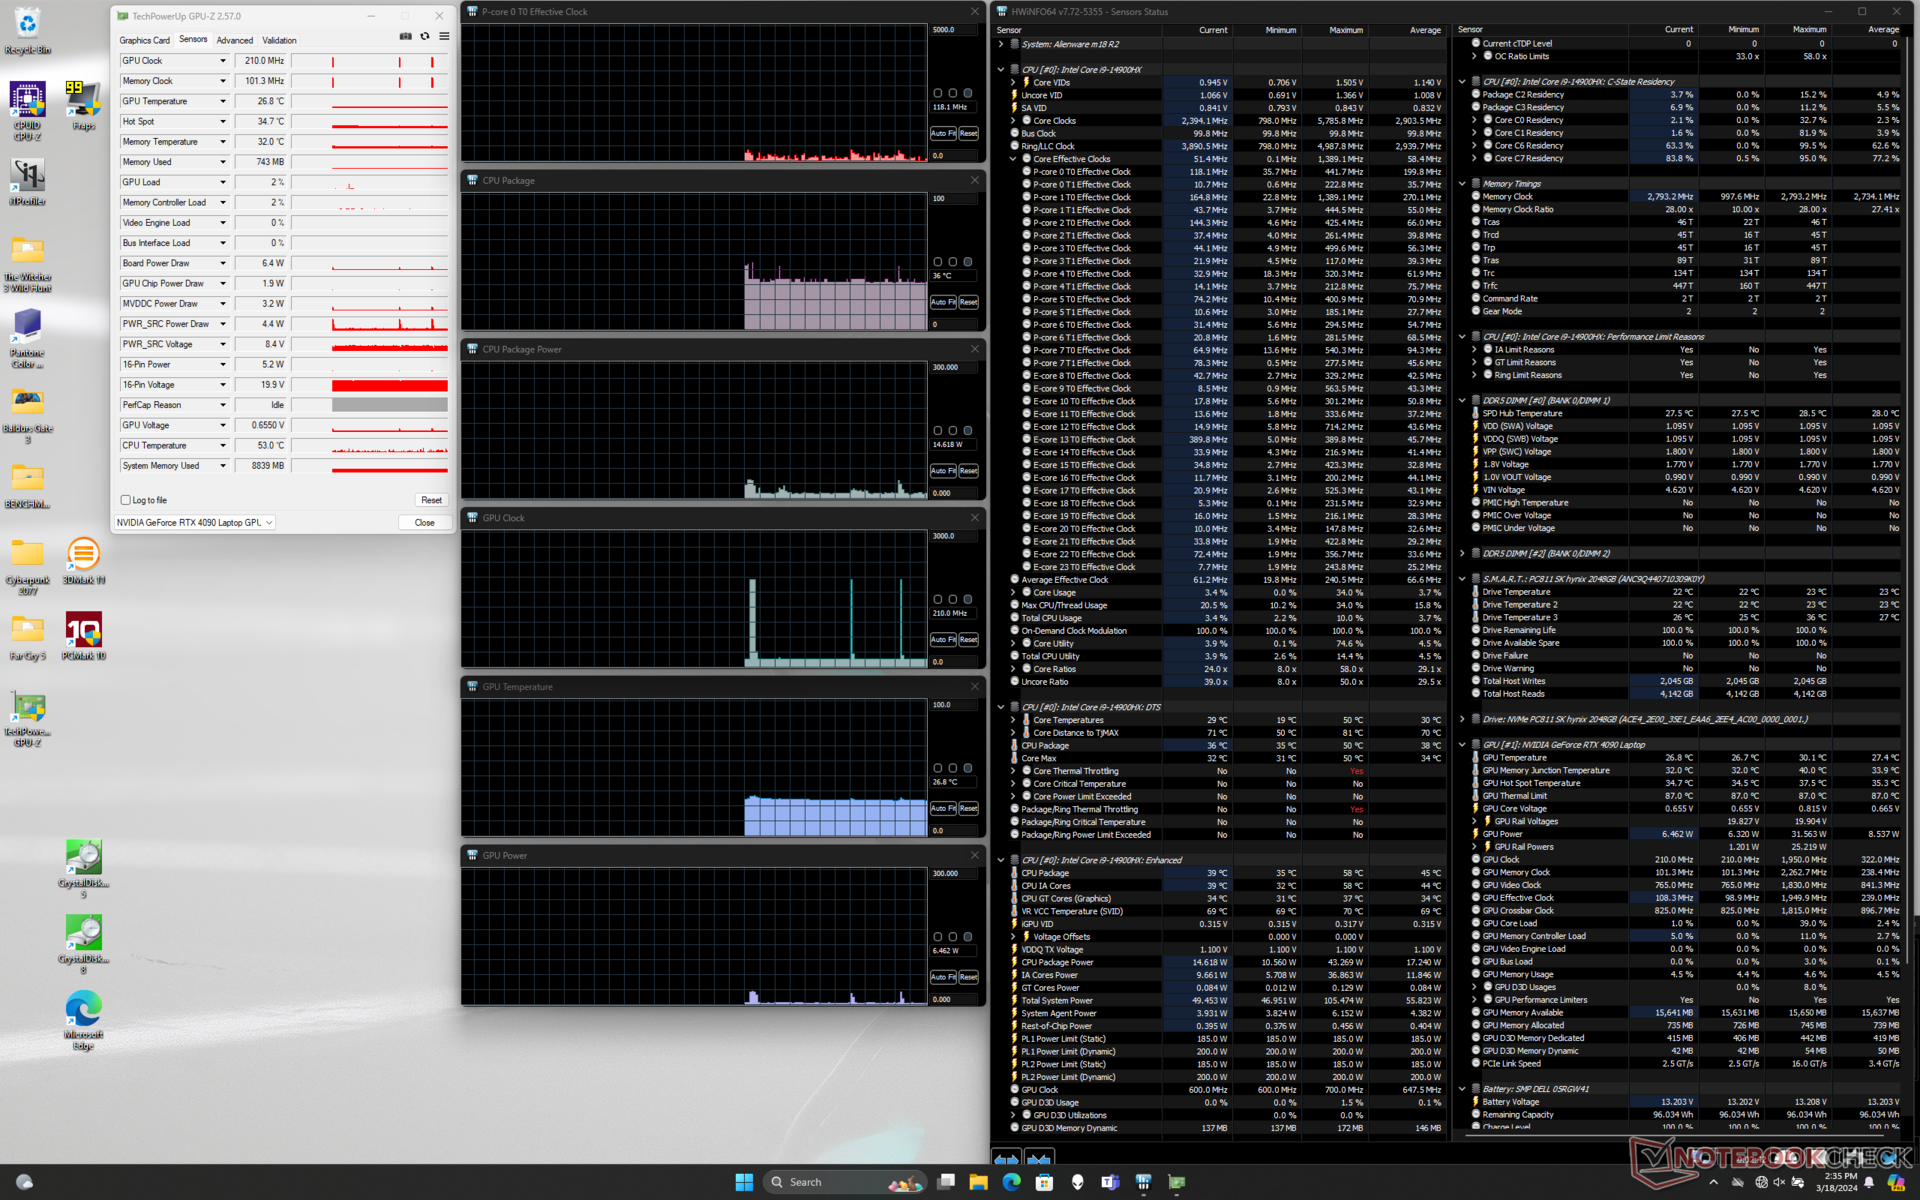
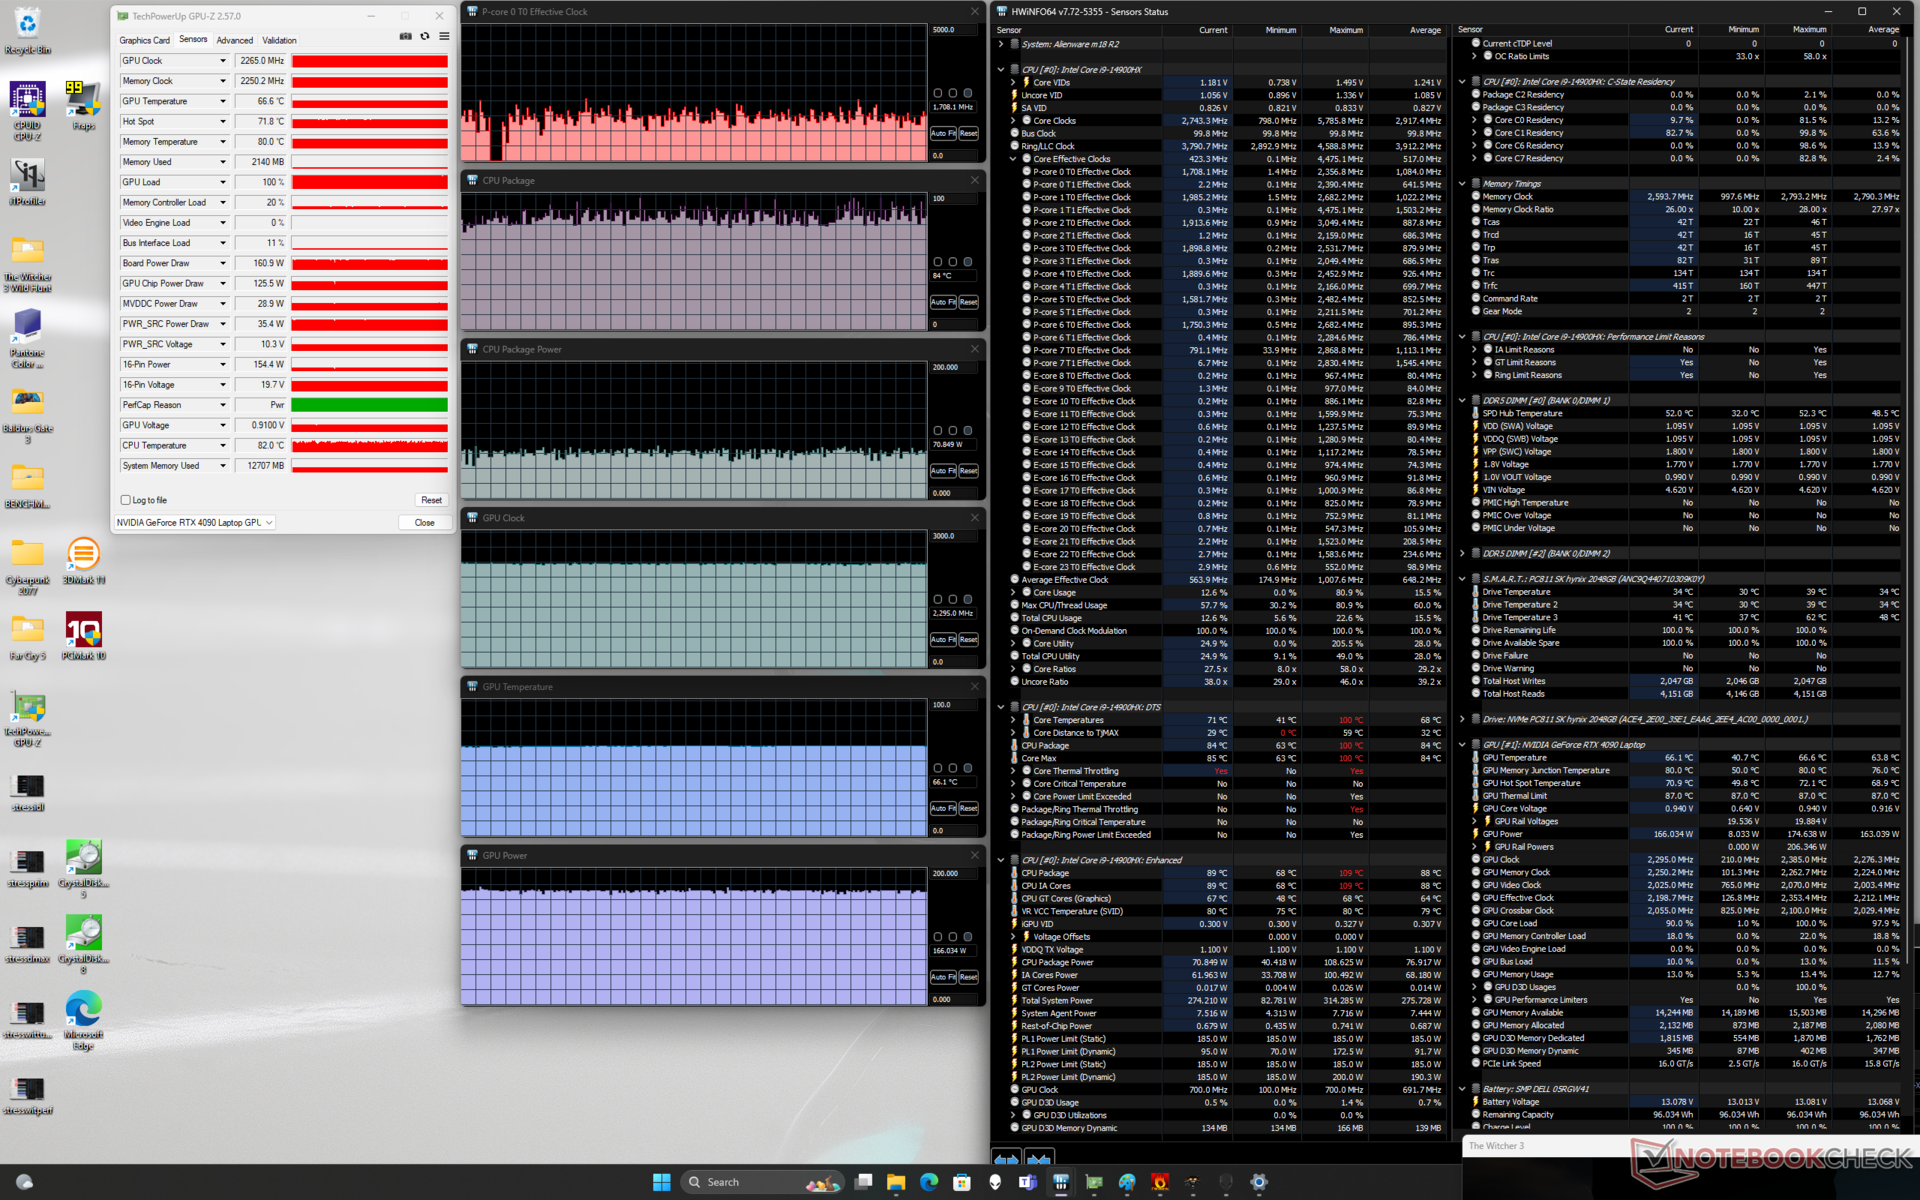
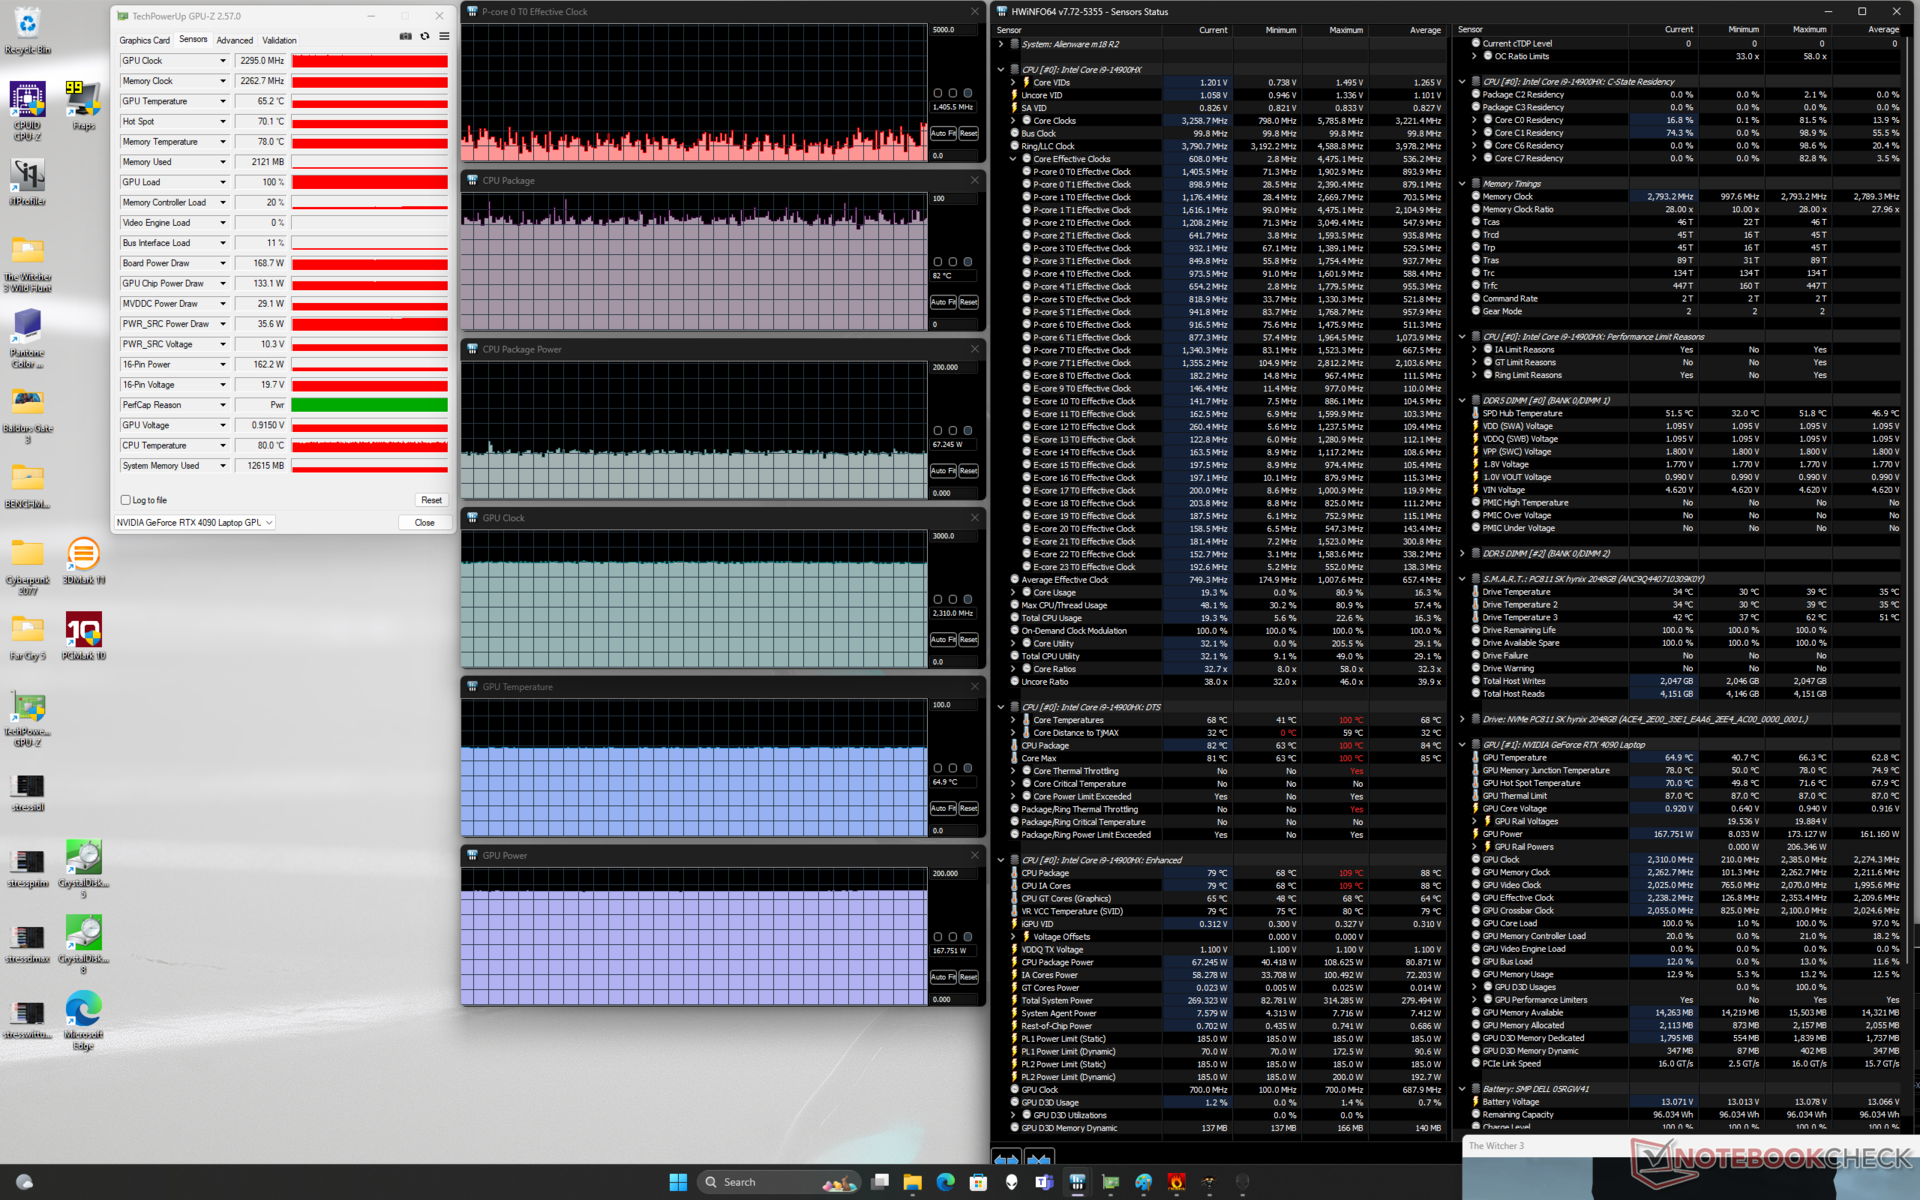
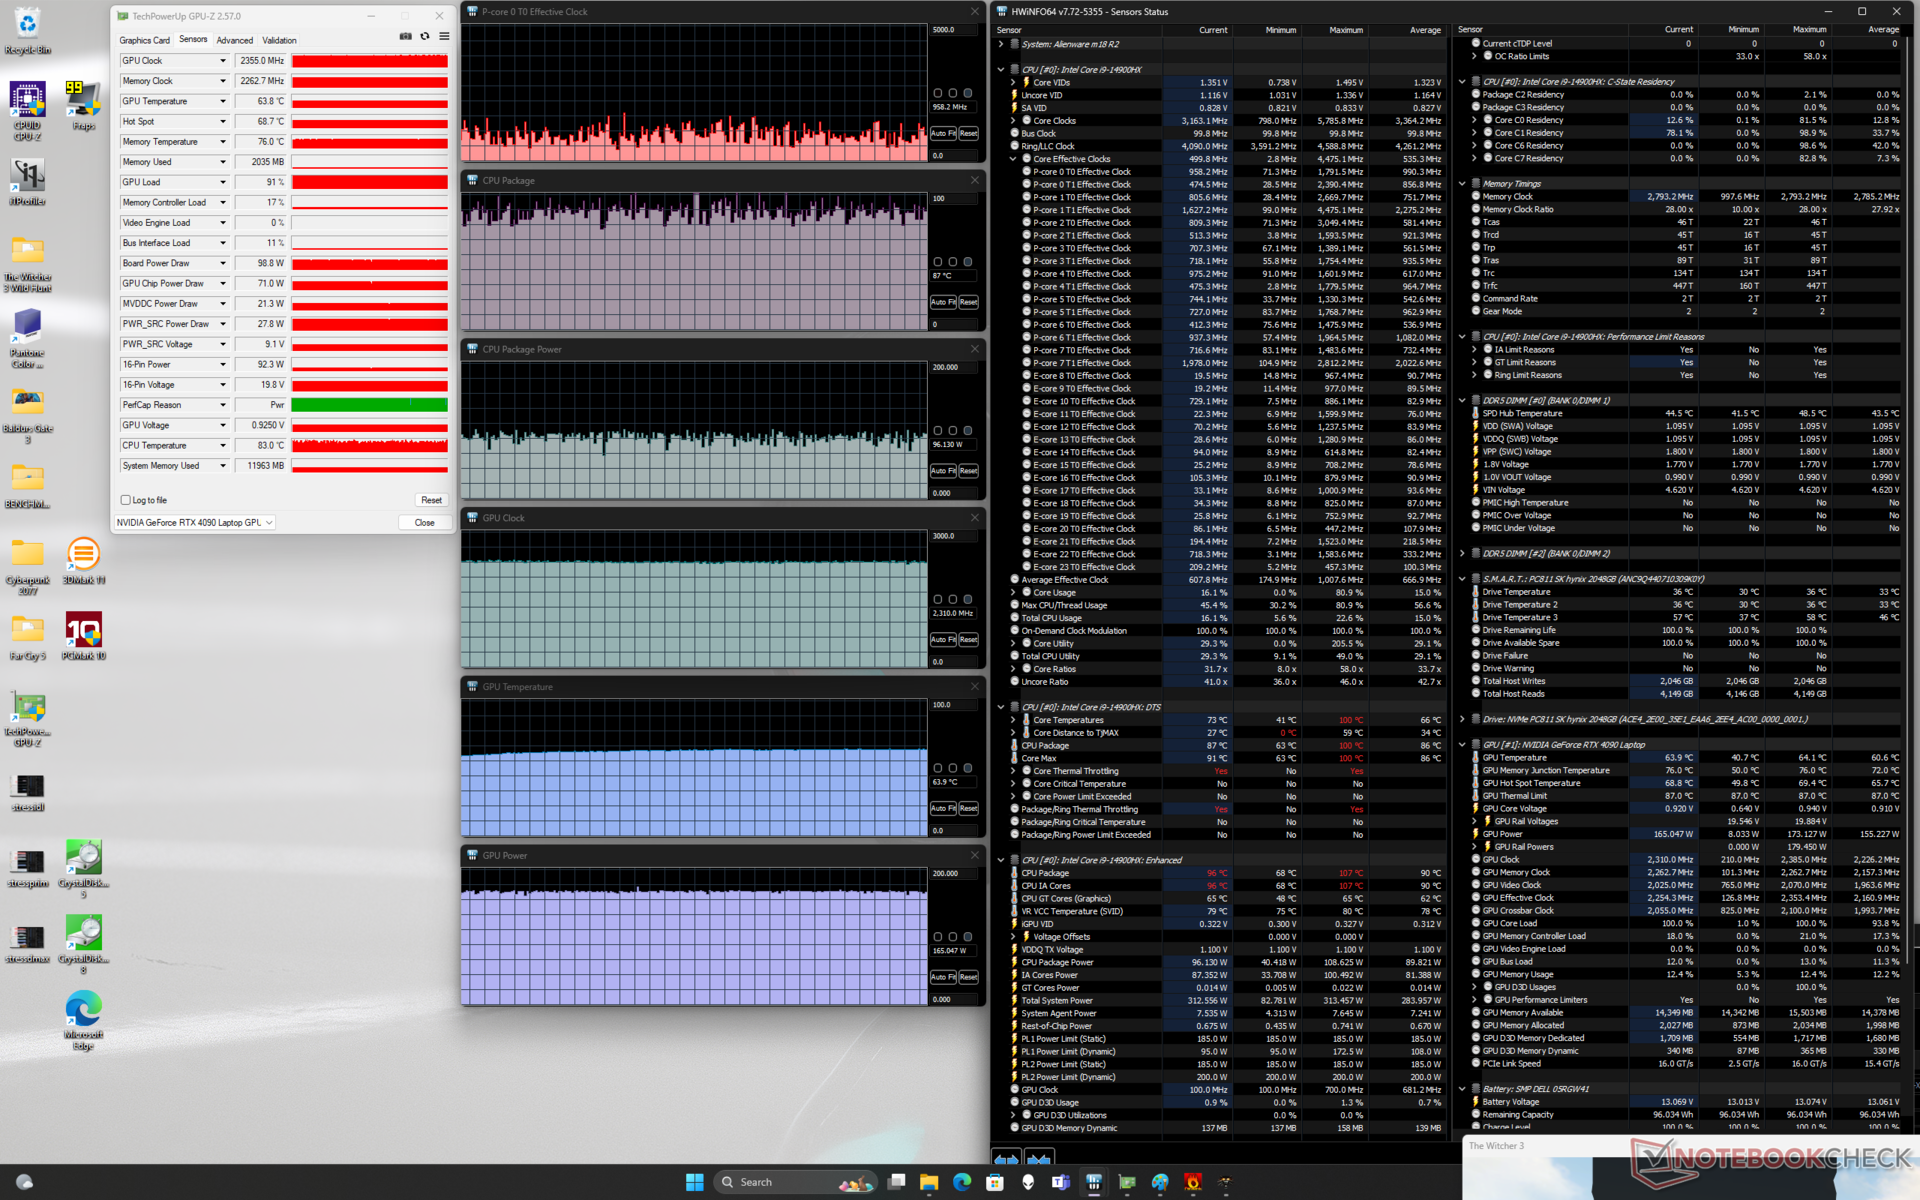
| CPU 时钟 (GHz) | GPU 时钟 (MHz) | CPU 平均温度 (°C) | GPU 平均温度(°C) | |
| 系统闲置 | -- | -- | 36 | 27 |
| Prime95 压力 | 2.1 - 3.3 | -- | 99 | 46 |
| Prime95 + FurMark 压力 | 1.7 - 3.7 | 1350 - 2370 | 74 - 100 | 54 - 61 |
| Witcher 3 压力(平衡模式) | ~1.7 | 2295 | ~84 | 66 |
| Witcher 3 压力(性能模式) | ~1.4 | 2310 | ~82 | 65 |
| Witcher 3 压力(超速模式) | ~1.0 | 2310 | ~87 | 64 |
系统性能
CrossMark: Overall | Productivity | Creativity | Responsiveness
WebXPRT 3: Overall
WebXPRT 4: Overall
Mozilla Kraken 1.1: Total
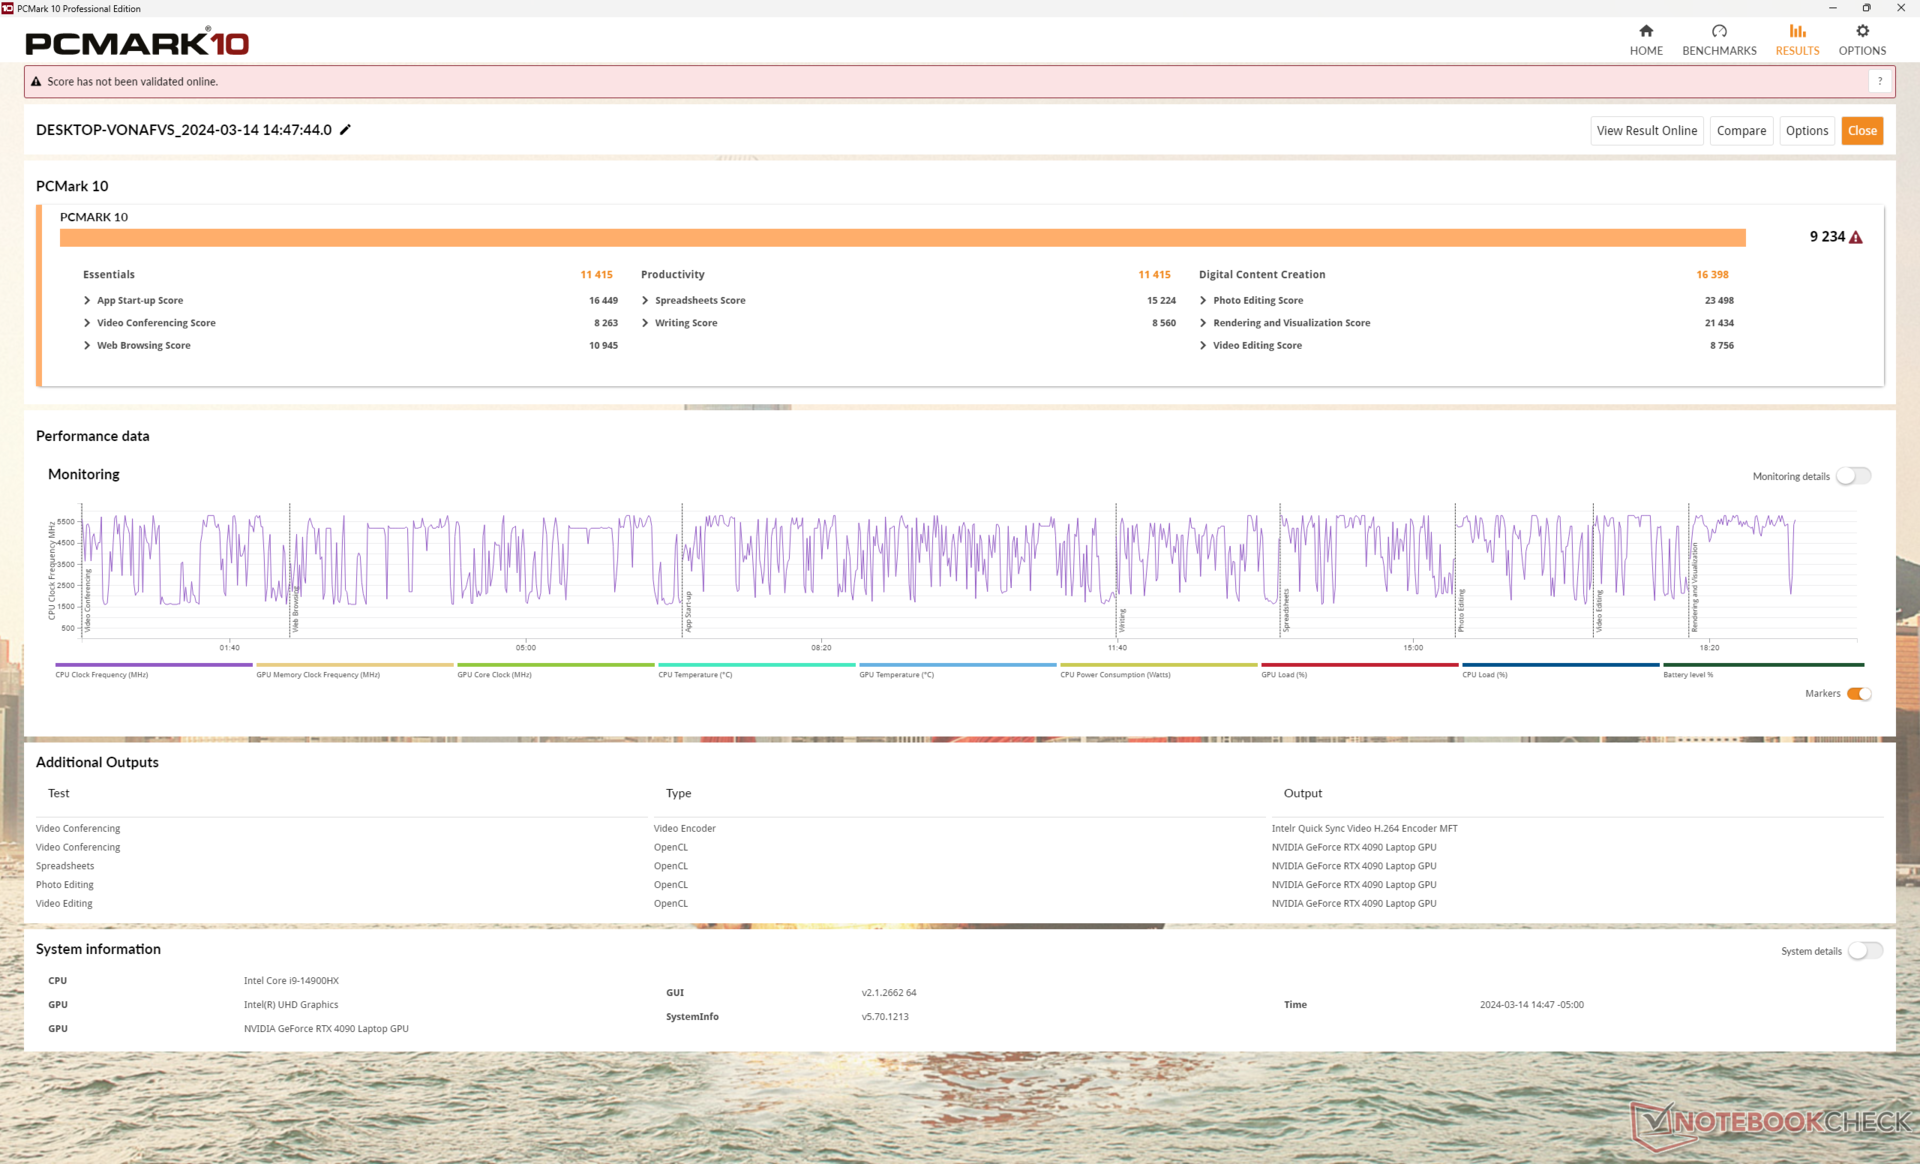
| PCMark 10 / Score | |
| Alienware m18 R1 AMD | |
| Alienware m18 R2 | |
| MSI Titan 18 HX A14VIG | |
| Alienware m18 R1 | |
| Average Intel Core i9-14900HX, NVIDIA GeForce RTX 4090 Laptop GPU (8230 - 9234, n=13) | |
| Acer Predator Helios 18 N23Q2 | |
| Asus ROG Strix G18 G814JI | |
| PCMark 10 / Essentials | |
| Alienware m18 R1 AMD | |
| MSI Titan 18 HX A14VIG | |
| Alienware m18 R2 | |
| Alienware m18 R1 | |
| Average Intel Core i9-14900HX, NVIDIA GeForce RTX 4090 Laptop GPU (10778 - 11628, n=13) | |
| Acer Predator Helios 18 N23Q2 | |
| Asus ROG Strix G18 G814JI | |
| PCMark 10 / Productivity | |
| Alienware m18 R2 | |
| Alienware m18 R1 AMD | |
| Average Intel Core i9-14900HX, NVIDIA GeForce RTX 4090 Laptop GPU (9458 - 11759, n=13) | |
| Acer Predator Helios 18 N23Q2 | |
| MSI Titan 18 HX A14VIG | |
| Alienware m18 R1 | |
| Asus ROG Strix G18 G814JI | |
| PCMark 10 / Digital Content Creation | |
| Alienware m18 R1 AMD | |
| MSI Titan 18 HX A14VIG | |
| Alienware m18 R2 | |
| Alienware m18 R1 | |
| Average Intel Core i9-14900HX, NVIDIA GeForce RTX 4090 Laptop GPU (13219 - 16462, n=13) | |
| Acer Predator Helios 18 N23Q2 | |
| Asus ROG Strix G18 G814JI | |
| CrossMark / Overall | |
| Acer Predator Helios 18 N23Q2 | |
| Alienware m18 R1 | |
| Average Intel Core i9-14900HX, NVIDIA GeForce RTX 4090 Laptop GPU (1877 - 2344, n=10) | |
| Alienware m18 R2 | |
| Alienware m18 R1 AMD | |
| MSI Titan 18 HX A14VIG | |
| CrossMark / Productivity | |
| Acer Predator Helios 18 N23Q2 | |
| Alienware m18 R1 | |
| Average Intel Core i9-14900HX, NVIDIA GeForce RTX 4090 Laptop GPU (1738 - 2162, n=10) | |
| Alienware m18 R2 | |
| Alienware m18 R1 AMD | |
| MSI Titan 18 HX A14VIG | |
| CrossMark / Creativity | |
| Alienware m18 R1 | |
| Acer Predator Helios 18 N23Q2 | |
| Alienware m18 R2 | |
| Average Intel Core i9-14900HX, NVIDIA GeForce RTX 4090 Laptop GPU (2195 - 2660, n=10) | |
| Alienware m18 R1 AMD | |
| MSI Titan 18 HX A14VIG | |
| CrossMark / Responsiveness | |
| Acer Predator Helios 18 N23Q2 | |
| Alienware m18 R1 | |
| Average Intel Core i9-14900HX, NVIDIA GeForce RTX 4090 Laptop GPU (1478 - 2327, n=10) | |
| Alienware m18 R2 | |
| Alienware m18 R1 AMD | |
| MSI Titan 18 HX A14VIG | |
| WebXPRT 3 / Overall | |
| Alienware m18 R1 AMD | |
| Alienware m18 R1 | |
| MSI Titan 18 HX A14VIG | |
| Alienware m18 R2 | |
| Average Intel Core i9-14900HX, NVIDIA GeForce RTX 4090 Laptop GPU (279 - 339, n=10) | |
| Acer Predator Helios 18 N23Q2 | |
| Asus ROG Strix G18 G814JI | |
| Asus ROG Strix G18 G814JI | |
| WebXPRT 4 / Overall | |
| Alienware m18 R2 | |
| Alienware m18 R1 | |
| Alienware m18 R1 AMD | |
| Average Intel Core i9-14900HX, NVIDIA GeForce RTX 4090 Laptop GPU (246 - 309, n=8) | |
| MSI Titan 18 HX A14VIG | |
| Asus ROG Strix G18 G814JI | |
| Asus ROG Strix G18 G814JI | |
| Mozilla Kraken 1.1 / Total | |
| Asus ROG Strix G18 G814JI | |
| Asus ROG Strix G18 G814JI | |
| Alienware m18 R1 AMD | |
| Alienware m18 R1 | |
| Acer Predator Helios 18 N23Q2 | |
| Average Intel Core i9-14900HX, NVIDIA GeForce RTX 4090 Laptop GPU (428 - 535, n=11) | |
| MSI Titan 18 HX A14VIG | |
| Alienware m18 R2 | |
* ... smaller is better
| PCMark 10 Score | 9234 points | |
Help | ||
| AIDA64 / Memory Copy | |
| Alienware m18 R1 | |
| Alienware m18 R2 | |
| Acer Predator Helios 18 N23Q2 | |
| Average Intel Core i9-14900HX (38028 - 83392, n=36) | |
| Asus ROG Strix G18 G814JI | |
| MSI Titan 18 HX A14VIG | |
| Alienware m18 R1 AMD | |
| AIDA64 / Memory Read | |
| Alienware m18 R1 | |
| Acer Predator Helios 18 N23Q2 | |
| Alienware m18 R2 | |
| Average Intel Core i9-14900HX (43306 - 87568, n=36) | |
| Asus ROG Strix G18 G814JI | |
| Alienware m18 R1 AMD | |
| MSI Titan 18 HX A14VIG | |
| AIDA64 / Memory Write | |
| Alienware m18 R1 | |
| Alienware m18 R2 | |
| Acer Predator Helios 18 N23Q2 | |
| Average Intel Core i9-14900HX (37146 - 80589, n=36) | |
| Alienware m18 R1 AMD | |
| Asus ROG Strix G18 G814JI | |
| MSI Titan 18 HX A14VIG | |
| AIDA64 / Memory Latency | |
| MSI Titan 18 HX A14VIG | |
| Alienware m18 R1 AMD | |
| Alienware m18 R2 | |
| Average Intel Core i9-14900HX (76.1 - 105, n=36) | |
| Asus ROG Strix G18 G814JI | |
| Acer Predator Helios 18 N23Q2 | |
| Alienware m18 R1 | |
* ... smaller is better
DPC 延迟
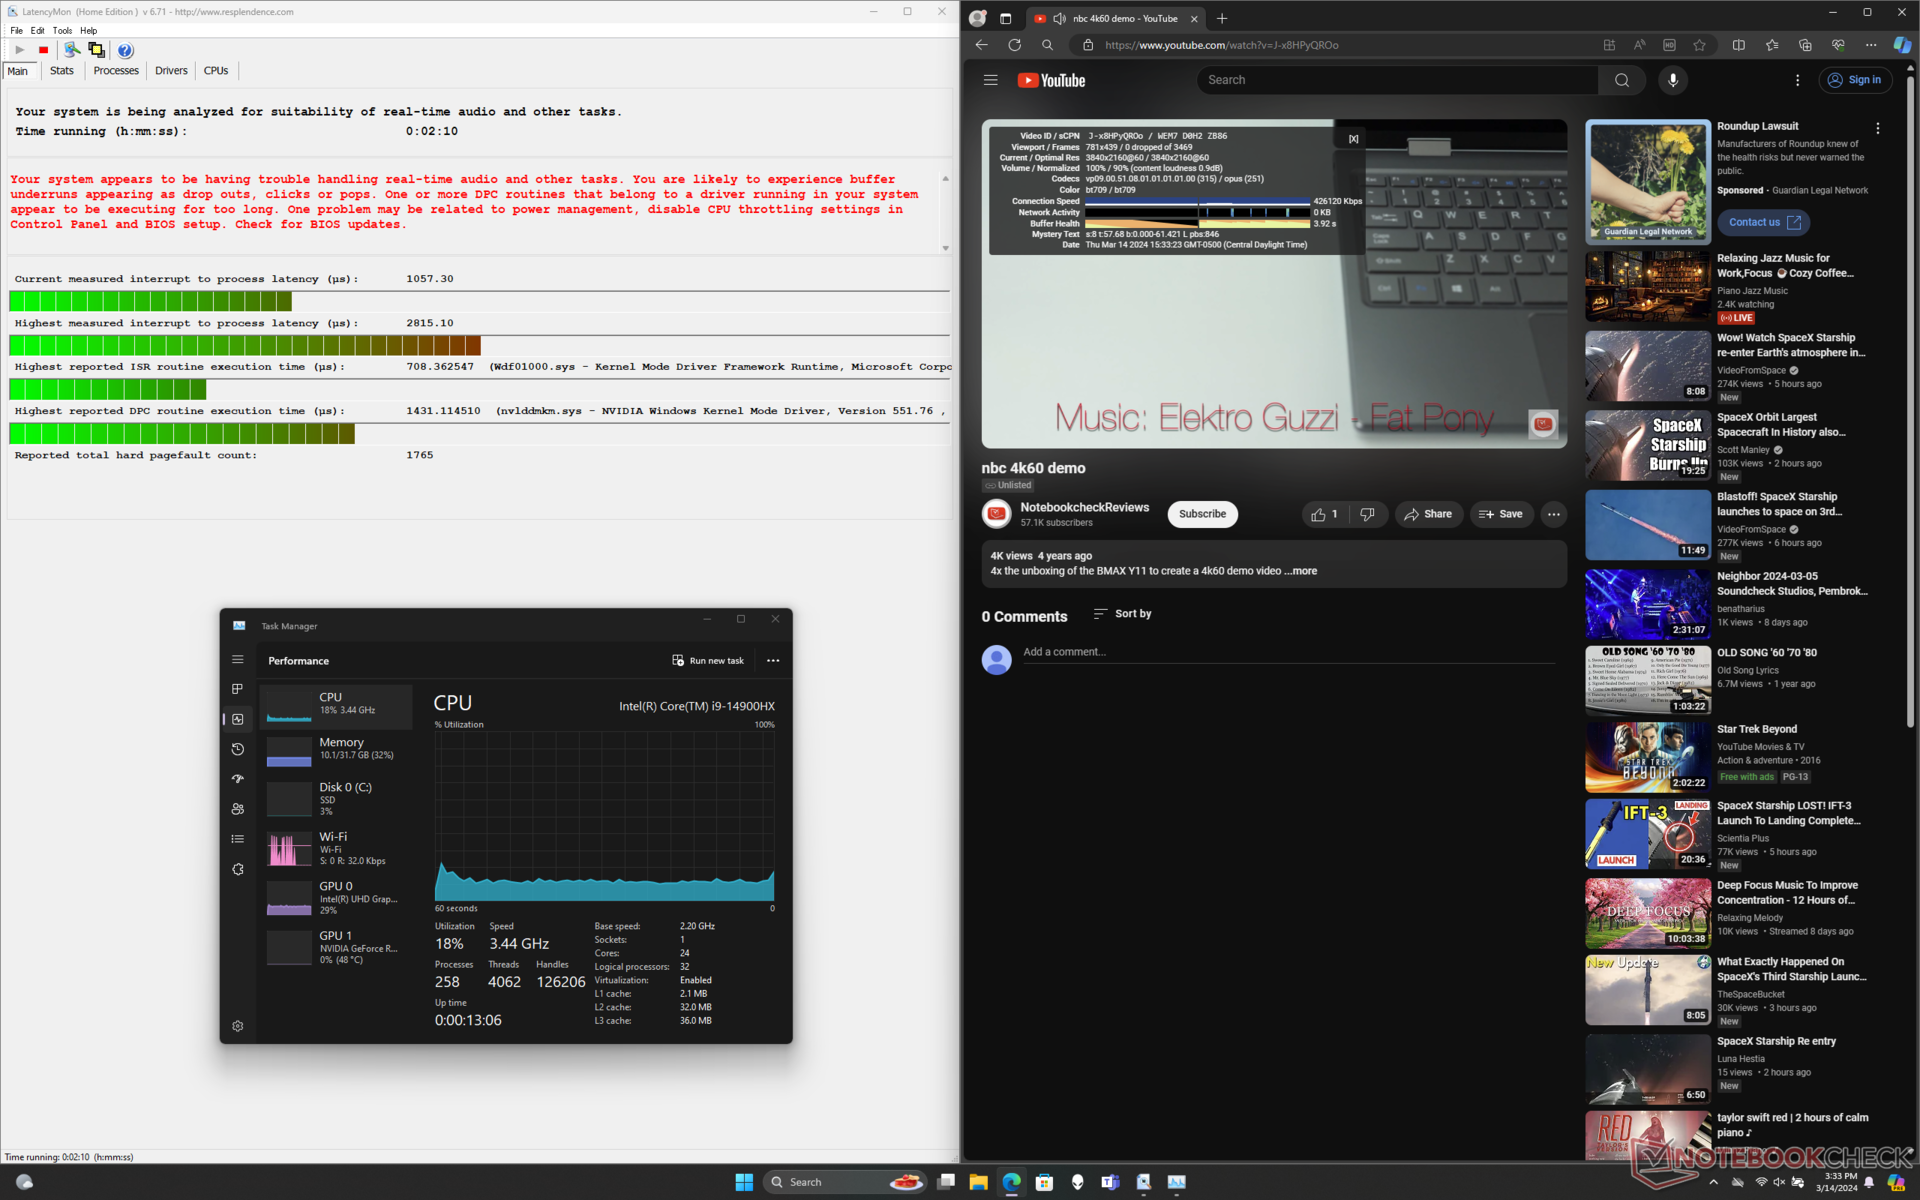
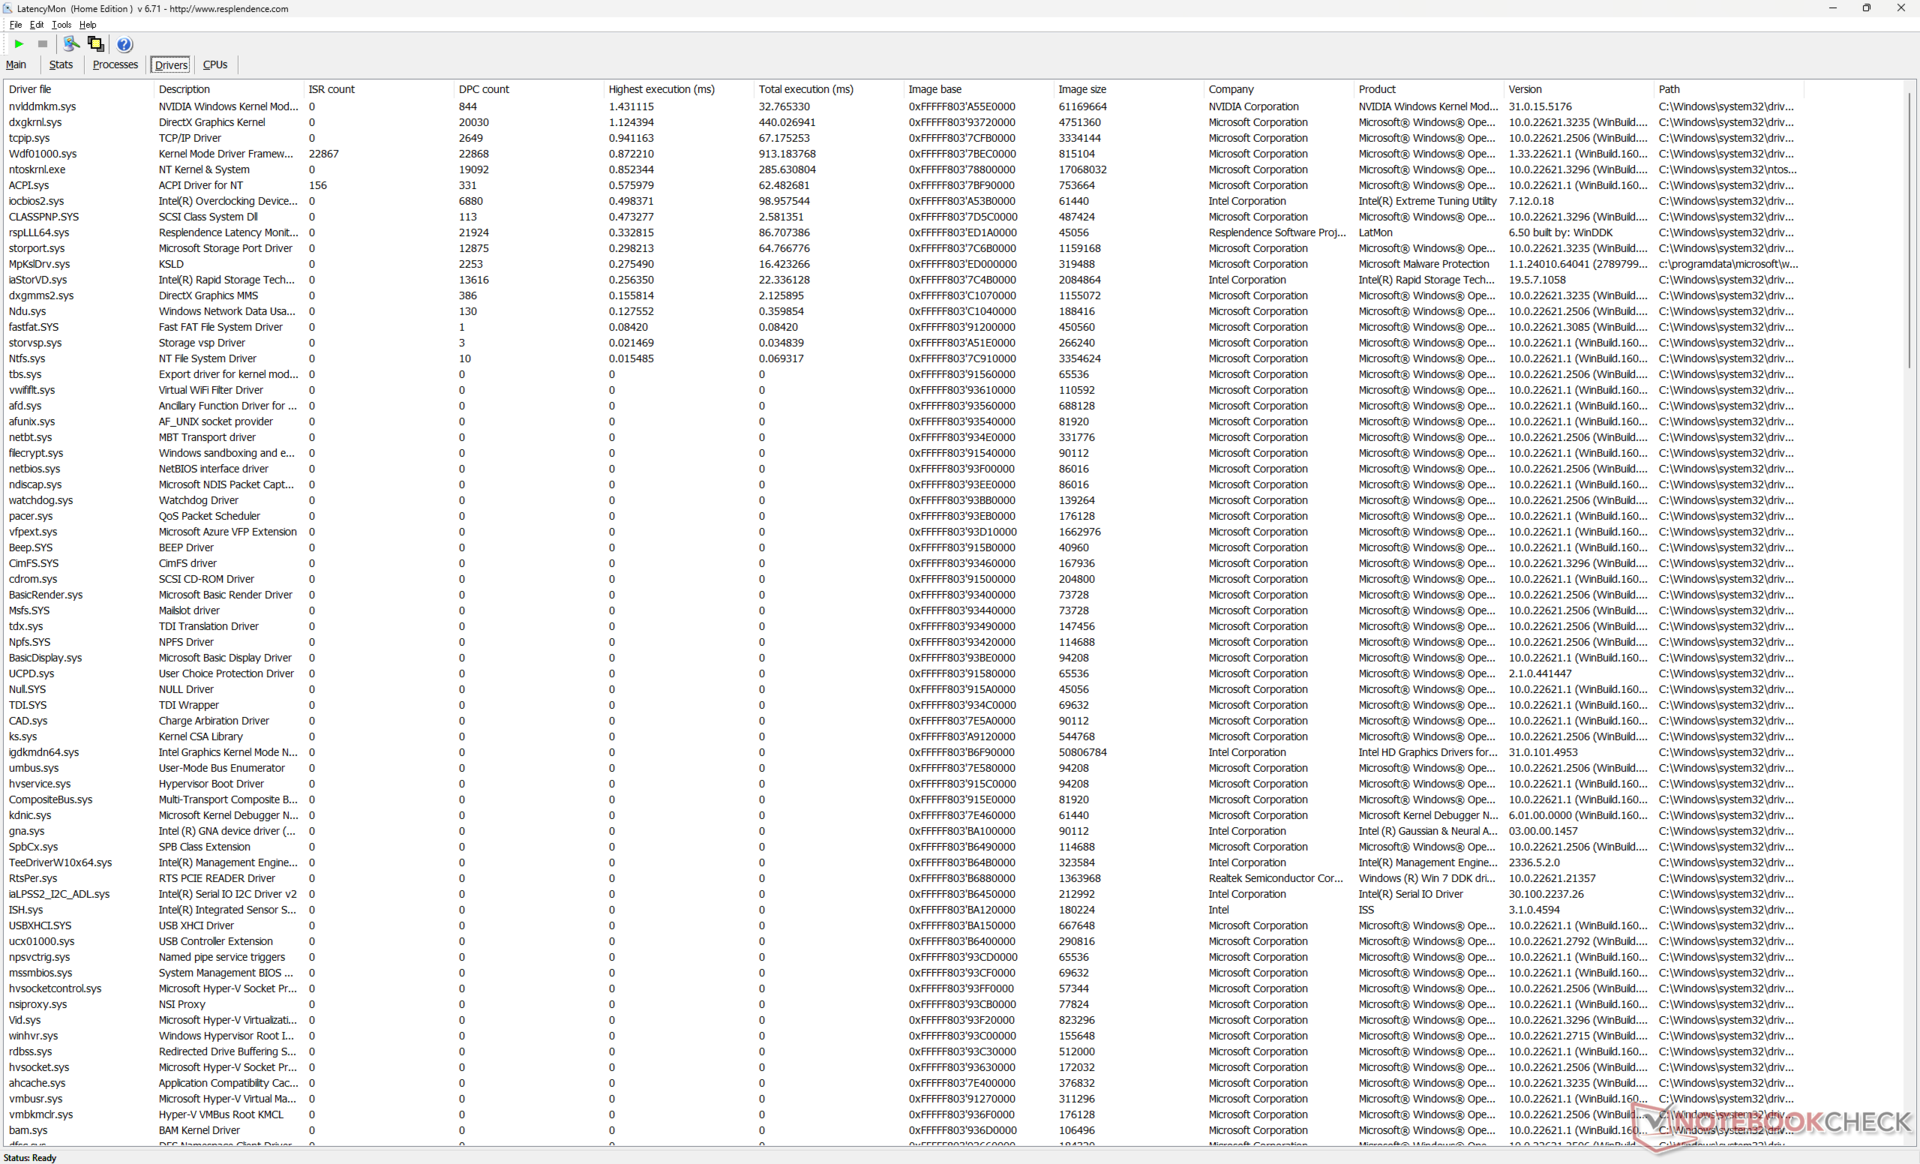
| DPC Latencies / LatencyMon - interrupt to process latency (max), Web, Youtube, Prime95 | |
| Acer Predator Helios 18 N23Q2 | |
| Alienware m18 R2 | |
| Alienware m18 R1 | |
| MSI Titan 18 HX A14VIG | |
| Alienware m18 R1 AMD | |
| Asus ROG Strix G18 G814JI | |
* ... smaller is better
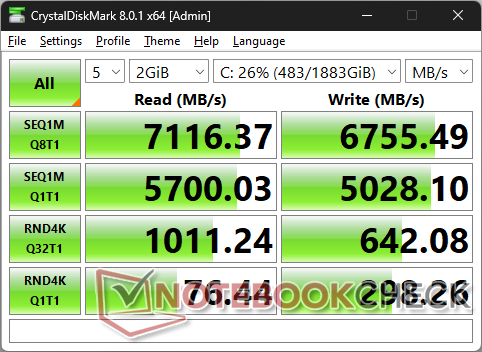
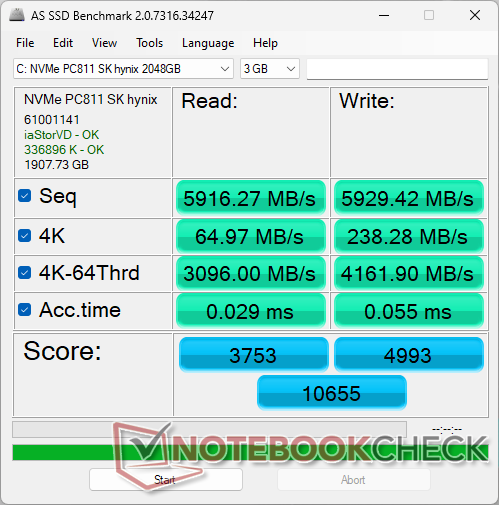
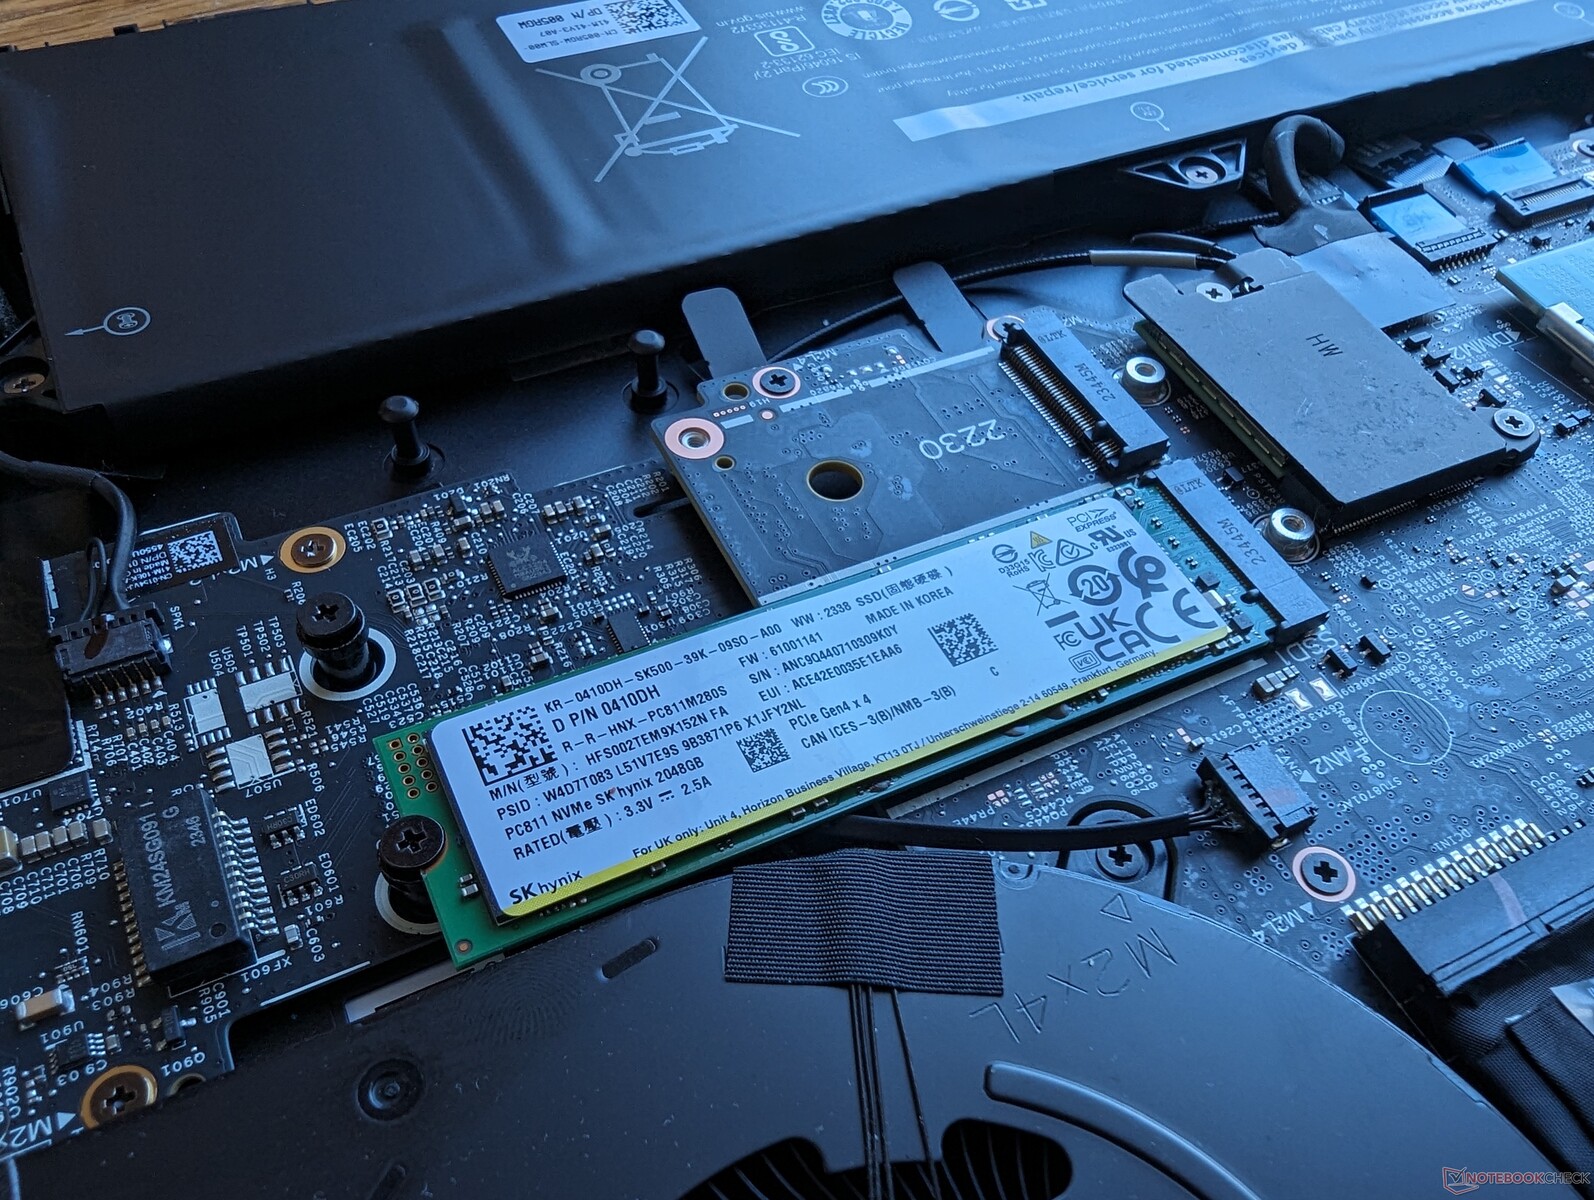
存储设备
Alienware 是首批配备 2 TB SK Hynix PC811PCIe4 x4 NVMe 固态硬盘。与 PC801 系列相比,PC811 系列采用了 8D NAND 闪存,而不是 4D NAND,从而提高了整体存储容量和能效。该硬盘在受压时能够维持每秒 ~7100 MB 的最大传输速率,这基本上是单一 PCIe4 x4 SSD 的性能上限。
戴尔可配置两个 4 TB 硬盘,总存储容量为 8 TB。

| Drive Performance rating - Percent | |
| Alienware m18 R2 | |
| Alienware m18 R1 | |
| Acer Predator Helios 18 N23Q2 | |
| MSI Titan 18 HX A14VIG | |
| Alienware m18 R1 AMD | |
| Asus ROG Strix G18 G814JI | |
* ... smaller is better
Disk Throttling: DiskSpd Read Loop, Queue Depth 8
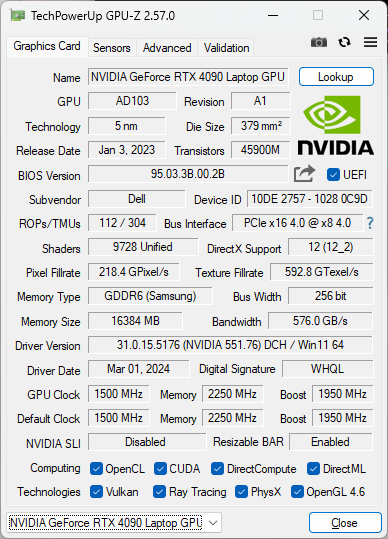
图形处理器性能 - 175 W TGP 图形处理器
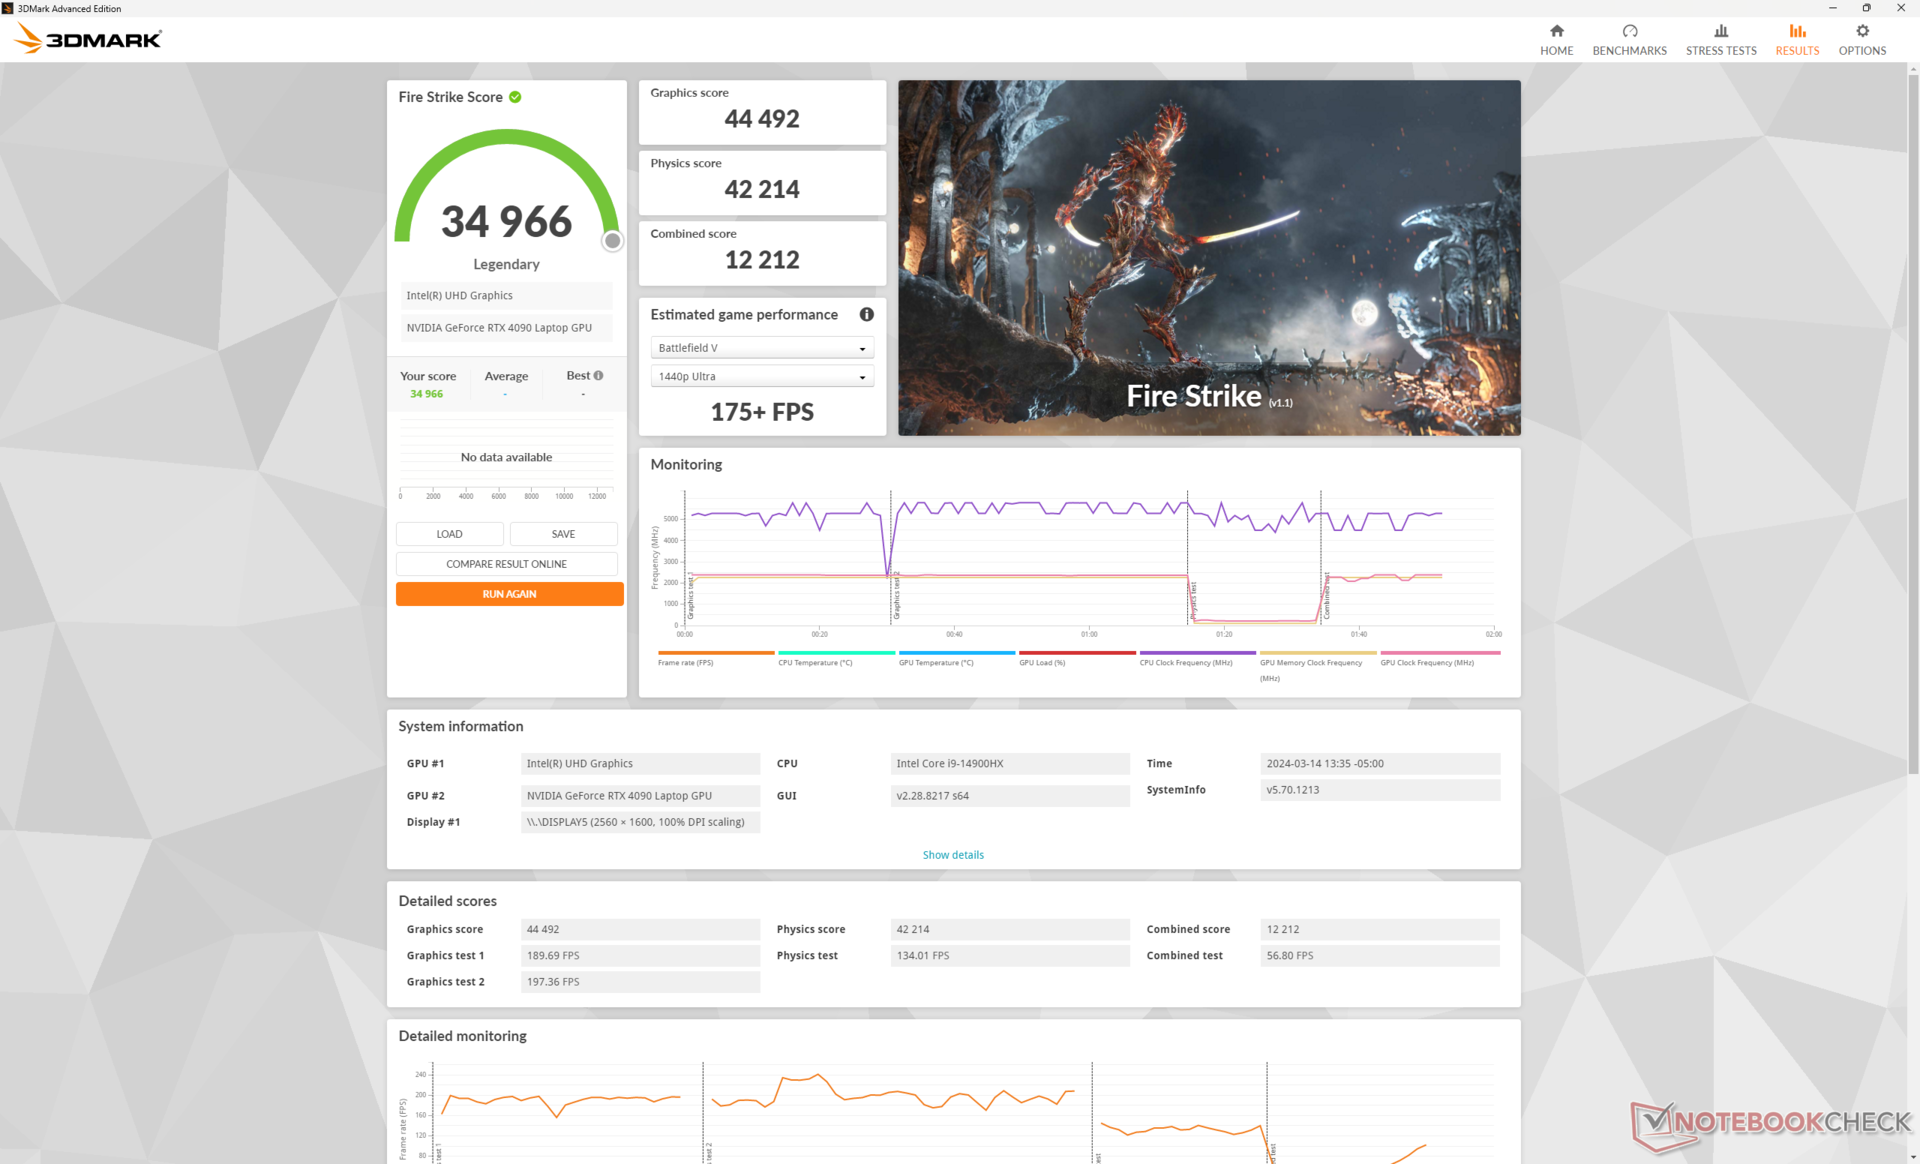
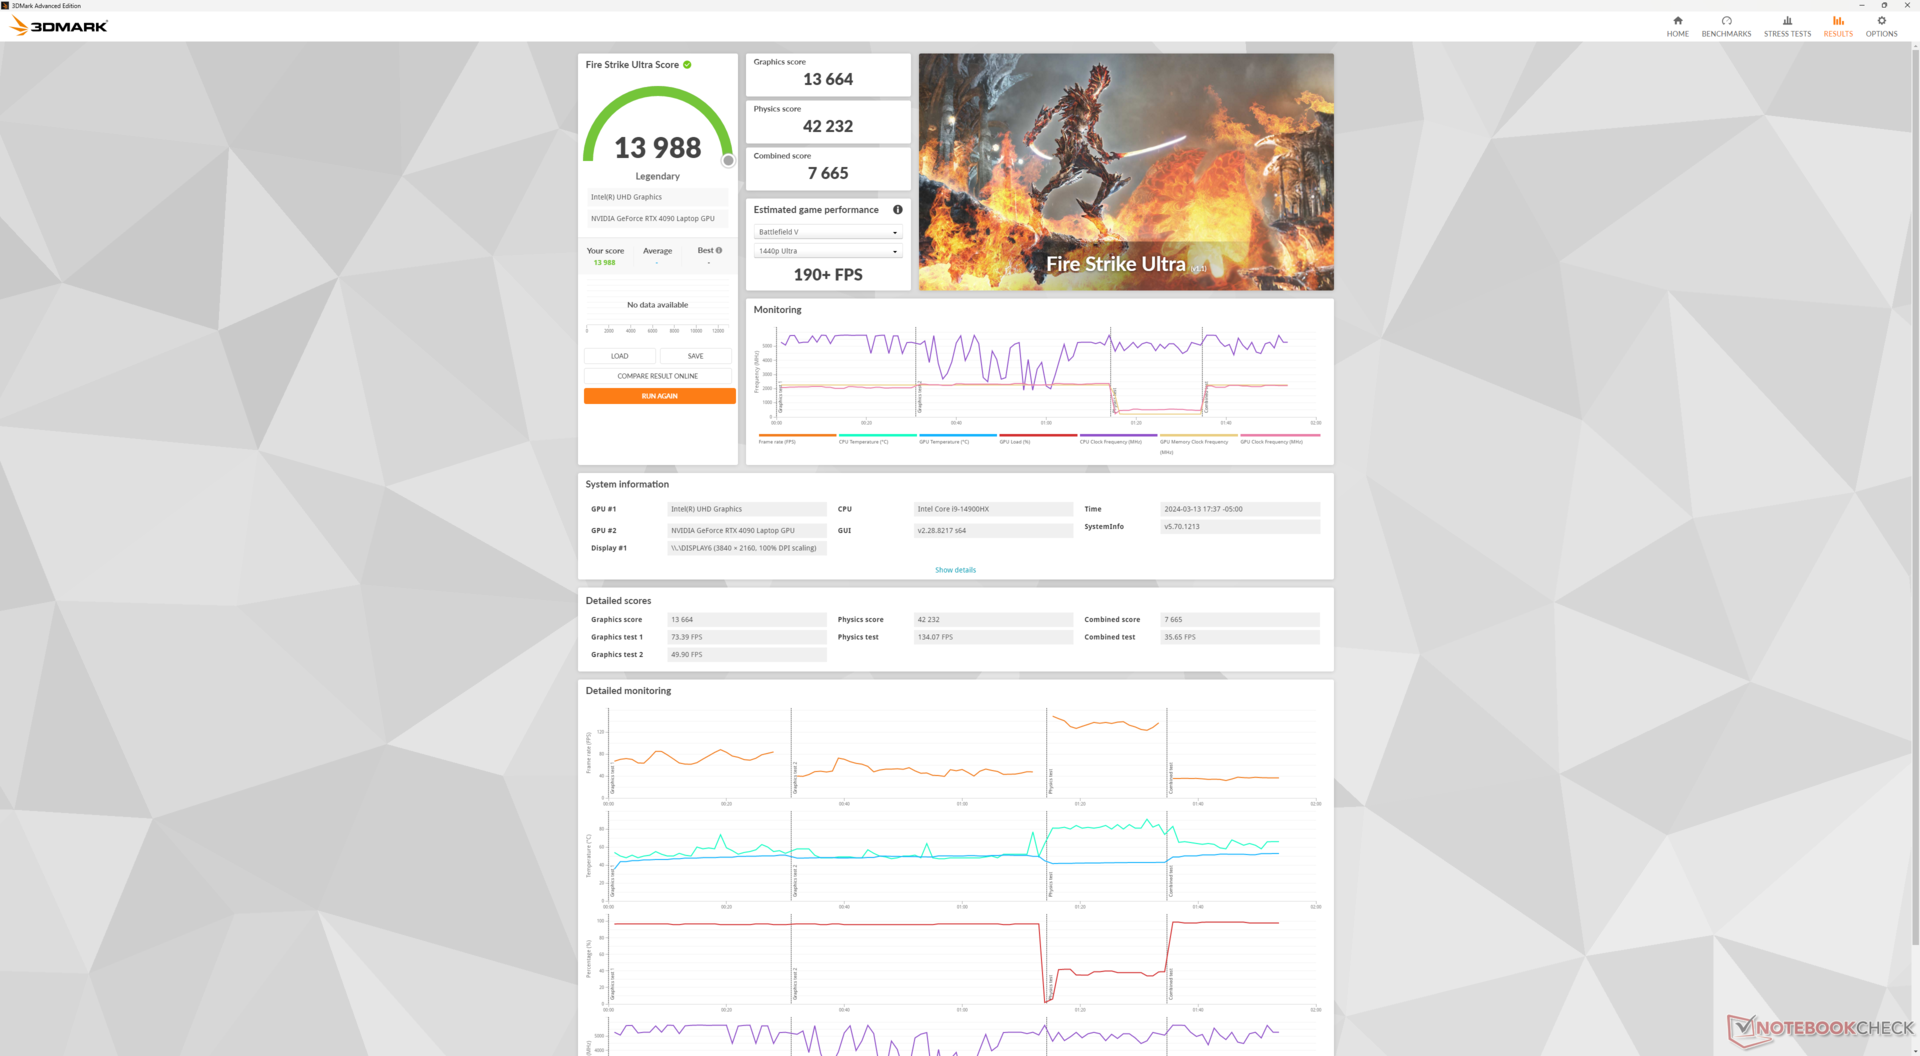
175 WGeForce RTX 4090 今年又回来了,与去年的 m18 R1 游戏性能相同,没有重大变化。也许最重要的是,如下表Fire Strike 所示,超频、性能和平衡配置文件之间再次没有重大性能差异。
| 电源配置文件 | 图形分数 | 物理得分 | 综合得分 |
| 超速模式 | 13664 | 42232 | 7665 |
| 性能模式 | 13579 (-0%) | 42217 (-0%) | 7541 (-2%) |
| 平衡模式 | 13449 (-1%) | 40978 (-3%) | 7592 (-1%) |
| 电池电量 | 5116 (-63%) | 22857 (-46%) | 2102 (-73%) |
降至 RTX 4080、4070 或 4060 配置的图形性能预计将分别降低约 5%至 10%、30%至 35%,以及 45%至 55%。因此,RTX 4080 和 RTX 4070 的性能下降幅度最大。
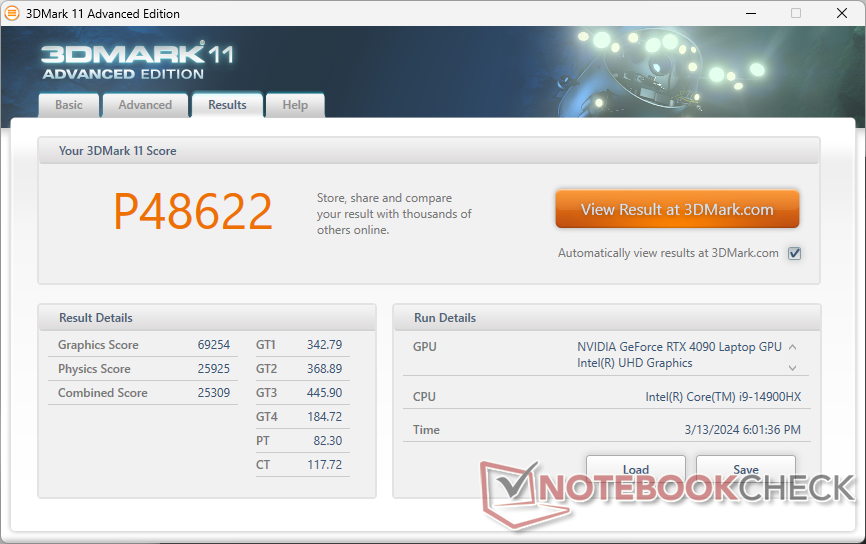
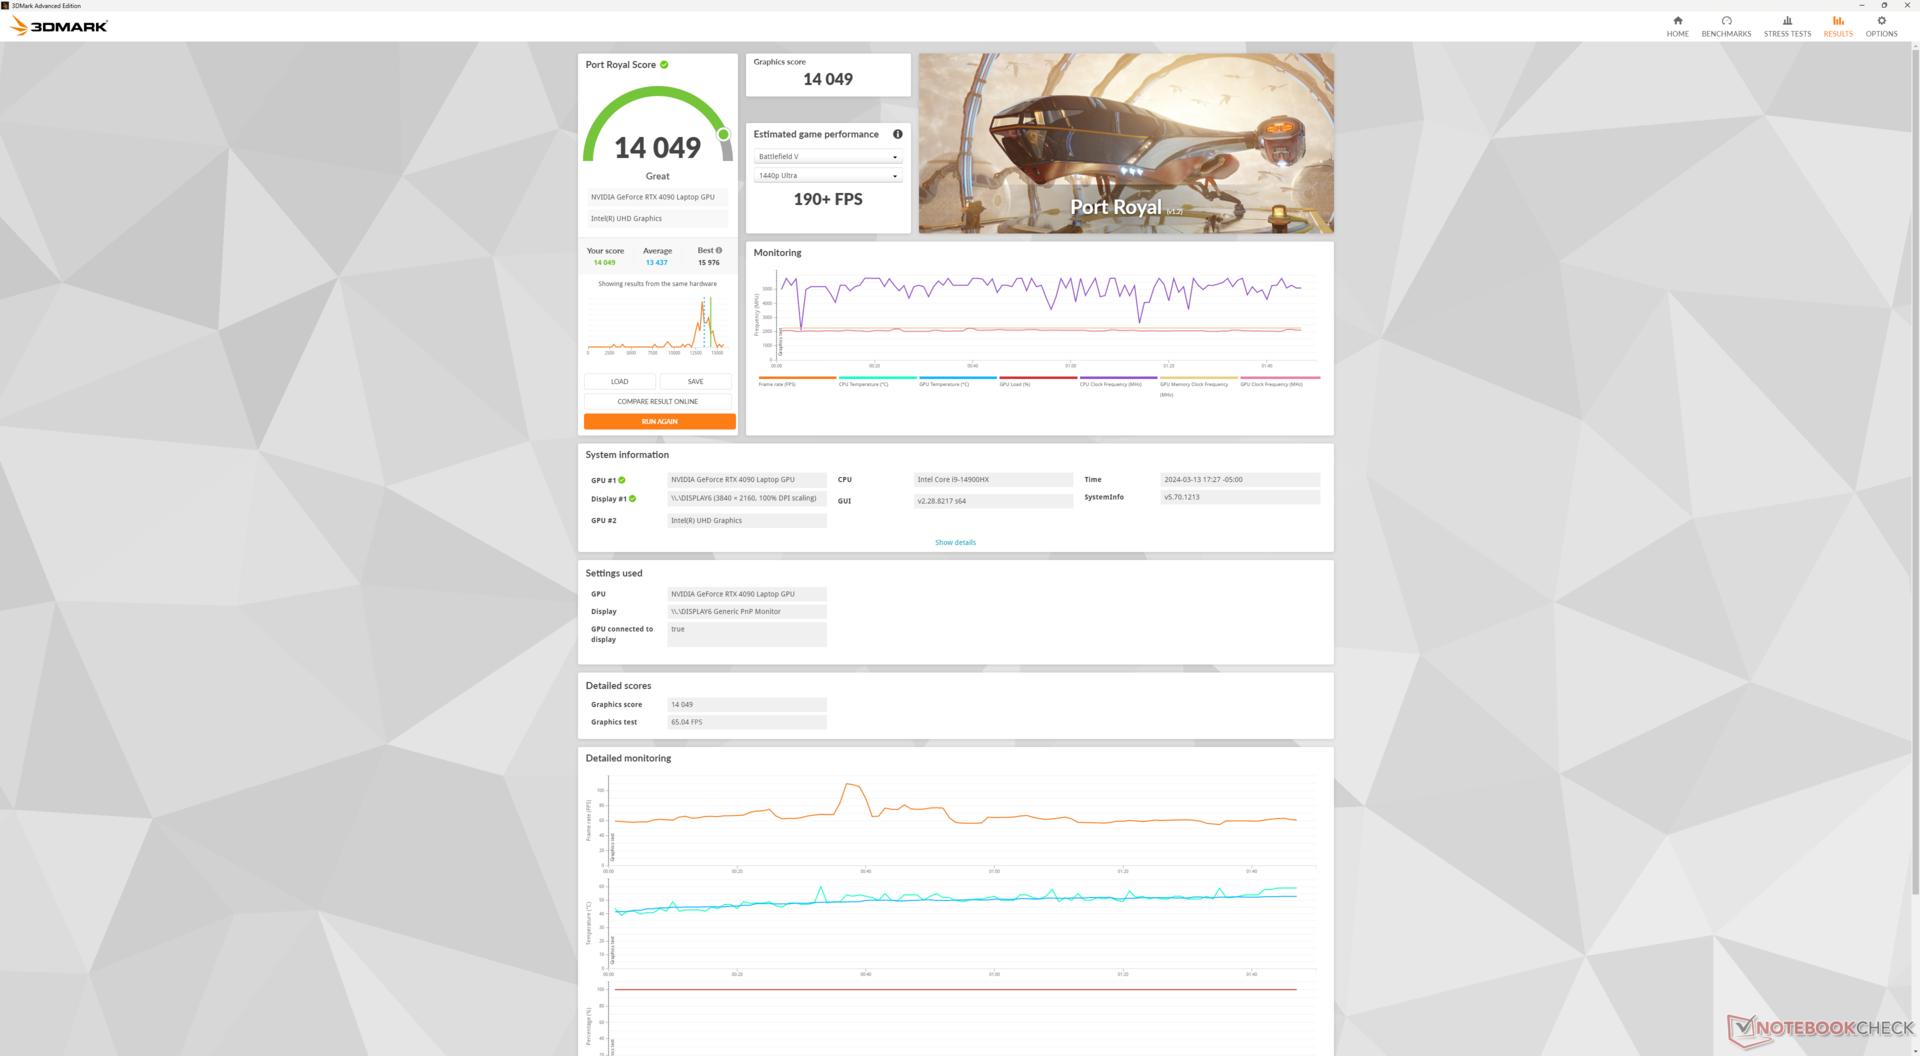
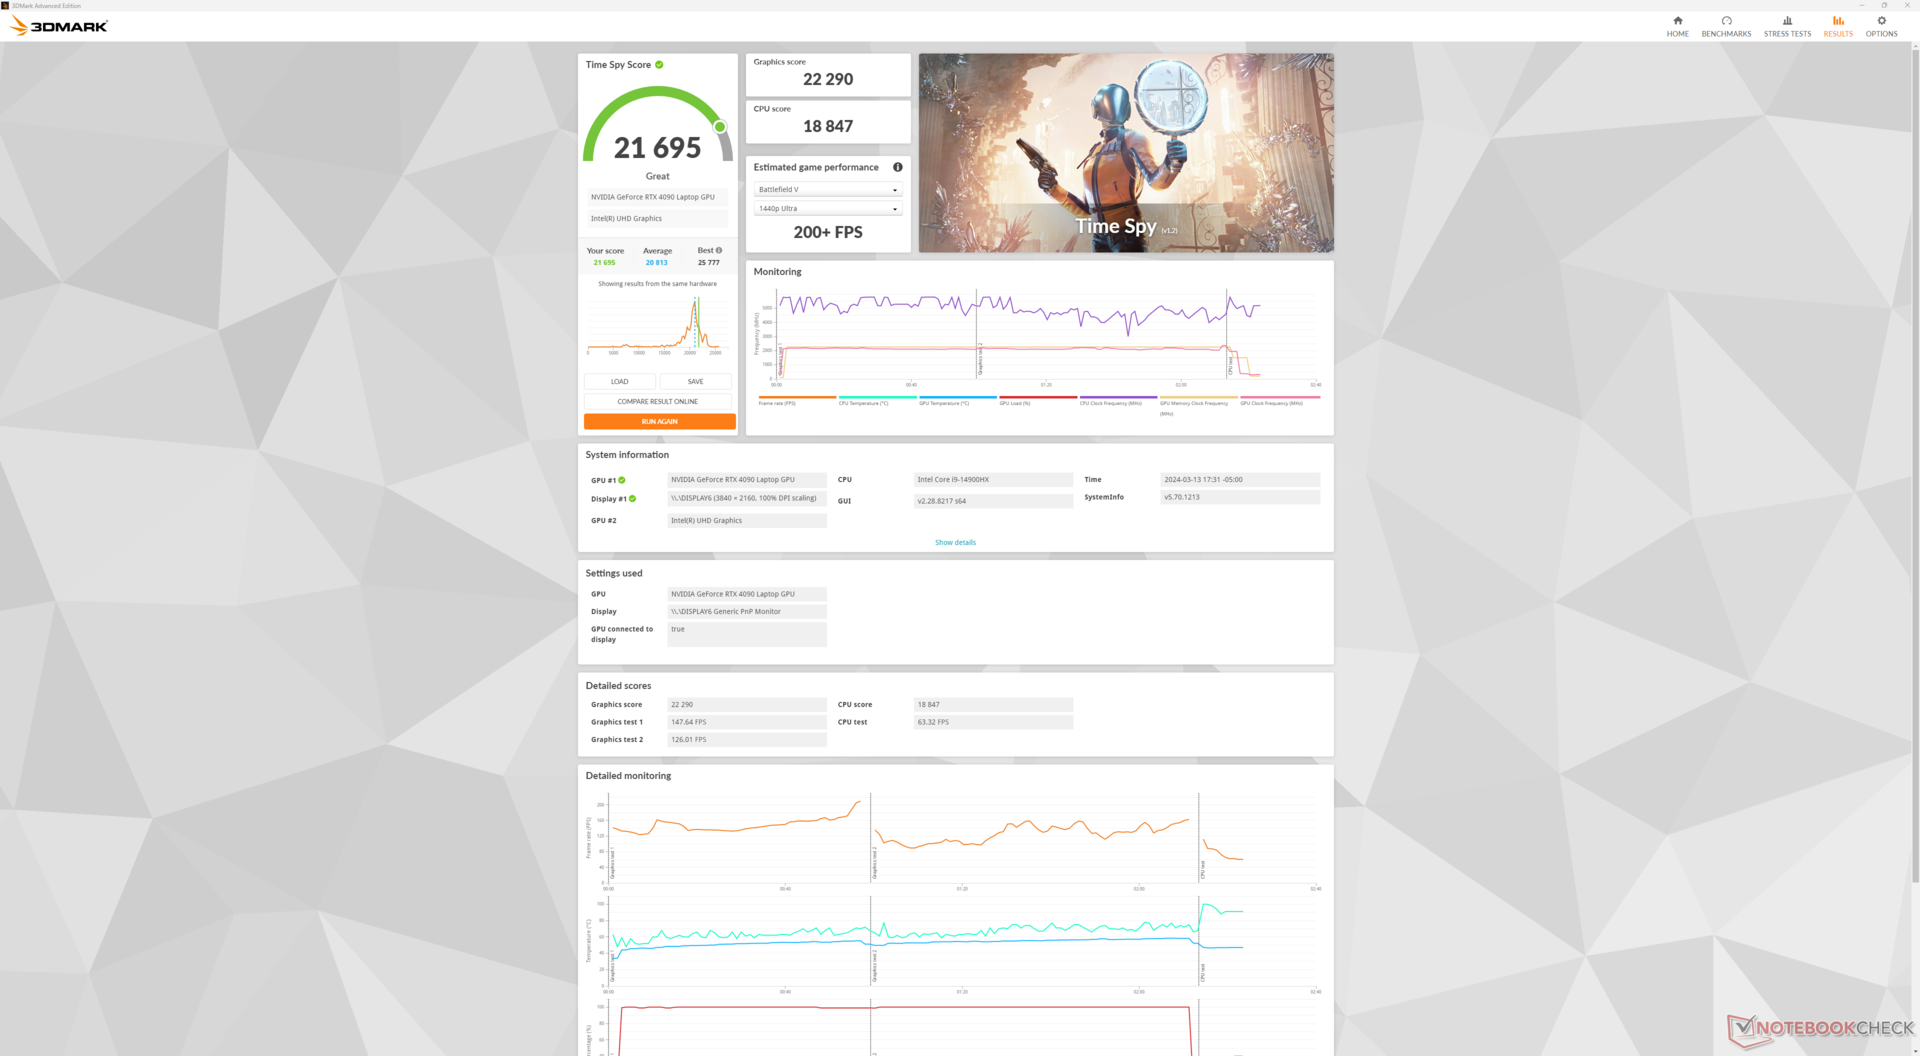
| 3DMark 11 Performance | 48622 points | |
| 3DMark Fire Strike Score | 34966 points | |
| 3DMark Time Spy Score | 21695 points | |
Help | ||
* ... smaller is better
游戏性能
尽管更换了 CPU,但游戏性能仍与 m18 R1 相同。当帧频超过 60 FPS 时,RTX 4090 与 1600p 分辨率的显示器搭配得非常好。
| Performance rating - Percent | |
| Alienware m18 R1 | |
| Alienware m18 R2 | |
| MSI Titan 18 HX A14VIG | |
| Acer Predator Helios 18 N23Q2 | |
| Alienware m18 R1 AMD | |
| Asus ROG Strix G18 G814JI | |
| The Witcher 3 - 1920x1080 Ultra Graphics & Postprocessing (HBAO+) | |
| Alienware m18 R1 | |
| MSI Titan 18 HX A14VIG | |
| Alienware m18 R2 | |
| Acer Predator Helios 18 N23Q2 | |
| Alienware m18 R1 AMD | |
| Asus ROG Strix G18 G814JI | |
| GTA V - 1920x1080 Highest AA:4xMSAA + FX AF:16x | |
| Acer Predator Helios 18 N23Q2 | |
| Alienware m18 R1 | |
| MSI Titan 18 HX A14VIG | |
| Alienware m18 R2 | |
| Asus ROG Strix G18 G814JI | |
| Alienware m18 R1 AMD | |
| Final Fantasy XV Benchmark - 1920x1080 High Quality | |
| Alienware m18 R1 | |
| Alienware m18 R2 | |
| MSI Titan 18 HX A14VIG | |
| Acer Predator Helios 18 N23Q2 | |
| Alienware m18 R1 AMD | |
| Asus ROG Strix G18 G814JI | |
| Strange Brigade - 1920x1080 ultra AA:ultra AF:16 | |
| MSI Titan 18 HX A14VIG | |
| Alienware m18 R1 | |
| Alienware m18 R2 | |
| Alienware m18 R1 AMD | |
| Acer Predator Helios 18 N23Q2 | |
| Asus ROG Strix G18 G814JI | |
| Dota 2 Reborn - 1920x1080 ultra (3/3) best looking | |
| Alienware m18 R1 | |
| Acer Predator Helios 18 N23Q2 | |
| MSI Titan 18 HX A14VIG | |
| Alienware m18 R2 | |
| Asus ROG Strix G18 G814JI | |
| Alienware m18 R1 AMD | |
| X-Plane 11.11 - 1920x1080 high (fps_test=3) | |
| Alienware m18 R1 | |
| Alienware m18 R2 | |
| Acer Predator Helios 18 N23Q2 | |
| MSI Titan 18 HX A14VIG | |
| Asus ROG Strix G18 G814JI | |
| Alienware m18 R1 AMD | |
Witcher 3 FPS Chart
| low | med. | high | ultra | QHD DLSS | QHD | 4K DLSS | 4K | |
|---|---|---|---|---|---|---|---|---|
| GTA V (2015) | 185.2 | 181.6 | 179.6 | 137 | 134.7 | 174.9 | ||
| The Witcher 3 (2015) | 585.5 | 525.8 | 405.6 | 205.7 | 157.7 | |||
| Dota 2 Reborn (2015) | 217 | 190.1 | 181.5 | 171.8 | 160.8 | |||
| Final Fantasy XV Benchmark (2018) | 229 | 199.2 | 193.2 | 160.1 | 93.8 | |||
| X-Plane 11.11 (2018) | 201 | 180.1 | 140.6 | 120.4 | ||||
| Far Cry 5 (2018) | 181 | 171 | 160 | 154 | 112 | |||
| Strange Brigade (2018) | 471 | 387 | 383 | 369 | 309 | 160.2 | ||
| Tiny Tina's Wonderlands (2022) | 348.6 | 285.3 | 227.2 | 187.5 | 132.8 | 71.2 | ||
| F1 22 (2022) | 305 | 295 | 276 | 135.1 | 91.4 | 45.4 | ||
| Baldur's Gate 3 (2023) | 246.9 | 222.5 | 206.7 | 202 | 151.6 | 81.7 | ||
| Cyberpunk 2077 (2023) | 149.3 | 148.7 | 142.9 | 133.9 | 94.1 | 43.4 | ||
| Assassin's Creed Mirage (2023) | 230 | 215 | 205 | 160 | 135 | 110 | 81 | |
| Alan Wake 2 (2023) | 124.6 | 121.4 | 116.9 | 83.1 | 62.3 | 45.2 | ||
| Call of Duty Modern Warfare 3 2023 (2023) | 276 | 255 | 220 | 205 | 160 | 113 | 106 | |
| Avatar Frontiers of Pandora (2023) | 162 | 150 | 131 | 103 | 70 | 63 | 36 | |
| Black Myth: Wukong (2024) | 55 | 62 | 42 | 25 | ||||
| Indiana Jones and the Great Circle (2024) | 121.1 | 95.6 | 60.9 | |||||
| Monster Hunter Wilds (2025) | 78.54 | 76.96 | 66.98 | 42.01 | ||||
| Assassin's Creed Shadows (2025) | 100 | 90 | 77 | 57 | 59 | 50 |
排放量
系统噪音
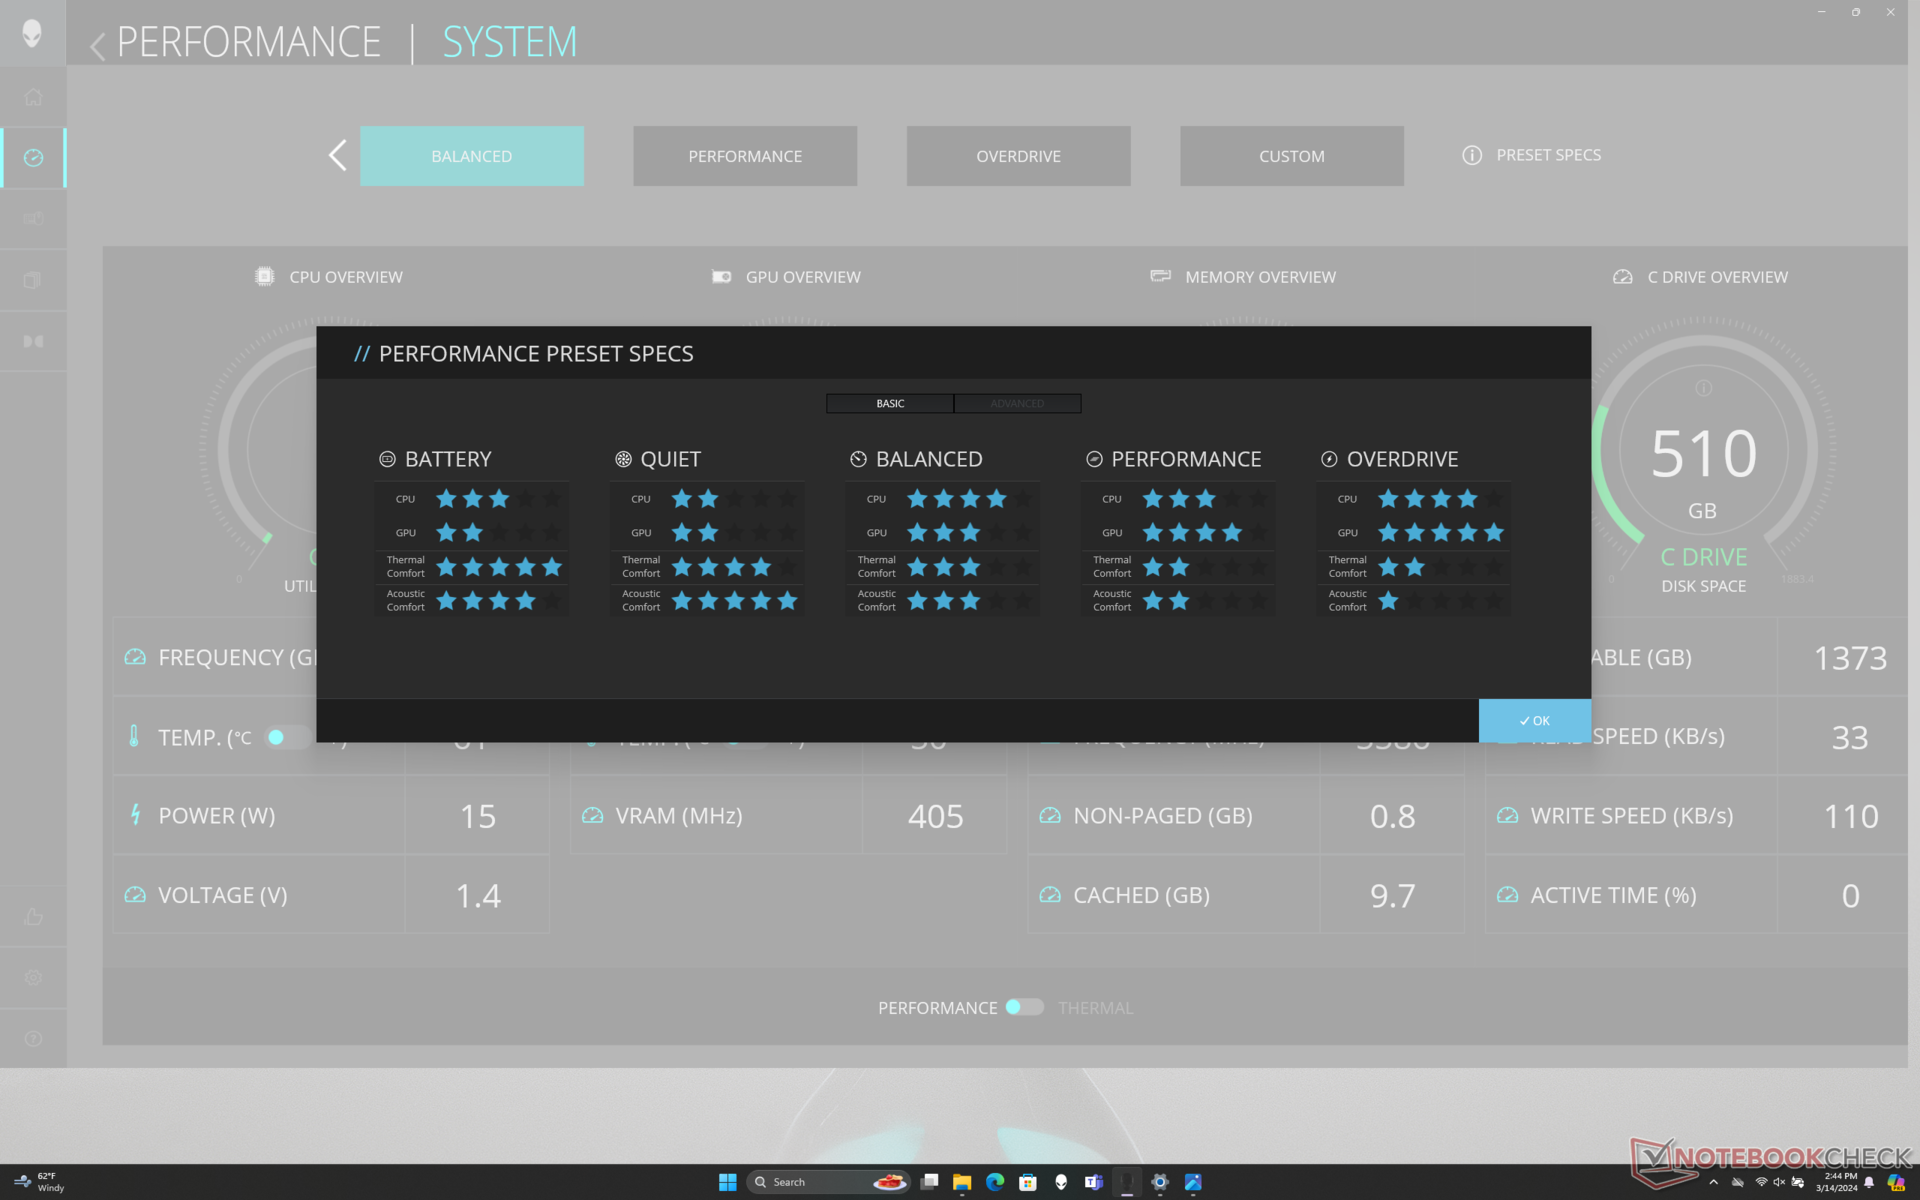
风扇噪音行为没有重大变化。最重要的一点是,与平衡模式相比,性能模式和超频模式的风扇噪音略大,尽管这三种模式的整体性能基本相同。这意味着你可以在平衡或性能模式下享受更安静的游戏体验,而无需牺牲显著的游戏性能。超频模式应保留用于超频目的。
Noise level
| Idle |
| 23.8 / 26.1 / 31.5 dB(A) |
| Load |
| 31.5 / 56.6 dB(A) |
 | ||
30 dB silent 40 dB(A) audible 50 dB(A) loud |
||
min: | ||
| Alienware m18 R2 GeForce RTX 4090 Laptop GPU, i9-14900HX, SK Hynix PC811 HFS002TEM9X152N | Alienware m18 R1 AMD Radeon RX 7900M, R9 7945HX, Kioxia XG8 KXG80ZNV1T02 | Alienware m18 R1 GeForce RTX 4090 Laptop GPU, i9-13980HX, SK hynix PC801 HFS001TEJ9X101N | MSI Titan 18 HX A14VIG GeForce RTX 4090 Laptop GPU, i9-14900HX, 2x Samsung PM9A1a MZVL22T0HDLB (RAID 0) | Asus ROG Strix G18 G814JI GeForce RTX 4070 Laptop GPU, i7-13650HX, Micron 2400 MTFDKBA1T0QFM | Acer Predator Helios 18 N23Q2 GeForce RTX 4080 Laptop GPU, i9-13900HX, Samsung PM9A1 MZVL22T0HBLB | |
|---|---|---|---|---|---|---|
| Noise | 1% | 5% | -3% | -1% | -3% | |
| off / environment * (dB) | 23.6 | 22.4 5% | 22.8 3% | 22.8 3% | 25 -6% | 23 3% |
| Idle Minimum * (dB) | 23.8 | 23 3% | 23 3% | 23.8 -0% | 26 -9% | 23 3% |
| Idle Average * (dB) | 26.1 | 23.4 10% | 23 12% | 23.8 9% | 28 -7% | 23 12% |
| Idle Maximum * (dB) | 31.5 | 33.5 -6% | 23 27% | 28 11% | 29 8% | 23 27% |
| Load Average * (dB) | 31.5 | 33.5 -6% | 35.6 -13% | 38 -21% | 41 -30% | 45.26 -44% |
| Witcher 3 ultra * (dB) | 52.1 | 53.6 -3% | 51.3 2% | 57.3 -10% | 44 16% | 59.82 -15% |
| Load Maximum * (dB) | 56.6 | 53.6 5% | 56.7 -0% | 62.8 -11% | 46 19% | 59.94 -6% |
* ... smaller is better
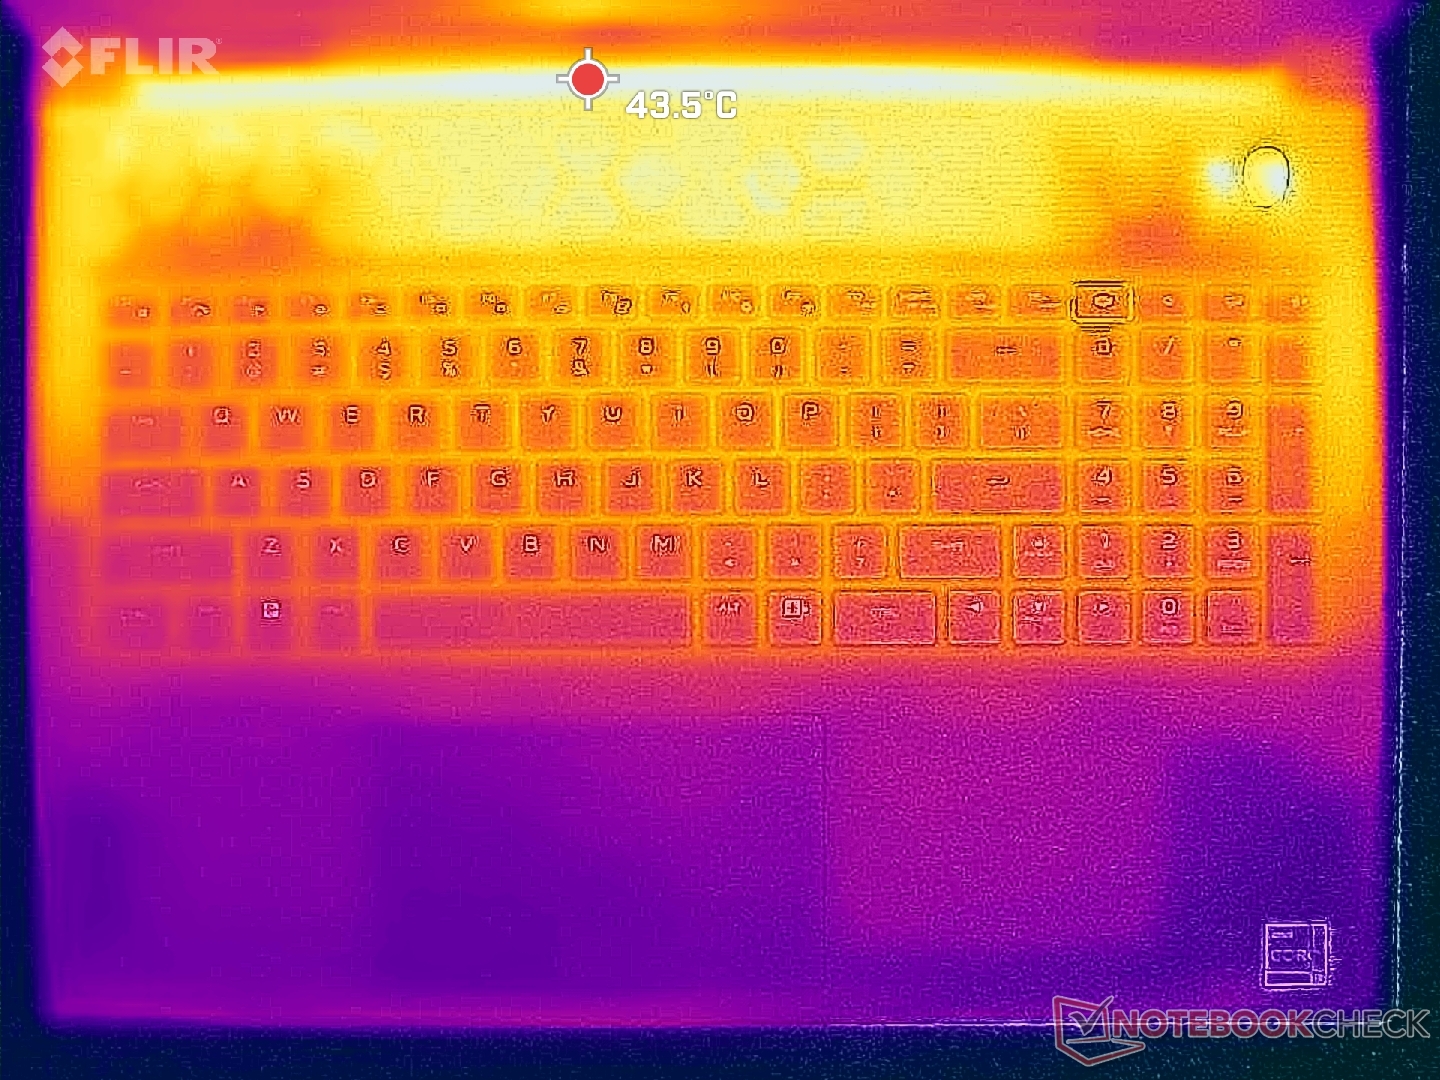
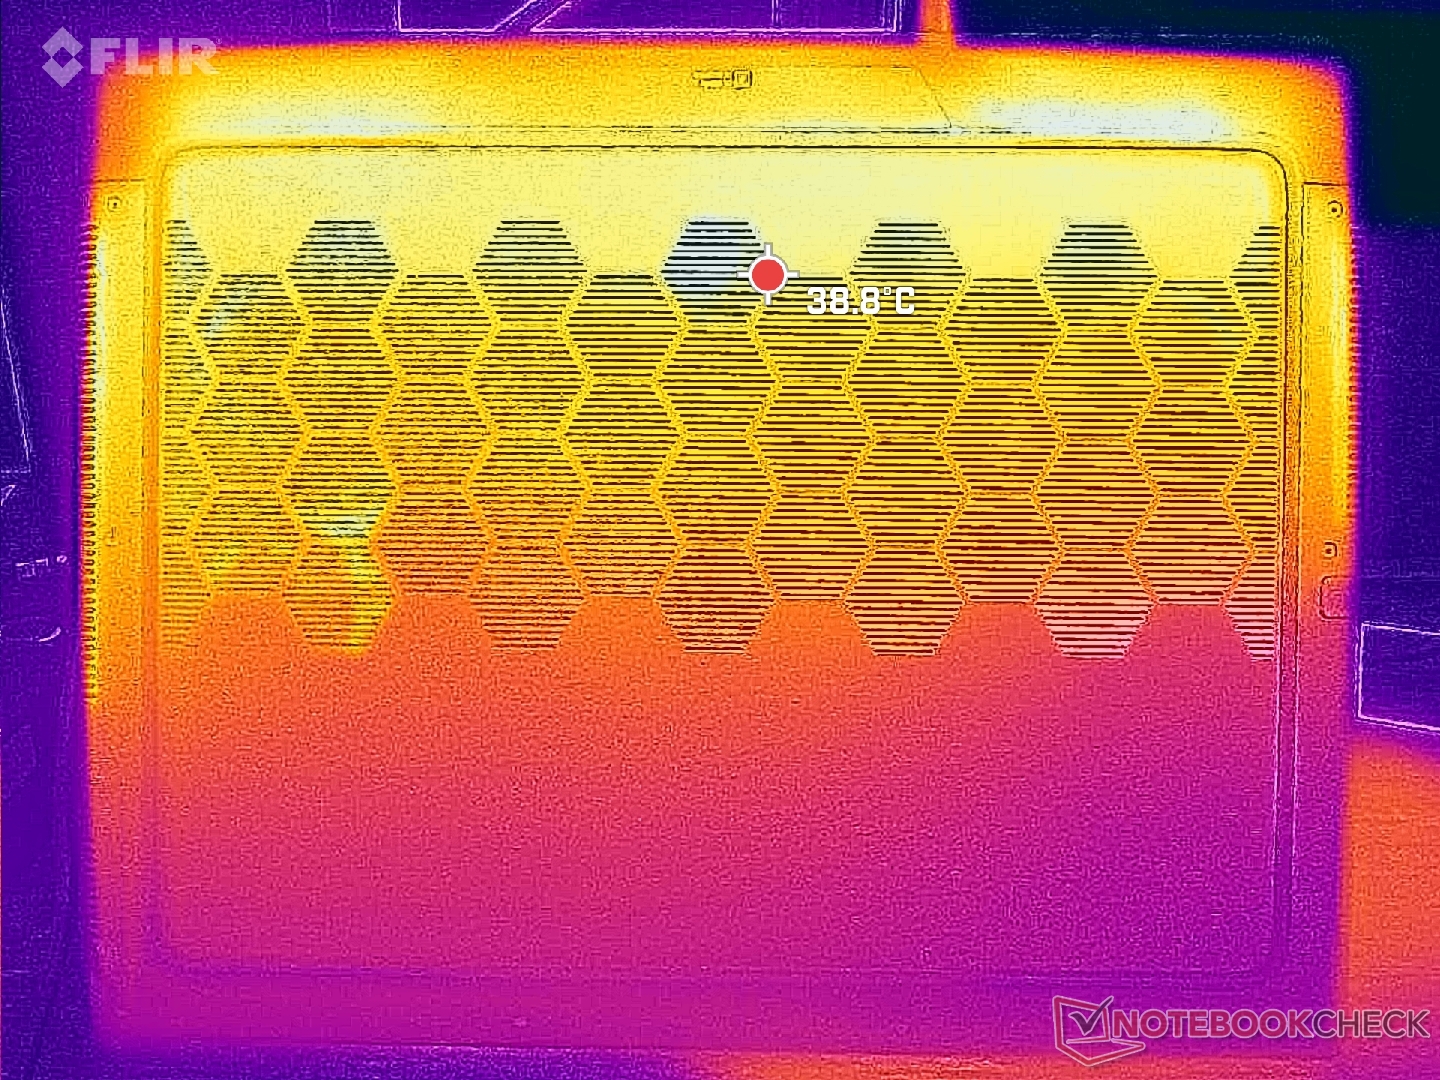
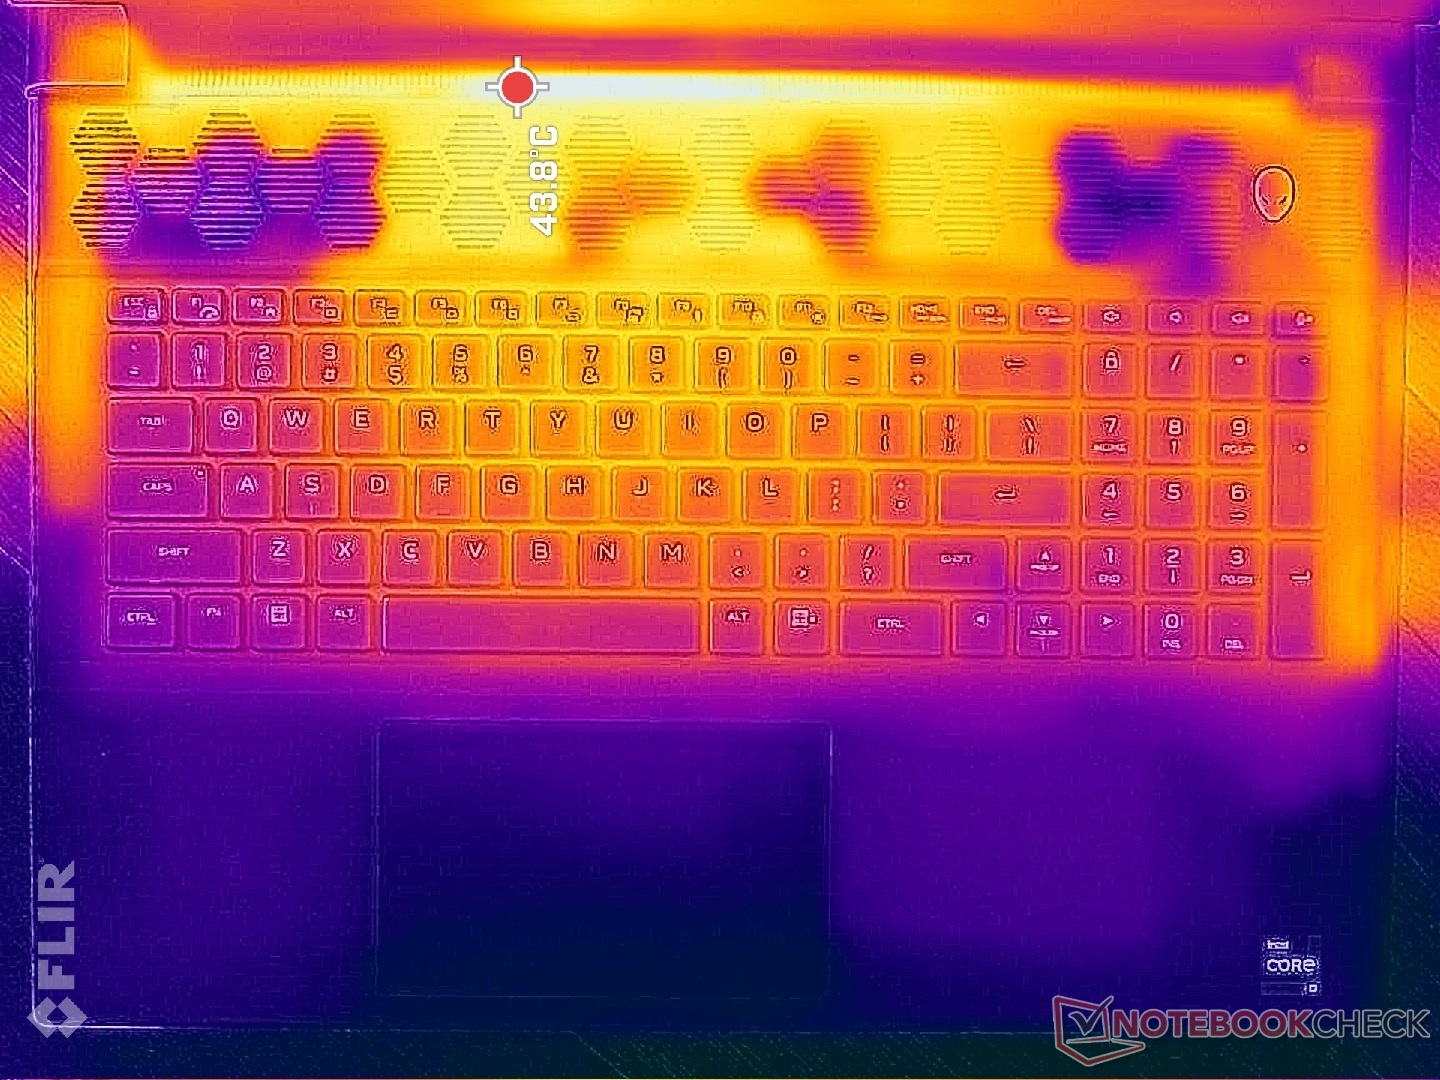
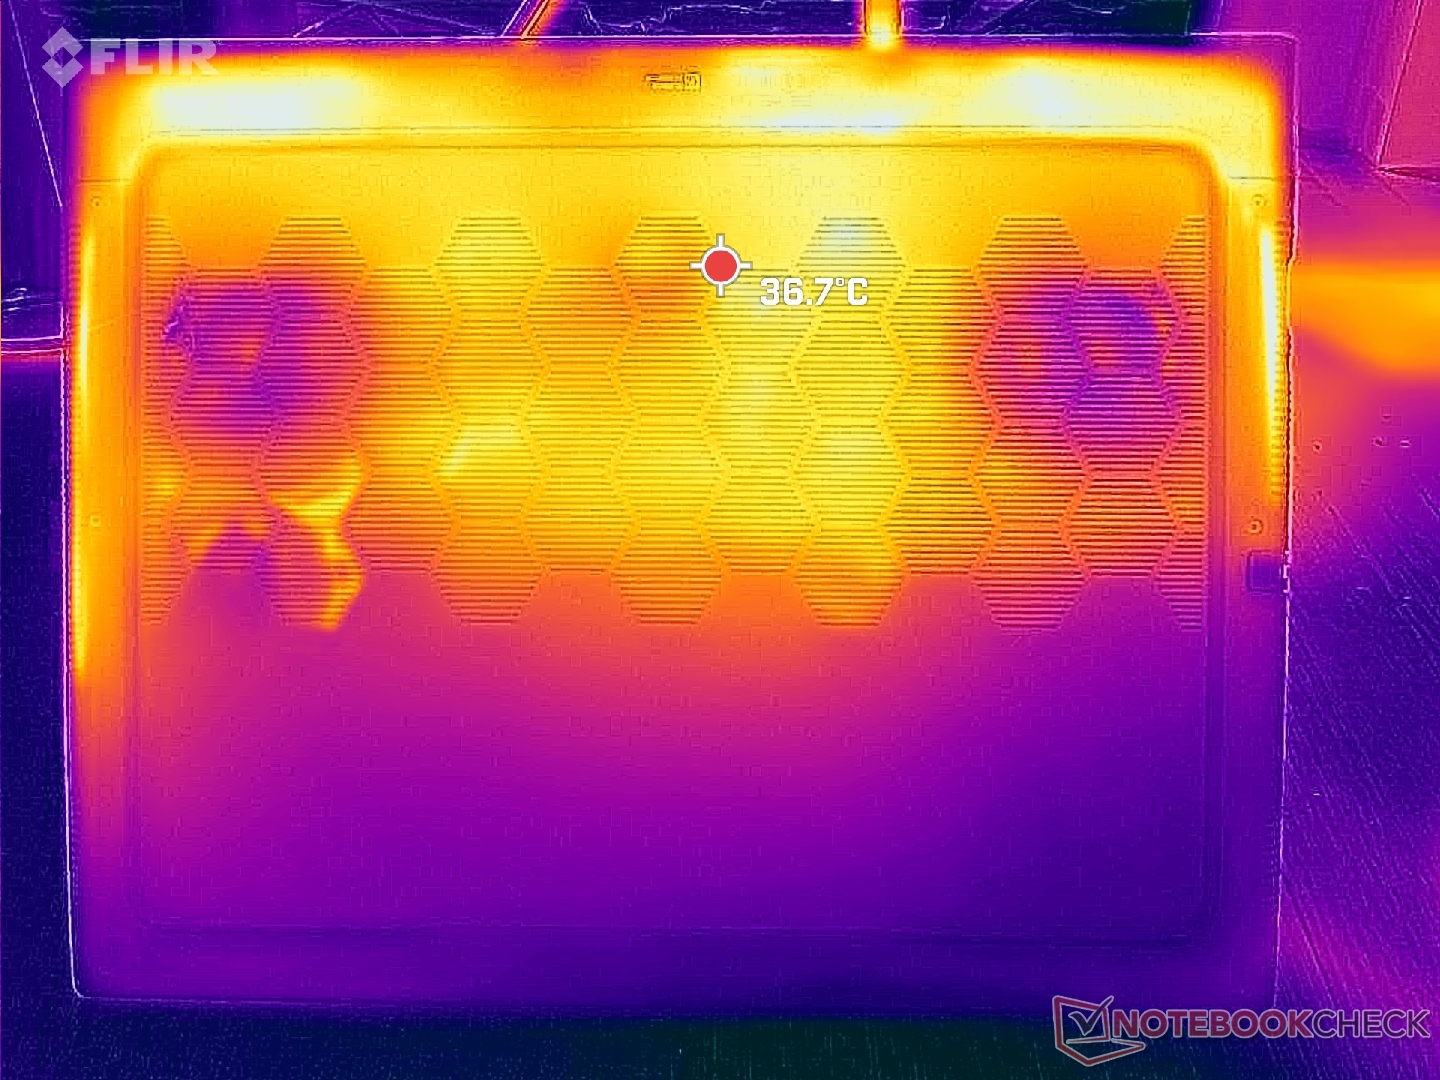
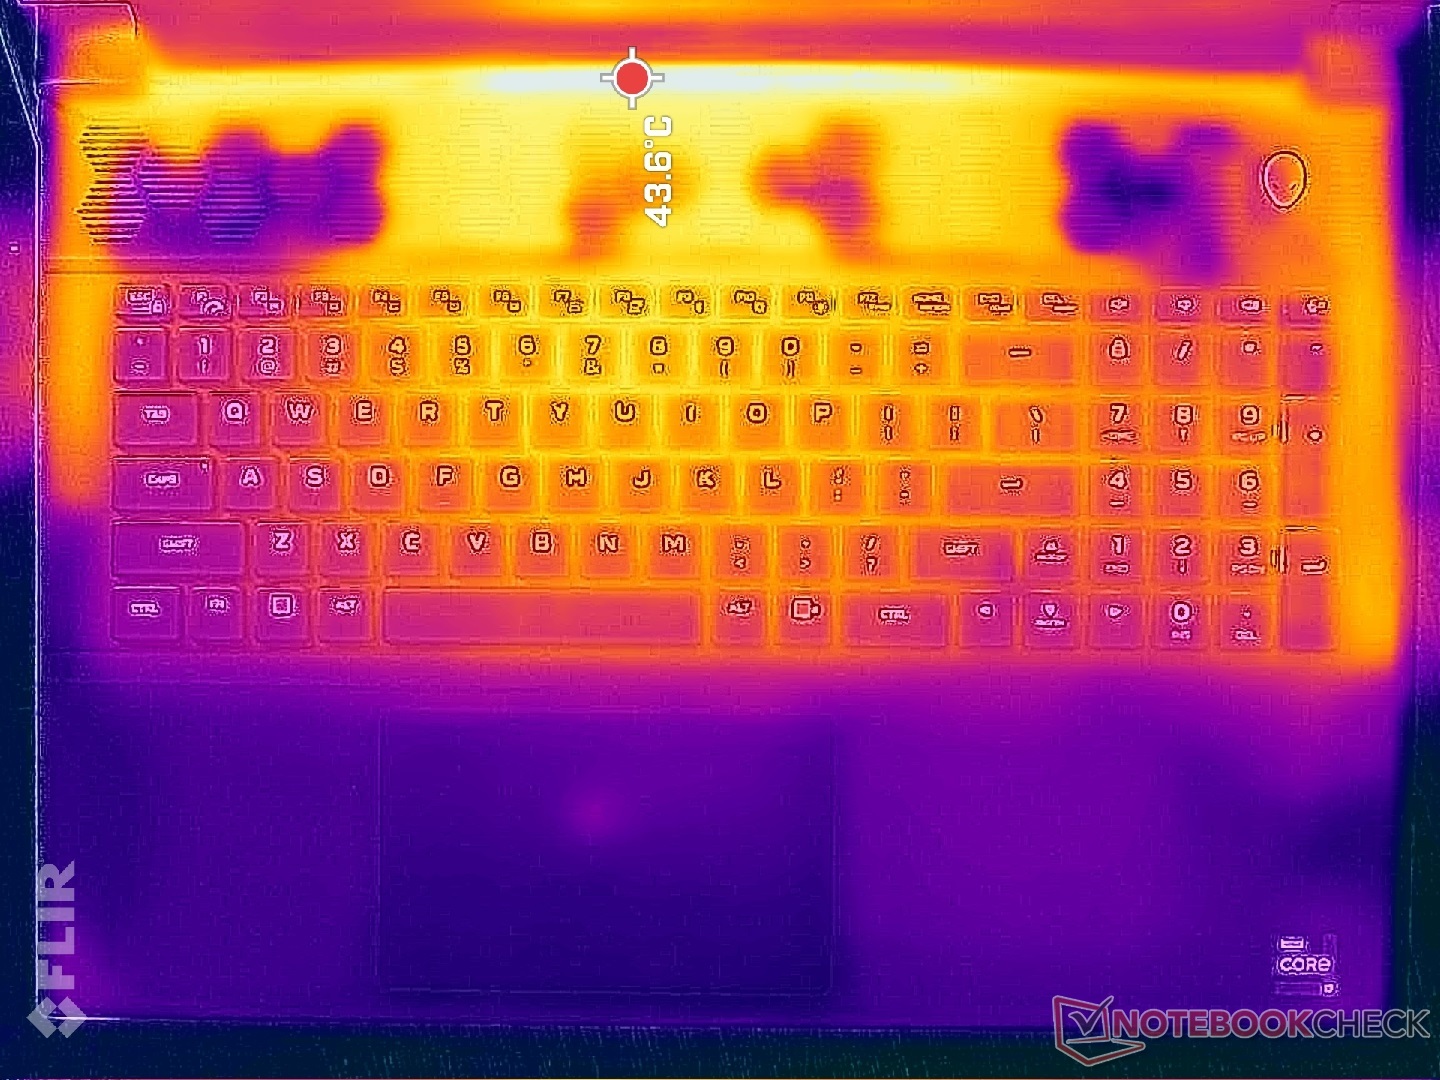
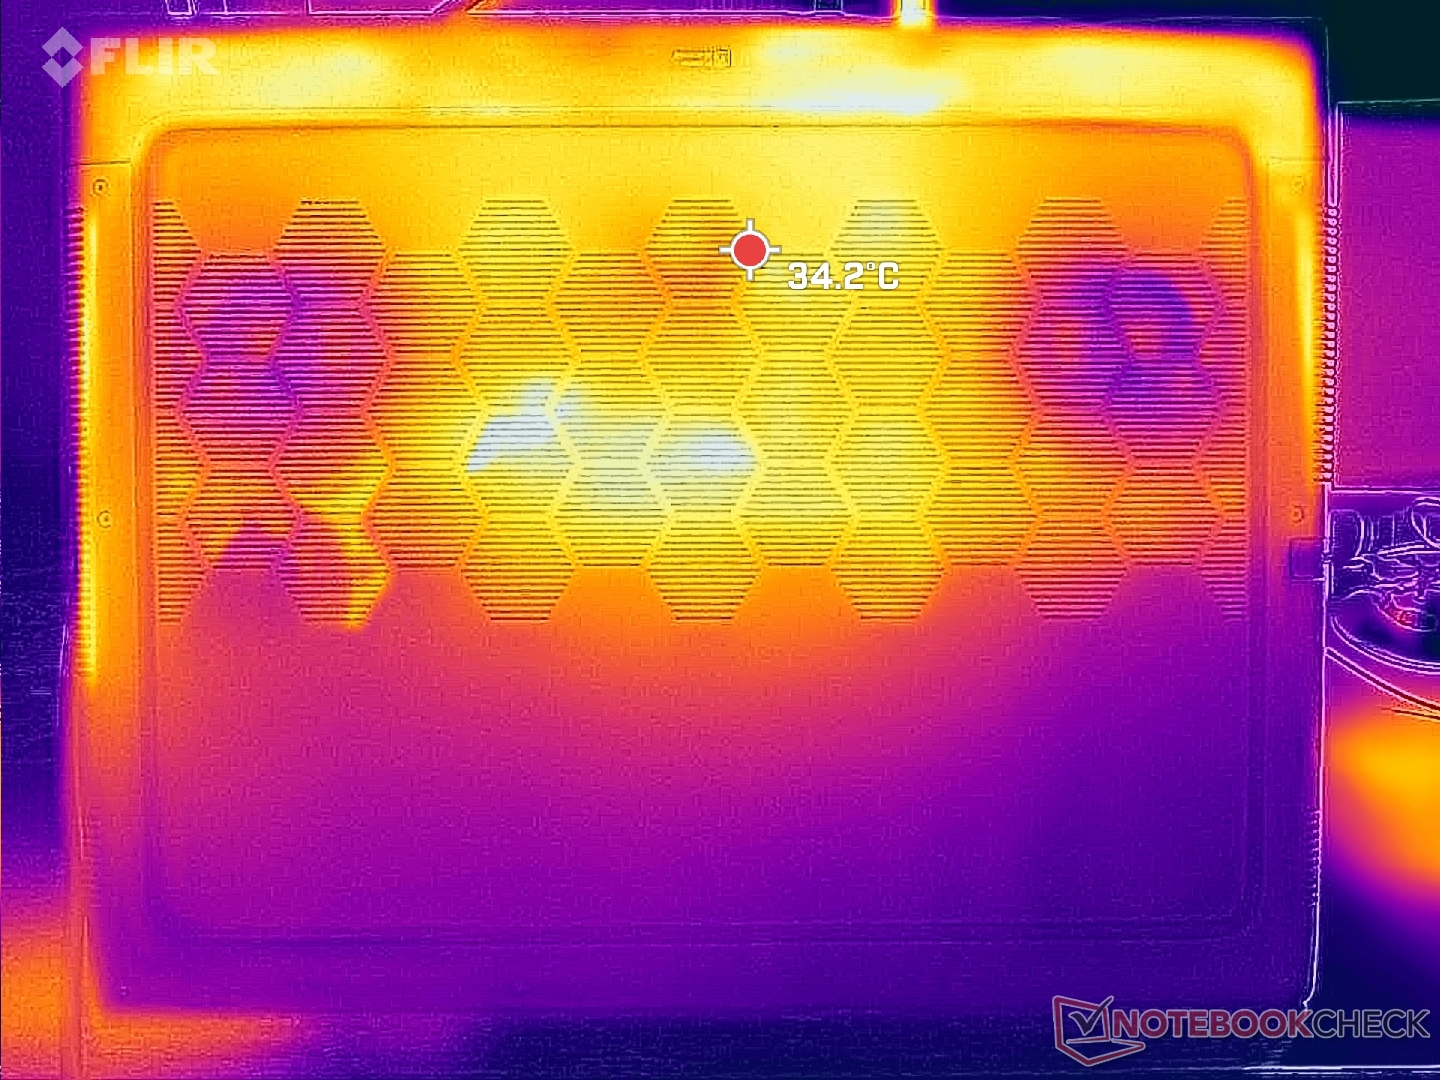
温度
平均表面温度普遍低于我们在 华硕 ROG Strix G18.发热点位于机箱后部,以减少皮肤接触。
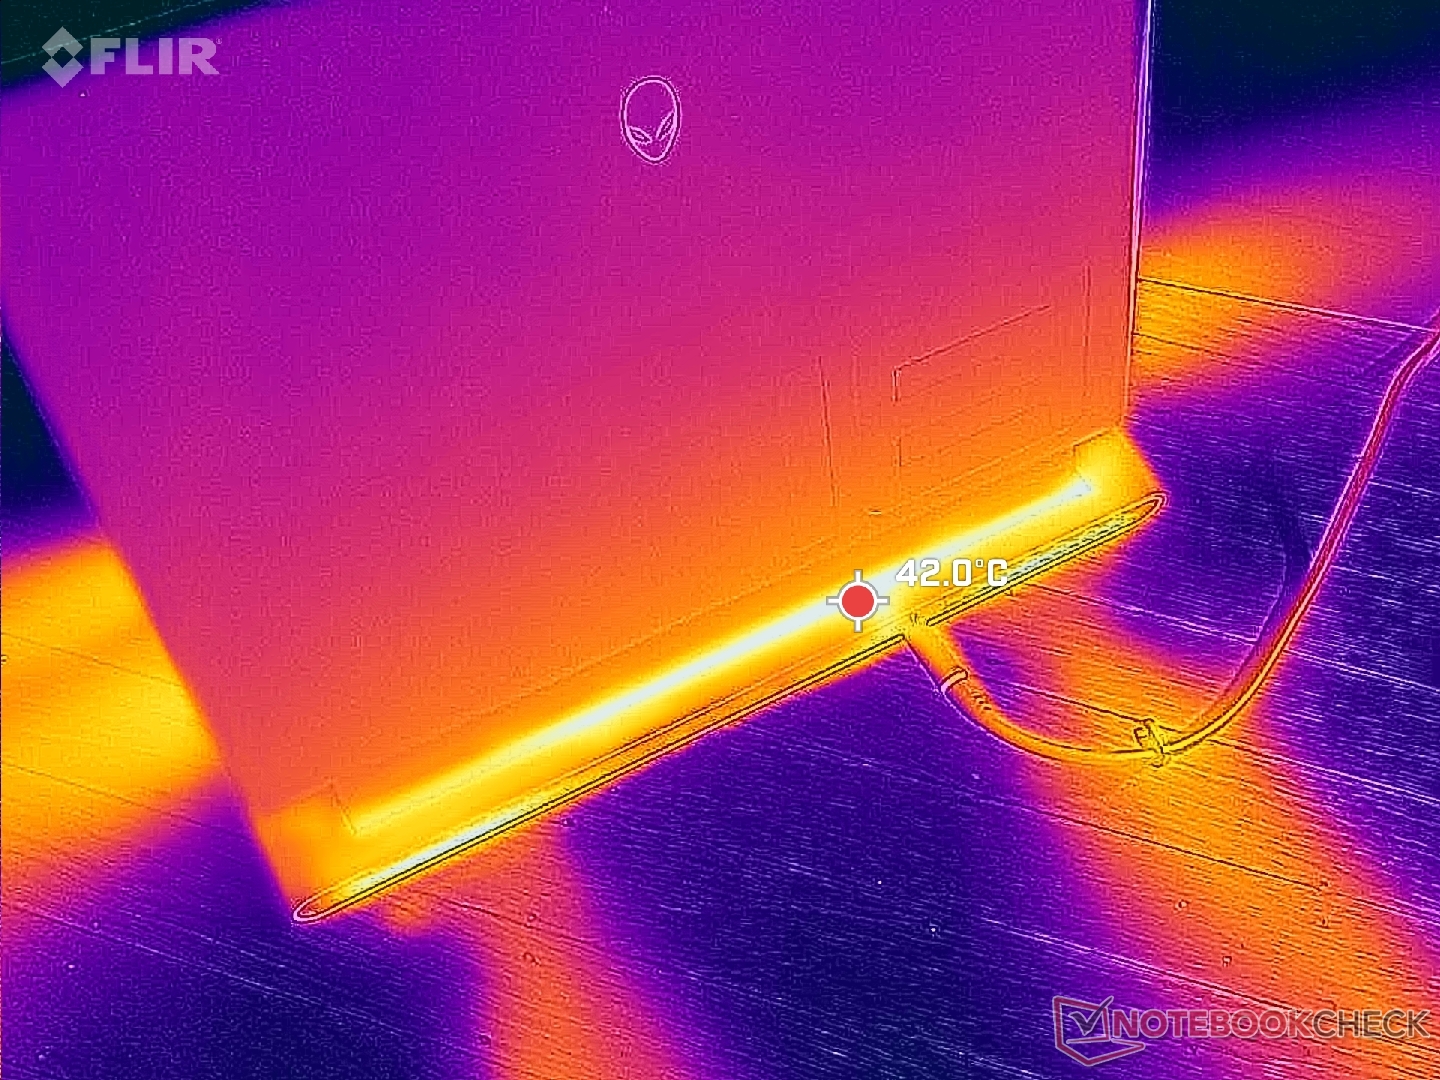
(±) The maximum temperature on the upper side is 41.2 °C / 106 F, compared to the average of 40.4 °C / 105 F, ranging from 21.2 to 68.8 °C for the class Gaming.
(+) The bottom heats up to a maximum of 34.6 °C / 94 F, compared to the average of 43.2 °C / 110 F
(±) In idle usage, the average temperature for the upper side is 34.9 °C / 95 F, compared to the device average of 33.9 °C / 93 F.
(±) Playing The Witcher 3, the average temperature for the upper side is 32 °C / 90 F, compared to the device average of 33.9 °C / 93 F.
(+) The palmrests and touchpad are cooler than skin temperature with a maximum of 28.2 °C / 82.8 F and are therefore cool to the touch.
(±) The average temperature of the palmrest area of similar devices was 28.8 °C / 83.8 F (+0.6 °C / 1 F).
| Alienware m18 R2 Intel Core i9-14900HX, NVIDIA GeForce RTX 4090 Laptop GPU | Alienware m18 R1 AMD AMD Ryzen 9 7945HX, AMD Radeon RX 7900M | Alienware m18 R1 Intel Core i9-13980HX, NVIDIA GeForce RTX 4090 Laptop GPU | MSI Titan 18 HX A14VIG Intel Core i9-14900HX, NVIDIA GeForce RTX 4090 Laptop GPU | Asus ROG Strix G18 G814JI Intel Core i7-13650HX, NVIDIA GeForce RTX 4070 Laptop GPU | Acer Predator Helios 18 N23Q2 Intel Core i9-13900HX, NVIDIA GeForce RTX 4080 Laptop GPU | |
|---|---|---|---|---|---|---|
| Heat | 13% | 17% | 9% | 5% | -4% | |
| Maximum Upper Side * (°C) | 41.2 | 40.2 2% | 39 5% | 37.8 8% | 45 -9% | 35 15% |
| Maximum Bottom * (°C) | 34.6 | 37.4 -8% | 36.4 -5% | 37.6 -9% | 47 -36% | 56 -62% |
| Idle Upper Side * (°C) | 42.8 | 31.6 26% | 29.2 32% | 34.8 19% | 28 35% | 34 21% |
| Idle Bottom * (°C) | 43.6 | 30.6 30% | 27.8 36% | 36 17% | 31 29% | 39 11% |
* ... smaller is better
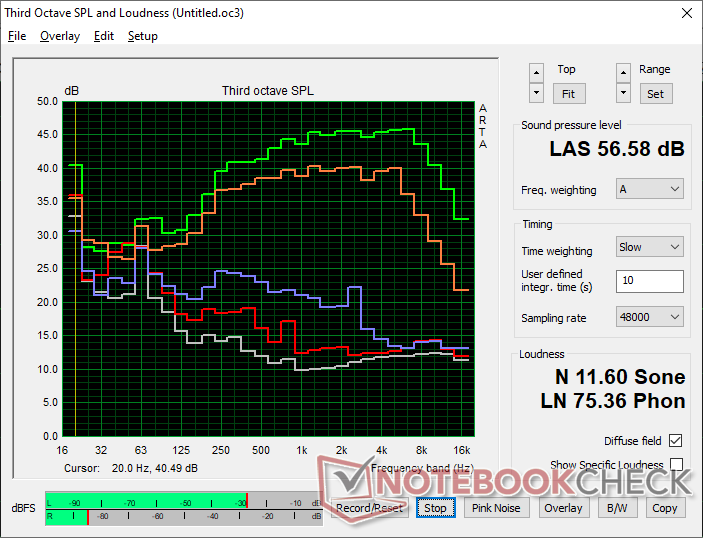
发言人
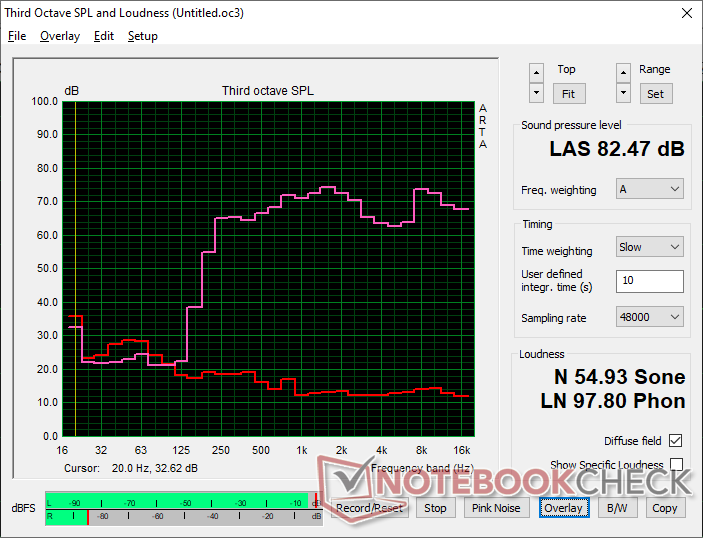
Alienware m18 R2 audio analysis
(+) | speakers can play relatively loud (82.5 dB)
Bass 100 - 315 Hz
(-) | nearly no bass - on average 22.1% lower than median
(±) | linearity of bass is average (14% delta to prev. frequency)
Mids 400 - 2000 Hz
(+) | balanced mids - only 4.1% away from median
(+) | mids are linear (3.3% delta to prev. frequency)
Highs 2 - 16 kHz
(+) | balanced highs - only 4% away from median
(+) | highs are linear (6.1% delta to prev. frequency)
Overall 100 - 16.000 Hz
(±) | linearity of overall sound is average (17% difference to median)
Compared to same class
» 45% of all tested devices in this class were better, 12% similar, 43% worse
» The best had a delta of 6%, average was 18%, worst was 132%
Compared to all devices tested
» 31% of all tested devices were better, 8% similar, 62% worse
» The best had a delta of 4%, average was 23%, worst was 134%
Apple MacBook Pro 16 2021 M1 Pro audio analysis
(+) | speakers can play relatively loud (84.7 dB)
Bass 100 - 315 Hz
(+) | good bass - only 3.8% away from median
(+) | bass is linear (5.2% delta to prev. frequency)
Mids 400 - 2000 Hz
(+) | balanced mids - only 1.3% away from median
(+) | mids are linear (2.1% delta to prev. frequency)
Highs 2 - 16 kHz
(+) | balanced highs - only 1.9% away from median
(+) | highs are linear (2.7% delta to prev. frequency)
Overall 100 - 16.000 Hz
(+) | overall sound is linear (4.6% difference to median)
Compared to same class
» 0% of all tested devices in this class were better, 0% similar, 100% worse
» The best had a delta of 5%, average was 17%, worst was 45%
Compared to all devices tested
» 0% of all tested devices were better, 0% similar, 100% worse
» The best had a delta of 4%, average was 23%, worst was 134%
能源管理
耗电量
运行 Witcher 3代表典型游戏负载的平均耗电量为 328 瓦,略高于我们在去年的 m18 R1 Intel 版本上记录的耗电量。因此,由于底层硬件没有变化,每瓦特性能没有重大提升。
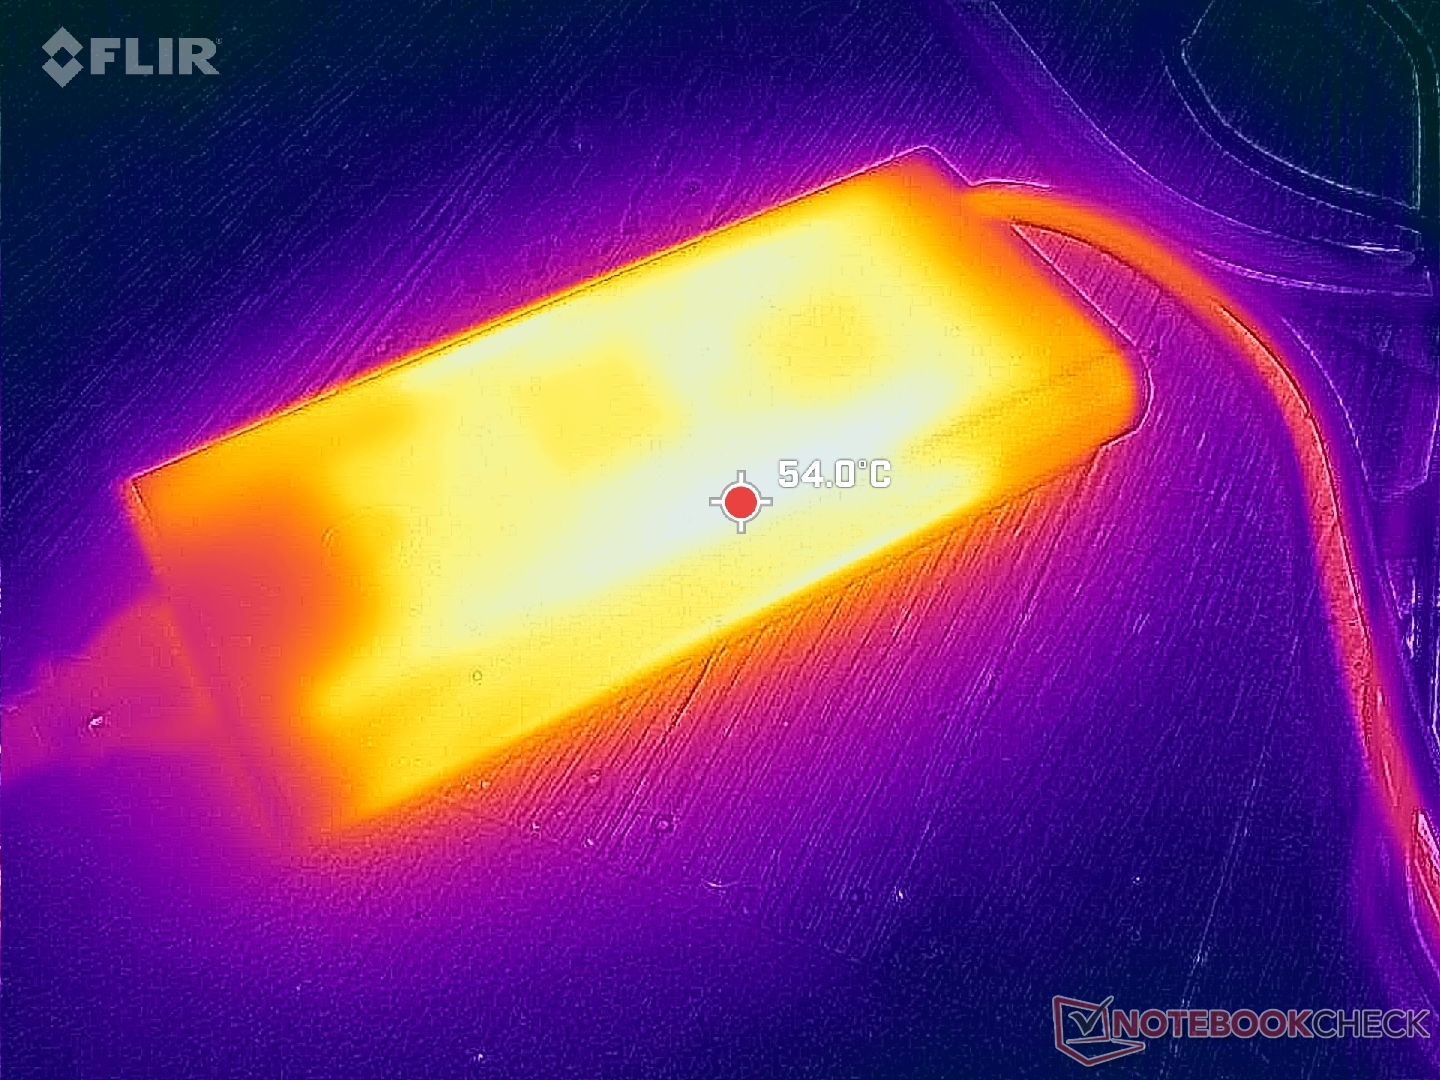
今年新增了容量更大的 360 瓦交流适配器,而 m18 R1 配备的是 330 瓦的适配器。由于改用了氮化镓技术,新的适配器也更小(约 18.9 x 8.6 x 2.6 厘米对 19.5 x 9.8 x 4 厘米)。更大容量的适配器降低了节流的几率,同时在同时运行高负载时可以更快地充电。
(编者注:当我们的 Metrahit Energy 万用表维修完成后,本部分将进行更新。不便之处,敬请谅解。)
| Off / Standby | |
| Idle | |
| Load |
|
Key:
min: | |
| Alienware m18 R2 i9-14900HX, GeForce RTX 4090 Laptop GPU, SK Hynix PC811 HFS002TEM9X152N, IPS, 2560x1600, 18" | Alienware m18 R1 AMD R9 7945HX, Radeon RX 7900M, Kioxia XG8 KXG80ZNV1T02, IPS, 1920x1200, 18" | Alienware m18 R1 i9-13980HX, GeForce RTX 4090 Laptop GPU, SK hynix PC801 HFS001TEJ9X101N, IPS, 1920x1200, 18" | MSI Titan 18 HX A14VIG i9-14900HX, GeForce RTX 4090 Laptop GPU, 2x Samsung PM9A1a MZVL22T0HDLB (RAID 0), Mini-LED, 3840x2400, 18" | Asus ROG Strix G18 G814JI i7-13650HX, GeForce RTX 4070 Laptop GPU, Micron 2400 MTFDKBA1T0QFM, IPS, 2560x1600, 18" | Acer Predator Helios 18 N23Q2 i9-13900HX, GeForce RTX 4080 Laptop GPU, Samsung PM9A1 MZVL22T0HBLB, IPS, 2560x1600, 18" | |
|---|---|---|---|---|---|---|
| Power Consumption | -72% | -21% | -9% | 36% | 13% | |
| Idle Minimum * (Watt) | 10.6 | 30.3 -186% | 21.6 -104% | 13.2 -25% | 8 25% | 16 -51% |
| Idle Average * (Watt) | 20.9 | 55.6 -166% | 25.2 -21% | 25.4 -22% | 15 28% | 19 9% |
| Idle Maximum * (Watt) | 40 | 101.1 -153% | 56.7 -42% | 53.5 -34% | 26 35% | 21.3 47% |
| Load Average * (Watt) | 201.1 | 160.3 20% | 164.1 18% | 151.4 25% | 102 49% | 124 38% |
| Witcher 3 ultra * (Watt) | 358 | 216 40% | 311 13% | 336 6% | 178.6 50% | 289 19% |
| Load Maximum * (Watt) | 378.9 | 332.1 12% | 338.9 11% | 395.2 -4% | 267 30% | 319 16% |
* ... smaller is better
Power Consumption Witcher 3 / Stresstest
Power Consumption external Monitor
电池寿命
运行时间与之前大致相同,甚至略微延长了约半小时。这与我们的 m18 R1 AMD 配置形成了鲜明对比,后者在测试过程中出现了电池耗尽的问题。
仍无法通过 USB-C 接口充电。
| Alienware m18 R2 i9-14900HX, GeForce RTX 4090 Laptop GPU, 97 Wh | Alienware m18 R1 AMD R9 7945HX, Radeon RX 7900M, 97 Wh | Alienware m18 R1 i9-13980HX, GeForce RTX 4090 Laptop GPU, 97 Wh | MSI Titan 18 HX A14VIG i9-14900HX, GeForce RTX 4090 Laptop GPU, 99.9 Wh | Asus ROG Strix G18 G814JI i7-13650HX, GeForce RTX 4070 Laptop GPU, 90 Wh | Acer Predator Helios 18 N23Q2 i9-13900HX, GeForce RTX 4080 Laptop GPU, 90 Wh | |
|---|---|---|---|---|---|---|
| Battery runtime | -71% | -10% | -12% | 69% | -8% | |
| WiFi v1.3 (h) | 4.8 | 1.4 -71% | 4.3 -10% | 4.2 -12% | 8.1 69% | 4.4 -8% |
| Reader / Idle (h) | 4.5 | 5.6 | 5.9 | 11.7 | ||
| Load (h) | 0.7 | 0.7 | 1.2 | 1.2 | 1.7 | |
| H.264 (h) | 4.8 |
Pros
Cons
结论 - 更像 Alienware m18 R1.1
游戏笔记本电脑今年处境艰难。Raptor Lake-HX 更新版 CPU 的性能几乎与 2023 年的同类产品完全相同,而没有任何新产品可以取代已使用一年之久的 RTX 4090。因此,像 Alienware m18 R2 这样的新游戏笔记本电脑或多或少都只能使用与去年机型相同的部件。因此,在市场上购买 Alienware m18 R2 的用户应该期望其性能水平与 m18 R1.
与 Alienware m18 R1 相比,Alienware m18 R2 的性能有所下降。它仍然是目前速度最快的游戏笔记本电脑之一,但充其量只能算是微不足道的改进。
虽然有一些小的改进,如更快的 RJ-45 端口、更小的交流适配器和更新的固态硬盘选项,但用户体验基本相同。我们建议在考虑 m18 R2 之前先考虑 m18 R1,尤其是现在 m18 R1 的价格更低。
价格和供应情况
戴尔现在已经开始发售Alienware m18 R2,基础版酷睿i7-14650HX、GeForce RTX 4060和1600p165显示屏配置起价1900美元,配置酷睿i9-14900HX、RTX 4090和1200p480显示屏起价超过3200美元。
Alienware m18 R2
- 03/22/2024 v7 (old)
Allen Ngo
Transparency
The selection of devices to be reviewed is made by our editorial team. The test sample was provided to the author as a loan by the manufacturer or retailer for the purpose of this review. The lender had no influence on this review, nor did the manufacturer receive a copy of this review before publication. There was no obligation to publish this review. As an independent media company, Notebookcheck is not subjected to the authority of manufacturers, retailers or publishers.
This is how Notebookcheck is testing
Every year, Notebookcheck independently reviews hundreds of laptops and smartphones using standardized procedures to ensure that all results are comparable. We have continuously developed our test methods for around 20 years and set industry standards in the process. In our test labs, high-quality measuring equipment is utilized by experienced technicians and editors. These tests involve a multi-stage validation process. Our complex rating system is based on hundreds of well-founded measurements and benchmarks, which maintains objectivity. Further information on our test methods can be found here.
Price comparison

