华硕ROG Zephyrus G14评测--配备AMD Zen4 Phoenix和RTX 4090的紧凑型游戏笔记本电脑
华硕ROG Zephyrus G14是一款非常强大的14英寸笔记本电脑,适合游戏玩家以及内容创作者。去年,我们测试了它与AMDRyzen 9 6900HS和Radeon RX 6800S,今年,新的G14是第一款配备新的AMD Zen4 Phoenix处理器的设备,即Ryzen 9 7940HS.这一次,新的Ryzen 9与Nvidia最新的笔记本电脑GPU相结合。
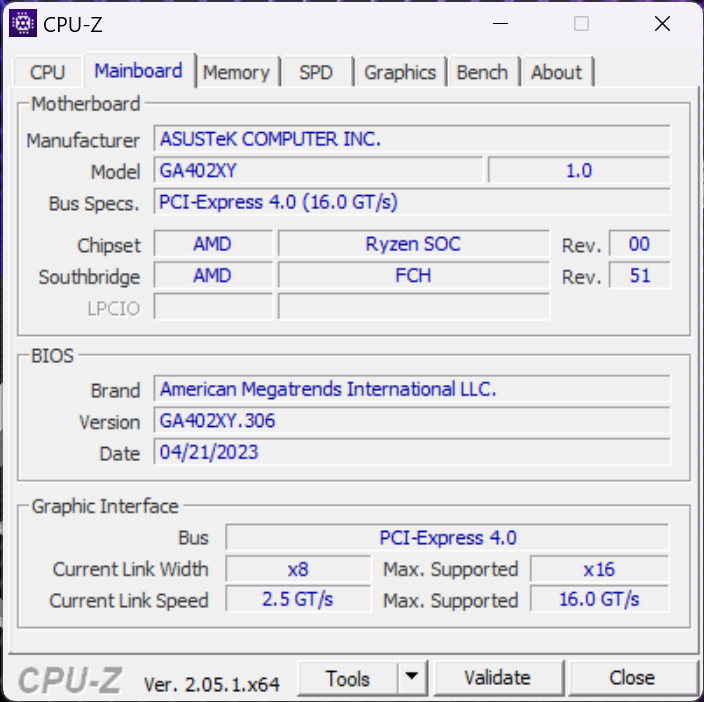
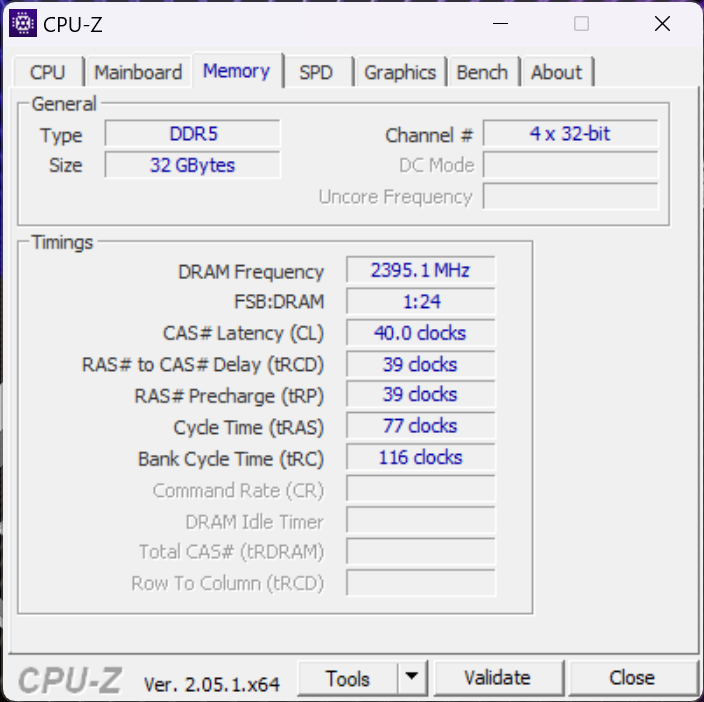
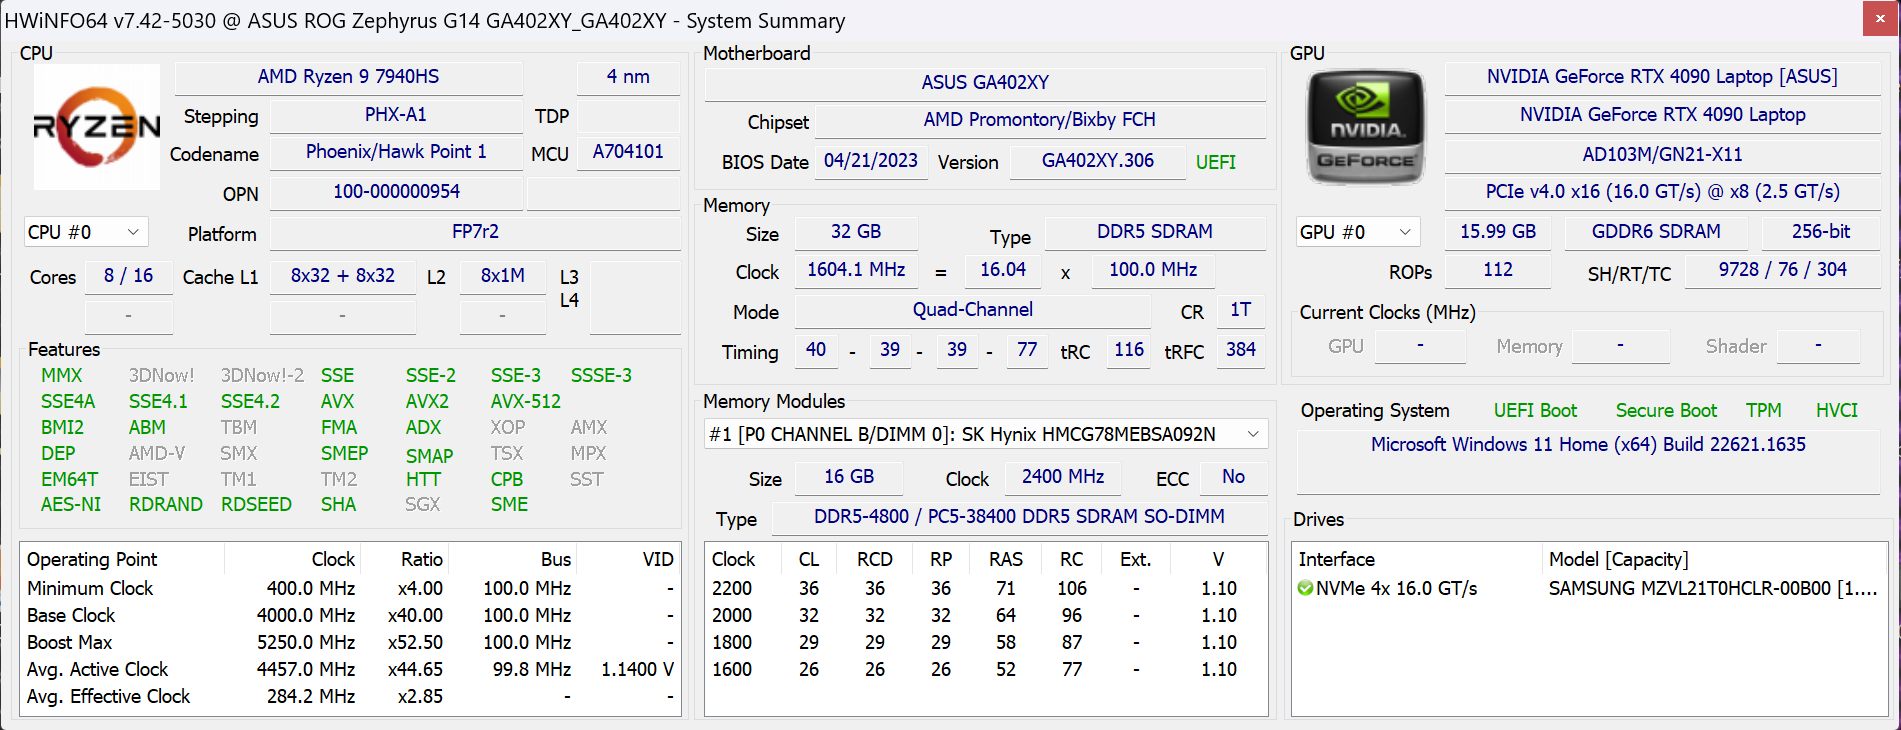
我们的审查单位与ROG Zephyrus G14 GA402XY是高端模型与前面提到的AMD Ryzen 9 7940HS, 32 GB内存, 一个1 TB PCIe-4.0 SSD, NvidiaGeForce RTX 4090 笔记本电脑,以及具有QHD+分辨率和165赫兹刷新率的哑光迷你LED面板。这个包显然不便宜,建议零售价为3999欧元。我们在性能部分概述了其他(不那么昂贵)的型号。我们显然想知道新的AMD处理器的性能如何,以及紧凑的14英寸机箱如何处理RTX 4090笔记本电脑。
我们还将很快发表关于新的AMD Ryzen 9 7940HS以及集成GPU Radeon 780M的全面分析文章。
潜在的竞争对手比较
Rating | Date | Model | Weight | Height | Size | Resolution | Price |
|---|---|---|---|---|---|---|---|
| 90 % v7 (old) | 05 / 2023 | Asus ROG Zephyrus G14 GA402XY R9 7940HS, GeForce RTX 4090 Laptop GPU | 1.7 kg | 20.5 mm | 14.00" | 2560x1600 | |
| 89.4 % v7 (old) | 05 / 2022 | Razer Blade 14 Ryzen 9 6900HX R9 6900HX, GeForce RTX 3070 Ti Laptop GPU | 1.8 kg | 16.8 mm | 14.00" | 2560x1440 | |
| 86.7 % v7 (old) | 03 / 2022 | Asus ROG Zephyrus G14 GA402RK R9 6900HS, Radeon RX 6800S | 1.7 kg | 19.5 mm | 14.00" | 2560x1600 | |
| 86.7 % v7 (old) | 03 / 2022 | Alienware x14 i7 RTX 3060 i7-12700H, GeForce RTX 3060 Laptop GPU | 1.8 kg | 14.5 mm | 14.00" | 1920x1080 | |
| 86 % v7 (old) | 11 / 2022 | Acer Predator Triton 300 SE i9-12900H, GeForce RTX 3060 Laptop GPU | 1.7 kg | 19.8 mm | 14.00" | 2880x1800 | |
| 93.9 % v7 (old) | 03 / 2023 | Apple MacBook Pro 14 2023 M2 Pro M2 Pro, M2 Pro 19-Core GPU | 1.6 kg | 15.5 mm | 14.20" | 3024x1964 |
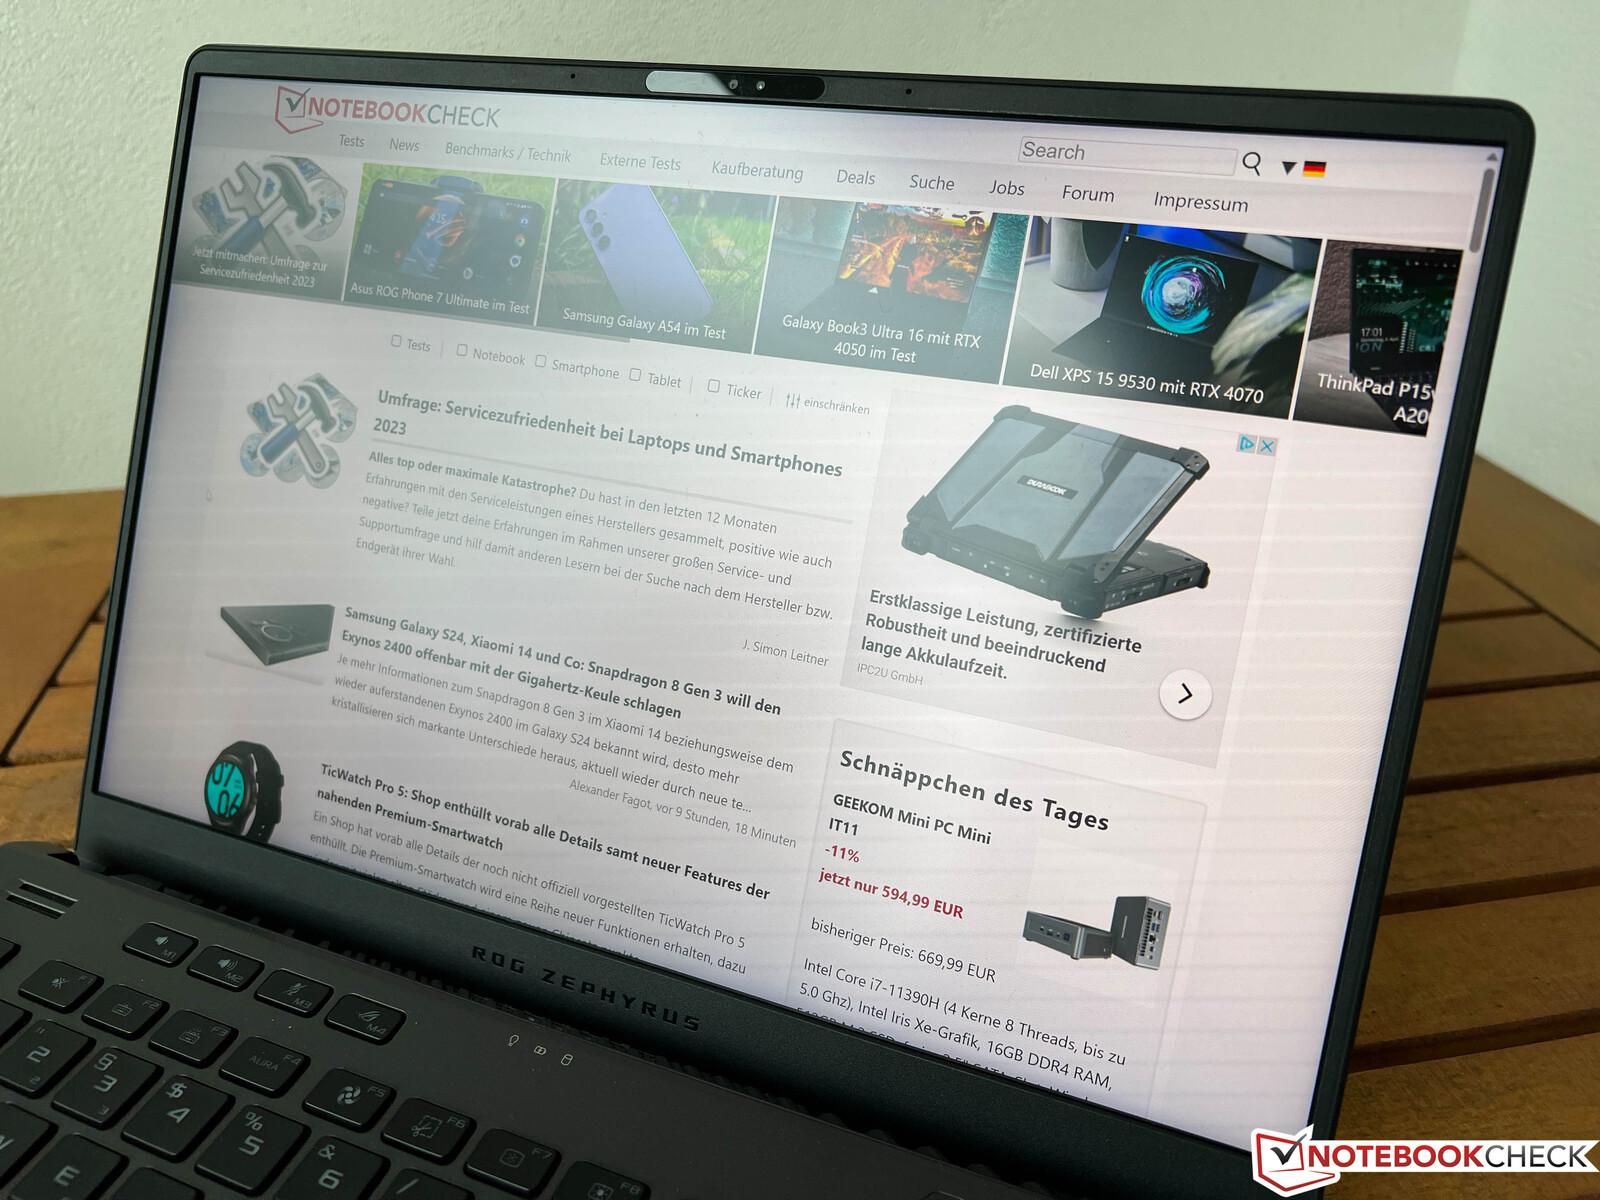
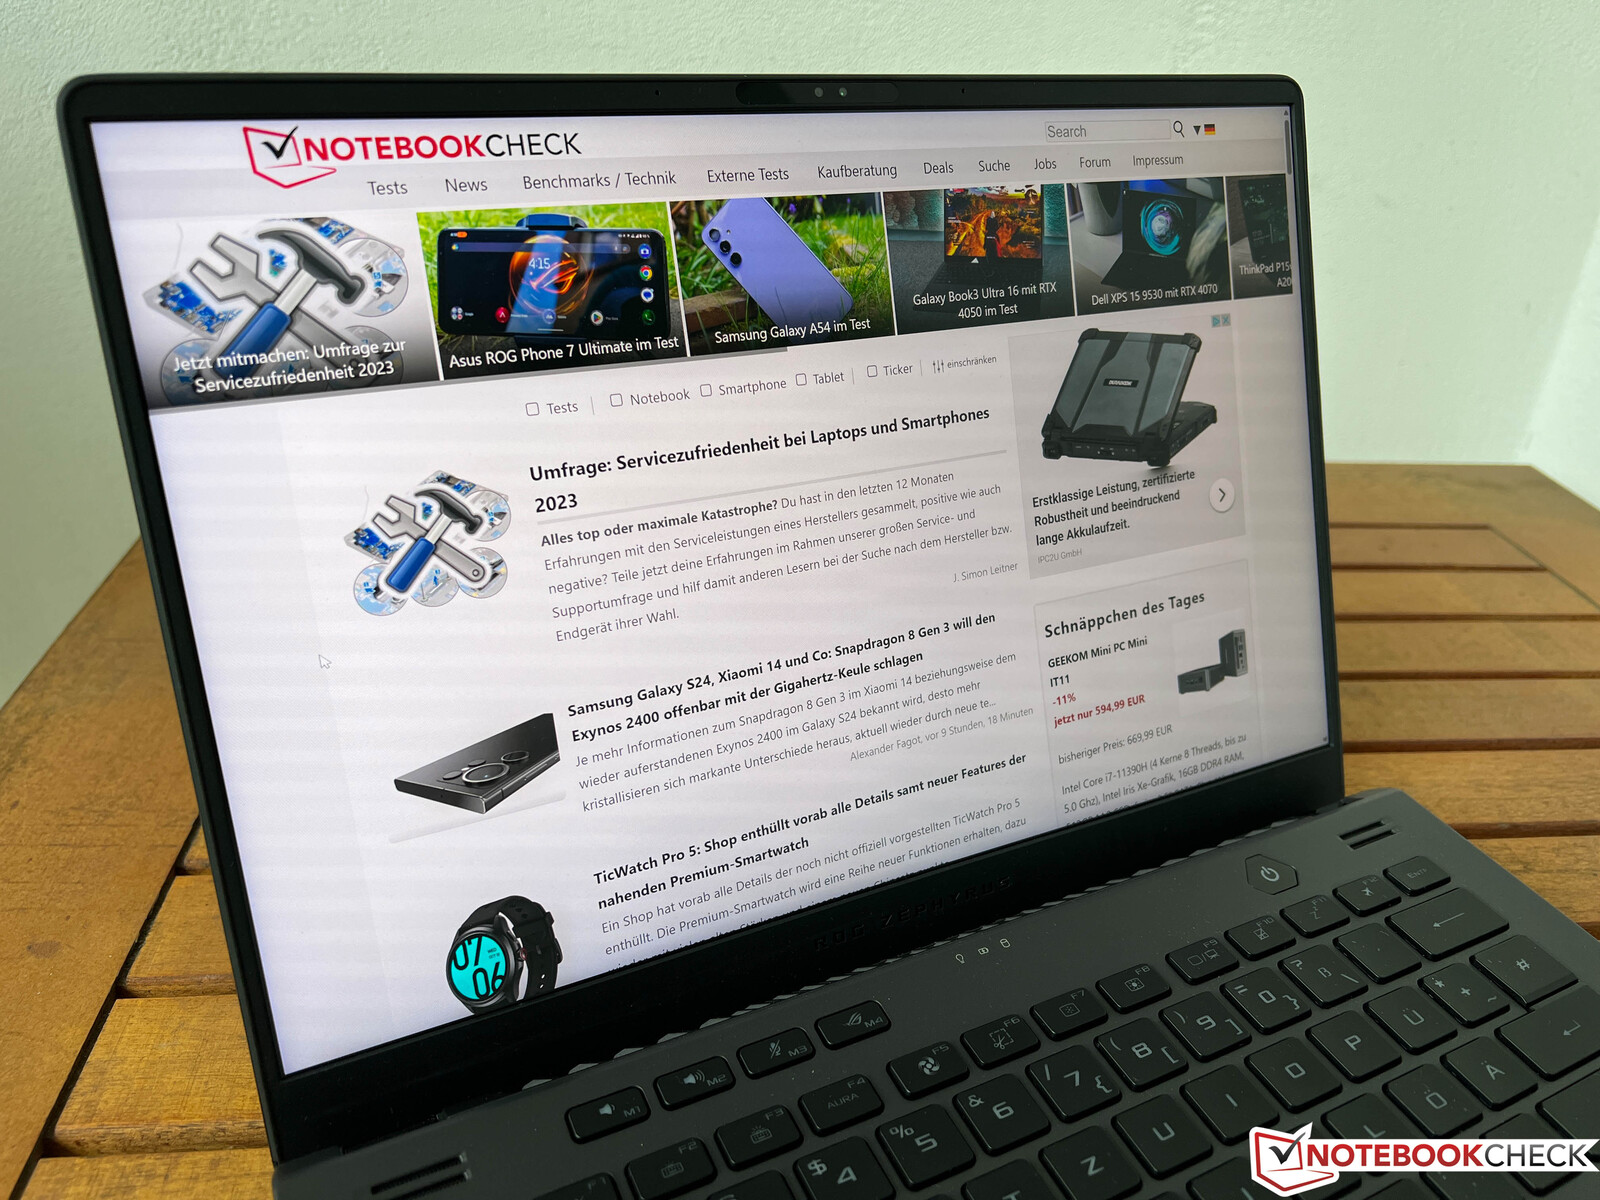
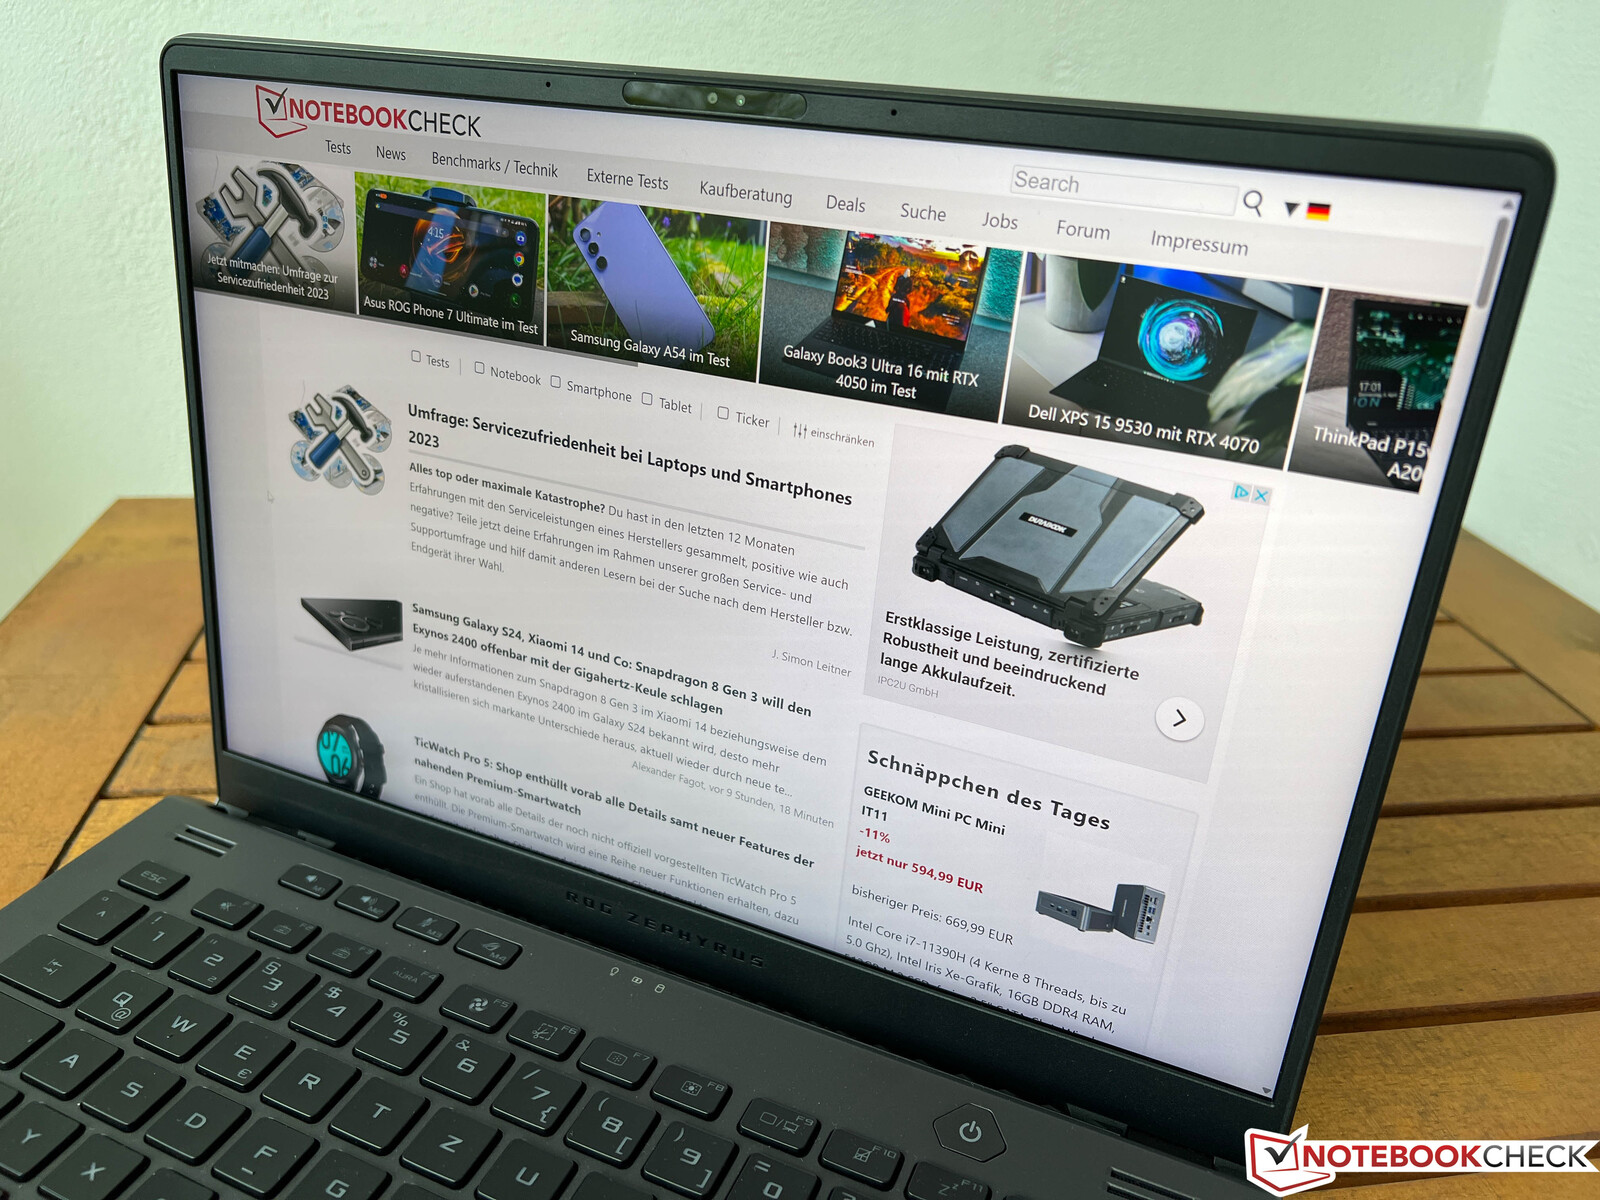
外壳 - G14,设计不显眼
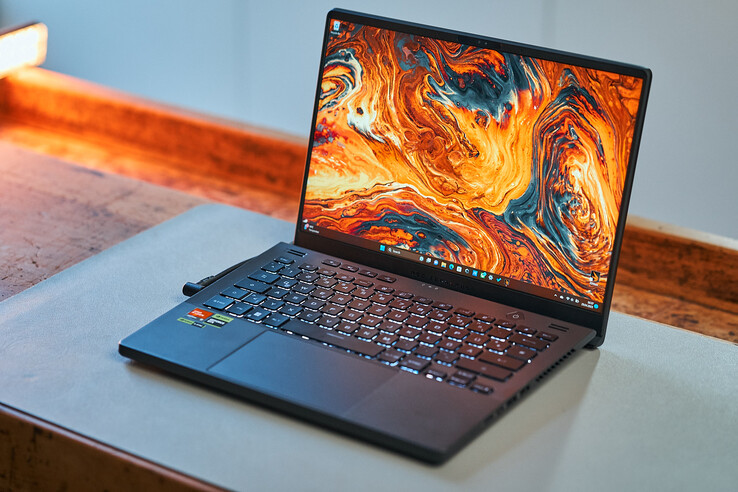
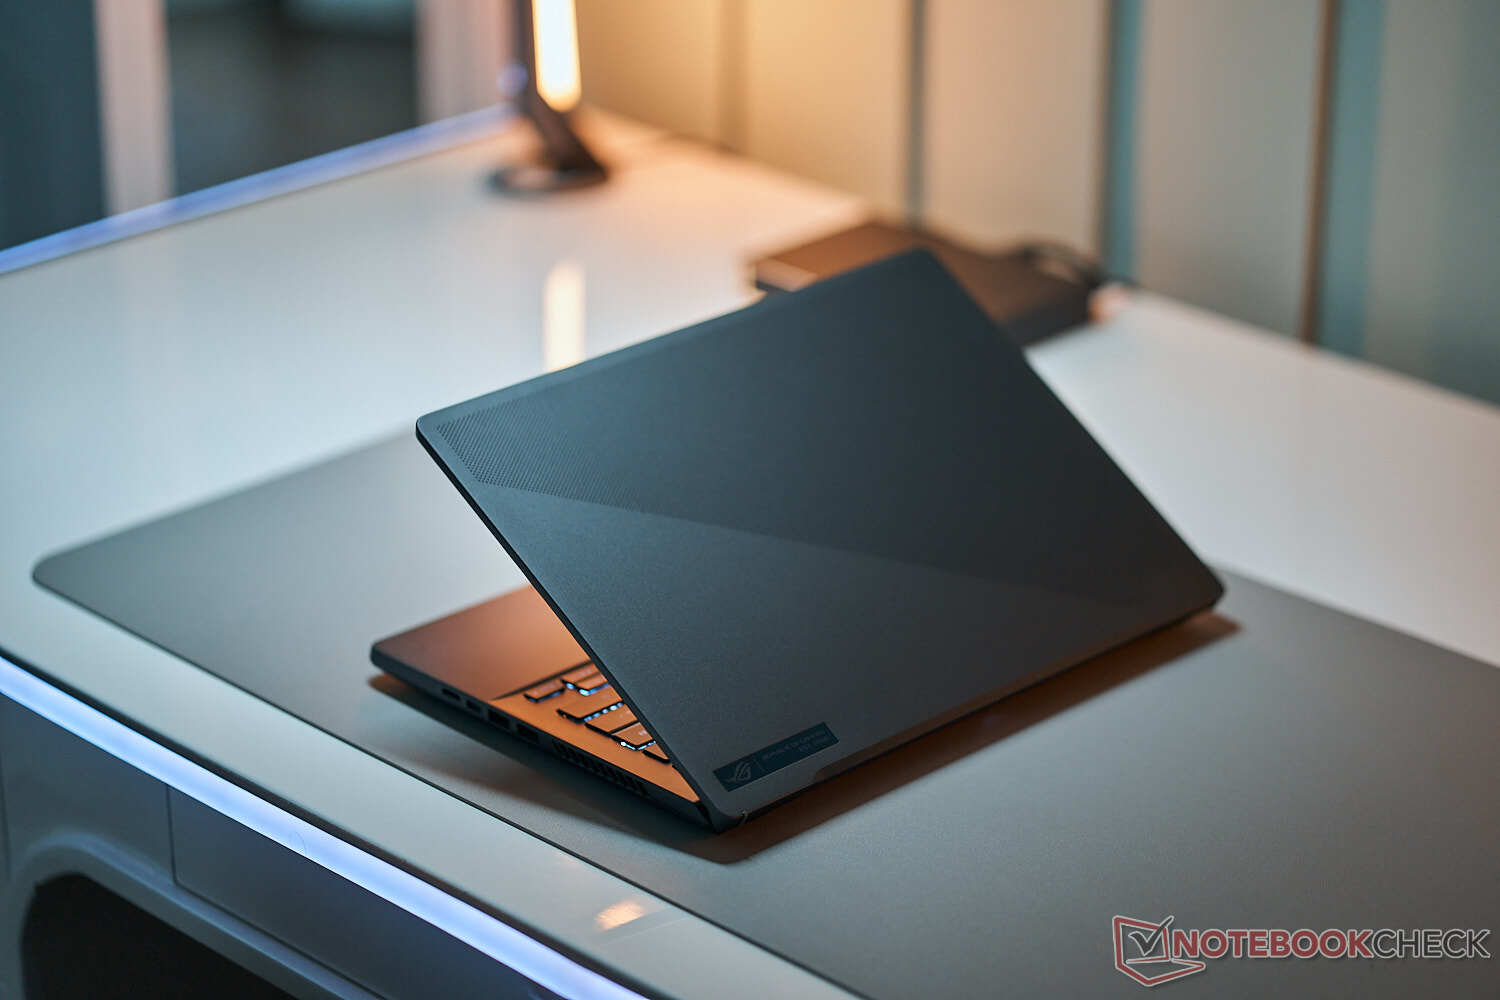
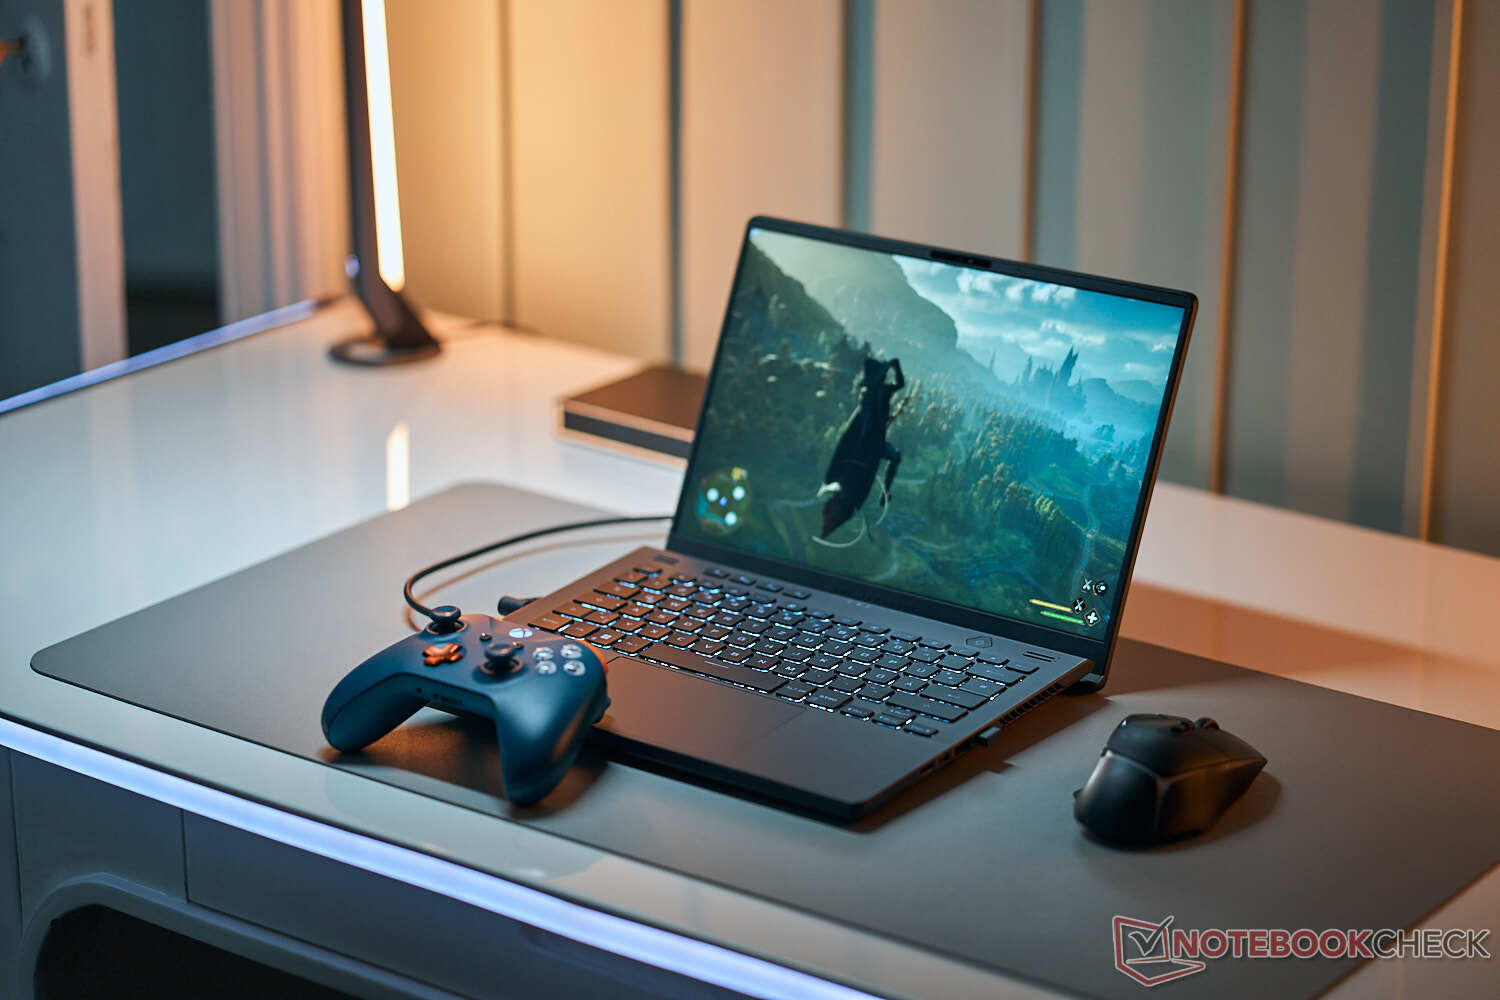
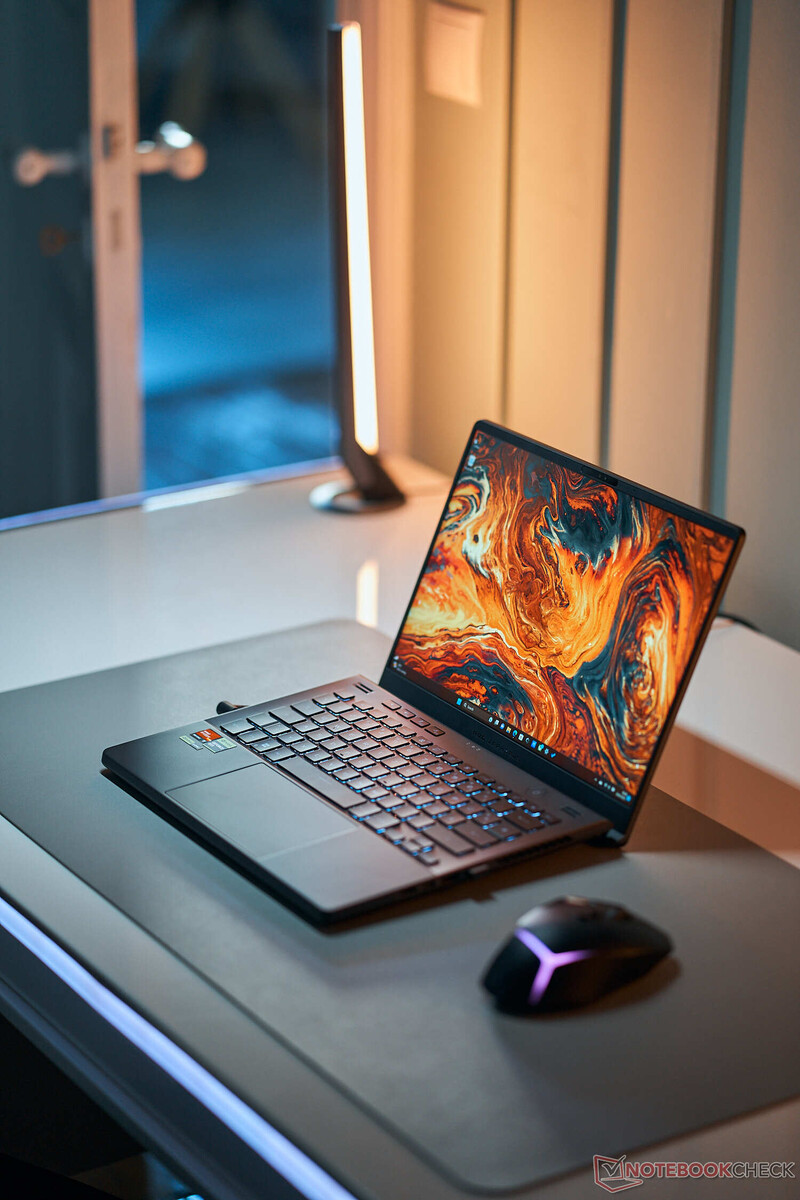
与之前的机型相比,华硕并没有改变机箱。上次我们评测了白色版本,包括盖子上的AniME显示屏,现在我们评测的是更微妙的灰色版本。这款游戏笔记本上也没有引人注目的设计元素,只是在盖子上有一个微妙的图案。在专业环境中使用这款笔记本应该不是问题,不会受到太多关注。
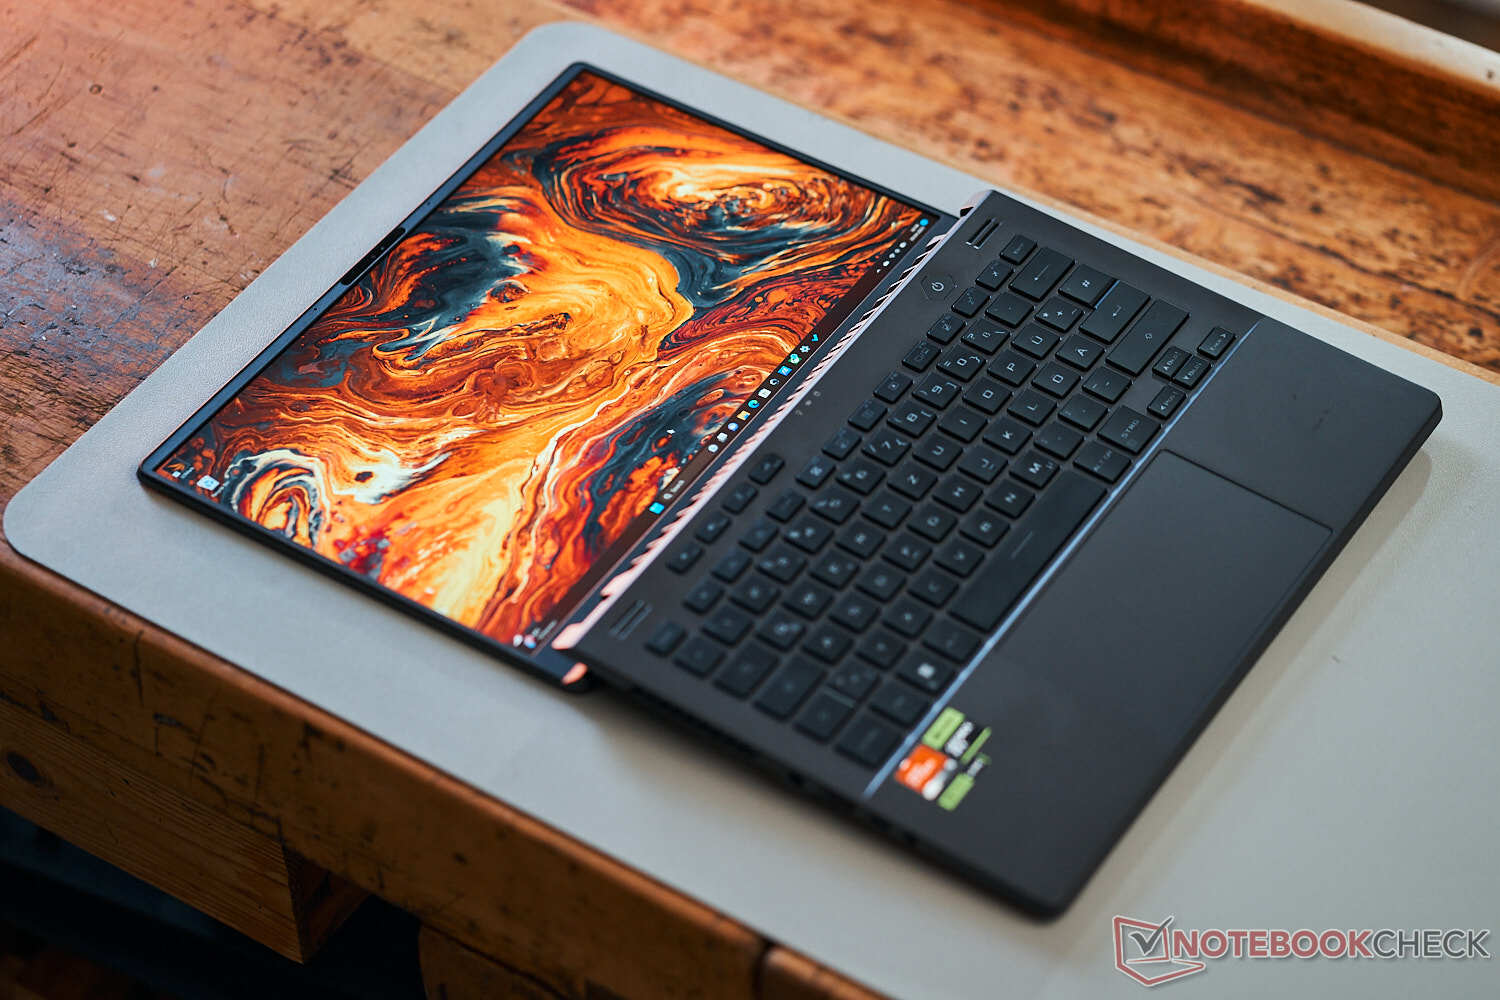
基本单元仍然由镁合金制成,尽管表面有轻微的软触感。但这并不是什么批评,该设备给人的感觉是优质产品,甚至指纹也不是什么大问题。当你打开盖子时,基本单元略微升高,这改善了热能以及人体工程学。稳定性真的很好,键盘没有弯曲,我们也无法扭转底座。我们也喜欢铰链的调整,尽管它们不能防止在你调整打开角度(最多180度)时的轻微晃动。然而,这在实践中不应该是一个问题。
盖子是由铝制成的,稍有弹性,但我们也无法激起任何吱吱作响的声音。边框非常纤细,尤其是在两侧,这导致了81%的体面的屏幕与身体的比率。
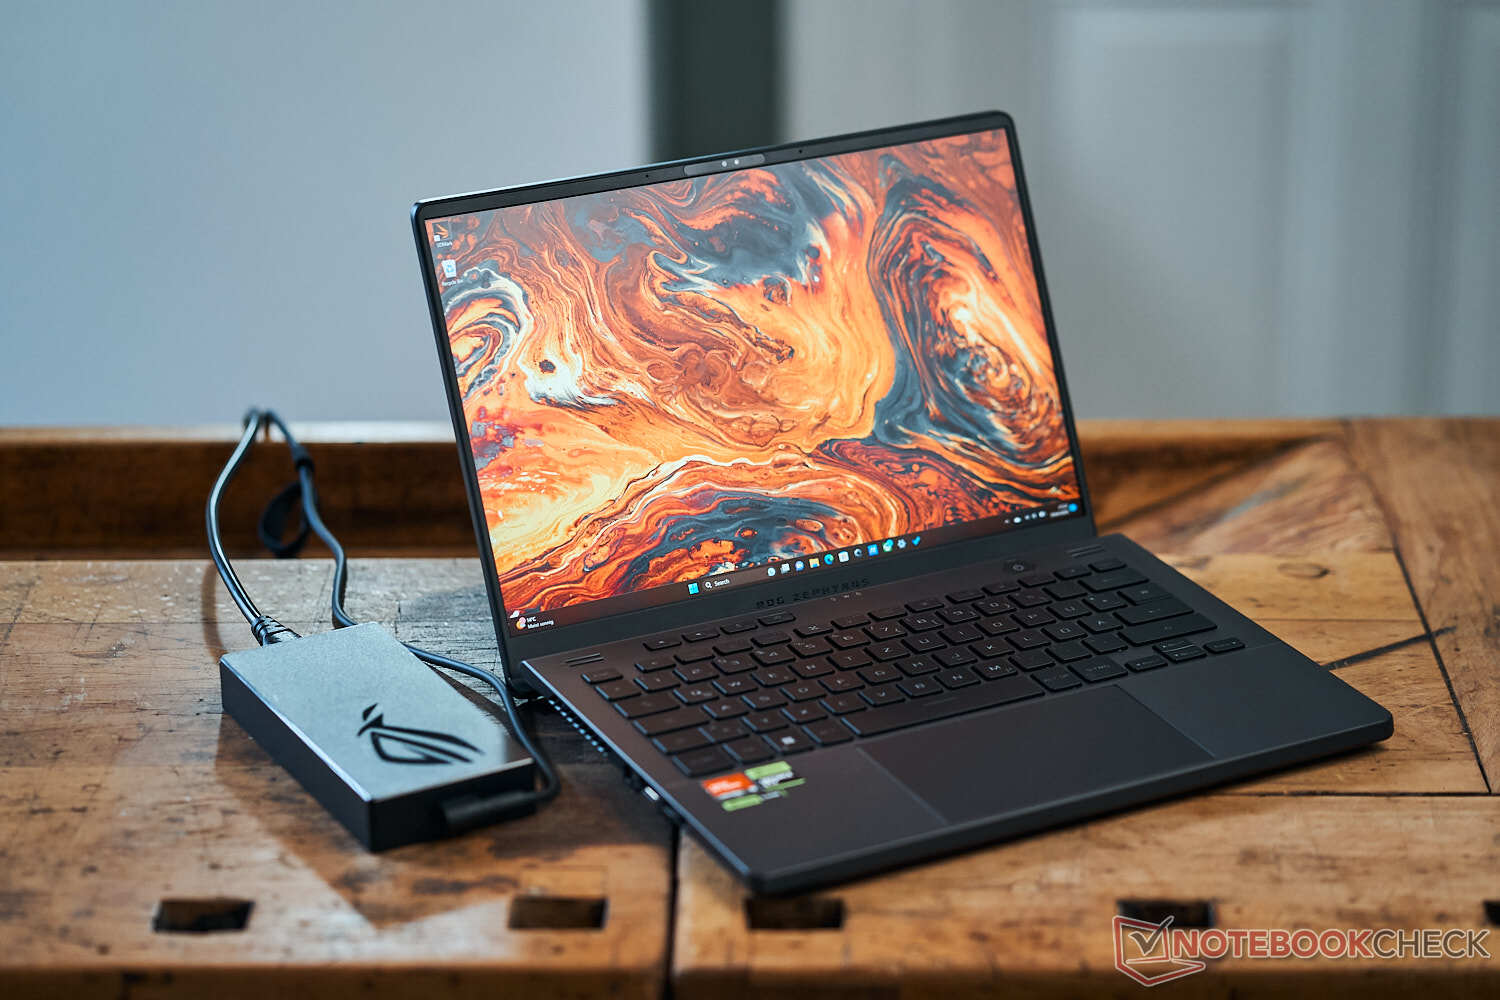
新的Zephyrus G14的体重接近1.7公斤,在我们的比较组中处于中间位置,尽管有高端组件和金属底盘。这款Alienware x14是迄今为止占地面积最大的设备,但其他设备也非常相似。然而,G14是最厚的设备,厚度为20.5毫米。显然,有更纤细的14英寸笔记本电脑,但它们几乎没有那么强大,G14仍然是一个非常移动的设备。对于大型的240W电源适配器(727克)来说,这并不是真正的情况,但你也可以在旅途中通过USB-C为设备充电。
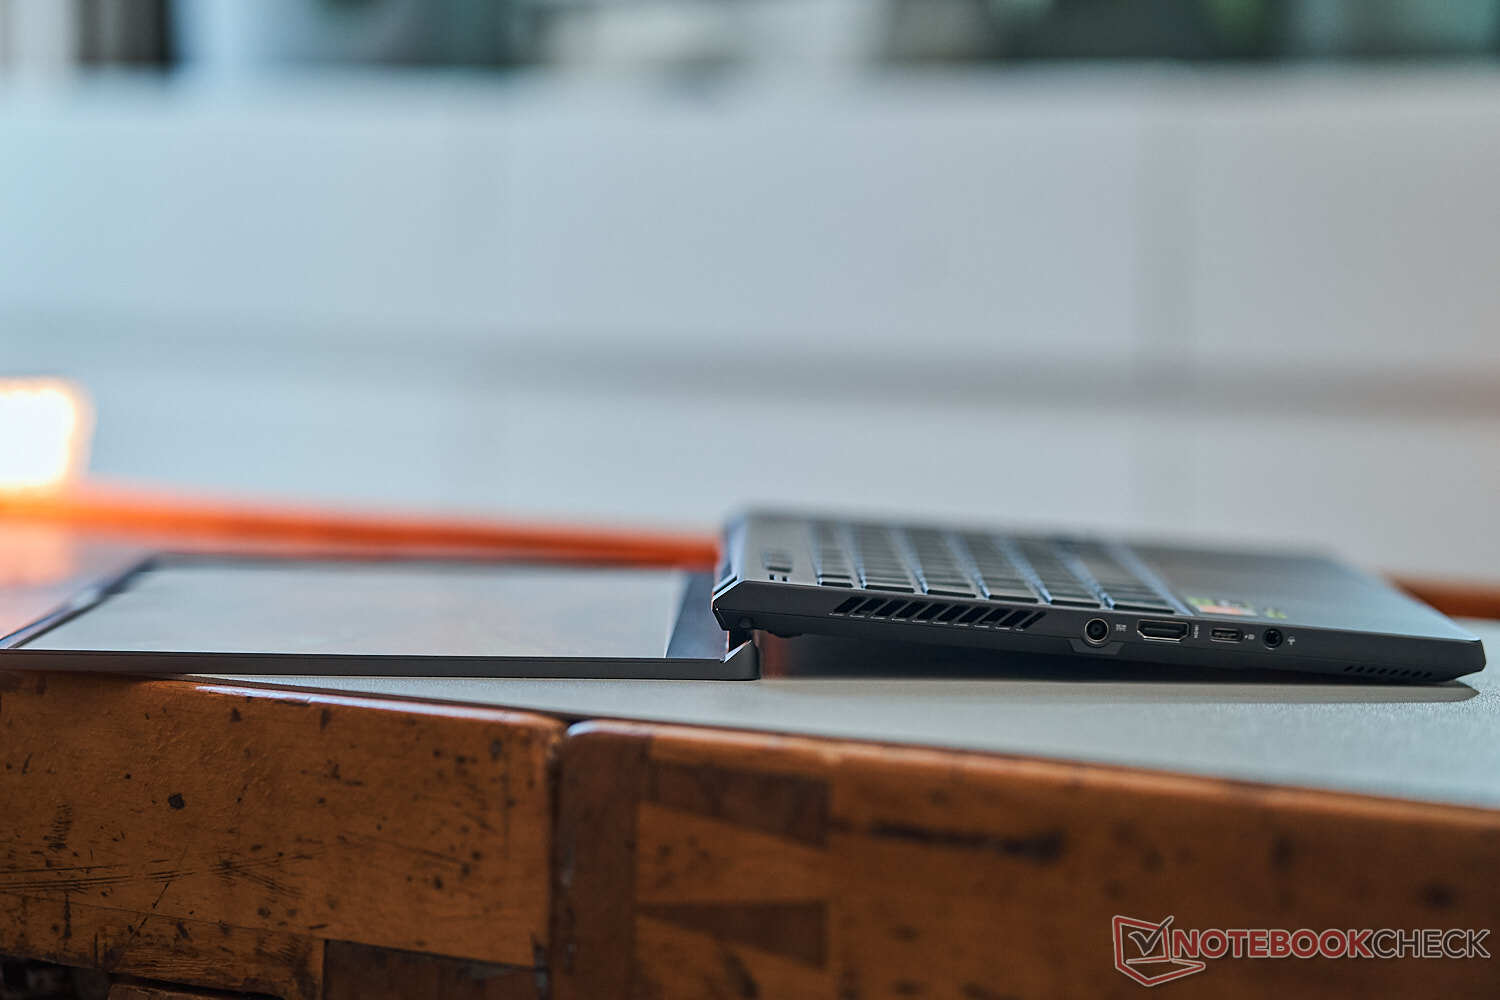
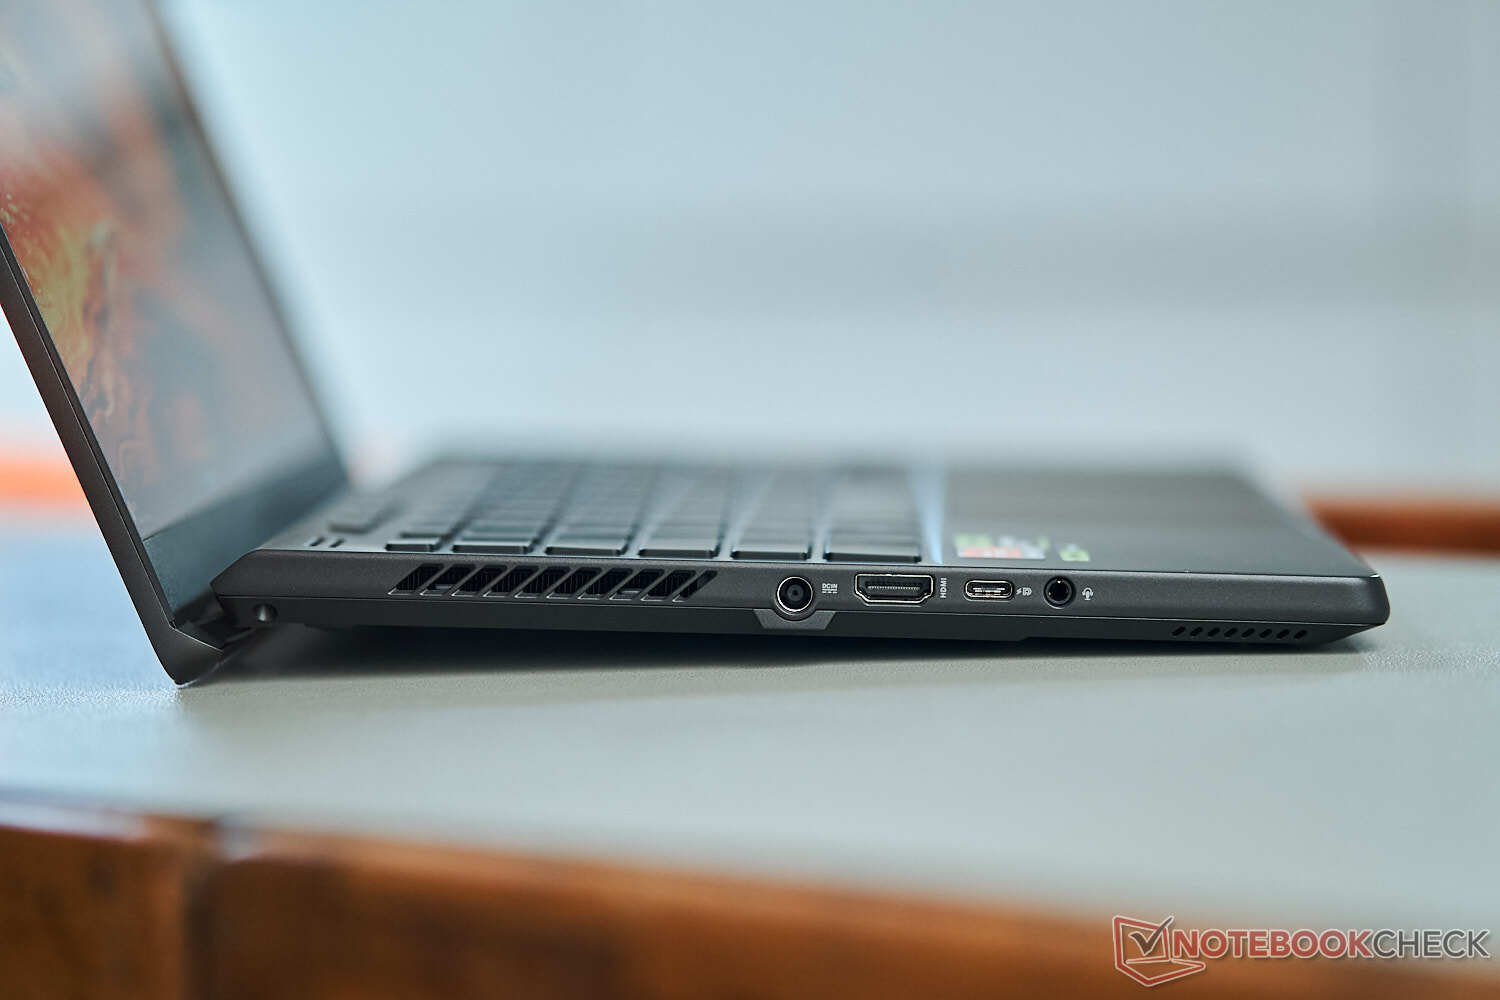
连接性 - 带有USB 4.0的AMD游戏机
端口布局与前代产品相同,这意味着所有的端口仍然位于两边的前面。如果你真的使用所有的连接器,可能会相当拥挤。后面的区域完全是为冷却和风扇排气保留的。
左侧的USB-C端口现在支持4.0标准,包括视频输出和电源传输。这个端口连接到iGPU,所以你可以使用这个输出来使用集成GPU的外部屏幕。如果你使用右侧的USB-C端口或HDMI输出,图形输出将由Nvidia GPU处理,在日常情况下会消耗更多能量。我们通过USB 4.0运行一个雷电底座(CalDigit TS4)和一个10 Gbps以太网适配器没有问题。
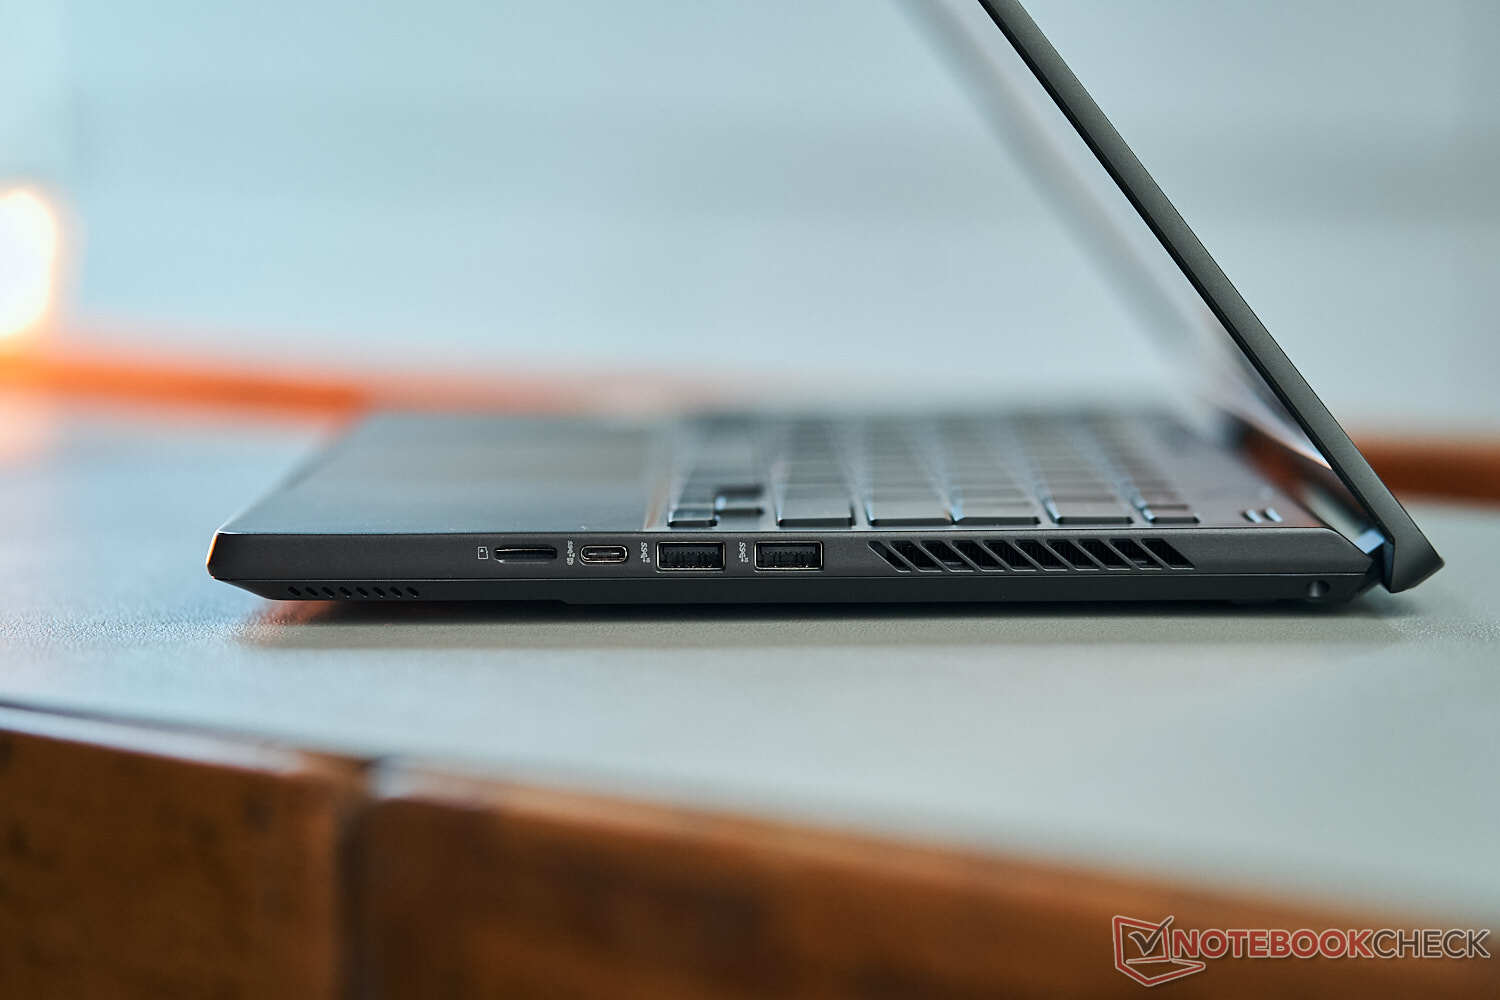
SD卡阅读器
小型microSD读卡器(弹簧机构)是最快的模块之一,我们用参考卡(Angelbird AV Pro V60)测得的最大传输速率超过了260 MB/s,当我们从卡上复制图像时,传输速率仍然达到了~130 MB/s。
| SD Card Reader | |
| average JPG Copy Test (av. of 3 runs) | |
| Alienware x14 i7 RTX 3060 (Angelbird AV Pro V60) | |
| Apple MacBook Pro 14 2023 M2 Pro (AV Pro V60) | |
| Asus ROG Zephyrus G14 GA402RK (AV PRO microSD 128 GB V60) | |
| Asus ROG Zephyrus G14 GA402XY (Angelibrid AV Pro V60) | |
| Average of class Gaming (20.9 - 210, n=54, last 2 years) | |
| maximum AS SSD Seq Read Test (1GB) | |
| Asus ROG Zephyrus G14 GA402XY (Angelibrid AV Pro V60) | |
| Alienware x14 i7 RTX 3060 (Angelbird AV Pro V60) | |
| Apple MacBook Pro 14 2023 M2 Pro (AV Pro V60) | |
| Asus ROG Zephyrus G14 GA402RK (AV PRO microSD 128 GB V60) | |
| Average of class Gaming (25.5 - 261, n=51, last 2 years) | |
沟通
华硕使用了RealTek的现代Wi-Fi模块(MT9722),它支持最新的Wi-Fi 6E标准以及蓝牙5.2。然而,我们无法将测试模型与我们的参考路由器(华硕)的相应6GHz网络连接起来,但在5GHz网络(Wi-Fi 6)中的传输速率也非常好和稳定。在我们审查期间,我们没有注意到任何连接问题。
网络摄像头
华硕升级了摄像头,现在使用的是包括红外摄像头在内的1080p模块,与Windows Hello相结合进行面部识别。与以前的机型相比,网络摄像头更好,整体质量还可以,但我们今年已经看到了更好的模块。我们在视频评测中包含了一个样本视频,所以你可以对质量有一个更好的印象。


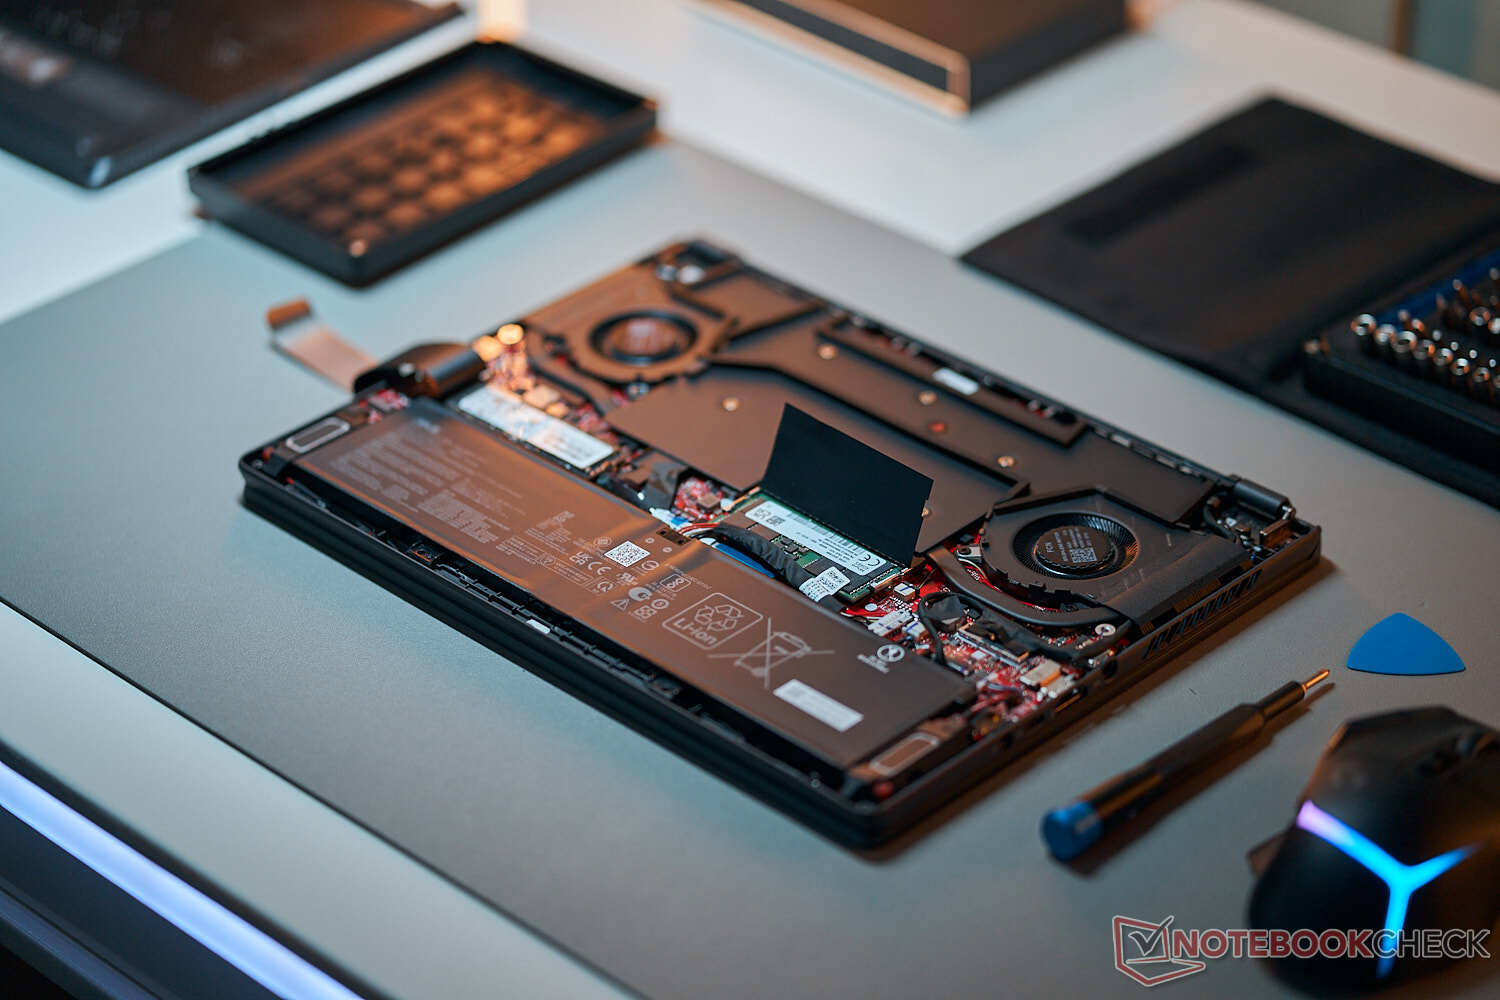
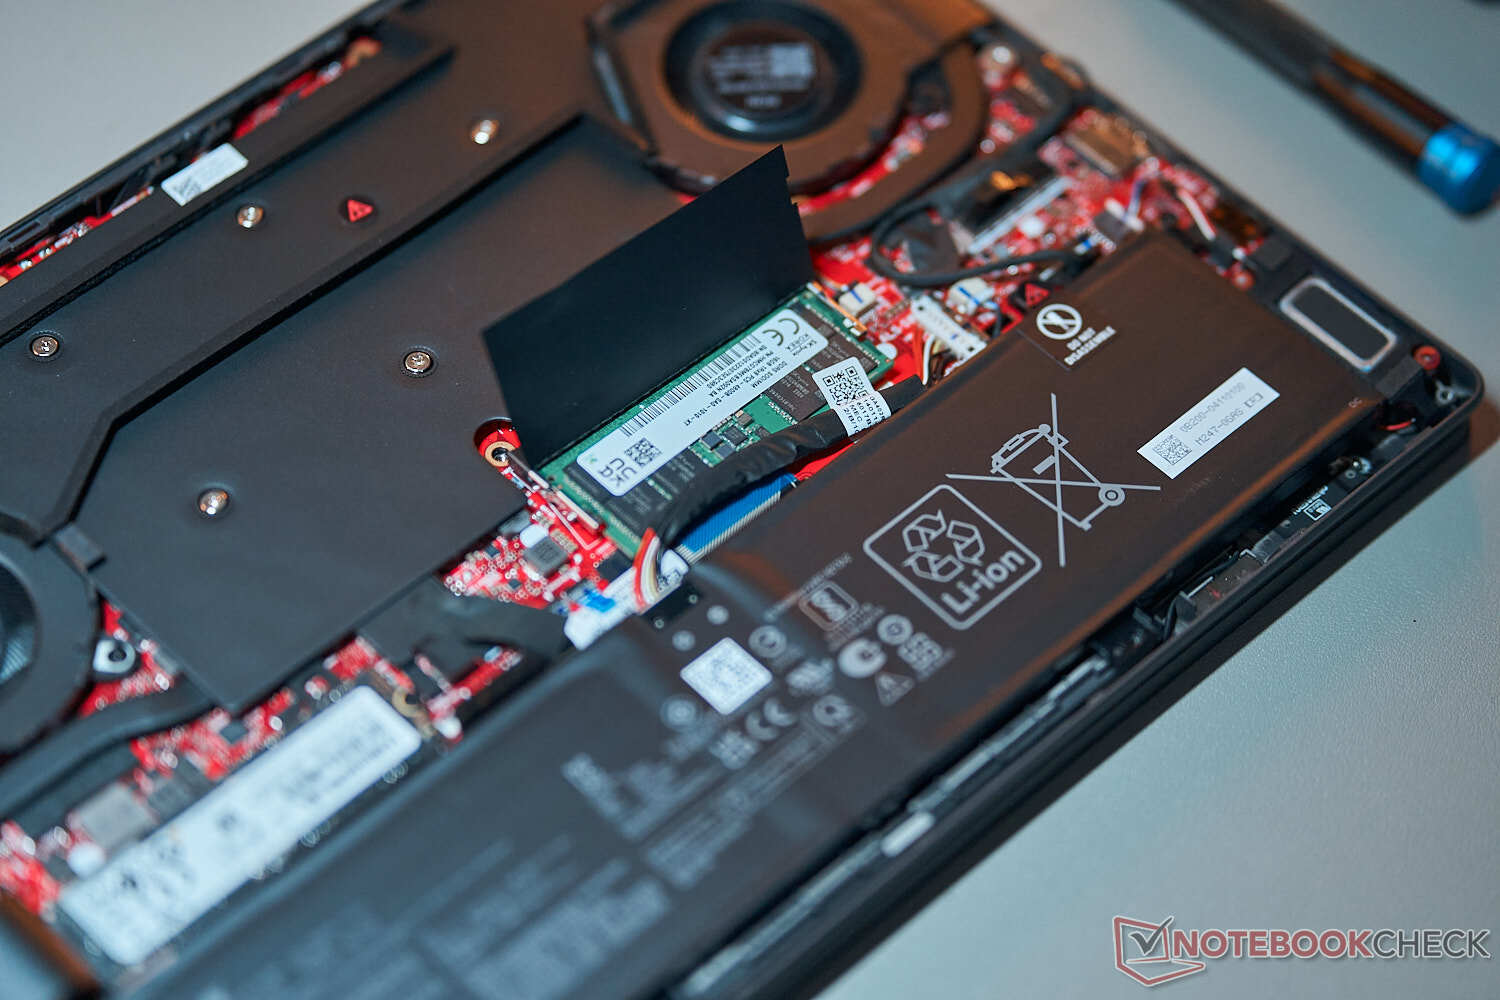
维护
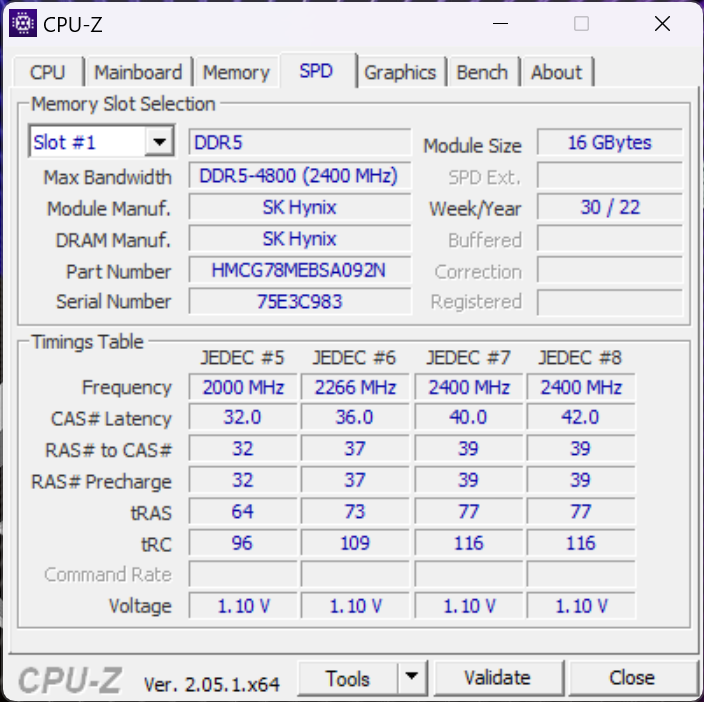
底部面板再次由11颗小飞利浦螺钉固定,但其中一些螺钉隐藏在小橡胶盖下面。一旦进入内部,你会看到带有两个风扇的大蒸气室以及电池。你可以更换固态硬盘,除了板载的16GB内存外,还有一个SO-DIMM插槽。这意味着你可以用一个32GB的模块使用多达48GB的内存。
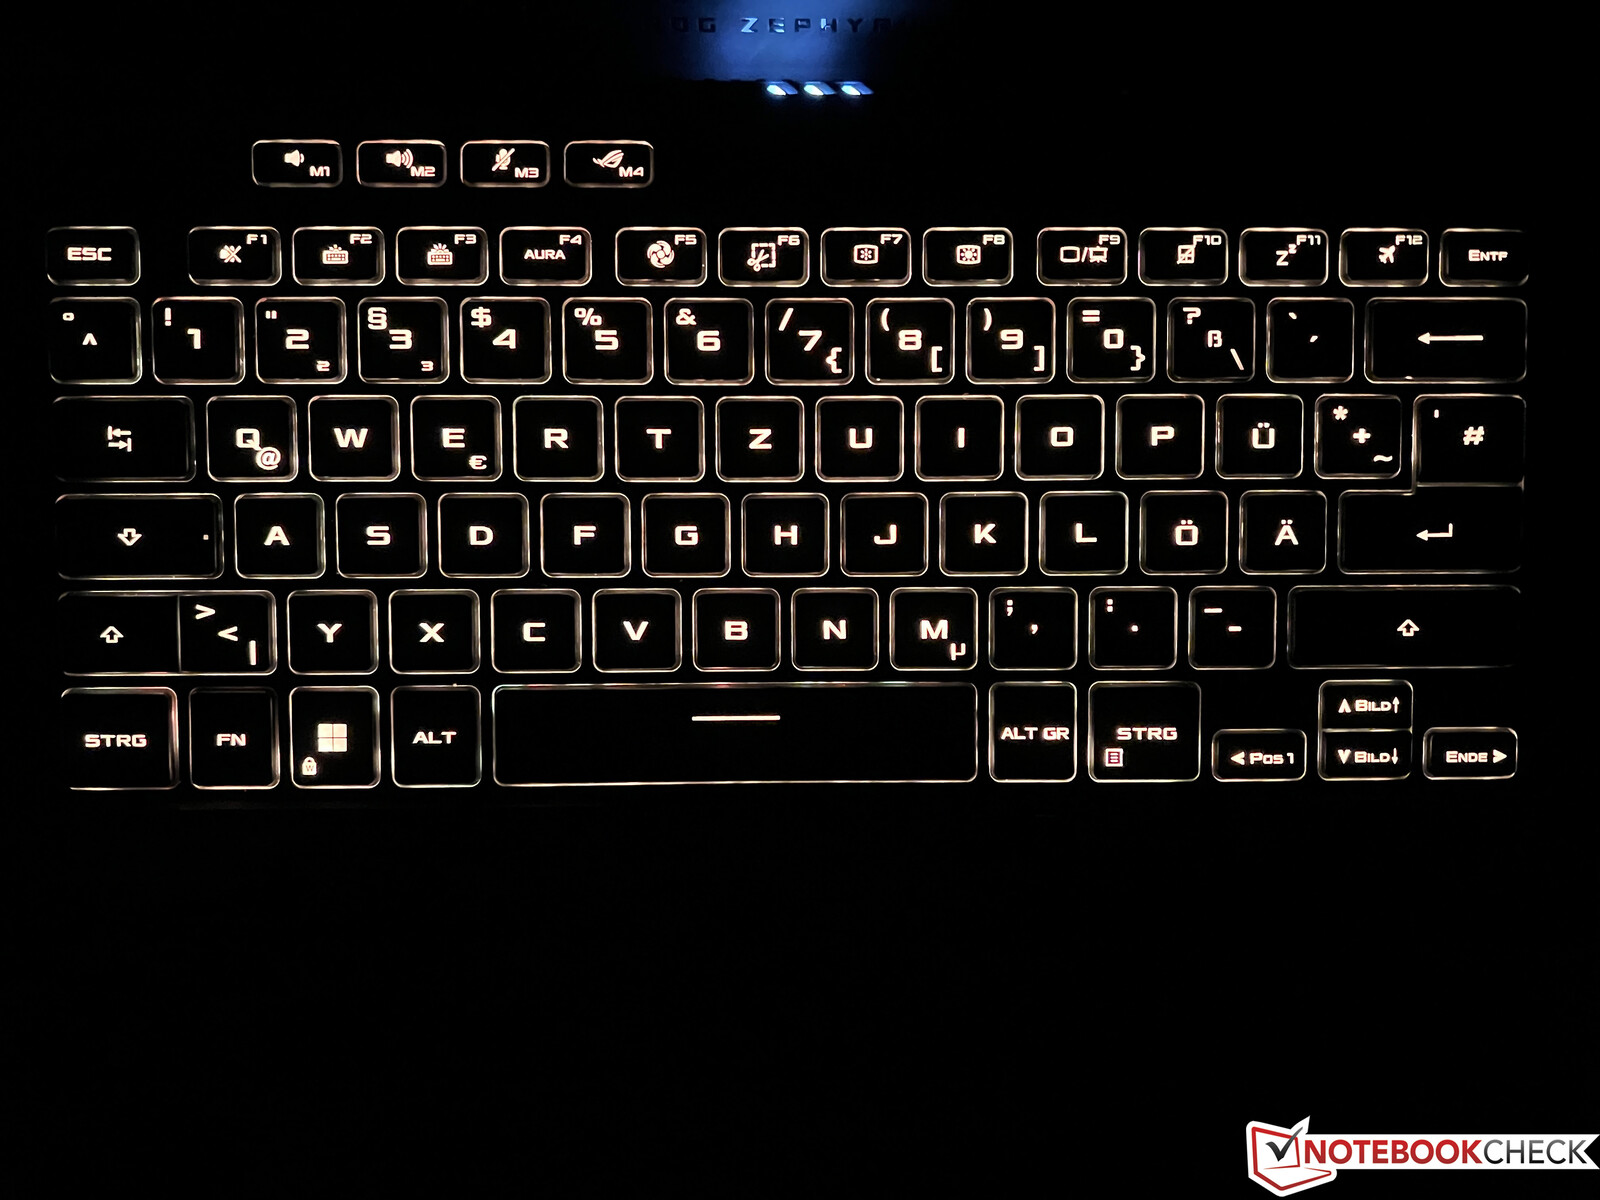
输入设备 - 带有Aura-Sync的ROG 14
键盘提供了1.7毫米的行程,并提供了非常牢固和精确的反馈,因此在G14上输入较长的文字是没有问题的。键盘照明可以通过软件定制多种颜色,但只在一个区域。还可以通过Aura Sync将照明与其他设备同步。
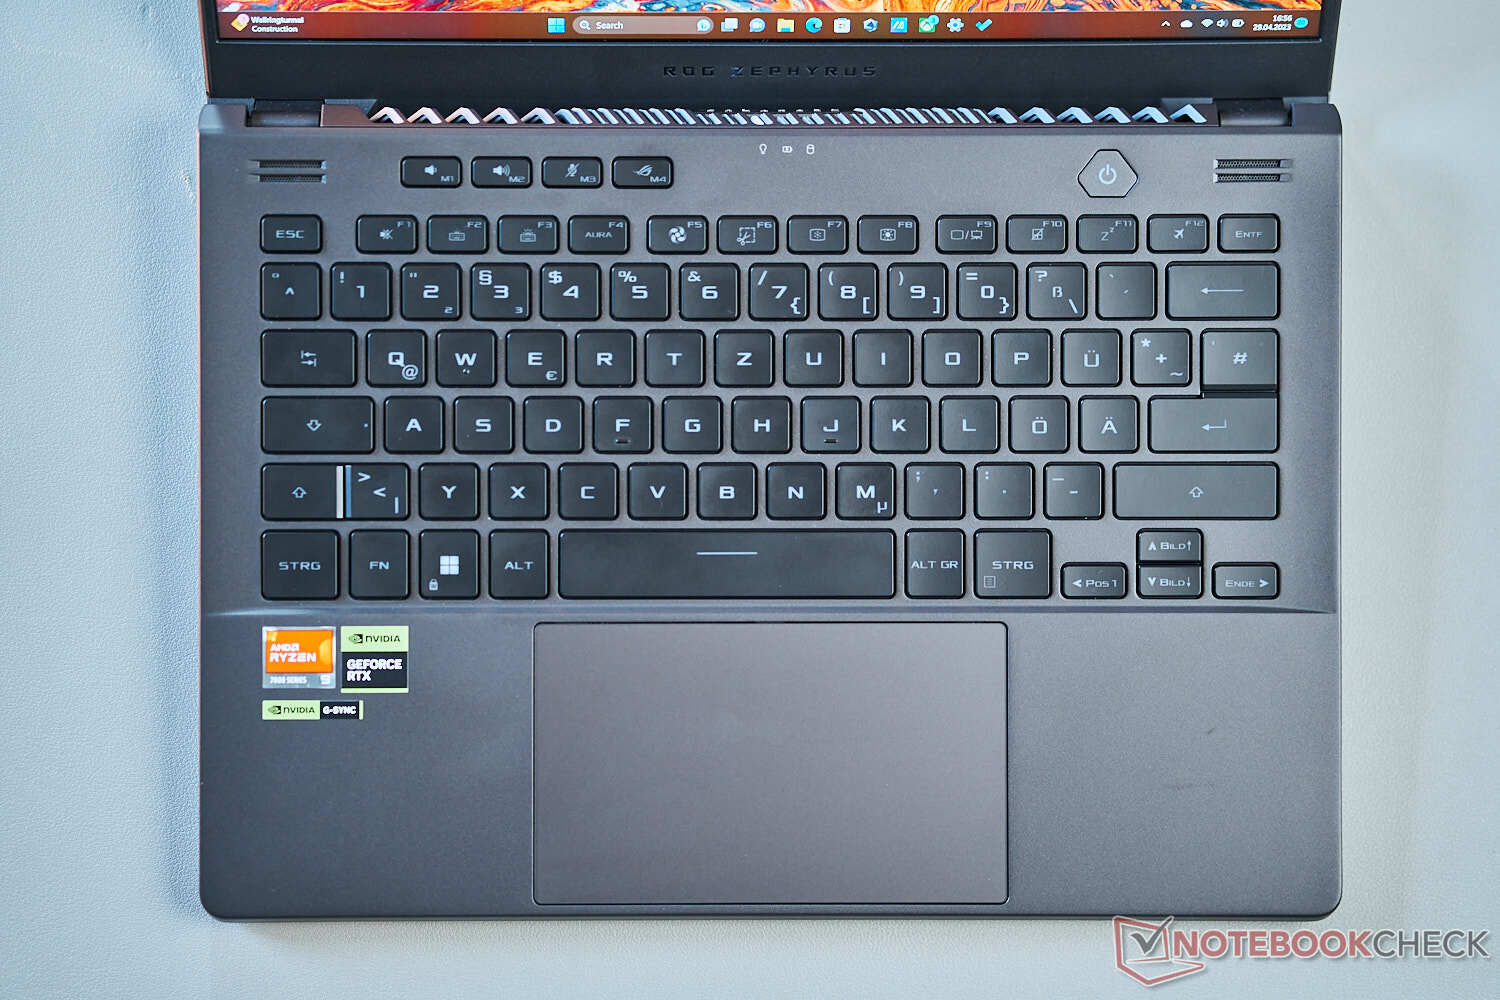
玻璃触摸板(12.8 x 7.6厘米)提供了良好的滑行能力,标准的光标移动以及最多四个手指的手势都没有问题。触摸板的下半部分可以被推倒,这导致了坚定的反馈和点击声,尽管它可以更安静一点。
显示屏 - 迷你LED,165赫兹
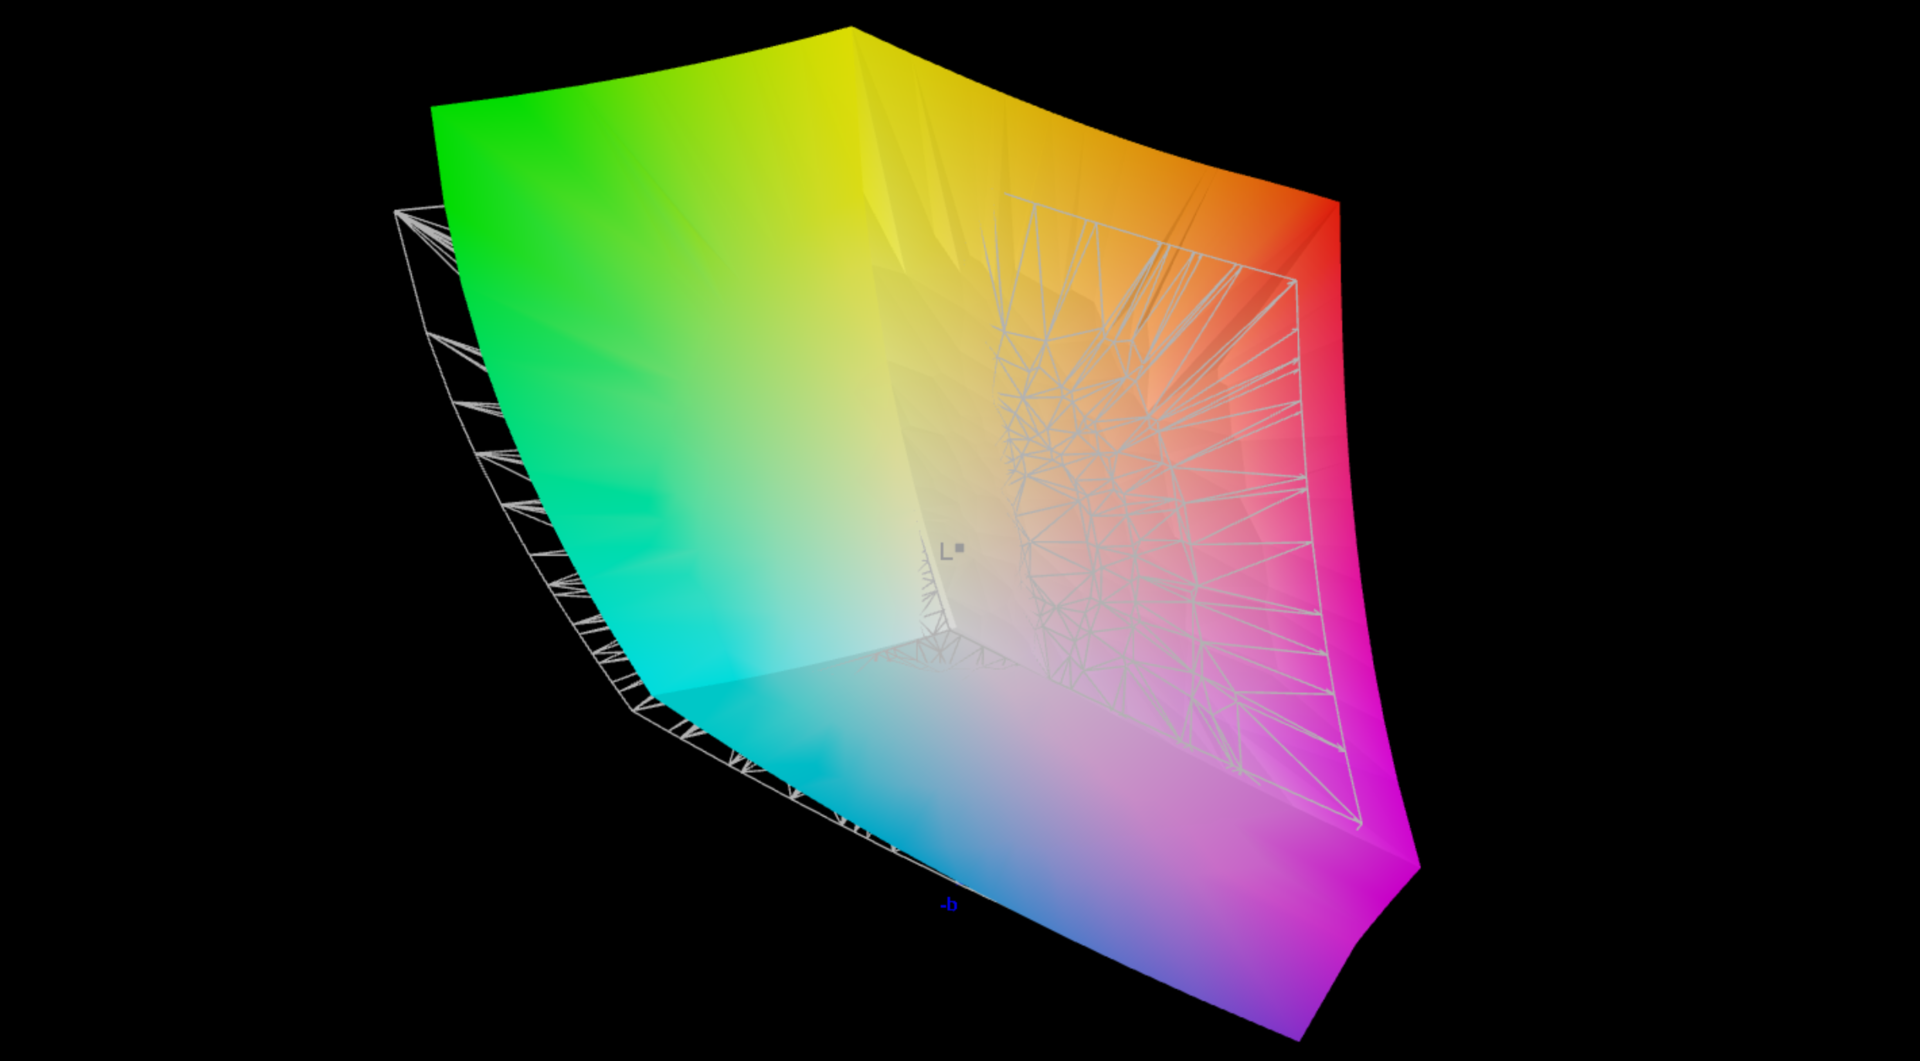
华硕为Zen4机型配备了14英寸IPS或Mini-LED面板,分辨率为QHD+(2560 x 1600像素,16:10)。规格表还列出了一个1080p的IPS面板,但我们还找不到相应的SKU。所有配备RTX 4070笔记本电脑或更好的型号都配备了165赫兹的Mini-LED面板。画面的主观印象非常好,内容锐利,没有颗粒感,色彩丰富,由于刷新率高,动作非常流畅。
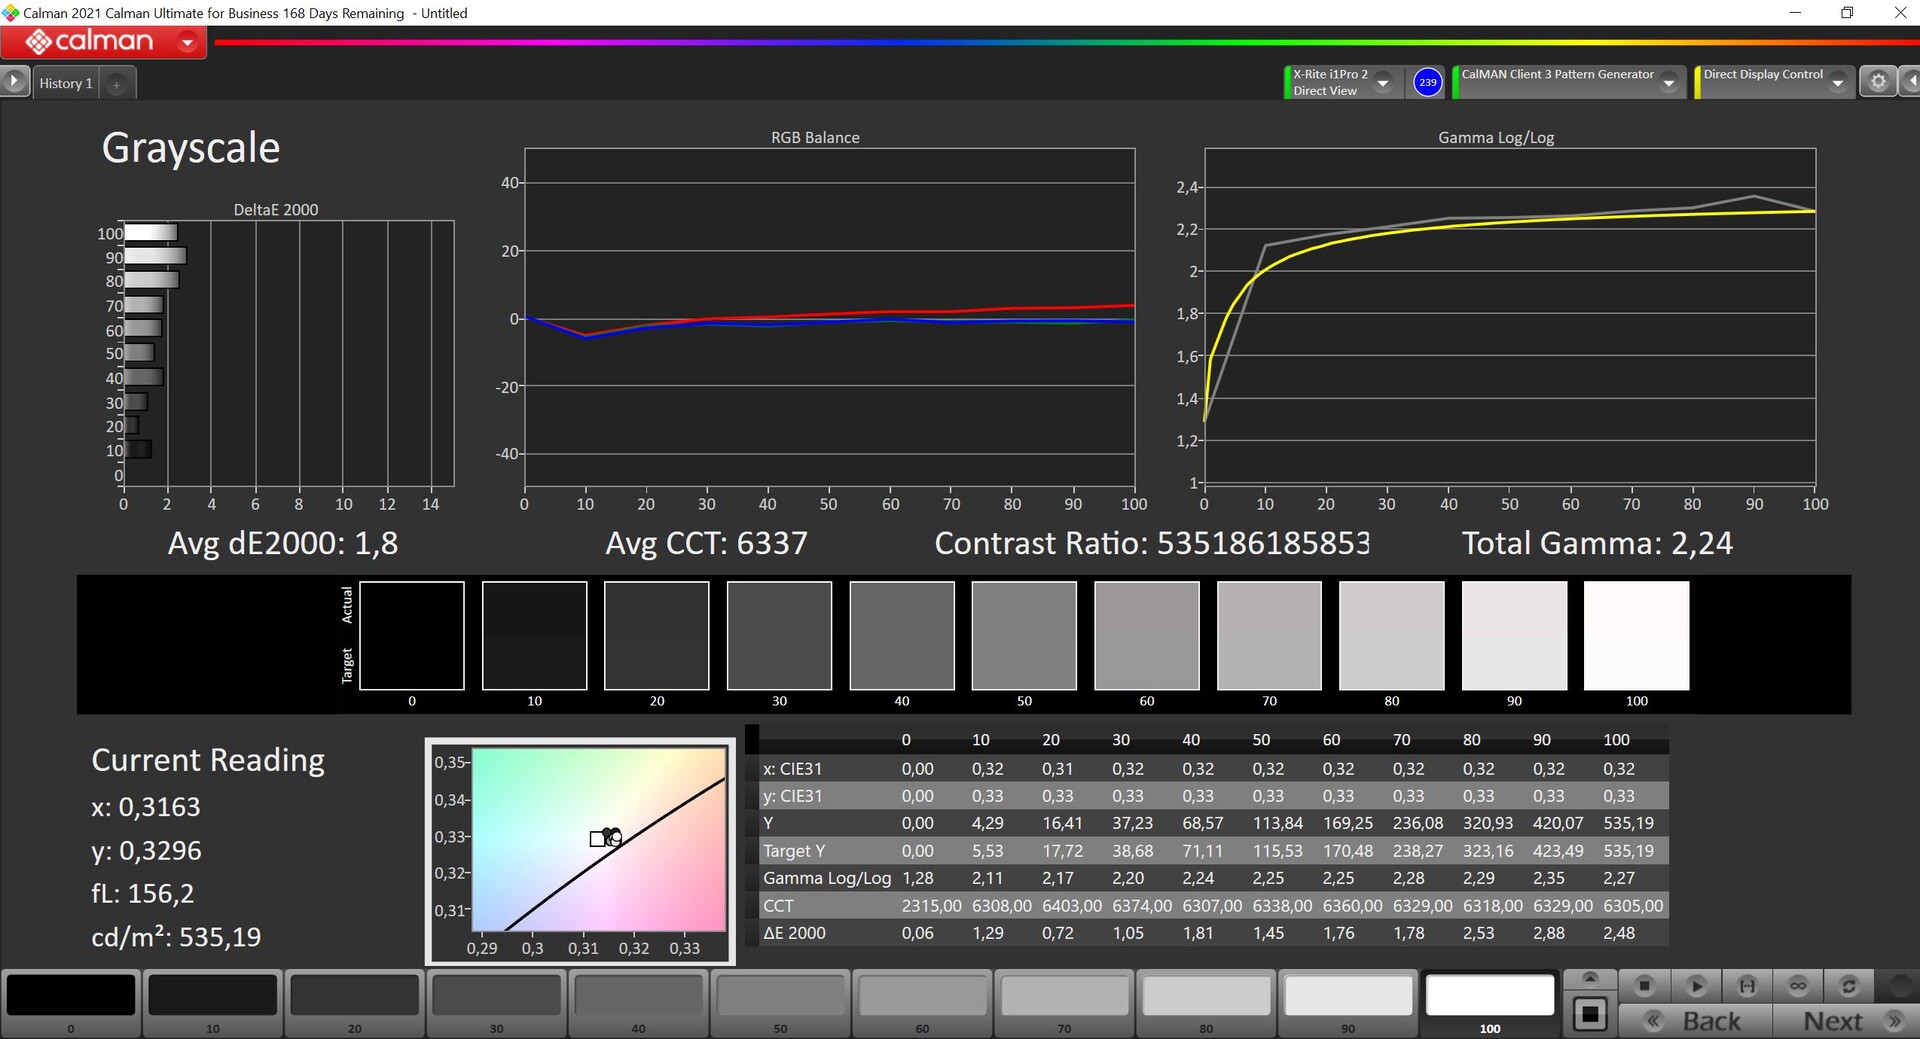
制造商宣传的亮度为500尼特(HDR的峰值为600尼特),但我们的测量显示平均亮度较高,约为560尼特。结合低黑值(0),对比度非常高,与OLED面板相似。这种对比度对主观画质也有很大影响。Mini-LED面板没有背光渗漏的问题,但当明亮的物体在黑暗的背景上移动时,由于不同的调光区,可能会出现混浊(光晕)。这个问题可以被挑起,但在日常情况下通常是不可见的。华硕还使用了所谓的星云HDR引擎,这应该是为了减少混浊现象。
| |||||||||||||||||||||||||
Brightness Distribution: 91 %
Center on Battery: 535 cd/m²
Contrast: ∞:1 (Black: 0 cd/m²)
ΔE ColorChecker Calman: 1 | ∀{0.5-29.43 Ø4.71}
ΔE Greyscale Calman: 1.8 | ∀{0.09-98 Ø4.96}
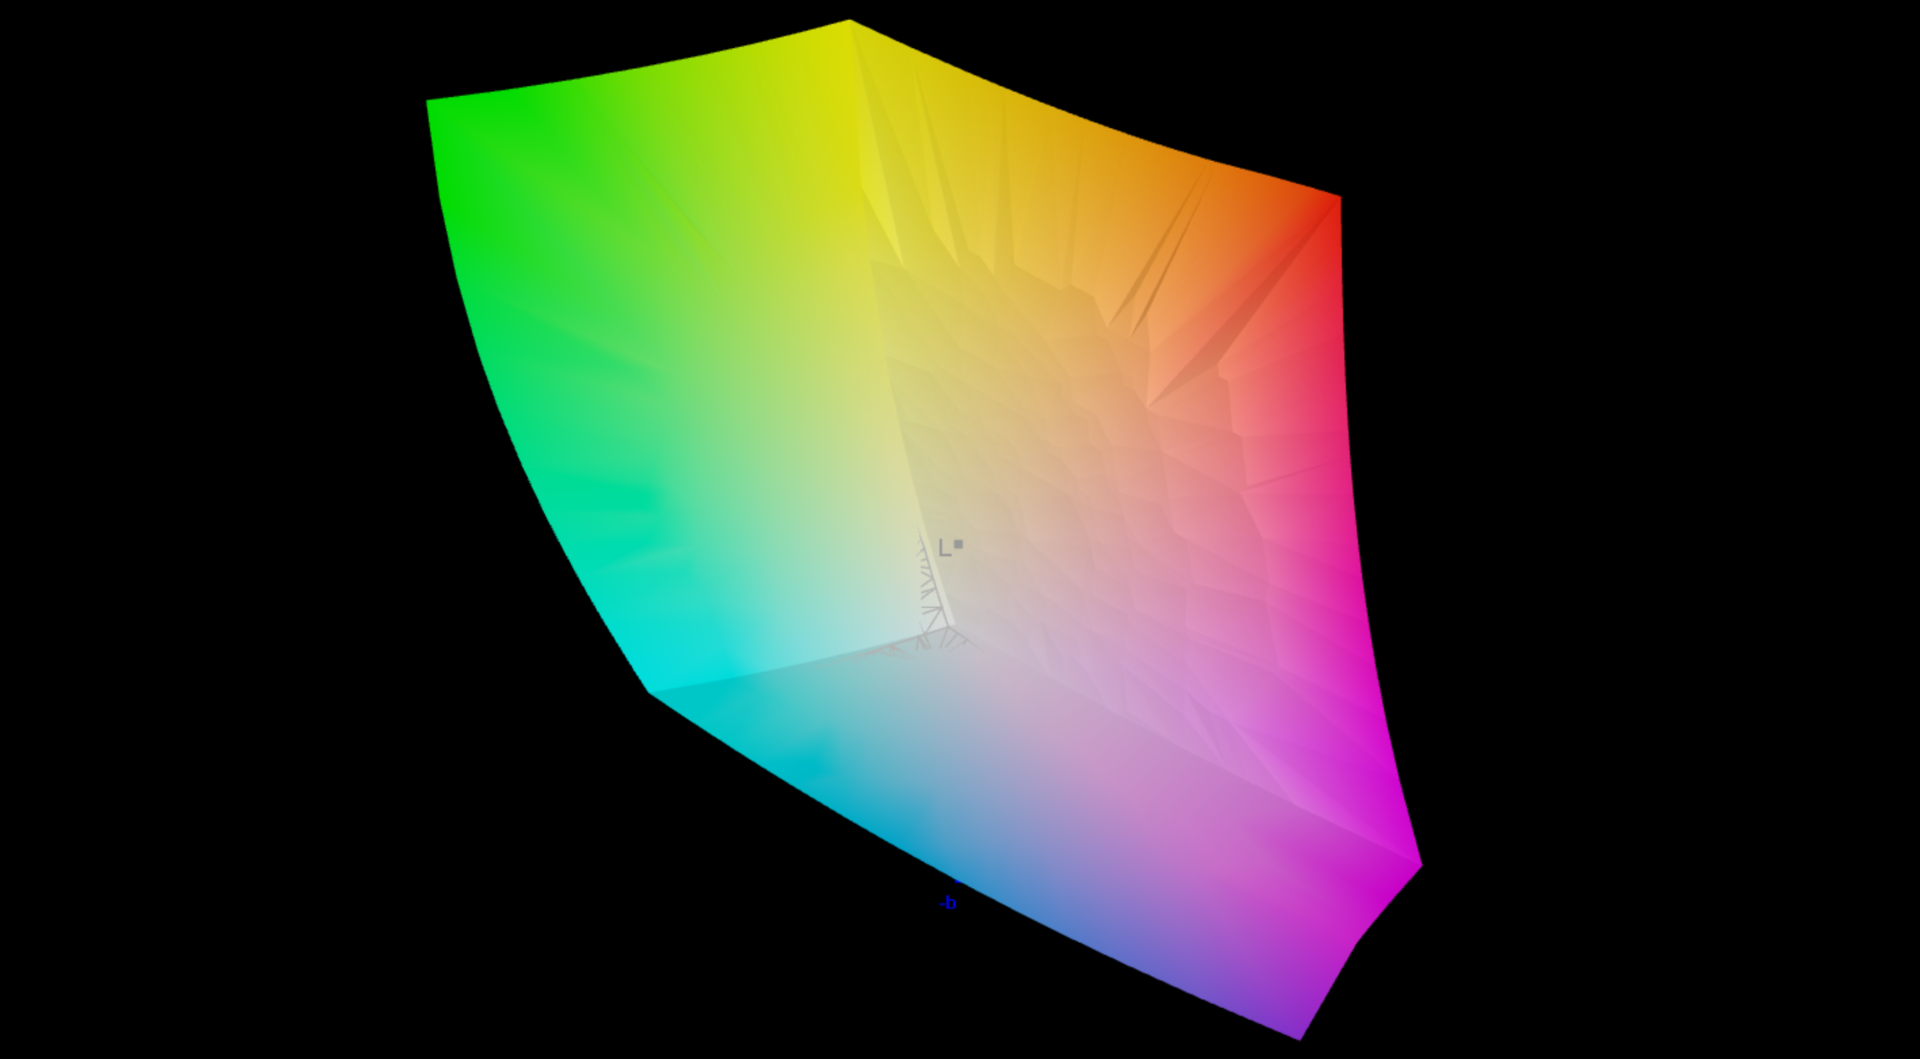
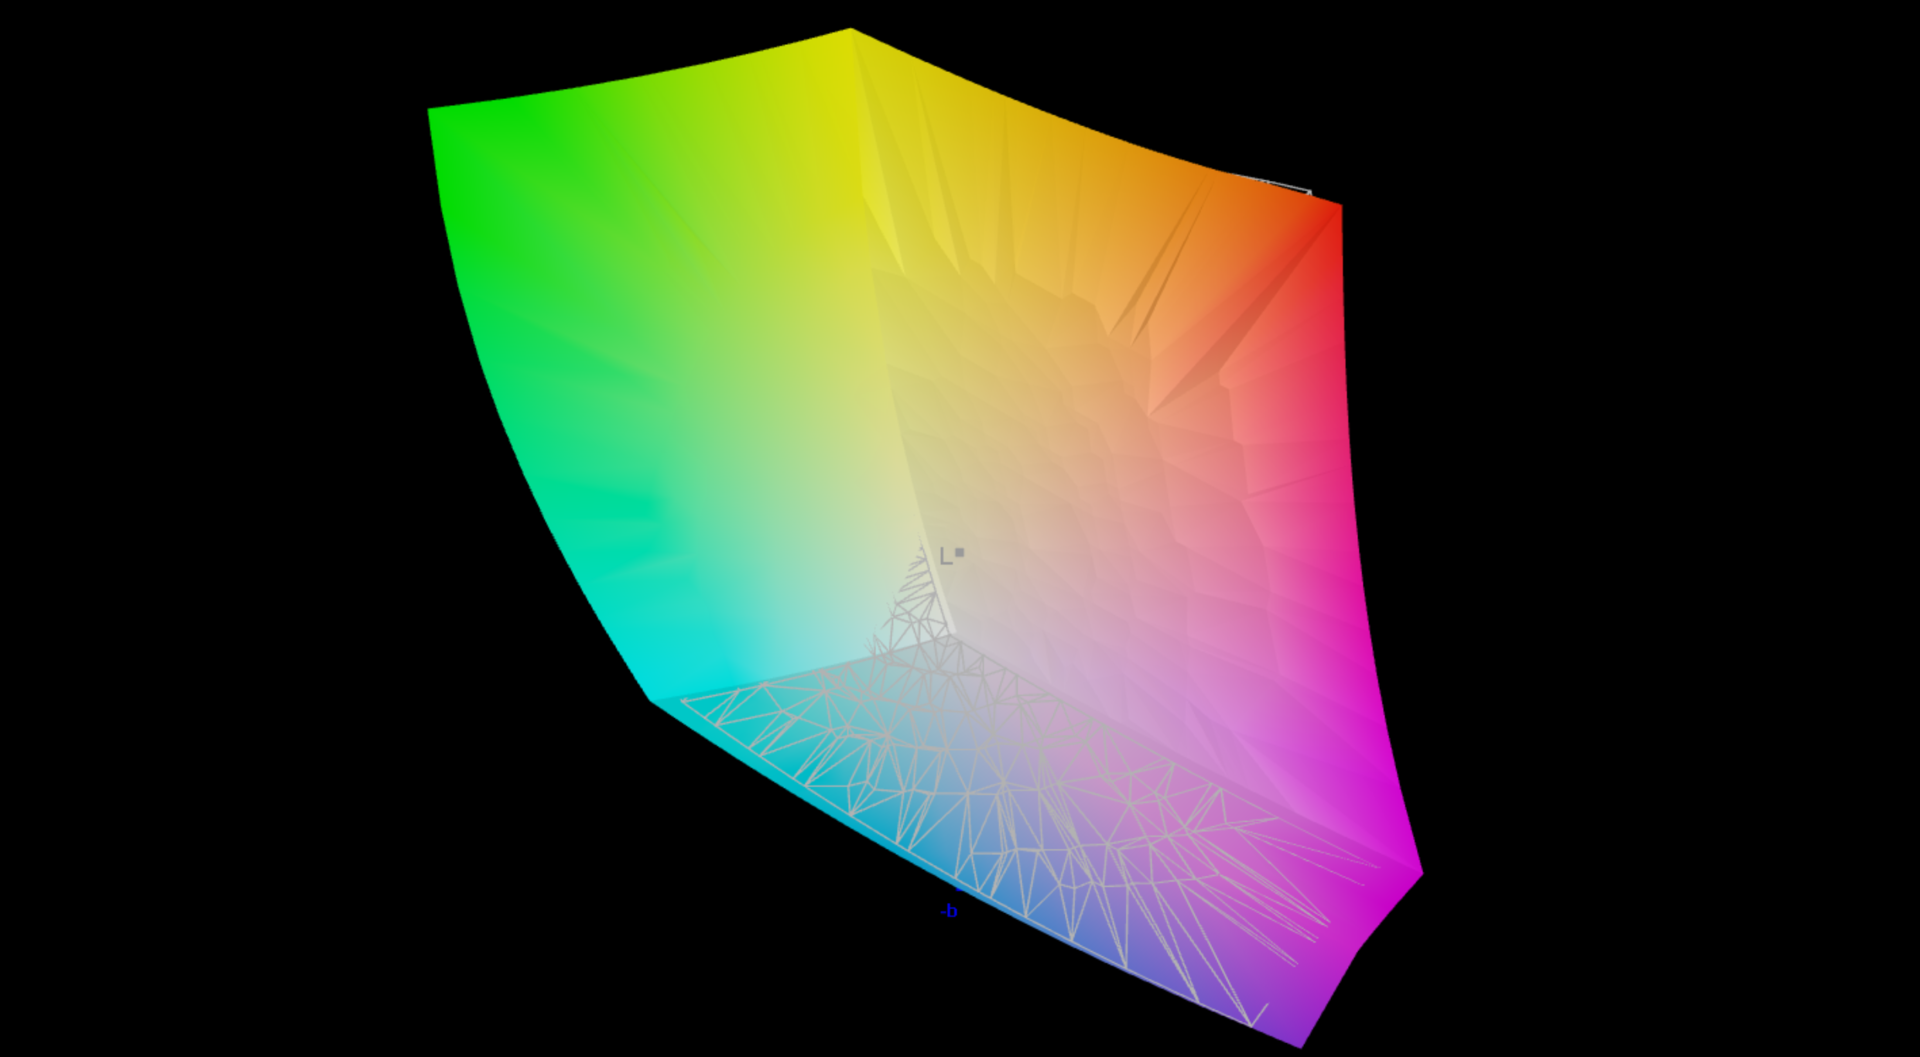
93.4% AdobeRGB 1998 (Argyll 3D)
100% sRGB (Argyll 3D)
99.6% Display P3 (Argyll 3D)
Gamma: 2.24
CCT: 6337 K
| Asus ROG Zephyrus G14 GA402XY B140QAN06.S, Mini-LED, 2560x1600, 14" | Razer Blade 14 Ryzen 9 6900HX TL140BDXP02-0, IPS, 2560x1440, 14" | Asus ROG Zephyrus G14 GA402RK NE140QDM-NX1 (BOE0A1D), IPS-Level, 2560x1600, 14" | Alienware x14 i7 RTX 3060 SHP154D, IPS, 1920x1080, 14" | Acer Predator Triton 300 SE Samsung ATNA40YK07-0, OLED, 2880x1800, 14" | Asus ROG Zephyrus M16 GU604VY-NM042X BOE0B74 (NE160QDM-NM4, IPS, 2560x1600, 16" | Apple MacBook Pro 14 2023 M2 Pro Mini-LED, 3024x1964, 14.2" | |
|---|---|---|---|---|---|---|---|
| Display | -3% | -3% | -2% | 2% | -1% | 0% | |
| Display P3 Coverage (%) | 99.6 | 97.2 -2% | 97.4 -2% | 99.6 0% | 99.9 0% | 99.33 0% | 99.2 0% |
| sRGB Coverage (%) | 100 | 99.9 0% | 99.9 0% | 100 0% | 100 0% | 99.9 0% | |
| AdobeRGB 1998 Coverage (%) | 93.4 | 85.7 -8% | 85.5 -8% | 87.6 -6% | 99 6% | 90.01 -4% | |
| Response Times | -26% | 44% | 34% | 89% | -197% | -136% | |
| Response Time Grey 50% / Grey 80% * (ms) | 17.2 ? | 16.8 ? 2% | 8.8 ? 49% | 9.6 ? 44% | 1.36 ? 92% | 50.8 ? -195% | 35.2 ? -105% |
| Response Time Black / White * (ms) | 9.9 ? | 15.2 ? -54% | 6 ? 39% | 7.6 ? 23% | 1.36 ? 86% | 29.6 ? -199% | 26.4 ? -167% |
| PWM Frequency (Hz) | 5430 | 27170 ? | 367.6 ? | 12000 | 14880 ? | ||
| Screen | -29% | -79% | -98% | -98% | 19% | -4% | |
| Brightness middle (cd/m²) | 535 | 354 -34% | 480 -10% | 434 -19% | 414.3 -23% | 634 19% | 500 -7% |
| Brightness (cd/m²) | 563 | 328 -42% | 456 -19% | 411 -27% | 416 -26% | 627 11% | 489 -13% |
| Brightness Distribution (%) | 91 | 86 -5% | 80 -12% | 89 -2% | 99 9% | 92 1% | 94 3% |
| Black Level * (cd/m²) | 0.37 | 0.48 | 0.25 | 0.03 | 0.02 | ||
| Colorchecker dE 2000 * | 1 | 1.66 -66% | 2.62 -162% | 3 -200% | 4.68 -368% | 0.89 11% | 1.2 -20% |
| Colorchecker dE 2000 max. * | 2.8 | 3.83 -37% | 6.71 -140% | 7.1 -154% | 7.78 -178% | 1.79 36% | 2.6 7% |
| Greyscale dE 2000 * | 1.8 | 1.6 11% | 4.2 -133% | 5.1 -183% | 1.8 -0% | 1.13 37% | 1.7 6% |
| Gamma | 2.24 98% | 2.23 99% | 2.16 102% | 2.19 100% | 2.22 99% | 2.47 89% | 2.24 98% |
| CCT | 6337 103% | 6542 99% | 7122 91% | 6204 105% | 6207 105% | 6497 100% | 6791 96% |
| Contrast (:1) | 957 | 1000 | 1736 | 21133 | 25000 | ||
| Colorchecker dE 2000 calibrated * | 1.12 | 0.7 | 0.91 | ||||
| Total Average (Program / Settings) | -19% /
-21% | -13% /
-36% | -22% /
-48% | -2% /
-37% | -60% /
-26% | -47% /
-33% |
* ... smaller is better

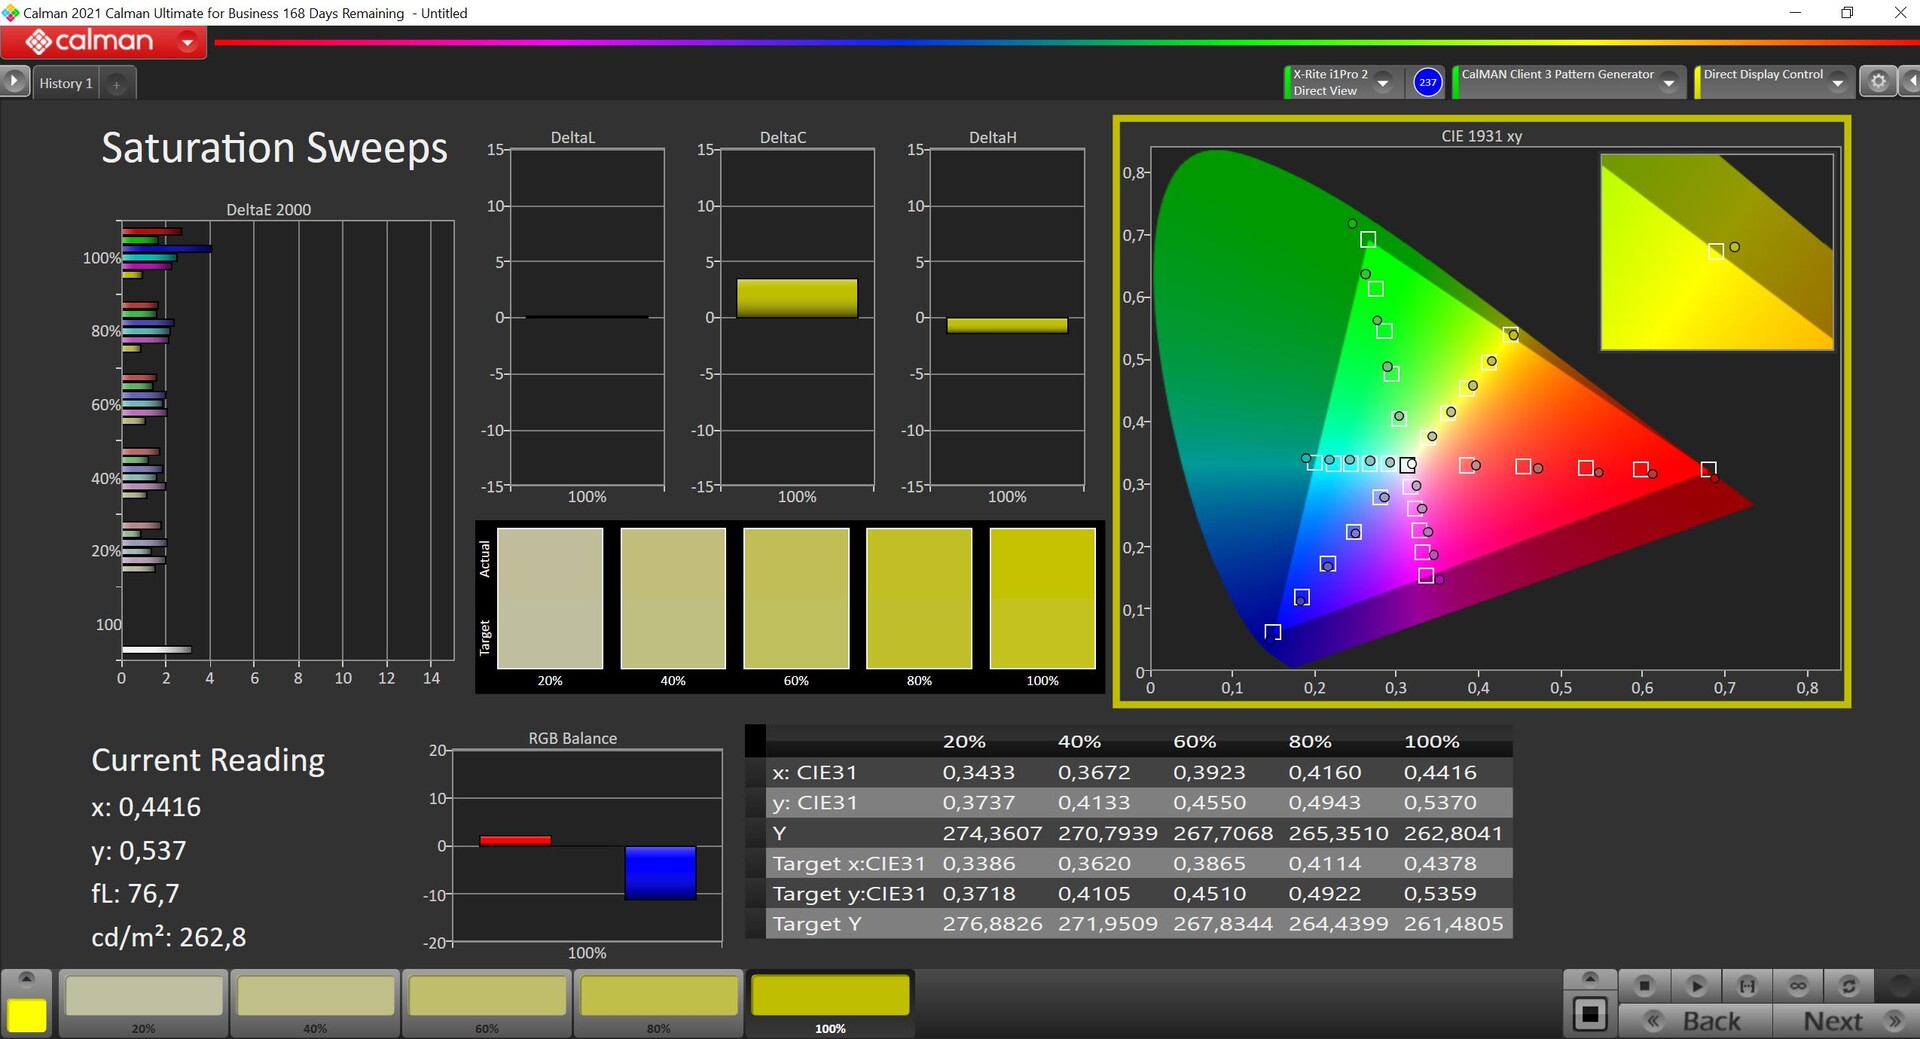
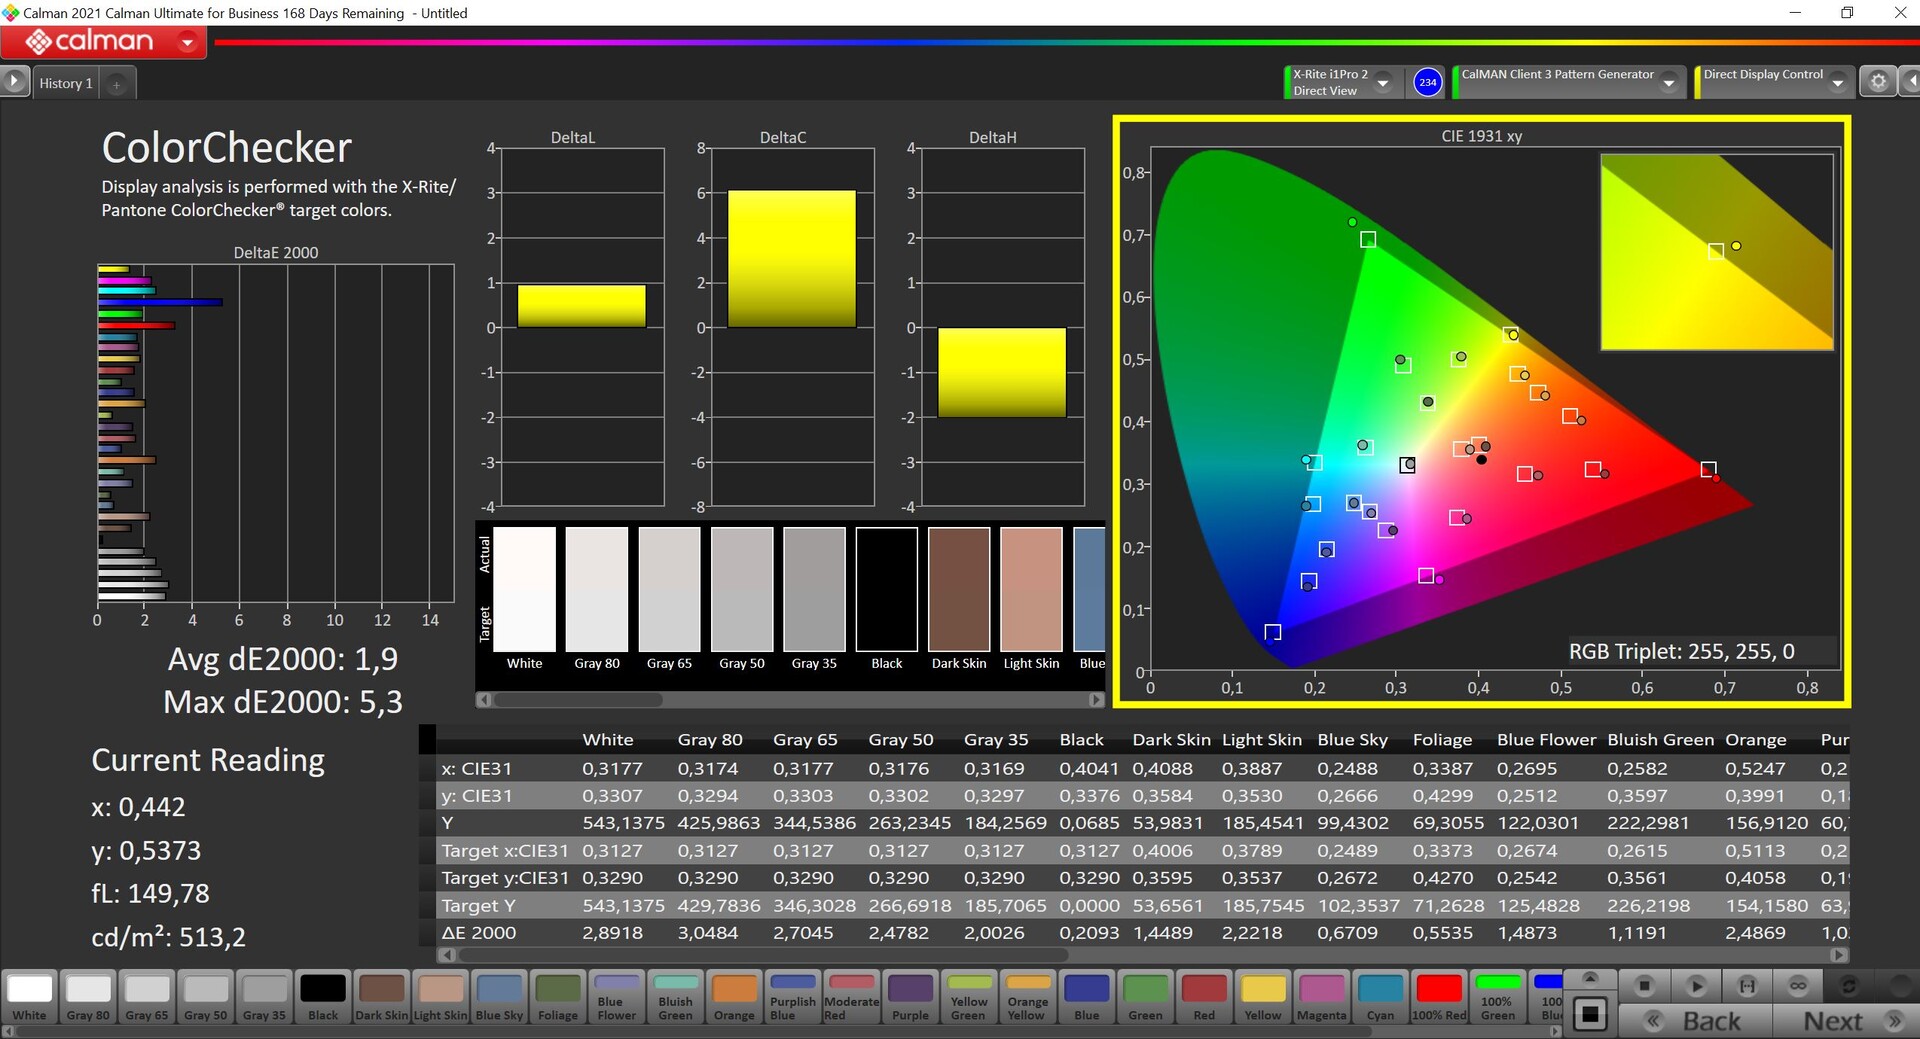
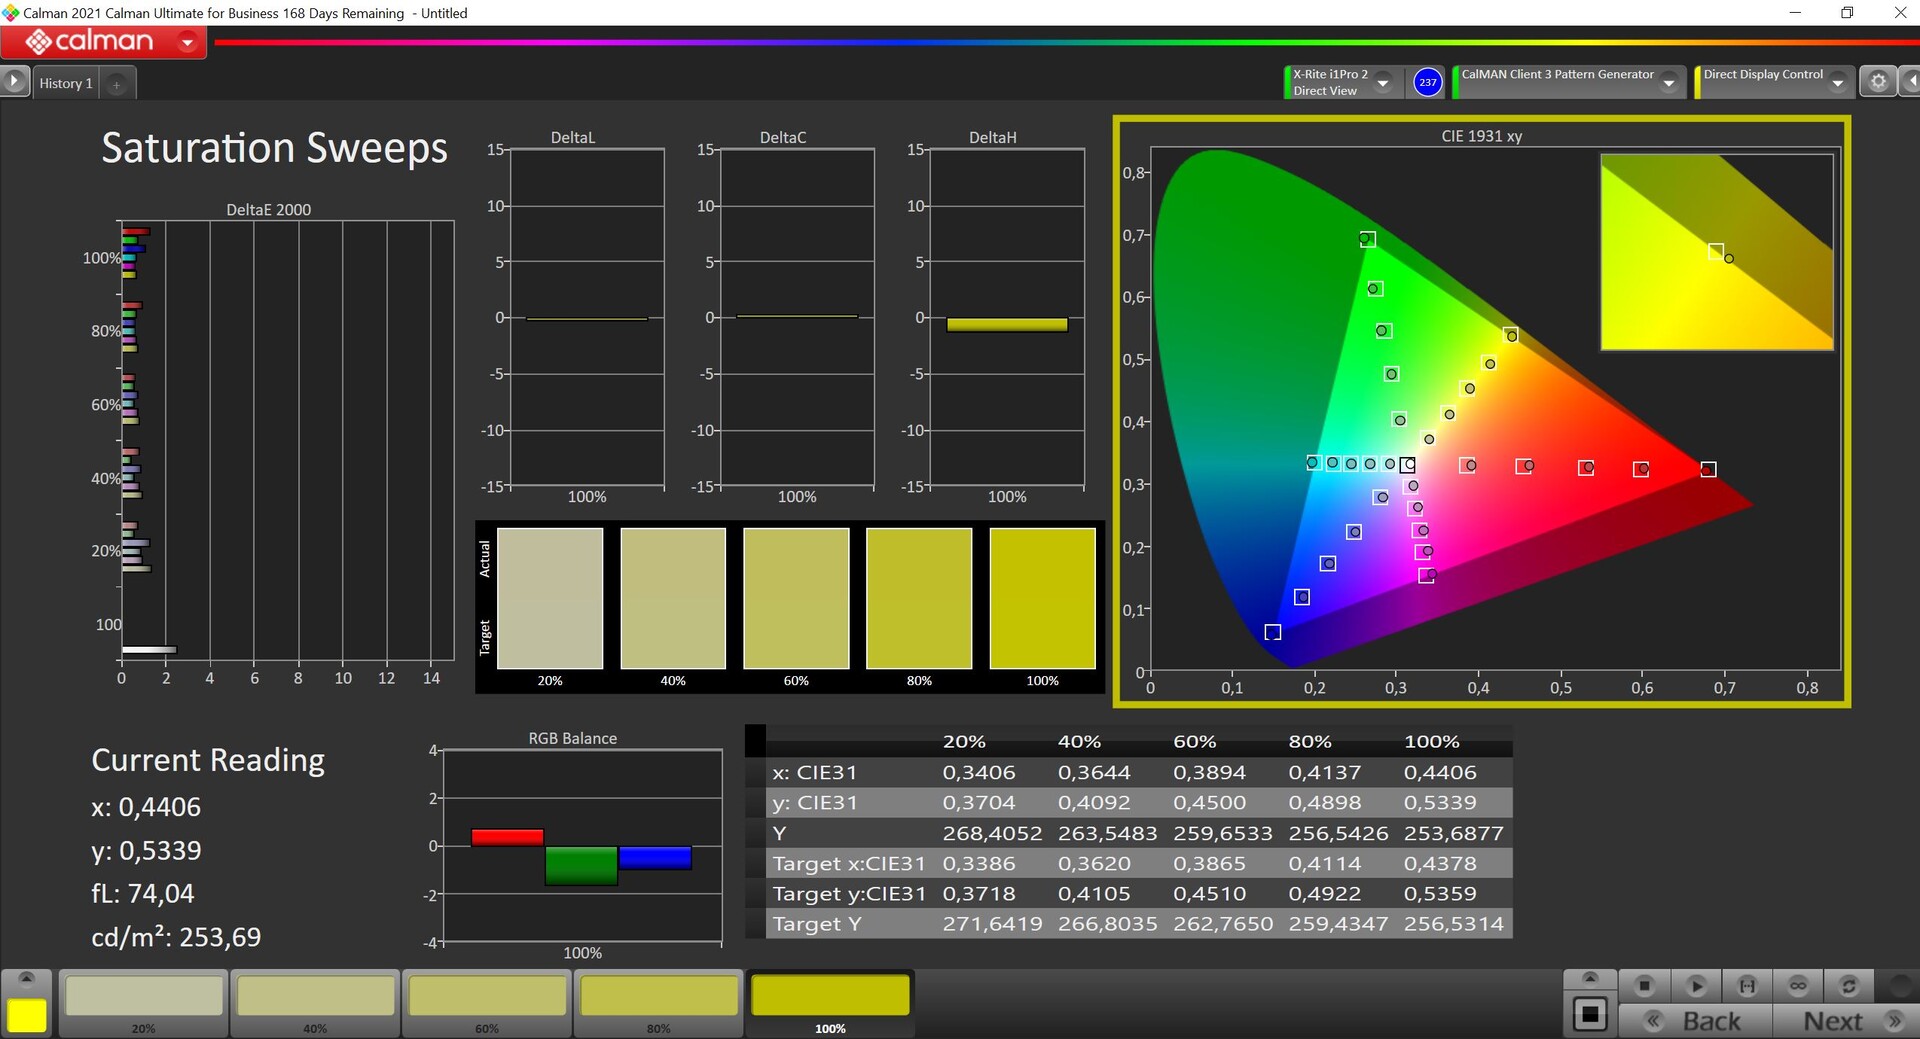
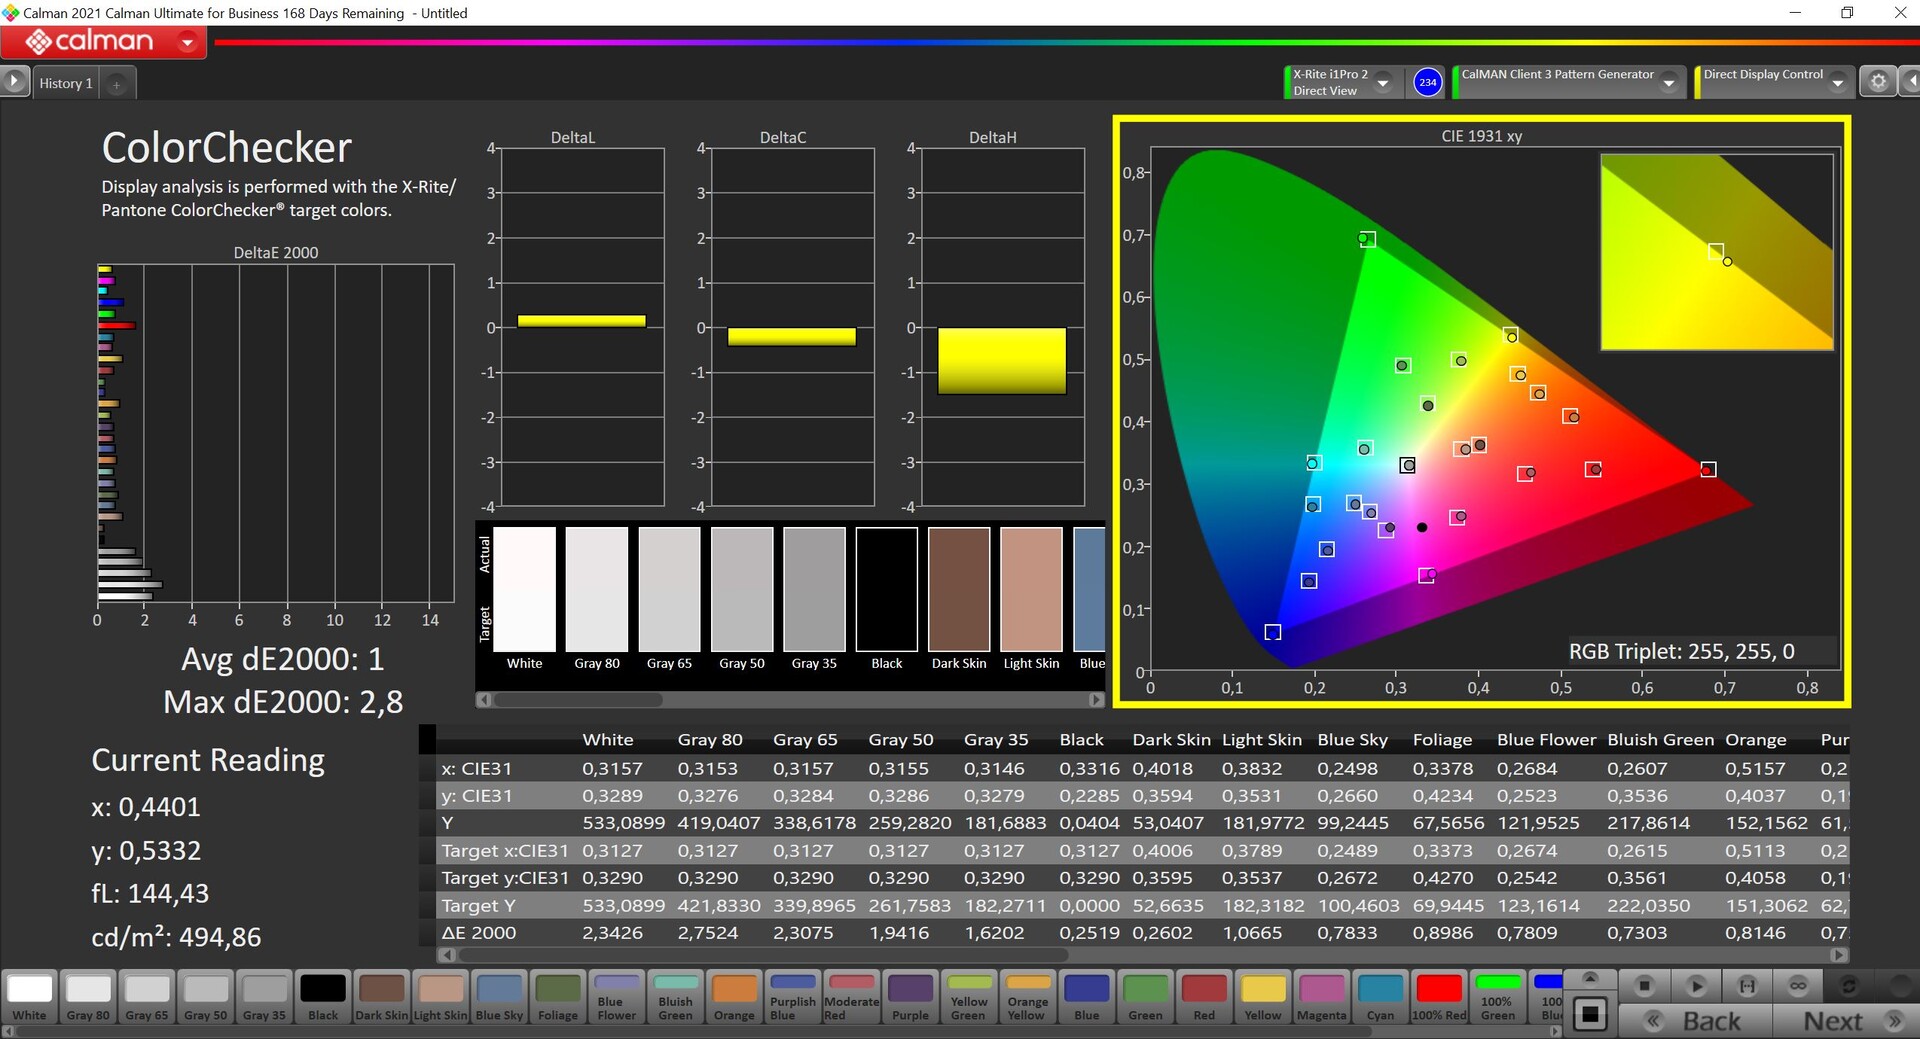
Armoury Crate软件提供了不同的颜色配置文件,默认情况下激活了本地配置文件。对于常规使用场景来说,这是一个不错的选择,颜色略微过饱和,所以画面显得更有色彩。我们还用专业的CalMAN软件(X-Rite i1 Pro 2)分析了配置文件Display P3,与P3参考值相比,它提供了非常准确的颜色,当你想编辑图片或视频时,它是一个理想的选择。还有一个sRGB配置文件。我们无法通过自己的校准来进一步提高图片质量,所以我们目前没有提供配置文件。
当你编辑图片时,你也会为软件设置从多区照明改为单区照明而感到高兴,这意味着整个图片被均匀地照亮了。然而,这对黑值和对比度有很大影响,所以我们建议在所有其他情况下采用多区模式。
Display Response Times
| ↔ Response Time Black to White | ||
|---|---|---|
| 9.9 ms ... rise ↗ and fall ↘ combined | ↗ 0.5 ms rise | 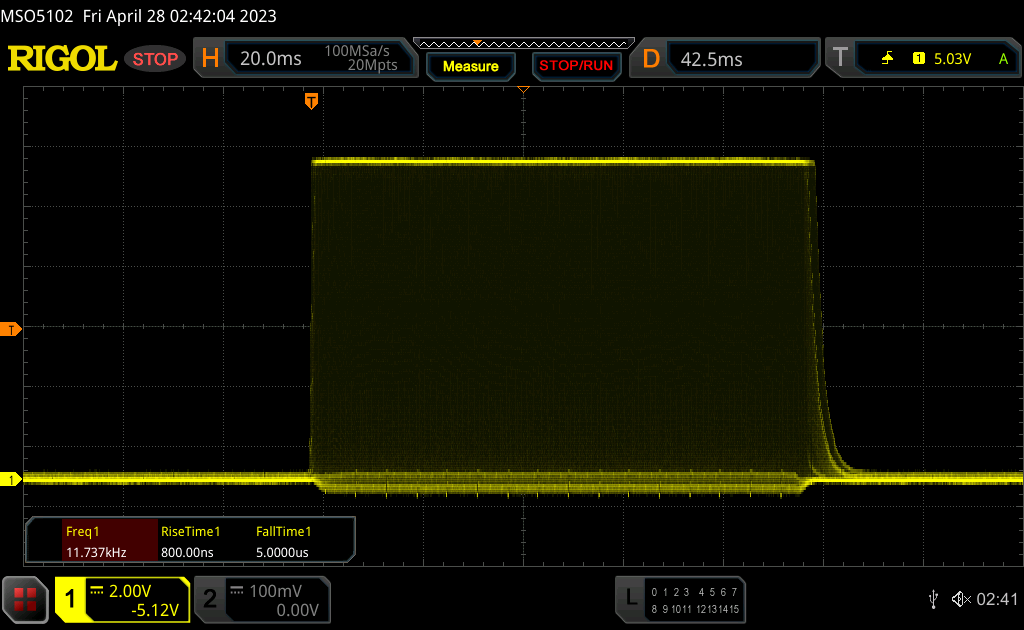 |
| ↘ 9.4 ms fall | ||
| The screen shows fast response rates in our tests and should be suited for gaming. In comparison, all tested devices range from 0.1 (minimum) to 240 (maximum) ms. » 27 % of all devices are better. This means that the measured response time is better than the average of all tested devices (19.8 ms). | ||
| ↔ Response Time 50% Grey to 80% Grey | ||
| 17.2 ms ... rise ↗ and fall ↘ combined | ↗ 7.2 ms rise | 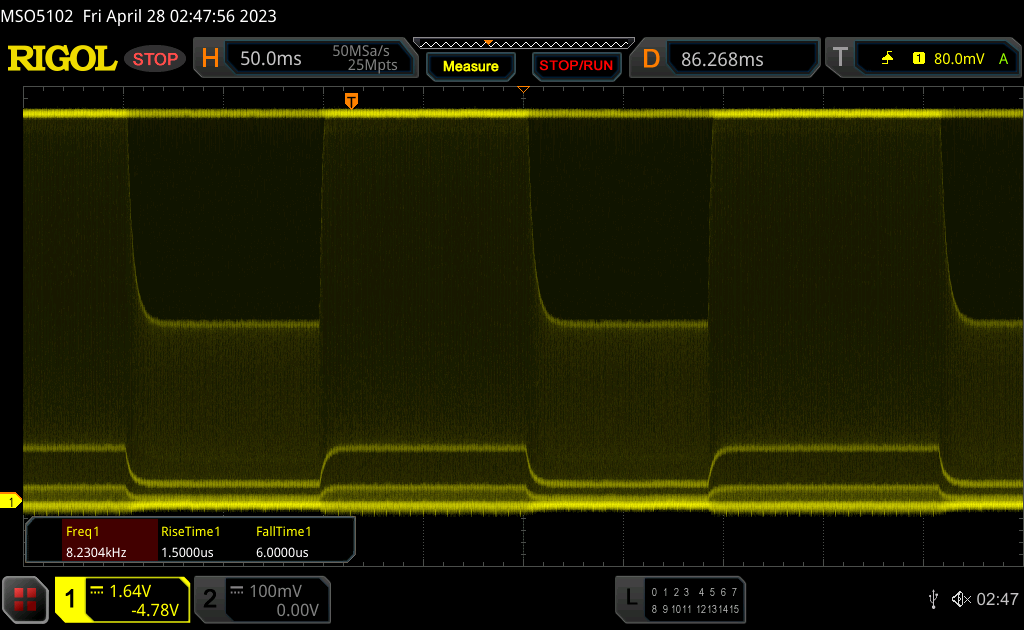 |
| ↘ 10 ms fall | ||
| The screen shows good response rates in our tests, but may be too slow for competitive gamers. In comparison, all tested devices range from 0.165 (minimum) to 636 (maximum) ms. » 31 % of all devices are better. This means that the measured response time is better than the average of all tested devices (31 ms). | ||
Screen Flickering / PWM (Pulse-Width Modulation)
| Screen flickering / PWM detected | 5430 Hz | 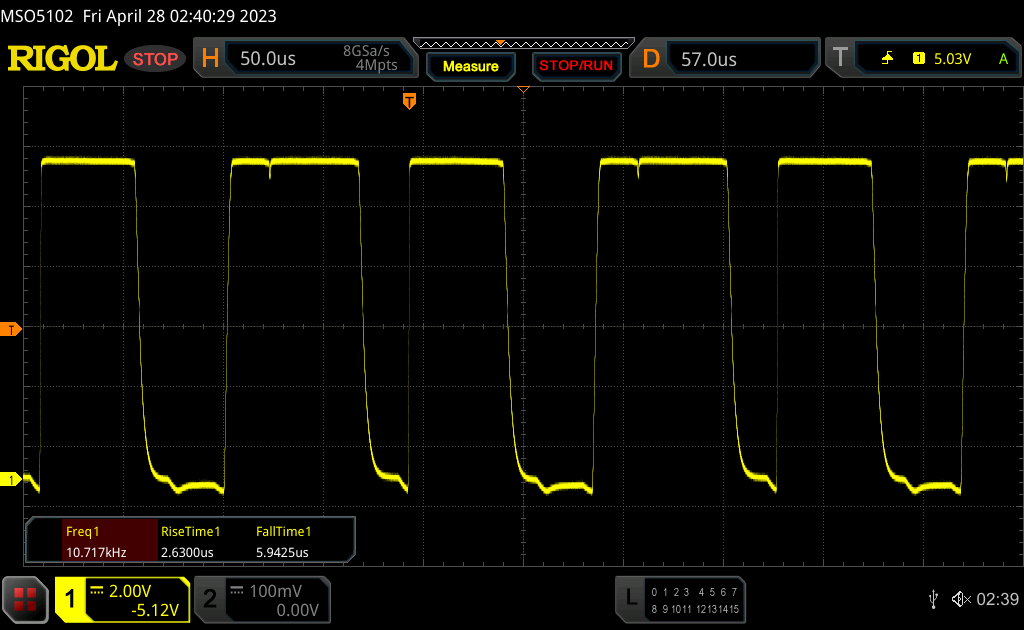 | |
The display backlight flickers at 5430 Hz (worst case, e.g., utilizing PWM) . The frequency of 5430 Hz is quite high, so most users sensitive to PWM should not notice any flickering. In comparison: 52 % of all tested devices do not use PWM to dim the display. If PWM was detected, an average of 7757 (minimum: 5 - maximum: 343500) Hz was measured. | |||
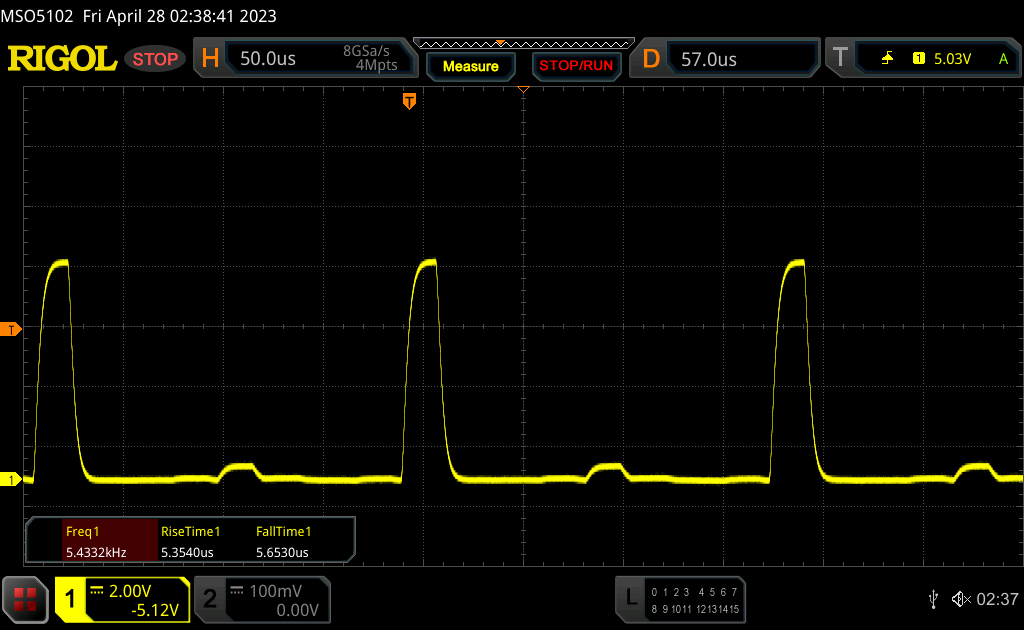
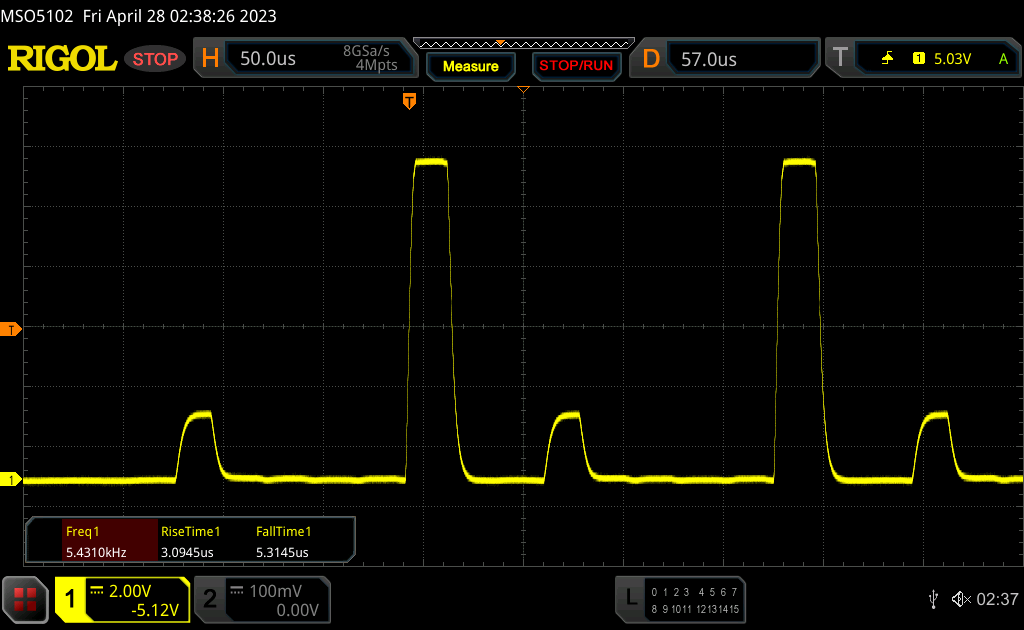
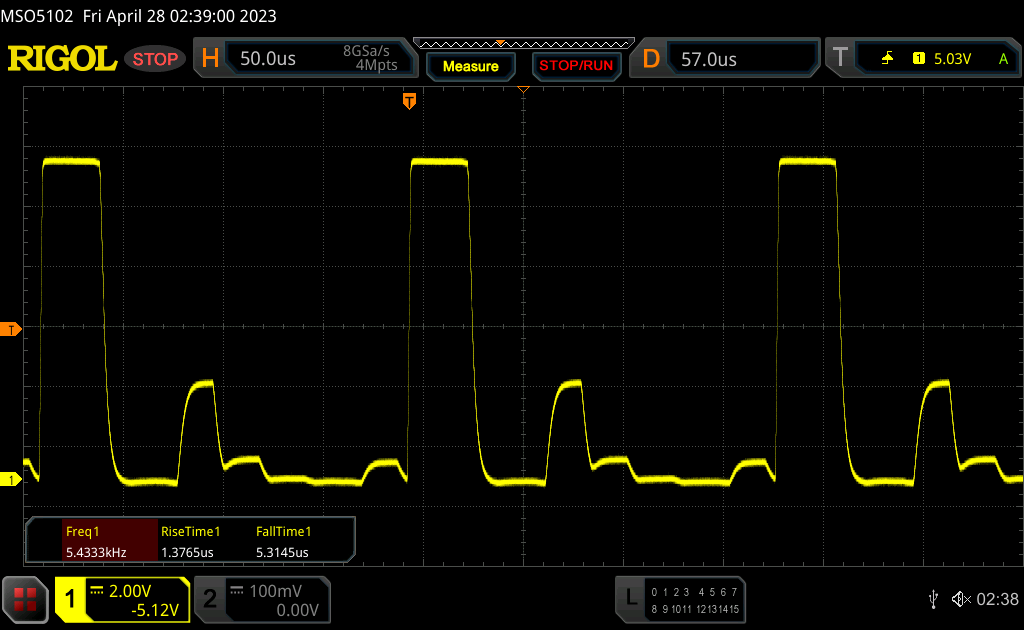
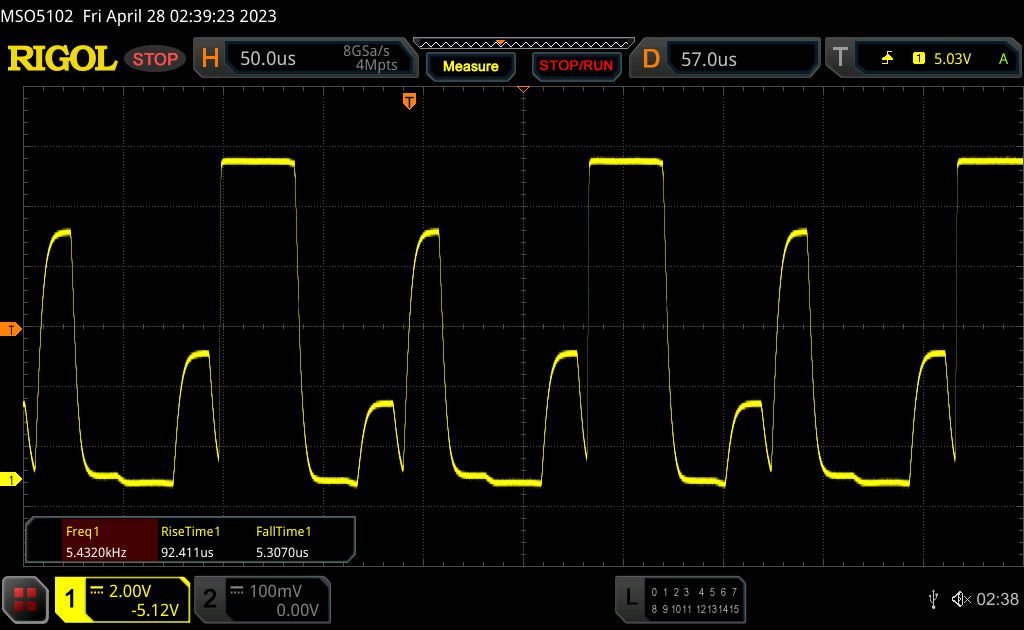
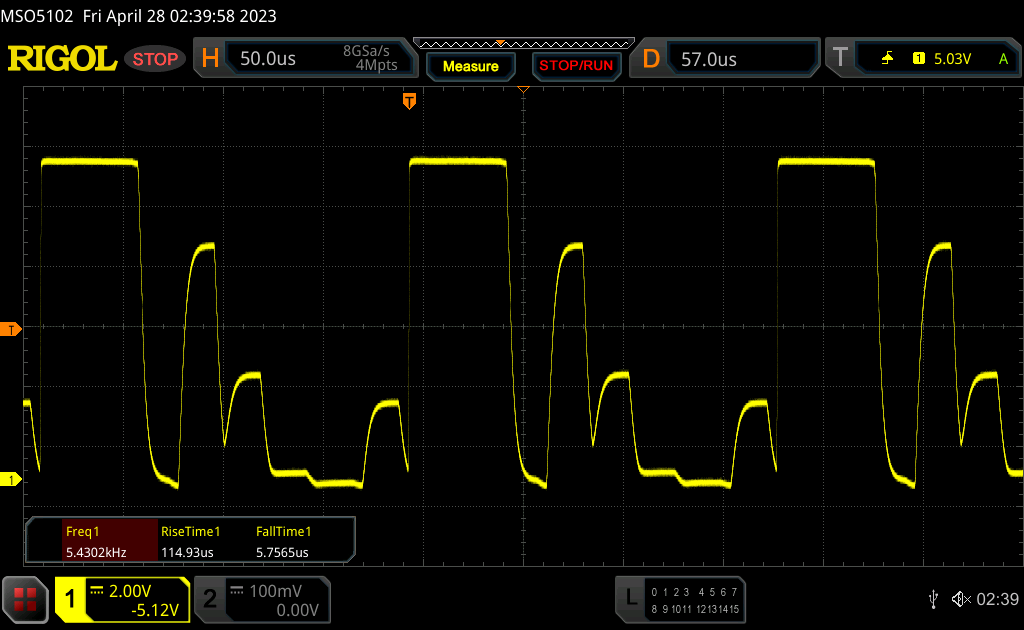
Mini-LED面板的各个调光区以5kHz的频率开启和关闭,这与典型的PWM相一致。我们可以在所有亮度水平上测量这种闪烁,但由于频率高,应该不会有任何问题。响应时间是一个更大的挑战,因为传统的方法(我们和其他行业使用的LED和OLED屏幕)不能正常工作。我们包括了我们的测量结果,但它们并不真正具有代表性,制造商宣传的是3ms。
注意:根据我们的信息,大多数制造商不能正确地确定Mini-LED面板的响应时间。相反,他们通过用传统的背光取代Mini-LED背光来测量响应时间,因为响应时间取决于面板本身而不是背光。我们将尝试在未来复制这个过程并展示结果,但我们显然不能对每一个评测单元都这样做。也可以检查我们是否已经用常规背光测试了面板本身,但对于友达光电的这款特定QHD+面板来说,情况并非如此。
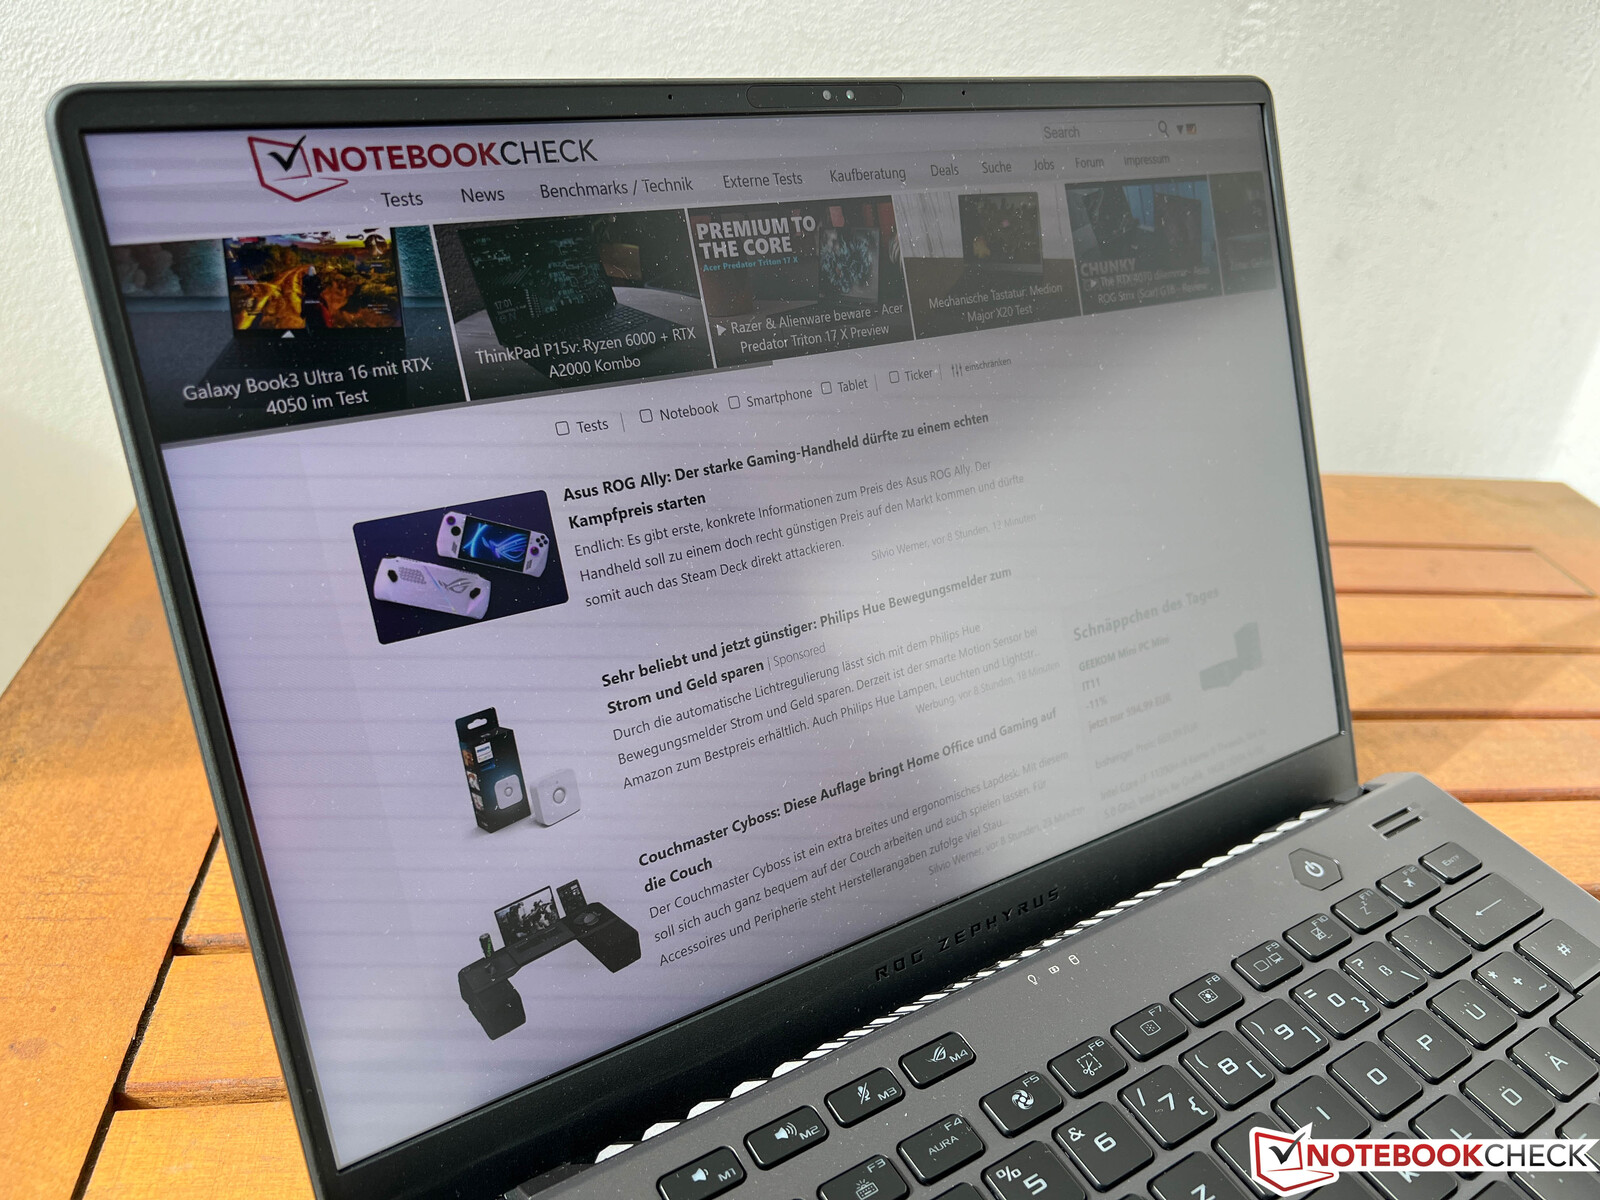
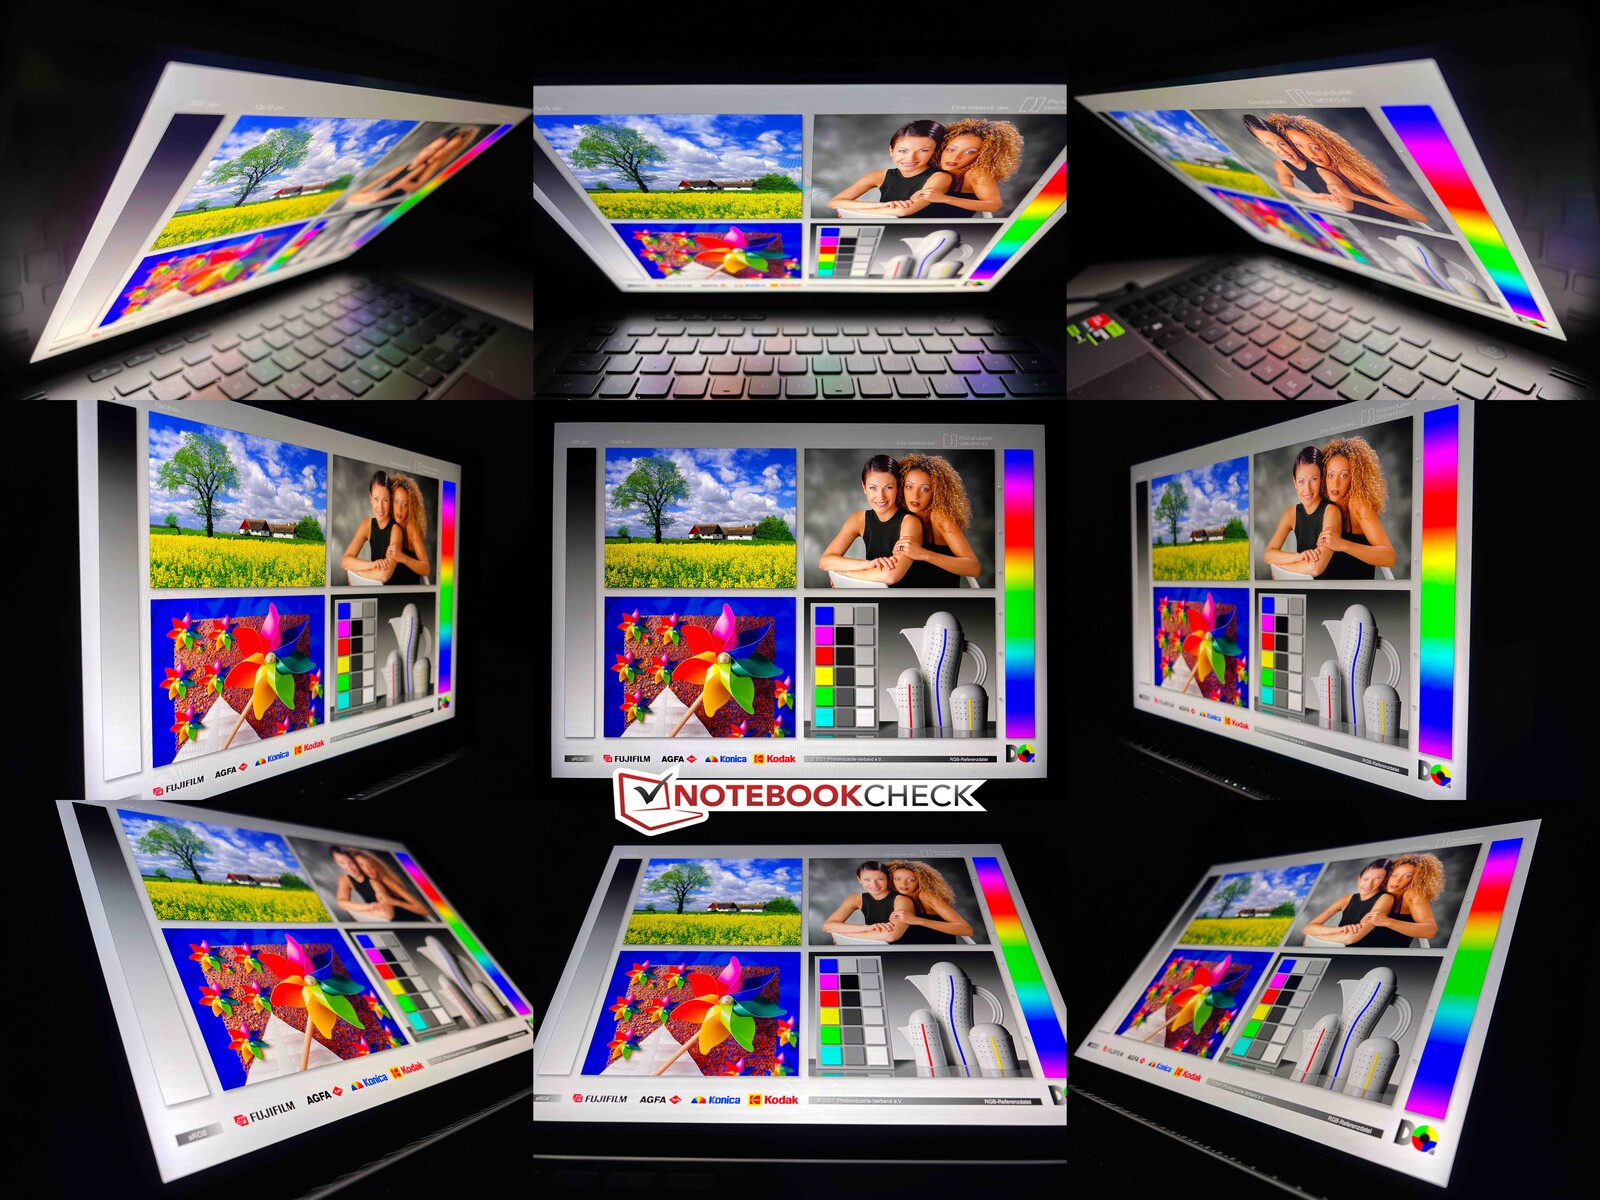
高亮度与哑光表面的结合在明亮的环境中效果很好,即使在晴天,我们也没有看到显示内容的问题。视角的稳定性也很好。
性能--Zen4 Phoenix & RTX 4090 笔记本电脑
我们的评测单元是ROG Zephyrus G14的高端SKU,配有Ryzen 9 7940HS(Zen4, 4nm, Phoenix),以及GeForce RTX 4090 笔记本电脑.你还可以将新的Zen4芯片与较小的RTX GPU结合起来,直至RTX 4060 笔记本电脑,而每次降级的价格差异约为500欧元。也有一个入门级的模型,其型号为Ryzen 7 7735HS(Zen3+, Rembrandt-R)和RTX 4050 笔记本电脑为2099欧元。我们在下面的表格中列出了不同的SKU选项。所有版本的ROG Zephyrus G14在发货时都配备了16GB的板载内存,并有一个额外的SO-DIMM插槽,最多可达48GB。
| SKU | CPU | GPU | RAM | SSD | 显示器(QHD+) | 价格 |
|---|---|---|---|---|---|---|
| GA402NU-N2010W | Ryzen 7 7735HS (Zen3+) | RTX 4050 笔记本电脑 | 16 GB | 1 TB | IPS/165 Hz/3ms | 2099欧元 |
| GA402XV-N2008W | Ryzen 9 7940HS (Zen4) | RTX 4060 笔记本电脑 | 16 GB | 1 TB | IPS/165 Hz/3ms | 2499欧元 |
| GA402XI-NC019W | Ryzen 9 7940HS (Zen4) | RTX 4070 笔记本电脑 | 32 GB | 1 TB | Mini-LED/165 Hz/3ms | 2999欧元 |
| GA402XZ-NC021W | Ryzen 9 7940HS (Zen4) | RTX 4080 笔记本电脑 | 32 GB | 1 TB | Mini-LED/165 Hz/3ms | 3499欧元 |
| GA402XY-NC020W | Ryzen 9 7940HS (Zen4) | RTX 4090 笔记本电脑 | 32 GB | 1 TB | Mini-LED/165 Hz/3ms | 3999欧元 |
审查设置
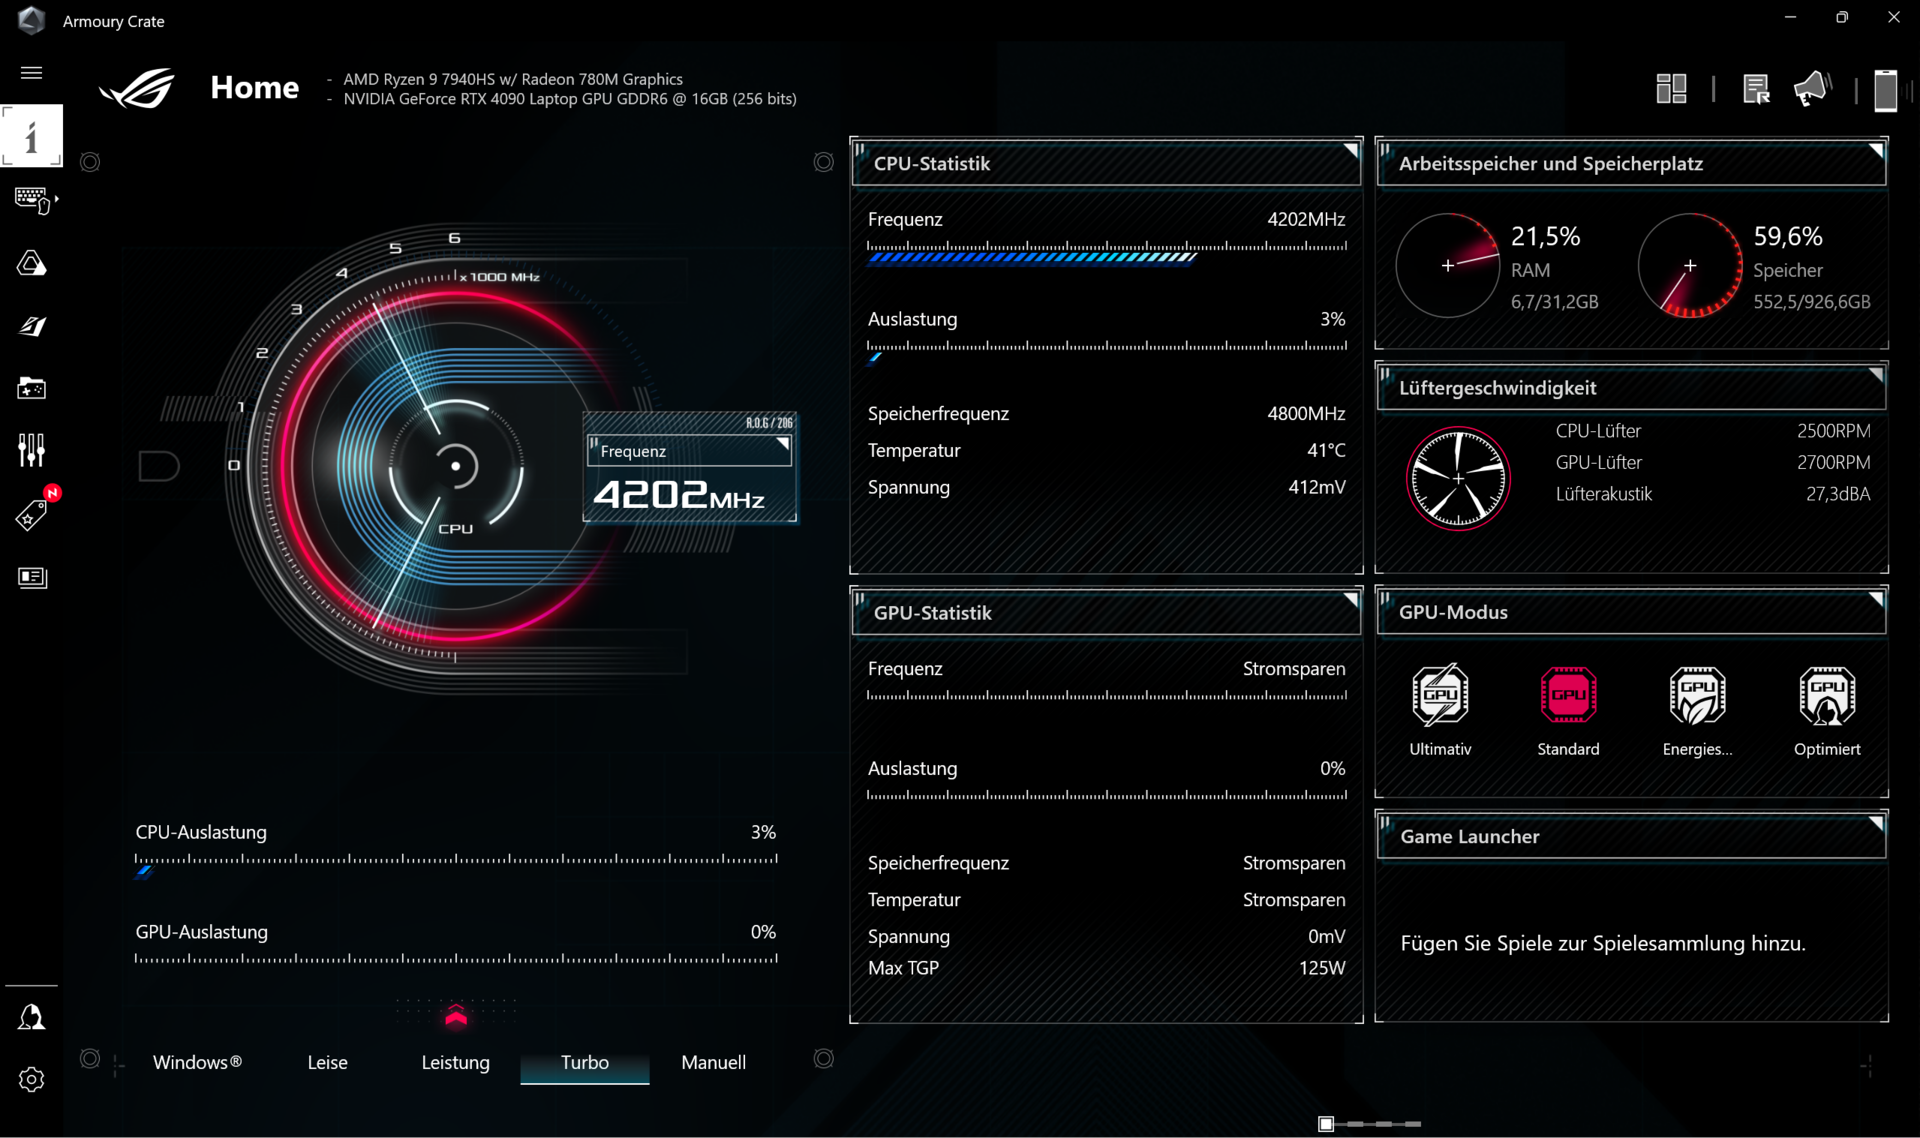
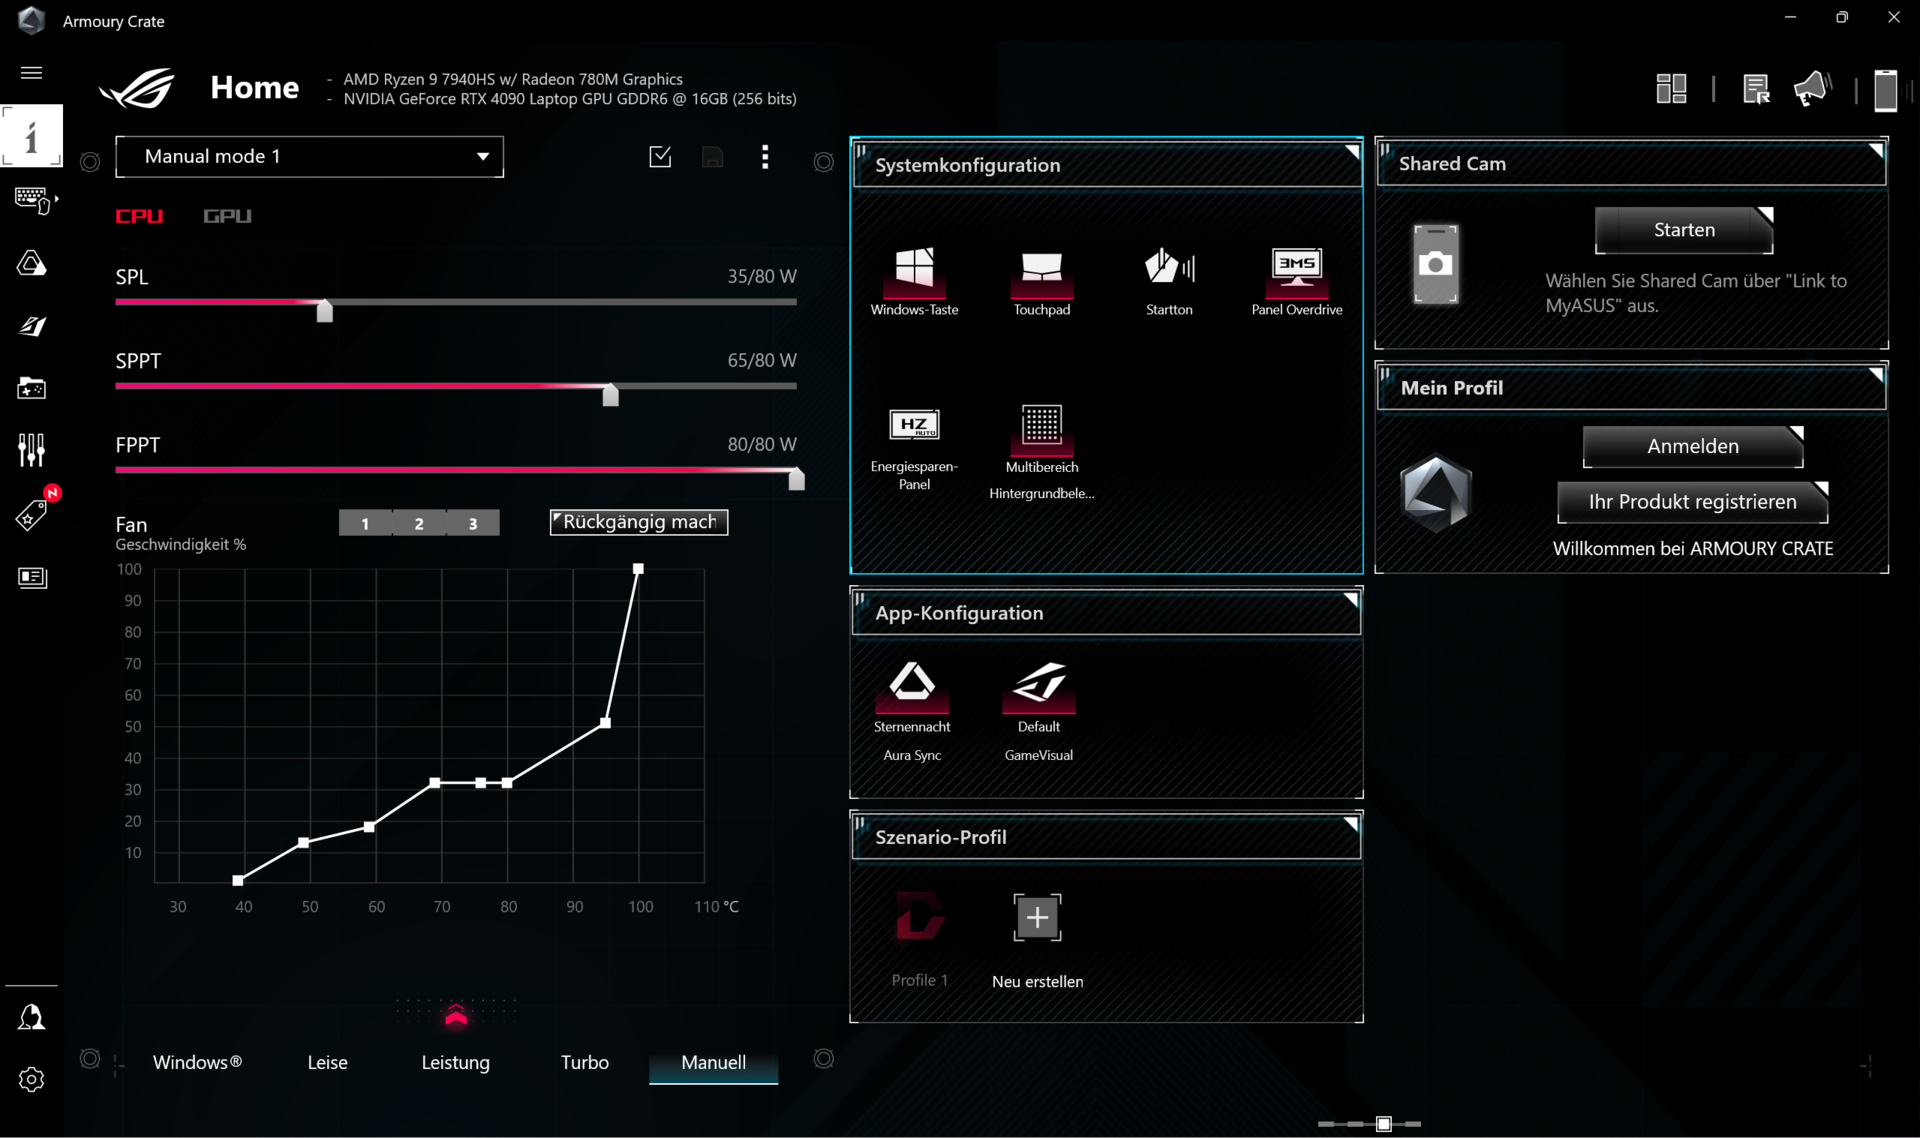
预装的Armoury Crate软件提供了不同的功率配置,还有一个手动模式,你可以在15-80瓦特的范围内调整CPU的TDP值。我们在下表中列出了电源配置文件和相应的TDP/TGP值:
| 功率概况 | CPU | GPU | 压力测试 | 风扇噪音Witcher 3 |
|---|---|---|---|---|
| 静音 | 45/65瓦 | 85瓦 | CPU: 25瓦 GPU:80 瓦特 |
39.9 dB(A) |
| 性能 | 45/65 瓦特 | 80 + 20 瓦特 | CPU:30瓦特 GPU:80 瓦特 |
46.2 dB(A) |
| Turbo | 80/80 瓦特 | 100 + 25 瓦特 | CPU:35瓦特 GPU:100 瓦特 |
52.5 dB(A) |
我们在下面的基准测试和测量中使用了Turbo模式,以获得最大的GPU性能,但你可以在日常工作中使用Silent模式,只需通过组合键Fn+F5非常舒适地切换电源配置文件。我们还将在风扇噪音部分检查其他电源配置文件的影响。涡轮模式在电池供电时不可用。
你应该习惯使用Armoury Crate软件,因为它提供了很多功能,包括GPU模式(你也可以停用Nvidia GPU)。我们在审查中使用了标准的GPU模式,并结合了Advanced Optimus。
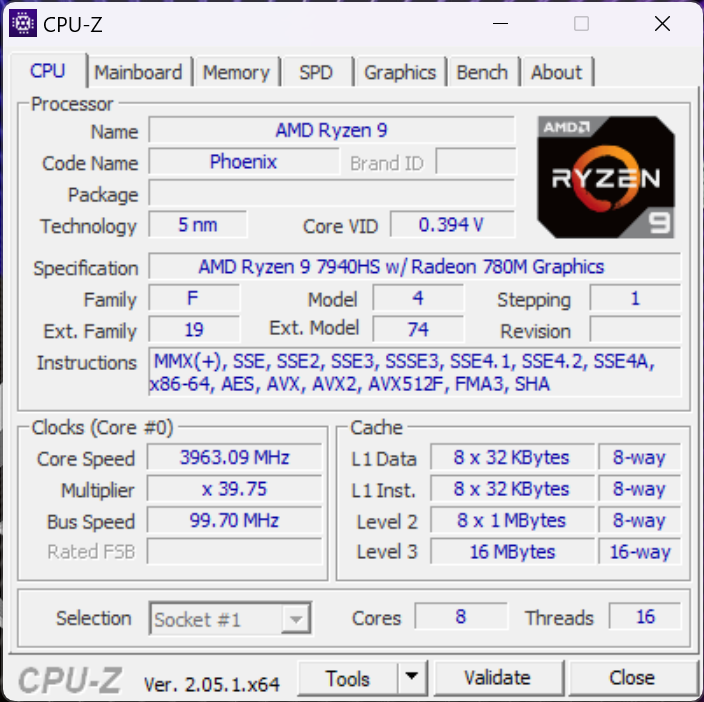
处理器 - Ryzen 9 7940HS
最后,它出现了:第一款采用4纳米Zen4核心的AMD Ryzen 7000移动处理器,代号为凤凰。我们的评论单元配备了45W HS系列的顶级型号,即Ryzen 9 7940HS.与英特尔相反,AMD没有使用混合架构,只是使用了8个成熟的Zen4核心,并支持超线程,因此CPU可以同时执行多达16个线程。该处理器在Turbo模式下的功耗为80W,可以保持这一性能水平。
与旧的Ryzen 9 6900HS相比,AMD成功地将单核性能提高了约15%。Ryzen 9 6900HS但AMD的处理器仍然比目前的英特尔芯片以及高端芯片慢一些。Ryzen 9 7945HX.
Cinebench R15 Multi Loop
在多核测试中,我们可以看到与之前的G14相比有44%的优势,新的Ryzen 9 7940HS仅被HX CPU以及快速的酷睿i9-13900H中的ROG Zephyrus M16,但英特尔芯片的消耗量也远远超过了100瓦。
总而言之,新的Zen4芯片非常有竞争力,我们将在短期内发布更详细的CPU分析,包括性能和效率基准。我们怀疑在较低的TDP值下,效率会更高。
在电池供电的情况下,CPU的功耗被限制在32瓦,这导致了约30%的性能赤字。更多的CPU基准测试可在 这里.
Cinebench R23: Multi Core | Single Core
Cinebench R20: CPU (Multi Core) | CPU (Single Core)
Cinebench R15: CPU Multi 64Bit | CPU Single 64Bit
Blender: v2.79 BMW27 CPU
7-Zip 18.03: 7z b 4 | 7z b 4 -mmt1
Geekbench 5.5: Multi-Core | Single-Core
HWBOT x265 Benchmark v2.2: 4k Preset
LibreOffice : 20 Documents To PDF
R Benchmark 2.5: Overall mean
| HWBOT x265 Benchmark v2.2 / 4k Preset | |
| Asus Zephyrus Duo 16 GX650PY-NM006W | |
| Lenovo Legion Pro 7 16IRX8H | |
| Asus ROG Strix G16 G614JZ | |
| Average of class Gaming (11.5 - 44.4, n=105, last 2 years) | |
| Asus ROG Zephyrus G14 GA402XY | |
| Asus ROG Zephyrus M16 GU604VY-NM042X | |
| Average AMD Ryzen 9 7940HS (18.5 - 22.6, n=11) | |
| Lenovo Yoga Pro 7 14IRH G8 | |
| Acer Predator Triton 300 SE | |
| Razer Blade 14 Ryzen 9 6900HX | |
| Alienware x14 i7 RTX 3060 | |
| Asus ROG Zephyrus G14 GA402RK | |
| LibreOffice / 20 Documents To PDF | |
| Asus Zephyrus Duo 16 GX650PY-NM006W | |
| Asus ROG Zephyrus M16 GU604VY-NM042X | |
| Razer Blade 14 Ryzen 9 6900HX | |
| Average of class Gaming (33.2 - 88.8, n=105, last 2 years) | |
| Asus ROG Strix G16 G614JZ | |
| Asus ROG Zephyrus G14 GA402RK | |
| Lenovo Yoga Pro 7 14IRH G8 | |
| Average AMD Ryzen 9 7940HS (36.9 - 54.8, n=12) | |
| Lenovo Legion Pro 7 16IRX8H | |
| Acer Predator Triton 300 SE | |
| Alienware x14 i7 RTX 3060 | |
| Asus ROG Zephyrus G14 GA402XY | |
| R Benchmark 2.5 / Overall mean | |
| Razer Blade 14 Ryzen 9 6900HX | |
| Asus ROG Zephyrus G14 GA402RK | |
| Alienware x14 i7 RTX 3060 | |
| Lenovo Yoga Pro 7 14IRH G8 | |
| Average AMD Ryzen 9 7940HS (0.4159 - 0.4467, n=12) | |
| Acer Predator Triton 300 SE | |
| Average of class Gaming (0.3439 - 0.759, n=106, last 2 years) | |
| Asus ROG Zephyrus G14 GA402XY | |
| Asus ROG Zephyrus M16 GU604VY-NM042X | |
| Asus Zephyrus Duo 16 GX650PY-NM006W | |
| Lenovo Legion Pro 7 16IRX8H | |
| Asus ROG Strix G16 G614JZ | |
* ... smaller is better
系统性能
系统性能很好,所有的输入都能无延迟地执行。合成基准测试结果也很好,但我们现在不能提供AIDA的任何结果,因为该应用程序反复导致崩溃。我们已经在与制造商联系,以找到一个解决方案。然而,除此之外,我们在审查期间没有发现任何问题。
CrossMark: Overall | Productivity | Creativity | Responsiveness
| PCMark 10 / Score | |
| Average of class Gaming (5828 - 12414, n=93, last 2 years) | |
| Asus ROG Zephyrus M16 GU604VY-NM042X | |
| Asus ROG Zephyrus G14 GA402XY | |
| Average AMD Ryzen 9 7940HS, NVIDIA GeForce RTX 4090 Laptop GPU (n=1) | |
| Lenovo Legion Pro 7 16IRX8H | |
| Asus ROG Zephyrus G14 GA402RK | |
| Acer Predator Triton 300 SE | |
| Razer Blade 14 Ryzen 9 6900HX | |
| Lenovo Yoga Pro 7 14IRH G8 | |
| Alienware x14 i7 RTX 3060 | |
| PCMark 10 / Essentials | |
| Lenovo Legion Pro 7 16IRX8H | |
| Asus ROG Zephyrus M16 GU604VY-NM042X | |
| Acer Predator Triton 300 SE | |
| Razer Blade 14 Ryzen 9 6900HX | |
| Asus ROG Zephyrus G14 GA402RK | |
| Lenovo Yoga Pro 7 14IRH G8 | |
| Average of class Gaming (8810 - 11935, n=97, last 2 years) | |
| Asus ROG Zephyrus G14 GA402XY | |
| Average AMD Ryzen 9 7940HS, NVIDIA GeForce RTX 4090 Laptop GPU (n=1) | |
| Alienware x14 i7 RTX 3060 | |
| PCMark 10 / Productivity | |
| Average of class Gaming (6845 - 25323, n=95, last 2 years) | |
| Asus ROG Zephyrus M16 GU604VY-NM042X | |
| Lenovo Legion Pro 7 16IRX8H | |
| Asus ROG Zephyrus G14 GA402XY | |
| Average AMD Ryzen 9 7940HS, NVIDIA GeForce RTX 4090 Laptop GPU (n=1) | |
| Acer Predator Triton 300 SE | |
| Asus ROG Zephyrus G14 GA402RK | |
| Alienware x14 i7 RTX 3060 | |
| Lenovo Yoga Pro 7 14IRH G8 | |
| Razer Blade 14 Ryzen 9 6900HX | |
| PCMark 10 / Digital Content Creation | |
| Average of class Gaming (7602 - 19954, n=95, last 2 years) | |
| Asus ROG Zephyrus G14 GA402XY | |
| Average AMD Ryzen 9 7940HS, NVIDIA GeForce RTX 4090 Laptop GPU (n=1) | |
| Asus ROG Zephyrus M16 GU604VY-NM042X | |
| Asus ROG Zephyrus G14 GA402RK | |
| Razer Blade 14 Ryzen 9 6900HX | |
| Acer Predator Triton 300 SE | |
| Lenovo Yoga Pro 7 14IRH G8 | |
| Lenovo Legion Pro 7 16IRX8H | |
| Alienware x14 i7 RTX 3060 | |
| CrossMark / Overall | |
| Average of class Gaming (1366 - 2409, n=94, last 2 years) | |
| Asus ROG Zephyrus M16 GU604VY-NM042X | |
| Acer Predator Triton 300 SE | |
| Alienware x14 i7 RTX 3060 | |
| Asus ROG Zephyrus G14 GA402XY | |
| Average AMD Ryzen 9 7940HS, NVIDIA GeForce RTX 4090 Laptop GPU (n=1) | |
| Apple MacBook Pro 14 2023 M2 Pro | |
| Lenovo Yoga Pro 7 14IRH G8 | |
| CrossMark / Productivity | |
| Acer Predator Triton 300 SE | |
| Average of class Gaming (1386 - 2254, n=94, last 2 years) | |
| Asus ROG Zephyrus M16 GU604VY-NM042X | |
| Alienware x14 i7 RTX 3060 | |
| Asus ROG Zephyrus G14 GA402XY | |
| Average AMD Ryzen 9 7940HS, NVIDIA GeForce RTX 4090 Laptop GPU (n=1) | |
| Lenovo Yoga Pro 7 14IRH G8 | |
| Apple MacBook Pro 14 2023 M2 Pro | |
| CrossMark / Creativity | |
| Apple MacBook Pro 14 2023 M2 Pro | |
| Average of class Gaming (1343 - 2786, n=94, last 2 years) | |
| Asus ROG Zephyrus M16 GU604VY-NM042X | |
| Acer Predator Triton 300 SE | |
| Asus ROG Zephyrus G14 GA402XY | |
| Average AMD Ryzen 9 7940HS, NVIDIA GeForce RTX 4090 Laptop GPU (n=1) | |
| Alienware x14 i7 RTX 3060 | |
| Lenovo Yoga Pro 7 14IRH G8 | |
| CrossMark / Responsiveness | |
| Acer Predator Triton 300 SE | |
| Alienware x14 i7 RTX 3060 | |
| Average of class Gaming (1226 - 2334, n=94, last 2 years) | |
| Asus ROG Zephyrus M16 GU604VY-NM042X | |
| Asus ROG Zephyrus G14 GA402XY | |
| Average AMD Ryzen 9 7940HS, NVIDIA GeForce RTX 4090 Laptop GPU (n=1) | |
| Lenovo Yoga Pro 7 14IRH G8 | |
| Apple MacBook Pro 14 2023 M2 Pro | |
| PCMark 10 Score | 8253 points | |
Help | ||
我们还对Photoshop和Premiere Pro这两个Adobe应用程序进行了PugetBench测试。G14在Adobe Photoshop中的表现非常好,可以跟上强大的(和更大的)对手,但在Premiere Pro中的表现却有所下降。我们还包括在DaVinci Resolve上从6K RAW源文件导出视频(4K H.264)时的性能:
| 设备 | 输出时间 |
|---|---|
| 华硕ROG Zephyrus G14 (Ryzen 9, 7940HS) | 5:26 分钟 |
| 联想Legion 7 (Core i9-13900HX, RTX 4090) | 4:54 分钟 |
| 华硕ROG Flow X16 (Core i9-13900H, RTX 4060) | 6:42分钟 |
| 微星 Stealth 14 Studio (Core i7-13700H, RTX 4050) | 7:50 分钟 |
| 华硕ROG Scar 17 SE (Ryzen 9 7945HX, RTX 4090) | 4:37分钟 |
| 华硕ROG Scar G16 (Core i9-13980HX, RTX 4080) | 5:32分钟 |
| Premiere Pro PugetBench - Overall Score 0.9 | |
| MSI Stealth 17 Studio A13VH-014 | |
| Asus Zephyrus Duo 16 GX650PY-NM006W | |
| MSI Titan GT77 HX 13VI | |
| Apple MacBook Pro 14 2023 M2 Pro | |
| Asus ROG Zephyrus G14 GA402XY | |
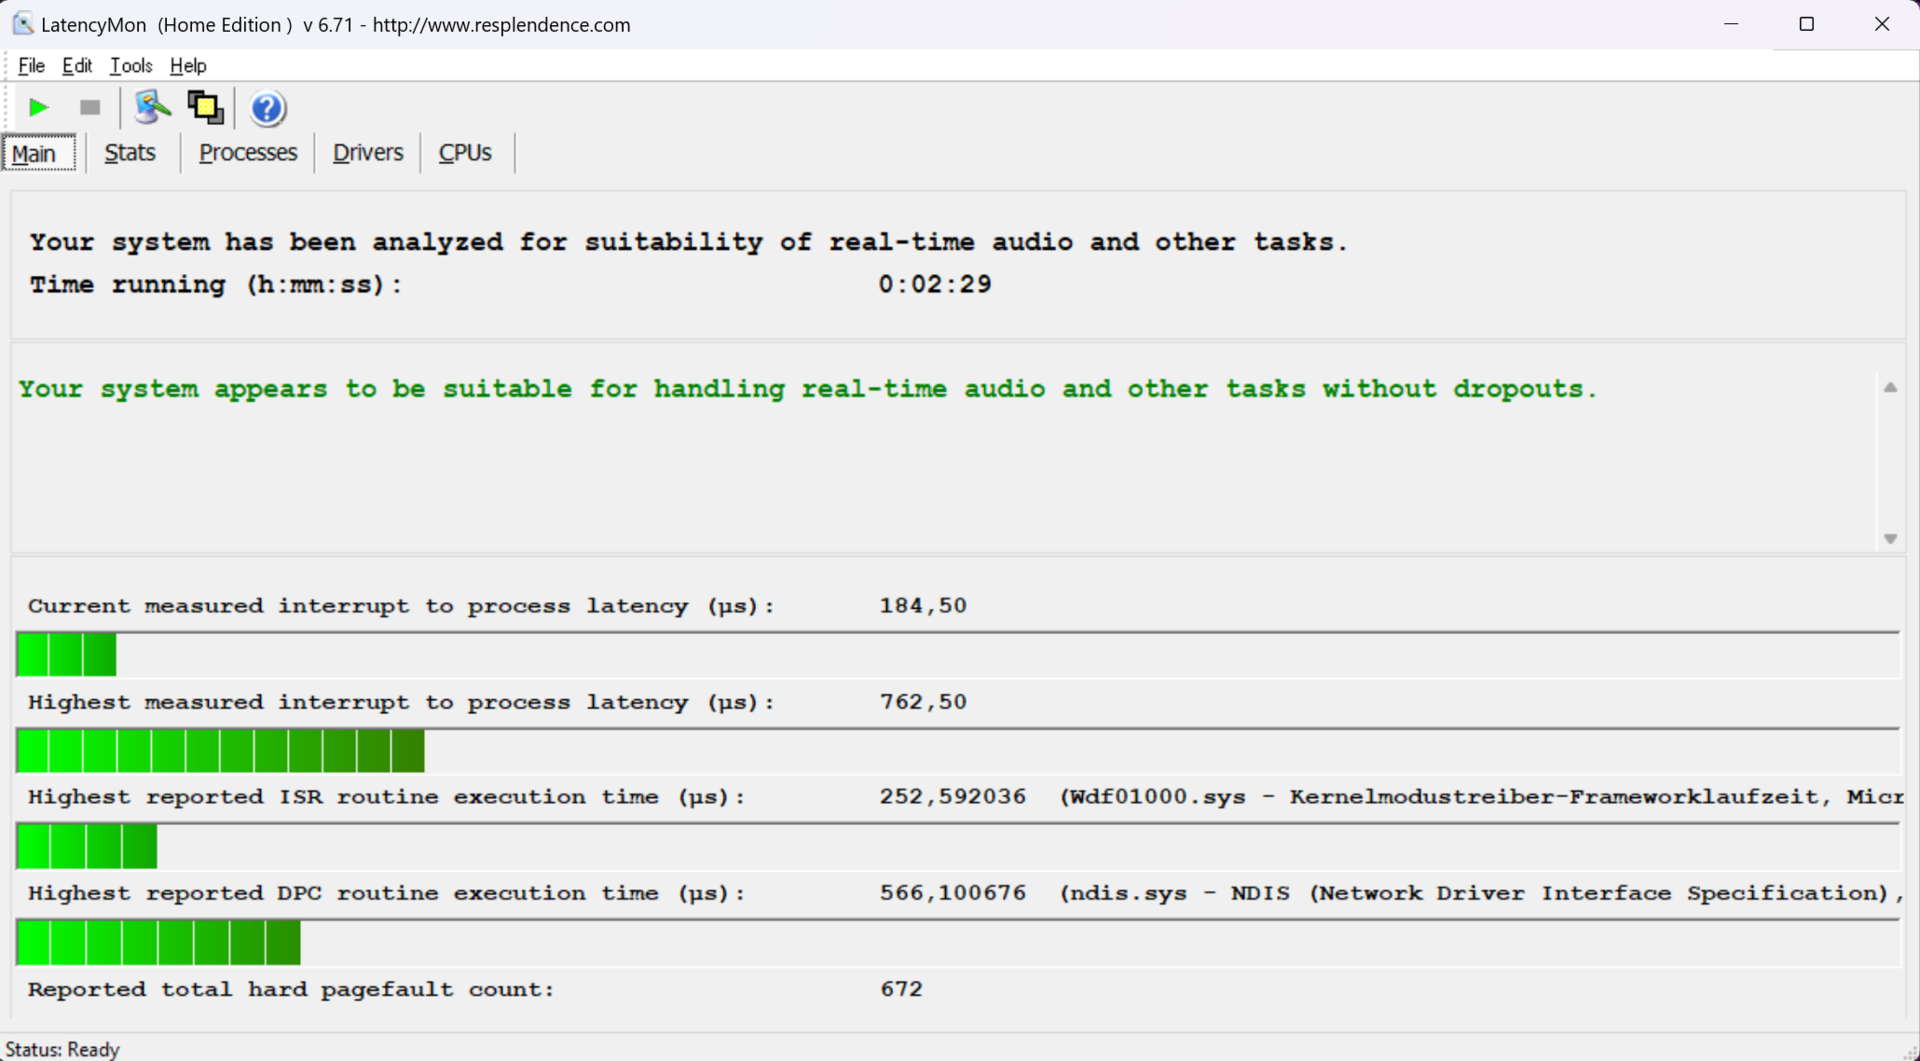
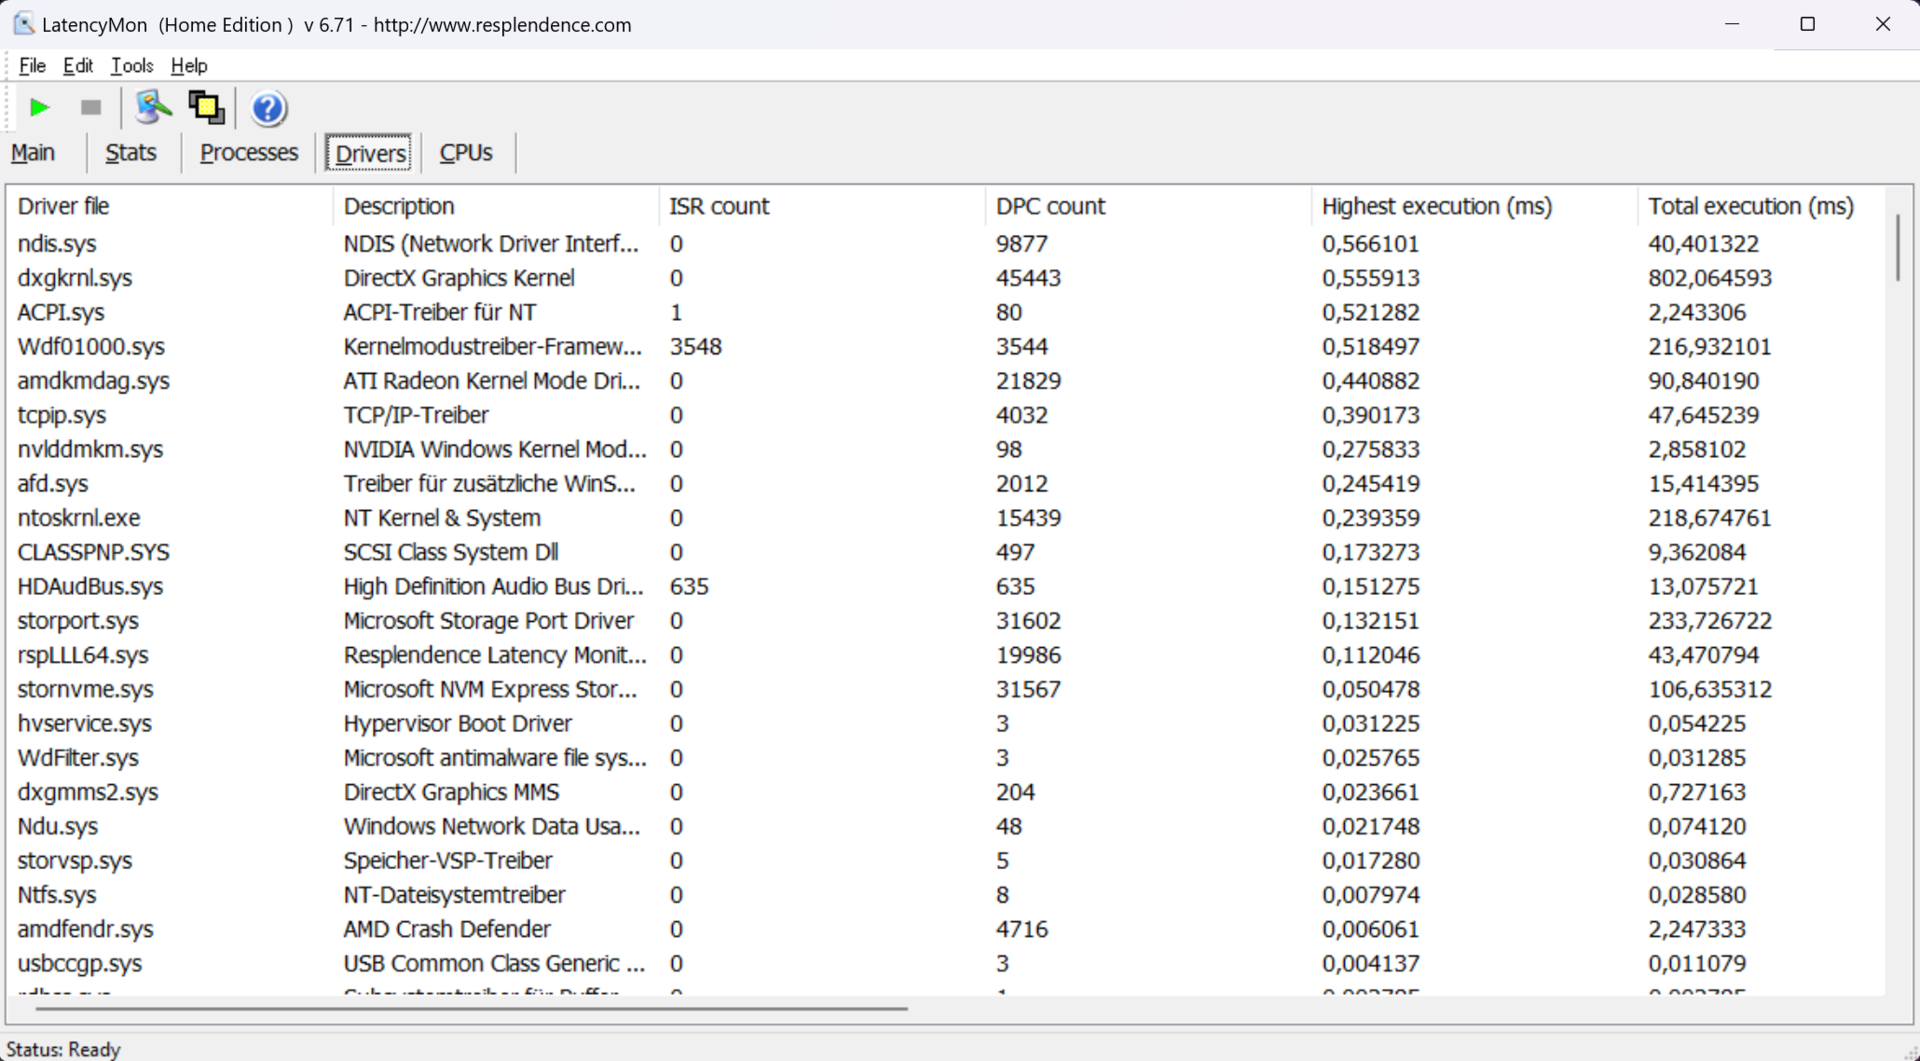
DPC-Latency
在我们的标准化延迟测试中(网页浏览、4K YouTube视频播放、CPU负载),评测单位没有显示任何限制,因此它适合实时音频应用。
| DPC Latencies / LatencyMon - interrupt to process latency (max), Web, Youtube, Prime95 | |
| Asus ROG Zephyrus G14 GA402RK | |
| Acer Predator Triton 300 SE | |
| Razer Blade 14 Ryzen 9 6900HX | |
| Alienware x14 i7 RTX 3060 | |
| Asus ROG Zephyrus G14 GA402XY | |
* ... smaller is better
存储设备
2023年的ROG G14再次提供一个M.2-2280插槽,通过PCI-4.0接口连接。我们的评测单元配备了1TB版本的三星PM9A1(980 Pro的OEM版本),整体性能非常好。在持续负载的情况下,性能也非常稳定,这对现代笔记本电脑来说并不是一个问题。开箱后,你可以为自己的文件和应用程序提供865GB。更多的SSD基准测试被列在 这里.

* ... smaller is better
Disk Throttling: DiskSpd Read Loop, Queue Depth 8
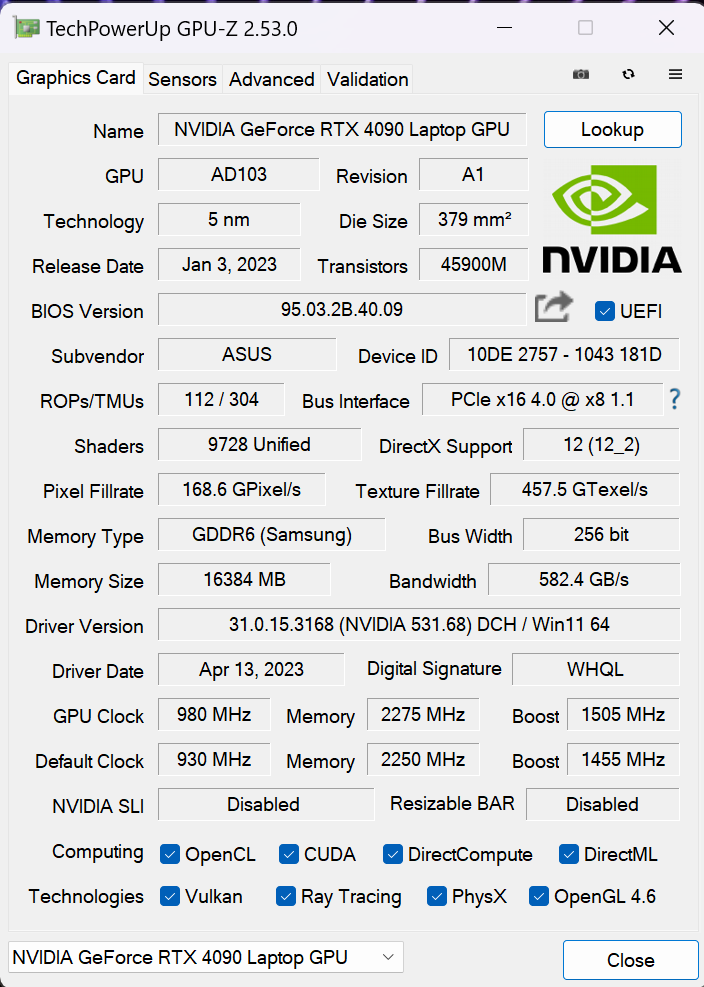
GPU性能 - RTX 4090 笔记本电脑
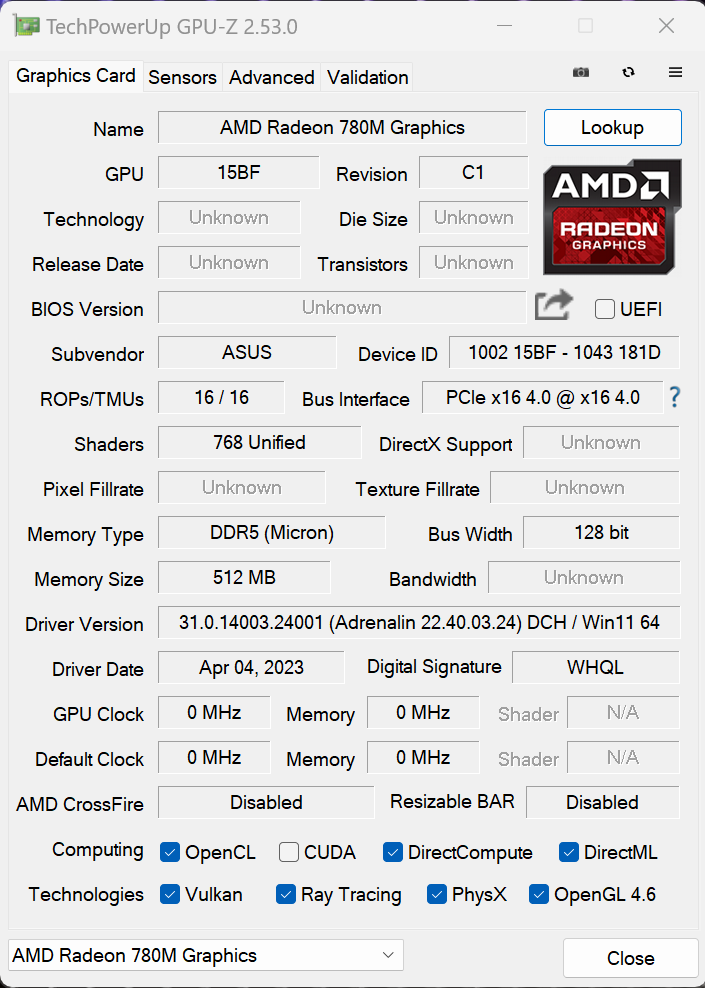
AMD处理器配备了新的iGPURadeon 780M,它可以处理日常情况下的图形输出。我们将在不久之后的专门文章中对新的iGPU进行详细介绍。Zephyrus G14支持高级优化技术,因此,系统无需重新启动就能切断iGPU。这是一个舒适的解决方案,以确保最大的GPU性能和不浪费任何电力用于所有其他任务。自动切换工作可靠,但当系统切换到dGPU时(例如,当你启动一个游戏时),会有一个小的停顿(1-2秒)。如果你不喜欢这种行为,你也可以切换到Nvidia控制面板中的 "Optimus "设置,这意味着iGPU不会被规避。
该RTX 4090 笔记本电脑带有16GB VRAM,在Turbo模式下可消耗125瓦(100W TGP + 25W Dynamic Boost),所以它不是市场上最快的RTX 4090。然而,审查单位的GPU仍然表现得非常好,我们数据库中的平均RTX 4090笔记本电脑只是快了15%。你现在不会找到一个更强大的14英寸设备。与之前的ROG Zephyrus G14与Radeon RX 6800S相比,新版本在基准测试中要快65%。
在较长的工作负荷中,GPU的性能是完全稳定的(Time Spy 压力测试:99.1%),但在电池电量方面的性能要低得多。GPU在电池上只能消耗55W,这导致约52%的性能下降。更多的GPU基准测试可在 这里.
| 3DMark 11 Performance | 41745 points | |
| 3DMark Fire Strike Score | 34720 points | |
| 3DMark Time Spy Score | 16719 points | |
| 3DMark Steel Nomad Score | 3966 points | |
Help | ||
| Blender / v3.3 Classroom OPTIX/RTX | |
| Acer Predator Triton 300 SE | |
| Lenovo Yoga Pro 7 14IRH G8 | |
| Average of class Gaming (9 - 32, n=106, last 2 years) | |
| Asus ROG Zephyrus M16 GU604VY-NM042X | |
| Lenovo Legion Pro 7 16IRX8H | |
| Asus ROG Strix G16 G614JZ | |
| Asus Zephyrus Duo 16 GX650PY-NM006W | |
| Asus ROG Zephyrus G14 GA402XY | |
| Average NVIDIA GeForce RTX 4090 Laptop GPU (9 - 19, n=39) | |
| Blender / v3.3 Classroom CUDA | |
| Acer Predator Triton 300 SE | |
| Lenovo Yoga Pro 7 14IRH G8 | |
| Average of class Gaming (15 - 228, n=106, last 2 years) | |
| Lenovo Legion Pro 7 16IRX8H | |
| Asus ROG Zephyrus G14 GA402XY | |
| Asus ROG Strix G16 G614JZ | |
| Asus Zephyrus Duo 16 GX650PY-NM006W | |
| Average NVIDIA GeForce RTX 4090 Laptop GPU (16 - 24, n=39) | |
| Asus ROG Zephyrus M16 GU604VY-NM042X | |
| Blender / v3.3 Classroom CPU | |
| Lenovo Yoga Pro 7 14IRH G8 | |
| Acer Predator Triton 300 SE | |
| Apple MacBook Pro 14 2023 M2 Pro | |
| Asus ROG Zephyrus G14 GA402XY | |
| Asus ROG Zephyrus M16 GU604VY-NM042X | |
| Average of class Gaming (122 - 565, n=102, last 2 years) | |
| Average NVIDIA GeForce RTX 4090 Laptop GPU (144 - 305, n=39) | |
| Lenovo Legion Pro 7 16IRX8H | |
| Asus ROG Strix G16 G614JZ | |
| Asus Zephyrus Duo 16 GX650PY-NM006W | |
| Blender / v3.3 Classroom METAL | |
| Apple MacBook Pro 14 2023 M2 Pro | |
* ... smaller is better
游戏性能
我们的游戏基准测试显示,与大型游戏笔记本电脑相比,差距略大,这分别是处理器或TDP/TGP配置的结果。G14中的AMD Ryzen 9 7940HS在综合工作负载中被限制在35W,这主要在1080p测试中很明显。然而,整体游戏性能仍然很好,我们看到与去年的模型相比有~50%的优势。
G14的性能在更高的分辨率下也非常好,通常与快速的RTX 4080型号相当,这意味着你可以在QHD的最高设置下轻松玩所有现代游戏。在更长的时间里,游戏性能也很稳定。更多关于RTX 4090的游戏基准测试列于 我们的技术部分.
| Call of Duty Modern Warfare 2 2022 | |
| 1920x1080 Extreme Quality Preset AA:T2X Filmic SM | |
| Asus Zephyrus Duo 16 GX650PY-NM006W | |
| Average NVIDIA GeForce RTX 4090 Laptop GPU (141 - 182, n=13) | |
| Asus ROG Zephyrus M16 GU604VY-NM042X | |
| Asus ROG Strix G16 G614JZ | |
| Asus ROG Zephyrus G14 GA402XY | |
| Lenovo Legion Pro 7 16IRX8H | |
| 2560x1440 Extreme Quality Preset AA:T2X Filmic SM | |
| Average NVIDIA GeForce RTX 4090 Laptop GPU (104 - 137, n=14) | |
| Asus Zephyrus Duo 16 GX650PY-NM006W | |
| Asus ROG Zephyrus M16 GU604VY-NM042X | |
| Asus ROG Strix G16 G614JZ | |
| Lenovo Legion Pro 7 16IRX8H | |
| Asus ROG Zephyrus G14 GA402XY | |
| 3840x2160 Extreme Quality Preset AA:T2X Filmic SM | |
| Average NVIDIA GeForce RTX 4090 Laptop GPU (63 - 86, n=12) | |
| Asus ROG Zephyrus M16 GU604VY-NM042X | |
| Lenovo Legion Pro 7 16IRX8H | |
| Asus ROG Zephyrus G14 GA402XY | |
| Far Cry 6 | |
| 3840x2160 Ultra Graphics Quality + HD Textures AA:T | |
| Average NVIDIA GeForce RTX 4090 Laptop GPU (64 - 92, n=10) | |
| Asus ROG Zephyrus M16 GU604VY-NM042X | |
| Asus ROG Zephyrus G14 GA402XY | |
| 2560x1440 Ultra Graphics Quality + HD Textures AA:T | |
| Average NVIDIA GeForce RTX 4090 Laptop GPU (85 - 146, n=12) | |
| Average of class Gaming (n=1last 2 years) | |
| Asus Zephyrus Duo 16 GX650PY-NM006W | |
| Asus ROG Zephyrus M16 GU604VY-NM042X | |
| Asus ROG Zephyrus G14 GA402XY | |
| Asus ROG Zephyrus G14 GA402RK | |
| 1920x1080 Ultra Graphics Quality + HD Textures AA:T | |
| Average of class Gaming (n=1last 2 years) | |
| Average NVIDIA GeForce RTX 4090 Laptop GPU (91 - 167, n=12) | |
| Asus Zephyrus Duo 16 GX650PY-NM006W | |
| Asus ROG Zephyrus M16 GU604VY-NM042X | |
| Asus ROG Zephyrus G14 GA402RK | |
| Asus ROG Zephyrus G14 GA402XY | |
我们还检查了一些带有Nvidia DLSS upsampling的质量预设和帧生成的标题。如果有的话,我们还激活了光线追踪。以下结果显示了令人印象深刻的性能提升:
| 标题 | Nativ | DLSS质量+FG+RT(如果有的话) | 差异 |
|---|---|---|---|
| Hogwarts Legacy | 43.1 FPS | 80.5 FPS | +86 % |
| Miles Morales | 50.8 FPS | 94.9 FPS | +87 % |
| Cyberpunk 2077 | 31.3 FPS | 81.9 FPS | +162 % |
| Witcher 3 4.00 | 33.6 fps | 73.6 fps | +119 % |
| Dying Light 2 | 34.8 FPS | 91.8 FPS | +163 % |
Witcher 3 FPS Chart
| low | med. | high | ultra | QHD | 4K DLSS | 4K | |
|---|---|---|---|---|---|---|---|
| GTA V (2015) | 172.3 | 114 | 108.9 | 143.3 | |||
| The Witcher 3 (2015) | 150.6 | 116.3 | |||||
| Dota 2 Reborn (2015) | 166.5 | 161 | 142.1 | 134.1 | |||
| Final Fantasy XV Benchmark (2018) | 186.7 | 145.5 | 113 | ||||
| X-Plane 11.11 (2018) | 121.3 | 105.2 | 82.7 | ||||
| Far Cry 5 (2018) | 142 | 130 | 123 | 75 | |||
| Strange Brigade (2018) | 306 | 274 | 218 | 126.3 | |||
| Shadow of the Tomb Raider (2018) | 166 | 166 | 135 | 73 | |||
| Assassin´s Creed Valhalla (2020) | 144 | 129 | 102 | 61 | |||
| F1 2021 (2021) | 276 | 169.6 | 140 | 89.9 | |||
| Far Cry 6 (2021) | 103 | 95 | 96 | 64 | |||
| Cyberpunk 2077 1.6 (2022) | 114.72 | 105.43 | 78 | 38.84 | |||
| Tiny Tina's Wonderlands (2022) | 168 | 141.12 | 103.39 | 53.27 | |||
| F1 22 (2022) | 220 | 98.4 | 65.9 | 36.8 | |||
| A Plague Tale Requiem (2022) | 87.1 | 77.4 | 58.9 | 48.4 | 33.1 | ||
| Call of Duty Modern Warfare 2 2022 (2022) | 147 | 141 | 104 | 86 | 63 | ||
| The Callisto Protocol (2022) | 116.43 | 102.64 | 82.09 | 48.14 | |||
| Hogwarts Legacy (2023) | 82.2 | 74.9 | 66.1 | 37.2 | |||
| The Last of Us (2023) | 103.1 | 92 | 68.2 | 54.3 | 34.9 | ||
| Cyberpunk 2077 (2023) | 101.7 | 70 | 31.55 |
排放--表面温度适中的游戏机
系统噪音
两个风扇的噪音水平在很大程度上取决于电源配置文件,它们在涡轮模式下对负载的反应非常快。这对这种模式来说是没问题的,我们建议你使用静音模式来完成要求不高的任务,当你需要更多功率时,只需切换到另一个模式。你也应该在较慢的配置文件中检查你最喜欢的游戏的性能。如果性能尚可,你可以从更安静的风扇中获益。G14在Turbo模式下的噪音相当大,为52 dB(A),但风扇噪音没有显示出任何恼人的频率迹象,考虑到性能的数量和紧凑的机箱,噪音水平仍然可以接受。有很多较大的游戏笔记本电脑的风扇声音甚至更大。在合成和游戏基准测试中,我们偶尔注意到一些轻微的电子噪音。
| 静音 | 性能 | 涡轮 | |
|---|---|---|---|
| 3DMark 06 | 29.5 dB(A) | 33 dB(A) | 49.5 dB(A) |
| Witcher 3 | 39.9 dB(A) | 46.2 dB(A) | 52.2 dB(A) |
| Cyberpunk 2077 | 39.9 dB(A) | 46.2 dB(A) | 52.2 dB(A) |
| 压力测试 | 39.9 dB(A) | 46.2 dB(A) | 52.2 dB(A) |
| Cinebench R23 Multi | 34.7 dB(A) | 39.9 dB(A) | 52.2 dB(A) |
Noise level
| Idle |
| 23.6 / 23.6 / 33 dB(A) |
| Load |
| 49.5 / 52.2 dB(A) |
 | ||
30 dB silent 40 dB(A) audible 50 dB(A) loud |
||
min: | ||
| Asus ROG Zephyrus G14 GA402XY GeForce RTX 4090 Laptop GPU, R9 7940HS, Samsung PM9A1 MZVL21T0HCLR | Razer Blade 14 Ryzen 9 6900HX GeForce RTX 3070 Ti Laptop GPU, R9 6900HX, Samsung PM9A1 MZVL21T0HCLR | Asus ROG Zephyrus G14 GA402RK Radeon RX 6800S, R9 6900HS, Micron 2450 1TB MTFDKBK1T0TFK | Alienware x14 i7 RTX 3060 GeForce RTX 3060 Laptop GPU, i7-12700H, WDC PC SN810 1TB | Acer Predator Triton 300 SE GeForce RTX 3060 Laptop GPU, i9-12900H, Micron 3400 1TB MTFDKBA1T0TFH | Apple MacBook Pro 14 2023 M2 Pro M2 Pro 19-Core GPU, M2 Pro, Apple SSD AP2048Z | |
|---|---|---|---|---|---|---|
| Noise | 14% | 5% | 2% | -2% | 15% | |
| off / environment * (dB) | 23.3 | 23.3 -0% | 24 -3% | 24.7 -6% | 23.8 -2% | 23.9 -3% |
| Idle Minimum * (dB) | 23.6 | 23.3 1% | 24 -2% | 24.7 -5% | 23.8 -1% | 23.9 -1% |
| Idle Average * (dB) | 23.6 | 23.3 1% | 26 -10% | 24.7 -5% | 23.8 -1% | 23.9 -1% |
| Idle Maximum * (dB) | 33 | 23.3 29% | 31 6% | 30.9 6% | 30.6 7% | 23.9 28% |
| Load Average * (dB) | 49.5 | 34.7 30% | 45 9% | 40 19% | 44.2 11% | 26 47% |
| Witcher 3 ultra * (dB) | 52.2 | 42.1 19% | 43 18% | 51.5 1% | 60.1 -15% | |
| Load Maximum * (dB) | 52.2 | 42.1 19% | 45 14% | 51.5 1% | 60 -15% | 43.2 17% |
* ... smaller is better
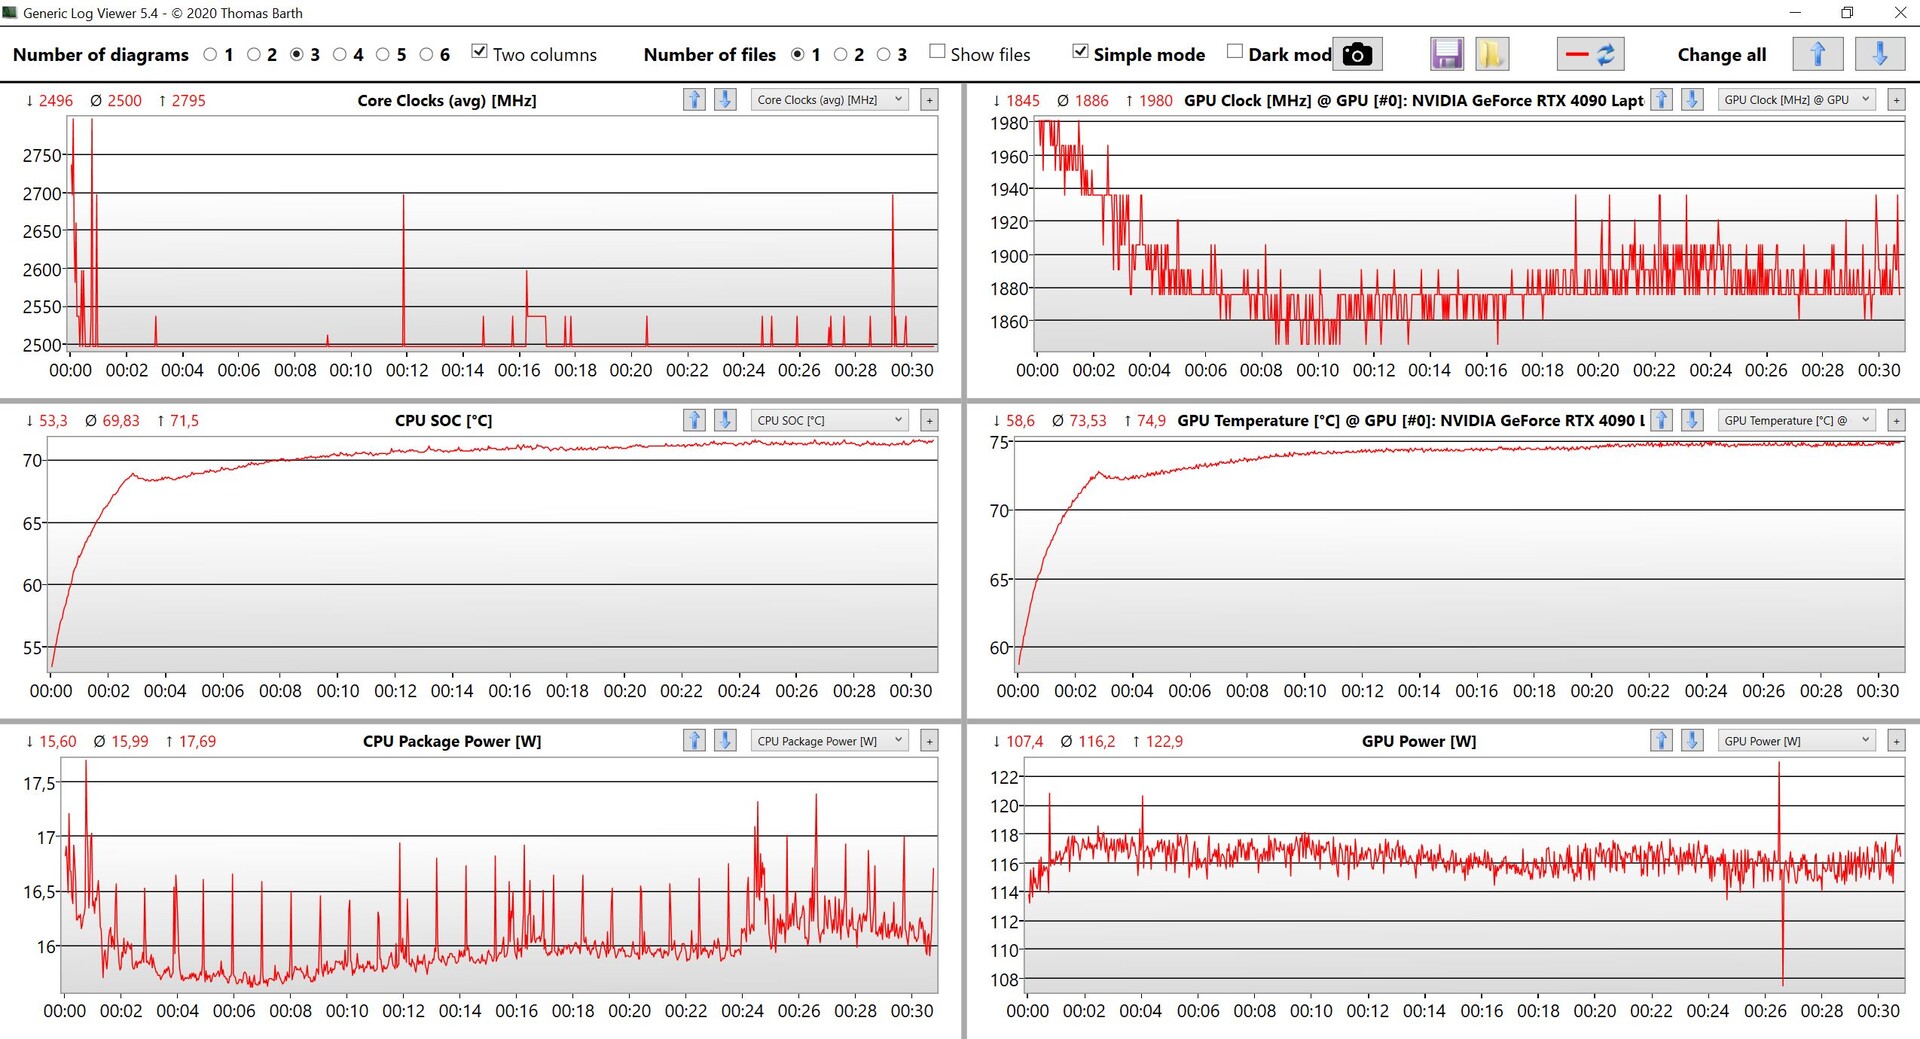
温度
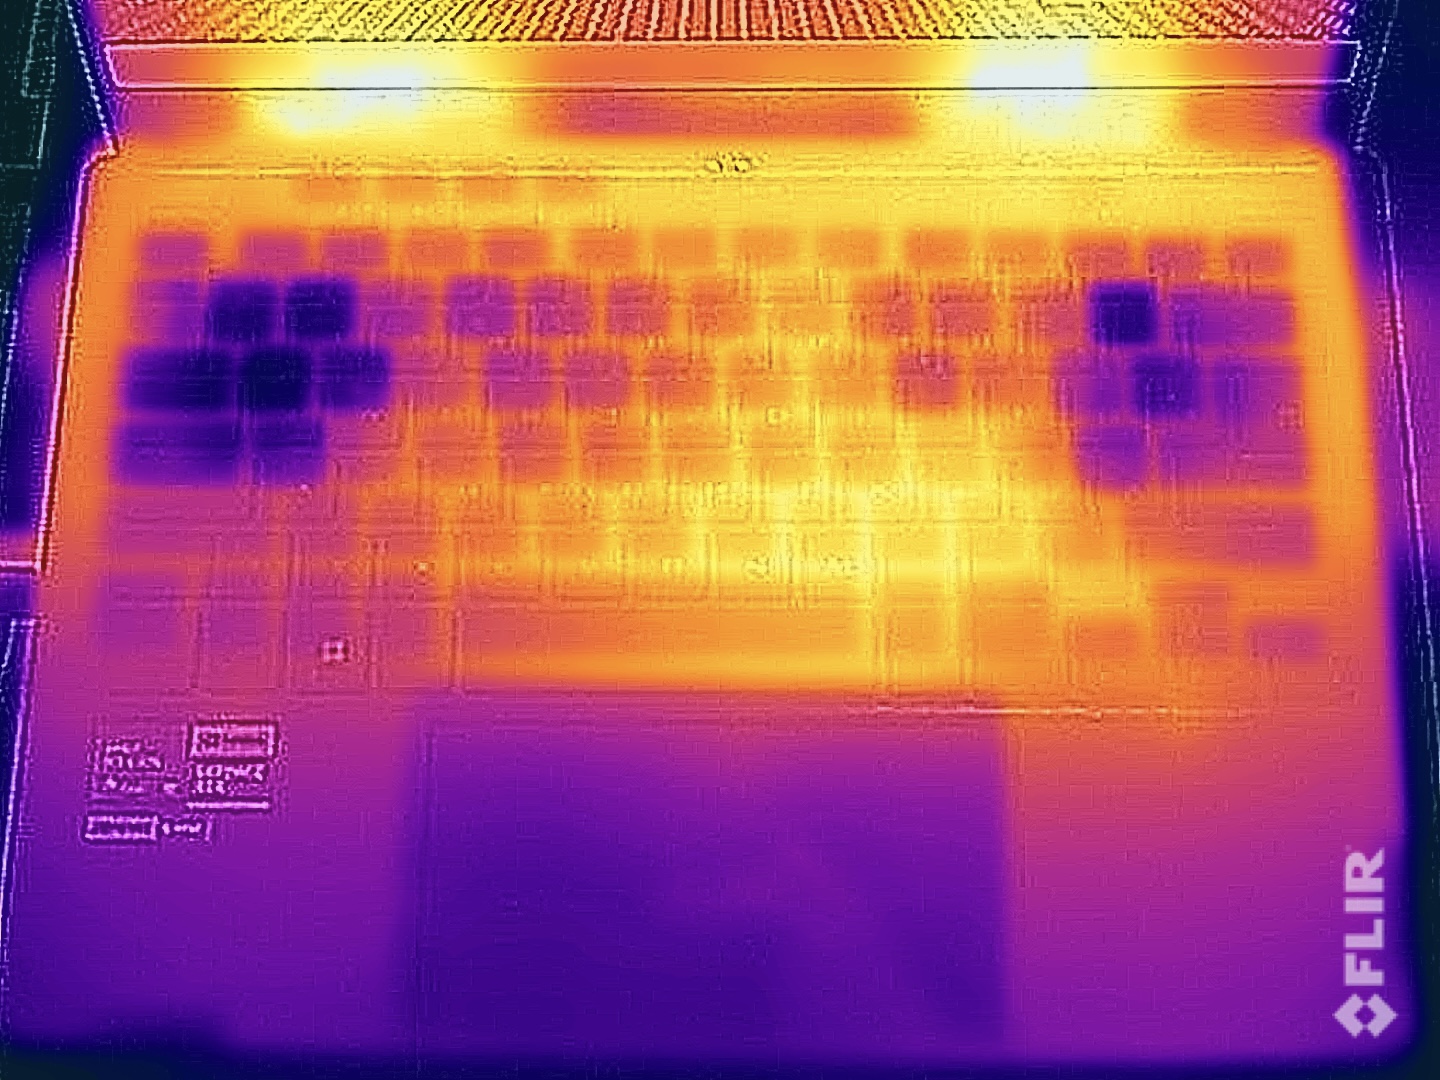
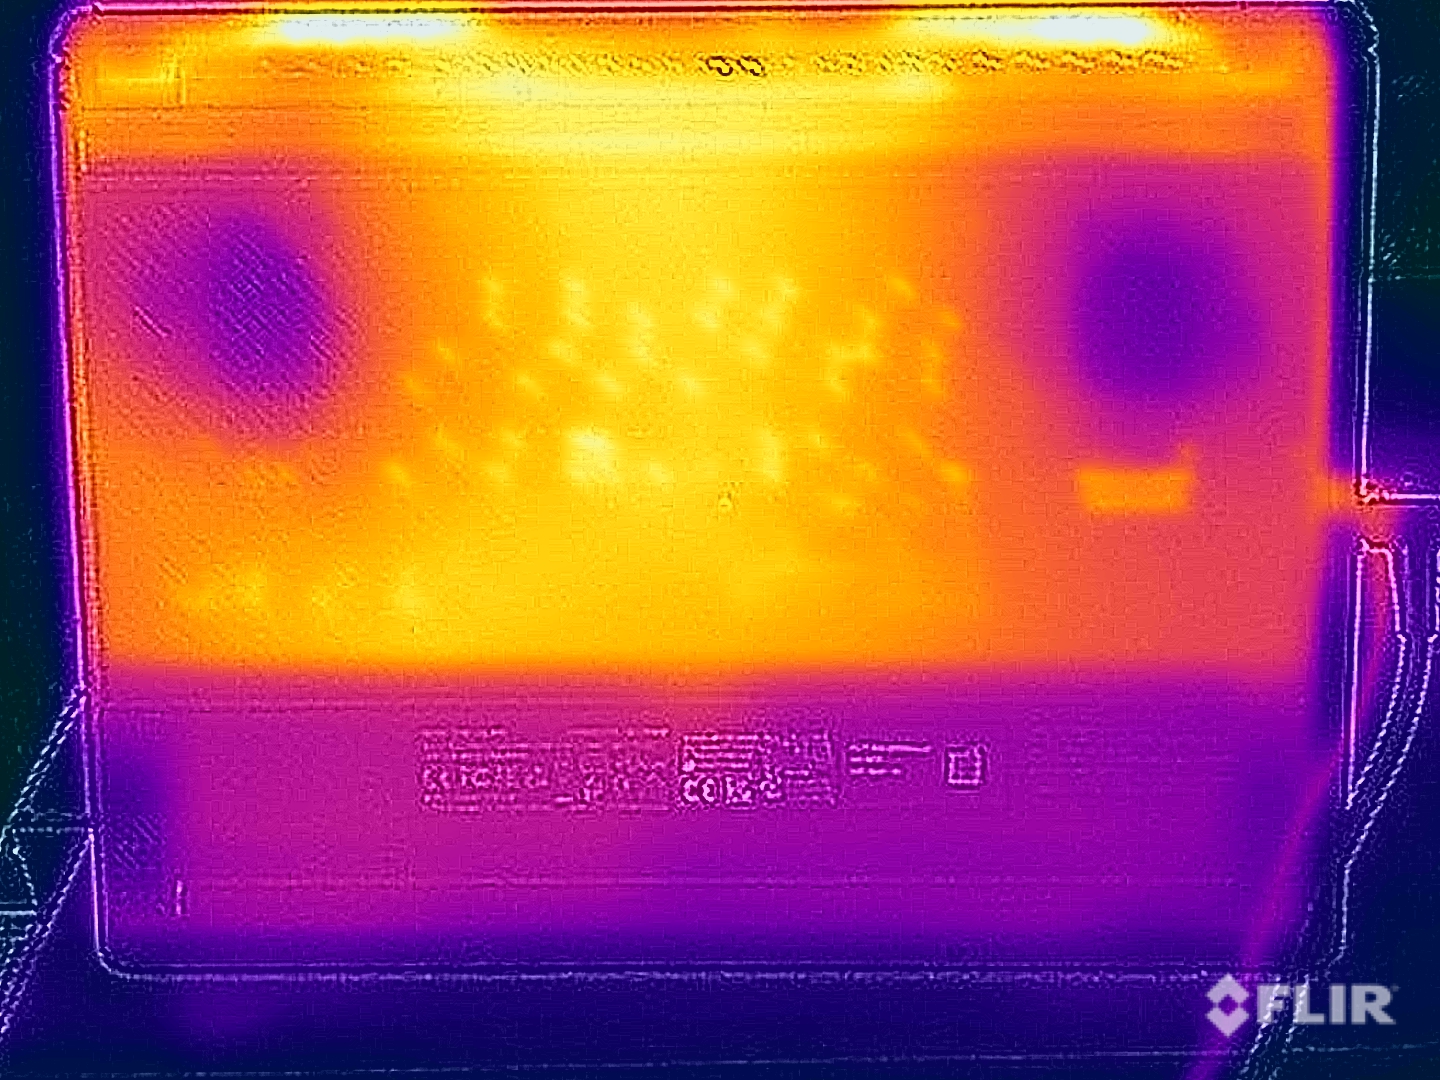
考虑到高性能和紧凑的尺寸,华硕对G14的表面温度管理得非常好。这款机箱在轻度工作负荷下非常凉爽,在压力测试和游戏过程中,我们可以测量到中心上部的温度高达46℃。在打字时,这一点很明显,手指会有点出汗,但没有任何限制。由于采用了ERGO-LIFT铰链,你甚至可以把G14放在你的腿上,在负载下。总而言之,带有液态金属和蒸汽室的冷却解决方案效果非常好。
压力测试期间的行为与广告中的规格相同,专用GPU明显受到青睐。几分钟后,处理器的功率降至35W,GPU的功率降至100W。在压力测试之后,并没有立即出现性能下降。
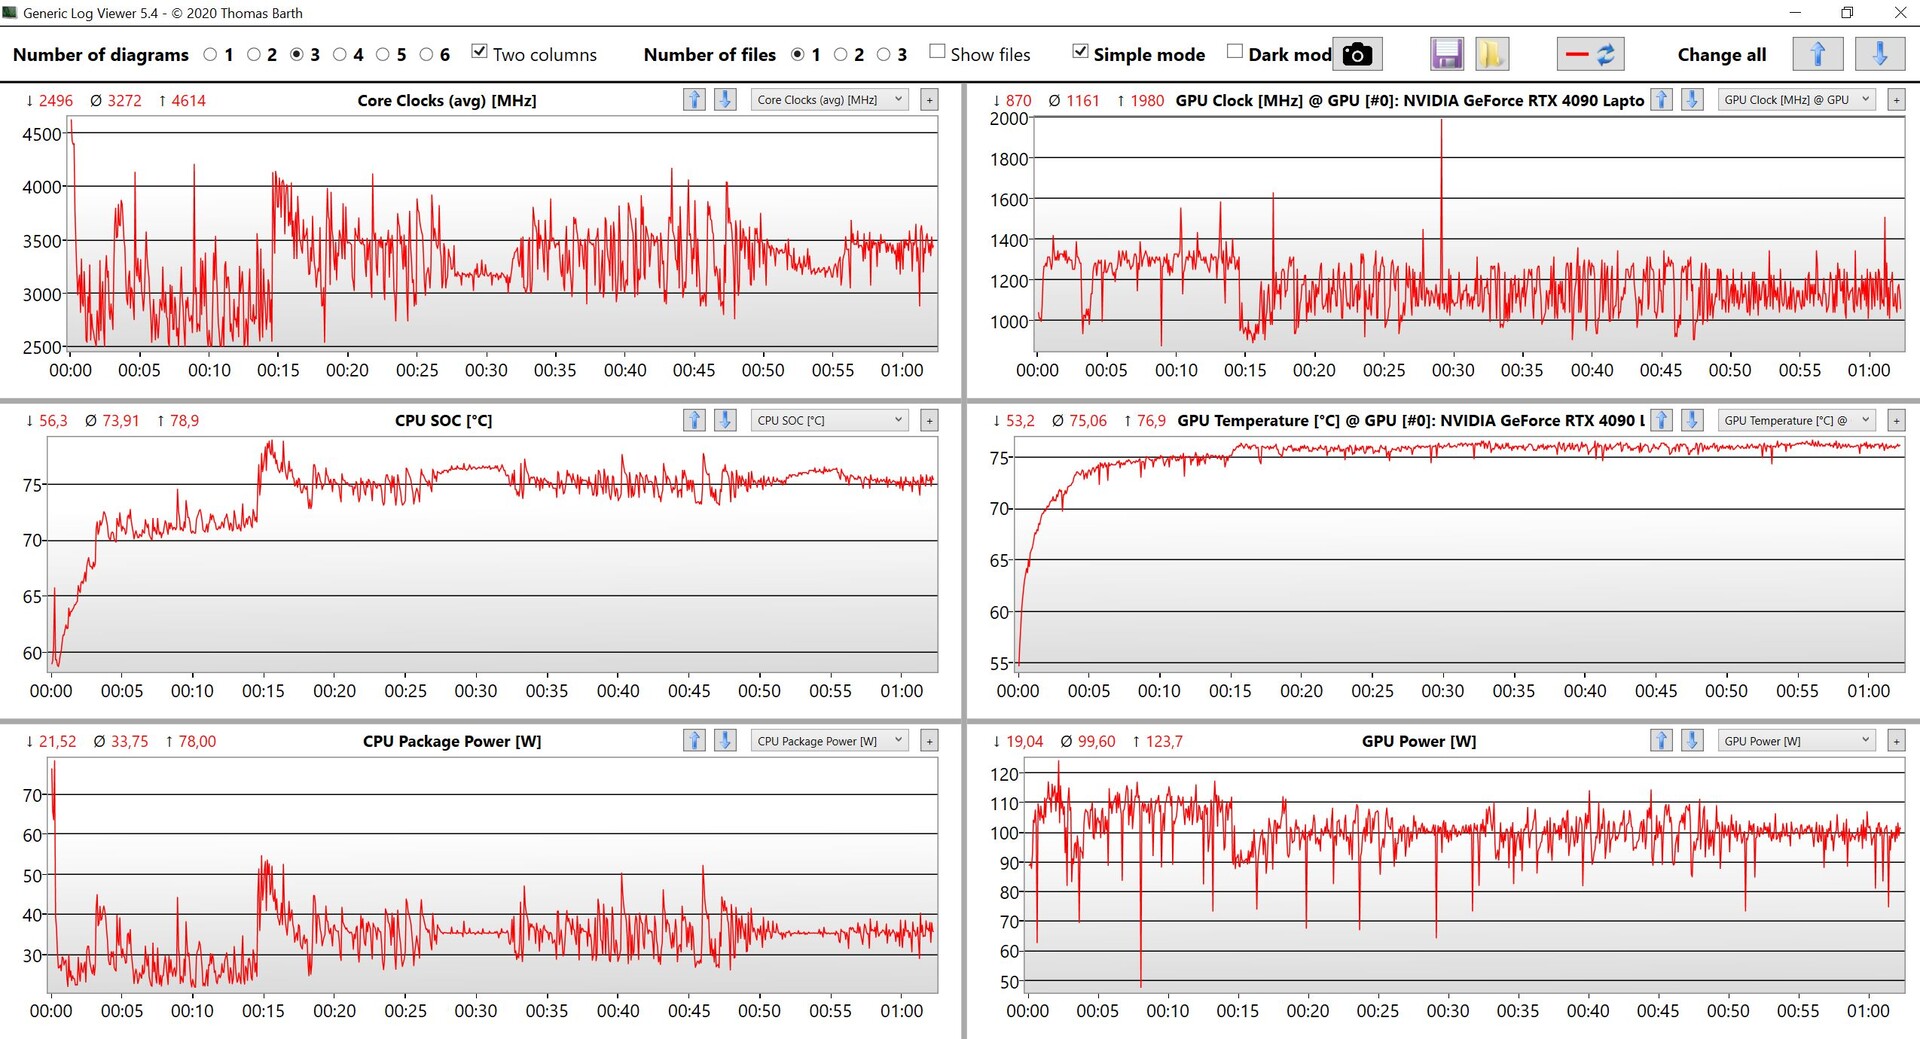
(-) The maximum temperature on the upper side is 47 °C / 117 F, compared to the average of 40.4 °C / 105 F, ranging from 21.2 to 68.8 °C for the class Gaming.
(-) The bottom heats up to a maximum of 46.5 °C / 116 F, compared to the average of 43.2 °C / 110 F
(+) In idle usage, the average temperature for the upper side is 25.1 °C / 77 F, compared to the device average of 33.9 °C / 93 F.
(-) Playing The Witcher 3, the average temperature for the upper side is 40.7 °C / 105 F, compared to the device average of 33.9 °C / 93 F.
(±) The palmrests and touchpad can get very hot to the touch with a maximum of 36.9 °C / 98.4 F.
(-) The average temperature of the palmrest area of similar devices was 28.8 °C / 83.8 F (-8.1 °C / -14.6 F).
| Asus ROG Zephyrus G14 GA402XY AMD Ryzen 9 7940HS, NVIDIA GeForce RTX 4090 Laptop GPU | Razer Blade 14 Ryzen 9 6900HX AMD Ryzen 9 6900HX, NVIDIA GeForce RTX 3070 Ti Laptop GPU | Asus ROG Zephyrus G14 GA402RK AMD Ryzen 9 6900HS, AMD Radeon RX 6800S | Alienware x14 i7 RTX 3060 Intel Core i7-12700H, NVIDIA GeForce RTX 3060 Laptop GPU | Acer Predator Triton 300 SE Intel Core i9-12900H, NVIDIA GeForce RTX 3060 Laptop GPU | Apple MacBook Pro 14 2023 M2 Pro Apple M2 Pro, Apple M2 Pro 19-Core GPU | |
|---|---|---|---|---|---|---|
| Heat | -14% | -16% | -1% | -0% | 13% | |
| Maximum Upper Side * (°C) | 47 | 40.6 14% | 55 -17% | 51.3 -9% | 43 9% | 46.9 -0% |
| Maximum Bottom * (°C) | 46.5 | 42.6 8% | 55 -18% | 44.4 5% | 46.4 -0% | 41.7 10% |
| Idle Upper Side * (°C) | 25.9 | 38 -47% | 30 -16% | 27.2 -5% | 28.2 -9% | 21.4 17% |
| Idle Bottom * (°C) | 28 | 37 -32% | 32 -14% | 26.6 5% | 28.4 -1% | 21.4 24% |
* ... smaller is better
发言人
华硕实现了两个低音单元和两个高音单元,它们位于键盘上方,将声音导向用户。整体效果非常好,声音显得很丰富,有足够的音量。与之相比Apple的MacBook Pro 14相比,该扬声器系统缺乏一点冲击力。总而言之,这些模块仍然适合音乐和视频,但由于风扇噪音,我们建议在游戏过程中使用耳机或耳麦。
Asus ROG Zephyrus G14 GA402XY audio analysis
(±) | speaker loudness is average but good (80 dB)
Bass 100 - 315 Hz
(±) | reduced bass - on average 8.8% lower than median
(±) | linearity of bass is average (9.7% delta to prev. frequency)
Mids 400 - 2000 Hz
(+) | balanced mids - only 3.3% away from median
(+) | mids are linear (5% delta to prev. frequency)
Highs 2 - 16 kHz
(+) | balanced highs - only 2% away from median
(+) | highs are linear (4.3% delta to prev. frequency)
Overall 100 - 16.000 Hz
(+) | overall sound is linear (10% difference to median)
Compared to same class
» 5% of all tested devices in this class were better, 2% similar, 93% worse
» The best had a delta of 6%, average was 18%, worst was 132%
Compared to all devices tested
» 4% of all tested devices were better, 1% similar, 94% worse
» The best had a delta of 4%, average was 23%, worst was 134%
Apple MacBook Pro 14 2023 M2 Pro audio analysis
(+) | speakers can play relatively loud (84.3 dB)
Bass 100 - 315 Hz
(+) | good bass - only 3.8% away from median
(+) | bass is linear (6.9% delta to prev. frequency)
Mids 400 - 2000 Hz
(+) | balanced mids - only 2.1% away from median
(+) | mids are linear (2.2% delta to prev. frequency)
Highs 2 - 16 kHz
(+) | balanced highs - only 2.7% away from median
(+) | highs are linear (4.8% delta to prev. frequency)
Overall 100 - 16.000 Hz
(+) | overall sound is linear (6% difference to median)
Compared to same class
» 3% of all tested devices in this class were better, 0% similar, 97% worse
» The best had a delta of 5%, average was 17%, worst was 45%
Compared to all devices tested
» 0% of all tested devices were better, 0% similar, 100% worse
» The best had a delta of 4%, average was 23%, worst was 134%
能源管理 - 迷你LED的运行时间成本
消耗功率
我们记录到新的ROG 14在最大亮度下的最大空闲消耗为15瓦特,这是令人惊讶的效率。在游戏过程中,你可以期待170瓦左右,在压力测试开始时,我们可以看到220瓦的最大消耗,最终也会稳定在170瓦。因此,240瓦的电源适配器是完全足够的。
| Off / Standby | |
| Idle | |
| Load |
|
Key:
min: | |
| Asus ROG Zephyrus G14 GA402XY R9 7940HS, GeForce RTX 4090 Laptop GPU, Samsung PM9A1 MZVL21T0HCLR, Mini-LED, 2560x1600, 14" | Razer Blade 14 Ryzen 9 6900HX R9 6900HX, GeForce RTX 3070 Ti Laptop GPU, Samsung PM9A1 MZVL21T0HCLR, IPS, 2560x1440, 14" | Asus ROG Zephyrus G14 GA402RK R9 6900HS, Radeon RX 6800S, Micron 2450 1TB MTFDKBK1T0TFK, IPS-Level, 2560x1600, 14" | Alienware x14 i7 RTX 3060 i7-12700H, GeForce RTX 3060 Laptop GPU, WDC PC SN810 1TB, IPS, 1920x1080, 14" | Acer Predator Triton 300 SE i9-12900H, GeForce RTX 3060 Laptop GPU, Micron 3400 1TB MTFDKBA1T0TFH, OLED, 2880x1800, 14" | Apple MacBook Pro 14 2023 M2 Pro M2 Pro, M2 Pro 19-Core GPU, Apple SSD AP2048Z, Mini-LED, 3024x1964, 14.2" | Average NVIDIA GeForce RTX 4090 Laptop GPU | Average of class Gaming | |
|---|---|---|---|---|---|---|---|---|
| Power Consumption | -31% | -3% | 15% | -2% | 44% | -77% | -40% | |
| Idle Minimum * (Watt) | 9.4 | 10.2 -9% | 7 26% | 7.9 16% | 7.6 19% | 2.4 74% | 16.2 ? -72% | 13 ? -38% |
| Idle Average * (Watt) | 14.2 | 26 -83% | 14 1% | 11.1 22% | 12.3 13% | 11.3 20% | 23.1 ? -63% | 19 ? -34% |
| Idle Maximum * (Watt) | 14.5 | 26.7 -84% | 22 -52% | 11.8 19% | 17.6 -21% | 11.5 21% | 34.2 ? -136% | 24.6 ? -70% |
| Load Average * (Watt) | 79 | 89.3 -13% | 98 -24% | 107.4 -36% | 111 -41% | 59.6 25% | 130.5 ? -65% | 110.7 ? -40% |
| Witcher 3 ultra * (Watt) | 172 | 158.7 8% | 141 18% | 111 35% | 117.1 32% | 55.9 67% | ||
| Load Maximum * (Watt) | 220.8 | 227.5 -3% | 188 15% | 140.4 36% | 245.8 -11% | 100 55% | 324 ? -47% | 259 ? -17% |
* ... smaller is better
Power consumption Witcher 3 / Stress test
Power consumption external screen
电池运行时间
76Wh的电池容量没有变化,但运行时间与之前的机型相比仍然有点短,这应该主要是迷你LED面板的结果。新的AMD芯片可能也会消耗更多的电力,Ryzen 9 7945HX已经是这种情况。我们将在我们的CPU分析中仔细研究这个问题。在150尼特(最大亮度的50%)下,我们的Wi-Fi测试运行了7.5小时,在最大亮度下运行了约5小时,都是在60赫兹下。在165赫兹下,150尼特的Wi-Fi运行时间降至6小时,但在最大亮度下的差异可以忽略不计,只有10分钟。
总而言之,电池运行时间还可以,但不是很好,大多数对手的运行时间更长。我们稍后将公布视频测试的结果(我们在150尼特下的常规测试以及全亮度下的HDR测试)。当设备打开时,完全充电需要大约90分钟;30分钟后可获得50%的电量,50分钟后可获得80%的电量。
| Asus ROG Zephyrus G14 GA402XY R9 7940HS, GeForce RTX 4090 Laptop GPU, 76 Wh | Razer Blade 14 Ryzen 9 6900HX R9 6900HX, GeForce RTX 3070 Ti Laptop GPU, 62 Wh | Asus ROG Zephyrus G14 GA402RK R9 6900HS, Radeon RX 6800S, 76 Wh | Alienware x14 i7 RTX 3060 i7-12700H, GeForce RTX 3060 Laptop GPU, 80 Wh | Acer Predator Triton 300 SE i9-12900H, GeForce RTX 3060 Laptop GPU, 76 Wh | Apple MacBook Pro 14 2023 M2 Pro M2 Pro, M2 Pro 19-Core GPU, 70 Wh | Average of class Gaming | |
|---|---|---|---|---|---|---|---|
| Battery runtime | 44% | 9% | 10% | 7% | 71% | 20% | |
| H.264 (h) | 7.2 | 9.4 31% | 15.3 113% | 8.32 ? 16% | |||
| WiFi v1.3 (h) | 7.5 | 9.5 27% | 9.5 27% | 8.9 19% | 6.2 -17% | 13.5 80% | 7.11 ? -5% |
| Load (h) | 1 | 1.6 60% | 0.9 -10% | 0.8 -20% | 1.3 30% | 1.2 20% | 1.502 ? 50% |
| Reader / Idle (h) | 12.2 | 18.1 | 8.1 | 8.27 ? | |||
| Witcher 3 ultra (h) | 0.8 |
Pros
Cons
结论 - ROG Zephyrus G14提供了一个令人印象深刻的软件包
华硕提高了新的2023年ROG Zephyrus G14相当的性能,为游戏玩家和内容创作者提供了一个非常强大的14英寸笔记本,具有足够的性能。高质量的机箱与去年相比没有变化,但现在配备了AMD以及Nvidia的最新和最先进的产品。
Nvidia的GeForce RTX 4090 笔记本电脑运行功率高达125瓦(游戏期间约100-110瓦),不符合最快版本的性能,但它们通常保留给更大的游戏笔记本电脑。Zen4 CPU在综合工作负载中也被减慢了速度,但这只是紧凑的机箱的结果。这对1080p的游戏性能有一点影响,但你仍然可以在原生QHD分辨率下流畅地玩所有现代游戏。
新的AMD Ryzen 9 7940HS也给人留下了良好的第一印象。AMD设法提高了单核性能,9核CPU可以在多核测试中与现代英特尔CPU竞争,尽管它们消耗的功率更大。我们不久将对新的CPU和Radeon 780M iGPU进行深入分析(包括效率测量)。
14英寸笔记本的最大性能:由于Ryzen 9 7940HS和GeForce RTX 4090 Laptop,新的ROG Zephyrus G14在一个紧凑的14英寸机箱中提供了非常强大的组件。整体性能非常好,你还可以得到一个伟大的165赫兹迷你LED面板。如果你能负担得起,这几乎是一个完美的包装。
Mini-LED面板也在几乎所有方面都有令人信服的表现,尽管MacBook Pro 14仍然提供卓越的亮度值。该面板在游戏方面的效果非常好,所包含的色彩配置文件提供了非常准确的色彩。当你编辑图片时,还可以将多区照明切换为单区照明。
这种水平的性能显然必须被冷却。表面温度控制得很好,但是风扇的声音很大,特别是在涡轮模式下。然而,考虑到性能,我们仍然认为结果是完全可以的。如果你想要的话,电源配置文件也提供了一个很好的平衡和退出的风扇噪音。电池运行时间只是平均水平,而且在电池供电时性能会降低,但这几乎是我们所有的批评。
不过,ne ROG G14的价格并不便宜,为4000欧元。较小的SKU提供了更好的性价比,但你应该记住,与具有175W TGP限制的大型游戏笔记本相比,RTX 4090和RTX 4080 SKU都不能利用GPU的全部潜力。RTX 4070笔记本电脑和更低的情况则不同,因为这些GPU在游戏过程中最多只消耗~105W(与制造商的TGP主张无关)。
我们已经迫不及待地想知道竞争对手是否像Razer Blade 14,Alienware x14和宏碁掠夺者Triton 300 SE可以跟上。就目前而言,新的ROG Zephyrus G14在14英寸游戏领域并没有真正的对手。
Asus ROG Zephyrus G14 GA402XY
- 04/30/2023 v7 (old)
Andreas Osthoff
Transparency
The selection of devices to be reviewed is made by our editorial team. The test sample was provided to the author as a loan by the manufacturer or retailer for the purpose of this review. The lender had no influence on this review, nor did the manufacturer receive a copy of this review before publication. There was no obligation to publish this review. As an independent media company, Notebookcheck is not subjected to the authority of manufacturers, retailers or publishers.
This is how Notebookcheck is testing
Every year, Notebookcheck independently reviews hundreds of laptops and smartphones using standardized procedures to ensure that all results are comparable. We have continuously developed our test methods for around 20 years and set industry standards in the process. In our test labs, high-quality measuring equipment is utilized by experienced technicians and editors. These tests involve a multi-stage validation process. Our complex rating system is based on hundreds of well-founded measurements and benchmarks, which maintains objectivity. Further information on our test methods can be found here.
Price comparison

