华硕ROG Zephyrus Duo 16笔记本回顾。带有AMD Zen4、RTX 4090和Mini-LED的多任务怪物
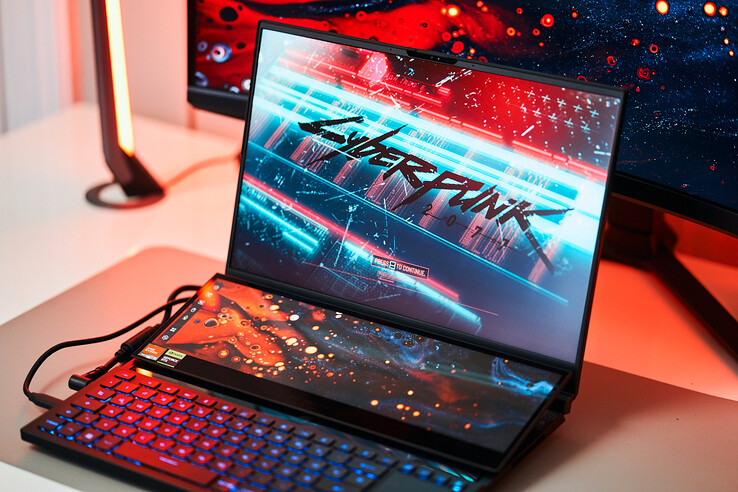
华硕在2023年延续了ROG Zephyrus Duo 16的双屏概念,并采用了目前能得到的最好的笔记本电脑技术。除了来自Nvidia的全新移动显卡外,还有GeForce RTX 4080 笔记本电脑和GeForce RTX 4090 笔记本电脑,华硕再次使用了AMD的HX处理器。它实际上是我们编辑部的第一批笔记本电脑之一,采用了新的AMD Ryzen 9 7945HX,它提供16个Zen4核心,对抗英特尔的Raptor Lake HX CPU。华硕还升级了显示屏。分辨率从4K下降到WQHD,但它是一个哑光的Mini-LED面板,刷新率为240赫兹,响应时间快。
笔记本电脑的分类实际上并不那么简单,因为Zephyrus Duo可能是一台游戏笔记本电脑,一台内容创作者的机器,甚至是一台移动工作站。然而,有两个屏幕的概念绝对不是每个用户都感兴趣。目前有四种不同的配置,我们的评测单元配有RTX 4090笔记本电脑,32GB内存和2TB SSD存储,售价为4999欧元。配备较小的1TB固态硬盘的SKU以及GeForce RTX 4080笔记本电脑将很快上市,售价为4299欧元。
潜在的竞争对手比较
Rating | Date | Model | Weight | Height | Size | Resolution | Price |
|---|---|---|---|---|---|---|---|
| 88 % v7 (old) | 04 / 2023 | Asus Zephyrus Duo 16 GX650PY-NM006W R9 7945HX, GeForce RTX 4090 Laptop GPU | 2.7 kg | 29.7 mm | 16.00" | 2560x1600 | |
| 89 % v7 (old) | 02 / 2023 | MSI Titan GT77 HX 13VI i9-13950HX, GeForce RTX 4090 Laptop GPU | 3.5 kg | 23 mm | 17.30" | 3840x2160 | |
v (old) | 02 / 2023 | Schenker XMG Neo 16 Raptor Lake i9-13900HX, GeForce RTX 4090 Laptop GPU | 16.00" | 2560x1600 | |||
| 89.4 % v7 (old) | 02 / 2023 | Lenovo Legion Pro 7 16IRX8H i9-13900HX, GeForce RTX 4080 Laptop GPU | 2.7 kg | 26 mm | 16.00" | 2560x1600 | |
| 91.2 % v7 (old) | 02 / 2023 | Razer Blade 16 Early 2023 i9-13950HX, GeForce RTX 4080 Laptop GPU | 2.4 kg | 21.99 mm | 16.00" | 2560x1600 | |
| 88.2 % v7 (old) | 05 / 2022 | Asus ROG Zephyrus Duo 16 GX650RX R9 6900HX, GeForce RTX 3080 Ti Laptop GPU | 2.6 kg | 20.5 mm | 16.00" | 3840x2400 | |
| 93.7 % v7 (old) | 03 / 2023 | Apple MacBook Pro 16 2023 M2 Max M2 Max, M2 Max 38-Core GPU | 2.2 kg | 16.8 mm | 16.20" | 3456x2234 |
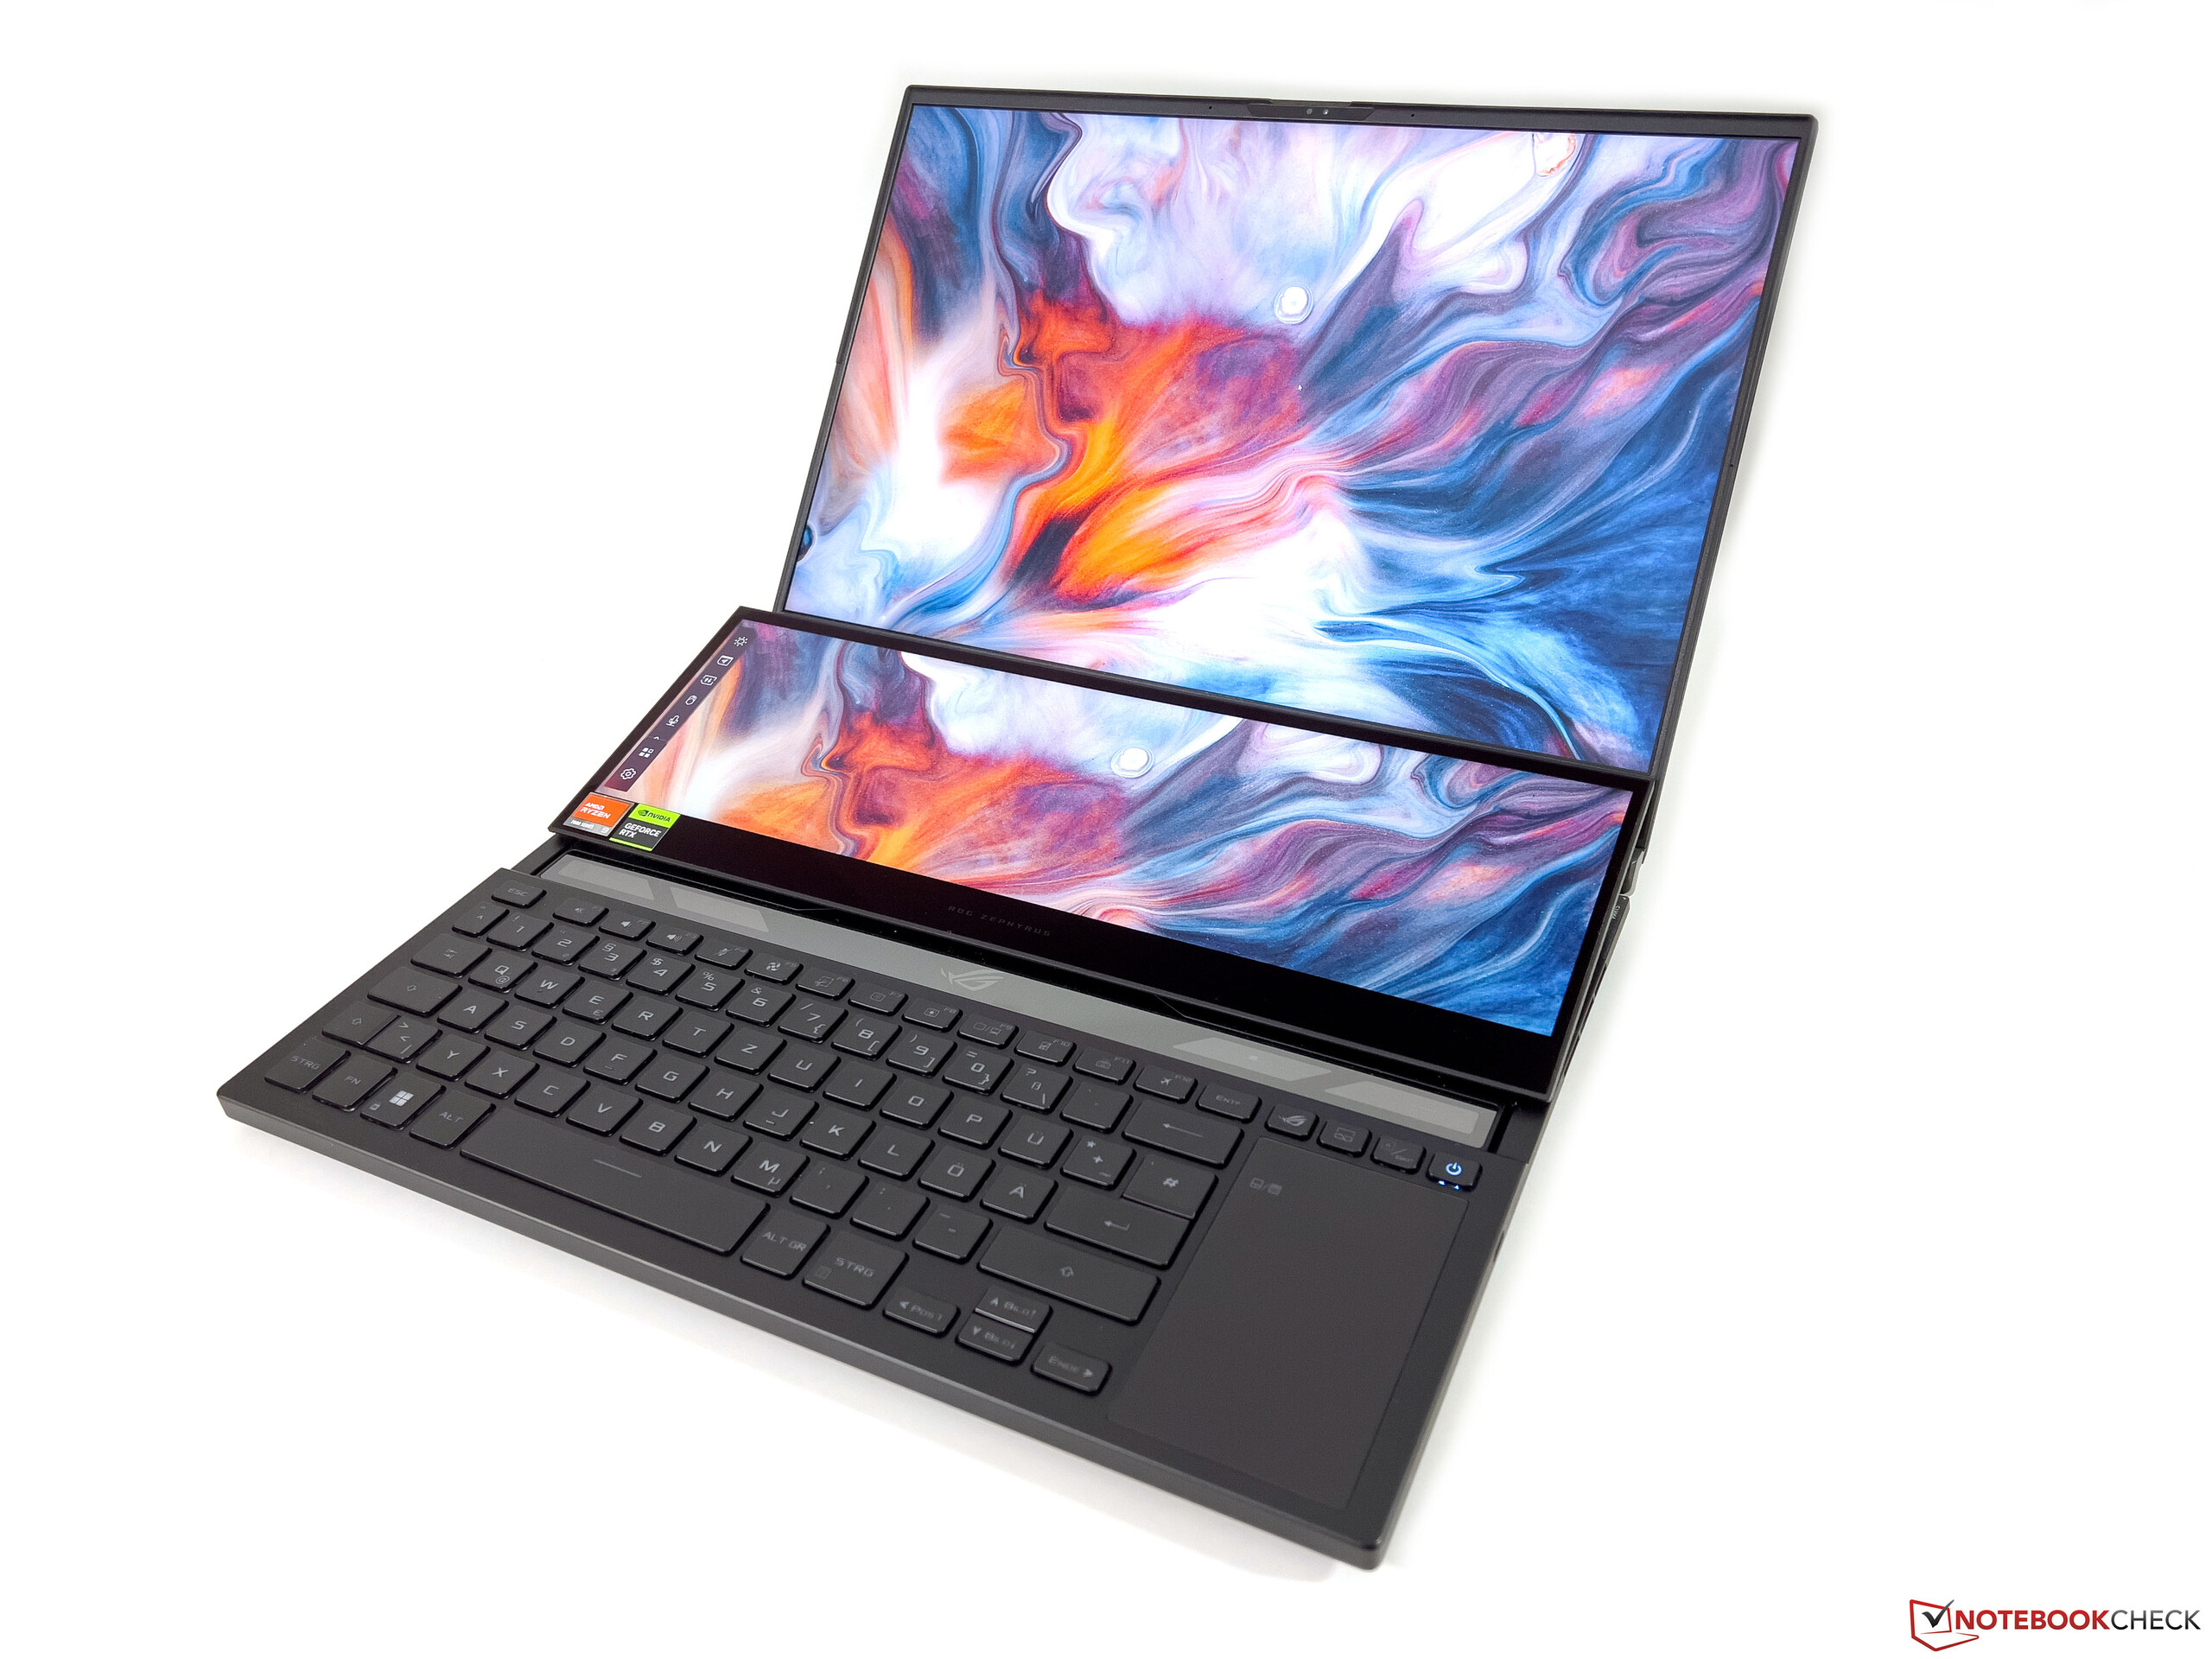
机箱 - 华硕熟悉的金属机箱
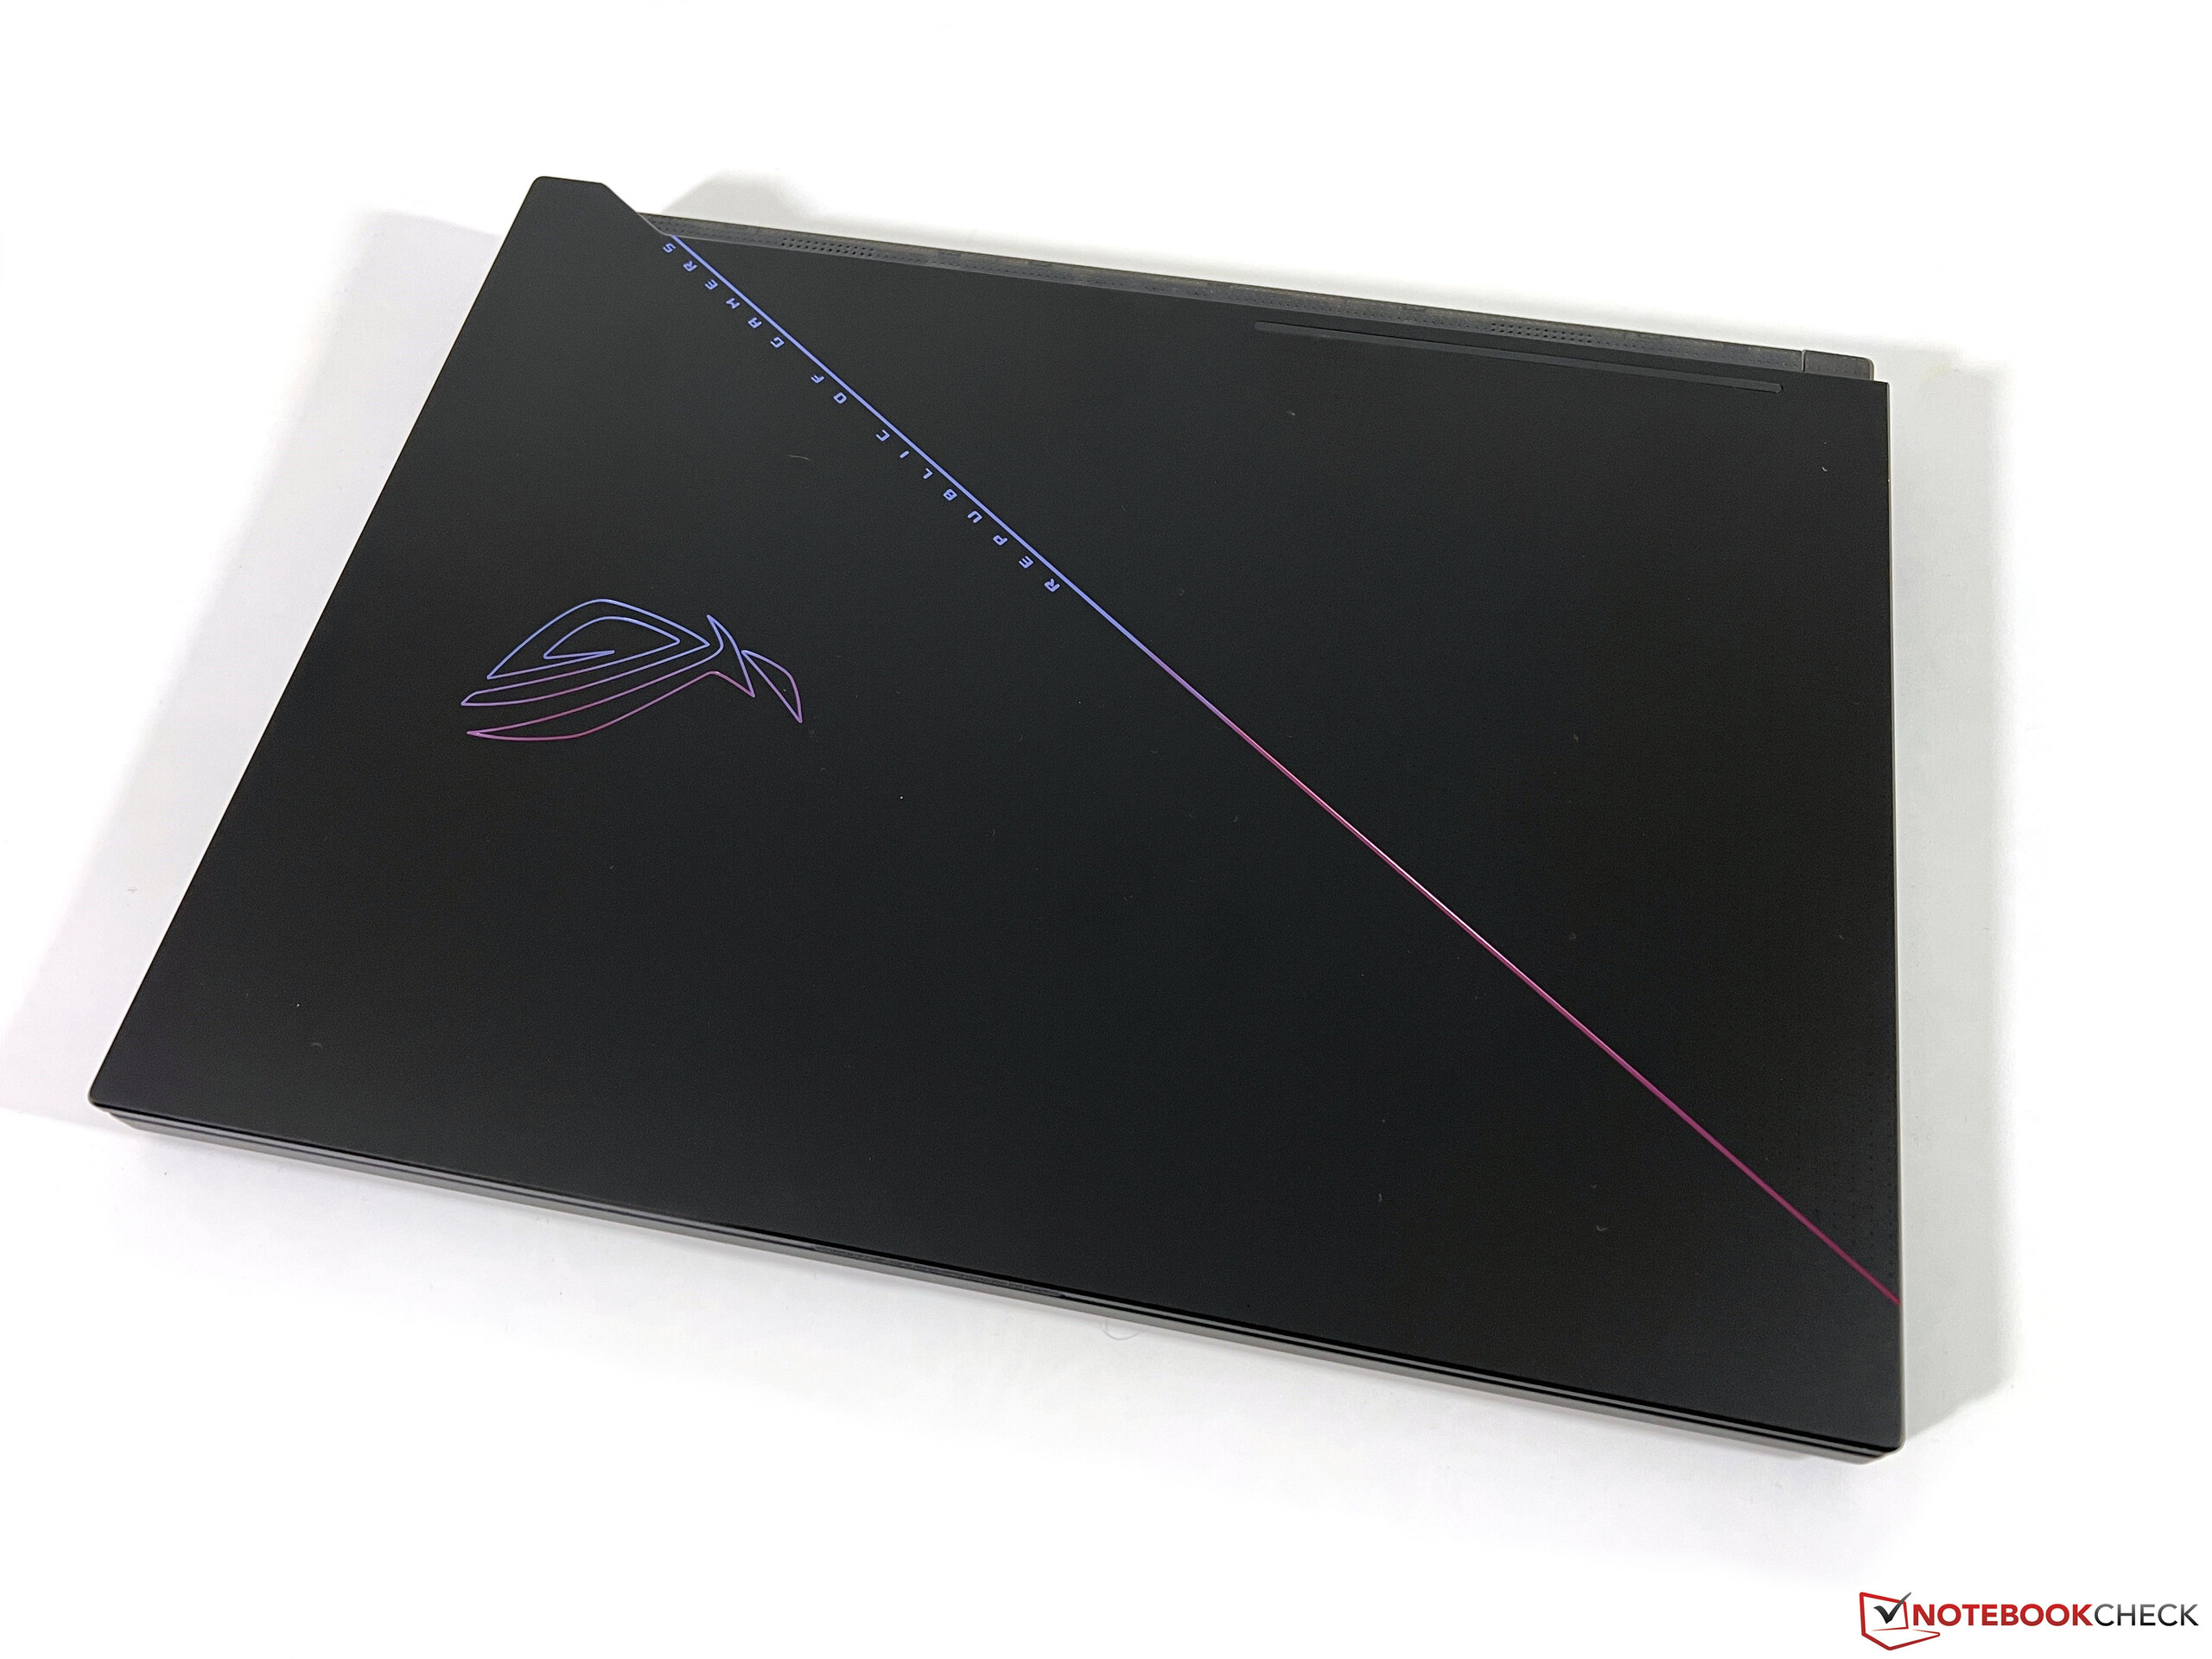
底盘设计与上一代车型相比没有变化。 以前的型号.当盖子关闭时,笔记本电脑实际上是相当微妙的,只有ROG的标志是彩色的,相比之下,其他的哑光黑色处理。也没有疯狂的机箱照明。笔记本电脑的质量给人留下了很好的印象,只有塑料底盖有点不足。
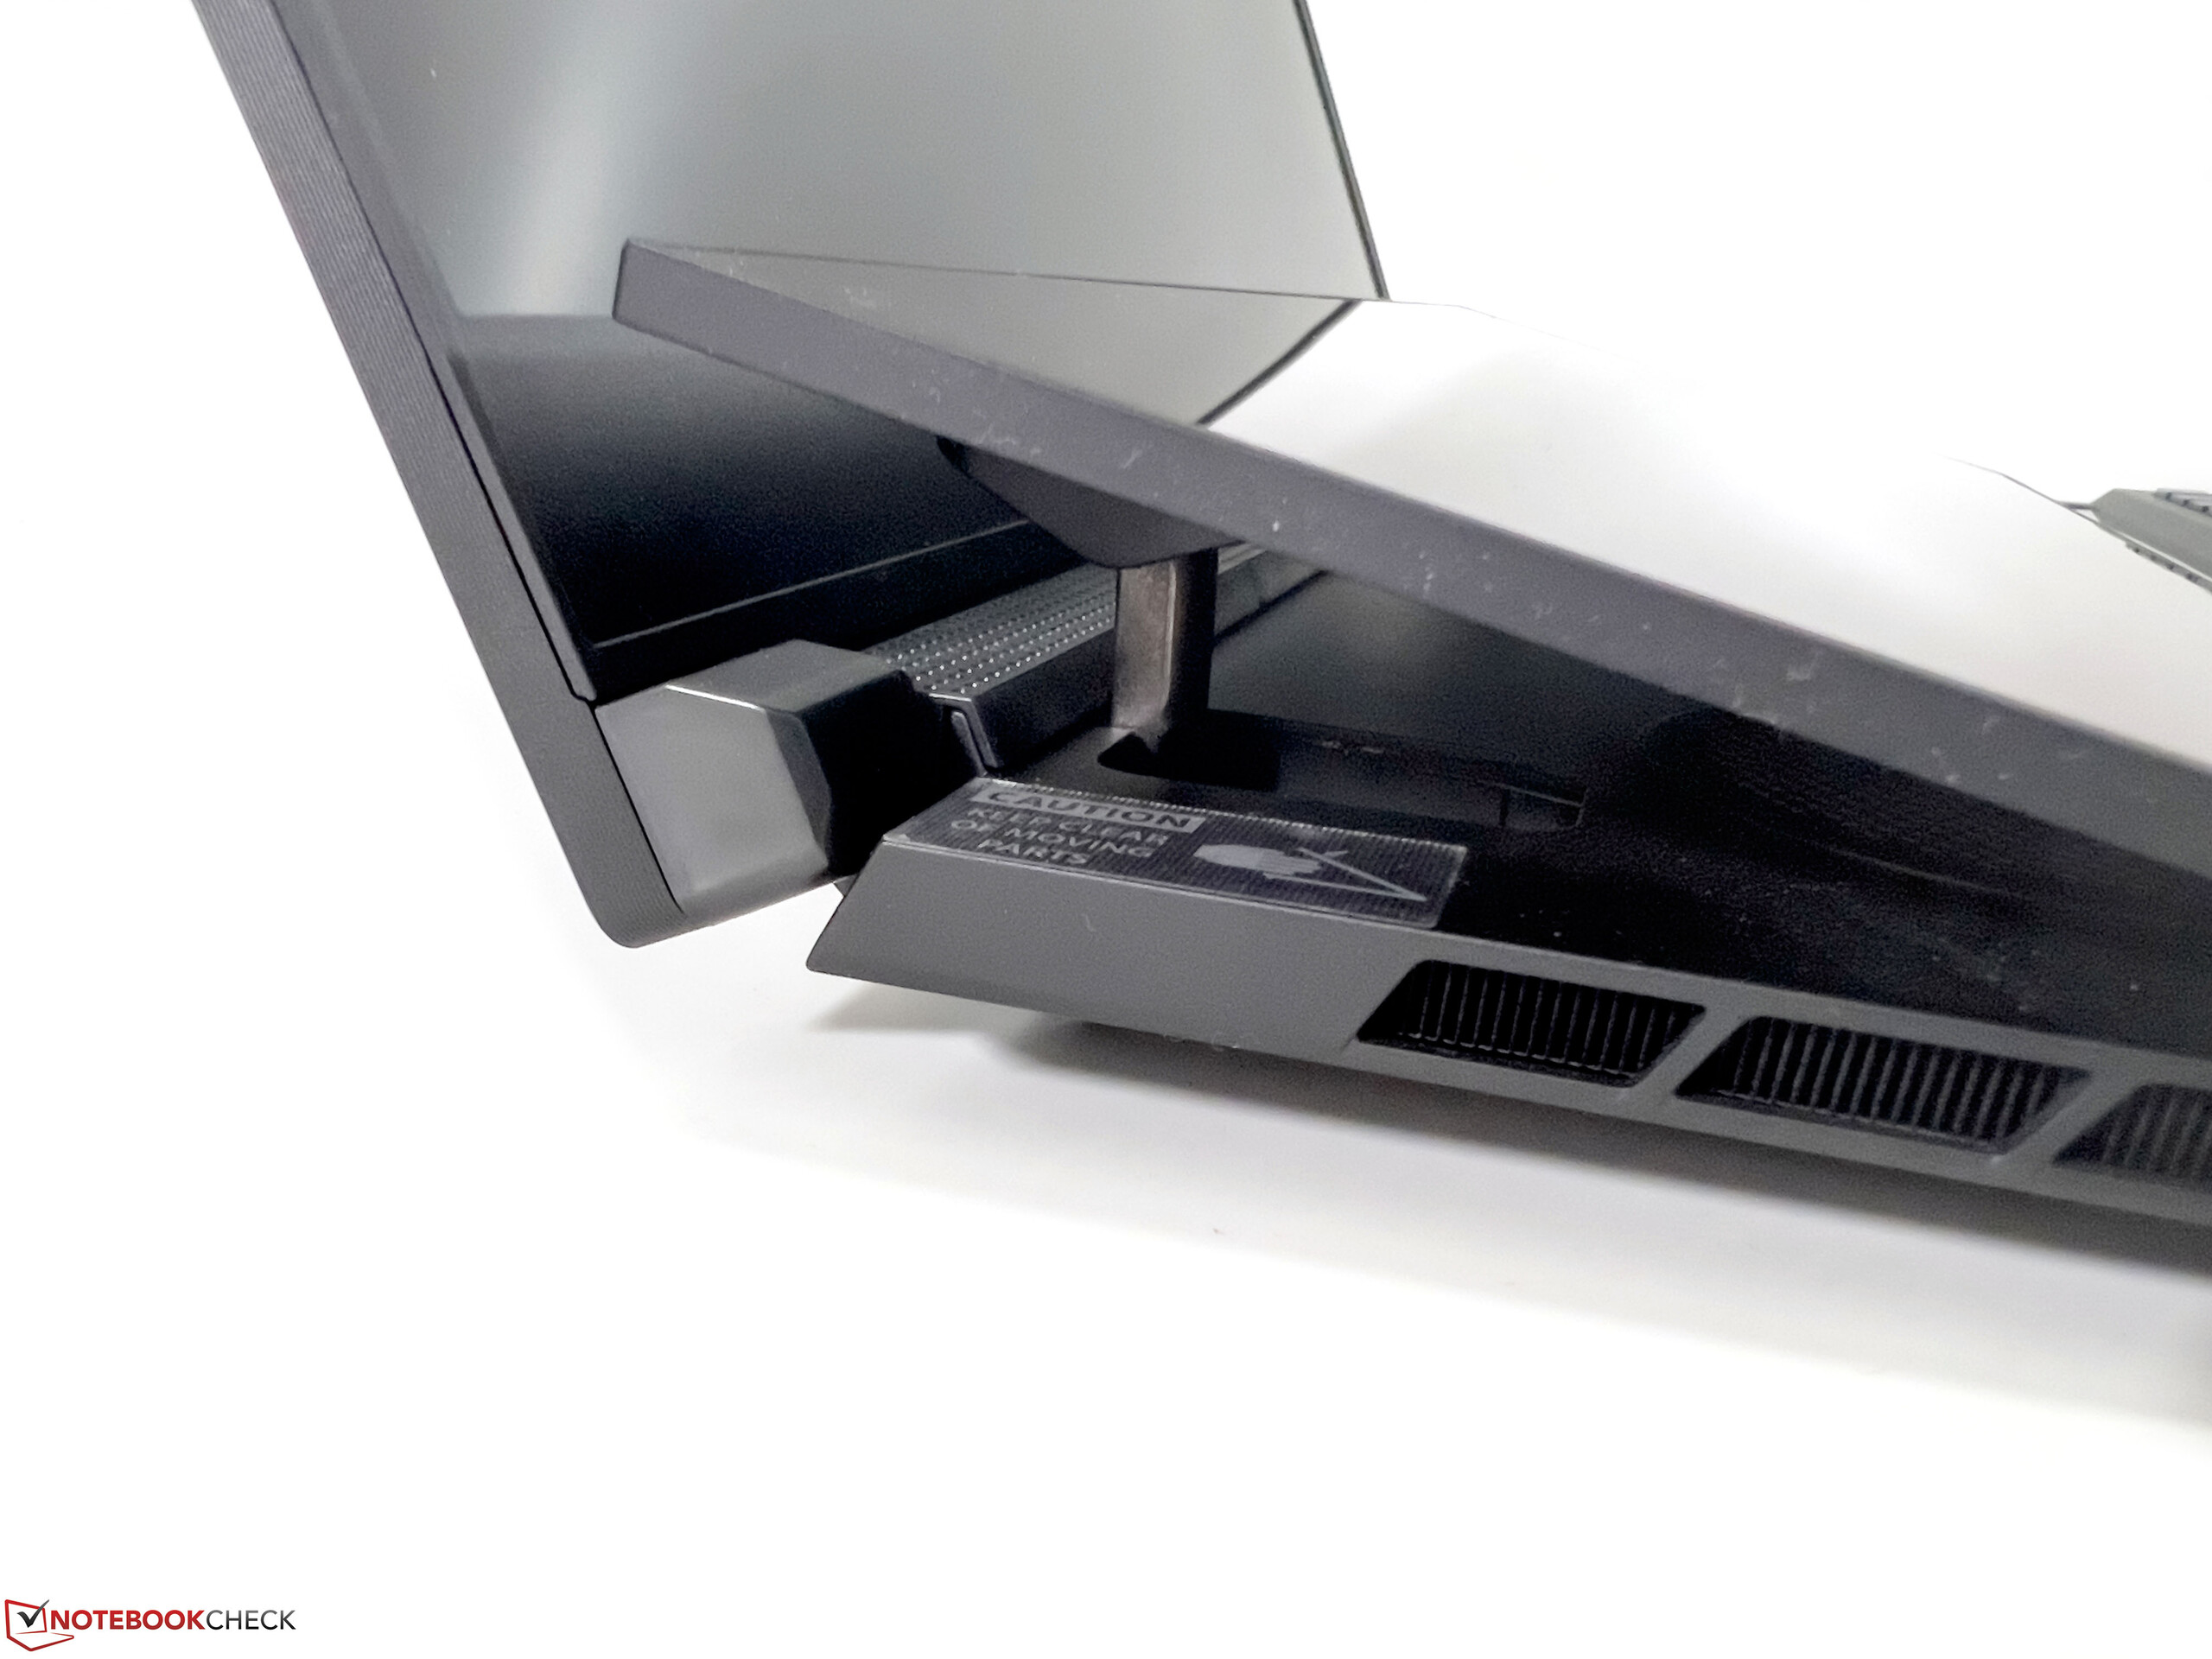
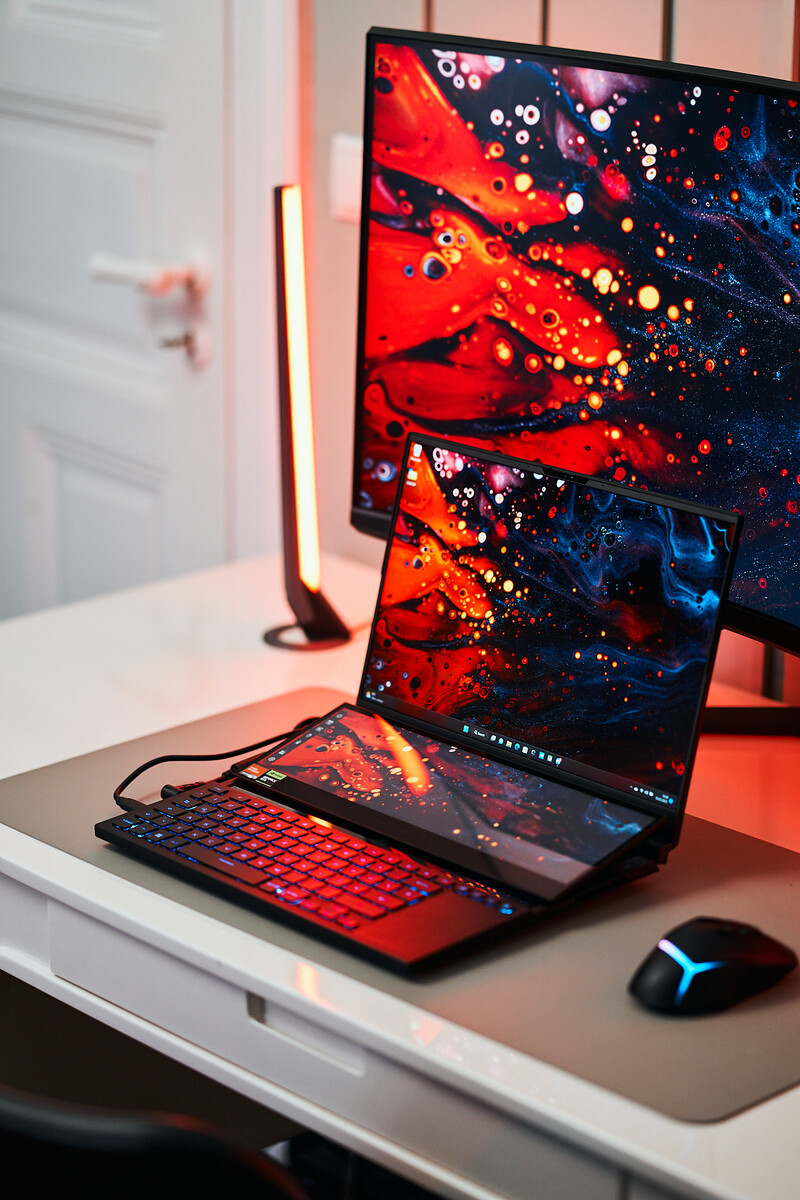
然而,一旦你打开盖子,你会立即发现这不是一台普通的笔记本电脑。根据主屏幕的打开角度,副屏幕会略微抬高(约15度),并向后面移动,这就在键盘上方揭开了一个透明的盖子,你甚至可以瞥见机箱内的角落。副屏的角度不能改变,但在实践中效果不错。提升机制也非常坚固,没有任何移动。总的来说,稳定性非常好,只是盖子的最大开启角度有点限制,大约为130度。
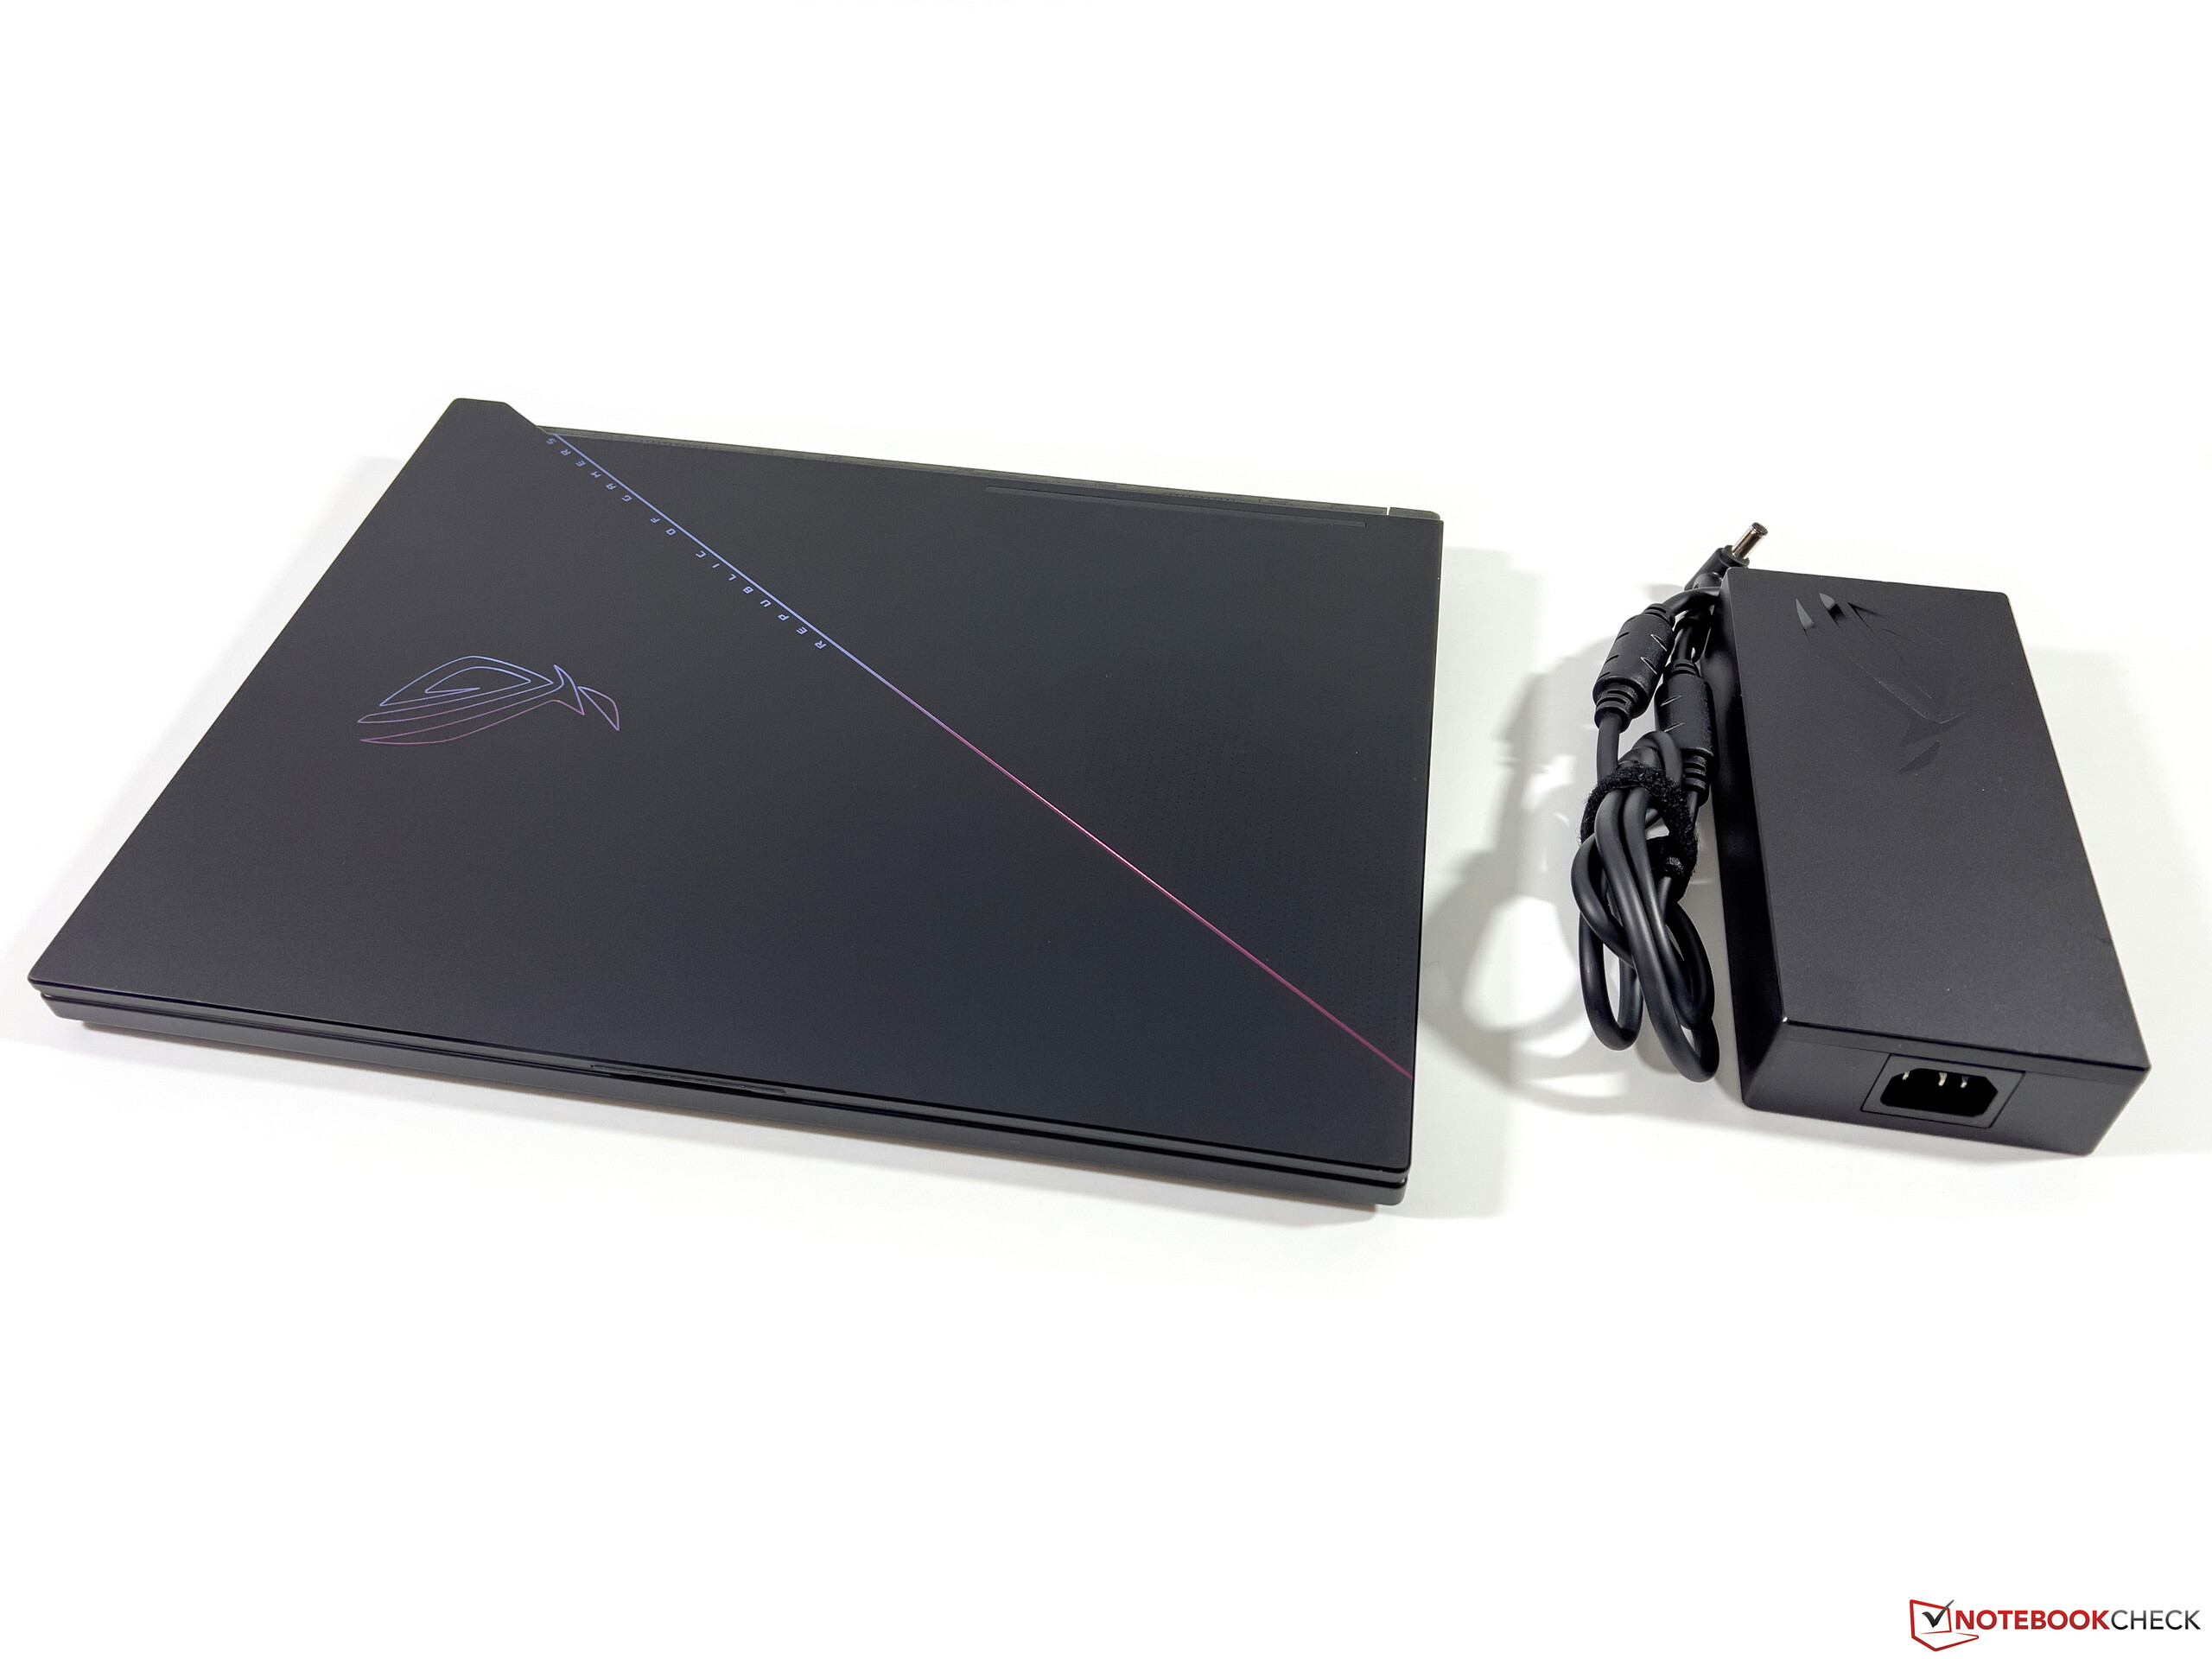
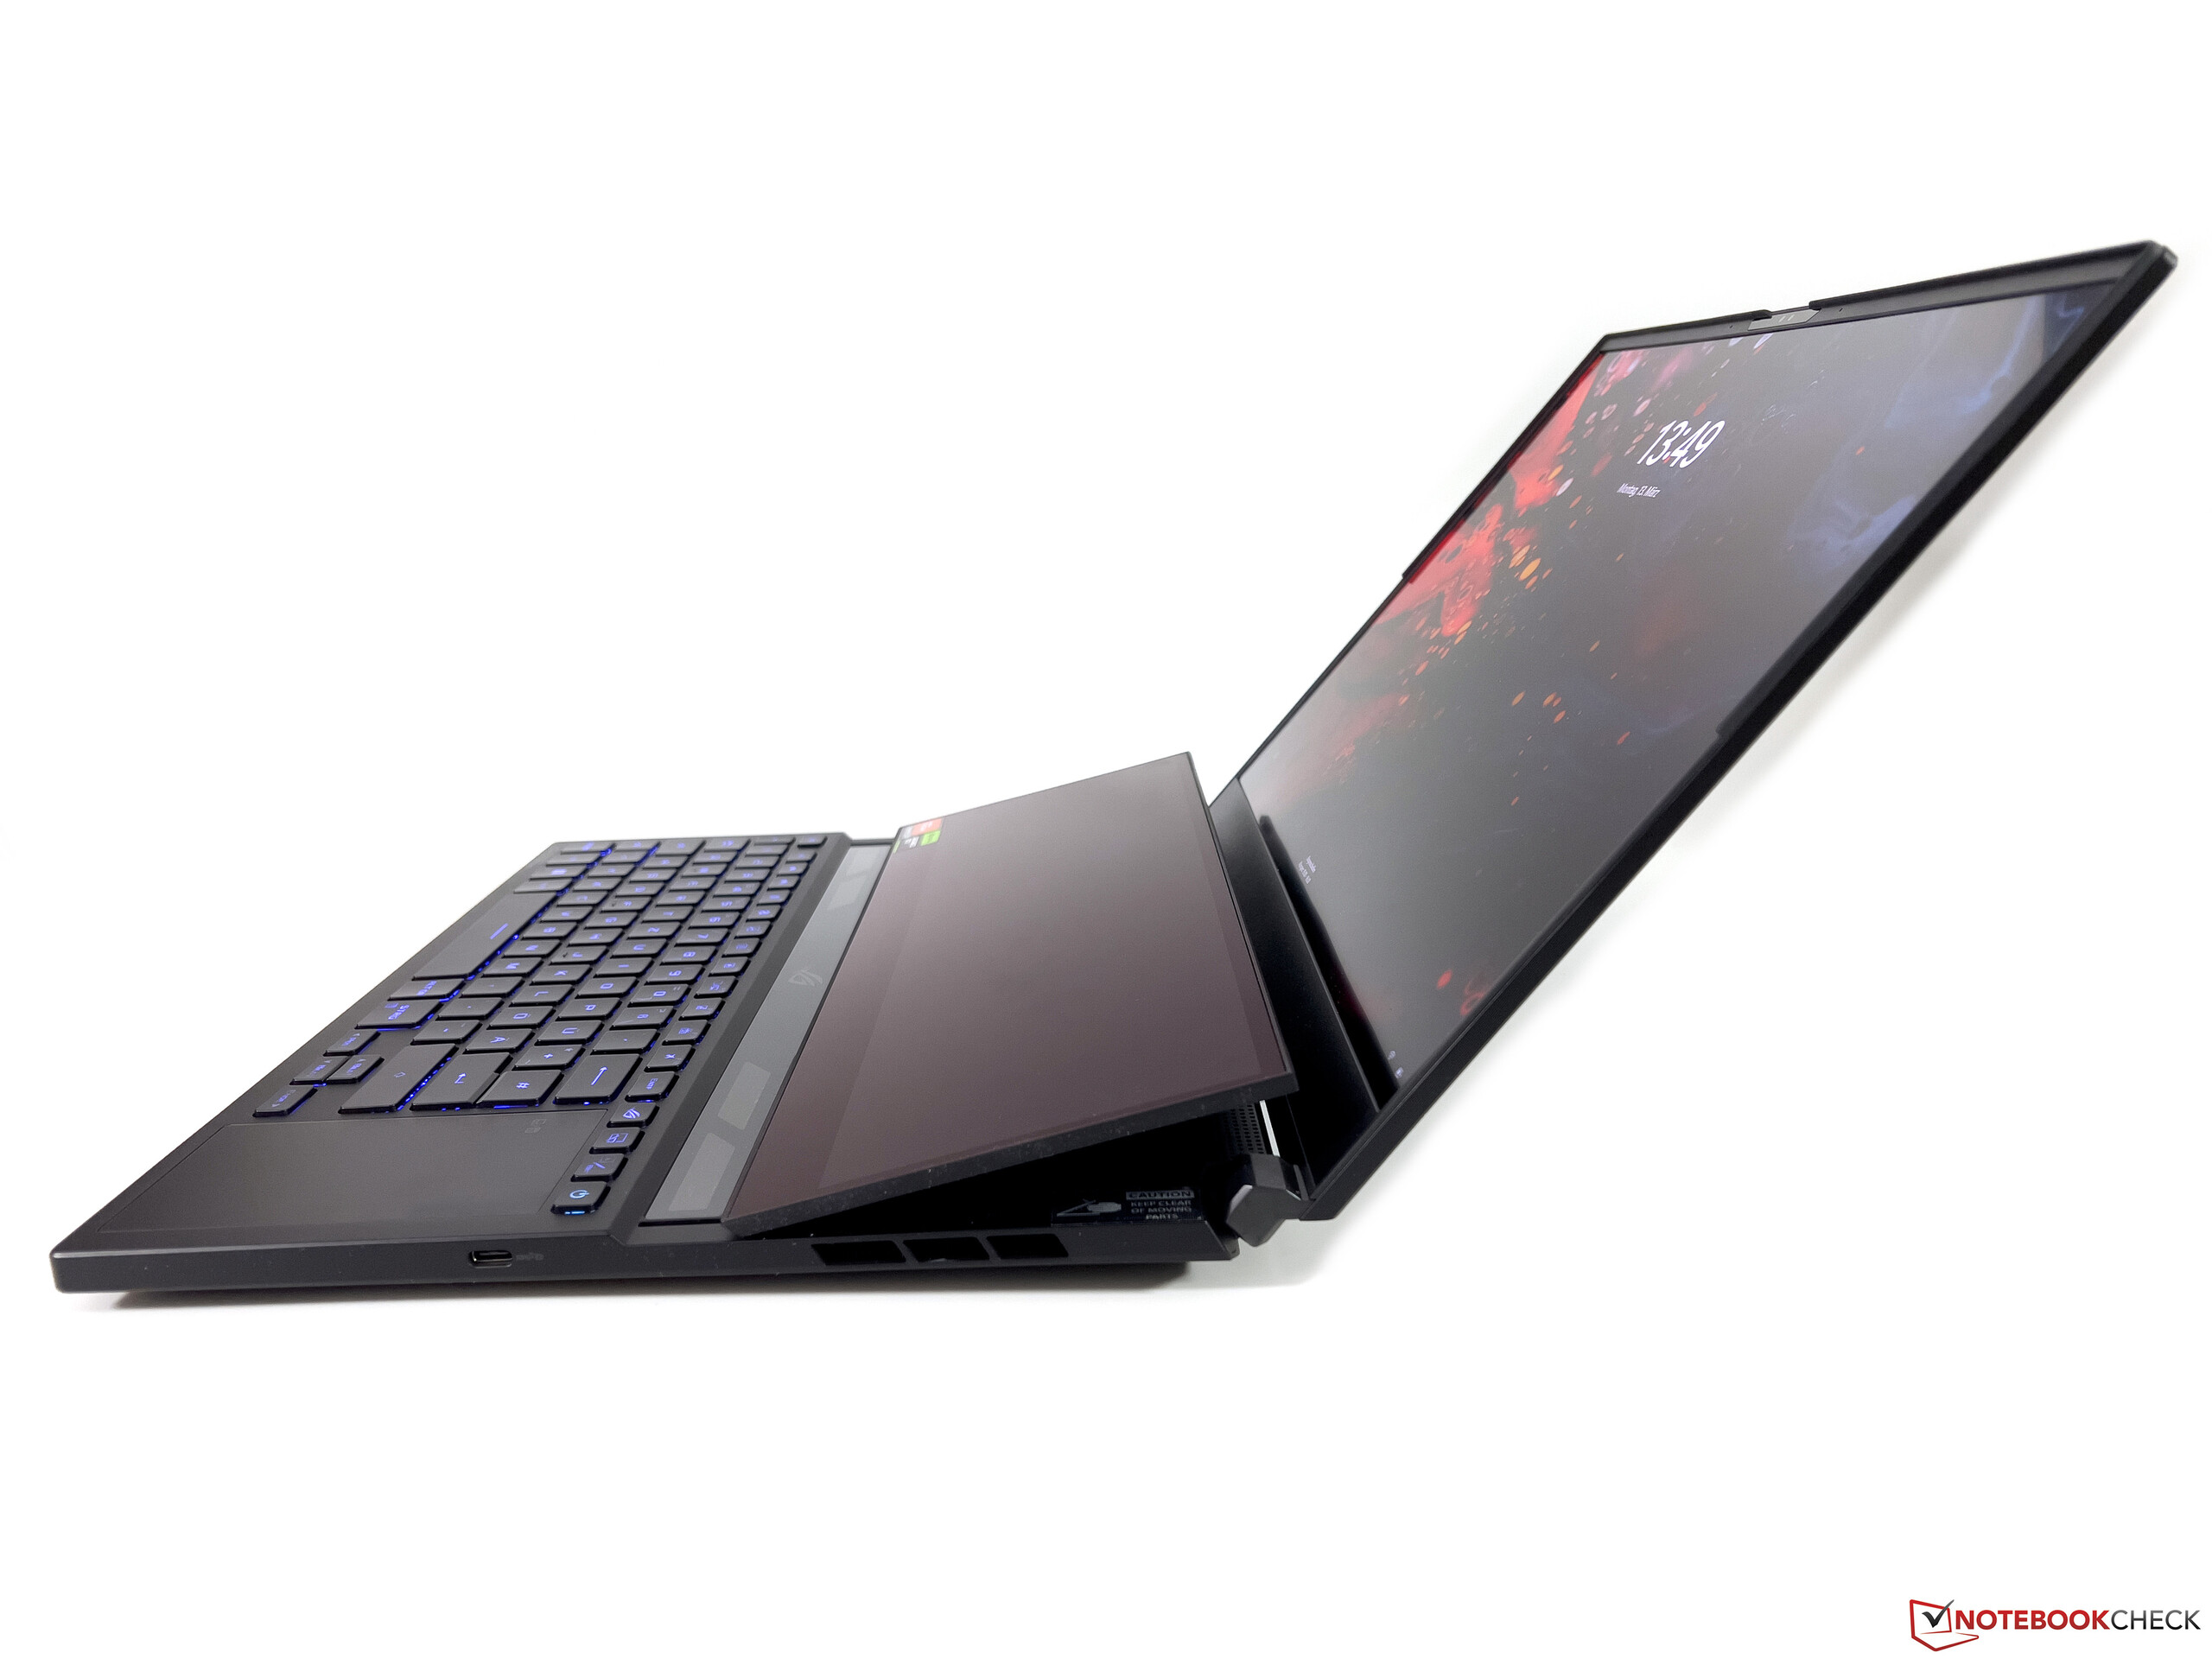
我们的尺寸比较显示,17英寸MSI Titan GT77有一个更大的足迹,但它也表明,ROG Zephyrus Duo 16是迄今为止我们的小对比组中最厚的设备。这显然是由副屏幕造成的,它需要额外的空间。它也是最重的16英寸机型之一,将近2.7公斤,你还必须考虑笨重的330瓦电源,它的重量超过1.1公斤。
连接性 - 读卡器,但没有USB 4.0
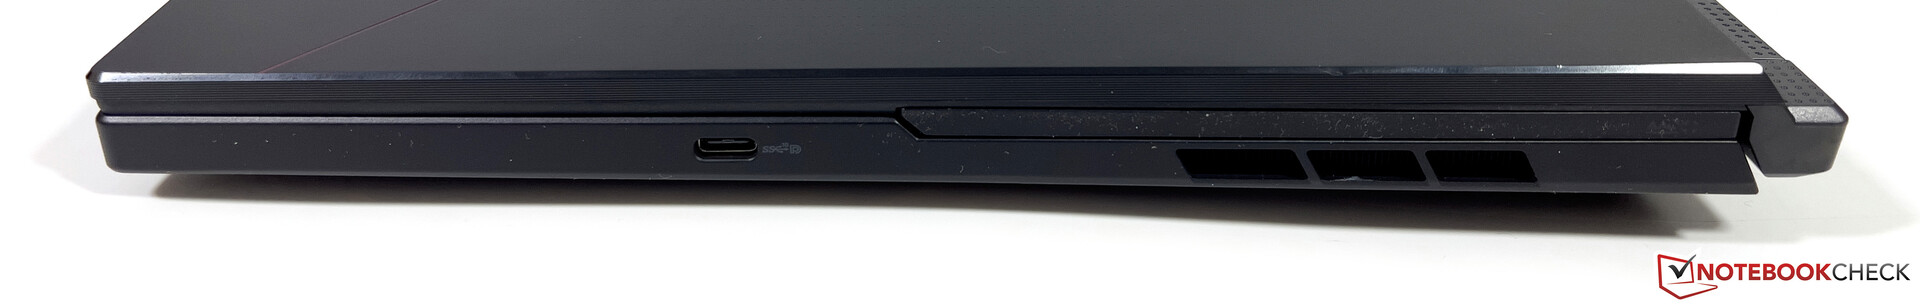
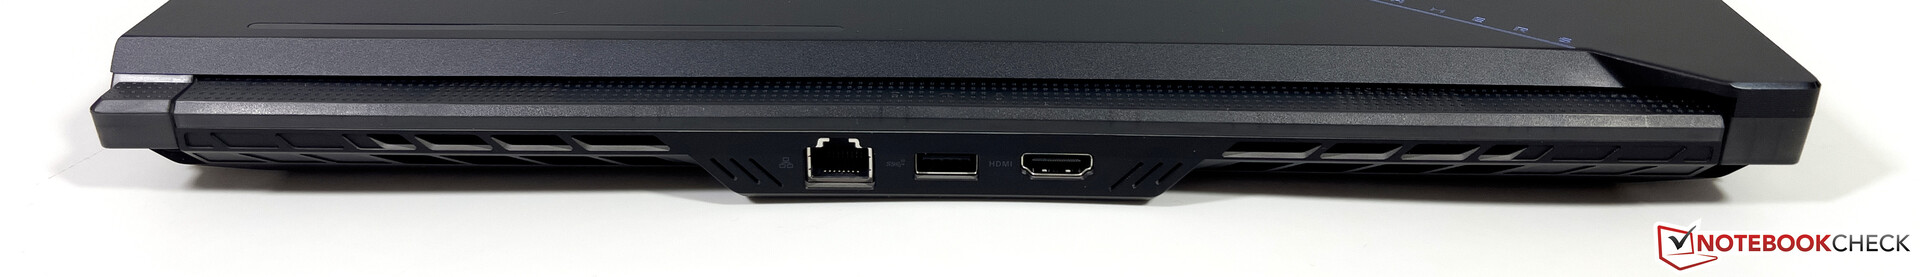
底座的后部区域几乎完全被散热所占据,这就是为什么在后部中央只有三个端口(以太网、HDMI、USB-A)。其余的大部分端口位于左侧的前端,倾斜的电源接口也是如此。来自PSU的电缆相当短,所以电源线会挡住USB-A端口,这取决于方向。在左侧还有一个USB-C接口。
除了有点不方便的端口布局外,我们对华硕没有包括USB 4支持感到惊讶。AMD处理器总体上支持USB 4,但需要一个额外的USB控制器,而华硕似乎不想花这个钱。
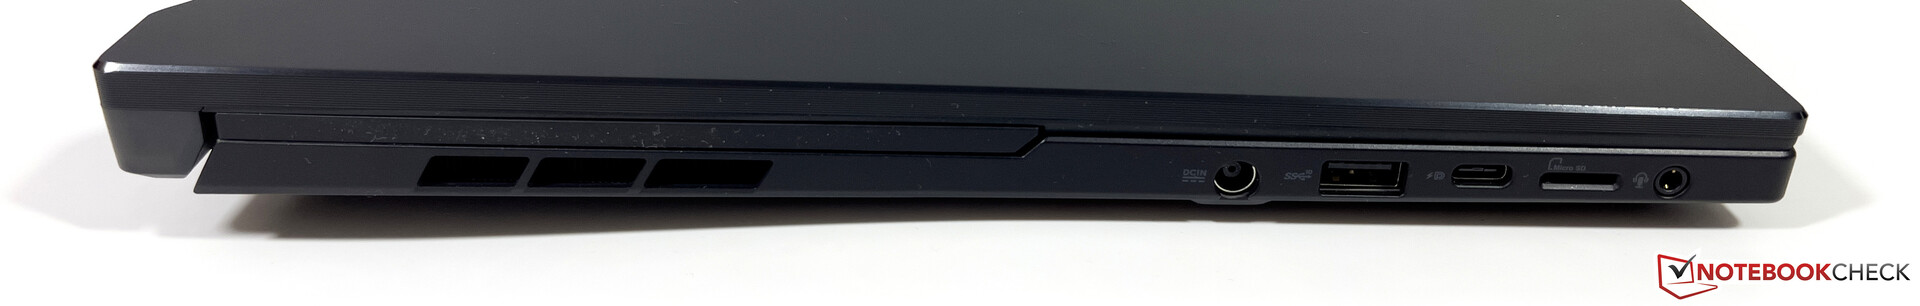
SD卡阅读器
左侧有一个microSD读卡器,SD卡与机箱平齐。与我们的参考卡(Angelbird AV Pro V60 128 GB)相结合的传输速率非常好,我们测量到270 MB/s,当我们复制jpeg图像文件时超过180 MB/s。
| SD Card Reader | |
| average JPG Copy Test (av. of 3 runs) | |
| Apple MacBook Pro 16 2023 M2 Max (Angelbird AV Pro V60) | |
| Asus Zephyrus Duo 16 GX650PY-NM006W (Angelbird AV Pro V60) | |
| Asus ROG Zephyrus Duo 16 GX650RX (AV PRO microSD 128 GB V60) | |
| Average of class Gaming (20.9 - 210, n=54, last 2 years) | |
| Razer Blade 16 Early 2023 (AV PRO microSD 128 GB V60) | |
| MSI Titan GT77 HX 13VI (Angelibird AV Pro V60) | |
| maximum AS SSD Seq Read Test (1GB) | |
| Asus Zephyrus Duo 16 GX650PY-NM006W (Angelbird AV Pro V60) | |
| Apple MacBook Pro 16 2023 M2 Max (Angelbird AV Pro V60) | |
| Razer Blade 16 Early 2023 (AV PRO microSD 128 GB V60) | |
| Asus ROG Zephyrus Duo 16 GX650RX (AV PRO microSD 128 GB V60) | |
| Average of class Gaming (25.5 - 261, n=51, last 2 years) | |
| MSI Titan GT77 HX 13VI (Angelibird AV Pro V60) | |
沟通
你在后面得到一个2.5Gbps的以太网插口,Wi-Fi模块(RZ616)也支持现代的6GHz网络的Wi-Fi 6E标准。我们用华硕的参考路由器使用相应的6GHz Wi-Fi网络没有任何问题,传输率非常高而且稳定。蓝牙5.2也被支持。
| Networking | |
| Asus Zephyrus Duo 16 GX650PY-NM006W | |
| iperf3 transmit AXE11000 6GHz | |
| iperf3 receive AXE11000 6GHz | |
| MSI Titan GT77 HX 13VI | |
| iperf3 transmit AXE11000 | |
| iperf3 receive AXE11000 | |
| Lenovo Legion Pro 7 16IRX8H | |
| iperf3 transmit AXE11000 | |
| iperf3 receive AXE11000 | |
| Razer Blade 16 Early 2023 | |
| iperf3 transmit AXE11000 | |
| iperf3 receive AXE11000 | |
| iperf3 transmit AXE11000 6GHz | |
| iperf3 receive AXE11000 6GHz | |
| Asus ROG Zephyrus Duo 16 GX650RX | |
| iperf3 transmit AXE11000 | |
| iperf3 receive AXE11000 | |
| Apple MacBook Pro 16 2023 M2 Max | |
| iperf3 transmit AXE11000 6GHz | |
| iperf3 receive AXE11000 6GHz | |
网络摄像头
华硕升级了网络摄像头,现在使用1080p传感器。与以前的型号相比,这对图像的清晰度有积极的影响,但色彩准确性仍然不是很好。ROG Zephyrus Duo 16不提供机械快门。


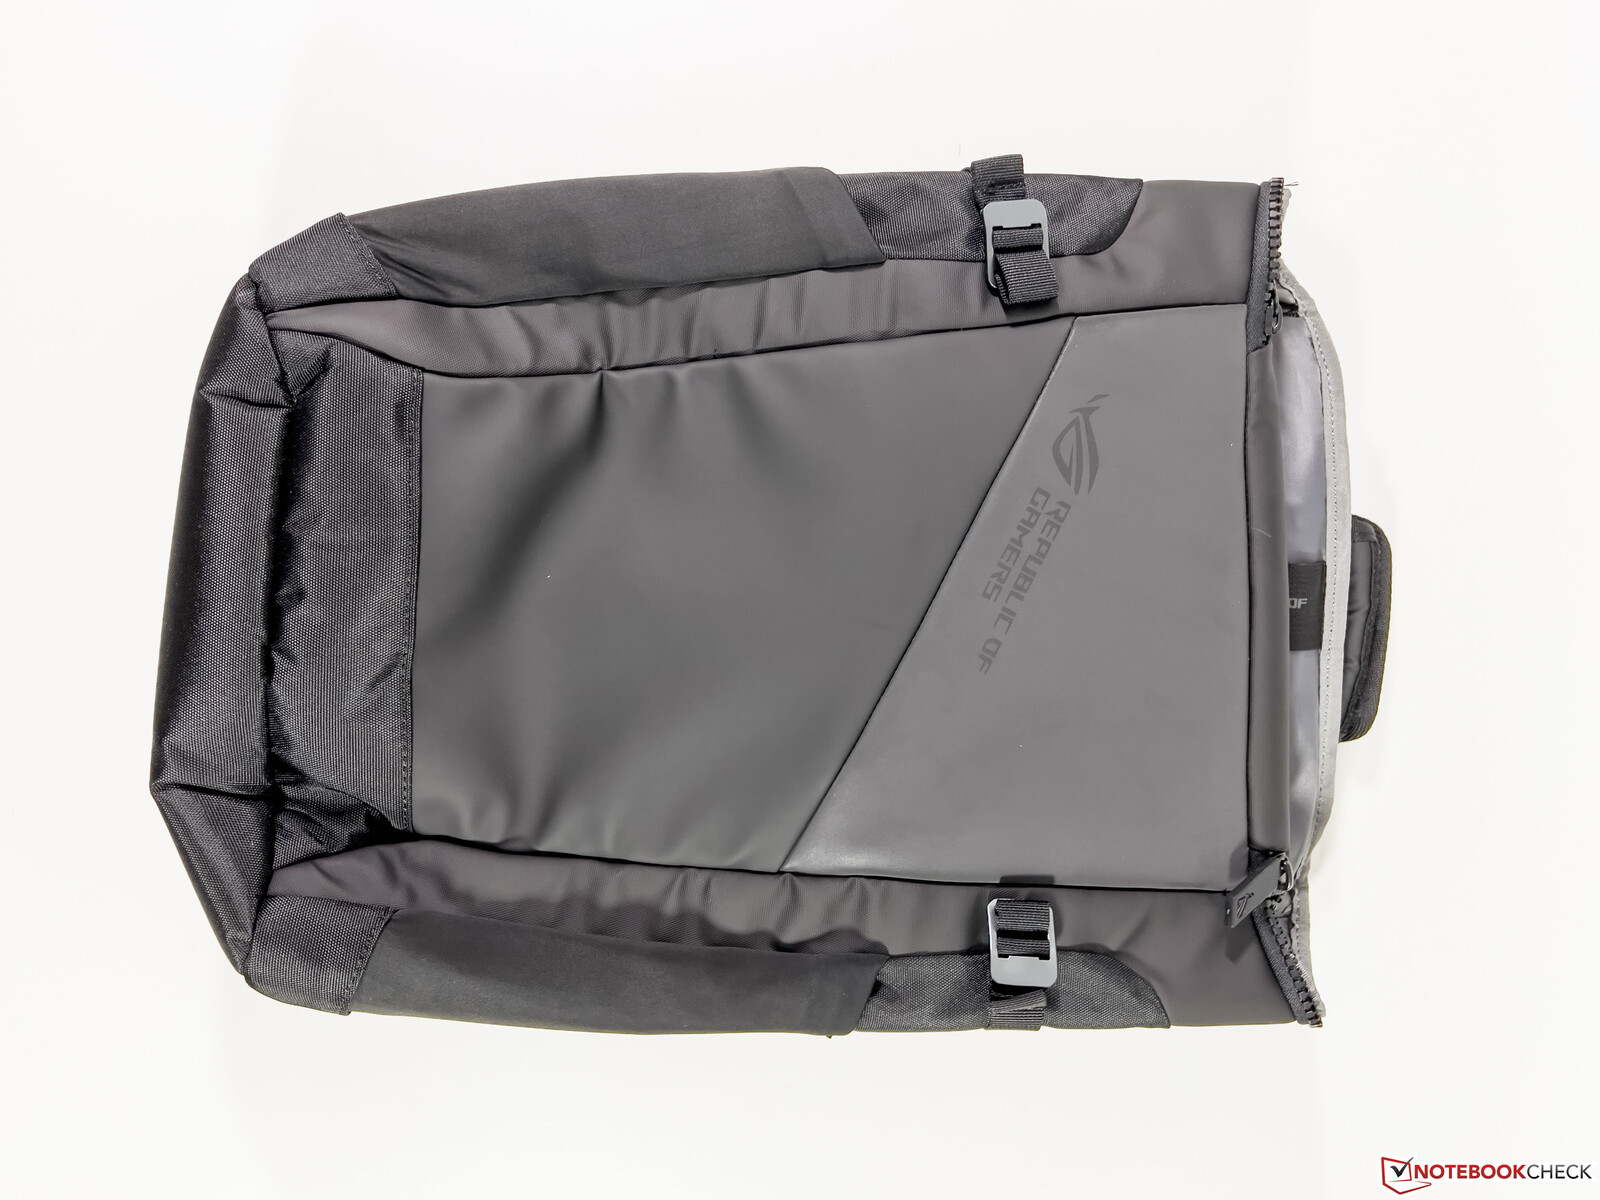
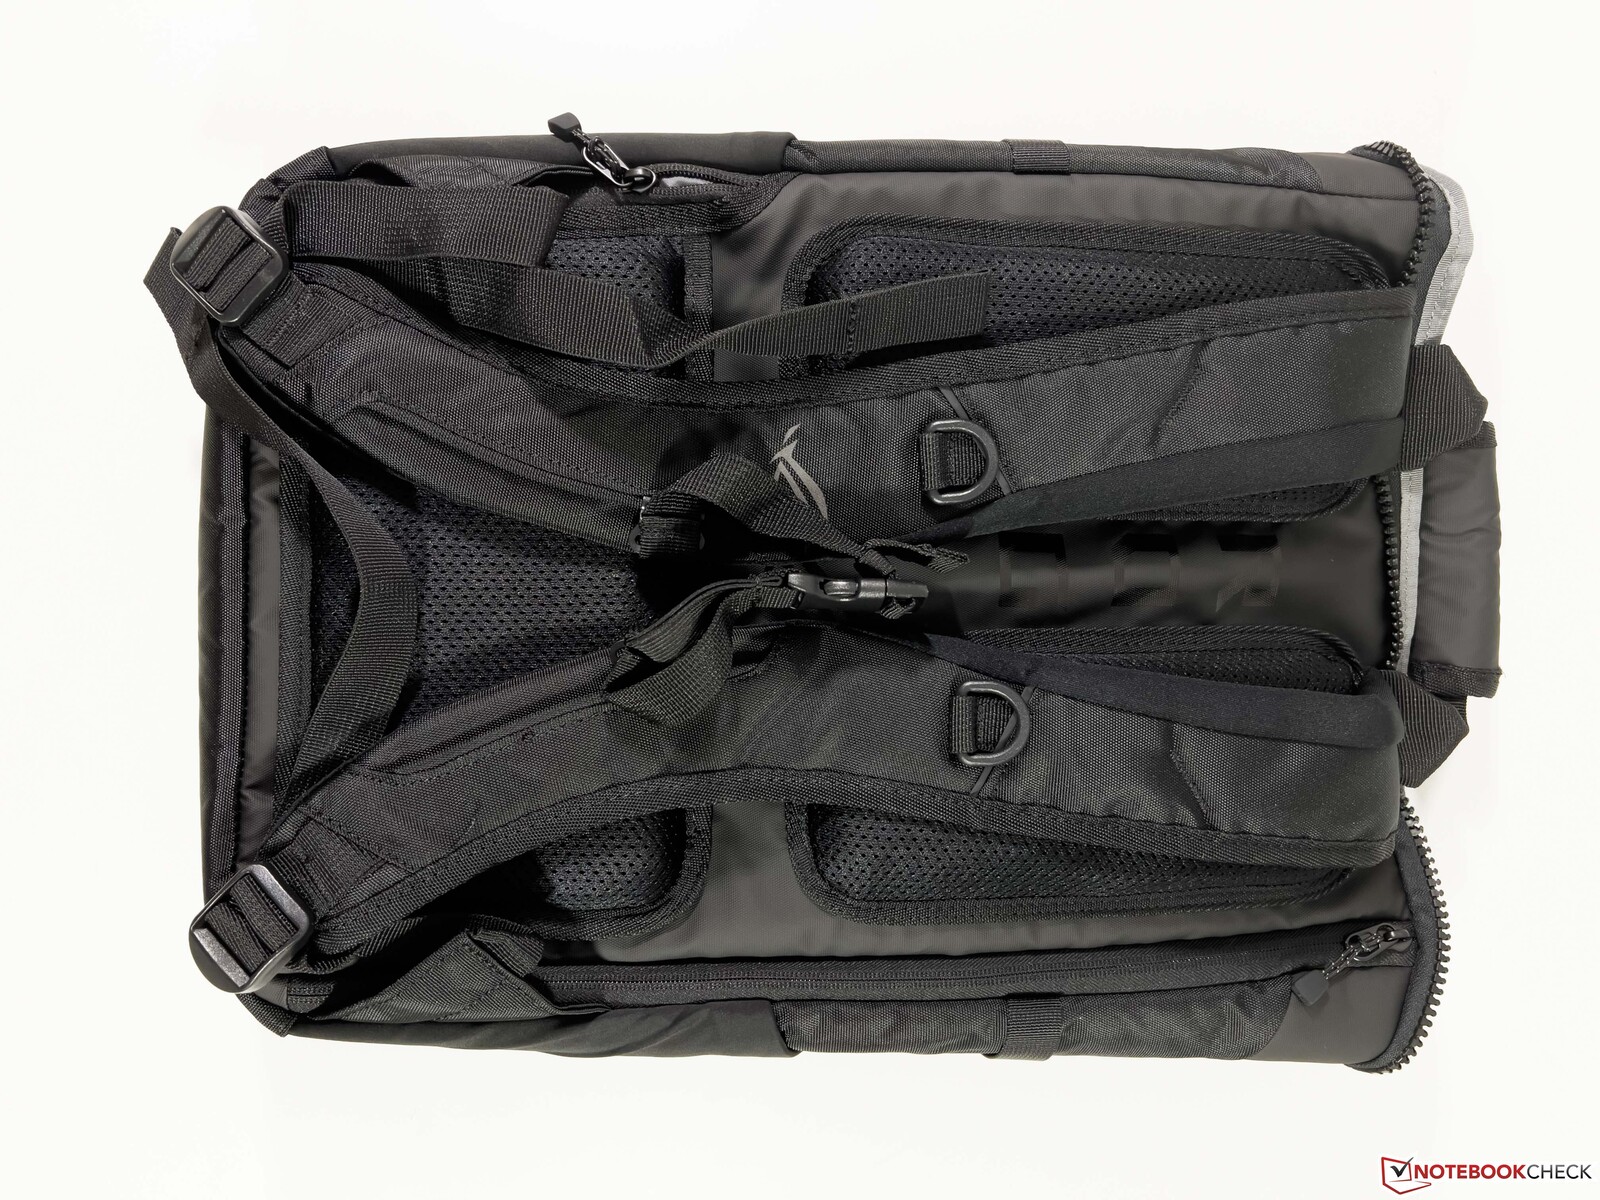
辅料
每个版本的ROG Zephyrus Duo 16在发货时都有一个橡胶掌托以及一个深色的ROG背包,这给人留下了相当好的质量印象。配备Windows 11专业版、64GB内存和2或4TB SSD存储的更昂贵的设备还包括ROG Fusion II 300耳机以及游戏鼠标ROG Gladius III Mouse P514。
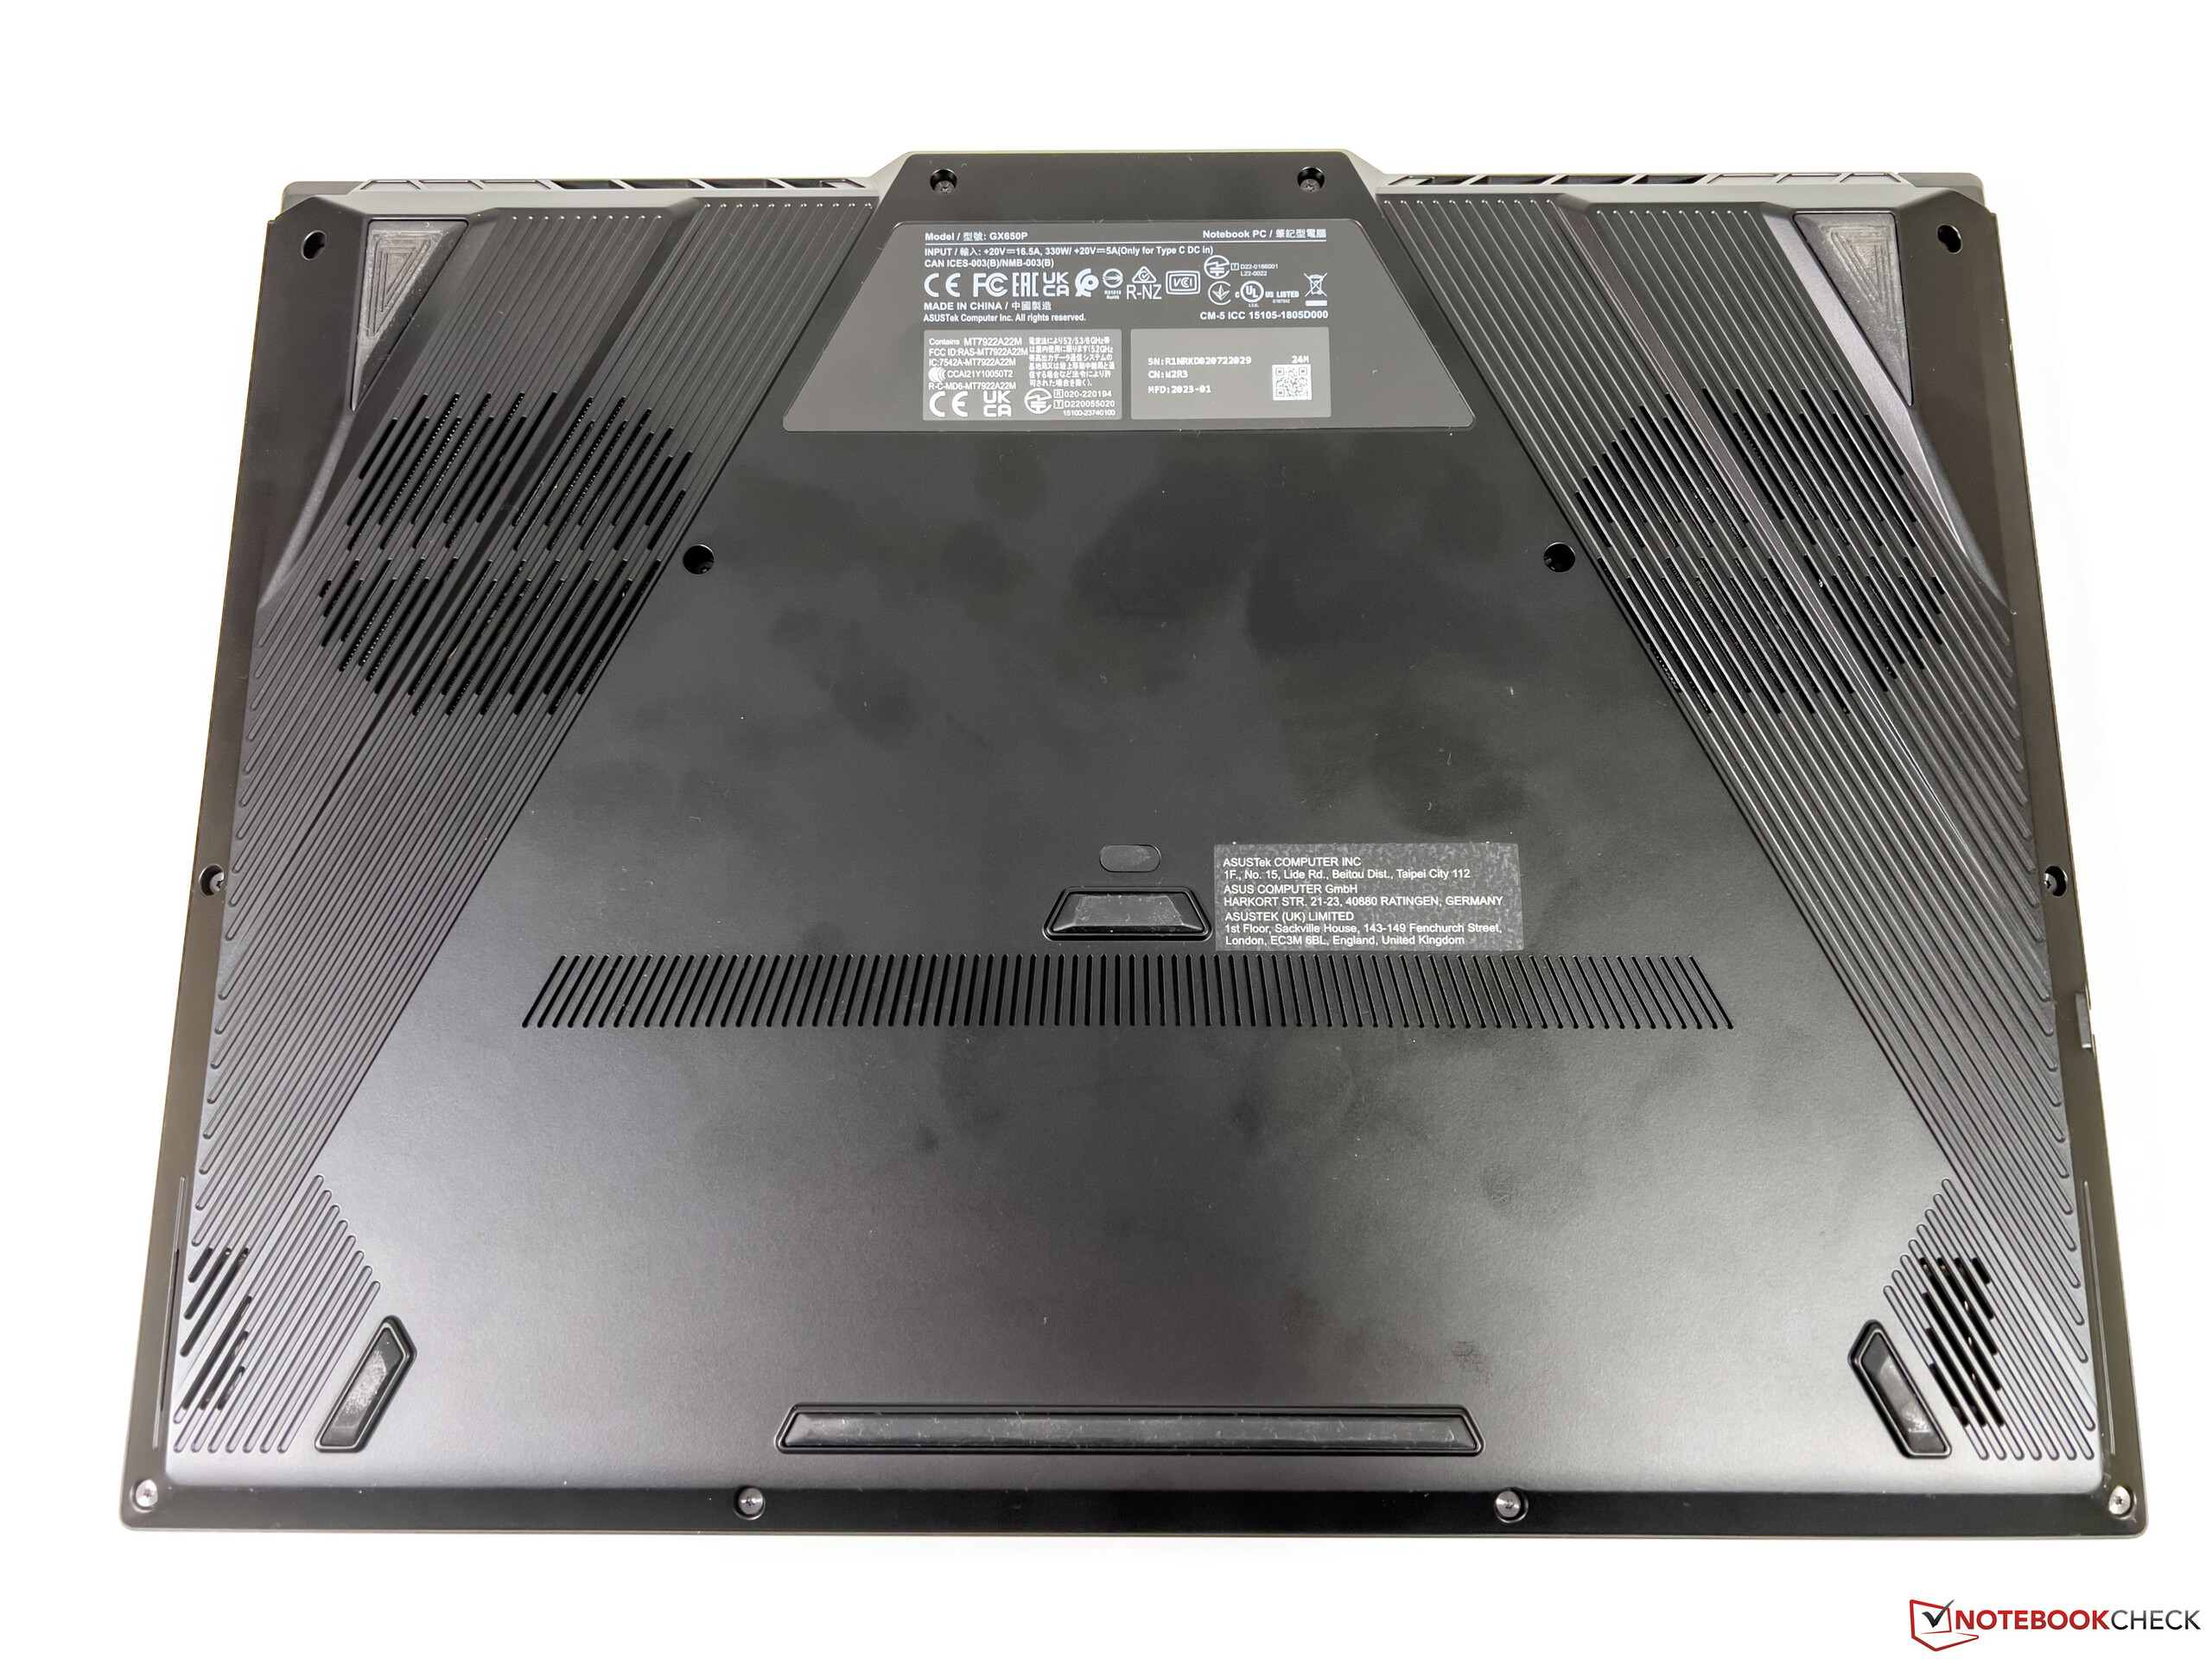
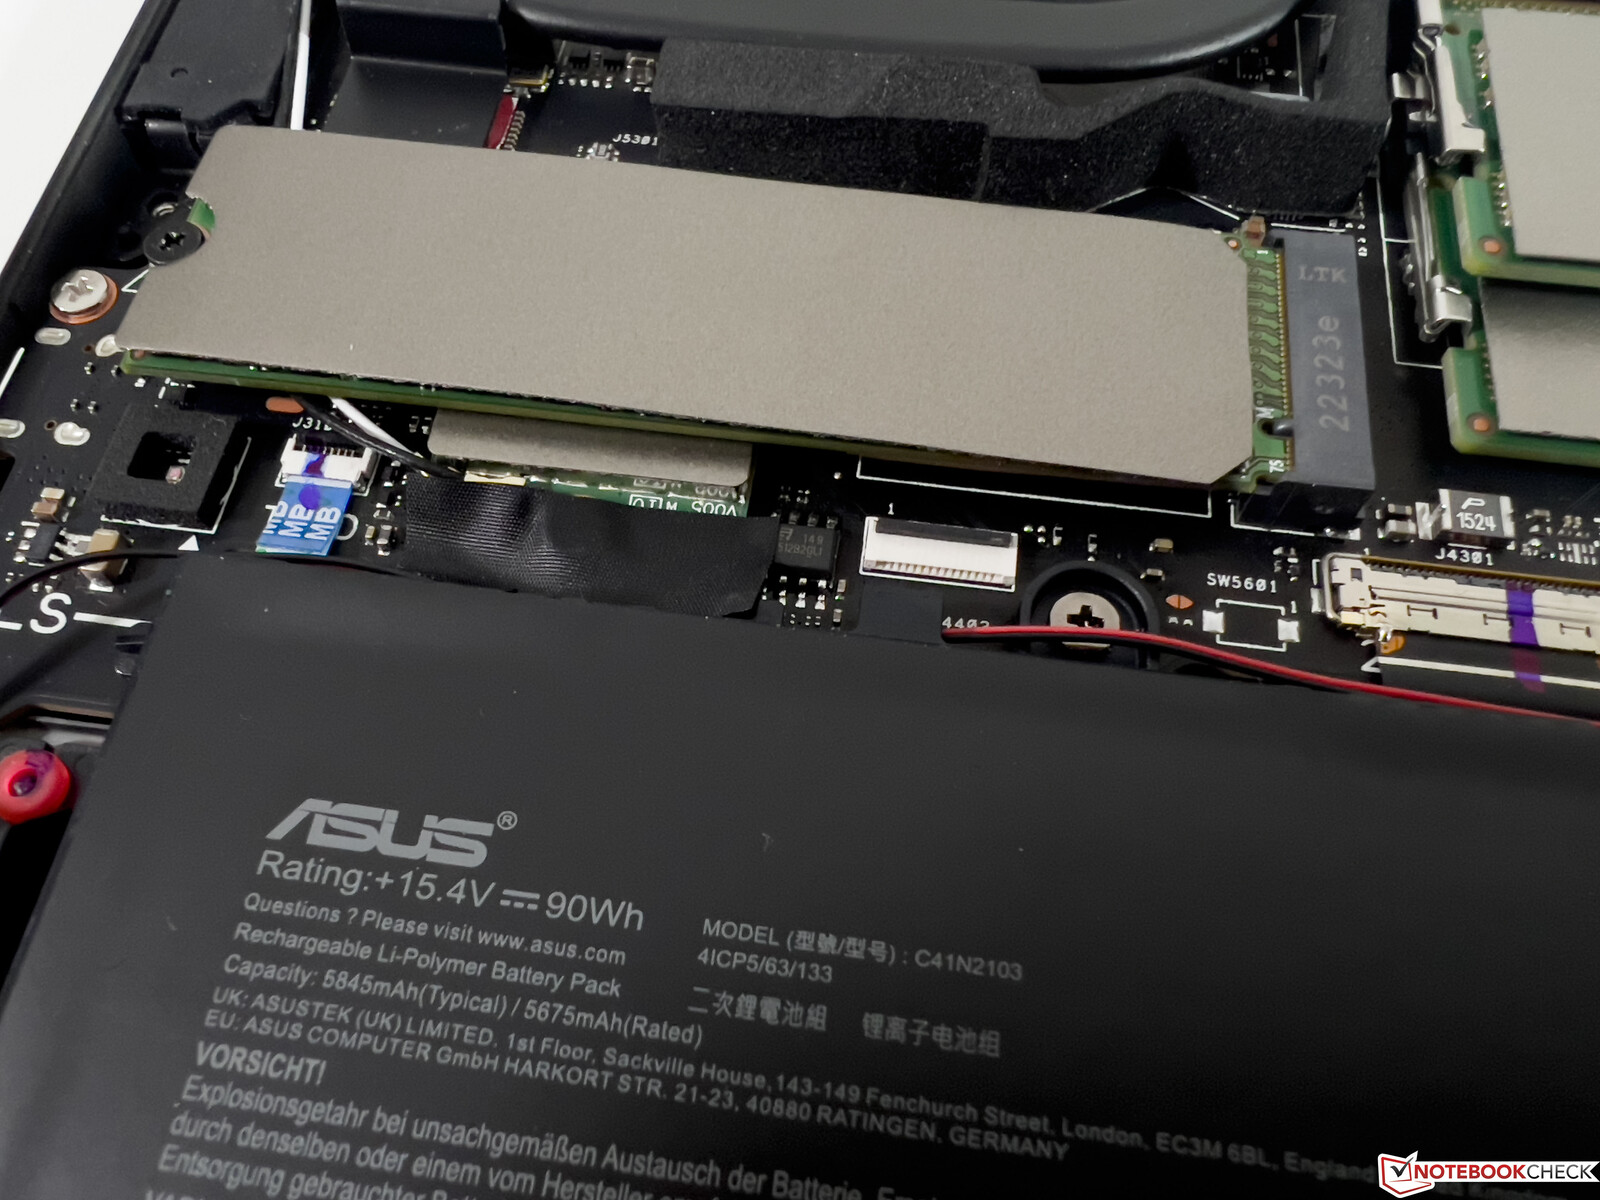
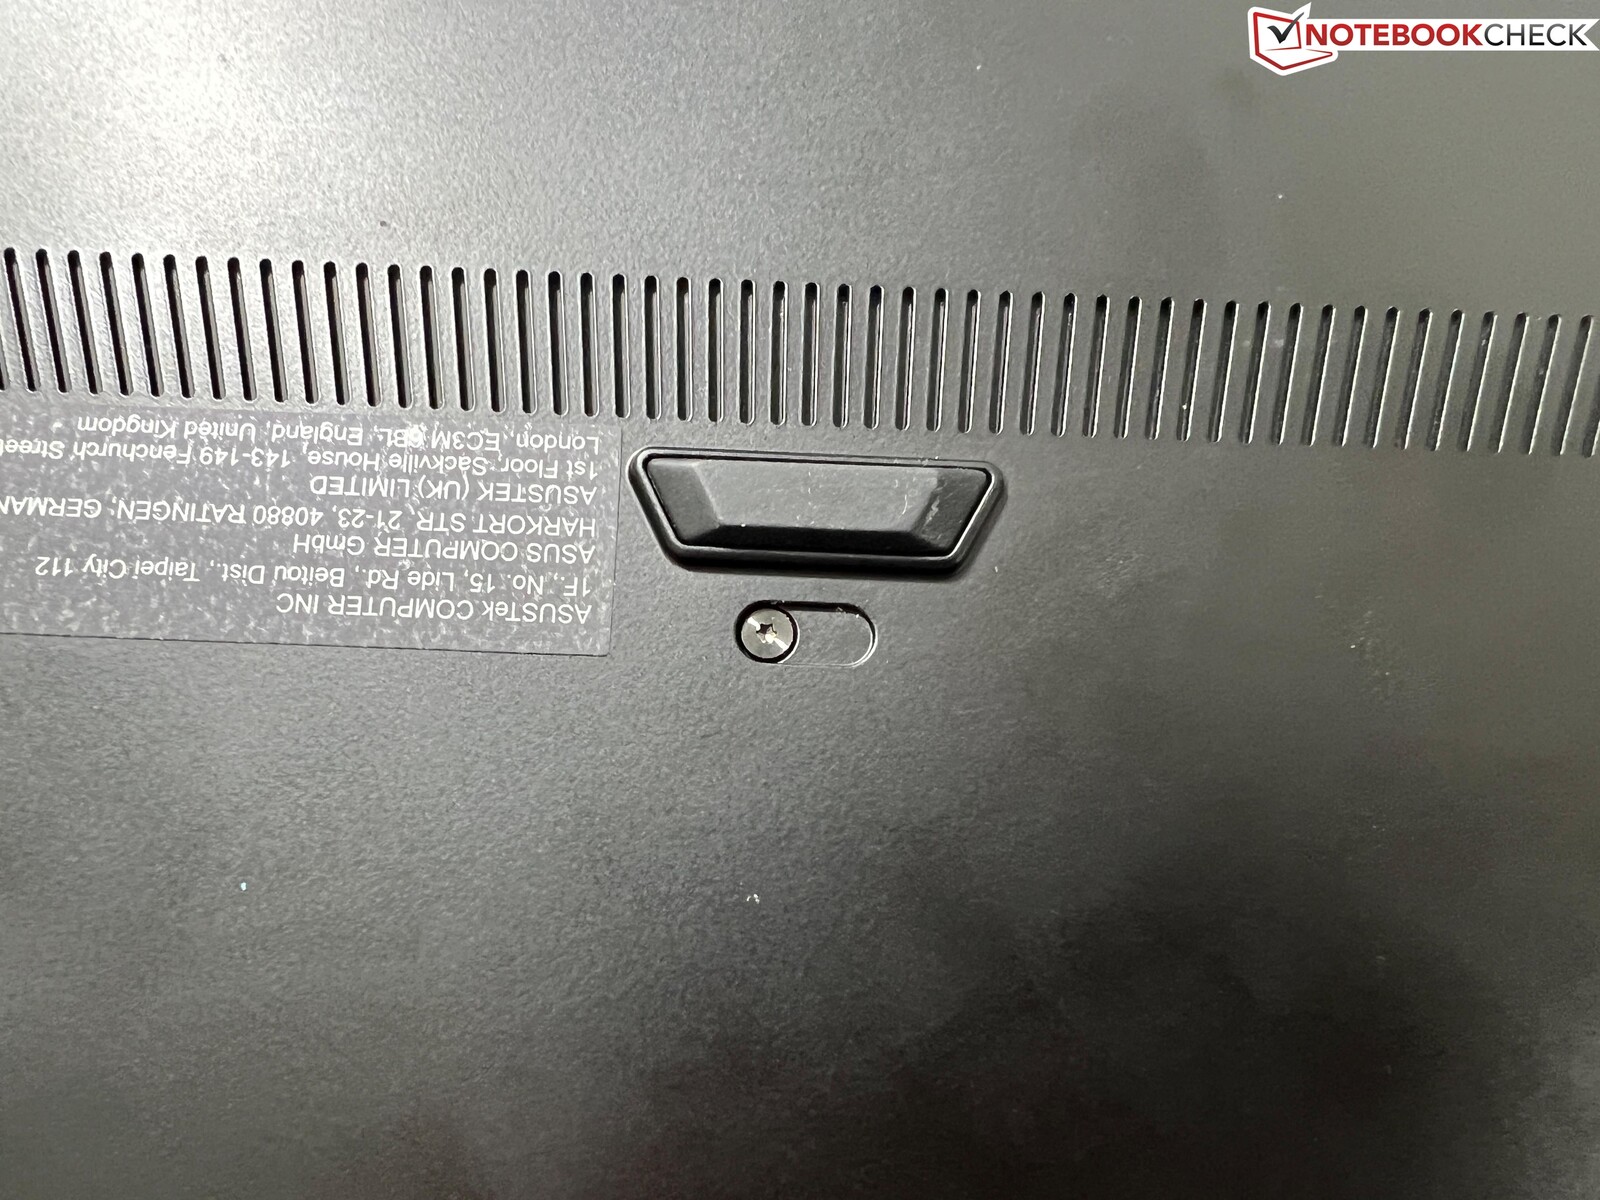
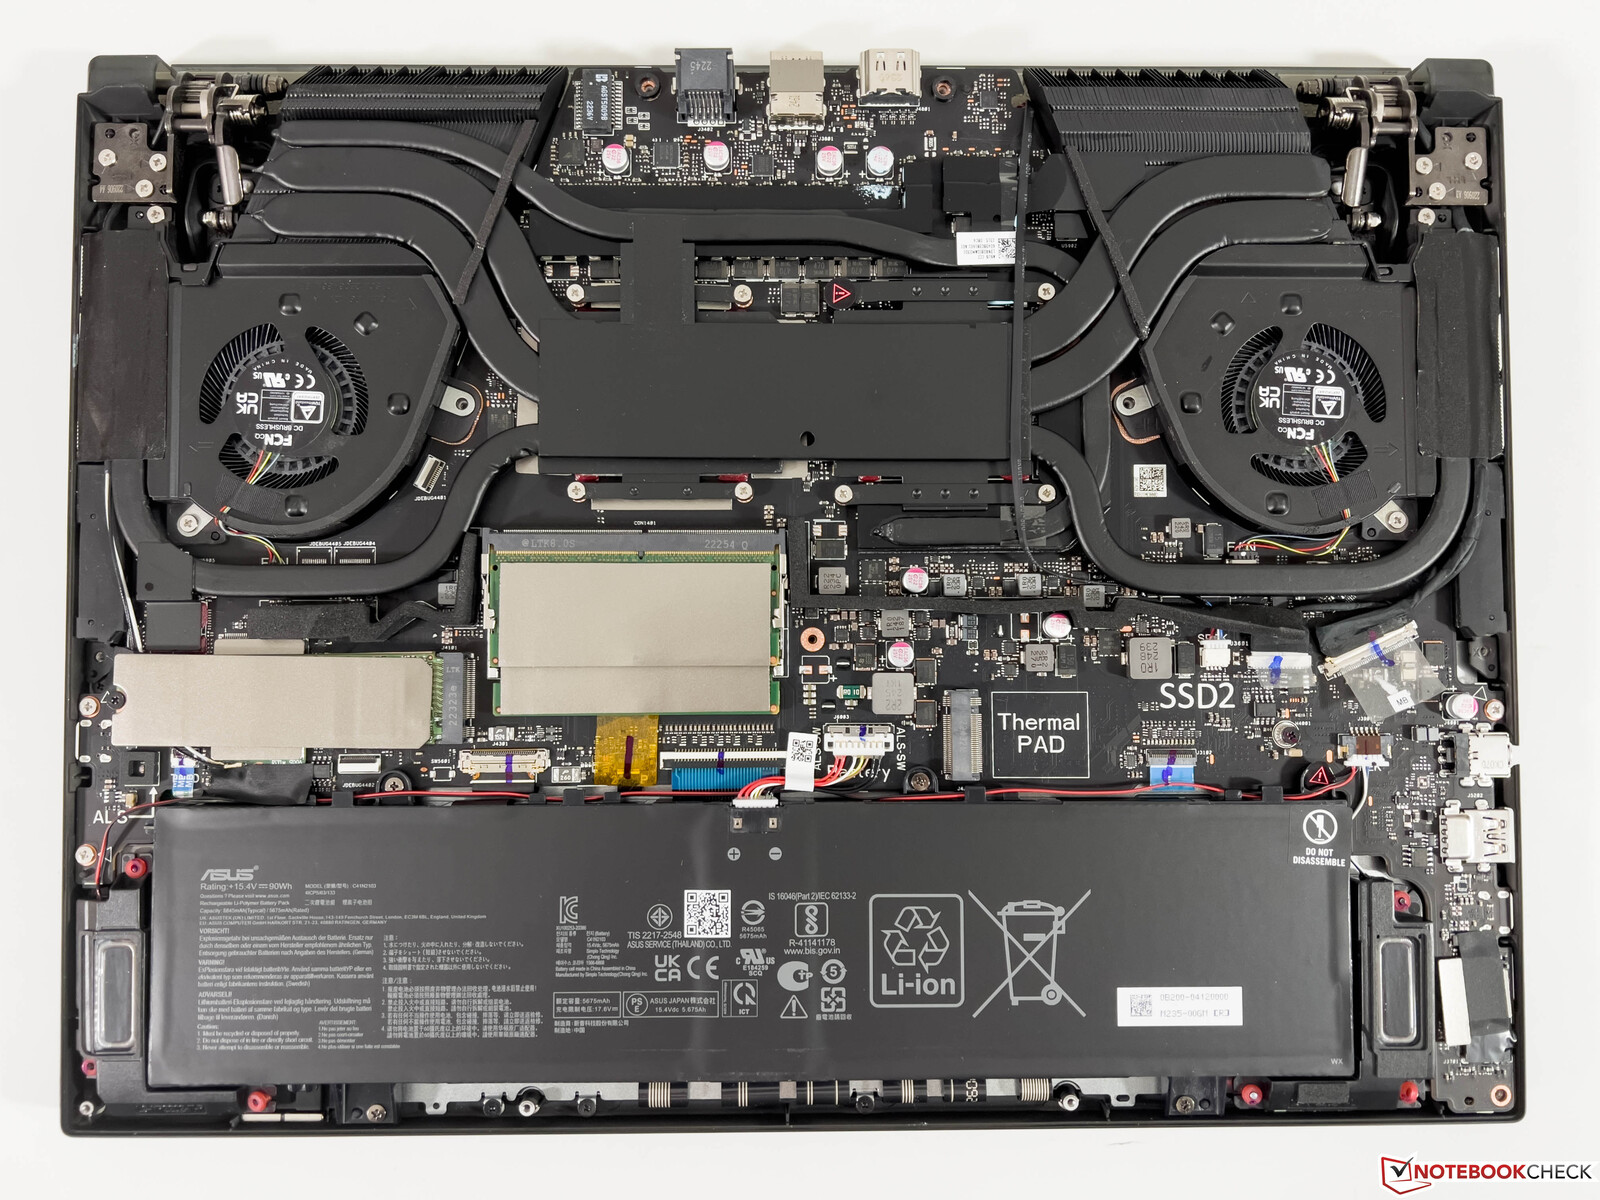
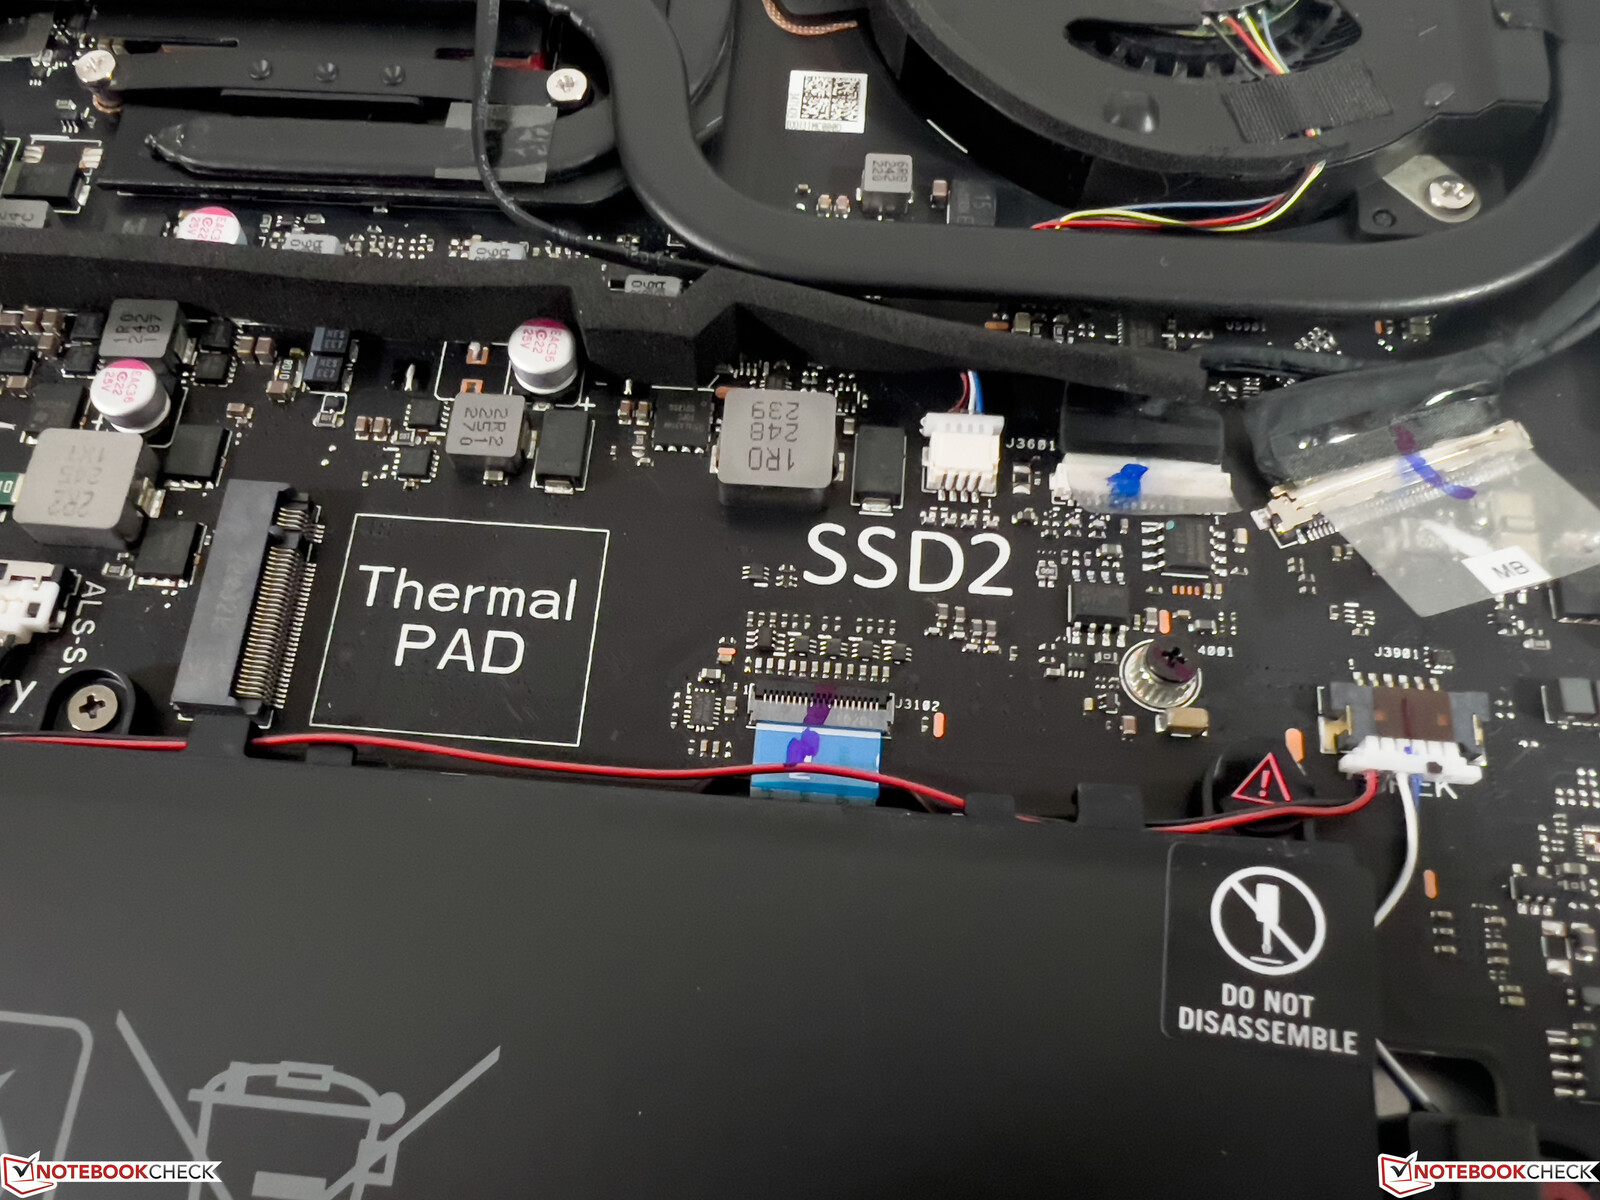
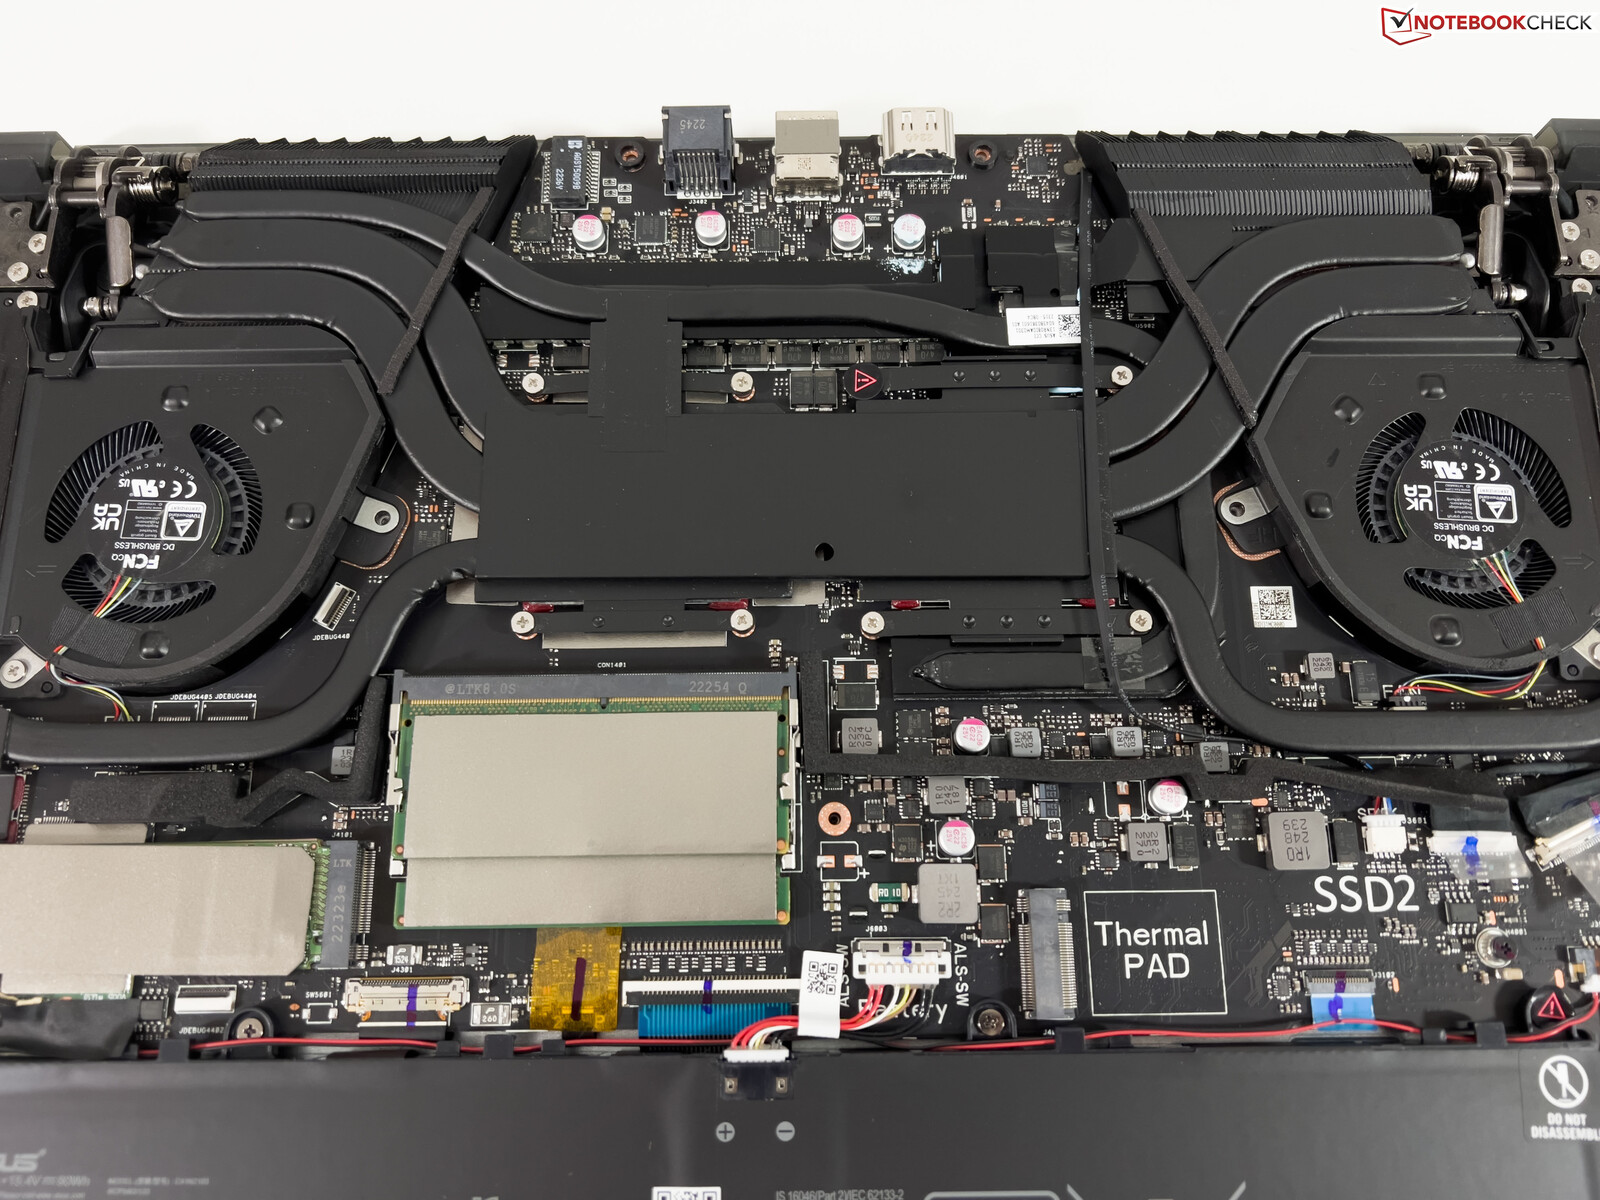
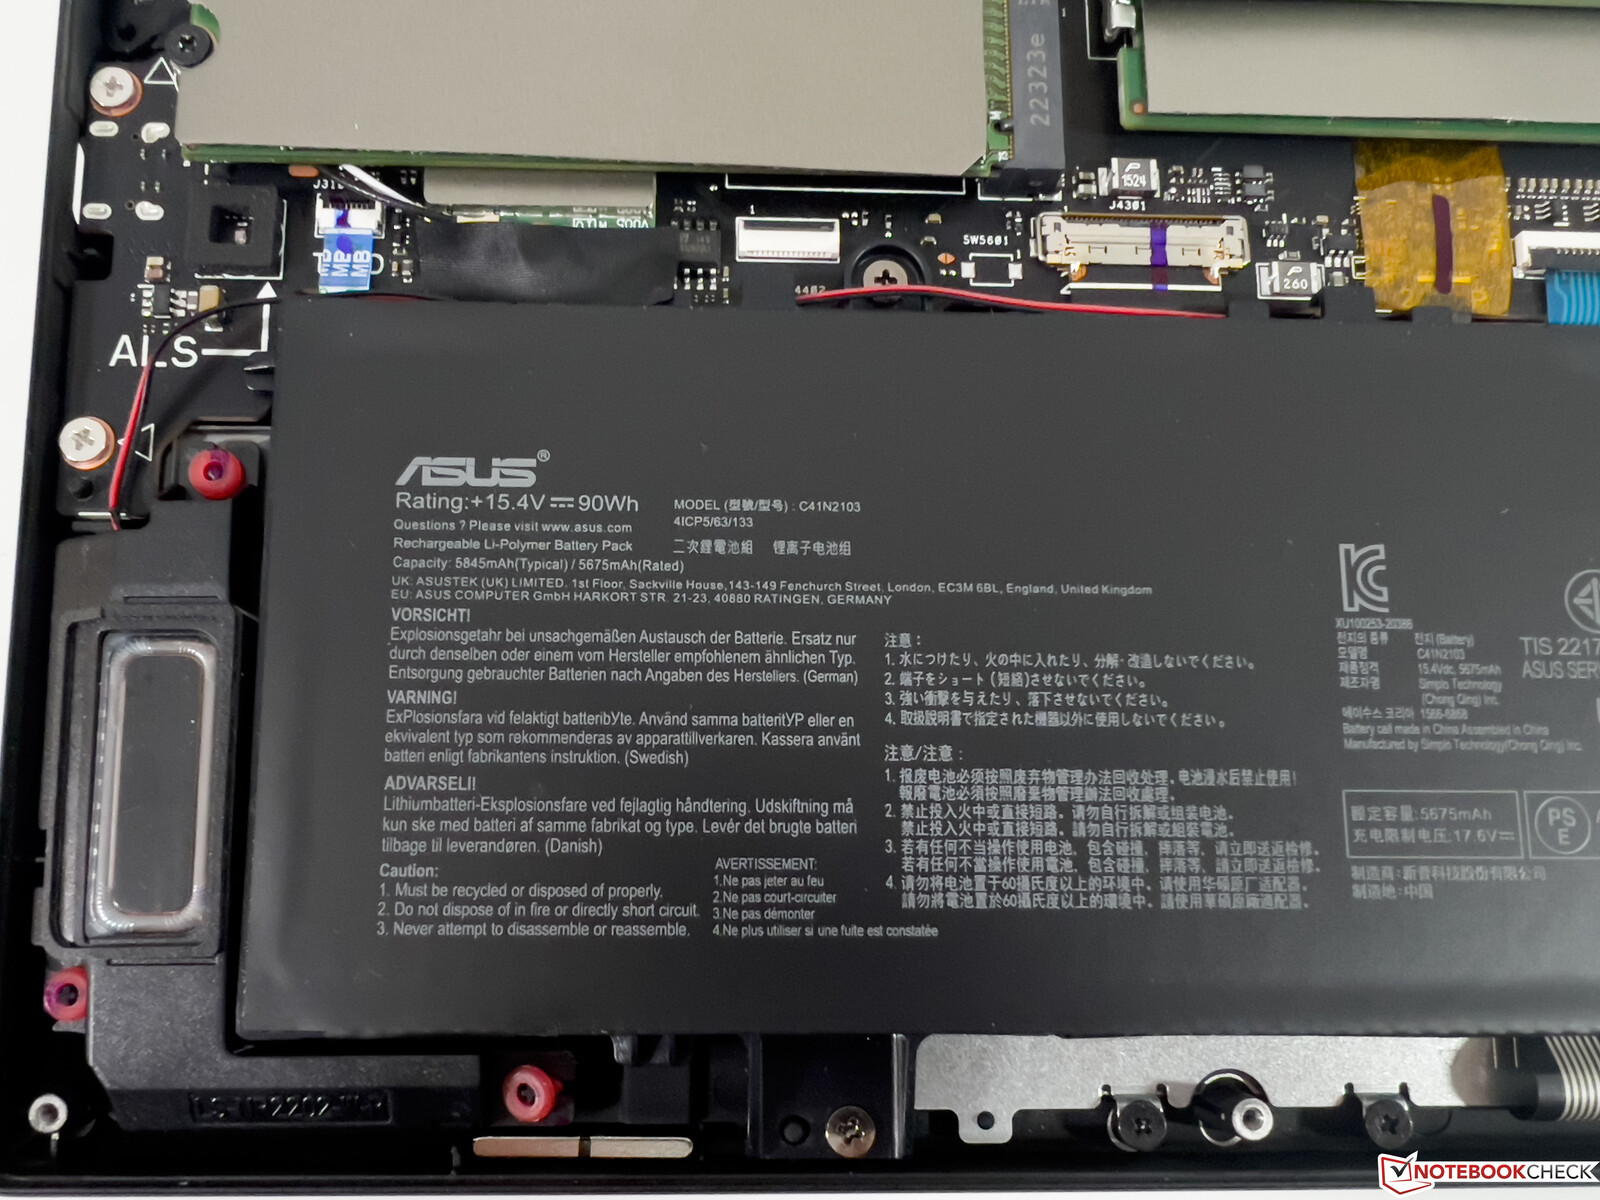
维护
底盖由几颗Torx螺丝(TR6)固定,但还有一颗螺丝隐藏在中间的胶合橡胶垫下面,这使得访问内部结构变得不必要的复杂。里面有两个SO-DIMM插槽,以及两个用于SSD的M.2-2280插槽。也可以更换Wi-Fi模块,但你必须先移除SSD。
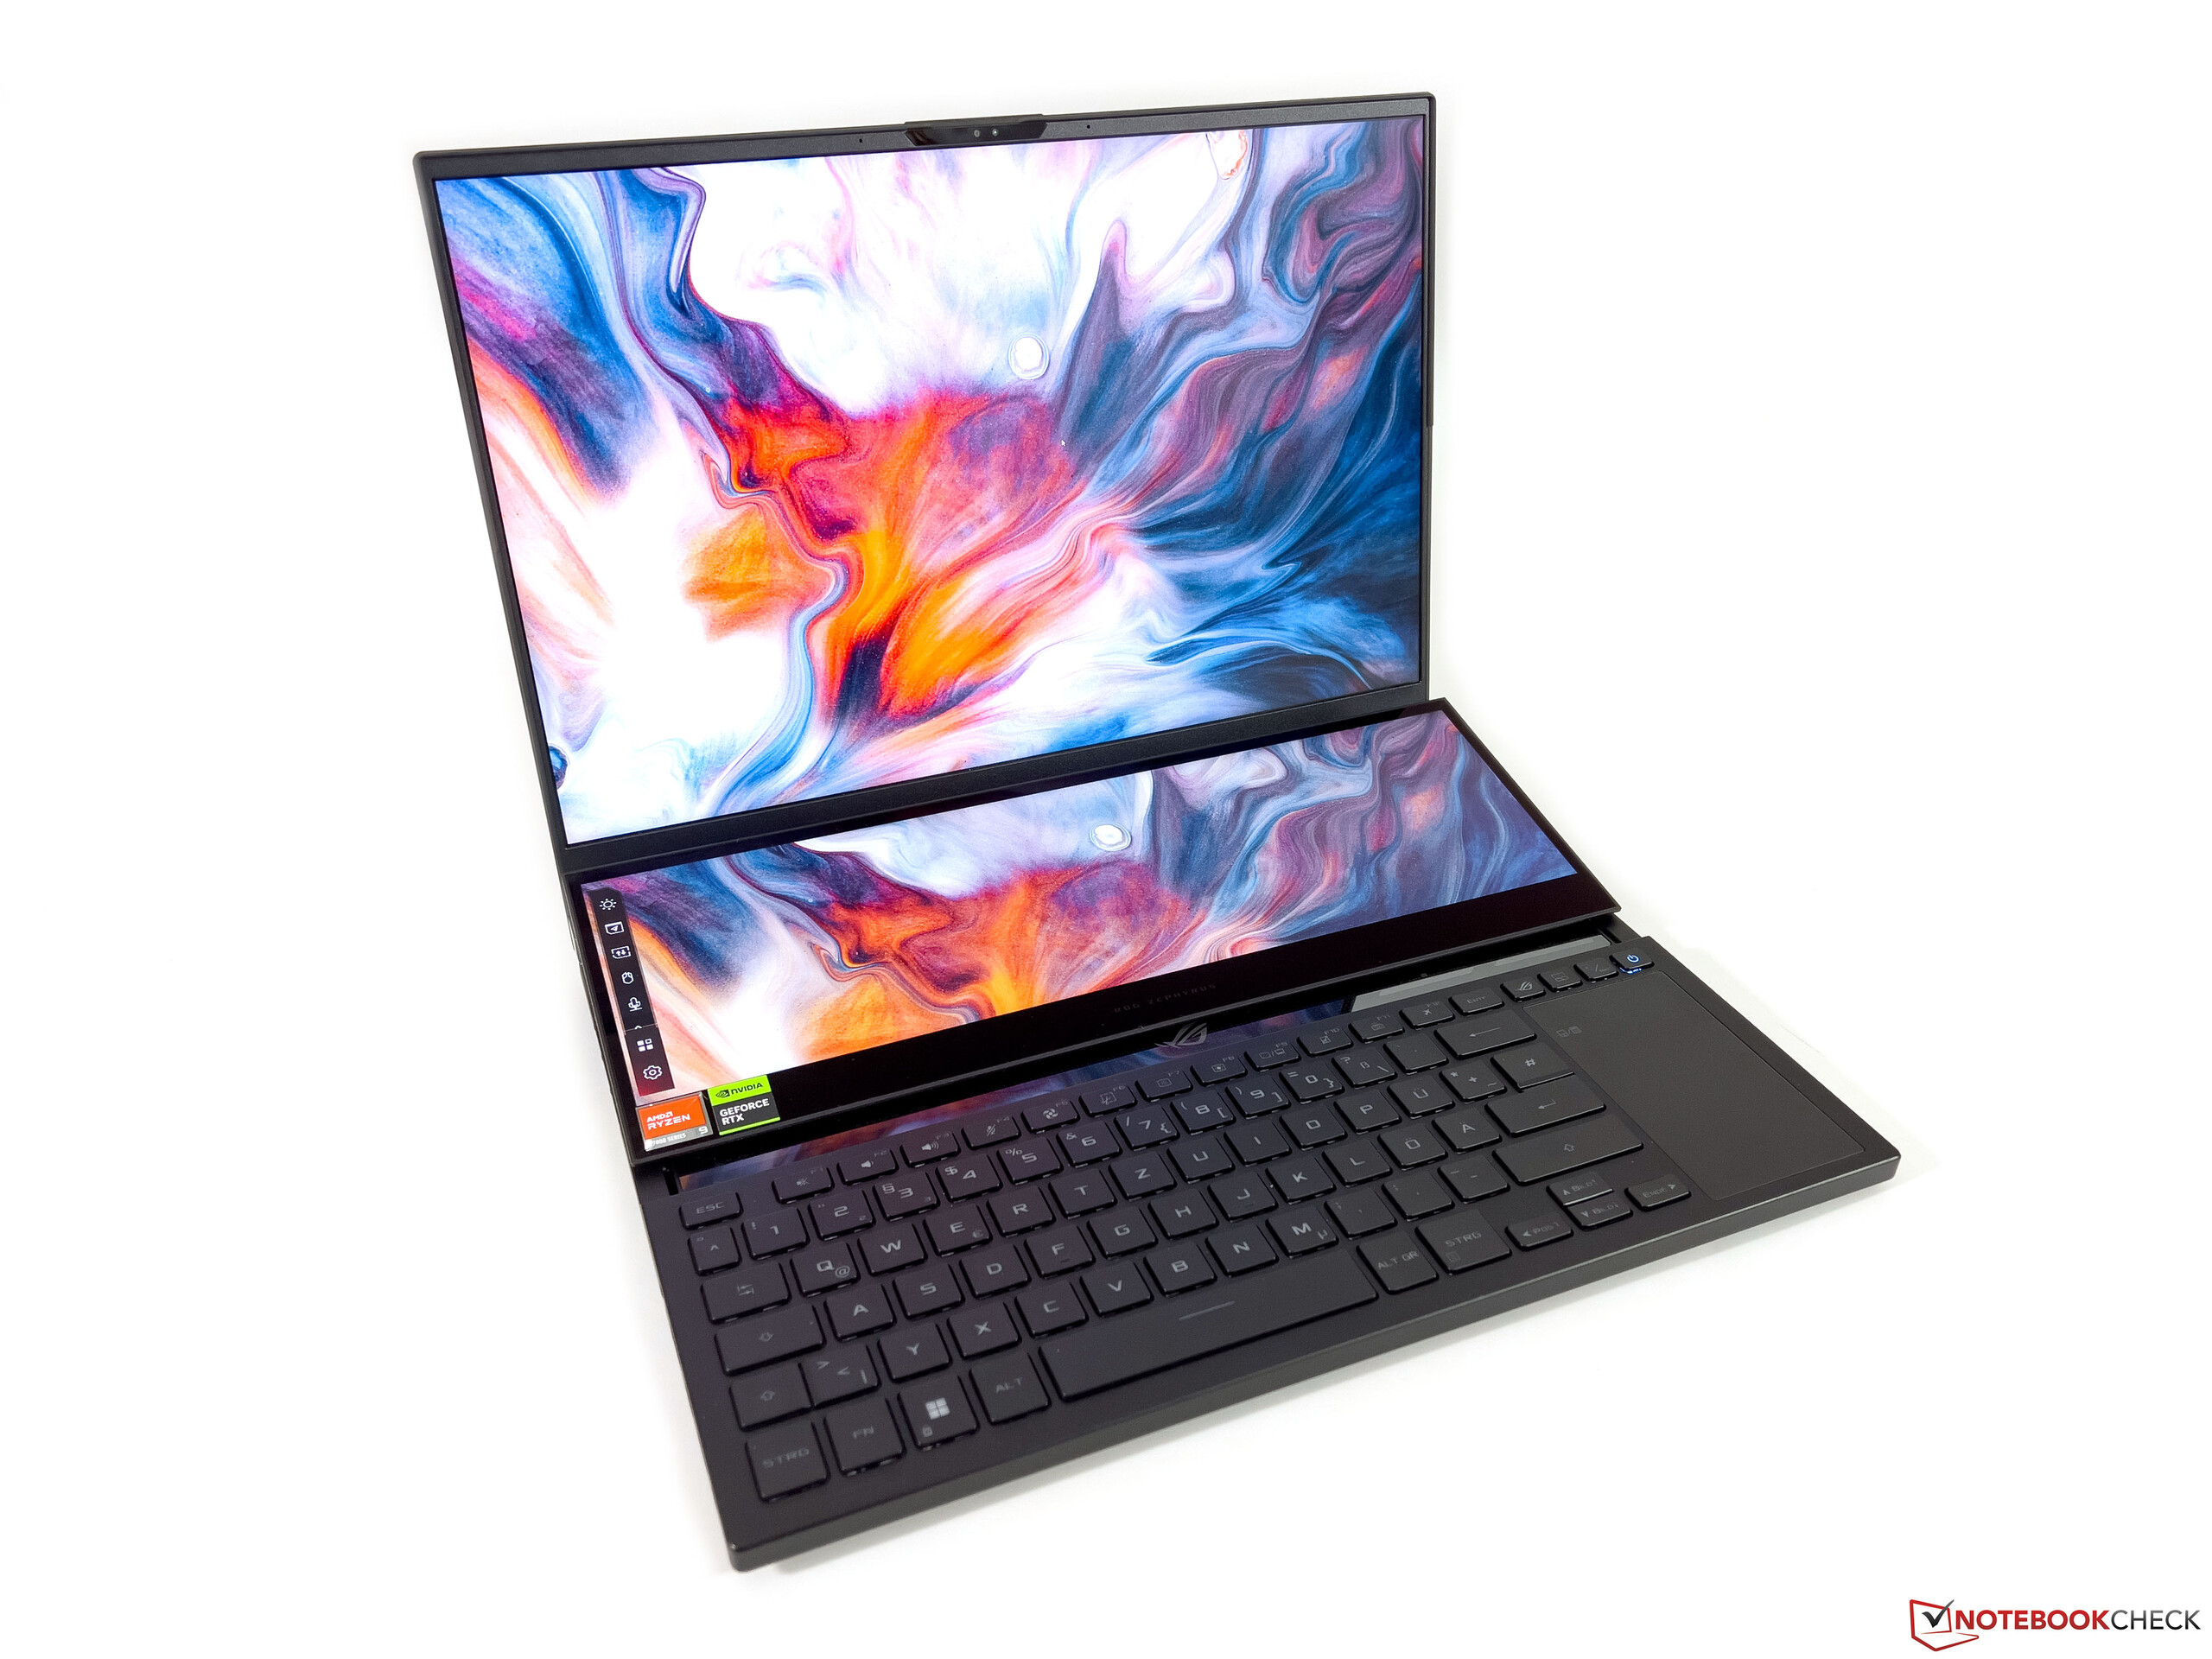
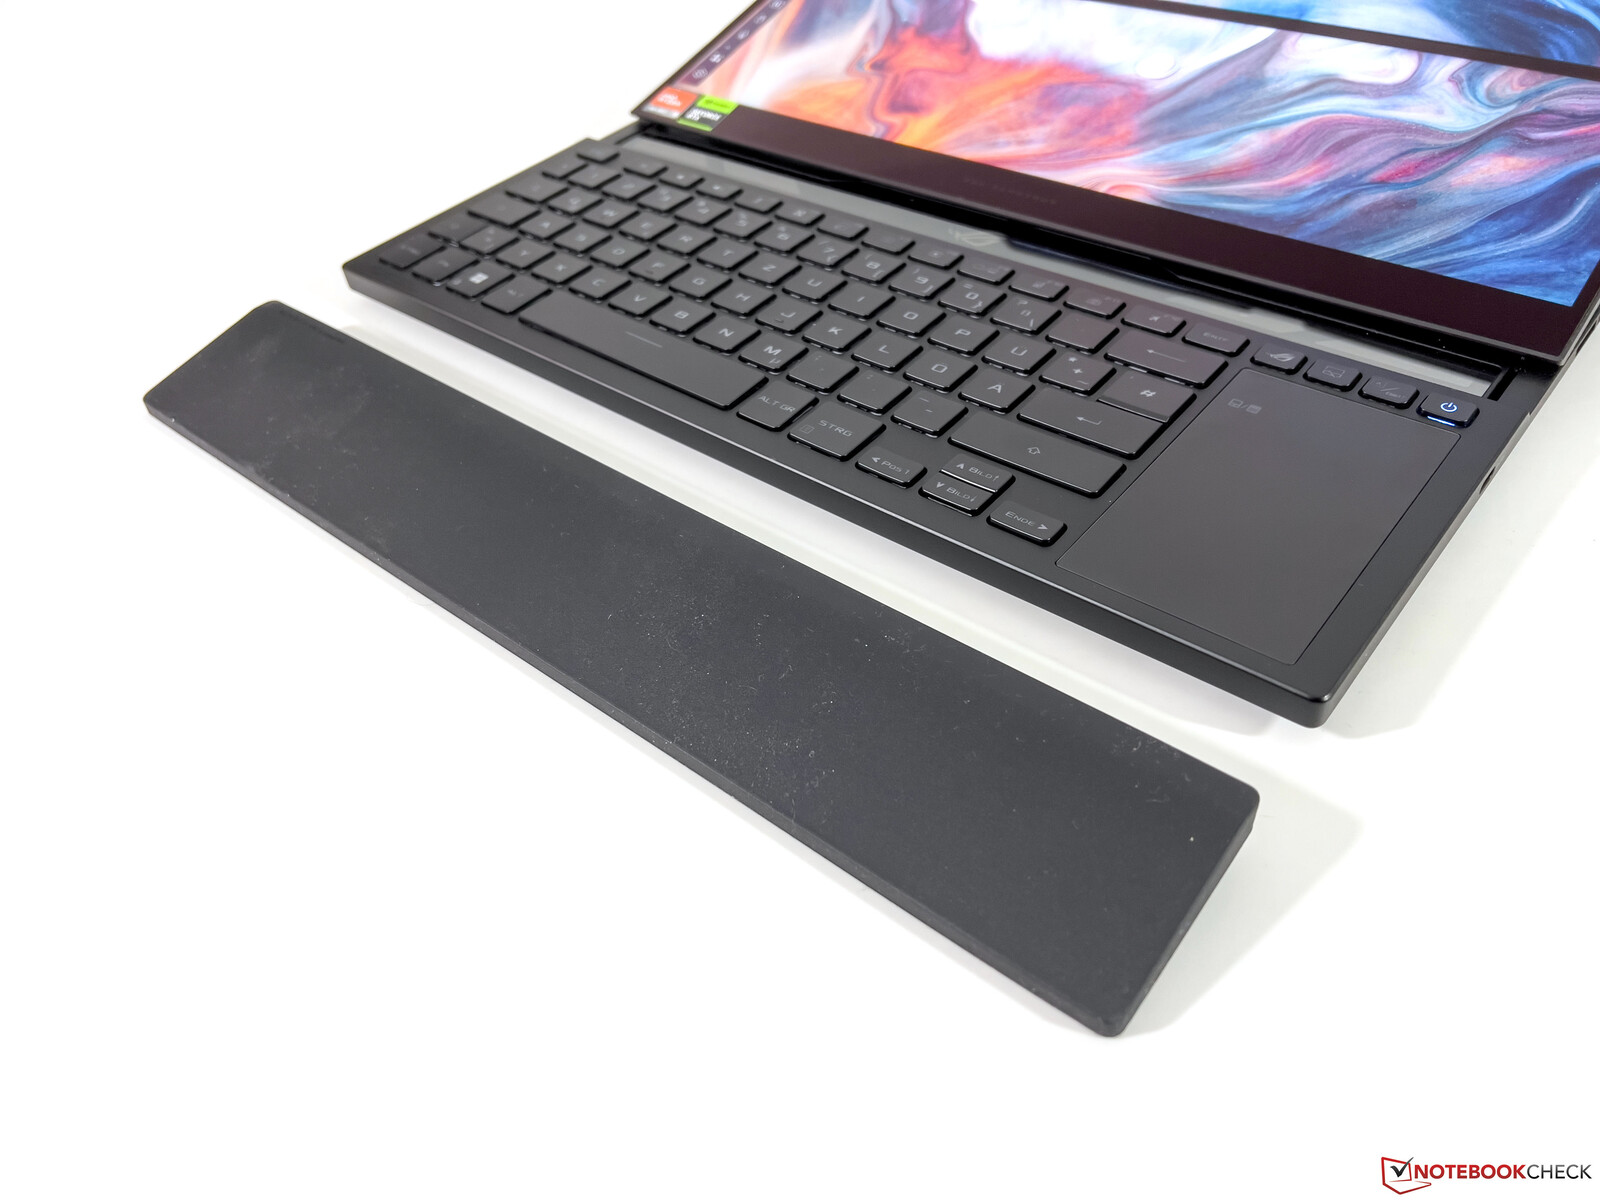
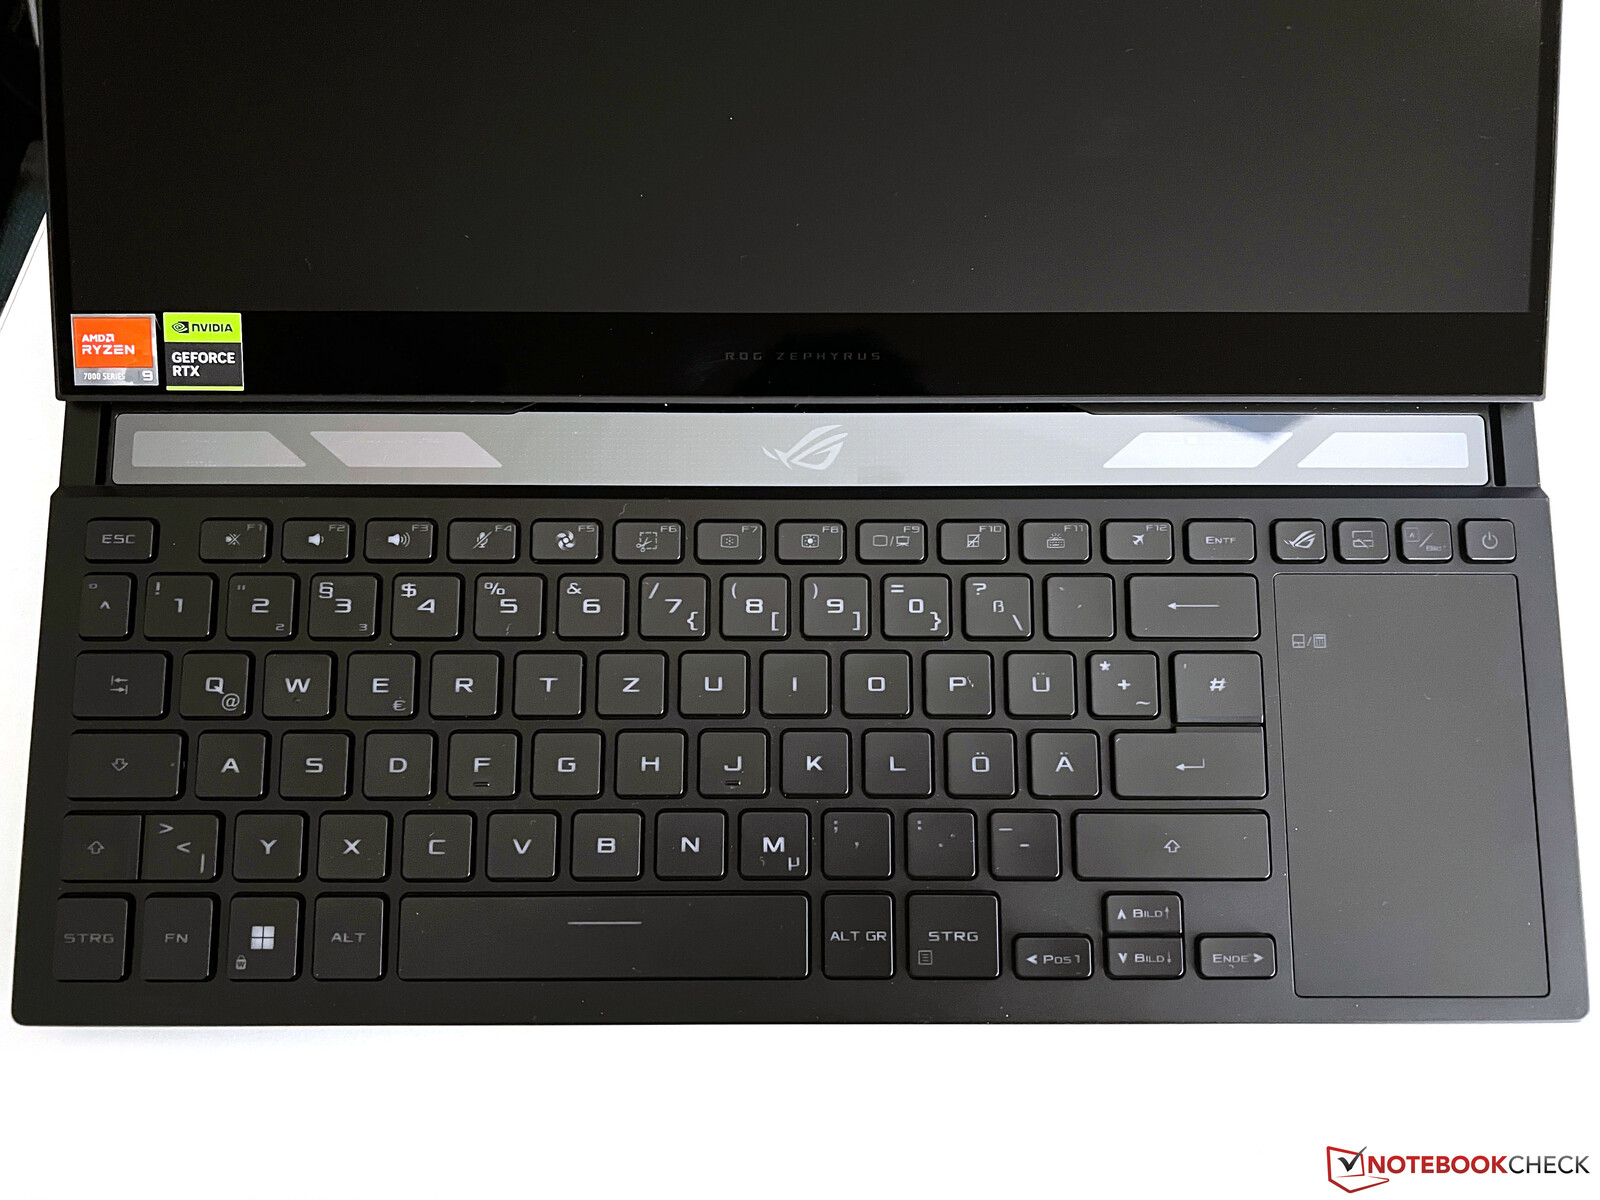
输入设备 - 键盘不符合人体工程学
额外的屏幕需要将键盘移到基本单元的前面,这显然对人体工程学不理想。华硕也知道这一点,并为每台设备配备了一个橡胶手掌托。它在你家里的桌子上很好用,但当你在路上的时候,它就没有帮助了。键盘本身提供了一个舒适的打字体验,键程较浅,但也很安静。键盘有照明,你可以使用Armoury Crate软件为每个键单独设置颜色(如果你愿意的话)。
纵向的触摸板紧挨着键盘,由于外形狭窄,即使是标准的光标移动也会有难度,需要多次尝试。你也可以将触摸板作为数字键盘使用(通过点击左上角激活),效果不错。

显示屏 - 240赫兹迷你LED
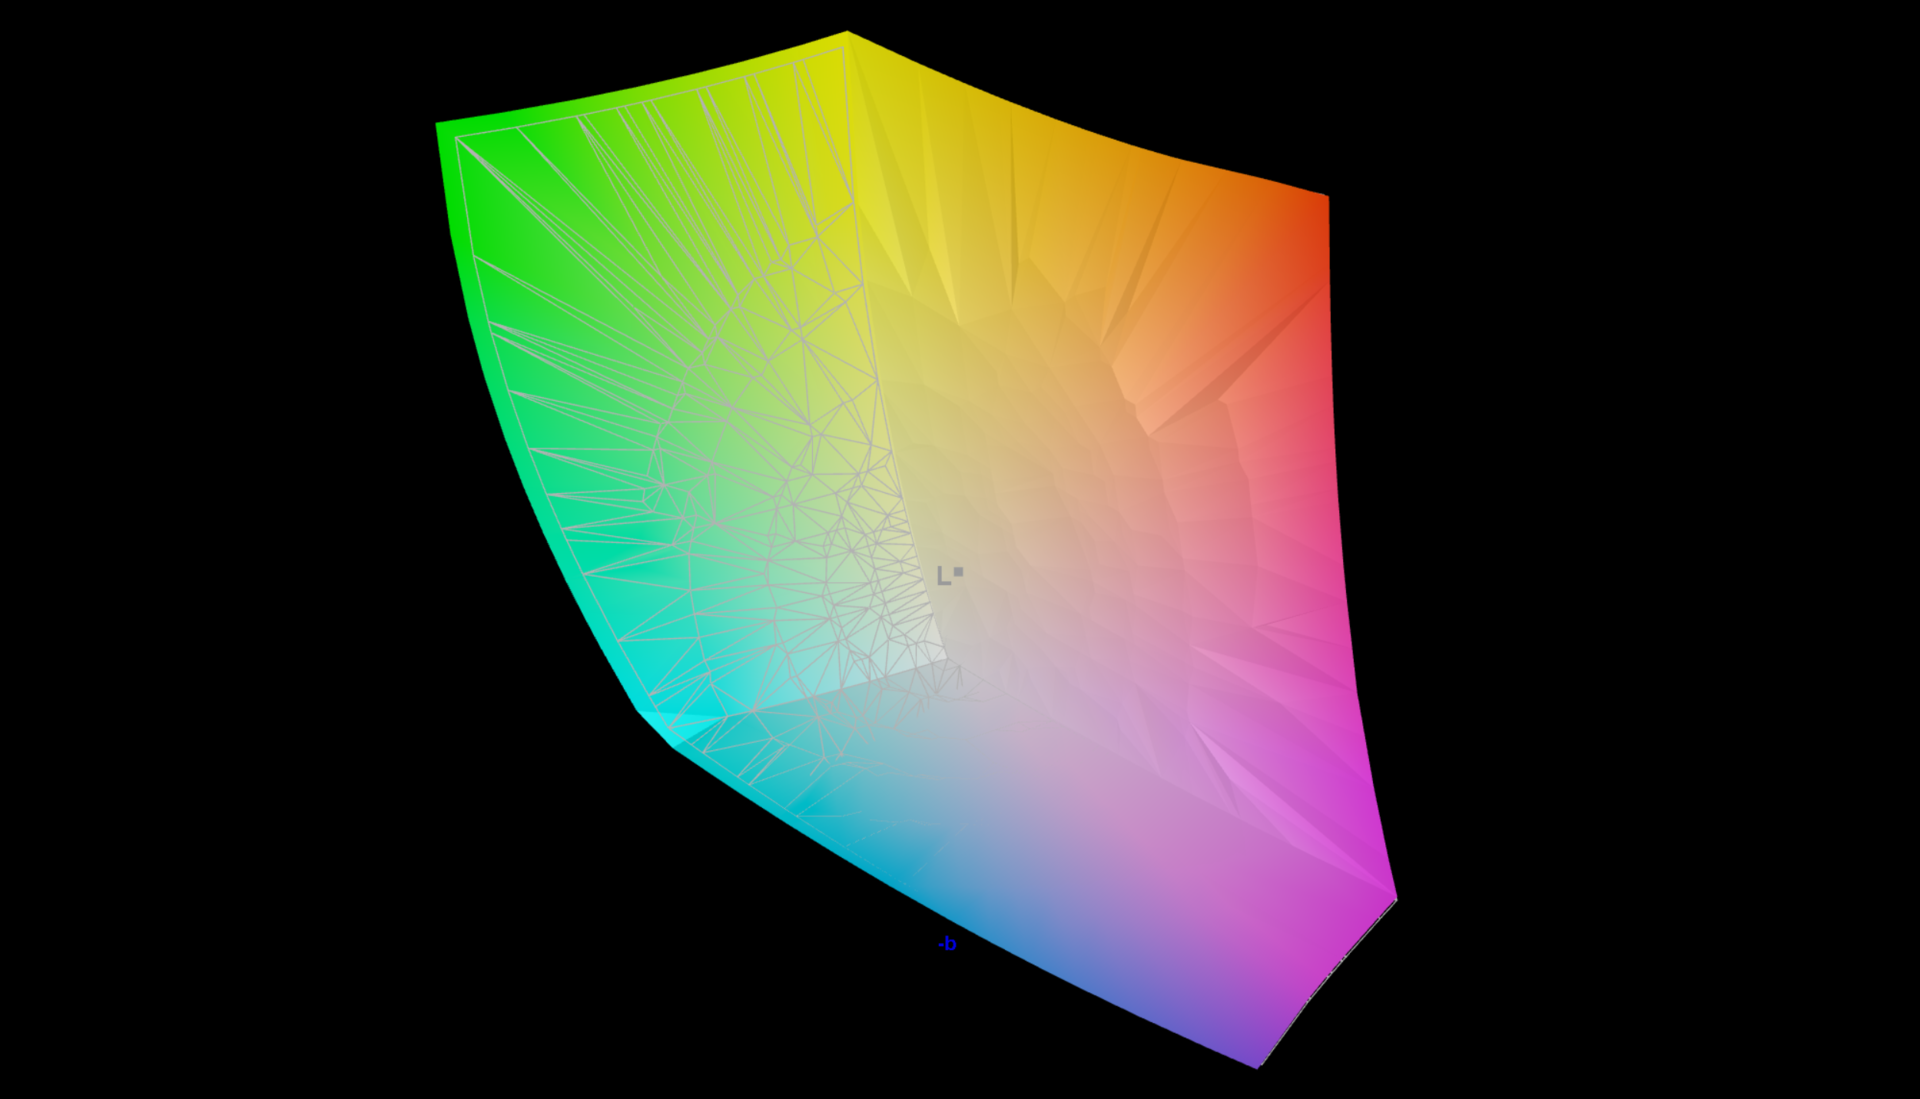
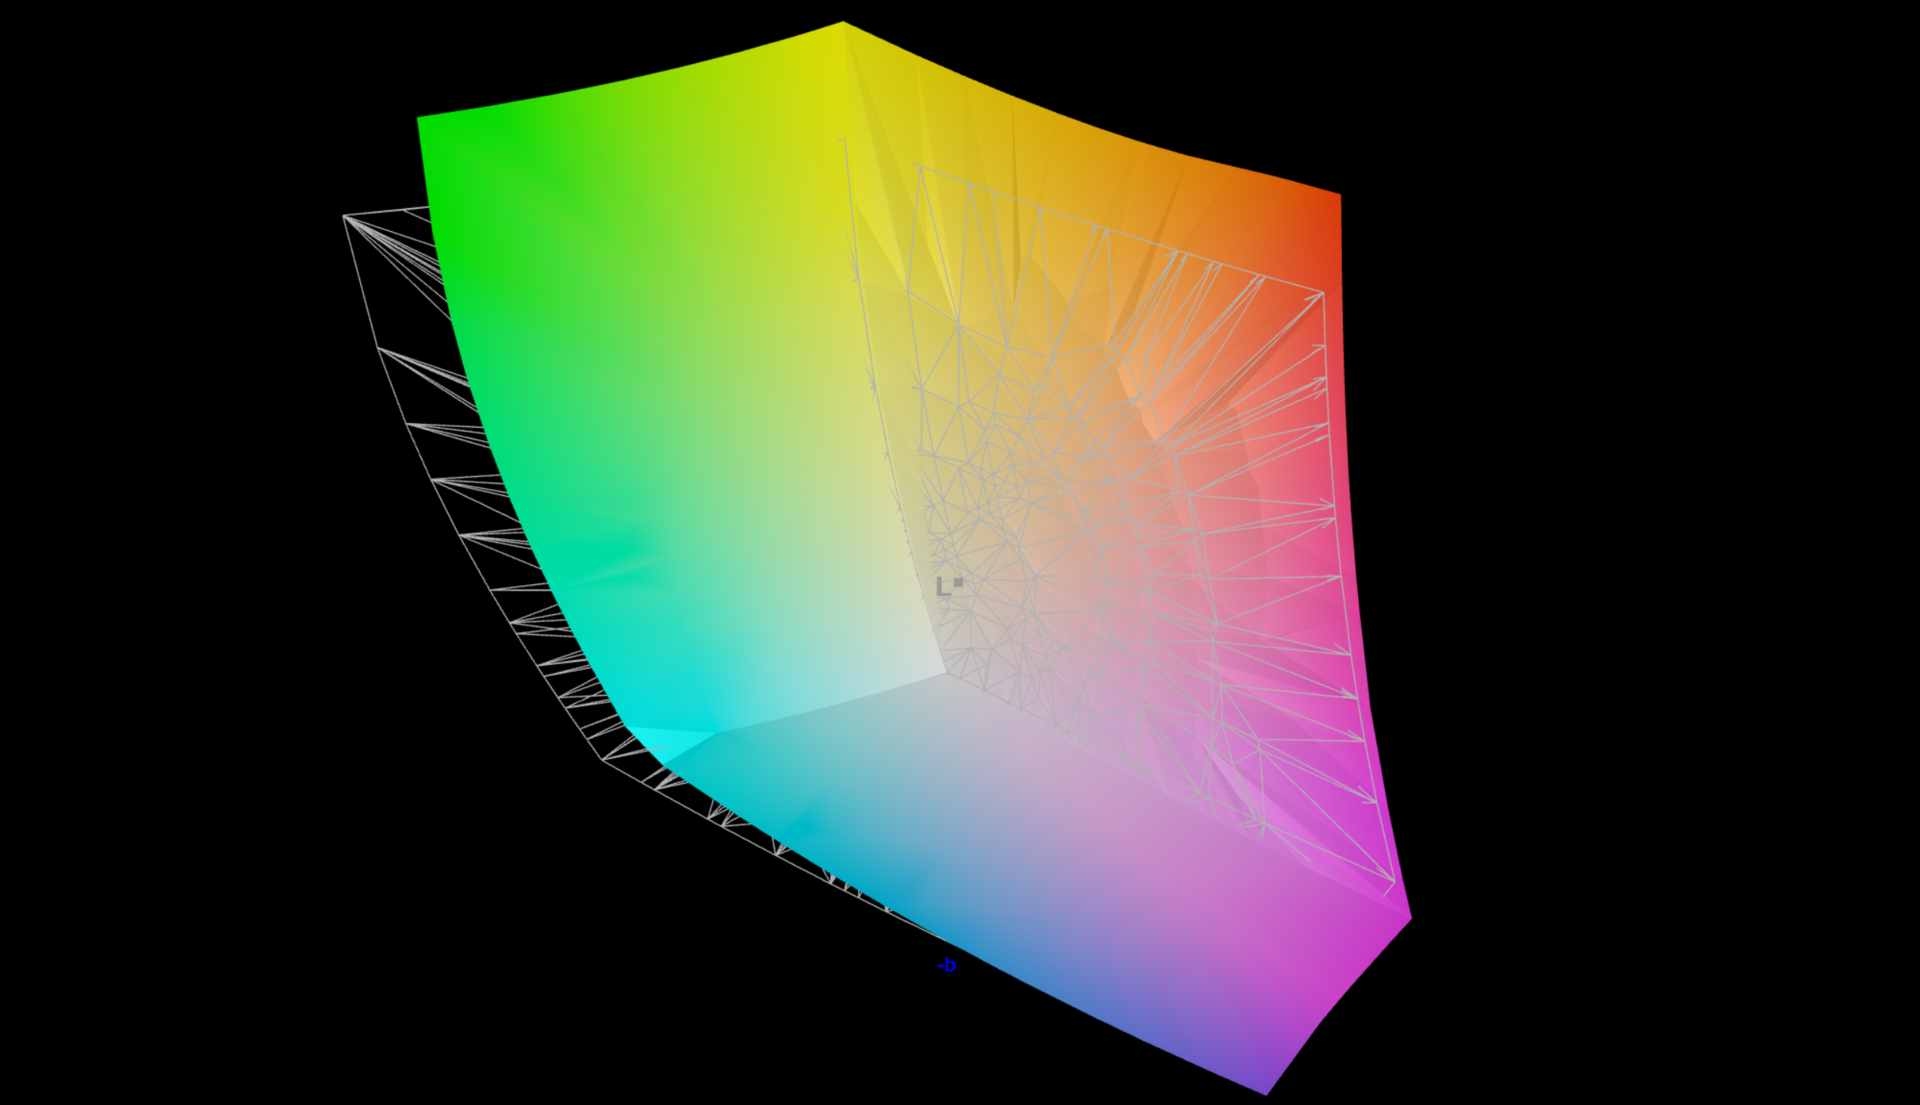
16英寸Mini-LED面板是对前一型号的一个重大升级。它提供了WQHD分辨率(2560 x 2600像素,16:10)和240 Hz的刷新率。哑光面板提供了一个特殊的图像质量,具有锐利的内容和丰富的色彩。华硕宣传的亮度高达1100尼特,但你必须区分SDR和HDR内容。
测试结果非常好,而MacBook Pro 16的Mini-LED面板则是MacBook Pro 16的Mini-LED面板在SDR内容中只达到500尼特,但在评测单元中可以测量到700尼特。在HDR内容下,它甚至可以达到近1400尼特,如果你只有一个小区域或一个完整的画面,这并不重要。另一方面,Windows的HDR实现仍然很麻烦,需要手动改变设置。
黑值极低,导致对比度极佳。迷你LED面板也没有任何混浊或背光渗出的问题。
| |||||||||||||||||||||||||
Brightness Distribution: 95 %
Center on Battery: 713 cd/m²
Contrast: 10171:1 (Black: 0.07 cd/m²)
ΔE ColorChecker Calman: 1.7 | ∀{0.5-29.43 Ø4.73}
calibrated: 1.2
ΔE Greyscale Calman: 2.8 | ∀{0.09-98 Ø4.97}
90.8% AdobeRGB 1998 (Argyll 3D)
100% sRGB (Argyll 3D)
99.4% Display P3 (Argyll 3D)
Gamma: 2.21
CCT: 6978 K
| Asus Zephyrus Duo 16 GX650PY-NM006W NE160QDM-NM4, MiniLED, 2560x1600, 16" | MSI Titan GT77 HX 13VI B173ZAN06.C, Mini-LED, 3840x2160, 17.3" | Schenker XMG Neo 16 Raptor Lake 2560x1600, 16" | Lenovo Legion Pro 7 16IRX8H MNG007DA2-3 (CSO1628), IPS, 2560x1600, 16" | Razer Blade 16 Early 2023 CSOT T3 MNG007DA4-1, IPS, 2560x1600, 16" | Asus ROG Zephyrus Duo 16 GX650RX BOE NE160QAM-NX1, IPS-Level, 3840x2400, 16" | Apple MacBook Pro 16 2023 M2 Max Mini-LED, 3456x2234, 16.2" | |
|---|---|---|---|---|---|---|---|
| Display | -1% | -20% | -17% | -1% | -2% | -1% | |
| Display P3 Coverage (%) | 99.4 | 94.9 -5% | 67.44 -32% | 69.1 -30% | 98.5 -1% | 98 -1% | 99 0% |
| sRGB Coverage (%) | 100 | 99.9 0% | 96.89 -3% | 99.7 0% | 100 0% | 99.9 0% | 100 0% |
| AdobeRGB 1998 Coverage (%) | 90.8 | 92.4 2% | 68.93 -24% | 71.2 -22% | 89.7 -1% | 86.3 -5% | 88.5 -3% |
| Response Times | -97% | 44% | 47% | 38% | -289% | ||
| Response Time Grey 50% / Grey 80% * (ms) | 15.2 ? | 38.4 ? -153% | 12.3 ? 19% | 6.6 ? 57% | 14.6 ? 4% | 80.5 ? -430% | |
| Response Time Black / White * (ms) | 19 ? | 26.6 ? -40% | 5.9 ? 69% | 12 ? 37% | 5.6 ? 71% | 47.2 ? -148% | |
| PWM Frequency (Hz) | 12000 ? | 2380 ? | 14880 ? | ||||
| Screen | 6565% | -152% | -48% | -78% | -104% | 618% | |
| Brightness middle (cd/m²) | 712 | 606 -15% | 377.62 -47% | 511 -28% | 456.8 -36% | 459 -36% | 504 -29% |
| Brightness (cd/m²) | 703 | 602 -14% | 469 -33% | 437 -38% | 434 -38% | 487 -31% | |
| Brightness Distribution (%) | 95 | 93 -2% | 86 -9% | 83 -13% | 88 -7% | 94 -1% | |
| Black Level * (cd/m²) | 0.07 | 0.0001 100% | 0.47 -571% | 0.4 -471% | 0.35 -400% | 0.44 -529% | 0.001 99% |
| Contrast (:1) | 10171 | 6060000 59481% | 803 -92% | 1278 -87% | 1305 -87% | 1043 -90% | 504000 4855% |
| Colorchecker dE 2000 * | 1.7 | 4.8 -182% | 3.2 -88% | 0.95 44% | 3.7 -118% | 2.97 -75% | 1.5 12% |
| Colorchecker dE 2000 max. * | 4 | 8.2 -105% | 6.9 -73% | 2.07 48% | 6.42 -61% | 8.13 -103% | 3.3 17% |
| Colorchecker dE 2000 calibrated * | 1.2 | 1.8 -50% | 0.91 24% | 0.66 45% | 1.03 14% | ||
| Greyscale dE 2000 * | 2.8 | 6.5 -132% | 3.9 -39% | 0.6 79% | 2.6 7% | 4.9 -75% | 2.1 25% |
| Gamma | 2.21 100% | 2.63 84% | 2.176 101% | 2.3 96% | 2.235 98% | 2.25 98% | |
| CCT | 6978 93% | 6596 99% | 6545 99% | 6108 106% | 6775 96% | 6882 94% | |
| Total Average (Program / Settings) | 2156% /
4206% | -86% /
-108% | -7% /
-28% | -11% /
-44% | -23% /
-62% | 109% /
336% |
* ... smaller is better
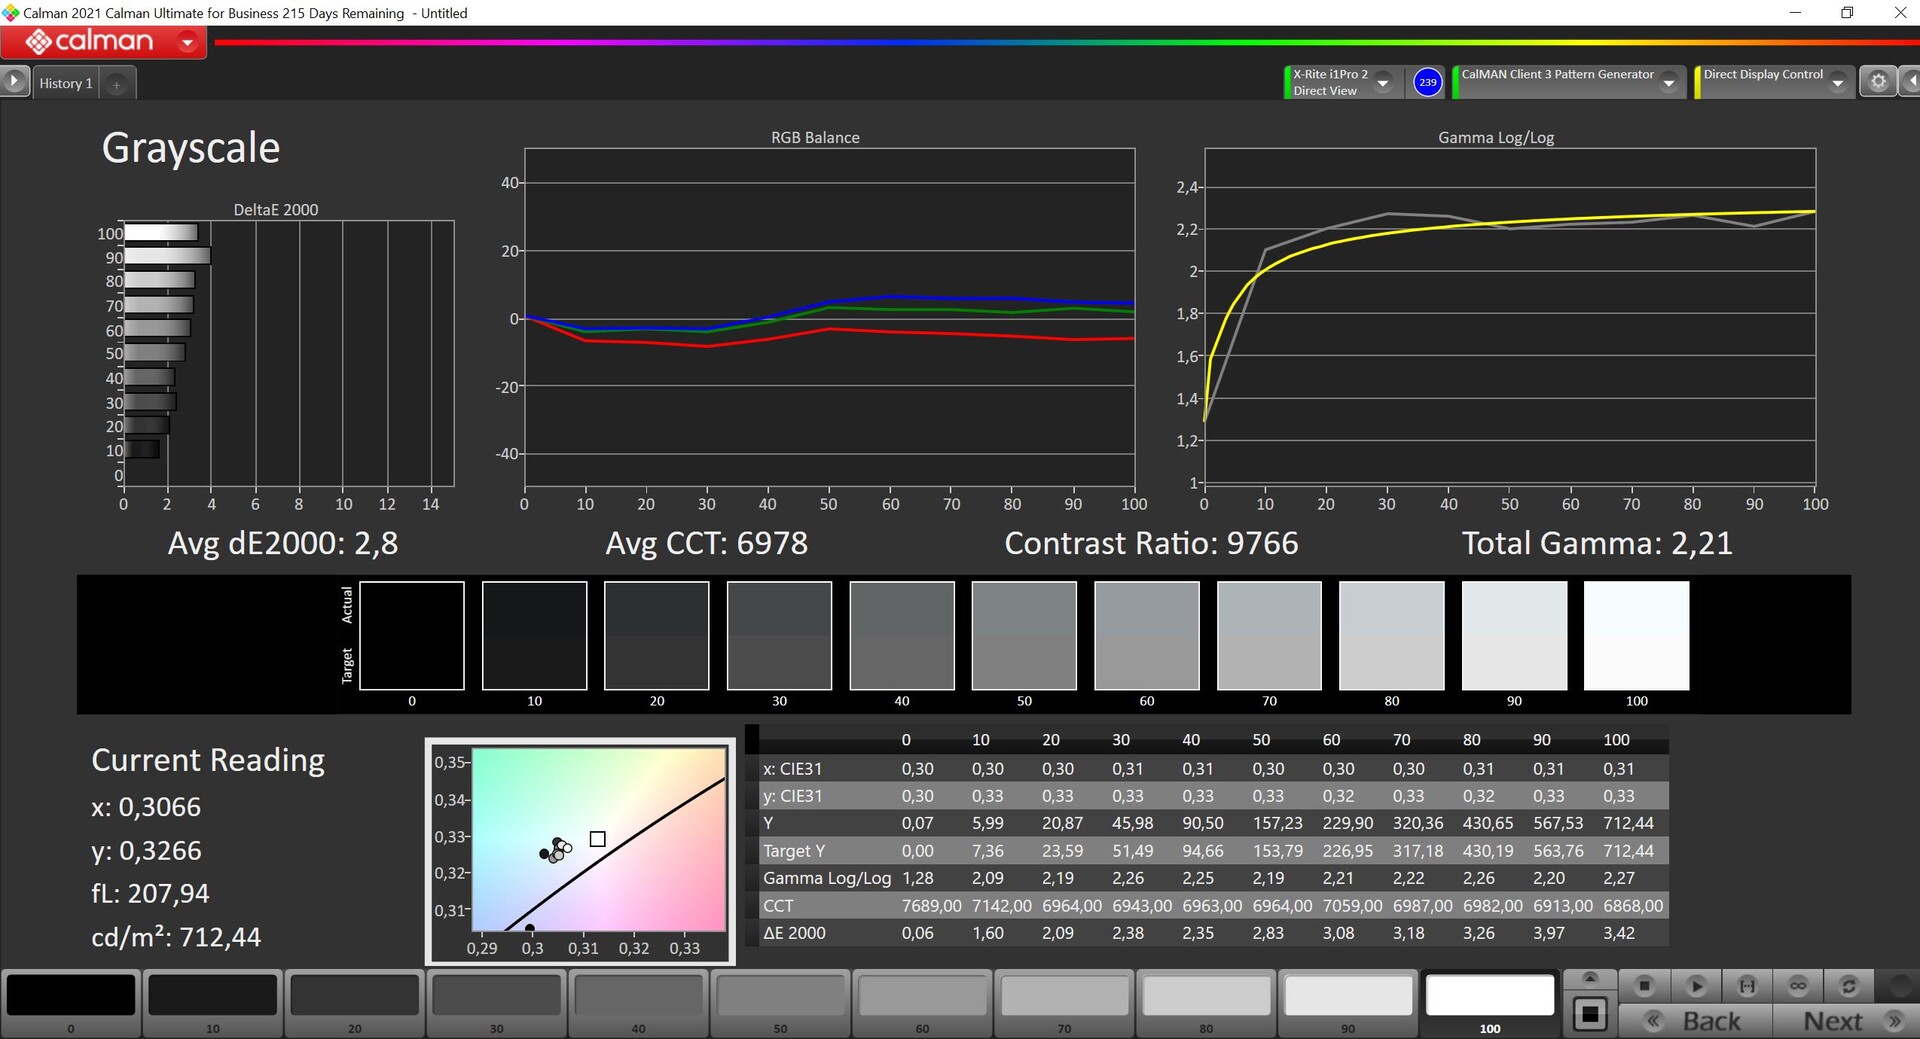

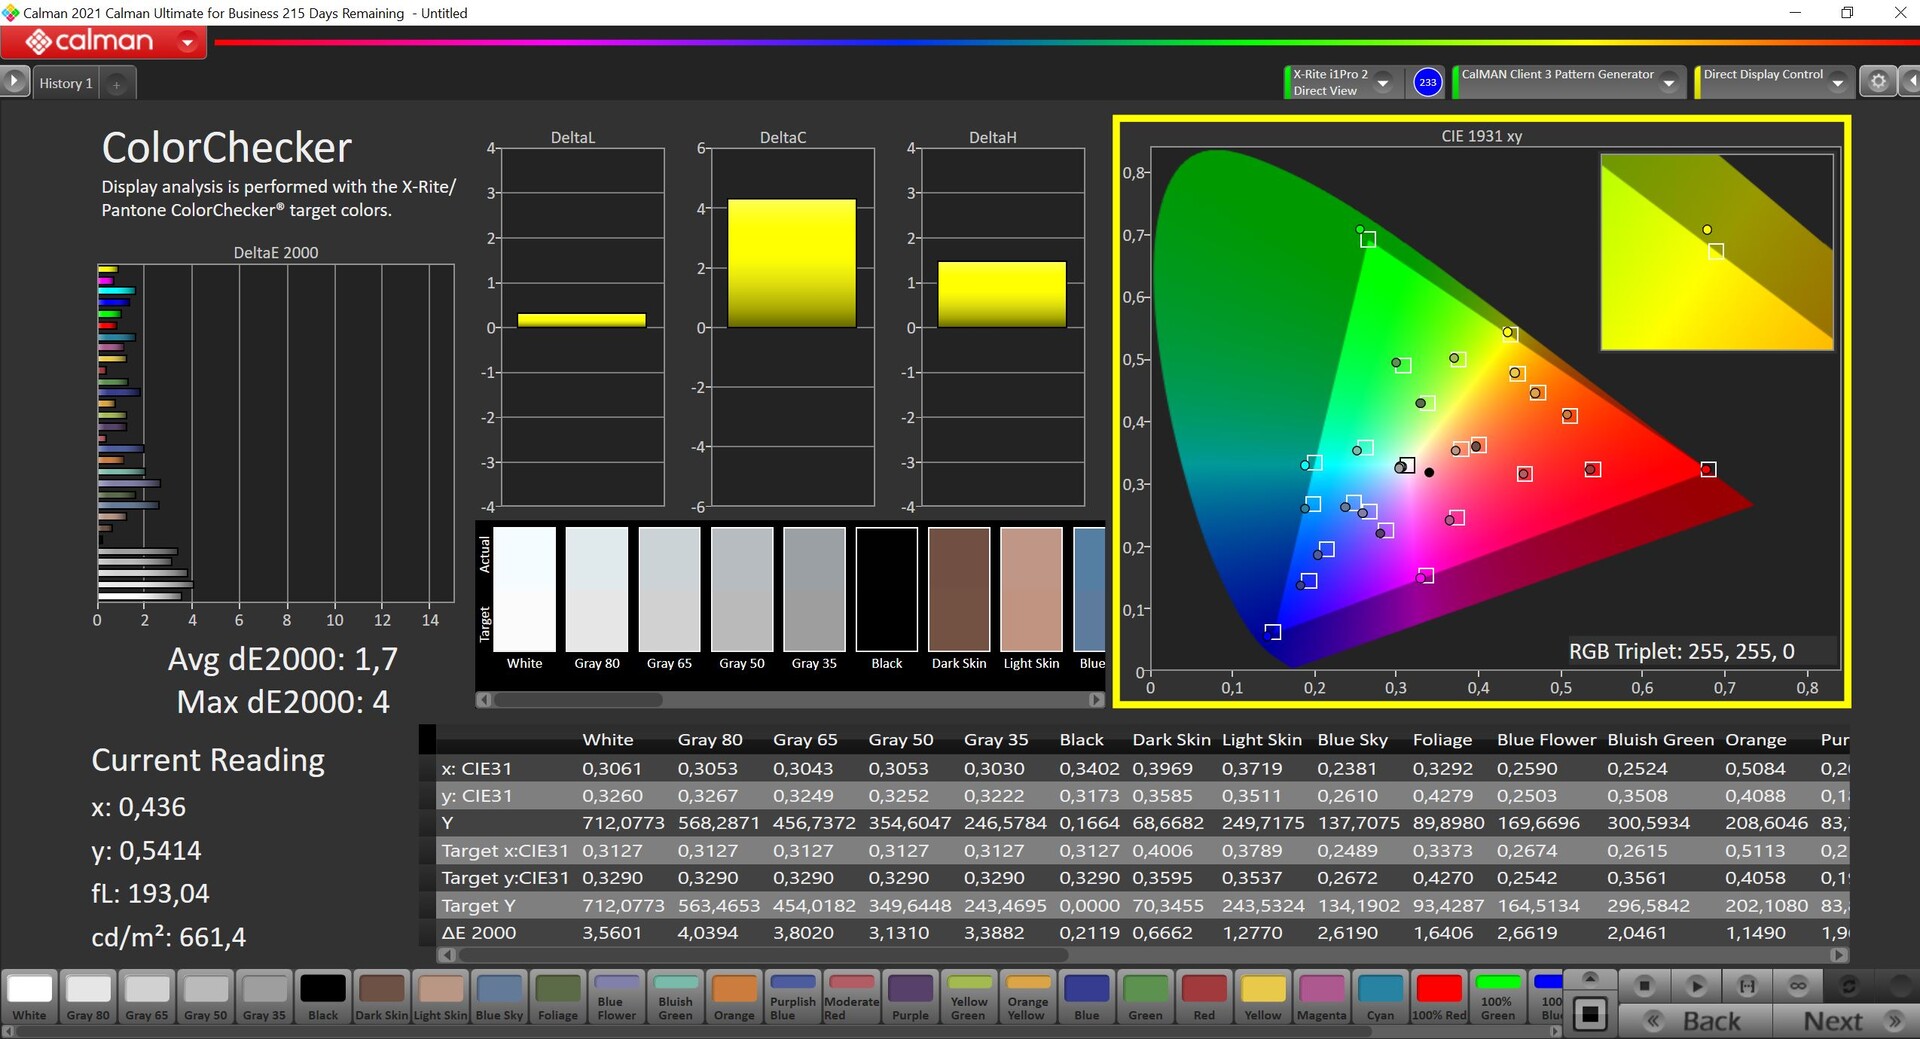

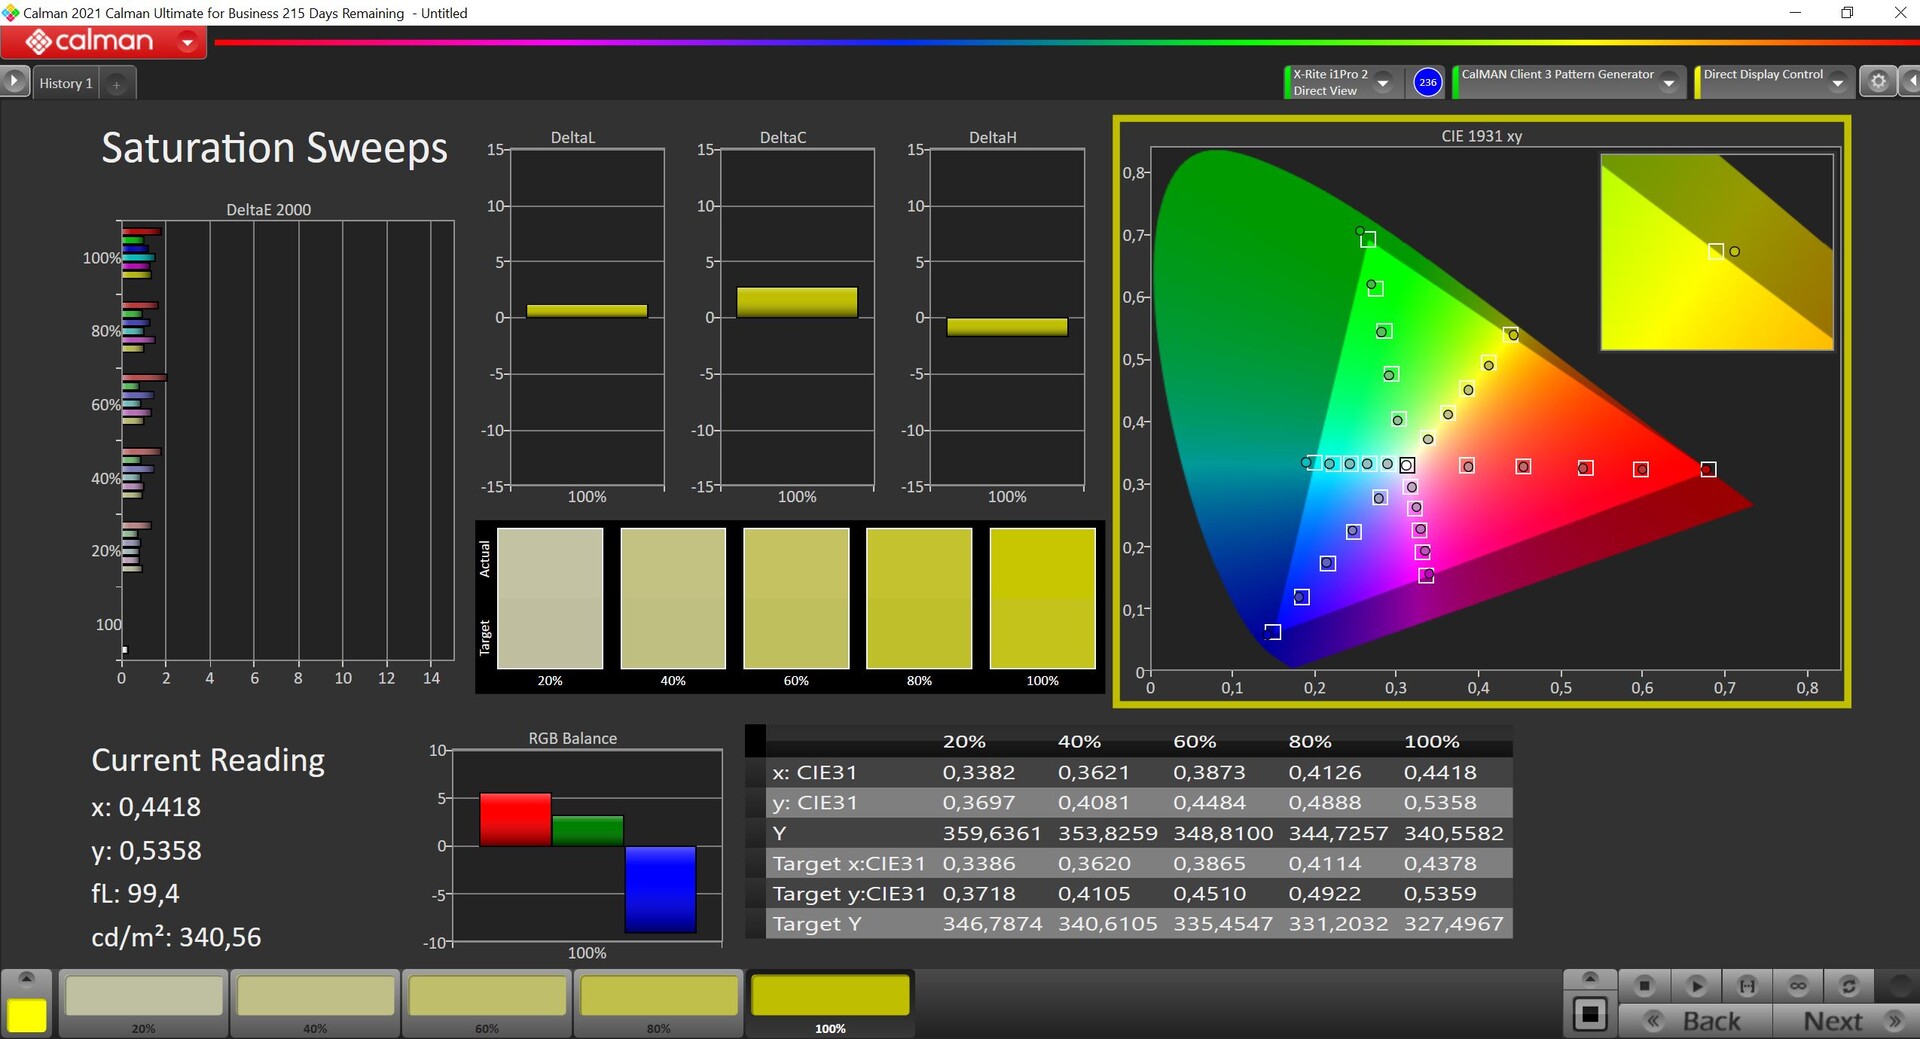
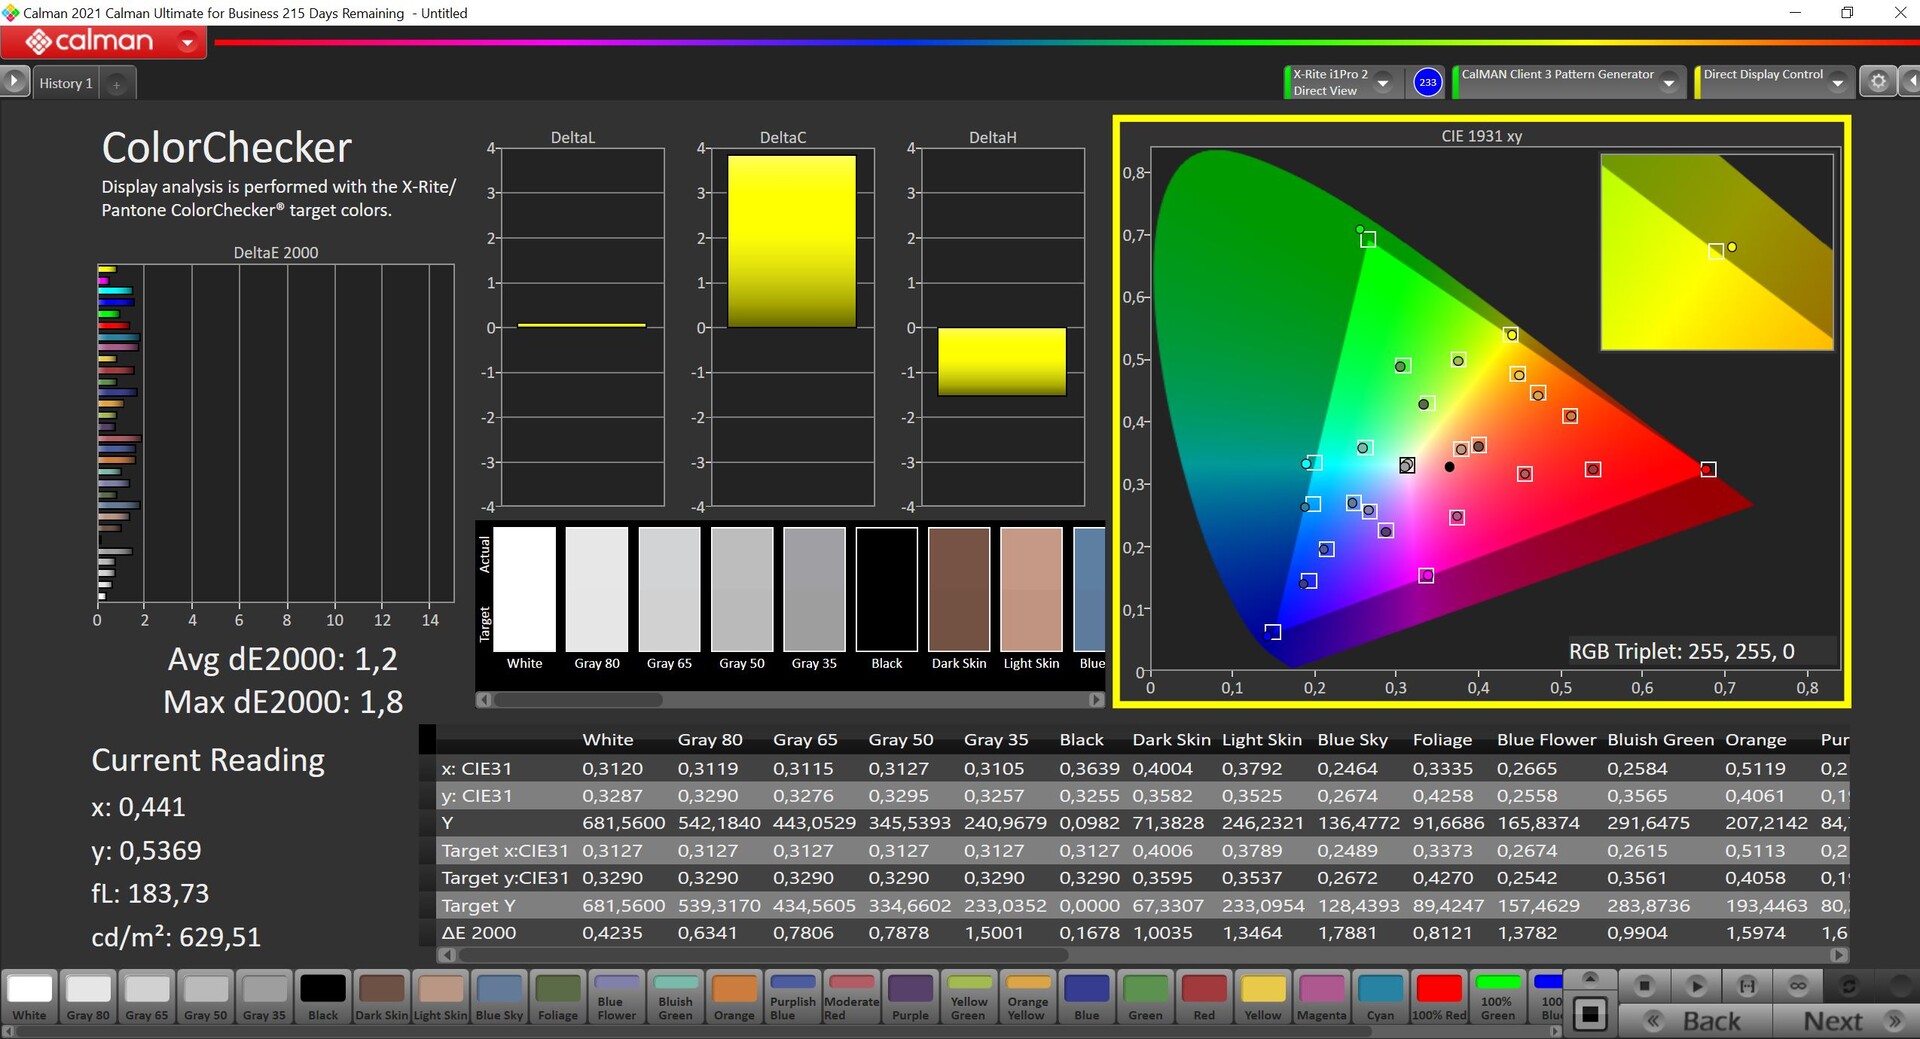
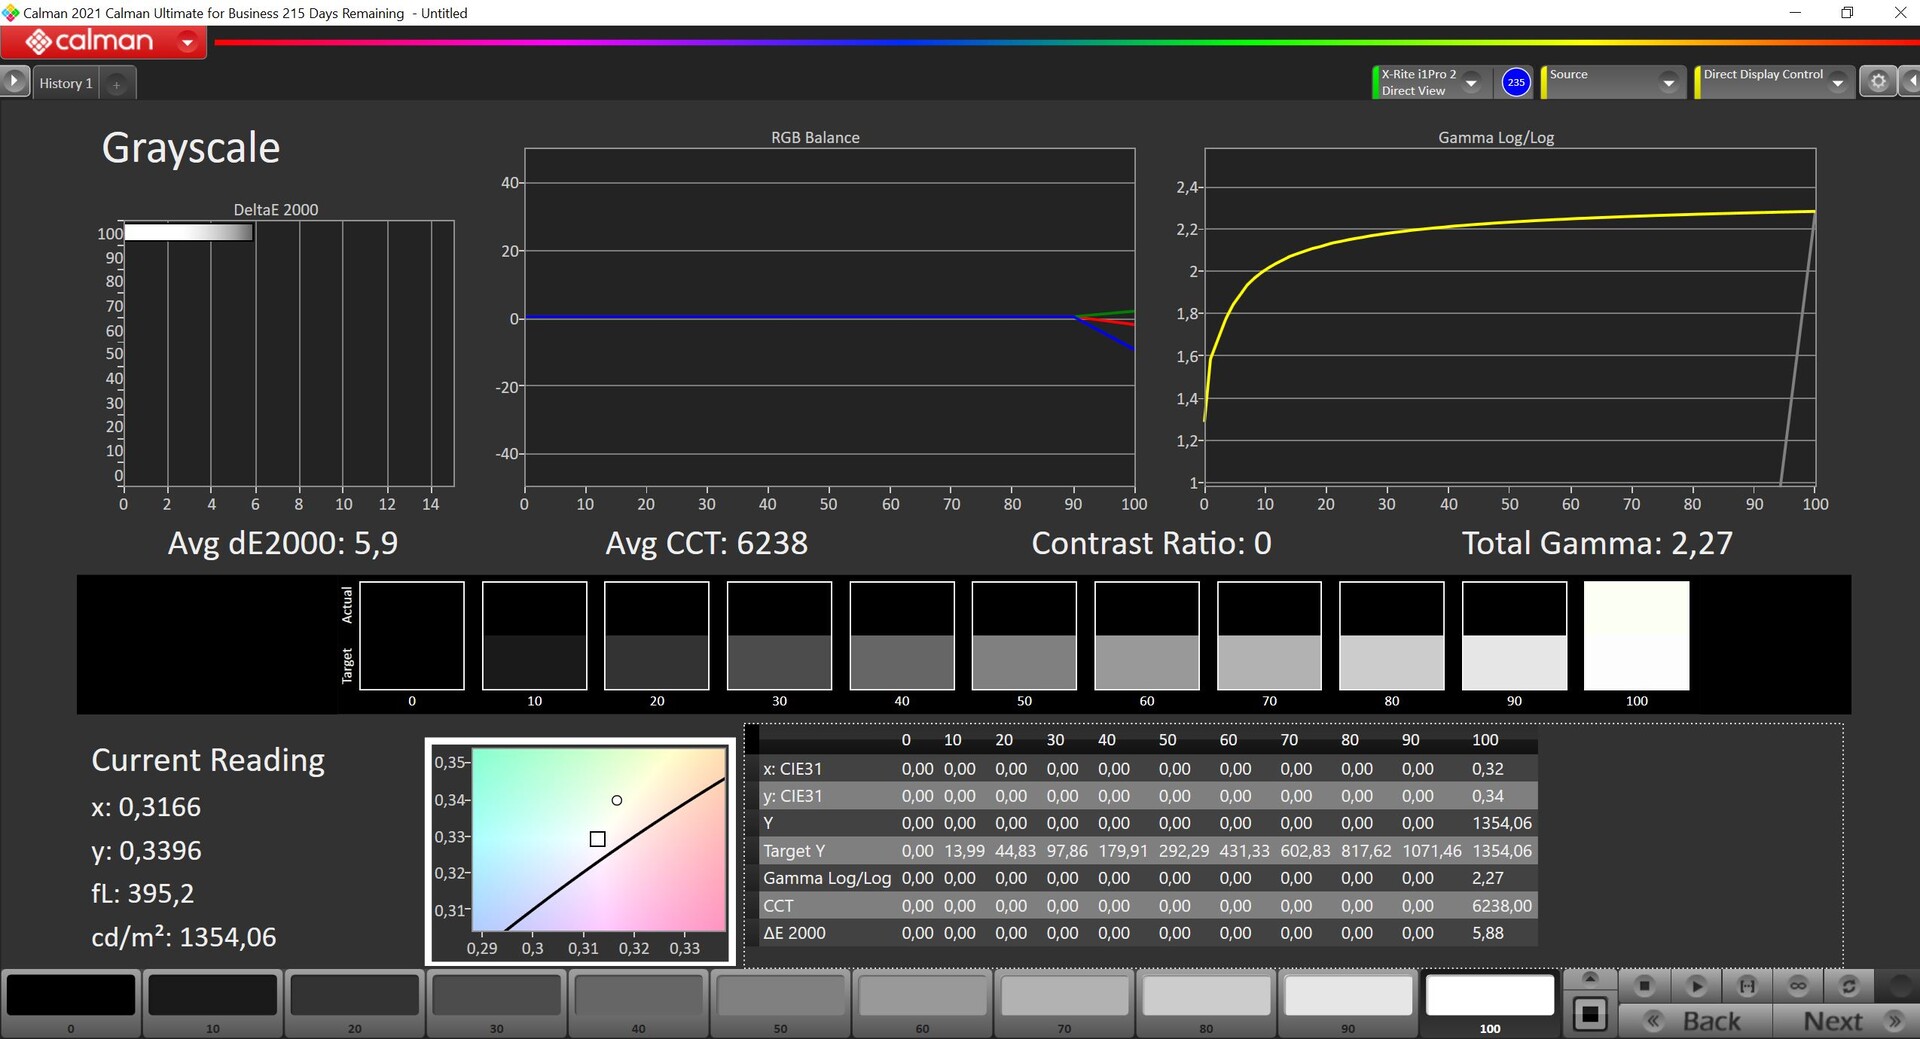
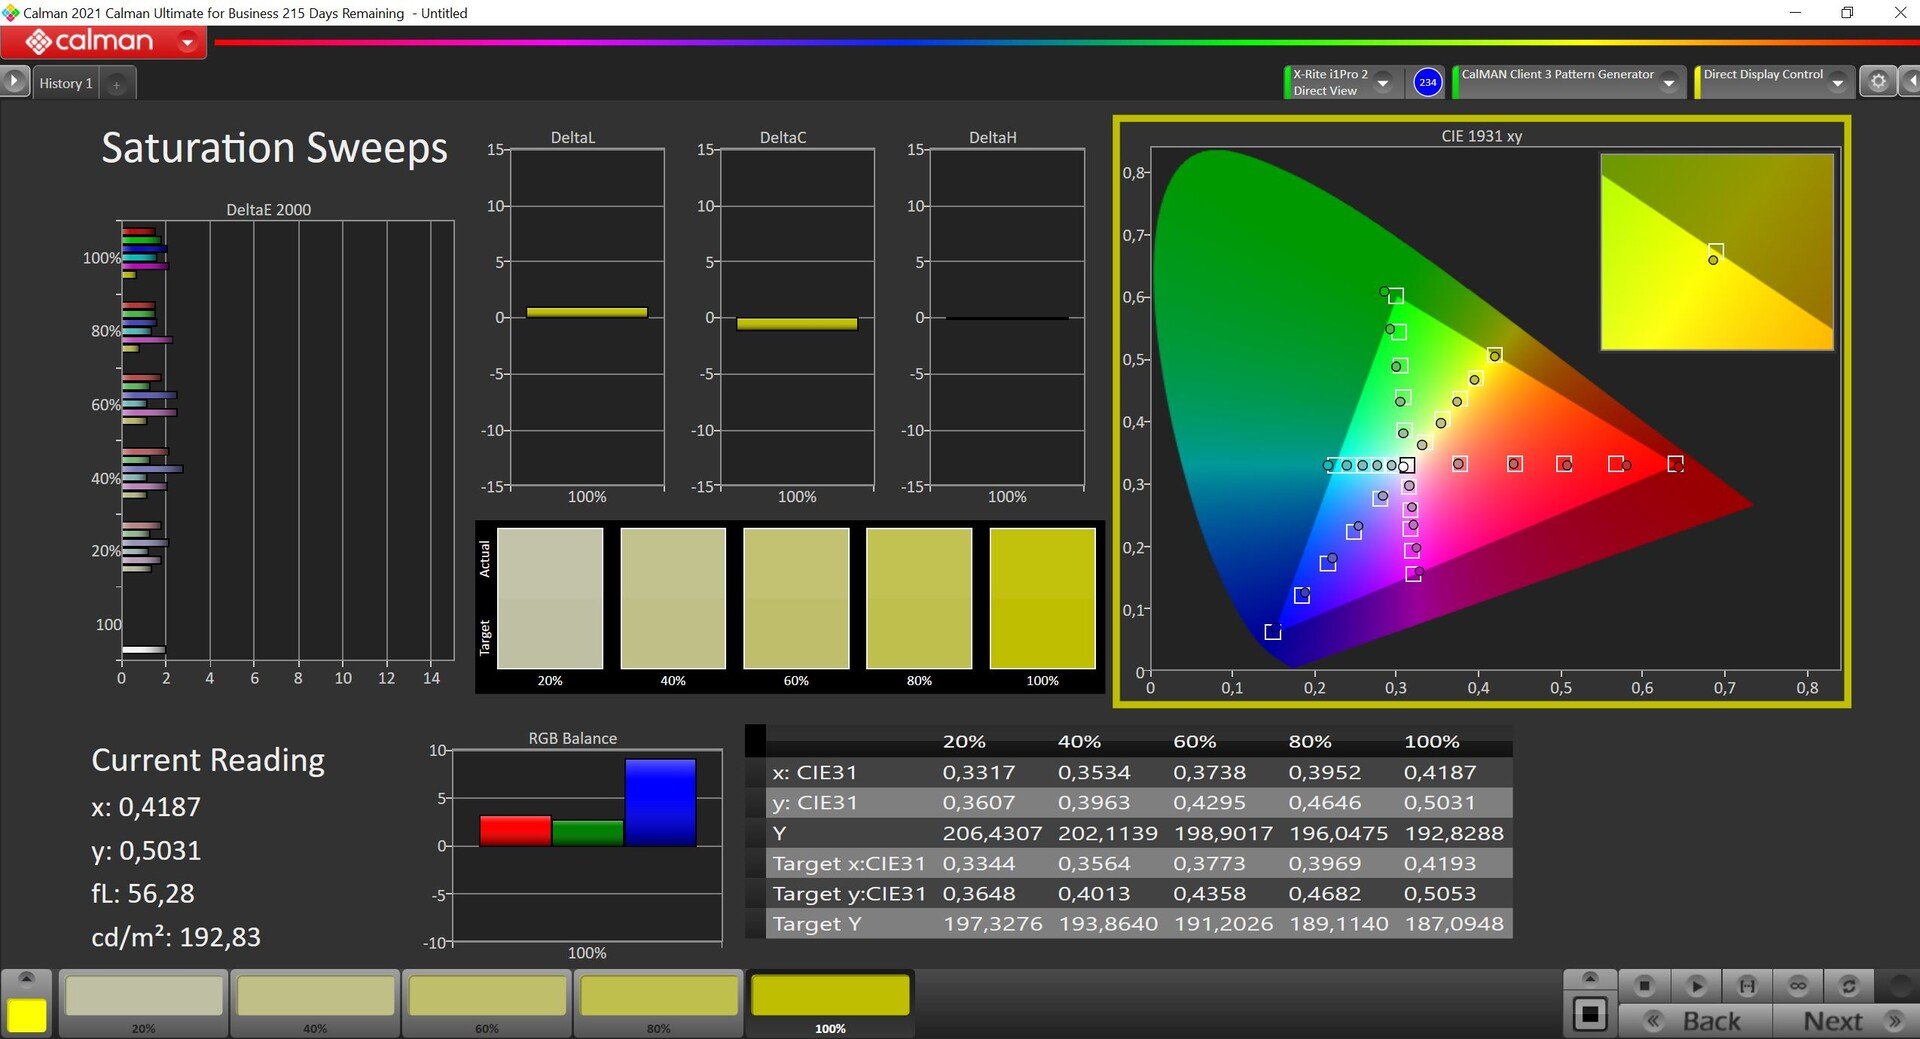
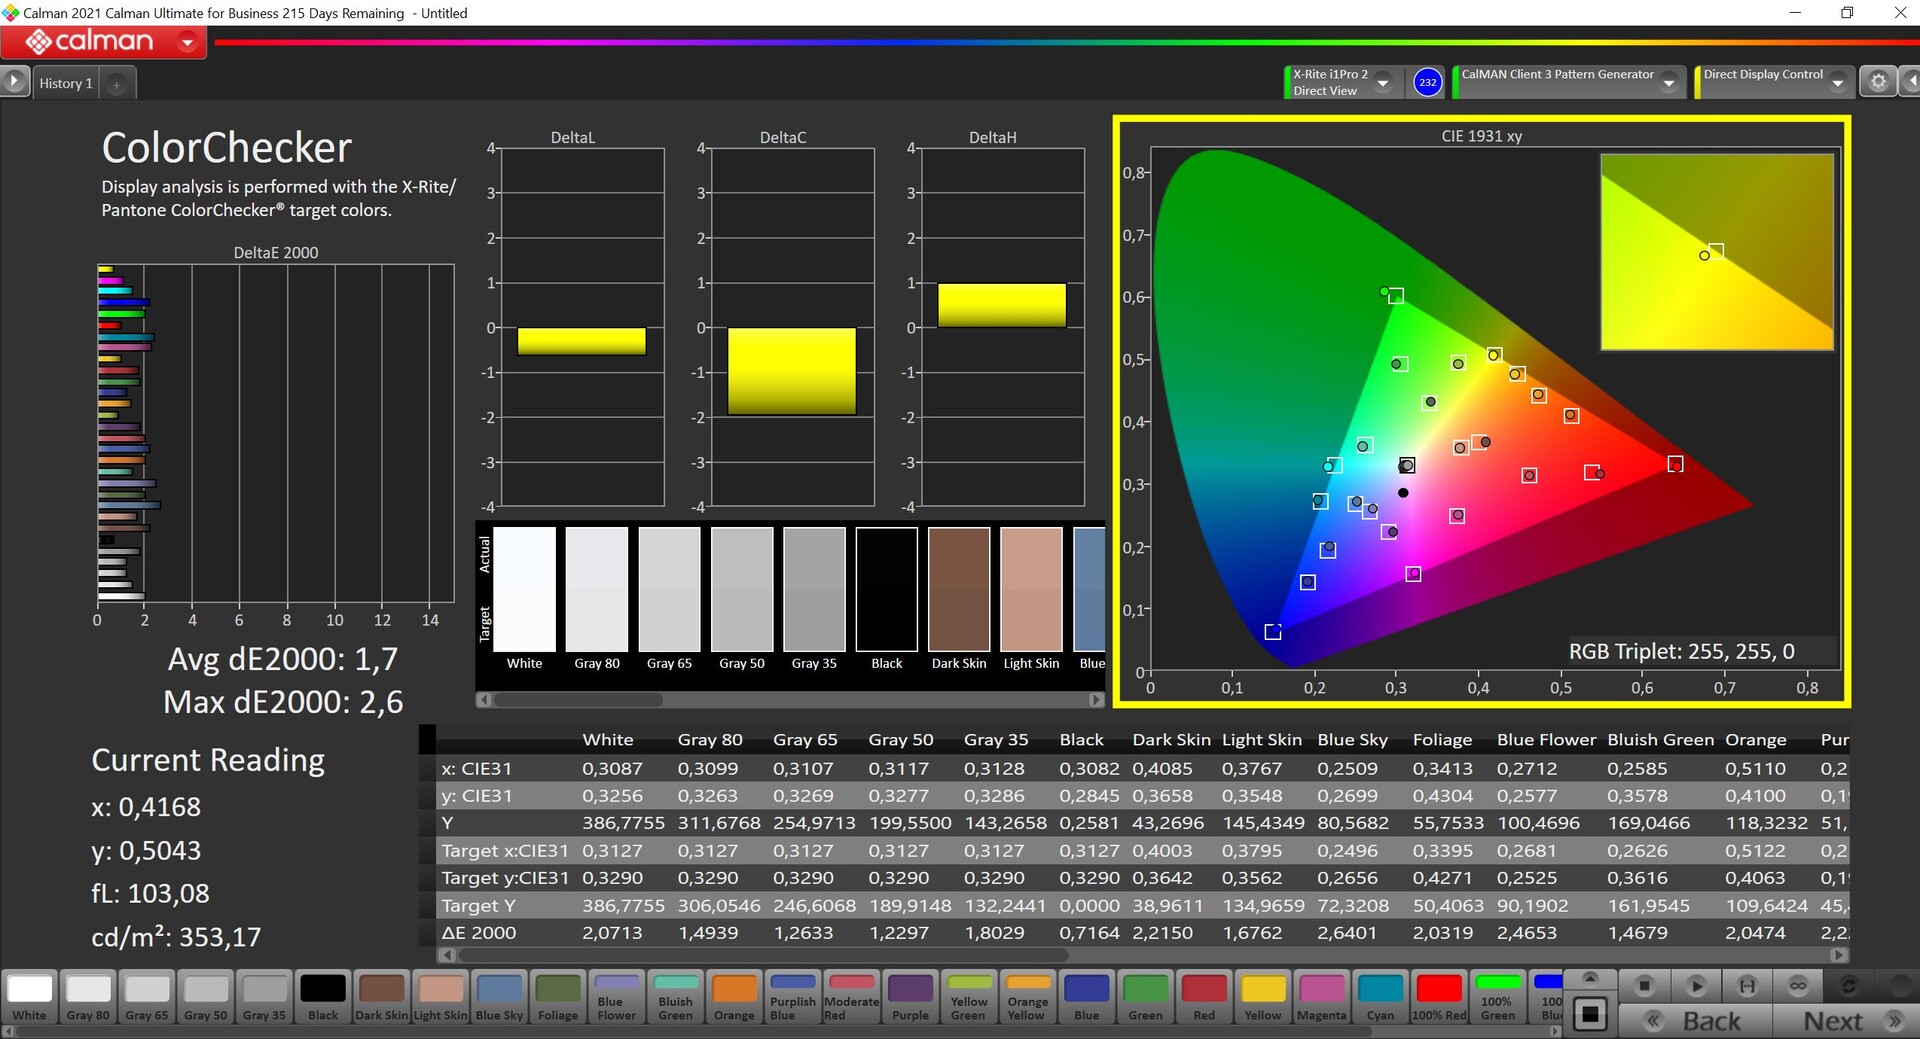
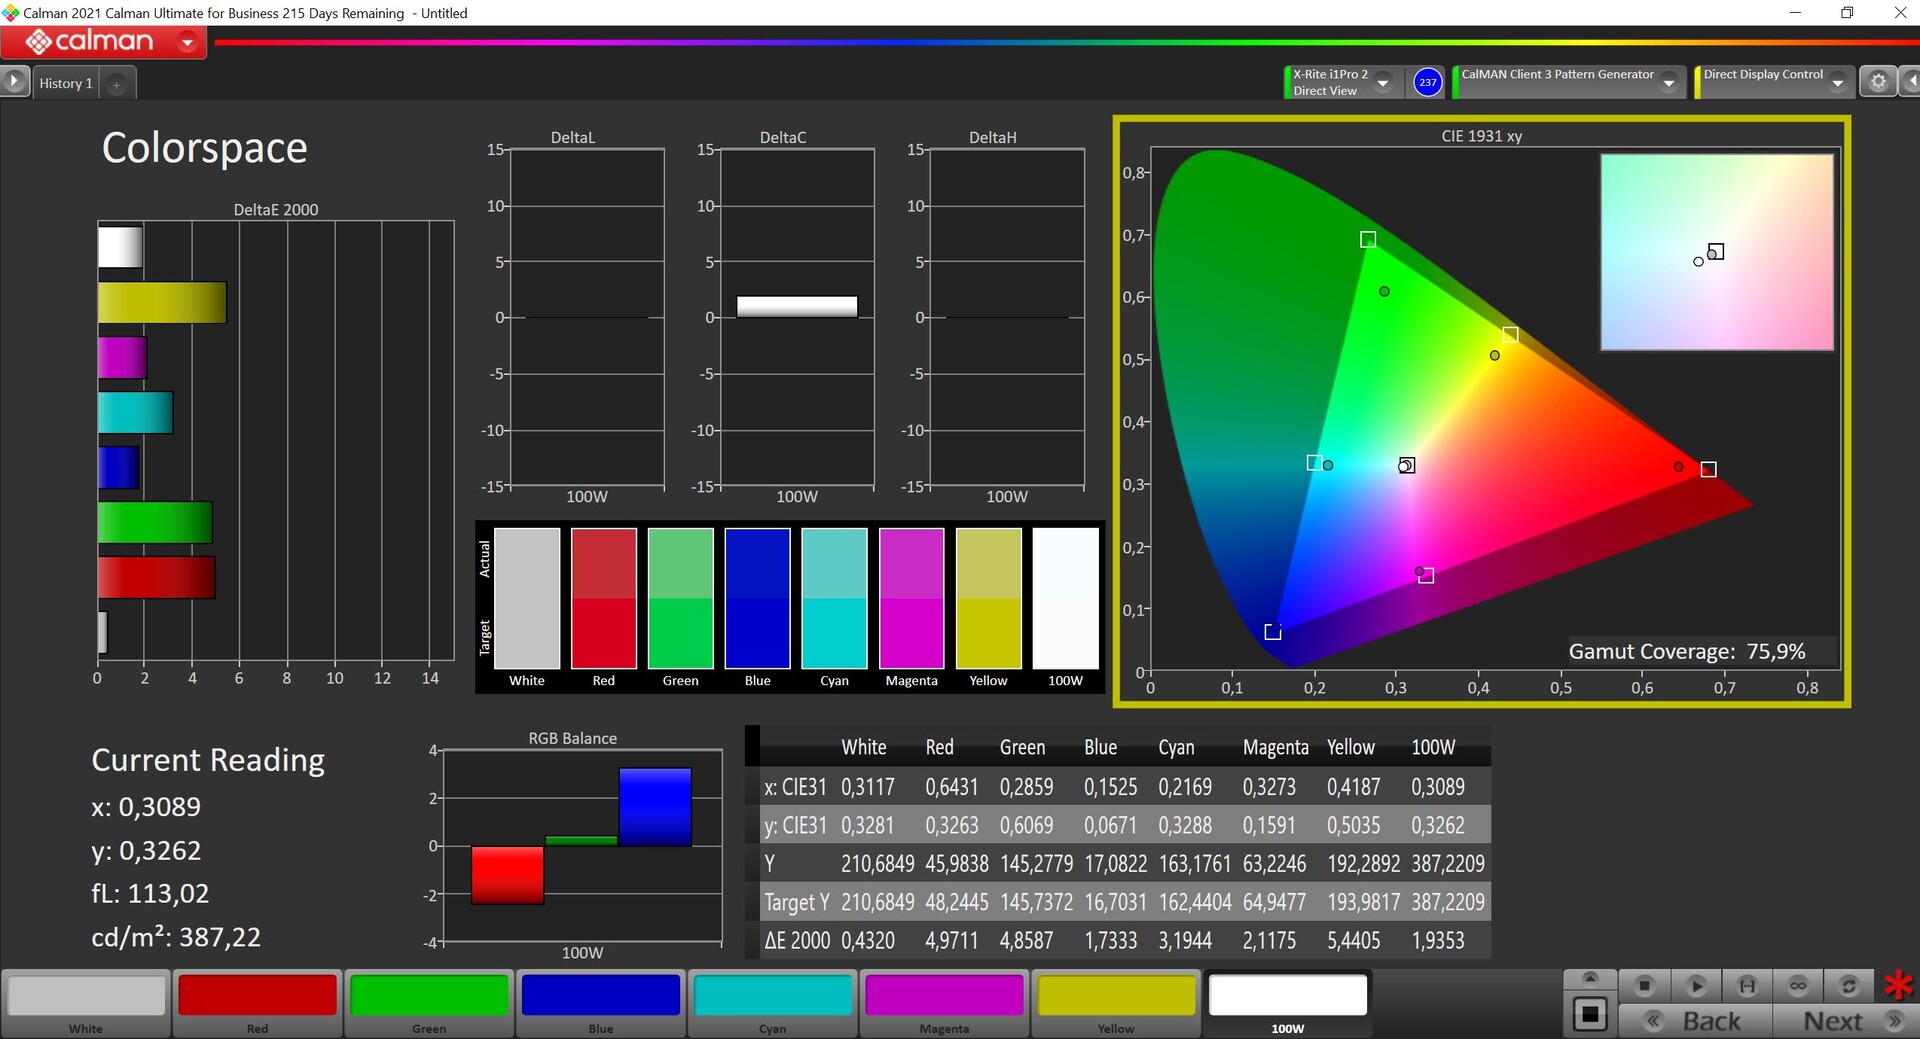
开箱后的画质已经非常好了。我们用专业的CalMAN软件(X-Rite i1 Pro 2)对面板进行了分析,与P3参考色彩空间相比,灰度以及色彩检查器的性能都只显示出小的偏差。然而,有一个小的蓝色偏移,色温也有点偏冷。我们自己的校准(配置文件可以在上面的盒子里免费下载)进一步提高了性能,所以该面板也适合于图片/视频编辑。有点遗憾的是,华硕没有包括一个切换到较小的sRGB色域的选项。
更新:Armoury Crate软件中有一个专门的sRGB配置文件。

Display Response Times
| ↔ Response Time Black to White | ||
|---|---|---|
| 19 ms ... rise ↗ and fall ↘ combined | ↗ 10.6 ms rise | 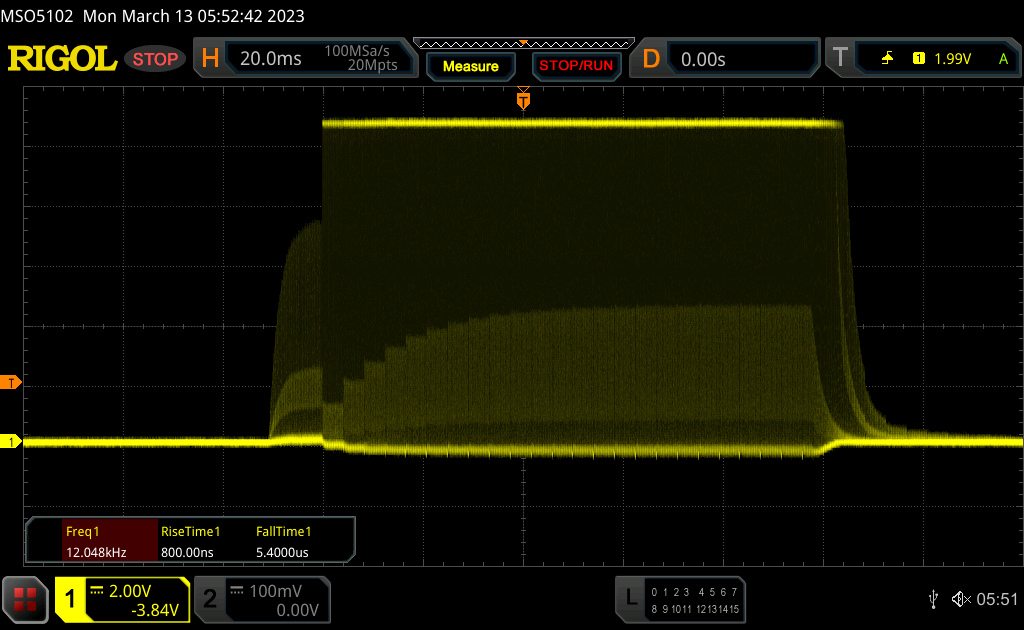 |
| ↘ 8.4 ms fall | ||
| The screen shows good response rates in our tests, but may be too slow for competitive gamers. In comparison, all tested devices range from 0.1 (minimum) to 240 (maximum) ms. » 42 % of all devices are better. This means that the measured response time is similar to the average of all tested devices (19.9 ms). | ||
| ↔ Response Time 50% Grey to 80% Grey | ||
| 15.2 ms ... rise ↗ and fall ↘ combined | ↗ 11.2 ms rise | 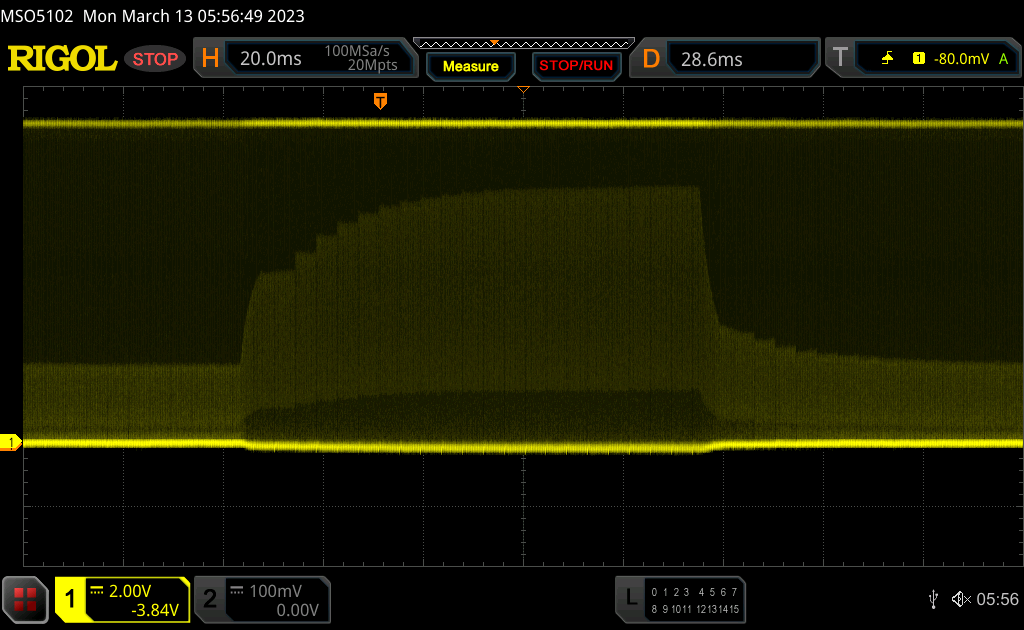 |
| ↘ 4 ms fall | ||
| The screen shows good response rates in our tests, but may be too slow for competitive gamers. In comparison, all tested devices range from 0.165 (minimum) to 636 (maximum) ms. » 29 % of all devices are better. This means that the measured response time is better than the average of all tested devices (31.1 ms). | ||
Screen Flickering / PWM (Pulse-Width Modulation)
| Screen flickering / PWM detected | 12000 Hz | ≤ 100 % brightness setting | 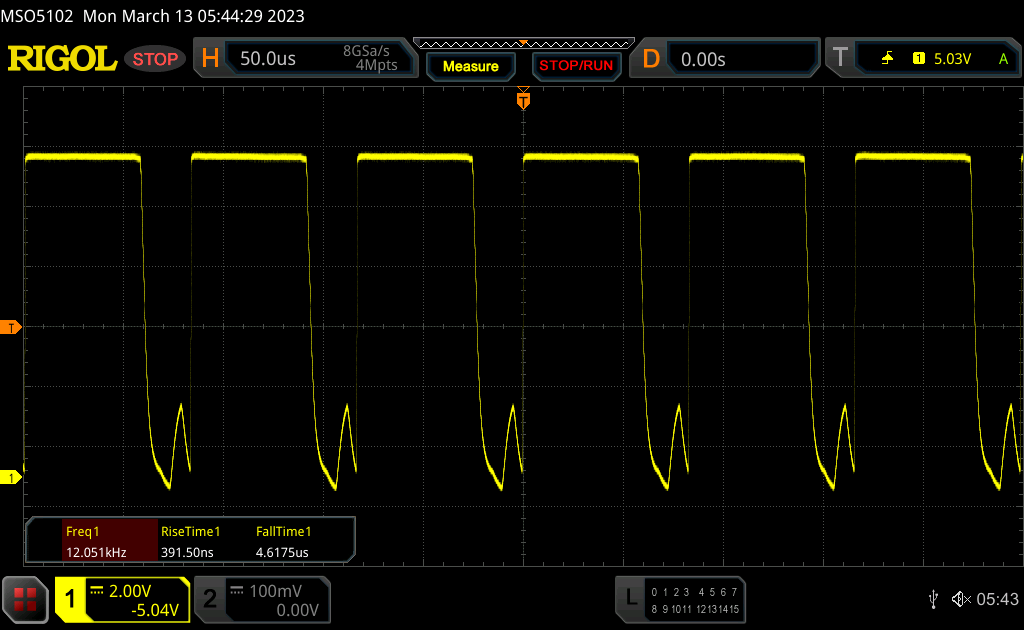 |
The display backlight flickers at 12000 Hz (worst case, e.g., utilizing PWM) Flickering detected at a brightness setting of 100 % and below. There should be no flickering or PWM above this brightness setting. The frequency of 12000 Hz is quite high, so most users sensitive to PWM should not notice any flickering. In comparison: 52 % of all tested devices do not use PWM to dim the display. If PWM was detected, an average of 7794 (minimum: 5 - maximum: 343500) Hz was measured. | |||
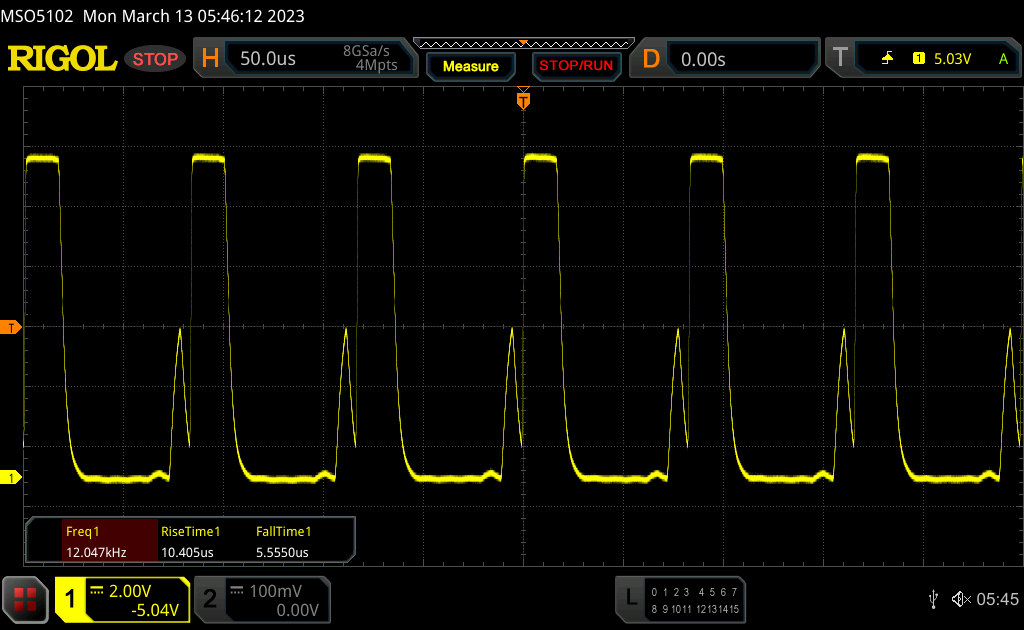
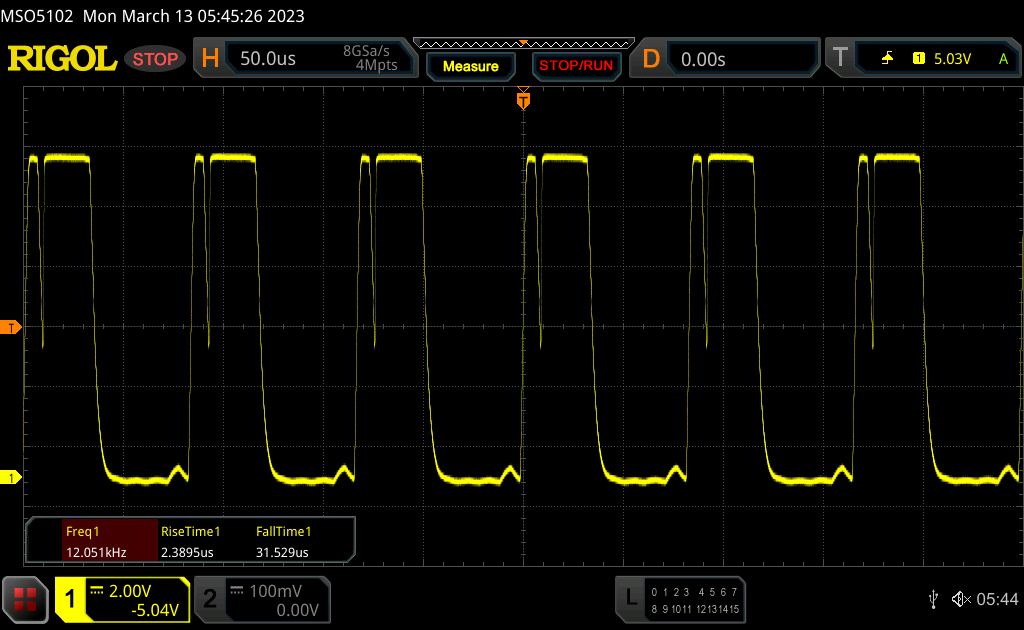
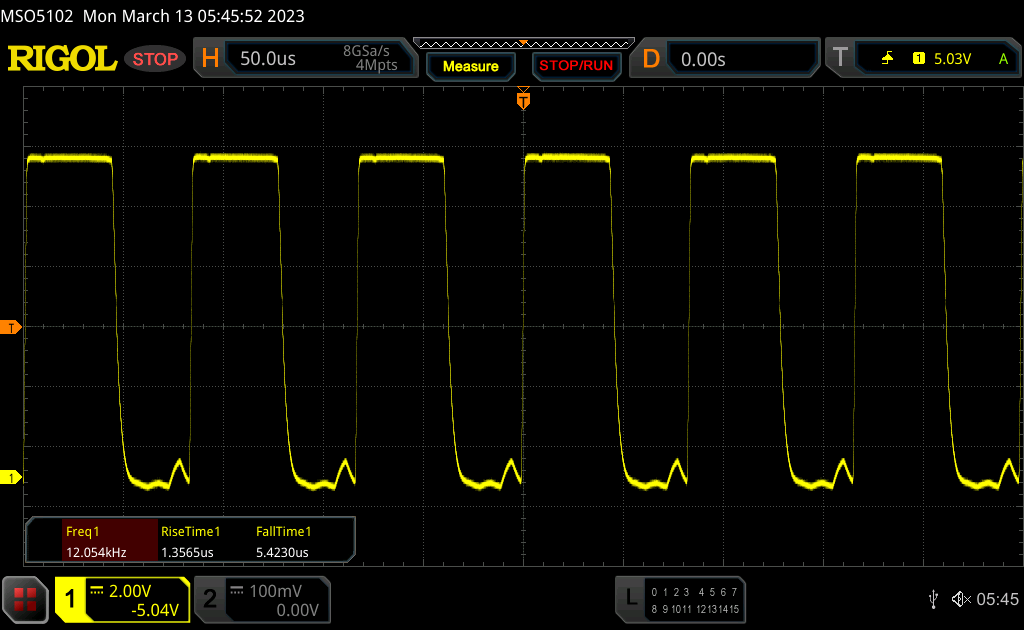
该面板在所有亮度水平上都使用了PWM,但12kHz的频率非常高,应该不会造成任何问题。然而,持续的PWM闪烁使其很难准确测量响应时间。我们的结果是相当平均的,但华硕宣传的响应时间是3毫秒。在我们的测试中,我们没有注意到任何重影,该面板对游戏来说是很好的。
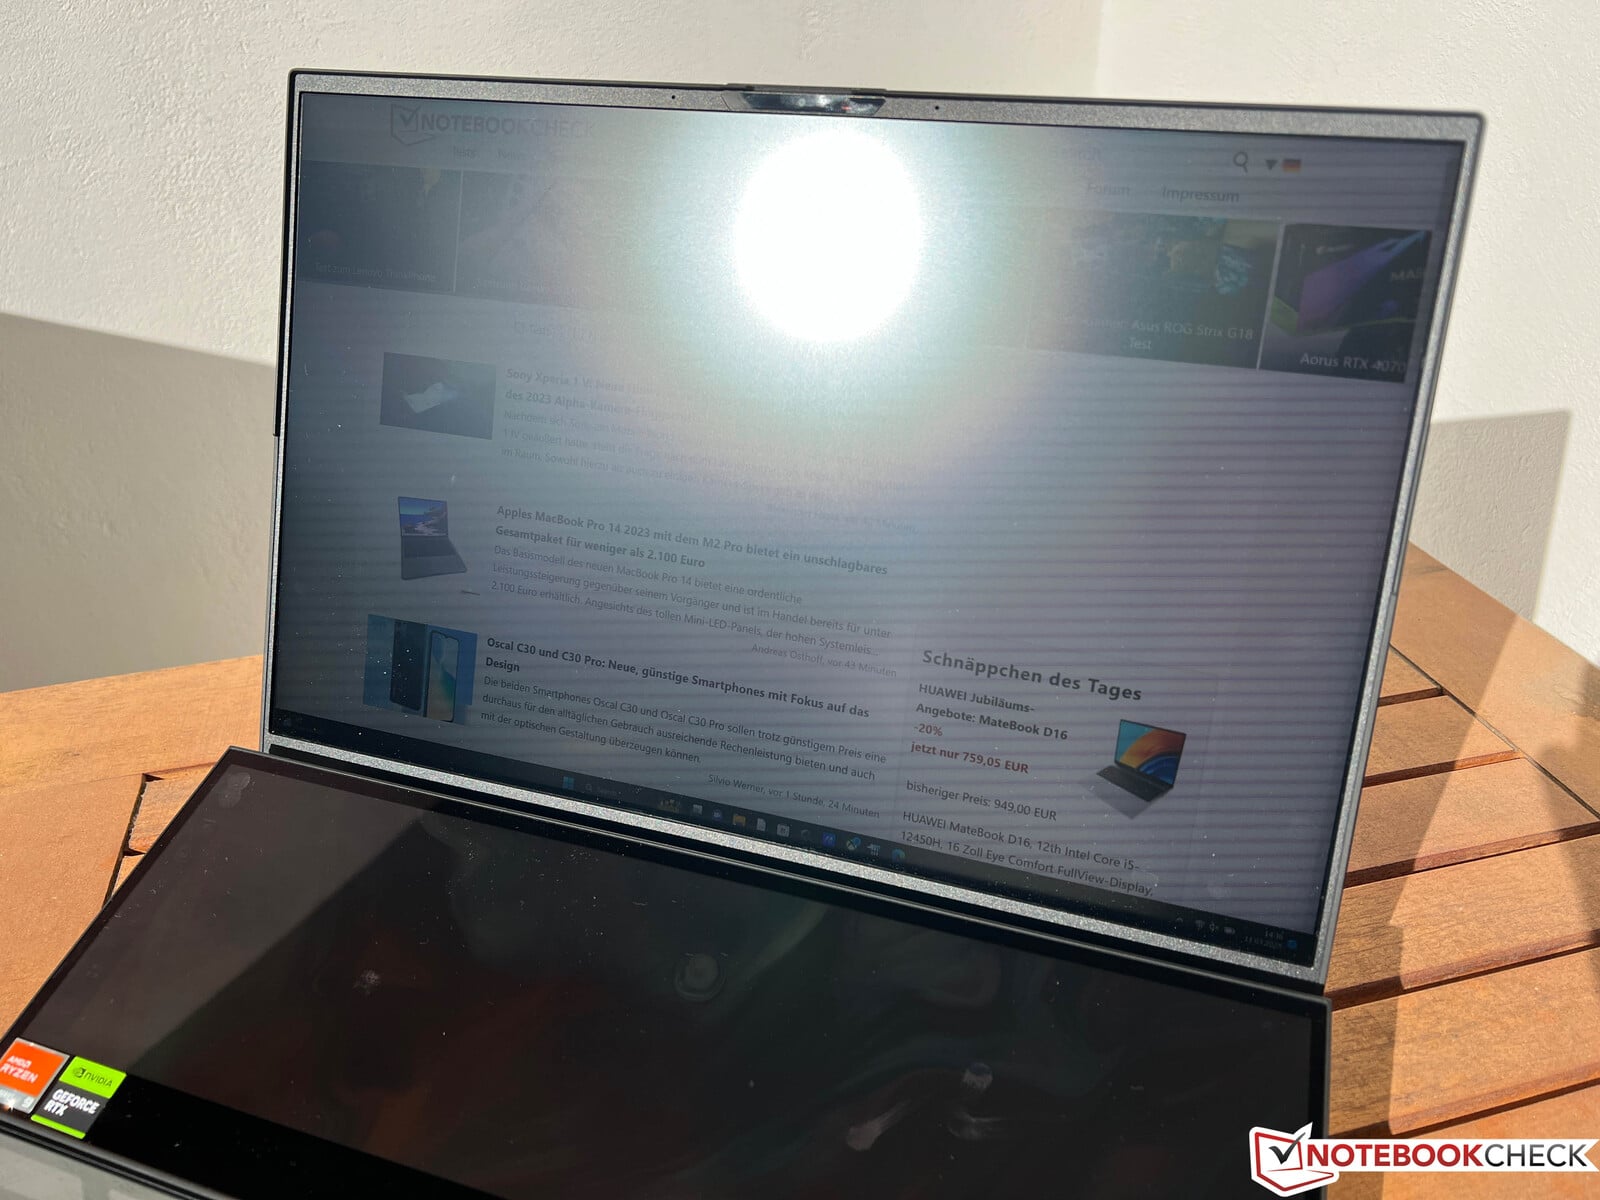
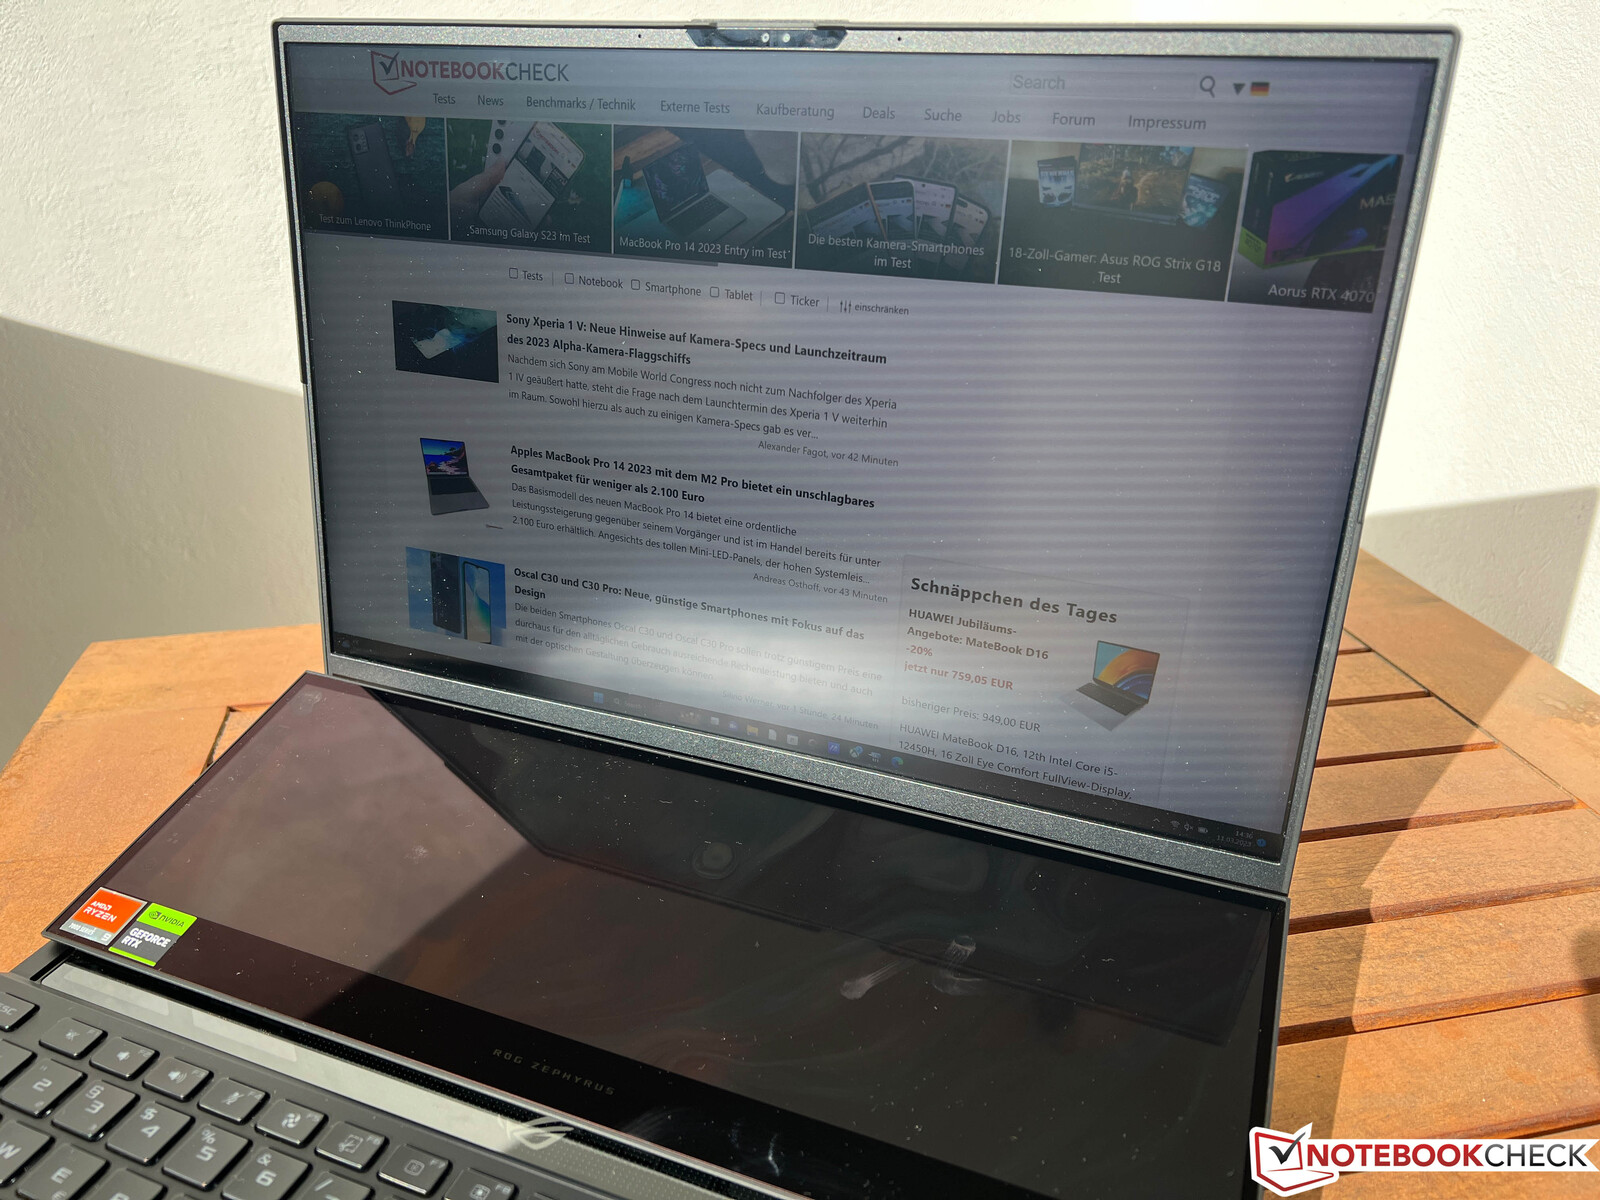
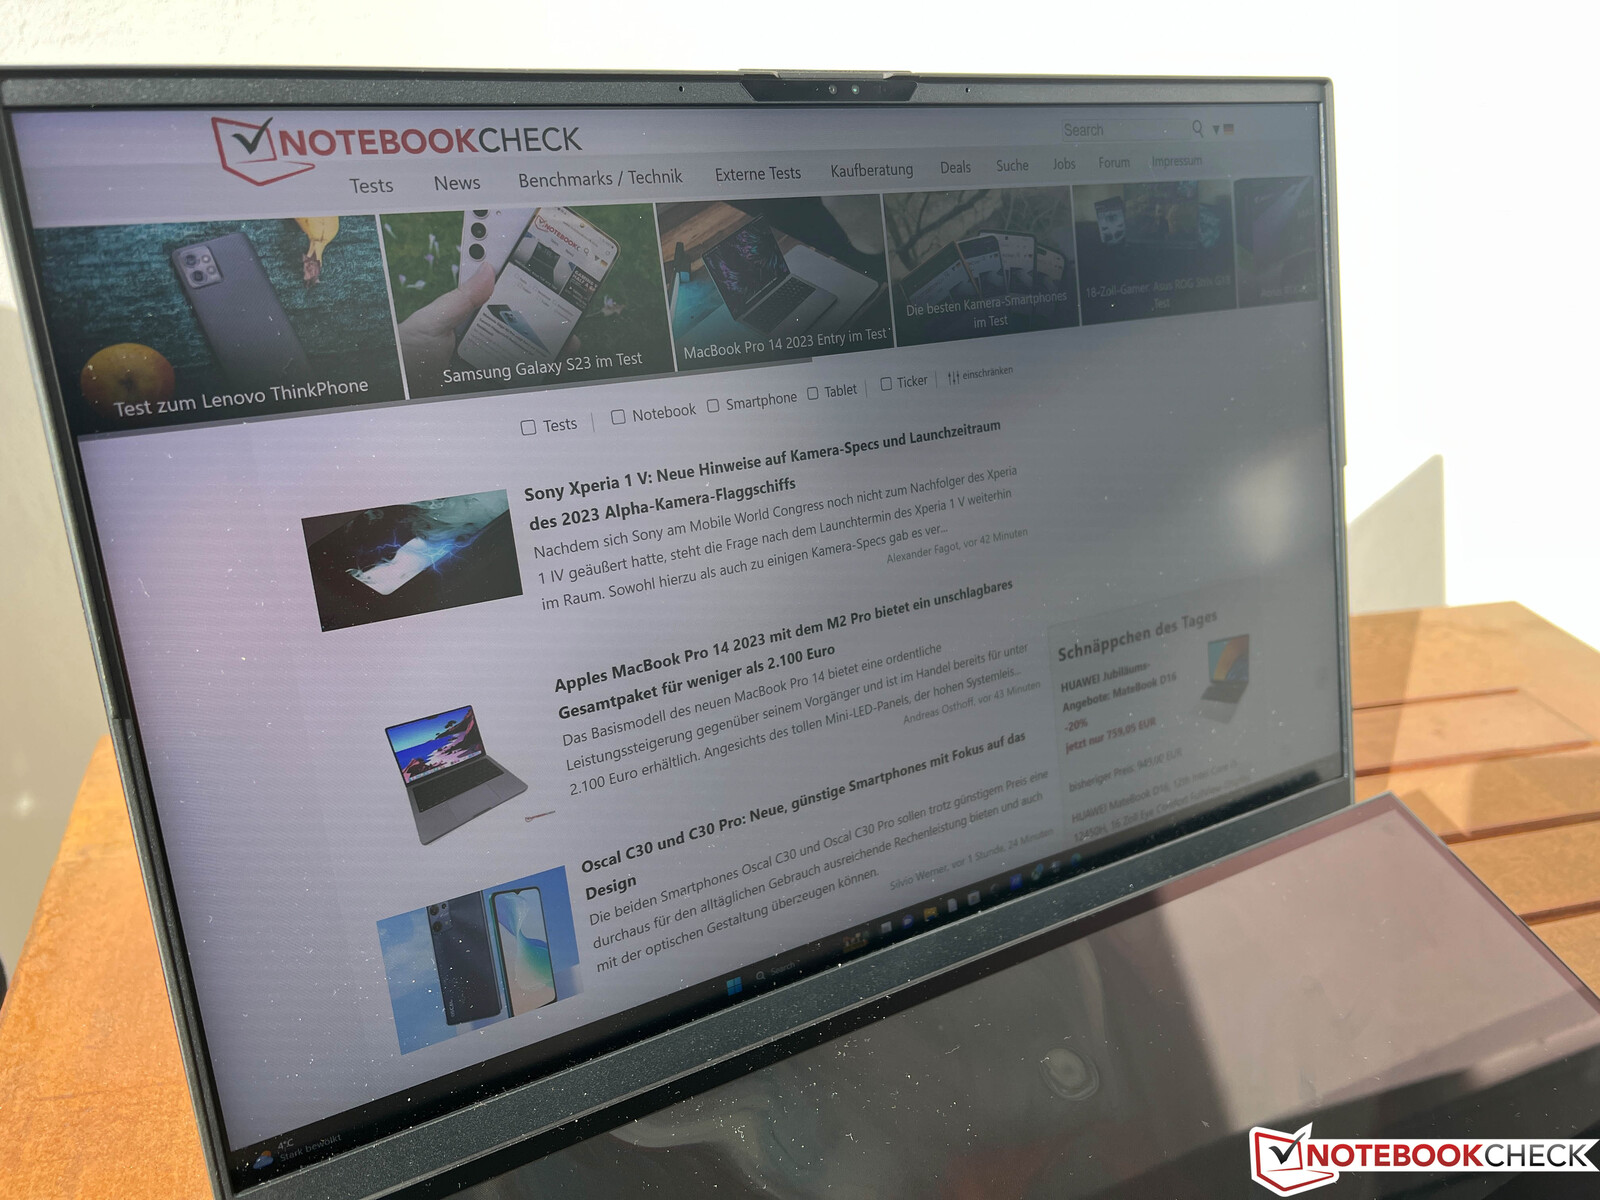
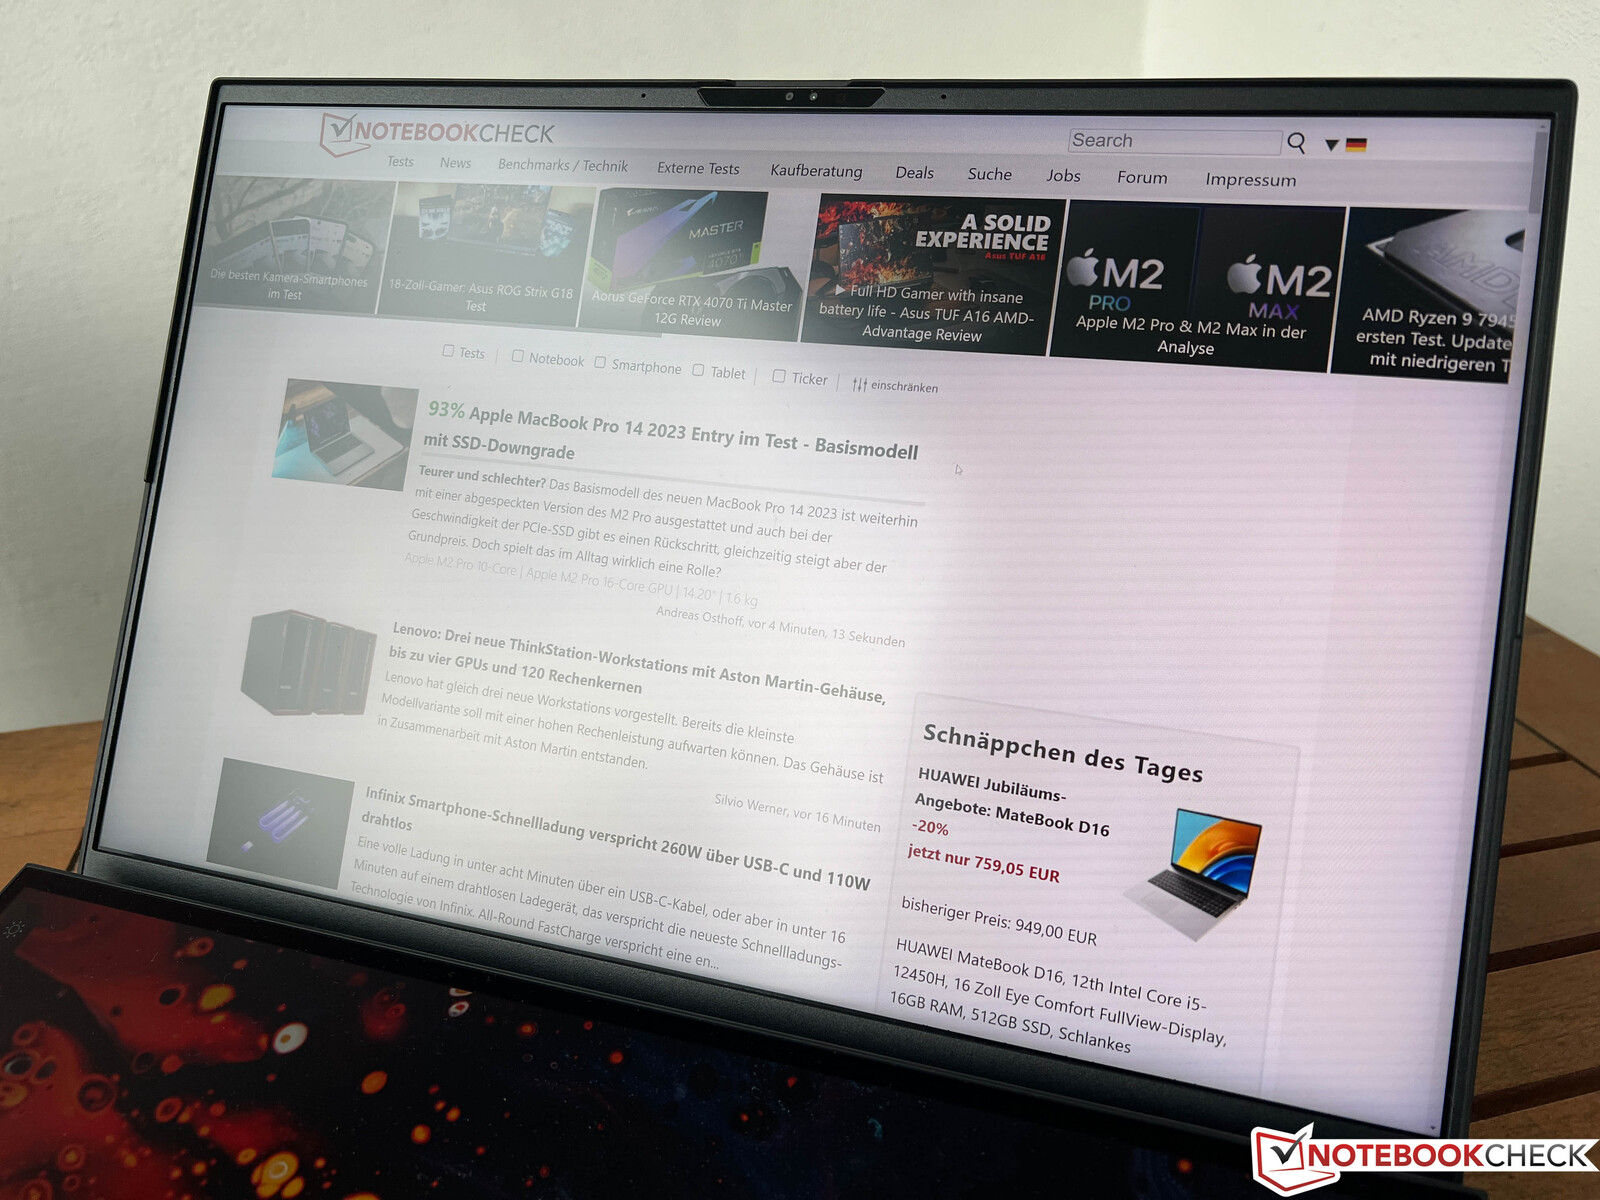
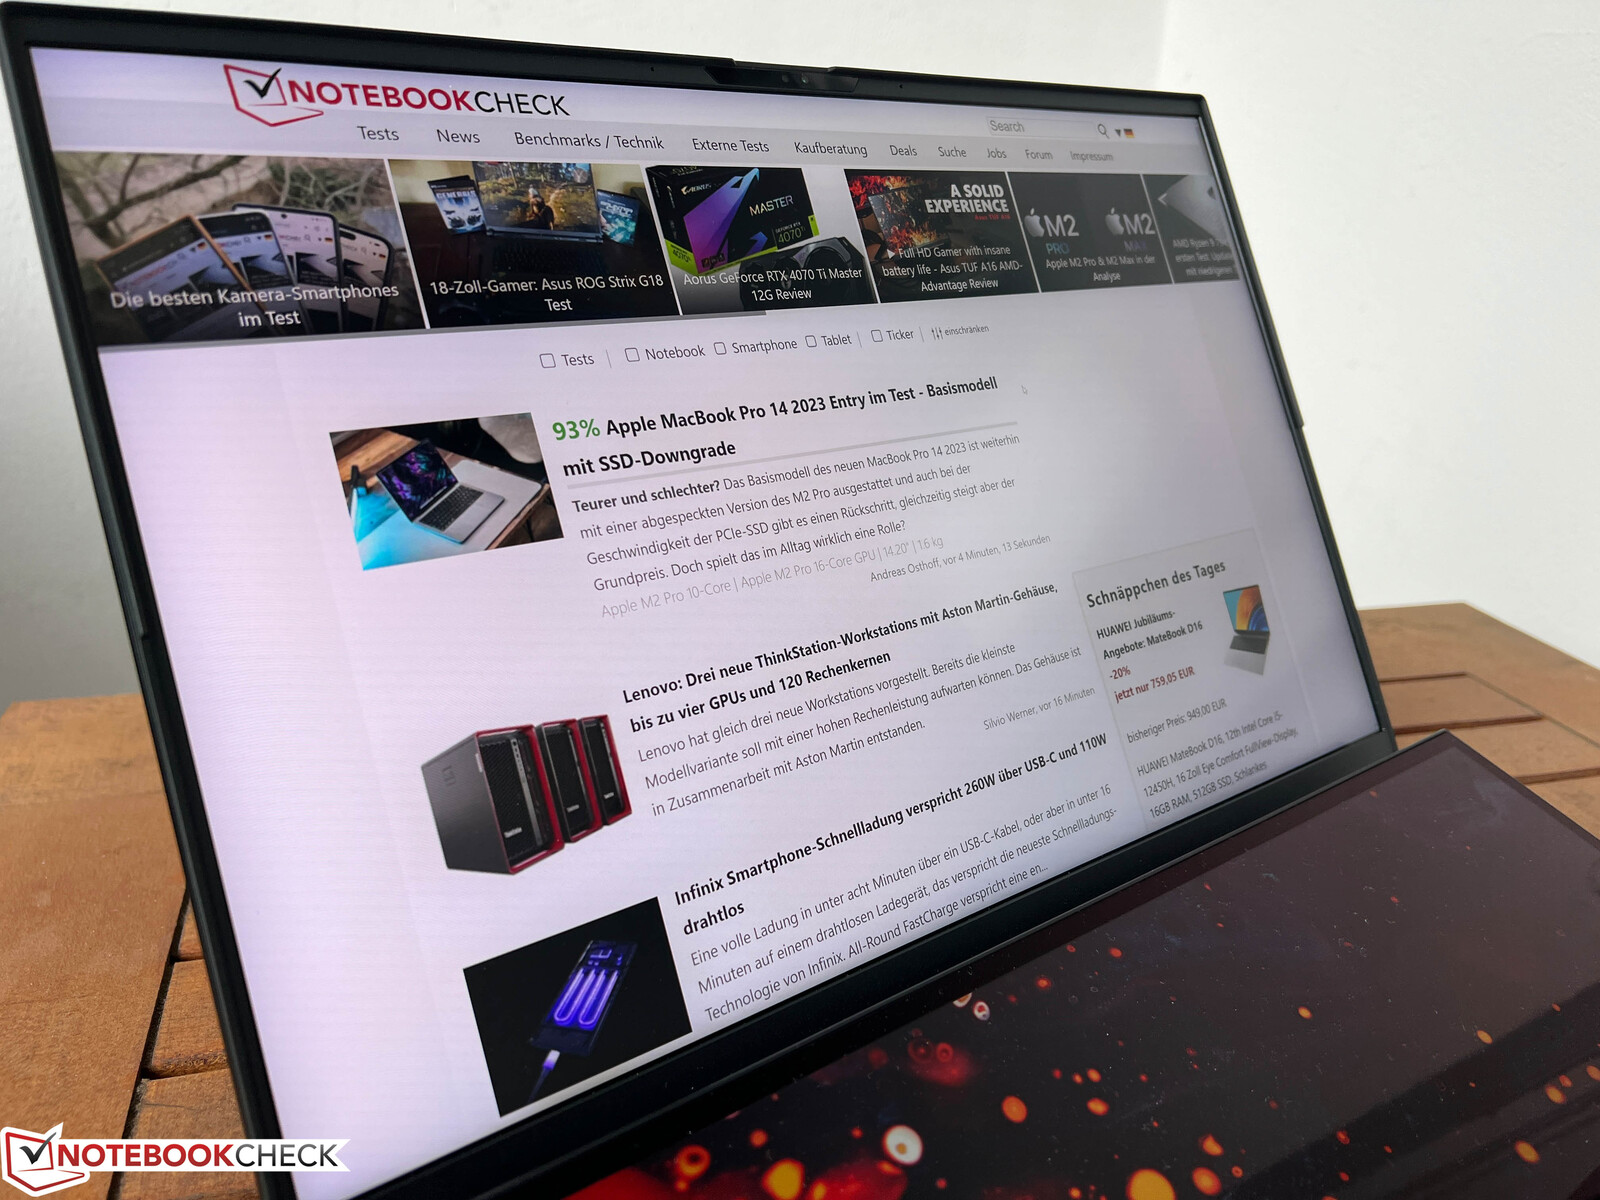
哑光的Mini-LED面板在户外也很好用,这在我们的户外照片中得到了证实。你显然应该避免来自直接光源的反射,但在阳光明媚的日子里,你仍然可以非常舒适地看到内容,而在光面副屏(约400尼特)上,你什么都看不到。视角的稳定性也不会引起任何批评。

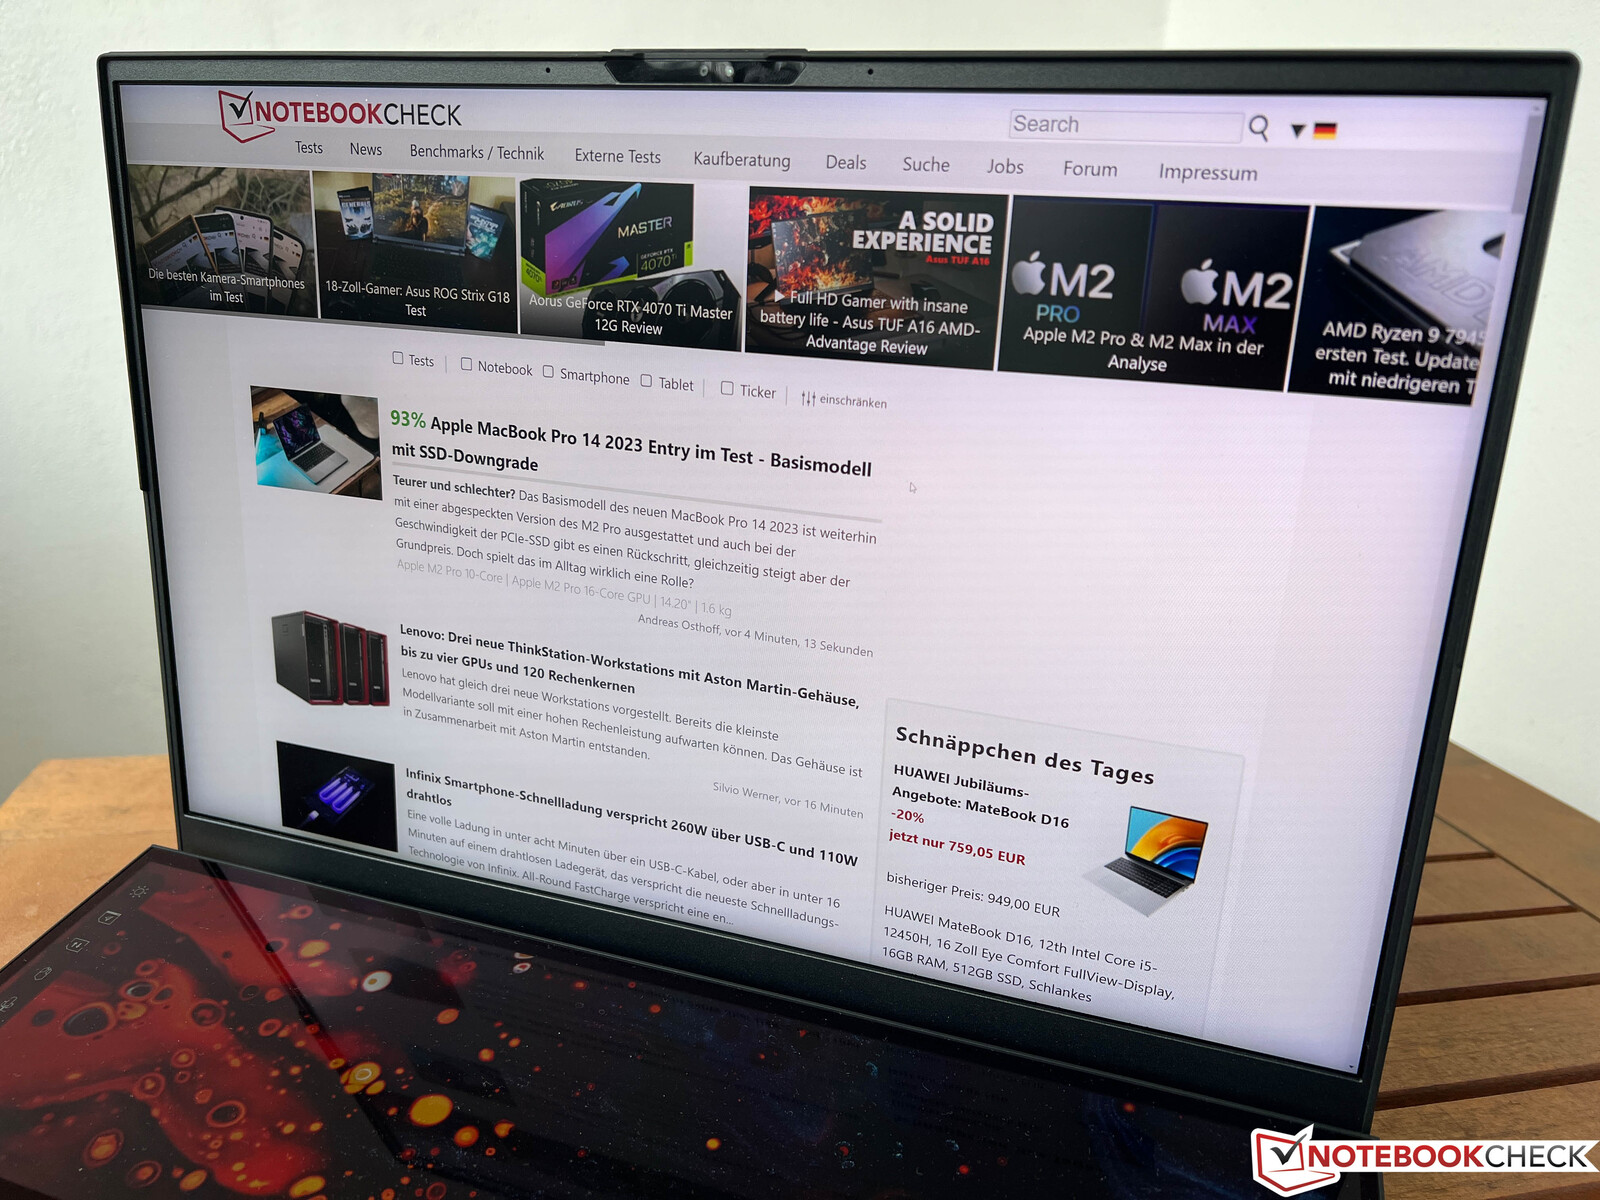
ScreenPad Plus - 4K IPS触摸屏
像 去年的型号,副屏的分辨率为3840 x 1100像素(14英寸),现在是光泽的。触摸输入执行得很好,华硕通过调整缩放系数避免了不同水平分辨率的问题,这意味着当你从一个显示器切换到另一个显示器时,窗口的宽度不会改变。这在实践中效果相当好,但在全屏模式下运行应用程序(如游戏)时可能会出现问题,因为第二屏幕上的应用程序或窗口会移动。
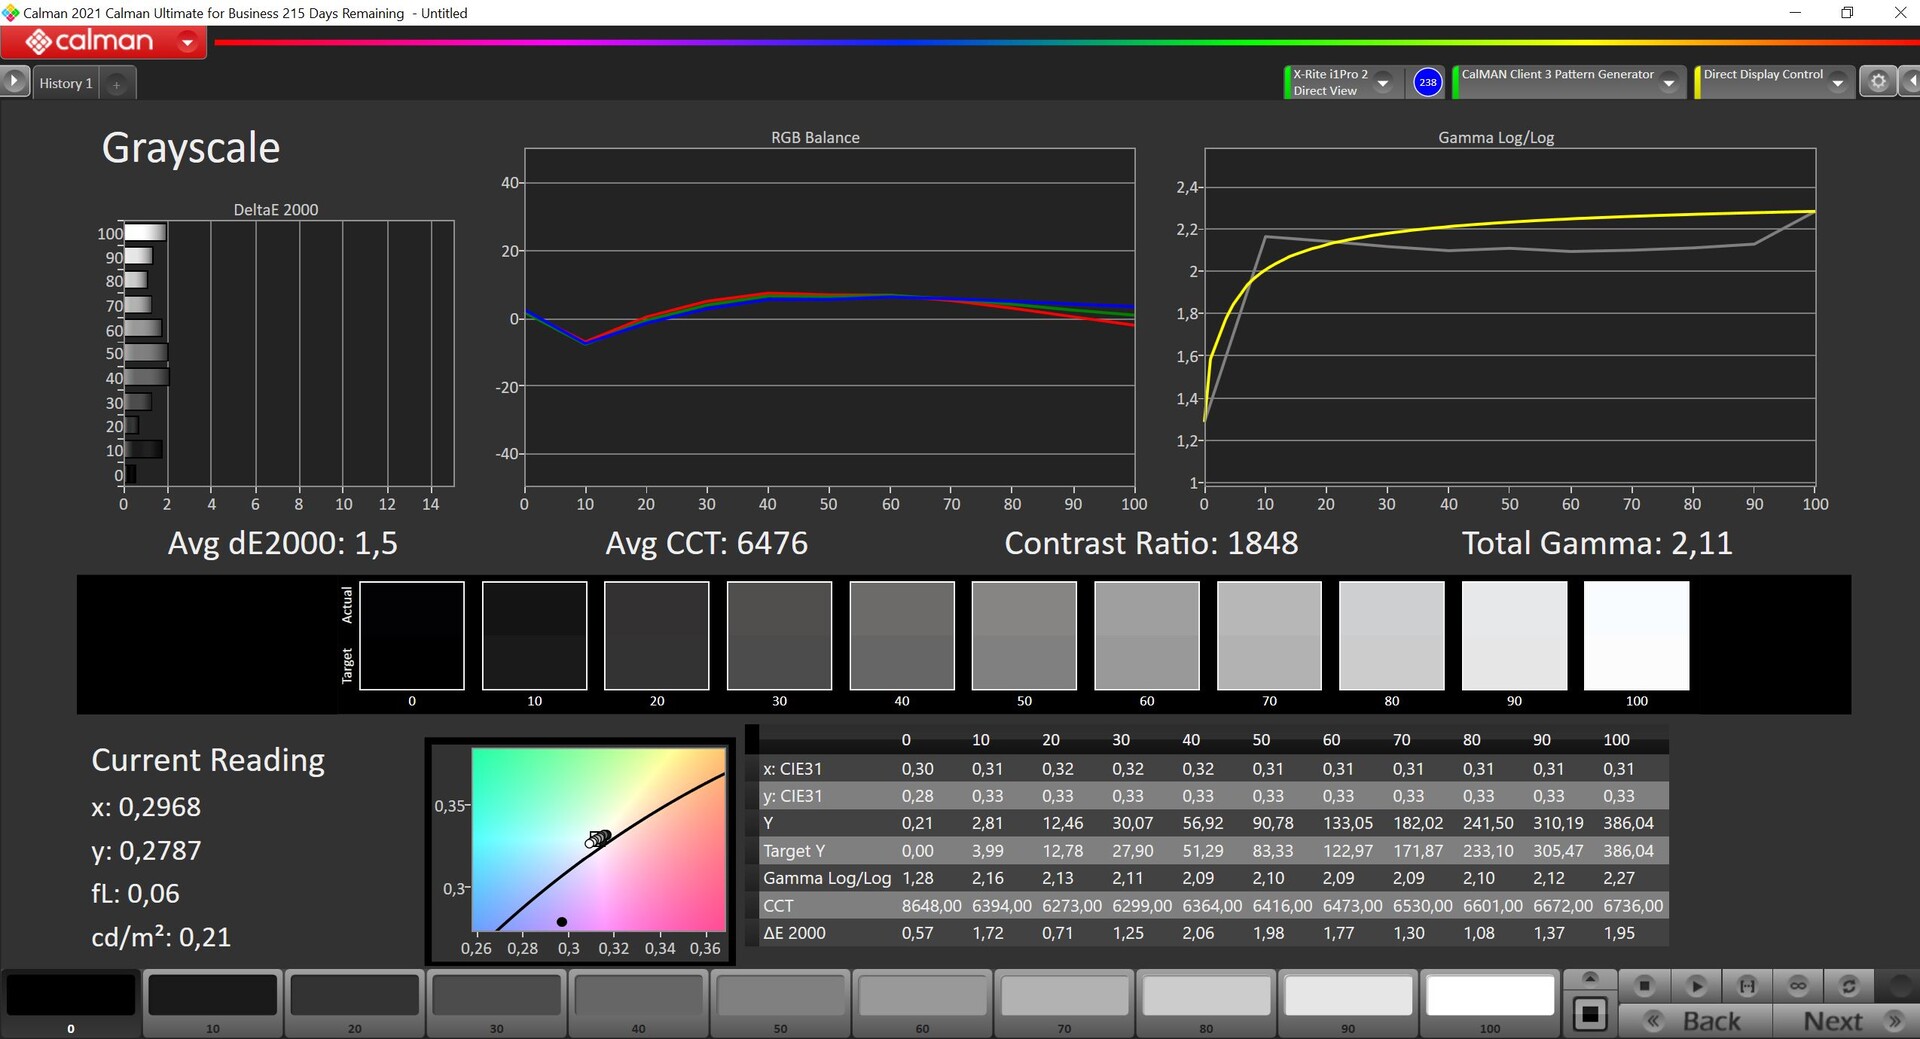
亮度接近400尼特,其他测量结果也不错,但画质无法跟上主屏幕。额外的面板也被限制在较小的sRGB色域内,但我们没有检测到任何PWM闪烁。
| |||||||||||||||||||||||||
Brightness Distribution: 90 %
Center on Battery: 386 cd/m²
Contrast: 1838:1 (Black: 0.21 cd/m²)
ΔE ColorChecker Calman: 1.7 | ∀{0.5-29.43 Ø4.73}
ΔE Greyscale Calman: 1.5 | ∀{0.09-98 Ø4.97}
Gamma: 2.11
CCT: 6476 K

Display Response Times
| ↔ Response Time Black to White | ||
|---|---|---|
| 17.2 ms ... rise ↗ and fall ↘ combined | ↗ 7.7 ms rise | 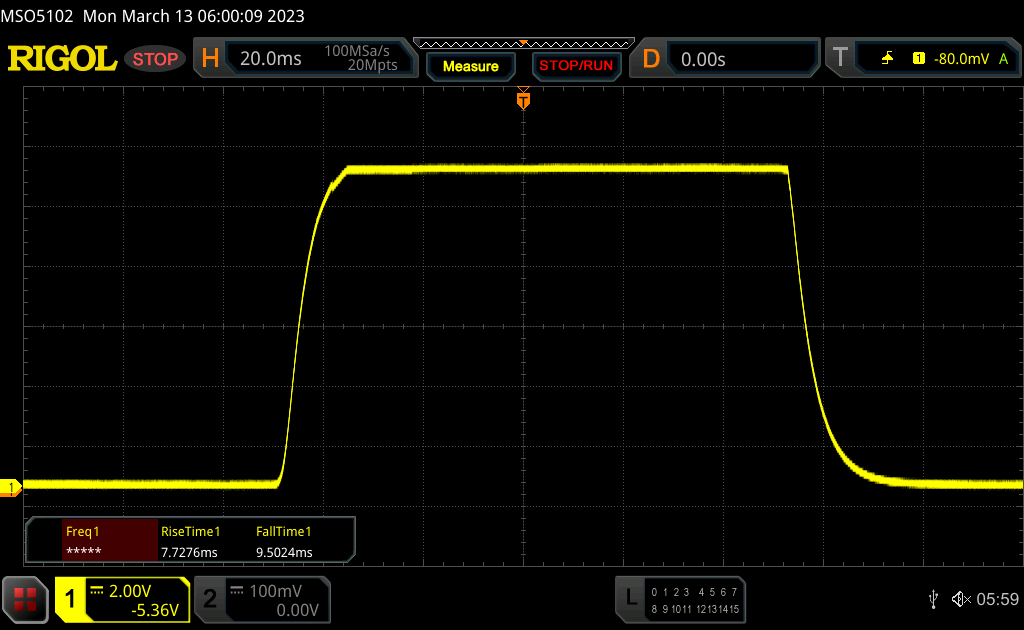 |
| ↘ 9.5 ms fall | ||
| The screen shows good response rates in our tests, but may be too slow for competitive gamers. In comparison, all tested devices range from 0.1 (minimum) to 240 (maximum) ms. » 39 % of all devices are better. This means that the measured response time is better than the average of all tested devices (19.9 ms). | ||
| ↔ Response Time 50% Grey to 80% Grey | ||
| 32.1 ms ... rise ↗ and fall ↘ combined | ↗ 15.4 ms rise | 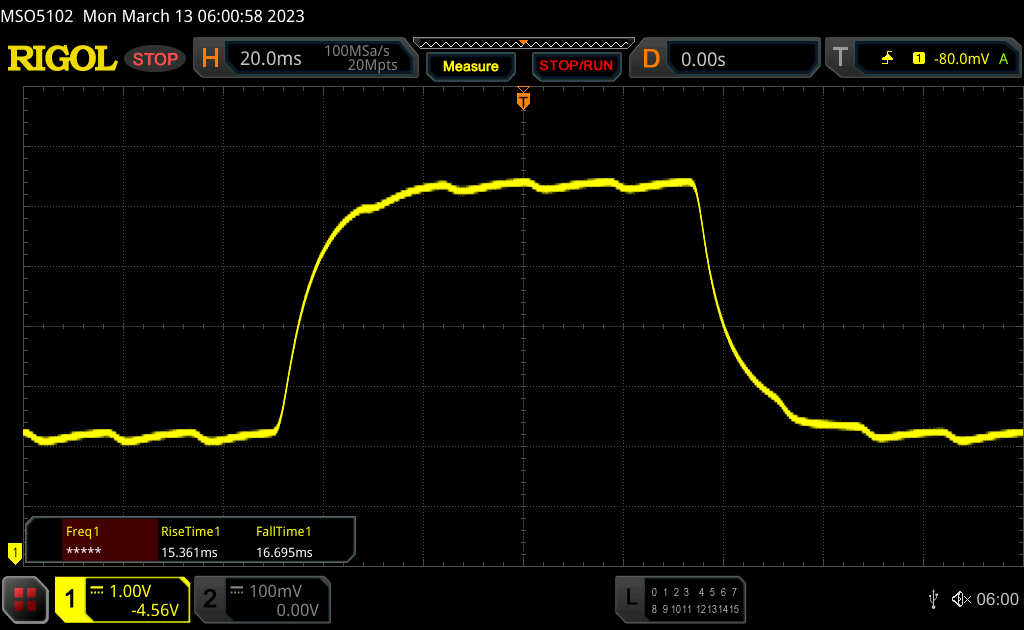 |
| ↘ 16.7 ms fall | ||
| The screen shows slow response rates in our tests and will be unsatisfactory for gamers. In comparison, all tested devices range from 0.165 (minimum) to 636 (maximum) ms. » 44 % of all devices are better. This means that the measured response time is similar to the average of all tested devices (31.1 ms). | ||
Screen Flickering / PWM (Pulse-Width Modulation)
| Screen flickering / PWM not detected | 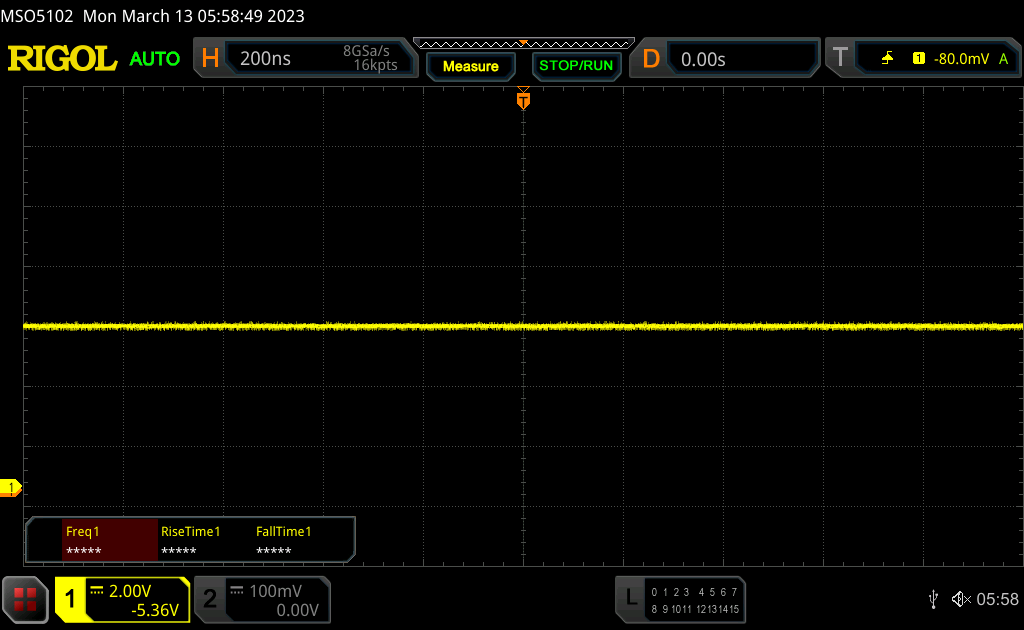 | ||
In comparison: 52 % of all tested devices do not use PWM to dim the display. If PWM was detected, an average of 7794 (minimum: 5 - maximum: 343500) Hz was measured. | |||
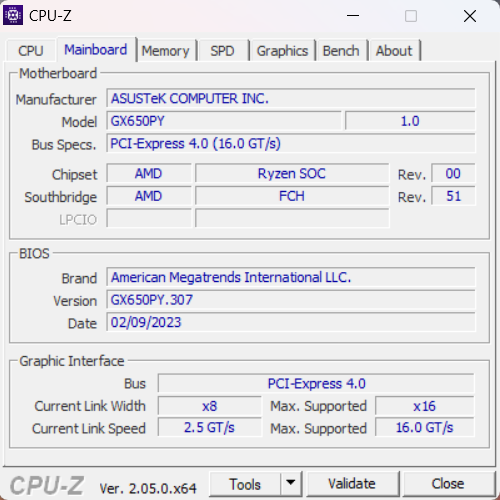
性能 - Ryzen 9和RTX 4090笔记本电脑
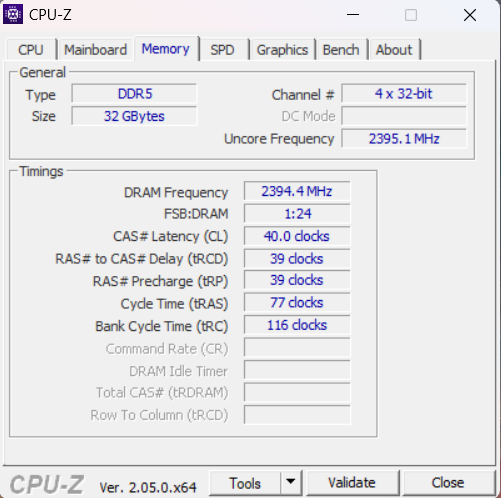
ROG Zephyrus Duo的所有型号都配备了强大的AMD Ryzen 9 7945HX,但华硕并没有使用快速内存,仍然使用DDR5-4800。我们在评测过程中也遇到了一些bug,例如,我们在启动AIDA64基准测试时甚至出现了一些蓝屏。你还必须知道,当你使用外部屏幕时,图形是由专用的GeForce GPU处理的。这是由副屏幕引起的,即使在关闭两个集成屏幕时,GeForce GPU也在运行,这显然会增加功耗。
审查设置
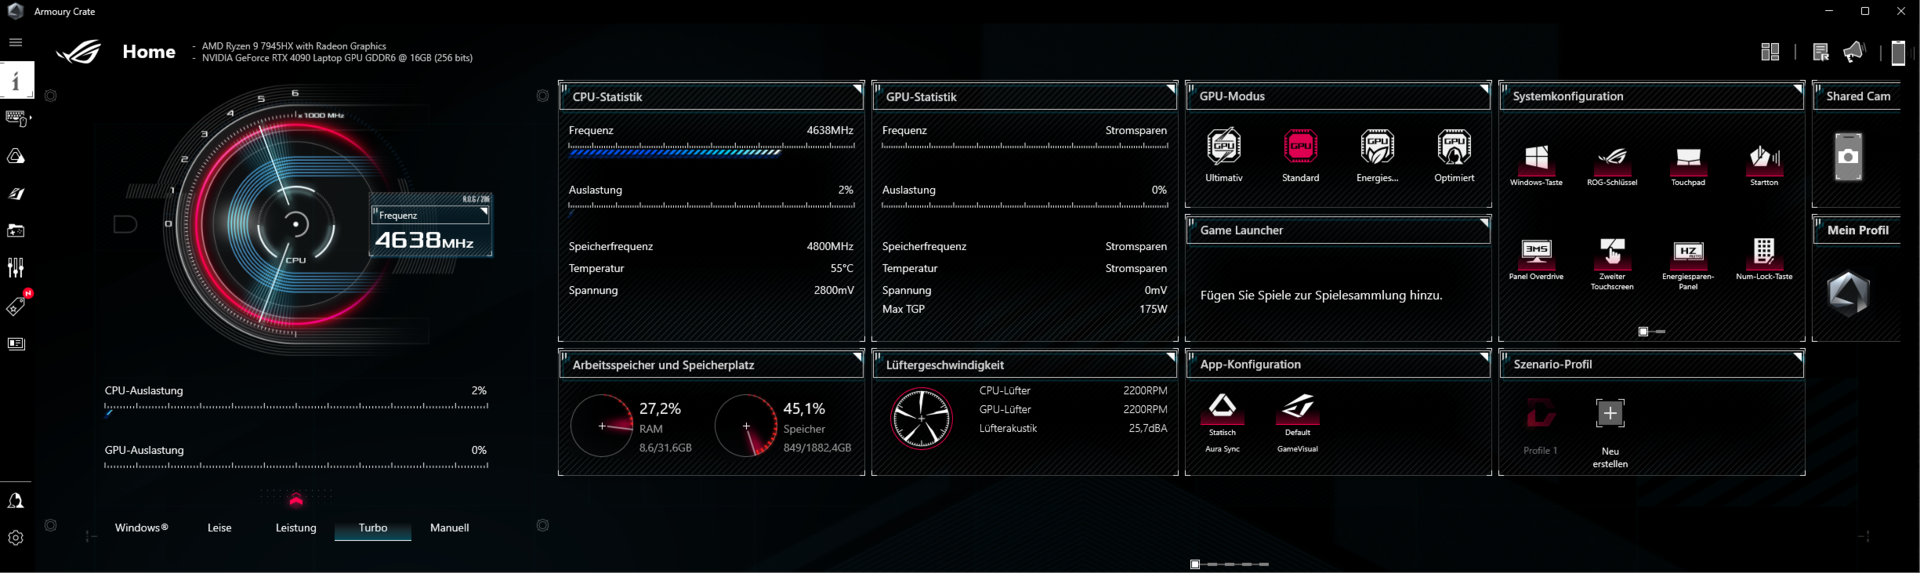
预装的Armoury Crate软件为ROG Zephyrus Duo 16提供了几个电源配置文件。除了基本配置文件外,还可以调整GPU设置。我们使用Turbo配置文件以及默认的GPU设置(MSHybrid)获得了最佳的整体效果。
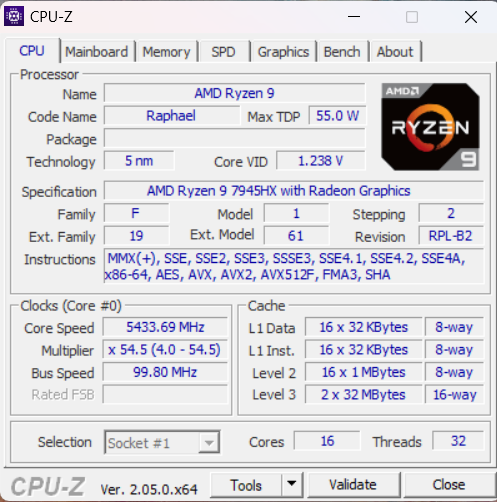
处理器
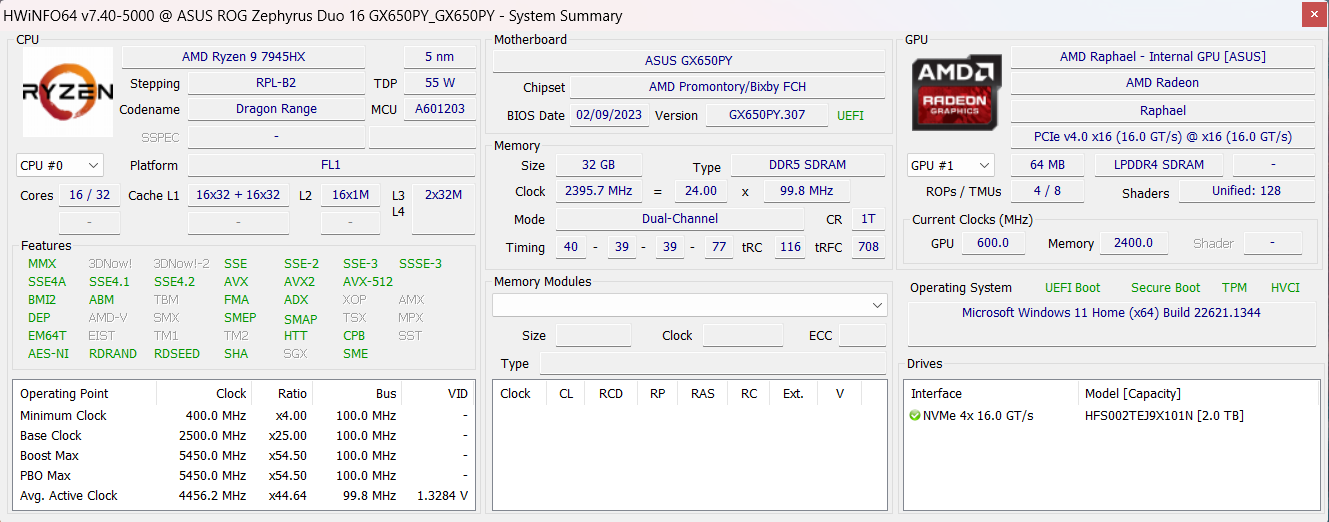
新的AMD Ryzen 9 7945HX (Dragon Range)使用16个Zen4内核(32个线程),采用5纳米工艺制造。它是AMD新的旗舰移动CPU,是英特尔目前猛禽湖HX芯片的直接对手。AMD宣传的典型TDP为55瓦,但ROH Zephyrus Duo 16中的处理器可消耗130瓦,持续工作负荷为120瓦。这意味着它比英特尔的最新型号如酷睿i9-13980HX等,后者在峰值负载情况下可消耗超过200瓦特。
特别是多核性能令人印象深刻,Ryzen 9 7945HX在几乎所有基准测试中都能占据榜首。英特尔目前的CPU只在单核测试中略有优势,但在这些情况下也会消耗更多电力。我们将在另一篇比较文章中提供新的AMD Ryzen 9 7945HX和猛禽湖HX CPU之间的性能和效率的详细比较。
Cinebench R15 Multi Loop
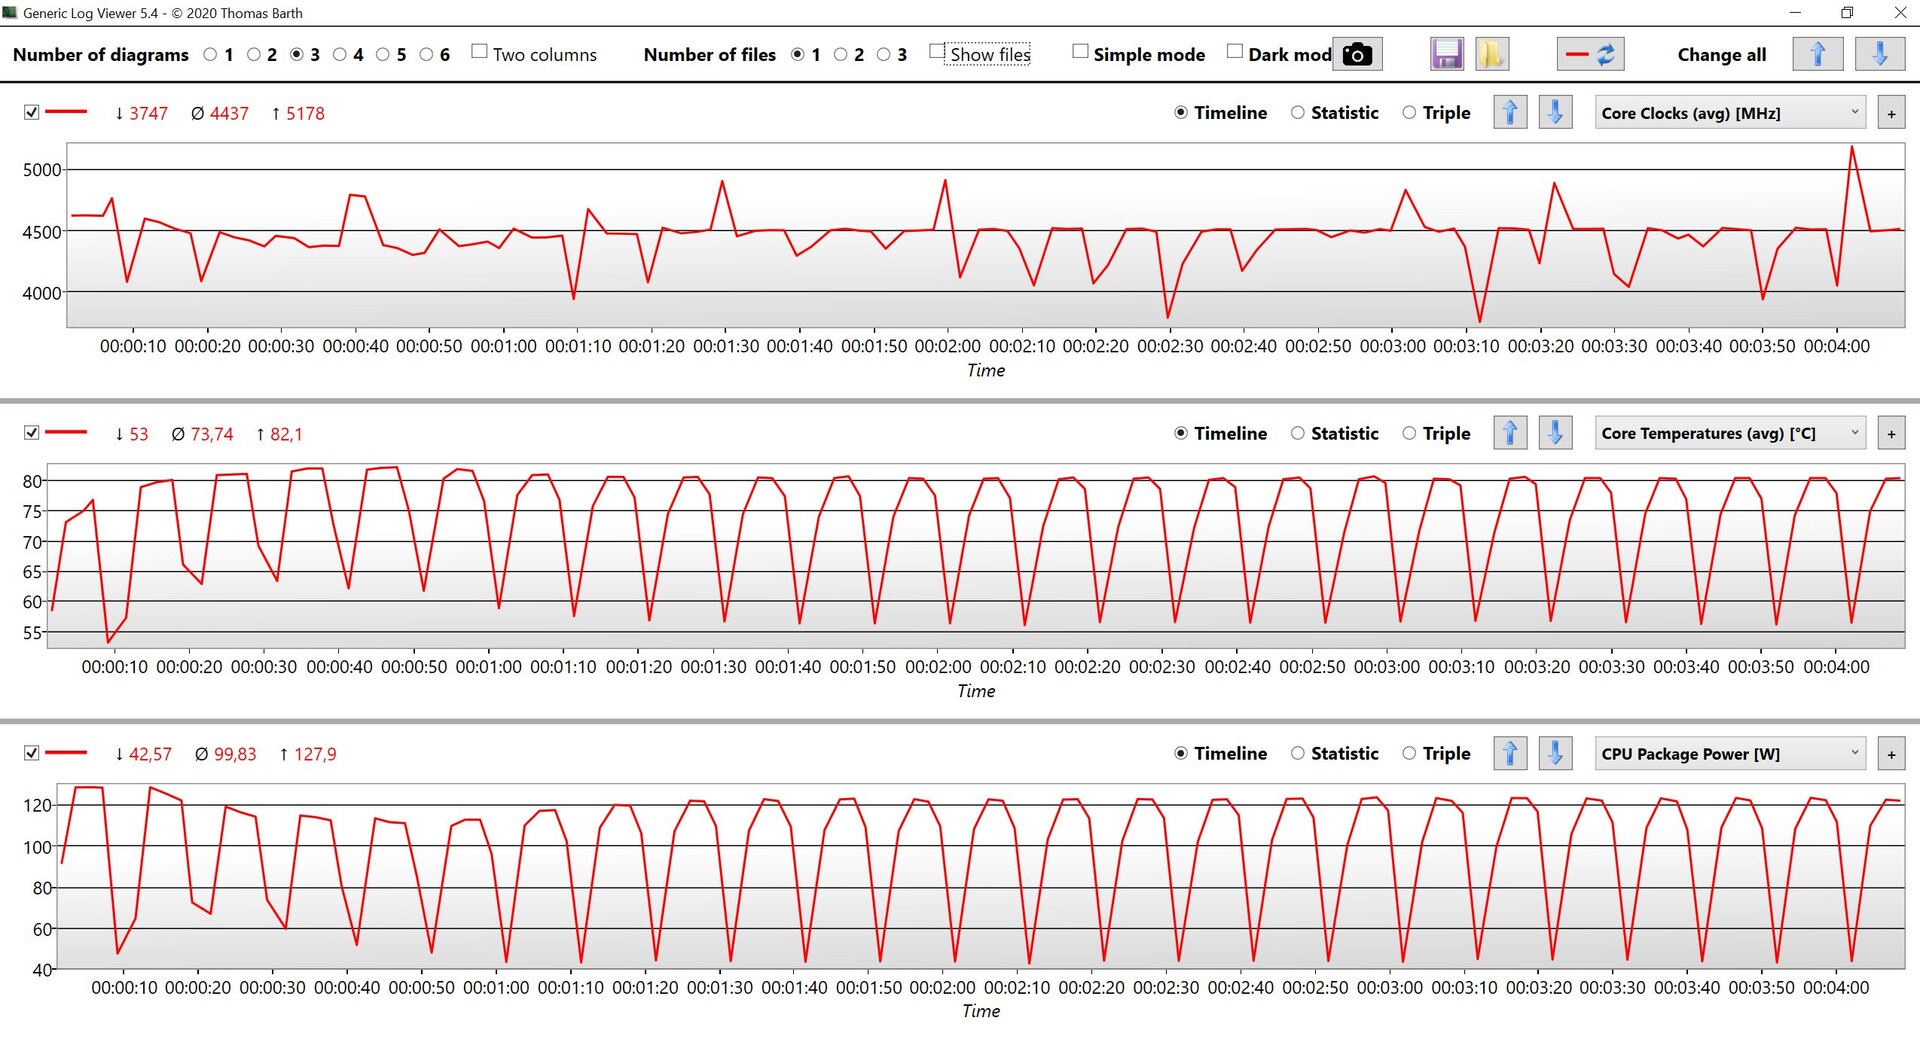
在持续的工作负荷下,CPU的性能几乎完全稳定,但在电池运行的多核测试中,你必须预期有大约50%的性能下降(单核性能不受影响)。与之相比Ryzen 9 6900HX在旧的Zephyrus Duo 16相比,在所有CPU基准测试中,CPU性能提高了68%。更多基准测试结果可在 我们的技术部分.
Cinebench R23: Multi Core | Single Core
Cinebench R20: CPU (Multi Core) | CPU (Single Core)
Cinebench R15: CPU Multi 64Bit | CPU Single 64Bit
Blender: v2.79 BMW27 CPU
7-Zip 18.03: 7z b 4 | 7z b 4 -mmt1
Geekbench 5.5: Multi-Core | Single-Core
HWBOT x265 Benchmark v2.2: 4k Preset
LibreOffice : 20 Documents To PDF
R Benchmark 2.5: Overall mean
| CPU Performance rating | |
| MSI Titan GT77 HX 13VI | |
| Average AMD Ryzen 9 7945HX | |
| Asus Zephyrus Duo 16 GX650PY-NM006W | |
| MSI Titan GT77 HX 13VI | |
| Lenovo Legion Pro 7 16IRX8H | |
| Schenker XMG Neo 16 Raptor Lake | |
| Razer Blade 16 Early 2023 | |
| Average of class Gaming | |
| MSI Titan GT77 12UHS | |
| Apple MacBook Pro 16 2023 M2 Max -6! | |
| Asus ROG Zephyrus Duo 16 GX650RX | |
| Cinebench R23 / Multi Core | |
| Asus Zephyrus Duo 16 GX650PY-NM006W | |
| MSI Titan GT77 HX 13VI | |
| Average AMD Ryzen 9 7945HX (30783 - 34613, n=9) | |
| MSI Titan GT77 HX 13VI | |
| Lenovo Legion Pro 7 16IRX8H | |
| Schenker XMG Neo 16 Raptor Lake | |
| Schenker XMG Neo 16 Raptor Lake | |
| Schenker XMG Neo 16 Raptor Lake | |
| Razer Blade 16 Early 2023 | |
| Average of class Gaming (10488 - 40970, n=112, last 2 years) | |
| MSI Titan GT77 12UHS | |
| Apple MacBook Pro 16 2023 M2 Max | |
| Asus ROG Zephyrus Duo 16 GX650RX | |
| Cinebench R23 / Single Core | |
| MSI Titan GT77 HX 13VI | |
| MSI Titan GT77 HX 13VI | |
| Schenker XMG Neo 16 Raptor Lake | |
| Lenovo Legion Pro 7 16IRX8H | |
| Razer Blade 16 Early 2023 | |
| Average of class Gaming (1166 - 2356, n=112, last 2 years) | |
| Asus Zephyrus Duo 16 GX650PY-NM006W | |
| Average AMD Ryzen 9 7945HX (1861 - 1957, n=9) | |
| MSI Titan GT77 12UHS | |
| Apple MacBook Pro 16 2023 M2 Max | |
| Asus ROG Zephyrus Duo 16 GX650RX | |
| Cinebench R20 / CPU (Multi Core) | |
| Asus Zephyrus Duo 16 GX650PY-NM006W | |
| Average AMD Ryzen 9 7945HX (10025 - 13769, n=9) | |
| MSI Titan GT77 HX 13VI | |
| MSI Titan GT77 HX 13VI | |
| Lenovo Legion Pro 7 16IRX8H | |
| Schenker XMG Neo 16 Raptor Lake | |
| Average of class Gaming (4029 - 16108, n=111, last 2 years) | |
| Razer Blade 16 Early 2023 | |
| MSI Titan GT77 12UHS | |
| Asus ROG Zephyrus Duo 16 GX650RX | |
| Apple MacBook Pro 16 2023 M2 Max | |
| Cinebench R20 / CPU (Single Core) | |
| MSI Titan GT77 HX 13VI | |
| MSI Titan GT77 HX 13VI | |
| Lenovo Legion Pro 7 16IRX8H | |
| Average of class Gaming (442 - 895, n=111, last 2 years) | |
| Schenker XMG Neo 16 Raptor Lake | |
| Asus Zephyrus Duo 16 GX650PY-NM006W | |
| Razer Blade 16 Early 2023 | |
| Average AMD Ryzen 9 7945HX (712 - 760, n=9) | |
| MSI Titan GT77 12UHS | |
| Asus ROG Zephyrus Duo 16 GX650RX | |
| Apple MacBook Pro 16 2023 M2 Max | |
| Cinebench R15 / CPU Multi 64Bit | |
| Asus Zephyrus Duo 16 GX650PY-NM006W | |
| Average AMD Ryzen 9 7945HX (4998 - 5663, n=10) | |
| MSI Titan GT77 HX 13VI | |
| MSI Titan GT77 HX 13VI | |
| Schenker XMG Neo 16 Raptor Lake | |
| Schenker XMG Neo 16 Raptor Lake | |
| Lenovo Legion Pro 7 16IRX8H | |
| Razer Blade 16 Early 2023 | |
| Average of class Gaming (1578 - 6271, n=111, last 2 years) | |
| MSI Titan GT77 12UHS | |
| Asus ROG Zephyrus Duo 16 GX650RX | |
| Apple MacBook Pro 16 2023 M2 Max | |
| Cinebench R15 / CPU Single 64Bit | |
| MSI Titan GT77 HX 13VI | |
| Asus Zephyrus Duo 16 GX650PY-NM006W | |
| Average AMD Ryzen 9 7945HX (290 - 311, n=10) | |
| Lenovo Legion Pro 7 16IRX8H | |
| MSI Titan GT77 HX 13VI | |
| Schenker XMG Neo 16 Raptor Lake | |
| Schenker XMG Neo 16 Raptor Lake | |
| Average of class Gaming (188.8 - 343, n=111, last 2 years) | |
| MSI Titan GT77 12UHS | |
| Razer Blade 16 Early 2023 | |
| Asus ROG Zephyrus Duo 16 GX650RX | |
| Apple MacBook Pro 16 2023 M2 Max | |
| Blender / v2.79 BMW27 CPU | |
| Asus ROG Zephyrus Duo 16 GX650RX | |
| Average of class Gaming (80 - 330, n=109, last 2 years) | |
| MSI Titan GT77 12UHS | |
| Razer Blade 16 Early 2023 | |
| Schenker XMG Neo 16 Raptor Lake | |
| Lenovo Legion Pro 7 16IRX8H | |
| MSI Titan GT77 HX 13VI | |
| MSI Titan GT77 HX 13VI | |
| Average AMD Ryzen 9 7945HX (87 - 100, n=9) | |
| Asus Zephyrus Duo 16 GX650PY-NM006W | |
| 7-Zip 18.03 / 7z b 4 | |
| Asus Zephyrus Duo 16 GX650PY-NM006W | |
| Average AMD Ryzen 9 7945HX (123364 - 140932, n=9) | |
| MSI Titan GT77 HX 13VI | |
| MSI Titan GT77 HX 13VI | |
| Lenovo Legion Pro 7 16IRX8H | |
| Schenker XMG Neo 16 Raptor Lake | |
| Razer Blade 16 Early 2023 | |
| Average of class Gaming (33491 - 148086, n=110, last 2 years) | |
| MSI Titan GT77 12UHS | |
| Asus ROG Zephyrus Duo 16 GX650RX | |
| 7-Zip 18.03 / 7z b 4 -mmt1 | |
| Average AMD Ryzen 9 7945HX (7319 - 7711, n=9) | |
| Asus Zephyrus Duo 16 GX650PY-NM006W | |
| Lenovo Legion Pro 7 16IRX8H | |
| MSI Titan GT77 HX 13VI | |
| MSI Titan GT77 HX 13VI | |
| Schenker XMG Neo 16 Raptor Lake | |
| Razer Blade 16 Early 2023 | |
| Average of class Gaming (4199 - 7436, n=110, last 2 years) | |
| MSI Titan GT77 12UHS | |
| Asus ROG Zephyrus Duo 16 GX650RX | |
| Geekbench 5.5 / Multi-Core | |
| Lenovo Legion Pro 7 16IRX8H | |
| Schenker XMG Neo 16 Raptor Lake | |
| MSI Titan GT77 HX 13VI | |
| MSI Titan GT77 HX 13VI | |
| Average AMD Ryzen 9 7945HX (18372 - 20394, n=9) | |
| Asus Zephyrus Duo 16 GX650PY-NM006W | |
| Razer Blade 16 Early 2023 | |
| Average of class Gaming (6460 - 27010, n=110, last 2 years) | |
| MSI Titan GT77 12UHS | |
| Apple MacBook Pro 16 2023 M2 Max | |
| Asus ROG Zephyrus Duo 16 GX650RX | |
| Geekbench 5.5 / Single-Core | |
| MSI Titan GT77 HX 13VI | |
| Asus Zephyrus Duo 16 GX650PY-NM006W | |
| Average AMD Ryzen 9 7945HX (1960 - 2158, n=9) | |
| Average of class Gaming (986 - 2474, n=110, last 2 years) | |
| MSI Titan GT77 HX 13VI | |
| Lenovo Legion Pro 7 16IRX8H | |
| Schenker XMG Neo 16 Raptor Lake | |
| Apple MacBook Pro 16 2023 M2 Max | |
| MSI Titan GT77 12UHS | |
| Razer Blade 16 Early 2023 | |
| Asus ROG Zephyrus Duo 16 GX650RX | |
| HWBOT x265 Benchmark v2.2 / 4k Preset | |
| Average AMD Ryzen 9 7945HX (33.8 - 37.6, n=8) | |
| Asus Zephyrus Duo 16 GX650PY-NM006W | |
| MSI Titan GT77 HX 13VI | |
| MSI Titan GT77 HX 13VI | |
| Lenovo Legion Pro 7 16IRX8H | |
| Schenker XMG Neo 16 Raptor Lake | |
| Razer Blade 16 Early 2023 | |
| Average of class Gaming (11.5 - 44.3, n=110, last 2 years) | |
| MSI Titan GT77 12UHS | |
| Asus ROG Zephyrus Duo 16 GX650RX | |
| LibreOffice / 20 Documents To PDF | |
| Asus Zephyrus Duo 16 GX650PY-NM006W | |
| Average of class Gaming (19 - 88.8, n=110, last 2 years) | |
| Razer Blade 16 Early 2023 | |
| MSI Titan GT77 HX 13VI | |
| Schenker XMG Neo 16 Raptor Lake | |
| Asus ROG Zephyrus Duo 16 GX650RX | |
| Average AMD Ryzen 9 7945HX (35.5 - 60.4, n=8) | |
| Lenovo Legion Pro 7 16IRX8H | |
| MSI Titan GT77 12UHS | |
| MSI Titan GT77 HX 13VI | |
| R Benchmark 2.5 / Overall mean | |
| Asus ROG Zephyrus Duo 16 GX650RX | |
| Average of class Gaming (0.3439 - 0.759, n=111, last 2 years) | |
| MSI Titan GT77 12UHS | |
| Razer Blade 16 Early 2023 | |
| Average AMD Ryzen 9 7945HX (0.3884 - 0.4159, n=8) | |
| MSI Titan GT77 HX 13VI | |
| MSI Titan GT77 HX 13VI | |
| Asus Zephyrus Duo 16 GX650PY-NM006W | |
| Lenovo Legion Pro 7 16IRX8H | |
| Schenker XMG Neo 16 Raptor Lake | |
* ... smaller is better
系统性能
除了前面提到的蓝屏,我们在评测期间还注意到一些软件错误。蓝牙连接有问题(我们偶尔要打开蓝牙菜单才能让鼠标工作),YouTube有时不能播放任何视频,这可以通过重启解决。我们目前不确定这些是华硕造成的软件问题还是新AMD平台的初始问题。
如果一切都按设计工作(大部分时间都是这样),性能真的很好。没有停顿,所有的输入都是无延迟地执行。合成基准测试的结果也很好,AMD系统可以击败大多数英特尔的竞争对手。
CrossMark: Overall | Productivity | Creativity | Responsiveness
| PCMark 10 / Score | |
| Asus Zephyrus Duo 16 GX650PY-NM006W | |
| Average AMD Ryzen 9 7945HX, NVIDIA GeForce RTX 4090 Laptop GPU (8733 - 9151, n=2) | |
| MSI Titan GT77 HX 13VI | |
| Average of class Gaming (5828 - 11574, n=95, last 2 years) | |
| Razer Blade 16 Early 2023 | |
| Lenovo Legion Pro 7 16IRX8H | |
| Asus ROG Zephyrus Duo 16 GX650RX | |
| PCMark 10 / Essentials | |
| Asus Zephyrus Duo 16 GX650PY-NM006W | |
| MSI Titan GT77 HX 13VI | |
| Lenovo Legion Pro 7 16IRX8H | |
| Average AMD Ryzen 9 7945HX, NVIDIA GeForce RTX 4090 Laptop GPU (11165 - 12176, n=2) | |
| Razer Blade 16 Early 2023 | |
| Average of class Gaming (8810 - 12600, n=99, last 2 years) | |
| Asus ROG Zephyrus Duo 16 GX650RX | |
| PCMark 10 / Productivity | |
| Asus Zephyrus Duo 16 GX650PY-NM006W | |
| Average AMD Ryzen 9 7945HX, NVIDIA GeForce RTX 4090 Laptop GPU (10266 - 11833, n=2) | |
| Lenovo Legion Pro 7 16IRX8H | |
| Average of class Gaming (6845 - 18766, n=97, last 2 years) | |
| MSI Titan GT77 HX 13VI | |
| Razer Blade 16 Early 2023 | |
| Asus ROG Zephyrus Duo 16 GX650RX | |
| PCMark 10 / Digital Content Creation | |
| MSI Titan GT77 HX 13VI | |
| Average AMD Ryzen 9 7945HX, NVIDIA GeForce RTX 4090 Laptop GPU (14432 - 15768, n=2) | |
| Razer Blade 16 Early 2023 | |
| Asus Zephyrus Duo 16 GX650PY-NM006W | |
| Average of class Gaming (7602 - 19657, n=97, last 2 years) | |
| Lenovo Legion Pro 7 16IRX8H | |
| Asus ROG Zephyrus Duo 16 GX650RX | |
| CrossMark / Overall | |
| MSI Titan GT77 HX 13VI | |
| Asus Zephyrus Duo 16 GX650PY-NM006W | |
| Average AMD Ryzen 9 7945HX, NVIDIA GeForce RTX 4090 Laptop GPU (1993 - 2078, n=2) | |
| Schenker XMG Neo 16 Raptor Lake | |
| Average of class Gaming (1366 - 2409, n=97, last 2 years) | |
| Apple MacBook Pro 16 2023 M2 Max | |
| Asus ROG Zephyrus Duo 16 GX650RX | |
| Razer Blade 16 Early 2023 | |
| CrossMark / Productivity | |
| MSI Titan GT77 HX 13VI | |
| Asus Zephyrus Duo 16 GX650PY-NM006W | |
| Average AMD Ryzen 9 7945HX, NVIDIA GeForce RTX 4090 Laptop GPU (1838 - 1946, n=2) | |
| Average of class Gaming (1386 - 2254, n=97, last 2 years) | |
| Schenker XMG Neo 16 Raptor Lake | |
| Asus ROG Zephyrus Duo 16 GX650RX | |
| Apple MacBook Pro 16 2023 M2 Max | |
| Razer Blade 16 Early 2023 | |
| CrossMark / Creativity | |
| Apple MacBook Pro 16 2023 M2 Max | |
| MSI Titan GT77 HX 13VI | |
| Schenker XMG Neo 16 Raptor Lake | |
| Asus Zephyrus Duo 16 GX650PY-NM006W | |
| Average AMD Ryzen 9 7945HX, NVIDIA GeForce RTX 4090 Laptop GPU (2334 - 2377, n=2) | |
| Average of class Gaming (1343 - 2729, n=97, last 2 years) | |
| Razer Blade 16 Early 2023 | |
| Asus ROG Zephyrus Duo 16 GX650RX | |
| CrossMark / Responsiveness | |
| MSI Titan GT77 HX 13VI | |
| Asus ROG Zephyrus Duo 16 GX650RX | |
| Average of class Gaming (1226 - 2334, n=97, last 2 years) | |
| Asus Zephyrus Duo 16 GX650PY-NM006W | |
| Average AMD Ryzen 9 7945HX, NVIDIA GeForce RTX 4090 Laptop GPU (1584 - 1689, n=2) | |
| Schenker XMG Neo 16 Raptor Lake | |
| Apple MacBook Pro 16 2023 M2 Max | |
| Razer Blade 16 Early 2023 | |
| PCMark 10 Score | 9151 points | |
Help | ||
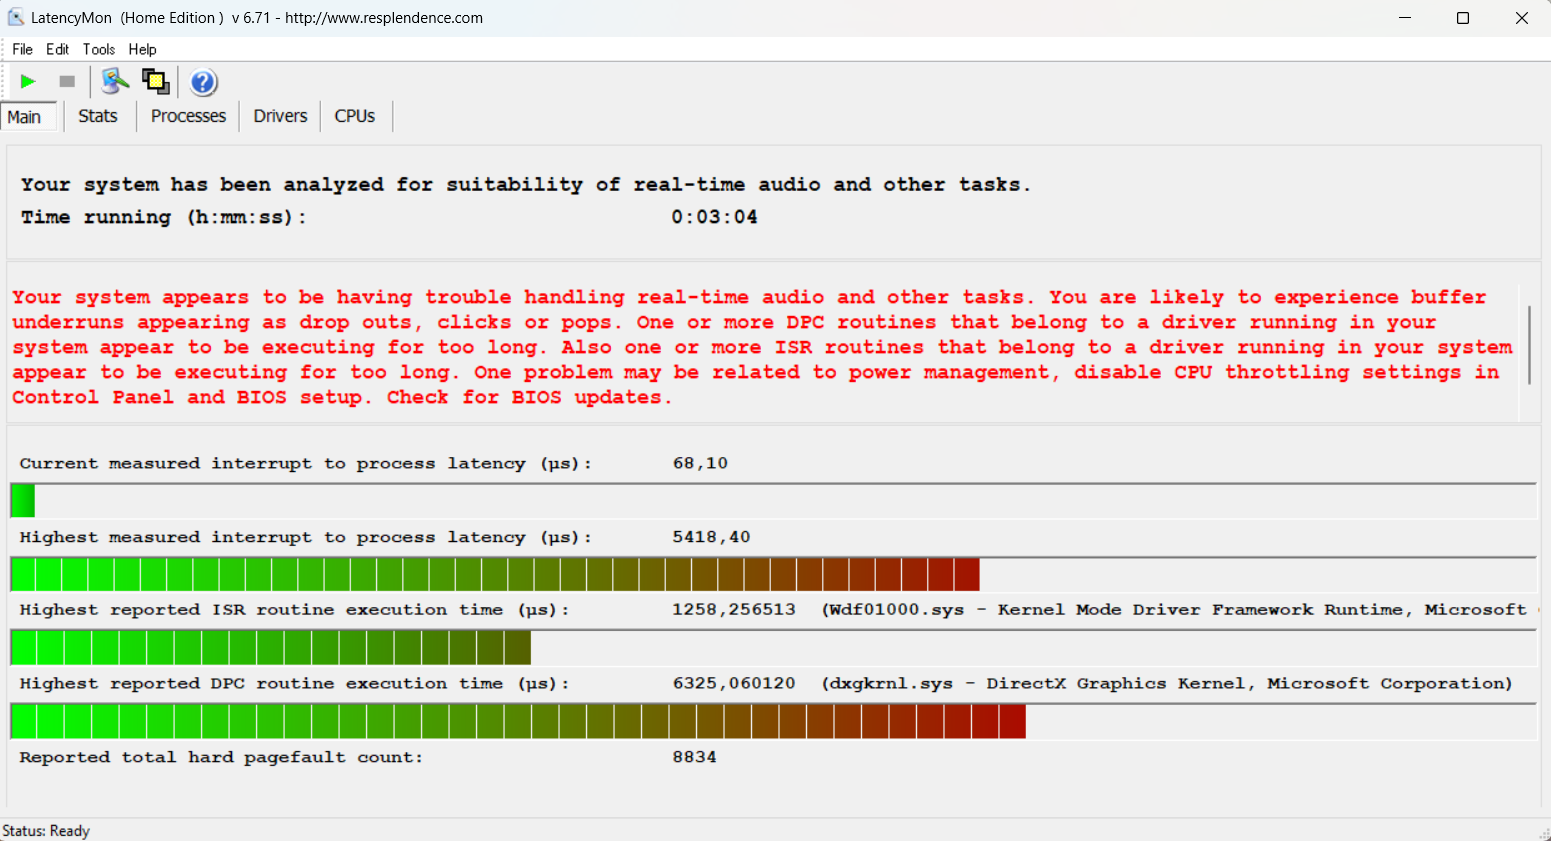
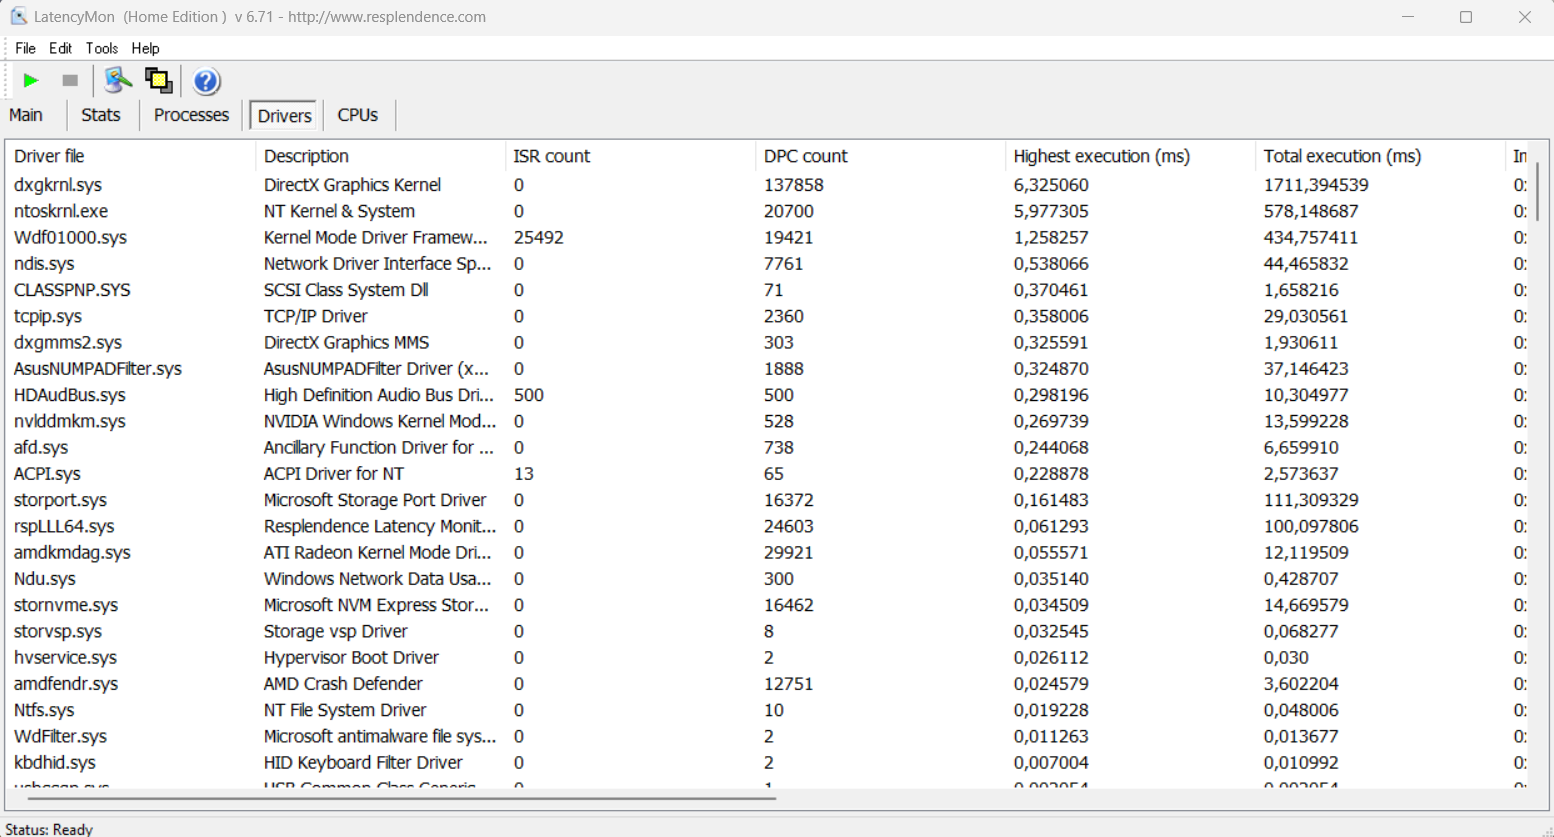
DPC延时
我们的标准化延迟测试(网页浏览、YouTube 4K播放、CPU负载)显示了当前BIOS版本的测试单元的显著局限性,因此它不适合实时音频应用。
| DPC Latencies / LatencyMon - interrupt to process latency (max), Web, Youtube, Prime95 | |
| Asus Zephyrus Duo 16 GX650PY-NM006W | |
| MSI Titan GT77 HX 13VI | |
| Razer Blade 16 Early 2023 | |
| Asus ROG Zephyrus Duo 16 GX650RX | |
| Lenovo Legion Pro 7 16IRX8H | |
* ... smaller is better
存储设备
我们的评测单元配备了SK海力士的快速2TB固态硬盘(PC801),它通过PCIe 4.0连接。NVMe驱动器的性能非常好,我们的传输速率超过了7GB/s。在持续的工作负荷下,性能也很稳定,这是目前许多高端笔记本电脑的一个问题。更多的SSD基准测试被列在 这里.

* ... smaller is better
Disk Throttling: DiskSpd Read Loop, Queue Depth 8
GPU性能
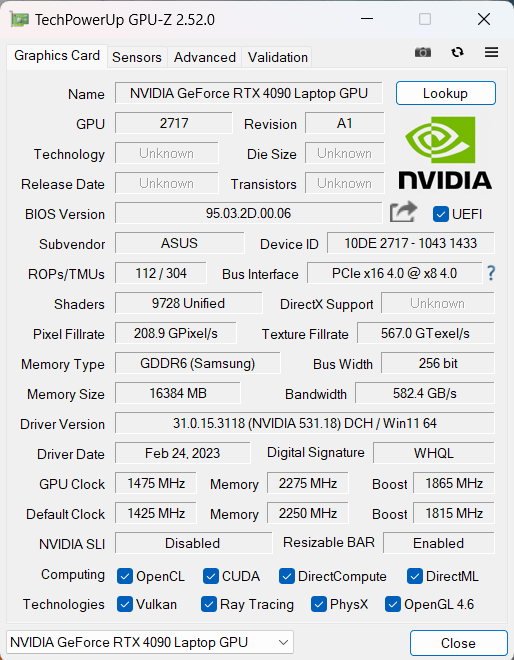
华硕提供新的ROG Zephyrus Duo 16与NvidiaGeForce RTX 4080 Laptop或GeForce RTX 4090 Laptop,就像我们现在的审查单位。从理论上讲,这是最快的GPU版本,但175瓦的最大TGP(150瓦TGP+25瓦Dynamic Boost)是保留给手动电源配置文件的。用于所有基准测试的Turbo配置文件被限制在155瓦(140瓦TGP + 15瓦动态提升)。
这意味着RTX 4090笔记本电脑在Turbo模式下,Zephyrus Duo 16不能完全跟上最快的对手,如Titan GT77,通常只比GeForce RTX 4080 Laptop快几个百分点。而RTX 3080 Ti在 之前的Zephyrus Duo 16在所有测试中明显被击败(快55-78 %)。计算性能也非常好,在一些SPECviewperf测试中,RTX 4090 Laptop也能与专业移动GPU相媲美。请参阅我们的 全面分析RTX 4090笔记本电脑和RTX 4080笔记本电脑的更多测试结果。
在持续工作负荷下,GPU性能稳定,Time Spy 压力测试以97.8%的比例通过。然而,在电池供电的情况下,GPU的功耗被限制在55W,这导致了超过50%的性能赤字(Time Spy Graphics: 9575分)。
| 3DMark 11 Performance | 46207 points | |
| 3DMark Fire Strike Score | 40149 points | |
| 3DMark Time Spy Score | 18602 points | |
Help | ||
| Blender / v3.3 Classroom OPTIX/RTX | |
| MSI Titan GT77 12UHS | |
| Average of class Gaming (9 - 32, n=111, last 2 years) | |
| Razer Blade 16 Early 2023 | |
| Lenovo Legion Pro 7 16IRX8H | |
| Asus Zephyrus Duo 16 GX650PY-NM006W | |
| Average NVIDIA GeForce RTX 4090 Laptop GPU (9 - 19, n=39) | |
| MSI Titan GT77 HX 13VI | |
| Schenker XMG Neo 16 Raptor Lake | |
| Blender / v3.3 Classroom CUDA | |
| Average of class Gaming (15 - 228, n=111, last 2 years) | |
| MSI Titan GT77 12UHS | |
| Lenovo Legion Pro 7 16IRX8H | |
| Razer Blade 16 Early 2023 | |
| Asus Zephyrus Duo 16 GX650PY-NM006W | |
| Average NVIDIA GeForce RTX 4090 Laptop GPU (16 - 24, n=39) | |
| Schenker XMG Neo 16 Raptor Lake | |
| MSI Titan GT77 HX 13VI | |
| Blender / v3.3 Classroom CPU | |
| Apple MacBook Pro 16 2023 M2 Max | |
| MSI Titan GT77 12UHS | |
| Average of class Gaming (122 - 565, n=107, last 2 years) | |
| Razer Blade 16 Early 2023 | |
| Schenker XMG Neo 16 Raptor Lake | |
| Average NVIDIA GeForce RTX 4090 Laptop GPU (144 - 305, n=39) | |
| Lenovo Legion Pro 7 16IRX8H | |
| MSI Titan GT77 HX 13VI | |
| Asus Zephyrus Duo 16 GX650PY-NM006W | |
| Blender / v3.3 Classroom METAL | |
| Apple MacBook Pro 16 2023 M2 Max | |
* ... smaller is better
游戏性能
ROG Zephyrus Duo 16的游戏性能非常好,但由于RTX 4090 Laptop的版本稍慢,与最快的设备相比有点低。AMD处理器在游戏过程中留下了良好的印象,不必躲在英特尔HX对应产品的后面。在我们的游戏基准测试中,我们也没有发现任何问题。然而,考虑到原生的WQHD分辨率,我们建议你把钱留给RTX 4090 笔记本电脑SKU,并获得RTX 4080笔记本电脑来代替。
| The Witcher 3 - 1920x1080 Ultra Graphics & Postprocessing (HBAO+) | |
| Schenker XMG Neo 16 Raptor Lake | |
| MSI Titan GT77 HX 13VI | |
| Asus Zephyrus Duo 16 GX650PY-NM006W | |
| Lenovo Legion Pro 7 16IRX8H | |
| Razer Blade 16 Early 2023 | |
| Average of class Gaming (95 - 240, n=8, last 2 years) | |
| MSI Titan GT77 12UHS | |
| Asus ROG Zephyrus Duo 16 GX650RX | |
| The Witcher 3 v4 - 1920x1080 Ultra Preset / On AA:FX | |
| MSI Titan GT77 HX 13VI | |
| Average NVIDIA GeForce RTX 4090 Laptop GPU (120.4 - 217, n=7) | |
| Schenker XMG Neo 16 Raptor Lake | |
| Asus Zephyrus Duo 16 GX650PY-NM006W | |
| Lenovo Legion Pro 7 16IRX8H | |
| Shadow of the Tomb Raider - 1920x1080 Highest Preset AA:T | |
| MSI Titan GT77 HX 13VI | |
| Asus Zephyrus Duo 16 GX650PY-NM006W | |
| Schenker XMG Neo 16 Raptor Lake | |
| Average NVIDIA GeForce RTX 4090 Laptop GPU (143.7 - 271, n=14) | |
| Razer Blade 16 Early 2023 | |
| Average of class Gaming (96 - 116, n=2, last 2 years) | |
Witcher 3 FPS Chart
| low | med. | high | ultra | QHD | |
|---|---|---|---|---|---|
| GTA V (2015) | 186.7 | 182.4 | 134 | 123.8 | |
| The Witcher 3 (2015) | 361 | 178.6 | |||
| Dota 2 Reborn (2015) | 227 | 207 | 196.1 | 179.7 | |
| Final Fantasy XV Benchmark (2018) | 210 | 169.6 | 142.1 | ||
| X-Plane 11.11 (2018) | 177.5 | 155.7 | 117.8 | ||
| Strange Brigade (2018) | 518 | 400 | 370 | 333 | 257 |
| Shadow of the Tomb Raider (2018) | 208 | 175 | |||
| Assassin´s Creed Valhalla (2020) | 161 | 126 | |||
| F1 2021 (2021) | 476 | 391 | 312 | 182.4 | 159.7 |
| Far Cry 6 (2021) | 117 | 110 | |||
| Cyberpunk 2077 1.6 (2022) | 136 | 130.6 | 86 | ||
| Tiny Tina's Wonderlands (2022) | 171.5 | 120 | |||
| F1 22 (2022) | 303 | 286 | 265 | 114.3 | 80.3 |
| Call of Duty Modern Warfare 2 2022 (2022) | 170 | 125 | |||
| The Witcher 3 v4 (2023) | 174 | 158 | 133.9 | 88 |
排放--Duo 16在涡轮模式下声音很大
系统噪音
Zephyrus Duo在日常情况下通常是可以听到的,当您不需要全部性能时,您应该使用静音功率配置文件。涡轮增压模式通常会导致超过30 dB(A),即使是在空转时。游戏和高负荷情况下,很快就会超过50分贝(A),最高可达56分贝(A),这在较长时间内会很烦人。你还可以注意到冷却解决方案中相对较小的风扇。当你需要最大性能时,没有办法绕过噪音,但我们建议你在玩游戏时检查Armoury Crate软件的其他电源配置文件。我们用三种不同的游戏对其进行了测试。
| 标题 | 静音 | 性能 | 涡轮增压 |
|---|---|---|---|
| Witcher 3 | 40.2 dB(A) | 48.6 dB(A) | 51.2 dB(A) |
| Witcher 3 v4.00 | 40.2 dB(A) | 48.6 dB(A) | 56 dB(A) |
| Cyberpunkt 2077 v1.5 | 40.2 dB(A) | 48.6 dB(A) | 56 dB(A) |
现代游戏通常会在性能模式下运行良好,与涡轮模式相比,帧数只是低了一点,但风扇的噪音更方便,约为49 dB(A)。静音模式主要适用于较老的作品,因为性能会明显下降。我们还注意到在一些基准测试/游戏中的一些电子声音。
Noise level
| Idle |
| 23.9 / 32.9 / 36.5 dB(A) |
| Load |
| 42.9 / 56 dB(A) |
 | ||
30 dB silent 40 dB(A) audible 50 dB(A) loud |
||
min: | ||
| Asus Zephyrus Duo 16 GX650PY-NM006W GeForce RTX 4090 Laptop GPU, R9 7945HX, SK hynix PC801 HFS002TEJ9X101N | MSI Titan GT77 HX 13VI GeForce RTX 4090 Laptop GPU, i9-13950HX, Samsung PM9A1 MZVL22T0HBLB | Lenovo Legion Pro 7 16IRX8H GeForce RTX 4080 Laptop GPU, i9-13900HX, Samsung PM9A1 MZVL21T0HCLR | Razer Blade 16 Early 2023 GeForce RTX 4080 Laptop GPU, i9-13950HX, SSSTC CA6-8D1024 | Asus ROG Zephyrus Duo 16 GX650RX GeForce RTX 3080 Ti Laptop GPU, R9 6900HX, 2x Samsung SSD 980 Pro 2TB MZ-V8P2T0 (RAID 0) | Apple MacBook Pro 16 2023 M2 Max M2 Max 38-Core GPU, M2 Max, Apple SSD AP2048Z | |
|---|---|---|---|---|---|---|
| Noise | -4% | -1% | 13% | 6% | 19% | |
| off / environment * (dB) | 23.9 | 24.6 -3% | 24 -0% | 23 4% | 26 -9% | 23.9 -0% |
| Idle Minimum * (dB) | 23.9 | 29.2 -22% | 26 -9% | 23 4% | 26 -9% | 23.9 -0% |
| Idle Average * (dB) | 32.9 | 29.2 11% | 28 15% | 23 30% | 27 18% | 23.9 27% |
| Idle Maximum * (dB) | 36.5 | 29.2 20% | 34 7% | 23.6 35% | 29 21% | 23.9 35% |
| Load Average * (dB) | 42.9 | 50.7 -18% | 47 -10% | 39 9% | 41 4% | 36.6 15% |
| Witcher 3 ultra * (dB) | 51.2 | 53.3 -4% | 55 -7% | 51.6 -1% | 48 6% | 35.1 31% |
| Load Maximum * (dB) | 56 | 61 -9% | 56 -0% | 51.3 8% | 50 11% | 43.2 23% |
* ... smaller is better
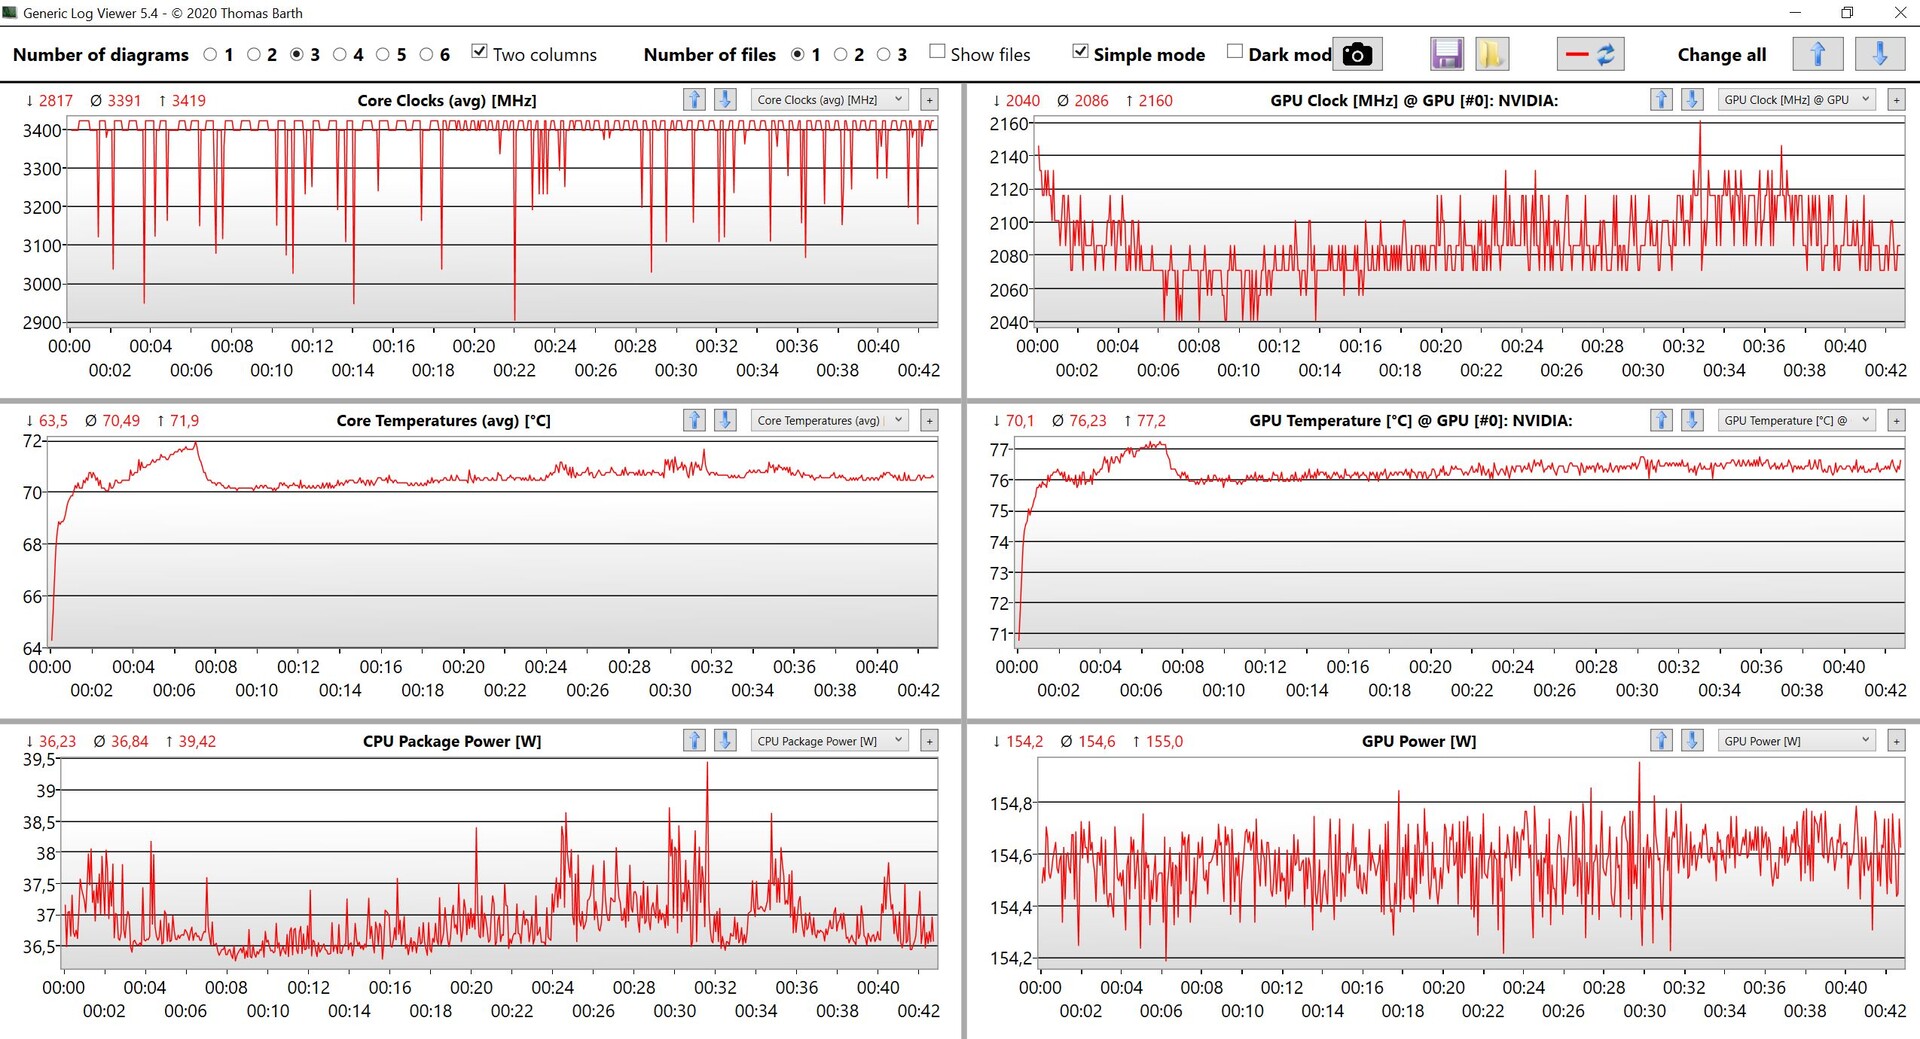
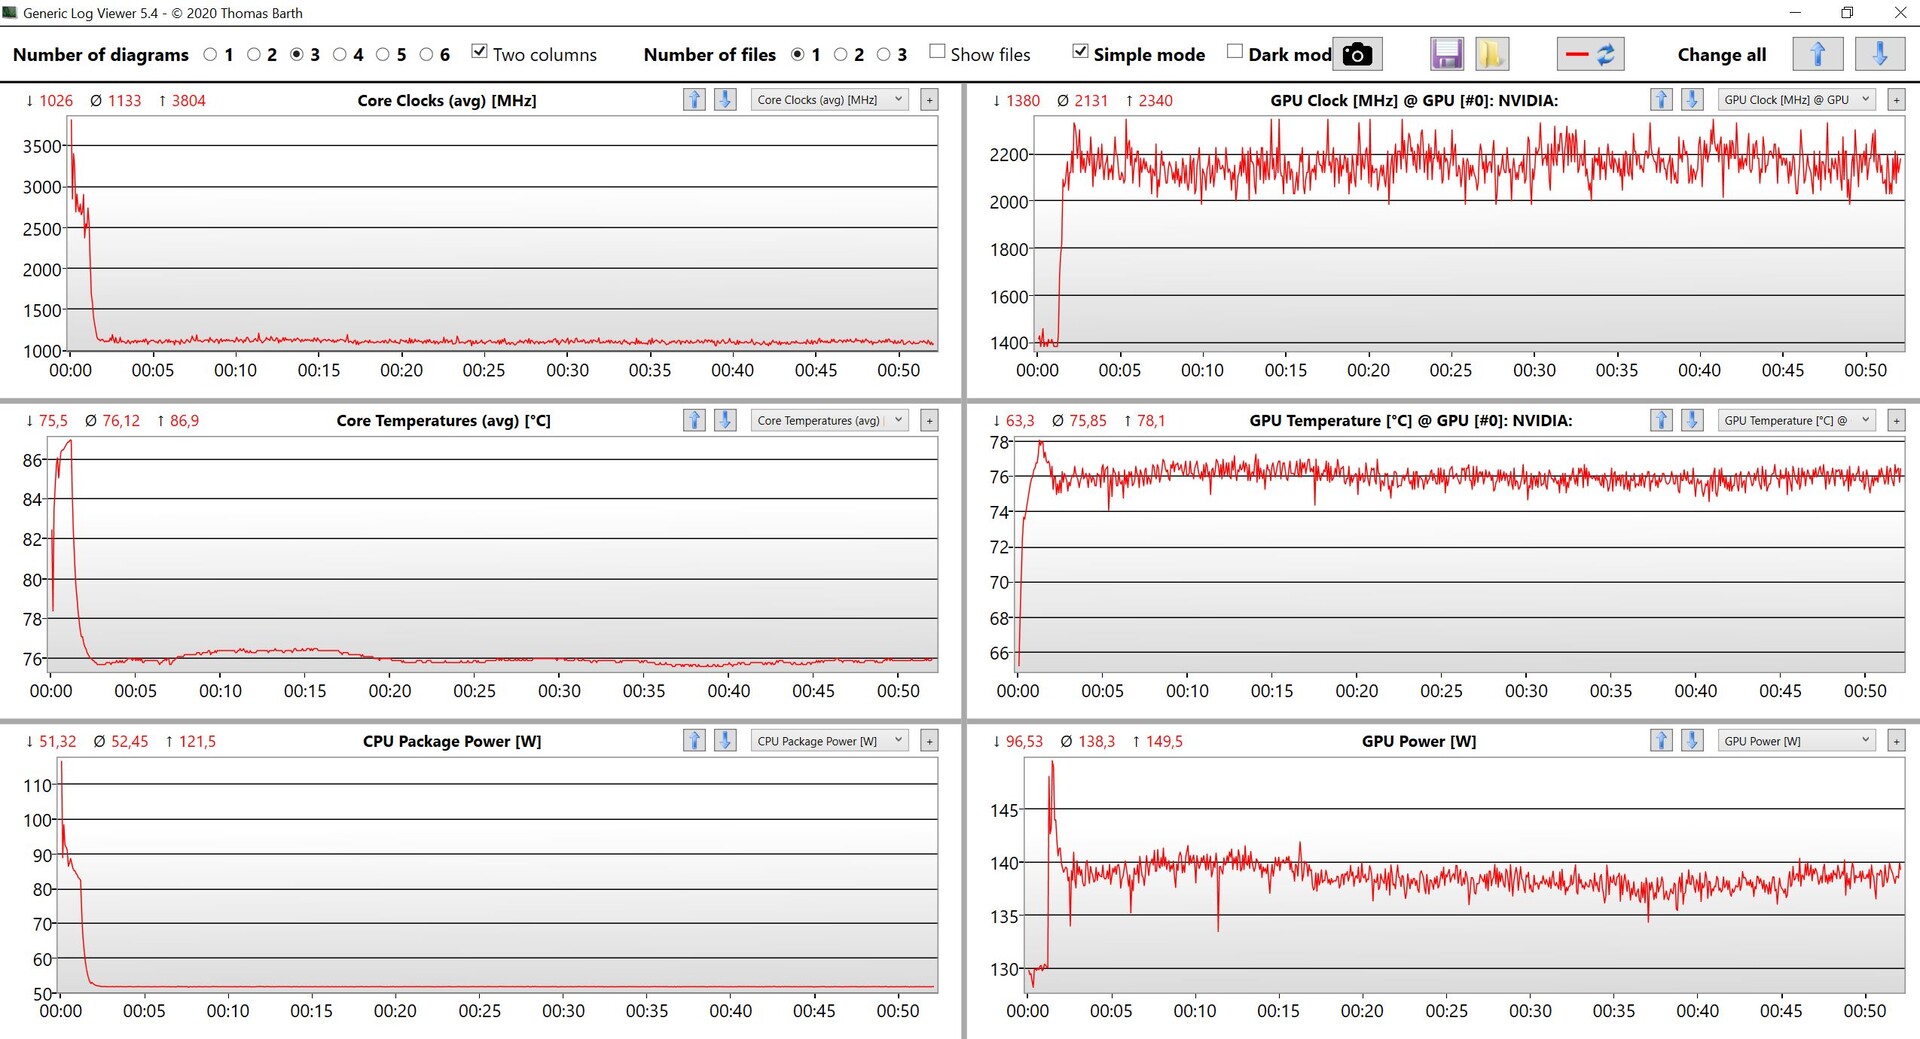
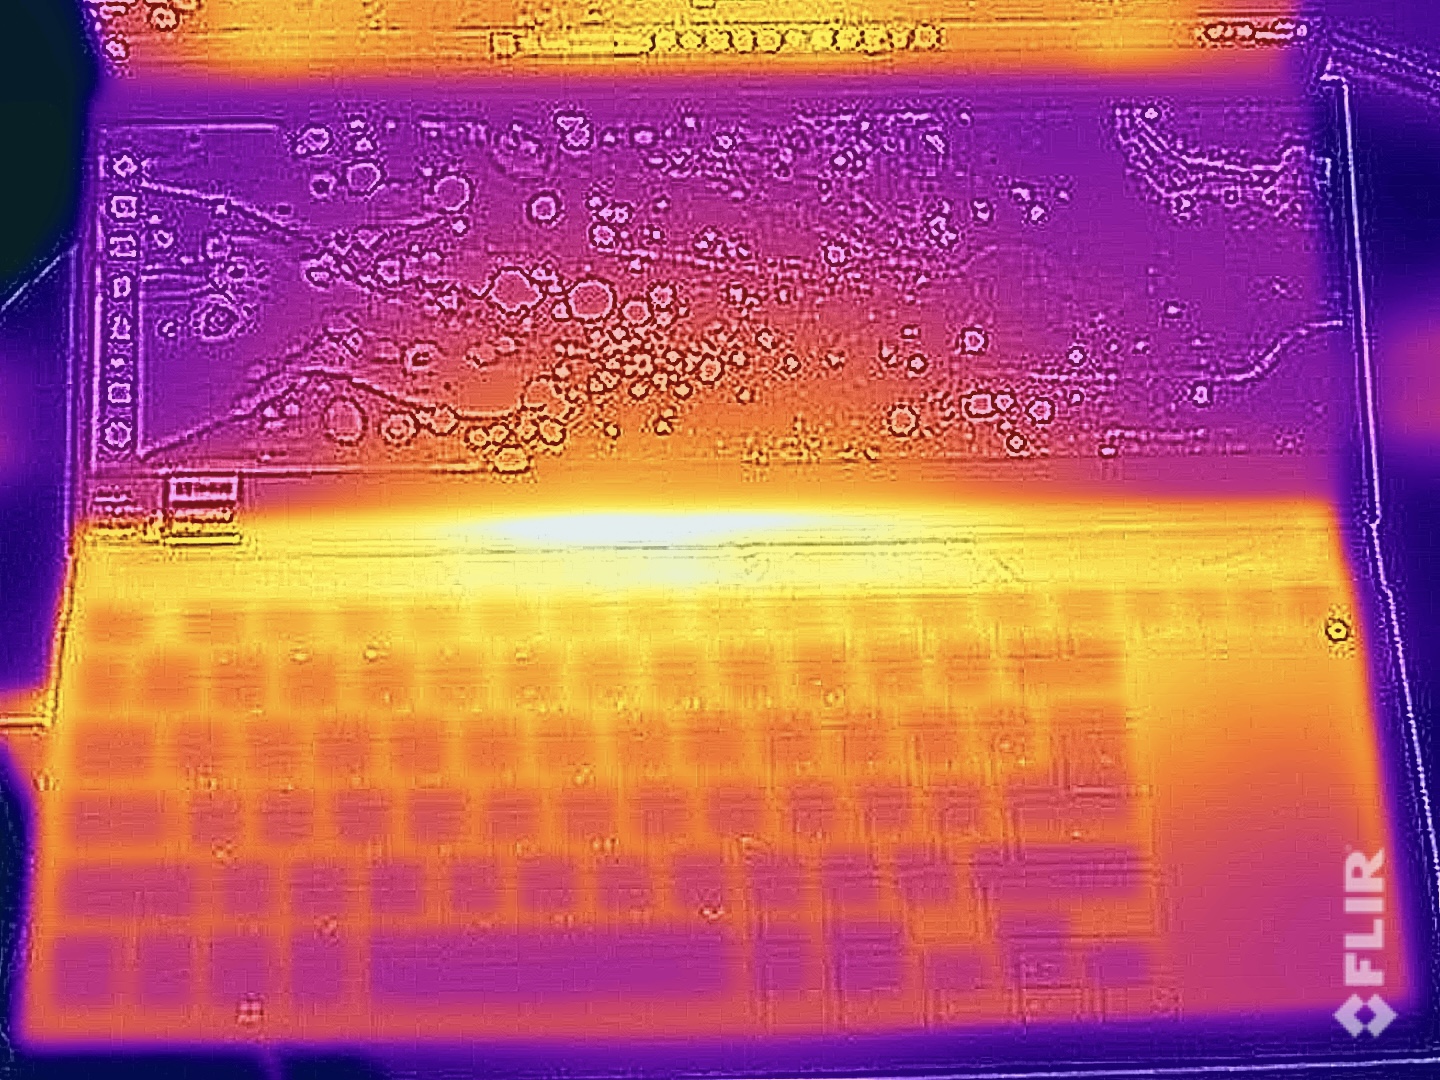
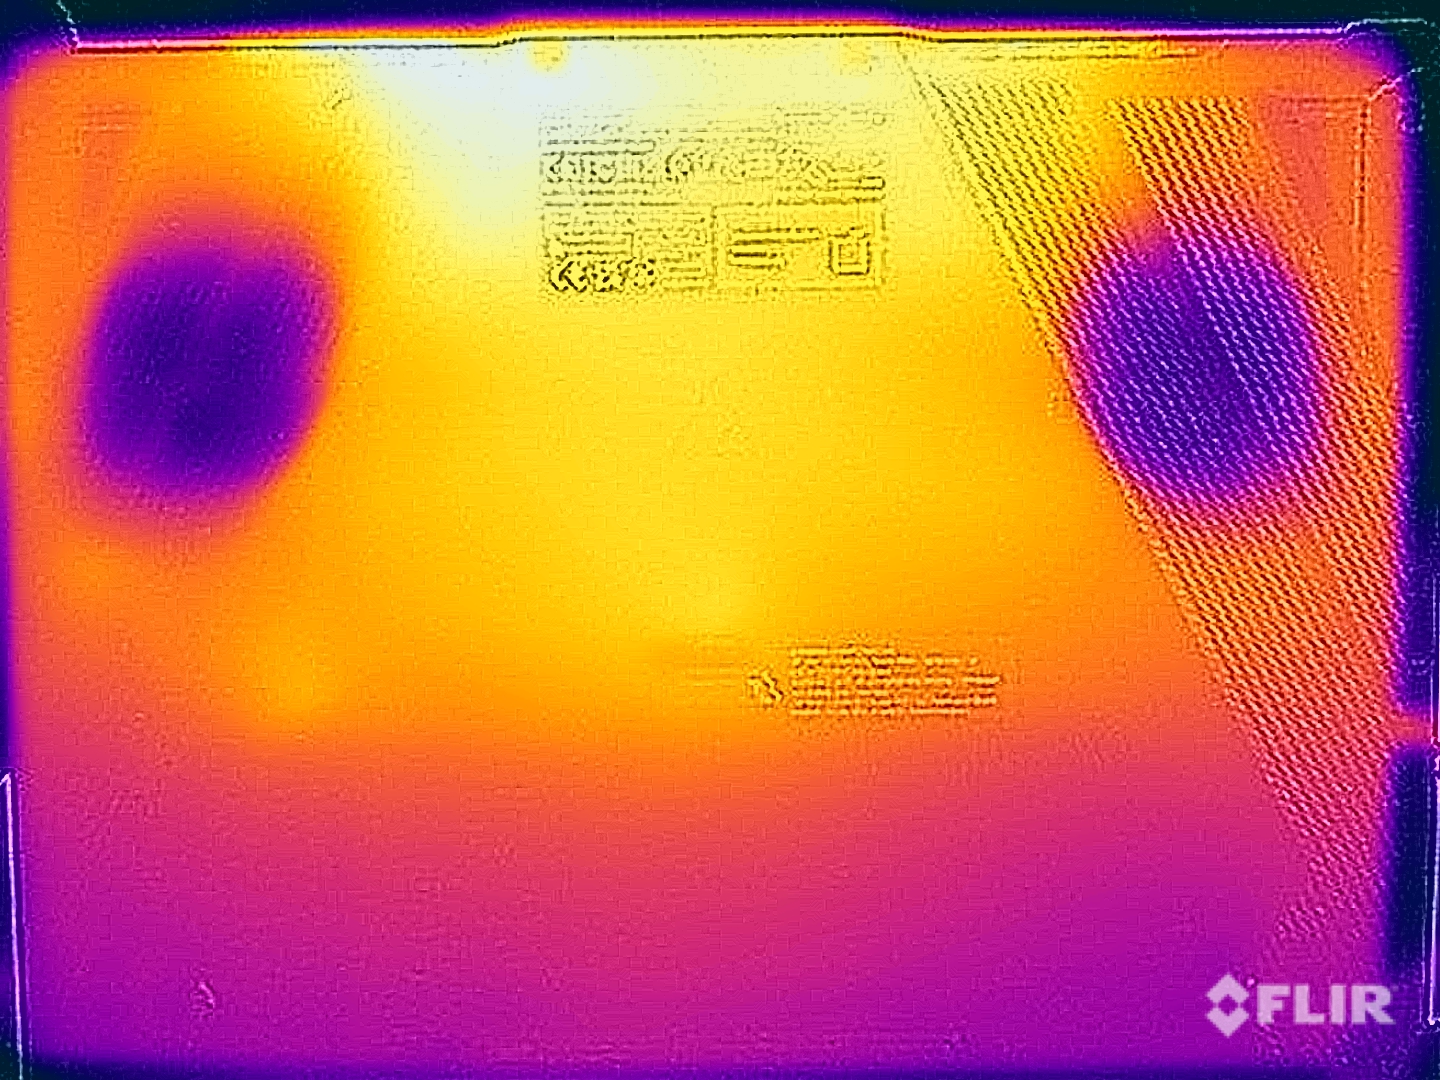
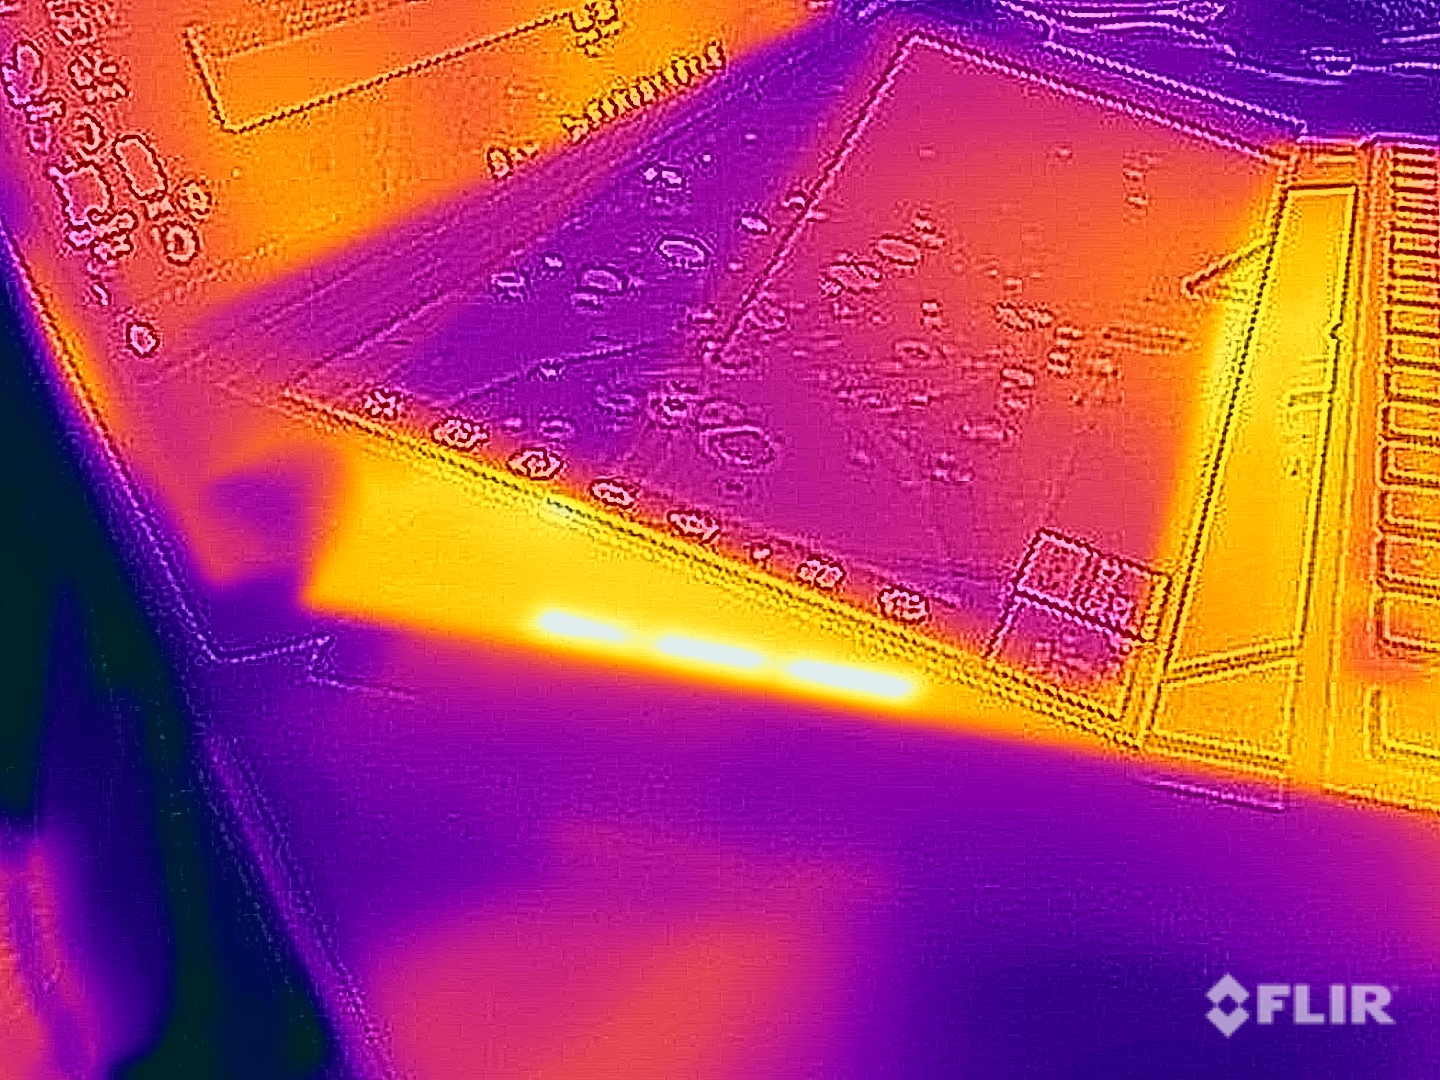
温度
在轻度工作负荷下,机箱温度非常舒适。键盘的位置对游戏/负载下的游戏是有利的,因为它只在上部区域升温,经常使用的按键通常保持非常凉爽。然而,键盘和副键盘之间的区域是一个热点。我们在底部测量到高达47℃,所以你不应该把设备放在负载下的腿上。整体温度发展还可以。
我们的压力测试有利于专用显卡,处理器将在几分钟后达到50瓦特的水平,而GPU的消耗从130瓦特上升到~140瓦特(这是Turbo电源配置文件的指定值)并保持在这个水平。这是一个不错的结果,我们没有看到压力测试后立即出现性能下降。在电池供电的情况下,CPU/GPU的综合工作负荷导致CPU消耗约43瓦特,GPU消耗约33瓦特。
(±) The maximum temperature on the upper side is 44.2 °C / 112 F, compared to the average of 40.4 °C / 105 F, ranging from 21.2 to 68.8 °C for the class Gaming.
(-) The bottom heats up to a maximum of 46.8 °C / 116 F, compared to the average of 43.2 °C / 110 F
(+) In idle usage, the average temperature for the upper side is 26.2 °C / 79 F, compared to the device average of 33.9 °C / 93 F.
(±) Playing The Witcher 3, the average temperature for the upper side is 36.5 °C / 98 F, compared to the device average of 33.9 °C / 93 F.
(+) The palmrests and touchpad are reaching skin temperature as a maximum (35.7 °C / 96.3 F) and are therefore not hot.
(-) The average temperature of the palmrest area of similar devices was 28.8 °C / 83.8 F (-6.9 °C / -12.5 F).
| Asus Zephyrus Duo 16 GX650PY-NM006W AMD Ryzen 9 7945HX, NVIDIA GeForce RTX 4090 Laptop GPU | MSI Titan GT77 HX 13VI Intel Core i9-13950HX, NVIDIA GeForce RTX 4090 Laptop GPU | Lenovo Legion Pro 7 16IRX8H Intel Core i9-13900HX, NVIDIA GeForce RTX 4080 Laptop GPU | Razer Blade 16 Early 2023 Intel Core i9-13950HX, NVIDIA GeForce RTX 4080 Laptop GPU | Asus ROG Zephyrus Duo 16 GX650RX AMD Ryzen 9 6900HX, NVIDIA GeForce RTX 3080 Ti Laptop GPU | Apple MacBook Pro 16 2023 M2 Max Apple M2 Max, Apple M2 Max 38-Core GPU | |
|---|---|---|---|---|---|---|
| Heat | 8% | -15% | 4% | -8% | 14% | |
| Maximum Upper Side * (°C) | 44.2 | 40.6 8% | 48 -9% | 40 10% | 45 -2% | 44.2 -0% |
| Maximum Bottom * (°C) | 46.8 | 41.1 12% | 49 -5% | 37.6 20% | 50 -7% | 42.9 8% |
| Idle Upper Side * (°C) | 29.2 | 26.2 10% | 40 -37% | 32.4 -11% | 33 -13% | 22.4 23% |
| Idle Bottom * (°C) | 30.2 | 30.3 -0% | 33 -9% | 31.4 -4% | 33 -9% | 22.3 26% |
* ... smaller is better
发言人
华硕采用了由6个模块组成的扬声器系统,整体效果非常好。与以前的型号相比,制造商还改进了声音性能,只是低音性能可以更好。这个结果对于偶尔的视频/电影播放来说绝对是足够的,但在游戏时,扬声器的声音通常会被风扇的噪音所匹敌。
Asus Zephyrus Duo 16 GX650PY-NM006W audio analysis
(+) | speakers can play relatively loud (82.5 dB)
Bass 100 - 315 Hz
(±) | reduced bass - on average 9.5% lower than median
(±) | linearity of bass is average (10.6% delta to prev. frequency)
Mids 400 - 2000 Hz
(±) | higher mids - on average 5.4% higher than median
(+) | mids are linear (3.3% delta to prev. frequency)
Highs 2 - 16 kHz
(+) | balanced highs - only 2.7% away from median
(+) | highs are linear (2.3% delta to prev. frequency)
Overall 100 - 16.000 Hz
(+) | overall sound is linear (12% difference to median)
Compared to same class
» 12% of all tested devices in this class were better, 4% similar, 84% worse
» The best had a delta of 6%, average was 18%, worst was 132%
Compared to all devices tested
» 9% of all tested devices were better, 2% similar, 88% worse
» The best had a delta of 4%, average was 24%, worst was 134%
Apple MacBook Pro 16 2023 M2 Max audio analysis
(+) | speakers can play relatively loud (86.1 dB)
Bass 100 - 315 Hz
(+) | good bass - only 3.9% away from median
(+) | bass is linear (5.7% delta to prev. frequency)
Mids 400 - 2000 Hz
(+) | balanced mids - only 1.2% away from median
(+) | mids are linear (1.5% delta to prev. frequency)
Highs 2 - 16 kHz
(+) | balanced highs - only 2.5% away from median
(+) | highs are linear (1.7% delta to prev. frequency)
Overall 100 - 16.000 Hz
(+) | overall sound is linear (4.9% difference to median)
Compared to same class
» 0% of all tested devices in this class were better, 0% similar, 99% worse
» The best had a delta of 5%, average was 17%, worst was 45%
Compared to all devices tested
» 0% of all tested devices were better, 0% similar, 100% worse
» The best had a delta of 4%, average was 24%, worst was 134%
能量管理--体力有限的Zephyrus
消耗功率
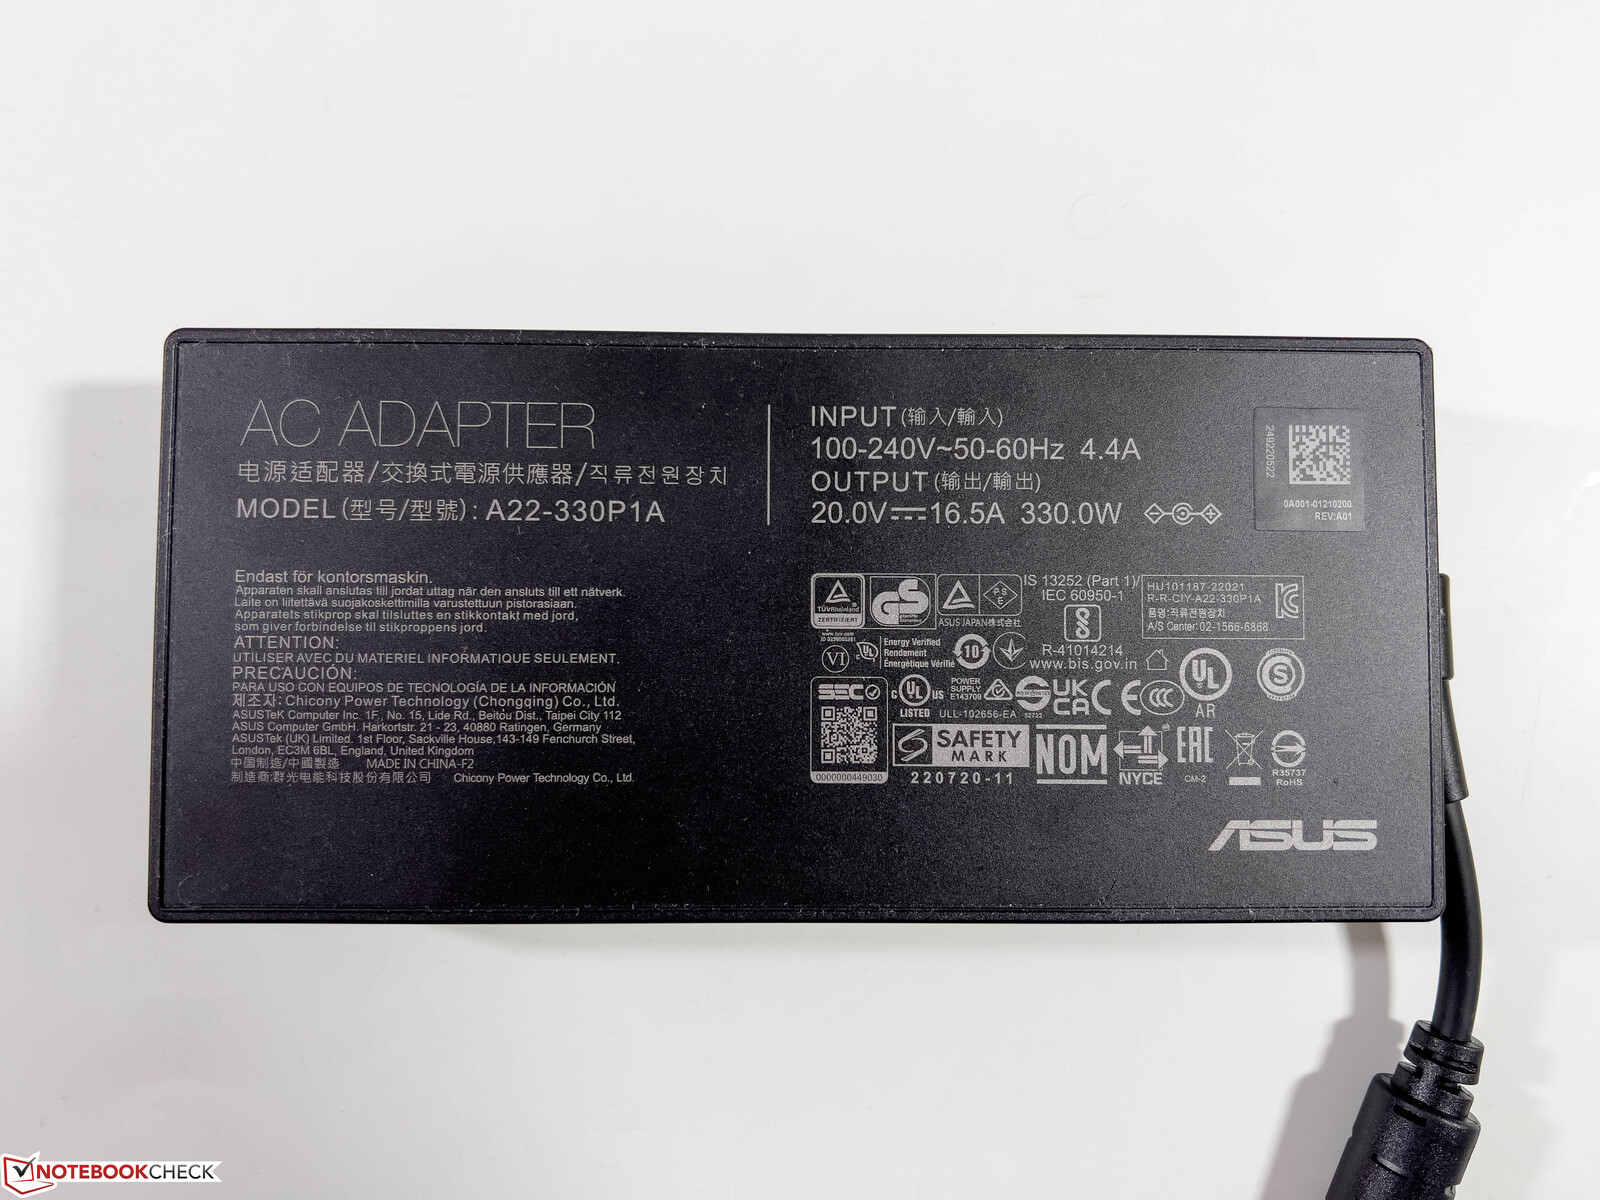
ROG Zephyrus Duo 16不是一个特别高效的设备,其最低功耗为19瓦,最大亮度时超过30瓦(副屏关闭)。副屏将增加4-7瓦的功耗,这取决于亮度。我们在游戏时测量到约260瓦特,在压力测试中高达330瓦特,但该值很快就在约270瓦特处趋于平稳。这意味着330瓦的PSU是完全足够的。
我们再次要提到,当你使用外部屏幕时,专用的GeForce GPU正在处理所有的图形任务,这意味着下面的CPU测量与外部屏幕不提供可比的结果。
| Off / Standby | |
| Idle | |
| Load |
|
Key:
min: | |
| Asus Zephyrus Duo 16 GX650PY-NM006W R9 7945HX, GeForce RTX 4090 Laptop GPU, SK hynix PC801 HFS002TEJ9X101N, MiniLED, 2560x1600, 16" | MSI Titan GT77 HX 13VI i9-13950HX, GeForce RTX 4090 Laptop GPU, Samsung PM9A1 MZVL22T0HBLB, Mini-LED, 3840x2160, 17.3" | Lenovo Legion Pro 7 16IRX8H i9-13900HX, GeForce RTX 4080 Laptop GPU, Samsung PM9A1 MZVL21T0HCLR, IPS, 2560x1600, 16" | Razer Blade 16 Early 2023 i9-13950HX, GeForce RTX 4080 Laptop GPU, SSSTC CA6-8D1024, IPS, 2560x1600, 16" | Asus ROG Zephyrus Duo 16 GX650RX R9 6900HX, GeForce RTX 3080 Ti Laptop GPU, 2x Samsung SSD 980 Pro 2TB MZ-V8P2T0 (RAID 0), IPS-Level, 3840x2400, 16" | Apple MacBook Pro 16 2023 M2 Max M2 Max, M2 Max 38-Core GPU, Apple SSD AP2048Z, Mini-LED, 3456x2234, 16.2" | Average NVIDIA GeForce RTX 4090 Laptop GPU | Average of class Gaming | |
|---|---|---|---|---|---|---|---|---|
| Power Consumption | 8% | 3% | 2% | 14% | 49% | 5% | 25% | |
| Idle Minimum * (Watt) | 19.2 | 14 27% | 18 6% | 15.2 21% | 19 1% | 5.2 73% | 16.2 ? 16% | 13.2 ? 31% |
| Idle Average * (Watt) | 29.7 | 21.6 27% | 24 19% | 22.8 23% | 24 19% | 16.5 44% | 23.1 ? 22% | 18.9 ? 36% |
| Idle Maximum * (Watt) | 30.8 | 24.8 19% | 32 -4% | 49.8 -62% | 31 -1% | 16.8 45% | 34.2 ? -11% | 24.3 ? 21% |
| Load Average * (Watt) | 126 | 122.5 3% | 130 -3% | 121.2 4% | 104 17% | 113 10% | 130.5 ? -4% | 108 ? 14% |
| Witcher 3 ultra * (Watt) | 258 | 265 -3% | 260 -1% | 242 6% | 186.5 28% | 92 64% | ||
| Load Maximum * (Watt) | 330 | 418 -27% | 320 3% | 273.7 17% | 256 22% | 145 56% | 324 ? 2% | 254 ? 23% |
* ... smaller is better
Power consumption Witcher 3 / Stress test
Power consumption external screen
电池运行时间
尽管使用同样的90Wh电池,但电池运行时间比前一型号要差得多。现在,我们不确定这是否只是由新的Mini-LED面板或新的AMD平台的问题造成的。即使在150尼特和没有副屏的情况下,我们也只能做到约4小时的视频播放和Wi-Fi运行时间,而在面板最大亮度下则下降到只有2.5小时。这些都是很差的结果,而且负载运行时间还不到一小时。笔记本电脑开机后,电池完全充电需要108分钟。
| Asus Zephyrus Duo 16 GX650PY-NM006W R9 7945HX, GeForce RTX 4090 Laptop GPU, 90 Wh | MSI Titan GT77 HX 13VI i9-13950HX, GeForce RTX 4090 Laptop GPU, 99.9 Wh | Lenovo Legion Pro 7 16IRX8H i9-13900HX, GeForce RTX 4080 Laptop GPU, 99.9 Wh | Razer Blade 16 Early 2023 i9-13950HX, GeForce RTX 4080 Laptop GPU, 95.2 Wh | Asus ROG Zephyrus Duo 16 GX650RX R9 6900HX, GeForce RTX 3080 Ti Laptop GPU, 90 Wh | Apple MacBook Pro 16 2023 M2 Max M2 Max, M2 Max 38-Core GPU, 99.6 Wh | Average of class Gaming | |
|---|---|---|---|---|---|---|---|
| Battery runtime | 44% | 69% | 47% | 80% | 224% | 80% | |
| H.264 (h) | 3.8 | 6 58% | 9.3 145% | 18.7 392% | 8.26 ? 117% | ||
| WiFi v1.3 (h) | 4 | 5.3 33% | 5.1 27% | 6.1 53% | 7.8 95% | 14.8 270% | 7.02 ? 76% |
| Load (h) | 1 | 1.4 40% | 2.1 110% | 1.4 40% | 1 0% | 1.1 10% | 1.47 ? 47% |
Pros
Cons
评语 - 有趣的概念,但有缺点
新的ROG Zephyrus Duo 16的副屏幕再次成为一个有趣的概念,但它也需要妥协。这款笔记本电脑明显比竞争对手厚,即使副屏的质量非常好,但它就是无法与新的240赫兹迷你LED屏幕的优秀图像质量相媲美。双屏处理在实践中也不一定理想,但这是Windows的一个普遍问题。副屏是通过iGPU连接的,这意味着当你使用外部屏幕(例如4K)时,Nvidia GPU负责所有图形计算,这将增加功耗。键盘在笔记本电脑前面的位置是另一个问题,在家里可以用附带的掌托解决,但在路上仍然是一个问题。副屏幕有什么意义吗?嗯,这取决于你的使用场景。
华硕在关键领域改进了笔记本电脑,首先是新的哑光240赫兹Mini-LED屏幕和WQHD分辨率。画面质量是惊人的,对于SDR内容来说,700尼特已经非常明亮(对于HDR内容来说,几乎是1400尼特)。开箱后的颜色已经非常准确,我们在校准屏幕方面没有问题。
新的GeForce RTX 4090 笔记本电脑是目前笔记本上最强大的GPU,与旧的RTX 3080 Ti相比,其性能优势非常大。然而,它只是手动模式下的最快版本(175W),但我们建议使用RTX 4080 LaptopSKU,尽管如此,考虑到原生的WQHD分辨率。
新的华硕ROG Zephyrus Duo 16凭借出色的Mini-LED屏幕以及由新的AMD Ryzen 9 7945HX和GeForce RTX 4090 Laptop组成的强大硬件组合令人信服,它在原生WQHD分辨率方面没有问题。不过仍有一些bug,而且当你利用全部性能潜力时,风扇非常嘈杂。
AMD的新Zen4处理器,即 Ryzen 9 7945HX可能是目前最有趣的升级。由于有16个Zen4核心,它从英特尔酷睿i9-13980HX手中抢走了多核性能的桂冠,甚至消耗更少的电力。由于之前提到的连接外部屏幕时专用Nvidia GPU的问题,我们目前无法提供准确的效率数字,但我们将在另一篇文章中介绍。
还有一些问题我们需要谈一谈,我们的测试装置有一些错误。闲置功耗也非常高,这显然也影响了电池的运行时间。这到底是华硕的软件问题还是新的AMD平台的初始问题,目前还不清楚。高价格是另一个问题,但现在所有RTX 4090笔记本都是这种情况。考虑到价格,我们也不得不批评缺乏USB 4以及使用DDR5-4800内存的问题。
总而言之,新的ROG Zephyrus Duo 16是具有充足动力的好设备,副屏对一些用户来说可能是一个真正的优势。然而,如果你不需要笔记本上的第二个显示屏(游戏玩家或内容创作者),你最好选择普通的笔记本电脑,这也意味着在某些方面的妥协更少。
价格和可用性
ROG Zephyrus Duo 16 2023现在只能预购,应该在未来几周内上市。
Asus Zephyrus Duo 16 GX650PY-NM006W
- 03/14/2023 v7 (old)
Andreas Osthoff
Transparency
The selection of devices to be reviewed is made by our editorial team. The test sample was provided to the author as a loan by the manufacturer or retailer for the purpose of this review. The lender had no influence on this review, nor did the manufacturer receive a copy of this review before publication. There was no obligation to publish this review. As an independent media company, Notebookcheck is not subjected to the authority of manufacturers, retailers or publishers.
This is how Notebookcheck is testing
Every year, Notebookcheck independently reviews hundreds of laptops and smartphones using standardized procedures to ensure that all results are comparable. We have continuously developed our test methods for around 20 years and set industry standards in the process. In our test labs, high-quality measuring equipment is utilized by experienced technicians and editors. These tests involve a multi-stage validation process. Our complex rating system is based on hundreds of well-founded measurements and benchmarks, which maintains objectivity. Further information on our test methods can be found here.
Price comparison

