Eurocom Raptor X17 酷睿 i9-14900HX 笔记本电脑评测:175 瓦 GPU 实现最高性能

Raptor X17 是 Eurocom 推出的速度最快的笔记本电脑之一。今年的机型采用了更新的 Raptor Lake-HX 选项,但 GPU 和机箱仍与过去相同。因此,我们建议您查看我们对 2023 猛禽 X17和 申克钥匙 17 Pro的评论,因为我们现有的评论仍然适用。
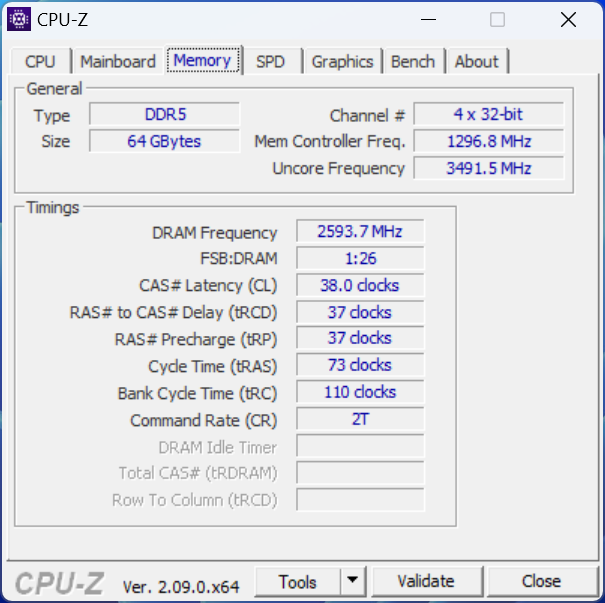
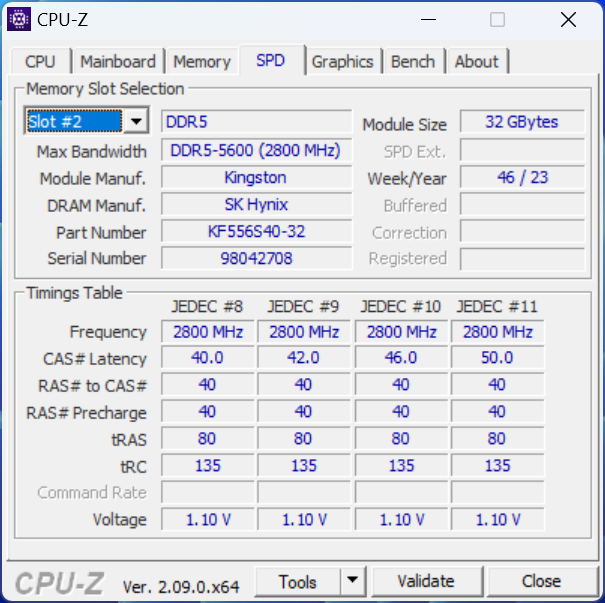
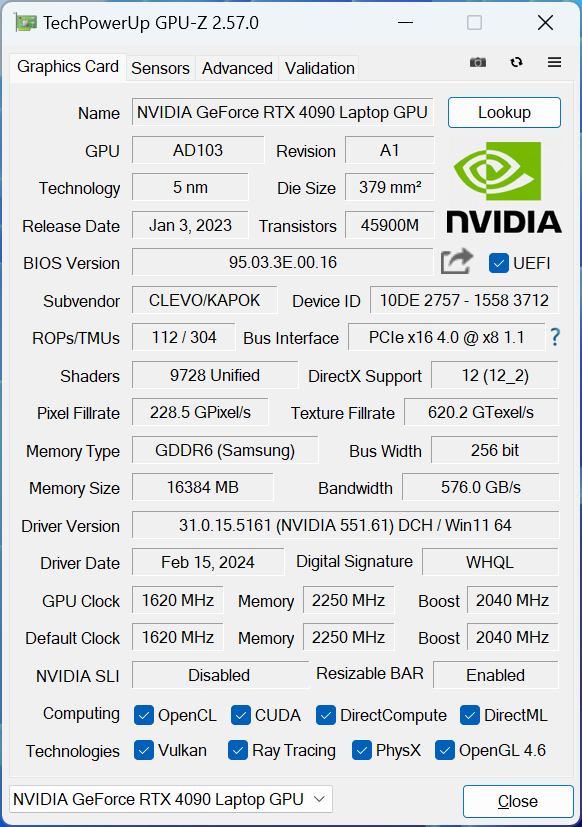
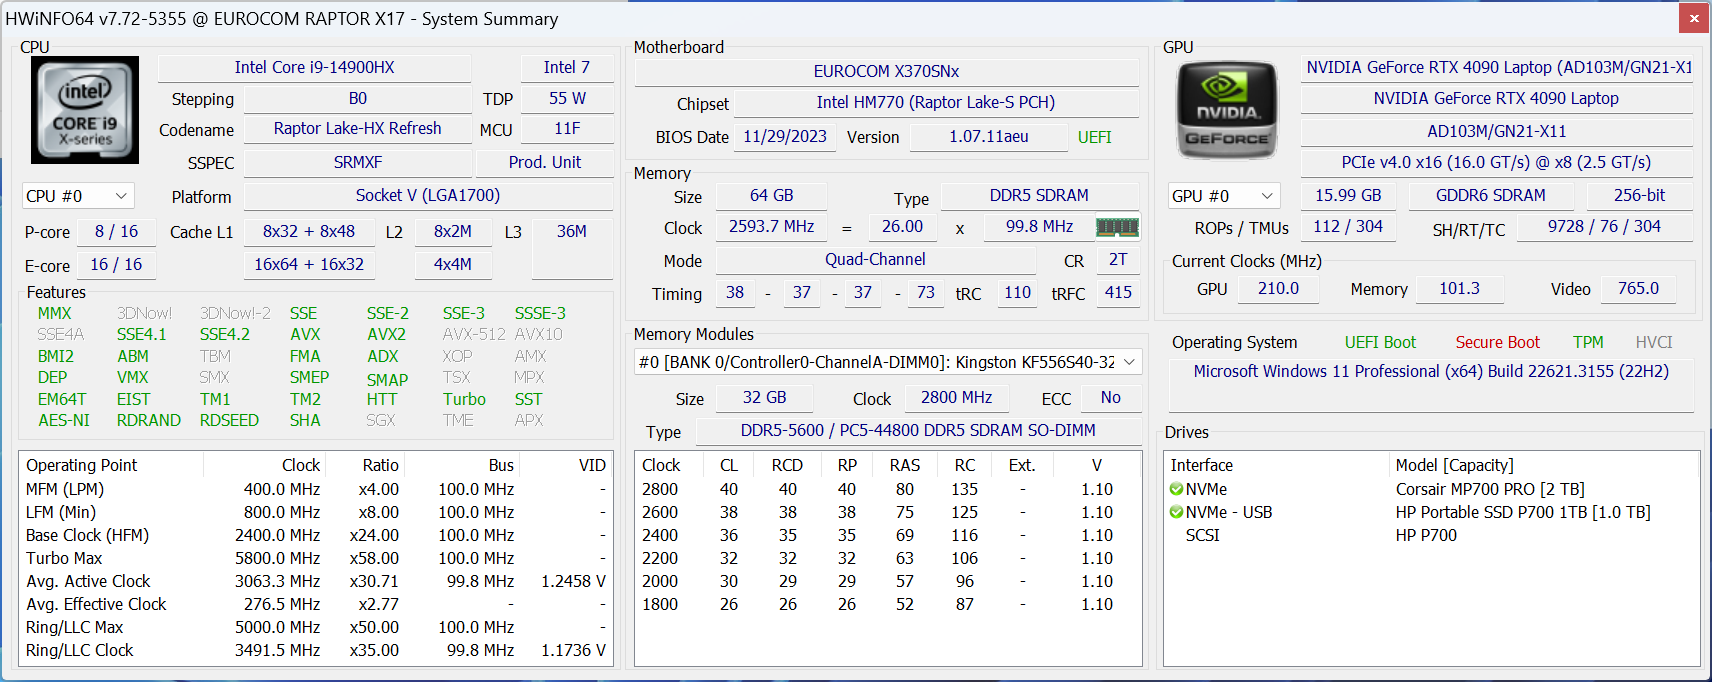
我们的 2024 Raptor X17 测试机配备了酷睿 i9-14900HX、PCIe5 固态硬盘和 4K 144 Hz 显示屏,与 2023 机型上的酷睿 i9-13900HX、PCIe4 固态硬盘和 2K 240 Hz 显示屏形成鲜明对比。175 WGeForce RTX 4090 保持不变。
猛禽 X17 的替代产品包括其他高性能游戏笔记本电脑,如 华硕 ROG Strix Scar 17, 微星 Titan 18 HX或 Alienware m18 R2.值得一提的是,猛禽 X17 是市场上为数不多的配备 17.3 英寸 16:9 显示屏的 RTX 4090 游戏笔记本电脑之一。
更多 Eurocom 评论:
潜在的竞争对手比较
Rating | Date | Model | Weight | Height | Size | Resolution | Price |
|---|---|---|---|---|---|---|---|
| 85.2 % v7 (old) | 03 / 2024 | Eurocom Raptor X17 Core i9-14900HX i9-14900HX, GeForce RTX 4090 Laptop GPU | 3.4 kg | 24.9 mm | 17.30" | 3840x2160 | |
| 82.8 % v7 (old) | 05 / 2023 | Eurocom Raptor X17 i9-13900HX, GeForce RTX 4090 Laptop GPU | 3.5 kg | 24.9 mm | 17.30" | 2560x1440 | |
| 85.6 % v7 (old) | 01 / 2024 | Asus TUF Gaming A17 FA707XI-NS94 R9 7940HS, GeForce RTX 4070 Laptop GPU | 2.5 kg | 25.4 mm | 17.30" | 1920x1080 | |
| 88.3 % v7 (old) | 04 / 2023 | Asus ROG Strix Scar 17 G733PY-XS96 R9 7945HX, GeForce RTX 4090 Laptop GPU | 2.9 kg | 28.3 mm | 17.30" | 2560x1440 | |
v (old) | MSI Raider GE78 HX 13VI i9-13980HX, GeForce RTX 4090 Laptop GPU | 17.30" | 2560x1600 | ||||
| 88.8 % v7 (old) | 01 / 2024 | MSI Titan 18 HX A14VIG i9-14900HX, GeForce RTX 4090 Laptop GPU | 3.6 kg | 32.1 mm | 18.00" | 3840x2400 |
交流
网络摄像头


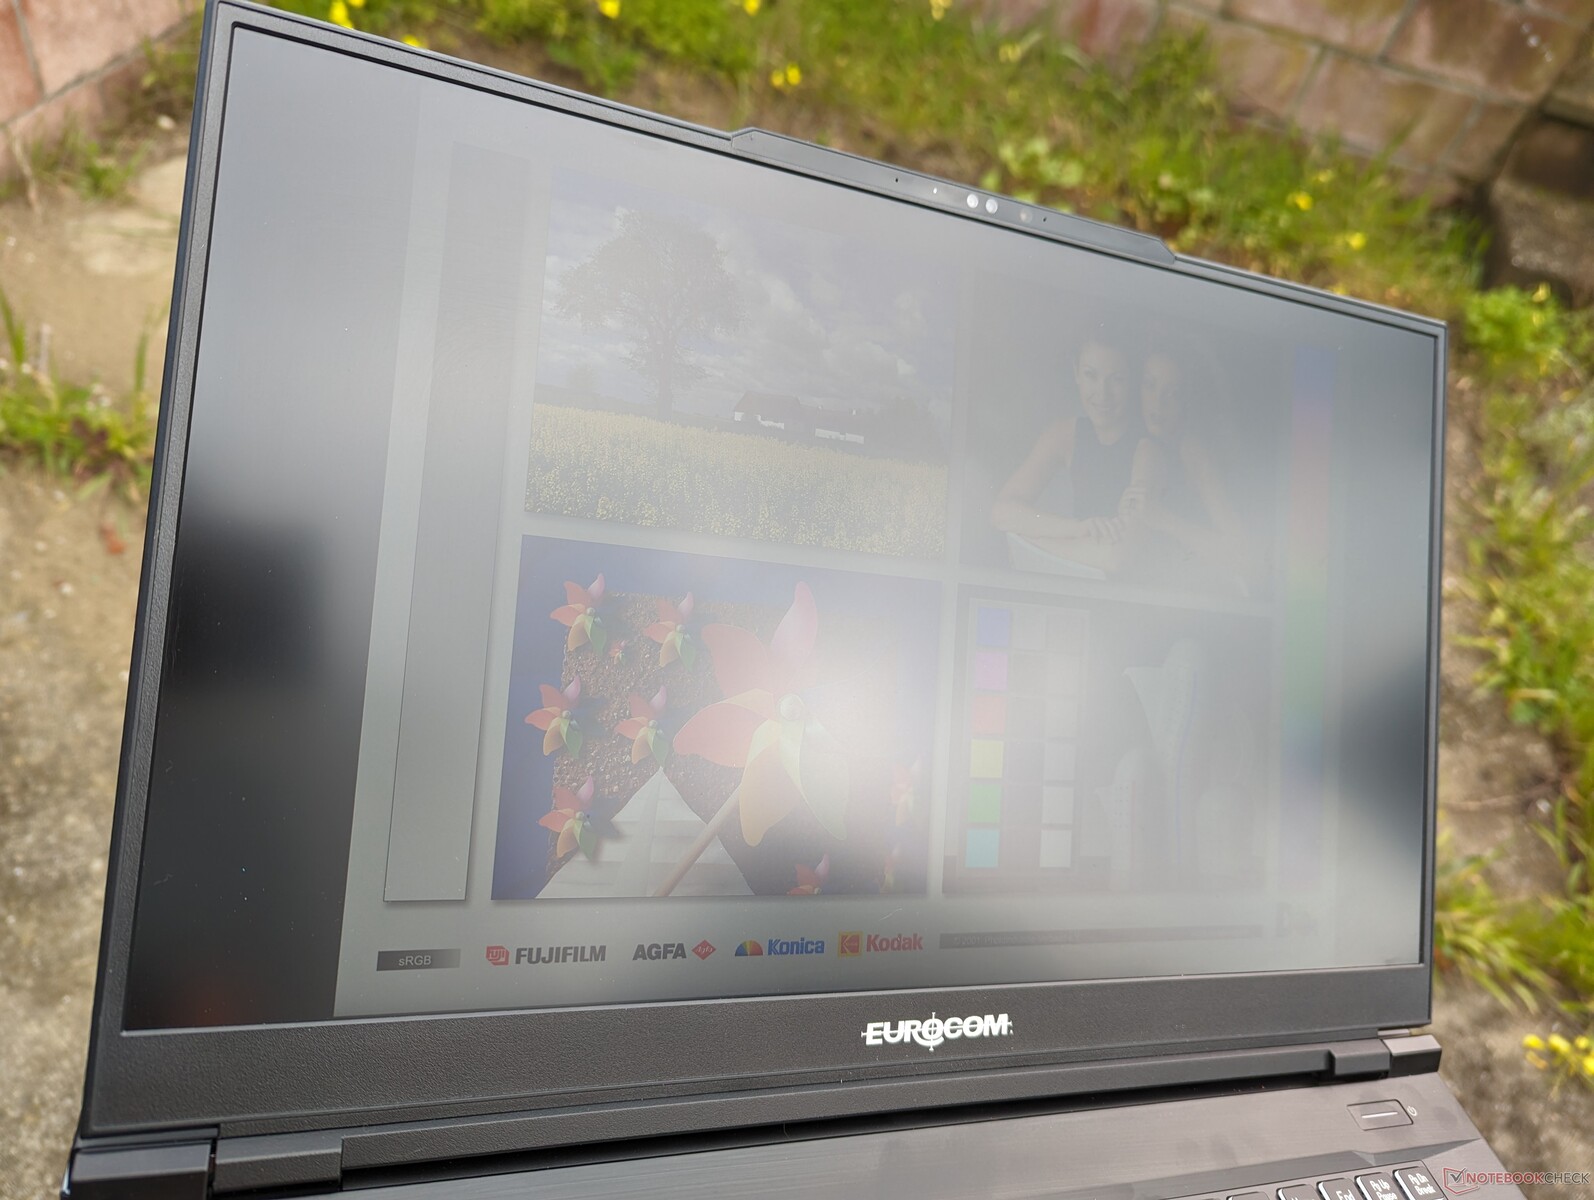
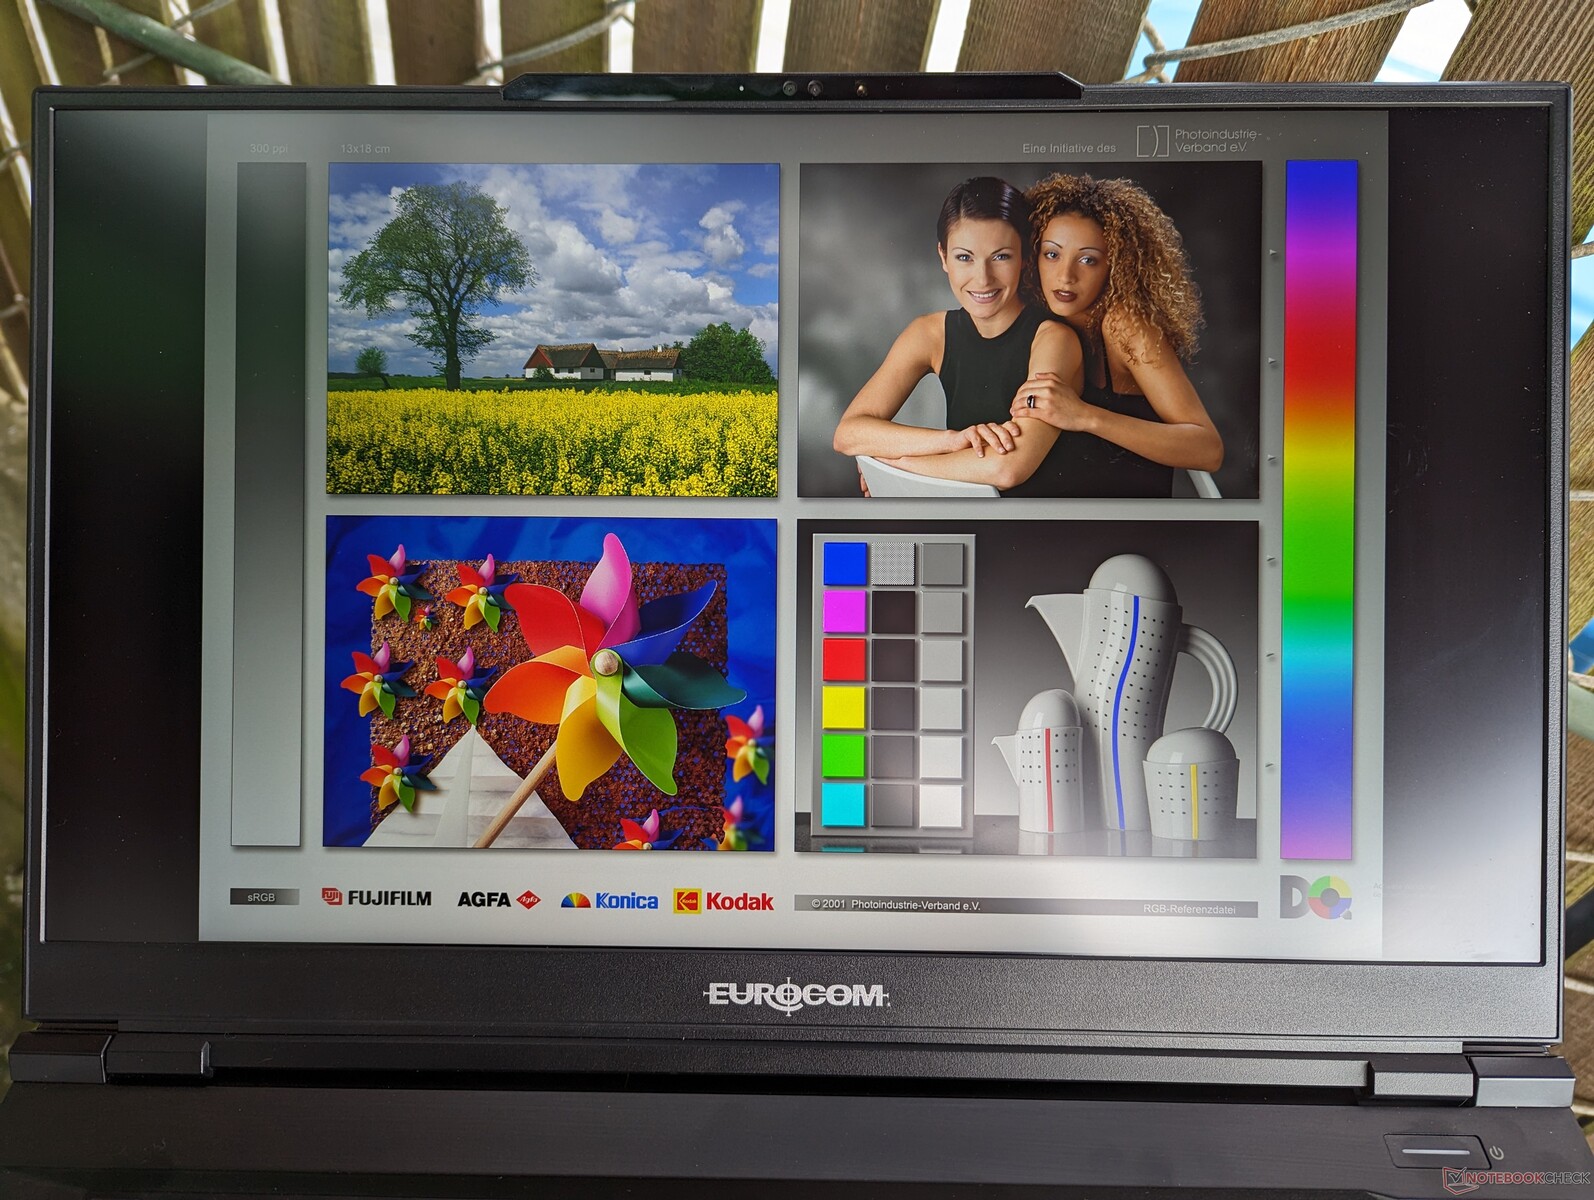
显示屏
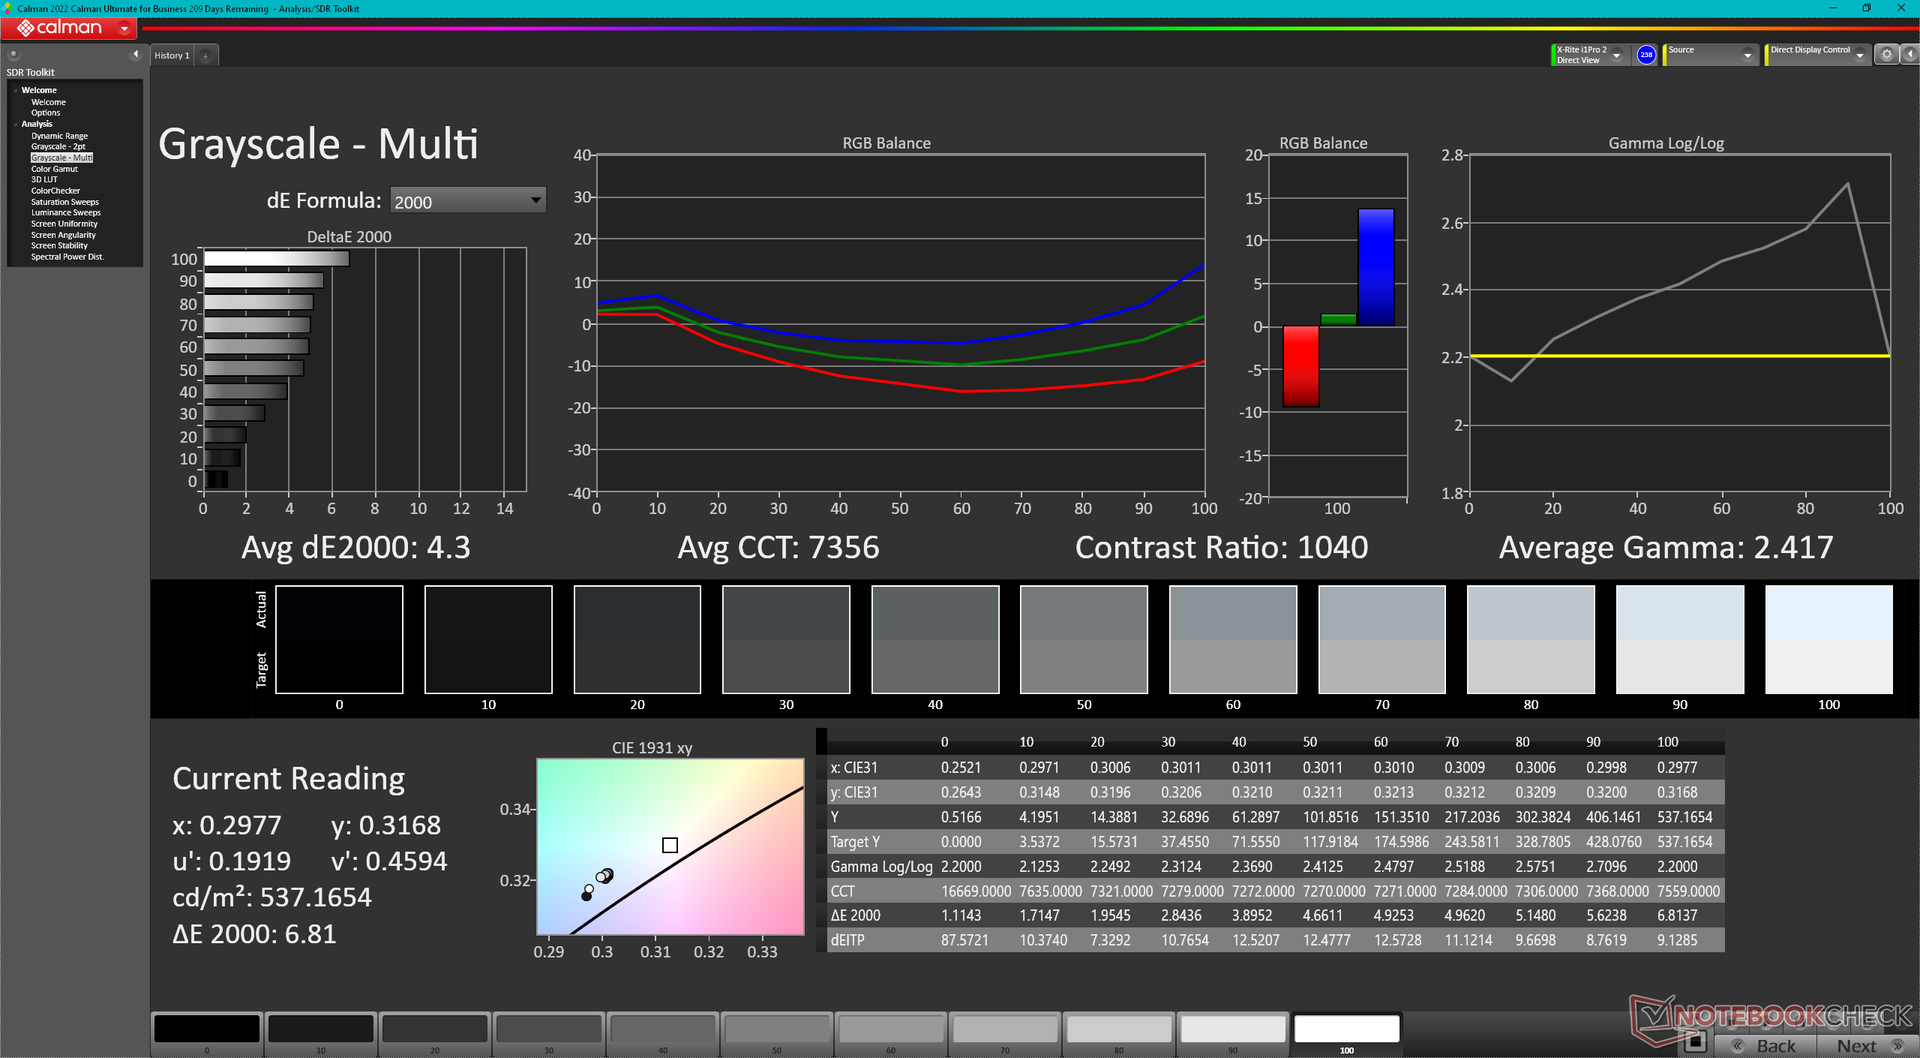
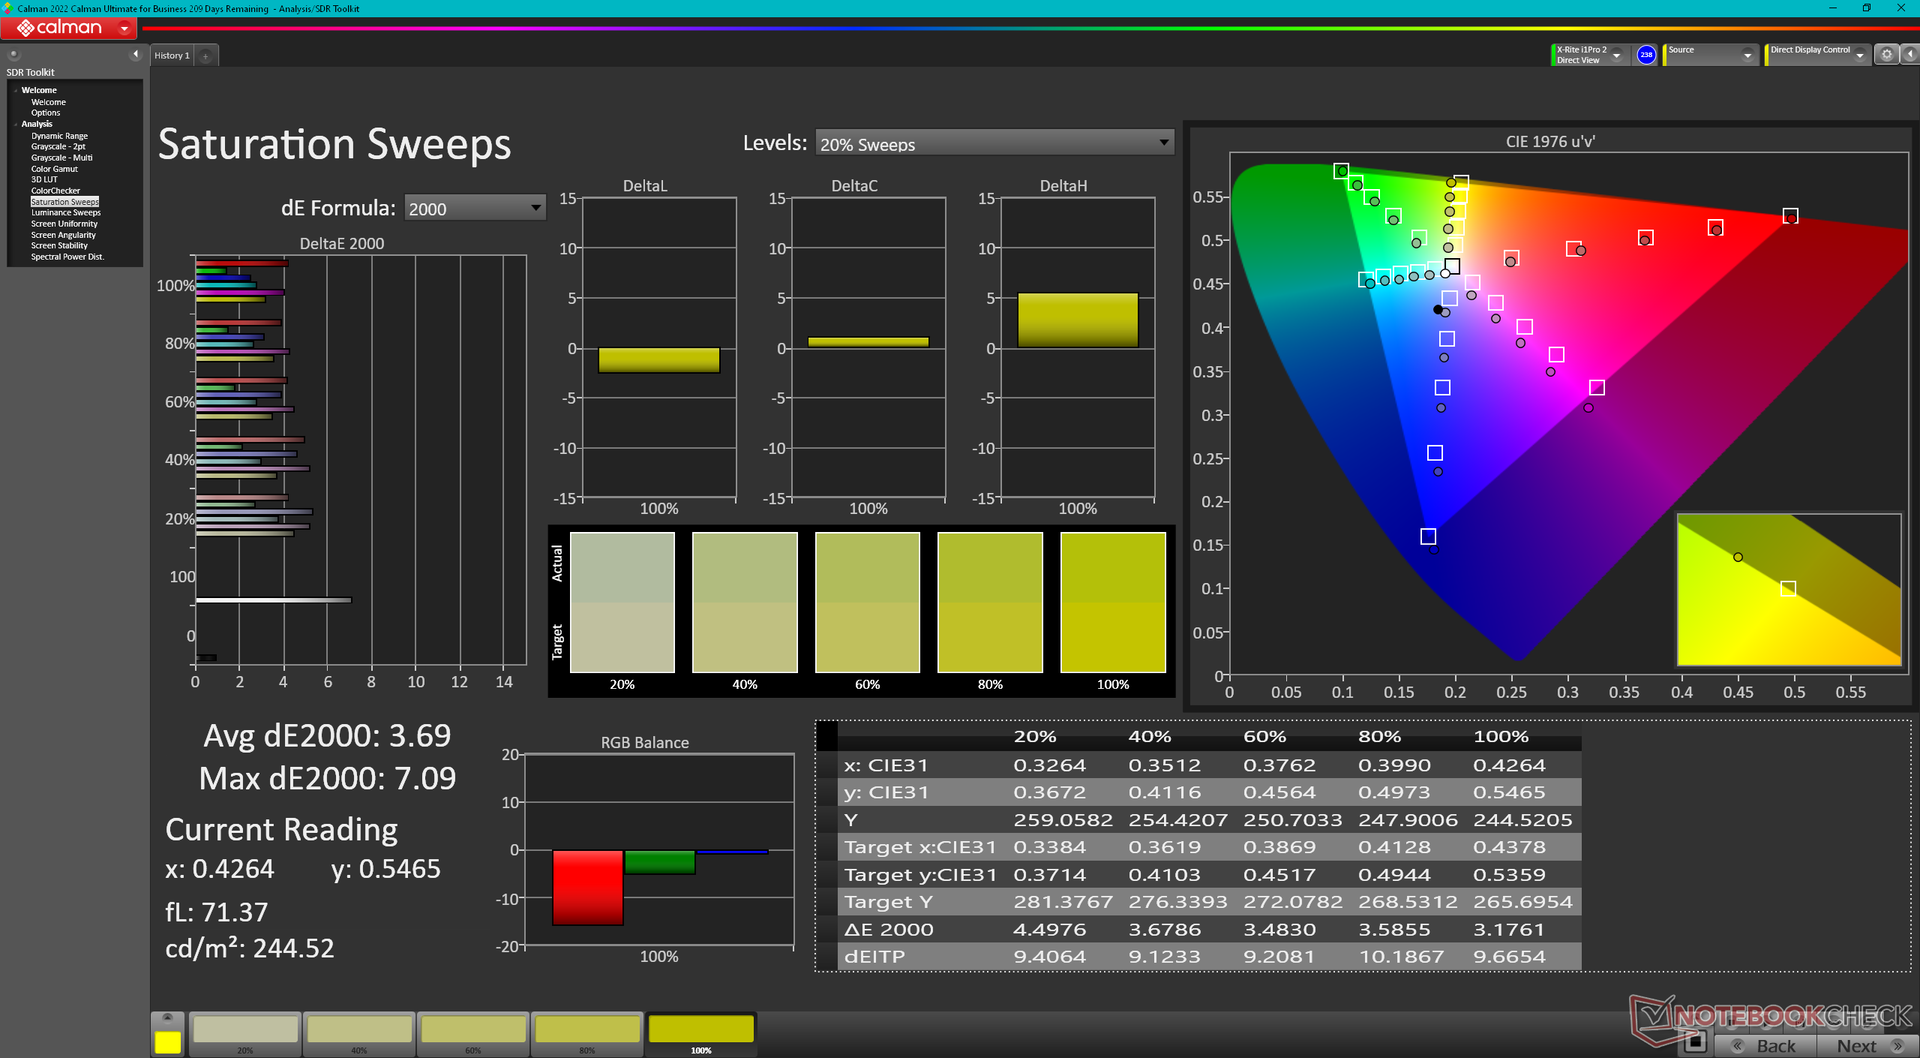
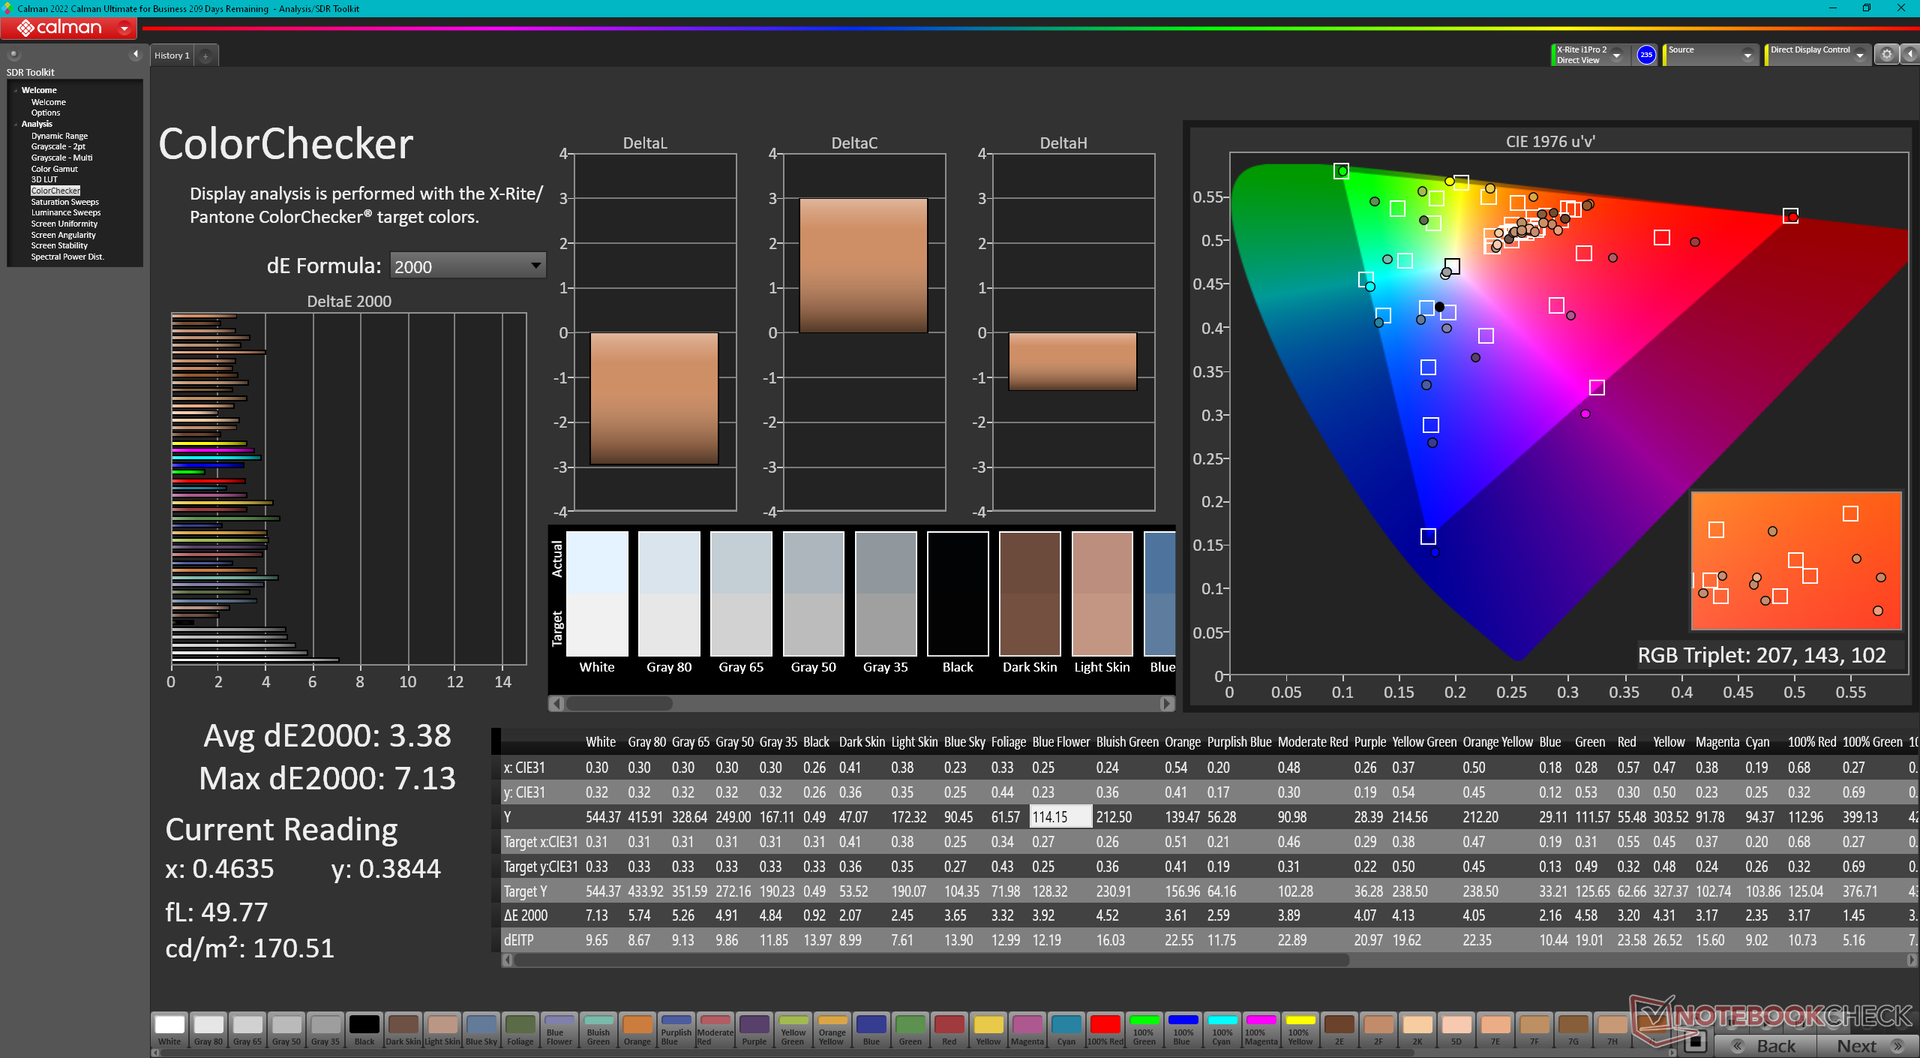
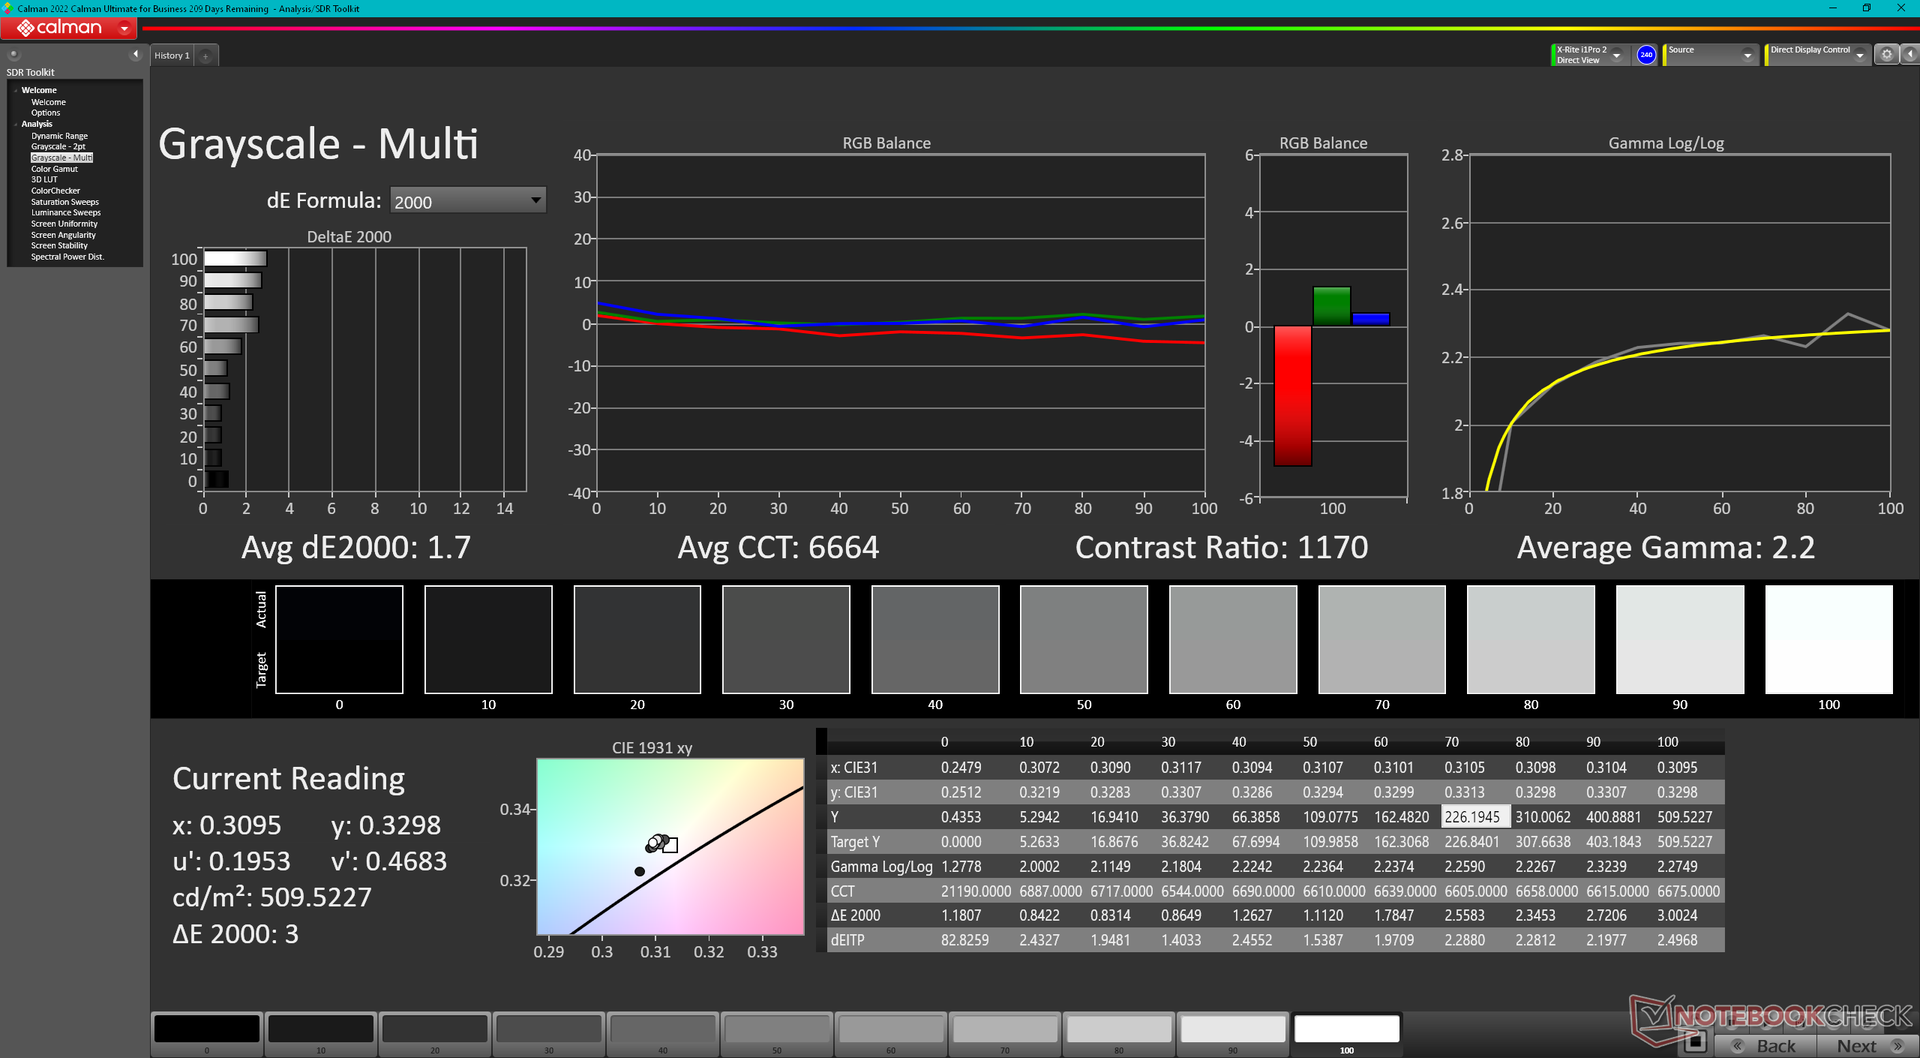
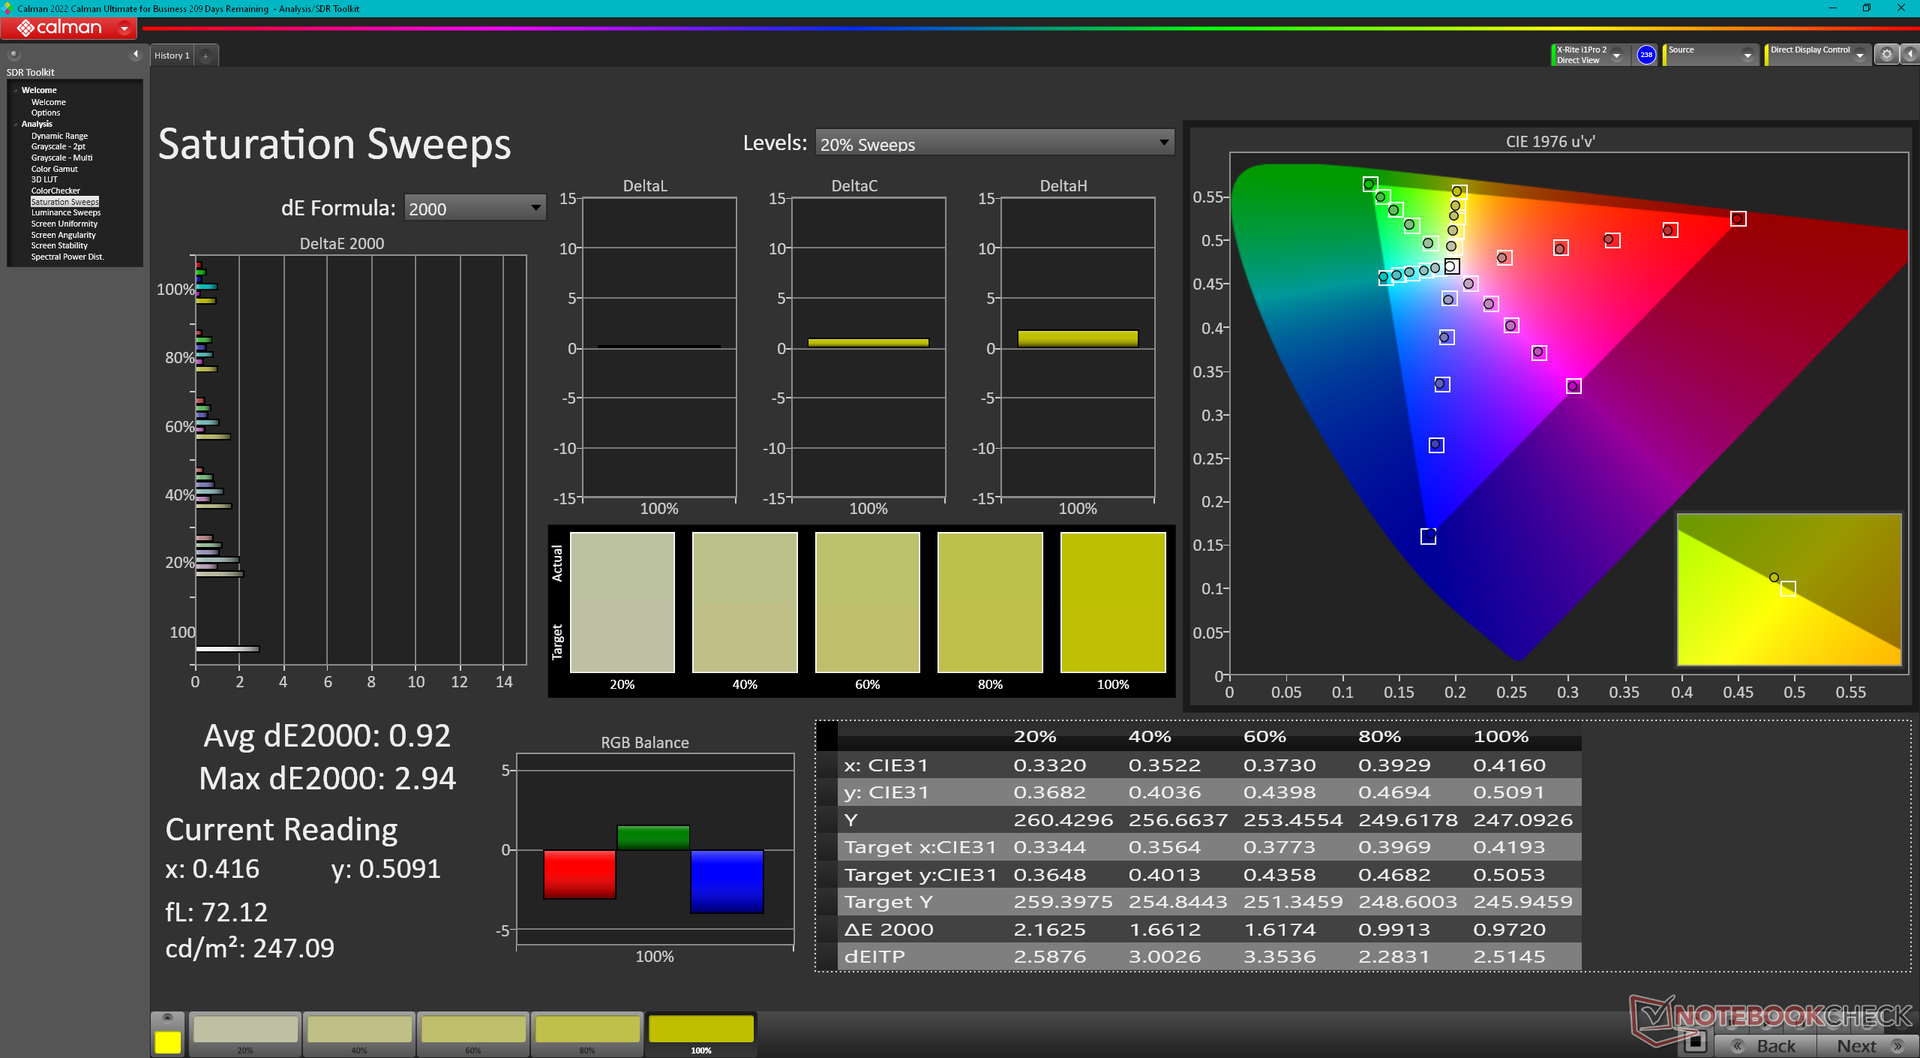
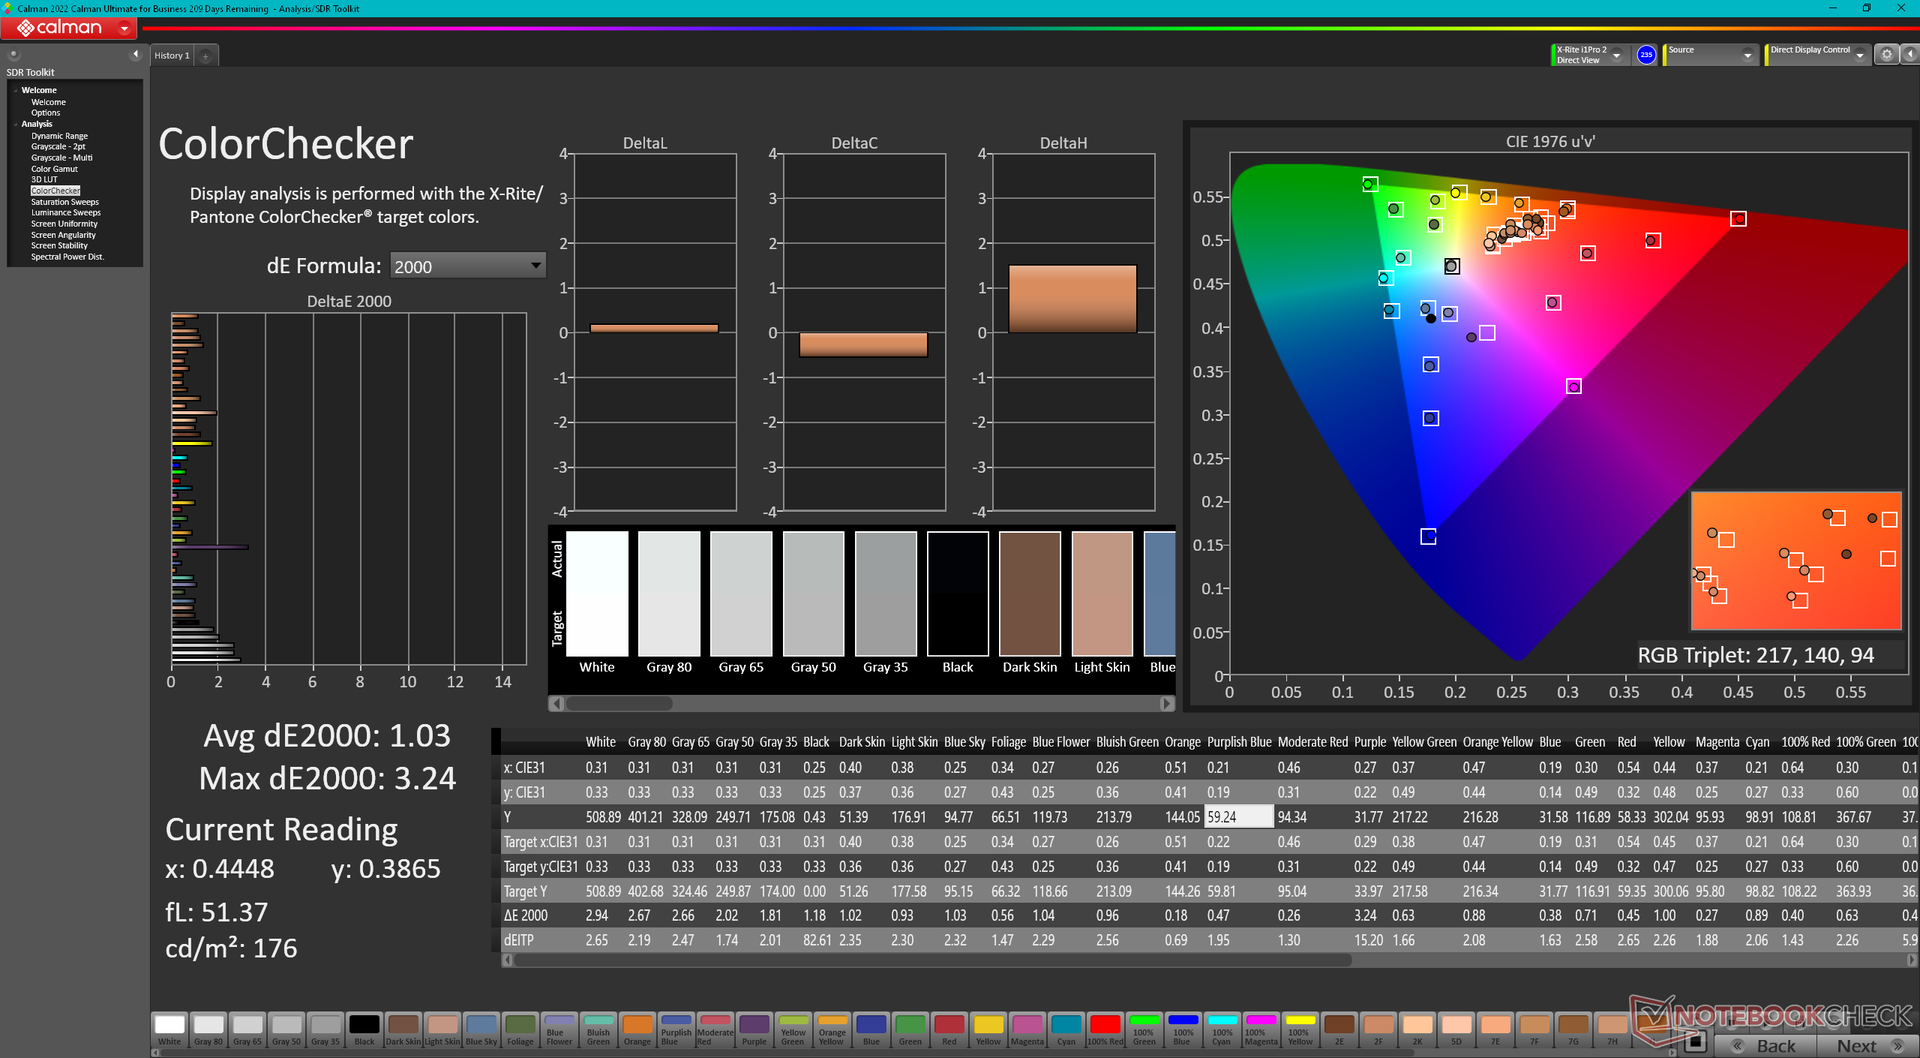
与 2023 配置的 2K 240 Hz 显示屏相比,我们的 2024 配置使用的是 4K 144 Hz 面板,但色彩覆盖率、对比度和响应时间都差不多。我们的高分辨率面板也明显更亮,平均亮度约为 500 尼特。
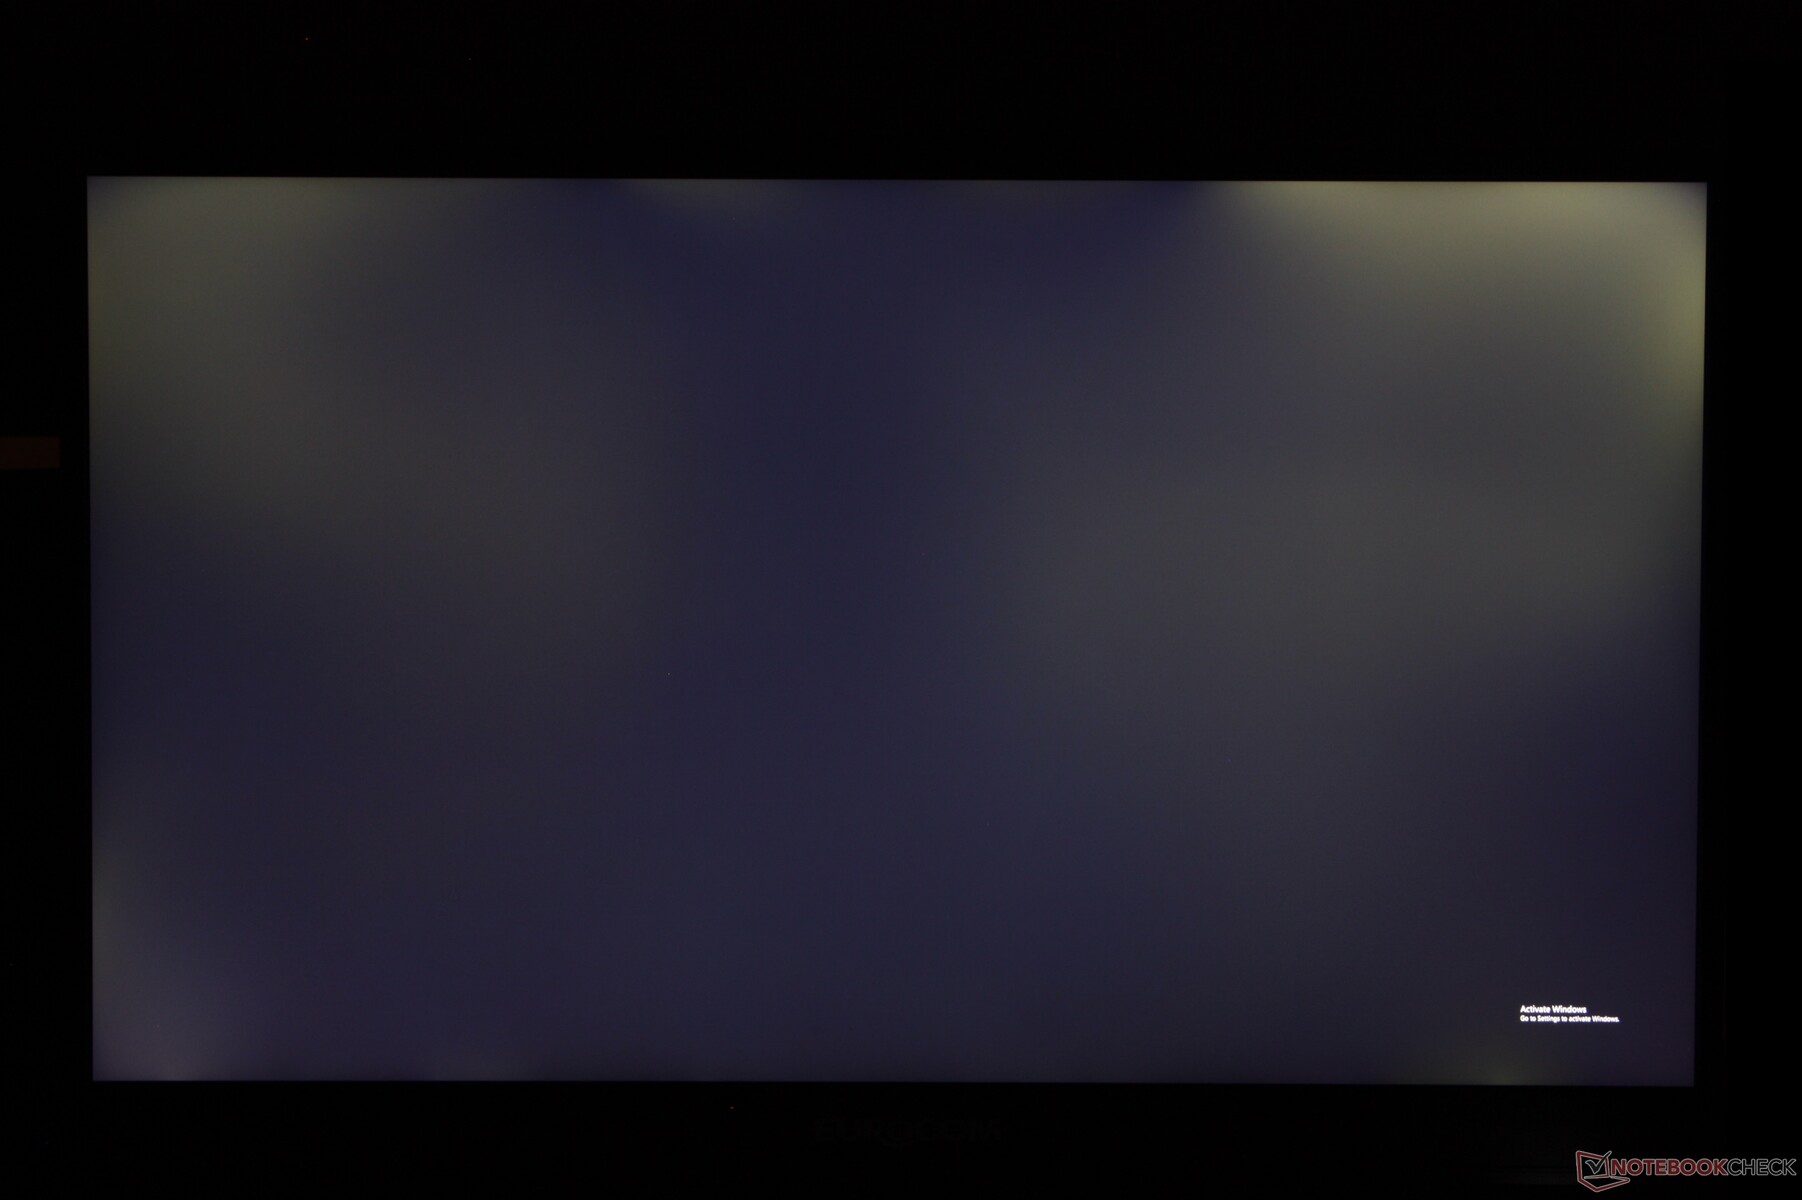
该显示器的一个主要缺点是采用了颗粒感较强的哑光面板,在黑暗场景中会出现明显的背光出血现象,而且不支持 HDR。在这方面,OLED 替代品要比锐龙 X17 看起来更清晰、更鲜艳。
京东方 NE173QUM-NY1 面板还可用于其他机型,如 申克 Key 17 Pro.

| |||||||||||||||||||||||||
Brightness Distribution: 77 %
Center on Battery: 544.6 cd/m²
Contrast: 1135:1 (Black: 0.48 cd/m²)
ΔE ColorChecker Calman: 3.38 | ∀{0.5-29.43 Ø4.71}
calibrated: 1.03
ΔE Greyscale Calman: 4.3 | ∀{0.09-98 Ø4.96}
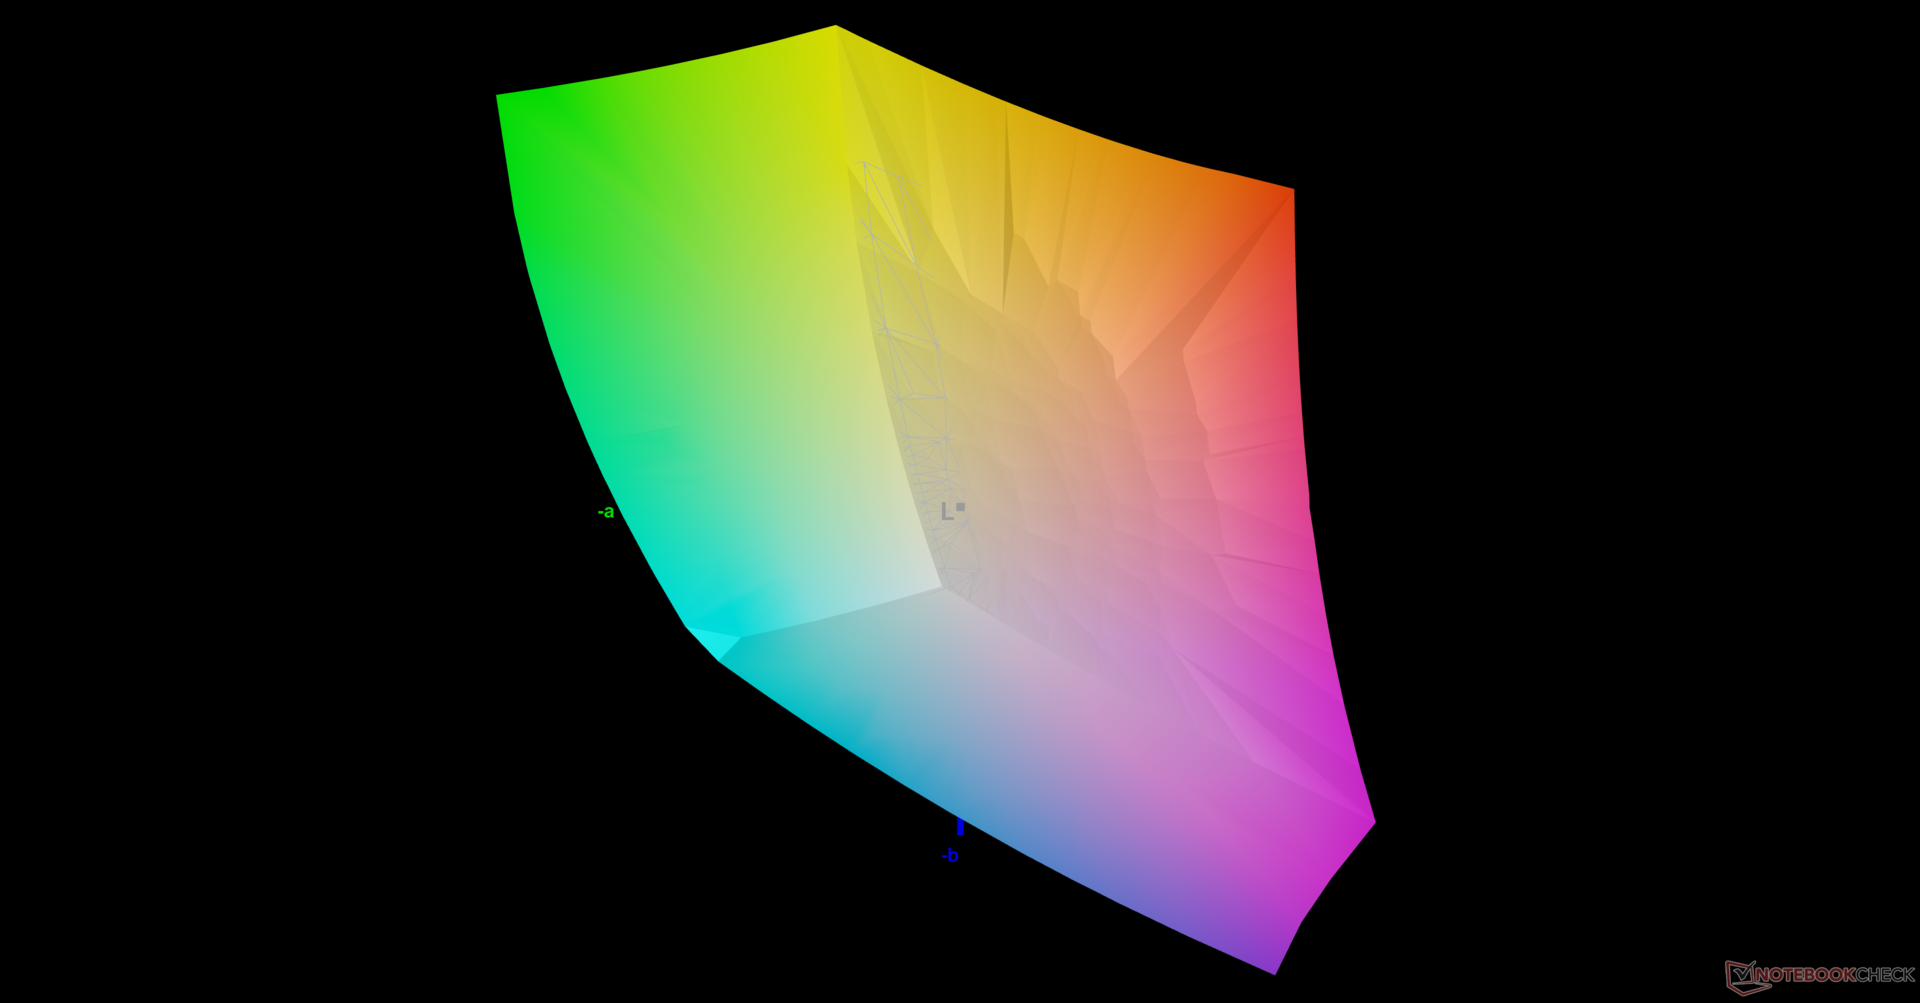
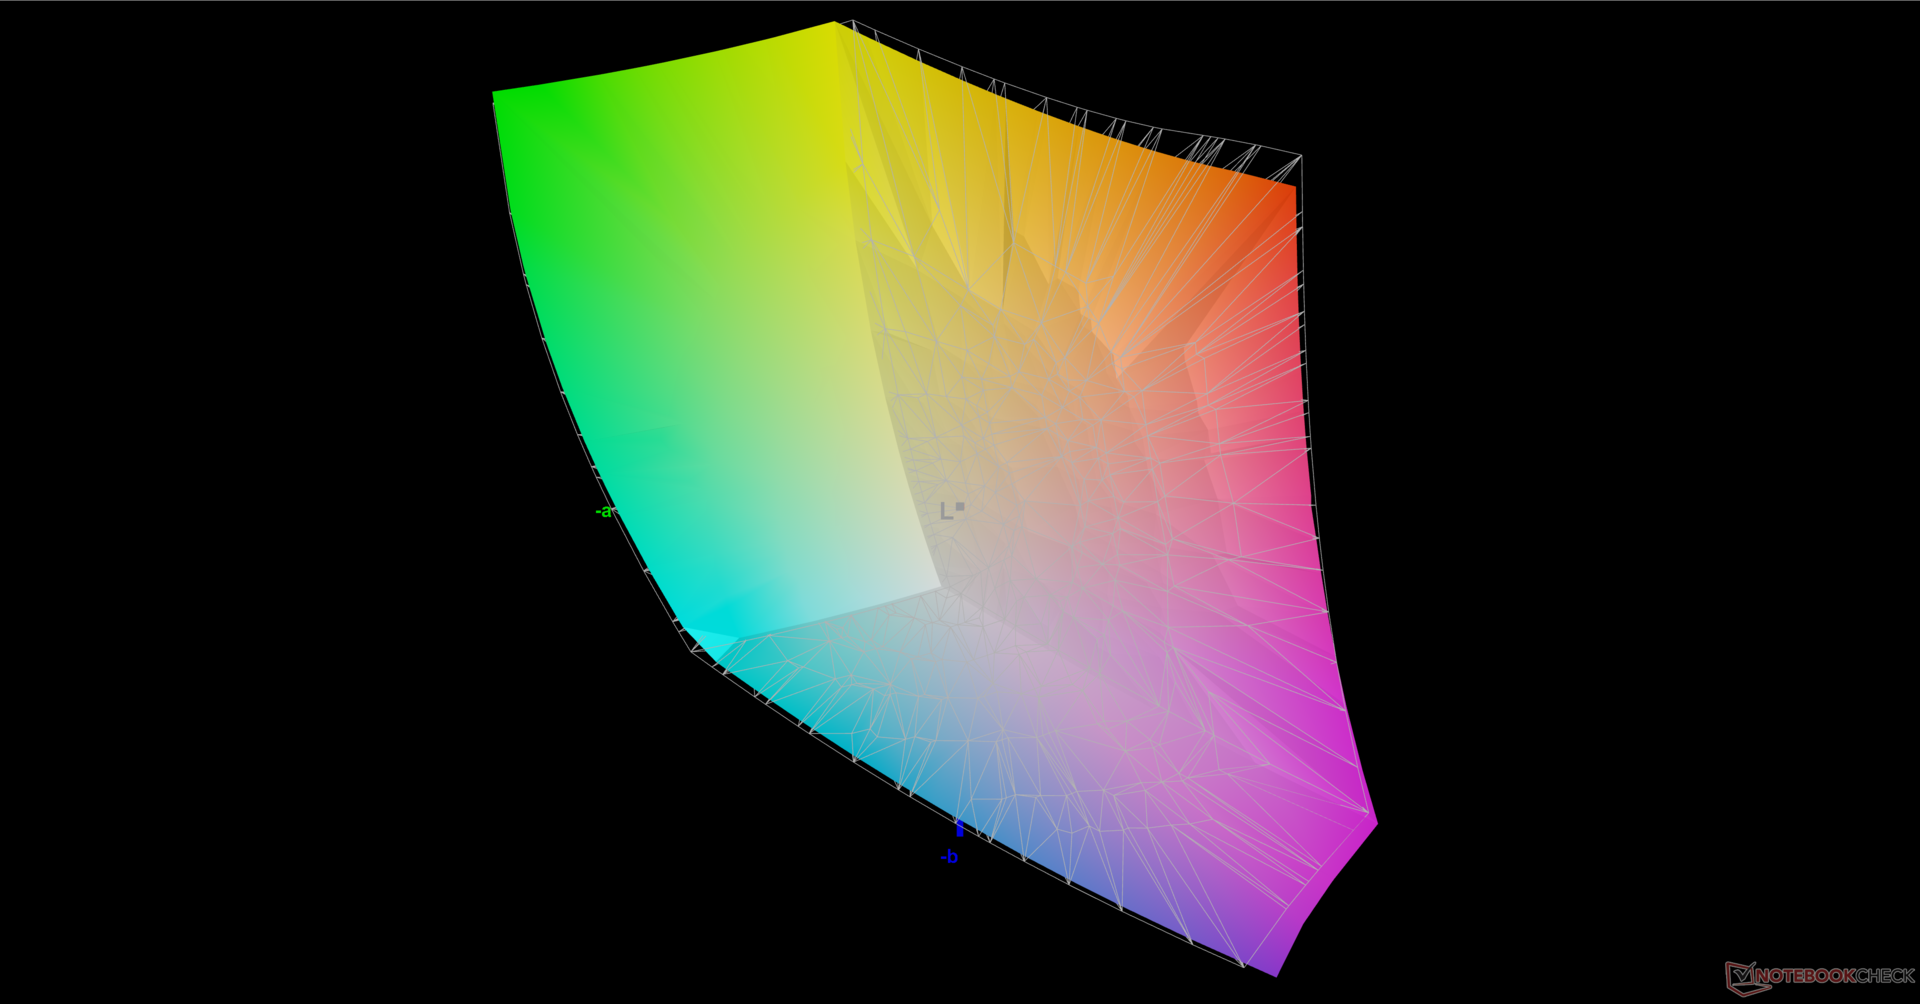
84.2% AdobeRGB 1998 (Argyll 3D)
99.8% sRGB (Argyll 3D)
95.9% Display P3 (Argyll 3D)
Gamma: 2.42
CCT: 7356 K
| Eurocom Raptor X17 Core i9-14900HX BOE CQ NE173QUM-NY1, IPS, 3840x2160, 17.3" | Eurocom Raptor X17 BOE NE173QHM-NZ1, IPS, 2560x1440, 17.3" | Asus TUF Gaming A17 FA707XI-NS94 AU Optronics B173HAN04.9, IPS, 1920x1080, 17.3" | Asus ROG Strix Scar 17 G733PY-XS96 NE173QHM-NZ2, IPS, 2560x1440, 17.3" | MSI GE78HX 13VH-070US AU Optronics B170QAN01.2, IPS, 2560x1600, 17" | MSI Titan 18 HX A14VIG AU Optronics B180ZAN01.0, Mini-LED, 3840x2400, 18" | |
|---|---|---|---|---|---|---|
| Display | 1% | -50% | 1% | 2% | 1% | |
| Display P3 Coverage (%) | 95.9 | 97.8 2% | 39.7 -59% | 98 2% | 97.6 2% | 98.1 2% |
| sRGB Coverage (%) | 99.8 | 99.9 0% | 59.1 -41% | 100 0% | 99.9 0% | 99.8 0% |
| AdobeRGB 1998 Coverage (%) | 84.2 | 85.4 1% | 41 -51% | 85.6 2% | 86.5 3% | 86.2 2% |
| Response Times | 11% | -150% | 29% | 58% | -288% | |
| Response Time Grey 50% / Grey 80% * (ms) | 14.8 ? | 13.3 ? 10% | 39 ? -164% | 6.2 ? 58% | 4.2 ? 72% | 8.6 ? 42% |
| Response Time Black / White * (ms) | 11.4 ? | 10 ? 12% | 26.9 ? -136% | 11.4 ? -0% | 6.4 ? 44% | 81.8 ? -618% |
| PWM Frequency (Hz) | 2592 ? | |||||
| Screen | -4% | -33% | 22% | -16% | -23% | |
| Brightness middle (cd/m²) | 544.6 | 312.6 -43% | 255.9 -53% | 322.5 -41% | 398.6 -27% | 467.5 -14% |
| Brightness (cd/m²) | 507 | 292 -42% | 248 -51% | 317 -37% | 384 -24% | 459 -9% |
| Brightness Distribution (%) | 77 | 75 -3% | 91 18% | 86 12% | 89 16% | 90 17% |
| Black Level * (cd/m²) | 0.48 | 0.26 46% | 0.21 56% | 0.29 40% | 0.46 4% | |
| Contrast (:1) | 1135 | 1202 6% | 1219 7% | 1112 -2% | 867 -24% | |
| Colorchecker dE 2000 * | 3.38 | 3.43 -1% | 4.51 -33% | 1.15 66% | 4.05 -20% | 3.77 -12% |
| Colorchecker dE 2000 max. * | 7.13 | 8.31 -17% | 20.77 -191% | 3.03 58% | 8.68 -22% | 6.12 14% |
| Colorchecker dE 2000 calibrated * | 1.03 | 0.74 28% | 1.82 -77% | 0.56 46% | 1.02 1% | 2.94 -185% |
| Greyscale dE 2000 * | 4.3 | 4.8 -12% | 3.2 26% | 1.7 60% | 6.5 -51% | 3.2 26% |
| Gamma | 2.42 91% | 2.12 104% | 2.08 106% | 2.27 97% | 2.11 104% | 2.43 91% |
| CCT | 7356 88% | 7082 92% | 6054 107% | 6299 103% | 7518 86% | 6478 100% |
| Total Average (Program / Settings) | 3% /
-1% | -78% /
-54% | 17% /
19% | 15% /
-2% | -103% /
-61% |
* ... smaller is better
虽然支持 P3 标准,但色彩精确度可能会更好。色温太低会影响灰度和色彩 deltaE 值。使用我们的 X-Rite 色度计进行校准可以解决这个问题。我们的 ICM 配置文件可在上面免费下载。
Display Response Times
| ↔ Response Time Black to White | ||
|---|---|---|
| 11.4 ms ... rise ↗ and fall ↘ combined | ↗ 6.1 ms rise | 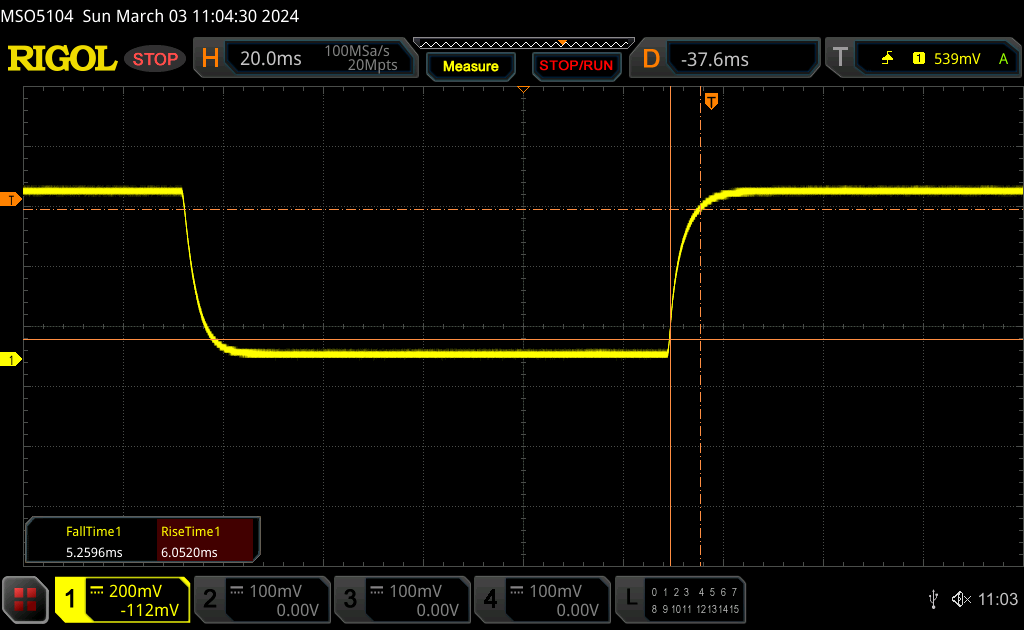 |
| ↘ 5.3 ms fall | ||
| The screen shows good response rates in our tests, but may be too slow for competitive gamers. In comparison, all tested devices range from 0.1 (minimum) to 240 (maximum) ms. » 31 % of all devices are better. This means that the measured response time is better than the average of all tested devices (19.8 ms). | ||
| ↔ Response Time 50% Grey to 80% Grey | ||
| 14.8 ms ... rise ↗ and fall ↘ combined | ↗ 7.2 ms rise | 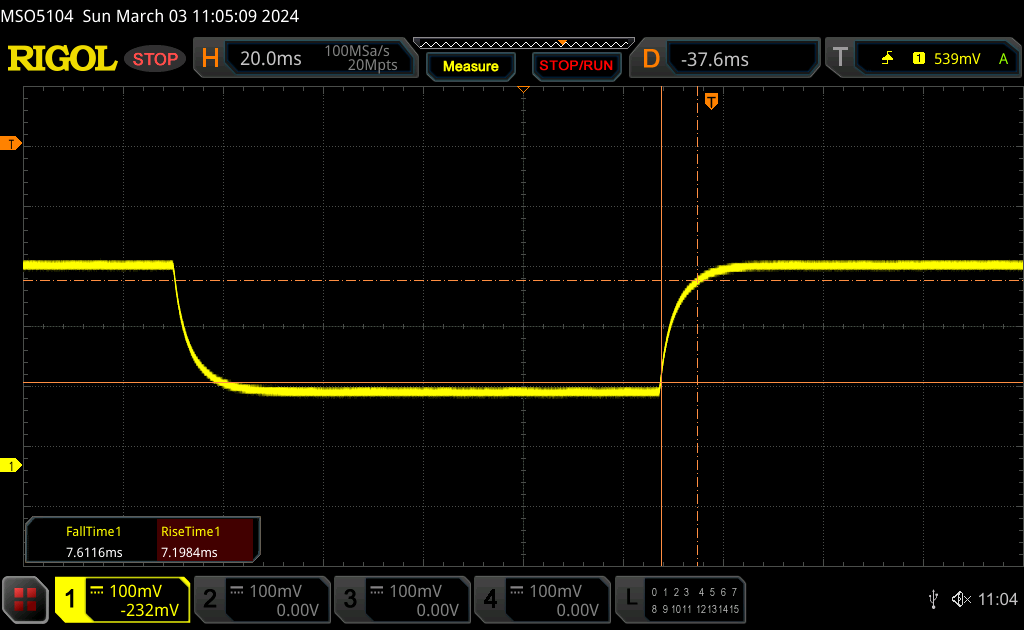 |
| ↘ 7.6 ms fall | ||
| The screen shows good response rates in our tests, but may be too slow for competitive gamers. In comparison, all tested devices range from 0.165 (minimum) to 636 (maximum) ms. » 29 % of all devices are better. This means that the measured response time is better than the average of all tested devices (31 ms). | ||
Screen Flickering / PWM (Pulse-Width Modulation)
| Screen flickering / PWM not detected | 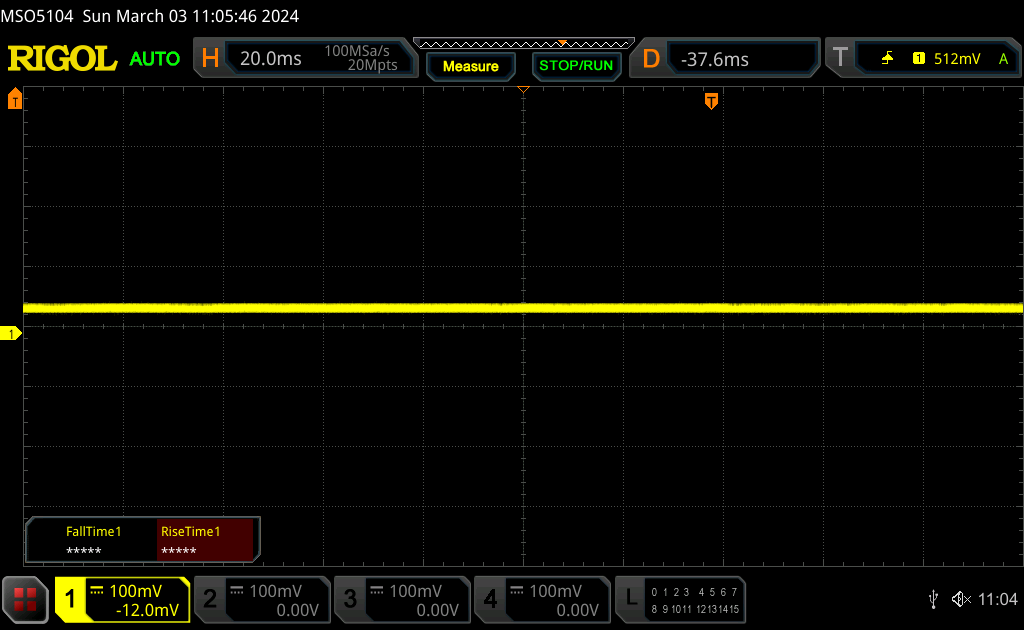 | ||
In comparison: 52 % of all tested devices do not use PWM to dim the display. If PWM was detected, an average of 7757 (minimum: 5 - maximum: 343500) Hz was measured. | |||
性能 - Raptor Lake-HX Refresh
测试条件
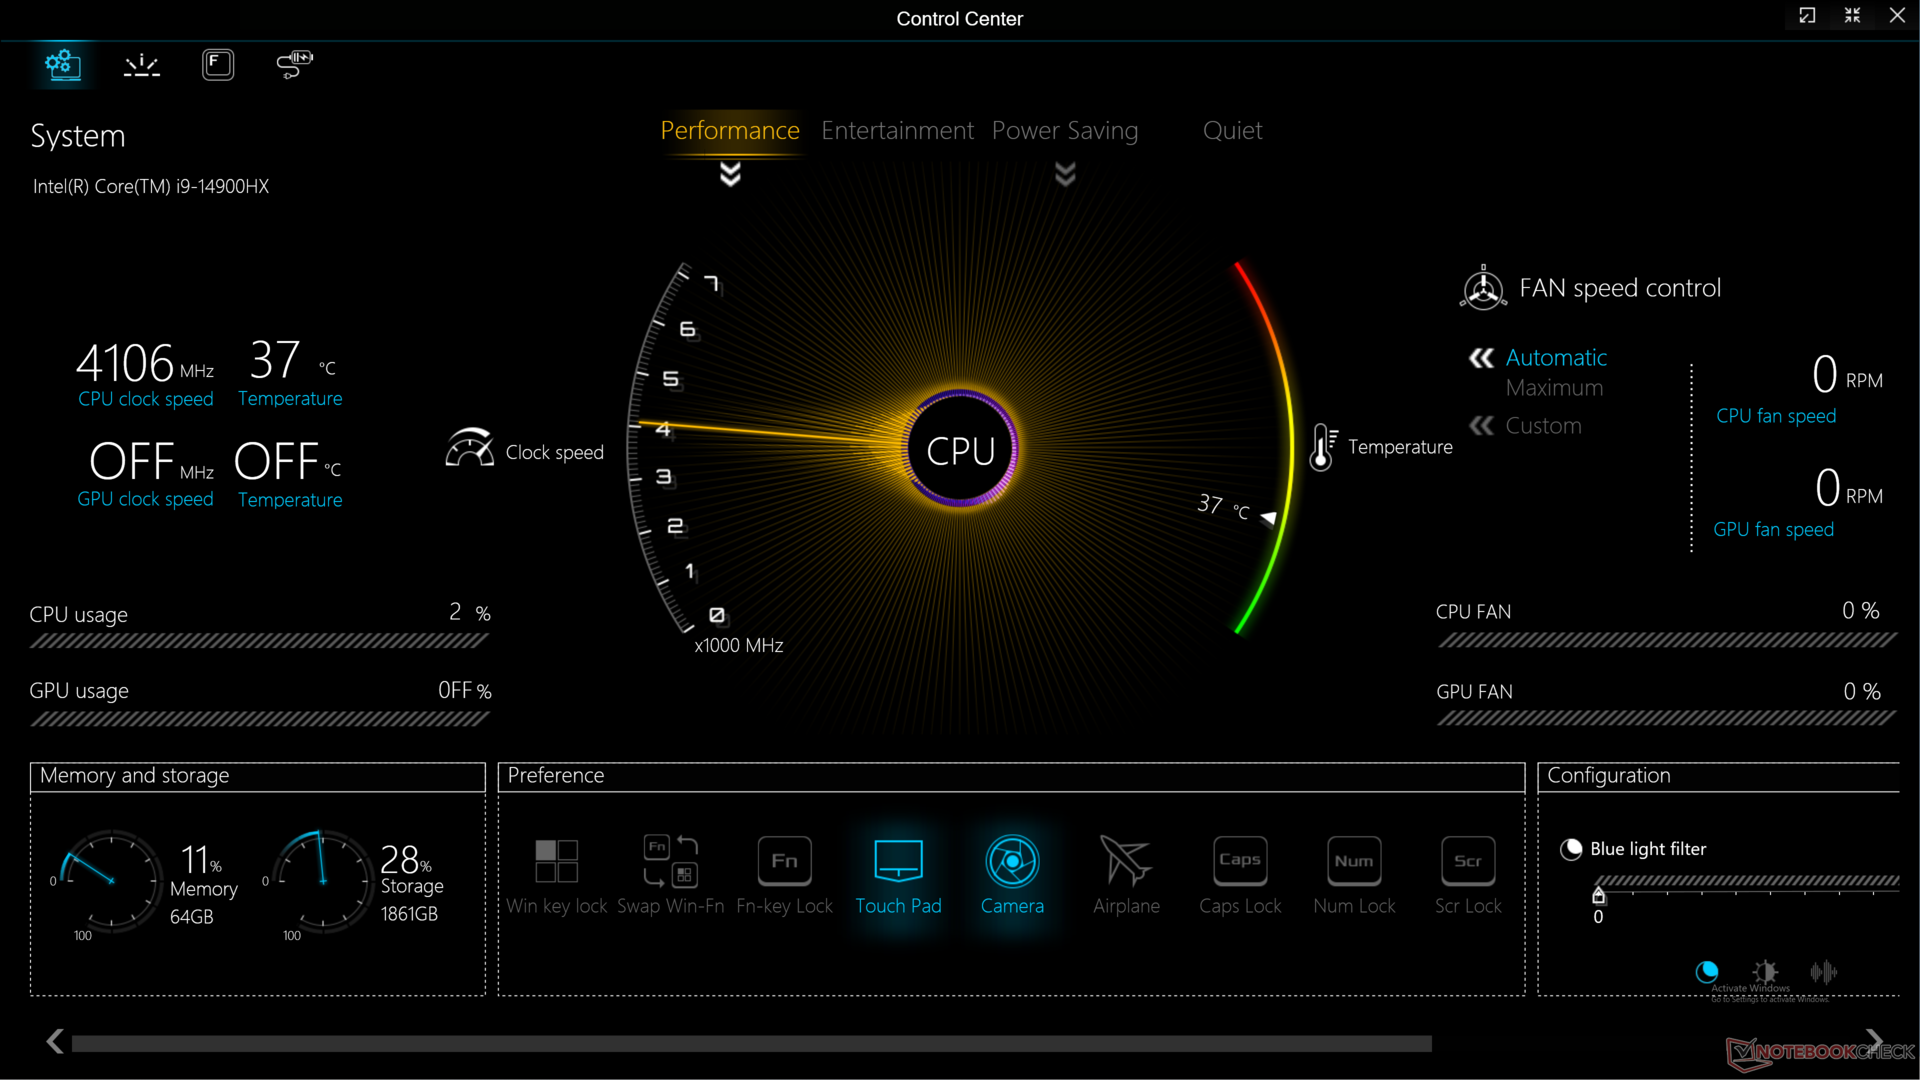
在运行下面的基准测试之前,我们将 Windows 和控制中心设置为性能模式,并激活了最大风扇。手动 GPU 开关也可在控制中心内找到,但不方便地隐藏在滚动条后面。在 iGPU 和 dGPU 之间切换时,支持 G-Sync,但不支持 Advanced Optimus,这意味着需要重启。
控制中心中的 "娱乐 "和 "性能 "模式可能会有些混乱。或许将 "娱乐 "模式更名为 "平衡 "模式会更合适。
处理器
Raptor Lake-HX 系列在 2024 年进行了更新,但与 2023 年系列相比,其性能优势充其量只是微不足道。从 酷睿 i9-13900HX跳转到 酷睿 i9-14900HX的性能仅提高了 5% 至 10%。与 Meteor Lake 平台不同,该芯片组没有集成 NPU。
Cinebench R15 Multi Loop
Cinebench R23: Multi Core | Single Core
Cinebench R20: CPU (Multi Core) | CPU (Single Core)
Cinebench R15: CPU Multi 64Bit | CPU Single 64Bit
Blender: v2.79 BMW27 CPU
7-Zip 18.03: 7z b 4 | 7z b 4 -mmt1
Geekbench 6.7: Multi-Core | Single-Core
Geekbench 5.5: Multi-Core | Single-Core
HWBOT x265 Benchmark v2.2: 4k Preset
LibreOffice : 20 Documents To PDF
R Benchmark 2.5: Overall mean
| CPU Performance rating | |
| KFA2 GeForce RTX 4080 Super SG -6! | |
| Asus ROG Strix Scar 17 G733PYV-LL053X | |
| Asus ROG Strix Scar 17 G733PY-XS96 -2! | |
| MSI GE78HX 13VH-070US -2! | |
| MSI Titan 18 HX A14VIG | |
| MSI Raider GE78 HX 13VI | |
| Average Intel Core i9-14900HX | |
| Eurocom Raptor X17 Core i9-14900HX | |
| Eurocom Raptor X17 -2! | |
| Alienware x16 R1 -3! | |
| Asus TUF Gaming A17 FA707XI-NS94 | |
| Dell XPS 17 9730 RTX 4070 -2! | |
| Medion Erazer Defender P40 -2! | |
| Eurocom Nightsky TXi317 -4! | |
| Acer Nitro 17 AN17-41-R9LN | |
| Alienware m17 R5 (R9 6900HX, RX 6850M XT) -2! | |
| Cinebench R15 / CPU Single 64Bit | |
| Asus ROG Strix Scar 17 G733PYV-LL053X | |
| Asus ROG Strix Scar 17 G733PY-XS96 | |
| Average Intel Core i9-14900HX (247 - 323, n=37) | |
| MSI GE78HX 13VH-070US | |
| MSI Raider GE78 HX 13VI | |
| MSI Titan 18 HX A14VIG | |
| Eurocom Raptor X17 Core i9-14900HX | |
| Eurocom Raptor X17 | |
| Asus TUF Gaming A17 FA707XI-NS94 | |
| Alienware x16 R1 | |
| Dell XPS 17 9730 RTX 4070 | |
| Acer Nitro 17 AN17-41-R9LN | |
| Alienware m17 R5 (R9 6900HX, RX 6850M XT) | |
| Medion Erazer Defender P40 | |
| Geekbench 6.7 / Multi-Core | |
| KFA2 GeForce RTX 4080 Super SG | |
| Eurocom Raptor X17 Core i9-14900HX | |
| MSI Raider GE78 HX 13VI | |
| Average Intel Core i9-14900HX (13158 - 19665, n=37) | |
| Asus ROG Strix Scar 17 G733PYV-LL053X | |
| MSI Titan 18 HX A14VIG | |
| Asus TUF Gaming A17 FA707XI-NS94 | |
| Acer Nitro 17 AN17-41-R9LN | |
| Geekbench 6.7 / Single-Core | |
| KFA2 GeForce RTX 4080 Super SG | |
| Average Intel Core i9-14900HX (2419 - 3129, n=37) | |
| Asus ROG Strix Scar 17 G733PYV-LL053X | |
| Eurocom Raptor X17 Core i9-14900HX | |
| MSI Titan 18 HX A14VIG | |
| MSI Raider GE78 HX 13VI | |
| Asus TUF Gaming A17 FA707XI-NS94 | |
| Acer Nitro 17 AN17-41-R9LN | |
Cinebench R23: Multi Core | Single Core
Cinebench R20: CPU (Multi Core) | CPU (Single Core)
Cinebench R15: CPU Multi 64Bit | CPU Single 64Bit
Blender: v2.79 BMW27 CPU
7-Zip 18.03: 7z b 4 | 7z b 4 -mmt1
Geekbench 6.7: Multi-Core | Single-Core
Geekbench 5.5: Multi-Core | Single-Core
HWBOT x265 Benchmark v2.2: 4k Preset
LibreOffice : 20 Documents To PDF
R Benchmark 2.5: Overall mean
* ... smaller is better
AIDA64: FP32 Ray-Trace | FPU Julia | CPU SHA3 | CPU Queen | FPU SinJulia | FPU Mandel | CPU AES | CPU ZLib | FP64 Ray-Trace | CPU PhotoWorxx
| Performance rating | |
| Asus ROG Strix Scar 17 G733PY-XS96 | |
| Eurocom Raptor X17 Core i9-14900HX | |
| MSI GE78HX 13VH-070US | |
| MSI Titan 18 HX A14VIG | |
| Average Intel Core i9-14900HX | |
| Eurocom Raptor X17 | |
| Asus TUF Gaming A17 FA707XI-NS94 | |
| AIDA64 / FP32 Ray-Trace | |
| Asus ROG Strix Scar 17 G733PY-XS96 | |
| MSI Titan 18 HX A14VIG | |
| Asus TUF Gaming A17 FA707XI-NS94 | |
| MSI GE78HX 13VH-070US | |
| Eurocom Raptor X17 Core i9-14900HX | |
| Average Intel Core i9-14900HX (13098 - 33474, n=36) | |
| Eurocom Raptor X17 | |
| AIDA64 / FPU Julia | |
| Asus ROG Strix Scar 17 G733PY-XS96 | |
| MSI Titan 18 HX A14VIG | |
| MSI GE78HX 13VH-070US | |
| Eurocom Raptor X17 Core i9-14900HX | |
| Average Intel Core i9-14900HX (67573 - 166040, n=36) | |
| Asus TUF Gaming A17 FA707XI-NS94 | |
| Eurocom Raptor X17 | |
| AIDA64 / CPU SHA3 | |
| Asus ROG Strix Scar 17 G733PY-XS96 | |
| MSI Titan 18 HX A14VIG | |
| Eurocom Raptor X17 Core i9-14900HX | |
| MSI GE78HX 13VH-070US | |
| Average Intel Core i9-14900HX (3589 - 7979, n=36) | |
| Eurocom Raptor X17 | |
| Asus TUF Gaming A17 FA707XI-NS94 | |
| AIDA64 / CPU Queen | |
| Asus ROG Strix Scar 17 G733PY-XS96 | |
| MSI Titan 18 HX A14VIG | |
| Eurocom Raptor X17 Core i9-14900HX | |
| MSI GE78HX 13VH-070US | |
| Average Intel Core i9-14900HX (118405 - 148966, n=36) | |
| Eurocom Raptor X17 | |
| Asus TUF Gaming A17 FA707XI-NS94 | |
| AIDA64 / FPU SinJulia | |
| Asus ROG Strix Scar 17 G733PY-XS96 | |
| MSI Titan 18 HX A14VIG | |
| MSI GE78HX 13VH-070US | |
| Eurocom Raptor X17 Core i9-14900HX | |
| Asus TUF Gaming A17 FA707XI-NS94 | |
| Average Intel Core i9-14900HX (10475 - 18517, n=36) | |
| Eurocom Raptor X17 | |
| AIDA64 / FPU Mandel | |
| Asus ROG Strix Scar 17 G733PY-XS96 | |
| MSI Titan 18 HX A14VIG | |
| MSI GE78HX 13VH-070US | |
| Eurocom Raptor X17 Core i9-14900HX | |
| Asus TUF Gaming A17 FA707XI-NS94 | |
| Average Intel Core i9-14900HX (32543 - 83662, n=36) | |
| Eurocom Raptor X17 | |
| AIDA64 / CPU AES | |
| Eurocom Raptor X17 Core i9-14900HX | |
| Asus ROG Strix Scar 17 G733PY-XS96 | |
| Average Intel Core i9-14900HX (86964 - 241777, n=36) | |
| MSI Titan 18 HX A14VIG | |
| MSI GE78HX 13VH-070US | |
| Eurocom Raptor X17 | |
| Asus TUF Gaming A17 FA707XI-NS94 | |
| AIDA64 / CPU ZLib | |
| Asus ROG Strix Scar 17 G733PY-XS96 | |
| MSI Titan 18 HX A14VIG | |
| MSI GE78HX 13VH-070US | |
| Eurocom Raptor X17 Core i9-14900HX | |
| Eurocom Raptor X17 | |
| Average Intel Core i9-14900HX (1054 - 2292, n=36) | |
| Asus TUF Gaming A17 FA707XI-NS94 | |
| AIDA64 / FP64 Ray-Trace | |
| Asus ROG Strix Scar 17 G733PY-XS96 | |
| MSI Titan 18 HX A14VIG | |
| Asus TUF Gaming A17 FA707XI-NS94 | |
| MSI GE78HX 13VH-070US | |
| Eurocom Raptor X17 Core i9-14900HX | |
| Average Intel Core i9-14900HX (6809 - 18349, n=36) | |
| Eurocom Raptor X17 | |
| AIDA64 / CPU PhotoWorxx | |
| Eurocom Raptor X17 | |
| Eurocom Raptor X17 Core i9-14900HX | |
| MSI GE78HX 13VH-070US | |
| Average Intel Core i9-14900HX (23903 - 54702, n=36) | |
| Asus ROG Strix Scar 17 G733PY-XS96 | |
| MSI Titan 18 HX A14VIG | |
| Asus TUF Gaming A17 FA707XI-NS94 | |
压力测试
这次运行 Prime95 时的核心温度略低,为 91 摄氏度,而去年的机型为 97 摄氏度,表明效率略有提高。
运行 Witcher 3以表示典型的游戏负载,并切换最大风扇模式和关闭模式,结果显示两者之间没有重大性能差异。这些结果补充了下文 GPU 性能部分中Fire Strike 的结果。无论屏幕负载如何,启用 "最大风扇 "模式只是让风扇以最大转速运行,实际上并没有提高风扇的最大上限。因此,两种模式下游戏时的风扇噪音是相同的。
游戏时 GPU 板功耗稳定在 169 W,几乎达到 175 W 的目标最大值。降至娱乐模式后,显卡功耗降至 148 W,图形性能略有降低。
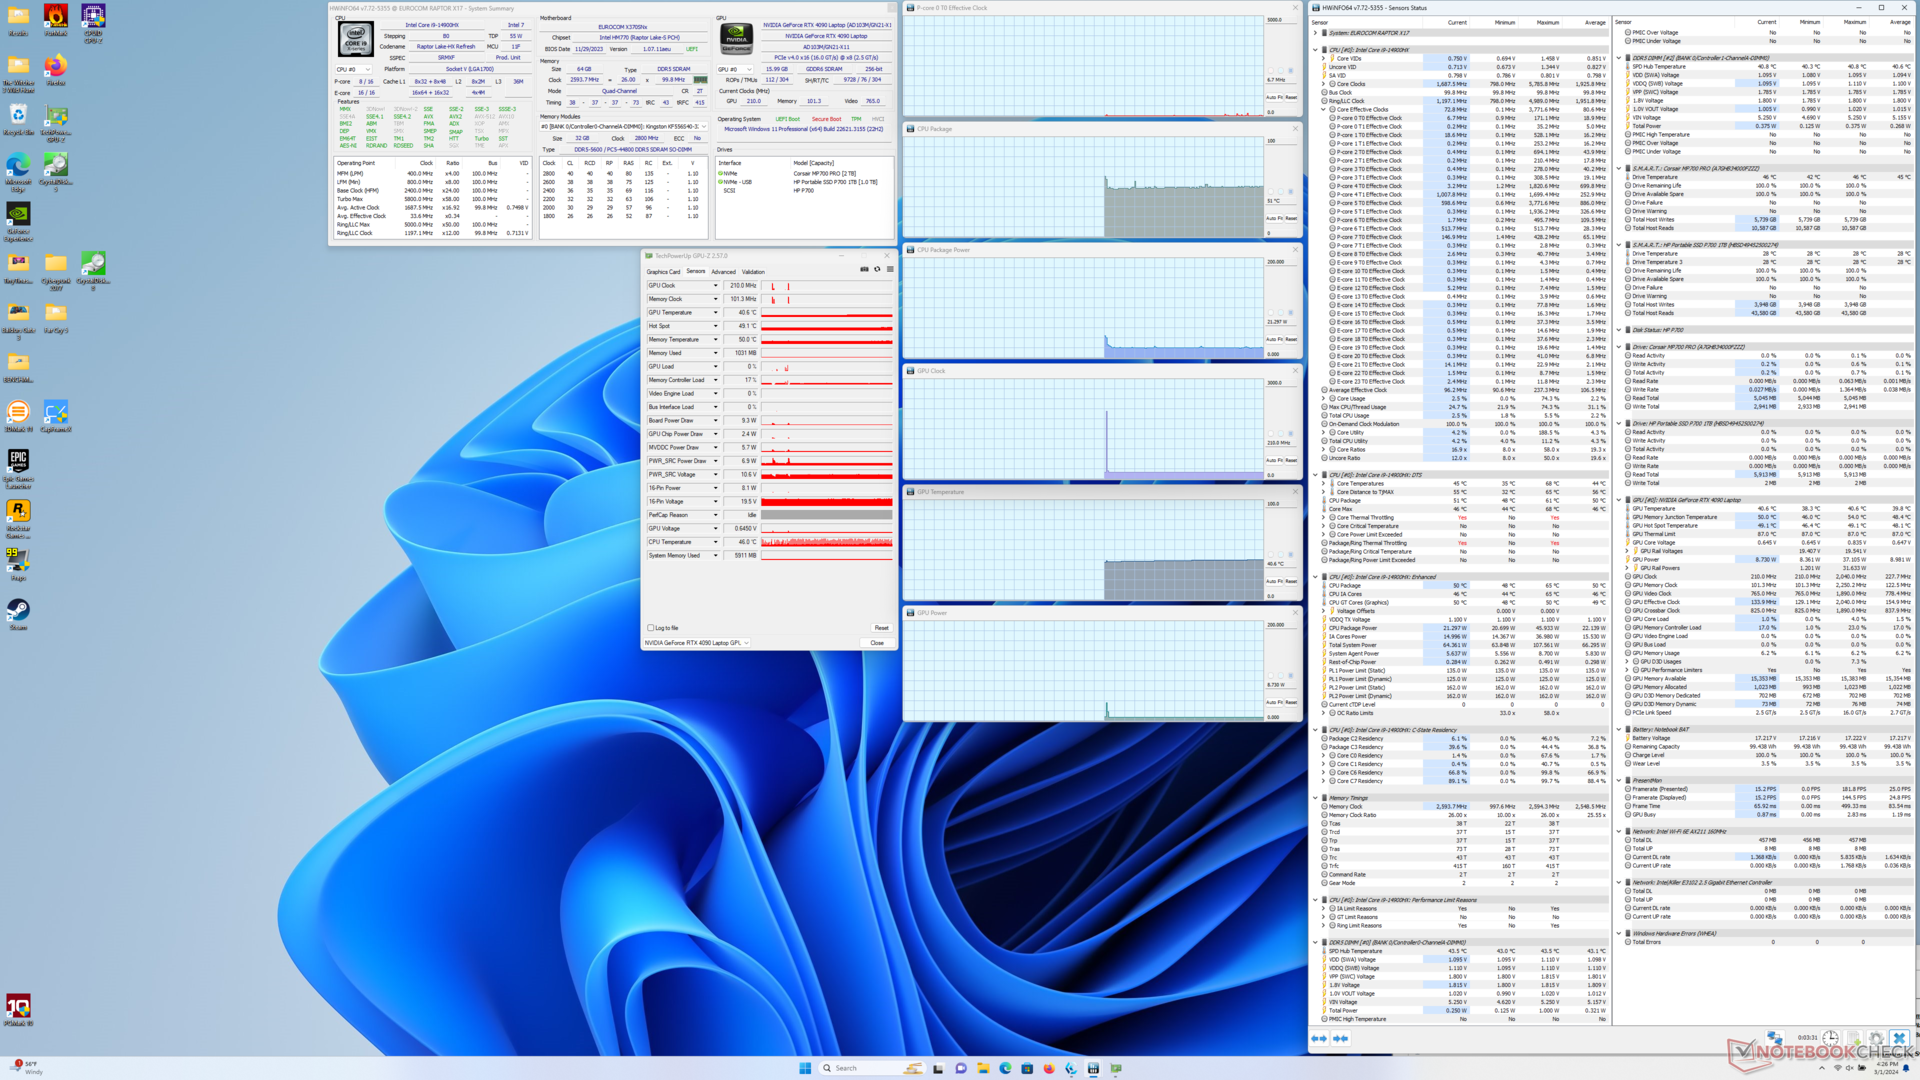
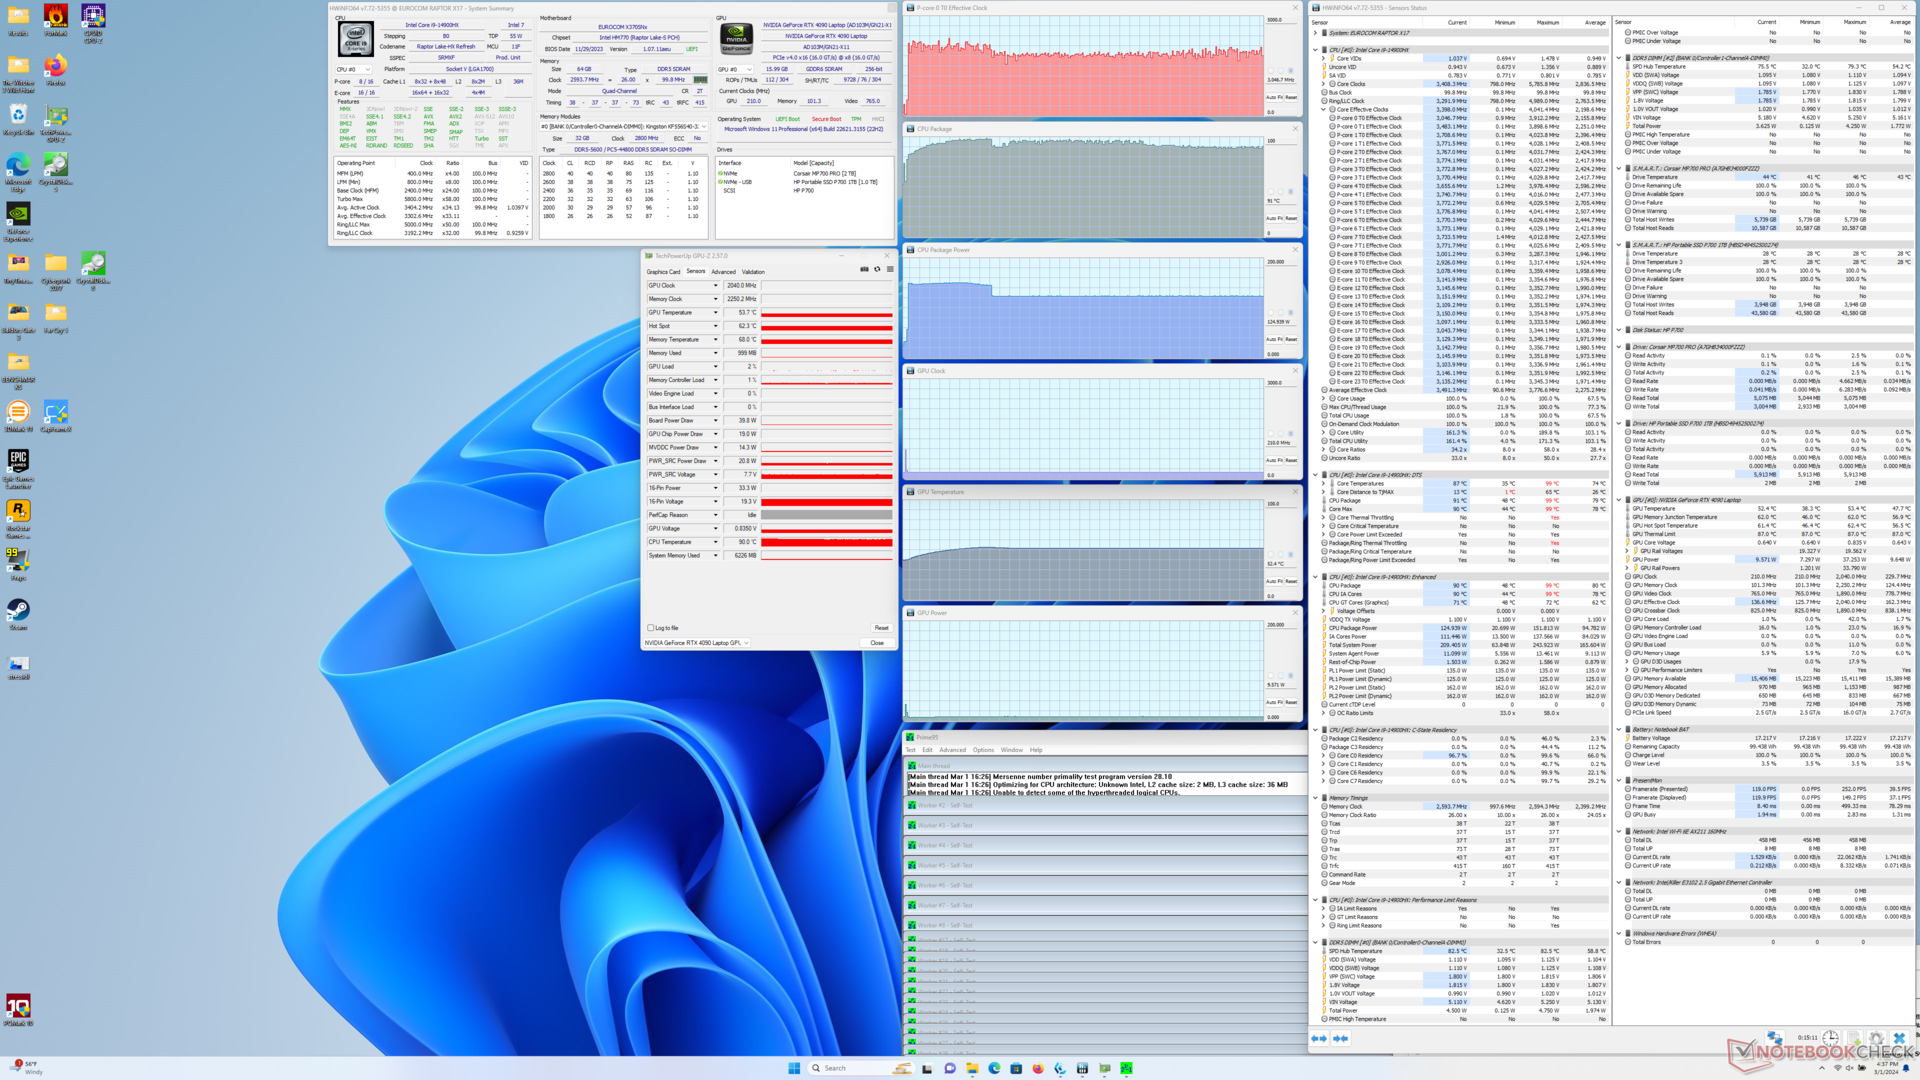
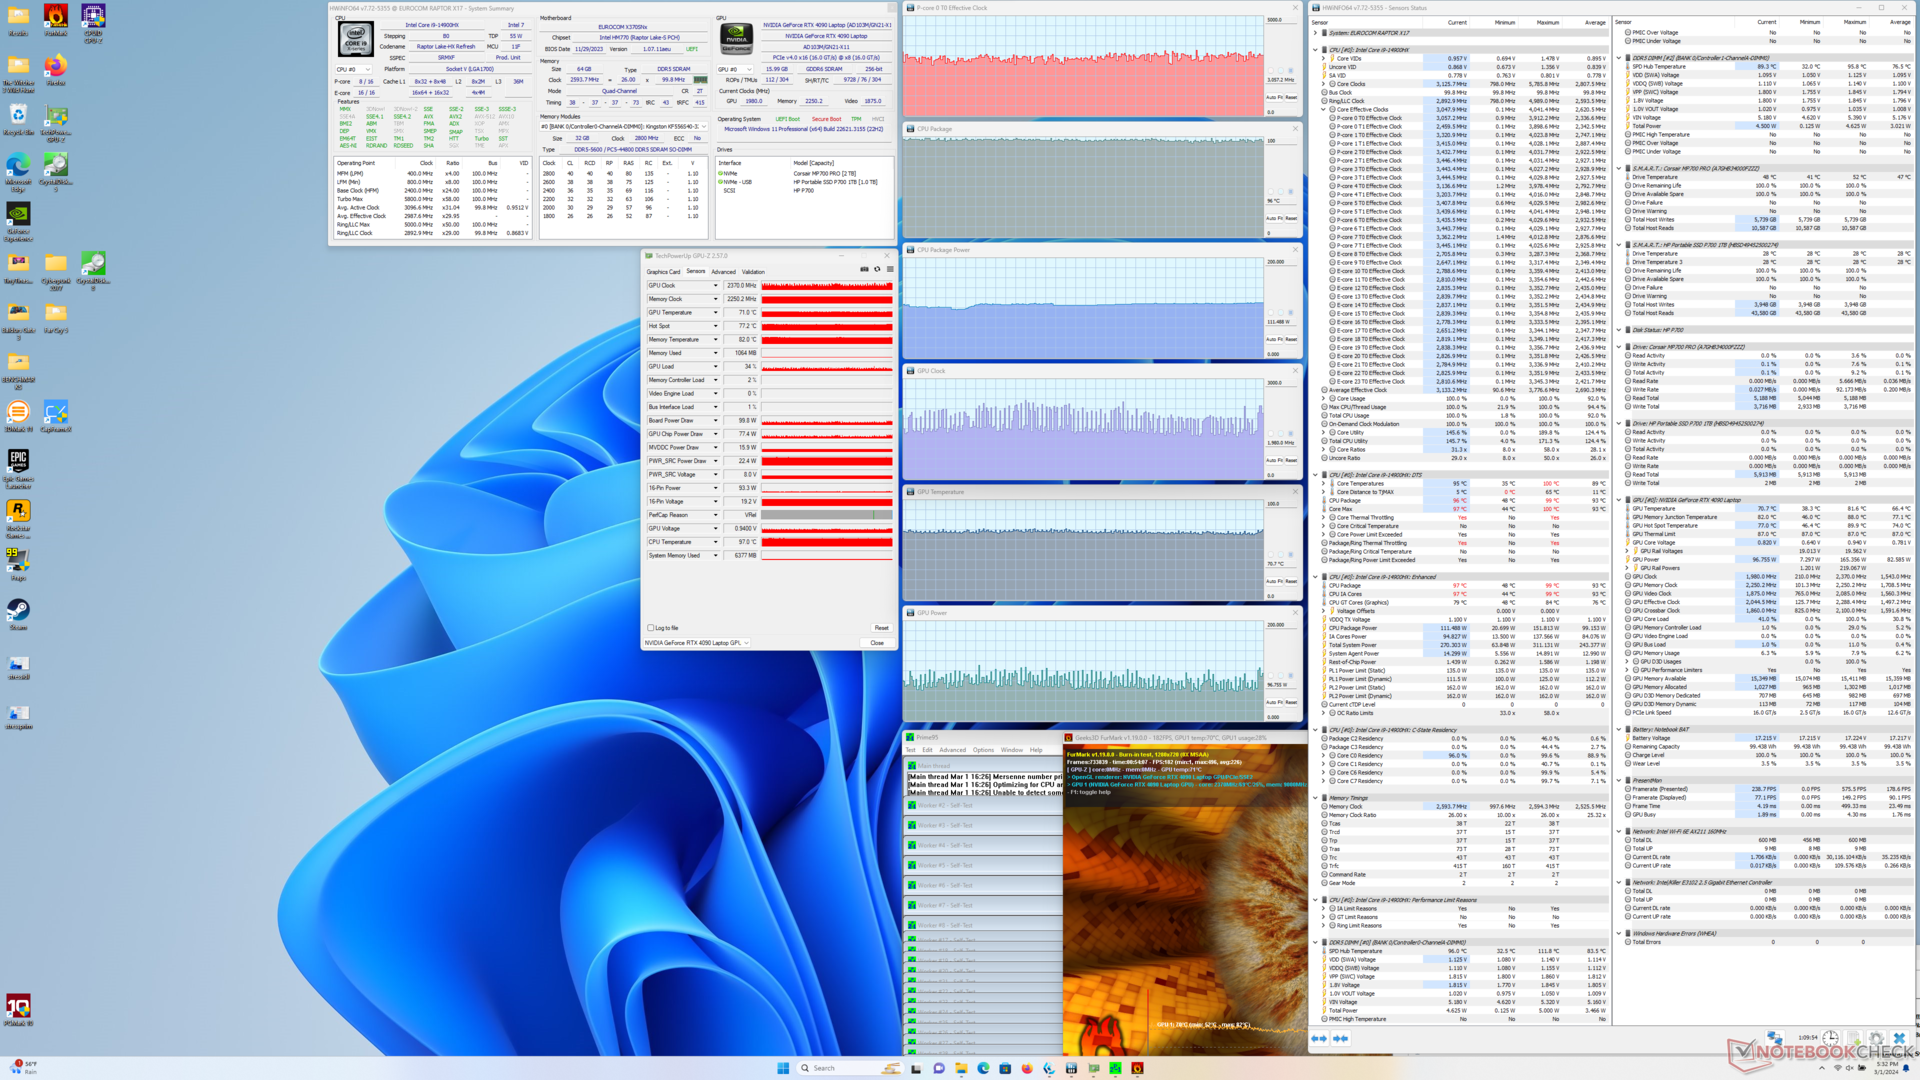
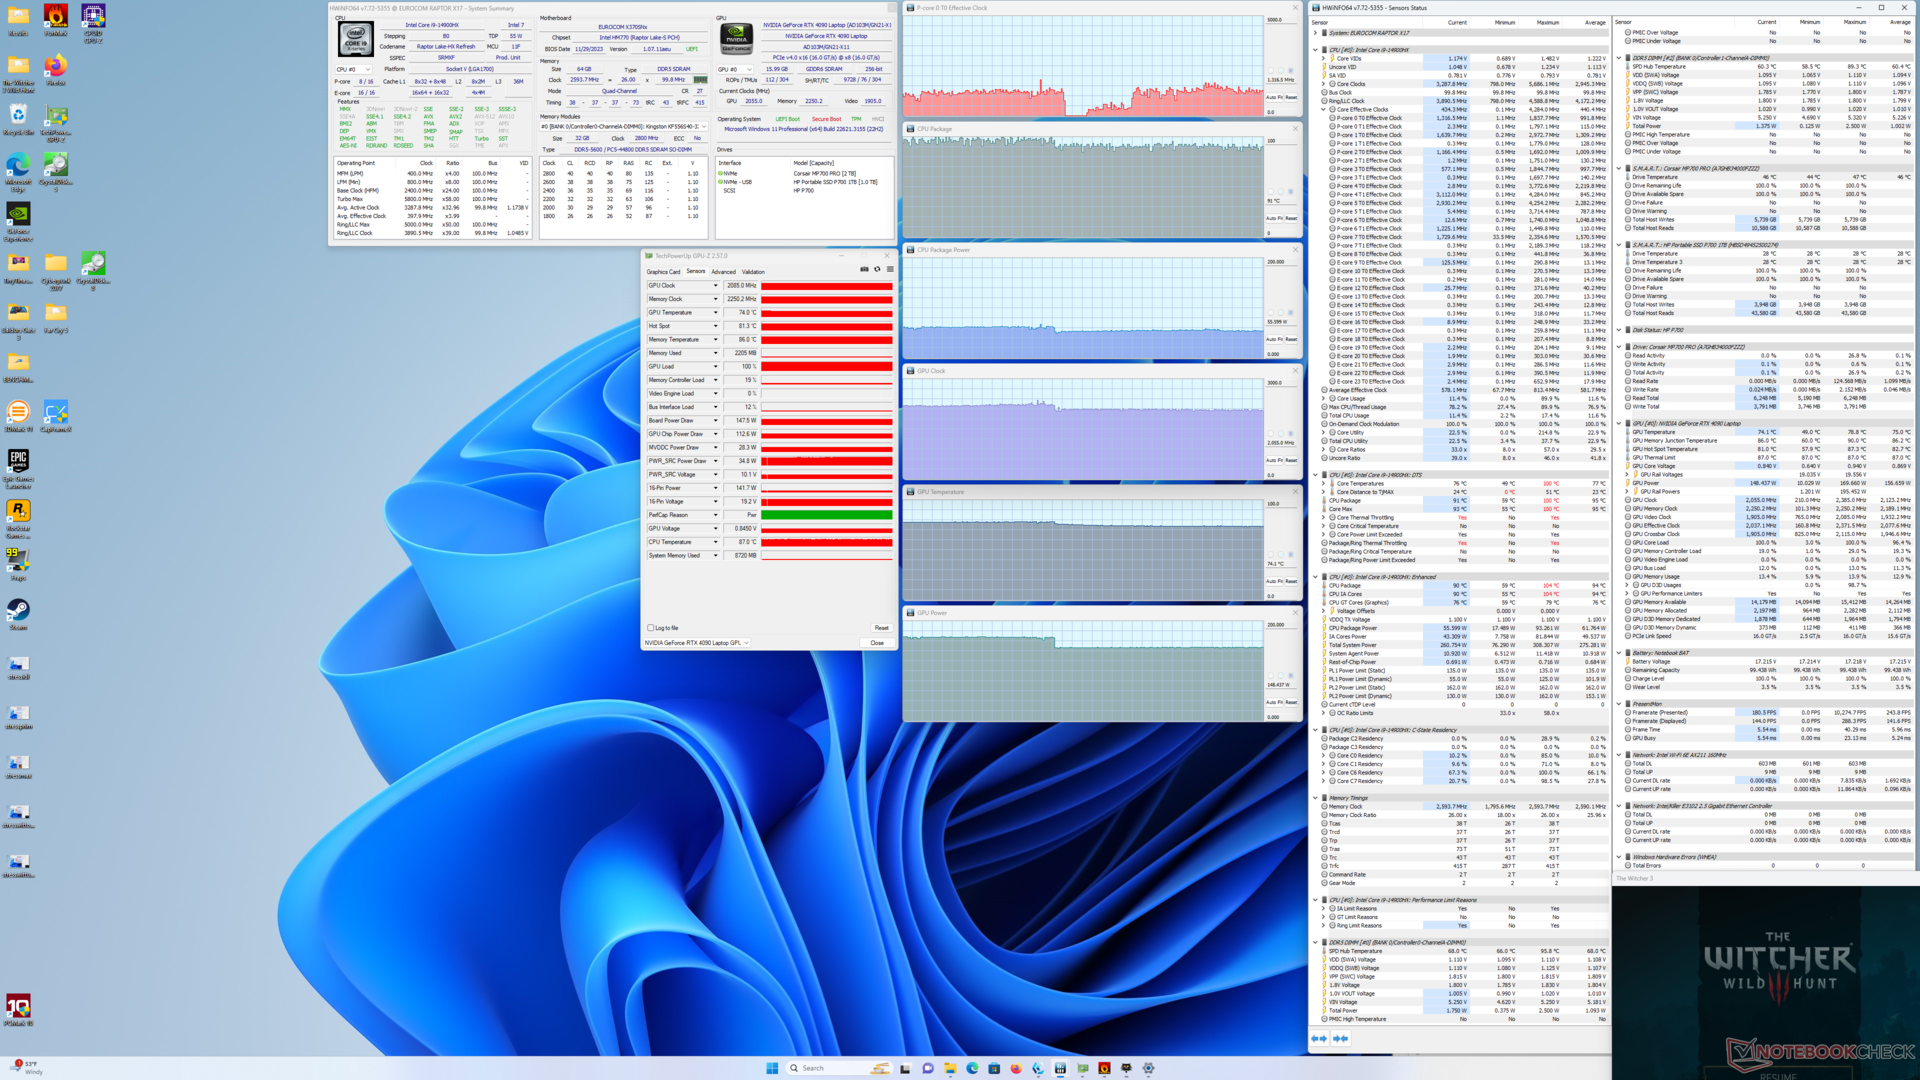

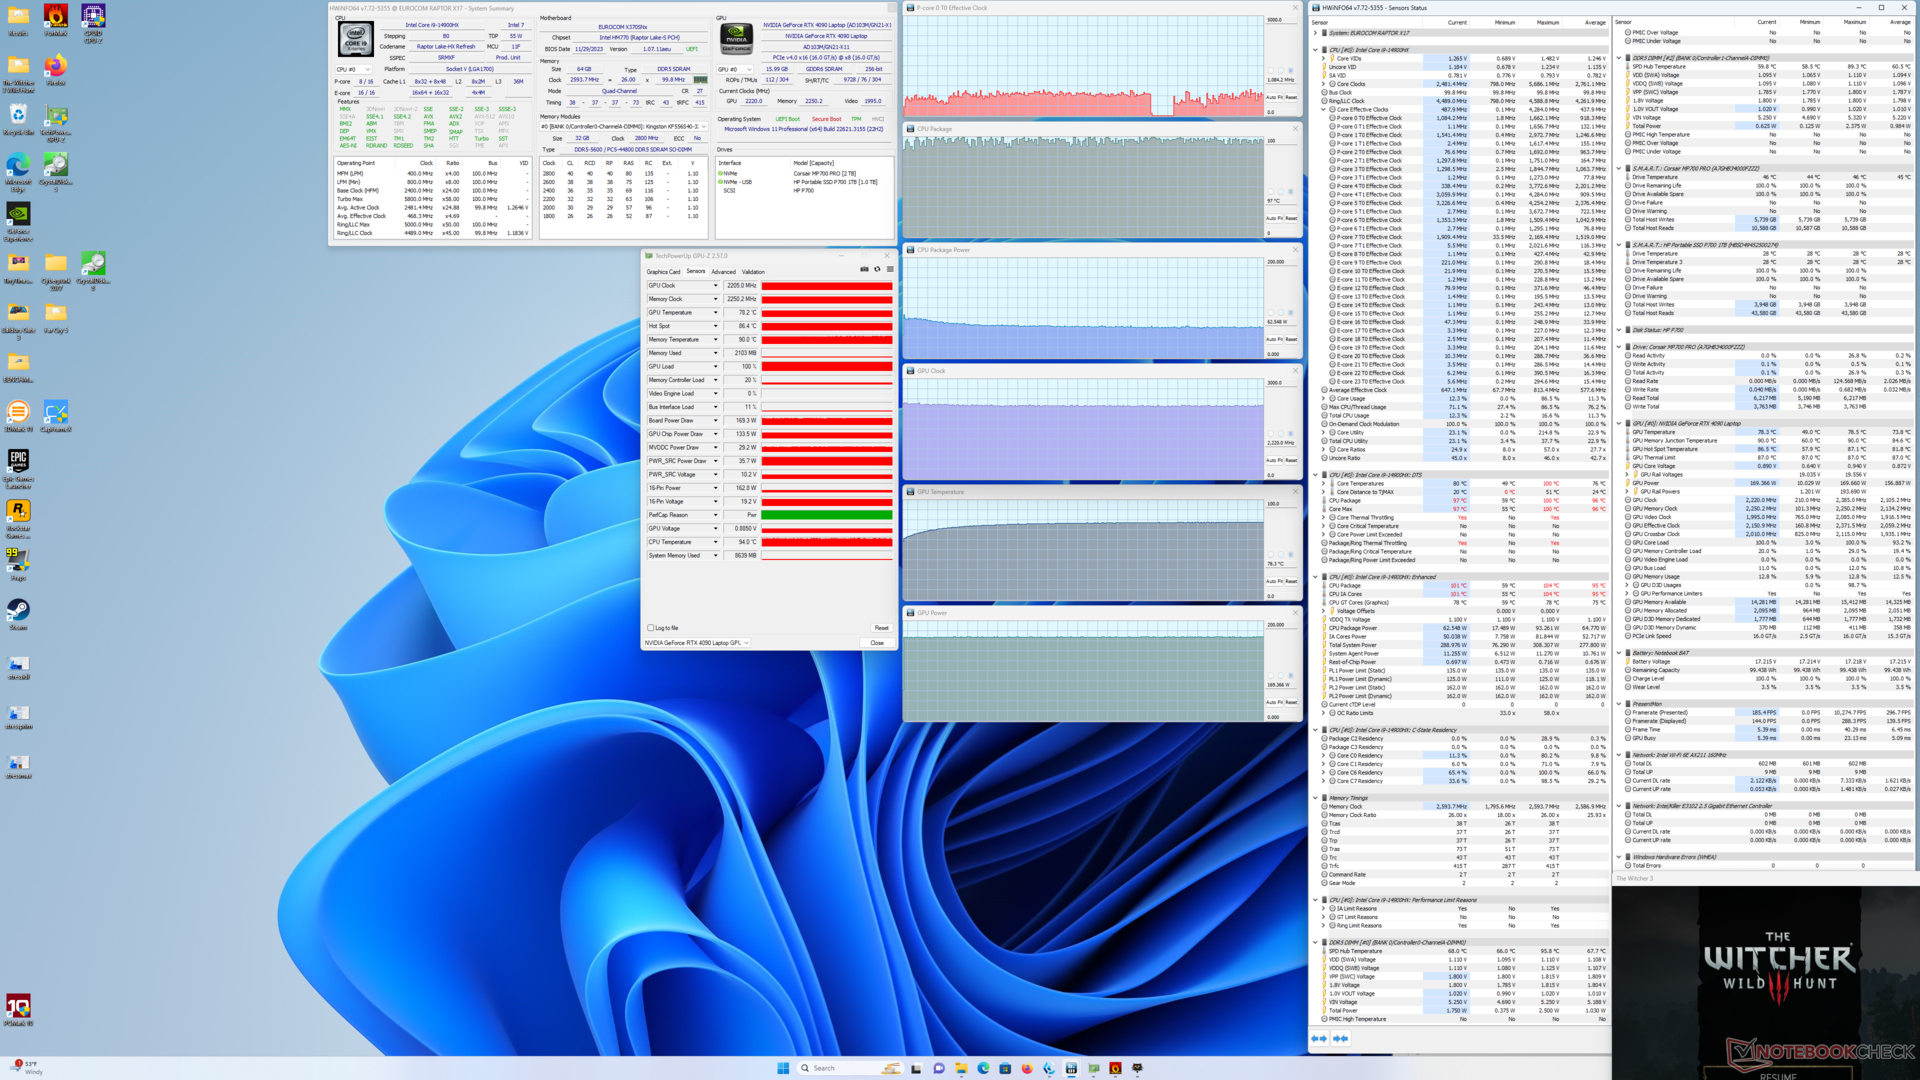
| CPU 时钟 (GHz) | GPU 时钟 (MHz) | CPU 平均温度 (°C) | GPU 平均温度(°C) | |
| 系统闲置 | -- | -- | 51 | 41 |
| Prime95 压力 | 3.1 | -- | 91 | 52 |
| Prime95 + FurMark 压力 | 3.1 | 1000 - 2300 | 96 | 71 |
| Witcher 3 压力(娱乐模式) | ~1.3 | 2085 | 91 | 74 |
| Witcher 3 压力(性能模式,关闭最大风扇) | 1.2 | 2250 | 99 | 78 |
| Witcher 3 压力(性能模式,打开最大风扇) | 1.2 | 2205 | 97 | 78 |
| AIDA64 / Memory Copy | |
| MSI GE78HX 13VH-070US | |
| Eurocom Raptor X17 | |
| Eurocom Raptor X17 Core i9-14900HX | |
| Average Intel Core i9-14900HX (38028 - 83392, n=36) | |
| Asus TUF Gaming A17 FA707XI-NS94 | |
| MSI Titan 18 HX A14VIG | |
| Asus ROG Strix Scar 17 G733PY-XS96 | |
| AIDA64 / Memory Read | |
| MSI GE78HX 13VH-070US | |
| Average Intel Core i9-14900HX (43306 - 87568, n=36) | |
| Eurocom Raptor X17 | |
| Eurocom Raptor X17 Core i9-14900HX | |
| Asus TUF Gaming A17 FA707XI-NS94 | |
| Asus ROG Strix Scar 17 G733PY-XS96 | |
| MSI Titan 18 HX A14VIG | |
| AIDA64 / Memory Write | |
| MSI GE78HX 13VH-070US | |
| Eurocom Raptor X17 Core i9-14900HX | |
| Eurocom Raptor X17 | |
| Asus TUF Gaming A17 FA707XI-NS94 | |
| Average Intel Core i9-14900HX (37146 - 80589, n=36) | |
| Asus ROG Strix Scar 17 G733PY-XS96 | |
| MSI Titan 18 HX A14VIG | |
| AIDA64 / Memory Latency | |
| MSI Titan 18 HX A14VIG | |
| Asus TUF Gaming A17 FA707XI-NS94 | |
| Eurocom Raptor X17 Core i9-14900HX | |
| Average Intel Core i9-14900HX (76.1 - 105, n=36) | |
| MSI GE78HX 13VH-070US | |
| Eurocom Raptor X17 | |
| Asus ROG Strix Scar 17 G733PY-XS96 | |
* ... smaller is better
DPC 延迟
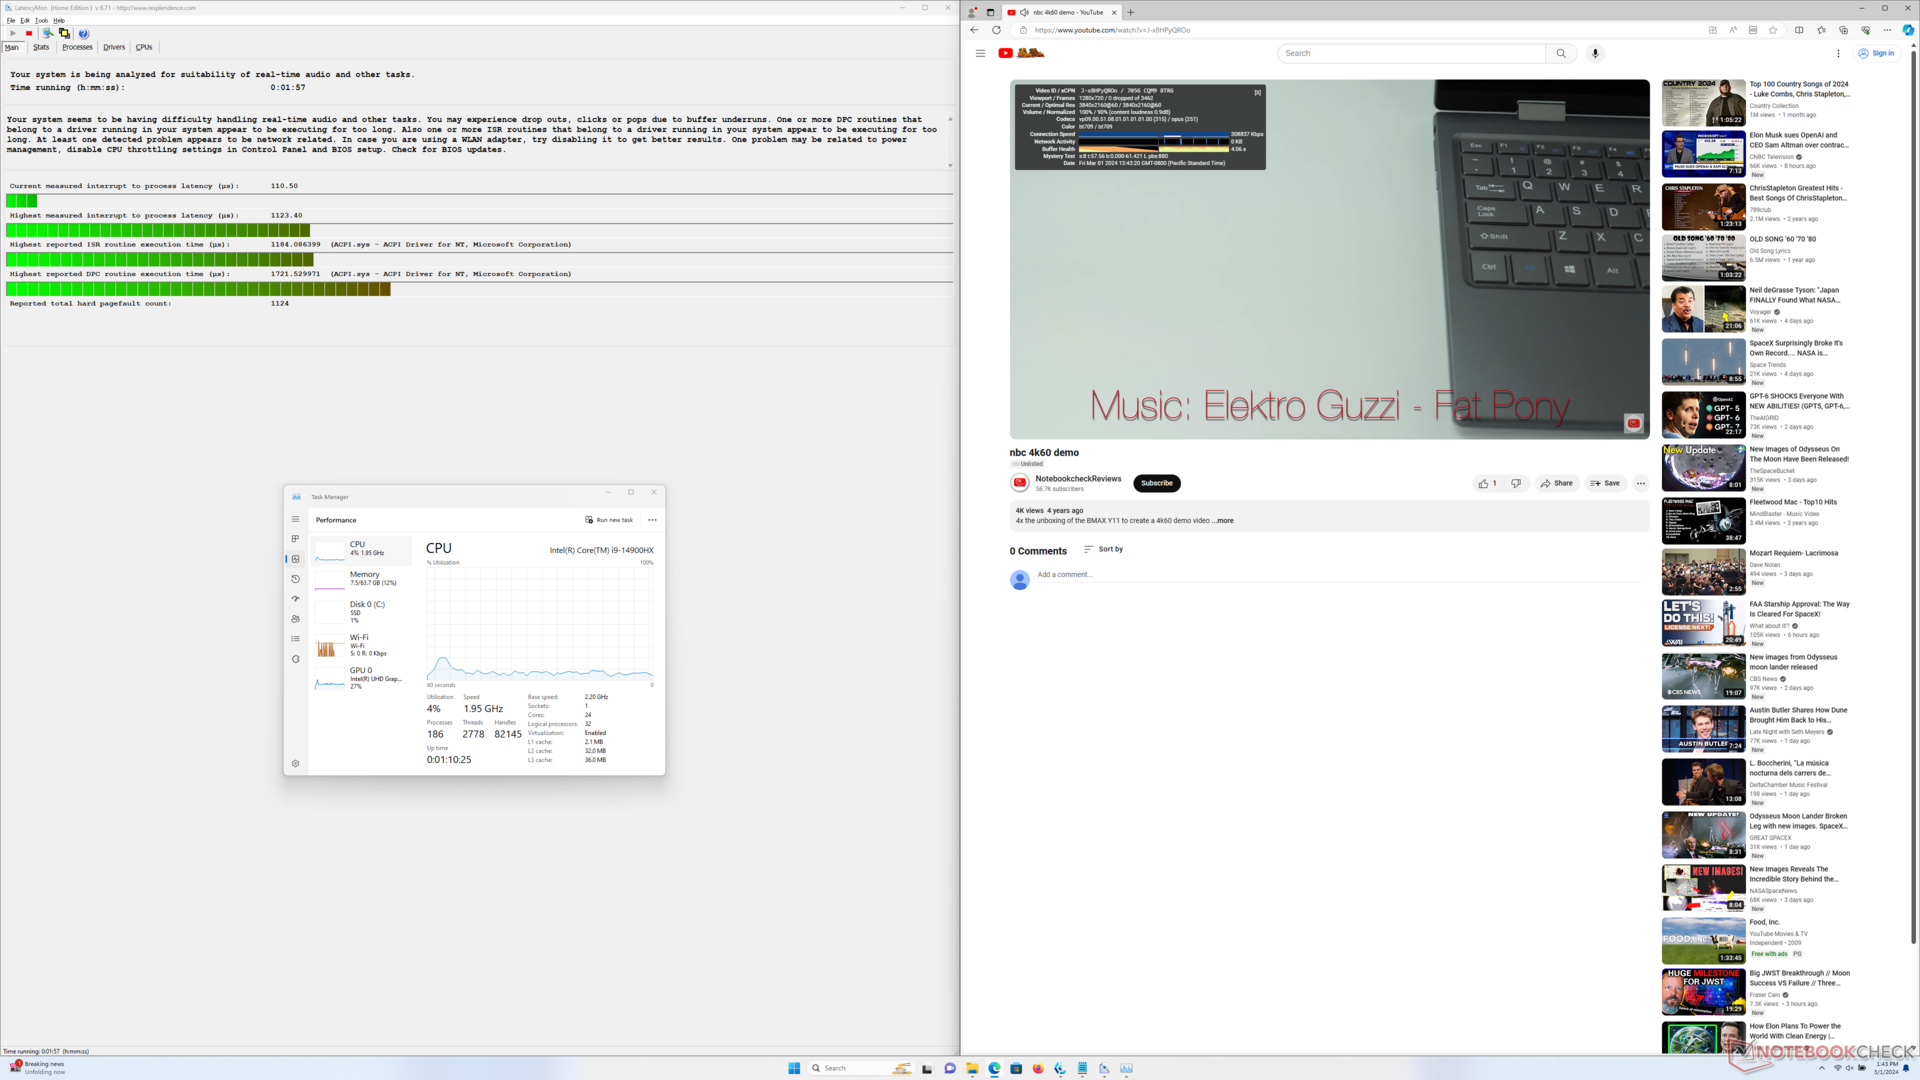
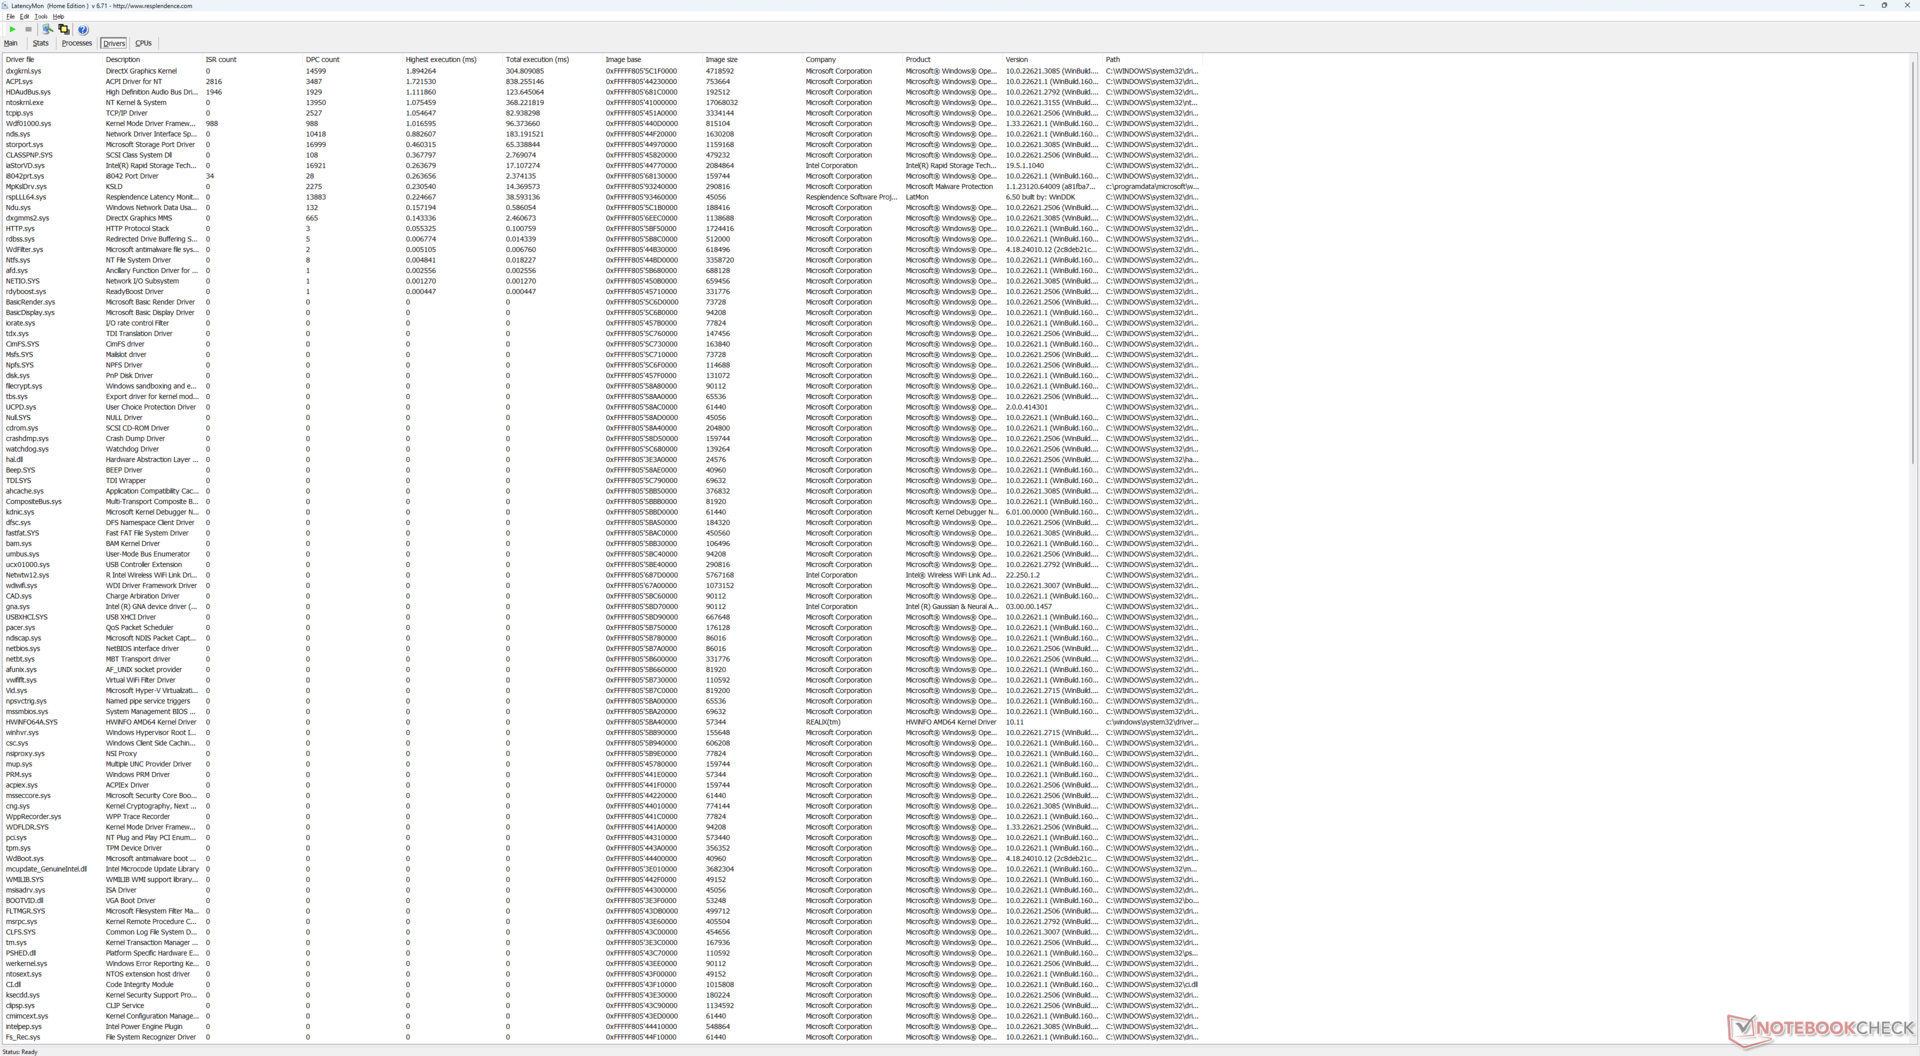
| DPC Latencies / LatencyMon - interrupt to process latency (max), Web, Youtube, Prime95 | |
| MSI GE78HX 13VH-070US | |
| Eurocom Raptor X17 | |
| MSI Titan 18 HX A14VIG | |
| Asus ROG Strix Scar 17 G733PY-XS96 | |
| Asus TUF Gaming A17 FA707XI-NS94 | |
| Eurocom Raptor X17 Core i9-14900HX | |
* ... smaller is better
存储设备
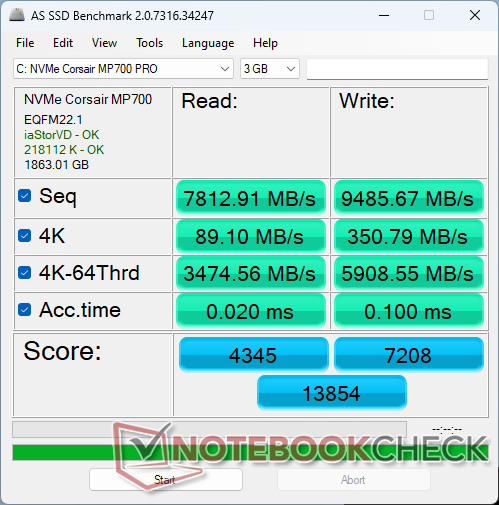
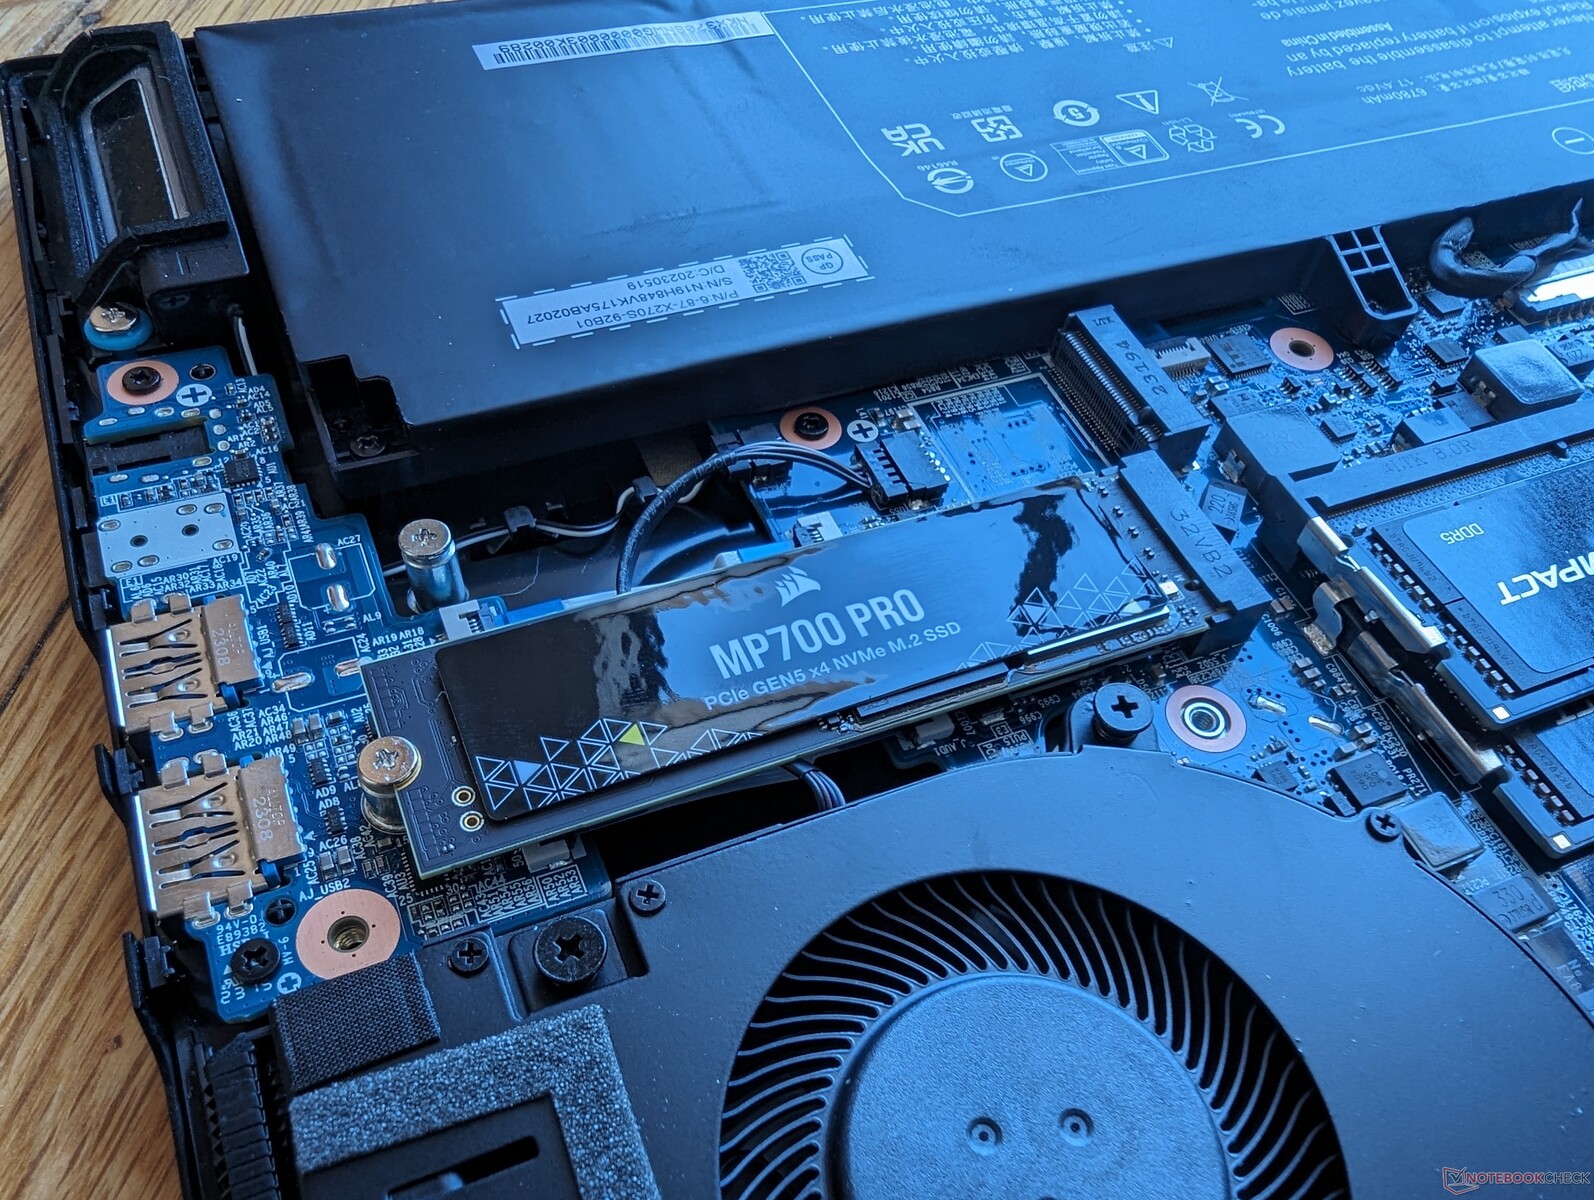
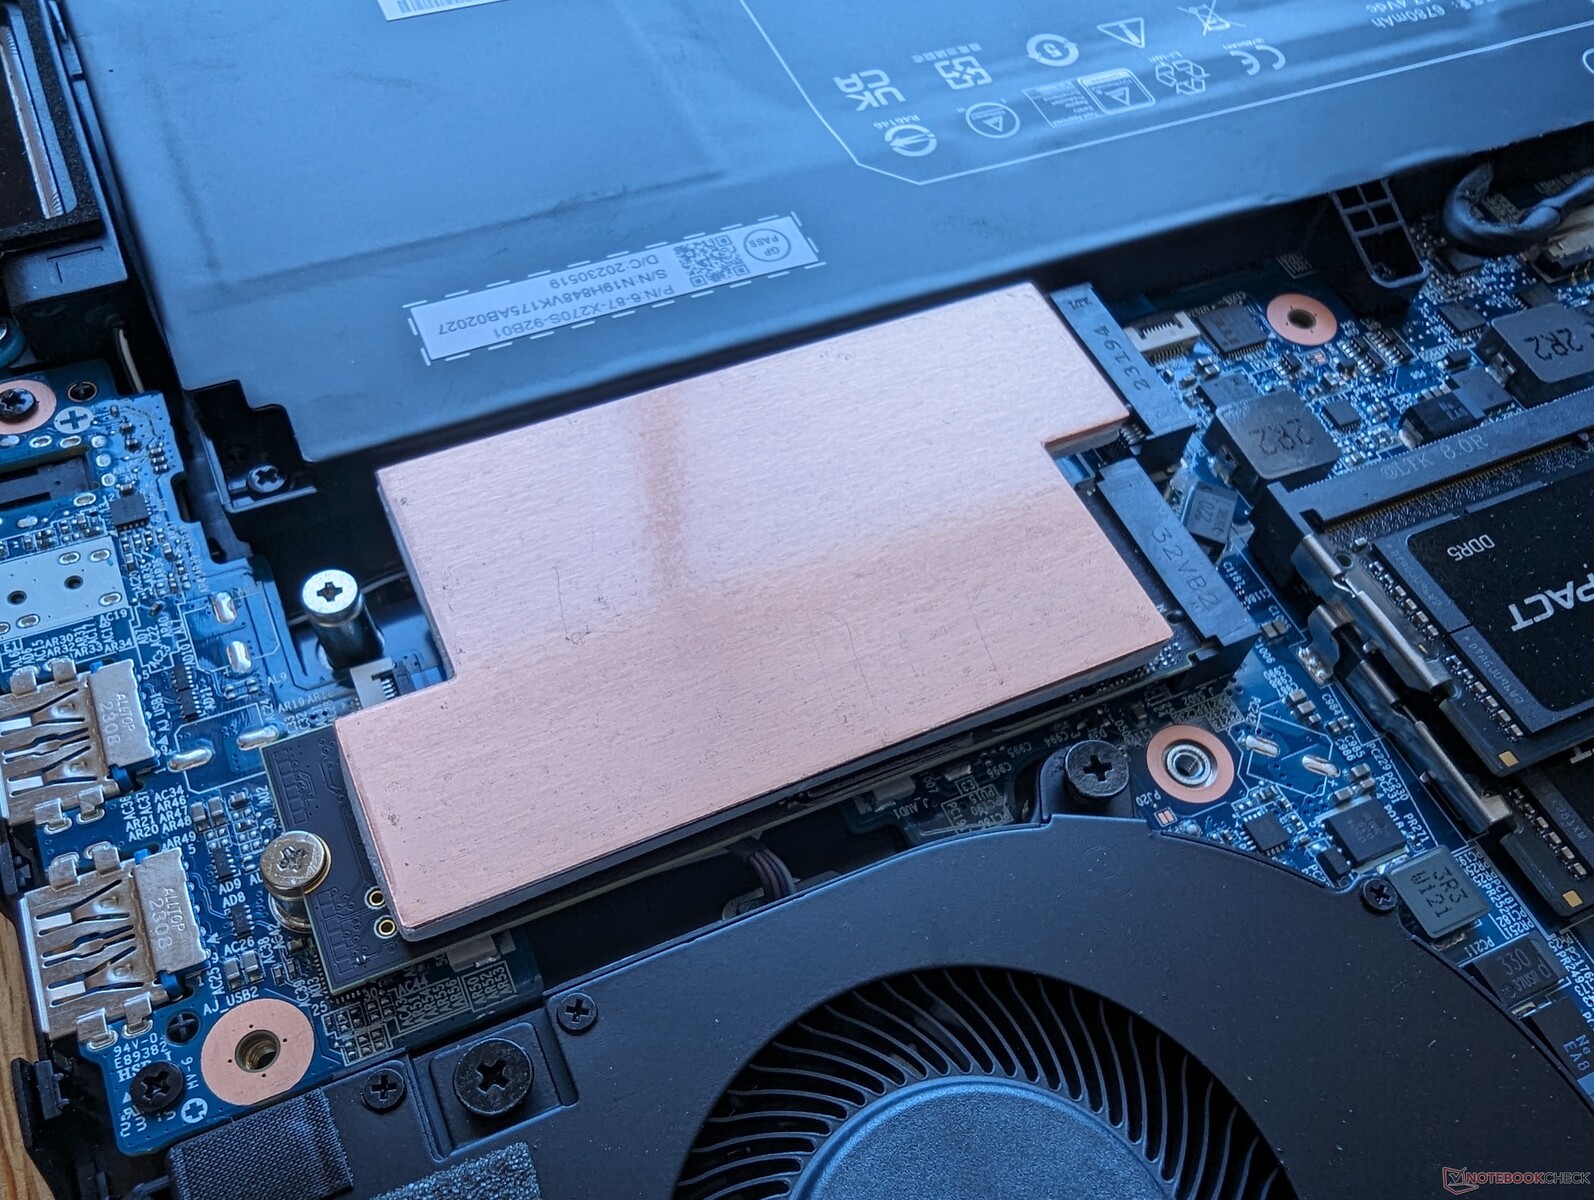
Eurocom 是为数不多的配置了 Corsair MP700 ProPCI5 x4 NVMe SSD 的连续读取速率高达 13000 MB/s,几乎是最快 PCIe4 硬盘的 2 倍。不过,为了维持如此高的传输速率,需要使用散热器。下面的 DiskSpd 循环结果显示了安装和未安装散热器时的性能差异。如果不安装散热片,最大传输速率只能在最初的一分钟左右达到,然后会节流到 3500 MB/s 至 6500 MB/s 的范围。安装散热器后,硬盘运行速度更快,运行时间更长。
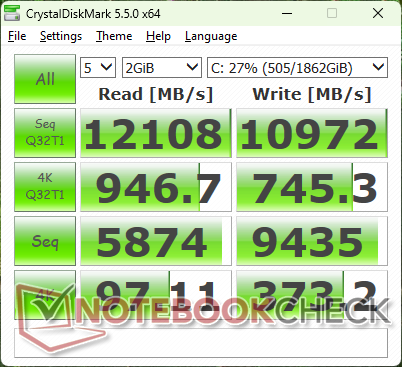

| Drive Performance rating - Percent | |
| Eurocom Raptor X17 Core i9-14900HX | |
| Eurocom Raptor X17 | |
| MSI GE78HX 13VH-070US | |
| MSI Titan 18 HX A14VIG | |
| Asus ROG Strix Scar 17 G733PY-XS96 | |
| Asus TUF Gaming A17 FA707XI-NS94 | |
* ... smaller is better
Disk Throttling: DiskSpd Read Loop, Queue Depth 8
图形处理器性能
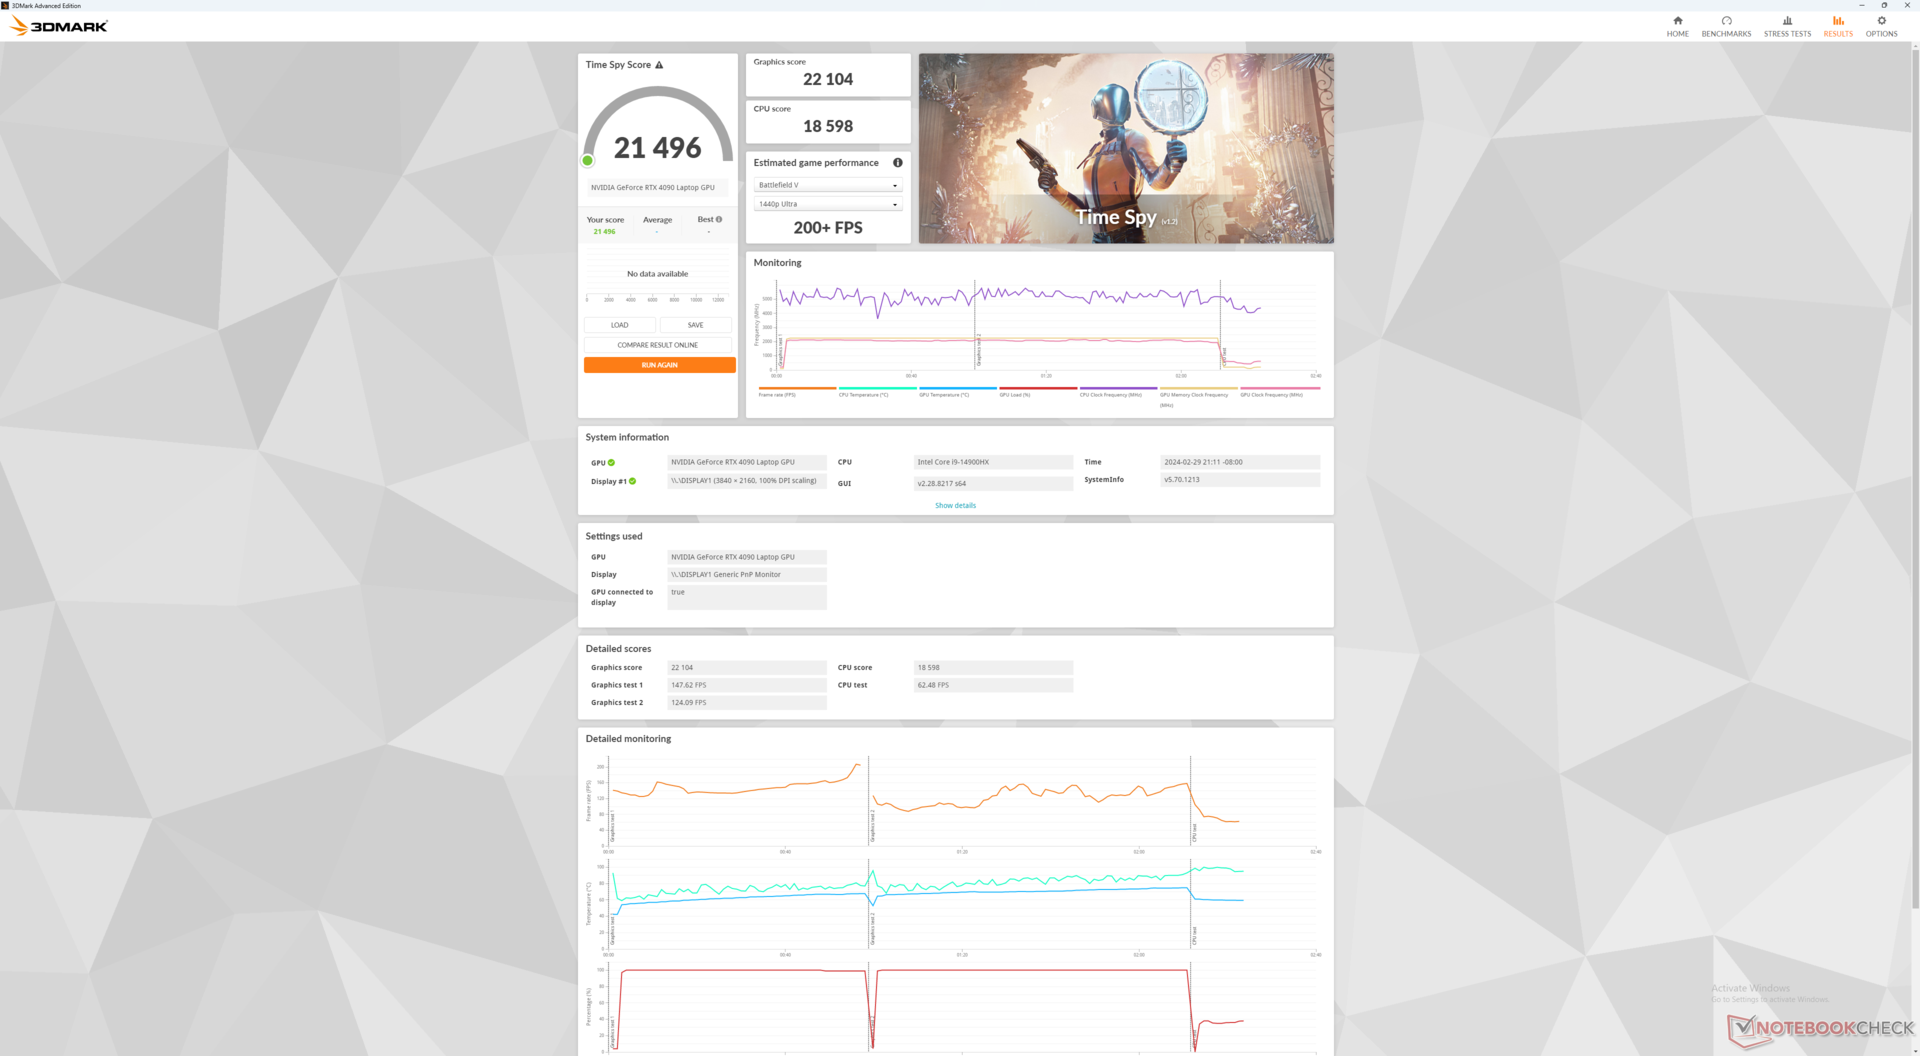
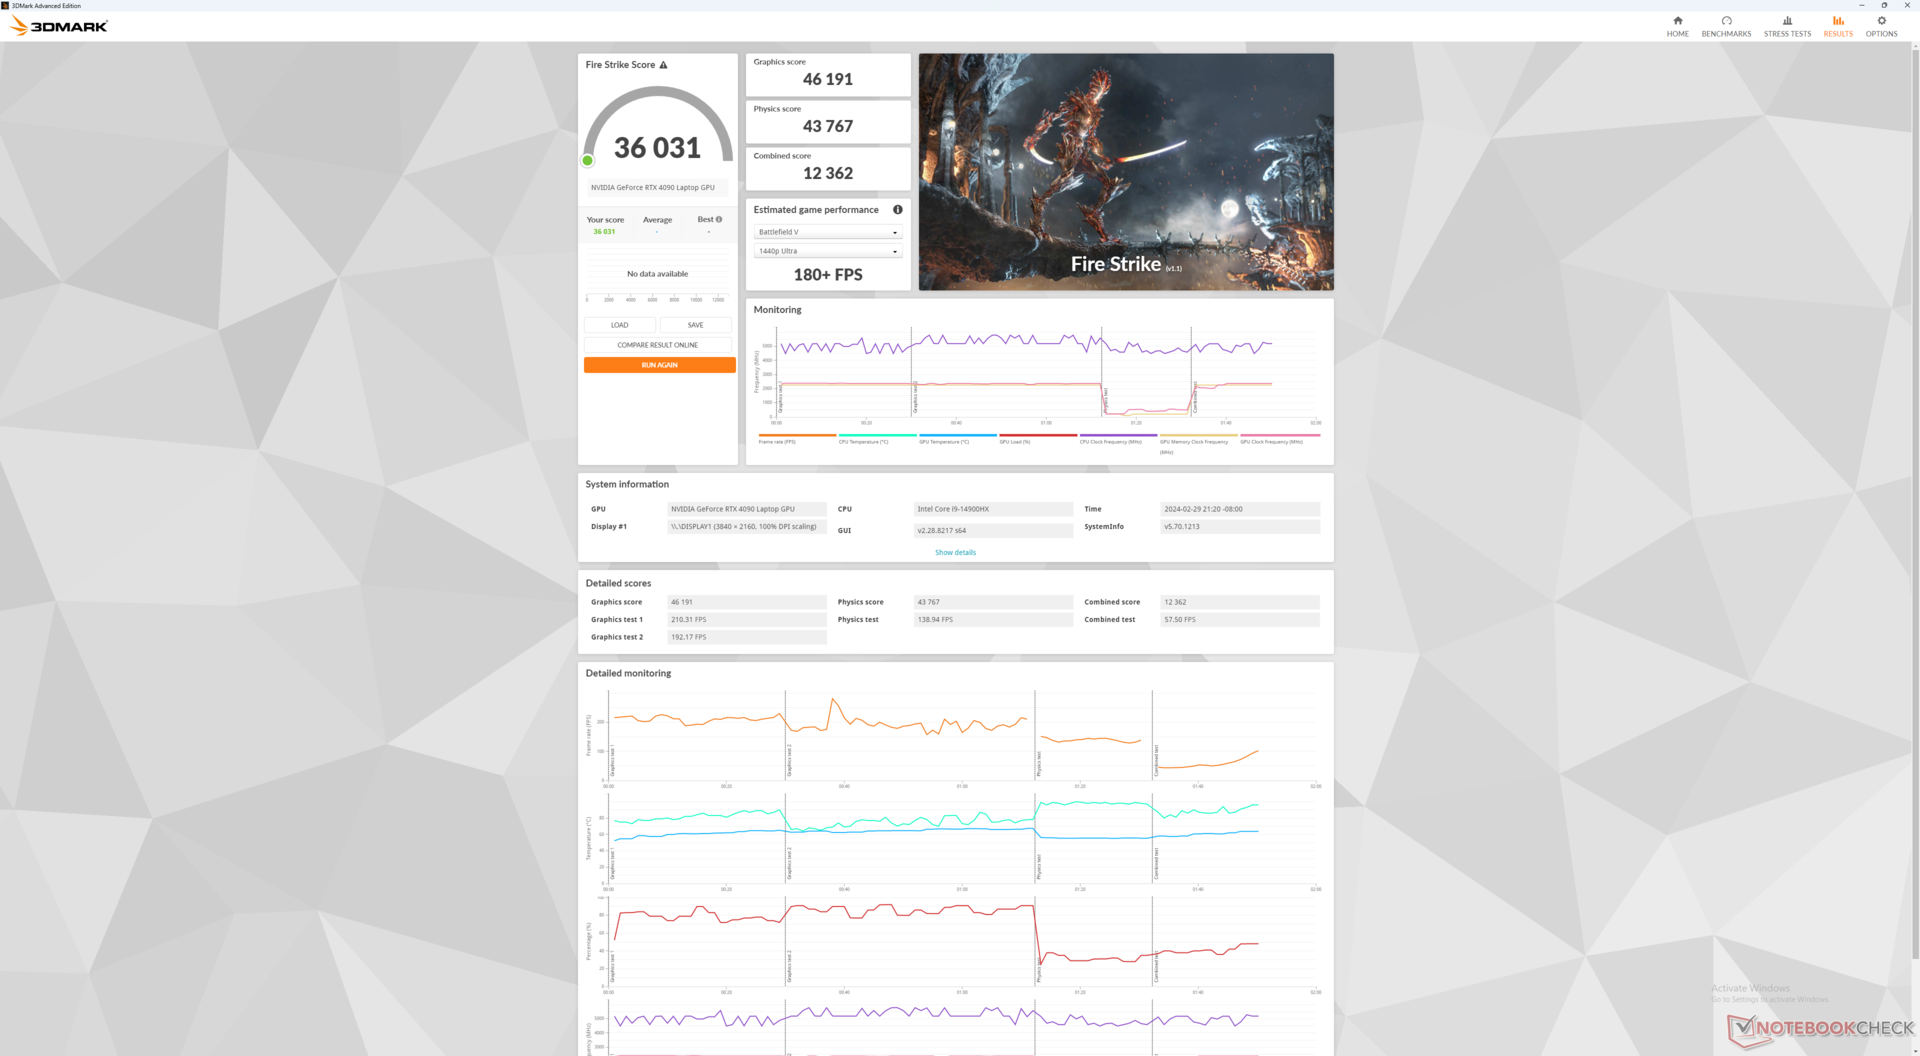
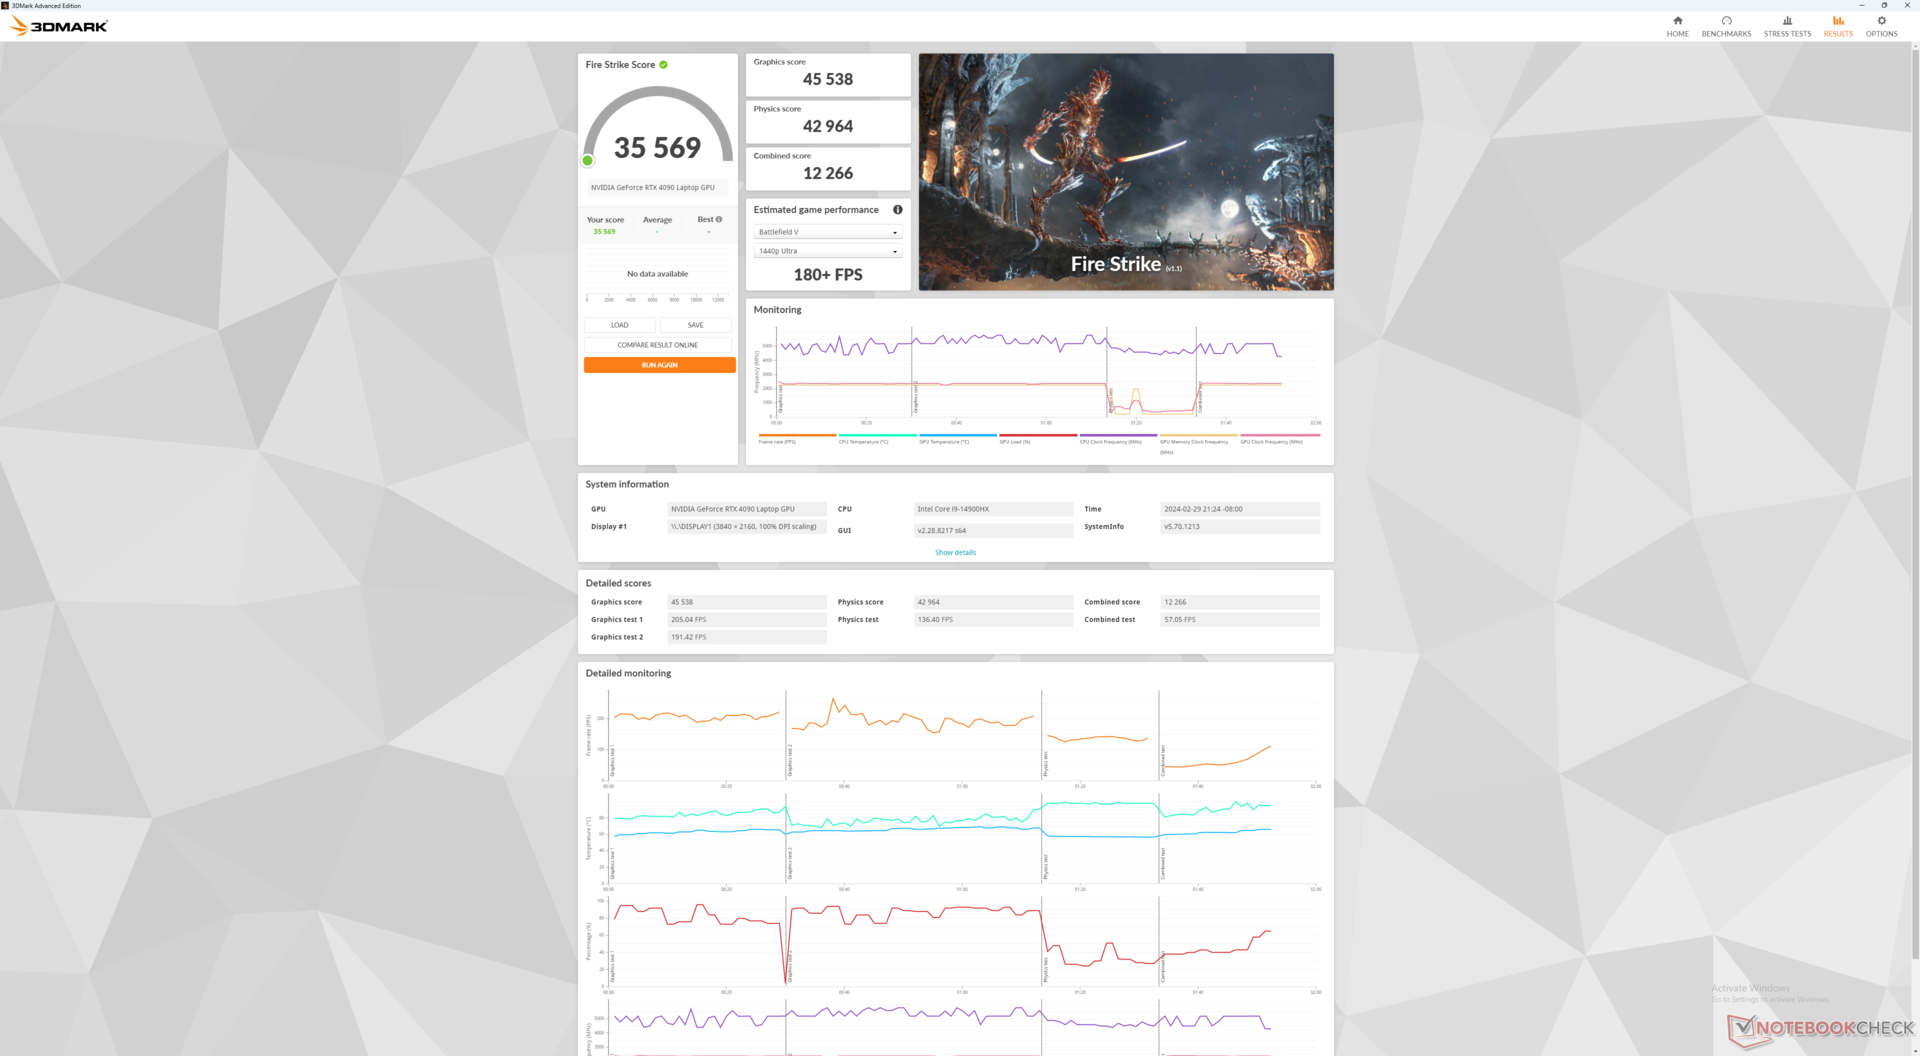
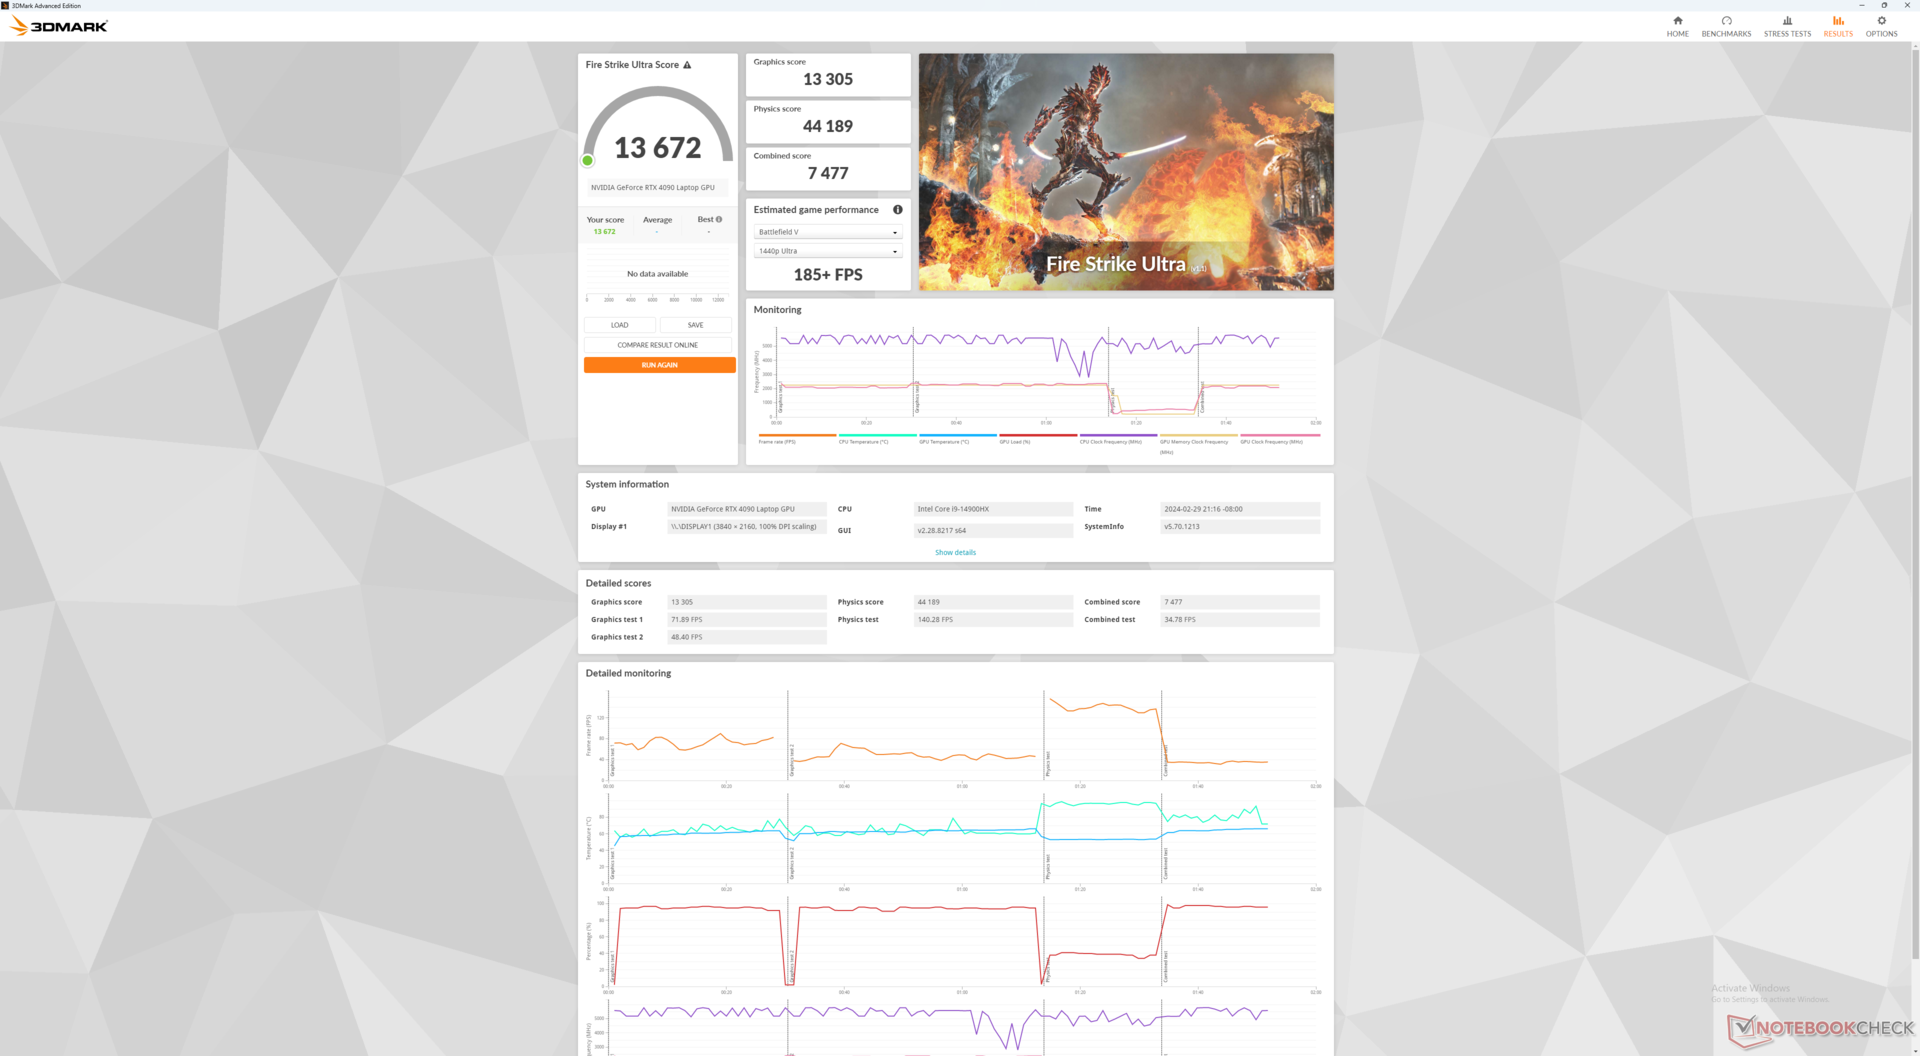
我们的 175 W GeForce RTX 4090GPU 的速度比我们去年在 Raptor X17 上记录的速度快 5%。它或多或少可以与 微星泰坦 18 HX相比。
请注意,启用最大风扇模式并不能明显提高性能,如下表Fire Strike 所示。因此,该模式对于在现有设置下最大限度地提高性能并不重要。不过,降至娱乐模式对性能的影响更大。
| 电源配置文件 | 图形得分 | 物理得分 | 综合得分 |
| 性能模式(最大风扇开启 | 46191 | 43767 | 12362 |
| 性能模式(最大风扇关闭 | 45538 (-1%) | 42964 (-2%) | 12266 (-1%) |
| Windows 平衡模式 | 45892 (-1%) | 42567 (-3%) | 13382 (-0%) |
| 娱乐模式 | 44593 (-4%) | 36839 (-16%) | 9640 (-22%) |
| 电池电量 | 7324 (-84%) | 14932 (-66%) | 1901 (-85%) |
尽管如此,我们还是遇到了几个值得一提的问题。Ubisoft Connect 每次都无法启动,《最终幻想15》在高设置下会崩溃,PCMark 10 即使更新到最新版本也会崩溃。
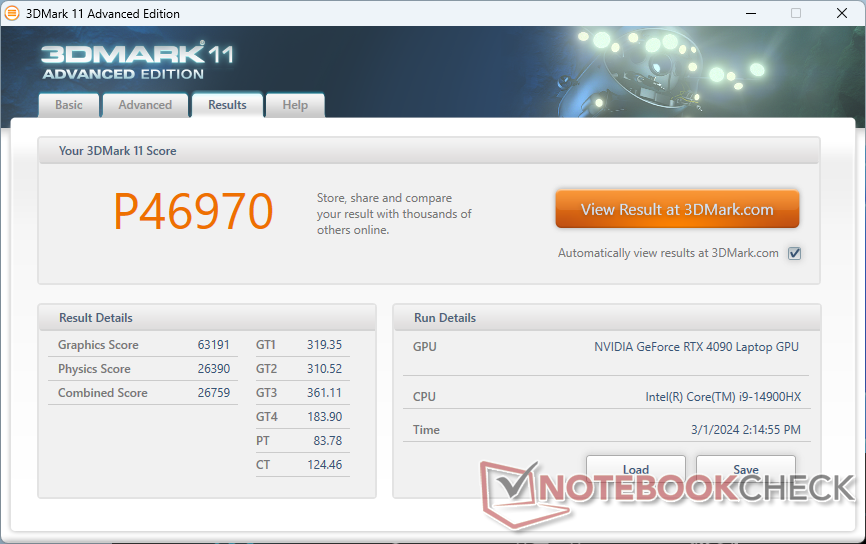
| 3DMark 11 Performance | 46970 points | |
| 3DMark Fire Strike Score | 36031 points | |
| 3DMark Time Spy Score | 21496 points | |
Help | ||
* ... smaller is better
| Performance rating - Percent | |
| Eurocom Raptor X17 Core i9-14900HX -1! | |
| MSI Titan 18 HX A14VIG | |
| Eurocom Raptor X17 | |
| Asus ROG Strix Scar 17 G733PY-XS96 -1! | |
| MSI GE78HX 13VH-070US | |
| Asus TUF Gaming A17 FA707XI-NS94 -1! | |
| The Witcher 3 - 1920x1080 Ultra Graphics & Postprocessing (HBAO+) | |
| MSI Titan 18 HX A14VIG | |
| Eurocom Raptor X17 | |
| Asus ROG Strix Scar 17 G733PY-XS96 | |
| Eurocom Raptor X17 Core i9-14900HX | |
| MSI GE78HX 13VH-070US | |
| Asus TUF Gaming A17 FA707XI-NS94 | |
| GTA V - 1920x1080 Highest AA:4xMSAA + FX AF:16x | |
| Eurocom Raptor X17 Core i9-14900HX | |
| Eurocom Raptor X17 | |
| MSI Titan 18 HX A14VIG | |
| Asus ROG Strix Scar 17 G733PY-XS96 | |
| MSI GE78HX 13VH-070US | |
| Final Fantasy XV Benchmark - 1920x1080 High Quality | |
| MSI Titan 18 HX A14VIG | |
| Eurocom Raptor X17 | |
| Asus ROG Strix Scar 17 G733PY-XS96 | |
| MSI GE78HX 13VH-070US | |
| Asus TUF Gaming A17 FA707XI-NS94 | |
| Strange Brigade - 1920x1080 ultra AA:ultra AF:16 | |
| Eurocom Raptor X17 Core i9-14900HX | |
| MSI Titan 18 HX A14VIG | |
| Eurocom Raptor X17 | |
| MSI GE78HX 13VH-070US | |
| Asus TUF Gaming A17 FA707XI-NS94 | |
| Dota 2 Reborn - 1920x1080 ultra (3/3) best looking | |
| Eurocom Raptor X17 Core i9-14900HX | |
| Eurocom Raptor X17 | |
| MSI Titan 18 HX A14VIG | |
| MSI GE78HX 13VH-070US | |
| Asus ROG Strix Scar 17 G733PY-XS96 | |
| Asus TUF Gaming A17 FA707XI-NS94 | |
| X-Plane 11.11 - 1920x1080 high (fps_test=3) | |
| Eurocom Raptor X17 Core i9-14900HX | |
| Eurocom Raptor X17 | |
| MSI GE78HX 13VH-070US | |
| MSI Titan 18 HX A14VIG | |
| Asus ROG Strix Scar 17 G733PY-XS96 | |
| Asus TUF Gaming A17 FA707XI-NS94 | |
Witcher 3 FPS Chart
| low | med. | high | ultra | QHD | 4K | |
|---|---|---|---|---|---|---|
| GTA V (2015) | 187.6 | 186.9 | 185.8 | 152.2 | 145.7 | 178.8 |
| The Witcher 3 (2015) | 688.1 | 591.6 | 423.9 | 200 | 149.7 | |
| Dota 2 Reborn (2015) | 254 | 224 | 212 | 195.2 | 195 | |
| X-Plane 11.11 (2018) | 221 | 193.1 | 150.2 | 126.7 | ||
| Far Cry 5 (2018) | 222 | 195 | 186 | 174 | 171 | 113 |
| Strange Brigade (2018) | 567 | 459 | 433 | 402 | 309 | 156.8 |
| F1 22 (2022) | 360 | 331 | 116.3 | 87.8 | 44.2 | |
| Baldur's Gate 3 (2023) | 244.1 | 217.9 | 203.8 | 200.4 | 148.9 | 75.6 |
| Cyberpunk 2077 (2023) | 195.2 | 185.2 | 164.5 | 144.7 | 93.8 | 41.4 |
排放量
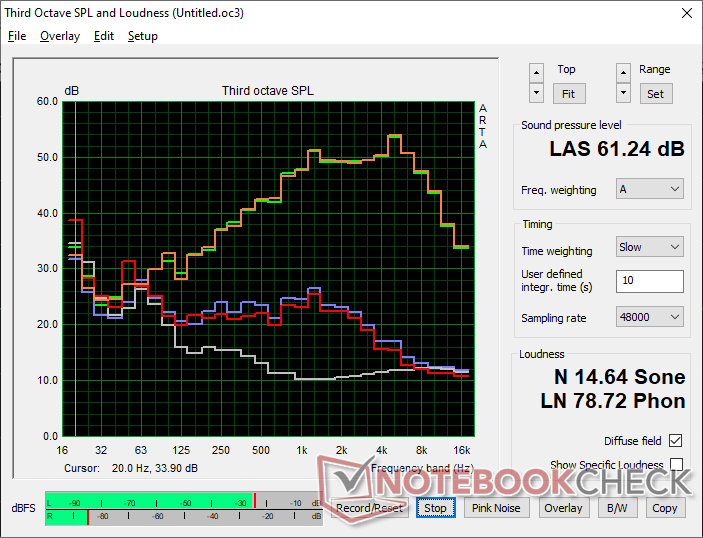
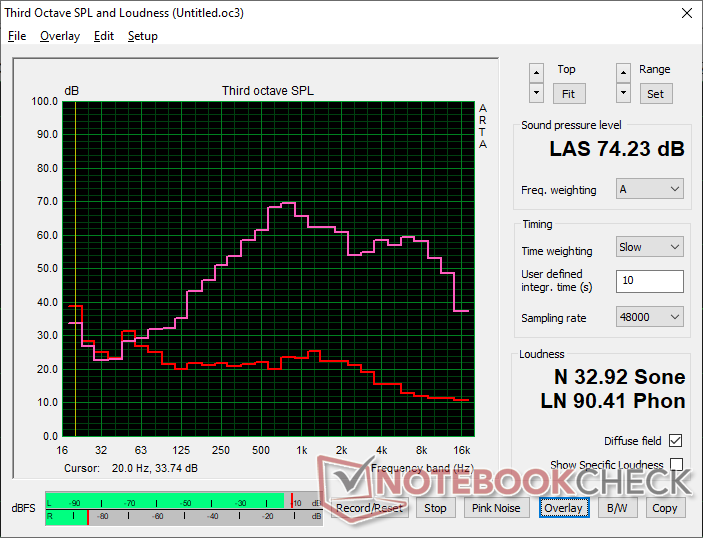
系统噪音 - 比许多其他游戏笔记本电脑都要大
风扇的脉冲频率远不及去年的机型。例如,在启动3DMark 06 时,风扇会在较长时间内保持较低噪音,然后再慢慢升高,而 2023 型号则会飙升到近 60 dB(A)。否则,在运行游戏等高负载时,两款机型的风扇噪音会稳定在差不多的数值上。
娱乐模式下的游戏噪音略低于性能模式下的游戏噪音(58.3 dB(A) vs. 61.4 dB(A))。请记住,如上所述,娱乐模式需要付出性能代价。
Noise level
| Idle |
| 31.7 / 31.7 / 32.9 dB(A) |
| Load |
| 34 / 61.6 dB(A) |
 | ||
30 dB silent 40 dB(A) audible 50 dB(A) loud |
||
min: | ||
| Eurocom Raptor X17 Core i9-14900HX GeForce RTX 4090 Laptop GPU, i9-14900HX, Corsair MP700 Pro 2TB | Eurocom Raptor X17 GeForce RTX 4090 Laptop GPU, i9-13900HX, 3x Samsung SSD 980 Pro 1TB (RAID 0) | Asus TUF Gaming A17 FA707XI-NS94 GeForce RTX 4070 Laptop GPU, R9 7940HS, WD PC SN560 SDDPNQE-1T00 | Asus ROG Strix Scar 17 G733PY-XS96 GeForce RTX 4090 Laptop GPU, R9 7945HX, SK hynix PC801 HFS001TEJ9X101N | MSI GE78HX 13VH-070US GeForce RTX 4080 Laptop GPU, i9-13950HX, Samsung PM9A1 MZVL22T0HBLB | MSI Titan 18 HX A14VIG GeForce RTX 4090 Laptop GPU, i9-14900HX, 2x Samsung PM9A1a MZVL22T0HDLB (RAID 0) | |
|---|---|---|---|---|---|---|
| Noise | -15% | 3% | 14% | 5% | 9% | |
| off / environment * (dB) | 23.7 | 23.3 2% | 27.9 -18% | 22.7 4% | 23.4 1% | 22.8 4% |
| Idle Minimum * (dB) | 31.7 | 33.1 -4% | 28.5 10% | 23.5 26% | 24.2 24% | 23.8 25% |
| Idle Average * (dB) | 31.7 | 33.1 -4% | 29.8 6% | 27.7 13% | 25.6 19% | 23.8 25% |
| Idle Maximum * (dB) | 32.9 | 40.7 -24% | 29.8 9% | 27.7 16% | 31 6% | 28 15% |
| Load Average * (dB) | 34 | 59.9 -76% | 34.8 -2% | 30.5 10% | 43.3 -27% | 38 -12% |
| Witcher 3 ultra * (dB) | 61.6 | 60.8 1% | 57.1 7% | 51.4 17% | 56.3 9% | 57.3 7% |
| Load Maximum * (dB) | 61.6 | 61 1% | 57.3 7% | 54.1 12% | 59.1 4% | 62.8 -2% |
* ... smaller is better
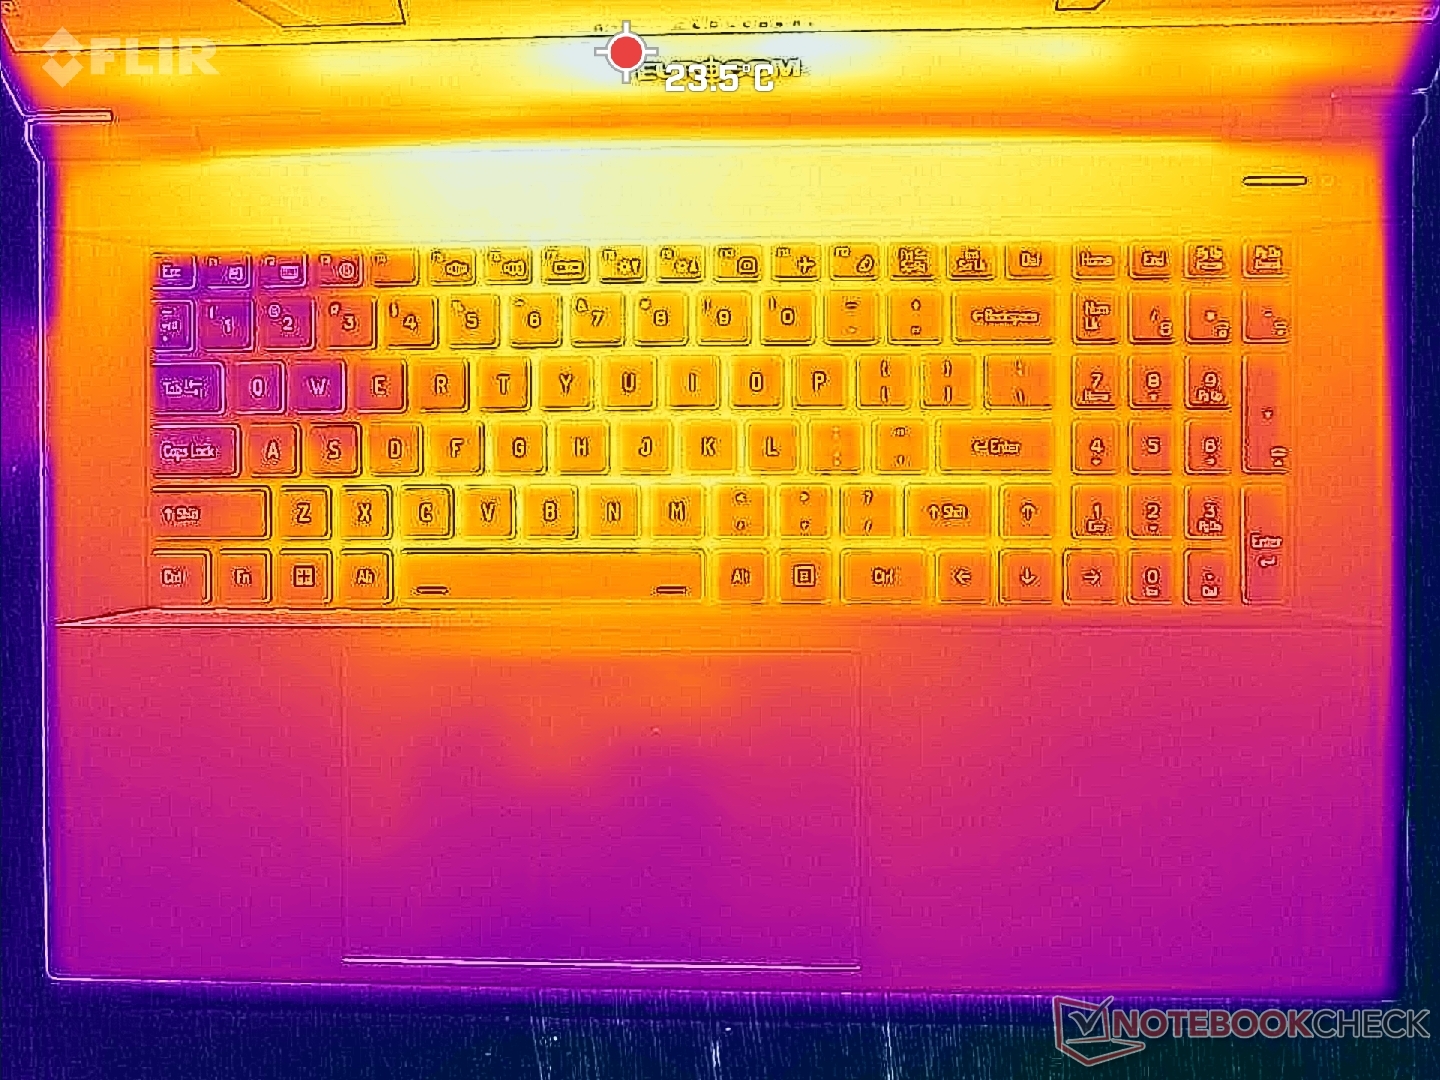
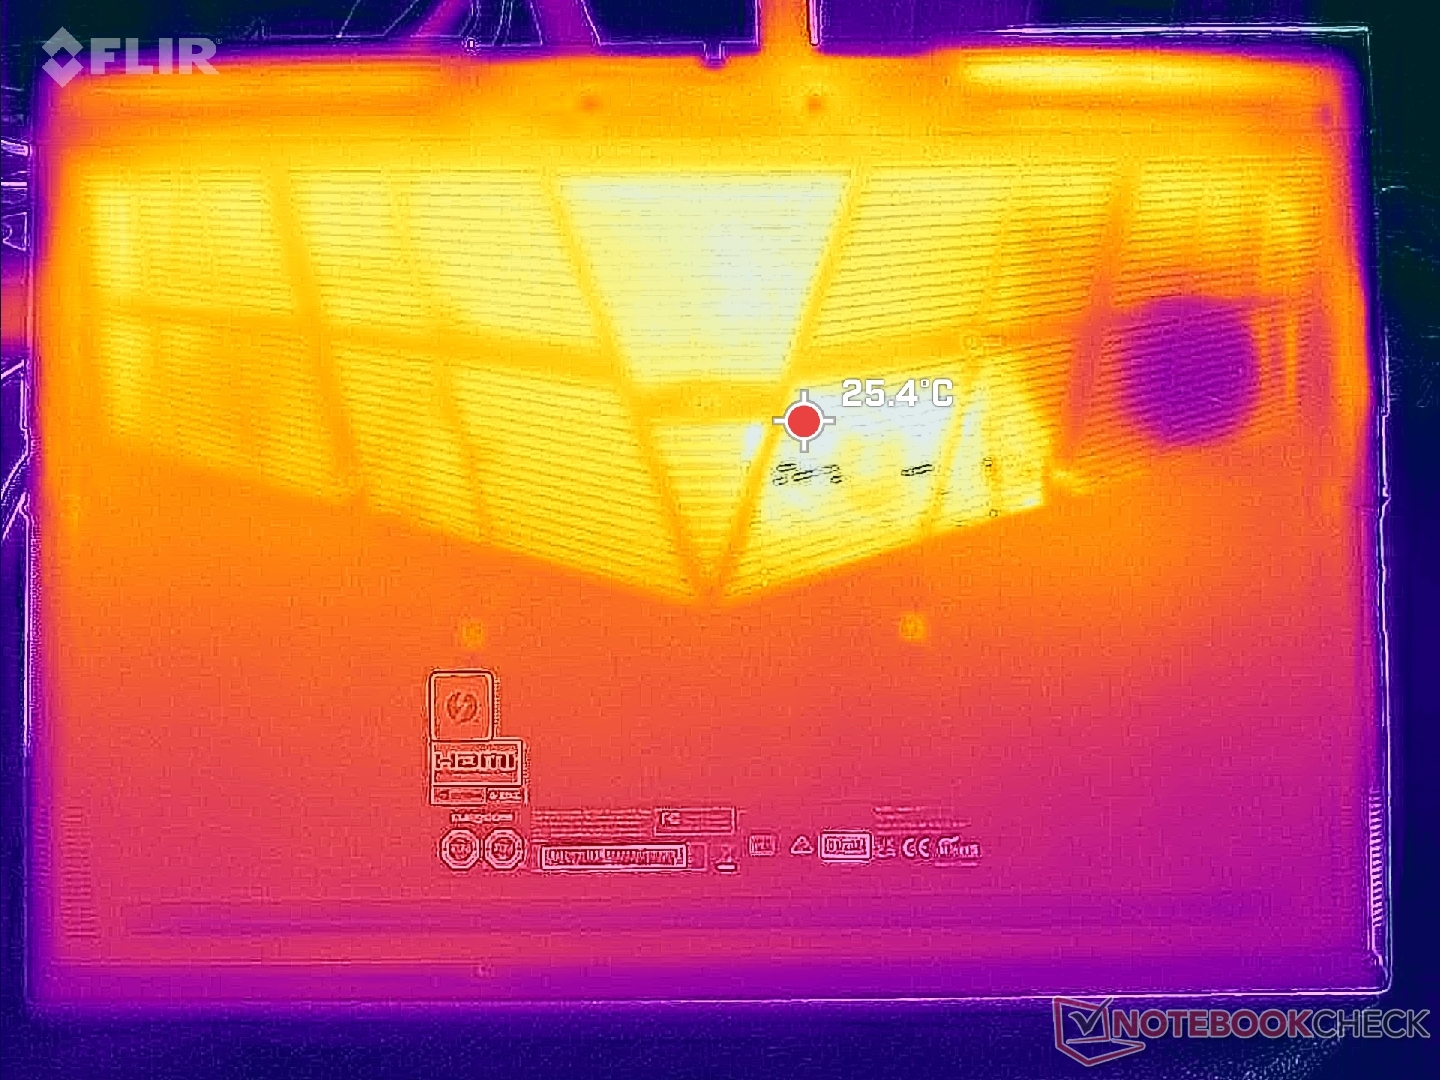
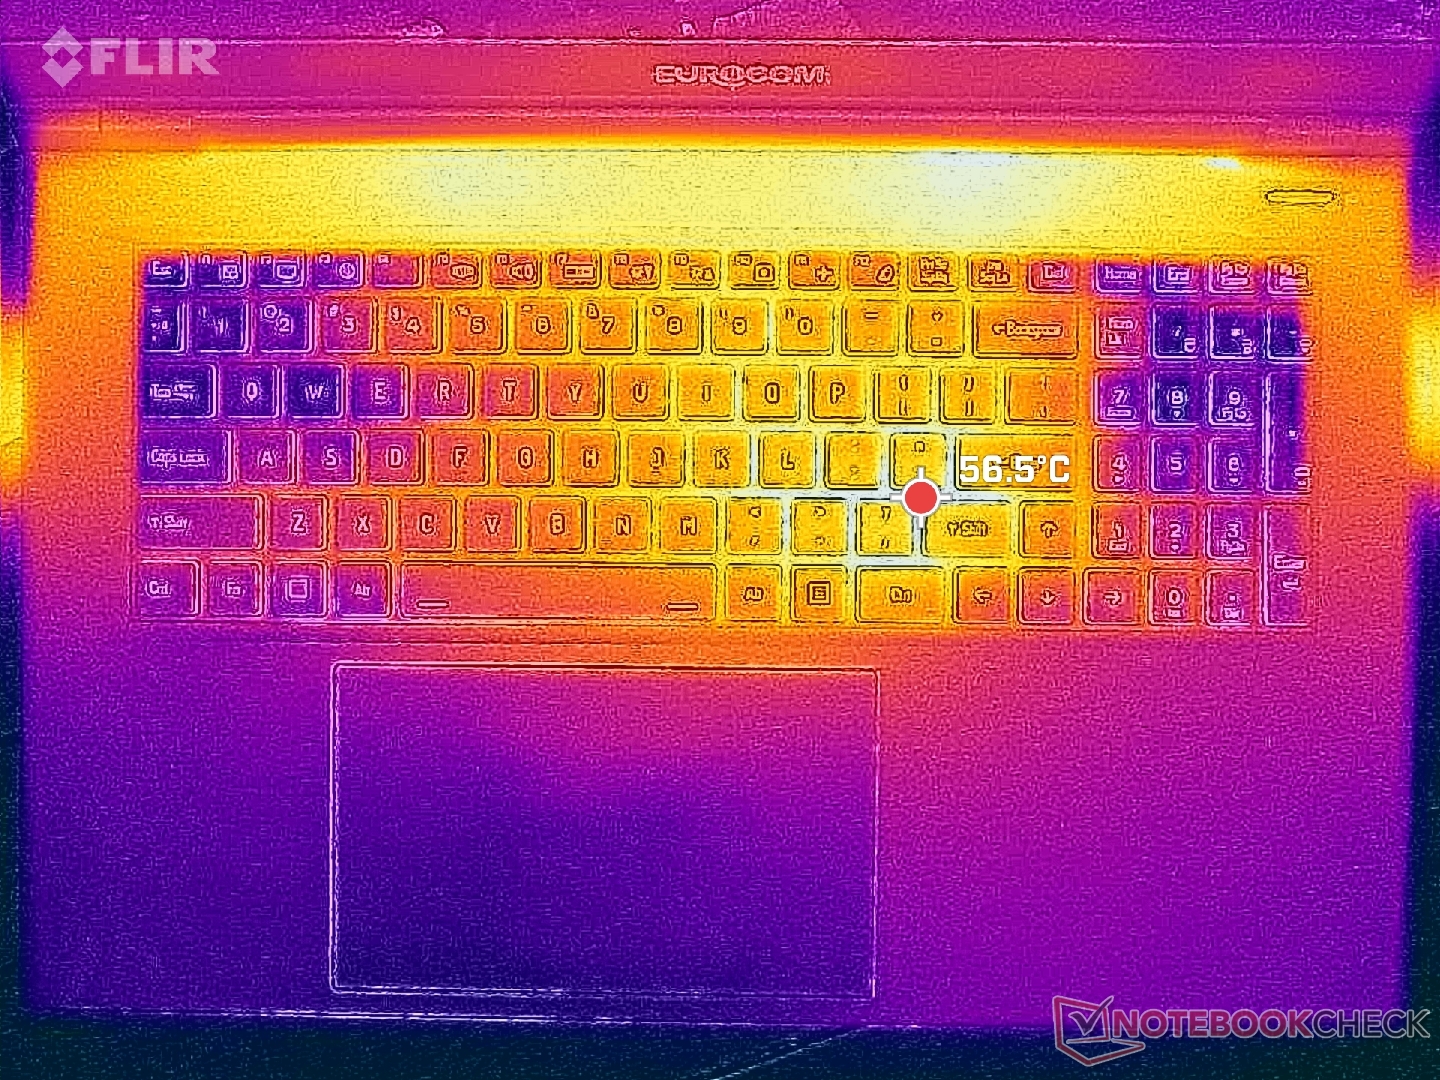
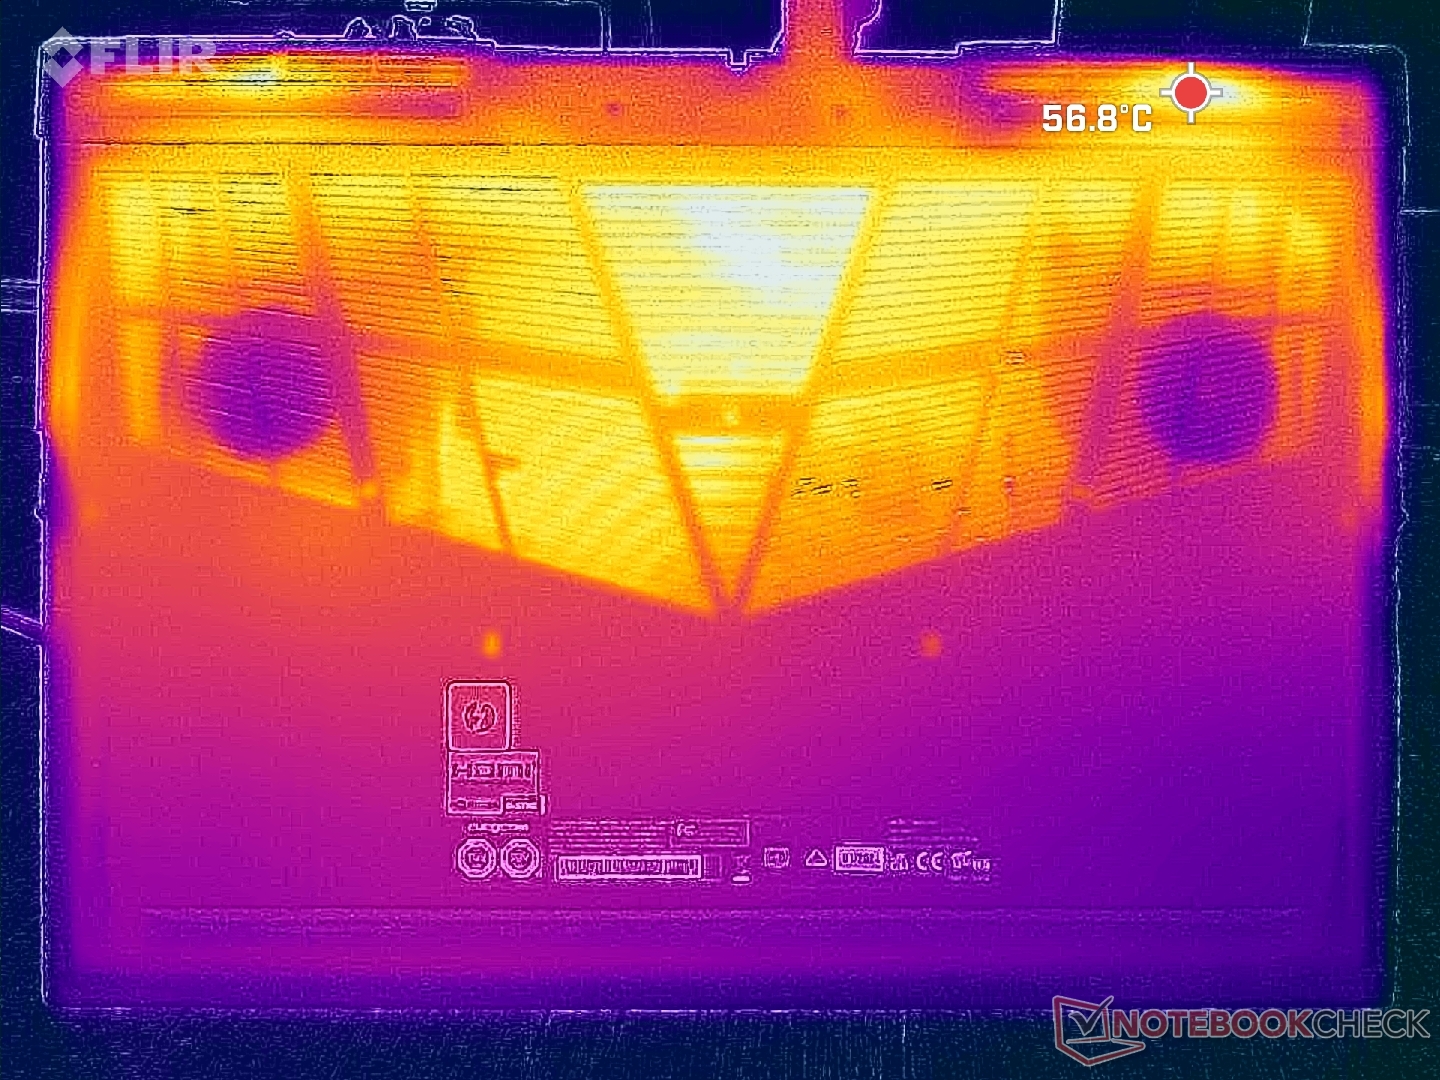
温度
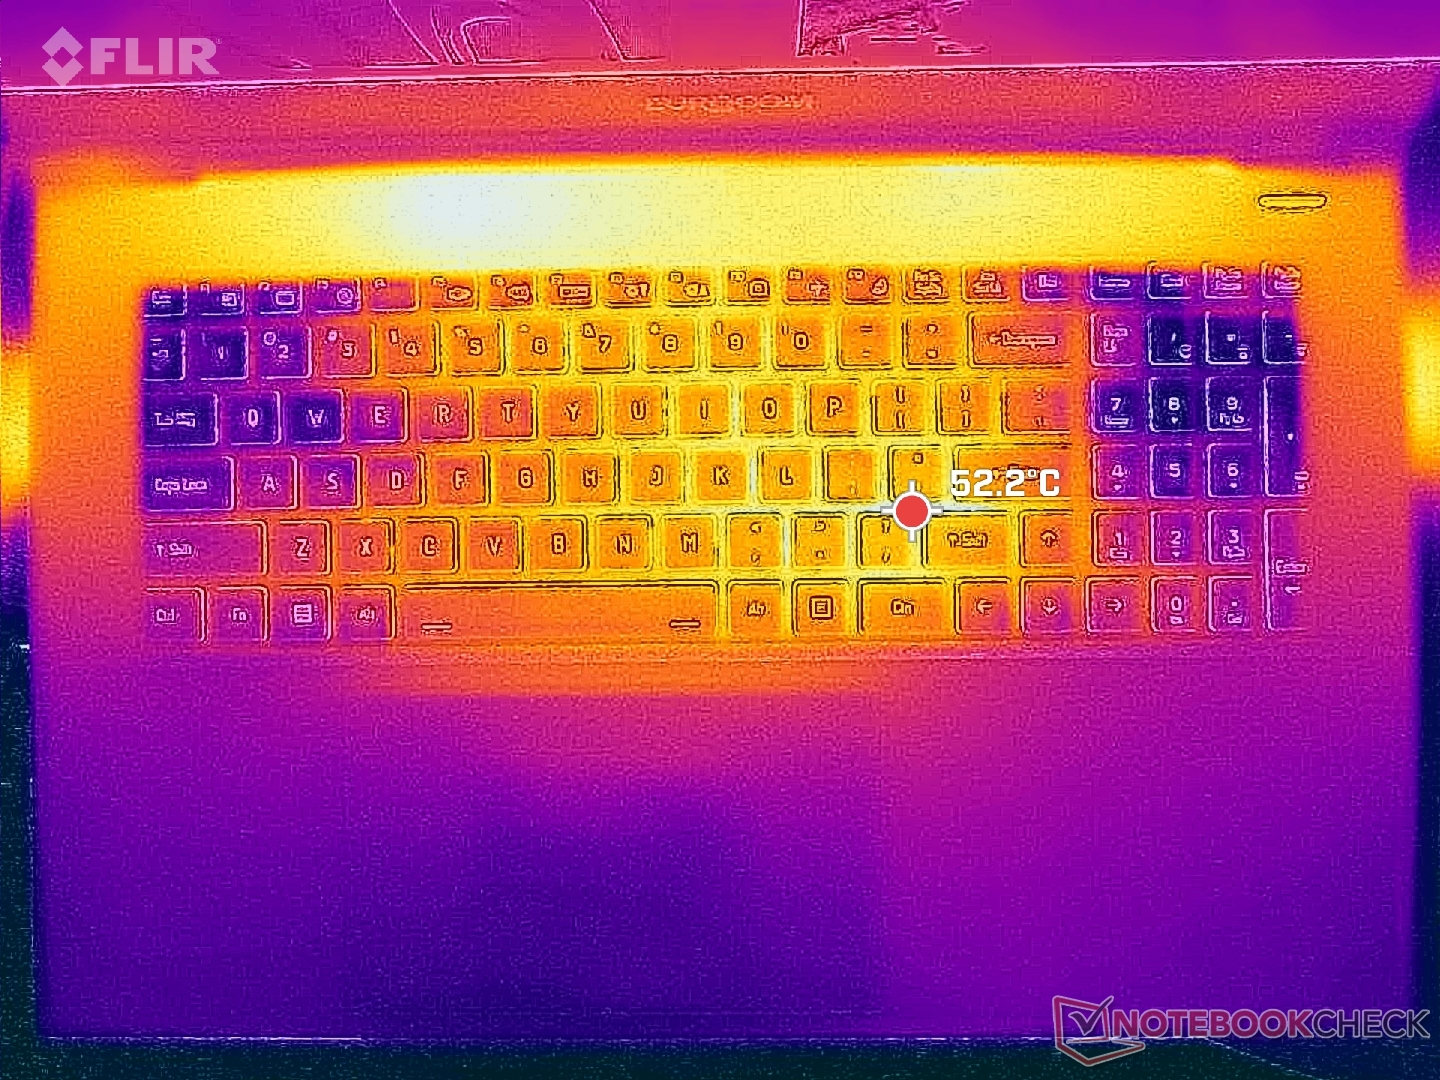
表面温度热点明显高于其他游戏笔记本电脑。尤其是键盘的某些区域,游戏时温度可高达 53 摄氏度,而微星 GE78HX 或华硕 TUF Gaming A17 的温度仅为 37 摄氏度或 40 摄氏度。
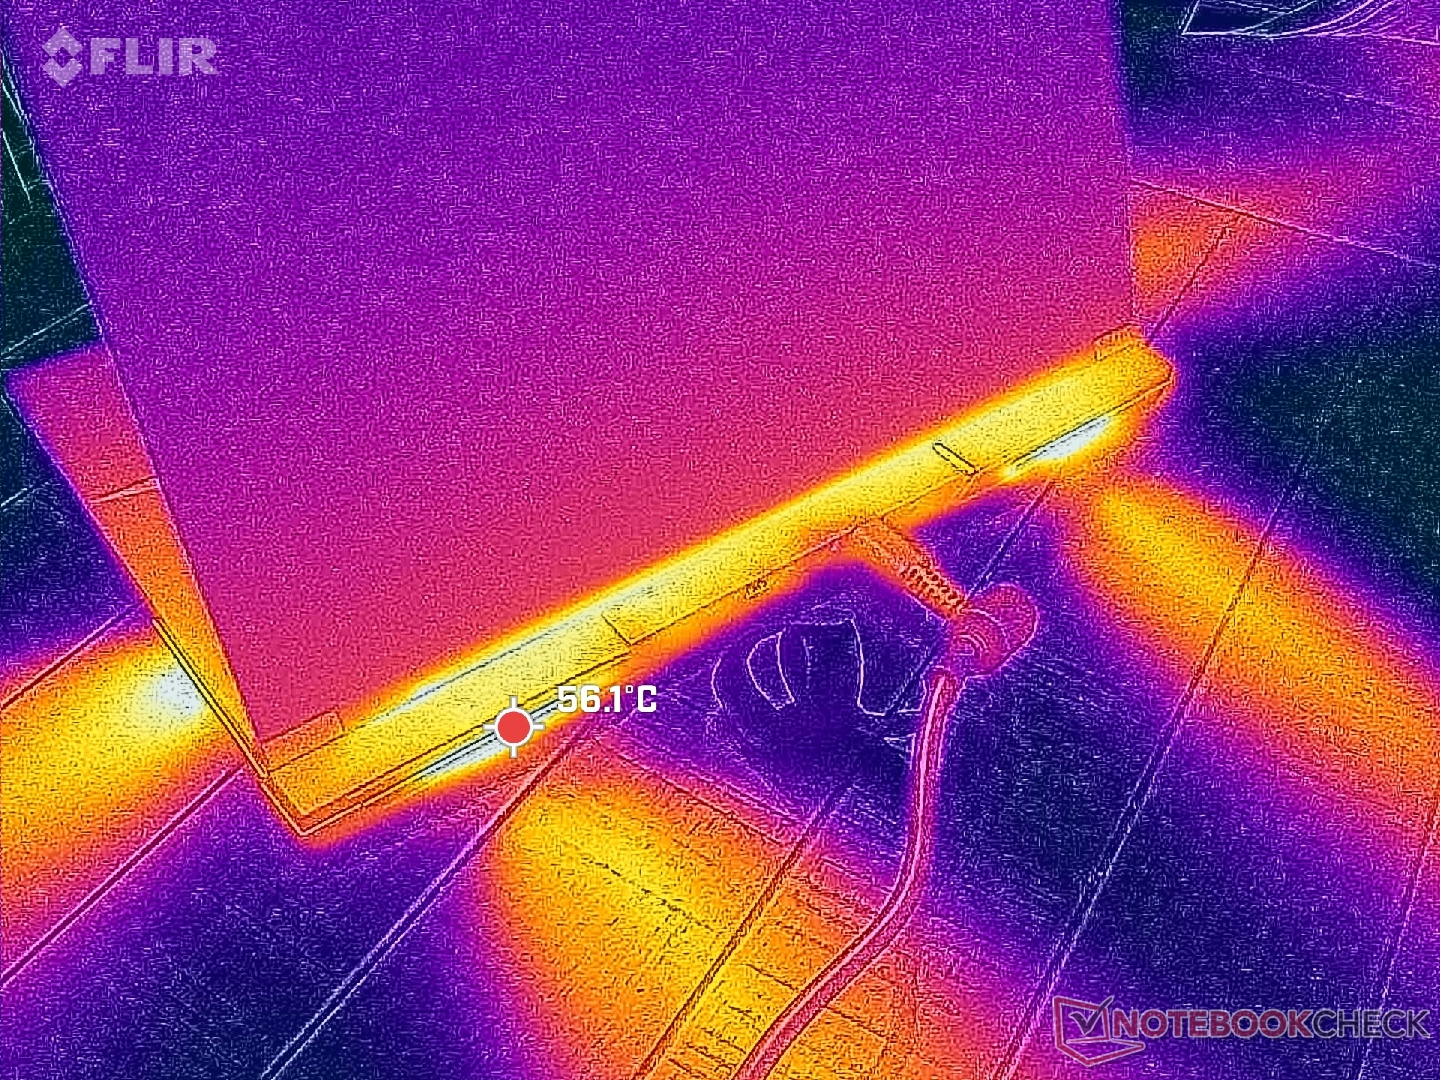
(-) The maximum temperature on the upper side is 52.2 °C / 126 F, compared to the average of 40.4 °C / 105 F, ranging from 21.2 to 68.8 °C for the class Gaming.
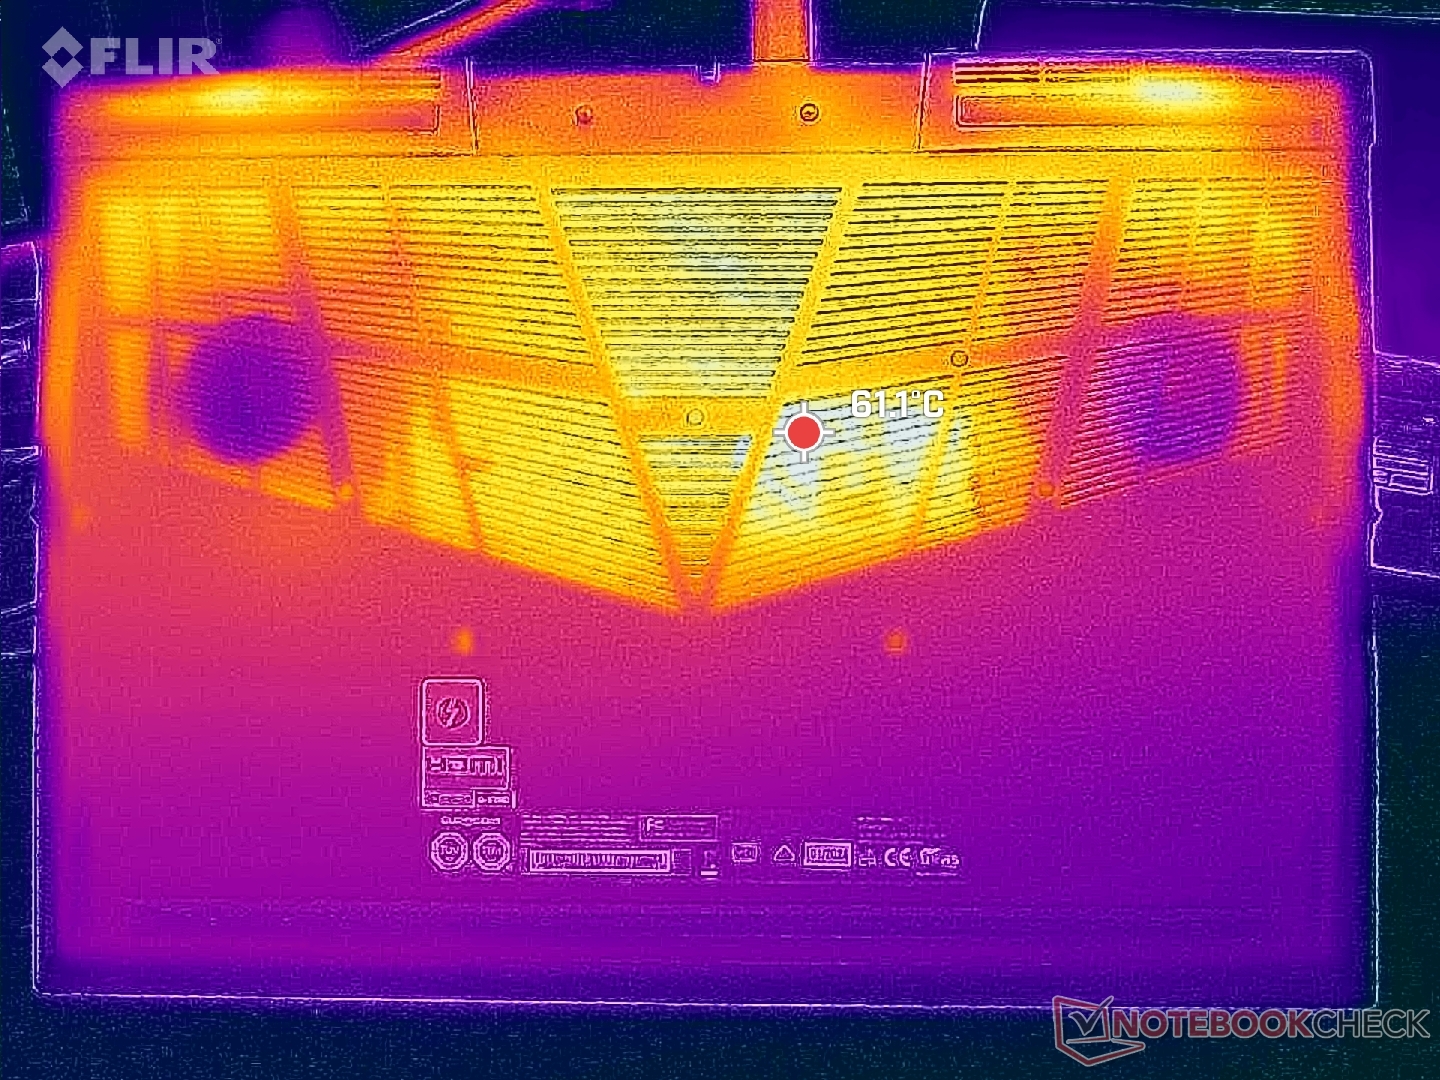
(-) The bottom heats up to a maximum of 53.2 °C / 128 F, compared to the average of 43.2 °C / 110 F
(+) In idle usage, the average temperature for the upper side is 25.8 °C / 78 F, compared to the device average of 33.9 °C / 93 F.
(±) Playing The Witcher 3, the average temperature for the upper side is 36.7 °C / 98 F, compared to the device average of 33.9 °C / 93 F.
(+) The palmrests and touchpad are cooler than skin temperature with a maximum of 28.8 °C / 83.8 F and are therefore cool to the touch.
(±) The average temperature of the palmrest area of similar devices was 28.8 °C / 83.8 F (0 °C / 0 F).
| Eurocom Raptor X17 Core i9-14900HX Intel Core i9-14900HX, NVIDIA GeForce RTX 4090 Laptop GPU | Eurocom Raptor X17 Intel Core i9-13900HX, NVIDIA GeForce RTX 4090 Laptop GPU | Asus TUF Gaming A17 FA707XI-NS94 AMD Ryzen 9 7940HS, NVIDIA GeForce RTX 4070 Laptop GPU | Asus ROG Strix Scar 17 G733PY-XS96 AMD Ryzen 9 7945HX, NVIDIA GeForce RTX 4090 Laptop GPU | MSI GE78HX 13VH-070US Intel Core i9-13950HX, NVIDIA GeForce RTX 4080 Laptop GPU | MSI Titan 18 HX A14VIG Intel Core i9-14900HX, NVIDIA GeForce RTX 4090 Laptop GPU | |
|---|---|---|---|---|---|---|
| Heat | -7% | 21% | 18% | 8% | 4% | |
| Maximum Upper Side * (°C) | 52.2 | 49.4 5% | 40 23% | 34.6 34% | 37.4 28% | 37.8 28% |
| Maximum Bottom * (°C) | 53.2 | 55.2 -4% | 33.6 37% | 35.6 33% | 45 15% | 37.6 29% |
| Idle Upper Side * (°C) | 28.6 | 33.4 -17% | 26.6 7% | 27.2 5% | 29.8 -4% | 34.8 -22% |
| Idle Bottom * (°C) | 29.8 | 33.4 -12% | 24.4 18% | 30 -1% | 32.4 -9% | 36 -21% |
* ... smaller is better
发言人
Eurocom Raptor X17 Core i9-14900HX audio analysis
(±) | speaker loudness is average but good (74.2 dB)
Bass 100 - 315 Hz
(±) | reduced bass - on average 13.4% lower than median
(±) | linearity of bass is average (10.1% delta to prev. frequency)
Mids 400 - 2000 Hz
(±) | higher mids - on average 6.6% higher than median
(±) | linearity of mids is average (8.6% delta to prev. frequency)
Highs 2 - 16 kHz
(+) | balanced highs - only 2% away from median
(±) | linearity of highs is average (8.5% delta to prev. frequency)
Overall 100 - 16.000 Hz
(±) | linearity of overall sound is average (24% difference to median)
Compared to same class
» 86% of all tested devices in this class were better, 4% similar, 9% worse
» The best had a delta of 6%, average was 18%, worst was 132%
Compared to all devices tested
» 72% of all tested devices were better, 6% similar, 22% worse
» The best had a delta of 4%, average was 23%, worst was 134%
Apple MacBook Pro 16 2021 M1 Pro audio analysis
(+) | speakers can play relatively loud (84.7 dB)
Bass 100 - 315 Hz
(+) | good bass - only 3.8% away from median
(+) | bass is linear (5.2% delta to prev. frequency)
Mids 400 - 2000 Hz
(+) | balanced mids - only 1.3% away from median
(+) | mids are linear (2.1% delta to prev. frequency)
Highs 2 - 16 kHz
(+) | balanced highs - only 1.9% away from median
(+) | highs are linear (2.7% delta to prev. frequency)
Overall 100 - 16.000 Hz
(+) | overall sound is linear (4.6% difference to median)
Compared to same class
» 0% of all tested devices in this class were better, 0% similar, 100% worse
» The best had a delta of 5%, average was 17%, worst was 45%
Compared to all devices tested
» 0% of all tested devices were better, 0% similar, 100% worse
» The best had a delta of 4%, average was 23%, worst was 134%
能源管理
耗电量
运行 Witcher 3需要的功率比以前略高,约为 325 W,几乎与 Titan 18 HX 不相上下。与我们的 2023 机型相比,功耗更高可能是由于我们最新配置的 4K 面板更亮、分辨率更高。
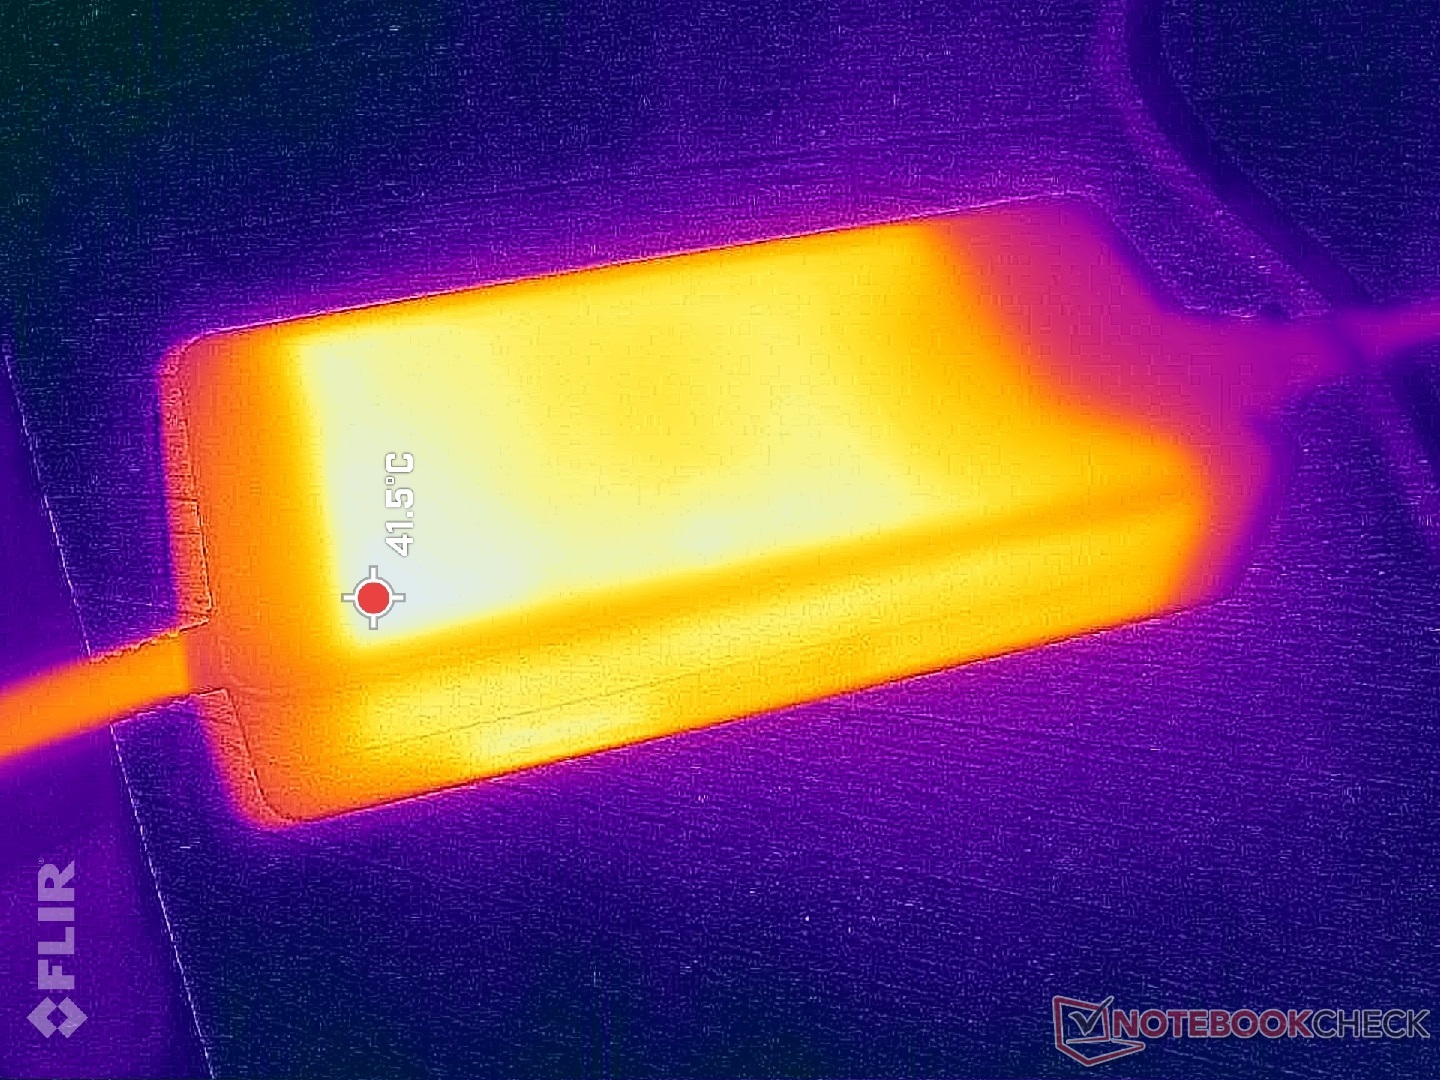
330 瓦的大型交流适配器与以前一样。由于游戏已经需要几乎整个适配器的输出功率,因此在游戏时为电池充电将需要更长的时间。
(编者注:当我们的 Metrahit Energy 万用表维修完毕后,我们将更新本节内容。不便之处,敬请谅解。)
| Off / Standby | |
| Idle | |
| Load |
|
Key:
min: | |
| Eurocom Raptor X17 Core i9-14900HX i9-14900HX, GeForce RTX 4090 Laptop GPU, Corsair MP700 Pro 2TB, IPS, 3840x2160, 17.3" | Eurocom Raptor X17 i9-13900HX, GeForce RTX 4090 Laptop GPU, 3x Samsung SSD 980 Pro 1TB (RAID 0), IPS, 2560x1440, 17.3" | Asus TUF Gaming A17 FA707XI-NS94 R9 7940HS, GeForce RTX 4070 Laptop GPU, WD PC SN560 SDDPNQE-1T00, IPS, 1920x1080, 17.3" | Asus ROG Strix Scar 17 G733PY-XS96 R9 7945HX, GeForce RTX 4090 Laptop GPU, SK hynix PC801 HFS001TEJ9X101N, IPS, 2560x1440, 17.3" | MSI GE78HX 13VH-070US i9-13950HX, GeForce RTX 4080 Laptop GPU, Samsung PM9A1 MZVL22T0HBLB, IPS, 2560x1600, 17" | MSI Titan 18 HX A14VIG i9-14900HX, GeForce RTX 4090 Laptop GPU, 2x Samsung PM9A1a MZVL22T0HDLB (RAID 0), Mini-LED, 3840x2400, 18" | |
|---|---|---|---|---|---|---|
| Power Consumption | 13% | 45% | 17% | 16% | -1% | |
| Idle Minimum * (Watt) | 18.7 | 13.4 28% | 6.2 67% | 14.5 22% | 16.1 14% | 13.2 29% |
| Idle Average * (Watt) | 29.9 | 22.2 26% | 21.8 27% | 21.1 29% | 24 20% | 25.4 15% |
| Idle Maximum * (Watt) | 43.8 | 42.4 3% | 22 50% | 42.8 2% | 34 22% | 53.5 -22% |
| Load Average * (Watt) | 148.9 | 132.8 11% | 59.2 60% | 116.7 22% | 123.6 17% | 151.4 -2% |
| Witcher 3 ultra * (Watt) | 310.5 | 304 2% | 189.7 39% | 278 10% | 286 8% | 336 -8% |
| Load Maximum * (Watt) | 340.2 | 319.8 6% | 247.8 27% | 279.6 18% | 285.7 16% | 395.2 -16% |
* ... smaller is better
Power Consumption Witcher 3 / Stresstest
Power Consumption external Monitor
电池寿命
与去年的配置相比,运行时间略有缩短,这可能是由于对 4K 分辨率的要求更高。
| Eurocom Raptor X17 Core i9-14900HX i9-14900HX, GeForce RTX 4090 Laptop GPU, 99 Wh | Eurocom Raptor X17 i9-13900HX, GeForce RTX 4090 Laptop GPU, 99 Wh | Asus TUF Gaming A17 FA707XI-NS94 R9 7940HS, GeForce RTX 4070 Laptop GPU, 90 Wh | Asus ROG Strix Scar 17 G733PY-XS96 R9 7945HX, GeForce RTX 4090 Laptop GPU, 90 Wh | MSI GE78HX 13VH-070US i9-13950HX, GeForce RTX 4080 Laptop GPU, 99 Wh | MSI Titan 18 HX A14VIG i9-14900HX, GeForce RTX 4090 Laptop GPU, 99.9 Wh | |
|---|---|---|---|---|---|---|
| Battery runtime | 6% | 94% | -13% | 30% | -11% | |
| WiFi v1.3 (h) | 4.7 | 5 6% | 9.1 94% | 4.1 -13% | 6.1 30% | 4.2 -11% |
| Reader / Idle (h) | 10.2 | 19.7 | 7.3 | 5.9 | ||
| Load (h) | 1.5 | 1.7 | 1.5 | 1.2 |
Pros
Cons
结论:新处理器,新外观
由于 酷睿 i9-14900HX基本上是昔日酷睿 i9-13900HX 的翻版,因此 2024 年的 Eurocom Raptor X17 与 2023 年的版本相比并无太大优势。处理器性能可能略有提升,但其他大部分性能都没有变化。尽管如此,整体性能仍可媲美一些最快的笔记本电脑,包括 微星泰坦 HX 或 华硕 ROG Strix Scar 18.Eurocom没有为该机型提供迷你LED或OLED显示屏,但这些选择都是为了迎合多媒体用户的需求,而Raptor X17则更偏向于高性能的专业空间。
风扇噪音可能会稍微稳定一些,但与已经超快的上一代产品相比,不要指望会有明显的性能提升。
决定配置 PCIe5 固态硬盘的强大用户绝对应该考虑同时订购散热器。否则,PCIe5 硬盘在重度使用几分钟后就会表现得更像 PCIe4 硬盘。
价格和供应情况
Eurocom 现已出货2024 Raptor X17 RTX 4080 和 2K 显示屏的起价为 3500 美元。如果配置 RTX 4090 和 4K 显示屏(如我们的评测机),价格将超过 4200 美元。
Eurocom Raptor X17 Core i9-14900HX
- 03/15/2024 v7 (old)
Allen Ngo
Transparency
The selection of devices to be reviewed is made by our editorial team. The test sample was provided to the author as a loan by the manufacturer or retailer for the purpose of this review. The lender had no influence on this review, nor did the manufacturer receive a copy of this review before publication. There was no obligation to publish this review. As an independent media company, Notebookcheck is not subjected to the authority of manufacturers, retailers or publishers.
This is how Notebookcheck is testing
Every year, Notebookcheck independently reviews hundreds of laptops and smartphones using standardized procedures to ensure that all results are comparable. We have continuously developed our test methods for around 20 years and set industry standards in the process. In our test labs, high-quality measuring equipment is utilized by experienced technicians and editors. These tests involve a multi-stage validation process. Our complex rating system is based on hundreds of well-founded measurements and benchmarks, which maintains objectivity. Further information on our test methods can be found here.
Price comparison

